Attached files
UNITED STATES
SECURITIES AND EXCHANGE COMMISSION
Washington, D.C. 20549
FORM 10-K
þ | ANNUAL REPORT PURSUANT TO SECTION 13 OR 15(d) OF THE SECURITIES EXCHANGE ACT OF 1934 |
For the fiscal year ended December 31, 2016 | |
OR
o | TRANSITION REPORT PURSUANT TO SECTION 13 OR 15(d) OF THE SECURITIES EXCHANGE ACT OF 1934 |
For the transition period from to | |
Commission file number 1-10945
____________________________________________
OCEANEERING INTERNATIONAL, INC.
(Exact name of registrant as specified in its charter)
Delaware | 95-2628227 |
(State or other jurisdiction of incorporation or organization) | (I.R.S. Employer Identification No.) |
11911 FM 529 Houston, Texas | 77041 |
(Address of principal executive offices) | (Zip Code) |
Registrant's telephone number, including area code: (713) 329-4500
Securities registered pursuant to Section 12(b) of the Act:
Title of each class | Name of each exchange on which registered |
Common Stock, $0.25 par value | New York Stock Exchange |
Securities registered pursuant to Section 12(g) of the Act:
None
____________________________________________
Indicate by check mark if the registrant is a well-known seasoned issuer, as defined in Rule 405 of the Securities Act.
þ Yes o No
Indicate by check mark if the registrant is not required to file reports pursuant to Section 13 or Section 15(d) of the Act. o Yes þ No
Indicate by check mark whether the registrant (1) has filed all reports required to be filed by Section 13 or 15(d) of the Securities Exchange Act of 1934 during the preceding 12 months (or for such shorter period that the registrant was required to file such reports), and (2) has been subject to such filing requirements for the past 90 days. þ Yes o No
Indicate by check mark whether the registrant has submitted electronically and posted on its corporate Web site, if any, every Interactive Data File required to be submitted and posted pursuant to Rule 405 of Regulation S-T (§ 232.405 of this chapter) during the preceding 12 months (or for such shorter period that the registrant was required to submit and post such files). þ Yes o No
Indicate by check mark if disclosure of delinquent filers pursuant to Item 405 of Regulation S-K (§ 229.405 of this chapter) is not contained herein, and will not be contained, to the best of registrant's knowledge, in definitive proxy or information statements incorporated by reference in Part III of this Form 10-K or any amendment to this Form 10-K. þ Yes o No
Indicate by check mark whether the registrant is a large accelerated filer, an accelerated filer, a non-accelerated filer, or a smaller reporting company. See definitions of "large accelerated filer," "accelerated filer" and "smaller reporting company" in Rule 12b-2 of the Exchange Act.
Large accelerated filer | þ | Accelerated filer | o |
Non-accelerated filer | o (Do not check if a smaller reporting company) | Smaller reporting company | o |
Indicate by check mark whether the registrant is a shell company (as defined in Rule 12b-2 of the Exchange Act).
o Yes þ No
Aggregate market value of the voting stock held by nonaffiliates of the registrant computed by reference to the closing price of $29.86 of the Common Stock on the New York Stock Exchange as of June 30, 2016, the last business day of the registrant's most recently completed second quarter: $2.9 billion
Number of shares of Common Stock outstanding at February 17, 2017: 98,072,195.
Documents Incorporated by Reference:
Portions of the proxy statement relating to the registrant's 2017 annual meeting of shareholders, to be filed on or before May 1, 2017 pursuant to Regulation 14A of the Securities Exchange Act of 1934, are incorporated by reference to the extent set forth in Part III, Items 10-14 of this report.
Oceaneering International, Inc.
Form 10-K
Table of Contents
Item 1. | ||
Item 1A. | ||
Item 1B. | ||
Item 2. | ||
Item 3. | ||
Item 4. | ||
Item 5. | ||
Item 6. | ||
Item 7. | ||
Item 7A. | ||
Item 8. | ||
Item 9. | ||
Item 9A. | ||
Item 9B. | ||
Item 10. | ||
Item 11. | ||
Item 12. | ||
Item 13. | ||
Item 14. | ||
Item 15. | ||
1
PART I
Item 1. | Business. |
GENERAL DEVELOPMENT OF BUSINESS
Oceaneering International, Inc. is a global oilfield provider of engineered services and products, primarily to the offshore oil and gas industry, with a focus on deepwater applications. Oceaneering also serves the defense, aerospace and commercial theme park industries. Oceaneering was organized as a Delaware corporation in 1969 out of the combination of three diving service companies founded in the early 1960s. Since our establishment, we have concentrated on the development and marketing of underwater services and products to meet customer needs requiring the use of advanced deepwater technology. We believe we are one of the world's largest underwater services contractors. The services and products we provide to the oil and gas industry include remotely operated vehicles, specialty subsea hardware, engineering and project management, subsea intervention services, including manned diving, survey and positioning services and asset integrity and nondestructive testing services. Our foreign operations, principally in the North Sea, Africa, Brazil, Australia and Asia, accounted for approximately 57% of our revenue, or $1.3 billion, for the year ended December 31, 2016.
Our business segments are contained within two businesses – services and products provided to the oil and gas industry ("Oilfield") and all other services and products ("Advanced Technologies"). Our four business segments within the Oilfield business are Remotely Operated Vehicles ("ROVs"), Subsea Products, Subsea Projects and Asset Integrity. We report our Advanced Technologies business as one segment. Unallocated Expenses are expenses not associated with a specific business segment. These consist of expenses related to our incentive and deferred compensation plans, including restricted stock and bonuses, as well as other general expenses.
Oilfield. The primary focus of our Oilfield business over the last several years has been toward increasing our asset base and capabilities for providing services and products for deepwater offshore operations and subsea completions. In more recent years we have focused on increasing our service and product offerings toward our customers' operating expenses.
During the past ten years, we have acquired businesses to expand and complement our service and product offerings. These include:
• | a Canadian manufacturer of clamp connectors, check valves and universal ball joints; |
• | a Norwegian-based provider of inspection, maintenance, subsea engineering and field operations services, principally to the oil and gas industry |
• | a Norwegian rental provider of specialized subsea dredging equipment, including ROV-deployed units, to the offshore oil and gas industry; |
• | a Norwegian oilfield technology company specializing in providing subsea tooling services and plugging, abandonment and decommissioning of offshore oil and gas production platforms and subsea wellheads; |
• | a Norwegian design and fabrication company specializing in subsea tools for the offshore oil and gas industry; |
• | a U.S.-based international provider of survey and positioning services; |
• | a business that uses ROVs to perform surveys on mobile offshore drilling units and floating production systems that satisfy the underwater inspection in lieu of drydocking (UWILD) requirements of all major classification societies; and |
• | the assets of a provider of riserless light well intervention services. |
ROVs. We provide ROVs, which are tethered submersible vehicles remotely operated from the surface, to customers in the oil and gas industry for drilling support and vessel-based services, including subsea hardware installation, construction, pipeline inspection, survey and facilities inspection, maintenance and repair. We design and build our new ROVs at in-house facilities, the largest of which is in Morgan City, LA. In 2016, we manufactured and added 6 ROVs to our fleet and retired 41. Our work-class ROV fleet size was 280 at December 31, 2016, 315 at December 31, 2015 and 336 at December 31, 2014. We have decreased our ROV fleet size over the last two years as a result of lower market demand.
2
Subsea Products. We manufacture or assemble a variety of specialty subsea oilfield products. These encompass production control umbilicals, tooling and subsea work systems, installation and workover control systems ("IWOCS"), and subsea hardware.
While most of our products are sold, we also rent tooling and provide IWOCS and subsea work systems as a service, including hydrate remediation, well stimulation, dredging and decommissioning.
To improve operational efficiency, in 2016 we reorganized our Subsea Products segment into two business units – (1) manufactured products and (2) service and rental. Manufactured products include production control umbilicals and specialty subsea hardware, while service and rental includes tooling, subsea work systems and installation and workover control systems, which we design and build but operate as a service. This internal reorganization does not affect our segment reporting structure or the historical comparability of our segment results.
We provide various types of subsea umbilicals through our Umbilical Solutions division from plants in the United States, Scotland and Brazil. Offshore operators use umbilicals to control subsea wellhead hydrocarbon flow rates, monitor downhole and wellhead conditions and perform chemical injection. Subsea umbilicals are also used to provide power and fluids to other subsea processing hardware, including pumps and gas separation equipment. We continue to invest in our plants to meet the requirements of the deepwater operations of our customers.
Subsea Projects. Our Subsea Projects segment consists of our subsea installation, inspection, maintenance and repair services, principally in the U.S. Gulf of Mexico and offshore Angola and India, utilizing a fleet of two owned and three long-term chartered dynamically positioned deepwater vessels with integrated high-specification work-class ROVs onboard, and four owned shallow water diving vessels, spot-chartered vessels and other assets. All of our owned vessels are Jones Act-compliant. The dynamically positioned vessels are equipped with thrusters that allow them to maintain a constant position at a location without the use of anchors. They are used in the inspection, maintenance and repair of subsea facilities, pipeline or flowline tie-ins, pipeline crossings and installations. These vessels can carry and install equipment or umbilicals required to bring subsea well completions into production (tie-back to production facilities).
Unless indicated otherwise, each of the chartered vessels discussed below is a deepwater multiservice subsea support vessel outfitted with two of our high-specification work-class ROVs.
Beginning in the third quarter of 2008, we chartered a vessel, the Olympic Intervention IV, for an initial term of five years. Following extension periods, the charter expired in July 2016, and we released the vessel to its owner. We had been using the Olympic Intervention IV in the U.S. Gulf of Mexico.
In 2012, we moved the chartered vessel Ocean Intervention III to Angola and also chartered the Bourbon Oceanteam 101 to work on a three-year field support vessel services contract for a unit of BP plc. We had extended the charter of the Bourbon Oceanteam 101 to January 2017. However, in early 2016, the customer exercised its right, under the field support vessel services contract, to terminate its use of the Bourbon Oceanteam 101 at the end of May 2016. Under the terms of the contract, the costs incurred by us associated with the early release and demobilization of the vessel were reimbursed by the customer. Following the release of the vessel, we redelivered it to the vessel supplier. Under the field support vessel services contract, which has been extended through January 2019, we are continuing to supply project management, engineering and the Ocean Intervention III, which we have under charter on a month-to-month basis through July 2017. We also provide ROV tooling, asset integrity services and installation and workover control system services. We also have provided other chartered vessels and barges as requested by the customer.
In March 2013, we commenced a five-year charter for a Jones Act-compliant multi-service support vessel, the Ocean Alliance, we have been using in the U.S. Gulf of Mexico. In January 2015, we commenced a two-year contract with a customer for the use of the Ocean Alliance. The contract expired in January 2017, and we are marketing the vessel for spot market work in the U.S. Gulf of Mexico.
3
In December 2013, we commenced a three-year charter for the Normand Flower, a multi-service subsea marine support vessel. We made modifications to the vessel and used the vessel in the U.S. Gulf of Mexico to perform inspection, maintenance and repair projects and hardware installations. In December 2016, we declined our option to extend the charter and the vessel was released.
In November 2015, we commenced a two-year charter for the use of the Island Pride, a multi-service subsea marine support vessel. We are using the vessel under a two-year contract to provide field support services off the coast of India for an oil and gas customer based in India. We have options to extend the charter for up to two additional years.
We also charter or lease vessels on a short-term basis as necessary to augment our fleet.
In 2010, we acquired a vessel, which we renamed the Ocean Patriot, and we have converted it to a dynamically positioned saturation diving and ROV service vessel. We installed a 12-man saturation ("SAT") diving system and one work-class ROV on the vessel, and we placed the vessel into service in December 2011.
During the third quarter of 2013, we signed an agreement with a shipyard for the construction of a subsea support vessel, to be named the Ocean Evolution. We expect delivery of that vessel in the middle of 2017. We intend for the vessel to be U.S.-flagged and documented with a coastwise endorsement by the U.S. Coast Guard. It is expected to have an overall length of 353 feet, a Class 2 dynamic positioning system, accommodations for 110 personnel, a helideck, a 250-ton active heave-compensated crane, and a working moonpool. We expect to outfit the vessel with two of our high specification work-class ROVs. The vessel will also be equipped with a satellite communications system capable of transmitting streaming video for real-time work observation by shore personnel. We anticipate the vessel will be used to augment our ability to provide subsea intervention services in the ultra-deep waters of the U.S. Gulf of Mexico. These services are required to perform inspection, maintenance and repair projects and hardware installations.
In 2015, we acquired C & C Technologies, Inc. ("C&C") for approximately $224 million. C&C is a global provider of ocean-bottom mapping services in deepwater utilizing customized autonomous underwater vehicles and provides marine construction surveys for both surface and subsea assets, as well as satellite-based positioning services for drilling rigs and seismic and construction vessels. C&C also provides land and near-shore survey services along the U.S. Gulf Coast and in Mexico, and performs shallow water conventional geophysical surveys in the U.S. Gulf of Mexico.
In 2016, we acquired the assets of Blue Ocean Technologies, LLC, a privately held provider of riserless light well intervention ("RLWI") services. Subsea well intervention services are intended to maximize production and increase the recovery rate from offshore oil and gas reservoirs or, alternatively, prepare wells to be plugged and abandoned. These RLWI systems have the capability to perform a wide variety of cost-effective services for well interventions, including well diagnostics, damaged well remediation and workovers, and well plugging and abandonment.
Asset Integrity. Through our Asset Integrity division, we provide asset integrity management, corrosion management, inspection, and non-destructive testing services, principally to customers in the oil and gas, power generation, and petrochemical industries. We perform these services on both onshore and offshore facilities, both topside and subsea.
In December 2011, we purchased a Norwegian-based provider of inspection, maintenance, subsea engineering and field operations services, principally to the oil and gas industry.
General. During the last five years, we have also made several small acquisitions to add complementary technology or niche markets. We intend to continue our strategy of acquiring, as opportunities arise, additional assets or businesses, to improve our market position or expand into related service and product lines.
Advanced Technologies. Our Advanced Technologies provides engineering services and related manufacturing, principally to the U.S. Department of Defense, NASA and its prime contractors, and the commercial theme park industry.
4
FINANCIAL INFORMATION ABOUT SEGMENTS
For financial information about our business segments, please see the tables in Note 7 of the Notes to Consolidated Financial Statements in this report, which present revenue, income from operations, depreciation and amortization expense and capital expenditures for 2016, 2015 and 2014, and identifiable assets, property and equipment and goodwill by business segment as of December 31, 2016 and 2015.
DESCRIPTION OF BUSINESS
Oilfield
Our Oilfield business consists of ROVs, Subsea Products, Subsea Projects and Asset Integrity.
ROVs. ROVs are tethered submersible vehicles remotely operated from the surface. We use our ROVs in the offshore oil and gas industry to perform a variety of underwater tasks, including drill support, vessel-based inspection, maintenance and repair, installation and construction support, pipeline inspection and surveys, and subsea production facility operation and maintenance. Work-class ROVs are outfitted with manipulators, sonar and video cameras, and can operate specialized tooling packages and other equipment or features to facilitate the performance of specific underwater tasks. At December 31, 2016, we owned 280 work-class ROVs. We believe we operate the largest fleet of ROVs in the world. We also believe we are the industry leader in providing ROV services for drill support, with an estimated 53% market share at the end of 2016.
ROV revenue: | Amount | Percent of Total Revenue | ||||
(in thousands) | ||||||
2016 | $ | 522,121 | 23 | % | ||
2015 | 807,723 | 27 | % | |||
2014 | 1,069,022 | 29 | % | |||
Subsea Products. We construct a variety of specialty subsea hardware to ISO 9001 quality requirements. These products include:
• | various types of subsea umbilicals utilizing thermoplastic hoses and steel tubes, along with termination assemblies; |
• | tooling, ROV tooling and subsea work packages; |
• | production control equipment; |
• | installation and workover control systems; |
• | clamp connectors; |
• | pipeline connector and repair systems; |
• | subsea and topside control valves; and |
• | subsea chemical injection valves. |
We market these products under the trade names Oceaneering Umbilical Solutions, Oceaneering Grayloc, Oceaneering Pipeline Connection & Repair Systems (PCRS) and Oceaneering Rotator.
Offshore well operators use subsea umbilicals and production control equipment to control subsea wellhead hydrocarbon flow, monitor downhole and wellhead conditions and perform chemical injection. They are also used to provide power and fluids to other subsea processing hardware, including pumps and gas/oil separation equipment. ROV tooling provides an additional operational interface between an ROV and permanently installed equipment located on the sea floor. Subsea work packages facilitate well and associated equipment intervention for the purposes of flow remediation and well stimulation.
Subsea Products revenue: | Amount | Percent of Total Revenue | ||||
(in thousands) | ||||||
2016 | $ | 692,030 | 30 | % | ||
2015 | 959,714 | 31 | % | |||
2014 | 1,238,746 | 34 | % | |||
5
Subsea Projects. We perform subsea oilfield hardware installation and inspection, maintenance and repair services. We service deepwater projects with dynamically positioned vessels that typically have Oceaneering ROVs onboard. We service shallow water projects with our manned diving operation utilizing dive support vessels and saturation diving systems.
We perform subsea intervention and hardware installation services, principally in the U.S. Gulf of Mexico, offshore Angola and offshore India from two owned and three chartered multiservice deepwater vessels that have Oceaneering ROVs onboard. These services include: subsea well tie-backs; pipeline/flowline tie-ins and repairs; pipeline crossings; umbilical and other subsea equipment installations; subsea intervention; and inspection, maintenance and repair activities.
We provide ocean-bottom mapping services in deepwater, utilizing customized autonomous underwater vehicles, as well as vessel-mounted and towed geophysical equipment. We also provide marine construction surveys for both surface and subsea assets, as well as satellite-based positioning services for drilling rigs and seismic and construction vessels.
We service oil and gas industry shallow water projects in the U.S. Gulf of Mexico and offshore Angola with our manned diving operation utilizing the traditional diving techniques of air, mixed gas and saturation diving, all of which use surface-supplied breathing gas. We supply our diving services from four owned diving support vessels and other vessels and facilities. We do not use traditional diving techniques in water depths greater than 1,000 feet.
Subsea Projects revenue: | Amount | Percent of Total Revenue | ||||
(in thousands) | ||||||
2016 | $ | 472,979 | 21 | % | ||
2015 | 604,484 | 20 | % | |||
2014 | 588,572 | 16 | % | |||
Asset Integrity. Through our Asset Integrity division, we offer a wide range of asset integrity services to customers worldwide to help ensure the safety of their facilities onshore and offshore, while reducing their unplanned maintenance and repair costs. We also provide third-party inspections to satisfy contractual structural specifications, internal safety standards or regulatory requirements. We provide these services principally to customers in the oil and gas, petrochemical and power generation industries. In the U.K., we provide Independent Inspection Authority services for the oil and gas industry, which includes first-pass integrity evaluation and assessment and nondestructive testing services. We use a variety of technologies to perform pipeline inspections, both onshore and offshore.
Asset Integrity revenue: | Amount | Percent of Total Revenue | ||||
(in thousands) | ||||||
2016 | $ | 275,397 | 12 | % | ||
2015 | 372,957 | 12 | % | |||
2014 | 500,237 | 14 | % | |||
Advanced Technologies
Our Advanced Technologies segment provides engineering services and products principally to the U.S. Department of Defense, NASA and its contractors, and the commercial theme park industry. We work with our customers to understand their specialized requirements, identify and mitigate risks, and provide them value-added, maintainable, safe and certified solutions. The U.S. Navy is our largest customer in this segment, for whom we perform work primarily on surface ships and submarines.
We provide support for the U.S. Navy, including underwater operations, data analysis, development of ocean-related computer software, and the design and development of new underwater tools and systems. We also install and maintain mechanical systems for the Navy's submarines, surface ships, offshore structures and moorings. We provide services and products to NASA and aerospace contractors. Our U.S. Navy and NASA-related activities substantially depend on continued government funding.
6
Advanced Technologies revenue: | Amount | Percent of Total Revenue | ||||
(in thousands) | ||||||
2016 | $ | 309,076 | 14 | % | ||
2015 | 317,876 | 10 | % | |||
2014 | 263,047 | 7 | % | |||
MARKETING
Oilfield. Oil and gas exploration and development expenditures fluctuate from year to year. In particular, budgetary approval for more expensive drilling and production in deepwater, an area in which we have a high degree of focus, may be postponed or suspended during periods when exploration and production companies reduce their offshore capital spending. In more recent years, we have focused on increasing our service and product offerings toward our customers' operating expenses.
We market our ROVs, Subsea Products, Subsea Projects and Asset Integrity services and products to domestic, international and foreign national oil and gas companies engaged in offshore exploration, development and production. We also provide services and products as a subcontractor to other oilfield service companies operating as prime contractors. Customers for these services typically award contracts on a competitive-bid basis. These contracts are typically less than one year in duration, although we enter into multi-year contracts from time to time.
In connection with the services we perform in our Oilfield business, we generally seek contracts that compensate us on a dayrate basis. Under dayrate contracts, the contractor provides the ROV, vessel or equipment and the required personnel to operate the unit and compensation is based on a rate per day for each day the unit is used. The typical dayrate depends on market conditions, the nature of the operations to be performed, the duration of the work, the equipment and services to be provided, the geographical areas involved and other variables. Dayrate contracts may also contain an alternate, lower dayrate that applies when a unit is moving to a new site or when operations are interrupted or restricted by equipment breakdowns, adverse weather or water conditions or other conditions beyond the contractor's control. Sales contracts for our products are generally for a fixed price.
Advanced Technologies. We market our marine services and related engineering services to government agencies, major defense contractors, NASA and NASA contractors, and to theme park and other commercial customers outside the energy sector.
Major Customers. Our top five customers in 2016, 2015 and 2014 accounted for 43%, 38% and 40%, respectively, of our consolidated revenue. In 2016, four of our top five customers were oil and gas exploration and production companies served by our Oilfield business segments, with the other one being the U.S. Navy or other parts of the U.S. Government, which is served by our Advanced Technologies segment. In 2015 and 2014, all of our top five customers were oil and gas exploration and production companies served by our Oilfield business segments. During each of 2016, 2015 and 2014, revenue from one customer, BP plc and subsidiaries, accounted for 18% of our total consolidated annual revenue.
While we do not depend on any one customer, the loss of one of our significant customers could, at least on a short-term basis, have an adverse effect on our results of operations and cash flows.
RAW MATERIALS
Most of the raw materials we use in our manufacturing operations, such as steel in various forms, copper, electronic components and plastics, are available from many sources. However, some components we use to manufacture subsea umbilicals are available from limited sources. With the exception of certain kinds of steel tube, where we are limited in the number of available suppliers, we can offer alternative materials or technologies in many cases, which depends on the requisite approval of our customers. While we have experienced some level of difficulty in obtaining certain kinds of steel tube in the past due to global demand outstripping capacity, an increase in supplier
7
capacity, coupled with a drop in global demand, has resolved this issue, and we believe the situation is unlikely to recur in the near future.
COMPETITION
Our businesses operate in highly competitive industry segments.
Oilfield
We are one of several companies that provide underwater services and specialty subsea hardware on a worldwide basis. We compete for contracts with companies that have worldwide operations, as well as numerous others operating locally in various areas. We believe that our ability to provide a wide range of underwater services and products on a worldwide basis enables us to compete effectively in all phases of the offshore oilfield life cycle. In some cases involving projects that require less sophisticated equipment, small companies have been able to bid for contracts at prices uneconomical to us. Additionally, in some jurisdictions we are subject to foreign governmental regulations favoring or requiring the awarding of contracts to local contractors or requiring foreign contractors to employ citizens of, or purchase supplies from, a particular jurisdiction. These regulations may adversely affect our ability to compete.
ROVs. We believe we are the world's largest owner/operator of work-class ROVs employed in oil and gas related operations. At December 31, 2016, we owned 280 work-class ROVs, and we estimate that this represented approximately 28% of the work-class ROVs utilized in the oilfield service industry. We compete with several major companies on a worldwide basis and with numerous others operating locally in various areas.
Competition for ROV services historically has been based on equipment availability, location of or ability to deploy the equipment, quality of service and price. The relative importance of these factors can vary over time based on market conditions. The ability to develop improved equipment and techniques and to train and retain skilled personnel is also an important competitive factor in our markets. Demand for ROVs has been decreasing since mid 2014 due to the oil price environment, and our margins have decreased in recent periods due to lower utilization and pricing pressure, as price has become a more important factor in the current oil price environment.
Subsea Products. There are many competitors offering specialized products. We are one of several companies that compete on a worldwide basis for the provision of thermoplastic and steel tube subsea control umbilicals, and compared to current and forecasted market demand, we are faced with overcapacity in the umbilical manufacturing market.
Subsea Projects. We perform subsea intervention and hardware installation services, principally in the U.S. Gulf of Mexico and offshore Angola and India, from two owned and three chartered multiservice deepwater vessels. We are one of many companies that offer these services. In general, our competitors can move their vessels to where we operate from other locations with relative ease. We also have many competitors that supply commercial diving services to the oil and gas industry in the U.S. Gulf of Mexico. Our survey and positioning services are similarly competitive.
Asset Integrity. The worldwide asset integrity and inspection markets consist of a wide range of inspection and certification requirements in many industries. We compete in only selected portions of this market. We believe that our broad geographic sales and operational coverage, long history of operations, technical reputation, application of various pipeline inspection technologies and accreditation to international quality standards enable us to compete effectively in our selected asset integrity and inspection services market segments.
Advanced Technologies
Engineering services is a very broad market with a large number of competitors. We compete in specialized areas in which we can combine our extensive program management experience, mechanical engineering expertise and the capability to continue the development of conceptual project designs into the manufacture of custom equipment for customers.
8
SEASONALITY AND BACKLOG
We generate a material amount of our consolidated revenue from contracts for services in the U.S. Gulf of Mexico in our Subsea Projects segment, which is usually more active in the second and third quarters, as compared to the rest of the year. The European operations of our Asset Integrity segment are also seasonally more active in the second and third quarters. Revenue in our ROV segment is subject to seasonal variations in demand, with our first quarter generally being the low quarter of the year. The level of our ROV seasonality depends on the number of ROVs we have engaged in vessel-based subsea infrastructure inspection, maintenance, repair and installation, which is more seasonal than drilling support. Revenue in each of our Subsea Products and Advanced Technologies segments has generally not been seasonal.
The amounts of backlog orders we believed to be firm as of December 31, 2016 and 2015 were as follows (in millions):
As of December 31, 2016 | As of December 31, 2015 | ||||||||||||||
Total | 1+ yr* | Total | 1+ yr* | ||||||||||||
Oilfield | |||||||||||||||
ROVs | $ | 498 | $ | 263 | $ | 890 | $ | 459 | |||||||
Subsea Products | 431 | 91 | 652 | 189 | |||||||||||
Subsea Projects | 149 | — | 376 | 46 | |||||||||||
Asset Integrity | 280 | 124 | 427 | 211 | |||||||||||
Total Oilfield | 1,358 | 478 | 2,345 | 905 | |||||||||||
Advanced Technologies | 195 | 29 | 170 | 39 | |||||||||||
Total | $ | 1,553 | $ | 507 | $ | 2,515 | $ | 944 | |||||||
* Represents amounts that were not expected to be performed within one year.
No material portion of our business is subject to renegotiation of profits or termination of contracts by the U.S. government.
PATENTS AND LICENSES
We currently hold numerous of U.S. and foreign patents and pending patent applications. We have acquired patents and licenses and granted licenses to others when we have considered it advantageous for us to do so. Although in the aggregate our patents and licenses are important to us, we do not regard any single patent or license or group of related patents or licenses as critical or essential to our business as a whole. In general, we depend on our technological capabilities and the application of know-how rather than patents and licenses in the conduct of our operations.
REGULATION
Our operations are affected from time to time and in varying degrees by foreign and domestic political developments and foreign, federal and local laws and regulations, including those relating to:
• | operating from and around offshore drilling, production and marine facilities; |
• | national preference for local equipment and personnel; |
• | marine vessel safety; |
• | protection of the environment; |
• | workplace health and safety; |
• | taxation of earnings; |
• | license requirements for exportation of our equipment and technology; and |
• | currency conversion and repatriation. |
9
In addition, our Oilfield business depends on the demand for our services and products from the oil and gas industry and, therefore, is affected by changing taxes, price controls and other laws and regulations relating to the oil and gas industry generally. The adoption of laws and regulations curtailing offshore exploration and development drilling for oil and gas for economic and other policy reasons would adversely affect our operations by limiting demand for our services. We cannot determine the extent to which new legislation, new regulations or changes in existing laws or regulations may affect our future operations.
Our operations and properties are subject to a wide variety of increasingly complex and stringent foreign, federal, state and local environmental laws and regulations, including those governing discharges into the air and water, the handling and disposal of solid and hazardous wastes, the remediation of soil and groundwater contaminated by hazardous substances and the health and safety of employees. Sanctions for noncompliance may include revocation of permits, corrective action orders, administrative or civil penalties and criminal prosecution. Some environmental laws provide for strict, joint and several liability for remediation of spills and other releases of hazardous substances, as well as damage to natural resources. In addition, companies may be subject to claims alleging personal injury or property damage as a result of alleged exposure to hazardous substances. These laws and regulations may also expose us to liability for the conduct of or conditions caused by others, or for our acts that were in compliance with all applicable laws at the time such acts were performed.
Environmental laws and regulations that apply to our operations include the Comprehensive Environmental Response, Compensation, and Liability Act of 1980, the Clean Air Act, the Clean Water Act, the Resource Conservation and Recovery Act (each, as amended) and similar laws that provide for responses to, and liability for, releases of hazardous substances into the environment. Environmental laws and regulations also include similar foreign, state or local counterparts to the above-mentioned federal laws, which regulate air emissions, water discharges, hazardous substances and waste, and require public disclosure related to the use of various hazardous substances. Our operations are also governed by laws and regulations relating to workplace safety and worker health, primarily, in the United States, the Occupational Safety and Health Act and regulations promulgated thereunder.
Compliance with federal, state and local provisions regulating the discharge of materials into the environment or relating to the protection of the environment has not had a material impact on our capital expenditures, earnings or competitive position. We cannot predict all of the environmental requirements or circumstances that will exist in the future but anticipate that environmental control and protection standards will become increasingly stringent and costly. Based on our experience to date, we do not currently anticipate any material adverse effect on our business or consolidated financial position, results of operations or cash flows as a result of future compliance with existing environmental laws and regulations. However, future events, such as changes in existing laws and regulations or their interpretation, more vigorous enforcement policies of regulatory agencies, or stricter or different interpretations of existing laws and regulations, may require additional expenditures by us, which may be material. Accordingly, there can be no assurance that we will not incur significant environmental compliance costs in the future.
Our quality management systems are registered as being in conformance with ISO 9001:2000 and cover:
• | all our Oilfield services and products in the United Kingdom and Norway; |
• | our Remotely Operated Vehicle operations in the U.S. Gulf of Mexico, Brazil, Canada, the Middle East, Australia and Asia; |
• | our Asset Integrity operations in the Western Hemisphere, the Middle East, Australia and Indonesia; |
• | our Subsea Projects operations, except for shallow water diving; |
• | our Subsea Products segment; and |
• | the Oceaneering Space Systems, Oceaneering Technologies, Entertainment and Marine Services units of our Advanced Technologies segment. |
10
ISO 9001 is an internationally recognized system for quality management established by the International Standards Organization, and the 2000 edition emphasizes customer satisfaction and continual improvement.
EMPLOYEES
As of December 31, 2016, we had approximately 9,300 employees. Taking into account reductions in workforce we announced in 2016 to take effect in 2017, we would have approximately 8,800 employees. Our workforce varies seasonally and peaks during the second and third quarters. We consider our relations with our employees to be satisfactory.
FINANCIAL INFORMATION ABOUT GEOGRAPHIC AREAS
For financial information about our geographic areas of operation, please see the tables in Note 7 of the Notes to Consolidated Financial Statements in this report, which present revenue for 2016, 2015 and 2014 and long-lived assets as of December 31, 2016 and 2015 attributable to each of our major geographic areas. For a discussion of risks attendant to our foreign operations, see the discussion in Item 1A, "Risk Factors" under the heading "Our international operations involve additional risks not associated with domestic operations."
CAUTIONARY STATEMENT CONCERNING FORWARD-LOOKING STATEMENTS
We are including the following discussion to inform our existing and potential security holders generally of some of the risks and uncertainties that can affect our company and to take advantage of the "safe harbor" protection for forward-looking statements that applicable federal securities law affords.
From time to time, our management or persons acting on our behalf make forward-looking statements to inform existing and potential security holders about our company. These statements may include projections and estimates concerning the timing and success of specific projects and our future orders, revenue, income and capital spending. Forward-looking statements are generally accompanied by words such as "estimate," "plan," "project," "predict," "believe," "expect," "anticipate," "plan," "forecast," "budget," "goal," "may," "should," or other words that convey the uncertainty of future events or outcomes. In addition, sometimes we will specifically describe a statement as being a forward-looking statement and refer to this cautionary statement.
In addition, various statements this report contains, including those that express a belief, expectation or intention are forward-looking statements. Those forward-looking statements appear in Part I of this report in Item 1 – "Business," Item 2 – "Properties" and Item 3 – "Legal Proceedings" and in Part II of this report in Item 7 – "Management's Discussion and Analysis of Financial Condition and Results of Operations," Item 7A – "Quantitative and Qualitative Disclosures About Market Risk" and in the Notes to Consolidated Financial Statements incorporated into Item 8 and elsewhere in this report. These forward-looking statements speak only as of the date of this report, we disclaim any obligation to update these statements, and we caution you not to rely unduly on them. We have based these forward-looking statements on our current expectations and assumptions about future events. While our management considers these expectations and assumptions to be reasonable, they are inherently subject to significant business, economic, competitive, regulatory and other risks, contingencies and uncertainties, most of which are difficult to predict and many of which are beyond our control. These risks, contingencies and uncertainties relate to, among other matters, the following:
• | worldwide demand for and prices of oil and gas; |
• | changes in, or our ability to comply with, government regulations, including those relating to the environment; |
• | the continued availability of qualified personnel; |
• | general economic and business conditions and industry trends; |
• | the volatility and uncertainties of credit markets; |
• | the highly competitive nature of our businesses; |
• | decisions about offshore developments to be made by oil and gas exploration, development and production companies; |
11
• | cancellations of contracts, change orders and other contractual modifications and the resulting adjustments to our backlog; |
• | collections from our customers; |
• | the use of subsea completions and our ability to capture associated market share; |
• | the strength of the industry segments in which we are involved; |
• | the levels of oil and gas production to be processed by the Medusa field production spar platform; |
• | our future financial performance, including availability, terms and deployment of capital; |
• | the consequences of significant changes in currency exchange rates; |
• | changes in tax laws, regulations and interpretation by taxing authorities; |
• | our ability to obtain raw materials and parts on a timely basis and, in some cases, from limited sources; |
• | operating risks normally incident to offshore exploration, development and production operations; |
• | hurricanes and other adverse weather and sea conditions; |
• | cost and time associated with drydocking of our vessels; |
• | adverse outcomes from legal or regulatory proceedings; |
• | the risks associated with integrating businesses we acquire; |
• | rapid technological changes; and |
• | social, political, military and economic situations in foreign countries where we do business and the possibilities of civil disturbances, war, other armed conflicts or terrorist attacks. |
We believe the items we have outlined above are important factors that could cause our actual results to differ materially from those expressed in a forward-looking statement made in this report or elsewhere by us or on our behalf. We have discussed most of these factors in more detail elsewhere in this report. These factors are not necessarily all the factors that could affect us. Unpredictable or unanticipated factors we have not discussed in this report could also have material adverse effects on actual results of matters that are the subject of our forward-looking statements. We do not intend to update our description of important factors each time a potential important factor arises. We advise our security holders that they should (1) be aware that important factors we do not refer to above could affect the accuracy of our forward-looking statements and (2) use caution and common sense when considering our forward-looking statements.
AVAILABLE INFORMATION
Our Web site address is www.oceaneering.com. We make available through this Web site under "Investor Relations — SEC Financial Reports," free of charge, our annual reports on Form 10-K, quarterly reports on Form 10-Q, current reports on Form 8-K, amendments to those reports and Section 16 filings by our directors and executive officers as soon as reasonably practicable after we, or our executive officers or directors, as the case may be, electronically file those materials with, or furnish those materials to, the SEC. You may read and copy any materials we file with the SEC at the SEC's Public Reference Room at 100 F Street, NE, Washington, DC 20549. You may obtain information regarding the Public Reference Room by calling the SEC at 1-800-SEC-0330. In addition, the SEC maintains a Web site, www.sec.gov, which contains reports, proxy and other information statements, and other information regarding issuers that file electronically with the SEC.
We have adopted, and posted on our Web site: our corporate governance guidelines; a code of ethics for our Chief Executive Officer and Senior Financial Officers; and charters for the Audit, Nominating and Corporate Governance and Compensation Committees of our Board of Directors.
12
EXECUTIVE OFFICERS OF THE REGISTRANT
Executive Officers. The following information relates to our executive officers as of February 17, 2017:
NAME | AGE | POSITION | OFFICER SINCE | EMPLOYEE SINCE | |||||
M. Kevin McEvoy | 66 | Chief Executive Officer and Director | 1990 | 1979 | |||||
Roderick A. Larson | 50 | President | 2012 | 2012 | |||||
Clyde W. Hewlett | 62 | Chief Operating Officer | 2004 | 1988 | |||||
Alan R. Curtis | 51 | Senior Vice President and Chief Financial Officer | 2014 | 1995 | |||||
W. Cardon Gerner | 62 | Senior Vice President and Chief Accounting Officer | 2006 | 2006 | |||||
David K. Lawrence | 57 | Senior Vice President, General Counsel and Secretary | 2012 | 2005 | |||||
Stephen P. Barrett | 59 | Senior Vice President, Business Development | 2015 | 2015 | |||||
William J. Boyle | 55 | Senior Vice President, Asset Integrity | 2016 | 2016 | |||||
John R. Kreider | 65 | Senior Vice President, Advanced Technologies | 2001 | 1992 | |||||
Martin J. McDonald | 53 | Senior Vice President, Remotely Operated Vehicles | 2016 | 1989 | |||||
Each executive officer serves at the discretion of our Chief Executive Officer and our Board of Directors and is subject to reelection or reappointment each year after the annual meeting of our shareholders. We do not know of any arrangement or understanding between any of the above persons and any other person or persons pursuant to which he was selected or appointed as an officer.
Business Experience. The following summarizes the business experience of our executive officers. Except where we otherwise indicate, each of these persons has held his current position with Oceaneering for at least the past five years.
M. Kevin McEvoy, Chief Executive Officer, joined Oceaneering in 1984 when we acquired Solus Ocean Systems, Inc. Since 1984, he has held various senior management positions in each of our operating groups. He was appointed a Vice President in 1990, a Senior Vice President in 1998, Executive Vice President in 2006 and to the additional office of Chief Operating Officer in February 2010, and became President and Chief Executive Officer and a director of Oceaneering in May 2011.
Roderick A. Larson joined Oceaneering in May 2012 as Senior Vice President and Chief Operating Officer and became President in February 2015. Mr. Larson previously held positions with Baker Hughes Incorporated from 1990 until he joined Oceaneering, serving most recently as President, Latin America Region from January 2011. Previously, he served as Vice President of Operations, Gulf of Mexico Region from 2009 to 2011, Gulf Coast Area Manager from 2007 to 2009, and Special Projects Leader Technical Training Task from 2006 to 2007.
Clyde W. Hewlett, Chief Operating Officer, has extensive experience in the offshore and subsea oilfield markets. He joined Oceaneering in 1988 and has held increasingly responsible positions. He has served as our Vice President of Mobile Offshore Production Systems, Vice President of Subsea Projects, Senior Vice President of Subsea Projects and Senior Vice President, Subsea Services. He was promoted to his current position in August 2015.
Alan R. Curtis, Senior Vice President and Chief Financial Officer, joined Oceaneering in 1995 as the Financial and Operations Controller for our Subsea Products segment, and became Vice President and Controller of Subsea Products in 2013 and Senior Vice President, Operations Support in 2014. He was appointed to his current position in August 2015. He is a Certified Public Accountant and Chartered Global Management Accountant.
W. Cardon Gerner, Senior Vice President and Chief Accounting Officer, joined Oceaneering in 2006 as Vice President and Chief Accounting Officer, and became a Senior Vice President in August 2011 and served as our Chief Financial Officer from that date until August 2015. From 1999 to 2006, he held
13
various financial positions with Service Corporation International, a global provider of death-care services, serving as Vice President Accounting from 2002 to 2006. He also served as Senior Vice President and Chief Financial Officer of Equity Corporation International from 1995 to 1999. He is a Certified Public Accountant.
David K. Lawrence, Senior Vice President, General Counsel and Secretary, joined Oceaneering in 2005 as Assistant General Counsel. He was appointed Associate General Counsel effective January 2011, Vice President, General Counsel and Secretary in January 2012 and to his current position in February 2014. He has over 20 years experience as in-house counsel in the oilfield services and products industry and manufacturing.
Stephen P. Barrett, Senior Vice President, Business Development, joined Oceaneering in July 2015 as Senior Vice President, Subsea Products. He was appointed to his current position in November 2016. Prior to joining Oceaneering, he served at FMC Technologies beginning in 1982, progressing through a variety of engineering, sales and marketing, and general management roles. His last three roles at FMC Technologies were Western Region Subsea General Manager, Global Subsea Products Director and Global Subsea Services Director.
William J. Boyle, Senior Vice President, Asset Integrity, joined Oceaneering in March 2016. Prior to joining Oceaneering, Mr. Boyle held the position of Chief Executive Officer with Underwater Integrity Solutions from November 2014 until December 2015. Previously, Mr. Boyle held senior leadership positions at Forum Energy Technologies, Inc. from 2013 to 2014, Clough Limited from 2008 to 2012, Subsea 7 S.A. from 2005 to 2008, John Wood Group PLC from 2003 to 2005 and Technip S.A. from 1991 to 2003.
John R. Kreider, Senior Vice President, Advanced Technologies, joined Oceaneering as a Vice President in 1992 when we acquired Eastport International, Inc. Since 1992, he has held various senior management positions in our Advanced Technologies segment. He was appointed Senior Vice President, Advanced Technologies in October 2001.
Martin J. McDonald, Senior Vice President, Remotely Operated Vehicles, joined Oceaneering in 1989. He has held a variety of domestic and international positions of increasing responsibility in our ROV segment and most recently served as Vice President and General Manager for our ROV operations in the Eastern Hemisphere from 2006 until being appointed to his current position effective January 2016.
14
Item 1A. | Risk Factors. |
We are subject to various risks and uncertainties in the course of our business. The following summarizes significant risks and uncertainties that may materially and adversely affect our business, financial condition, results of operations or cash flows and the market value of our securities. Investors in our company should consider these matters, in addition to the other information we have provided in this report and the documents we incorporate by reference.
We derive most of our revenue from companies in the offshore oil and gas industry, a historically cyclical industry with levels of activity that are significantly affected by the levels and volatility of oil and gas prices.
We derive most of our revenue from customers in the offshore oil and gas exploration, development and production industry. The offshore oil and gas industry is a historically cyclical industry characterized by significant changes in the levels of exploration and development activities. Oil and gas prices, and market expectations of potential changes in those prices, significantly affect the levels of those activities. Worldwide political, economic and military events have contributed to oil and gas price volatility and are likely to continue to do so in the future. Since the general decline in the price of oil from mid 2014, many oil and gas companies made significant reductions in their capital and operating expenditures, which are adversely impacting demand for the services and products provided by our Oilfield business. Any prolonged reduction in the overall level of offshore oil and gas exploration and development activities, whether resulting from changes in oil and gas prices or otherwise, could materially and adversely affect our financial condition and results of operations in our segments within our Oilfield business. Some factors that have affected and are likely to continue affecting oil and gas prices and the level of demand for our services and products include the following:
• | worldwide demand for oil and gas; |
• | general economic and business conditions and industry trends; |
• | the ability of the Organization of Petroleum Exporting Countries, or OPEC, to set and maintain production levels; |
• | the level of production by non-OPEC countries, including U.S. shale oil; |
• | the ability of oil and gas companies to generate funds for capital expenditures; |
• | domestic and foreign tax policy; |
• | laws and governmental regulations that restrict exploration and development of oil and gas in various offshore jurisdictions; |
• | technological changes; |
• | the political environment of oil-producing regions; |
• | the price and availability of alternative fuels; and |
• | overall economic conditions. |
Our operations could be adversely impacted by the effects of new regulations.
During 2010, the U.S. government established new regulations relating to the design of wells and testing of the integrity of wellbores, the use of drilling fluids, the functionality and testing of well control equipment, including blowout preventers, and other safety and environmental regulations. The U.S. government is requiring that operators demonstrate their compliance with those regulations before commencing deepwater drilling operations. Changes in laws or regulations regarding offshore oil and gas exploration and development activities, the cost or availability of insurance and the impacts of these factors on decisions by customers or other industry participants could further reduce demand for our services, which would have a negative impact on our operations.
15
Our international operations involve additional risks not associated with domestic operations.
A significant portion of our revenue is attributable to operations in foreign countries. These activities accounted for approximately 57% of our consolidated revenue in 2016. Risks associated with our operations in foreign areas include risks of:
• | regional and global economic downturns; |
• | disturbances or other risks that may limit or disrupt markets; |
• | expropriation, confiscation or nationalization of assets; |
• | renegotiation or nullification of existing contracts; |
• | foreign exchange restrictions; |
• | foreign currency fluctuations, particularly in countries highly dependent on oil revenue; |
• | foreign taxation, including the application and interpretation of tax laws; |
• | the inability to repatriate earnings or capital; |
• | changing political conditions; |
• | changing foreign and domestic monetary policies; and |
• | social, political, military and economic situations in foreign areas where we do business and the possibilities of civil disturbances, war, other armed conflict, terrorist attacks or acts of piracy. |
Additionally, in some jurisdictions we are subject to foreign governmental regulations favoring or requiring the awarding of contracts to local contractors or requiring foreign contractors to employ citizens of, or purchase supplies from, a particular jurisdiction. These regulations may adversely affect our ability to compete.
Our exposure to the risks we described above varies from country to country. In recent periods, economic conditions, political instability and civil unrest in Africa have been our greatest concerns. There is a risk that a continuation or worsening of these conditions could materially and adversely impact our future business, operations, financial condition and results of operations. Of our total consolidated revenue for 2016, we generated approximately 21% from our operations in Africa, primarily in Angola.
Foreign exchange risks and fluctuations may affect our profitability on certain projects.
We operate on a worldwide basis with substantial operations outside the U.S. that subject us to U.S. dollar translation and economic risks. In order to manage some of the risks associated with foreign currency exchange rates, we may enter into foreign currency derivative (hedging) instruments, especially when there is currency risk exposure that is not naturally mitigated via our contracts. However, these actions may not always eliminate all currency risk exposure, in particular for our long-term contracts. A disruption in the foreign currency markets, including the markets with respect to any particular currencies, could adversely affect our hedging instruments and subject us to additional currency risk exposure. Based on fluctuations in currency, the U.S. dollar value of our backlog may from time to time increase or decrease significantly. We do not enter into derivative instruments for trading or other speculative purposes. Our operational cash flows and cash balances, though predominately held in U.S. dollars, may consist of different currencies at various points in time in order to execute our contracts globally. Non-U.S. asset and liability balances are subject to currency fluctuations when measured period to period for financial reporting purposes in U.S. dollars.
Our backlog is subject to unexpected adjustments and cancellations and is, therefore, an uncertain indicator of our future revenues and earnings.
There can be no assurance that the revenues included in our backlog will be realized or, if realized, will result in profits. Because of project cancellations or potential changes in the scope or schedule of our customers' projects, we cannot predict with certainty when or if backlog will be realized. Material delays, suspensions, cancellations or payment defaults could materially affect our financial condition, results of operations and cash flows. We may be at greater risk of delays, suspensions and cancellations in the current oil price environment.
16
Reductions in our backlog due to cancellation by a customer or for other reasons would adversely affect, potentially to a material extent, the revenues and earnings we actually receive from contracts included in our backlog. Many of our ROV contracts have 30-day notice termination clauses. Some of the contracts in our backlog provide for cancellation fees in the event customers cancel projects. These cancellation fees usually provide for reimbursement of our out-of-pocket costs, revenues for work performed prior to cancellation and a varying percentage of the profits we would have realized had the contract been completed. We typically have no contractual right upon cancellation to the total contract revenues as reflected in our backlog. If we experience significant project terminations, suspensions or scope adjustments to contracts reflected in our backlog, our financial condition, results of operations and cash flows may be adversely impacted.
A global financial crisis could impact our business and financial condition in ways that we currently cannot predict.
A recurrence of the credit crisis and related turmoil in the global financial system that occurred in 2008 and 2009 could have an impact on our business and our financial condition. In particular, the cost of capital increased substantially while the availability of funds from the capital markets diminished significantly. Although the capital markets have recovered, in a recurrence, our ability to access the capital markets in the future could be restricted or be available only on terms we do not consider favorable. Limited access to the capital markets could adversely impact our ability to take advantage of business opportunities or react to changing economic and business conditions and could adversely impact our ability to continue our growth strategy. Ultimately, we could be required to reduce our future capital expenditures substantially. Such a reduction could have a material adverse effect on our business and our consolidated financial condition, results of operations and cash flows. A recurrence of such a global financial crisis could have further impacts on our business that we currently cannot predict or anticipate.
A global financial crisis or economic recession could have an impact on our suppliers and our customers, causing them to fail to meet their obligations to us, which could have a material adverse effect on our revenue, income from operations and cash flows.
If one or more of the lenders under our revolving credit facility were to become unable or unwilling to perform their obligations under that facility, our borrowing capacity could be reduced. Our inability to borrow under our revolving credit facility could limit our ability to fund our future operations and growth.
In addition, we maintain our cash balances and short-term investments in accounts held by major banks and financial institutions located principally in North America, Europe, Africa and Asia, and some of those accounts hold deposits that exceed available insurance. It is possible that one or more of the financial institutions in which we hold our cash and investments could become subject to bankruptcy, receivership or similar proceedings. As a result, we could be at risk of not being able to access material amounts of our cash, which could result in a temporary liquidity crisis that could impede our ability to fund operations.
Employee, agent or partner misconduct or our overall failure to comply with laws or regulations could weaken our ability to win contracts, which could result in reduced revenues and profits.
Misconduct, fraud, non-compliance with applicable laws and regulations, or other improper activities by one or more of our employees, agents or partners could have a significant negative impact on our business and reputation. Such misconduct could include the failure to comply with the U.S. Foreign Corrupt Practices Act ("FCPA"), which prohibits companies and their intermediaries from making improper payments to non-U.S. officials, as well as the failure to comply with government procurement regulations, regulations on lobbying or similar activities, regulations pertaining to the internal controls over financial reporting and various other applicable laws or regulations, including the U.K. Bribery Act. We operate in some countries that international corruption monitoring groups have identified as having high levels of corruption. Our activities create the risk of unauthorized payments or offers of payments by one of our employees or agents that could be in violation of the FCPA or other applicable anti-corruption laws. The precautions we take to prevent and detect misconduct, fraud or non-compliance with applicable laws and regulations may not be effective, and
17
we could face unknown risks or losses. Our failure to comply with applicable laws or regulations or acts of misconduct could subject us to fines, penalties or other sanctions, which could have a material adverse effect on our business and our consolidated financial condition, results of operations and cash flows.
Our business strategy contemplates future acquisitions. Acquisitions of other businesses or assets present various risks and uncertainties.
We may pursue growth through the acquisition of businesses or assets that will enable us to broaden our service and product offerings and expand into new markets. We may be unable to implement this element of our growth strategy if we cannot identify suitable businesses or assets, reach agreement on potential strategic acquisitions on acceptable terms or for other reasons. Moreover, acquisitions involve various risks, including:
• | difficulties relating to the assimilation of personnel, services and systems of an acquired business and the assimilation of marketing and other operational capabilities; |
• | challenges resulting from unanticipated changes in customer and other third-party relationships subsequent to acquisition; |
• | additional financial and accounting challenges and complexities in areas such as tax planning, treasury management, financial reporting and internal controls; |
• | assumption of liabilities of an acquired business, including liabilities that were unknown at the time the acquisition transaction was negotiated; |
• | possible liabilities under the FCPA and other anti-corruption laws; |
• | diversion of management's attention from day-to-day operations; |
• | failure to realize anticipated benefits, such as cost savings and revenue enhancements; |
• | potentially substantial transaction costs associated with acquisitions; and |
• | potential impairment resulting from the overpayment for an acquisition. |
Future acquisitions may require us to obtain additional equity or debt financing, which may not be available on attractive terms. Moreover, to the extent an acquisition transaction financed by non-equity consideration results in goodwill, it will reduce our tangible net worth, which might have an adverse effect on credit availability.
Additionally, an acquisition may bring us into businesses we have not previously conducted and expose us to additional business risks that are different from those we have previously experienced.
Our business strategy also includes development and commercialization of new technologies to support our growth. The development and commercialization of new technologies require capital investment and involve various risks and uncertainties.
Our future growth will depend on our ability to continue to innovate by developing and commercializing new service and product offerings. Investments in new technologies involve varying degrees of uncertainties and risk. Commercial success depends on many factors, including the levels of innovation, the development costs and the availability of capital resources to fund those costs, the levels of competition from others developing similar or other competing technologies, our ability to obtain or maintain government permits or certifications, the effectiveness of production, distribution and marketing efforts, and the costs to customers to deploy and provide support for the new technologies. We may not achieve significant revenues from new service and product investments for a number of years, if at all. Moreover, new services and products may not be profitable, and, even if they are profitable, our operating margins from new services and products may not be as high as the margins we have experienced historically.
The loss of the services of one or more of our key personnel, or our failure to attract, assimilate and retain trained personnel in the future, could disrupt our operations and result in loss of revenues.
Our success depends on the continued active participation of our executive officers and key operating personnel. The unexpected loss of the services of any one of these persons could adversely affect our operations.
Our operations require the services of employees having the technical training and experience necessary to obtain the proper operational results. As a result, if we should suffer any material loss
18
of personnel to competitors or be unable to employ additional or replacement personnel with the requisite level of training and experience to adequately operate our equipment, our operations could be adversely affected. A significant increase in the wages paid by other employers could result in a reduction in our workforce, increases in wage rates, or both.
We may not be able to compete successfully against current and future competitors.
Our businesses operate in highly competitive industry segments. Some of our competitors or potential competitors have greater financial or other resources than we have. Our operations may be adversely affected if our current competitors or new market entrants introduce new products or services with better features, performance, prices or other characteristics than those of our services and products. This factor is significant to our segments' operations, particularly in the segments within our Oilfield business, where capital investment is critical to our ability to compete.
We rely on intellectual property law and confidentiality agreements to protect our intellectual property. We also rely on intellectual property we license from third parties. Our failure to protect our intellectual property rights, or our inability to obtain or renew licenses to use intellectual property of third parties, could adversely affect our business.
We rely on a variety of intellectual property rights that we use in our services and products, and our success depends, in part, on our ability to protect our proprietary information and other intellectual property. Our intellectual property could be challenged, invalidated, circumvented or rendered unenforceable. In addition, effective intellectual property protection may be limited or unavailable in some foreign countries where we operate.
Our failure to protect our intellectual property rights may result in the loss of valuable technologies or adversely affect our competitive business position. We rely significantly on proprietary technology, information, processes and know-how that are not subject to patent or copyright protection. We seek to protect this information through trade secret or confidentiality agreements with our employees, consultants, subcontractors or other parties, as well as through other security measures. These agreements and security measures may be inadequate to deter or prevent misappropriation of our confidential information. In the event of an infringement of our intellectual property rights, a breach of a confidentiality agreement or divulgence of proprietary information, we may not have adequate legal remedies to protect our intellectual property.
In some instances, we have augmented our technology base by licensing the proprietary intellectual property of third parties. However, it is possible that the tools, techniques, methodologies, programs and components we use to provide our services or products may infringe on the intellectual property rights of others. In the future, we may not be able to obtain necessary licenses on commercially reasonable terms. Royalty payments under licenses from third parties, if available, or developing non-infringing technologies could materially increase our costs. Additionally, if a license or non-infringing technology were not available, we might not be able to continue providing a particular service or product, which could materially and adversely affect our financial condition, results of operations and cash flows.
Litigation to determine the scope of intellectual property rights, even if ultimately successful, could be costly and could divert management's attention away from other aspects of our business. In addition, our trade secrets may otherwise become known or be independently developed by competitors.
Our information technology systems are subject to interruption and cybersecurity risks that could adversely impact our operations.
We continue to evaluate potential replacements or upgrades of existing key information technology systems. The implementation of new information technology systems or upgrades to existing systems subjects us to inherent costs and risks associated with replacing or changing these systems, including potential disruption of our internal control structure, substantial capital expenditures, demands on management time and other risks. Our possible new information technology systems implementations or upgrades may not result in productivity improvements at the levels anticipated, or at all. In addition, the implementation of new or upgraded information technology systems may cause disruptions in our business operations. Any such disruption, and any other information technology system disruptions, if not anticipated and appropriately mitigated, could have a material adverse effect on our operations.
19
Our operations (both onshore and offshore) are highly dependent on information technology systems. Threats to our information technology systems associated with cybersecurity risks and cyber incidents or attacks continue to grow. In addition, breaches to our systems could go unnoticed for some period of time. Risks associated with these threats include disruptions of certain systems on our vessels or utilized to operate our ROVs; other impairments of our ability to conduct our operations; loss of or damage to intellectual property, proprietary information or customer data; disruption of our customers’ operations; loss or damage to our customer data delivery systems; and increased costs to prevent, respond to or mitigate cybersecurity incidents. If such a cyber-incident were to occur, it could have a material adverse effect on our business and our consolidated financial condition, results of operations and cash flows.
Our offshore oilfield operations involve a variety of operating hazards and risks that could cause losses.
Our operations are subject to the hazards inherent in the offshore oilfield business. These include blowouts, explosions, fires, collisions, capsizings and severe weather conditions. These hazards could result in personal injury and loss of life, severe damage to or destruction of property and equipment, pollution or environmental damage and suspension of operations. We may incur substantial liabilities or losses as a result of these hazards. While we maintain insurance protection against some of these risks, and seek to obtain indemnity agreements from our customers requiring the customers to hold us harmless from some of these risks, our insurance and contractual indemnity protection may not be sufficient or effective to protect us under all circumstances or against all risks. The occurrence of a significant event not fully insured or indemnified against or the failure of a customer to meet its indemnification obligations to us could materially and adversely affect our results of operations and financial condition.
Laws and governmental regulations may add to our costs or adversely affect our operations.
Our business is affected by changes in public policy and by federal, state, local and foreign laws and regulations relating to the offshore oil and gas industry. Offshore oil and gas exploration and production operations are affected by tax, environmental, safety and other laws, by changes in those laws, application or interpretation of existing laws, and changes in related administrative regulations. It is also possible that these laws and regulations may in the future add significantly to our operating costs or those of our customers or otherwise directly or indirectly affect our operations.
Environmental laws and regulations can increase our costs, and our failure to comply with those laws and regulations can expose us to significant liabilities.
Risks of substantial costs and liabilities related to environmental compliance issues are inherent in our operations. Our operations are subject to extensive federal, state, local and foreign laws and regulations relating to the generation, storage, handling, emission, transportation and discharge of materials into the environment. Permits are required for the operation of various facilities, and those permits are subject to revocation, modification and renewal. Governmental authorities have the power to enforce compliance with their regulations, and violations are subject to fines, injunctions or both. In some cases, those governmental requirements can impose liability for the entire cost of cleanup on any responsible party without regard to negligence or fault and impose liability on us for the conduct of or conditions others have caused, or for our acts that complied with all applicable requirements when we performed them. It is possible that other developments, such as stricter environmental laws and regulations, and claims for damages to property or persons resulting from our operations, would result in substantial costs and liabilities. Our insurance policies and the contractual indemnity protection we seek to obtain from our customers may not be sufficient or effective to protect us under all circumstances or against all risks involving compliance with environmental laws and regulations.
Our internal controls may not be sufficient to achieve all stated goals and objectives.
Our internal controls and procedures were developed through a process in which our management applied its judgment in assessing the costs and benefits of such controls and procedures, which, by their nature, can provide only reasonable assurance regarding the control objectives. The design of any system of internal controls and procedures is based, in part, on various assumptions about the likelihood of future events. We cannot assure that any design will succeed in achieving its stated goals under all potential future conditions, regardless of how remote.
20
The use of estimates could result in future adjustments to our assets, liabilities and results of operations.
The preparation of financial statements in conformity with accounting principles generally accepted in the United States requires that our management make estimates and assumptions that affect the reported amounts of assets and liabilities, disclosure of contingent assets and liabilities at the date of the financial statements and the reported amounts of revenue and expense during the reporting period. Actual results could differ from those estimates.
We may issue preferred stock whose terms could adversely affect the voting power or value of our common stock.
Our certificate of incorporation authorizes us to issue, without the approval of our shareholders, one or more classes or series of preferred stock having such preferences, powers and relative, participating, optional and other rights, including preferences over our common stock respecting dividends and distributions, as our board of directors may determine. The terms of one or more classes or series of preferred stock could adversely impact the voting power or value of our common stock. For example, we might grant holders of preferred stock the right to elect some number of our directors in all events or on the happening of specified events or the right to veto specified transactions. Similarly, the repurchase or redemption rights or liquidation preferences we might assign to holders of preferred stock could affect the residual value of the common stock.
Provisions in our corporate documents and Delaware law could delay or prevent a change in control of our company, even if that change would be beneficial to our shareholders.
The existence of some provisions in our corporate documents and Delaware law could delay or prevent a change in control of our company, even if that change would be beneficial to our shareholders. Our certificate of incorporation and bylaws contain provisions that may make acquiring control of our company difficult, including:
• | provisions relating to the classification, nomination and removal of our directors; |
• | provisions regulating the ability of our shareholders to bring matters for action at annual meetings of our shareholders; |
• | provisions requiring the approval of the holders of at least 80% of our voting stock for a broad range of business combination transactions with related persons; and |
• | the authorization given to our board of directors to issue and set the terms of preferred stock. |
In addition, the Delaware General Corporation Law imposes restrictions on mergers and other business combinations between us and any holder of 15% or more of our outstanding common stock.
Item 1B. | Unresolved Staff Comments. |
None.
Item 2. | Properties. |
We maintain office, shop and yard facilities in various parts of the world to support our operations. We consider these facilities, which we describe below, to be suitable for their intended use. In these locations, we typically own or lease office facilities for our administrative and engineering staff, shops equipped for fabrication, testing, repair and maintenance activities and warehouses and yard areas for storage and mobilization of equipment to work sites. All sites are available to support any of our business segments as the need arises. The groupings that follow associate our significant offices with the primary business segment they serve.
Oilfield. In general, our Oilfield business segments share facilities. Our location in Morgan City, Louisiana consists of ROV manufacturing and training facilities, vessel docking facilities, open and covered warehouse space and offices. The Morgan City facilities primarily support operations in the United States. We have regional support offices for our North Sea, Africa, Brazil and Southeast Asia operations in: Aberdeen, Scotland; Stavanger and Bergen, Norway; Dubai, U.A.E.; Rio de Janeiro and Macaé, Brazil; Luanda, Angola; Chandigarh, India; Perth, Australia; Kuala Lumpur, Malaysia; and Singapore. We also have operational bases in various other locations.
21
We use workshop and office space in Houston, Texas in our Subsea Products, Subsea Projects and Asset Integrity business segments. Our principal manufacturing facilities for our Subsea Products segment are located in or near: Houston, Texas; Panama City, Florida; Aberdeen and Rosyth, Scotland; Nodeland and Stavanger, Norway; Perth, Australia; Luanda, Angola; and Niterói and Macaé, Brazil. Each of these manufacturing facilities is suitable for its intended purpose and has sufficient capacity to respond to increases in demand for our subsea products that may be reasonably anticipated in the foreseeable future.
For a description of the vessels we use in our Subsea Projects operations, see the discussion in Item 1. "Business" under the heading "GENERAL DEVELOPMENT OF BUSINESS – Oilfield – Subsea Projects."
Advanced Technologies. Our primary facilities for our Advanced Technologies segment are leased offices and workshops in Hanover, Maryland. We have regional offices in Chesapeake, Virginia; Bremerton, Washington; Pearl Harbor, Hawaii; and San Diego, California, which support our services for the U.S. Navy. We also have an office in Orlando, Florida, which supports our commercial theme park animation activities, facilities in Utrecht, Netherlands, to support robotic activities, and facilities in Houston, Texas, to support our space industry activities.
Item 3. | Legal Proceedings. |
On June 17, 2014, Peter L. Jacobs, a purported shareholder, filed a derivative complaint against all of the then current members of our board of directors and one of our former directors, as defendants, and our company, as nominal defendant, in the Court of Chancery of the State of Delaware. Through the complaint, the plaintiff is asserting, on behalf of our company, actions for breach of fiduciary duties and unjust enrichment in connection with prior determinations of our board of directors relating to nonexecutive director compensation. The plaintiff is seeking relief including disgorgement of payments made to the defendants, an award of unspecified damages and an award for attorneys’ fees and other costs. We and the defendants filed a motion to dismiss the complaint and a supporting brief on which the Court has not yet ruled. In any event, our company is only a nominal defendant in this litigation, and we do not expect the resolution of this matter to have a material adverse effect on our results of operations, cash flows or financial position.
In the ordinary course of business, we are subject to actions for damages alleging personal injury under the general maritime laws of the United States, including the Jones Act, for alleged negligence. We report actions for personal injury to our insurance carriers and believe that the settlement or disposition of those claims will not have a material adverse effect on our consolidated financial position, results of operations or cash flows.
Various other actions and claims are pending against us, most of which are covered by insurance. Although we cannot predict the ultimate outcome of these matters, we believe that our ultimate liability, if any, that may result from these other actions and claims will not materially affect our results of operations, cash flows or financial position.
Item 4. | Mine Safety Disclosures. |
Not applicable.
22
Part II
Item 5. | Market for Registrant's Common Equity, Related Stockholder Matters and Issuer Purchases of Equity Securities. |
Our common stock is listed on the New York Stock Exchange under the symbol OII. We submitted to the New York Stock Exchange during 2016 a certification of our Chief Executive Officer regarding compliance with the Exchange's corporate governance listing standards. We also included as exhibits to this annual report on Form 10-K, as filed with the SEC, the certifications of our principal executive officer and principal financial officer required under Section 302 of the Sarbanes-Oxley Act of 2002.
The following table sets out, for the periods indicated, the high and low sales prices for our common stock as reported on the New York Stock Exchange (consolidated transaction reporting system):
2016 | 2015 | ||||||||||||||
High | Low | High | Low | ||||||||||||
For the quarter ended: | |||||||||||||||
March 31 | $ | 39.04 | $ | 25.33 | $ | 59.37 | $ | 48.37 | |||||||
June 30 | 36.92 | 28.36 | 59.65 | 46.05 | |||||||||||
September 30 | 31.55 | 24.33 | 46.86 | 37.00 | |||||||||||
December 31 | 32.12 | 22.47 | 48.11 | 36.87 | |||||||||||
On February 17, 2017, there were 433 holders of record of our common stock. On that date, the closing sales price, as quoted on the New York Stock Exchange, was $27.20. In 2016, we declared quarterly cash dividends of $0.27 per share in the first three quarters and $0.15 per share in the fourth quarter. In 2015, we declared quarterly cash dividends of $0.27 per share in each quarter. It is our intent to continue to pay a quarterly cash dividend; however, payment of future cash dividends will be at the discretion of our board of directors in accordance with applicable law, after taking into account various factors, including our financial condition, earnings, capital requirements, legal requirements, regulatory constraints, industry practice and any other factors that our board of directors believes are relevant.
In February 2010, our Board of Directors approved a program to repurchase up to 12 million shares of our common stock. Through December 31, 2014 under that program, we repurchased the 12 million shares of our common stock for $677 million.
In December 2014, following completion of the February 2010 program, our Board of Directors approved a new share repurchase program under which we may repurchase up to 10 million shares of our common stock on a discretionary basis. The December 2014 program calls for the repurchases to be made in the open market, or in privately negotiated transactions from time to time, in compliance with applicable laws, rules and regulations, including Rule 10b-18 under the Securities Exchange Act of 1934, as amended, subject to market and business conditions, levels of available liquidity, cash requirements for other purposes, applicable legal requirements and other relevant factors. The timing and amount of any repurchases will be determined by management based on its evaluation of these factors. We expect that any shares repurchased under the new program will be held as treasury stock for future use. The new program does not obligate us to repurchase any particular number of shares. Under the new program, we had repurchased 2.0 million shares of our common stock for $100 million through December 31, 2015. We did not repurchase any shares during 2016.
23
EQUITY COMPENSATION PLAN INFORMATION
The following presents equity compensation plan information as of December 31, 2016:
Plan Category | Number of securities to be issued upon exercise of outstanding options, warrants and rights | Weighted-average exercise price of outstanding options, warrants and rights | Number of securities remaining available for future issuance under equity compensation plans (excluding securities reflected in the first column) | |||||
Equity compensation plans approved by security holders | — | N/A | 1,068,572 | |||||
Equity compensation plans not approved by security holders | — | N/A | — | |||||
Total | — | N/A | 1,068,572 | |||||
We had no outstanding options, warrants or rights at December 31, 2016.
At December 31, 2016, there were: (1) no shares of Oceaneering common stock under equity compensation plans not approved by security holders available for grant; and (2) 1,068,572 shares of Oceaneering common stock under equity compensation plans approved by security holders available for grant in the form of stock options, stock appreciation rights or stock awards. We have not granted any stock options since 2005 and the Compensation Committee of our Board of Directors has expressed its intention to refrain from using stock options as a component of employee compensation for our executive officers and other employees for the foreseeable future. Additionally, our Board of Directors has expressed its intention to refrain from using stock options as a component of nonemployee director compensation for the foreseeable future. For a description of the material features of our equity compensation arrangements, see the discussion in Note 8 of Notes to Consolidated Financial Statements under the heading "Incentive Plan."
24
PERFORMANCE GRAPH
The following graph compares our total shareholder return to the Standard & Poor's 500 Stock Index ("S&P 500") and the PHLX Oil Service Sector Index from December 31, 2011 through December 31, 2016. The PHLX Oil Service Sector Index is designed to track the performance of a set of companies involved in the oil services sector.
It is assumed in the graph that: (1) $100 was invested in Oceaneering Common Stock, the S&P 500 and the PHLX Oil Service Sector Index on December 31, 2011; and (2) any Oceaneering dividends are reinvested. The shareholder return shown is not necessarily indicative of future performance.
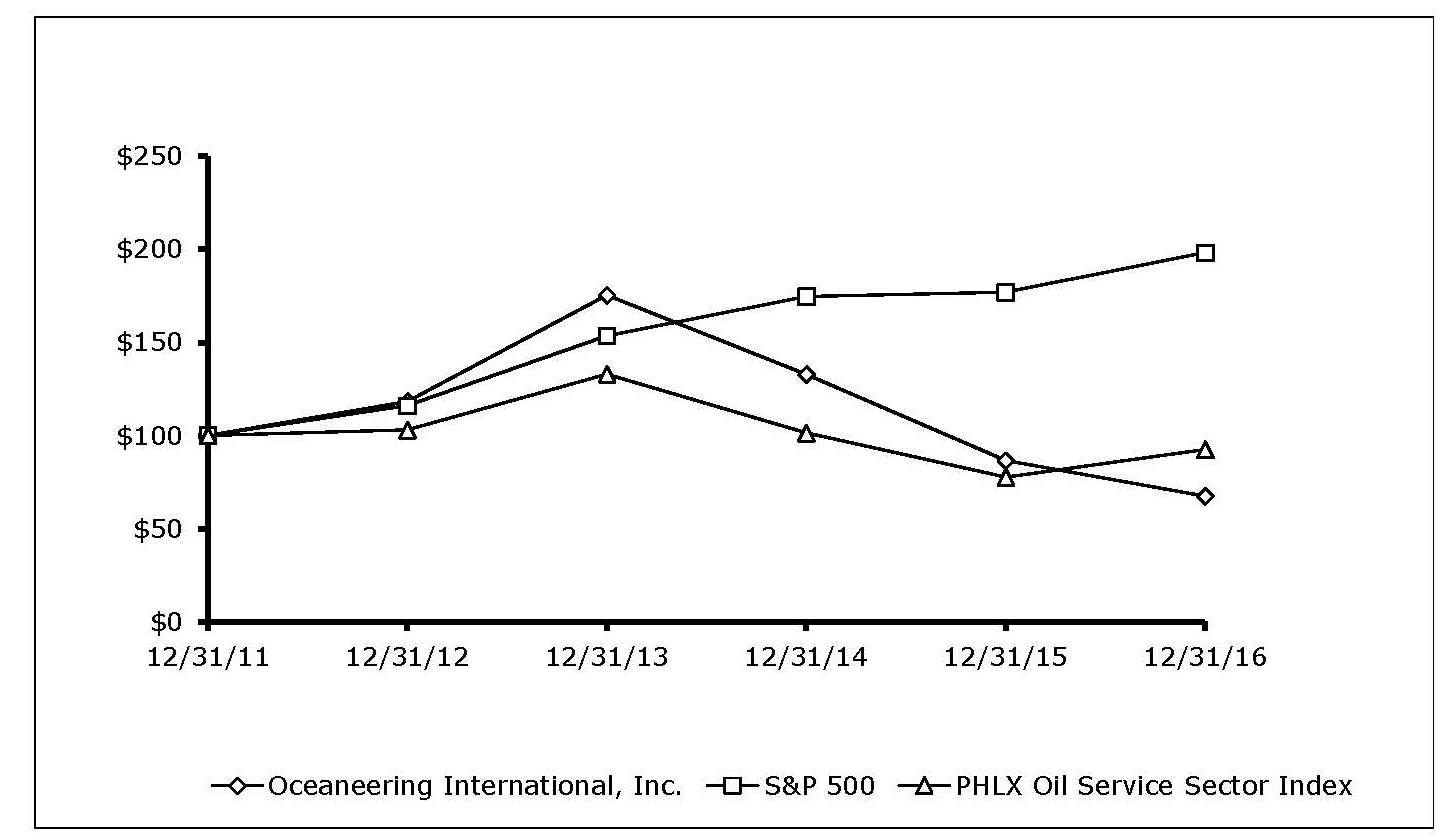
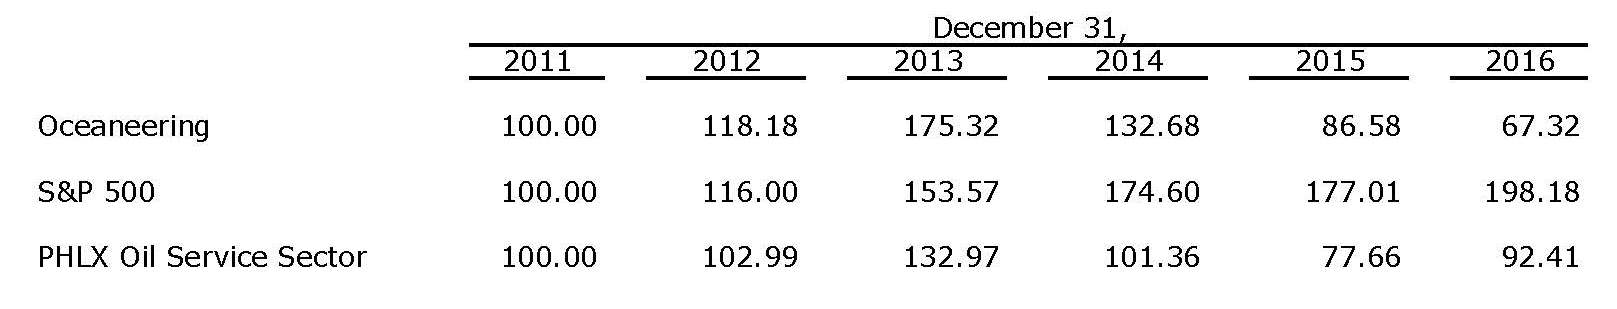
25
Item 6. Selected Financial Data.
The following table sets forth certain selected historical consolidated financial data and should be read in conjunction with Management's Discussion and Analysis of Financial Condition and Results of Operation and our Consolidated Financial Statements and Notes included in this report. The following information may not be indicative of our future operating results.
Results of Operations:
Year Ended December 31, | ||||||||||||||||||||
(in thousands, except per share amounts) | 2016 | 2015 | 2014 | 2013 | 2012 | |||||||||||||||
Revenue | $ | 2,271,603 | $ | 3,062,754 | $ | 3,659,624 | $ | 3,287,019 | $ | 2,782,604 | ||||||||||
Cost of services and products | 1,992,376 | 2,457,325 | 2,800,423 | 2,521,483 | 2,154,746 | |||||||||||||||
Gross margin | 279,227 | 605,429 | 859,201 | 765,536 | 627,858 | |||||||||||||||
Selling, general and administrative expense | 208,463 | 231,619 | 230,871 | 220,420 | 199,261 | |||||||||||||||
Income from operations | $ | 70,764 | $ | 373,810 | $ | 628,330 | $ | 545,116 | $ | 428,597 | ||||||||||
Net income | $ | 24,586 | $ | 231,011 | $ | 428,329 | $ | 371,500 | $ | 289,017 | ||||||||||
Cash dividends declared per Share | $ | 0.96 | $ | 1.08 | $ | 1.03 | $ | 0.84 | $ | 0.69 | ||||||||||
Diluted earnings per share | $ | 0.25 | $ | 2.34 | $ | 4.00 | $ | 3.42 | $ | 2.66 | ||||||||||
Depreciation and amortization | $ | 250,247 | $ | 241,235 | $ | 229,779 | $ | 202,228 | $ | 176,483 | ||||||||||
Capital expenditures, including business acquisitions | $ | 142,513 | $ | 423,988 | $ | 426,671 | $ | 393,590 | $ | 309,858 | ||||||||||
Other Financial Data:
As of December 31, | ||||||||||||||||||||
(dollars in thousands) | 2016 | 2015 | 2014 | 2013 | 2012 | |||||||||||||||
Working capital ratio | 2.48 | 2.46 | 2.52 | 1.97 | 1.95 | |||||||||||||||
Working capital | $ | 754,231 | $ | 901,537 | $ | 1,034,413 | $ | 706,187 | $ | 585,805 | ||||||||||
Total assets | $ | 3,130,315 | $ | 3,429,536 | $ | 3,504,940 | $ | 3,128,500 | $ | 2,768,118 | ||||||||||
Long-term debt | $ | 793,058 | $ | 795,836 | $ | 743,469 | $ | — | $ | 94,000 | ||||||||||
Shareholders' equity | $ | 1,516,643 | $ | 1,578,734 | $ | 1,657,471 | $ | 2,043,440 | $ | 1,815,460 | ||||||||||
Goodwill as a percentage of Shareholders' equity | 29 | % | 27 | % | 20 | % | 17 | % | 20 | % | ||||||||||
26
Item 7. | Management's Discussion and Analysis of Financial Condition and Results of Operations. |
Certain statements in this annual report on Form 10-K, including, without limitation, statements regarding the following matters, are forward-looking statements made pursuant to the safe harbor provisions of the Private Securities Litigation Reform Act of 1995:
• | our business strategy; |
• | our plans for future operations; |
• | industry conditions; |
• | seasonality; |
• | our expectations about 2017 earnings per share, items below the operating income line and segment operating results, and the factors underlying those expectations, including our expectations about demand and pricing for our deepwater oilfield services and products as a result of the factors we specify in "Overview" and "Results of Operations" below; |
• | projections relating to floating rig demand and subsea tree installations; |
• | the adequacy of our liquidity and capital resources to support our operations and internally generated growth initiatives; |
• | our projected capital expenditures for 2017; |
• | our plans to add ROVs to our fleet; |
• | our intentions relating to the subsea support vessel scheduled for delivery in 2017; |
• | our expectations regarding deferred tax assets and our belief that our goodwill will not be impaired during 2017; |
• | the adequacy of our accruals for uninsured expected liabilities from workers' compensation, maritime employer's liability and general liability claims; |
• | our belief that our total unrecognized tax benefits will not significantly increase or decrease in the next 12 months; |
• | our anticipated tax rates and underlying assumptions; |
• | our anticipation of a discrete tax item in the first quarter of 2017; |
• | our expectations regarding shares repurchased under our share repurchase plan; |
• | our backlog; and |
• | our expectations regarding the effect of inflation in the near future. |
These forward-looking statements are subject to various risks, uncertainties and assumptions, including those we refer to under the headings "CAUTIONARY STATEMENT CONCERNING FORWARD-LOOKING STATEMENTS" and "Risk Factors" in Part I of this report. Although we believe that the expectations reflected in such forward-looking statements are reasonable, because of the inherent limitations in the forecasting process, as well as the relatively volatile nature of the industries in which we operate, we can give no assurance that those expectations will prove to have been correct. Accordingly, evaluation of our future prospects must be made with caution when relying on forward-looking information.
Overview
The table that follows sets out our revenue and operating results for 2016, 2015 and 2014.
Year Ended December 31, | ||||||||||||
(dollars in thousands) | 2016 | 2015 | 2014 | |||||||||
Revenue | $ | 2,271,603 | $ | 3,062,754 | $ | 3,659,624 | ||||||
Gross Margin | 279,227 | 605,429 | 859,201 | |||||||||
Gross Margin % | 12 | % | 20 | % | 23 | % | ||||||
Operating Income | 70,764 | 373,810 | 628,330 | |||||||||
Operating Income % | 3 | % | 12 | % | 17 | % | ||||||
Net Income | 24,586 | 231,011 | 428,329 | |||||||||
Our business substantially depends on the level of spending on offshore developments by our customers in the oil and gas industry. During 2016, we generated approximately 86% of our
27
revenue, and 92% of our operating income before Unallocated Expenses, from services and products we provided to the oil and gas industry. In 2016, our revenue decreased by 26%, with the larger percentage decreases occurring in our ROV, Subsea Products and Asset Integrity segments, all of which decreased from lower oilfield activity resulting from the general decline in crude oil prices from mid 2014. Starting in 2015, we have taken initiatives to align our operations with current and anticipated declining activity and pricing levels. These initiatives required us to reduce our workforce, incur unusual expenses, and make certain accounting adjustments.
The $25 million consolidated net income we earned in 2016 was substantially less than the $231 million we earned in 2015, and the $0.25 earnings per diluted share was the lowest we made since 2000. The $206 million decrease from 2015 net income was attributable to lower profit contributions from all of our oilfield business segments, most notably:
• | our ROV segment, which had $167 million less operating income on $286 million less revenue; |
• | our Subsea Products segment, which had $100 million less operating income on $268 million less revenue; and |
• | our Subsea Projects segment, which had $58 million less operating income on $132 million less revenue. |
In 2016, we invested in the following capital projects:
• | additions of capabilities in our Subsea Products segment, including payment of $28 million for the purchase of the assets of a provider of riserless light well intervention services; |
• | $13 million related to a new subsea support vessel for our Subsea Projects segment scheduled for delivery in 2017; and |
• | additions of and upgrades to our work-class ROVs. |
In 2015, we exited the business of manufacturing subsea blow out preventer ("BOP") control systems.
We expect our 2017 diluted earnings per share to be less than the $0.25 we reported in 2016. With our limited market visibility resulting from the uncertain energy market, we are not providing earnings per share guidance for 2017. We anticipate lower global demand for deepwater drilling, field development, and inspection, maintenance and repair activities due to the current and anticipated oil price environment, which has led to spending cuts from our customers and pricing pressure. Compared to 2016, in 2017 we are forecasting that we will be marginally profitable at the operating income line. Below the operating income line, we expect:
• | a loss on our equity investment in Medusa Spar LLC as production continues to decline; |
• | increased interest expense from higher interest rates, which affects our floating rate debt and our swaps to floating rates on $200 million of fixed-rate debt; |
• | in the first quarter, a discrete additional tax expense related to our share-based compensation plan. |
We use our ROVs to provide drilling support, vessel-based inspection, maintenance and repair, subsea hardware installation, construction, and pipeline inspection services to customers in the oil and gas industry. The largest percentage of our ROVs has historically been used to provide drill support services. Therefore, the number of floating drilling rigs on hire is a leading market indicator for this business. The following table shows average floating rigs under contract and our ROV utilization.
2016 | 2015 | 2014 | |||
Average number of floating rigs under contract | 177 | 241 | 280 | ||
ROV days on hire (in thousands) | 60 | 84 | 98 | ||
ROV utilization | 53% | 69% | 83% | ||
28
Demand for floating rigs is the primary leading indicator of the strength of the deepwater market. According to industry data published by IHS Petrodata, at the end of 2016, there were 336 floating drilling rigs in operation or available for work throughout the world, with 151 of those rigs under contract. Of the 151 rigs under contract, 91 are contracted through the end of 2017. Recent industry forecasts of floating rig demand point to an expectation that demand in 2017 will decline by approximately 25%.
In addition to floating rig demand, the number of subsea tree completions is another leading indicator, and the primary demand driver for our Subsea Products lines. According to industry data published by Infield Systems Limited in January 2017, there will be 200 subsea tree installations in 2017, down from 305 in 2016, 308 in 2015 and 349 in 2014. Subsea tree installations are forecast to increase to 227 in 2018.
Critical Accounting Policies and Estimates
We have based the following discussion and analysis of our financial condition and results of operations on our consolidated financial statements, which we have prepared in conformity with accounting principles generally accepted in the United States. These principles require us to make various estimates, judgments and assumptions that affect the reported amounts of assets and liabilities at the date of the financial statements and the reported amounts of revenue and expense during the periods we present. We base our estimates on historical experience, available information and other assumptions we believe to be reasonable under the circumstances. On an ongoing basis, we evaluate our estimates; however, our actual results may differ from these estimates under different assumptions or conditions. The following discussion summarizes the accounting policies we believe (1) require our management's most difficult, subjective or complex judgments and (2) are the most critical to our reporting of results of operations and financial position.
Revenue Recognition. We recognize our revenue according to the type of contract involved. On a daily basis, we recognize revenue under contracts that provide for specific time, material and equipment charges, which we bill periodically, ranging from weekly to monthly.
We account for significant fixed-price contracts, which we enter into mainly in our Subsea Products segment, and to a lesser extent in our Subsea Projects and Advanced Technologies segments, using the percentage-of-completion method. In 2016, we accounted for 16% of our revenue using the percentage-of-completion method. In determining whether a contract should be accounted for using the percentage-of-completion method, we consider whether:
• | the customer provides specifications for the construction of facilities or production of goods or for the provision of related services; |
• | we can reasonably estimate our progress towards completion and our costs; |
• | the contract includes provisions as to the enforceable rights regarding the goods or services to be provided, consideration to be received and the manner and terms of payment; |
• | the customer can be expected to satisfy its obligations under the contract; and |
• | we can be expected to perform our contractual obligations. |
Under the percentage-of-completion method, we generally recognize estimated contract revenue based on costs incurred to date as a percentage of total estimated costs. Changes in the expected cost of materials and labor, productivity, scheduling and other factors affect the total estimated costs. Additionally, external factors, including weather or other factors outside of our control, may also affect the progress and estimated cost of a project's completion and, therefore, the timing of income and revenue recognition. We routinely review estimates related to our contracts and reflect revisions to profitability in earnings immediately. If a current estimate of total contract cost indicates an ultimate loss on a contract, we recognize the projected loss in full when we determine it. In prior years, we have recorded adjustments to earnings as a result of revisions to contract estimates. Although we are continually striving to accurately estimate our contract costs and profitability, adjustments to overall contract costs could be significant in future periods.
We recognize the remainder of our revenue when persuasive evidence of an arrangement exists, delivery has occurred or services have been rendered, price is fixed or determinable and collection is reasonably assured.
29
Property and Equipment and Long-lived Intangible Assets. We periodically and upon the occurrence of a triggering event review the realizability of our property and equipment and long-lived intangible assets to determine whether any events or changes in circumstances indicate that the carrying amount of the asset may not be recoverable. For long-lived assets to be held and used, we base our evaluation on impairment indicators such as the nature of the assets, the future economic benefits of the assets, any historical or future profitability measurements and other external market conditions or factors that may be present. If such impairment indicators are present or other factors exist that indicate that the carrying amount of an asset may not be recoverable, we determine whether an impairment has occurred through the use of an undiscounted cash flows analysis of the asset at the lowest level for which identifiable cash flows exist. If an impairment has occurred, we recognize a loss for the difference between the carrying amount and the fair value of the asset. For assets held for sale or disposal, the fair value of the asset is measured using fair market value less cost to sell. Assets are classified as held-for-sale when we have a plan for disposal of certain assets and those assets meet the held for sale criteria.
We charge the costs of repair and maintenance of property and equipment to operations as incurred, while we capitalize the costs of improvements that extend asset lives or functionality.
Goodwill. In our annual evaluation of goodwill for impairment, we first assess qualitative factors to determine whether the existence of events or circumstances leads to a determination that it is more likely than not that the fair value of a reporting unit is less than its carrying amount. If, after assessing the totality of events or circumstances, we determine it is more likely than not that the fair value of a reporting unit exceeds its carrying amount, performing the two-step impairment test is unnecessary. However, if we conclude otherwise, then we are required to perform the first step of the two-step impairment test. We estimate fair value of the reporting units using both an income approach, which considers a discounted cash flow model, and a market approach. Reductions in estimates of our future cash flows or adverse changes in market comparable information may result in goodwill impairments in the future.
For reporting units with goodwill, we do not believe our goodwill will be impaired during 2017.
Income Taxes. Our tax provisions are based on our expected taxable income, statutory rates and tax-planning opportunities available to us in the various jurisdictions in which we operate. Determination of taxable income in any jurisdiction requires the interpretation of the related tax laws. We are at risk that a taxing authority's final determination of our tax liabilities may differ from our interpretation. Our effective tax rate may fluctuate from year to year as our operations are conducted in different taxing jurisdictions, the amount of pre-tax income fluctuates, the amounts of foreign income we anticipate will be repatriated and our estimates regarding the realizability of items such as foreign tax credits may change. We consider $623 million of unremitted earnings of our foreign subsidiaries to be indefinitely reinvested. We believe we have the ability to indefinitely reinvest these foreign earnings based on our expectations of profitability for our U.S. operations over the long term, our significant U.S. liquidity, and the amount of unremitted earnings of our foreign subsidiaries not considered indefinitely reinvested, for which we have provided deferred income taxes.
We account for any applicable interest and penalties on uncertain tax positions as a component of our provision for income taxes on our financial statements. Current income tax expense represents either nonresident withholding taxes or the liabilities expected to be reflected on our income tax returns for the current year, while the net deferred income tax expense or benefit represents the change in the balance of deferred tax assets or liabilities as reported on our balance sheet.
We establish valuation allowances to reduce deferred tax assets when it is more likely than not that some portion or all of the deferred tax assets will not be realized in the future. While we have considered estimated future taxable income and ongoing prudent and feasible tax-planning strategies in assessing the need for the valuation allowances, changes in these estimates and assumptions, as well as changes in tax laws, could require us to provide for valuation allowances for our deferred tax assets. Provisions for valuation allowances impact our income tax provision in the period in which such adjustments are identified and recorded. We established a deferred tax asset valuation allowance of $4.2 million in 2016 related to the realizability of loss carryforwards in certain of our foreign jurisdictions.
30
In March 2016, the FASB issued ASU 2016-09, "Compensation – Stock Compensation Improvements to Employee Share-Based Payment Accounting." This update requires that all excess tax benefits and tax deficiencies (including tax benefits of dividends on share-based payment awards) should be recognized as income tax expense or benefit in the income statement. The tax effects of exercised or vested awards should be treated as discrete items in the reporting period in which they occur. An entity also should recognize excess tax benefits regardless of whether the benefit reduces taxes payable in the current period. Currently, an entity must determine, for each award, whether the difference between the deduction for tax purposes and the compensation cost recognized for financial reporting purposes results in either an excess tax benefit or a tax deficiency. The amendments in this update are effective for us beginning January 1, 2017. Through December 31, 2016, we recognized excess tax benefits in additional paid-in capital, and tax deficiencies have been recognized as an offset to accumulated excess tax benefits. In 2017, we expect a tax deficiency in the first quarter and, under this new standard, we will recognize it as a discrete item in the income statement rather than in additional paid-in capital. We do not anticipate that this update will have a material effect on our consolidated financial statements.
For a summary of our major accounting policies and a discussion of recently adopted accounting standards, please see Note 1 to our Consolidated Financial Statements.
Liquidity and Capital Resources
We consider our liquidity and capital resources adequate to support our operations and growth initiatives. At December 31, 2016, we had working capital of $754 million, including cash and cash equivalents of $450 million. Additionally, we had $500 million available through our revolving credit facility under a credit agreement (as amended, the "Credit Agreement"), which is scheduled to expire on October 25, 2021.
In October 2014, we entered into the Credit Agreement with a group of banks to replace our prior principal credit agreement. The Credit Agreement provides for a $300 million three-year term loan (the "Term Loan Facility") and a $500 million five-year revolving credit facility (the "Revolving Credit Facility"). Subject to certain conditions, the aggregate commitments under the Revolving Credit Facility may be increased to up to $800 million at any time upon agreement between us and existing or additional lenders. Borrowings under the Revolving Credit Facility and the Term Loan Facility may be used for general corporate purposes. Simultaneously with the execution of the Credit Agreement and pursuant to its terms, we repaid all amounts outstanding under, and terminated, the prior credit agreement.
In November 2015, we entered into an Agreement and Amendment No. 1 to Credit Agreement ("Amendment No. 1"). Amendment No. 1 amended the Credit Agreement to (1) replace the maximum leverage ratio financial covenant with a new financial covenant restricting the maximum total capitalization ratio (defined in Amendment No. 1 to be the ratio of consolidated debt to total capitalization) to 55% and (2) extend the maturities of the Term Loan Facility and the Revolving Credit Facility by one year each, which maturity terms have since been superseded by amendment, as described below.
In November 2016, we entered into Agreement and Amendment No. 2 to Credit Agreement ("Amendment No. 2"). Amendment No. 2 amended the Credit Agreement to, among other things, extend the maturities of the Term Loan Facility and the Revolving Credit Facility to October 25, 2019 and October 25, 2021, respectively, with the extending Lenders, which represent 90% of the existing commitments of the Lenders, such that (a) the total commitments for the Revolving Credit Facility will be $500 million until October 25, 2020 and thereafter $450 million until October 25, 2021, and (b) the outstanding term loan maturities pursuant to the Term Loan Facility will be $300 million until October 27, 2018 and thereafter $270 million until October 25, 2019.
Borrowings under the Credit Agreement bear interest at an Adjusted Base Rate or the Eurodollar Rate (both as defined in the Credit Agreement), at our option, plus an applicable margin initially based on our Leverage Ratio (as defined in the Credit Agreement) and, at our election, based on ratings of our senior unsecured debt by designated ratings services, thereafter to be based on such debt ratings. The applicable margin varies: (1) in the case of advances bearing interest at the
31
Adjusted Base Rate, from 0.125% to 0.750% for borrowings under the Revolving Credit Facility and from 0% to 0.500% for borrowings under the Term Loan Facility; and (2) in the case of advances bearing interest at the Eurodollar Rate, from 1.125% to 1.750% for borrowings under the Revolving Credit Facility and from 1.000% to 1.500% for borrowings under the Term Loan Facility. The Adjusted Base Rate is the highest of (1) the per annum rate established by the administrative agent as its prime rate, (2) the federal funds rate plus 0.50% and (3) the daily one-month LIBOR plus 1%. We pay a commitment fee ranging from 0.125% to 0.300% on the unused portion of the Revolving Credit Facility, depending on our Leverage Ratio. The commitment fees are included as interest expense in our consolidated financial statements.
The Credit Agreement contains various covenants that we believe are customary for agreements of this nature, including, but not limited to, restrictions on our ability and the ability of each of our subsidiaries to incur debt, grant liens, make certain investments, make distributions, merge or consolidate, sell assets, enter into transactions with affiliates and enter into certain restrictive agreements. We are also subject to a maximum total capitalization ratio of 55%, as noted above. The Credit Agreement includes customary events of default and associated remedies. As of December 31, 2016, we were in compliance with all the covenants set forth in the Credit Agreement.
In November 2014, we completed the public offering of $500 million aggregate principal amount of 4.650% Senior Notes due 2024 (the "Senior Notes"). We pay interest on the Senior Notes on May 15 and November 15 of each year, beginning on May 15, 2015. The Senior Notes are scheduled to mature on November 15, 2024. We may redeem some or all of the Senior Notes prior to maturity at specified redemption prices. We used the net proceeds from the offering for general corporate purposes, including funding the acquisition described below, other capital expenditures and repurchases of shares of our common stock.
Our maximum outstanding indebtedness during 2016 under the Credit Agreement and Senior Notes was $800 million, and our total interest costs, including commitment fees, were $29.1 million.
Our capital expenditures, including business acquisitions, for 2016, 2015 and 2014 were $143 million, $424 million and $427 million, respectively. Our capital expenditures in 2016 included $50 million in our ROV segment, $57 million in our Subsea Products segment and $26 million in our Subsea Projects segment. Our capital expenditures in 2015 included our acquisition of C & C Technologies, Inc. ("C&C") for approximately $224 million. C&C is a global provider of ocean-bottom mapping services in deepwater utilizing customized autonomous underwater vehicles and provides marine construction surveys for both surface and subsea assets, as well as satellite-based positioning services for drilling rigs and seismic and construction vessels. C&C also provides land and near-shore survey services along the U.S. Gulf Coast and in Mexico, and performs shallow water conventional geophysical surveys in the U.S. Gulf of Mexico. In addition to the C&C acquisition, our capital expenditures in 2015 included: $58 million for upgrading and expanding our ROV fleet; $69 million in our Subsea Products segment, principally for growth of our tooling and installation and workover control systems capabilities; and $52 million in our Subsea Projects segment, including $43 million related to a new subsea support vessel scheduled for delivery in 2017. Our capital expenditures in 2014 included: $189 million for upgrading and expanding our ROV fleet; $113 million in our Subsea Products segment, principally for growth of our tooling and installation and workover control systems capabilities, expansion of our Houston manufacturing facilities and establishment of manufacturing capabilities in Angola; and $92 million in our Subsea Projects segment, including $40 million related to a new subsea support vessel scheduled for delivery in 2017.
For 2017, we expect our capital expenditures to be in the range of $90 million to $120 million, exclusive of business acquisitions. This estimate includes $25 million in our Subsea Projects segment to complete the new-build subsea support vessel, the Ocean Evolution, scheduled for delivery in the middle of 2017. During the third quarter of 2013, we signed an agreement with a shipyard for the construction of the Ocean Evolution. We intend for the vessel to be U.S.-flagged and documented with a coastwise endorsement by the U.S. Coast Guard. It is expected to have an overall length of 353 feet, a Class 2 dynamic positioning system, accommodations for 110 personnel, a helideck, a 250-ton active heave-compensated crane, and a working moonpool. We expect to outfit the vessel with two of our high specification work-class ROVs. The vessel will also be equipped
32
with a satellite communications system capable of transmitting streaming video for real-time work observation by shore personnel. We anticipate the vessel will be used to augment our ability to provide subsea intervention services in the U.S. Gulf of Mexico. These services are required to perform inspection, maintenance and repair projects and hardware installations.
Our capital expenditures during 2016, 2015 and 2014 included $50 million, $58 million and $189 million, respectively, in our ROV segment, principally for additions and upgrades to our ROV fleet to expand the fleet and replace units we retired and for facilities infrastructure to support our growing ROV fleet size. We currently plan to add new ROVs only to meet contractual commitments. We added 6, 16 and 49 ROVs to our fleet and retired 41, 36, and 17 units during 2016, 2015 and 2014, respectively, and transferred one to our Advanced Technologies segment in 2015, resulting in a total of 280 work-class systems in the fleet at December 31, 2016. Over the past two years, we retired a greater number of ROVs than we have added due to market conditions and outlook.
Unless indicated otherwise, each of the vessels discussed below is a deepwater multiservice subsea support vessel outfitted with two of our high-specification work-class ROVs.
Beginning in the third quarter of 2008, we chartered a vessel, the Olympic Intervention IV, for an initial term of five years. Following extension periods, the charter expired in July 2016, and we released the vessel to its owner. We had been using the Olympic Intervention IV in the U.S. Gulf of Mexico.
In 2012, we moved the chartered vessel Ocean Intervention III to Angola and also chartered the Bourbon Oceanteam 101 to work on a three-year field support vessel services contract for a unit of BP plc. We had extended the charter of the Bourbon Oceanteam 101 to January 2017. However, in early 2016, the customer exercised its right, under the field support vessel services contract, to terminate its use of the Bourbon Oceanteam 101 at the end of May 2016. Under the terms of the contract, the costs incurred by us associated with the early release and demobilization of the vessel were reimbursed by the customer. Following the release of the vessel, we redelivered it to the vessel supplier. Under the field support vessel services contract, which has been extended through January 2019, we are continuing to supply project management, engineering and the Ocean Intervention III, which we have under charter on a month-to-month basis through July 2017. We also provide ROV tooling, asset integrity services and installation and workover control system services. We also have provided other chartered vessels and barges as requested by the customer.
In March 2013, we commenced a five-year charter for a Jones Act-compliant multi-service support vessel, the Ocean Alliance, we have been using in the U.S. Gulf of Mexico. In January 2015, we commenced a two-year contract with a customer for the use of the Ocean Alliance. The contract expired in January 2017, and we are marketing the vessel for spot market work in the U.S. Gulf of Mexico.
In December 2013, we commenced a three-year charter for the Normand Flower, a multi-service subsea marine support vessel. We made modifications to the vessel and used the vessel in the U.S. Gulf of Mexico to perform inspection, maintenance and repair projects and hardware installations. In December 2016, we declined our option to extend the charter and the vessel was released.
In November 2015, we commenced a two-year charter for the use of the Island Pride, a multi-service subsea marine support vessel. We are using the vessel under a two-year contract to provide field support services off the coast of India for an oil and gas customer based in India. We have options to extend the charter for up to two additional years.
We also charter or lease vessels on a short-term basis as necessary to augment our fleet.
Our principal source of cash from operating activities is our net income, adjusted for the non-cash expenses of depreciation and amortization, deferred income taxes and noncash compensation under our restricted stock plans. Our $341 million, $560 million and $722 million of cash provided from operating activities in 2016, 2015 and 2014, respectively, were affected by cash increases/(decreases) of: (1) $123 million, $179 million and $(8) million, respectively, of changes in accounts receivable; (2) $18 million, $33 million and $66 million, respectively, of changes in inventory; and (3) $(117) million, $(45) million and $(44) million, respectively, of changes in accounts payable and
33
accrued liabilities. In 2016 and 2015, our accounts receivable, inventory and accounts payable and accrued liabilities all decreased as a result of lower revenue and activity in general from each year's preceding year. The 2016 and 2015 decreases in inventory were in addition to write-downs totaling $30 million and $26 million, respectively, in our ROV and Subsea Products segments discussed below. In 2014, our inventory decreased as a result of the use of inventory in progressing and completing projects that had been in our Subsea Products backlog at December 31, 2013 and our expectation of lower Subsea Products demand in 2015 as compared to 2014.
In 2016, we used a net of $169 million in investing activities, with $143 million used to fund the capital expenditures described above and $39 million used to purchase Angolan central bank bonds indexed to the U.S. dollar. In 2015, we used a net of $437 million in investing activities, with $424 million used to fund the capital expenditures and business acquisitions described above. In 2014, we used a net of $419 million in investing activities, with $427 million used to fund the capital expenditures and business acquisitions described above.
In 2016, we used $97 million in financing activities, primarily for the $94 million of cash dividends we paid. In 2015, we used $157 million in financing activities. We borrowed $50 million, repurchased 2 million shares for $100 million and paid cash dividends of $106 million. In 2014, we generated $45 million in financing activities. We borrowed $742 million, net of associated expenses and debt discount, repurchased 8.9 million shares for $590 million and paid cash dividends of $110 million.
In February 2010, our Board of Directors approved a program to repurchase up to 12 million shares of our common stock. In 2014, we completed the purchase of the shares authorized under that program by repurchasing the remaining 8.9 million shares for $590 million. The total cost for the repurchase of the 12 million shares of our common stock was $677 million.
In December 2014, following completion of the February 2010 program, our Board of Directors approved a new share repurchase program under which we may repurchase up to 10 million shares of our common stock on a discretionary basis. The December 2014 program calls for the repurchases to be made in the open market, or in privately negotiated transactions from time to time, in compliance with applicable laws, rules and regulations, including Rule 10b-18 under the Securities Exchange Act of 1934, as amended, subject to market and business conditions, levels of available liquidity, cash requirements for other purposes, applicable legal requirements and other relevant factors. The timing and amount of any repurchases will be determined by our management based on its evaluation of these factors. We expect that any shares repurchased under the new program will be held as treasury stock for future possible use. The new program does not obligate us to repurchase any particular number of shares. Through December 31, 2015 under the new program, we repurchased 2 million shares of our common stock for $100 million. We did not repurchase any shares in 2016.
As of December 31, 2016, we retained 12.8 million of the shares we had repurchased. We expect to hold the shares repurchased for future use.
Because of our significant foreign operations, we are exposed to currency fluctuations and exchange rate risks. We generally minimize these risks primarily through matching, to the extent possible, revenue and expense in the various currencies in which we operate. Cumulative translation adjustments as of December 31, 2016 relate primarily to our net investments in, including long-term loans to, our foreign subsidiaries. A stronger U.S. dollar against the U.K. pound sterling, Norwegian kroner and Brazilian real would result in lower operating income. See Item 7A – "Quantitative and Qualitative Disclosures About Market Risk."
34
Results of Operations
Additional information on our business segments is shown in Note 7 of the Notes to Consolidated Financial Statements included in this report.
Oilfield. The table that follows sets out revenue and profitability for the business segments within our Oilfield business. In the ROV section of the table that follows, "Days available" includes all days from the first day that an ROV is placed in service until the ROV is retired. All days in this period are considered available days, including periods when an ROV is undergoing maintenance or repairs. Our ROVs do not have scheduled maintenance or repair that requires significant time when the ROVs are not available for utilization.
Year Ended December 31, | ||||||||||||
(dollars in thousands) | 2016 | 2015 | 2014 | |||||||||
Remotely Operated Vehicles | ||||||||||||
Revenue | $ | 522,121 | $ | 807,723 | $ | 1,069,022 | ||||||
Gross Margin | 59,038 | 227,330 | 361,466 | |||||||||
Gross Margin % | 11 | % | 28 | % | 34 | % | ||||||
Operating Income | 25,193 | 192,514 | 320,550 | |||||||||
Operating Income % | 5 | % | 24 | % | 30 | % | ||||||
Days available | 112,588 | 121,944 | 117,882 | |||||||||
Days utilized | 59,963 | 83,838 | 98,302 | |||||||||
Utilization % | 53 | % | 69 | % | 83 | % | ||||||
Subsea Products | ||||||||||||
Revenue | 692,030 | 959,714 | 1,238,746 | |||||||||
Gross Margin | 140,275 | 257,755 | 364,760 | |||||||||
Gross Margin % | 20 | % | 27 | % | 29 | % | ||||||
Operating Income | 75,938 | 175,585 | 281,239 | |||||||||
Operating Income % | 11 | % | 18 | % | 23 | % | ||||||
Backlog at end of period | 431,000 | 652,000 | 690,000 | |||||||||
Subsea Projects | ||||||||||||
Revenue | 472,979 | 604,484 | 588,572 | |||||||||
Gross Margin | 51,392 | 114,672 | 124,418 | |||||||||
Gross Margin % | 11 | % | 19 | % | 21 | % | ||||||
Operating Income | 34,476 | 92,034 | 107,852 | |||||||||
Operating Income % | 7 | % | 15 | % | 18 | % | ||||||
Asset Integrity | ||||||||||||
Revenue | 275,397 | 372,957 | 500,237 | |||||||||
Gross Margin | 41,458 | 47,342 | 87,236 | |||||||||
Gross Margin % | 15 | % | 13 | % | 17 | % | ||||||
Operating Income | 7,551 | 18,235 | 55,469 | |||||||||
Operating Income % | 3 | % | 5 | % | 11 | % | ||||||
Total Oilfield | ||||||||||||
Revenue | $ | 1,962,527 | $ | 2,744,878 | $ | 3,396,577 | ||||||
Gross Margin | 292,163 | 647,099 | 937,880 | |||||||||
Gross Margin % | 15 | % | 24 | % | 28 | % | ||||||
Operating Income | 143,158 | 478,368 | 765,110 | |||||||||
Operating Income % | 7 | % | 17 | % | 23 | % | ||||||
35
Historically, we built new ROVs to increase the size of our fleet in response to demand to support deepwater drilling and vessel-based inspection, maintenance and repair ("IMR") and installation work. In 2015, as a result of declining market conditions, we began building fewer ROVs, primarily to meet contractual commitments. These vehicles are designed for use around the world in water depths of 10,000 feet or more. We added 6, 16 and 49 ROVs in 2016, 2015 and 2014, respectively, while retiring 94 units over the three-year period and transferring one to our Advanced Technologies segment over that period. Our ROV fleet size was 280 at December 31, 2016, 315 at December 31, 2015 and 336 at December 31, 2014. We have decreased our ROV fleet size over the last two years as a result of lower market demand.
Our ROV operating income decreased in the year ended December 31, 2016 compared to the prior year, as a result of lower days on hire and lower average revenue per day-on-hire, as well as inventory write-downs and fixed asset write-offs totaling $36.0 million in 2016. During 2016, the leading indicator for deepwater activity, contracted floating rigs, continued to decline as the rate of rigs being idled, either by contract termination or expiration, continued. This prevailing market condition required us to reassess the number of ROVs we had in our fleet, as well as the associated inventory. As a result of our reassessment, in 2016 we recorded $36.0 million of charges consisting of: (1) $25.2 million for a reserve for excess inventory; and (2) $10.8 million for the retirement of 39 ROVs. During 2016 we also incurred charges related to restructuring expenses of $3.8 million and bad debt expenses of $1.2 million.
For 2015, our ROV revenue and operating income declined from 2014 from lower demand for drill support services and a reduction in average revenue per day across all our geographic areas of operation. ROV days on hire decreased by 15% and revenue per day on hire decreased 11%. In 2015, our ROV cost of services and products included inventory write-downs of $15.7 million, restructuring expenses of $7.2 million and ROV retirements resulting in write-offs of $2.9 million. The inventory write downs were due to excess inventory, which we do not anticipate using given current and forecast market conditions. The restructuring expenses related to severance costs for incurred and designated future workforce reductions and costs associated with closing excess facilities. The write-offs were necessitated as a result of our retiring an unusually large number of ROVs in 2015 due to market prospects for these vehicles.
In our financial statements, the charges incurred in both 2016 and 2015 are reflected in our cost of services and products, except for the charges related to bad debts, which are reflected in general and administrative expenses.
We anticipate ROV operating income to decrease in 2017 as a result of decreases in average revenue per day on hire and the number of days on hire for drilling support services, attributable to the market conditions described under "Overview" above. We normally expect to retire, on average, 4% to 5% of our fleet on an annual basis, although we retired a greater number in each of 2016 and 2015 due to market conditions.
To improve operational efficiency, in 2016 we reorganized our Subsea Products segment into two business units – (1) manufactured products and (2) service and rental. Manufactured products include production control umbilicals and specialty subsea hardware, while service and rental includes tooling, subsea work systems and installation and workover control systems. This internal reorganization does not affect our segment reporting structure or the historical comparability of our segment results. The following table presents revenue from manufactured products and service and rental, as their respective percentages of total Subsea Products revenue:
Year Ended December 31, | |||||||||
2016 | 2015 | 2014 | |||||||
Manufactured Products | 65 | % | 61 | % | 64 | % | |||
Service and Rental | 35 | % | 39 | % | 36 | % | |||
36
For the year ended December 31, 2016, our Subsea Products revenue and operating income decreased from the prior year across both business units, but most notably due to lower demand for and pricing of service and rental. In 2016 we incurred the following charges:
• | $8.2 million, predominantly for tools and inventory in our portfolio used to support deepwater drilling and operations; |
• | $3.7 of restructuring expenses; and |
• | $1.9 million of allowances for bad debts. |
Subsea Products revenue, operating income and margin were lower in 2015 than in 2014 due to lower demand and pricing for tooling and subsea hardware and lower umbilical plant throughput. Due to deteriorating market conditions, we wrote down Subsea Products inventory $10.3 million in 2015, including $9.0 million associated with our decision to cease manufacture of subsea BOP control systems. In 2015, Subsea Products also incurred the following charges:
• | $8.7 million of restructuring expenses; |
• | $6.6 million of a non-current asset reserve; and |
• | $4.8 million for an allowance for bad debts. |
In our financial statements, the charges incurred in both 2016 and 2015 are reflected in our cost of services and products, except for the charges related to the allowances for bad debts, which are reflected in general and administrative expenses. The restructuring expenses related to severance costs for incurred and designated future workforce reductions and costs associated with closing excess facilities. The charge for a non-current asset reserve related to prepaid non-income taxes based on consumption, and the charge amount is based on our estimate of the amount that will expire due to reduced activity going forward. The allowance for bad debts in 2015 related to a customer that filed for bankruptcy and was unable to pay for a built umbilical.
We anticipate our Subsea Products segment operating income in 2017 to be lower than in 2016 on a decline in pricing in current backlog and new orders, and we expect reduced margins in the mid- to high-single digit range. Our Subsea Products backlog was $431 million at December 31, 2016, approximately 34% lower than it was at December 31, 2015. The backlog decrease from 2015 was principally in umbilicals.
For the year ended December 31, 2016, our Subsea Projects revenue and operating income decreased from that of the prior year, as a result of decreased demand and lower pricing for deepwater vessel services, including the completion during April 2015 of work associated with the Bourbon Evolution 803, a vessel we chartered on a short-term basis for use offshore Angola associated with our field support vessel services contract, and the release in May 2016 of the Bourbon Oceanteam 101, which was previously deployed under the same contract offshore Angola.
Subsea Projects operating income declined slightly during 2015 from 2014 on slightly higher revenue. The relatively better performance compared to the other oilfield segments was aided by an increase in international manned diving operations. The decline in operating income was due to lower deepwater vessel activity and market pricing offshore Angola and in the U.S. Gulf of Mexico and from survey operations from reduced demand and lower pricing.
For the year ended December 31, 2016, our Asset Integrity revenue and operating income decreased from that of the prior year across most of our operating areas, due to decreased demand and pricing. Our Asset Integrity results in 2016 included bad debt expense of $5.0 million, which is reflected in selling, general and administrative expense, and $1.4 million of restructuring charges, which are reflected in our cost of services and products.
In 2015, our Asset Integrity operating income declined precipitously on lower global demand and pricing for inspection services. Asset Integrity results in 2015 include restructuring charges of $6.4 million reflected in our cost of services and products.
We anticipate our 2017 operating income for Asset Integrity to be lower than in 2016 on continued lower global demand and pricing.
37
Advanced Technologies. The table that follows sets out revenue and profitability for this segment.
Year Ended December 31, | ||||||||||||
(dollars in thousands) | 2016 | 2015 | 2014 | |||||||||
Revenue | $ | 309,076 | $ | 317,876 | $ | 263,047 | ||||||
Gross Margin | 33,784 | 30,034 | 32,410 | |||||||||
Gross Margin % | 11 | % | 9 | % | 12 | % | ||||||
Operating Income | 11,809 | 9,689 | 13,230 | |||||||||
Operating Income % | 4 | % | 3 | % | 5 | % | ||||||
For the year ended December 31, 2016, Advanced Technologies operating income was higher than that of the corresponding period of 2015, due to improved execution on commercial theme park projects. Advanced Technologies operating income for 2015 was lower than that of 2014 due to execution issues on commercial theme park projects. We project an improvement in our Advanced Technologies operating income in 2017, due to increased activity.
Unallocated Expenses. Our unallocated expenses, i.e., those not associated with a specific business segment, within gross margin consist of expenses related to our incentive and deferred compensation plans, including restricted stock and bonuses, as well as other general expenses. Our unallocated expenses within operating income consist of those within gross margin plus general and administrative expenses related to corporate functions.
The table that follows sets out our unallocated expenses.
Year Ended December 31, | ||||||||||||
(dollars in thousands) | 2016 | 2015 | 2014 | |||||||||
Gross margin expenses | $ | (46,720 | ) | $ | (71,704 | ) | $ | (111,089 | ) | |||
% of revenue | 2 | % | 2 | % | 3 | % | ||||||
Operating expenses | (84,203 | ) | (114,247 | ) | (150,010 | ) | ||||||
% of revenue | 4 | % | 4 | % | 4 | % | ||||||
Our unallocated expenses have trended with the amounts of our incentive compensation expenses. Our unallocated gross margin and operating expenses decreased in 2016 and in 2015, due to lower compensation expenses related to the expected annual bonuses and valuation of performance units awarded under our incentive plan. We expect higher incentive plan compensation expenses in 2017, as 2016 included downward revisions of estimated expenses for the performance units outstanding under the incentive plan.
Other. The table that follows sets forth our financial statement items below the operating income line.
Year Ended December 31, | ||||||||||||
(dollars in thousands) | 2016 | 2015 | 2014 | |||||||||
Interest income | $ | 3,900 | $ | 607 | $ | 293 | ||||||
Interest expense, net of amounts capitalized | (25,318 | ) | (25,050 | ) | (4,708 | ) | ||||||
Equity earnings (loss) of unconsolidated affiliates | 244 | 2,230 | (51 | ) | ||||||||
Other income (expense), net | (6,244 | ) | (15,336 | ) | (387 | ) | ||||||
Provision for income taxes | 18,760 | 105,250 | 195,148 | |||||||||
Interest income increased in 2016 from our investment in Angola bonds, as mentioned in"Liquidity and Capital Resources" above.
In addition to interest on borrowings, interest expense includes amortization of loan costs, fees for
lender commitments under our revolving credit agreement and fees for standby letters of credit and
bank guarantees that banks issue on our behalf for performance bonds, bid bonds and self-insurance
requirements.
38
Interest expense increased in 2015 over 2014 from higher average debt levels. We capitalized $3.7 million, $2.4 million and $0.7 million of interest in 2016, 2015 and 2014, respectively, associated with the new-build vessel described under "Liquidity and Capital Resources" above.
Included in other income (expense), net are foreign currency transaction losses of $4.8 million, $15.4 million and $0.5 million for 2016, 2015 and 2014, respectively. The losses in 2016 and 2015 primarily related to Angola, which devalued its currency by 18% in 2016 and 24% in 2015. We likely would incur further foreign currency exchange losses in Angola if additional currency devaluations occur. In 2016, other income (expense), net also includes curtailment costs of $1.1 million related to the Norway defined benefit plan.
Our effective tax rate, including foreign, state and local taxes, was 43.3%, 31.3%, and 31.3% for 2016, 2015 and 2014, respectively, which included a combination of expiring statutes of limitations and the resolution of uncertain tax positions of $0.9 million, $1.3 million and $0.9 million, respectively, related to certain liabilities for uncertain tax positions we recorded in prior years. In 2016, the increase in the effective tax rate was primarily due to a change in the mix of income or losses between the U.S. and certain foreign jurisdictions. This resulted in a recapture of prior year U.S. manufacturing deductions and a limitation of the current benefit from certain foreign tax payments. In 2015 and 2014, the primary difference between our effective tax rates and the U.S. federal statutory rate of 35% was from our intent to indefinitely reinvest in certain of our international operations. Therefore, we were not providing for U.S. taxes on a portion of our foreign earnings. In 2017, we cannot project a meaningful effective rate, as the rate is less significant at a low pretax income or a pretax loss position. We do project a discrete additional income tax provision in the first quarter of 2017 in accordance with a new accounting standard associated with our share-based incentive plan.
Off-Balance Sheet Arrangements
We do not have any off-balance sheet arrangements, as defined by SEC rules.
Contractual Obligations
At December 31, 2016, we had payments due under contractual obligations as follows:
(dollars in thousands) | Payments due by period | ||||||||||||||||||
Total | 2017 | 2017-2018 | 2019-2020 | After 2020 | |||||||||||||||
Long-term Debt | $ | 800,000 | $ | — | $ | 30,000 | $ | 270,000 | $ | 500,000 | |||||||||
Vessel Charters | 26,260 | 24,970 | 1,290 | — | |||||||||||||||
Other Operating Leases | 255,699 | 31,478 | 49,193 | 36,221 | 138,807 | ||||||||||||||
Purchase Obligations | 160,471 | 149,954 | 10,413 | 45 | 59 | ||||||||||||||
Other Long-term Obligations reflected on our Balance Sheet under GAAP | 64,592 | 1,452 | 3,011 | 2,344 | 57,785 | ||||||||||||||
TOTAL | $ | 1,307,022 | $ | 207,854 | $ | 93,907 | $ | 308,610 | $ | 696,651 | |||||||||
The vessel charter obligations in the table above do not include any optional extension periods.
At December 31, 2016, we had outstanding purchase order commitments totaling $160 million, including approximately $25 million for the construction of a new subsea support vessel scheduled for delivery in 2017.
In 2001, we entered into an agreement with our Chairman of the Board of Directors (the "Chairman") who was also then our Chief Executive Officer. That agreement was amended in 2006 and in 2008. Pursuant to the amended agreement, the Chairman relinquished his position as Chief Executive Officer in May 2006 and began his post-employment service period on December 31, 2006, which continued through August 15, 2011, during which service period the Chairman, acting as an independent contractor, agreed to serve as nonexecutive Chairman of our Board of Directors. The agreement provides the Chairman with post-employment benefits for ten years following August 15, 2011. The agreement also provides for medical coverage on an after-tax basis to the
39
Chairman, his spouse and children for their lives. We recognized the net present value of the post-employment benefits over the expected service period. Our total accrued liabilities, current and long-term, under this post-employment benefit were $4.5 million and $5.1 million at December 31, 2016 and 2015, respectively.
Effects of Inflation and Changing Prices
Our financial statements are prepared in accordance with generally accepted accounting principles in the United States, using historical U.S. dollar accounting, or historical cost. Statements based on historical cost, however, do not adequately reflect the cumulative effect of increasing costs and changes in the purchasing power of the dollar, especially during times of significant and continued inflation.
In order to minimize the negative impact of inflation on our operations, we attempt to cover the increased cost of anticipated changes in labor, material and service costs, either through an estimate of those changes, which we reflect in the original price, or through price escalation clauses in our contracts. Inflation has not had a material effect on our revenue or income from operations in the past three years, and no such effect is expected in the near future.
40
Item 7A. | Quantitative and Qualitative Disclosures About Market Risk. |
We are currently exposed to certain market risks arising from transactions we have entered into in the normal course of business. These risks relate to interest rate changes and fluctuations in foreign exchange rates. We do not believe these risks are material. We have not entered into any market risk sensitive instruments for speculative or trading purposes. We currently have two interest rate swaps in place on a total of $200 million of the Senior Notes. See Note 6 of Notes to Consolidated Financial Statements included in this report for a description of these interest rate swaps. We typically manage our exposure to interest rate changes through the use of a combination of fixed- and floating-rate debt. See Note 5 of Notes to Consolidated Financial Statements included in this report for a description of our revolving credit facility and interest rates on our borrowings. We believe significant interest rate changes would not have a material near-term impact on our future earnings or cash flows.
Because we operate in various oil and gas exploration and production regions in the world, we conduct a portion of our business in currencies other than the U.S. dollar. The functional currency for several of our international operations is the applicable local currency. A stronger U.S. dollar against the U.K. pound sterling, the Norwegian kroner and the Brazilian real would result in lower operating income. We manage our exposure to changes in foreign exchange rates principally through arranging compensation in U.S. dollars or freely convertible currency and, to the extent possible, by limiting compensation received in other currencies to amounts necessary to meet obligations denominated in those currencies. We use the exchange rates in effect as of the balance sheet date to translate assets and liabilities as to which the functional currency is the local currency, resulting in translation adjustments that we reflect as accumulated other comprehensive income or loss in the shareholders' equity section of our Consolidated Balance Sheets. We recorded negative adjustments of $6 million, $119 million and $129 million to our equity accounts in 2016, 2015 and 2014, respectively. Negative adjustments reflect the net impact of the strengthening of the U.S. dollar against various foreign currencies for locations where the functional currency is not the U.S. dollar. Conversely, positive adjustments reflect the effect of a weakening U.S. dollar.
Included in other income (expenses), net are foreign currency transaction losses of $4.8 million, $15.4 million and $0.5 million for 2016, 2015 and 2014, respectively. The losses in 2016 and 2015 primarily related to Angola, which devalued its currency by 18% in 2016 and 24% in 2015. We likely would incur further foreign currency exchange losses in Angola if additional currency devaluations occur.
As of December 31, 2016, we had the equivalent of approximately $32.0 million of cash in kwanza in Angola reflected on our balance sheet. To mitigate our currency exposure risk in Angola, we have used kwanza to purchase $59.1 million equivalent Angolan central bank (Banco Nacional de Angola) bonds with various maturities throughout 2018. The bonds are denominated as U.S. dollar equivalents, so that, upon payment of semi-annual interest and principal upon maturity, payment is made in kwanza, equivalent to the respective U.S. dollars at the then-current exchange rate.
Item 8. | Financial Statements and Supplementary Data. |
In this report, our consolidated financial statements and supplementary data appear following the signature page to this report and are incorporated into this item by reference.
Item 9. | Changes in and Disagreements With Accountants on Accounting and Financial Disclosure. |
None.
41
Item 9A. | Controls and Procedures. |
Disclosure Controls and Procedures
In accordance with Rules 13a-15 and 15d-15 under the Securities Exchange Act of 1934, as amended (the "Exchange Act"), we carried out an evaluation, under the supervision and with the participation of management, including our principal executive officer and principal financial officer, of the effectiveness of our disclosure controls and procedures (as that term is defined in Rules 13a-15(e) and 15d-15(e) under the Exchange Act) as of the end of the period covered by this report. Based on that evaluation, our principal executive officer and principal financial officer concluded that our disclosure controls and procedures were effective as of December 31, 2016 to provide reasonable assurance that information required to be disclosed in our reports filed or submitted under the Exchange Act is recorded, processed, summarized and reported within the time periods specified in the Securities and Exchange Commission's rules and forms.
Internal Control over Financial Reporting
There has been no change in our internal control over financial reporting that occurred during the quarter ended December 31, 2016 that has materially affected, or is reasonably likely to materially affect, our internal control over financial reporting.
Management's Report on Internal Control Over Financial Reporting
Our management is responsible for establishing and maintaining adequate internal control over financial reporting (as that term is defined in Rules 13a-15(f) and 15d-15(f) under the Exchange Act). Our internal control over financial reporting is a process designed to provide reasonable, but not absolute, assurance regarding the reliability of financial reporting and the preparation of financial statements for external reporting purposes in accordance with accounting principles generally accepted in the United States of America. We developed our internal control over financial reporting through a process in which our management applied its judgment in assessing the costs and benefits of various controls and procedures, which, by their nature, can provide only reasonable assurance regarding the control objectives. You should note that the design of any system of controls is based in part on various assumptions about the likelihood of future events, and we cannot assure you that any system of controls will succeed in achieving its stated goals under all potential future conditions, regardless of how remote. Because of its inherent limitations, internal control over financial reporting may not prevent or detect misstatements. Also, projections of any evaluation of effectiveness to future periods are subject to the risk that controls may become inadequate because of changes in conditions, or that the degree of compliance with the policies and procedures may deteriorate.
Under the supervision and with the participation of our management, including our principal executive, financial and accounting officers, we have conducted an evaluation of the effectiveness of our internal control over financial reporting based on the framework in Internal Control – Integrated Framework issued by the Committee of Sponsoring Organizations of the Treadway Commission (2013 framework). This evaluation included a review of the documentation surrounding our financial reporting controls, an evaluation of the design effectiveness of these controls, testing of the operating effectiveness of these controls and an evaluation of our overall control environment. Based on that evaluation, our management has concluded that our internal control over financial reporting was effective as of December 31, 2016.
Ernst & Young LLP, the independent registered public accounting firm that audited our financial statements, has audited our internal control over financial reporting, as stated in their report that follows.
42
Report of Independent Registered Public Accounting Firm
To the Board of Directors and Shareholders of Oceaneering International, Inc.
We have audited the internal control over financial reporting of Oceaneering International, Inc. and subsidiaries as of December 31, 2016, based on criteria established in Internal Control – Integrated Framework issued by the Committee of Sponsoring Organizations of the Treadway Commission (2013 framework) (the "COSO criteria"). Oceaneering International, Inc. and subsidiaries' management is responsible for maintaining effective internal control over financial reporting, and for its assessment of the effectiveness of internal control over financial reporting included in the accompanying Management's Report on Internal Control Over Financial Reporting. Our responsibility is to express an opinion on the company's internal control over financial reporting based on our audit.
We conducted our audit in accordance with the standards of the Public Company Accounting Oversight Board (United States). Those standards require that we plan and perform the audit to obtain reasonable assurance about whether effective internal control over financial reporting was maintained in all material respects. Our audit included obtaining an understanding of internal control over financial reporting, assessing the risk that a material weakness exists, testing and evaluating the design and operating effectiveness of internal control based on the assessed risk, and performing such other procedures as we considered necessary in the circumstances. We believe that our audit provides a reasonable basis for our opinion.
A company's internal control over financial reporting is a process designed to provide reasonable assurance regarding the reliability of financial reporting and the preparation of financial statements for external purposes in accordance with generally accepted accounting principles. A company's internal control over financial reporting includes those policies and procedures that (1) pertain to the maintenance of records that, in reasonable detail, accurately and fairly reflect the transactions and dispositions of the assets of the company; (2) provide reasonable assurance that transactions are recorded as necessary to permit preparation of financial statements in accordance with generally accepted accounting principles, and that receipts and expenditures of the company are being made only in accordance with authorizations of management and directors of the company; and (3) provide reasonable assurance regarding prevention or timely detection of unauthorized acquisition, use, or disposition of the company's assets that could have a material effect on the financial statements.
Because of its inherent limitations, internal control over financial reporting may not prevent or detect misstatements. Also, projections of any evaluation of effectiveness to future periods are subject to the risk that controls may become inadequate because of changes in conditions, or that the degree of compliance with the policies or procedures may deteriorate.
In our opinion, Oceaneering International, Inc. and subsidiaries maintained, in all material respects, effective internal control over financial reporting as of December 31, 2016, based on the COSO criteria.
We also have audited, in accordance with the standards of the Public Company Accounting Oversight Board (United States), the consolidated balance sheets of Oceaneering International, Inc. and subsidiaries as of December 31, 2016 and 2015, and the related consolidated statements of income, comprehensive income, shareholders' equity and cash flows for each of the three years in the period ended December 31, 2016, and our report dated February 24, 2017 expressed an unqualified opinion thereon.
Houston, Texas | /s/ ERNST & YOUNG LLP |
February 24, 2017 | |
Item 9B. Other Information.
None.
43
Part III
Item 10. | Directors, Executive Officers and Corporate Governance. |
The information with respect to the directors and nominees for election to our Board of Directors is incorporated by reference from the section "Election of Directors" in our definitive proxy statement to be filed on or before May 1, 2017, relating to our 2017 Annual Meeting of Shareholders.
Information concerning our Audit Committee and the audit committee financial experts is incorporated by reference from the sections entitled "Corporate Governance" and "Committees of the Board – Audit Committee" in the proxy statement referred to in this Item 10. Information concerning our Code of Ethics is incorporated by reference from the section entitled "Code of Ethics" for the Chief Executive Officer and Senior Financial Officers in the proxy statement previously referred to in this Item 10.
The information with respect to our executive officers is provided under the heading "Executive Officers of the Registrant" following Item 1 of Part I of this report. There are no family relationships between any of our directors or executive officers.
The information with respect to the reporting by our directors and executive officers and persons who own more than 10% of our Common Stock under Section 16 of the Securities Exchange Act of 1934 is incorporated by reference from the section entitled "Section 16(a) Beneficial Ownership Reporting Compliance" in the proxy statement previously referred to in this Item 10.
Item 11. | Executive Compensation. |
The information required by Item 11 is incorporated by reference from the sections entitled "Compensation Committee Interlocks and Insider Participation," "Compensation Discussion and Analysis," "Report of the Compensation Committee," "Compensation of Executive Officers," and "Compensation of Nonemployee Directors" in the proxy statement referred to in Item 10 above.
Item 12. | Security Ownership of Certain Beneficial Owners and Management and Related Stockholder Matters. |
The information required by Item 12 is incorporated by reference from (1) the Equity Compensation Plan Information table appearing in Item 5 – "Market for Registrant's Common Equity, Related Stockholder Matters and Issuer Purchases of Equity Securities" in Part II of this report and (2) the section "Security Ownership of Management and Certain Beneficial Owners" in the proxy statement referred to in Item 10 above.
Item 13. | Certain Relationships and Related Transactions, and Director Independence. |
The information required by Item 13 is incorporated by reference from the sections entitled "Corporate Governance" and "Certain Relationships and Related Transactions" in the proxy statement referred to in Item 10 above.
Item 14. | Principal Accounting Fees and Services. |
The information required by Item 14 is incorporated by reference from the section entitled "Ratification of Appointment of Independent Auditors – Fees Incurred for Audit and Other Services provided by Ernst & Young LLP" in the proxy statement referred to in Item 10 above.
44
Part IV
Item 15. Exhibits, Financial Statement Schedules.
(a) | Documents filed as part of this report. |
1. | Financial Statements: |
(i) | Report of Independent Registered Public Accounting Firm |
(ii) | Consolidated Balance Sheets |
(iii) | Consolidated Statements of Income |
(iv) | Consolidated Statements of Comprehensive Income |
(v) | Consolidated Statements of Cash Flows |
(vi) | Consolidated Statements of Shareholders' Equity |
(vii) | Notes to Consolidated Financial Statements |
2. | Financial Statement Schedules: |
All schedules for which provision is made in the applicable regulations of the Securities and Exchange Commission have been omitted because they are not required under the relevant instructions or because the required information is not significant.
3. Exhibits:
Registration or File Number | Form of Report | Report Date | Exhibit Number | |||||||||
* | 3.01 | Restated Certificate of Incorporation | 1-10945 | 10-K | Dec. 2000 | 3.01 | ||||||
* | 3.02 | Certificate of Amendment to Restated Certificate of Incorporation | 1-10945 | 8-K | May 2008 | 3.1 | ||||||
* | 3.03 | Certificate of Amendment to Restated Certificate of Incorporation | 1-10945 | 8-K | May 2014 | 3.1 | ||||||
* | 3.04 | Amended and Restated Bylaws | 1-10945 | 8-K | Aug. 2015 | 3.1 | ||||||
* | 4.01 | Specimen of Common Stock Certificate | 1-10945 | 10-K | Mar. 1993 | 4(a) | ||||||
* | 4.02 | Credit Agreement, dated as of October 27, 2014, by and among Oceaneering International, Inc., Wells Fargo Bank, National Association, as administrative agent and swing line lender, and certain lenders party thereto | 1-10945 | 8-K | Oct. 2014 | 4.1 | ||||||
* | 4.03 | Agreement and Amendment No. 1 to Credit Agreement | 1-10945 | 8-K | Nov. 2015 | 4.1 | ||||||
* | 4.04 | Agreement and Amendment No. 2 to Credit Agreement | 1-10945 | 8-K | Nov. 2016 | 4.1 | ||||||
* | 4.05 | Indenture dated, November 21, 2014, between Oceaneering International, Inc. and Wells Fargo Bank, National Association, as Trustee, relating to senior debt securities of Oceaneering International, Inc. | 1-10945 | 8-K | Nov. 2014 | 4.1 | ||||||
* | 4.06 | First Supplemental Indenture, dated November 21, 2014, between Oceaneering International, Inc. and Wells Fargo Bank, National Association, as Trustee, providing for the issuance of Oceaneering International, Inc.’s 4.650% Senior Notes due 2024 (including Form of Notes). | 1-10945 | 8-K | Nov. 2014 | 4.2 | ||||||
45
We and certain of our consolidated subsidiaries are parties to debt instruments under which the total amount of securities authorized does not exceed 10% of our total consolidated assets. Pursuant to paragraph 4(iii)(A) of Item 601(b) of Regulation S-K, we agree to furnish a copy of those instruments to the Securities and Exchange Commission on request. | ||||||||||||
10.01 | + | Oceaneering International, Inc. Retirement Investment Plan, with amendments through December 28, 2016 | ||||||||||
* | 10.02 | + | Oceaneering Retirement Investment Plan Trust Agreement effective December 31, 2013 | 1-10945 | 10-K | Dec. 2014 | 10.13 | |||||
* | 10.03 | + | Amended and Restated Service Agreement dated as of December 21, 2006 between Oceaneering and John R. Huff | 1-10945 | 8-K | Dec. 2006 | 10.1 | |||||
* | 10.04 | + | Modification to Service Agreement dated as of December 21, 2006 between Oceaneering and John R. Huff | 1-10945 | 8-K | Dec. 2008 | 10.9 | |||||
* | 10.05 | + | Trust Agreement dated as of May 12, 2006 between Oceaneering and United Trust Company, National Association | 1-10945 | 8-K | May 2006 | 10.2 | |||||
* | 10.06 | + | First Amendment to Trust Agreement dated as of May 12, 2006 between Oceaneering International, Inc. and Bank of America National Association, as successor trustee | 1-10945 | 8-K | Dec. 2008 | 10.10 | |||||
* | 10.07 | + | Oceaneering International, Inc. Supplemental Executive Retirement Plan, as amended and restated effective January 1, 2009 | 1-10945 | 8-K | Dec. 2008 | 10.5 | |||||
* | 10.08 | + | Amended and Restated Oceaneering International, Inc. Supplemental Executive Retirement Plan, as amended and restated effective January 1, 2000 (for Internal Revenue Code Section 409A-grandfathered benefits) | 1-10945 | 8-K | Dec. 2008 | 10.6 | |||||
* | 10.09 | + | Change-of-Control Agreement dated as of November 16, 2001 between Oceaneering and M. Kevin McEvoy | 1-10945 | 10-K | Dec. 2001 | 10.06 | |||||
* | 10.10 | + | Form of First Amendment to Change-of-Control Agreement with M. Kevin McEvoy | 1-10945 | 8-K | Dec. 2008 | 10.7 | |||||
* | 10.11 | + | Form of Change-of-Control Agreement and Annex for Roderick A. Larson | 1-10945 | 8-K | Aug. 2015 | 10.3 | |||||
* | 10.12 | + | Form of Change-of-Control Agreement | 1-10945 | 8-K | May 2011 | 10.5 | |||||
* | 10.13 | + | Form of Indemnification Agreement | 1-10945 | 8-K | May 2011 | 10.4 | |||||
* | 10.14 | + | 2010 Incentive Plan | 333-166612 | S-8 | May 2010 | 4.6 | |||||
* | 10.15 | + | Amended and Restated 2010 Incentive Plan | 1-10945 | DEF 14A | Apr. 2015 | Appendix A | |||||
* | 10.16 | + | Form of 2016 Restricted Stock Unit Agreement | 1-10945 | 8-K | Feb. 2016 | 10.1 | |||||
* | 10.17 | + | Form of 2016 Performance Unit Agreement | 1-10945 | 8-K | Feb. 2016 | 10.2 | |||||
* | 10.18 | + | Form of 2016 Performance Award: Goals and Measures, relating to the form of 2016 Performance Unit Agreement | 1-10945 | 8-K | Feb. 2016 | 10.3 | |||||
* | 10.19 | + | Form of 2016 Nonemployee Director Restricted Stock Agreement | 1-10945 | 8-K | Feb. 2016 | 10.4 | |||||
* | 10.20 | + | 2016 Annual Cash Bonus Award Program Summary | 1-10945 | 8-K | Feb. 2016 | 10.5 | |||||
* | 10.21 | + | Form of 2015 Restricted Stock Unit Agreement | 1-10945 | 8-K | Feb. 2015 | 10.1 | |||||
* | 10.22 | + | Form of 2015 Performance Unit Agreement | 1-10945 | 8-K | Feb. 2015 | 10.2 | |||||
46
* | 10.23 | + | 2015 Performance Award: Goals and Measures, relating to the form of 2015 Performance Unit Agreement | 1-10945 | 8-K | Feb. 2015 | 10.3 | |||||
* | 10.24 | + | Form of 2015 Nonemployee Director Restricted Stock Agreement for Messrs. Collins, Huff, Hughes, Murphy and Pappas | 1-10945 | 8-K | Feb. 2015 | 10.4 | |||||
* | 10.25 | + | Form of 2015 Nonemployee Director Restricted Stock Agreement for Mr. DesRoche | 1-10945 | 8-K | Feb. 2015 | 10.5 | |||||
* | 10.26 | + | Oceaneering International, Inc. 2015 Annual Bonus Program Award Summary | 1-10945 | 8-K | Feb. 2015 | 10.7 | |||||
* | 10.27 | + | Form of 2014 Employee Restricted Stock Unit Agreement for Executive Officers | 1-10945 | 8-K | Feb. 2014 | 10.1 | |||||
* | 10.28 | + | Form of 2014 Chairman Restricted Stock Unit Agreement for Mr. Huff | 1-10945 | 8-K | Feb. 2014 | 10.3 | |||||
* | 10.29 | + | Form of 2014 Performance Unit Agreement for Executive Officers | 1-10945 | 8-K | Feb. 2014 | 10.2 | |||||
* | 10.30 | + | Form of 2014 Chairman Performance Unit Agreement for Mr. Huff | 1-10945 | 8-K | Feb. 2014 | 10.4 | |||||
* | 10.31 | + | 2014 Performance Award: Goals and Measures, relating to the form of 2014 Performance Unit Agreement for its executive officers and 2014 Chairman Performance Unit Agreement | 1-10945 | 8-K | Feb. 2014 | 10.5 | |||||
* | 10.32 | + | Form of 2014 Nonemployee Director Restricted Stock Agreement for Messrs. Collins, DesRoche, Hughes, Murphy and Pappas | 1-10945 | 8-K | Feb. 2014 | 10.6 | |||||
* | 10.33 | + | Oceaneering International, Inc. 2014 Annual Bonus Award Program Summary | 1-10945 | 8-K | Feb. 2015 | 10.6 | |||||
12.01 | Computation of Ratio of Earnings to Fixed Charges | |||||||||||
21.01 | Subsidiaries of Oceaneering | |||||||||||
23.01 | Consent of Independent Registered Public Accounting Firm | |||||||||||
31.01 | Rule 13a – 14(a)/15d – 14(a) certification of principal executive officer | |||||||||||
31.02 | Rule 13a – 14(a)/15d – 14(a) certification of principal financial officer | |||||||||||
32.01 | Section 1350 certification of principal executive officer | |||||||||||
32.02 | Section 1350 certification of principal financial officer | |||||||||||
101.INS | XBRL Instance Document | |||||||||||
101.SCH | XBRL Taxonomy Extension Schema Document | |||||||||||
101.CAL | XBRL Taxonomy Extension Calculation Linkbase Document | |||||||||||
101.DEF | XBRL Taxonomy Extension Definition Linkbase Document | |||||||||||
101.LAB | XBRL Taxonomy Extension Label Linkbase Document | |||||||||||
101.PRE | XBRL Taxonomy Extension Presentation Linkbase Document | |||||||||||
* | Exhibit previously filed with the Securities and Exchange Commission, as indicated, and incorporated herein by reference. | |||||||||||
+ | Management contract or compensatory plan or arrangement. | |||||||||||
47
SIGNATURES
Pursuant to the requirements of Section 13 or 15(d) of the Securities Exchange Act of 1934, the registrant has duly caused this report to be signed on its behalf by the undersigned, thereunto duly authorized.
OCEANEERING INTERNATIONAL, INC. | ||||
Date: | February 24, 2017 | By: | /S/ M. KEVIN MCEVOY | |
M. Kevin McEvoy | ||||
Chief Executive Officer | ||||
Pursuant to the requirements of the Securities Exchange Act of 1934, this report has been signed below by the following persons on behalf of the registrant and in the capacities and on the dates indicated.
Signature | Title | Date | |
/S/ M. KEVIN MCEVOY | Chief Executive Officer and Director | February 24, 2017 | |
M. Kevin McEvoy | (Principal Executive Officer) | ||
/S/ ALAN R. CURTIS | Senior Vice President and Chief Financial Officer | February 24, 2017 | |
Alan R. Curtis | (Principal Financial Officer) | ||
/S/ W. CARDON GERNER | Senior Vice President and Chief Accounting Officer | February 24, 2017 | |
W. Cardon Gerner | (Principal Accounting Officer) | ||
/S/ JOHN R. HUFF | Chairman of the Board | February 24, 2017 | |
John R. Huff | |||
/S/ WILLIAM B. BERRY | Director | February 24, 2017 | |
William B. Berry | |||
/S/ T. JAY COLLINS | Director | February 24, 2017 | |
T. Jay Collins | |||
/S/ D. MICHAEL HUGHES | Director | February 24, 2017 | |
D. Michael Hughes | |||
/S/ PAUL B. MURPHY, JR. | Director | February 24, 2017 | |
Paul B. Murphy, Jr. | |||
/S/ JON ERIK REINHARDSEN | Director | February 24, 2017 | |
Jon Erik Reinhardsen | |||
/S/ STEVEN A. WEBSTER | Director | February 24, 2017 | |
Steven A. Webster | |||
48
INDEX TO FINANCIAL STATEMENTS AND SCHEDULES
Index to Financial Statements
Index to Schedules
All schedules for which provision is made in the applicable regulations of the Securities and Exchange Commission have been omitted because they are not required under the relevant instructions or because the required information is not significant.
49
REPORT OF INDEPENDENT REGISTERED PUBLIC ACCOUNTING FIRM
To the Board of Directors and Shareholders of Oceaneering International, Inc.
We have audited the accompanying consolidated balance sheets of Oceaneering International, Inc. and subsidiaries as of December 31, 2016 and 2015, and the related consolidated statements of income, comprehensive income, shareholders' equity and cash flows for each of the three years in the period ended December 31, 2016. These financial statements are the responsibility of the Company's management. Our responsibility is to express an opinion on these financial statements based on our audits.
We conducted our audits in accordance with the standards of the Public Company Accounting Oversight Board (United States). Those standards require that we plan and perform the audit to obtain reasonable assurance about whether the financial statements are free of material misstatement. An audit includes examining, on a test basis, evidence supporting the amounts and disclosures in the financial statements. An audit also includes assessing the accounting principles used and significant estimates made by management, as well as evaluating the overall financial statement presentation. We believe that our audits provide a reasonable basis for our opinion.
In our opinion, the consolidated financial statements referred to above present fairly, in all material respects, the consolidated financial position of Oceaneering International, Inc. and subsidiaries as of December 31, 2016 and 2015, and the consolidated results of its operations and its cash flows for each of the three years in the period ended December 31, 2016, in conformity with U.S. generally accepted accounting principles.
We also have audited, in accordance with the standards of the Public Company Accounting Oversight Board (United States), Oceaneering International, Inc.'s internal control over financial reporting as of December 31, 2016, based on criteria established in Internal Control – Integrated Framework issued by the Committee of Sponsoring Organizations of the Treadway Commission (2013 framework) and our report dated February 24, 2017 expressed an unqualified opinion thereon.
/s/ ERNST & YOUNG LLP | ||
Houston, Texas | ||
February 24, 2017 | ||
50
OCEANEERING INTERNATIONAL, INC. AND SUBSIDIARIES
CONSOLIDATED BALANCE SHEETS
December 31, | ||||||||
(in thousands, except share data) | 2016 | 2015 | ||||||
ASSETS | ||||||||
Current Assets: | ||||||||
Cash and cash equivalents | $ | 450,193 | $ | 385,235 | ||||
Accounts receivable, net of allowances for doubtful accounts of $8,288 and $5,893 | 489,749 | 612,785 | ||||||
Inventory | 280,130 | 328,453 | ||||||
Other current assets | 42,523 | 191,020 | ||||||
Total Current Assets | 1,262,595 | 1,517,493 | ||||||
Property and Equipment, at cost | 2,728,125 | 2,772,580 | ||||||
Less accumulated depreciation | 1,574,867 | 1,505,849 | ||||||
Net Property and Equipment | 1,153,258 | 1,266,731 | ||||||
Other Assets: | ||||||||
Goodwill | 443,551 | 426,872 | ||||||
Other non-current assets | 270,911 | 218,440 | ||||||
Total Other Assets | 714,462 | 645,312 | ||||||
Total Assets | $ | 3,130,315 | $ | 3,429,536 | ||||
LIABILITIES AND SHAREHOLDERS' EQUITY | ||||||||
Current Liabilities: | ||||||||
Accounts payable | $ | 77,593 | $ | 118,277 | ||||
Accrued liabilities | 430,771 | 497,679 | ||||||
Total Current Liabilities | 508,364 | 615,956 | ||||||
Long-term Debt | 793,058 | 795,836 | ||||||
Other Long-term Liabilities | 312,250 | 439,010 | ||||||
Commitments and Contingencies | ||||||||
Shareholders' Equity: | ||||||||
Common Stock, par value $0.25 per share; 360,000,000 shares authorized; 110,834,088 shares issued | 27,709 | 27,709 | ||||||
Additional paid-in capital | 227,566 | 230,179 | ||||||
Treasury stock; 12,768,726 and 12,984,829 shares, at cost | (731,202 | ) | (743,577 | ) | ||||
Retained earnings | 2,295,234 | 2,364,786 | ||||||
Accumulated other comprehensive income (loss) | (302,664 | ) | (300,363 | ) | ||||
Total Shareholders' Equity | 1,516,643 | 1,578,734 | ||||||
Total Liabilities and Shareholders' Equity | $ | 3,130,315 | $ | 3,429,536 | ||||
The accompanying Notes are an integral part of these Consolidated Financial Statements.
51
OCEANEERING INTERNATIONAL, INC. AND SUBSIDIARIES
CONSOLIDATED STATEMENTS OF INCOME
Year Ended December 31, | |||||||||||||
(in thousands, except per share data) | 2016 | 2015 | 2014 | ||||||||||
Revenue | $ | 2,271,603 | $ | 3,062,754 | $ | 3,659,624 | |||||||
Cost of services and products | 1,992,376 | 2,457,325 | 2,800,423 | ||||||||||
Gross Margin | 279,227 | 605,429 | 859,201 | ||||||||||
Selling, general and administrative expense | 208,463 | 231,619 | 230,871 | ||||||||||
Income from Operations | 70,764 | 373,810 | 628,330 | ||||||||||
Interest income | 3,900 | 607 | 293 | ||||||||||
Interest expense, net of amounts capitalized | (25,318 | ) | (25,050 | ) | (4,708 | ) | |||||||
Equity earnings (losses) of unconsolidated affiliates | 244 | 2,230 | (51 | ) | |||||||||
Other income (expense), net | (6,244 | ) | (15,336 | ) | (387 | ) | |||||||
Income before Income Taxes | 43,346 | 336,261 | 623,477 | ||||||||||
Provision for income taxes | 18,760 | 105,250 | 195,148 | ||||||||||
Net Income | $ | 24,586 | $ | 231,011 | $ | 428,329 | |||||||
Cash dividends declared per Share | $ | 0.96 | $ | 1.08 | $ | 1.03 | |||||||
Basic Earnings per Share | $ | 0.25 | $ | 2.35 | $ | 4.02 | |||||||
Weighted average basic shares outstanding | 98,035 | 98,417 | 106,593 | ||||||||||
Diluted Earnings per Share | $ | 0.25 | $ | 2.34 | $ | 4.00 | |||||||
Weighted average diluted shares outstanding | 98,424 | 98,808 | 107,091 | ||||||||||
The accompanying Notes are an integral part of these Consolidated Financial Statements.
52
OCEANEERING INTERNATIONAL, INC. AND SUBSIDIARIES
CONSOLIDATED STATEMENTS OF COMPREHENSIVE INCOME
(in thousands)
Year Ended December 31, | |||||||||||||
2016 | 2015 | 2014 | |||||||||||
Net Income | $ | 24,586 | $ | 231,011 | $ | 428,329 | |||||||
Other comprehensive income (loss), net of tax: | |||||||||||||
Foreign currency translation | (5,559 | ) | (118,705 | ) | (128,666 | ) | |||||||
Pension-related adjustments | 3,258 | 1,532 | (1,947 | ) | |||||||||
Other comprehensive income (loss) | (2,301 | ) | (117,173 | ) | (130,613 | ) | |||||||
Comprehensive Income | $ | 22,285 | $ | 113,838 | $ | 297,716 | |||||||
The accompanying Notes are an integral part of these Consolidated Financial Statements.
53
OCEANEERING INTERNATIONAL, INC. AND SUBSIDIARIES
CONSOLIDATED STATEMENTS OF CASH FLOWS
Year Ended December 31, | ||||||||||||
(in thousands) | 2016 | 2015 | 2014 | |||||||||
Cash Flows from Operating Activities: | ||||||||||||
Net income | $ | 24,586 | $ | 231,011 | $ | 428,329 | ||||||
Adjustments to reconcile net income to net cash provided by operating activities: | ||||||||||||
Depreciation and amortization | 250,247 | 241,235 | 229,779 | |||||||||
Deferred income tax provision | 98 | 29,090 | 70,717 | |||||||||
Inventory write-downs | 30,490 | 25,990 | — | |||||||||
Net loss (gain) on dispositions of property and equipment | 387 | 4,917 | (1,165 | ) | ||||||||
Noncash compensation | 14,687 | 17,289 | 20,034 | |||||||||
Excluding the effects of acquisitions, increase (decrease) in cash from: | ||||||||||||
Accounts receivable | 123,036 | 178,796 | (8,482 | ) | ||||||||
Inventory | 17,833 | 33,192 | 66,327 | |||||||||
Other operating assets | 53,946 | (65,786 | ) | (11,197 | ) | |||||||
Currency translation effect on working capital, excluding cash | (9,183 | ) | (30,228 | ) | (21,603 | ) | ||||||
Accounts payable and accrued liabilities | (117,133 | ) | (44,783 | ) | (43,507 | ) | ||||||
Income taxes payable | (38,985 | ) | (45,943 | ) | (15,639 | ) | ||||||
Other operating liabilities | (9,487 | ) | (14,372 | ) | 8,169 | |||||||
Total adjustments to net income | 315,936 | 329,397 | 293,433 | |||||||||
Net Cash Provided by Operating Activities | 340,522 | 560,408 | 721,762 | |||||||||
Cash Flows from Investing Activities: | ||||||||||||
Purchases of property and equipment | (112,392 | ) | (199,970 | ) | (386,883 | ) | ||||||
Business acquisitions, net of cash acquired | (30,121 | ) | (224,018 | ) | (39,788 | ) | ||||||
Other investments | (39,130 | ) | (19,531 | ) | — | |||||||
Distributions of capital from unconsolidated affiliates | 6,470 | 5,963 | 4,772 | |||||||||
Dispositions of property and equipment and life insurance proceeds | 5,702 | 376 | 2,427 | |||||||||
Net Cash Used in Investing Activities | (169,471 | ) | (437,180 | ) | (419,472 | ) | ||||||
Cash Flows from Financing Activities: | ||||||||||||
Net proceeds of 4.65% Senior Notes, net of issuance costs | — | — | 493,125 | |||||||||
Net proceeds (payments) of bank credit facilities, net of new loan costs | — | 49,665 | 248,429 | |||||||||
Excess tax benefits (deficiencies) from employee benefit plans | (3,004 | ) | 247 | 3,932 | ||||||||
Cash dividends | (94,138 | ) | (106,454 | ) | (109,742 | ) | ||||||
Purchases of treasury stock | — | (100,459 | ) | (590,384 | ) | |||||||
Net Cash Provided by (Used in) Financing Activities | (97,142 | ) | (157,001 | ) | 45,360 | |||||||
Effect of exchange rates on cash | (8,951 | ) | (11,706 | ) | (8,366 | ) | ||||||
Net Increase (Decrease) in Cash and Cash Equivalents | 64,958 | (45,479 | ) | 339,284 | ||||||||
Cash and Cash Equivalents—Beginning of Period | 385,235 | 430,714 | 91,430 | |||||||||
Cash and Cash Equivalents—End of Period | $ | 450,193 | $ | 385,235 | $ | 430,714 | ||||||
The accompanying Notes are an integral part of these Consolidated Financial Statements.
54
OCEANEERING INTERNATIONAL, INC. AND SUBSIDIARIES
CONSOLIDATED STATEMENTS OF SHAREHOLDERS' EQUITY
Accumulated Other Comprehensive Income (Loss) | |||||||||||||||||||||||||||||||
Common Stock Issued | Additional Paid-in Capital | Treasury Stock | Retained Earnings | Currency Translation Adjustments | Pension | ||||||||||||||||||||||||||
(in thousands) | Shares | Amount | Total | ||||||||||||||||||||||||||||
Balance, December 31, 2013 | 110,834 | $ | 27,709 | $ | 222,402 | $ | (75,736 | ) | $ | 1,921,642 | $ | (50,144 | ) | $ | (2,433 | ) | $ | 2,043,440 | |||||||||||||
Net Income | — | — | — | — | 428,329 | — | — | 428,329 | |||||||||||||||||||||||
Other Comprehensive Income | — | — | — | — | — | (128,666 | ) | (1,947 | ) | (130,613 | ) | ||||||||||||||||||||
Restricted stock unit activity | — | — | 4,311 | 8,198 | — | — | — | 12,509 | |||||||||||||||||||||||
Restricted stock activity | — | — | (1,005 | ) | 1,005 | — | — | — | — | ||||||||||||||||||||||
Tax benefits from employee benefit plans | — | — | 3,932 | — | — | — | — | 3,932 | |||||||||||||||||||||||
Cash dividends | — | — | — | — | (109,742 | ) | — | — | (109,742 | ) | |||||||||||||||||||||
Treasury stock purchases, 8,900,000 shares | (590,384 | ) | (590,384 | ) | |||||||||||||||||||||||||||
Balance, December 31, 2014 | 110,834 | 27,709 | 229,640 | (656,917 | ) | 2,240,229 | (178,810 | ) | (4,380 | ) | 1,657,471 | ||||||||||||||||||||
Net Income | — | — | — | — | 231,011 | — | — | 231,011 | |||||||||||||||||||||||
Other Comprehensive Income | — | — | — | — | — | (118,705 | ) | 1,532 | (117,173 | ) | |||||||||||||||||||||
Restricted stock unit activity | — | — | 2,163 | 11,928 | — | — | — | 14,091 | |||||||||||||||||||||||
Restricted stock activity | — | — | (1,871 | ) | 1,871 | — | — | — | — | ||||||||||||||||||||||
Tax benefits from employee benefit plans | — | — | 247 | — | — | — | — | 247 | |||||||||||||||||||||||
Cash dividends | — | — | — | — | (106,454 | ) | — | — | (106,454 | ) | |||||||||||||||||||||
Treasury stock purchases, 2,000,000 shares | — | — | — | (100,459 | ) | — | — | — | (100,459 | ) | |||||||||||||||||||||
Balance, December 31, 2015 | 110,834 | 27,709 | 230,179 | (743,577 | ) | 2,364,786 | (297,515 | ) | (2,848 | ) | 1,578,734 | ||||||||||||||||||||
Net Income | — | — | — | — | 24,586 | — | — | 24,586 | |||||||||||||||||||||||
Other Comprehensive Income | — | — | — | — | — | (5,559 | ) | 3,258 | (2,301 | ) | |||||||||||||||||||||
Restricted stock unit activity | — | — | 2,338 | 10,428 | — | — | — | 12,766 | |||||||||||||||||||||||
Restricted stock activity | — | — | (1,947 | ) | 1,947 | — | — | — | — | ||||||||||||||||||||||
Tax benefits (deficiencies) from employee benefit plans | — | — | (3,004 | ) | — | — | — | — | (3,004 | ) | |||||||||||||||||||||
Cash dividends | — | — | — | — | (94,138 | ) | — | — | (94,138 | ) | |||||||||||||||||||||
Balance, December 31, 2016 | 110,834 | $ | 27,709 | $ | 227,566 | $ | (731,202 | ) | $ | 2,295,234 | $ | (303,074 | ) | $ | 410 | $ | 1,516,643 | ||||||||||||||
The accompanying Notes are an integral part of these Consolidated Financial Statements.
55
NOTES TO CONSOLIDATED FINANCIAL STATEMENTS
1. | SUMMARY OF MAJOR ACCOUNTING POLICIES |
Principles of Consolidation. The consolidated financial statements include the accounts of Oceaneering International, Inc. and our 50% or more owned and controlled subsidiaries. We also consolidate entities that are determined to be variable interest entities if we determine that we are the primary beneficiary; otherwise, we account for those entities using the equity method of accounting. We use the equity method to account for our investments in unconsolidated affiliated companies of which we own an equity interest of between 20% and 50% and as to which we have significant influence, but not control, over operations. We use the cost method for all other long-term investments. Investments in entities that we do not consolidate are reflected on our balance sheet in Other non-current assets. All significant intercompany accounts and transactions have been eliminated.
Use of Estimates. The preparation of financial statements in conformity with accounting principles generally accepted in the United States ("U.S. GAAP") requires that our management make estimates and assumptions that affect the reported amounts of assets and liabilities, disclosure of contingent assets and liabilities at the date of the financial statements and the reported amounts of revenue and expense during the reporting period. Actual results could differ from those estimates.
Reclassifications. Certain amounts from prior periods have been reclassified to conform with the current year presentation.
Cash and Cash Equivalents. Cash and cash equivalents include demand deposits and highly liquid investments with original maturities of three months or less from the date of investment.
Accounts Receivable – Allowances for Doubtful Accounts. We determine the need for allowances for doubtful accounts using the specific identification method. We do not generally require collateral from our customers.
Inventory. Inventory is valued at lower of cost or market. We determine cost using the weighted-average method. During 2016, we recorded inventory write-downs totaling $30.5 million for excess inventory of $25.2 million in our ROV segment and $5.3 million in our Subsea Products segment. In 2015, we recorded inventory write-downs totaling $26.0 million: $15.7 million attributable to remotely operated vehicle components, as we determined the components would not be used as a result of the deterioration in market conditions, and $10.3 million in our Subsea Products segment, primarily the result of our decision to cease manufacturing subsea blow out preventer ("BOP") control systems.
Property and Equipment and Long-Lived Intangible Assets. We provide for depreciation of property and equipment on the straight-line method over estimated useful lives of eight years for ROVs, three to 20 years for marine services equipment (such as vessels and diving equipment), and three to 25 years for buildings, improvements and other equipment.
Long-lived intangible assets, primarily acquired in connection with business combinations, include trade names, intellectual property and customer relationships and are being amortized with a weighted average remaining life of approximately nine years. Amortization expense on intangible assets was $10.2 million, $7.8 million and $6.6 million in 2016, 2015 and 2014, respectively.
We charge the costs of repair and maintenance of property and equipment to operations as incurred, while we capitalize the costs of improvements that extend asset lives or functionality.
We capitalize interest on assets where the construction period is anticipated to be more than three months. We capitalized $3.7 million, $2.4 million and $0.7 million of interest in 2016, 2015 and 2014, respectively. We do not allocate general administrative costs to capital projects. Upon the disposition of property and equipment, the related cost and accumulated depreciation accounts are relieved and any resulting gain or loss is included as an adjustment to cost of services and products.
56
Our management periodically, and upon the occurrence of a triggering event, reviews the realizability of our property and equipment and long-lived intangible assets to determine whether any events or changes in circumstances indicate that the carrying amount of the asset may not be recoverable. For long-lived assets to be held and used, we base our evaluation on impairment indicators such as the nature of the assets, the future economic benefits of the assets, any historical or future profitability measurements and other external market conditions or factors that may be present. If such impairment indicators are present or other factors exist that indicate that the carrying amount of an asset may not be recoverable, we determine whether an impairment has occurred through the use of an undiscounted cash flows analysis of the asset at the lowest level for which identifiable cash flows exist. If an impairment has occurred, we recognize a loss for the difference between the carrying amount and the fair value of the asset. For assets held for sale or disposal, the fair value of the asset is measured using fair market value less cost to sell. Assets are classified as held-for-sale when we have a plan for disposal of certain assets and those assets meet the held for sale criteria.
Business Acquisitions. We account for business combinations using the acquisition method of accounting, with acquisition prices being allocated to the assets acquired and liabilities assumed based on their fair values at the respective dates of acquisition.
We made several smaller acquisitions during the periods presented, none of which were material.
In April 2015, we completed the acquisition of C & C Technologies, Inc. ("C&C"). C&C is a global provider of ocean-bottom mapping services in deepwater utilizing customized autonomous underwater vehicles and provides marine construction surveys for both surface and subsea assets, as well as satellite-based positioning services for drilling rigs and seismic and construction vessels. C&C also provides land and near-shore survey services along the U.S. Gulf Coast and in Mexico, and performs shallow water conventional geophysical surveys in the U.S. Gulf of Mexico. The acquisition price of approximately $224 million was paid in cash. We have accounted for this acquisition by allocating the purchase price to the assets acquired and liabilities assumed based on their estimated fair values at the date of acquisition. Based on the terms of the acquisition agreement, all of our goodwill and other intangible assets associated with the C&C acquisition will be deductible for income tax purposes. We have included C&C's operations in our consolidated financial statements starting from the date of closing, and its operating results are reflected in our Subsea Projects segment. The acquisition of C&C did not have a material effect on our operating results, cash flows from operations or financial position.
Goodwill. In our annual evaluation of goodwill impairment, we first assess qualitative factors to determine whether the existence of events or circumstances leads to a determination that it is more likely than not that the fair value of a reporting unit is less than its carrying amount. If, after assessing the totality of events or circumstances, we determine it is more likely than not that the fair value of a reporting unit exceeds its carrying amount, performing the two-step impairment test is unnecessary. However, if we conclude otherwise, then we are required to perform the first step of the two-step impairment test. We tested the goodwill attributable to each of our reporting units for impairment as of December 31, 2016 and 2015 and concluded that there was no impairment. The only changes in our reporting units' goodwill balances during the periods presented are from business acquisitions, as discussed above, and currency exchange rate changes. For information regarding goodwill by business segment, see Note 7.
Revenue Recognition. We recognize our revenue according to the type of contract involved. On a daily basis, we recognize revenue under contracts that provide for specific time, material and equipment charges, which we bill periodically, ranging from weekly to monthly.
57
We account for significant fixed-price contracts, which we enter into mainly in our Subsea Products segment, and to a lesser extent in our Subsea Projects and Advanced Technologies segments, using the percentage-of-completion method. In 2016, we accounted for 16% of our revenue using the percentage-of-completion method. In determining whether a contract should be accounted for using the percentage-of-completion method, we consider whether:
• | the customer provides specifications for the construction of facilities or production of goods or for the provision of related services; |
• | we can reasonably estimate our progress towards completion and our costs; |
• | the contract includes provisions as to the enforceable rights regarding the goods or services to be provided, consideration to be received and the manner and terms of payment; |
• | the customer can be expected to satisfy its obligations under the contract; and |
• | we can be expected to perform our contractual obligations. |
Under the percentage-of-completion method, we generally recognize estimated contract revenue based on costs incurred to date as a percentage of total estimated costs. Changes in the expected cost of materials and labor, productivity, scheduling and other factors affect the total estimated costs. Additionally, external factors, including weather or other factors outside of our control, may also affect the progress and estimated cost of a project's completion and, therefore, the timing of income and revenue recognition. We routinely review estimates related to our contracts and reflect revisions to profitability in earnings immediately. If a current estimate of total contract cost indicates an ultimate loss on a contract, we recognize the projected loss in full when we determine it. In prior years, we have recorded adjustments to earnings as a result of revisions to contract estimates. Although we are continually striving to accurately estimate our contract costs and profitability, adjustments to overall contract costs could be significant in future periods.
We recognize the remainder of our revenue when persuasive evidence of an arrangement exists, delivery has occurred or services have been rendered, price is fixed or determinable and collection is reasonably assured.
Revenue in Excess of Amounts Billed is classified as accounts receivable and relates to recoverable costs and accrued profits on contracts in progress. Billings in Excess of Revenue Recognized on uncompleted contracts are classified in accrued liabilities.
Revenue in Excess of Amounts Billed on uncompleted fixed-price contracts accounted for using the percentage-of-completion method is summarized as follows:
December 31, | ||||||||
(in thousands) | 2016 | 2015 | ||||||
Revenue recognized | $ | 538,986 | $ | 694,690 | ||||
Less: Billings to customers | (488,814 | ) | (649,550 | ) | ||||
Revenue in excess of amounts billed | $ | 50,172 | $ | 45,140 | ||||
Billings in Excess of Revenue Recognized on uncompleted fixed-price contracts accounted for using the percentage-of-completion method are summarized as follows:
December 31, | ||||||||
(in thousands) | 2016 | 2015 | ||||||
Amounts billed to customers | $ | 178,914 | $ | 302,904 | ||||
Less: Revenue recognized | (81,800 | ) | (190,812 | ) | ||||
Billings in excess of revenue recognized | $ | 97,114 | $ | 112,092 | ||||
Stock-Based Compensation. We recognize all share-based payments to directors, officers and employees over their vesting periods in the income statement based on their estimated fair values. For more information on our employee benefit plans, see Note 8.
58
Income Taxes. We provide income taxes at appropriate tax rates in accordance with our interpretation of the respective tax laws and regulations after review and consultation with our internal tax department, tax advisors and, in some cases, legal counsel in various jurisdictions. We provide for deferred income taxes for differences between carrying amounts of assets and liabilities for financial and tax reporting purposes. We provide for deferred U.S. income taxes on foreign income only to the extent such income is not indefinitely reinvested in foreign entities. We provide a valuation allowance against deferred tax assets when it is more likely than not that the asset will not be realized.
We recognize the benefit for a tax position if the benefit is more likely than not to be sustainable upon audit by the applicable taxing authority. If this threshold is met, the tax benefit is then measured and recognized at the largest amount that we believe is greater than 50% likely of being realized upon ultimate settlement. We account for any applicable interest and penalties on uncertain tax positions as a component of our provision for income taxes on our financial statements.
Foreign Currency Translation. The functional currency for most of our foreign subsidiaries is the applicable local currency. Results of operations for foreign subsidiaries with functional currencies other than the U.S. dollar are translated into U.S. dollars using average exchange rates during the period. Assets and liabilities of these foreign subsidiaries are translated into U.S. dollars using the exchange rates in effect at the balance sheet date, and the resulting translation adjustments are recognized, net of tax, in accumulated other comprehensive income as a component of shareholders' equity. All foreign currency transaction gains and losses are recognized currently in the Consolidated Statements of Income. We recorded $(4.8) million, $(15.4) million and $(0.5) million of foreign currency transaction gains (losses) in 2016, 2015 and 2014, respectively, and those amounts are included as a component of Other income (expense), net.
Earnings per Share. For each year presented, the only difference between our annual calculated weighted average basic and diluted number of shares outstanding is the effect of outstanding restricted stock units.
Repurchase Plans. In February 2010, our Board of Directors approved a program to repurchase up to 12 million shares of our common stock. In 2014, we completed the purchase of the shares authorized under that program by repurchasing the remaining 8.9 million shares for $590 million. The total cost for the repurchase of the 12 million shares of our common stock was $677 million.
In December 2014, following completion of the February 2010 program, our Board of Directors approved a new share repurchase program under which we may repurchase up to 10 million shares of our common stock on a discretionary basis. The December 2014 program calls for the repurchases to be made in the open market, or in privately negotiated transactions from time to time, in compliance with applicable laws, rules and regulations, including Rule 10b-18 under the Securities Exchange Act of 1934, as amended, subject to market and business conditions, levels of available liquidity, cash requirements for other purposes, applicable legal requirements and other relevant factors. The timing and amount of any repurchases will be determined by management based on its evaluation of these factors. We expect that any shares repurchased under the new program will be held as treasury stock for future use. The new program does not obligate us to repurchase any particular number of shares. Under the new program, we had repurchased 2 million shares of our common stock for $100 million through December 31, 2016. We account for the shares we hold in treasury under the cost method, at average cost.
Financial Instruments. We recognize all derivative instruments as either assets or liabilities in the balance sheet and measure those instruments at fair value. Subsequent changes in fair value are reflected in current earnings, other comprehensive income or changes in assets or liabilities, depending on whether a derivative instrument is designated as part of a hedge relationship and, if it is, the type of hedge relationship. See Note 6 for information relative to the interest rate swaps we have in effect.
59
New Accounting Standards. In May 2014, the Financial Accounting Standards Board ("FASB") issued Accounting Standards Update ("ASU") 2014-09, "Revenue from Contracts with Customers." ASU 2014-09, as amended, completes the joint effort by the FASB and International Accounting Standards Board to improve financial reporting by creating common revenue recognition guidance for U.S. GAAP and International Financial Reporting Standards. ASU 2014-09 applies to all companies that enter into contracts with customers to transfer goods or services. ASU 2014-09 is effective for us for interim and annual reporting periods beginning after December 15, 2017. Early application is not permitted before periods beginning after December 15, 2016. We are currently determining the impacts of ASU 2014-09 on our existing contracts. We have formed a project team for this implementation. Our approach includes performing a detailed review of contracts representative of our different businesses and comparing historical accounting policies and practices to the requirements of this update. Because the update will impact our business processes, systems and controls, we are also developing a project plan for the implementation. We have chosen to apply ASU 2014-09 by recognizing the cumulative effect of applying ASU 2014-09 at the date of initial application and not adjusting comparative information. Our evaluation of the requirements of ASU 2014-09 is ongoing and we have not yet determined its impact on our consolidated financial statements.
In July 2015, the FASB issued ASU 2015-11, "Inventory - Simplifying the Measurement of Inventory." ASU 2015-11 requires companies to measure inventory at the lower of cost or net realizable value rather than at the lower of cost or market. Net realizable value is the estimated selling price in the ordinary course of business, less reasonably predictable costs of completion, disposal and transportation. This guidance is effective for our inventories beginning January 1, 2017. We do not anticipate that this update will have a material impact on our consolidated financial statements.
In September 2015, the FASB issued ASU 2015-16, "Business Combinations - Simplifying the Accounting for Measurement-Period Adjustments." This update requires that an acquirer recognize adjustments to provisional amounts that are identified during the measurement period in the reporting period in which the adjustment amounts are determined. The update requires that the acquirer record, in the same period’s financial statements, the effect on earnings of changes in depreciation, amortization, or other income effects, if any, as a result of the change to the provisional amounts, calculated as if the accounting had been completed at the acquisition date. The update requires an entity to present separately on the face of the income statement or disclose in the notes the portion of the amount recorded in current-period earnings by line item that would have been recorded in previous reporting periods if the adjustment to the provisional amounts had been recognized as of the acquisition date. ASU 2015-16 became effective for our financial statements January 1, 2016. This update has not had a material impact on our consolidated financial statements.
In November 2015, the FASB issued ASU 2015-17, "Balance Sheet Classification of Deferred Taxes." Previous GAAP required an entity to separate deferred income tax liabilities and assets into current and noncurrent amounts in a classified statement of financial position. The update requires that deferred tax liabilities and assets be classified as noncurrent in a classified statement of financial position. ASU 2015-17 is effective for our financial statements issued for fiscal years beginning after December 15, 2016, and interim periods within those fiscal years. Earlier application is permitted, and we have adopted this update for our December 31, 2016 balance sheet. This update did not have a material impact on our consolidated financial statements. Prior periods were not retrospectively adjusted.
60
In January 2016, the FASB issued ASU 2016-01, "Financial Instruments—Overall (Subtopic 825-10) Recognition and Measurement of Financial Assets and Financial Liabilities." This update:
• | requires equity investments (except those accounted for under the equity method of accounting or those that result in consolidation of the investee) to be measured at fair value with changes in fair value recognized in net income; |
• | simplifies the impairment assessment of equity investments without readily determinable fair values by requiring a qualitative assessment to identify impairment. When a qualitative assessment indicates that impairment exists, an entity is required to measure the investment at fair value; |
• | eliminates the requirement to disclose the method(s) and significant assumptions used to estimate the fair value that is required to be disclosed for financial instruments measured at amortized cost on the balance sheet; |
• | requires entities to use the exit price notion when measuring the fair value of financial instruments for disclosure purposes; |
• | requires an entity to present separately in other comprehensive income the portion of the total change in the fair value of a liability resulting from a change in the instrument-specific credit risk when the entity has elected to measure the liability at fair value in accordance with the fair value option for financial instruments; |
• | requires separate presentation of financial assets and financial liabilities by measurement category and form of financial asset (that is, securities or loans and receivables) on the balance sheet or the accompanying notes to the financial statements; and |
• | clarifies that an entity should evaluate the need for a valuation allowance on a deferred tax asset related to available-for-sale securities in combination with the entity’s other deferred tax assets. |
ASU 2016-01 will be effective for us beginning on January 1, 2018. We are currently assessing the impact of these requirements on our consolidated financial statements and future disclosures.
In February 2016, the FASB issued ASU No. 2016-02, "Leases." This update requires reporting entities to separate the lease components from the non-lease components in a contract and recognize lease assets and lease liabilities on the balance sheet for substantially all lease arrangements. ASU No. 2016-02 is effective for us beginning January 1, 2019. We are currently evaluating the requirements of ASU 2016-02 and have not yet determined its impact on our consolidated financial statements.
In March 2016, the FASB issued ASU 2016-09, "Compensation – Stock Compensation Improvements to Employee Share-Based Payment Accounting." This update requires that all excess tax benefits and tax deficiencies (including tax benefits of dividends on share-based payment awards) should be recognized as income tax expense or benefit in the income statement. The tax effects of exercised or vested awards should be treated as discrete items in the reporting period in which they occur. An entity also should recognize excess tax benefits regardless of whether the benefit reduces taxes payable in the current period. Currently, an entity must determine, for each award, whether the difference between the deduction for tax purposes and the compensation cost recognized for financial reporting purposes results in either an excess tax benefit or a tax deficiency. The amendments in this update are effective for us beginning January 1, 2017. Through December 31, 2016, we recognized excess tax benefits in additional paid-in capital, and tax deficiencies have been recognized as an offset to accumulated excess tax benefits. In 2017, we expect a tax deficiency in the first quarter and, under this new standard, we will recognize it as a discrete item in the income statement rather than in additional paid-in capital. We do not anticipate that this update will have a material effect on our consolidated financial statements.
61
In August 2016, the FASB issued ASU 2016-15, "Classification of Certain Cash Receipts and Cash Payments." This update was issued to clarify a diversity in practice in how certain cash receipts and cash payments are presented and classified in the statement of cash flows and addresses eight specific cash flow issues, with the objective of reducing the existing diversity in practice. One of the items addressed affects how we previously treated cash proceeds received from the settlement of corporate-owned life insurance policies. These proceeds are now classified in our statement of cash flows as cash inflows from investing activities.
In October 2016, the FASB issued ASU 2016-16, "Income Taxes (Topic 740) – Intra-Entity Transfers of Assets Other than Inventory." Current U.S. GAAP generally prohibits the recognition of current and deferred income taxes for an intra-entity asset transfer until the asset has been sold to an outside party. The amendments in this update will eliminate the exception for an intra-entity transfer of an asset other than inventory. Two common examples of assets included within the scope of this update are intellectual property and property, plant and equipment. The exception for an intra-entity transfer of inventory will remain in place. The amendments in this update are effective for us beginning January 1, 2018. We do not anticipate that this update will have a material effect on our consolidated financial statements.
In January 2017, the FASB issued ASU 2017-04, "Intangibles—Goodwill and Other (Topic 350) Simplifying the Test for Goodwill Impairment." This update simplifies how an entity is required to test goodwill for impairment by eliminating Step 2 from the goodwill impairment test. Step 2 measures a goodwill impairment loss by comparing the implied fair value of a reporting unit’s goodwill with the carrying amount of that goodwill. Under the amendments in this update, an entity should perform its annual, or interim, goodwill impairment test by comparing the fair value of a reporting unit with its carrying amount. An entity should recognize an impairment charge for the amount by which the carrying amount exceeds the reporting unit’s fair value; however, the loss recognized should not exceed the total amount of goodwill allocated to that reporting unit. Additionally, an entity should consider income tax effects from any tax deductible goodwill on the carrying amount of the reporting unit when measuring the goodwill impairment loss, if applicable. An entity still has the option to perform the qualitative assessment for a reporting unit to determine if the quantitative impairment test is necessary. The amendments in this update are effective for us beginning January 1, 2020. Early adoption is permitted after January 1, 2017, and the update is to be applied on a prospective basis. We do not anticipate that this update will have a material effect on our consolidated financial statements.
62
2. | SELECTED BALANCE SHEET INFORMATION |
The following is information regarding selected balance sheet accounts:
December 31, | |||||||||
(in thousands) | 2016 | 2015 | |||||||
Inventory: | |||||||||
Remotely operated vehicle parts and components | $ | 118,236 | $ | 163,539 | |||||
Other inventory, primarily raw materials | 161,894 | 164,914 | |||||||
Total | $ | 280,130 | $ | 328,453 | |||||
Other Current Assets: | |||||||||
Deferred income taxes | $ | — | $ | 57,337 | |||||
Prepaid expenses | 42,523 | 133,683 | |||||||
Total | $ | 42,523 | $ | 191,020 | |||||
Other Non-Current Assets: | |||||||||
Intangible assets, net | $ | 87,801 | $ | 93,701 | |||||
Angola bonds | 59,130 | — | |||||||
Cash surrender value of life insurance policies | 60,160 | 55,924 | |||||||
Investment in unconsolidated affiliates | 39,826 | 49,144 | |||||||
Deferred income taxes | 12,187 | — | |||||||
Other | 11,807 | 19,671 | |||||||
Total | $ | 270,911 | $ | 218,440 | |||||
Accrued Liabilities: | |||||||||
Payroll and related costs | $ | 141,485 | $ | 161,228 | |||||
Accrued job costs | 59,331 | 79,857 | |||||||
Deferred revenue | 122,223 | 157,042 | |||||||
Income taxes payable | 35,126 | 20,395 | |||||||
Other | 72,606 | 79,157 | |||||||
Total | $ | 430,771 | $ | 497,679 | |||||
Other Long-Term Liabilities: | |||||||||
Deferred income taxes | $ | 236,113 | $ | 353,181 | |||||
Supplemental Executive Retirement Plan | 49,163 | 46,931 | |||||||
Long-Term Incentive Plan | — | 15,650 | |||||||
Accrued post-employment benefit obligations | 4,648 | 7,511 | |||||||
Other | 22,326 | 15,737 | |||||||
Total | $ | 312,250 | $ | 439,010 | |||||
63
3. | INCOME TAXES |
Our provisions for income taxes and our cash taxes paid are as follows:
Year Ended December 31, | ||||||||||||
(in thousands) | 2016 | 2015 | 2014 | |||||||||
Current: | ||||||||||||
Domestic | $ | (6,899 | ) | $ | 11,028 | $ | 17,856 | |||||
Foreign | 25,561 | 65,132 | 106,575 | |||||||||
Total current | 18,662 | 76,160 | 124,431 | |||||||||
Deferred: | ||||||||||||
Domestic | (8,617 | ) | 40,284 | 73,520 | ||||||||
Foreign | 8,715 | (11,194 | ) | (2,803 | ) | |||||||
Total deferred | 98 | 29,090 | 70,717 | |||||||||
Total provision for income taxes | $ | 18,760 | $ | 105,250 | $ | 195,148 | ||||||
Cash taxes paid | $ | 75,819 | $ | 119,591 | $ | 139,724 | ||||||
The components of income before income taxes are as follows:
Year Ended December 31, | ||||||||||||
(in thousands) | 2016 | 2015 | 2014 | |||||||||
Domestic | $ | (180,132 | ) | $ | 51,018 | $ | 110,800 | |||||
Foreign | 223,478 | 285,243 | 512,677 | |||||||||
Income before income taxes | $ | 43,346 | $ | 336,261 | $ | 623,477 | ||||||
As of December 31, 2016 and 2015, our worldwide deferred tax assets, liabilities and net deferred tax liabilities were as follows:
December 31, | ||||||||
(in thousands) | 2016 | 2015 | ||||||
Deferred tax assets: | ||||||||
Deferred compensation | $ | 38,602 | $ | 46,973 | ||||
Deferred income | 9,830 | 18,787 | ||||||
Accrued expenses | 24,663 | 12,624 | ||||||
Other | 60,885 | 55,547 | ||||||
Gross deferred tax assets | 133,980 | 133,931 | ||||||
Valuation allowance | (4,200 | ) | — | |||||
Total deferred tax assets | $ | 129,780 | $ | 133,931 | ||||
Deferred tax liabilities: | ||||||||
Property and equipment | $ | 86,237 | $ | 126,079 | ||||
Unremitted foreign earnings not considered indefinitely reinvested | 257,414 | 296,018 | ||||||
Basis difference in equity investments | 10,055 | 7,678 | ||||||
Other | — | — | ||||||
Total deferred tax liabilities | $ | 353,706 | $ | 429,775 | ||||
Net deferred income tax liability | $ | 223,926 | $ | 295,844 | ||||
64
Our net deferred tax liability is reflected within our balance sheet as follows:
December 31, | ||||||||
(in thousands) | 2016 | 2015 | ||||||
Deferred tax liabilities | $ | 236,113 | $ | 353,181 | ||||
Current deferred tax assets | — | (57,337 | ) | |||||
Long-term deferred tax assets | (12,187 | ) | — | |||||
Net deferred income tax liability | $ | 223,926 | $ | 295,844 | ||||
At December 31, 2016, we had approximately $51 million of foreign tax credits and no U.S. net operating losses available to reduce future payments of U.S. federal income taxes. The tax credits expire commencing in 2024. We assessed the recoverability of our deferred tax assets and believe it is more likely than not that a portion of our loss carryforwards in foreign jurisdictions will not be realized. As a result, we have established a deferred tax asset valuation allowance of $4.2 million.
Reconciliations between the actual provision for income taxes on continuing operations and that computed by applying the United States statutory rate to income before income taxes were as follows:
Year Ended December 31, | |||||||||
2016 | 2015 | 2014 | |||||||
United States statutory rate | 35.0 | % | 35.0 | % | 35.0 | % | |||
Valuation allowance | 9.7 | — | — | ||||||
Foreign tax rate differential | (4.1 | ) | (2.5 | ) | (2.6 | ) | |||
Other items, net | 2.7 | (1.2 | ) | (1.1 | ) | ||||
Total effective tax rate | 43.3 | % | 31.3 | % | 31.3 | % | |||
In 2016, we incurred a recapture of a portion of previously-taken U.S. manufacturing deductions. This increased our effective tax rate by 1.9% and this increase is part of the 2.7% of other items, net in the table above.
We consider $623 million of unremitted earnings of our foreign subsidiaries to be indefinitely reinvested. It is not practical for us to compute the amount of additional U.S. tax that would be due on this amount. We have provided deferred income taxes on the foreign earnings not considered indefinitely reinvested.
We recognize the benefit for a tax position if the benefit is more likely than not to be sustainable upon audit by the applicable taxing authority. If this threshold is met, the tax benefit is then measured and recognized at the largest amount that we believe is greater than 50% likely of being realized upon ultimate settlement.
We account for any applicable interest and penalties on uncertain tax positions as a component of our provision for income taxes on our financial statements. We increased/(decreased) income tax expense by $1.2 million, $(0.9) million and $(0.4) million in 2016, 2015 and 2014, respectively, for penalties and interest on uncertain tax positions, which brought our total liabilities for penalties and interest on uncertain tax positions to $3.2 million and $2.0 million on our balance sheets at December 31, 2016 and 2015, respectively. All additions or reductions to those liabilities would affect our effective income tax rate in the periods of change.
A reconciliation of the beginning and ending amount of gross unrecognized tax benefits, not including associated foreign tax credits and penalties and interest, is as follows:
65
Year Ended December 31, | ||||||||||||
(in thousands) | 2016 | 2015 | 2014 | |||||||||
Beginning of year | $ | 5,245 | $ | 5,575 | $ | 7,168 | ||||||
Additions based on tax positions related to the current year | 1,999 | 260 | 432 | |||||||||
Reductions for expiration of statutes of limitations | (1,028 | ) | (1,649 | ) | (1,572 | ) | ||||||
Additions based on tax positions related to prior years | 114 | 1,059 | 254 | |||||||||
Reductions based on tax positions related to prior years | — | — | (707 | ) | ||||||||
Settlements | — | — | — | |||||||||
Balance at end of year | $ | 6,330 | $ | 5,245 | $ | 5,575 | ||||||
Including associated foreign tax credits and penalties and interest, we have accrued a net total of $6.4 million in the caption "other long-term liabilities" on our balance sheet at December 31, 2016 for unrecognized tax benefits. We do not believe that the total of unrecognized tax benefits will significantly increase or decrease in the next 12 months.
We file a consolidated U.S. federal income tax return for Oceaneering International, Inc. and our domestic subsidiaries. We conduct our international operations in a number of locations that have varying laws and regulations with regard to income and other taxes, some of which are subject to interpretation. Our management believes that adequate provisions have been made for all taxes that will ultimately be payable, although final determination of tax liabilities may differ from our estimates.
Our tax returns are subject to audit by taxing authorities in multiple jurisdictions. These audits often take years to complete and settle. The following lists the earliest tax years open to examination by tax authorities where we have significant operations:
Jurisdiction | Periods | |
United States | 2013 | |
United Kingdom | 2012 | |
Norway | 2006 | |
Angola | 2013 | |
Brazil | 2010 | |
Australia | 2012 | |
4. | SELECTED INCOME STATEMENT INFORMATION |
The following schedule shows our revenue, costs and gross margins by services and products:
Year Ended December 31, | ||||||||||||
(in thousands) | 2016 | 2015 | 2014 | |||||||||
Revenue: | ||||||||||||
Services | $ | 1,509,786 | $ | 2,001,167 | $ | 2,336,304 | ||||||
Products | 761,817 | 1,061,587 | 1,323,320 | |||||||||
Total revenue | 2,271,603 | 3,062,754 | 3,659,624 | |||||||||
Cost of Services and Products: | ||||||||||||
Services | 1,330,218 | 1,585,305 | 1,742,411 | |||||||||
Products | 615,438 | 800,316 | 946,923 | |||||||||
Unallocated expenses | 46,720 | 71,704 | 111,089 | |||||||||
Total cost of services and products | 1,992,376 | 2,457,325 | 2,800,423 | |||||||||
Gross margin: | ||||||||||||
Services | 179,568 | 415,862 | 593,893 | |||||||||
Products | 146,379 | 261,271 | 376,397 | |||||||||
Unallocated expenses | (46,720 | ) | (71,704 | ) | (111,089 | ) | ||||||
Total gross margin | $ | 279,227 | $ | 605,429 | $ | 859,201 | ||||||
66
5.DEBT
Long-term Debt consisted of the following:
December 31, | |||||||||
(in thousands) | 2016 | 2015 | |||||||
4.650% Senior Notes due 2024: | |||||||||
Principal of the notes | $ | 500,000 | $ | 500,000 | |||||
Issuance costs, net of amortization | (5,385 | ) | (6,073 | ) | |||||
Fair value of interest rate swaps on $200 million of principal | (1,557 | ) | 1,909 | ||||||
Term Loan Facility | 300,000 | 300,000 | |||||||
Revolving Credit Facility | — | — | |||||||
Long-term Debt | $ | 793,058 | $ | 795,836 | |||||
In October 2014, we entered into a new credit agreement (as amended, the "Credit Agreement") with a group of banks to replace our prior principal credit agreement. The Credit Agreement provides for a $300 million three-year term loan (the "Term Loan Facility") and a $500 million five-year revolving credit facility (the "Revolving Credit Facility"). Subject to certain conditions, the aggregate commitments under the Revolving Credit Facility may be increased by up to $300 million at any time upon agreement between us and existing or additional lenders. Borrowings under the Revolving Credit Facility and the Term Loan Facility may be used for general corporate purposes. Simultaneously with the execution of the Credit Agreement and pursuant to its terms, we repaid all amounts outstanding under, and terminated, the prior credit agreement.
In November 2015, we entered into an Agreement and Amendment No. 1 to Credit Agreement ("Amendment No. 1"). Amendment No. 1 amended the Credit Agreement to (1) replace the maximum leverage ratio financial covenant with a new financial covenant restricting the maximum total capitalization ratio (defined in Amendment No. 1 to be the ratio of consolidated debt to total capitalization) to 55% and (2) extend the maturities of the Term Loan Facility and the Revolving Credit Facility by one year each, which maturity terms have since been superseded by amendment, as described below.
In November 2016, we entered into an Agreement and Amendment No. 2 to Credit Agreement ("Amendment No. 2"). Amendment No. 2 amended the Credit Agreement to, among other things, extend the maturities of the Term Loan Facility and the Revolving Credit Facility to October 25, 2019 and October 25, 2021, respectively, with the extending Lenders, which represent 90% of the existing commitments of the Lenders, such that (a) the total commitments for the Revolving Credit Facility will be $500 million until October 25, 2020 and thereafter $450 million until October 25, 2021, and (b) the outstanding term loan advances pursuant to the Term Loan Facility will be $300 million until October 27, 2018 and thereafter $270 million until October 25, 2019.
Borrowings under the Credit Agreement bear interest at an Adjusted Base Rate or the Eurodollar Rate (both as defined in the Credit Agreement), at our option, plus an applicable margin initially based on our Leverage Ratio (as defined in the Credit Agreement) and, at our election, based on the ratings of our senior unsecured debt by designated ratings services, thereafter to be based on such debt ratings. The applicable margin varies: (1) in the case of advances bearing interest at the Adjusted Base Rate, from 0.125% to 0.750% for borrowings under the Revolving Credit Facility and from 0% to 0.500% for borrowings under the Term Loan Facility; and (2) in the case of advances bearing interest at the Eurodollar Rate, from 1.125% to 1.750% for borrowings under the Revolving Credit Facility and from 1.000% to 1.500% for borrowings under the Term Loan Facility. The Adjusted Base Rate is the highest of (1) the per annum rate established by the administrative agent as its prime rate, (2) the federal funds rate plus 0.50% and (3) the daily one-month LIBOR plus 1%. We pay a commitment fee ranging from 0.125% to 0.300% on the unused portion of the Revolving Credit Facility, depending on our Leverage Ratio. The commitment fees are included as interest expense in our consolidated financial statements.
The Credit Agreement contains various covenants that we believe are customary for agreements of this nature, including, but not limited to, restrictions on our ability and the ability of each of our
67
subsidiaries to incur debt, grant liens, make certain investments, make distributions, merge or consolidate, sell assets, enter into transactions with affiliates and enter into certain restrictive agreements. We are also subject to a maximum Capitalization Ratio of 55%. The Credit Agreement includes customary events of default and associated remedies. As of December 31, 2016, we were in compliance with all the covenants set forth in the Credit Agreement.
In November 2014, we completed the public offering of $500 million aggregate principal amount of 4.650% Senior Notes due 2024 (the "Senior Notes"). We pay interest on the Senior Notes on May 15 and November 15 of each year, beginning on May 15, 2015. The Senior Notes are scheduled to mature on November 15, 2024. We may redeem some or all of the Senior Notes prior to maturity at specified redemption prices. We used the net proceeds from the offering for general corporate purposes, including funding the C&C acquisition, other capital expenditures and repurchases of shares of our common stock.
We incurred $6.9 million of issuance costs related to the Senior Notes and $2.2 million of new loan costs, including costs of the Amendments, related to the Credit Agreement. We are amortizing these costs, which are included on our balance sheet as a reduction of debt for the Senior Notes and as an other non-current asset for the Credit Agreement, to interest expense over ten years for the Senior Notes and over six years for the Revolving Credit Facility and the Term Loan Facility.
We made cash interest payments of $29.2 million, $27.2 million and $3.7 million in 2016, 2015 and 2014, respectively.
6. | COMMITMENTS AND CONTINGENCIES |
Lease Commitments
At December 31, 2016, we occupied several facilities under noncancellable operating leases expiring at various dates through 2035. Future minimum rentals under all of our operating leases, including vessel rentals, are as follows:
(in thousands) | ||||
2017 | $ | 56,448 | ||
2018 | 27,782 | |||
2019 | 22,701 | |||
2020 | 19,380 | |||
2021 | 16,841 | |||
Thereafter | 138,807 | |||
Total Lease Commitments | $ | 281,959 | ||
Rental expense, which includes hire of vessels, specialized equipment and real estate rental, was approximately $205 million, $229 million and $257 million in 2016, 2015 and 2014, respectively.
Insurance
We self-insure for workers' compensation, maritime employer's liability and comprehensive general liability claims to levels we consider financially prudent, and, beyond the self-insurance level of exposure, we carry insurance, which can be by occurrence or in the aggregate. We determine the level of accruals for claims exposure by reviewing our historical experience and current year claim activity. We do not record accruals on a present-value basis. We review larger claims with insurance adjusters and establish specific reserves for known liabilities. We establish an additional reserve for incidents incurred but not reported to us for each year using our estimates and based on prior experience. We believe we have established adequate accruals for uninsured expected liabilities arising from those obligations. However, it is possible that future earnings could be affected by changes in our estimates relating to these matters.
68
Litigation
On June 17, 2014, Peter L. Jacobs, a purported shareholder, filed a derivative complaint against all of the then current members of our board of directors and one of our former directors, as defendants, and our company, as nominal defendant, in the Court of Chancery of the State of Delaware. Through the complaint, the plaintiff is asserting, on behalf of our company, actions for breach of fiduciary duties and unjust enrichment in connection with prior determinations of our board of directors relating to nonexecutive director compensation. The plaintiff is seeking relief including disgorgement of payments made to the defendants, an award of unspecified damages and an award for attorneys’ fees and other costs. We and the defendants filed a motion to dismiss the complaint and a supporting brief on which the Court has not yet ruled. In any event, our company is only a nominal defendant in this litigation, and we do not expect the resolution of this matter to have a material adverse effect on our results of operations, cash flows or financial position.
In the ordinary course of business, we are subject to actions for damages alleging personal injury under the general maritime laws of the United States, including the Jones Act, for alleged negligence. We report actions for personal injury to our insurance carriers and believe that the settlement or disposition of those claims will not have a material adverse effect on our consolidated financial position, results of operations or cash flows.
Various other actions and claims are pending against us, most of which are covered by insurance. Although we cannot predict the ultimate outcome of these matters, we believe that our ultimate liability, if any, that may result from these other actions and claims will not materially affect our results of operations, cash flows or financial position.
Letters of Credit
We had $54 million and $58 million in letters of credit outstanding as of December 31, 2016 and 2015, respectively, as guarantees in force for self-insurance requirements and various bid and performance bonds, which are usually for the duration of the applicable contract.
Financial Instruments and Risk Concentration
In the normal course of business, we manage risks associated with foreign exchange rates and interest rates through a variety of strategies, including the use of hedging transactions. As a matter of policy, we do not use derivative instruments unless there is an underlying exposure.
Other financial instruments that potentially subject us to concentrations of credit risk are principally cash and cash equivalents and accounts receivable. The carrying value of cash and cash equivalents approximates its fair value due to the short maturity of the underlying instruments. Accounts receivable are generated from a broad group of customers, primarily from within the energy industry, which is our major source of revenue. Due to their short-term nature, carrying values of our accounts receivable and accounts payable approximate fair market value. The carrying values of borrowings under the Credit Agreement approximate their fair values, because the short-term durations of the associated interest rate periods result in the applicable interest rates reflecting market changes to interest rates. Our borrowings under the Credit Agreement are classified as Level 2 in the fair value hierarchy under U.S. GAAP (inputs other than quoted prices in active markets for similar assets and liabilities that are observable or can be corroborated by observable market data for substantially the full term for the assets or liabilities).
Since the second quarter of 2015, the exchange rate for the Angolan kwanza relative to the U.S. dollar has been declining. As our functional currency in Angola is the U.S. dollar, we recorded foreign currency transaction gains (losses) related to the kwanza of $(7.3) million, $(17.4) million and $0.4 million in 2016, 2015 and 2014, as a component of Other income (expense), net in our Consolidated Statements of Income for those respective periods. Our foreign currency transaction losses related primarily to the remeasurement of our Angolan kwanza cash balances to U.S. dollars. Conversion of cash balances from kwanza to U.S. dollars is controlled by the central bank in Angola, and the central bank has slowed this process since mid-2015, causing our kwanza cash balances to increase.
69
As of December 31, 2016, we had the equivalent of approximately $32.0 million of cash in kwanza in Angola reflected on our balance sheet. To mitigate our currency exposure risk in Angola, we have used kwanza to purchase $59.1 million equivalent Angolan central bank (Banco Nacional de Angola) bonds with various maturities throughout 2018. The bonds are denominated as U.S. dollar equivalents, so that, upon payment of semi-annual interest and principal upon maturity, payment is made in kwanza, equivalent to the respective U.S. dollars at the then-current exchange rate. We have classified these instruments as held-to-maturity, and have recorded the original cost on our balance sheet as other non-current assets. We estimated the fair market value of the Angolan bonds to be $57.5 million at December 31, 2016 using quoted prices. Since the market for the Angolan bonds is not an active market, the fair value of the Angolan bonds is classified within Level 2 in the fair value hierarchy under U.S. GAAP.
We estimated the fair market value of the Senior Notes to be $495 million at December 31, 2016 based on quoted prices. Since the market for the Senior Notes is not an active market, the fair value of the Senior Notes is classified within Level 2 in the fair value hierarchy under U.S. GAAP.
We have two interest rate swaps in place on a total of $200 million of the Senior Notes to November 2024. The agreements swap the fixed interest rate of 4.650% on $200 million of the Senior Notes to the floating rate of one month LIBOR plus 2.426% on $100 million and one month LIBOR plus 2.823% on the other $100 million. We estimate the fair value of the interest rate swaps to be a net liability of $1.6 million at December 31, 2016, with $2.2 million included on our balance sheet in our other long-term liabilities, and $0.6 million included in non-current assets. These values were arrived at using a discounted cash flow model using Level 2 inputs.
7. | OPERATIONS BY BUSINESS SEGMENT AND GEOGRAPHIC AREA |
Business Segment Information
We are a global oilfield provider of engineered services and products, primarily to the offshore oil and gas industry, with a focus on deepwater applications. Through the use of our applied technology expertise, we also serve the defense, aerospace and commercial theme park industries. Our Oilfield business consists of Remotely Operated Vehicles ("ROVs"), Subsea Products, Subsea Projects and Asset Integrity. Our ROV segment provides submersible vehicles operated from the surface to support offshore oil and gas exploration, development and production activities. Our Subsea Products segment supplies a variety of specialty subsea hardware and related services. Our Subsea Projects segment provides multiservice subsea support vessels and oilfield diving and support vessel operations, primarily for inspection, maintenance and repair and installation activities. Since April 2015, we have also provided survey, autonomous underwater vehicle ("AUV") and satellite-positioning services. Our Asset Integrity segment provides asset integrity management and assessment services and nondestructive testing and inspection. Our Advanced Technologies business provides project management, engineering services and equipment for applications in non-oilfield markets. Unallocated Expenses are those not associated with a specific business segment. These consist of expenses related to our incentive and deferred compensation plans, including restricted stock and bonuses, as well as other general expenses, including corporate administrative expenses.
There are no differences in the basis of segmentation or in the basis of measurement of segment profit or loss in the year ended December 31, 2016 from those used in our consolidated financial statements for the years ended December 31, 2015 and 2014.
70
The table that follows presents Revenue, Income from Operations, Depreciation and Amortization Expense and Equity Earnings of Unconsolidated Affiliates by business segment:
Year Ended December 31, | ||||||||||||
(in thousands) | 2016 | 2015 | 2014 | |||||||||
Revenue | ||||||||||||
Oilfield | ||||||||||||
Remotely Operated Vehicles | $ | 522,121 | $ | 807,723 | $ | 1,069,022 | ||||||
Subsea Products | 692,030 | 959,714 | 1,238,746 | |||||||||
Subsea Projects | 472,979 | 604,484 | 588,572 | |||||||||
Asset Integrity | 275,397 | 372,957 | 500,237 | |||||||||
Total Oilfield | 1,962,527 | 2,744,878 | 3,396,577 | |||||||||
Advanced Technologies | 309,076 | 317,876 | 263,047 | |||||||||
Total | $ | 2,271,603 | $ | 3,062,754 | $ | 3,659,624 | ||||||
Income from Operations | ||||||||||||
Oilfield | ||||||||||||
Remotely Operated Vehicles | $ | 25,193 | $ | 192,514 | $ | 320,550 | ||||||
Subsea Products | 75,938 | 175,585 | 281,239 | |||||||||
Subsea Projects | 34,476 | 92,034 | 107,852 | |||||||||
Asset Integrity | 7,551 | 18,235 | 55,469 | |||||||||
Total Oilfield | 143,158 | 478,368 | 765,110 | |||||||||
Advanced Technologies | 11,809 | 9,689 | 13,230 | |||||||||
Unallocated Expenses | (84,203 | ) | (114,247 | ) | (150,010 | ) | ||||||
Total | $ | 70,764 | $ | 373,810 | $ | 628,330 | ||||||
Depreciation and Amortization Expense | ||||||||||||
Oilfield | ||||||||||||
Remotely Operated Vehicles | $ | 140,967 | $ | 143,364 | $ | 145,691 | ||||||
Subsea Products | 53,759 | 49,792 | 46,085 | |||||||||
Subsea Projects | 34,042 | 29,863 | 18,561 | |||||||||
Asset Integrity | 14,336 | 10,713 | 12,775 | |||||||||
Total Oilfield | 243,104 | 233,732 | 223,112 | |||||||||
Advanced Technologies | 3,120 | 2,549 | 2,574 | |||||||||
Unallocated Expenses | 4,023 | 4,954 | 4,093 | |||||||||
Total | $ | 250,247 | $ | 241,235 | $ | 229,779 | ||||||
We determine income from operations for each business segment before interest income or expense, other income (expense) and provision for income taxes. We do not consider an allocation of these items to be practical.
During 2016, we recognized restructuring expenses of $11.6 million, attributable to each reporting segment as follows:
• | Remotely Operated Vehicles - $3.8 million; |
• | Subsea Products - $3.7 million; |
• | Subsea Projects - $2.1 million; |
• | Asset Integrity - $1.4 million; |
• | Advanced Technologies - $0.5 million; and |
• | Unallocated Expenses - $0.1 million. |
The restructuring expenses were all severance costs, of which $8.4 million was unpaid at December 31, 2016.
71
During 2015, we recognized restructuring expenses of $25.4 million, attributable to each reporting segment as follows:
• | Remotely Operated Vehicles - $7.2 million; |
• | Subsea Products - $8.7 million; |
• | Subsea Projects - $2.5 million; |
• | Asset Integrity - $6.4 million; |
• | Advanced Technologies - $0.2 million; and |
• | Unallocated Expenses - $0.4 million. |
The restructuring expenses consisted substantially of severance costs that totaled $23.1 million during the year, of which $7.0 million was unpaid at December 31, 2015 and paid in 2016.
During each of 2016, 2015 and 2014, revenue from one customer, BP plc and subsidiaries, accounted for 18% of our total consolidated annual revenue.
The following table presents Assets, Property and Equipment and Goodwill by business segment as of the dates indicated:
December 31, | ||||||||
(in thousands) | 2016 | 2015 | ||||||
Assets | ||||||||
Oilfield | ||||||||
Remotely Operated Vehicles | $ | 755,894 | $ | 951,001 | ||||
Subsea Products | 833,919 | 890,041 | ||||||
Subsea Projects | 608,411 | 671,019 | ||||||
Asset Integrity | 261,410 | 295,955 | ||||||
Total Oilfield | 2,459,634 | 2,808,016 | ||||||
Advanced Technologies | 101,756 | 97,764 | ||||||
Corporate and Other | 568,925 | 523,756 | ||||||
Total | $ | 3,130,315 | $ | 3,429,536 | ||||
Property and Equipment, net | ||||||||
Oilfield | ||||||||
Remotely Operated Vehicles | $ | 485,063 | $ | 580,315 | ||||
Subsea Products | 344,973 | 348,042 | ||||||
Subsea Projects | 273,384 | 277,695 | ||||||
Asset Integrity | 24,571 | 35,359 | ||||||
Total Oilfield | 1,127,991 | 1,241,411 | ||||||
Advanced Technologies | 12,057 | 12,614 | ||||||
Corporate and Other | 13,210 | 12,706 | ||||||
Total | $ | 1,153,258 | $ | 1,266,731 | ||||
Goodwill | ||||||||
Oilfield | ||||||||
Remotely Operated Vehicles | $ | 24,406 | $ | 24,344 | ||||
Subsea Products | 99,336 | 88,279 | ||||||
Subsea Projects | 154,823 | 149,389 | ||||||
Asset Integrity | 143,144 | 143,018 | ||||||
Total Oilfield | 421,709 | 405,030 | ||||||
Advanced Technologies | 21,842 | 21,842 | ||||||
Total | $ | 443,551 | $ | 426,872 | ||||
All assets specifically identified with a particular business segment have been segregated. Cash and cash equivalents, certain other current assets, certain investments and certain other assets have not been allocated to particular business segments and are included in Corporate and Other.
72
The following table presents Capital Expenditures, including business acquisitions, by business segment for the periods indicated:
Year Ended December 31, | ||||||||||||
(in thousands) | 2016 | 2015 | 2014 | |||||||||
Capital Expenditures | ||||||||||||
Oilfield | ||||||||||||
Remotely Operated Vehicles | $ | 50,339 | $ | 57,558 | $ | 188,848 | ||||||
Subsea Products | 56,669 | 69,434 | 112,851 | |||||||||
Subsea Projects | 25,602 | 276,308 | 91,918 | |||||||||
Asset Integrity | 3,910 | 9,841 | 27,027 | |||||||||
Total Oilfield | 136,520 | 413,141 | 420,644 | |||||||||
Advanced Technologies | 2,742 | 5,015 | 2,352 | |||||||||
Corporate and Other | 3,251 | 5,832 | 3,675 | |||||||||
Total | $ | 142,513 | $ | 423,988 | $ | 426,671 | ||||||
Geographic Operating Areas
The following table summarizes certain financial data by geographic area:
Year Ended December 31, | ||||||||||||
(in thousands) | 2016 | 2015 | 2014 | |||||||||
Revenue | ||||||||||||
Foreign: | ||||||||||||
Africa | $ | 486,615 | $ | 659,038 | $ | 795,229 | ||||||
United Kingdom | 304,635 | 367,326 | 456,804 | |||||||||
Norway | 166,180 | 250,272 | 488,789 | |||||||||
Asia and Australia | 196,679 | 245,978 | 317,277 | |||||||||
Brazil | 73,280 | 118,056 | 185,299 | |||||||||
Other | 66,870 | 116,647 | 98,881 | |||||||||
Total Foreign | 1,294,259 | 1,757,317 | 2,342,279 | |||||||||
United States | 977,344 | 1,305,437 | 1,317,345 | |||||||||
Total | $ | 2,271,603 | $ | 3,062,754 | $ | 3,659,624 | ||||||
Long-Lived Assets | ||||||||||||
Foreign: | ||||||||||||
Norway | $ | 277,949 | $ | 274,868 | $ | 332,503 | ||||||
Africa | 234,921 | 205,440 | 215,122 | |||||||||
United Kingdom | 102,140 | 138,327 | 113,191 | |||||||||
Asia and Australia | 66,279 | 71,438 | 90,061 | |||||||||
Brazil | 61,418 | 57,896 | 99,269 | |||||||||
Other | 44,166 | 43,128 | 56,079 | |||||||||
Total Foreign | 786,873 | 791,097 | 906,225 | |||||||||
United States | 1,027,428 | 1,070,841 | 838,273 | |||||||||
Total | $ | 1,814,301 | $ | 1,861,938 | $ | 1,744,498 | ||||||
Revenue is based on location where services are performed and products are manufactured.
73
8. | EMPLOYEE BENEFIT PLANS |
Retirement Investment Plans
We have several employee retirement investment plans that, taken together, cover most of our full-time employees. The Oceaneering Retirement Investment Plan is a 401(k) plan in which U.S. employees may participate by deferring a portion of their gross monthly salary and directing us to contribute the deferred amount to the plan. We match a portion of the employees' deferred compensation. Our contributions to the 401(k) plan were $20.0 million, $22.8 million and $21.3 million for the plan years ended December 31, 2016, 2015 and 2014, respectively.
We also make matching contributions to foreign employee savings plans similar in nature to a 401(k) plan. In 2016, 2015 and 2014, these contributions, principally related to plans associated with U.K. and Norwegian subsidiaries, were $12.1 million, $15.1 million and $18.7 million, respectively.
The Oceaneering International, Inc. Supplemental Executive Retirement Plan covers selected key management employees and executives, as approved by the Compensation Committee of our Board of Directors (the "Compensation Committee"). Under this plan, we accrue an amount determined as a percentage of the participant's gross monthly salary and the amounts accrued are treated as if they are invested in one or more investment vehicles pursuant to this plan. Expenses related to this plan during 2016, 2015 and 2014 were $3.3 million, $3.3 million and $3.3 million, respectively.
We have defined benefit plans covering some of our employees in the U.K. and Norway. At December 31, 2015, there were no further benefits accruing under the U.K. plan, and the Norway plan was closed to new participants. During 2016, we agreed to settlements with almost all the participants in the Norway plan. Our curtailment costs for the Norway plan in 2016 were $1.1 million and are included in other income (expense), net. The projected benefit obligations for the plans were $18 million (U.K. only in 2016) and $28 million, at December 31, 2016 and 2015, respectively, and the fair values of the plan assets (using Level 2 inputs) for both plans were $19 million (U.K. only in 2016) and $26 million at December 31, 2016 and 2015, respectively.
Incentive Plan
Under our Amended and Restated 2010 Incentive Plan (the "Incentive Plan"), shares of our common stock are made available for awards to employees and nonemployee members of our Board of Directors.
The Incentive Plan is administered by the Compensation Committee; however, the full Board of Directors makes determinations regarding awards to nonemployee directors under the Incentive Plan. The Compensation Committee or our Board of Directors, as applicable, determines the type(s) of award(s) to be made to each participant and sets forth in the related award agreement the terms, conditions and limitations applicable to each award. Stock options, stock appreciation rights and stock and cash awards may be made under the Incentive Plan. There has been no stock option activity after December 31, 2010 and there are no options outstanding under the Incentive Plan. We have not granted any stock options since 2005 and the Compensation Committee has expressed its intention to refrain from using stock options as a component of employee compensation for our executive officers and other employees for the foreseeable future. Additionally, the Board of Directors has expressed its intention to refrain from using stock options as a component of nonemployee director compensation for the foreseeable future.
74
In 2016, 2015 and 2014, the Compensation Committee granted awards of performance units to certain of our key executives and employees and, in 2014, our Board of Directors granted performance units under a prior incentive plan to our Chairman of the Board of Directors (our "Chairman"). The performance units awarded are scheduled to vest in full on the third anniversary of the award date, or pro rata over three years if the participant meets certain age and years of service requirements. The Compensation Committee and the Board of Directors have approved specific financial goals and measures (as defined in the Performance Award Goals and Measures), based on our cumulative cash flow from operations and a comparison of return on invested capital and cost of capital for each of the three-year periods ending December 31, 2018, 2017 and 2016 to be used as the basis for the final value of the performance units. The final value of each performance unit granted in 2016, 2015 and 2014 may range from $0 to $150. Upon vesting and determination of value, the value of the performance units will be payable in cash. Compensation expense (benefit) related to the performance units was $(4.2) million, $6.8 million and $22.8 million in 2016, 2015 and 2014, respectively. As of December 31, 2016, there were 437,223 performance units outstanding.
During 2016, 2015 and 2014, the Compensation Committee granted restricted units of our common stock to certain of our key executives and employees. During 2016, our Board of Directors granted restricted common stock to our nonemployee directors. During 2015 and 2014, our Board of Directors granted restricted units of our common stock to our Chairman and restricted common stock to our other nonemployee directors. Over 65%, 65%, and 60% of the grants made to our employees in 2016, 2015 and 2014, respectively, vest in full on the third anniversary of the award date, conditional upon continued employment. The remainder of the grants made to employees and all the grants of restricted stock units made to our Chairman vest pro rata over three years, as these participants meet certain age and years-of-service requirements. For the grants of restricted stock units to each of the participant employees and the Chairman, the participant will be issued a share of our common stock for the participant's vested restricted stock units at the earlier of three years or, if the participant vested earlier after meeting the age and service requirements, following termination of employment or service. The grants of restricted stock to our nonemployee directors were scheduled to vest in full on the first anniversary of the award date conditional upon continued service as a director, with one exception. In February 2015, we granted shares of restricted common stock to a director who had given written notice of his intention to retire from our board of directors. Those shares were to vest if the director's service continued until the election of directors at our subsequent annual meeting of shareholders in May 2015. The director fulfilled that requirement by resigning concurrent with that election and the shares of restricted stock became vested.
In April 2009, the Compensation Committee adopted a policy that Oceaneering will not provide U.S. federal income tax gross-up payments to any of its directors or executive officers in connection with future awards of restricted stock or stock units. This policy had no effect on the existing change-in-control agreement with one of our executive officers or the existing service agreement with our Chairman, which provide for tax gross-up payments that could become applicable to such future awards in limited circumstances, such as following a change in control of Oceaneering. Since August 2010, there have been no outstanding awards that provide for tax gross-up payments.
The tax benefit (additional charge) realized from tax deductions in excess of (less than) the financial statement expense of our restricted stock grants was $(3.0) million, $(0.9) million and $3.1 million in 2016, 2015 and 2014, respectively.
75
The following is a summary of our restricted stock and restricted stock unit activity for 2016, 2015 and 2014:
Number | Weighted Average Fair Value | Aggregate Intrinsic Value | ||||||||
Balance at December 31, 2013 | 960,290 | $ | 52.53 | |||||||
Granted | 299,274 | 70.63 | ||||||||
Issued | (411,800 | ) | 43.57 | $ | 29,043,000 | |||||
Forfeited | (33,364 | ) | 62.66 | |||||||
Balance at December 31, 2014 | 814,400 | 63.30 | ||||||||
Granted | 380,991 | 52.40 | ||||||||
Issued | (311,119 | ) | 57.94 | $ | 16,518,000 | |||||
Forfeited | (52,981 | ) | 60.45 | |||||||
Balance at December 31, 2015 | 831,291 | 60.49 | ||||||||
Granted | 587,953 | 27.90 | ||||||||
Issued | (278,572 | ) | 61.48 | $ | 7,866,000 | |||||
Forfeited | (88,665 | ) | 43.03 | |||||||
Balance at December 31, 2016 | 1,052,007 | $ | 43.48 | |||||||
The restricted stock units granted in 2016, 2015 and 2014 carry no voting rights and no dividend rights. Each grantee of shares of restricted common stock is deemed to be the record owner of those shares during the restriction period, with the right to vote and receive any dividends on those shares.
Grants of restricted stock units are valued at their estimated fair values as of their respective grant dates. The grants in 2016, 2015 and 2014 were subject only to vesting conditioned on continued employment or service as a nonemployee director; therefore, these grants were valued at the grant date fair market value using the closing price of our stock on the New York Stock Exchange.
Compensation expense under the restricted stock plans was $13.9 million, $15.9 million and $17.2 million for 2016, 2015 and 2014, respectively. As of December 31, 2016, we had $13.3 million of future expense to be recognized related to our restricted stock unit plans over a weighted average remaining life of 1.7 years.
76
Post-Employment Benefit
In 2001, we entered into an agreement with our Chairman who was also then our Chief Executive Officer. That agreement was amended in 2006 and in 2008. Pursuant to the amended agreement, the Chairman relinquished his position as Chief Executive Officer in May 2006 and began his post-employment service period on December 31, 2006, which continued through August 15, 2011, during which service period the Chairman, acting as an independent contractor, agreed to serve as nonexecutive Chairman of our Board of Directors. The agreement provides the Chairman with post-employment benefits for ten years following August 15, 2011. The agreement also provides for medical coverage on an after-tax basis to the Chairman, his spouse and children for their lives. We recognized the net present value of the post-employment benefits over the expected service period. Our total accrued liabilities, current and long-term, under this post-employment benefit were $4.5 million and $5.1 million at December 31, 2016 and 2015, respectively.
As part of the arrangements relating to the Chairman's post-employment benefits, we established an irrevocable grantor trust, commonly known as a "rabbi trust," to provide the Chairman greater assurance that we will set aside an adequate source of funds to fund payment of the post-retirement benefits under this agreement, including the medical coverage benefits payable to the Chairman, his spouse and their children for their lives. In connection with establishment of the rabbi trust, we contributed to the trust a life insurance policy on the life of the Chairman, which we had previously obtained, and we agreed to continue to pay the premiums due on that policy. When the life insurance policy matures, the proceeds of the policy will become assets of the trust. If the value of the trust exceeds $4 million, as adjusted by the consumer price index, at any time after January 1, 2012, the excess may be paid to us. However, because the trust is irrevocable, the assets of the trust are generally not available to fund our future operations until the trust terminates, which is not expected to be during the lives of the Chairman, his spouse or their children. Furthermore, no tax deduction will be available for our contributions to the trust; however, we may benefit from future tax deductions for benefits actually paid from the trust (although benefit payments from the trust are not expected to occur in the near term, because we expect to make direct payments of those benefits for the foreseeable future).
77
SELECTED QUARTERLY FINANCIAL DATA (UNAUDITED)
(in thousands, except per share data)
Year Ended December 31, 2016 | ||||||||||||||||||||
Quarter Ended | March 31 | June 30 | Sept. 30 | Dec. 31 | Total | |||||||||||||||
Revenue | $ | 608,344 | $ | 625,539 | $ | 549,275 | $ | 488,445 | $ | 2,271,603 | ||||||||||
Gross margin | 97,480 | 95,233 | 35,443 | 51,071 | 279,227 | |||||||||||||||
Income from operations | 48,099 | 38,380 | (11,856 | ) | (3,859 | ) | 70,764 | |||||||||||||
Net income | 25,103 | 22,309 | (11,798 | ) | (11,028 | ) | 24,586 | |||||||||||||
Diluted earnings per share | $ | 0.26 | $ | 0.23 | $ | (0.12 | ) | $ | (0.11 | ) | $ | 0.25 | ||||||||
Weighted average number of diluted shares outstanding | 98,286 | 98,424 | 98,061 | 98,064 | 98,424 | |||||||||||||||
Year Ended December 31, 2015 | ||||||||||||||||||||
Quarter Ended | March 31 | June 30 | Sept. 30 | Dec. 31 | Total | |||||||||||||||
Revenue | $ | 786,772 | $ | 810,303 | $ | 743,613 | $ | 722,066 | $ | 3,062,754 | ||||||||||
Gross margin | 163,449 | 167,545 | 168,313 | 106,122 | 605,429 | |||||||||||||||
Income from operations | 106,650 | 107,940 | 113,464 | 45,756 | 373,810 | |||||||||||||||
Net income | 69,499 | 65,468 | 68,539 | 27,505 | 231,011 | |||||||||||||||
Diluted earnings per share | $ | 0.70 | $ | 0.66 | $ | 0.70 | $ | 0.28 | $ | 2.34 | ||||||||||
Weighted average number of diluted shares outstanding | 99,912 | 98,893 | 98,185 | 98,268 | 98,808 | |||||||||||||||
78
Exhibit Index
Registration or File Number | Form of Report | Report Date | Exhibit Number | |||||||||
* | 3.01 | Restated Certificate of Incorporation | 1-10945 | 10-K | Dec. 2000 | 3.01 | ||||||
* | 3.02 | Certificate of Amendment to Restated Certificate of Incorporation | 1-10945 | 8-K | May 2008 | 3.1 | ||||||
* | 3.03 | Certificate of Amendment to Restated Certificate of Incorporation | 1-10945 | 8-K | May 2014 | 3.1 | ||||||
* | 3.04 | Amended and Restated Bylaws | 1-10945 | 8-K | Aug. 2015 | 3.1 | ||||||
* | 4.01 | Specimen of Common Stock Certificate | 1-10945 | 10-K | Mar. 1993 | 4(a) | ||||||
* | 4.02 | Credit Agreement, dated as of October 27, 2014, by and among Oceaneering International, Inc., Wells Fargo Bank, National Association, as administrative agent and swing line lender, and certain lenders party thereto | 1-10945 | 8-K | Oct. 2014 | 4.1 | ||||||
* | 4.03 | Agreement and Amendment No. 1 to Credit Agreement | 1-10945 | 8-K | Nov. 2015 | 4.1 | ||||||
* | 4.04 | Agreement and Amendment No. 2 to Credit Agreement | 1-10945 | 8-K | Nov. 2016 | 4.1 | ||||||
* | 4.05 | Indenture dated, November 21, 2014, between Oceaneering International, Inc. and Wells Fargo Bank, National Association, as Trustee, relating to senior debt securities of Oceaneering International, Inc. | 1-10945 | 8-K | Nov. 2014 | 4.1 | ||||||
* | 4.06 | First Supplemental Indenture, dated November 21, 2014, between Oceaneering International, Inc. and Wells Fargo Bank, National Association, as Trustee, providing for the issuance of Oceaneering International, Inc.’s 4.650% Senior Notes due 2024 (including Form of Notes). | 1-10945 | 8-K | Nov. 2014 | 4.2 | ||||||
We and certain of our consolidated subsidiaries are parties to debt instruments under which the total amount of securities authorized does not exceed 10% of our total consolidated assets. Pursuant to paragraph 4(iii)(A) of Item 601(b) of Regulation S-K, we agree to furnish a copy of those instruments to the Securities and Exchange Commission on request. | ||||||||||||
10.01 | + | Oceaneering International, Inc. Retirement Investment Plan, with amendments through December 28, 2016 | ||||||||||
* | 10.02 | + | Oceaneering Retirement Investment Plan Trust Agreement effective December 31, 2013 | 1-10945 | 10-K | Dec. 2014 | 10.13 | |||||
* | 10.03 | + | Amended and Restated Service Agreement dated as of December 21, 2006 between Oceaneering and John R. Huff | 1-10945 | 8-K | Dec. 2006 | 10.1 | |||||
* | 10.04 | + | Modification to Service Agreement dated as of December 21, 2006 between Oceaneering and John R. Huff | 1-10945 | 8-K | Dec. 2008 | 10.9 | |||||
* | 10.05 | + | Trust Agreement dated as of May 12, 2006 between Oceaneering and United Trust Company, National Association | 1-10945 | 8-K | May 2006 | 10.2 | |||||
* | 10.06 | + | First Amendment to Trust Agreement dated as of May 12, 2006 between Oceaneering International, Inc. and Bank of America National Association, as successor trustee | 1-10945 | 8-K | Dec. 2008 | 10.10 | |||||
79
* | 10.07 | + | Oceaneering International, Inc. Supplemental Executive Retirement Plan, as amended and restated effective January 1, 2009 | 1-10945 | 8-K | Dec. 2008 | 10.5 | |||||
* | 10.08 | + | Amended and Restated Oceaneering International, Inc. Supplemental Executive Retirement Plan, as amended and restated effective January 1, 2000 (for Internal Revenue Code Section 409A-grandfathered benefits) | 1-10945 | 8-K | Dec. 2008 | 10.6 | |||||
* | 10.09 | + | Change-of-Control Agreement dated as of November 16, 2001 between Oceaneering and M. Kevin McEvoy | 1-10945 | 10-K | Dec. 2001 | 10.06 | |||||
* | 10.10 | + | Form of First Amendment to Change-of-Control Agreement with M. Kevin McEvoy | 1-10945 | 8-K | Dec. 2008 | 10.7 | |||||
* | 10.11 | + | Form of Change-of-Control Agreement and Annex for Roderick A. Larson | 1-10945 | 8-K | Aug. 2015 | 10.3 | |||||
* | 10.12 | + | Form of Change-of-Control Agreement | 1-10945 | 8-K | May 2011 | 10.5 | |||||
* | 10.13 | + | Form of Indemnification Agreement | 1-10945 | 8-K | May 2011 | 10.4 | |||||
* | 10.14 | + | 2010 Incentive Plan | 333-166612 | S-8 | May 2010 | 4.6 | |||||
* | 10.15 | + | Amended and Restated 2010 Incentive Plan | 1-10945 | DEF 14A | Apr. 2015 | Appendix A | |||||
* | 10.16 | + | Form of 2016 Restricted Stock Unit Agreement | 1-10945 | 8-K | Feb. 2016 | 10.1 | |||||
* | 10.17 | + | Form of 2016 Performance Unit Agreement | 1-10945 | 8-K | Feb. 2016 | 10.2 | |||||
* | 10.18 | + | Form of 2016 Performance Award: Goals and Measures, relating to the form of 2016 Performance Unit Agreement | 1-10945 | 8-K | Feb. 2016 | 10.3 | |||||
* | 10.19 | + | Form of 2016 Nonemployee Director Restricted Stock Agreement | 1-10945 | 8-K | Feb. 2016 | 10.4 | |||||
* | 10.20 | + | 2016 Annual Cash Bonus Award Program Summary | 1-10945 | 8-K | Feb. 2016 | 10.5 | |||||
* | 10.21 | + | Form of 2015 Restricted Stock Unit Agreement | 1-10945 | 8-K | Feb. 2015 | 10.1 | |||||
* | 10.22 | + | Form of 2015 Performance Unit Agreement | 1-10945 | 8-K | Feb. 2015 | 10.2 | |||||
* | 10.23 | + | 2015 Performance Award: Goals and Measures, relating to the form of 2015 Performance Unit Agreement | 1-10945 | 8-K | Feb. 2015 | 10.3 | |||||
* | 10.24 | + | Form of 2015 Nonemployee Director Restricted Stock Agreement for Messrs. Collins, Huff, Hughes, Murphy and Pappas | 1-10945 | 8-K | Feb. 2015 | 10.4 | |||||
* | 10.25 | + | Form of 2015 Nonemployee Director Restricted Stock Agreement for Mr. DesRoche | 1-10945 | 8-K | Feb. 2015 | 10.5 | |||||
* | 10.26 | + | Oceaneering International, Inc. 2015 Annual Bonus Program Award Summary | 1-10945 | 8-K | Feb. 2015 | 10.7 | |||||
* | 10.27 | + | Form of 2014 Employee Restricted Stock Unit Agreement for Executive Officers | 1-10945 | 8-K | Feb. 2014 | 10.1 | |||||
* | 10.28 | + | Form of 2014 Chairman Restricted Stock Unit Agreement for Mr. Huff | 1-10945 | 8-K | Feb. 2014 | 10.3 | |||||
* | 10.29 | + | Form of 2014 Performance Unit Agreement for Executive Officers | 1-10945 | 8-K | Feb. 2014 | 10.2 | |||||
* | 10.30 | + | Form of 2014 Chairman Performance Unit Agreement for Mr. Huff | 1-10945 | 8-K | Feb. 2014 | 10.4 | |||||
80
* | 10.31 | + | 2014 Performance Award: Goals and Measures, relating to the form of 2014 Performance Unit Agreement for its executive officers and 2014 Chairman Performance Unit Agreement | 1-10945 | 8-K | Feb. 2014 | 10.5 | |||||
* | 10.32 | + | Form of 2014 Nonemployee Director Restricted Stock Agreement for Messrs. Collins, DesRoche, Hughes, Murphy and Pappas | 1-10945 | 8-K | Feb. 2014 | 10.6 | |||||
* | 10.33 | + | Oceaneering International, Inc. 2014 Annual Bonus Award Program Summary | 1-10945 | 8-K | Feb. 2015 | 10.6 | |||||
12.01 | Computation of Ratio of Earnings to Fixed Charges | |||||||||||
21.01 | Subsidiaries of Oceaneering | |||||||||||
23.01 | Consent of Independent Registered Public Accounting Firm | |||||||||||
31.01 | Rule 13a – 14(a)/15d – 14(a) certification of principal executive officer | |||||||||||
31.02 | Rule 13a – 14(a)/15d – 14(a) certification of principal financial officer | |||||||||||
32.01 | Section 1350 certification of principal executive officer | |||||||||||
32.02 | Section 1350 certification of principal financial officer | |||||||||||
101.INS | XBRL Instance Document | |||||||||||
101.SCH | XBRL Taxonomy Extension Schema Document | |||||||||||
101.CAL | XBRL Taxonomy Extension Calculation Linkbase Document | |||||||||||
101.DEF | XBRL Taxonomy Extension Definition Linkbase Document | |||||||||||
101.LAB | XBRL Taxonomy Extension Label Linkbase Document | |||||||||||
101.PRE | XBRL Taxonomy Extension Presentation Linkbase Document | |||||||||||
* | Exhibit previously filed with the Securities and Exchange Commission, as indicated, and incorporated herein by reference. | |||||||||||
+ | Management contract or compensatory plan or arrangement. | |||||||||||
81