Attached files
| file | filename |
|---|---|
| EX-32.2 - EX-32.2 - NAVIENT CORP | d293261dex322.htm |
| EX-32.1 - EX-32.1 - NAVIENT CORP | d293261dex321.htm |
| EX-31.2 - EX-31.2 - NAVIENT CORP | d293261dex312.htm |
| EX-31.1 - EX-31.1 - NAVIENT CORP | d293261dex311.htm |
| EX-23.1 - EX-23.1 - NAVIENT CORP | d293261dex231.htm |
| EX-21.1 - EX-21.1 - NAVIENT CORP | d293261dex211.htm |
| EX-12.1 - EX-12.1 - NAVIENT CORP | d293261dex121.htm |
Table of Contents
UNITED STATES
SECURITIES AND EXCHANGE COMMISSION
Washington, D.C. 20549
Form 10-K
(Mark One)
| ☑ | ANNUAL REPORT PURSUANT TO SECTION 13 OR 15(d) OF THE SECURITIES EXCHANGE ACT OF 1934 |
For the fiscal year ended December 31, 2016
or
| ☐ | TRANSITION REPORT PURSUANT TO SECTION 13 or 15(d) OF THE SECURITIES EXCHANGE ACT OF 1934 |
For the transition period from to
Commission file numbers 001-36228
Navient Corporation
(Exact Name of Registrant as Specified in Its Charter)
| Delaware | 46-4054283 | |
| (State or Other Jurisdiction of Incorporation or Organization) |
(I.R.S. Employer Identification No.) | |
| 123 Justison Street, Wilmington, Delaware 19801 | (302) 283-8000 | |
| (Address of Principal Executive Offices) | (Telephone Number) | |
Securities registered pursuant to Section 12(b) of the Act
| Title of Each Class |
Name of Exchange on which Listed | |
| Common stock, par value $.01 per share | The NASDAQ Global Select Market | |
| Medium Term Notes, Series A, CPI-Linked Notes due 2017 | The NASDAQ Global Select Market | |
| Medium Term Notes, Series A, CPI-Linked Notes due 2018 | The NASDAQ Global Select Market | |
| 6% Senior Notes due December 15, 2043 | The NASDAQ Global Select Market |
Securities registered pursuant to Section 12(g) of the Act:
None.
Indicate by check mark if the registrant is a well-known seasoned issuer, as defined in Rule 405 of the Securities Act. Yes ☑ No ☐
Indicate by check mark if the registrant is not required to file reports pursuant to Section 13 or 15(d) of the Act. Yes ☐ No ☑
Indicate by check mark whether the registrant: (1) has filed all reports required to be filed by Section 13 or 15(d) of the Securities Exchange Act of 1934 during the preceding 12 months (or for such shorter period that the registrant was required to file such reports), and (2) has been subject to such filing requirements for the past 90 days. Yes ☑ No ☐
Indicate by check mark whether the registrant has submitted electronically and posted on its corporate Web site, if any, every Interactive Data File required to be submitted and posted pursuant to Rule 405 of Regulation S-T during the preceding 12 months (or for such shorter period that the registrant was required to submit and post such files). Yes ☑ No ☐
Indicate by check mark if disclosure of delinquent filers pursuant to Item 405 of Regulation S-K is not contained herein, and will not be contained, to the best of registrant’s knowledge, in definitive proxy or information statements incorporated by reference in Part III of this Form 10-K or any amendment to this Form 10-K ☐
Indicate by check mark whether the registrant is a large accelerated filer, an accelerated filer, a non-accelerated filer, or a smaller reporting company. See the definitions of “large accelerated filer,” “accelerated filer” and “smaller reporting company” in Rule 12b-2 of the Exchange Act. (Check one):
| Large accelerated filer ☑ | Accelerated filer ☐ | |||||
| Non-accelerated filer ☐ | Smaller reporting company ☐ | |||||
| (Do not check if a smaller reporting company) | ||||||
Indicate by check mark whether the registrant is a shell company (as defined in Rule 12b-2 of the Exchange Act). Yes ☐ No ☑
The aggregate market value of voting stock held by non-affiliates of the registrant as of June 30, 2016 was $3.8 billion (based on closing sale price of $11.95 per share as reported for the NASDAQ Global Select Market).
As of January 31, 2017, there were 291,008,528 shares of common stock outstanding.
DOCUMENTS INCORPORATED BY REFERENCE
Portions of the proxy statement (the “2017 Proxy Statement”) relating to the Registrant’s 2017 Annual Meeting of Stockholders, currently scheduled to be held on May 25, 2017, are incorporated by reference into Part III of this Annual Report on Form 10-K.
Table of Contents
NAVIENT CORPORATION
Table of Contents
FORWARD-LOOKING AND CAUTIONARY STATEMENTS
This report contains “forward-looking” statements and other information that is based on management’s current expectations as of the date of this report. Statements that are not historical facts, including statements about our beliefs, opinions, or expectations and statements that assume or are dependent upon future events, are forward-looking statements and often contain words such as “expect,” “anticipate,” “intend,” “plan,” “believe,” “seek,” “see,” “will,” “would,” or “target.” Forward-looking statements are subject to risks, uncertainties, assumptions and other factors that may cause actual results to be materially different from those reflected in such forward-looking statements.
For us, these factors include, among others, the risks and uncertainties associated with:
| • | increases in financing costs; |
| • | the availability of financing or limits on liquidity resulting from disruptions in the capital markets or other factors; |
| • | unanticipated increases in costs associated with compliance with federal, state or local laws and regulations; |
| • | changes in the marketplaces in which we compete (including changes in demand or changes resulting from new laws and regulations); |
| • | changes in accounting standards including but not limited to changes pertaining to loan loss reserves and estimates or other accounting standards that may impact our operations; |
| • | adverse outcomes in any significant litigation to which we are a party; |
| • | credit risk associated with our exposure to third parties, including counterparties to hedging or other derivative transactions; and |
| • | changes in the terms of education loans and the educational credit marketplace (including changes resulting from new laws and the implementation of existing laws). |
We could also be affected by, among other things:
| • | unanticipated deferrals in our FFELP securitization trusts that would delay repayment of the bonds beyond their legal final maturity date; |
| • | reductions to our credit ratings, the credit ratings of asset-backed securitizations we sponsor or the credit ratings of the United States of America; |
| • | failures of our operating systems or infrastructure, or those of third-party vendors; |
| • | risks related to cybersecurity including the potential disruption of our systems or potential disclosure of confidential customer information; |
| • | damage to our reputation resulting from cyber-breaches, litigation, the politicization of student loan servicing or other actions or factors; |
| • | failures to successfully implement cost-cutting initiatives and adverse effects of such initiatives on our business; |
| • | delays or errors in converting portfolio acquisitions to our servicing platform; |
| • | changes in law and regulations including but not limited to changes with respect to the student lending or servicing business and financial institutions generally, securitizations or derivatives; |
| • | increased competition from banks and other consumer lenders; |
| • | changes in the general interest rate environment, including the relationship between the relevant money-market index rate and the rate at which our assets are priced; |
1
Table of Contents
| • | our ability to successfully effectuate any acquisitions and other strategic initiatives; |
| • | changes in the demand for asset management and business processing services; |
| • | changes in general economic conditions; and |
| • | the other factors that are described in the “Risk Factors” section of this Annual Report on Form 10-K and in our other reports filed with the Securities and Exchange Commission (“SEC”). |
The preparation of our consolidated financial statements also requires management to make certain estimates and assumptions including estimates and assumptions about future events. These estimates or assumptions may prove to be incorrect and actual results could differ materially. All forward-looking statements contained in this report are qualified by these cautionary statements and are made only as of the date of this report. We do not undertake any obligation to update or revise these forward-looking statements except as required by law.
Definitions for certain capitalized terms used but not otherwise defined in this Annual Report on Form 10-K can be found in the “Glossary” at the end of this report.
Through this discussion and analysis, we intend to provide the reader with some narrative context for how our management views our consolidated financial statements, additional context within which to assess our operating results, and information on the quality and variability of our earnings, liquidity and cash flows.
2
Table of Contents
Our website address is www.navient.com. Our Annual Reports on Form 10-K, Quarterly Reports on Form 10-Q, Current Reports on Form 8-K, and amendments to reports filed pursuant to Sections 13(a) and 15(d) of the Securities Exchange Act of 1934, as amended (the “Exchange Act”), are filed with the Securities and Exchange Commission (the “SEC”). We are subject to the informational requirements of the Exchange Act and file or furnish reports, proxy statements and other information with the SEC. Copies of these reports, as well as any amendments to these reports, are available free of charge through our website at www.navient.com/about/investors/stockholderinfo/secfilings, as soon as reasonably practicable after they are electronically filed with, or furnished to, the SEC. The public may also read and copy any materials filed by the Company with the SEC at the SEC’s Public Reference Room at 100 F Street, NE, Room 1580, Washington, DC 20549. The public may obtain information on the operation of the Public Reference Room by calling the SEC at 1-800-SEC-0330. The SEC maintains an Internet site that contains reports, proxy and information statements and other information regarding issuers that file electronically with the SEC at www.sec.gov.
In addition, copies of our Board Governance Guidelines, Code of Business Conduct (which includes the code of ethics applicable to our Principal Executive Officer, Principal Financial Officer and Principal Accounting Officer) and the governing charters for each committee of our Board of Directors are available free of charge on our website at www.navient.com/about/investors/corp_governance, as well as in print to any stockholder upon request. We intend to disclose any amendments to or waivers from our Code of Business Conduct (to the extent applicable to our Principal Executive Officer or Principal Financial Officer) by posting such information on our website.
Information contained or referenced on the foregoing websites is not incorporated by reference into and does not form a part of this Annual Report on Form 10-K. Further, the Company’s references to the URLs for these websites are intended to be inactive textual references only.
3
Table of Contents
PART I.
| Item 1. | Business |
Overview
Navient is a Fortune 500 company that provides asset management and business processing services to education, health care and government clients at the federal, state, and local levels. We help our clients and millions of Americans achieve financial success through our services and support. Headquartered in Wilmington, Delaware, Navient employs team members in Western New York, Northeastern Pennsylvania, Indiana, Tennessee, Texas, Virginia, and other locations.
Navient holds the largest portfolio of education loans insured or federally guaranteed under the Federal Family Education Loan Program (“FFELP”). We also hold the largest portfolio of Private Education Loans. Navient services its own portfolio of education loans, as well as education loans owned by the United States Department of Education (“ED”), financial institutions and nonprofit education lenders. Navient is one of the largest servicers to ED under its Direct Student Loan Program (“DSLP”). Our data-driven insight, service and innovation support customers on the path to successful education loan repayment.
Navient also provides business processing services to education-related clients, such as guaranty agencies and colleges and universities.
Finally, the company leverages its scale and expertise to provide additional business processing services to a variety of other clients, including federal agencies, state and local governments, regional authorities, courts, hospitals, health care systems and other health care providers, financial service providers, and municipalities.
For all our clients, we aim to improve their financial performance, optimize their operations, and maintain compassionate, compliant service for their customers and constituents.
As of December 31, 2016, Navient’s principal assets consisted of:
| • | $87.7 billion in FFELP Loans, with a net interest margin of 0.85 percent for the year ended December 31, 2016 on a “Core Earnings” basis and a weighted average life of 7.1 years; |
| • | $23.3 billion in Private Education Loans, with a net interest margin of 3.41 percent for the year ended December 31, 2016 on a “Core Earnings” basis and a weighted average life of 6.4 years; |
| • | a leading education loan servicing platform that services loans for more than 12 million DSLP Loan, FFELP Loan and Private Education Loan customers (including cosigners), including 6.2 million customer accounts serviced under Navient’s contract with ED; and |
| • | a leading business processing platform through which we provide services for over 1,000 clients in the education, health care and public sectors. |
Strengths and Opportunities
Navient possesses a number of competitive advantages that distinguish it from its competitors, including:
Large, high quality asset base generating significant and predictable cash flows. At December 31, 2016, Navient’s $111 billion education loan portfolio is 77 percent funded to term and is expected to produce consistent and predictable cash flows over the remaining life of the portfolio. Navient’s $87.7 billion portfolio of FFELP Loans generally bears a maximum 3 percent loss exposure under the terms of the federal guaranty. Navient’s $23.3 billion portfolio of Private Education Loans bears the full credit risk of the borrower and any cosigner. Navient expects that cash flows from its FFELP Loan and Private Education Loan portfolios will significantly exceed future debt service obligations. Our interest earning assets are funded by both secured and unsecured debt. We reduced our unsecured debt outstanding by approximately 9 percent, from $15.1 billion at December 31, 2015 to $13.7 billion as of December 31, 2016.
4
Table of Contents
Efficient and large-scale operating platforms. Navient is the largest servicer of education loans, servicing over $300 billion in education loans for more than 12 million customers. Navient’s inventory of contingent asset recovery receivables is $20.0 billion as of December 31, 2016. We provide services to over 1,000 education, health care and public sector clients. Navient has demonstrated scalable infrastructure with capacity to add volume at a low cost. Our market share and tested infrastructure have enabled expansion to additional clients and asset types.
Superior performance. Navient has demonstrated superior default prevention performance and industry-leading services. The combined portfolio of federal loans serviced by Navient experienced a Cohort Default Rate (“CDR”) that is 31 percent lower than our peers, as calculated from the most recent CDR released by ED in September 2016. We are consistently a top performer in our asset recovery business and deliver superior service to our public and private sector clients. We continually leverage data-driven insights and customer service to identify new ways to add value to our clients.
Commitment to compliance and customer centricity. Navient fosters a robust compliance culture driven by a “customer first” approach. We invest in rigorous training programs, internal and external auditing, escalated service tracking and analysis, and customer research to enhance our compliance and customer service.
Strong capital return. As a result of our significant cash flow and capital generation, Navient expects to return excess capital to stockholders through dividends and share repurchases. In 2016, Navient repurchased 59.6 million shares of common stock (17 percent of common shares outstanding) for $755 million compared with 56.0 million shares of common shares repurchased in 2015 (14 percent of common shares outstanding) for $945 million, fully utilizing our existing share repurchase programs. In December 2016, Navient’s board of directors authorized a new $600 million share repurchase program effective January 1, 2017.
Navient has paid a quarterly dividend of $0.16 per share of common stock since the first quarter of 2015. For the years ended December 31, 2016 and 2015, Navient paid $201 million and $240 million, respectively, in dividends.
Meaningful growth opportunities. In the Asset Management business, Navient will continue pursuing opportunistic acquisitions of FFELP and Private Education Loan portfolios, including refinanced Private Education Loans, and other consumer loans. During the year ended December 31, 2016, Navient acquired $3.7 billion of education loans.
In the Business Processing Services business, Navient will pursue additional growth opportunities, including, among others:
| • | The continued expansion and growth of providing services to state and local governments through our Gila LLC subsidiary (commonly known as Municipal Services Bureau, or MSB). Gila provides receivables management services and account processing solutions for state governments, agencies, court systems, municipalities, toll authorities and financial services entities. Gila expands our customer base in the public sector and leverages our business processing services. |
| • | The continued expansion and growth of providing services to federal agencies. For example, on September 26, 2016, the Internal Revenue Service announced that it plans to begin private collection of certain overdue federal tax debts in the spring of 2017. A Navient subsidiary, Pioneer Credit Recovery, was selected along with three other contractors to implement the new program. |
| • | The continued expansion and growth of providing services to hospitals, health care systems and other health care providers through our Xtend Healthcare subsidiary, a health care revenue cycle management company. Xtend’s services include full revenue cycle outsourcing, accounts receivable management, extended business office support and consulting engagements. Xtend leverages Navient’s asset recovery and business processing capabilities into the health care payments sector. |
| • | The continued expansion and growth of providing services to education related clients. On April 4, 2016, ED published the first part of a two-part request for proposals (“RFP”) related to a new servicing platform |
5
Table of Contents
| for the Direct Student Loan Program. The first part of the RFP focused on screening candidates’ capabilities relative to certain published criteria. In July 2016, Navient was selected as one of three companies eligible to submit responses in the second part of the RFP process. On October 26, 2016, ED published the second part of the RFP for which we submitted our bid on January 9, 2017. |
Navient intends to leverage its large-scale operating platforms, superior and data-driven default prevention and asset recovery performance, operating efficiency and regulatory compliance and risk management infrastructure in growing these businesses and in pursuing other growth opportunities.
Navient’s Approach Helps Education Loan Borrowers Achieve Success
Navient services loans for more than 12 million DSLP Loan, FFELP Loan, and Private Education Loan customers, including 6.2 million customers whose accounts are serviced under Navient’s contract with ED. We help our customers navigate the path to financial success through proactive outreach and innovative, data-driven approaches.
Leveraging four decades of expertise: In our experience, customer success means making steady progress toward repayment and avoiding falling behind on or putting off payments. With customer success and default prevention as our top priorities, we apply data-driven outreach that draws from our more than 40 years of experience. Our strategists employ risk modeling to pinpoint struggling borrowers and deploy resources where needed. By tailoring our approach to each borrower’s unique situation — e.g., recent graduates, students re-entering school, those experiencing hardships or those with student debt but no degree — we help ensure industry-leading outcomes, as evidenced by a default rate that is 31 percent lower than other servicers. Nine times out of 10 when we can reach federal loan customers who have missed payments, we can identify a solution to help them avoid default.
Getting borrowers into the right payment plans: We help customers understand the complex array of federal loan repayment options so they can make informed choices about the plans that are aligned with their financial circumstances and goals. We promote awareness of federal repayment plan options, including Income-Driven Repayment (“IDR), through more than 170 million communications annually, including mail, email, phone calls, videos and text messages. For example, as of December 31, 2016, approximately one in four federal student borrowers and 49 percent of student loan balances serviced by Navient for the government were enrolled in an IDR plan (excluding loan types ineligible for the plans). We also help borrowers understand that options lengthening their repayment term may increase the total cost of their loans, while reminding them that they may pay extra or switch repayment plans at any time.
Leading the industry: Navient is a leader in recommending policy reforms aimed at improving upfront education and simplifying federal loan repayment options — reforms that we believe would make a meaningful difference for millions of Americans with student loans.
In 2009, we pioneered the creation of a loan modification program to help private education loan borrowers needing additional assistance. As of December 31, 2016, $2.6 billion of our Private Education Loans were enrolled in this interest rate reduction program, helping customers through more affordable monthly payments while making progress in repaying their principal loan balance.
We continually make enhancements designed to help our customers, drawing from a variety of inputs including customer surveys, analysis of customer inquiries and complaint data, regulator commentary and website activity. We regularly use customer and employee research panels to gather real-time feedback to inform enhancements underway.
Our Office of the Customer Advocate, established in 1997, offers escalated assistance to customers who request it. We are committed to working with customers and appreciate customer comments, which, combined with our own customer communication channels, help us improve the ways we assist our customers.
6
Table of Contents
We also continue to offer free resources to help customers and the general public build knowledge on personal finance topics, and we make recommendations for reforms to enhance student loan repayment success. We offer Path to Success, a series of interactive financial literacy videos. We also conduct a national research study, Money Under 35, that measures the financial health of Americans ages 22 to 35.
We take seriously our commitment to serve military customers and have developed a best-in-class approach to assist them. Navient was the first student loan servicer to launch a dedicated military benefits customer service team, website (Navient.com/military), and toll-free number. Navient’s military benefits team offers a single point of contact for all calls from service members and their families to help them learn about and access the benefits designed for them, including interest rate benefits, deferment and other options.
Business Segments
We have three primary reportable business segments: FFELP Loans, Private Education Loans and Business Services. A fourth segment — Other — primarily consists of financial results of our holding company, including activities related to repurchases of debt, our corporate liquidity portfolio, unallocated overhead and regulatory-related costs. Each of these business segments are discussed below.
FFELP Loans Segment
In the FFELP Loans segment, we acquire and finance FFELP Loans. Although FFELP Loans are no longer originated, we continue to pursue acquisitions of FFELP Loan portfolios. These acquisitions leverage our servicing scale and generate incremental earnings and cash flow. In this segment, we generate revenue primarily through net interest income on the FFELP Loan portfolio (after provision for loan losses). This segment is expected to generate significant amounts of earnings and cash flow as the portfolio amortizes.
We are currently the largest holder of FFELP Loans. Navient’s portfolio of FFELP Loans as of December 31, 2016 was $87.7 billion and we anticipate that this FFELP Loan portfolio will have an amortization period in excess of 20 years and a 7-year remaining weighted average life. Navient’s goal is to maximize and optimize the timing of the cash flows generated by its FFELP Loan portfolio. Navient also seeks to acquire FFELP Loan portfolios from third parties to add net interest income and servicing revenue. During the year ended December 31, 2016, Navient acquired $3.5 billion of FFELP Loans. FFELP Loans are insured or guaranteed by state or not-for-profit agencies and are protected by contractual rights to recovery from the United States pursuant to guaranty agreements among ED and these agencies. These guaranty agreements generally cover at least 97 percent of a FFELP Loan’s principal and accrued interest for loans disbursed. For more discussion of the FFELP and related credit support mechanisms, see Appendix A “Description of Federal Family Education Loan Program.”
As a result of the long-term funding strategy used for our FFELP Loan portfolio and the insurance and guarantees provided on these loans, the portfolio generates consistent and predictable cash flows. As of December 31, 2016, approximately 81 percent of the FFELP Loans held by Navient were funded to term with non-recourse, long-term securitization debt.
The Higher Education Act of 1965 (“HEA”) continues to regulate every aspect of FFELP Loans, including ongoing communications with borrowers and default aversion requirements. Failure to service FFELP Loans properly could jeopardize the insurance, guarantees and federal support on these loans. The insurance and guarantees on Navient’s existing FFELP Loans were not affected by the termination of FFELP originations.
Private Education Loans Segment
In this segment, we acquire, finance, and service our Private Education Loans. Private Education Loans primarily bridge the gap between the cost of higher education and the amount funded through financial aid, federal loans. or students’ and families’ resources. They also allow borrowers to refinance existing education
7
Table of Contents
loans at a lower rate. We pursue acquisitions of Private Education Loan portfolios. These acquisitions leverage our servicing scale and generate incremental earnings and cash flow. In this segment, we generate revenue primarily through net interest income on the Private Education Loan portfolio (after provision for loan losses). This segment is expected to generate significant amounts of earnings and cash flow as the portfolio amortizes.
We are currently the largest holder of Private Education Loans. Navient’s portfolio of Private Education Loans as of December 31, 2016 was $23.3 billion and we anticipate that this Private Education Loan portfolio will have an amortization period in excess of 20 years and a 6-year remaining weighted average life. Navient’s goal is to maximize and optimize the timing of the cash flows generated by its Private Education Loan portfolio. As of December 31, 2016, approximately 61 percent of the Private Education Loans held by Navient were funded to term with non-recourse, long-term securitization debt.
Unlike FFELP Loans, the holder of a Private Education Loan bears the full credit risk of the borrower and any cosigner. Navient believes the credit risk of the Private Education Loans it owns is well managed through the rigorous underwriting practices and risk-based pricing applied when the loans were originated, the continued high levels of qualified cosigners, our internal servicing and risk mitigation practices, and our careful use of forbearance and loan modification programs. Navient believes that these elements and practices reduce the risk of payment interruptions and defaults on its Private Education Loan portfolio.
Business Services Segment
Our Business Services segment generates revenue from business processing services related to servicing, asset recovery and other business processing activities. Within this segment, we generate revenue primarily through servicing our FFELP Loan portfolio as well as servicing education loans for Guarantors of FFELP Loans and other institutions, including ED. We provide asset recovery services for loans and receivables on behalf of Guarantors of FFELP Loans and higher education institutions. In addition, we provide asset recovery and other business processing services for federal, state, court, and municipal clients, public authorities, and health care organizations.
We provide business processing services for over 1,000 clients, working with a broad spectrum of services and asset classes. This market is highly fragmented and provides attractive organic growth opportunities. As of December 31, 2016, Navient had an outstanding inventory of asset recovery receivables of approximately $20.0 billion, of which $10.1 billion was attributable to asset classes unrelated to education loans. Non-education related asset recovery revenues increased 77 percent, from $99 million in 2015 to $174 million in 2016.
Federal Education Loan Related Revenues
In 2016, federal education loan (FFELP and ED) related revenues in the Business Services segment accounted for 80 percent of total Business Services segment revenues compared with 87 percent in 2015. Total Business Services segment revenues were $1.01 billion for the year ended December 31, 2016, compared to $1.02 billion for the year ended December 31, 2015.
Navient is currently the largest servicer and collector of loans made under the FFELP program, and the majority of our income has been derived, directly or indirectly, from our portfolio of FFELP Loans and the servicing and asset recovery we have provided for Guarantors and third-party owners of FFELP Loans. In 2010, Congress passed legislation ending the origination of education loans under FFELP. The terms and conditions of existing FFELP Loans were not affected by this legislation. We anticipate that the revenue we earn from providing servicing and asset recovery services on FFELP Loans will decline over time.
| • | Servicing revenues from the FFELP Loans we own represent intercompany charges to the FFELP Loans segment at rates paid to us by the securitization trusts which own the loans. These fees are contractually the first payment priority of the trusts after the payment of the trustee fees and exceed the actual cost of servicing the loans. Intercompany loan servicing revenues declined to $389 million in 2016 from $427 million in 2015. Intercompany loan servicing revenues will continue to decline as our FFELP Loan portfolio amortizes. |
8
Table of Contents
| • | In 2016, we earned account maintenance fees on FFELP Loans serviced for Guarantors of $21 million, down from $33 million in 2015. These fees will continue to decline as the underlying FFELP Loan portfolio serviced for Guarantors amortizes. |
| • | As of December 31, 2016, we provide asset recovery (default aversion, post-default collections and claims processing) to 11 of the 26 Guarantor agencies that serve as intermediaries between the U.S. federal government and FFELP lenders and are responsible for paying the claims made on defaulted loans. In 2016, asset recovery revenue from Guarantor clients totaled $194 million, compared to $209 million the prior year. As FFELP Loans are no longer originated, these revenues will decline over time unless we add additional Guarantor clients. The rate at which these revenues will decrease has also been affected by the Bipartisan Budget Act (the “Budget Act”) enacted on December 26, 2013 and effective on July 1, 2014, which reduced the amount to be paid to Guarantor agencies for assisting customers to rehabilitate their defaulted FFELP Loans under Section 428F of the HEA. This aspect of the Budget Act reduced our revenue by approximately $79 million in 2015 compared to 2014. |
Since 2009 when we were selected through a competitive bidding process, Navient has been one of four TIVAS that provides loan servicing for federal loans owned by ED. This contract has been extended through 2019. Under the terms of the contract extension, the allocation of new borrower volume is determined twice each year based on the relative performance of the servicers on five metrics: borrowers in current repayment status (30 percent), borrowers more than 90 but less than 271 days delinquent (15 percent), borrowers 271 days or more but less than 360 days delinquent (15 percent), a survey of borrowers (35 percent), and a survey of ED personnel (5 percent). Under this servicing contract as of December 31, 2016, we service approximately 6.2 million accounts or $197.0 billion in loans. We earned $151 million of revenue under the contract for the year ended December 31, 2016. We continually strive to help our customers succeed and seek to improve on the performance metrics that determine the allocation of new accounts under the servicing contract with ED.
On April 4, 2016, ED published the first part of a two-part RFP related to a new servicing platform for the Direct Student Loan Program. The first part of the RFP focused on screening candidates’ capabilities relative to certain published criteria. In July 2016, Navient was selected as one of three companies eligible to submit responses in the second part of the RFP process. On October 26, 2016, ED published the second part of the RFP. On January 9, 2017, Navient submitted its bid for ED’s single servicing solution contract. We have been informed that one of the two other bidders filed a bid protest in relation to this RFP on January 5, 2017.
Other Segment
Our Other segment primarily consists of activities of our holding company, including the repurchase of debt, our corporate liquidity portfolio, unallocated overhead and regulatory-related costs. We also include results from certain smaller wind-down operations within this segment.
Employees
At December 31, 2016, we had 6,773 employees. None of our employees are covered by collective bargaining agreements.
Spin-Off of Navient
On April 30, 2014, the spin-off of Navient from SLM Corporation (the “Spin-Off”) was completed and Navient became an independent, publicly traded company focused on asset management and business processing services. The separation was completed through the distribution of 100 percent of the outstanding shares of Navient common stock, on the basis of one share of Navient common stock for each share of SLM Corporation common stock. SLM Corporation continues operation as a separate publicly traded company and includes Sallie Mae Bank.
Due to the relative significance of Navient to SLM Corporation prior to the Spin-Off, for financial reporting purposes, Navient is treated as the “accounting spinnor” and therefore is the “accounting successor” to SLM
9
Table of Contents
Corporation as constituted prior to the Spin-Off, notwithstanding the legal form of the Spin-Off. Since Navient is the accounting successor, the historical financial statements of SLM Corporation prior to the Spin-Off are the historical financial statements of Navient. As a result, the GAAP financial results reported in this Annual Report on Form 10-K include the historical financial results of SLM Corporation prior to the Spin-Off on April 30, 2014 (i.e., such consolidated results include our asset management and business processing services business and the consumer banking business associated with Sallie Mae Bank (“SLM BankCo”)) and reflect the deemed distribution of SLM BankCo to SLM Corporation’s stockholders on April 30, 2014.
The following table shows the condensed balance sheet of SLM BankCo that the financial statements of Navient reflect as a shareholder distribution on April 30, 2014:
| (Dollars in millions) |
April 30, 2014 | |||
| Assets |
||||
| FFELP Loans, net |
$ | 1,380 | ||
| Private Education Loans, net |
7,204 | |||
| Investments |
139 | |||
| Cash and cash equivalents |
2,170 | |||
| Other assets |
883 | |||
|
|
|
|||
| Total assets |
$ | 11,776 | ||
|
|
|
|||
| Liabilities |
||||
| Short-term borrowings |
$ | 6,491 | ||
| Long-term borrowings |
2,750 | |||
| Other liabilities(1) |
825 | |||
|
|
|
|||
| Total liabilities |
10,066 | |||
|
|
|
|||
| Equity |
||||
| Preferred stock |
||||
| Series A |
165 | |||
| Series B |
400 | |||
| Common equity |
1,145 | |||
|
|
|
|||
| Total equity(2) |
1,710 | |||
|
|
|
|||
| Total liabilities and equity |
$ | 11,776 | ||
|
|
|
|||
| (1) | “Other liabilities” include net income tax liabilities of $383 million, which were presented as net income tax assets within “Other assets” on the consolidated financial statements of Navient. |
| (2) | In addition to the $1,710 million of consumer banking business net assets distributed, we also removed $41 million of goodwill from our balance sheet as required under Accounting Standards Codification (“ASC”) 350, “Intangibles – Goodwill and Other,” in connection with the distribution. This goodwill was allocated to the consumer banking business based on relative fair value. This total of $1,751 million is the amount that appears on our consolidated statement of changes in stockholders’ equity in connection with the deemed distribution of the consumer banking business. |
In connection with the Spin-Off, three public exchange-traded senior unsecured notes listed on NASDAQ Stock Market LLC and originally issued by SLM Corporation (and its predecessors in interest) remained obligations of Navient. These notes are referred to as (a) Medium Term Notes, Series A, CPI-Linked Notes due 2017, (NASDAQ: OSM / CUSIP: 63938C 207), (b) Medium Term Notes, Series A, CPI-Linked Notes due 2018 (NASDAQ: ISM / CUSIP: 63938C 306), and (c) 6% Senior Notes due December 15, 2043 (NASDAQ: JSM / CUSIP: 63938C 405). The notes are referred collectively as the “Exchange-traded Notes.” Navient’s status as the successor to the original issuer of these notes has been previously reported. On March 29, 2016, the Company filed Form 8-A with the SEC to reflect the transfer of the Nasdaq listing of the Exchange-traded Notes to the Company in connection with the Spin-Off and the Merger, pursuant to Section 12(b) of the Securities Exchange Act of 1934, as amended. In December of 2016, at the request of Nasdaq, the Company changed the CUSIP numbers on each of the Exchange-traded Notes, which change became effective on January 17, 2017. The new CUSIP numbers for each notes are reflected in the disclosure above.
10
Table of Contents
Supervision and Regulation
The Dodd-Frank Act
The Dodd-Frank Act was adopted to reform and strengthen regulation and supervision of the U.S. financial services industry. The Dodd-Frank Act contains comprehensive provisions that govern the practices and oversight of financial institutions (including large non-bank financial institutions) and other participants in the financial markets. It imposed significant regulations, additional requirements and oversight on almost every aspect of the U.S. financial services industry, including increased capital and liquidity requirements, limits on leverage and enhanced supervisory authority. Some of these provisions apply to Navient and its various businesses and securitization vehicles.
The Consumer Financial Protection Act established the Consumer Financial Protection Bureau (“CFPB”), which has broad authority to write regulations under federal consumer financial protection laws and to directly or indirectly enforce those laws and examine financial institutions for compliance. The CFPB is authorized to impose fines and provide consumer restitution in the event of violations, engage in consumer financial education, track consumer complaints, request data and promote the availability of financial services to underserved consumers and communities. It has authority to prevent unfair, deceptive or abusive practices by issuing regulations that define the same or by using its enforcement authority without first issuing regulations. Since its creation, the CFPB has been active in its supervision, examination and enforcement of financial services companies, most notably bringing enforcement actions, imposing fines and mandating large refunds to customers of several large banking institutions, auto financing companies and debt collection companies. The CFPB has filed a lawsuit against Navient alleging several unfair, deceptive or abusive practices, and other violations of consumer protection statutes.
The Dodd-Frank Act also authorizes state officials to enforce regulations issued by the CFPB and to enforce the Dodd-Frank Act’s general prohibition against unfair, deceptive and abusive practices. The Attorneys General of the State of Illinois and the State of Washington also filed lawsuits against Navient and some of its subsidiaries containing similar alleged violations of consumer protection laws as the CFPB lawsuit.
Regulatory Outlook
In general, the number and scope of regulatory and enforcement actions in 2015 and 2016, as well as the amounts of fines and penalties levied against financial institutions, were significant. The types and numbers of class and stockholder derivative actions arising from allegations of violations of consumer protection and regulatory provisions also continued to increase. A number of prominent themes appear to be emerging from these actions:
| • | The number and configuration of regulators bringing actions often adds to the complexity, cost and unpredictability of timing for resolution of particular regulatory issues. |
| • | The regulatory compliance and risk control structures of financial institutions subject to enforcement actions are frequently cited, regardless of whether past practices have been changed, and enforcement orders have often included detailed demands for increased compliance, audit and board supervision, as well as the use of third-party consultants or monitors to recommend further changes or monitor remediation efforts. |
| • | Issues first identified with respect to one consumer product class or distribution channel are often applied to other product classes or channels. |
Navient is subject to oversight from several regulatory entities. We expect that the regulators overseeing our businesses will continue to be active and that consumer protection regulations, standards, supervision, examination and enforcement practices will continue to evolve in both detail and scope. This evolution has added and may continue to significantly add to Navient’s compliance, servicing and operating costs. We have invested
11
Table of Contents
in compliance through multiple steps including realignment of Navient’s compliance management system to a servicing, collections and business services business model rather than a loan originations business model; dedicated compliance resources for certain topics (such as the Servicemembers Civil Relief Act (“SCRA”); the Telephone Consumer Protection Act (“TCPA”); unfair, deceptive, or abusive acts and practices (“UDAAP”); and third-party vendor management) to focus on regulator and consumer expectations; formation of business support operations to enhance risk, control and compliance functions in each business area; additional regulatory training for front-line employees to ensure obligations are understood and followed during interactions with customers as well as additional regulatory training for our board of directors to enhance their ability to oversee the Company’s risk framework and compliance as it and the regulatory environment changes; expanded oversight of our incentive compensation programs; and expanded oversight and analysis of complaint trends to identify and remediate if necessary, areas of potential consumer harm.
While current operations and compliance processes may or may not satisfy evolving regulatory standards, they cannot provide assurance that past practices or products will not be the focus of examinations, inquiries or lawsuits.
As described in Item 7. “Management’s Discussion and Analysis of Financial Condition and Results of Operations — Risk Management,” Navient has implemented a coordinated, formal enterprise risk management system aimed at reducing business and regulatory risks.
Listed below are some of the most significant recent and pending regulatory changes that have the potential to affect Navient.
Consumer Financial Protection Bureau. The CFPB has oversight of the private education loan industry as well as education loan servicers. The CFPB has been active in the education loan industry and undertook a number of initiatives in recent years relative to the private education loan market and education loan servicing, including:
| • | In February 2013, the CFPB published a notice soliciting information on potential options to offer more affordable repayment options to borrowers having difficulty repaying their private education loans. Based on the more than 28,000 comments received, on May 8, 2013, the CFPB published a report highlighting the ways in which private education loan debt can be a roadblock to financial soundness for consumers. The report analyzes the impact of private education loan burdens on the broader economy, assesses recent actions of policymakers in the education loan market and discusses policy options put forth by the public regarding private education loans. The report proposes a number of considerations for policymakers and market participants, such as refinancing relief and monthly payments more closely correlated with a borrower’s debt-to-income ratio. For a discussion on Navient’s approach to helping its customers, see “— Navient’s Approach to Helping Education Loan Borrowers Achieve Success” above. |
| • | On December 3, 2013, the CFPB issued a final rule defining larger participants of the education loan servicing market. The rule, which became effective on March 1, 2014, allows the CFPB to federally supervise certain nonbank education loan servicers for the first time. Under the final rule, the CFPB has supervisory authority over any nonbank education loan servicer that services more than one million borrower accounts, including accounts for both private and federal education loans. Our education loan servicing subsidiaries are subject to this oversight. The CFPB’s supervision includes gathering reports, conducting examinations for compliance with federal consumer financial laws and taking enforcement actions as appropriate. |
| • | On October 16, 2014, the Student Loan Ombudsman within the CFPB submitted his annual report based on private education loan inquiries and complaints received through the CFPB portal from October 1, 2013 through September 30, 2014. The CFPB does not seek to resolve or substantiate the inquiry or complaint but merely provides a gateway between the consumer and the lender or servicer to attempt to address consumer concerns. The Dodd-Frank Act created the Student Loan Ombudsman within the CFPB to receive and attempt to informally resolve inquiries about private education loans. The Student Loan |
12
Table of Contents
| Ombudsman reports to Congress annually on the trends and issues that he identifies through this process. The report offers analysis, commentary and recommendations to address issues reported by consumers. |
| • | On May 14, 2015, the CFPB issued a Request for Information (“RFI”) about student loan servicing practices. The RFI identified a number of potential systemic problems with student loan servicing, and sought public comment from market participants regarding issues that the CFPB believe were identified through consumer complaints including: (1) delays in payment posting, which can result in increased accrued interest; (2) application of overpayments across all loans, instead of to the loans with the highest interest rates; (3) application of partial payments in a manner that maximizes late fees; (4) failure to correct payment processing or other errors in a timely fashion; (5) lost paperwork submitted to process applications for forbearance or alternative payments plans; and (6) issues related to servicing transfers, including failure to notify borrowers of servicing transfers, interruptions in receiving billing statements and other communications, and imposition of late fees when borrowers send payments to their prior servicers. |
| • | In October 2015, the Student Loan Ombudsman within the CFPB issued its annual report analyzing complaints submitted by consumers with student loans from October 1, 2014 through September 30, 2015. This report highlighted problems experienced by student loan borrowers with older federal student loans made by private lenders. Borrowers continued to submit complaints describing servicing and debt collection practices that create barriers to enroll in alternative repayment plans, including income-driven repayment plans for borrowers with federal loans. The Ombudsman noted that private student loan borrowers report that they encounter servicing problems, including lack of access to timely and accurate information on availability or eligibility criteria to enroll in alternative repayment programs. Additionally, the Ombudsman discussed analysis from a voluntary request sent by the Bureau’s Student Loan Ombudsman to certain market participants, asking for data about loans originated under FFELP and held by private investors. |
| • | In April 2016, the CFPB released a set of prototype disclosures (“Payback Playbook”) in conjunction with an RFI seeking information about how to best provide borrowers with information about their repayment options. The proposal, if implemented, would require servicers to provide personalized repayment options to borrowers. The submissions to this request were intended to assist policymakers and market participants when considering potential options to supplement or revise written communications in such a way to reduce defaults, improve borrower outcomes, and spur innovation. As a result of this RFI, the CFPB released a revised prototype Payback Playbook that was provided to ED in January 2017. This revised proposal would provide borrowers in good standing with personalized information about their current repayment plan and two alternatives. Struggling borrowers would receive information about their current plan and one alternative option that offers the lowest available monthly payment and customized instructions on how to enroll in that option. |
| • | On October 17, 2016, the Student Loan Ombudsman issued his 2016 Annual Report analyzing complaints submitted by consumers from September 1, 2015 through August 31, 2016. This report highlighted debt collection and servicing issues experienced by borrowers who had defaulted in the federal loan program. Borrowers are able to regain good standing (or “rehabilitate”) by making nine payments within a 10-month period. However, the Ombudsman estimates that 1 in 3 of these rehabilitated borrowers will re-default within two years due to problems accessing and obtaining income-driven repayment plans. This report also stated that defaulted borrowers reported complaints about debt collectors setting incorrect monthly payment amounts and failing to apply payments toward the loan rehabilitation process, and both collectors and servicers failing to communicate when a borrower’s loan is transferred out of default, or failing to communicate consistent information. In coordination with the release of this report, the CFPB also sent a voluntary information request to student loan servicers seeking information about how previously-defaulted borrowers perform over time. |
| • | In October 2016, the CFPB also revised the education loan examination procedures, incorporating information it gathered from its three years of supervisory and enforcement work, reflecting its revised supervisory priorities. |
13
Table of Contents
Debt Collection Supervision. Consistent with the authority granted to it under the Dodd-Frank Act, the CFPB also maintains supervisory authority over larger consumer debt collectors. On October 24, 2012, the CFPB issued its Larger Participant rule and examination procedures that allow the agency to federally supervise larger consumer debt collectors. The rule, which became effective January 2, 2013, defines larger participants as third-party debt collectors, debt buyers and collection attorneys with more than $10 million in annual receipts resulting from consumer debt collection. Under the rule, Navient’s collection subsidiaries are considered larger participants and are subject to supervision. In July 2016, the CFPB proposed new rules that would impose drastic changes to the debt collection industry generally. Under the proposals currently under consideration, debt collectors would, among other things, be required to limit communications attempts with borrowers, provide enhanced disclosure of debt details, and make it easier to dispute the debt. When responding to disputes, collectors would be prohibited from continuing to pursue debt without sufficient evidence. These requirements and restrictions would follow the debt if it were sold or transferred. The issuance of the CFPB’s rules does not preempt the various and varied levels of state consumer and collection regulations to which the activities of Navient’s subsidiaries are currently subject. Navient also utilizes third-party debt collectors to collect defaulted and charged-off education loans and will continue to be responsible for oversight of their procedures and controls.
Oversight of Derivatives. The Dodd-Frank Act created a comprehensive new regulatory framework for derivatives transactions, to be implemented by the Commodity Futures Trading Commission (“CFTC”), other prudential regulators and the SEC. This framework, among other things, subjects certain swap participants to new capital and margin requirements, recordkeeping and business conduct standards and imposes registration and regulation of swap dealers and major swap participants. The scope of potential exemptions continues to be defined through agency rulemakings. Even where Navient or a securitization trust sponsored by Navient qualifies for an exemption, many of its derivatives counterparties are subject to the new capital, margin and business conduct requirements and therefore Navient’s business may be impacted. Where Navient or the securitization trusts it sponsors do not qualify for an exemption, Navient or an existing or future securitization trust sponsored by Navient may be unable to enter into new swaps to hedge interest rate or currency risk or the costs associated with such swaps may increase. With respect to existing securitization trusts, an inability to amend, novate or otherwise materially modify existing swap contracts could result in a downgrade of its outstanding asset-backed securities. As a result, Navient’s business, ability to access the capital markets for financing and costs may be impacted by new regulations for derivatives transactions.
Other Significant Sources of Regulation
Many aspects of Navient’s businesses are subject to federal and state regulation and administrative oversight. Some of the most significant of these are described below.
Higher Education Act. Navient is subject to the HEA and its education loan operations are periodically reviewed by ED and Guarantors. As a servicer of federal education loans, Navient is subject to ED regulations regarding financial responsibility and administrative capability that govern all third-party servicers of insured education loans. In connection with its servicing operations on behalf of Guarantor clients, Navient must comply with ED regulations that govern Guarantor activities as well as agreements for reimbursement between ED and our Guarantor clients.
Federal Financial Institutions Examination Council. As a third-party service provider to financial institutions, Navient is also subject to periodic examination by the Federal Financial Institutions Examination Council (“FFIEC”). FFIEC is a formal interagency body of the U.S. government empowered to prescribe uniform principles, standards, and report forms for the federal examination of financial institutions by the Federal Reserve Banks (the “FRB”), the Federal Deposit Insurance Corporation (the “FDIC”), the National Credit Union Administration, the Office of the Comptroller of the Currency and the CFPB and to make recommendations to promote uniformity in the supervision of financial institutions.
14
Table of Contents
Consumer Protection and Privacy. Navient’s business servicing education loans is subject to federal and state consumer protection, privacy and related laws and regulations and is subject to examination by the CFPB. Some of the more significant federal laws and regulations include:
| • | various laws governing unfair, deceptive or abusive acts or practices; |
| • | the Truth-In-Lending Act and Regulation Z issued by the FRB, which governs disclosures of credit terms to consumer borrowers; |
| • | the Fair Credit Reporting Act and Regulation V issued by the CFPB, which governs the use and provision of information to consumer reporting agencies; |
| • | the Equal Credit Opportunity Act and Regulation B issued by the CFPB, which prohibit discrimination on the basis of race, creed or other prohibited factors in extending credit; |
| • | the SCRA, which applies to all debts incurred prior to commencement of active military service (including education loans) and limits the amount of interest, including certain fees or charges that are related to the obligation or liability; and |
| • | the TCPA, which governs communication methods that may be used to contact customers. |
Several states have passed or proposed student loan bills of rights or licensing requirements that may also apply to Navient’s education loan servicing business. It is possible that more states will propose or pass similar or different requirements on either holders of education loans or their servicers. These laws or rules may impose additional or different requirements than Navient faces at the federal level.
Navient’s business processing services businesses are subject to federal and state consumer protection, privacy and related laws and regulations, including supervision by the CFPB of larger consumer debt collectors as discussed above. Some of the more significant federal statutes are the Fair Debt Collection Practices Act and additional provisions of the acts listed above, as well as the HEA and the various laws and regulations that govern government contractors. These activities are also subject to state laws and regulations similar to the federal laws and regulations listed above.
Recent Developments
The Company announced on February 21, 2017, that Christian Lown will join the Company as executive vice president and chief financial officer, effective March 27, 2017. Somsak Chivavibul, the current CFO, will remain as CFO until that date after which he will spearhead the launch of the Company’s new enterprise-wide decision management center, where he will be the Company’s executive vice president and chief decision management officer. The Company filed a Form 8-K announcing these appointments on February 21, 2017.
| Item 1A. | Risk Factors |
Navient employs a Risk Appetite Framework which defines the most significant risks impacting our business and provides a process for evaluating and quantifying such risks. Our Enterprise Risk Committee monitors approved risk limits and thresholds to ensure our businesses are operating within approved risk parameters. Through ongoing monitoring of risk exposures, management endeavors to identify potential risks and develop appropriate responses and mitigation strategies. Our Risk Appetite Framework segments Navient’s risks across nine domains: (1) credit; (2) market; (3) funding and liquidity; (4) compliance; (5) legal; (6) operational; (7) reputational/political; (8) governance; and (9) strategy. The risk factors enumerated in this section are presented in a manner that is consistent with our overall risk framework.
These are not the only risks facing our Company. Additional risks not currently known to us or that we currently deem to be immaterial also may materially adversely affect our business, financial conditions or results of operations in future periods. In addition, our reaction to material future developments as well as our competitors’ and regulators’ reactions to these developments will affect our future results.
15
Table of Contents
In addition to the other information set forth in this report including any forward-looking statements, you should carefully consider the following factors because these factors could cause our business, actual results of operations or financial condition to be materially different from our historic results or from our anticipated results of operations, cash flows or financial condition for future periods.
CREDIT RISK. Credit risk is the risk to earnings or capital resulting from an obligor’s failure to meet the terms of any contract with us or otherwise fail to perform as agreed. Credit risk is found in all activities where success depends on counterparty, issuer or borrower performance.
Economic conditions and the creditworthiness of third parties could have a material adverse effect on Navient’s business, results of operations, financial condition and stock price.
We anticipate that, for a period of time, Navient’s earnings will be largely dependent on the expected future creditworthiness of its education loan customers, especially with respect to its Private Education Loan portfolio. Our research consistently indicates that borrower unemployment rates and the failure of in-school borrowers to graduate or otherwise complete their education are two of the most significant macroeconomic factors that increase loan delinquencies and defaults. Additionally, modifications to the original repayment terms in the form of loan forbearance, deferment, grace periods and the use of payment modification programs, including income-based repayment programs can individually and cumulatively impact the performance of the Company’s FFELP Loan and Private Education Loan portfolios. Modifications to private loans may lower the potential return on investment and may have the related effect of delaying defaults which would otherwise have become apparent in the performance of our portfolios. Therefore, deterioration in the economy could adversely affect the credit quality of our borrowers requiring more frequent use of these loan modification tools. Higher credit-related losses and weaker credit quality could negatively affect Navient’s business, financial condition and results of operations and limit its funding options, including Navient’s access to the capital markets, which could also adversely impact its liquidity position.
Defaults on education loans held by Navient, particularly Private Education Loans, could adversely affect Navient’s earnings.
FFELP Loans are insured or guaranteed by state or not-for-profit agencies and are also protected by contractual rights to recovery from the United States pursuant to guaranty agreements among ED and these agencies. These guarantees generally cover at least 97 percent of a FFELP Loan’s principal and accrued interest and, in limited circumstances, 100 percent of the loan’s principal and accrued interest. Nevertheless, Navient is exposed to credit risk on the non-guaranteed portion of the FFELP Loans in its portfolio. Under certain circumstances, if we fail to service FFELP Loans in compliance with HEA regulations that relate to our ongoing communications with borrowers and default aversion requirements, we may jeopardize the insurance, guarantees and federal support we receive on these loans. A small percentage of our FFELP Loan portfolio has become permanently uninsured as a result of these regulations and we anticipate this will continue to a limited extent in the future. Under such circumstances, Navient bears the full credit exposure on such previously insured loans.
Navient bears the full credit exposure on all its Private Education Loans. Navient believes that delinquencies are an important indicator of the potential future credit performance for Private Education Loans. Navient’s delinquencies as a percentage of Private Education Loans in repayment were 7.4 percent at December 31, 2016. For a complete discussion of Navient’s loan delinquencies, see Item 7. “Management’s Discussion and Analysis of Financial Condition and Results of Operations — Private Education Loan Portfolio Performance.”
The evaluation of Navient’s allowance for loan losses is inherently subjective and it requires estimates that may be subject to significant changes. Future defaults could be higher than anticipated due to a variety of factors outside of Navient’s control, such as downturns in the economy, regulatory or operational changes and other unforeseen future trends. According to Company-sponsored independent research, young adults who stopped attending college before earning a degree or certificate are among those most likely to have trouble making payments. Losses on Private Education Loans are also impacted by various risk characteristics that may be
16
Table of Contents
specific to individual loans. Loan status (in-school, grace, forbearance, repayment and delinquency), loan seasoning (number of months in which a payment has been made by a customer), underwriting criteria (e.g., credit scores), existence of a cosigner are all factors that can impact the likelihood of default. The type of school may also play a significant role in loan performance. Additionally, general economic and employment conditions, including employment rates for recent college graduates can have a significant impact on loan delinquency and default rates. If actual loan performance is worse than currently estimated, it could materially affect Navient’s estimate of the allowance for loan losses and the related provision for loan losses in Navient’s statements of income and as a result adversely affect Navient’s results of operations.
MARKET, FUNDING & LIQUIDITY RISK. Market risk is the risk to earnings or capital resulting from changes in market conditions. Navient is exposed to various types of market risk, in particular the risk of loss resulting in a mismatch between the maturity/duration of assets and liabilities, interest rate risk, foreign currency exchange rates and other risks that arise through the management of our investment, debt and education loan portfolios. Funding and liquidity risk is the risk to earnings, capital or the conduct of our business arising from the inability to meet our obligations when they become due, such as the ability to access the unsecured or asset backed securities credit markets to fund liability maturities or invest in future asset growth and business operations at reasonable market rates.
Navient’s business is affected by the cost and availability of funding in the capital markets.
The capital markets have from time to time experienced periods of significant volatility. This volatility can dramatically and adversely affect financing costs when compared to historical norms or make funding unavailable at any costs. Additional factors that could make financing more expensive or unavailable to Navient include, but are not limited to, financial losses, events that have an adverse impact on Navient’s reputation, changes in the activities of Navient’s business partners, events that have an adverse impact on the financial services industry generally, counterparty availability, negative credit rating actions with respect to Navient, asset-backed securities sponsored by Navient or the U.S. federal government, changes affecting Navient’s assets, the ability of existing or future Navient-sponsored securitization trusts to hedge interest rate and currency risk, corporate and regulatory actions, absolute and comparative interest rate changes, general economic conditions and the legal, regulatory and tax environments governing funding transactions, including existing or future securitization and derivatives transactions. If financing is difficult, expensive or unavailable, Navient’s results of operations, cash flow or financial condition could be materially and adversely affected.
Higher or lower than expected prepayments of loans could change the expected net interest income the Company receives as the holder of the Residual Interests of securitization trusts holding education loans or cause the bonds issued by the securitization trust to be paid at a different speed than originally anticipated. These factors could materially alter our net interest margin or the value of our Residual Interests.
The rate at which borrowers prepay their loans can have a material impact on our net interest margin or the value of our Residual Interests. Prepayment rates and levels are subject to a variety of economic, social, competitive and other factors, including changes in interest rates, availability of alternative financings, regulatory changes affecting the education loan market and the general economy.
FFELP Loans and Private Education Loans may be voluntarily prepaid without penalty by the borrower or consolidated with the borrower’s other education loans through refinancing.
FFELP Loans may also be repaid after default by the Guarantors of FFELP Loans. Conversely, borrowers might not choose to prepay their education loans or the terms of the education loans may be extended as a result of grace periods, deferment periods, income-driven repayment plans or other repayment terms or monthly payment amount modifications agreed to by the servicer, for example. FFELP Loan borrowers may be eligible for various existing income-based repayment programs under which borrowers can qualify for reduced or zero monthly payment or even debt forgiveness after a certain number of years of repayment.
17
Table of Contents
Future initiatives by ED or by Congress to encourage or force consolidation, create additional income-based repayment or debt forgiveness programs or establish other policies and programs that influence the rate at which borrowers repay their loans, could also affect prepayments on education loans. Additionally, several recent entrants into the student loan refinancing market may increase borrower prepayments. These companies specialize in consolidating and refinancing student loans and may have certain advantages including lower cost structures, fewer regulatory constraints and the ability to be highly selective in choosing borrowers who are eligible to refinance. Their ability to selectively market to borrowers with high incomes, high credit scores or other credit determinants may adversely impact the performance of our remaining portfolio.
While we anticipate some variability in prepayment levels, extraordinary or extended increases or decreases in prepayment rates could materially affect our liquidity, interest income, net interest margin and the value of our Residual Interests. Additionally, a prolonged introduction of significant amounts of subsidized funding into the Private Education Loan market at below market interest rates — whether from Federal or private sources —could increase the prepayment rates of our existing Private Education Loans and have a material adverse effect on our business, results of operations and cash flows When, as a result of unanticipated prepayment levels, education loans within a securitization trust amortize faster than originally contracted, the trust’s pool balance may decline at a rate faster than the prepayment rate assumed when the trust’s bonds were originally issued. If the trust’s pool balance declines faster than originally anticipated, in most of our securitization structures, the bonds issued by that trust will also be repaid faster than originally anticipated. In such cases, the Company’s net interest income may decrease and the value of any retained Residual Interest in the trust may similarly decline.
Conversely, when education loans within a securitization trust amortize more slowly than originally contracted, the trust’s pool balance may decline more slowly than the prepayment rate assumed when the trust’s bonds were originally issued and the bonds may be repaid more slowly than originally anticipated. In these cases, the Company’s net interest income increases and the value of any retained Residual Interest in the trust may increase. In addition, if the prepayment rate is especially slow and certain rights of the sellers or the servicer are not exercised or are insufficient or other action is not taken to counter the slower prepayment rate, the trust’s bonds may not be repaid by their legal final maturity date(s), which could result in an event of default under the underlying securitization agreements. Since June 30, 2016, Moody’s and Fitch have taken final ratings action on $52.4 billion and $38.8 billion, respectively, of non-recourse FFELP ABS sponsored by our affiliates due to concerns that trust cash flows may not be sufficient to pay all bonds by the legal final maturity date. As of January 31, 2017, these actions have resulted in downgrades to non-investment grade rating on $4.1 billion and $6.6 billion in FFELP ABS by Moody’s and Fitch, respectively. Subsequent to the initial downgrade action, Fitch has upgraded $0.5 billion of FFELP ABS to investment grade after the Company successfully extended the legal final maturity dates of these bonds. As of January 31, 2017, $11.3 billion of non-recourse FFELP ABS sponsored by our affiliates remains on credit watch by Fitch. Moody’s has completed its ratings actions. For a discussion of the rating agencies actions and the Company’s efforts to mitigate the “legal final maturity” risk, see Item 7. “Management’s Discussion and Analysis of Financial Condition and Results of Operations — Liquidity and Capital Resources — Funding and Liquidity Risk Management.”
Finally, rating agencies may place bonds on watch or change their ratings on (or their ratings methodology for) the bonds issued by a securitization trust, possibly raising or lowering their ratings, based upon these prepayment rates and their perception of the risk posed by those rates to the timing of the trust cash flows. Placing bonds on watch, or changing ratings negatively or proposing or making changes to ratings methodology could: (i) affect our liquidity; (ii) impede our access to the securitization markets; (iii) require changes to our securitization structures; (iv) impact our net interest margins; and/or (v) raise or lower the value of our Residual Interests of our future securitization transactions.
High or increasing interest rate environments may cause Navient’s Floor Income to decline, which may adversely affect its earnings.
FFELP Loans disbursed before April 1, 2006 generally earn interest at the higher of either the borrower rate, which is fixed over a period of time, or a floating rate based on a Special Allowance Payment or SAP formula set
18
Table of Contents
by ED. Navient has generally financed its FFELP Loans with floating rate debt whose interest is matched closely to the floating nature of the applicable SAP formula. Historically, these loans have been indexed to either the Treasury bill, commercial paper or one-month LIBOR rates. If a decline in interest rates causes the borrower rate to exceed the SAP formula rate, Navient will continue to earn interest on the loan at the fixed borrower rate while the floating rate interest on Navient debt will continue to decline. The additional spread earned between the fixed borrower rate and the SAP formula rate is referred to as “Floor Income.”
Depending on the type of FFELP Loan and when it was originated, the borrower rate is either fixed to term or is reset to a market rate on July 1 of each year. For loans where the borrower rate is fixed to term, Navient may earn Floor Income for an extended period of time; for those loans where the borrower interest rate is reset annually on July 1, Navient may earn Floor Income to the next reset date. In accordance with legislation enacted in 2006, holders of FFELP Loans are required to rebate Floor Income to ED for all FFELP Loans disbursed on or after April 1, 2006.
Floor Income can be volatile as rates on the underlying education loans move up and down. Subject to prevailing market conditions, Navient generally hedges this risk by using derivatives in an effort to lock in a portion of our Floor Income over the term of the contract. A rise in interest rates will reduce the amount of Floor Income received on the FFELP Loans not presently hedged with derivatives, which will compress Navient’s net interest margins. Additionally, net interest margins can be negatively impacted by unusual variances between one-month and three-month LIBOR.
Navient’s credit ratings are important to its liquidity. A reduction in its credit ratings could adversely affect its liquidity, increase its borrowing costs or limit its access to the capital markets.
As of December 31, 2016, Moody’s, S&P and Fitch rate Navient’s long term unsecured debt below investment grade. In addition, the capital markets for sub-investment grade companies are not as liquid as those involving investment grade entities. These factors have resulted in a higher cost of funds for the Company, and has caused our senior unsecured debt to trade with greater volatility.
Navient’s unsecured debt totaled $13.7 billion at December 31, 2016, and Navient utilizes the unsecured debt markets to help fund its business and refinance outstanding debt. The amount, type and cost of its funding directly affects the cost of operating its business and growing its assets and is dependent upon outside factors, including its credit rating from rating agencies. There can be no assurance that the Company’s credit ratings will not be reduced further. A reduction in the credit ratings of the Company’s senior unsecured debt could adversely affect Navient’s liquidity, increase its borrowing costs, limit its access to the capital markets and place incremental pressure on its net interest income.
Adverse market conditions or an inability to effectively manage its liquidity risk could negatively impact Navient’s ability to meet its liquidity and funding needs, which could materially and adversely impact its results of operations, cash flow or financial condition.
Navient must effectively manage its liquidity risk. Navient requires liquidity to meet cash requirements such as day-to-day operating expenses, required payments of principal and interest on borrowings, and distributions to stockholders. We expect to fund our ongoing liquidity needs, including the repayment of $0.7 billion of senior unsecured notes that mature in 2017, primarily through our current cash, investments and unencumbered FFELP Loan portfolio, the predictable operating cash flows provided by operating activities ($1.4 billion in the year ended December 31, 2016), the repayment of principal on unencumbered education loan assets, and the distribution of overcollateralization from our securitization trusts. We may also draw down on our secured FFELP Loan and Private Education Loan facilities, issue term ABS, enter into additional repurchase facilities to finance the Residual Interests in existing Private Education Loan ABS trusts (each a “Private Education Loan ABS Repurchase Facility”) or issue additional unsecured debt. Navient may maintain too much liquidity, which can be costly, or may be too illiquid, which could result in financial distress during times of financial stress or capital market disruptions.
19
Table of Contents
The interest rate characteristics of Navient’s earning assets do not always match the interest rate characteristics of its funding arrangements, which may increase the price of, or decrease Navient’s ability to obtain, necessary liquidity.
Net interest income will be the primary source of cash flow generated by Navient’s portfolios of FFELP Loans and Private Education Loans. At the present, interest earned on FFELP Loans and Private Education Loans is primarily indexed to one-month LIBOR and either one-month LIBOR or the one-month Prime rate, respectively, but Navient’s debt is primarily indexed to rates other than one-month LIBOR and Prime.
The different interest rate characteristics of Navient’s loan portfolios and the liabilities funding these loan portfolios result in basis risk and repricing risk. It is not economically feasible to hedge all of Navient’s exposure to such risks. While the asset and hedge indices are short-term with rate movements that are typically highly correlated, there can be no assurance that the historically high correlation will not be disrupted by capital market dislocations or other factors not within our control. For example, during the second half of 2016, Navient experienced widening spreads between one-month and three-month LIBOR and the cost of hedging this variance was prohibitive. We cannot provide any assurance that such a situation will not reoccur which will reduce our net interest margins and net income. In these circumstances, Navient’s earnings could be materially adversely affected.
Navient’s use of derivatives to manage interest rate and foreign currency sensitivity exposes it to credit and market risk that could have a material adverse effect on its earnings and liquidity.
Navient strives to maintain an overall strategy that uses derivatives to minimize the economic effect of interest rate and/or foreign currency changes. However, developing an effective strategy for dealing with these movements is complex, and no strategy can completely avoid the risks associated with these fluctuations. For example, Navient’s education loan portfolio is subject to prepayment risk that could result in its being under- or over-hedged, which could result in material losses. In addition, Navient’s use of derivatives in its risk management activities could expose it to mark-to-market losses if interest rates or foreign currencies move in a materially different way than was expected when Navient entered into the related derivative contracts. As a result, there can be no assurance that hedging activities using derivatives will effectively manage Navient’s interest rate or foreign currency sensitivity, have the desired beneficial impact on its results of operations or financial condition or not adversely impact its liquidity and earnings.
Navient’s use of derivatives also exposes it to market risk and credit risk. Market risk is the chance of financial loss resulting from changes in interest rates, foreign exchange rates and market liquidity. For example, during 2016, Navient’s net interest margin was negatively impacted by unusually wide variances between one-month and three-month LIBOR. Navient’s Floor Income Contracts and some of the basis swaps it uses to manage earnings variability caused by different reset characteristics on interest-earning assets and interest-bearing liabilities do not qualify for hedge accounting treatment. Therefore, the change in fair value, called the “mark-to-market,” of these derivative instruments is included in Navient’s statement of income without a corresponding mark-to-market of the economically hedged item. A decline in the fair value of these derivatives could have a material adverse effect on Navient’s reported earnings.
Credit risk is the risk that a counterparty will not perform its obligations under a contract. Credit risk is limited to the loss of the fair value gain in a derivative that the counterparty or clearinghouse owes Navient and therefore exists for derivatives with a positive fair value. If a counterparty or clearinghouse fails to perform its obligations, Navient could, depending on the type of counterparty arrangement, experience a loss of liquidity or an economic loss. In addition, Navient might not be able to cost effectively replace the derivative position depending on the type of derivative and the current economic environment.
Navient’s securitization trusts, which it consolidates on its balance sheet, had $8.5 billion of Euro and British Pound Sterling denominated bonds outstanding as of December 31, 2016. To convert these non-U.S. dollar denominated bonds into U.S. dollar liabilities, the trusts have entered into foreign-currency swaps with highly rated counterparties. A failure by a swap counterparty to perform its obligations could, if the swap has a positive fair value to Navient, materially and adversely affect Navient’s earnings.
20
Table of Contents
REGULATORY, COMPLIANCE & LEGAL RISK. Compliance risk is the risk to earnings or capital or reputation arising from violations of, or non-conformance with, laws, rules, regulations, prescribed practices, internal policies and procedures, or ethical standards. Legal risk is the risk to earnings, capital or reputation manifested by claims made through the legal system and may arise from a product or service, a transaction, a business relationship, property (real, personal or intellectual), conduct of an employee or change in law or regulation.
Navient’s businesses are subject to a wide variety of laws, rules, regulations and government policies that may change in significant ways and changes to such laws and regulations or changes in existing regulatory guidance or their interpretation or enforcement could materially adversely impact Navient’s business and results of operations.
Our businesses are subject to regulation under a wide variety of U.S. federal and state and non-U.S. laws, rules, regulations and policies. There can be no assurance that these laws, rules, regulations and policies will not be changed in ways that will require us to modify our business models or objectives or in ways that affect our returns on investment by restricting existing activities or services, subjecting them to escalating costs or prohibiting them outright.
In particular, the CFPB has broad authority with respect to Navient’s loan servicing business. It has authority to write regulations under federal consumer financial protection laws and to directly or indirectly enforce those laws and examine Navient for compliance. The CFPB also has examination and enforcement authority with respect to various federal consumer financial laws for some providers of consumer financial products and services, including Navient. In December 2013, the CFPB issued a final rule, effective March 1, 2014, defining “larger participants” in the education loan servicing market that are subject to supervision and examination by the CFPB, a category that includes Navient’s education loan servicing subsidiaries. In July 2016, the CFPB proposed new rules that would, among other things, impose strict limitations on the frequency with which we are permitted to contact borrowers. Additionally, the proposed rules require us to provide enhanced disclosure to borrowers of debt details, and make it easier for borrowers to dispute their debts. The cumulative impact of these proposed regulations, if implemented, could have a material effect on our asset recoveries and may result in significant capital expenditures to develop systems that enable us to comply with the new regulations.
The CFPB is authorized to impose monetary penalties, collect fines and provide consumer restitution in the event of violations, engage in consumer financial education, track consumer complaints, request data and promote the availability of financial services to underserved consumers and communities. The CFPB has authority to prevent unfair, deceptive or abusive acts or practices and to ensure that all consumers have access to fair, transparent and competitive markets for consumer financial products and services. The review of products and practices to prevent unfair, deceptive or abusive conduct will be a continuing focus of the CFPB. The ultimate impact of this heightened scrutiny is uncertain, but it has resulted in, and could continue to result in, changes to pricing, practices, products and procedures. It could also result in increased costs related to regulatory oversight, supervision and examination, additional remediation efforts and possible penalties.
In addition, where a company has violated Title X of the Dodd-Frank Act or CFPB regulations implemented under Title X of the Dodd-Frank Act, the Dodd-Frank Act empowers state attorneys general and state regulators to bring civil actions to remedy violations of state law. If the CFPB or one or more state attorneys general or state regulators believe that Navient has violated any of the applicable laws or regulations, they could exercise their enforcement powers in ways that could have a material adverse effect on Navient or its business.
Loans serviced under the FFELP are subject to the HEA and related laws, rules, regulations and policies. Navient’s servicing operations are designed and monitored to comply with the HEA, related regulations and program guidance; however, ED could determine that Navient is not in compliance for a variety of reasons, including that it misinterpreted ED guidance or incorrectly applied the HEA and its related laws, rules, regulations and policies. Failure to comply could result in fines, the loss of the insurance and related federal
21
Table of Contents
guarantees on affected FFELP Loans, expenses required to cure servicing deficiencies, suspension or termination of its right to participate as a FFELP servicer, negative publicity and potential legal claims. The imposition of significant fines, the loss of the insurance and related federal guarantees on a material number of FFELP Loans, the incurrence of additional expenses and/or the loss of its ability to participate as a FFELP servicer could individually or in the aggregate have a material, negative impact on its business, financial condition or results of operations.
In addition to CFPB regulation, Navient’s asset recovery business is also subject to regulation and oversight by various state and federal agencies, particularly in the area of consumer protection, and is subject to numerous state and federal laws and regulations. Failure to comply with these laws and regulations may result in significant costs, including litigation costs, and/or business sanctions including but not limited to termination or non-renewal of contracts.
Expanded regulatory and governmental oversight of Navient’s businesses will increase its costs and risks.
Navient’s businesses and operations are increasingly subject to governmental and regulatory oversight and scrutiny, both at the federal and state levels. Navient is now, and may be subject in the future, to inquiries and audits from state and federal regulators as well as litigation from private plaintiffs. In recent years, Navient has entered into consent orders and other settlements with the FDIC, the United States Department of Justice (“DOJ”) and other banking and state regulators. Navient has paid fines and penalties or provided monetary and other relief in connection with many of these actions and settlements. We have also enhanced our procedures and controls, expanded the risk and control functions within each line of business, invested in technology and hired additional risk, control and compliance personnel.
If Navient fails to successfully address the requirements of the Consent Orders or other settlements it is currently subject, or more generally to effectively enhance its risk and control procedures and processes to meet the heightened expectations of its regulators and other government agencies, it could be required to enter into further orders and settlements, pay additional fines, penalties or judgments, or accept material regulatory restrictions on its businesses, which could adversely affect its operations and, in turn, its financial results.
Navient expects heightened regulatory scrutiny and governmental investigations and enforcement actions to continue for it and for the financial services industry as a whole. Navient anticipates that regulators will continue to take formal enforcement action, rather than taking informal supervisory actions, more frequently than they have done historically. Such actions can have significant consequences for a financial institution such as Navient, including loss of customers and business and the inability to operate certain businesses.
Due to the uncertainty engendered by these new regulations, guidance and actions, coupled with the likelihood of additional changes or additions to the local, state and federal statutes, regulations and practices applicable to its business, Navient is not able to estimate the ultimate impact of changes in law on its financial results, business operations or strategies. Navient believes that the cost of responding to and complying with these evolving laws and regulations, as well as any guidance from enforcement actions, will continue to increase, as will the risk of penalties and fines from any enforcement actions that may be imposed on its businesses. Navient’s profitability, results of operations, financial condition, cash flows or future business prospects could be materially and adversely affected as a result.
Navient’s framework for managing risks may not be effective in mitigating the risk of loss.
Navient’s risk management framework seeks to mitigate risk and appropriately balance risk and returns. Navient has established processes and procedures intended to identify, measure, monitor, control and report the types of risk to which it is subject. Navient seeks to monitor and control risk exposure through a framework of policies, procedures, limits and reporting requirements. Management of risks in some cases depends upon the use of analytical and forecasting models. If the models that Navient uses to mitigate these risks are inadequate, it may incur increased losses. In addition, there may be risks that exist, or that develop in the future, that Navient has not
22
Table of Contents
appropriately anticipated, identified or mitigated. If Navient’s risk management framework does not effectively identify or mitigate risks, Navient could suffer unexpected losses, and its results of operations, cash flow or financial condition could be materially adversely affected.
We are subject to various legal proceedings and some of these legal proceedings or other contingencies may materially adversely affect our business, financial condition or results from operations.
We are subject to a variety of legal proceedings in virtually every part of our businesses including the legal proceedings described in the Legal Proceedings section of this Annual Report on Form 10-K. While we believe we have adopted appropriate legal and risk management and compliance programs, the diverse nature of our operations, including operations of business we have recently acquired, means that legal and compliance risks will continue to exist and additional legal proceedings and other contingencies, the outcome of which cannot be predicted with certainty, will arise from time to time. Some of these legal proceedings or other contingencies may materially adversely affect our business, financial condition or results from operations.
Navient is subject to evolving and complex tax laws, which may result in additional liabilities that may affect its results of operations.
Navient is subject to evolving and complex federal and state tax laws. Significant judgment is required for determining Navient’s tax liabilities. SLM Corporation’s tax returns have been, and Navient’s tax returns continue to be, periodically examined by various tax authorities. Navient has, among other tax liabilities, risks for future tax contingencies arising from operations post-Spin-Off. Due to the complexity of tax contingencies, the ultimate resolution of any tax matters related to operations post-Spin-Off may result in payments greater or less than amounts accrued.
In addition, Navient may be impacted by changes in tax laws, including tax rate changes, changes to the laws related to the treatment and remittance of foreign earnings, new tax laws and subsequent interpretations of tax laws by federal and state tax authorities.
Incorrect estimates and assumptions by management in connection with the preparation of Navient’s consolidated financial statements could adversely affect Navient’s reported assets, liabilities, income, revenue or expenses.
The preparation of Navient’s consolidated financial statements requires management to make critical accounting estimates and assumptions that affect the reported amounts of assets, liabilities, income, revenue or expenses during the reporting periods. Incorrect estimates and assumptions by management could adversely affect Navient’s reported amounts of assets, liabilities, income, revenue and expenses during the reporting periods. If Navient makes incorrect assumptions or estimates, it may under- or overstate reported financial results, which could materially and adversely affect its business, financial condition and results of operations.
We could have a material write down related to our Deferred Tax Asset as a result of a decrease in our corporate tax rate of 35 percent.
As of December 31, 2016, the balance of our net deferred tax asset was $802 million. Any decrease in the corporate tax rate would result in an immediate decrease in the deferred tax asset and a related charge to earnings that could materially affect our financial results.
Since the 2016 presidential election, there has been a great deal of discussion relating to possible changes to the Internal Revenue Code and corporate tax rates. A number of proposals for broad reform of the corporate tax system are under evaluation by various legislative and administrative bodies, but it is not possible to accurately determine the overall impact of such proposals on our tax rate at this time. Excluding the impact to the Deferred Tax Asset balance discussed above, any reduction in the corporate tax rate would benefit future earnings.
23
Table of Contents
OPERATIONAL RISKS. Operational risk relates to risks arising from systems, process, people and external events that affect the operation of our business, it includes information management, data protection and cybersecurity, business disruption and other risks including human resources.
If Navient does not effectively and continually align its cost structure with its business operations, its results of operations and financial condition could be materially adversely affected.
Navient continually needs to align its cost structure with its business operations. Navient’s ability to properly size its cost structure is dependent upon a number of variables, including its ability to successfully execute on its business plans and growth initiatives and future legislative or regulatory changes. If Navient undertakes cost reductions based on its business plan, those reductions could be too dramatic and could cause disruptions in its business, reductions in the quality of the services it provides or cause it to fail to comply with applicable regulatory standards. Alternatively, Navient may fail to implement, or be unable to achieve, necessary cost savings commensurate with its business and prospects. In either case, Navient’s business, results of operations and financial condition could be adversely affected.
A failure of the operating systems or infrastructure of Navient could disrupt its business, cause significant losses, result in regulatory action or damage its reputation.
A failure of Navient’s operating systems or infrastructure could disrupt our business. Navient’s business is dependent on its ability to process and monitor large numbers of daily transactions in compliance with contractual, legal and regulatory standards and its own product specifications, both currently and in the future. As Navient’s processing demands and loan portfolios change, both in volume and in terms and conditions, Navient’s ability to develop and maintain its operating systems and infrastructure may become increasingly challenging. There is no assurance that Navient has adequately or efficiently developed, maintained or acquired such systems and infrastructure or will do so in the future.
The servicing, financial, accounting, data processing and other operating systems and facilities that support Navient’s business may fail to operate properly or become disabled as a result of events that are beyond Navient’s control, adversely affecting its ability to timely process transactions. Any such failure could adversely affect Navient’s ability to service its clients, and result in financial loss or liability to its clients, disrupt its business, and result in regulatory action or cause reputational damage.
Despite the plans and facilities Navient has in place, its ability to conduct business may be adversely affected by a disruption in the infrastructure that supports its business. This may include a disruption involving electrical, communications, Internet, transportation or other services used by Navient or third parties with which it conducts business. Notwithstanding efforts to maintain business continuity, a disruptive event impacting Navient’s processing locations could adversely affect its business, financial condition and results of operations.
Navient depends on secure information technology, and a breach of its information technology systems could result in significant losses, disclosure of confidential customer information and reputational damage, which would adversely affect Navient’s business.
Navient’s operations rely on the secure processing, storage and transmission of personal, confidential and other information in its computer systems and networks. Although Navient takes protective measures it deems reasonable and appropriate, its computer systems, software and networks may be vulnerable to unauthorized access, computer viruses, malicious attacks and other events that could have a security impact beyond Navient’s control. These technologies, systems and networks, and those of third parties, may become the target of cyber-attacks or information security breaches that could result in the unauthorized release, gathering, monitoring, misuse, loss or destruction of Navient’s or its customers’ confidential, proprietary and other information, or otherwise disrupt Navient’s business operations or those of its customers or other third parties. Information security risks for institutions that handle large numbers of financial transactions on a daily basis such as Navient have generally increased in recent years, in part because of the proliferation of new technologies, the use of the
24
Table of Contents
Internet and telecommunications technologies to conduct financial transactions, and the increased sophistication and activities of organized crime, hackers, terrorists, activists and other external parties.
If one or more of such events occur, personal, confidential and other information processed and stored in, and transmitted through, Navient’s computer systems and networks could be jeopardized or could cause interruptions or malfunctions in Navient’s operations that could result in significant losses or reputational damage. Navient routinely transmits and receives personal, confidential and proprietary information, some of it through third parties. Navient maintains secure transmission capability and works to ensure that third parties follow similar procedures. Nevertheless, an interception, misuse or mishandling of personal, confidential or proprietary information being sent to or received from a customer or third party could result in legal liability, regulatory action and reputational harm. In the event personal, confidential or other information is jeopardized, intercepted, misused or mishandled, Navient may need to expend significant additional resources to modify its protective measures or to investigate and remediate vulnerabilities or other exposures, and it may be subject to fines, penalties, litigation and settlement costs and financial losses that may either not be insured against or not be fully covered through insurance. If one or more of such events occur, Navient’s business, financial condition or results of operations could be significantly and adversely affected.
Navient depends on third parties for a wide array of services, systems and information technology applications, and a breach or violation of law by one of these third parties could disrupt Navient’s business or provide its competitors with an opportunity to enhance their position at Navient’s expense.
Navient depends on third parties for a wide array of services, systems and information technology applications. Third-party vendors are significantly involved in many aspects of Navient’s software and systems development, the timely transmission of information across its data communication network, and for other telecommunications, processing, remittance and technology-related services in connection with Navient’s payment services businesses. Navient also utilizes various third-party debt collectors in the collection of defaulted Private Education Loans and in other areas. If a service provider fails to provide the services required or expected, or fails to meet applicable contractual or regulatory requirements such as service levels or compliance with applicable laws, the failure could negatively impact Navient’s business by adversely affecting its ability to process customers’ transactions in a timely and accurate manner, otherwise hampering Navient’s ability to serve its customers, or subjecting Navient to litigation and regulatory risk for matters as diverse as poor vendor oversight or improper release or protection of personal information. Such a failure could also adversely affect the perception of the reliability of Navient’s networks and services and the quality of its brands, which could materially adversely affect Navient’s business and results of operations.
Navient’s work with government clients exposes it to additional risks inherent in the government contracting environment.
Navient’s clients include federal, state and local governmental entities. This work carries various risks inherent in the government contracting process. These risks include, but are not limited to, the following:
| • | Government entities in the United States often reserve the right to audit contract costs and conduct inquiries and investigations of business practices. These entities also conduct reviews and investigations and make inquiries regarding systems, including systems of third parties, used in connection with the performance of the contracts. Negative findings from audits, investigations or inquiries could affect the contractor’s future revenues and profitability by preventing them, by operation of law or in practice, (i) from receiving new government contracts for some period of time or (ii) from being paid at the rate they believe is warranted. |
| • | If improper or illegal activities are found in the course of government audits or investigations, the contractor may become subject to various civil and criminal penalties, including those under the civil U.S. False Claims Act. Additionally, Navient may be subject to administrative sanctions, which may include termination or non-renewal of contracts, forfeiture of profits, suspension of payments, fines and suspensions or debarment from doing business with other agencies of that government. Due to the inherent limitations of internal controls, it may not be possible to detect or prevent all improper or illegal activities. |
25
Table of Contents
The occurrences or conditions described above could affect not only Navient’s business with the particular government entities involved, but also its business or potential future business with other entities of the same or other governmental bodies or with commercial clients, and could have a material adverse effect on its business or its results of operations.
If Navient is unable to attract and retain professionals with strong leadership skills, its business, results of operations and financial condition may be materially adversely affected.
Navient’s success is dependent, in large part, on its ability to attract and retain personnel with the knowledge and skills to lead its business. Experienced personnel in its industry are in high demand, and competition for talent is very high. Navient must hire, retain and motivate appropriate numbers of talented people with diverse skills in order to serve its clients, respond quickly to rapid and ongoing technology, industry and macroeconomic developments, and grow and manage its business. As Navient expands its services and solutions, it must also hire and retain an increasing number of professionals with different skills and professional expectations than those of the professionals it has historically hired and retained. If Navient is unable to successfully integrate, motivate and retain these professionals, its ability to continue to secure work in those industries and for its services and solutions may suffer.
REPUTATIONAL/POLITICAL RISK. Reputational risk is the risk to earnings or capital arising from damage to our reputation in the view of, or loss of the trust of, customers and the general public. Political risk is the closely related risk to earnings or capital arising from damage to our relationships with governmental entities, regulators and political leaders and candidates. These risks can arise due to both our own acts and omissions (both real and perceived), and the acts and omissions of other industry participants or other third parties, and they are inherent in all of our businesses.
Federal funding constraints and spending policy changes triggered by associated federal spending deadlines and ongoing lawmaker and regulatory efforts to change the student lending sector may result in disruption of federal payments for services Navient provides to the government, which could materially and adversely affect Navient’s business strategy or future business prospects.
Navient receives payments from the federal government on its FFELP Loan portfolio and for other services it provides, including servicing loans under the DSLP, providing default aversion and contingency collections to ED, and providing performance-based services to the IRS to support its national recovery program. Payments for these services may be affected by various factors, including the following:
| • | The Budget Act: The Budget Act enacted on December 26, 2013, included several provisions that will have or could have an effect on Navient’s business. First, the Budget Act reduced the amount paid to guaranty agencies for defaulted FFELP Loans rehabilitated under Section 428F of the HEA, beginning on July 1, 2014. In addition, the Budget Act eliminated funding for the Direct Loan servicing performed by not-for-profit servicers. The Budget Act requires that all servicing funding be provided through the annual appropriations process which is subject to certain limitations. Although the payments for Navient’s DSLP servicing contract are already funded from annual appropriations, the requirement to fund all servicing from the limited appropriated funding could have an effect on our future business in ways the Company cannot predict at this time. |
| • | Other Higher Education Legislation: As Congress and the new Administration consider the reauthorization of the Higher Education Act, they may consider legislation that would reduce the payments to Guarantors or change the consolidation program in a way that would incentivize education loan borrowers to refinance their existing education loans, both private and federal. Such reforms could reduce Navient’s cash flows from servicing and interest income as well as its net interest margin. |
It is possible that the administration and Congress in the future could engage in a prolonged debate linking the federal deficit, debt ceiling and other budget issues. If U.S. lawmakers in the future fail to reach agreement on these issues, the federal government could stop or delay payment on its obligations, including those on services
26
Table of Contents
Navient provides. The recent presidential election in the United States could result in significant changes (or uncertainty) in governmental policies, regulatory environments, spending sentiment and many other factors and conditions, some of which could adversely impact Navient’s business, financial condition and results of operations. Further, legislation to address the federal deficit and spending could impose proposals that would adversely affect FFELP and DSLP-related servicing businesses. A protracted reduction, suspension or cancellation of the demand for the services Navient provides, or proposed changes to the terms or pricing of services provided under existing contracts with the federal government, including its contract with ED, could have a material adverse effect on Navient’s revenues, cash flows, profitability and business outlook, and, as a result, could materially adversely affect its business, financial condition and results of operations. Navient cannot predict how or what programs or policies will be impacted by any actions that the Administration, Congress or the federal government may take.
RISKS ASSOCIATED WITH OUR SPIN-OFF
Navient’s historical and pro forma financial information is not necessarily representative of the results that it would have achieved as a separate, publicly traded company and may not be a reliable indicator of its future results.
Due to the relative significance of Navient to SLM Corporation, among other factors, Navient is the “accounting successor” to SLM Corporation for financial reporting purposes, notwithstanding the legal form of the Spin-Off described in this Form 10-K. Hence, Navient’s historical consolidated financial statements included in this Form 10-K are the consolidated financial statements of SLM Corporation. Other significant changes have occurred in Navient’s cost structure, management, financing and business operations due to the Company operating as a company separate from the combined businesses of SLM Corporation. Accordingly, the historical financial information for Navient included in this Form 10-K does not necessarily reflect the financial condition, results of operations or cash flows that Navient would have achieved as a separate, publicly traded company during the periods presented or those that Navient will achieve in the future.
Navient owes obligations, including service and indemnification obligations, to SLM BankCo under various transaction agreements that were executed as part of the Spin-Off. These obligations could be materially disruptive to Navient’s business or subject it to substantial liabilities, including contingent liabilities and liabilities that are presently unknown.
In connection with the Spin-Off, Navient, SLM Corporation and SLM BankCo entered into various agreements, including, among others, a separation and distribution agreement, a transition services agreement, a tax sharing agreement, an employee matters agreement, a loan servicing and administration agreement, a joint marketing agreement, a key systems agreement, a data sharing agreement and a sublease agreement. Under the transition services agreement, a subsidiary of Navient hosts and provides SLM BankCo with access to Navient’s information technology systems and services, and Navient assists SLM BankCo in migrating its customer data and service functions to a separate environment. The performance by Navient of its obligations to SLM BankCo under these agreements may require the diversion of a significant amount of Navient management’s time from Navient’s operations and could be disruptive to its business operations.
The separation and distribution agreement between Navient, SLM Corporation and SLM BankCo provides for, among other things, indemnification obligations designed to make Navient financially responsible for substantially all liabilities that may exist whether incurred prior to or after the Spin-Off, relating to the business activities of SLM Corporation prior to the Spin-Off, other than those arising out of the consumer banking business and expressly assumed by SLM BankCo pursuant to the Spin-Off and the separation and distribution agreement. This includes Navient being financially responsible for all servicing and collections activities that it performed or directed on behalf of Sallie Mae Bank. If Navient is required to indemnify SLM BankCo under the circumstances set forth in the separation and distribution agreement, Navient may be subject to substantial liabilities including liabilities that are accrued, contingent or otherwise and regardless of whether the liabilities were known or unknown at the time of the Spin-Off. SLM BankCo is party to various claims, litigation and legal,
27
Table of Contents
regulatory and other proceedings resulting from ordinary business activities relating to its current and former operations including the lawsuit brought by the State of Illinois Attorney General. Previous business activities of SLM BankCo, including originations and acquisitions of various classes of consumer loans outside of Sallie Mae Bank, may also result in liability due to future laws, rules, interpretations or court decisions which purport to have retroactive effect, and such liability could be significant. SLM BankCo may also be subject to liabilities related to past activities of acquired businesses. It is inherently difficult, and in some cases impossible, to estimate the probable losses associated with contingent and unknown liabilities of this nature, but future losses may be substantial and will be borne by Navient in accordance with the terms of the separation and distribution agreement.
There could be significant liability to Navient if the Spin-Off is determined to be a taxable transaction.
The Spin-Off of Navient from SLM BankCo was intended to qualify as a reorganization under various provisions of the Code and as such to not be a taxable transaction. The Spin-Off was therefore conditioned on the receipt by SLM Corporation of a private letter ruling from the IRS to the effect that, among other things, (i) the merger of SLM Corporation with and into a limited liability company wholly owned by SLM BankCo (the “SLM Merger”) (together with the conversion of the shares of SLM Corporation common and preferred stock into shares of SLM BankCo common and preferred stock pursuant to the SLM Merger) would qualify as a “reorganization” within the meaning of Section 368(a)(1)(F) of the Code and will not be integrated with the rest of the Spin-Off , and (ii) the Spin-Off would qualify as a “reorganization” for U.S. federal income tax purposes under Sections 355 and 368(a)(1)(D) of the Code. In addition, the Spin-Off was conditioned on SLM BankCo’s receipt of an opinion from outside tax counsel to the effect that, with respect to certain requirements for tax-free treatment under Section 355 of the Code on which the IRS will not rule, such requirements will be satisfied. Both of these conditions were satisfied or waived prior to the Spin-Off. Navient received the private letter ruling from the IRS after the Spin-Off.
The ruling and the opinion rely on facts, assumptions, representations and undertakings from SLM Corporation, SLM BankCo and Navient regarding the past and future conduct of the companies’ respective businesses and other matters. If any of these facts, assumptions, representations or undertakings is incorrect, SLM BankCo and its stockholders may not be able to rely on the ruling or the opinion of tax counsel and could be subject to significant tax liabilities. In addition, notwithstanding receipt of the private letter ruling from the IRS and opinion of tax counsel, the IRS could determine on audit that the SLM Merger and/or Spin-Off was taxable if it determines that any of these facts, assumptions, representations or undertakings were not correct or have been violated or if it disagrees with the conclusions in the opinion that are not covered by the private letter ruling, or for other reasons, including as a result of significant changes in the share ownership of SLM BankCo or Navient after the Spin-Off. If the SLM Merger and/or Spin-Off is determined to be taxable for U.S. federal income tax purposes, SLM BankCo and its stockholders that are subject to U.S. federal income tax could incur significant U.S. federal income tax liabilities and Navient could incur significant liabilities related thereto.
28
Table of Contents
GOVERNANCE RISK. Governance risk is the risk of not establishing and maintaining a control environment that aligns with stakeholder and regulatory expectations, including our relationship with the regulators as well as compliance environment within the Company and board oversight. These risks are inherent in all of our businesses.
Certain provisions of Delaware law and Navient’s amended and restated certificate of incorporation and amended and restated by-laws prevent or delay an acquisition of Navient, which could decrease the trading price of Navient’s common stock.
Certain provisions of Delaware law and of Navient’s amended and restated certificate of incorporation and amended and restated by-laws are intended to deter coercive takeover practices and inadequate takeover bids by, among other things, encouraging prospective acquirors to negotiate directly with Navient’s board of directors rather than to attempt a hostile takeover. These provisions include, among others:
| • | limitations on the ability of Navient’s stockholders to call a special meeting such that stockholder-requested special meetings will only be called upon the request of the holders of at least one-third of Navient’s capital stock issued and outstanding and entitled to vote at an election of directors; |
| • | rules regarding how stockholders may present proposals or nominate directors for election at stockholder meetings; |
| • | the right of Navient’s board of directors to issue one or more series of preferred stock without stockholder approval; |
| • | the inability of Navient’s stockholders to fill vacancies on Navient’s board of directors; |
| • | the requirement that the affirmative vote of the holders of at least 75 percent in voting power of Navient’s stock entitled to vote thereon is required for stockholders to amend Navient’s amended and restated by-laws; and |
| • | the inability of Navient stockholders to cumulate their votes in the election of directors. |
In addition, Navient’s amended and restated certificate of incorporation makes it subject to Section 203 of the Delaware General Corporation Law. Section 203 generally provides that, with limited exceptions, persons who acquire, or are affiliated with a person that acquires, 15 percent or more of the outstanding voting stock of a Delaware corporation shall not engage in any business combination with that corporation, including by merger, consolidation or acquisitions of additional shares, for a three-year period following the time at which that person or its affiliates becomes the holder of 15 percent or more of the corporation’s outstanding voting stock. Being subject to Section 203 could cause a delay in or completely prevent a change of control that stockholders may favor.
Navient believes these provisions protect its stockholders from coercive or otherwise unfair takeover tactics by requiring potential acquirors to negotiate with Navient’s board of directors and by providing our board of directors with more time to assess any acquisition proposal. These provisions are not intended to make the Company immune from takeovers. However, these provisions will apply even if the offer may be considered beneficial by some stockholders and could delay or prevent an acquisition that Navient’s board of directors determines is not in the best interests of Navient and Navient’s stockholders.
Stockholders’ percentage ownership in Navient may be diluted in the future.
In the future, stockholders’ percentage ownership in Navient may be diluted as a result of equity issuances for acquisitions, capital market transactions or otherwise, including equity awards that Navient may grant to its directors, officers and employees. For a period of time, Navient will continue and certain SLM BankCo employees may continue to have options to purchase shares of Navient common stock after the Spin-Off as a result of conversion of a portion of their SLM Corporation stock options to Navient stock options. From time to time, Navient may issue additional stock options or other equity-based awards to its employees under Navient’s employee benefits plans. Such awards will have a dilutive effect on Navient’s earnings per share, which could adversely affect the market price of shares of Navient common stock.
29
Table of Contents
In addition, Navient’s amended and restated certificate of incorporation authorizes Navient to issue, without the approval of Navient’s stockholders, one or more series of preferred stock. Navient’s board of directors generally may determine the rights of preferred stockholders including their powers, preferences and relative, participating, optional and other special rights, including preferences over Navient’s common stock with respect to dividends and distributions. If Navient’s board were to approve the issuance of preferred stock in the future, the terms of one or more series of such preferred stock could dilute the voting power or reduce the value of Navient’s common stock. For example, Navient could grant the holders of preferred stock the right to elect some number of Navient’s directors in all circumstances or upon the happening of specified events, or the right to veto specified transactions. Similarly, it could grant the preferred stockholders certain repurchase or redemption rights or liquidation preferences that could affect the value of the common stock.
STRATEGIC RISK. Strategic risk is the risk to results of operations, cash flow or financial condition arising from our potential inability to successfully carry out our strategy. This risk can arise due to both our own acts or omissions, and the acts or omissions of other industry participants or other third parties, and it is inherent in all of our businesses. The success of our business plans depends upon achieving our strategic objectives, including through acquisition, joint ventures, dispositions and restructurings.
Acquisitions or strategic investments that Navient pursues may not be successful and could disrupt its business, harm its financial condition or reduce its earnings.
Navient’s growth strategy includes making opportunistic acquisitions of, or material investments in, loan portfolios, complementary businesses and products. Navient may not be able to identify suitable opportunities and, if not, this strategy could fail. Even if it is able to identify suitable opportunities, Navient may not be able to obtain financing necessary to allow Navient to make such acquisitions or investments on satisfactory terms or at all or obtain necessary regulatory approvals, or be able to complete the transactions on satisfactory terms. If the purchase price of any acquisition or investment is paid in cash, it may have an adverse effect on Navient’s financial condition; if the purchase price is paid with Navient stock, it could be dilutive to stockholders. Navient may assume liabilities, including unrecorded liabilities that are not discovered at the time of the transaction, and the repayment of those liabilities may have an adverse effect on our results of operations, cash flow or financial condition.
In addition to the financial risks, acquisitions involve operational risks and Navient may not be able to successfully integrate personnel, operations, businesses, products or technologies acquired in an acquisition. There may be additional risks if Navient enters into a line of business in which it has limited experience or which operates in a legal, regulatory or competitive environment with which Navient is not familiar. Navient may not have or be able to maintain the expertise needed to manage the new business. The expected benefits of acquisitions and investments also may not be realized for various reasons, including the loss of key personnel, customers or vendors. If Navient fails to integrate or realize the expected benefits of its acquisitions or investments, it may lose the return on these acquisitions or investments or incur additional transaction costs, and its business and financial condition may be harmed as a result.
Under the separation and distribution agreement, Navient is precluded from conducting certain activities until January 1, 2019, including originating Private Education Loans. As a result, interest income and fee-based servicing revenue derived from its existing Private Education Loan portfolio is anticipated to decline as our existing portfolio amortizes. We also may not be able to develop revenue streams to replace the declining revenue from Private Education Loans.
Navient is not presently originating new Private Education Loans and as part of its Spin-Off transaction agreed not to originate certain of these loans until January 1, 2019. As a result, interest income on Navient’s Private Education Loan portfolio and fee-based revenue on that portfolio are anticipated to decline over time as the loans are paid down, refinanced or charged off. If Navient does not begin to originate Private Education Loans as permitted under its separation and distribution agreement, acquire additional Private Education Loans
30
Table of Contents
or otherwise grow or develop new revenue streams to replace or supplement its Private Education Loan net interest and servicing revenue, Navient’s consolidated revenue and operating income will continue to decrease which could materially and adversely impact our results of operations, cash flow or financial condition.
Navient’s businesses operate in competitive environments and could lose market share and revenues if competitors compete more aggressively or effectively.
Navient competes with for-profit and not-for-profit servicing, asset recovery and business processing businesses, many with strong records of performance. Navient competes based on effectiveness and customer service metrics. To the extent its competitors compete aggressively or more effectively than Navient, Navient could lose market share to them or Navient’s service offerings may not prove to be profitable.
Since the second quarter of 2009, Navient has been one of four large servicers (TIVAS) awarded a servicing contract by ED to service federal loans owned by ED. On August 27, 2014, ED extended its servicing contract with Navient to service federal loans for five more years. Under the terms of the contract extension, the allocation of additional volume will be determined twice each year based on the relative performance of the servicers utilizing five performance metrics. Quarterly scores in each metric are be averaged together twice each year to calculate the final result for each metric. Beginning on January 1, 2015, ED increased the aggregate allocation for not-for-profit servicers to 25 percent of all new DSLP borrowers.
If Navient is unable to improve its performance and increase its relative standing compared to the three other servicing companies with whom it competes, its ability to maintain or increase its servicing business with ED may be materially adversely affected.
Legislation passed by Congress in 2010 ended new loan originations under the FFELP program, and, as a result, net income on Navient’s existing FFELP Loan portfolio is anticipated to decline over time. Navient may not be able to develop revenue streams to fully replace the declining revenue from FFELP Loans.
In 2010, Congress passed legislation ending the origination of education loans under the FFELP program. Since then, all federal education loans have been originated through the DSLP of the ED. While the 2010 law did not alter or affect the terms and conditions of existing FFELP Loans, it significantly impacted the education loan industry. As a result of this legislation, net income on Navient’s FFELP Loan portfolio is anticipated to decline over time as existing FFELP Loans are paid down, refinanced or repaid after default by Guarantors. Additionally, the law has encouraged consolidation among FFELP servicers and guaranty agencies. In 2016, ownership in two of the student loan guarantors was transferred to a competitor. While Navient is actively seeking to acquire additional FFELP portfolios, we can provide no assurance that we will be successful in such efforts. If Navient is not able to acquire additional FFELP Loans or otherwise grow or develop new revenue streams to replace or supplement its existing, and declining, FFELP Loan net income, Navient’s consolidated revenue and operating income will continue to decrease which could materially and adversely impact our results of operations, cash flow or financial condition.
| Item 1B. | Unresolved Staff Comments |
None.
31
Table of Contents
| Item 2. | Properties |
The following table lists the principal facilities owned by us as of December 31, 2016:
| Location |
Function |
Business Segment(s) |
Approximate Square Feet |
|||||
| Fishers, IN |
Loan Servicing and Data Center | FFELP Loans; Private Education Loans; Business Services | 450,000 | |||||
| Wilkes-Barre, PA |
Loan Servicing Center | FFELP Loans; Private Education Loans; Business Services | 133,000 | |||||
| Big Flats, NY |
GRC and Pioneer Credit Recovery — Collections Center | Business Services | 60,000 | |||||
| Indianapolis, IN |
Loan Servicing Center | Business Services | 50,000 | |||||
| Arcade, NY |
Pioneer Credit Recovery — Collections Center | Business Services | 46,000 | |||||
| Perry, NY |
Pioneer Credit Recovery — Collections Center | Business Services | 45,000 | |||||
| Lake City, FL |
Gila MSB — Collections Center | Business Services | 8,000 | |||||
The following table lists the principal facilities leased by us as of December 31, 2016:
| Location |
Function |
Business Segment(s) |
Approximate Square Feet |
|||||
| Newark, DE |
Operations Center and Administrative Offices | FFELP Loans; Private Education Loans; Business Services; Other | 85,568 | |||||
| Reston, VA(1) |
Administrative Offices | FFELP Loans; Private Education Loans; Business Services; Other | 90,000 | |||||
| Muncie, IN |
Collections Center | Private Education Loans; Business Services | 75,400 | |||||
| Mason, OH |
GRC Headquarters and Collections Center | Business Services | 54,000 | |||||
| Wilmington, DE |
Headquarters | FFELP Loans; Private Education Loans; Business Services; Other | 46,000 | |||||
| Moorestown, NJ |
Pioneer Credit Recovery — Collections Center | Business Services; Other | 30,000 | |||||
| Austin, TX |
Gila MSB — Collections Center | Business Services; Other | 55,000 | |||||
| Hendersonville, TN(2) |
Xtend Healthcare — Revenue Cycle Management | Business Services; Other | 90,000 | |||||
| Nashville, TN |
Xtend Healthcare — Revenue Cycle Management | Business Services; Other | 28,000 | |||||
| (1) | Includes 18,000 square feet sublet to SLM Corporation. |
| (2) | Includes 34,000 square feet at 500 West Main Street and 56,000 square feet at 90 Volunteer Drive. |
None of the facilities that we own is encumbered by a mortgage. We believe that our headquarters, loan servicing centers, data center, back-up facility and data management and collections centers are generally adequate to meet our long-term customer needs and business goals. Our headquarters is currently in leased space at 123 Justison Street, Wilmington, Delaware, 19801.
| Item 3. | Legal Proceedings |
We and our subsidiaries and affiliates are subject to various claims, lawsuits and other actions that arise in the normal course of business. We believe that these claims, lawsuits and other actions will not, individually or in the aggregate, have a material adverse effect on our business, financial condition or results of operations, except as otherwise disclosed. Most of these matters are claims including individual and class action lawsuits against our servicing and collection subsidiaries by borrowers and debtors alleging the violation of state or federal laws in connection with servicing or collection activities on their education loans and other debts.
In the ordinary course of our business, the Company, our subsidiaries and affiliates may receive information and document requests and investigative demands from state attorneys general, U.S. Attorneys, legislative committees and administrative agencies. These requests may be informational or regulatory in nature and may relate to our business practices, the industries in which we operate, or other companies with whom we conduct business. Our practice has been and continues to be to cooperate with these bodies and to be responsive to any such requests.
32
Table of Contents
These inquiries and the volume of related information demands are increasing the costs and resources we must dedicate to timely respond to these requests and may, depending on their outcome, result in payments of additional amounts of restitution, fines and penalties in addition to those described below.
On March 18, 2011, an education loan borrower filed a putative class action complaint against SLM Corporation as it existed prior to the Spin-Off (“Old SLM”) in the U.S. District Court for the Northern District of California. The complaint was captioned Tina M. Ubaldi v. SLM Corporation et. al. The plaintiff brought the complaint on behalf of a putative class consisting of other similarly situated California borrowers. The complaint alleged, among other things, that Old SLM’s practice of charging late fees that were proportional to the amount of missed payments constituted liquidated damages in violation of California law and that Old SLM engaged in unfair business practices by charging daily interest on private educational loans. Plaintiffs subsequently amended their complaint to include usury claims under California state law and to seek restitution of late charges and interest paid by members of the putative class, injunctive relief, cancellation of all future interest payments, treble damages as permitted by law, as well as costs and attorneys’ fees, among other relief. In the fourth quarter of 2016, the parties reached a settlement in principle that would resolve the Ubaldi matter, as well as the related lawsuits of Marlene Blyden v. Navient Corporation, et al. and Jamie Beechum, et al. v. Navient Solutions, Inc. While we cannot provide any assurances that we will be able to finalize the proposed settlement on terms that are acceptable to the Company, we do not believe that the financial impact of the final settlement, if any, will be material. The Company agreed to settle these matters to avoid the burden, expense, risk, and uncertainty of continued litigation. A reserve has been established for this matter as of December 31, 2016.
During the first quarter of 2016, Navient Corporation, certain Navient officers and directors, and the underwriters of certain Navient securities offerings were sued in three putative securities class action lawsuits filed on behalf of certain investors in Navient stock or Navient unsecured debt. These three cases, which were filed in the U.S. District Court for the District of Delaware, were consolidated by the District Court, with Lord Abbett Funds appointed as Lead Plaintiff. The caption of the consolidated case is Lord Abbett Affiliated Fund, Inc., et al. v. Navient Corporation, et al. The plaintiffs filed their amended and consolidated complaint in September 2016. The Navient defendants intend to vigorously defend against the allegations in this lawsuit, and filed a Motion to Dismiss the Consolidated Amended Class Action Complaint in November 2016. Plaintiffs filed an Opposition in December 2016. At this stage in the proceedings, we are unable to anticipate the timing of resolution or the ultimate impact, if any, that the legal proceedings may have on the consolidated financial position, liquidity, results of operations or cash-flows of Navient and its affiliates. As a result, it is not possible at this time to estimate a range of potential exposure, if any, for amounts that may be payable in connection with these matters and reserves have not been established. It is possible that an adverse ruling or rulings may have a material adverse impact on the Company.
The Company has been named as defendant in a number of putative class action cases alleging violations of various state and federal consumer protection laws. One of these putative class action suits is Randy Johnson v. Navient Solutions, Inc. On May 4, 2015, Randy Johnson filed a putative class action in the United States District Court for the Southern District of Indiana alleging violations of the Telephone Consumer Protection Act (“TCPA”). During the fourth quarter of 2016, the parties entered into a settlement agreement and on December 23, 2016, filed a Motion to Approve the Class Action Settlement with the Court. The Court preliminarily approved the settlement on January 26, 2017. We have denied all claims asserted against the Company, but agreed to settle the case to avoid the burden, expense, risk and uncertainty of continued litigation. A reserve has been established for this matter as of December 31, 2016.
On January 18, 2017, the CFPB and Attorneys General for the State of Illinois and the State of Washington (collectively the “Attorneys General”) initiated civil actions naming Navient Corporation and several of its subsidiaries as defendants alleging violations of Federal and State consumer protection statutes, including the Consumer Financial Protection Act of 2010, the Fair Credit Reporting Act, the Fair Debt Collection Practices Act and various state consumer protection laws. For additional information on these civil actions, please refer to section entitled “Regulatory Matters” below.
33
Table of Contents
Regulatory Matters
On May 2, 2014, Navient Solutions, Inc., now known as Navient Solutions, LLC (“Solutions”), a wholly-owned subsidiary of Navient, and Sallie Mae Bank entered into consent orders, without admitting any wrongdoing, with the Federal Deposit Insurance Corporation (the “FDIC”) (respectively, the “Solutions Order” and the “Bank Order”; collectively, the “FDIC Orders”) to settle matters related to certain cited violations of Section 5 of the Federal Trade Commission Act, including the disclosures and assessments of certain late fees, as well as alleged violations under the Servicemembers Civil Relief Act (the “SCRA”). The FDIC Orders, which became effective upon the signing of the consent order with the United States Department of Justice (the “DOJ”) by Solutions and SLM BankCo on May 13, 2014, required Solutions to pay $3.3 million in civil monetary penalties. Solutions paid its civil monetary penalties. In addition, the FDIC Orders required the establishment of a restitution reserve account totaling $30 million to provide restitution with respect to loans owned or originated by Sallie Mae Bank, from November 28, 2005 until the effective date of the FDIC Orders. Pursuant to the Separation and Distribution Agreement among SLM Corporation, SLM BankCo and Navient dated as of April 28, 2014 (the “Separation Agreement”), Navient funded the restitution reserve account in May 2014. While the FDIC issued its final exam report in December 2016, we are unable at this point in time to predict the timing of when the FDIC will lift the consent order.
The Solutions Order also required Solutions to ensure proper servicing for service members and proper application of SCRA benefits under a revised and broader definition of eligibility than previously required by the statute and regulatory guidance and to make changes to billing statements and late fee practices. These changes to billing statements and late fee practices have already been implemented. Solutions also decided to voluntarily make restitution of certain late fees to all other customers whose loans were neither owned nor originated by Sallie Mae Bank. They were calculated in the same manner as that which was required under the FDIC Orders and are estimated to be $42 million. The process to refund these fees as well as distribute amounts from the restitution fund is complete.
With respect to alleged civil violations of the SCRA, Solutions and Sallie Mae Bank entered into a consent order with the DOJ in May 2014. The DOJ consent order (the “DOJ Order”) covers all loans either owned by Sallie Mae Bank or serviced by Solutions from November 28, 2005 until the effective date of the settlement. The DOJ Order required Solutions to fund a $60 million settlement fund, which represents the total amount of compensation due to service members under the DOJ agreement, and to pay $55,000 in civil penalties. The DOJ Order was approved by the United States District Court in Delaware on September 29, 2014 and has a term of four years. Shortly thereafter, Navient funded the settlement fund and paid the civil money penalties pursuant to the terms of the order. The funds were disbursed beginning in the second quarter of 2015. In the third quarter of 2016, the Company completed the distributions from the fund by distributing the remaining funds to charities approved by the DOJ.
The total reserves established by the Company in 2013 and 2014 to cover these costs were $177 million, and as of December 31, 2016, substantially all of this amount had been paid or credited or refunded to customer accounts. The final cost of these proceedings will remain uncertain until all of the work under the various consent orders has been completed and the consent orders are lifted.
As previously disclosed, the Company and various of its subsidiaries have been subject to the following investigations and inquiries:
| • | In December 2013, Navient received Civil Investigative Demands (“CIDs”) issued by the State of Illinois Office of Attorney General and the State of Washington Office of the Attorney General and multiple other state Attorneys General. According to the CIDs, the investigations were initiated to ascertain whether any practices declared to be unlawful under the Consumer Fraud and Deceptive Business Practices Act have occurred or are about to occur. |
| • | In April 2014, Solutions received a CID from the CFPB as part of the CFPB’s separate investigation regarding allegations relating to Navient’s disclosures and assessment of late fees and other matters. Navient has received a series of supplemental CIDs on these matters. On August 19, 2015, Solutions |
34
Table of Contents
| received a letter from the CFPB notifying Solutions that, in accordance with the CFPB’s discretionary Notice and Opportunity to Respond and Advise (“NORA”) process, the CFPB’s Office of Enforcement is considering recommending that the CFPB take legal action against Solutions. The NORA letter relates to a previously disclosed investigation into Solutions’ disclosures and assessment of late fees and other matters and states that, in connection with any action, the CFPB may seek restitution, civil monetary penalties and corrective action against Solutions. The Company responded to the NORA letter on September 10, 2015. |
| • | In November 2014, Navient’s subsidiary, Pioneer Credit Recovery, Inc. (“Pioneer”), received a CID from the CFPB as part of the CFPB’s investigation regarding Pioneer’s activities relating to rehabilitation loans and collection of defaulted student debt. The CFPB has informed the Company that they have combined this matter with the aforementioned servicing matter. |
| • | In December 2014, Solutions received a subpoena from the New York Department of Financial Services (the “NY DFS”) as part of the NY DFS’s inquiry with regard to whether persons or entities have engaged in fraud or misconduct with respect to a financial product or service under New York Financial Services Law or other laws. |
On January 18, 2017, the CFPB and Attorneys General for the State of Illinois and the State of Washington (collectively the “Attorneys General”) initiated civil actions naming Navient Corporation and several of its subsidiaries as defendants alleging violations of Federal and State consumer protection statutes, including the Consumer Financial Protection Act of 2010, the Fair Credit Reporting Act, the Fair Debt Collection Practices Act and various state consumer protection laws. These civil actions are related to the aforementioned CIDs and the NORA letter that were previously issued by the CFPB and the Attorneys General. In addition to these matters, a number of lawsuits have been or may be filed by additional governmental or nongovernmental parties seeking damages or other remedies related to similar issues raised by the CFPB and the Attorneys General. As the Company has previously stated, we believe the suit improperly seeks to impose penalties on Navient based on new servicing standards applied retroactively and applied only against one servicer and that the allegations are false. We intend to vigorously defend against the allegations. At this point in time, the Company is unable to anticipate the timing of a resolution or the ultimate impact that these legal proceedings may have on the Company’s consolidated financial position, liquidity, results of operation or cash flows. As a result, it is not possible at this time to estimate a range of potential exposure, if any, for amounts that may be payable in connection with these matters and reserves have not been established. It is possible that an adverse ruling or rulings may have a material adverse impact on the Company.
In addition, Navient and its subsidiaries are subject to examination or regulation by the SEC, CFPB, FDIC, ED and various state agencies as part of its ordinary course of business. Items or matters similar to or different from those described above may arise during the course of those examinations. We also routinely receive inquiries or requests from various regulatory entities or bodies or government agencies concerning our business or our assets. The Company endeavors to cooperate with each such inquiry or request.
Under the terms of the Separation Agreement, Navient has agreed to indemnify SLM BankCo for all claims, actions, damages, losses or expenses that may arise from the conduct of all activities of pre-Spin-Off SLM BankCo occurring prior to the Spin-Off other than those specifically excluded in the Separation and Distribution Agreement. As a result, liabilities arising out of the regulatory matters and CFPB and State Attorneys General lawsuits mentioned above, other than fines or penalties directly levied against Sallie Mae Bank and other matters specifically excluded, are the responsibility of, or assumed by, Navient or one of its subsidiaries, and Navient has agreed to indemnify and hold harmless Sallie Mae and its subsidiaries, including Sallie Mae Bank, therefrom. Navient has no additional reserves related to indemnification matters with SLM BankCo as of December 31, 2016.
OIG Audit
The Office of the Inspector General (the “OIG”) of ED commenced an audit regarding Special Allowance Payments (“SAP”) on September 10, 2007. On September 25, 2013, we received the final audit determination of
35
Table of Contents
Federal Student Aid (the “Final Audit Determination”) on the final audit report issued by the OIG on August 3, 2009 related to this audit. The Final Audit Determination concurred with the final audit report issued by the OIG and instructed us to make adjustment to our government billing to reflect the policy determination. In August 2016, we filed our notice of appeal relating to this Final Audit Determination to the Administrative Actions and Appeals Service Group of ED. This matter remains open. We continue to believe that our SAP billing practices were proper, considering then-existing ED guidance and lack of applicable regulations. The Company established a reserve for this matter in 2014 as part of the total reserve for pending regulatory matters discussed previously and does not believe, at this time, that an adverse ruling would have a material effect on the Company as a whole.
| Item 4. | Mine Safety Disclosures |
N/A
36
Table of Contents
PART II.
| Item 5. | Market for Registrant’s Common Equity, Related Stockholder Matters and Issuer Purchases of Equity Securities |
Our common stock is listed and traded on the NASDAQ under the symbol NAVI. As of January 31, 2017, there were 291,008,528 shares of our common stock outstanding and 376 holders of record.
The following table presents the high and low sales prices for Navient’s common stock for each quarter within the two most recent fiscal years.
| Sales Price | ||||||||
| High | Low | |||||||
| 2016 |
||||||||
|
1st Quarter (January 1 — Mar 31, 2016) |
$ | 12.60 | $ | 8.20 | ||||
|
2nd Quarter (May 1 — Jun 30, 2016) |
14.00 | 11.01 | ||||||
|
3rd Quarter (Jul 1 — Sep 30, 2016) |
14.82 | 11.53 | ||||||
|
4th Quarter (Oct 1 — Dec 31, 2016) |
17.95 | 12.66 | ||||||
| 2015 |
||||||||
|
1st Quarter (January 1 — Mar 31, 2015) |
$ | 22.41 | $ | 17.16 | ||||
|
2nd Quarter (May 1 — Jun 30, 2015) |
20.95 | 18.09 | ||||||
|
3rd Quarter (Jul 1 — Sep 30, 2015) |
19.00 | 10.95 | ||||||
|
4th Quarter (Oct 1 — Dec 31, 2015) |
13.93 | 10.62 | ||||||
We paid quarterly cash dividends on our common stock of $0.16 per share for each quarter of 2015 and 2016.
Issuer Purchases of Equity Securities
The following table provides information relating to our purchases of shares of our common stock in the three months ended December 31, 2016.
| Total Number of Shares Purchased(1) |
Average Price Paid per Share |
Total Number
of Shares Purchased as Part of Publicly Announced Plans or Programs(2) |
Approximate
Dollar Value of Shares that May Yet Be Purchased Under Publicly Announced Plans or Programs(2) |
|||||||||||||
| (In millions, except per share data) |
||||||||||||||||
| Period: |
||||||||||||||||
| Oct 1 – Oct 31, 2016 |
7.8 | $ | 13.78 | 7.8 | $ | 73 | ||||||||||
| Nov 1 – Nov 30, 2016 |
5.3 | 15.59 | 4.7 | — | ||||||||||||
| Dec 1 – Dec 31, 2016 |
.1 | 16.80 | — | — | ||||||||||||
|
|
|
|
|
|
|
|||||||||||
| Total fourth quarter |
13.2 | $ | 14.53 | 12.5 | ||||||||||||
|
|
|
|
|
|
|
|||||||||||
| (1) | The total number of shares purchased includes: (i) shares purchased under the stock repurchase program discussed below and (ii) shares of our common stock tendered to us to satisfy the exercise price in connection with cashless exercise of stock options, and tax withholding obligations in connection with exercise of stock options and vesting of restricted stock and restricted stock units. |
| (2) | In 2015, our board of directors authorized us to purchase up to $1.7 billion of shares of our common stock. |
37
Table of Contents
Stock Performance
The following performance graph compares the monthly dollar change in our cumulative total shareholder return on our common stock to that of the S&P 500 Financials Index and the S&P 500 following the Spin-Off on April 30, 2014. The graph assumes a base investment of $100 at May 1, 2014 and reinvestment of dividends through December 31, 2016.
Cumulative Total Stockholder Return since Spin-Off
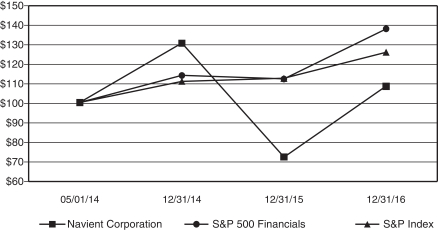
| Company/Index |
5/01/14 | 12/31/14 | 12/31/15 | 12/31/16 | ||||||||||||
| Navient Corporation |
$ | 100.0 | $ | 130.4 | $ | 72.1 | $ | 108.3 | ||||||||
| S&P 500 Financials Index |
100.0 | 113.9 | 112.1 | 137.7 | ||||||||||||
| S&P 500 |
100.0 | 110.9 | 112.4 | 125.8 | ||||||||||||
Source: Bloomberg Total Return Analysis
38
Table of Contents
| Item 6. | Selected Financial Data. |
Selected Financial Data 2012-2016
(Dollars in millions, except per share amounts)
The following table sets forth our selected financial and other operating information prepared in accordance with GAAP. The selected financial data in the table is derived from our consolidated financial statements. The data should be read in conjunction with the consolidated financial statements, related notes, and Item 7. “Management’s Discussion and Analysis of Financial Condition and Results of Operations.”
| 2016 | 2015 | 2014 | 2013 | 2012 | ||||||||||||||||
| Operating Data: |
||||||||||||||||||||
| Net interest income |
$ | 1,705 | $ | 2,221 | $ | 2,667 | $ | 3,167 | $ | 3,208 | ||||||||||
| Net income (loss) attributable to Navient Corporation: |
||||||||||||||||||||
| Continuing operations, net of tax |
$ | 681 | $ | 983 | $ | 1,137 | $ | 1,312 | $ | 941 | ||||||||||
| Discontinued operations, net of tax |
— | 1 | — | 106 | (2 | ) | ||||||||||||||
|
|
|
|
|
|
|
|
|
|
|
|||||||||||
| Net income (loss) attributable to Navient Corporation |
$ | 681 | $ | 984 | $ | 1,137 | $ | 1,418 | $ | 939 | ||||||||||
|
|
|
|
|
|
|
|
|
|
|
|||||||||||
| Basic earnings (loss) per common share attributable to Navient Corporation: |
||||||||||||||||||||
| Continuing operations |
$ | 2.15 | $ | 2.62 | $ | 2.71 | $ | 2.94 | $ | 1.93 | ||||||||||
| Discontinued operations |
— | — | — | .24 | — | |||||||||||||||
|
|
|
|
|
|
|
|
|
|
|
|||||||||||
| Total |
$ | 2.15 | $ | 2.62 | $ | 2.71 | $ | 3.18 | $ | 1.93 | ||||||||||
|
|
|
|
|
|
|
|
|
|
|
|||||||||||
| Diluted earnings (loss) per common share attributable to Navient Corporation: |
||||||||||||||||||||
| Continuing operations |
$ | 2.12 | $ | 2.58 | $ | 2.66 | $ | 2.89 | $ | 1.90 | ||||||||||
| Discontinued operations |
— | — | — | .23 | — | |||||||||||||||
|
|
|
|
|
|
|
|
|
|
|
|||||||||||
| Total |
$ | 2.12 | $ | 2.58 | $ | 2.66 | $ | 3.12 | $ | 1.90 | ||||||||||
|
|
|
|
|
|
|
|
|
|
|
|||||||||||
| Dividends per common share attributable to Navient Corporation common shareholders |
$ | .64 | $ | .64 | $ | .60 | $ | .60 | $ | .50 | ||||||||||
| Return on common stockholders’ equity |
18 | % | 25 | % | 26 | % | 29 | % | 21 | % | ||||||||||
| Net interest margin |
1.38 | 1.64 | 1.89 | 1.98 | 1.78 | |||||||||||||||
| Return on assets |
.55 | .73 | .80 | .89 | .52 | |||||||||||||||
| Dividend payout ratio |
30 | 25 | 23 | 19 | 26 | |||||||||||||||
| Average equity/average assets |
2.90 | 2.82 | 3.12 | 3.28 | 2.69 | |||||||||||||||
| Balance Sheet Data: |
||||||||||||||||||||
| Education loans, net |
$ | 111,070 | $ | 122,796 | $ | 134,241 | $ | 142,043 | $ | 162,546 | ||||||||||
| Total assets |
121,136 | 134,046 | 146,299 | 159,501 | 181,260 | |||||||||||||||
| Total borrowings |
114,702 | 127,403 | 139,529 | 150,443 | 172,257 | |||||||||||||||
| Total Navient Corporation stockholders’ equity |
3,699 | 3,909 | 4,144 | 5,595 | 5,060 | |||||||||||||||
| Book value per common share |
12.72 | 11.22 | 10.32 | 11.73 | 9.92 | |||||||||||||||
39
Table of Contents
| Item 7. | Management’s Discussion and Analysis of Financial Condition and Results of Operations |
The following discussion and analysis should be read in conjunction with our consolidated financial statements and related notes included elsewhere in this Annual Report on Form 10-K. This discussion and analysis also contains forward-looking statements and should also be read in conjunction with the disclosures and information contained in “Forward-Looking and Cautionary Statements” and Item 1A. “Risk Factors” in this Annual Report on Form 10-K.
Through this discussion and analysis, we intend to provide the reader with some narrative context for how our management views our consolidated financial statements, additional context within which to assess our operating results, and information on the quality and variability of our earnings, liquidity and cash flows.
Selected Historical Financial Information and Ratios
On April 30, 2014, the spin-off of Navient from SLM Corporation (the “Spin-Off”) was completed and Navient became an independent, publicly traded company focused on asset management and business processing services. Although SLM BankCo is the entity that distributed the shares of Navient common stock to SLM BankCo common stockholders, for financial reporting purposes, Navient is treated as the “accounting spinnor” and therefore Navient, and not SLM BankCo, is the “accounting successor” to SLM Corporation. Hence, the following GAAP financial information to the extent related to periods on or prior to April 30, 2014 reflects the historical results of operations and financial condition of SLM Corporation, which is the accounting predecessor of Navient. For a discussion of how “Core Earnings” results are different than GAAP results, see “‘Core Earnings’ — Definition and Limitations” and “Differences between ‘Core Earnings’ and GAAP.”
| Years Ended December 31, | ||||||||||||
| (In millions, except per share data) |
2016 | 2015 | 2014 | |||||||||
| GAAP Basis |
||||||||||||
| Net income attributable to Navient Corporation |
$ | 681 | $ | 984 | $ | 1,137 | ||||||
| Diluted earnings per common share attributable to Navient Corporation |
$ | 2.12 | $ | 2.58 | $ | 2.66 | ||||||
| Weighted average shares used to compute diluted earnings per share |
322 | 382 | 425 | |||||||||
| Net interest margin, FFELP Loans |
.98 | % | 1.22 | % | 1.30 | % | ||||||
| Net interest margin, Private Education Loans |
3.36 | % | 3.61 | % | 4.06 | % | ||||||
| Return on assets |
.55 | % | .73 | % | .80 | % | ||||||
| Ending FFELP Loans, net |
$ | 87,730 | $ | 96,402 | $ | 104,445 | ||||||
| Ending Private Education Loans, net |
23,340 | 26,394 | 29,796 | |||||||||
|
|
|
|
|
|
|
|||||||
| Ending total education loans, net |
$ | 111,070 | $ | 122,796 | $ | 134,241 | ||||||
|
|
|
|
|
|
|
|||||||
| Average FFELP Loans |
$ | 92,497 | $ | 100,421 | $ | 100,662 | ||||||
| Average Private Education Loans |
25,361 | 28,803 | 33,672 | |||||||||
|
|
|
|
|
|
|
|||||||
| Average total education loans |
$ | 117,858 | $ | 129,224 | $ | 134,334 | ||||||
|
|
|
|
|
|
|
|||||||
| “Core Earnings” Basis(1) |
||||||||||||
| Net income attributable to Navient Corporation |
$ | 587 | $ | 681 | $ | 806 | ||||||
| Diluted earnings per common share attributable to Navient Corporation |
$ | 1.82 | $ | 1.79 | $ | 1.90 | ||||||
| Weighted average shares used to compute diluted earnings per share |
322 | 382 | 425 | |||||||||
| Net interest margin, FFELP Loans |
.85 | % | .84 | % | .90 | % | ||||||
| Net interest margin, Private Education Loans |
3.41 | % | 3.67 | % | 3.94 | % | ||||||
| Return on assets |
.48 | % | .50 | % | .59 | % | ||||||
| Ending FFELP Loans, net |
$ | 87,730 | $ | 96,402 | $ | 104,445 | ||||||
| Ending Private Education Loans, net |
23,340 | 26,394 | 29,796 | |||||||||
|
|
|
|
|
|
|
|||||||
| Ending total education loans, net |
$ | 111,070 | $ | 122,796 | $ | 134,241 | ||||||
|
|
|
|
|
|
|
|||||||
| Average FFELP Loans |
$ | 92,497 | $ | 100,421 | $ | 100,202 | ||||||
| Average Private Education Loans |
25,361 | 28,803 | 31,243 | |||||||||
|
|
|
|
|
|
|
|||||||
| Average total education loans |
$ | 117,858 | $ | 129,224 | $ | 131,445 | ||||||
|
|
|
|
|
|
|
|||||||
| (1) | “Core Earnings” are non-GAAP financial measures and do not represent a comprehensive basis of accounting. For a greater explanation of “Core Earnings,” see the section titled “‘Core Earnings’ — Definition and Limitations” and subsequent sections. |
40
Table of Contents
Overview
The following discussion and analysis presents a review of our business and operations as of and for the year ended December 31, 2016.
We monitor and assess our ongoing operations and results based on the following four reportable segments: (1) FFELP Loans (2) Private Education Loans, (3) Business Services and (4) Other. Our segment presentation excludes the results of SLM BankCo distributed on April 30, 2014. See “‘Core Earnings’ — Definition and Limitations” for further discussion.
FFELP Loans Segment
In the FFELP Loans segment, we acquire and finance FFELP Loans. Although FFELP Loans are no longer originated, we continue to pursue acquisitions of FFELP Loan portfolios. These acquisitions leverage our servicing scale and generate incremental earnings and cash flow. In this segment, we generate revenue primarily through net interest income on the FFELP Loan portfolio (after provision for loan losses). This segment is expected to generate significant amounts of earnings and cash flow as the portfolio amortizes.
Private Education Loans Segment
In this segment, we acquire, finance, and service our Private Education Loans. Private Education Loans primarily bridge the gap between the cost of higher education and the amount funded through financial aid, federal loans. or students’ and families’ resources. They also allow borrowers to refinance existing education loans at a lower rate. We pursue acquisitions of Private Education Loan portfolios. These acquisitions leverage our servicing scale and generate incremental earnings and cash flow. In this segment, we generate revenue primarily through net interest income on the Private Education Loan portfolio (after provision for loan losses). This segment is expected to generate significant amounts of earnings and cash flow as the portfolio amortizes.
Business Services Segment
Our Business Services segment generates revenue from business processing services related to servicing, asset recovery and other business processing activities. Within this segment, we generate revenue primarily through servicing our FFELP Loan portfolio as well as servicing education loans for Guarantors of FFELP Loans and other institutions, including ED. We provide asset recovery services for loans and receivables on behalf of Guarantors of FFELP Loans and higher education institutions. In addition, we provide asset recovery and other business processing services for federal, state, court, and municipal clients, public authorities, and health care organizations.
Other
Our Other segment primarily consists of activities of our holding company, including the repurchase of debt, our corporate liquidity portfolio, unallocated overhead and regulatory-related costs. We also include results from certain smaller wind-down operations within this segment.
Key Financial Measures
Our operating results are primarily driven by net interest income, provisions for loan losses and expenses incurred in our education loan portfolios; the revenues and expenses generated by our servicing, asset recovery and business processing businesses; and gains and losses on loan sales and debt repurchases. A brief summary of our key financial measures are listed below.
Net Interest Income
The most significant portion of our earnings is generated by the spread earned between the interest income we receive on assets in our education loan portfolios and the interest expense on debt funding these loans. We report these earnings as net interest income. Net interest income in our FFELP Loans and Private Education Loans segments are driven by significantly different factors.
41
Table of Contents
FFELP Loans Segment
Net interest income will be the primary source of net income generated by this segment as this portfolio will have an amortization period in excess of 20 years and a 7-year remaining weighted average life. Interest earned on our FFELP Loans is primarily indexed to one-month LIBOR and our cost of funds is primarily indexed to rates other than one-month LIBOR, creating the possibility of basis and repricing risk related to these assets. The FFELP Loans segment’s “Core Earnings” net interest margin was 0.85 percent in 2016 compared with 0.84 percent in 2015. At December 31, 2016, 81 percent of our FFELP Loan portfolio was funded to term with non-recourse, long-term securitization debt. As of December 31, 2016, we had $87.7 billion of FFELP Loans outstanding, compared with $96.4 billion outstanding at December 31, 2015.
A source of variability in net interest income could be Floor Income we earn on certain FFELP Loans. Pursuant to the terms of the FFELP, certain FFELP Loans can earn interest at the stated fixed rate of interest as underlying debt interest rate expense remains variable. We refer to this additional spread income as “Floor Income.” Floor Income can be volatile since it is dependent on interest rate levels. We frequently hedge this volatility with derivatives which lock in the value of the Floor Income over the term of the contract.
Private Education Loans Segment
Net interest income will be the primary source of net income generated by this segment as this portfolio will have an amortization period in excess of 20 years and a 6-year remaining weighted average life. Interest earned on our Private Education Loans is generally indexed to either Prime or one-month LIBOR rates and our cost of funds is primarily indexed to one-month or three-month LIBOR, creating the possibility of basis and repricing risk related to these assets. The Private Education Loans segment’s “Core Earnings” net interest margin was 3.41 percent in 2016 compared with 3.67 percent in 2015. At December 31, 2016, 61 percent of our Private Education Loan portfolio was funded to term with non-recourse, long-term securitization debt. As of December 31, 2016, we had $23.3 billion of Private Education Loans outstanding, compared with $26.4 billion outstanding at December 31, 2015.
Provisions for Loan Losses
Management estimates and maintains an allowance for loan losses at a level sufficient to cover charge-offs expected over the next two years, plus an additional allowance to cover life-of-loan expected losses for loans classified as a troubled debt restructuring (“TDR”). The provision for loan losses increases the related allowance for loan losses. Generally, the provision for loan losses rises when future charge-offs are expected to increase and falls when future charge-offs are expected to decline. Our loss exposure and resulting provision for loan losses is small for FFELP Loans because we generally bear a maximum of 3 percent loss exposure on defaults. We bear the full credit exposure on our Private Education Loans. Our provision for loan losses in our FFELP Loans segment was $43 million in 2016 compared with $46 million in 2015. Losses in our Private Education Loans segment are determined by risk characteristics, such as school type, loan status (in-school, grace, forbearance, repayment and delinquency), loan seasoning (number of months a payment has been made by a customer), underwriting criteria (e.g., credit scores), existence of a cosigner and the current economic environment. Our provision for loan losses in our Private Education Loans segment was $383 million in 2016 compared with $538 million in 2015.
Charge-Offs and Delinquencies
When we conclude a loan is uncollectible, the unrecoverable portion of the loan is charged against the allowance for loan losses in the applicable segment. Charge-off data provides relevant information with respect to the performance of our loan portfolios. Management focuses on delinquencies as well as the progression of loans from early to late stage delinquency. In the second quarter of 2015, we changed our assumptions related to estimated recoveries and as a result, the portion of the Private Education Loan amount charged off at default increased from 73 percent to 79 percent. This change resulted in a $330 million reduction to the balance of the
42
Table of Contents
receivable for partially charged-off loans. Excluding this amount, the Private Education Loans segment’s charge-offs decreased to $513 million in 2016, down $146 million from $659 million in 2015. Delinquencies are a very important indicator of the potential future credit performance. Private Education Loan delinquencies decreased to $1.64 billion in 2016, down $127 million from $1.77 billion in 2015. The FFELP Loans segment’s charge-offs decreased to $54 million in 2016 compared with $61 million in 2015.
Servicing, Asset Recovery and Business Processing Revenues
We earn servicing revenues from servicing education loans which is primarily driven by the underlying volume of loans we are servicing on behalf of others. We earn asset recovery revenue primarily related to default aversion and post-default collection work we perform on education loans and on various receivables on behalf of our federal, state, court and municipal clients. The fees we recognize are primarily driven by our success in collecting or rehabilitating defaulted or delinquent loans and receivables. We also earn business processing revenue related to transaction processing we perform on behalf of our municipal, public authority and health care clients. The fees we recognize are primarily driven by the number of transactions processed.
Other Income / (Loss)
In managing our loan portfolios and funding sources, we periodically engage in sales of loans and the repurchase of our outstanding debt. In each case, depending on market conditions, we may incur gains or losses from these transactions that affect our results from operations.
Operating Expenses
The operating expenses reported for our Private Education Loans and Business Services segments are those that are directly attributable to the generation of revenues by those segments. The operating expenses for the FFELP Loans segment primarily represent an intercompany servicing charge from the Business Services segment and do not reflect our actual underlying costs incurred to service the loans. We have included unallocated corporate overhead expenses and certain information technology costs (together referred to as “Overhead”) as well as regulatory-related costs in our Other segment rather than allocate those expenses by segment. Overhead expenses include executive management, the board of directors, accounting, finance, legal, human resources, stock-based compensation expense and certain information technology and infrastructure costs. Regulatory-related costs include actual settlement amounts as well as third-party professional fees we incur in connection with regulatory matters.
“Core Earnings”
We report financial results on a GAAP basis and also present certain “Core Earnings” performance measures. Our management, equity investors, credit rating agencies and debt capital providers use these “Core Earnings” measures to monitor our business performance. “Core Earnings” is the basis in which we prepare our segment disclosures as required by GAAP under ASC 280, “Segment Reporting” (see “Note 15 — Segment Reporting”). For a full explanation of the contents and limitations of “Core Earnings,” see the section titled “‘Core Earnings’ — Definition and Limitations” of this Item 7.
2016 Summary of Results
2016 GAAP net income was $681 million ($2.12 diluted earnings per share), versus net income of $984 million ($2.58 diluted earnings per share) in the prior year. The changes in GAAP net income are impacted by the same “Core Earnings” items discussed below, as well as changes in net income attributable to (1) restructuring and reorganization expense incurred in connection with the spin-off of Navient from SLM Corporation on April 30, 2014, (2) unrealized, mark-to-market gains/losses on derivatives and (3) goodwill and acquired intangible asset amortization and impairment. These items are recognized in GAAP but have not been included in “Core Earnings” results. In 2016, GAAP results included gains of $212 million from derivative
43
Table of Contents
accounting treatment that are excluded from “Core Earnings” results, compared with gains of $543 million in the prior year. See “‘Core Earnings’ — Definition and Limitations — Differences between ‘Core Earnings’ and GAAP” for a complete reconciliation between GAAP net income and “Core Earnings.”
“Core Earnings” for the year were $587 million ($1.82 diluted core earnings per share), compared with $681 million ($1.79 diluted core earnings per share) for 2015. Full-year 2016 and 2015 diluted “Core Earnings” per share were $1.86 and $1.82, respectively, excluding regulatory-related costs of $17 million and $19 million, respectively.
During 2016, we:
| • | acquired $3.7 billion of education loans; |
| • | issued $5.8 billion of FFELP asset-backed securities (“ABS”), and $488 million of Private Education Loan ABS; |
| • | closed on a $478 million Private Education Loan ABS Repurchase Facility; |
| • | increased our FFELP asset-backed commercial paper (“ABCP”) facility from $7.0 billion to $7.5 billion and extended its maturity date from March 2017 to March 2018; |
| • | extended our Private Education Loan ABCP facility from June 2016 to June 2017; the maximum financing amount decreased to $750 million from $1 billion; |
| • | issued $1.3 billion in unsecured debt; |
| • | retired or repurchased $2.6 billion of our senior unsecured debt; |
| • | repurchased 60 million common shares for $755 million; |
| • | paid $201 million in common dividends; and |
| • | authorized $600 million to be utilized in a new share repurchase program effective January 1, 2017. |
Results of Operations
We present the results of operations below first on a consolidated basis in accordance with GAAP. Following our discussion of consolidated earnings results on a GAAP basis, we present our results on a segment basis. We have four business segments: FFELP Loans, Private Education Loans, Business Services and Other. Since these segments operate in distinct business environments and we manage and evaluate the financial performance of these segments using non-GAAP financial measures, these segments are presented on a “Core Earnings” basis (see “‘Core Earnings’ — Definition and Limitations”).
44
Table of Contents
GAAP Consolidated Statements of Income
| Increase (Decrease) | ||||||||||||||||||||||||||||
| Years Ended December 31, | 2016 vs. 2015 | 2015 vs. 2014 | ||||||||||||||||||||||||||
| (Dollars in millions, except per share amounts) |
2016 | 2015 | 2014 | $ | % | $ | % | |||||||||||||||||||||
| Interest income |
||||||||||||||||||||||||||||
| FFELP Loans |
$ | 2,528 | $ | 2,524 | $ | 2,556 | $ | 4 | — | % | $ | (32 | ) | (1 | )% | |||||||||||||
| Private Education Loans |
1,587 | 1,756 | 2,156 | (169 | ) | (10 | ) | (400 | ) | (19 | ) | |||||||||||||||||
| Other loans |
9 | 7 | 9 | 2 | 29 | (2 | ) | (22 | ) | |||||||||||||||||||
| Cash and investments |
22 | 8 | 9 | 14 | 175 | (1 | ) | (11 | ) | |||||||||||||||||||
|
|
|
|
|
|
|
|
|
|
|
|
|
|
|
|||||||||||||||
| Total interest income |
4,146 | 4,295 | 4,730 | (149 | ) | (3 | ) | (435 | ) | (9 | ) | |||||||||||||||||
| Total interest expense |
2,441 | 2,074 | 2,063 | 367 | 18 | 11 | 1 | |||||||||||||||||||||
|
|
|
|
|
|
|
|
|
|
|
|
|
|
|
|||||||||||||||
| Net interest income |
1,705 | 2,221 | 2,667 | (516 | ) | (23 | ) | (446 | ) | (17 | ) | |||||||||||||||||
| Less: provisions for loan losses |
429 | 581 | 647 | (152 | ) | (26 | ) | (66 | ) | (10 | ) | |||||||||||||||||
|
|
|
|
|
|
|
|
|
|
|
|
|
|
|
|||||||||||||||
| Net interest income after provisions for loan losses |
1,276 | 1,640 | 2,020 | (364 | ) | (22 | ) | (380 | ) | (19 | ) | |||||||||||||||||
| Other income (loss): |
||||||||||||||||||||||||||||
| Servicing revenue |
304 | 340 | 298 | (36 | ) | (11 | ) | 42 | 14 | |||||||||||||||||||
| Asset recovery and business processing revenue |
390 | 367 | 388 | 23 | 6 | (21 | ) | (5 | ) | |||||||||||||||||||
| Other income |
7 | 17 | 82 | (10 | ) | (59 | ) | (65 | ) | (79 | ) | |||||||||||||||||
| Losses on sales of loans and investments |
— | (9 | ) | — | 9 | (100 | ) | (9 | ) | (100 | ) | |||||||||||||||||
| Gains on debt repurchases |
1 | 21 | — | (20 | ) | (95 | ) | 21 | 100 | |||||||||||||||||||
| Gains (losses) on derivative and hedging activities, net |
117 | 166 | 139 | (49 | ) | (30 | ) | 27 | 19 | |||||||||||||||||||
|
|
|
|
|
|
|
|
|
|
|
|
|
|
|
|||||||||||||||
| Total other income |
819 | 902 | 907 | (83 | ) | (9 | ) | (5 | ) | (1 | ) | |||||||||||||||||
| Expenses: |
||||||||||||||||||||||||||||
| Operating expenses |
951 | 918 | 987 | 33 | 4 | (69 | ) | (7 | ) | |||||||||||||||||||
| Goodwill and acquired intangible assets impairment and amortization expense |
36 | 12 | 9 | 24 | 200 | 3 | 33 | |||||||||||||||||||||
| Restructuring and other reorganization expenses |
— | 32 | 113 | (32 | ) | (100 | ) | (81 | ) | (72 | ) | |||||||||||||||||
|
|
|
|
|
|
|
|
|
|
|
|
|
|
|
|||||||||||||||
| Total expenses |
987 | 962 | 1,109 | 25 | 3 | (147 | ) | (13 | ) | |||||||||||||||||||
| Income from continuing operations, before income tax expense |
1,108 | 1,580 | 1,818 | (472 | ) | (30 | ) | (238 | ) | (13 | ) | |||||||||||||||||
| Income tax expense |
427 | 597 | 681 | (170 | ) | (28 | ) | (84 | ) | (12 | ) | |||||||||||||||||
|
|
|
|
|
|
|
|
|
|
|
|
|
|
|
|||||||||||||||
| Net income from continuing operations |
681 | 983 | 1,137 | (302 | ) | (31 | ) | (154 | ) | (14 | ) | |||||||||||||||||
| Income from discontinued operations, net of tax expense |
— | 1 | — | (1 | ) | (100 | ) | 1 | 100 | |||||||||||||||||||
|
|
|
|
|
|
|
|
|
|
|
|
|
|
|
|||||||||||||||
| Net income |
681 | 984 | 1,137 | (303 | ) | (31 | ) | (153 | ) | (13 | ) | |||||||||||||||||
| Less: net income (loss) attributable to noncontrolling interest |
— | — | — | — | — | — | — | |||||||||||||||||||||
|
|
|
|
|
|
|
|
|
|
|
|
|
|
|
|||||||||||||||
| Net income attributable to Navient Corporation |
681 | 984 | 1,137 | (303 | ) | (31 | ) | (153 | ) | (13 | ) | |||||||||||||||||
| Preferred stock dividends |
— | — | 6 | — | — | (6 | ) | (100 | ) | |||||||||||||||||||
|
|
|
|
|
|
|
|
|
|
|
|
|
|
|
|||||||||||||||
| Net income attributable to Navient Corporation common stock |
$ | 681 | $ | 984 | $ | 1,131 | $ | (303 | ) | (31 | )% | $ | (147 | ) | (13 | )% | ||||||||||||
|
|
|
|
|
|
|
|
|
|
|
|
|
|
|
|||||||||||||||
| Basic earnings per common share attributable to Navient Corporation |
$ | 2.15 | $ | 2.62 | $ | 2.71 | $ | (.47 | ) | (18 | )% | $ | (.09 | ) | (3 | )% | ||||||||||||
|
|
|
|
|
|
|
|
|
|
|
|
|
|
|
|||||||||||||||
| Diluted earnings per common share attributable to Navient Corporation |
$ | 2.12 | $ | 2.58 | $ | 2.66 | $ | (.46 | ) | (18 | )% | $ | (.08 | ) | (3 | )% | ||||||||||||
|
|
|
|
|
|
|
|
|
|
|
|
|
|
|
|||||||||||||||
| Dividends per common share |
$ | .64 | $ | .64 | $ | .60 | $ | — | — | % | $ | .04 | 7 | % | ||||||||||||||
|
|
|
|
|
|
|
|
|
|
|
|
|
|
|
|||||||||||||||
Consolidated Earnings Summary — GAAP basis
Year Ended December 31, 2016 Compared with Year Ended December 31, 2015
For the year ended December 31, 2016, net income was $681 million, or $2.12 diluted earnings per common share, compared with net income of $984 million, or $2.58 diluted earnings per common share, for the year ended December 31, 2015. The decrease in diluted earnings per share was primarily due to a $516 million
45
Table of Contents
decrease in net interest income, a $49 million decrease in net gains on derivative and hedging activities, a $36 million decrease in servicing revenue, a $33 million increase in operating expenses, a $20 million decrease in gains on debt repurchases and a $10 million decrease in other income. This was partially offset by a $152 million decrease in the provision for loan losses, a $32 million decrease in restructuring and other reorganization expenses, a $23 million increase in asset recovery and business processing revenue, a $9 million decrease in losses on sales of loans and investments and fewer shares outstanding due to common share repurchases.
The primary contributors to each of the identified drivers of changes in net income for the year ended December 31, 2016 compared with the year ended December 31, 2015 are as follows:
| • | Net interest income decreased by $516 million, primarily as a result of the amortization of the education loan balance and a decline in the net interest margin. The decline in net interest margin was primarily due to higher funding credit spreads and a widening of the asset and related funding interest rate indices. |
| • | Provisions for loan losses decreased $152 million from the year-ago period, primarily related to the provision for Private Education Loan losses. The provision for Private Education Loan losses was $383 million in 2016, down $155 million from 2015 due to a 12 percent decrease in Private Education Loans outstanding and a $127 million reduction in delinquent loans compared to the year-ago period. The provision for loan losses was elevated in the year-ago period due to an increase in the amount of loans exiting deferment status in 2014 over prior years and those loans experiencing unfavorable credit trends compared to loans that exited deferment in prior years. These factors led to decreases in expected future charge-offs. |
| • | Servicing revenue decreased by $36 million primarily due to a benefit recorded in the year-ago period as a result of increasing our recovery expectation on previously assessed servicing fees. |
| • | Asset recovery and business processing revenue increased $23 million. This increase was primarily due to additional revenue from Gila LLC (acquired in February 2015) and from Xtend Healthcare (acquired in October 2015), which was offset by a reduction in revenue related to a decrease in education loan-related asset recovery volume. |
| • | Other income decreased $10 million primarily due to a reduction in foreign currency translation gains. The foreign currency translation gains relate to a portion of our foreign currency denominated debt that does not receive hedge accounting treatment. These gains were partially offset by the “gains (losses) on derivative and hedging activities, net” line item on the income statement related to the derivatives used to economically hedge these debt instruments. |
| • | Losses on sales of loans and investments decreased $9 million due to a $21 million loss on the sale of $178 million of Private Education Loans in 2015, partially offset by a $12 million gain on the sale of $412 million of FFELP Loans in 2015. There were no sales in 2016. |
| • | Gains on debt repurchases decreased $20 million. Debt repurchase activity will fluctuate based on market fundamentals and our liability management strategy. As a result, gains or losses on our debt repurchase activity may vary in future periods. |
| • | Net gains on derivative and hedging activities decreased $49 million. The primary factors affecting the change were interest rate and foreign currency fluctuations, which primarily affected the valuations of our Floor Income Contracts, basis swaps and foreign currency hedges during each period. Valuations of derivative instruments fluctuate based upon many factors including changes in interest rates, credit risk, foreign currency fluctuations and other market factors. As a result, net gains and losses on derivative and hedging activities may vary significantly in future periods. |
| • | In 2016 and 2015, we recorded regulatory-related costs of $17 million and $19 million, respectively. Excluding these regulatory-related costs, operating expenses were $934 million in 2016, a $35 million increase from 2015. This increase was primarily due to an increase in operating costs related to Gila LLC (acquired in February 2015) and to Xtend Healthcare (acquired in October 2015), as well as an increase in |
46
Table of Contents
| legal contingency expense of approximately $25 million in 2016. These increases were partially offset by a general reduction in costs primarily related to operating efficiency initiatives as well as reduced education loan-related asset recovery volumes. |
| • | Goodwill and acquired intangible asset impairment and amortization expense increased $24 million primarily as a result of the intangible assets and related amortization from our acquisitions of Gila LLC and Xtend Healthcare. |
| • | Restructuring and other reorganization expenses decreased $32 million, from $32 million to $0 million. During the second-quarter 2015, the Company launched a restructuring initiative to simplify and streamline its management structure post-Spin-Off to improve the operating efficiency and effectiveness of the organization, and as a result recorded $29 million of restructuring expense primarily related to expected severance and other related costs. |
We repurchased 59.6 million shares and 56.0 million shares of our common stock during the years ended December 31, 2016 and 2015, respectively, as part of our common share repurchase program. Primarily as a result of ongoing common share repurchases, our average outstanding diluted shares decreased by 60 million common shares (or 16 percent) from the year-ago period.
Year Ended December 31, 2015 Compared with Year Ended December 31, 2014
For the year ended December 31, 2015, net income was $984 million, or $2.58 diluted earnings per common share, compared with net income of $1.1 billion, or $2.66 diluted earnings per common share, for the year ended December 31, 2014. The decrease in net income was primarily due to a $446 million decline in net interest income, a $65 million decrease in other income, and a $21 million decrease in asset recovery and business processing revenue. This was partially offset by an $81 million decrease in restructuring and other reorganization expenses, a $69 million decrease in operating expenses, a $66 million decrease in the provision for loan losses, a $42 million increase in servicing revenue, a $27 million increase in net gains on derivative and hedging activities, and a $21 million increase in gains on debt repurchases.
The primary contributors to each of the identified drivers of changes in net income for the current year-end period compared with the year-ago period are as follows:
| • | Net interest income decreased by $446 million, of which $186 million related to the deemed distribution of SLM BankCo on April 30, 2014. Also contributing to the decrease was a reduction in Private Education Loan net interest income due to a decline in the loan balance and net interest margin, as well as a reduction in the net interest margin on the FFELP Loans. |
| • | Provisions for loan losses declined $66 million, of which $49 million related to the deemed distribution of SLM BankCo on April 30, 2014. |
| • | Servicing revenue increased $42 million primarily as a result of increasing our recovery expectation on previously assessed late fees, as well as a general increase in third-party servicing revenue, primarily related to servicing for ED. |
| • | Asset recovery and business processing revenue decreased $21 million primarily as a result of the Bipartisan Budget Act (the “Budget Act”) enacted on December 26, 2013 and effective on July 1, 2014, which reduced the amount paid to Guarantor agencies for defaulted FFELP Loans that are rehabilitated. This legislative reduction in fees represents $79 million of the decrease in asset recovery and business processing revenue. This reduction was partially offset by $69 million of additional revenue from Gila LLC, acquired in February 2015, and Xtend Healthcare, acquired in October 2015. |
| • | Other income decreased $65 million due in part to a reduction in foreign currency translation gains. The foreign currency translation gains relate to a portion of our foreign currency denominated debt that does not receive hedge accounting treatment. These gains were partially offset by the “gains (losses) on derivative and hedging activities, net” line item on the income statement related to the derivatives used to economically hedge these debt instruments. |
47
Table of Contents
| • | Losses on sales of loans and investments increased $9 million due to a $21 million loss on the sale of $178 million of Private Education Loans, partially offset by $12 million in gains on the sale of $412 million of FFELP Loans. There were no loan sales in the prior year. |
| • | Gains on debt repurchases increased $21 million. Debt repurchase activity will fluctuate based on market fundamentals and our liability management strategy. |
| • | Net gains on derivative and hedging activities increased $27 million. The primary factors affecting the change were interest rate and foreign currency fluctuations, which primarily affected the valuations of our Floor Income Contracts, basis swaps and foreign currency hedges during each period. Valuations of derivative instruments fluctuate based upon many factors including changes in interest rates, credit risk, foreign currency fluctuations and other market factors. As a result, net gains and losses on derivative and hedging activities may continue to vary significantly in future periods. |
| • | In 2015 and 2014, we recorded $19 million and $112 million, respectively, of regulatory-related costs. Excluding these expenses, operating expenses increased $24 million. This increase was primarily due to operating costs related to Gila LLC, which was acquired in February 2015, and to Xtend Healthcare, which was acquired in October 2015, and incremental third-party servicing expenses related to an $8.5 billion loan acquisition in fourth-quarter 2014 (including $11 million of one-time conversion costs to move $4.9 billion of FFELP Loans to our servicing system). This was partially offset by $63 million related to the deemed distribution of SLM BankCo on April 30, 2014. |
| • | Restructuring and other reorganization expenses decreased $81 million, from $113 million to $32 million. The year-ago period’s expenses were primarily related to third-party costs incurred in connection with the Spin-Off. In second-quarter 2015, the Company launched a restructuring initiative to simplify and streamline its management structure post-Spin-Off to improve the operating efficiency and effectiveness of the organization, and as a result recorded $29 million of restructuring expense primarily related to expected severance and other related costs. |
We repurchased 56.0 million shares and 30.4 million shares of our common stock during the years ended December 31, 2015 and 2014, respectively, as part of our common share repurchase program. Primarily as a result of ongoing common share repurchases, our average outstanding diluted shares decreased by 43 million common shares (or 10 percent) from the year-ago period.
48
Table of Contents
Correction of an Immaterial Error in Prior Periods Related to FFELP Provision for Loan Losses
Under the FFELP, in the event of a borrower default, the principal balance and all unpaid accrued interest on FFELP Loans is insured for 97 percent to 100 percent of the defaulted amount. Under certain circumstances, FFELP Loans can lose their government insurance. In these cases, within our servicing systems these loans are assigned a “Permanently Uninsured” status code. When FFELP Loans become permanently uninsured, they no longer have the protection of government insurance and the owner of such loans is exposed to 100 percent of losses upon default. In the fourth quarter of 2016, the Company identified a portfolio of Permanently Uninsured FFELP Loans ($105 million as of December 31, 2015) that were correctly charged off in prior periods. Subsequent to the charge off, these loans were incorrectly accounted for as a recovery of previously defaulted loans as a result of the incorrect application of a system data field. This error understated the previously reported net charge-offs and provision for loan losses in 2015 and earlier years. The impact of this error to all prior periods was not material. The Company has revised the prior periods contained in this Form 10-K to correct this error. The table below shows the impact of this error to the years ended December 31, 2015 and 2014.
| (Dollars in millions) |
Year Ended December 31, 2015 |
Year Ended December 31, 2014 |
||||||
| Increase to FFELP Loan charge-offs and provision for loan losses(1) |
$ | 20 | $ | 19 | ||||
| After-tax reduction to net income from increase in FFELP Loan provision for loan losses |
$ | (13 | ) | $ | (12 | ) | ||
| Reduction to diluted earnings per share from increase in FFELP Loan provision for loan losses |
$ | (.03 | ) | $ | (.03 | ) | ||
| GAAP net income — previously reported |
$ | 997 | $ | 1,149 | ||||
| GAAP net income — revised |
$ | 984 | $ | 1,137 | ||||
| “Core Earnings” net income — previously reported |
$ | 694 | $ | 818 | ||||
| “Core Earnings” net income — revised |
$ | 681 | $ | 806 | ||||
| (1) | In 2015 and 2014, $20 million and $19 million of FFELP Permanently Uninsured Loans, respectively, were incorrectly classified as a recovery of previously defaulted loans, which understated the net charge-offs and provision for loan losses reported for FFELP Loans. The revised results correct for this error and result in $20 million and $19 million of additional FFELP Loan charge-offs and provision for loan losses being recorded in 2015 and 2014, respectively. There were $66 million of FFELP Permanently Uninsured Loans in years prior to 2014 that were incorrectly classified as a recovery of previously defaulted loans. The impact to each of the periods prior to 2014 was not material. Retained earnings were reduced by $42 million (after tax) as of December 31, 2013, to correct for this error. |
“Core Earnings” — Definition and Limitations
We prepare financial statements and present financial results in accordance with GAAP. However, we also evaluate our business segments and present financial results on a basis that differs from GAAP. We refer to this different basis of presentation as “Core Earnings.” We provide this “Core Earnings” basis of presentation on a consolidated basis for each business segment because this is what we review internally when making management decisions regarding our performance and how we allocate resources. We also refer to this information in our presentations with credit rating agencies, lenders and investors. Because our “Core Earnings” basis of presentation corresponds to our segment financial presentations, we are required by GAAP to provide “Core Earnings” disclosure in the notes to our consolidated financial statements for our business segments.
“Core Earnings” are not a substitute for reported results under GAAP. We use “Core Earnings” to manage each business segment because “Core Earnings” reflect adjustments to GAAP financial results for three items, discussed below, that are either related to the Spin-Off or create significant volatility mostly due to timing factors generally beyond the control of management. Accordingly, we believe that “Core Earnings” provide management with a useful basis from which to better evaluate results from ongoing operations against the business plan or against results from prior periods. Consequently, we disclose this information because we believe it provides investors with additional information regarding the operational and performance indicators that are most closely
49
Table of Contents
assessed by management. When compared to GAAP results, the three items we remove to result in our “Core Earnings” presentations are:
| 1. | The financial results attributable to the operations of SLM BankCo prior to the Spin-Off and related restructuring and reorganization expense incurred in connection with the Spin-Off, including the restructuring expenses related to the restructuring initiative launched in second-quarter 2015 to simplify and streamline the Company’s management structure post-Spin-Off. For GAAP purposes, Navient reflected the deemed distribution of SLM BankCo on April 30, 2014. For “Core Earnings,” we exclude the consumer banking business (SLM BankCo) as if it had never been a part of Navient’s historical results prior to the deemed distribution of SLM BankCo on April 30, 2014; |
| 2. | Unrealized mark-to-market gains/losses resulting from our use of derivative instruments to hedge our economic risks that do not qualify for hedge accounting treatment or do qualify for hedge accounting treatment but result in ineffectiveness; and |
| 3. | The accounting for goodwill and acquired intangible assets. |
While GAAP provides a uniform, comprehensive basis of accounting, for the reasons described above, our “Core Earnings” basis of presentation does not. “Core Earnings” are subject to certain general and specific limitations that investors should carefully consider. For example, there is no comprehensive, authoritative guidance for management reporting. Our “Core Earnings” are not defined terms within GAAP and may not be comparable to similarly titled measures reported by other companies. Accordingly, our “Core Earnings” presentation does not represent a comprehensive basis of accounting. Investors, therefore, may not be able to compare our performance with that of other financial services companies based upon “Core Earnings.” “Core Earnings” results are only meant to supplement GAAP results by providing additional information regarding the operational and performance indicators that are most closely used by management, our board of directors, credit rating agencies, lenders and investors to assess performance.
50
Table of Contents
The following tables show “Core Earnings” for each business segment and our business as a whole along with the adjustments made to the income/expense items to reconcile the amounts to our reported GAAP results as required by GAAP and reported in “Note 15 — Segment Reporting.”
| Year Ended December 31, 2016 | ||||||||||||||||||||||||||||||||||||||||
| (Dollars in millions) |
FFELP Loans |
Private Education Loans |
Business Services |
Other | Eliminations(1) | Total “Core Earnings” |
Adjustments | Total GAAP |
||||||||||||||||||||||||||||||||
| Reclassifications | Additions/ (Subtractions) |
Total Adjustments(2) |
||||||||||||||||||||||||||||||||||||||
| Interest income: |
||||||||||||||||||||||||||||||||||||||||
| Education loans |
$ | 2,395 | $ | 1,587 | $ | — | $ | — | $ | — | $ | 3,982 | $ | 247 | $ | (114 | ) | $ | 133 | $ | 4,115 | |||||||||||||||||||
| Other loans |
— | — | — | 9 | — | 9 | — | — | — | 9 | ||||||||||||||||||||||||||||||
| Cash and investments |
16 | 2 | — | 4 | — | 22 | — | — | — | 22 | ||||||||||||||||||||||||||||||
|
|
|
|
|
|
|
|
|
|
|
|
|
|
|
|
|
|
|
|
|
|||||||||||||||||||||
| Total interest income |
2,411 | 1,589 | — | 13 | — | 4,013 | 247 | (114 | ) | 133 | 4,146 | |||||||||||||||||||||||||||||
| Total interest expense |
1,592 | 705 | — | 113 | — | 2,410 | 31 | — | 31 | 2,441 | ||||||||||||||||||||||||||||||
|
|
|
|
|
|
|
|
|
|
|
|
|
|
|
|
|
|
|
|
|
|||||||||||||||||||||
| Net interest income (loss) |
819 | 884 | — | (100 | ) | — | 1,603 | 216 | (114 | ) | 102 | 1,705 | ||||||||||||||||||||||||||||
| Less: provisions for loan losses |
43 | 383 | — | 3 | — | 429 | — | — | — | 429 | ||||||||||||||||||||||||||||||
|
|
|
|
|
|
|
|
|
|
|
|
|
|
|
|
|
|
|
|
|
|||||||||||||||||||||
| Net interest income (loss) after provisions for loan losses |
776 | 501 | — | (103 | ) | — | 1,174 | 216 | (114 | ) | 102 | 1,276 | ||||||||||||||||||||||||||||
| Other income (loss): |
||||||||||||||||||||||||||||||||||||||||
| Servicing revenue |
55 | 14 | 624 | — | (389 | ) | 304 | — | — | — | 304 | |||||||||||||||||||||||||||||
| Asset recovery and business processing revenue |
— | — | 390 | — | — | 390 | — | — | — | 390 | ||||||||||||||||||||||||||||||
| Other income |
— | — | — | 14 | — | 14 | (216 | ) | 326 | 110 | 124 | |||||||||||||||||||||||||||||
| Gains on debt repurchases |
— | — | — | 1 | — | 1 | — | — | — | 1 | ||||||||||||||||||||||||||||||
|
|
|
|
|
|
|
|
|
|
|
|
|
|
|
|
|
|
|
|
|
|||||||||||||||||||||
| Total other income (loss) |
55 | 14 | 1,014 | 15 | (389 | ) | 709 | (216 | ) | 326 | 110 | 819 | ||||||||||||||||||||||||||||
| Expenses: |
||||||||||||||||||||||||||||||||||||||||
| Direct operating expenses |
401 | 167 | 524 | 28 | (389 | ) | 731 | — | — | — | 731 | |||||||||||||||||||||||||||||
| Overhead expenses |
— | — | — | 220 | — | 220 | — | — | — | 220 | ||||||||||||||||||||||||||||||
|
|
|
|
|
|
|
|
|
|
|
|
|
|
|
|
|
|
|
|
|
|||||||||||||||||||||
| Operating expenses |
401 | 167 | 524 | 248 | (389 | ) | 951 | — | — | — | 951 | |||||||||||||||||||||||||||||
| Goodwill and acquired intangible asset impairment and amortization |
— | — | — | — | — | — | — | 36 | 36 | 36 | ||||||||||||||||||||||||||||||
| Restructuring and other reorganization expenses |
— | — | — | — | — | — | — | — | — | — | ||||||||||||||||||||||||||||||
|
|
|
|
|
|
|
|
|
|
|
|
|
|
|
|
|
|
|
|
|
|||||||||||||||||||||
| Total expenses |
401 | 167 | 524 | 248 | (389 | ) | 951 | — | 36 | 36 | 987 | |||||||||||||||||||||||||||||
|
|
|
|
|
|
|
|
|
|
|
|
|
|
|
|
|
|
|
|
|
|||||||||||||||||||||
| Income (loss) from continuing operations, before income tax expense (benefit) |
430 | 348 | 490 | (336 | ) | — | 932 | — | 176 | 176 | 1,108 | |||||||||||||||||||||||||||||
| Income tax expense (benefit)(3) |
158 | 129 | 182 | (124 | ) | — | 345 | — | 82 | 82 | 427 | |||||||||||||||||||||||||||||
|
|
|
|
|
|
|
|
|
|
|
|
|
|
|
|
|
|
|
|
|
|||||||||||||||||||||
| Net income (loss) from continuing operations |
272 | 219 | 308 | (212 | ) | — | 587 | — | 94 | 94 | 681 | |||||||||||||||||||||||||||||
| Income (loss) from discontinued operations, net of tax expense (benefit) |
— | — | — | — | — | — | — | — | — | — | ||||||||||||||||||||||||||||||
|
|
|
|
|
|
|
|
|
|
|
|
|
|
|
|
|
|
|
|
|
|||||||||||||||||||||
| Net income (loss) |
$ | 272 | $ | 219 | $ | 308 | $ | (212 | ) | $ | — | $ | 587 | $ | — | $ | 94 | $ | 94 | $ | 681 | |||||||||||||||||||
|
|
|
|
|
|
|
|
|
|
|
|
|
|
|
|
|
|
|
|
|
|||||||||||||||||||||
| (1) | The eliminations in servicing revenue and direct operating expense represent the elimination of intercompany servicing revenue where the Business Services segment performs the loan servicing function for the FFELP Loans segment. |
| (2) | “Core Earnings” adjustments to GAAP: |
| Year Ended December 31, 2016 | ||||||||||||||||
| (Dollars in millions) |
Net Impact from Spin-Off of SLM BankCo |
Net Impact of Derivative Accounting |
Net Impact of Acquired Intangibles |
Total | ||||||||||||
| Net interest income after provisions for loan losses |
$ | — | $ | 102 | $ | — | $ | 102 | ||||||||
| Total other income (loss) |
— | 110 | — | 110 | ||||||||||||
| Operating expenses |
— | — | — | — | ||||||||||||
| Goodwill and acquired intangible asset impairment and amortization |
— | — | 36 | 36 | ||||||||||||
| Restructuring and other reorganization expenses |
— | — | — | — | ||||||||||||
|
|
|
|
|
|
|
|
|
|||||||||
| Total “Core Earnings” adjustments to GAAP |
$ | — | $ | 212 | $ | (36 | ) | 176 | ||||||||
|
|
|
|
|
|
|
|||||||||||
| Income tax expense (benefit) |
82 | |||||||||||||||
|
|
|
|||||||||||||||
| Net income (loss) |
$ | 94 | ||||||||||||||
|
|
|
|||||||||||||||
| (3) | Income taxes are based on a percentage of net income before tax for the individual reportable segment. |
51
Table of Contents
| Year Ended December 31, 2015 | ||||||||||||||||||||||||||||||||||||||||
| (Dollars in millions) |
FFELP Loans |
Private Education Loans |
Business Services |
Other | Eliminations(1) | Total “Core Earnings” |
Adjustments | Total GAAP |
||||||||||||||||||||||||||||||||
| Reclassifications | Additions/ (Subtractions) |
Total Adjustments(2) |
||||||||||||||||||||||||||||||||||||||
| Interest income: |
||||||||||||||||||||||||||||||||||||||||
| Education loans |
$ | 2,112 | $ | 1,756 | $ | — | $ | — | $ | — | $ | 3,868 | $ | 650 | $ | (238 | ) | $ | 412 | $ | 4,280 | |||||||||||||||||||
| Other loans |
— | — | — | 7 | — | 7 | — | — | — | 7 | ||||||||||||||||||||||||||||||
| Cash and investments |
6 | — | — | 2 | — | 8 | — | — | — | 8 | ||||||||||||||||||||||||||||||
|
|
|
|
|
|
|
|
|
|
|
|
|
|
|
|
|
|
|
|
|
|||||||||||||||||||||
| Total interest income |
2,118 | 1,756 | — | 9 | — | 3,883 | 650 | (238 | ) | 412 | 4,295 | |||||||||||||||||||||||||||||
| Total interest expense |
1,245 | 680 | — | 112 | — | 2,037 | 37 | — | 37 | 2,074 | ||||||||||||||||||||||||||||||
|
|
|
|
|
|
|
|
|
|
|
|
|
|
|
|
|
|
|
|
|
|||||||||||||||||||||
| Net interest income (loss) |
873 | 1,076 | — | (103 | ) | — | 1,846 | 613 | (238 | ) | 375 | 2,221 | ||||||||||||||||||||||||||||
| Less: provisions for loan losses |
46 | 538 | — | (3 | ) | — | 581 | — | — | — | 581 | |||||||||||||||||||||||||||||
|
|
|
|
|
|
|
|
|
|
|
|
|
|
|
|
|
|
|
|
|
|||||||||||||||||||||
| Net interest income (loss) after provisions for loan losses |
827 | 538 | — | (100 | ) | — | 1,265 | 613 | (238 | ) | 375 | 1,640 | ||||||||||||||||||||||||||||
| Other income (loss): |
||||||||||||||||||||||||||||||||||||||||
| Servicing revenue |
95 | 21 | 651 | — | (427 | ) | 340 | — | — | — | 340 | |||||||||||||||||||||||||||||
| Asset recovery and business processing revenue |
— | — | 367 | — | — | 367 | — | — | — | 367 | ||||||||||||||||||||||||||||||
| Other income |
— | — | 4 | 11 | — | 15 | (613 | ) | 781 | 168 | 183 | |||||||||||||||||||||||||||||
| Gains (losses) on sales of loans and investments |
12 | (21 | ) | — | — | — | (9 | ) | — | — | — | (9 | ) | |||||||||||||||||||||||||||
| Gains on debt repurchases |
— | — | — | 21 | — | 21 | — | — | — | 21 | ||||||||||||||||||||||||||||||
|
|
|
|
|
|
|
|
|
|
|
|
|
|
|
|
|
|
|
|
|
|||||||||||||||||||||
| Total other income (loss) |
107 | — | 1,022 | 32 | (427 | ) | 734 | (613 | ) | 781 | 168 | 902 | ||||||||||||||||||||||||||||
| Expenses: |
||||||||||||||||||||||||||||||||||||||||
| Direct operating expenses |
443 | 168 | 485 | 30 | (427 | ) | 699 | — | — | — | 699 | |||||||||||||||||||||||||||||
| Overhead expenses |
— | — | — | 219 | — | 219 | — | — | — | 219 | ||||||||||||||||||||||||||||||
|
|
|
|
|
|
|
|
|
|
|
|
|
|
|
|
|
|
|
|
|
|||||||||||||||||||||
| Operating expenses |
443 | 168 | 485 | 249 | (427 | ) | 918 | — | — | — | 918 | |||||||||||||||||||||||||||||
| Goodwill and acquired intangible asset impairment and amortization |
— | — | — | — | — | — | — | 12 | 12 | 12 | ||||||||||||||||||||||||||||||
| Restructuring and other reorganization expenses |
— | — | — | — | — | — | — | 32 | 32 | 32 | ||||||||||||||||||||||||||||||
|
|
|
|
|
|
|
|
|
|
|
|
|
|
|
|
|
|
|
|
|
|||||||||||||||||||||
| Total expenses |
443 | 168 | 485 | 249 | (427 | ) | 918 | — | 44 | 44 | 962 | |||||||||||||||||||||||||||||
|
|
|
|
|
|
|
|
|
|
|
|
|
|
|
|
|
|
|
|
|
|||||||||||||||||||||
| Income (loss) from continuing operations, before income tax expense (benefit) |
491 | 370 | 537 | (317 | ) | — | 1,081 | — | 499 | 499 | 1,580 | |||||||||||||||||||||||||||||
| Income tax expense (benefit)(3) |
183 | 137 | 199 | (118 | ) | — | 401 | — | 196 | 196 | 597 | |||||||||||||||||||||||||||||
|
|
|
|
|
|
|
|
|
|
|
|
|
|
|
|
|
|
|
|
|
|||||||||||||||||||||
| Net income (loss) from continuing operations |
308 | 233 | 338 | (199 | ) | — | 680 | — | 303 | 303 | 983 | |||||||||||||||||||||||||||||
| Income (loss) from discontinued operations, net of tax expense (benefit) |
— | — | — | 1 | — | 1 | — | — | — | 1 | ||||||||||||||||||||||||||||||
|
|
|
|
|
|
|
|
|
|
|
|
|
|
|
|
|
|
|
|
|
|||||||||||||||||||||
| Net income (loss) |
$ | 308 | $ | 233 | $ | 338 | $ | (198 | ) | $ | — | $ | 681 | $ | — | $ | 303 | $ | 303 | $ | 984 | |||||||||||||||||||
|
|
|
|
|
|
|
|
|
|
|
|
|
|
|
|
|
|
|
|
|
|||||||||||||||||||||
| (1) | The eliminations in servicing revenue and direct operating expense represent the elimination of intercompany servicing revenue where the Business Services segment performs the loan servicing function for the FFELP Loans segment. |
| (2) | “Core Earnings” adjustments to GAAP: |
| Year Ended December 31, 2015 | ||||||||||||||||
| (Dollars in millions) |
Net Impact from Spin-Off of SLM BankCo |
Net Impact of Derivative Accounting |
Net Impact of Acquired Intangibles |
Total | ||||||||||||
| Net interest income after provisions for loan losses |
$ | — | $ | 375 | $ | — | $ | 375 | ||||||||
| Total other income (loss) |
— | 168 | — | 168 | ||||||||||||
| Operating expenses |
— | — | — | — | ||||||||||||
| Goodwill and acquired intangible asset impairment and amortization |
— | — | 12 | 12 | ||||||||||||
| Restructuring and other reorganization expenses |
32 | — | — | 32 | ||||||||||||
|
|
|
|
|
|
|
|
|
|||||||||
| Total “Core Earnings” adjustments to GAAP |
$ | (32 | ) | $ | 543 | $ | (12 | ) | 499 | |||||||
|
|
|
|
|
|
|
|||||||||||
| Income tax expense (benefit) |
196 | |||||||||||||||
|
|
|
|||||||||||||||
| Net income (loss) |
$ | 303 | ||||||||||||||
|
|
|
|||||||||||||||
| (3) | Income taxes are based on a percentage of net income before tax for the individual reportable segment. |
52
Table of Contents
| Year Ended December 31, 2014 | ||||||||||||||||||||||||||||||||||||||||
| (Dollars in millions) |
FFELP Loans |
Private Education Loans |
Business Services |
Other | Eliminations(1) | Total “Core Earnings” |
Adjustments | Total GAAP |
||||||||||||||||||||||||||||||||
| Reclassifications | Additions/ (Subtractions) |
Total Adjustments(2) |
||||||||||||||||||||||||||||||||||||||
| Interest income: |
||||||||||||||||||||||||||||||||||||||||
| Education loans |
$ | 2,097 | $ | 1,958 | $ | — | $ | — | $ | — | $ | 4,055 | $ | 699 | $ | (42 | ) | $ | 657 | $ | 4,712 | |||||||||||||||||||
| Other loans |
— | — | — | 9 | — | 9 | — | — | — | 9 | ||||||||||||||||||||||||||||||
| Cash and investments |
4 | — | — | 4 | — | 8 | — | 1 | 1 | 9 | ||||||||||||||||||||||||||||||
|
|
|
|
|
|
|
|
|
|
|
|
|
|
|
|
|
|
|
|
|
|||||||||||||||||||||
| Total interest income |
2,101 | 1,958 | — | 13 | — | 4,072 | 699 | (41 | ) | 658 | 4,730 | |||||||||||||||||||||||||||||
| Total interest expense |
1,168 | 708 | — | 114 | — | 1,990 | 42 | 31 | 73 | 2,063 | ||||||||||||||||||||||||||||||
|
|
|
|
|
|
|
|
|
|
|
|
|
|
|
|
|
|
|
|
|
|||||||||||||||||||||
| Net interest income (loss) |
933 | 1,250 | — | (101 | ) | — | 2,082 | 657 | (72 | ) | 585 | 2,667 | ||||||||||||||||||||||||||||
| Less: provisions for loan losses |
59 | 539 | — | — | — | 598 | — | 49 | 49 | 647 | ||||||||||||||||||||||||||||||
|
|
|
|
|
|
|
|
|
|
|
|
|
|
|
|
|
|
|
|
|
|||||||||||||||||||||
| Net interest income (loss) after provisions for loan losses |
874 | 711 | — | (101 | ) | — | 1,484 | 657 | (121 | ) | 536 | 2,020 | ||||||||||||||||||||||||||||
| Other income (loss): |
||||||||||||||||||||||||||||||||||||||||
| Servicing revenue |
62 | 25 | 668 | — | (456 | ) | 299 | — | (1 | ) | (1 | ) | 298 | |||||||||||||||||||||||||||
| Asset recovery and business processing revenue |
— | — | 388 | — | — | 388 | — | — | — | 388 | ||||||||||||||||||||||||||||||
| Other income |
— | — | 6 | 26 | — | 32 | (657 | ) | 846 | 189 | 221 | |||||||||||||||||||||||||||||
| Gains (losses) on sales of loans and investments |
— | — | — | — | — | — | — | — | — | — | ||||||||||||||||||||||||||||||
| Gains on debt repurchases |
— | — | — | — | — | — | — | — | — | — | ||||||||||||||||||||||||||||||
|
|
|
|
|
|
|
|
|
|
|
|
|
|
|
|
|
|
|
|
|
|||||||||||||||||||||
| Total other income (loss) |
62 | 25 | 1,062 | 26 | (456 | ) | 719 | (657 | ) | 845 | 188 | 907 | ||||||||||||||||||||||||||||
| Expenses: |
||||||||||||||||||||||||||||||||||||||||
| Direct operating expenses |
478 | 181 | 389 | 132 | (456 | ) | 724 | — | 36 | 36 | 760 | |||||||||||||||||||||||||||||
| Overhead expenses |
— | — | — | 200 | — | 200 | — | 27 | 27 | 227 | ||||||||||||||||||||||||||||||
|
|
|
|
|
|
|
|
|
|
|
|
|
|
|
|
|
|
|
|
|
|||||||||||||||||||||
| Operating expenses |
478 | 181 | 389 | 332 | (456 | ) | 924 | — | 63 | 63 | 987 | |||||||||||||||||||||||||||||
| Goodwill and acquired intangible asset impairment and amortization |
— | — | — | — | — | — | — | 9 | 9 | 9 | ||||||||||||||||||||||||||||||
| Restructuring and other reorganization expenses |
— | — | — | — | — | — | — | 113 | 113 | 113 | ||||||||||||||||||||||||||||||
|
|
|
|
|
|
|
|
|
|
|
|
|
|
|
|
|
|
|
|
|
|||||||||||||||||||||
| Total expenses |
478 | 181 | 389 | 332 | (456 | ) | 924 | — | 185 | 185 | 1,109 | |||||||||||||||||||||||||||||
| Income (loss) from continuing operations, before income tax expense (benefit) |
458 | 555 | 673 | (407 | ) | — | 1,279 | — | 539 | 539 | 1,818 | |||||||||||||||||||||||||||||
| Income tax expense (benefit)(3) |
171 | 204 | 248 | (150 | ) | — | 473 | — | 208 | 208 | 681 | |||||||||||||||||||||||||||||
|
|
|
|
|
|
|
|
|
|
|
|
|
|
|
|
|
|
|
|
|
|||||||||||||||||||||
| Net income (loss) from continuing operations |
$ | 287 | $ | 351 | $ | 425 | $ | (257 | ) | $ | — | $ | 806 | $ | — | $ | 331 | $ | 331 | $ | 1,137 | |||||||||||||||||||
| Income (loss) from discontinued operations, net of tax expense (benefit) |
— | — | — | — | — | — | — | — | — | — | ||||||||||||||||||||||||||||||
|
|
|
|
|
|
|
|
|
|
|
|
|
|
|
|
|
|
|
|
|
|||||||||||||||||||||
| Net income (loss) |
$ | 287 | $ | 351 | $ | 425 | $ | (257 | ) | $ | — | $ | 806 | $ | — | $ | 331 | $ | 331 | $ | 1,137 | |||||||||||||||||||
|
|
|
|
|
|
|
|
|
|
|
|
|
|
|
|
|
|
|
|
|
|||||||||||||||||||||
| (1) | The eliminations in servicing revenue and direct operating expense represent the elimination of intercompany servicing revenue where the Business Services segment performs the loan servicing function for the FFELP Loans segment. |
| (2) | “Core Earnings” adjustments to GAAP: |
| Year Ended December 31, 2014 | ||||||||||||||||
| (Dollars in millions) |
Net Impact from Spin-Off of SLM BankCo |
Net Impact of Derivative Accounting |
Net Impact of Acquired Intangibles |
Total | ||||||||||||
| Net interest income after provisions for loan losses |
$ | 136 | $ | 400 | $ | — | $ | 536 | ||||||||
| Total other income (loss) |
15 | 173 | — | 188 | ||||||||||||
| Operating expenses |
63 | — | — | 63 | ||||||||||||
| Goodwill and acquired intangible asset impairment and amortization |
— | — | 9 | 9 | ||||||||||||
| Restructuring and other reorganization expenses |
113 | — | — | 113 | ||||||||||||
|
|
|
|
|
|
|
|
|
|||||||||
| Total “Core Earnings” adjustments to GAAP |
$ | (25 | ) | $ | 573 | $ | (9 | ) | 539 | |||||||
|
|
|
|
|
|
|
|||||||||||
| Income tax expense (benefit) |
208 | |||||||||||||||
|
|
|
|||||||||||||||
| Net income (loss) |
$ | 331 | ||||||||||||||
|
|
|
|||||||||||||||
| (3) | Income taxes are based on a percentage of net income before tax for the individual reportable segment. |
53
Table of Contents
Differences between “Core Earnings” and GAAP
The following discussion summarizes the differences between “Core Earnings” and GAAP net income and details each specific adjustment required to reconcile our “Core Earnings” segment presentation to our GAAP earnings.
| Years Ended December 31, | ||||||||||||
| (Dollars in millions) |
2016 | 2015 | 2014 | |||||||||
| “Core Earnings” net income attributable to Navient Corporation |
$ | 587 | $ | 681 | $ | 806 | ||||||
| “Core Earnings” adjustments to GAAP: |
||||||||||||
| Net impact of the removal of SLM BankCo’s operations and restructuring and reorganization expense in connection with the Spin-Off |
— | (32 | ) | (25 | ) | |||||||
| Net impact of derivative accounting |
212 | 543 | 573 | |||||||||
| Net impact of goodwill and acquired intangible assets |
(36 | ) | (12 | ) | (9 | ) | ||||||
| Net income tax effect |
(82 | ) | (196 | ) | (208 | ) | ||||||
|
|
|
|
|
|
|
|||||||
| Total “Core Earnings” adjustments to GAAP |
94 | 303 | 331 | |||||||||
|
|
|
|
|
|
|
|||||||
| GAAP net income attributable to Navient Corporation |
$ | 681 | $ | 984 | $ | 1,137 | ||||||
|
|
|
|
|
|
|
|||||||
1) SLM BankCo’s operations and restructuring and reorganization expense in connection with the Spin-Off: On April 30, 2014, the Spin-Off of Navient from SLM Corporation was completed and Navient became an independent, publicly-traded company. Due to the relative significance of Navient to SLM Corporation prior to the Spin-Off, among other factors, for financial reporting purposes Navient is treated as the “accounting spinnor” and therefore is the “accounting successor” to SLM Corporation as constituted prior to the Spin-Off, notwithstanding the legal form of the Spin-Off. Since Navient is treated for accounting purposes as the “accounting spinnor,” the GAAP financial statements of Navient reflect the deemed distribution of SLM BankCo to SLM BankCo’s stockholders on April 30, 2014.
For “Core Earnings,” we have assumed SLM BankCo was never a part of Navient’s historical results prior to the deemed distribution of SLM BankCo on April 30, 2014 and we have removed the restructuring and other reorganization expense incurred in connection with the Spin-Off, including the restructuring expenses related to the restructuring initiative launched in second-quarter 2015 to simplify and streamline the Company’s management structure post-Spin-Off. Excluding these items provides management with a useful basis from which to better evaluate results from ongoing operations against results from prior periods. The adjustment relates to the exclusion of the consumer banking business and represents the operations, assets, liabilities and equity of SLM BankCo, which is comprised of Sallie Mae Bank, Upromise Rewards, the Insurance Business, and the Private Education Loan origination functions. Included in these amounts are also certain general corporate overhead expenses related to the consumer banking business. General corporate overhead consists of costs primarily associated with accounting, finance, legal, human resources, certain information technology costs, stock compensation, and executive management and the board of directors. These costs were generally allocated to the consumer banking business based on the proportionate level of effort provided to the consumer banking business relative to SLM Corporation using a relevant allocation driver (e.g., in proportion to the number of employees by function that were being transferred to SLM BankCo as opposed to remaining at Navient). All intercompany transactions between SLM BankCo and Navient have been eliminated. In addition, all prior preferred stock dividends have been removed as SLM BankCo succeeded SLM Corporation as the issuer of the preferred stock in connection with the Spin-Off.
| Years Ended December 31, | ||||||||||||
| (Dollars in millions) |
2016 | 2015 | 2014 | |||||||||
| SLM BankCo net income, before income tax expense |
$ | — | $ | — | $ | 88 | ||||||
| Restructuring and reorganization expense in connection with the Spin-Off |
— | (32 | ) | (113 | ) | |||||||
|
|
|
|
|
|
|
|||||||
| Total net impact of SLM BankCo, before income tax expense |
$ | — | $ | (32 | ) | $ | (25 | ) | ||||
|
|
|
|
|
|
|
|||||||
54
Table of Contents
2) Derivative Accounting: “Core Earnings” exclude periodic unrealized gains and losses that are caused by the fair value adjustments on derivatives that do not qualify for hedge accounting treatment under GAAP, as well as the periodic unrealized gains and losses that are a result of ineffectiveness recognized related to effective hedges under GAAP. These unrealized gains and losses occur in our FFELP Loans, Private Education Loans and Other business segments. Under GAAP, for our derivatives that are held to maturity, the cumulative net unrealized gain or loss over the life of the contract will equal $0 except for Floor Income Contracts, where the cumulative unrealized gain will equal the amount for which we sold the contract. In our “Core Earnings” presentation, we recognize the economic effect of these hedges, which generally results in any net settlement cash paid or received being recognized ratably as an interest expense or revenue over the hedged item’s life.
The accounting for derivatives requires that changes in the fair value of derivative instruments be recognized currently in earnings, with no fair value adjustment of the hedged item, unless specific hedge accounting criteria are met. We believe that our derivatives are effective economic hedges, and as such, are a critical element of our interest rate and foreign currency risk management strategy. However, some of our derivatives, primarily Floor Income Contracts and certain basis swaps, do not qualify for hedge accounting treatment and the stand-alone derivative must be adjusted to fair value in the income statement with no consideration for the corresponding change in fair value of the hedged item. These gains and losses recorded in “Gains (losses) on derivative and hedging activities, net” are primarily caused by interest rate and foreign currency exchange rate volatility and changing credit spreads during the period as well as the volume and term of derivatives not receiving hedge accounting treatment.
Our Floor Income Contracts are written options that must meet more stringent requirements than other hedging relationships to achieve hedge effectiveness. Specifically, our Floor Income Contracts do not qualify for hedge accounting treatment because the pay down of principal of the education loans underlying the Floor Income embedded in those education loans does not exactly match the change in the notional amount of our written Floor Income Contracts. Additionally, the term, the interest rate index, and the interest rate index reset frequency of the Floor Income Contract can be different than that of the education loans. Under derivative accounting treatment, the upfront contractual payment is deemed a liability and changes in fair value are recorded through income throughout the life of the contract. The change in the fair value of Floor Income Contracts is primarily caused by changing interest rates that cause the amount of Floor Income paid to the counterparties to vary. This is economically offset by the change in the amount of Floor Income earned on the underlying education loans but that offsetting change in fair value is not recognized. We believe the Floor Income Contracts are economic hedges because they effectively fix the amount of Floor Income earned over the contract period, thus eliminating the timing and uncertainty that changes in interest rates can have on Floor Income for that period. Therefore, for purposes of “Core Earnings,” we have removed the unrealized gains and losses related to these contracts and added back the amortization of the net contractual premiums received on the Floor Income Contracts. The amortization of the net contractual premiums received on the Floor Income Contracts for “Core Earnings” is reflected in education loan interest income. Under GAAP accounting, the premiums received on the Floor Income Contracts are recorded as revenue in the “gains (losses) on derivative and hedging activities, net” line item by the end of the contracts’ lives.
Basis swaps are used to convert floating rate debt from one floating interest rate index to another to better match the interest rate characteristics of the assets financed by that debt. We primarily use basis swaps to hedge our education loan assets that are primarily indexed to LIBOR or Prime. The accounting for derivatives requires that when using basis swaps, the change in the cash flows of the hedge effectively offset both the change in the cash flows of the asset and the change in the cash flows of the liability. Our basis swaps hedge variable interest rate risk; however, they generally do not meet this effectiveness test because the index of the swap does not exactly match the index of the hedged assets as required for hedge accounting treatment. Additionally, some of our FFELP Loans can earn at either a variable or a fixed interest rate depending on market interest rates and therefore swaps economically hedging these FFELP Loans do not meet the criteria for hedge accounting treatment. As a result, under GAAP, these swaps are recorded at fair value with changes in fair value reflected currently in the income statement.
55
Table of Contents
The table below quantifies the adjustments for derivative accounting between GAAP and “Core Earnings” net income.
| Years Ended December 31, | ||||||||||||
| (Dollars in millions) |
2016 | 2015 | 2014 | |||||||||
| “Core Earnings” derivative adjustments: |
||||||||||||
| Gains (losses) on derivative and hedging activities, net, included in other income |
$ | 117 | $ | 166 | $ | 139 | ||||||
| Plus: Realized losses on derivative and hedging activities, net(1) |
216 | 613 | 657 | |||||||||
|
|
|
|
|
|
|
|||||||
| Unrealized gains (losses) on derivative and hedging activities, net(2) |
333 | 779 | 796 | |||||||||
| Amortization of net premiums on Floor Income Contracts in net interest income for “Core Earnings” |
(114 | ) | (238 | ) | (255 | ) | ||||||
| Other derivative accounting adjustments(3) |
(7 | ) | 2 | 32 | ||||||||
|
|
|
|
|
|
|
|||||||
| Total net impact of derivative accounting |
$ | 212 | $ | 543 | $ | 573 | ||||||
|
|
|
|
|
|
|
|||||||
| (1) | See the section titled “Reclassification of Realized Gains (Losses) on Derivative and Hedging Activities” below for a detailed breakdown of the components of realized losses on derivative and hedging activities. |
| (2) | “Unrealized gains (losses) on derivative and hedging activities, net” comprises the following unrealized mark-to-market gains (losses): |
| Years Ended December 31, | ||||||||||||
| (Dollars in millions) |
2016 | 2015 | 2014 | |||||||||
| Floor Income Contracts |
$ | 297 | $ | 557 | $ | 633 | ||||||
| Basis swaps |
2 | 42 | (5 | ) | ||||||||
| Foreign currency hedges |
40 | 129 | 72 | |||||||||
| Other |
(6 | ) | 51 | 96 | ||||||||
|
|
|
|
|
|
|
|||||||
| Total unrealized gains (losses) on derivative and hedging activities, net |
$ | 333 | $ | 779 | $ | 796 | ||||||
|
|
|
|
|
|
|
|||||||
| (3) | Other derivative accounting adjustments primarily consist of adjustments related to: (1) foreign currency denominated debt that is adjusted to spot foreign exchange rates for GAAP where such adjustment is reversed for “Core Earnings”; and (2) certain terminated derivatives that did not receive hedge accounting treatment under GAAP but were economic hedges under “Core Earnings” and, as a result, such gains or losses amortized into “Core Earnings” over the life of the hedged item. |
56
Table of Contents
Reclassification of Realized Gains (Losses) on Derivative and Hedging Activities
Derivative accounting requires net settlement income/expense on derivatives and realized gains/losses related to derivative dispositions (collectively referred to as “realized gains (losses) on derivative and hedging activities”) that do not qualify as hedges to be recorded in a separate income statement line item below net interest income. Under our “Core Earnings” presentation, these gains and losses are reclassified to the income statement line item of the economically hedged item. For our “Core Earnings” net interest margin, this would primarily include: (a) reclassifying the net settlement amounts related to our Floor Income Contracts to education loan interest income and (b) reclassifying the net settlement amounts related to certain of our basis swaps to debt interest expense. The table below summarizes the realized losses on derivative and hedging activities and the associated reclassification on a “Core Earnings” basis.
| Years Ended December 31, | ||||||||||||
| (Dollars in millions) |
2016 | 2015 | 2014 | |||||||||
| Reclassification of realized gains (losses) on derivative and hedging activities: |
||||||||||||
| Net settlement expense on Floor Income Contracts reclassified to net interest income |
$ | (247 | ) | $ | (650 | ) | $ | (699 | ) | |||
| Net settlement income on interest rate swaps reclassified to net interest income |
31 | 37 | 42 | |||||||||
| Net realized gains (losses) on terminated derivative contracts reclassified to other income |
— | — | — | |||||||||
|
|
|
|
|
|
|
|||||||
| Total reclassifications of realized losses on derivative and hedging activities |
$ | (216 | ) | $ | (613 | ) | $ | (657 | ) | |||
|
|
|
|
|
|
|
|||||||
Cumulative Impact of Derivative Accounting under GAAP compared to “Core Earnings”
As of December 31, 2016, derivative accounting has reduced GAAP equity by approximately $90 million as a result of cumulative net unrealized losses (after tax) recognized under GAAP, but not in “Core Earnings.” The following table rolls forward the cumulative impact to GAAP equity due to these unrealized after tax net losses related to derivative accounting.
| Years Ended December 31, | ||||||||||||
| (Dollars in millions) |
2016 | 2015 | 2014 | |||||||||
| Beginning impact of derivative accounting on GAAP equity |
$ | (281 | ) | $ | (553 | ) | $ | (926 | ) | |||
| Net impact of net unrealized gains/(losses) under derivative accounting(1) |
191 | 272 | 373 | |||||||||
|
|
|
|
|
|
|
|||||||
| Ending impact of derivative accounting on GAAP equity |
$ | (90 | ) | $ | (281 | ) | $ | (553 | ) | |||
|
|
|
|
|
|
|
|||||||
| (1) | Net impact of net unrealized gains (losses) under derivative accounting is composed of the following: |
| Years Ended December 31, | ||||||||||||
| (Dollars in millions) |
2016 | 2015 | 2014 | |||||||||
| Total pre-tax net impact of derivative accounting recognized in net income(a) |
$ | 212 | $ | 543 | $ | 573 | ||||||
| Tax impact of derivative accounting adjustment recognized in net income |
(78 | ) | (211 | ) | (195 | ) | ||||||
| Change in unrealized gains on derivatives, net of tax recognized in Other Comprehensive Income |
57 | (60 | ) | (5 | ) | |||||||
|
|
|
|
|
|
|
|||||||
| Net impact of net unrealized gains (losses) under derivative accounting |
$ | 191 | $ | 272 | $ | 373 | ||||||
|
|
|
|
|
|
|
|||||||
| (a) | See “‘Core Earnings’ derivative adjustments” table above. |
Hedging Embedded Floor Income
Net Floor premiums received on Floor Income Contracts that have not been amortized into “Core Earnings” as of the respective year-ends are presented in the table below. These net premiums will be recognized in “Core
57
Table of Contents
Earnings” in future periods. As of December 31, 2016, the remaining amortization term of the net floor premiums was approximately 5.0 years. Historically, we have sold Floor Income Contracts on a periodic basis and depending upon market conditions and pricing, we may enter into additional Floor Income Contracts in the future. The balance of unamortized Floor Income Contracts will increase as we sell new contracts and decline due to the amortization of existing contracts.
In addition to using Floor Income Contracts, we also use pay-fixed interest rate swaps to hedge the embedded Floor Income within FFELP Loans. These interest rate swaps qualify as GAAP hedges and are accounted for as cash flow hedges of variable rate debt. For GAAP, gains and losses on the effective portion of these hedges are recorded in accumulated other comprehensive income and gains and losses on the ineffective portion are recorded immediately to earnings. Hedged Floor Income from these cash flow hedges that has not been recognized into “Core Earnings” and GAAP as of the respective period-ends is presented in the table below. This hedged Floor Income will be recognized in “Core Earnings” and GAAP in future periods and is presented net of tax. As of December 31, 2016, the remaining hedged period is approximately 5.0 years. Historically, we have used pay-fixed interest rate swaps on a periodic basis to hedge embedded Floor Income and depending upon market conditions and pricing, we may enter into swaps in the future. The balance of unrecognized hedged Floor Income will increase as we enter into new swaps and decline as revenue is recognized.
| December 31, | ||||||||||||
| (Dollars in millions) |
2016 | 2015 | 2014 | |||||||||
| Unamortized net Floor premiums (net of tax) |
$ | (147 | ) | $ | (145 | ) | $ | (295 | ) | |||
| Unrecognized hedged Floor Income related to pay-fixed rate swaps (net of tax) |
(551 | ) | (342 | ) | (320 | ) | ||||||
|
|
|
|
|
|
|
|||||||
|
Total(1) |
$ | (698 | ) | $ | (487 | ) | $ | (615 | ) | |||
|
|
|
|
|
|
|
|||||||
| (1) | $(1.1) billion, $(773) million and $(974) million on a pre-tax basis as of December 31, 2016, 2015 and 2014, respectively. |
3) Goodwill and Acquired Intangible Assets: Our “Core Earnings” exclude goodwill and intangible asset impairment and the amortization of acquired intangible assets. The following table summarizes the goodwill and acquired intangible asset adjustments.
| Years Ended December 31, | ||||||||||||
| (Dollars in millions) |
2016 | 2015 | 2014 | |||||||||
| “Core Earnings” goodwill and acquired intangible asset adjustments |
$ | (36 | ) | $ | (12 | ) | $ | (9 | ) | |||
|
|
|
|
|
|
|
|||||||
58
Table of Contents
Business Segment Earnings Summary — “Core Earnings” Basis
FFELP Loans Segment
The following table includes “Core Earnings” results for our FFELP Loans segment.
| Years Ended December 31, | % Increase (Decrease) | |||||||||||||||||||
| (Dollars in millions) |
2016 | 2015 | 2014 | 2016 vs. 2015 | 2015 vs. 2014 | |||||||||||||||
| “Core Earnings” interest income: |
||||||||||||||||||||
| FFELP Loans |
$ | 2,395 | $ | 2,112 | $ | 2,097 | 13 | % | 1 | % | ||||||||||
| Cash and investments |
16 | 6 | 4 | 167 | 50 | |||||||||||||||
|
|
|
|
|
|
|
|
|
|
|
|||||||||||
| Total “Core Earnings” interest income |
2,411 | 2,118 | 2,101 | 14 | 1 | |||||||||||||||
| Total “Core Earnings” interest expense |
1,592 | 1,245 | 1,168 | 28 | 7 | |||||||||||||||
|
|
|
|
|
|
|
|
|
|
|
|||||||||||
| Net “Core Earnings” interest income |
819 | 873 | 933 | (6 | ) | (6 | ) | |||||||||||||
| Less: provision for loan losses |
43 | 46 | 59 | (7 | ) | (22 | ) | |||||||||||||
|
|
|
|
|
|
|
|
|
|
|
|||||||||||
| Net “Core Earnings” interest income after provision for loan losses |
776 | 827 | 874 | (6 | ) | (5 | ) | |||||||||||||
| Servicing revenue |
55 | 95 | 62 | (42 | ) | 53 | ||||||||||||||
| Gains on sales of loans and investments |
— | 12 | — | (100 | ) | 100 | ||||||||||||||
|
|
|
|
|
|
|
|
|
|
|
|||||||||||
| Total other income |
55 | 107 | 62 | (49 | ) | 73 | ||||||||||||||
| Direct operating expenses |
401 | 443 | 478 | (9 | ) | (7 | ) | |||||||||||||
|
|
|
|
|
|
|
|
|
|
|
|||||||||||
| Income before income tax expense |
430 | 491 | 458 | (12 | ) | 7 | ||||||||||||||
| Income tax expense |
158 | 183 | 171 | (14 | ) | 7 | ||||||||||||||
|
|
|
|
|
|
|
|
|
|
|
|||||||||||
| “Core Earnings” |
$ | 272 | $ | 308 | $ | 287 | (12 | )% | 7 | % | ||||||||||
|
|
|
|
|
|
|
|
|
|
|
|||||||||||
“Core Earnings” were $272 million in 2016, compared with $308 million and $287 million in 2015 and 2014, respectively. The $36 million decrease from 2015 to 2016 was primarily the result of a $54 million decrease in net interest income due to the amortization of the portfolio and a $40 million decrease in servicing revenue, partially offset by a $42 million decrease in operating expenses. The $21 million increase from 2014 to 2015 was primarily the result of a $33 million increase in servicing revenue and a $13 million decline in the provision for loan losses, partially offset by a decrease in net interest income due to a decline in the net interest margin. “Core Earnings” key performance metrics are as follows:
| Years Ended December 31, | ||||||||||||
| (Dollars in millions) |
2016 | 2015 | 2014 | |||||||||
| FFELP Loan spread |
.94 | % | .92 | % | .99 | % | ||||||
| Net interest margin |
.85 | % | .84 | % | .90 | % | ||||||
| Provision for loan losses |
$ | 43 | $ | 46 | $ | 59 | ||||||
| Charge-offs |
$ | 54 | $ | 61 | $ | 79 | ||||||
| Charge-off rate |
.07 | % | .08 | % | .11 | % | ||||||
| Total delinquency rate |
12.2 | % | 15.2 | % | 16.5 | % | ||||||
| Greater than 90-day delinquency rate |
6.3 | % | 8.2 | % | 8.4 | % | ||||||
| Forbearance rate |
12.9 | % | 15.3 | % | 15.5 | % | ||||||
59
Table of Contents
FFELP Loan Net Interest Margin
The following table includes the “Core Earnings” basis FFELP Loan net interest margin along with reconciliation to the GAAP basis FFELP Loan net interest margin.
| Years Ended December 31, | ||||||||||||
| 2016 | 2015 | 2014 | ||||||||||
| “Core Earnings” basis FFELP Loan yield |
2.99 | % | 2.60 | % | 2.56 | % | ||||||
| Hedged Floor Income |
.28 | .24 | .25 | |||||||||
| Unhedged Floor Income |
.22 | .15 | .15 | |||||||||
| Consolidation Loan Rebate Fees |
(.65 | ) | (.64 | ) | (.65 | ) | ||||||
| Repayment Borrower Benefits |
(.11 | ) | (.11 | ) | (.11 | ) | ||||||
| Premium amortization |
(.14 | ) | (.14 | ) | (.11 | ) | ||||||
|
|
|
|
|
|
|
|||||||
| “Core Earnings” basis FFELP Loan net yield |
2.59 | 2.10 | 2.09 | |||||||||
| “Core Earnings” basis FFELP Loan cost of funds |
(1.65 | ) | (1.18 | ) | (1.10 | ) | ||||||
|
|
|
|
|
|
|
|||||||
| “Core Earnings” basis FFELP Loan spread |
.94 | .92 | .99 | |||||||||
| “Core Earnings” basis other interest-earning asset spread impact |
(.09 | ) | (.08 | ) | (.09 | ) | ||||||
|
|
|
|
|
|
|
|||||||
| “Core Earnings” basis FFELP Loan net interest margin(1) |
.85 | % | .84 | % | .90 | % | ||||||
|
|
|
|
|
|
|
|||||||
| “Core Earnings” basis FFELP Loan net interest margin(1) |
.85 | % | .84 | % | .90 | % | ||||||
| Adjustment for GAAP accounting treatment(2) |
.13 | .38 | .40 | |||||||||
|
|
|
|
|
|
|
|||||||
| GAAP basis FFELP Loan net interest margin |
.98 | % | 1.22 | % | 1.30 | % | ||||||
|
|
|
|
|
|
|
|||||||
| (1) | The average balances of our FFELP Loan “Core Earnings” basis interest-earning assets for the respective periods are: |
| Years Ended December 31, | ||||||||||||
| (Dollars in millions) |
2016 | 2015 | 2014 | |||||||||
| FFELP Loans |
$ | 92,497 | $ | 100,421 | $ | 100,202 | ||||||
| Other interest-earning assets |
3,505 | 4,017 | 3,890 | |||||||||
|
|
|
|
|
|
|
|||||||
| Total FFELP Loan “Core Earnings” basis interest-earning assets |
$ | 96,002 | $ | 104,438 | $ | 104,092 | ||||||
|
|
|
|
|
|
|
|||||||
| (2) | Represents the reclassification of periodic interest accruals on derivative contracts from net interest income to other income and other derivative accounting adjustments. For further discussion of these adjustments, see section titled “‘Core Earnings’ — Definition and Limitations — Differences between ‘Core Earnings’ and GAAP” above. |
The decrease in the net interest margin from 2014 to 2015 is primarily the result of an increase in premium expense related to an $8.5 billion acquisition in the fourth quarter 2014 as well as an increase in the cost of funds.
The Company acquired $3.5 billion of FFELP Loans in 2016. As of December 31, 2016, our FFELP Loan portfolio totaled $87.7 billion, comprising $32.3 billion of FFELP Stafford Loans and $55.4 billion of FFELP Consolidation Loans. The weighted-average life of these portfolios as of December 31, 2016 was 4.6 years and 8.5 years, respectively, assuming a Constant Prepayment Rate (“CPR”) of 5 percent and 3 percent, respectively.
60
Table of Contents
Floor Income
The following table analyzes, on a “Core Earnings” basis, the ability of the FFELP Loans in our portfolio to earn Floor Income after December 31, 2016 and 2015, based on interest rates as of those dates.
| December 31, 2016 | December 31, 2015 | |||||||||||||||||||||||
| (Dollars in billions) |
Fixed Borrower Rate |
Variable Borrower Rate |
Total | Fixed Borrower Rate |
Variable Borrower Rate |
Total | ||||||||||||||||||
| Education loans eligible to earn Floor Income |
$ | 76.4 | $ | 10.4 | $ | 86.8 | $ | 83.3 | $ | 11.8 | $ | 95.1 | ||||||||||||
| Less: post-March 31, 2006 disbursed loans required to rebate Floor Income |
(39.5 | ) | (.8 | ) | (40.3 | ) | (43.3 | ) | (.9 | ) | (44.2 | ) | ||||||||||||
| Less: economically hedged Floor Income |
(17.6 | ) | — | (17.6 | ) | (27.2 | ) | — | (27.2 | ) | ||||||||||||||
|
|
|
|
|
|
|
|
|
|
|
|
|
|||||||||||||
| Education loans eligible to earn Floor Income |
$ | 19.3 | $ | 9.6 | $ | 28.9 | $ | 12.8 | $ | 10.9 | $ | 23.7 | ||||||||||||
|
|
|
|
|
|
|
|
|
|
|
|
|
|||||||||||||
| Education loans earning Floor Income |
$ | 10.6 | $ | .4 | $ | 11.0 | $ | 7.3 | $ | .4 | $ | 7.7 | ||||||||||||
|
|
|
|
|
|
|
|
|
|
|
|
|
|||||||||||||
The following table presents a projection of the average balance of FFELP Consolidation Loans for which Fixed Rate Floor Income has been economically hedged with derivatives for the period January 1, 2017 to December 31, 2021.
| (Dollars in billions) |
2017 | 2018 | 2019 | 2020 | 2021 | |||||||||||||||
| Average balance of FFELP Consolidation Loans whose Floor Income is economically hedged |
$ | 19.9 | $ | 21.5 | $ | 18.1 | $ | 12.6 | $ | 7.2 | ||||||||||
|
|
|
|
|
|
|
|
|
|
|
|||||||||||
Servicing Revenue — FFELP Loans
The increase in servicing revenue in 2015 compared to 2014 was primarily the result of an increase to our recovery expectation on previously assessed late fees.
Gains on Sales of Loans and Investments
We recorded a $12 million gain on the sale of $412 million of FFELP Loans in 2015. There were no sales in 2016 or 2014.
Operating Expenses — FFELP Loans Segment
Operating expenses for our FFELP Loans segment primarily include the contractual rates we pay to service loans in term asset-backed securitization trusts or a similar rate if a loan is not in a term financing facility (which is presented as an intercompany charge from the Business Services segment who services the loans), the fees we pay for third-party loan servicing and costs incurred to acquire loans. The intercompany revenue charged by the Business Services segment and included in those amounts was $389 million, $427 million and $456 million for the years ended December 31, 2016, 2015 and 2014, respectively. These amounts exceed the actual cost of servicing the loans. Operating expenses were 43 basis points, 44 basis points and 48 basis points of average FFELP Loans in the years ended December 31, 2016, 2015 and 2014, respectively. The decrease in operating expenses from the prior periods was primarily the result of the decrease in the balance of the portfolio and the average servicing rate paid.
61
Table of Contents
Private Education Loans Segment
The following table includes “Core Earnings” results for our Private Education Loans segment.
| Years Ended December 31, | % Increase (Decrease) | |||||||||||||||||||
| (Dollars in millions) |
2016 | 2015 | 2014 | 2016 vs. 2015 | 2015 vs. 2014 | |||||||||||||||
| “Core Earnings” interest income: |
||||||||||||||||||||
| Private Education Loans |
$ | 1,587 | $ | 1,756 | $ | 1,958 | (10 | )% | (10 | )% | ||||||||||
| Cash and investments |
2 | — | — | — | — | |||||||||||||||
|
|
|
|
|
|
|
|
|
|
|
|||||||||||
| Total “Core Earnings” interest income |
1,589 | 1,756 | 1,958 | (10 | ) | (10 | ) | |||||||||||||
| Total “Core Earnings” interest expense |
705 | 680 | 708 | 4 | (4 | ) | ||||||||||||||
|
|
|
|
|
|
|
|
|
|
|
|||||||||||
| Net “Core Earnings” interest income |
884 | 1,076 | 1,250 | (18 | ) | (14 | ) | |||||||||||||
| Less: provision for loan losses |
383 | 538 | 539 | (29 | ) | — | ||||||||||||||
|
|
|
|
|
|
|
|
|
|
|
|||||||||||
| Net “Core Earnings” interest income after provision for loan losses |
501 | 538 | 711 | (7 | ) | (24 | ) | |||||||||||||
| Servicing revenue |
14 | 21 | 25 | (33 | ) | (16 | ) | |||||||||||||
| Losses on sales of loans and investments |
— | (21 | ) | — | (100 | ) | (100 | ) | ||||||||||||
|
|
|
|
|
|
|
|
|
|
|
|||||||||||
| Total other income |
14 | — | 25 | 100 | (100 | ) | ||||||||||||||
| Direct operating expenses |
167 | 168 | 181 | (1 | ) | (7 | ) | |||||||||||||
|
|
|
|
|
|
|
|
|
|
|
|||||||||||
| Income before income tax expense |
348 | 370 | 555 | (6 | ) | (33 | ) | |||||||||||||
| Income tax expense |
129 | 137 | 204 | (6 | ) | (33 | ) | |||||||||||||
|
|
|
|
|
|
|
|
|
|
|
|||||||||||
| “Core Earnings” |
$ | 219 | $ | 233 | $ | 351 | (6 | )% | (34 | )% | ||||||||||
|
|
|
|
|
|
|
|
|
|
|
|||||||||||
62
Table of Contents
“Core Earnings” were $219 million in 2016, compared with $233 million in 2015 and $351 million in 2014. The $14 million decrease in 2016 compared to 2015 was primarily the result of a $192 million decrease in net interest income due to the amortization of the portfolio and a decrease in net interest margin, partially offset by a $155 million decrease in the provision for loan losses. The year-ago period also had a $21 million loss on the sale of $178 million of loans. The decrease in 2015 compared to 2014 was primarily the result of a $174 million decrease in net interest income due to a decline in the balance of the portfolio and net interest margin, partially offset by a decline in expenses. “Core Earnings” key performance metrics are as follows:
| Years Ended December 31, | ||||||||||||
| (Dollars in millions) |
2016 | 2015 | 2014 | |||||||||
| Private Education Loan spread |
3.56 | % | 3.79 | % | 4.04 | % | ||||||
| Net interest margin |
3.41 | % | 3.67 | % | 3.94 | % | ||||||
| Provision for loan losses |
$ | 383 | $ | 538 | $ | 539 | ||||||
| Net adjustment resulting from the change in the charge-off rate(1) |
$ | — | $ | 330 | $ | — | ||||||
| Net charge-offs remaining |
513 | 659 | 717 | |||||||||
|
|
|
|
|
|
|
|||||||
| Total net charge-offs |
$ | 513 | $ | 989 | $ | 717 | ||||||
| Net charge-offs as a percentage of average loans in repayment, excluding the net adjustment resulting from the change in the charge-off rate(1) |
2.2 | % | 2.6 | % | 2.6 | % | ||||||
| Net adjustment resulting from the change in the charge-off rate as a percentage of average loans in repayment(1) |
— | % | 1.3 | % | — | % | ||||||
| Total delinquency rate |
7.4 | % | 7.2 | % | 8.1 | % | ||||||
| Greater than 90-day delinquency rate |
3.6 | % | 3.4 | % | 3.8 | % | ||||||
| Forbearance rate |
3.4 | % | 3.8 | % | 3.8 | % | ||||||
| Loans in repayment with more than 12 payments made |
95 | % | 94 | % | 91 | % | ||||||
| Cosigner rate |
64 | % | 64 | % | 64 | % | ||||||
| (1) | In the second quarter of 2015, the portion of the loan amount charged off at default increased from 73 percent to 79 percent. This did not impact the provision for loan losses as previously this had been reserved through the allowance for loan losses. This change resulted in a $330 million reduction to the balance of the receivable for partially charged-off loans. |
63
Table of Contents
Private Education Loan Net Interest Margin
The following table shows the “Core Earnings” basis Private Education Loan net interest margin along with reconciliation to the GAAP basis Private Education Loan net interest margin before provision for loan losses.
| Years Ended December 31, | ||||||||||||
| 2016 | 2015 | 2014 | ||||||||||
| “Core Earnings” basis Private Education Loan yield |
6.26 | % | 6.10 | % | 6.27 | % | ||||||
| “Core Earnings” basis Private Education Loan cost of funds |
(2.70 | ) | (2.31 | ) | (2.23 | ) | ||||||
|
|
|
|
|
|
|
|||||||
| “Core Earnings” basis Private Education Loan spread |
3.56 | 3.79 | 4.04 | |||||||||
| “Core Earnings” basis other interest-earning asset spread impact |
(.15 | ) | (.12 | ) | (.10 | ) | ||||||
|
|
|
|
|
|
|
|||||||
| “Core Earnings” basis Private Education Loan net interest margin(1) |
3.41 | % | 3.67 | % | 3.94 | % | ||||||
|
|
|
|
|
|
|
|||||||
| “Core Earnings” basis Private Education Loan net interest margin(1) |
3.41 | % | 3.67 | % | 3.94 | % | ||||||
| Adjustment for GAAP accounting treatment(2) |
(.05 | ) | (.06 | ) | .12 | |||||||
|
|
|
|
|
|
|
|||||||
| GAAP basis Private Education Loan net interest margin(1) |
3.36 | % | 3.61 | % | 4.06 | % | ||||||
|
|
|
|
|
|
|
|||||||
| (1) | The average balances of our Private Education Loan “Core Earnings” basis interest-earning assets for the respective periods are: |
| Years Ended December 31, | ||||||||||||
| (Dollars in millions) |
2016 | 2015 | 2014 | |||||||||
| Private Education Loans |
$ | 25,361 | $ | 28,803 | $ | 31,243 | ||||||
| Other interest-earning assets |
584 | 548 | 494 | |||||||||
|
|
|
|
|
|
|
|||||||
| Total Private Education Loan “Core Earnings” basis interest-earning assets |
$ | 25,945 | $ | 29,351 | $ | 31,737 | ||||||
|
|
|
|
|
|
|
|||||||
| (2) | Represents the reclassification of periodic interest accruals on derivative contracts from net interest income to other income and other derivative accounting adjustments. For further discussion of these adjustments, see the section titled “‘Core Earnings’ — Definition and Limitations — Differences between ‘Core Earnings’ and GAAP.” |
The decline in the net interest margin from prior years primarily relates to an increase in the cost of funds as a result of higher funding credit spreads, as well as a widening of the asset and related funding interest rate indices in 2016.
The Company acquired $225 million of Private Education Loans in 2016. As of December 31, 2016, our Private Education Loan portfolio totaled $23.3 billion. The weighted-average life of this portfolio as of December 31, 2016 was 6.4 years assuming a CPR of 5 percent.
Private Education Loan Provision for Loan Losses
In establishing the allowance for Private Education Loan losses as of December 31, 2016, we considered several factors with respect to our Private Education Loan portfolio. Among these factors were: total loan delinquencies decreased to $1.64 billion, down $127 million from $1.77 billion in the prior year. Loan delinquencies of 90 days or more decreased to $801 million, down $45 million from $846 million in the prior year. In the second quarter of 2015, the portion of the loan amount charged off at default increased from 73 percent to 79 percent. This change resulted in a $330 million reduction to the balance of the receivable for partially charged-off loans. Excluding this amount, charge-offs decreased to $513 million, down $146 million from $659 million in the prior year. Loans in forbearance decreased to $790 million, down $183 million from $973 million in the prior year.
64
Table of Contents
The provision for Private Education Loan losses was $383 million in 2016, down $155 million from 2015 due to a 12 percent decrease in Private Education Loans outstanding and a $127 million reduction in delinquent loans compared to the prior year. The provision for loan losses was elevated in the year-ago period due to an increase in the amount of loans exiting deferment status in 2014 over prior years and those loans experiencing unfavorable credit trends compared to loans that exited deferment in prior years. These factors led to decreases in expected future charge-offs.
For a more detailed discussion of our policy for determining the collectability of Private Education Loans and maintaining our allowance for Private Education Loan losses, see the section titled “Critical Accounting Policies and Estimates — Allowance for Loan Losses.”
Losses on Sales of Loans and Investments
We recorded a $21 million loss on the sale of $178 million of Private Education Loans in 2015. There were no sales in 2016 or 2014.
Operating Expenses — Private Education Loans Segment
Operating expenses for our Private Education Loans segment include costs incurred to service and collect on our Private Education Loan portfolio. Operating expenses were $167 million, $168 million and $181 million for the years ended December 31, 2016, 2015 and 2014, respectively.
Business Services Segment
The following tables include “Core Earnings” results for our Business Services segment.
| Years Ended December 31, | % Increase (Decrease) | |||||||||||||||||||
| (Dollars in millions) |
2016 | 2015 | 2014 | 2016 vs. 2015 | 2015 vs. 2014 | |||||||||||||||
| Net interest income after provision |
$ | — | $ | — | $ | — | — | % | — | % | ||||||||||
| Servicing revenue: |
||||||||||||||||||||
| Intercompany loan servicing |
389 | 427 | 456 | (9 | ) | (6 | ) | |||||||||||||
| Third-party loan servicing |
212 | 191 | 176 | 11 | 9 | |||||||||||||||
| Guarantor servicing |
21 | 33 | 36 | (36 | ) | (8 | ) | |||||||||||||
| Other servicing |
2 | — | — | 100 | — | |||||||||||||||
|
|
|
|
|
|
|
|
|
|
|
|||||||||||
| Total servicing revenue |
624 | 651 | 668 | (4 | ) | (3 | ) | |||||||||||||
| Asset recovery and business processing revenue |
390 | 367 | 388 | 6 | (5 | ) | ||||||||||||||
| Other Business Services revenue |
— | 4 | 6 | (100 | ) | (33 | ) | |||||||||||||
|
|
|
|
|
|
|
|
|
|
|
|||||||||||
| Total other income |
1,014 | 1,022 | 1,062 | (1 | ) | (4 | ) | |||||||||||||
| Direct operating expenses |
524 | 485 | 389 | 8 | 25 | |||||||||||||||
|
|
|
|
|
|
|
|
|
|
|
|||||||||||
| Income before income tax expense |
490 | 537 | 673 | (9 | ) | (20 | ) | |||||||||||||
| Income tax expense |
182 | 199 | 248 | (9 | ) | (20 | ) | |||||||||||||
|
|
|
|
|
|
|
|
|
|
|
|||||||||||
| “Core Earnings” |
$ | 308 | $ | 338 | $ | 425 | (9 | )% | (20 | )% | ||||||||||
|
|
|
|
|
|
|
|
|
|
|
|||||||||||
“Core Earnings” were $308 million for 2016, compared with $338 million and $425 million in 2015 and 2014, respectively. The $30 million decrease in 2016 from 2015 was primarily the result of the decrease in intercompany loan servicing revenue related to the amortization of the portfolio, lower education loan-related asset recovery revenue in connection with lower volumes, and an increase in legal contingency expense of $17 million. The $87 million decrease in 2015 from 2014 was primarily the result of a $93 million reduction in asset recovery revenue related to legislative reductions in certain fees earned and a $23 million increase in third-
65
Table of Contents
party servicing and conversion expenses related to an $8.5 billion FFELP loan acquisition in the fourth quarter of 2014. Key segment metrics are as follows:
| As of December 31, |
||||||||||||
| (Dollars in billions) |
2016 | 2015 | 2014 | |||||||||
| Number of accounts serviced for ED (in millions) |
6.2 | 6.3 | 6.2 | |||||||||
| Total federal loans serviced |
$ | 293 | $ | 288 | $ | 276 | ||||||
| Contingent collections receivables inventory: |
||||||||||||
| Education loans |
$ | 9.9 | $ | 10.3 | $ | 12.5 | ||||||
| Other |
10.1 | 9.9 | 2.9 | |||||||||
|
|
|
|
|
|
|
|||||||
| Total contingent collections receivables inventory |
$ | 20.0 | $ | 20.2 | $ | 15.4 | ||||||
|
|
|
|
|
|
|
|||||||
Revenues related to services performed on FFELP Loans accounted for 66 percent, 71 percent and 77 percent of total Business Services segment revenues for the years ended December 31, 2016, 2015 and 2014, respectively.
Revenue
Servicing Revenue
Our Business Services segment includes intercompany loan servicing fees from servicing the FFELP Loans in our FFELP Loans segment. The average balance of this portfolio was $91 billion, $98 billion and $99 billion for the years ended December 31, 2016, 2015 and 2014, respectively. The decline in the intercompany loan servicing revenue from the year-ago periods was the primary reason for the decline in servicing revenue and was due to the decline in the average balance of FFELP Loans serviced as well as the decrease in the average servicing rate paid.
The Company services education loans for more than 12 million DSLP Loan, FFELP Loan and Private Education Loan customers (including cosigners), including 6.2 million customer accounts under the ED Servicing Contract as of December 31, 2016, compared with 6.3 million and 6.2 million customer accounts serviced at December 31, 2015 and 2014, respectively. Third-party loan servicing fees in the years ended December 31, 2016, 2015 and 2014 included $151 million, $139 million and $130 million, respectively, of servicing revenue related to the ED Servicing Contract. On June 13, 2014, ED extended its servicing contract with us to service DSLP Loans for five more years.
On April 4, 2016, ED published the first part of a two-part RFP related to a new servicing platform for the Direct Student Loan Program. The first part of the RFP focused on screening candidates’ capabilities relative to certain published criteria. In July 2016, Navient was selected as one of three companies eligible to submit responses in the second part of the RFP process. On October 26, 2016, ED published the second part of the RFP for which we submitted our bid on January 9, 2017. We have been informed that one of the two other bidders filed a bid protest in relation to this RFP on January 5, 2017.
Asset Recovery and Business Processing Revenue
Our asset recovery and business processing revenue consists of fees we receive for asset recovery of delinquent and defaulted debt on behalf of third-party clients performed on a contingent basis. Business processing revenue consists of fees we earn processing transactions on behalf of our municipal, public authority and health care clients. Asset recovery and business processing revenue increased $23 million from 2015 to 2016 primarily due to additional revenue from Gila LLC (acquired in February 2015) and from Xtend Healthcare (acquired in October 2015), which was offset by a reduction in revenue related to a decrease in education loan-related asset recovery volume, mostly related to the ED contract discussed below. Asset recovery and business
66
Table of Contents
processing revenue decreased $21 million in 2015 compared with 2014, primarily as a result of the Bipartisan Budget Act (the “Budget Act”) enacted on December 26, 2013 and effective on July 1, 2014, which reduced the amount paid to Guarantor agencies for defaulted FFELP Loans that are rehabilitated. This legislative reduction in fees represents $79 million of the decrease in asset recovery revenue from 2014 to 2015, partially offset by $69 million of additional revenue (which is mostly business processing related) from Gila LLC and Xtend Healthcare.
Since 1997, Navient has provided asset recovery services on defaulted education loans to ED. This contract expired by its terms on February 21, 2015 and our Pioneer Credit Recovery (“Pioneer”) subsidiary received no new account placements under the contract. We engaged with ED to learn more about their decision and address any questions or concerns they may have. In addition, on March 9, 2015, Pioneer filed a bid protest with the U.S. Government Accountability Office (“GAO”). This bid protest was dismissed on March 13, 2015 from the GAO based upon overlapping jurisdiction. Following the bid protest dismissal, Pioneer filed its own complaint with the U.S. Court of Federal Claims, which complaint was consolidated with several similar cases filed by other private collection agencies. On April 16, 2015, Pioneer’s complaint, together with the other plaintiffs’ consolidated complaints, was dismissed for lack of jurisdiction. We appealed this decision to the United States Court of Appeals for the Federal Circuit and, on July 16, 2016, the Court of Appeals reversed the ruling of the Federal Court of Claims and remanded the case for further proceedings.
Separately, we had submitted a response to ED’s RFP in relation to a new contract for similar services. On December 9, 2016, Navient was informed by ED that neither of our subsidiaries, Pioneer nor General Revenue Corporation (“GRC”), was awarded a contract to perform collections and loan rehabilitation services for federal student loan borrowers. In December 2016, both Pioneer and GRC filed bid protests with the GAO. GRC’s bid protest was dismissed in part in January 2017 and GRC filed a supplemental protest. These matters are still outstanding.
In December 2016, Great Lakes Higher Education Assistance Corp. (“Great Lakes”) assumed control of United Student Aid Funds, Inc. (“USAF”). As part of this transfer, Great Lakes notified us of their intent to rebid the services we currently provide for USAF and Northwest Education Loan Association (“NELA”). The services we provide primarily relate to FFELP-related servicing and asset recovery services. Prior to this announcement, Navient had not provided these services directly to Great Lakes. If we are unsuccessful in our efforts to win these services along with additional opportunities with Great Lakes, the current agreements would be terminated effective as of December 31, 2017.
Operating Expenses — Business Services Segment
Operating expenses for our Business Services segment primarily include costs incurred to service our FFELP Loan portfolio, third-party servicing and asset recovery and business processing costs, and other operating costs. The $39 million increase in operating expenses in 2016 compared with 2015 was primarily due to increases in operating costs related to Gila LLC, acquired in February 2015, and to Xtend Healthcare, acquired in October 2015, as well as a $17 million increase in legal contingency expense. These increases were partially offset by a general reduction in costs primarily related to operating efficiency initiatives as well as reduced education loan related asset recovery volumes. The $96 million increase in operating expenses in 2015 compared with 2014 was primarily due to operating costs related to Gila LLC and Xtend Healthcare, as well as incremental third-party servicing and conversion expenses related to an $8.5 billion loan acquisition in fourth-quarter 2014.
67
Table of Contents
Other Segment
The following table includes “Core Earnings” results for our Other segment.
| Years Ended December 31, | % Increase (Decrease) | |||||||||||||||||||
| (Dollars in millions) |
2016 | 2015 | 2014 | 2016 vs. 2015 | 2015 vs. 2014 | |||||||||||||||
| Net interest loss after provision for loan losses |
$ | (103 | ) | $ | (100 | ) | $ | (101 | ) | 3 | % | (1 | )% | |||||||
| Other income |
14 | 11 | 26 | 27 | (58 | ) | ||||||||||||||
| Gains on debt repurchases |
1 | 21 | — | (95 | ) | 100 | ||||||||||||||
|
|
|
|
|
|
|
|
|
|
|
|||||||||||
| Total other income |
15 | 32 | 26 | (53 | ) | 23 | ||||||||||||||
| Direct operating expenses |
28 | 30 | 132 | (7 | ) | (77 | ) | |||||||||||||
| Overhead expenses: |
||||||||||||||||||||
| Corporate overhead |
112 | 100 | 97 | 12 | 3 | |||||||||||||||
| Unallocated information technology costs |
108 | 119 | 103 | (9 | ) | 16 | ||||||||||||||
|
|
|
|
|
|
|
|
|
|
|
|||||||||||
| Total overhead expenses |
220 | 219 | 200 | — | 10 | |||||||||||||||
|
|
|
|
|
|
|
|
|
|
|
|||||||||||
| Total operating expenses |
248 | 249 | 332 | — | (25 | ) | ||||||||||||||
|
|
|
|
|
|
|
|
|
|
|
|||||||||||
| Loss from continuing operations, before income tax benefit |
(336 | ) | (317 | ) | (407 | ) | 6 | (22 | ) | |||||||||||
| Income tax benefit |
(124 | ) | (118 | ) | (150 | ) | 5 | (21 | ) | |||||||||||
|
|
|
|
|
|
|
|
|
|
|
|||||||||||
| Net loss from continuing operations |
(212 | ) | (199 | ) | (257 | ) | 7 | (23 | ) | |||||||||||
| Income from discontinued operations, net of tax expense |
— | 1 | — | (100 | ) | 100 | ||||||||||||||
|
|
|
|
|
|
|
|
|
|
|
|||||||||||
| “Core Earnings” net loss |
$ | (212 | ) | $ | (198 | ) | $ | (257 | ) | 7 | % | (23 | )% | |||||||
|
|
|
|
|
|
|
|
|
|
|
|||||||||||
Net Interest Loss after Provision for Loan Losses
Net interest loss after provision for loan losses includes net interest loss related to our corporate liquidity portfolio, partially offset by net interest income related to our mortgage and consumer loan portfolios.
Gains on Debt Repurchases
We repurchased $1.5 billion, $1.7 billion and $548 million face amount of our senior unsecured debt in 2016, 2015 and 2014, respectively. Debt repurchase activity will fluctuate based on market fundamentals and our liability management strategy.
Other Income — Other Segment
The decrease in other income from 2014 to 2015 is primarily due to income earned in 2014 for services provided to SLM BankCo under various transition services agreements entered into in connection with the Spin-Off.
Direct Operating Expenses — Other Segment
In 2016, 2015 and 2014, we recognized $17 million, $19 million and $120 million, respectively, of regulatory-related costs. Regulatory-related costs include actual settlement amounts as well as third-party professional fees we incur in connection with regulatory matters (for additional information, see Item 3. “Legal Proceedings — Regulatory Matters”). These costs were the primary driver of the change in operating expenses from 2014 to 2015.
Overhead — Other Segment
Unallocated corporate overhead is comprised of costs related to executive management, the board of directors, accounting, finance, legal, human resources and stock-based compensation expense. Unallocated information
68
Table of Contents
technology costs are related to infrastructure and operations. The increase in overhead expenses in 2015 from 2014 is primarily due to incremental costs post-Spin-Off resulting from operating as a new separate company.
Financial Condition
This section provides additional information regarding the changes related to our loan portfolio assets and related liabilities as well as credit performance indicators related to our loan portfolio.
Average Balance Sheets — GAAP
The following table reflects the rates earned on interest-earning assets and paid on interest-bearing liabilities and reflects our net interest margin on a consolidated basis.
| Years Ended December 31, | ||||||||||||||||||||||||
| 2016 | 2015 | 2014 | ||||||||||||||||||||||
| (Dollars in millions) |
Balance | Rate | Balance | Rate | Balance | Rate | ||||||||||||||||||
| Average Assets |
||||||||||||||||||||||||
| FFELP Loans |
$ | 92,497 | 2.73 | % | $ | 100,421 | 2.51 | % | $ | 100,662 | 2.54 | % | ||||||||||||
| Private Education Loans |
25,361 | 6.26 | 28,803 | 6.10 | 33,672 | 6.40 | ||||||||||||||||||
| Other loans |
90 | 10.06 | 76 | 9.25 | 92 | 9.36 | ||||||||||||||||||
| Cash and investments |
5,304 | .41 | 6,126 | .13 | 6,971 | .14 | ||||||||||||||||||
|
|
|
|
|
|
|
|
|
|
|
|
|
|||||||||||||
| Total interest-earning assets |
123,252 | 3.36 | % | 135,426 | 3.17 | % | 141,397 | 3.34 | % | |||||||||||||||
|
|
|
|
|
|
|
|||||||||||||||||||
| Non-interest-earning assets |
3,962 | 4,190 | 3,498 | |||||||||||||||||||||
|
|
|
|
|
|
|
|||||||||||||||||||
| Total assets |
$ | 127,214 | $ | 139,616 | $ | 144,895 | ||||||||||||||||||
|
|
|
|
|
|
|
|||||||||||||||||||
| Average Liabilities and Equity |
||||||||||||||||||||||||
| Short-term borrowings |
$ | 2,092 | 3.13 | % | $ | 3,167 | 2.37 | % | $ | 7,541 | .77 | % | ||||||||||||
| Long-term borrowings |
118,973 | 2.00 | 129,817 | 1.54 | 130,250 | 1.54 | ||||||||||||||||||
|
|
|
|
|
|
|
|
|
|
|
|
|
|||||||||||||
| Total interest-bearing liabilities |
121,065 | 2.02 | % | 132,984 | 1.56 | % | 137,791 | 1.50 | % | |||||||||||||||
|
|
|
|
|
|
|
|||||||||||||||||||
| Non-interest-bearing liabilities |
2,433 | 2,692 | 2,575 | |||||||||||||||||||||
| Equity |
3,716 | 3,940 | 4,529 | |||||||||||||||||||||
|
|
|
|
|
|
|
|||||||||||||||||||
| Total liabilities and equity |
$ | 127,214 | $ | 139,616 | $ | 144,895 | ||||||||||||||||||
|
|
|
|
|
|
|
|||||||||||||||||||
| Net interest margin |
1.38 | % | 1.64 | % | 1.89 | % | ||||||||||||||||||
|
|
|
|
|
|
|
|||||||||||||||||||
Rate/Volume Analysis — GAAP
The following rate/volume analysis shows the relative contribution of changes in interest rates and asset volumes.
| Increase (Decrease) |
Change Due To(1) | |||||||||||
| (Dollars in millions) |
Rate | Volume | ||||||||||
| 2016 vs. 2015 |
||||||||||||
| Interest income |
$ | (149 | ) | $ | 251 | $ | (400 | ) | ||||
| Interest expense |
367 | 566 | (199 | ) | ||||||||
|
|
|
|
|
|
|
|||||||
| Net interest income |
$ | (516 | ) | $ | (315 | ) | $ | (201 | ) | |||
|
|
|
|
|
|
|
|||||||
| 2015 vs. 2014 |
||||||||||||
| Interest income |
$ | (435 | ) | $ | (240 | ) | $ | (195 | ) | |||
| Interest expense |
11 | 84 | (73 | ) | ||||||||
|
|
|
|
|
|
|
|||||||
| Net interest income |
$ | (446 | ) | $ | (324 | ) | $ | (122 | ) | |||
|
|
|
|
|
|
|
|||||||
| (1) | Changes in income and expense due to both rate and volume have been allocated in proportion to the relationship of the absolute dollar amounts of the change in each. |
69
Table of Contents
Summary of our Education Loan Portfolio
Ending Education Loan Balances, net — GAAP Basis
| December 31, 2016 | ||||||||||||||||||||
| (Dollars in millions) |
FFELP Stafford and Other |
FFELP Consolidation Loans |
Total FFELP Loans |
Private Education Loans |
Total Portfolio |
|||||||||||||||
| Total education loan portfolio: |
||||||||||||||||||||
| In-school(1) |
$ | 148 | $ | — | $ | 148 | $ | 104 | $ | 252 | ||||||||||
| Grace, repayment and other(2) |
31,700 | 55,070 | 86,770 | 24,229 | 110,999 | |||||||||||||||
|
|
|
|
|
|
|
|
|
|
|
|||||||||||
| Total, gross |
31,848 | 55,070 | 86,918 | 24,333 | 111,251 | |||||||||||||||
| Unamortized premium/(discount) |
510 | 369 | 879 | (457 | ) | 422 | ||||||||||||||
| Receivable for partially charged-off loans |
— | — | — | 815 | 815 | |||||||||||||||
| Allowance for loan losses |
(39 | ) | (28 | ) | (67 | ) | (1,351 | ) | (1,418 | ) | ||||||||||
|
|
|
|
|
|
|
|
|
|
|
|||||||||||
| Total education loan portfolio |
$ | 32,319 | $ | 55,411 | $ | 87,730 | $ | 23,340 | $ | 111,070 | ||||||||||
|
|
|
|
|
|
|
|
|
|
|
|||||||||||
| % of total FFELP |
37 | % | 63 | % | 100 | % | ||||||||||||||
| % of total |
29 | % | 50 | % | 79 | % | 21 | % | 100 | % | ||||||||||
| December 31, 2015 | ||||||||||||||||||||
| (Dollars in millions) |
FFELP Stafford and Other |
FFELP Consolidation Loans |
Total FFELP Loans |
Private Education Loans |
Total Portfolio |
|||||||||||||||
| Total education loan portfolio: |
||||||||||||||||||||
| In-school(1) |
$ | 259 | $ | — | $ | 259 | $ | 216 | $ | 475 | ||||||||||
| Grace, repayment and other(2) |
36,016 | 59,118 | 95,134 | 27,299 | 122,433 | |||||||||||||||
|
|
|
|
|
|
|
|
|
|
|
|||||||||||
| Total, gross |
36,275 | 59,118 | 95,393 | 27,515 | 122,908 | |||||||||||||||
| Unamortized premium/(discount) |
627 | 460 | 1,087 | (531 | ) | 556 | ||||||||||||||
| Receivable for partially charged-off loans |
— | — | — | 881 | 881 | |||||||||||||||
| Allowance for loan losses |
(48 | ) | (30 | ) | (78 | ) | (1,471 | ) | (1,549 | ) | ||||||||||
|
|
|
|
|
|
|
|
|
|
|
|||||||||||
| Total education loan portfolio |
$ | 36,854 | $ | 59,548 | $ | 96,402 | $ | 26,394 | $ | 122,796 | ||||||||||
|
|
|
|
|
|
|
|
|
|
|
|||||||||||
| % of total FFELP |
38 | % | 62 | % | 100 | % | ||||||||||||||
| % of total |
30 | % | 48 | % | 78 | % | 22 | % | 100 | % | ||||||||||
| December 31, 2014 | ||||||||||||||||||||
| (Dollars in millions) |
FFELP Stafford and Other |
FFELP Consolidation Loans |
Total FFELP Loans |
Private Education Loans |
Total Portfolio |
|||||||||||||||
| Total education loan portfolio: |
||||||||||||||||||||
| In-school(1) |
$ | 488 | $ | — | $ | 488 | $ | 436 | $ | 924 | ||||||||||
| Grace, repayment and other(2) |
39,882 | 62,992 | 102,874 | 30,625 | 133,499 | |||||||||||||||
|
|
|
|
|
|
|
|
|
|
|
|||||||||||
| Total, gross |
40,370 | 62,992 | 103,362 | 31,061 | 134,423 | |||||||||||||||
| Unamortized premium/(discount) |
677 | 499 | 1,176 | (594 | ) | 582 | ||||||||||||||
| Receivable for partially charged-off loans |
— | — | — | 1,245 | 1,245 | |||||||||||||||
| Allowance for loan losses |
(58 | ) | (35 | ) | (93 | ) | (1,916 | ) | (2,009 | ) | ||||||||||
|
|
|
|
|
|
|
|
|
|
|
|||||||||||
| Total education loan portfolio |
$ | 40,989 | $ | 63,456 | $ | 104,445 | $ | 29,796 | $ | 134,241 | ||||||||||
|
|
|
|
|
|
|
|
|
|
|
|||||||||||
| % of total FFELP |
39 | % | 61 | % | 100 | % | ||||||||||||||
| % of total |
31 | % | 47 | % | 78 | % | 22 | % | 100 | % | ||||||||||
| (1) | Loans for customers still attending school and are not yet required to make payments on the loan. |
| (2) | Includes loans in deferment or forbearance. |
70
Table of Contents
| December 31, 2013 | ||||||||||||||||||||
| (Dollars in millions) |
FFELP Stafford and Other |
FFELP Consolidation Loans |
Total FFELP Loans |
Private Education Loans |
Total Portfolio |
|||||||||||||||
| Total education loan portfolio: |
||||||||||||||||||||
| In-school(1) |
$ | 742 | $ | — | $ | 742 | $ | 2,629 | $ | 3,371 | ||||||||||
| Grace, repayment and other(2) |
38,695 | 64,178 | 102,873 | 36,371 | 139,244 | |||||||||||||||
|
|
|
|
|
|
|
|
|
|
|
|||||||||||
| Total, gross |
39,437 | 64,178 | 103,615 | 39,000 | 142,615 | |||||||||||||||
| Unamortized premium/(discount) |
602 | 433 | 1,035 | (704 | ) | 331 | ||||||||||||||
| Receivable for partially charged-off loans |
— | — | — | 1,313 | 1,313 | |||||||||||||||
| Allowance for loan losses |
(75 | ) | (44 | ) | (119 | ) | (2,097 | ) | (2,216 | ) | ||||||||||
|
|
|
|
|
|
|
|
|
|
|
|||||||||||
| Total education loan portfolio |
$ | 39,964 | $ | 64,567 | $ | 104,531 | $ | 37,512 | $ | 142,043 | ||||||||||
|
|
|
|
|
|
|
|
|
|
|
|||||||||||
| % of total FFELP |
38 | % | 62 | % | 100 | % | ||||||||||||||
| % of total |
29 | % | 45 | % | 74 | % | 26 | % | 100 | % | ||||||||||
| December 31, 2012 | ||||||||||||||||||||
| (Dollars in millions) |
FFELP Stafford and Other |
FFELP Consolidation Loans |
Total FFELP Loans |
Private Education Loans |
Total Portfolio |
|||||||||||||||
| Total education loan portfolio: |
||||||||||||||||||||
| In-school(1) |
$ | 1,506 | $ | — | $ | 1,506 | $ | 2,194 | $ | 3,700 | ||||||||||
| Grace, repayment and other(2) |
42,189 | 80,640 | 122,829 | 36,360 | 159,189 | |||||||||||||||
|
|
|
|
|
|
|
|
|
|
|
|||||||||||
| Total, gross |
43,695 | 80,640 | 124,335 | 38,554 | 162,889 | |||||||||||||||
| Unamortized premium/(discount) |
691 | 745 | 1,436 | (796 | ) | 640 | ||||||||||||||
| Receivable for partially charged-off loans |
— | — | — | 1,347 | 1,347 | |||||||||||||||
| Allowance for loan losses |
(97 | ) | (62 | ) | (159 | ) | (2,171 | ) | (2,330 | ) | ||||||||||
|
|
|
|
|
|
|
|
|
|
|
|||||||||||
| Total education loan portfolio |
$ | 44,289 | $ | 81,323 | $ | 125,612 | $ | 36,934 | $ | 162,546 | ||||||||||
|
|
|
|
|
|
|
|
|
|
|
|||||||||||
| % of total FFELP |
35 | % | 65 | % | 100 | % | ||||||||||||||
| % of total |
27 | % | 50 | % | 77 | % | 23 | % | 100 | % | ||||||||||
| (1) | Loans for customers still attending school and are not yet required to make payments on the loan. |
| (2) | Includes loans in deferment or forbearance. |
71
Table of Contents
Ending Education Loan Balances, net — “Core Earnings” Basis
| December 31, 2016 | ||||||||||||||||||||
| (Dollars in millions) |
FFELP Stafford and Other |
FFELP Consolidation Loans |
Total FFELP Loans |
Private Education Loans |
Total Portfolio |
|||||||||||||||
| Total education loan portfolio: |
||||||||||||||||||||
| In-school(1) |
$ | 148 | $ | — | $ | 148 | $ | 104 | $ | 252 | ||||||||||
| Grace, repayment and other(2) |
31,700 | 55,070 | 86,770 | 24,229 | 110,999 | |||||||||||||||
|
|
|
|
|
|
|
|
|
|
|
|||||||||||
| Total, gross |
31,848 | 55,070 | 86,918 | 24,333 | 111,251 | |||||||||||||||
| Unamortized premium/(discount) |
510 | 369 | 879 | (457 | ) | 422 | ||||||||||||||
| Receivable for partially charged-off loans |
— | — | — | 815 | 815 | |||||||||||||||
| Allowance for loan losses |
(39 | ) | (28 | ) | (67 | ) | (1,351 | ) | (1,418 | ) | ||||||||||
|
|
|
|
|
|
|
|
|
|
|
|||||||||||
| Total education loan portfolio |
$ | 32,319 | $ | 55,411 | $ | 87,730 | $ | 23,340 | $ | 111,070 | ||||||||||
|
|
|
|
|
|
|
|
|
|
|
|||||||||||
| % of total FFELP |
37 | % | 63 | % | 100 | % | ||||||||||||||
| % of total |
29 | % | 50 | % | 79 | % | 21 | % | 100 | % | ||||||||||
| December 31, 2015 | ||||||||||||||||||||
| (Dollars in millions) |
FFELP Stafford and Other |
FFELP Consolidation Loans |
Total FFELP Loans |
Private Education Loans |
Total Portfolio |
|||||||||||||||
| Total education loan portfolio: |
||||||||||||||||||||
| In-school(1) |
$ | 259 | $ | — | $ | 259 | $ | 216 | $ | 475 | ||||||||||
| Grace, repayment and other(2) |
36,016 | 59,118 | 95,134 | 27,299 | 122,433 | |||||||||||||||
|
|
|
|
|
|
|
|
|
|
|
|||||||||||
| Total, gross |
36,275 | 59,118 | 95,393 | 27,515 | 122,908 | |||||||||||||||
| Unamortized premium/(discount) |
627 | 460 | 1,087 | (531 | ) | 556 | ||||||||||||||
| Receivable for partially charged-off loans |
— | — | — | 881 | 881 | |||||||||||||||
| Allowance for loan losses |
(48 | ) | (30 | ) | (78 | ) | (1,471 | ) | (1,549 | ) | ||||||||||
|
|
|
|
|
|
|
|
|
|
|
|||||||||||
| Total education loan portfolio |
$ | 36,854 | $ | 59,548 | $ | 96,402 | $ | 26,394 | $ | 122,796 | ||||||||||
|
|
|
|
|
|
|
|
|
|
|
|||||||||||
| % of total FFELP |
38 | % | 62 | % | 100 | % | ||||||||||||||
| % of total |
30 | % | 48 | % | 78 | % | 22 | % | 100 | % | ||||||||||
| December 31, 2014 | ||||||||||||||||||||
| (Dollars in millions) |
FFELP Stafford and Other |
FFELP Consolidation Loans |
Total FFELP Loans |
Private Education Loans |
Total Portfolio |
|||||||||||||||
| Total education loan portfolio: |
||||||||||||||||||||
| In-school(1) |
$ | 488 | $ | — | $ | 488 | $ | 436 | $ | 924 | ||||||||||
| Grace, repayment and other(2) |
39,882 | 62,992 | 102,874 | 30,625 | 133,499 | |||||||||||||||
|
|
|
|
|
|
|
|
|
|
|
|||||||||||
| Total, gross |
40,370 | 62,992 | 103,362 | 31,061 | 134,423 | |||||||||||||||
| Unamortized premium/(discount) |
677 | 499 | 1,176 | (594 | ) | 582 | ||||||||||||||
| Receivable for partially charged-off loans |
— | — | — | 1,245 | 1,245 | |||||||||||||||
| Allowance for loan losses |
(58 | ) | (35 | ) | (93 | ) | (1,916 | ) | (2,009 | ) | ||||||||||
|
|
|
|
|
|
|
|
|
|
|
|||||||||||
| Total education loan portfolio |
$ | 40,989 | $ | 63,456 | $ | 104,445 | $ | 29,796 | $ | 134,241 | ||||||||||
|
|
|
|
|
|
|
|
|
|
|
|||||||||||
| % of total FFELP |
39 | % | 61 | % | 100 | % | ||||||||||||||
| % of total |
31 | % | 47 | % | 78 | % | 22 | % | 100 | % | ||||||||||
| (1) | Loans for customers still attending school and are not yet required to make payments on the loan. |
| (2) | Includes loans in deferment or forbearance. |
72
Table of Contents
| December 31, 2013 | ||||||||||||||||||||
| (Dollars in millions) |
FFELP Stafford and Other |
FFELP Consolidation Loans |
Total FFELP Loans |
Private Education Loans |
Total Portfolio |
|||||||||||||||
| Total education loan portfolio: |
||||||||||||||||||||
| In-school(1) |
$ | 739 | $ | — | $ | 739 | $ | 438 | $ | 1,177 | ||||||||||
| Grace, repayment and other(2) |
38,175 | 63,274 | 101,449 | 31,999 | 133,448 | |||||||||||||||
|
|
|
|
|
|
|
|
|
|
|
|||||||||||
| Total, gross |
38,914 | 63,274 | 102,188 | 32,437 | 134,625 | |||||||||||||||
| Unamortized premium/(discount) |
601 | 430 | 1,031 | (709 | ) | 322 | ||||||||||||||
| Receivable for partially charged-off loans |
— | — | — | 1,313 | 1,313 | |||||||||||||||
| Allowance for loan losses |
(73 | ) | (40 | ) | (113 | ) | (2,035 | ) | (2,148 | ) | ||||||||||
|
|
|
|
|
|
|
|
|
|
|
|||||||||||
| Total education loan portfolio |
$ | 39,442 | $ | 63,664 | $ | 103,106 | $ | 31,006 | $ | 134,112 | ||||||||||
|
|
|
|
|
|
|
|
|
|
|
|||||||||||
| % of total FFELP |
38 | % | 62 | % | 100 | % | ||||||||||||||
| % of total |
30 | % | 47 | % | 77 | % | 23 | % | 100 | % | ||||||||||
| December 31, 2012 | ||||||||||||||||||||
| (Dollars in millions) |
FFELP Stafford and Other |
FFELP Consolidation Loans |
Total FFELP Loans |
Private Education Loans |
Total Portfolio |
|||||||||||||||
| Total education loan portfolio: |
||||||||||||||||||||
| In-school(1) |
$ | 1,501 | $ | — | $ | 1,501 | $ | 674 | $ | 2,175 | ||||||||||
| Grace, repayment and other(2) |
41,836 | 79,955 | 121,791 | 32,372 | 154,163 | |||||||||||||||
|
|
|
|
|
|
|
|
|
|
|
|||||||||||
| Total, gross |
43,337 | 79,955 | 123,292 | 33,046 | 156,338 | |||||||||||||||
| Unamortized premium/(discount) |
690 | 745 | 1,435 | (801 | ) | 634 | ||||||||||||||
| Receivable for partially charged-off loans |
— | — | — | 1,347 | 1,347 | |||||||||||||||
| Allowance for loan losses |
(95 | ) | (60 | ) | (155 | ) | (2,106 | ) | (2,261 | ) | ||||||||||
|
|
|
|
|
|
|
|
|
|
|
|||||||||||
| Total education loan portfolio |
$ | 43,932 | $ | 80,640 | $ | 124,572 | $ | 31,486 | $ | 156,058 | ||||||||||
|
|
|
|
|
|
|
|
|
|
|
|||||||||||
| % of total FFELP |
35 | % | 65 | % | 100 | % | ||||||||||||||
| % of total |
28 | % | 52 | % | 80 | % | 20 | % | 100 | % | ||||||||||
| (1) | Loans for customers still attending school and are not yet required to make payments on the loan. |
| (2) | Includes loans in deferment or forbearance. |
73
Table of Contents
Average Education Loan Balances (net of unamortized premium/discount) — GAAP Basis
| Year Ended December 31, 2016 | ||||||||||||||||||||
| (Dollars in millions) |
FFELP Stafford and Other |
FFELP Consolidation Loans |
Total FFELP Loans |
Private Education Loans |
Total Portfolio |
|||||||||||||||
| Total |
$ | 34,710 | $ | 57,787 | $ | 92,497 | $ | 25,361 | $ | 117,858 | ||||||||||
| % of FFELP |
38 | % | 62 | % | 100 | % | ||||||||||||||
| % of total |
29 | % | 49 | % | 78 | % | 22 | % | 100 | % | ||||||||||
| Year Ended December 31, 2015 | ||||||||||||||||||||
| (Dollars in millions) |
FFELP Stafford and Other |
FFELP Consolidation Loans |
Total FFELP Loans |
Private Education Loans |
Total Portfolio |
|||||||||||||||
| Total |
$ | 38,932 | $ | 61,489 | $ | 100,421 | $ | 28,803 | $ | 129,224 | ||||||||||
| % of FFELP |
39 | % | 61 | % | 100 | % | ||||||||||||||
| % of total |
30 | % | 48 | % | 78 | % | 22 | % | 100 | % | ||||||||||
| Year Ended December 31, 2014 | ||||||||||||||||||||
| (Dollars in millions) |
FFELP Stafford and Other |
FFELP Consolidation Loans |
Total FFELP Loans |
Private Education Loans |
Total Portfolio |
|||||||||||||||
| Total |
$ | 38,335 | $ | 62,327 | $ | 100,662 | $ | 33,672 | $ | 134,334 | ||||||||||
| % of FFELP |
38 | % | 62 | % | 100 | % | ||||||||||||||
| % of total |
29 | % | 46 | % | 75 | % | 25 | % | 100 | % | ||||||||||
Average Education Loan Balances (net of unamortized premium/discount) — “Core Earnings” Basis
| Year Ended December 31, 2016 | ||||||||||||||||||||
| (Dollars in millions) |
FFELP Stafford and Other |
FFELP Consolidation Loans |
Total FFELP Loans |
Private Education Loans |
Total Portfolio |
|||||||||||||||
| Total |
$ | 34,710 | $ | 57,787 | $ | 92,497 | $ | 25,361 | $ | 117,858 | ||||||||||
| % of FFELP |
38 | % | 62 | % | 100 | % | ||||||||||||||
| % of total |
29 | % | 49 | % | 78 | % | 22 | % | 100 | % | ||||||||||
| Year Ended December 31, 2015 | ||||||||||||||||||||
| (Dollars in millions) |
FFELP Stafford and Other |
FFELP Consolidation Loans |
Total FFELP Loans |
Private Education Loans |
Total Portfolio |
|||||||||||||||
| Total |
$ | 38,932 | $ | 61,489 | $ | 100,421 | $ | 28,803 | $ | 129,224 | ||||||||||
| % of FFELP |
39 | % | 61 | % | 100 | % | ||||||||||||||
| % of total |
30 | % | 48 | % | 78 | % | 22 | % | 100 | % | ||||||||||
| Year Ended December 31, 2014 | ||||||||||||||||||||
| (Dollars in millions) |
FFELP Stafford and Other |
FFELP Consolidation Loans |
Total FFELP Loans |
Private Education Loans |
Total Portfolio |
|||||||||||||||
| Total |
$ | 38,168 | $ | 62,034 | $ | 100,202 | $ | 31,243 | $ | 131,445 | ||||||||||
| % of FFELP |
38 | % | 62 | % | 100 | % | ||||||||||||||
| % of total |
29 | % | 47 | % | 76 | % | 24 | % | 100 | % | ||||||||||
74
Table of Contents
Education Loan Activity — GAAP Basis
| Year Ended December 31, 2016 | ||||||||||||||||||||
| (Dollars in millions) |
FFELP Stafford and Other |
FFELP Consolidation Loans |
Total FFELP Loans |
Private Education Loans |
Total Portfolio |
|||||||||||||||
| Beginning balance |
$ | 36,854 | $ | 59,548 | $ | 96,402 | $ | 26,394 | $ | 122,796 | ||||||||||
| Acquisitions |
1,312 | 2,146 | 3,458 | 225 | 3,683 | |||||||||||||||
| Capitalized interest and premium/discount amortization |
1,006 | 1,024 | 2,030 | 418 | 2,448 | |||||||||||||||
| Consolidations to third parties |
(2,821 | ) | (2,412 | ) | (5,233 | ) | (506 | ) | (5,739 | ) | ||||||||||
| Repayments and other |
(4,032 | ) | (4,895 | ) | (8,927 | ) | (3,191 | ) | (12,118 | ) | ||||||||||
|
|
|
|
|
|
|
|
|
|
|
|||||||||||
| Ending balance |
$ | 32,319 | $ | 55,411 | $ | 87,730 | $ | 23,340 | $ | 111,070 | ||||||||||
|
|
|
|
|
|
|
|
|
|
|
|||||||||||
| Year Ended December 31, 2015 | ||||||||||||||||||||
| (Dollars in millions) |
FFELP Stafford and Other |
FFELP Consolidation Loans |
Total FFELP Loans |
Private Education Loans |
Total Portfolio |
|||||||||||||||
| Beginning balance |
$ | 40,989 | $ | 63,456 | $ | 104,445 | $ | 29,796 | $ | 134,241 | ||||||||||
| Acquisitions |
2,047 | 1,671 | 3,718 | 18 | 3,736 | |||||||||||||||
| Capitalized interest and premium/discount amortization |
1,180 | 1,110 | 2,290 | 522 | 2,812 | |||||||||||||||
| Consolidations to third parties |
(2,545 | ) | (1,924 | ) | (4,469 | ) | (227 | ) | (4,696 | ) | ||||||||||
| Loan sales |
(316 | ) | (85 | ) | (401 | ) | (176 | ) | (577 | ) | ||||||||||
| Repayments and other |
(4,501 | ) | (4,680 | ) | (9,181 | ) | (3,539 | ) | (12,720 | ) | ||||||||||
|
|
|
|
|
|
|
|
|
|
|
|||||||||||
| Ending balance |
$ | 36,854 | $ | 59,548 | $ | 96,402 | $ | 26,394 | $ | 122,796 | ||||||||||
|
|
|
|
|
|
|
|
|
|
|
|||||||||||
| Year Ended December 31, 2014 | ||||||||||||||||||||
| (Dollars in millions) |
FFELP Stafford and Other |
FFELP Consolidation Loans |
Total FFELP Loans |
Private Education Loans |
Total Portfolio |
|||||||||||||||
| Beginning balance |
$ | 39,964 | $ | 64,567 | $ | 104,531 | $ | 37,512 | $ | 142,043 | ||||||||||
| Acquisitions |
6,566 | 4,733 | 11,299 | 2,504 | 13,803 | |||||||||||||||
| Capitalized interest and premium/discount amortization |
1,165 | 1,110 | 2,275 | 693 | 2,968 | |||||||||||||||
| Consolidations to third parties |
(2,081 | ) | (1,610 | ) | (3,691 | ) | (111 | ) | (3,802 | ) | ||||||||||
| Distribution of SLM BankCo |
(495 | ) | (885 | ) | (1,380 | ) | (7,204 | ) | (8,584 | ) | ||||||||||
| Repayments and other |
(4,130 | ) | (4,459 | ) | (8,589 | ) | (3,598 | ) | (12,187 | ) | ||||||||||
|
|
|
|
|
|
|
|
|
|
|
|||||||||||
| Ending balance |
$ | 40,989 | $ | 63,456 | $ | 104,445 | $ | 29,796 | $ | 134,241 | ||||||||||
|
|
|
|
|
|
|
|
|
|
|
|||||||||||
75
Table of Contents
Education Loan Activity — “Core Earnings” Basis
| Year Ended December 31, 2016 | ||||||||||||||||||||
| (Dollars in millions) |
FFELP Stafford and Other |
FFELP Consolidation Loans |
Total FFELP Loans |
Private Education Loans |
Total Portfolio |
|||||||||||||||
| Beginning balance |
$ | 36,854 | $ | 59,548 | $ | 96,402 | $ | 26,394 | $ | 122,796 | ||||||||||
| Acquisitions |
1,312 | 2,146 | 3,458 | 225 | 3,683 | |||||||||||||||
| Capitalized interest and premium/discount amortization |
1,006 | 1,024 | 2,030 | 418 | 2,448 | |||||||||||||||
| Consolidations to third parties |
(2,821 | ) | (2,412 | ) | (5,233 | ) | (506 | ) | (5,739 | ) | ||||||||||
| Repayments and other |
(4,032 | ) | (4,895 | ) | (8,927 | ) | (3,191 | ) | (12,118 | ) | ||||||||||
|
|
|
|
|
|
|
|
|
|
|
|||||||||||
| Ending balance |
$ | 32,319 | $ | 55,411 | $ | 87,730 | $ | 23,340 | $ | 111,070 | ||||||||||
|
|
|
|
|
|
|
|
|
|
|
|||||||||||
| Year Ended December 31, 2015 | ||||||||||||||||||||
| (Dollars in millions) |
FFELP Stafford and Other |
FFELP Consolidation Loans |
Total FFELP Loans |
Private Education Loans |
Total Portfolio |
|||||||||||||||
| Beginning balance |
$ | 40,989 | $ | 63,456 | $ | 104,445 | $ | 29,796 | $ | 134,241 | ||||||||||
| Acquisitions |
2,047 | 1,671 | 3,718 | 18 | 3,736 | |||||||||||||||
| Capitalized interest and premium/discount amortization |
1,180 | 1,110 | 2,290 | 522 | 2,812 | |||||||||||||||
| Consolidations to third parties |
(2,545 | ) | (1,924 | ) | (4,469 | ) | (227 | ) | (4,696 | ) | ||||||||||
| Loan sales |
(316 | ) | (85 | ) | (401 | ) | (176 | ) | (577 | ) | ||||||||||
| Repayments and other |
(4,501 | ) | (4,680 | ) | (9,181 | ) | (3,539 | ) | (12,720 | ) | ||||||||||
|
|
|
|
|
|
|
|
|
|
|
|||||||||||
| Ending balance |
$ | 36,854 | $ | 59,548 | $ | 96,402 | $ | 26,394 | $ | 122,796 | ||||||||||
|
|
|
|
|
|
|
|
|
|
|
|||||||||||
| Year Ended December 31, 2014 | ||||||||||||||||||||
| (Dollars in millions) |
FFELP Stafford and Other |
FFELP Consolidation Loans |
Total FFELP Loans |
Private Education Loans |
Total Portfolio |
|||||||||||||||
| Beginning balance |
$ | 39,442 | $ | 63,664 | $ | 103,106 | $ | 31,006 | $ | 134,112 | ||||||||||
| Acquisitions |
6,567 | 4,732 | 11,299 | 1,624 | 12,923 | |||||||||||||||
| Capitalized interest and premium/discount amortization |
1,158 | 1,099 | 2,257 | 661 | 2,918 | |||||||||||||||
| Consolidations to third parties |
(2,074 | ) | (1,605 | ) | (3,679 | ) | (103 | ) | (3,782 | ) | ||||||||||
| Repayments and other |
(4,104 | ) | (4,434 | ) | (8,538 | ) | (3,392 | ) | (11,930 | ) | ||||||||||
|
|
|
|
|
|
|
|
|
|
|
|||||||||||
| Ending balance |
$ | 40,989 | $ | 63,456 | $ | 104,445 | $ | 29,796 | $ | 134,241 | ||||||||||
|
|
|
|
|
|
|
|
|
|
|
|||||||||||
76
Table of Contents
Education Loan Allowance for Loan Losses Activity — GAAP Basis
| December 31, 2016 | December 31, 2015 | December 31, 2014 | ||||||||||||||||||||||||||||||||||
| (Dollars in millions) |
FFELP Loans |
Private Education Loans |
Total Portfolio |
FFELP Loans |
Private Education Loans |
Total Portfolio |
FFELP Loans |
Private Education Loans |
Total Portfolio |
|||||||||||||||||||||||||||
| Beginning balance |
$ | 78 | $ | 1,471 | $ | 1,549 | $ | 93 | $ | 1,916 | $ | 2,009 | $ | 119 | $ | 2,097 | $ | 2,216 | ||||||||||||||||||
| Less: |
||||||||||||||||||||||||||||||||||||
| Net adjustment resulting from the change in the charge-off rate(1) |
— | — | — | — | (330 | ) | (330 | ) | — | — | — | |||||||||||||||||||||||||
| Net charge-offs remaining(2) |
(54 | ) | (513 | ) | (567 | ) | (61 | ) | (659 | ) | (720 | ) | (79 | ) | (717 | ) | (796 | ) | ||||||||||||||||||
|
|
|
|
|
|
|
|
|
|
|
|
|
|
|
|
|
|
|
|||||||||||||||||||
| Total net charge-offs |
(54 | ) | (513 | ) | (567 | ) | (61 | ) | (989 | ) | (1,050 | ) | (79 | ) | (717 | ) | (796 | ) | ||||||||||||||||||
| Loan sales |
— | — | — | — | (5 | ) | (5 | ) | — | — | — | |||||||||||||||||||||||||
| Distribution of SLM BankCo |
— | — | — | — | — | — | (6 | ) | (69 | ) | (75 | ) | ||||||||||||||||||||||||
| Plus: |
||||||||||||||||||||||||||||||||||||
| Provision for loan losses |
43 | 383 | 426 | 46 | 538 | 584 | 59 | 588 | 647 | |||||||||||||||||||||||||||
| Reclassification of interest reserve(3) |
— | 10 | 10 | — | 11 | 11 | — | 17 | 17 | |||||||||||||||||||||||||||
|
|
|
|
|
|
|
|
|
|
|
|
|
|
|
|
|
|
|
|||||||||||||||||||
| Ending balance |
$ | 67 | $ | 1,351 | $ | 1,418 | $ | 78 | $ | 1,471 | $ | 1,549 | $ | 93 | $ | 1,916 | $ | 2,009 | ||||||||||||||||||
|
|
|
|
|
|
|
|
|
|
|
|
|
|
|
|
|
|
|
|||||||||||||||||||
| Percent of total |
5 | % | 95 | % | 100 | % | 5 | % | 95 | % | 100 | % | 5 | % | 95 | % | 100 | % | ||||||||||||||||||
|
|
|
|
|
|
|
|
|
|
|
|
|
|
|
|
|
|
|
|||||||||||||||||||
| Troubled debt restructuring(4) |
$ | — | $ | 10,759 | $ | 10,759 | $ | — | $ | 10,575 | $ | 10,575 | $ | — | $ | 10,205 | $ | 10,205 | ||||||||||||||||||
| December 31, 2013 | December 31, 2012 | |||||||||||||||||||||||
| (Dollars in millions) |
FFELP Loans |
Private Education Loans |
Total Portfolio |
FFELP Loans |
Private Education Loans |
Total Portfolio |
||||||||||||||||||
| Balance at beginning of period |
$ | 159 | $ | 2,171 | $ | 2,330 | $ | 187 | $ | 2,171 | $ | 2,358 | ||||||||||||
| Less: |
||||||||||||||||||||||||
| Total net charge-offs(2) |
(78 | ) | (878 | ) | (956 | ) | (92 | ) | (1,037 | ) | (1,129 | ) | ||||||||||||
| Loan sales |
(14 | ) | — | (14 | ) | (8 | ) | — | (8 | ) | ||||||||||||||
| Plus: |
||||||||||||||||||||||||
| Provision for loan losses |
52 | 787 | 839 | 72 | 1,008 | 1,080 | ||||||||||||||||||
| Reclassification of interest reserve(3) |
— | 17 | 17 | — | 29 | 29 | ||||||||||||||||||
|
|
|
|
|
|
|
|
|
|
|
|
|
|||||||||||||
| Ending balance |
$ | 119 | $ | 2,097 | $ | 2,216 | $ | 159 | $ | 2,171 | $ | 2,330 | ||||||||||||
|
|
|
|
|
|
|
|
|
|
|
|
|
|||||||||||||
| Percent of total |
5 | % | 95 | % | 100 | % | 7 | % | 93 | % | 100 | % | ||||||||||||
|
|
|
|
|
|
|
|
|
|
|
|
|
|||||||||||||
| Troubled debt restructuring(4) |
$ | — | $ | 8,949 | $ | 8,949 | $ | — | $ | 7,294 | $ | 7,294 | ||||||||||||
| (1) | In the second quarter of 2015, the portion of the loan amount charged off at default on Private Education Loans increased from 73 percent to 79 percent. This did not impact the provision for loan losses as previously this had been reserved through the allowance for loan losses. This change resulted in a $330 million reduction to the balance of the receivable for partially charged-off loans. |
| (2) | Charge-offs are reported net of expected recoveries. For Private Education Loans, the expected recovery amount is transferred to the receivable for partially charged-off loan balance. Charge-offs include charge-offs against the receivable for partially charged-off loans which represents the difference between what was expected to be collected and any shortfalls in what was actually collected in the period. See “Receivable for Partially Charged-Off Private Education Loans” for further discussion. |
| (3) | Represents the additional allowance related to the amount of uncollectible interest reserved within interest income that is transferred in the period to the allowance for loan losses when interest is capitalized to a loan’s principal balance. |
| (4) | Represents the recorded investment of loans identified as troubled debt restructuring. |
77
Table of Contents
Education Loan Allowance for Loan Losses Activity — “Core Earnings” Basis
| December 31, 2016 | December 31, 2015 | December 31, 2014 | ||||||||||||||||||||||||||||||||||
| (Dollars in millions) |
FFELP Loans |
Private Education Loans |
Total Portfolio |
FFELP Loans |
Private Education Loans |
Total Portfolio |
FFELP Loans |
Private Education Loans |
Total Portfolio |
|||||||||||||||||||||||||||
| Beginning balance |
$ | 78 | $ | 1,471 | $ | 1,549 | $ | 93 | $ | 1,916 | $ | 2,009 | $ | 113 | $ | 2,035 | $ | 2,148 | ||||||||||||||||||
| Less: |
||||||||||||||||||||||||||||||||||||
| Net adjustment resulting from the change in the charge-off rate(1) |
— | — | — | — | (330 | ) | (330 | ) | — | — | — | |||||||||||||||||||||||||
| Net charge-offs remaining(2) |
(54 | ) | (513 | ) | (567 | ) | (61 | ) | (659 | ) | (720 | ) | (79 | ) | (717 | ) | (796 | ) | ||||||||||||||||||
|
|
|
|
|
|
|
|
|
|
|
|
|
|
|
|
|
|
|
|||||||||||||||||||
| Total net charge-offs |
(54 | ) | (513 | ) | (567 | ) | (61 | ) | (989 | ) | (1,050 | ) | (79 | ) | (717 | ) | (796 | ) | ||||||||||||||||||
| Loan sales |
— | — | — | — | (5 | ) | (5 | ) | — | — | — | |||||||||||||||||||||||||
| Plus: |
||||||||||||||||||||||||||||||||||||
| Provision for loan losses |
43 | 383 | 426 | 46 | 538 | 584 | 59 | 539 | 598 | |||||||||||||||||||||||||||
| Reclassification of interest |
— | 10 | 10 | — | 11 | 11 | — | 17 | 17 | |||||||||||||||||||||||||||
| Other transactions(4) |
— | — | — | — | — | — | — | 42 | 42 | |||||||||||||||||||||||||||
|
|
|
|
|
|
|
|
|
|
|
|
|
|
|
|
|
|
|
|||||||||||||||||||
| Ending balance |
$ | 67 | $ | 1,351 | $ | 1,418 | $ | 78 | $ | 1,471 | $ | 1,549 | $ | 93 | $ | 1,916 | $ | 2,009 | ||||||||||||||||||
|
|
|
|
|
|
|
|
|
|
|
|
|
|
|
|
|
|
|
|||||||||||||||||||
| Percent of total |
5 | % | 95 | % | 100 | % | 5 | % | 95 | % | 100 | % | 5 | % | 95 | % | 100 | % | ||||||||||||||||||
|
|
|
|
|
|
|
|
|
|
|
|
|
|
|
|
|
|
|
|||||||||||||||||||
| Troubled debt restructuring(5) |
$ | — | $ | 10,759 | $ | 10,759 | $ | — | $ | 10,575 | $ | 10,575 | $ | — | $ | 10,205 | $ | 10,205 | ||||||||||||||||||
| December 31, 2013 | December 31, 2012 | |||||||||||||||||||||||
| (Dollars in millions) |
FFELP Loans |
Private Education Loans |
Total Portfolio |
FFELP Loans |
Private Education Loans |
Total Portfolio |
||||||||||||||||||
| Balance at beginning of period |
$ | 155 | $ | 2,106 | $ | 2,261 | $ | 187 | $ | 2,102 | $ | 2,289 | ||||||||||||
| Less: |
||||||||||||||||||||||||
| Total net charge-offs(2) |
(76 | ) | (878 | ) | (954 | ) | (92 | ) | (1,037 | ) | (1,129 | ) | ||||||||||||
| Loan sales |
(14 | ) | — | (14 | ) | (8 | ) | — | (8 | ) | ||||||||||||||
| Plus: |
||||||||||||||||||||||||
| Provision for loan losses |
48 | 722 | 770 | 68 | 946 | 1,014 | ||||||||||||||||||
| Reclassification of interest reserve(3) |
— | 17 | 17 | — | 29 | 29 | ||||||||||||||||||
| Other transactions(4) |
— | 68 | 68 | — | 66 | 66 | ||||||||||||||||||
|
|
|
|
|
|
|
|
|
|
|
|
|
|||||||||||||
| Ending balance |
$ | 113 | $ | 2,035 | $ | 2,148 | $ | 155 | $ | 2,106 | $ | 2,261 | ||||||||||||
|
|
|
|
|
|
|
|
|
|
|
|
|
|||||||||||||
| Percent of total |
5 | % | 95 | % | 100 | % | 7 | % | 93 | % | 100 | % | ||||||||||||
|
|
|
|
|
|
|
|
|
|
|
|
|
|||||||||||||
| Troubled debt restructuring(5) |
$ | — | $ | 8,949 | $ | 8,949 | $ | — | $ | 7,294 | $ | 7,294 | ||||||||||||
| (1) | In the second quarter of 2015, the portion of the loan amount charged off at default on Private Education Loans increased from 73 percent to 79 percent. This did not impact the provision for loan losses as previously this had been reserved through the allowance for loan losses. This change resulted in a $330 million reduction to the balance of the receivable for partially charged-off loans. |
| (2) | Charge-offs are reported net of expected recoveries. For Private Education Loans, the expected recovery amount is transferred to the receivable for partially charged-off loan balance. Charge-offs include charge-offs against the receivable for partially charged-off loans which represents the difference between what was expected to be collected and any shortfalls in what was actually collected in the period. See “Receivable for Partially Charged-Off Private Education Loans” for further discussion. |
| (3) | Represents the additional allowance related to the amount of uncollectible interest reserved within interest income that is transferred in the period to the allowance for loan losses when interest is capitalized to a loan’s principal balance. |
| (4) | Relates to loans purchased from Sallie Mae Bank by Navient related entities prior to the Spin-Off. Amount is the related allowance for loan losses that was transferred in connection with the loans purchased. |
| (5) | Represents the recorded investment of loans identified as troubled debt restructuring. |
78
Table of Contents
FFELP Loan Portfolio Performance
FFELP Loan Delinquencies and Forbearance — GAAP and “Core Earnings” Basis
| FFELP Loan Delinquencies | ||||||||||||||||||||||||
| December 31, | ||||||||||||||||||||||||
| 2016 | 2015 | 2014 | ||||||||||||||||||||||
| (Dollars in millions) |
Balance | % | Balance | % | Balance | % | ||||||||||||||||||
| Loans in-school/grace/deferment(1) |
$ | 5,871 | $ | 8,257 | $ | 10,861 | ||||||||||||||||||
| Loans in forbearance(2) |
10,490 | 13,298 | 14,366 | |||||||||||||||||||||
| Loans in repayment and percentage of each status: |
||||||||||||||||||||||||
| Loans current |
61,977 | 87.8 | % | 62,651 | 84.8 | % | 65,221 | 83.5 | % | |||||||||||||||
| Loans delinquent 31-60 days(3) |
2,820 | 4.0 | 3,285 | 4.5 | 3,942 | 5.0 | ||||||||||||||||||
| Loans delinquent 61-90 days(3) |
1,325 | 1.9 | 1,856 | 2.5 | 2,451 | 3.1 | ||||||||||||||||||
| Loans delinquent greater than 90 days(3) |
4,435 | 6.3 | 6,046 | 8.2 | 6,521 | 8.4 | ||||||||||||||||||
|
|
|
|
|
|
|
|
|
|
|
|
|
|||||||||||||
| Total FFELP Loans in repayment |
70,557 | 100 | % | 73,838 | 100 | % | 78,135 | 100 | % | |||||||||||||||
|
|
|
|
|
|
|
|
|
|
|
|
|
|||||||||||||
| Total FFELP Loans, gross |
86,918 | 95,393 | 103,362 | |||||||||||||||||||||
| FFELP Loan unamortized premium |
879 | 1,087 | 1,176 | |||||||||||||||||||||
|
|
|
|
|
|
|
|||||||||||||||||||
| Total FFELP Loans |
87,797 | 96,480 | 104,538 | |||||||||||||||||||||
| FFELP Loan allowance for losses |
(67 | ) | (78 | ) | (93 | ) | ||||||||||||||||||
|
|
|
|
|
|
|
|||||||||||||||||||
| FFELP Loans, net |
$ | 87,730 | $ | 96,402 | $ | 104,445 | ||||||||||||||||||
|
|
|
|
|
|
|
|||||||||||||||||||
| Percentage of FFELP Loans in repayment |
81.2 | % | 77.4 | % | 75.6 | % | ||||||||||||||||||
|
|
|
|
|
|
|
|||||||||||||||||||
| Delinquencies as a percentage of FFELP Loans in repayment |
12.2 | % | 15.2 | % | 16.5 | % | ||||||||||||||||||
|
|
|
|
|
|
|
|||||||||||||||||||
| FFELP Loans in forbearance as a percentage of loans in repayment and forbearance |
12.9 | % | 15.3 | % | 15.5 | % | ||||||||||||||||||
|
|
|
|
|
|
|
|||||||||||||||||||
| (1) | Loans for customers who may still be attending school or engaging in other permitted educational activities and are not yet required to make payments on the loans, e.g., residency periods for medical students or a grace period for bar exam preparation, as well as loans for customers who have requested and qualify for other permitted program deferments such as military, unemployment, or economic hardship. |
| (2) | Loans for customers who have used their allowable deferment time or do not qualify for deferment, that need additional time to obtain employment or who have temporarily ceased making full payments due to hardship or other factors. |
| (3) | The period of delinquency is based on the number of days scheduled payments are contractually past due. |
79
Table of Contents
Allowance for FFELP Loan Losses — GAAP Basis
| Years Ended December 31, | ||||||||||||
| (Dollars in millions) |
2016 | 2015 | 2014 | |||||||||
| Allowance at beginning of period |
$ | 78 | $ | 93 | $ | 119 | ||||||
| Provision for FFELP Loan losses |
43 | 46 | 59 | |||||||||
| Charge-offs |
(54 | ) | (61 | ) | (79 | ) | ||||||
| Distribution of SLM BankCo |
— | — | (6 | ) | ||||||||
|
|
|
|
|
|
|
|||||||
| Allowance at end of period |
$ | 67 | $ | 78 | $ | 93 | ||||||
|
|
|
|
|
|
|
|||||||
| Charge-offs as a percentage of average loans in repayment |
.07 | % | .08 | % | .11 | % | ||||||
| Allowance as a percentage of the ending total loans, gross |
.08 | % | .08 | % | .09 | % | ||||||
| Allowance as a percentage of ending loans in repayment |
.09 | % | .10 | % | .12 | % | ||||||
| Allowance coverage of charge-offs |
1.2 | 1.3 | 1.2 | |||||||||
| Ending total loans, gross |
$ | 86,918 | $ | 95,393 | $ | 103,362 | ||||||
| Average loans in repayment |
$ | 72,714 | $ | 75,925 | $ | 72,811 | ||||||
| Ending loans in repayment |
$ | 70,557 | $ | 73,838 | $ | 78,135 | ||||||
Allowance for FFELP Loan Losses — “Core Earnings” Basis
| Years Ended December 31, | ||||||||||||
| (Dollars in millions) |
2016 | 2015 | 2014 | |||||||||
| Allowance at beginning of period |
$ | 78 | $ | 93 | $ | 113 | ||||||
| Provision for FFELP Loan losses |
43 | 46 | 59 | |||||||||
| Charge-offs |
(54 | ) | (61 | ) | (79 | ) | ||||||
|
|
|
|
|
|
|
|||||||
| Allowance at end of period |
$ | 67 | $ | 78 | $ | 93 | ||||||
|
|
|
|
|
|
|
|||||||
| Charge-offs as a percentage of average loans in repayment |
.07 | % | .08 | % | .11 | % | ||||||
| Allowance as a percentage of the ending total loans, gross |
.08 | % | .08 | % | .09 | % | ||||||
| Allowance as a percentage of ending loans in repayment |
.09 | % | .10 | % | .12 | % | ||||||
| Allowance coverage of charge-offs |
1.2 | 1.3 | 1.2 | |||||||||
| Ending total loans, gross |
$ | 86,918 | $ | 95,393 | $ | 103,362 | ||||||
| Average loans in repayment |
$ | 72,714 | $ | 75,925 | $ | 72,481 | ||||||
| Ending loans in repayment |
$ | 70,557 | $ | 73,838 | $ | 78,135 | ||||||
80
Table of Contents
Private Education Loan Portfolio Performance
Private Education Loan Delinquencies and Forbearance — GAAP and “Core Earnings” Basis
| Private Education Loan Delinquencies | ||||||||||||||||||||||||
| December 31, | ||||||||||||||||||||||||
| 2016 | 2015 | 2014 | ||||||||||||||||||||||
| (Dollars in millions) |
Balance | % | Balance | % | Balance | % | ||||||||||||||||||
| Loans in-school/grace/deferment(1) |
$ | 1,393 | $ | 2,040 | $ | 3,053 | ||||||||||||||||||
| Loans in forbearance(2) |
790 | 973 | 1,059 | |||||||||||||||||||||
| Loans in repayment and percentage of each status: |
||||||||||||||||||||||||
| Loans current |
20,506 | 92.6 | % | 22,731 | 92.8 | % | 24,761 | 91.9 | % | |||||||||||||||
| Loans delinquent 31-60 days(3) |
522 | 2.4 | 577 | 2.4 | 734 | 2.7 | ||||||||||||||||||
| Loans delinquent 61-90 days(3) |
321 | 1.4 | 348 | 1.4 | 436 | 1.6 | ||||||||||||||||||
| Loans delinquent greater than 90 days(3) |
801 | 3.6 | 846 | 3.4 | 1,018 | 3.8 | ||||||||||||||||||
|
|
|
|
|
|
|
|
|
|
|
|
|
|||||||||||||
| Total Private Education Loans in repayment |
22,150 | 100 | % | 24,502 | 100 | % | 26,949 | 100 | % | |||||||||||||||
|
|
|
|
|
|
|
|
|
|
|
|
|
|||||||||||||
| Total Private Education Loans, gross |
24,333 | 27,515 | 31,061 | |||||||||||||||||||||
| Private Education Loan unamortized discount |
(457 | ) | (531 | ) | (594 | ) | ||||||||||||||||||
|
|
|
|
|
|
|
|||||||||||||||||||
| Total Private Education Loans |
23,876 | 26,984 | 30,467 | |||||||||||||||||||||
| Private Education Loan receivable for partially charged-off loans |
815 | 881 | 1,245 | |||||||||||||||||||||
| Private Education Loan allowance for losses |
(1,351 | ) | (1,471 | ) | (1,916 | ) | ||||||||||||||||||
|
|
|
|
|
|
|
|||||||||||||||||||
| Private Education Loans, net |
$ | 23,340 | $ | 26,394 | $ | 29,796 | ||||||||||||||||||
|
|
|
|
|
|
|
|||||||||||||||||||
| Percentage of Private Education Loans in repayment |
91.0 | % | 89.0 | % | 86.8 | % | ||||||||||||||||||
|
|
|
|
|
|
|
|||||||||||||||||||
| Delinquencies as a percentage of Private Education Loans in repayment |
7.4 | % | 7.2 | % | 8.1 | % | ||||||||||||||||||
|
|
|
|
|
|
|
|||||||||||||||||||
| Loans in forbearance as a percentage of loans in repayment and forbearance |
3.4 | % | 3.8 | % | 3.8 | % | ||||||||||||||||||
|
|
|
|
|
|
|
|||||||||||||||||||
| Loans in repayment with more than 12 payments made |
95 | % | 94.1 | % | 91.5 | % | ||||||||||||||||||
|
|
|
|
|
|
|
|||||||||||||||||||
| Percentage of Private Education Loans with a cosigner |
64 | % | 64 | % | 64 | % | ||||||||||||||||||
|
|
|
|
|
|
|
|||||||||||||||||||
| (1) | Deferment includes customers who have returned to school or are engaged in other permitted educational activities and are not yet required to make payments on the loans, e.g., residency periods for medical students or a grace period for bar exam preparation. |
| (2) | Loans for customers who have requested extension of grace period generally during employment transition or who have temporarily ceased making full payments due to hardship or other factors, consistent with established loan program servicing policies and procedures. |
| (3) | The period of delinquency is based on the number of days scheduled payments are contractually past due. |
81
Table of Contents
Allowance for Private Education Loan Losses — GAAP Basis
| Years Ended December 31, | ||||||||||||
| (Dollars in millions) |
2016 | 2015 | 2014 | |||||||||
| Allowance at beginning of period |
$ | 1,471 | $ | 1,916 | $ | 2,097 | ||||||
| Provision for Private Education Loan losses |
383 | 538 | 588 | |||||||||
| Net adjustment resulting from the change in the charge-off rate(1) |
— | (330 | ) | — | ||||||||
| Net charge-offs remaining(2) |
(513 | ) | (659 | ) | (717 | ) | ||||||
|
|
|
|
|
|
|
|||||||
| Total net charge-offs |
(513 | ) | (989 | ) | (717 | ) | ||||||
| Reclassification of interest reserve(3) |
10 | 11 | 17 | |||||||||
| Loan sales |
— | (5 | ) | — | ||||||||
| Distribution of SLM BankCo |
— | — | (69 | ) | ||||||||
|
|
|
|
|
|
|
|||||||
| Allowance at end of period |
$ | 1,351 | $ | 1,471 | $ | 1,916 | ||||||
|
|
|
|
|
|
|
|||||||
| Net charge-offs as a percentage of average loans in repayment, excluding the net adjustment resulting from the change in the charge-off rate(1) |
2.2 | % | 2.6 | % | 2.5 | % | ||||||
| Net adjustment resulting from the change in the charge-off rate as a percentage of average loans in repayment(1) |
— | % | 1.3 | % | — | % | ||||||
| Allowance coverage of net charge-offs, excluding the net adjustment resulting from the change in the charge-off rate(1) |
2.6 | 2.2 | 2.7 | |||||||||
| Allowance as a percentage of the ending total loans |
5.4 | % | 5.2 | % | 5.9 | % | ||||||
| Allowance as a percentage of ending loans in repayment |
6.1 | % | 6.0 | % | 7.1 | % | ||||||
| Ending total loans(4) |
$ | 25,148 | $ | 28,396 | $ | 32,306 | ||||||
| Average loans in repayment |
$ | 23,275 | $ | 25,802 | $ | 28,577 | ||||||
| Ending loans in repayment |
$ | 22,150 | $ | 24,502 | $ | 26,949 | ||||||
| (1) | In the second quarter of 2015, the portion of the loan amount charged off at default was increased from 73 percent to 79 percent. This did not impact the provision for loan losses as previously this had been reserved through the allowance for loan losses. This change resulted in a $330 million reduction to the balance of the receivable for partially charged-off loans. |
| (2) | Charge-offs are reported net of expected recoveries. The expected recovery amount is transferred to the receivable for partially charged-off loan balance. Charge-offs include charge-offs against the receivable for partially charged-off loans which represents the difference between what was expected to be collected and any shortfalls in what was actually collected in the period. See the section titled “Receivable for Partially Charged-Off Private Education Loans” for further discussion. |
| (3) | Represents the additional allowance related to the amount of uncollectible interest reserved within interest income that is transferred in the period to the allowance for loan losses when interest is capitalized to a loan’s principal balance. |
| (4) | Ending total loans represents gross Private Education Loans, plus the receivable for partially charged-off loans. |
82
Table of Contents
Allowance for Private Education Loan Losses — “Core Earnings” Basis
| Years Ended December 31, | ||||||||||||
| (Dollars in millions) |
2016 | 2015 | 2014 | |||||||||
| Allowance at beginning of period |
$ | 1,471 | $ | 1,916 | $ | 2,035 | ||||||
| Provision for Private Education Loan losses |
383 | 538 | 539 | |||||||||
| Net adjustment resulting from the change in the charge-off rate(1) |
— | (330 | ) | — | ||||||||
| Net charge-offs remaining(2) |
(513 | ) | (659 | ) | (717 | ) | ||||||
|
|
|
|
|
|
|
|||||||
| Total net charge-offs |
(513 | ) | (989 | ) | (717 | ) | ||||||
| Reclassification of interest reserve(3) |
10 | 11 | 17 | |||||||||
| Loan sales |
— | (5 | ) | — | ||||||||
| Other transactions(4) |
— | — | 42 | |||||||||
|
|
|
|
|
|
|
|||||||
| Allowance at end of period |
$ | 1,351 | $ | 1,471 | $ | 1,916 | ||||||
|
|
|
|
|
|
|
|||||||
| Net charge-offs as a percentage of average loans in repayment, excluding the net adjustment resulting from the change in the charge-off rate(1) |
2.2 | % | 2.6 | % | 2.6 | % | ||||||
| Net adjustment resulting from the change in the charge-off rate as a percentage of average loans in repayment(1) |
— | % | 1.3 | % | — | % | ||||||
| Allowance coverage of net charge-offs, excluding the net adjustment resulting from the change in the charge-off rate(1) |
2.6 | 2.2 | 2.7 | |||||||||
| Allowance as a percentage of the ending total loans |
5.4 | % | 5.2 | % | 5.9 | % | ||||||
| Allowance as a percentage of ending loans in repayment |
6.1 | % | 6.0 | % | 7.1 | % | ||||||
| Ending total loans(5) |
$ | 25,148 | $ | 28,396 | $ | 32,306 | ||||||
| Average loans in repayment |
$ | 23,275 | $ | 25,802 | $ | 27,145 | ||||||
| Ending loans in repayment |
$ | 22,150 | $ | 24,502 | $ | 26,949 | ||||||
| (1) | In the second quarter of 2015, the portion of the loan amount charged off at default was increased from 73 percent to 79 percent. This did not impact the provision for loan losses as previously this had been reserved through the allowance for loan losses. This change resulted in a $330 million reduction to the balance of the receivable for partially charged-off loans. |
| (2) | Charge-offs are reported net of expected recoveries. The expected recovery amount is transferred to the receivable for partially charged-off loan balance. Charge-offs include charge-offs against the receivable for partially charged-off loans which represents the difference between what was expected to be collected and any shortfalls in what was actually collected in the period. See the section titled “Receivable for Partially Charged-Off Private Education Loans” for further discussion. |
| (3) | Represents the additional allowance related to the amount of uncollectible interest reserved within interest income that is transferred in the period to the allowance for loan losses when interest is capitalized to a loan’s principal balance. |
| (4) | Relates to loans purchased from Sallie Mae Bank by Navient related entities prior to the Spin-Off. Amount is the related allowance for loan losses that was transferred in connection with the loans purchased. |
| (5) | Ending total loans represents gross Private Education Loans, plus the receivable for partially charged-off loans. |
As part of determining the adequacy of the allowance for loan losses, we review key allowance and loan metrics. The most significant of these metrics considered are the charge-off rate and delinquency and forbearance percentages and the resulting allowance coverage of charge-offs ratio, and the allowance as a percentage of total loans and of loans in repayment.
Receivable for Partially Charged-Off Private Education Loans
At the end of each month, for loans that are 212 or more days past due, we charge off the estimated loss of a defaulted loan balance. Actual recoveries are applied against the remaining loan balance that was not charged off. We refer to this remaining loan balance as the “receivable for partially charged-off loans.” If actual periodic recoveries are less than expected, the difference is immediately charged off through the allowance for Private Education Loan losses with an offsetting reduction in the receivable for partially charged-off Private Education Loans. If actual periodic recoveries are greater than expected, they will be reflected as a recovery through the allowance for Private Education Loan losses once the cumulative recovery amount exceeds the cumulative amount originally expected to be recovered. The financial crisis, which began in 2007, impacted our collections
83
Table of Contents
on defaulted loans and as a result, Private Education Loans which defaulted from 2007 through March 31, 2015, experienced collection performance below our pre-financial crisis experience. For that reason, until we gained enough data and experience to determine the long-term, post-default recovery rate of 21 percent in second-quarter 2015, we established a reserve for potential shortfalls in recoveries. In the second quarter of 2015, the portion of the loan amount charged off at default increased from 73 percent to 79 percent. This did not impact the provision for loan losses as previously this had been reserved through the allowance for loan losses. This change resulted in a $330 million reduction to the balance of the receivable for partially charged-off loans.
The following table summarizes the activity in the receivable for partially charged-off loans.
| Years Ended December 31, | ||||||||||||
| (Dollars in millions) |
2016 | 2015 | 2014 | |||||||||
| Receivable at beginning of period |
$ | 881 | $ | 1,245 | $ | 1,313 | ||||||
| Expected future recoveries of current period defaults(1) |
128 | 183 | 233 | |||||||||
| Recoveries(2) |
(181 | ) | (191 | ) | (215 | ) | ||||||
| Net adjustment resulting from the change in the charge-off rate(3) |
— | (330 | ) | — | ||||||||
| Net charge-offs remaining(4) |
(13 | ) | (26 | ) | (86 | ) | ||||||
|
|
|
|
|
|
|
|||||||
| Total net charge-offs(5) |
(13 | ) | (356 | ) | (86 | ) | ||||||
|
|
|
|
|
|
|
|||||||
| Receivable at end of period |
815 | 881 | 1,245 | |||||||||
| Allowance for estimated recovery shortfalls(6) |
— | — | (385 | ) | ||||||||
|
|
|
|
|
|
|
|||||||
| Net receivable at end of period |
$ | 815 | $ | 881 | $ | 860 | ||||||
|
|
|
|
|
|
|
|||||||
| (1) | Represents the difference between the defaulted loan balance and our estimate of the amount to be collected in the future. |
| (2) | Current period cash collections. |
| (3) | In the second quarter of 2015, the portion of the loan amount charged off at default increased from 73 percent to 79 percent. This change resulted in a $330 million reduction to the balance of the receivable for partially charged-off loans. |
| (4) | Represents the current period recovery shortfall — the difference between what was expected to be collected and what was actually collected. |
| (5) | These amounts are included in total charge-offs as reported in the “Allowance for Private Education Loan Losses” table. |
| (6) | The allowance for estimated recovery shortfalls of the receivable for partially charged-off Private Education Loans is a component of the $1.9 billion overall allowance for Private Education Loan losses as of December 31, 2014. This component of the allowance was removed in the second quarter of 2015 due to the increase in the charge-off rate discussed above. |
Use of Forbearance as a Private Education Loan Collection Tool
Forbearance involves granting the customer a temporary cessation of payments (or temporary acceptance of smaller than scheduled payments) for a specified period of time. Using forbearance extends the original term of the loan. Forbearance does not grant any reduction in the total repayment obligation (principal or interest). While in forbearance status, interest continues to accrue and is capitalized to principal when the loan re-enters repayment status. Our forbearance policies include limits on the number of forbearance months granted consecutively and the total number of forbearance months granted over the life of the loan. In some instances, we require good-faith payments before granting forbearance. Exceptions to forbearance policies are permitted when such exceptions are judged to increase the likelihood of recovery of the loan. Forbearance as a recovery tool is used most effectively when applied based on a customer’s unique situation, including historical information and judgments. We leverage updated customer information and other decision support tools to best determine who will be granted forbearance based on our expectations as to a customer’s ability and willingness to repay their obligation. This strategy is aimed at mitigating the overall risk of the portfolio as well as encouraging cash resolution of delinquent loans.
Forbearance may be granted to customers who are exiting their grace period to provide additional time to obtain employment and income to support their obligations, or to current customers who are faced with a hardship and request forbearance time to provide temporary payment relief. In these circumstances, a customer’s
84
Table of Contents
loan is placed into a forbearance status in limited monthly increments and is reflected in the forbearance status at month-end during this time. At the end of their granted forbearance period, the customer will enter repayment status as current and is expected to begin making their scheduled monthly payments on a go-forward basis.
Forbearance may also be granted to customers who are delinquent in their payments. In these circumstances, the forbearance cures the delinquency and the customer is returned to a current repayment status. In more limited instances, delinquent customers will also be granted additional forbearance time.
The tables below show the composition and status of the Private Education Loan portfolio aged by the number of months for which a scheduled monthly payment was received. As indicated in the tables, the percentage of loans that are in forbearance status, are delinquent greater than 90 days or that are charged off decreases the longer the loans have been making scheduled monthly payments.
At December 31, 2016, loans in forbearance status as a percentage of loans in repayment and forbearance were 12.9 percent for loans that have made less than 25 monthly payments. The percentage drops to 1.6 percent for loans that have made more than 48 monthly payments.
At December 31, 2016, loans in repayment that are delinquent greater than 90 days as a percentage of loans in repayment were 10.4 percent for loans that have made less than 25 monthly payments. The percentage drops to 2.0 percent for loans that have made more than 48 monthly payments.
For the year ended December 31, 2016, charge-offs as a percentage of loans in repayment were 8 percent for loans that have made less than 25 monthly payments. The percentage drops to 1 percent for loans that have made more than 48 monthly payments.
85
Table of Contents
GAAP Basis:
| (Dollars in millions) |
Monthly Scheduled Payments Received | Not Yet in Repayment |
||||||||||||||||||||||||||
| December 31, 2016 |
0 to 12 | 13 to 24 | 25 to 36 | 37 to 48 | More than 48 | Total | ||||||||||||||||||||||
| Loans in-school/grace/deferment |
$ | — | $ | — | $ | — | $ | — | $ | — | $ | 1,393 | $ | 1,393 | ||||||||||||||
| Loans in forbearance |
239 | 98 | 95 | 99 | 259 | — | 790 | |||||||||||||||||||||
| Loans in repayment — current |
860 | 973 | 1,565 | 2,363 | 14,745 | — | 20,506 | |||||||||||||||||||||
| Loans in repayment — delinquent 31-60 days |
65 | 56 | 69 | 81 | 251 | — | 522 | |||||||||||||||||||||
| Loans in repayment — delinquent 61-90 days |
45 | 37 | 48 | 51 | 140 | — | 321 | |||||||||||||||||||||
| Loans in repayment — delinquent greater than 90 days |
131 | 107 | 131 | 129 | 303 | — | 801 | |||||||||||||||||||||
|
|
|
|
|
|
|
|
|
|
|
|
|
|
|
|||||||||||||||
| Total |
$ | 1,340 | $ | 1,271 | $ | 1,908 | $ | 2,723 | $ | 15,698 | $ | 1,393 | 24,333 | |||||||||||||||
|
|
|
|
|
|
|
|
|
|
|
|
|
|||||||||||||||||
| Unamortized discount |
(457 | ) | ||||||||||||||||||||||||||
| Receivable for partially charged-off loans |
815 | |||||||||||||||||||||||||||
| Allowance for loan losses |
(1,351 | ) | ||||||||||||||||||||||||||
|
|
|
|||||||||||||||||||||||||||
| Total Private Education Loans, net |
$ | 23,340 | ||||||||||||||||||||||||||
|
|
|
|||||||||||||||||||||||||||
| Loans in forbearance as a percentage of loans in repayment and forbearance |
17.8 | % | 7.7 | % | 5.0 | % | 3.6 | % | 1.6 | % | — | % | 3.4 | % | ||||||||||||||
|
|
|
|
|
|
|
|
|
|
|
|
|
|
|
|||||||||||||||
| Loans in repayment — delinquent greater than 90 days as a percentage of loans in repayment |
11.9 | % | 9.1 | % | 7.2 | % | 4.9 | % | 2.0 | % | — | % | 3.6 | % | ||||||||||||||
|
|
|
|
|
|
|
|
|
|
|
|
|
|
|
|||||||||||||||
| Net charge-offs as a percentage of average loans in repayment |
12.6 | % | 5.7 | % | 4.1 | % | 2.5 | % | 1.0 | % | — | % | 2.3 | % | ||||||||||||||
|
|
|
|
|
|
|
|
|
|
|
|
|
|
|
|||||||||||||||
| (Dollars in millions) |
Monthly Scheduled Payments Received | Not Yet in Repayment |
||||||||||||||||||||||||||
| December 31, 2015 |
0 to 12 | 13 to 24 | 25 to 36 | 37 to 48 | More than 48 | Total | ||||||||||||||||||||||
| Loans in-school/grace/deferment |
$ | — | $ | — | $ | — | $ | — | $ | — | $ | 2,040 | $ | 2,040 | ||||||||||||||
| Loans in forbearance |
341 | 134 | 136 | 119 | 243 | — | 973 | |||||||||||||||||||||
| Loans in repayment — current |
1,088 | 1,576 | 2,543 | 3,407 | 14,117 | — | 22,731 | |||||||||||||||||||||
| Loans in repayment — delinquent 31-60 days |
97 | 76 | 92 | 87 | 225 | — | 577 | |||||||||||||||||||||
| Loans in repayment — delinquent 61-90 days |
64 | 52 | 56 | 51 | 125 | — | 348 | |||||||||||||||||||||
| Loans in repayment — delinquent greater than 90 days |
186 | 139 | 155 | 123 | 243 | — | 846 | |||||||||||||||||||||
|
|
|
|
|
|
|
|
|
|
|
|
|
|
|
|||||||||||||||
| Total |
$ | 1,776 | $ | 1,977 | $ | 2,982 | $ | 3,787 | $ | 14,953 | $ | 2,040 | 27,515 | |||||||||||||||
|
|
|
|
|
|
|
|
|
|
|
|
|
|||||||||||||||||
| Unamortized discount |
(531 | ) | ||||||||||||||||||||||||||
| Receivable for partially charged-off loans |
881 | |||||||||||||||||||||||||||
| Allowance for loan losses |
(1,471 | ) | ||||||||||||||||||||||||||
|
|
|
|||||||||||||||||||||||||||
| Total Private Education Loans, net |
$ | 26,394 | ||||||||||||||||||||||||||
|
|
|
|||||||||||||||||||||||||||
| Loans in forbearance as a percentage of loans in repayment and forbearance |
19.2 | % | 6.8 | % | 4.6 | % | 3.1 | % | 1.6 | % | — | % | 3.8 | % | ||||||||||||||
|
|
|
|
|
|
|
|
|
|
|
|
|
|
|
|||||||||||||||
| Loans in repayment — delinquent greater than 90 days as a percentage of loans in repayment |
13.0 | % | 7.5 | % | 5.4 | % | 3.3 | % | 1.7 | % | — | % | 3.4 | % | ||||||||||||||
|
|
|
|
|
|
|
|
|
|
|
|
|
|
|
|||||||||||||||
| Net charge-offs as a percentage of average loans in repayment, excluding the net adjustment resulting from the change in the charge-off rate(1) |
13.1 | % | 5.1 | % | 2.9 | % | 1.8 | % | .9 | % | — | % | 2.6 | % | ||||||||||||||
|
|
|
|
|
|
|
|
|
|
|
|
|
|
|
|||||||||||||||
| (1) | In the second quarter of 2015, the portion of the loan amount charged off at default increased from 73 percent to 79 percent. This did not impact the provision for loan losses as previously this had been reserved through the allowance for loan losses. This change resulted in a $330 million reduction to the balance of the receivable for partially charged-off loans. |
86
Table of Contents
| (Dollars in millions) |
Monthly Scheduled Payments Received | Not Yet in Repayment |
||||||||||||||||||||||||||
| December 31, 2014 |
0 to 12 | 13 to 24 | 25 to 36 | 37 to 48 | More than 48 | Total | ||||||||||||||||||||||
| Loans in-school/grace/deferment |
$ | — | $ | — | $ | — | $ | — | $ | — | $ | 3,053 | $ | 3,053 | ||||||||||||||
| Loans in forbearance |
438 | 168 | 148 | 121 | 184 | — | 1,059 | |||||||||||||||||||||
| Loans in repayment — current |
1,732 | 2,586 | 3,734 | 3,982 | 12,727 | — | 24,761 | |||||||||||||||||||||
| Loans in repayment — delinquent 31-60 days |
163 | 122 | 124 | 107 | 218 | — | 734 | |||||||||||||||||||||
| Loans in repayment — delinquent 61-90 days |
102 | 81 | 78 | 62 | 113 | — | 436 | |||||||||||||||||||||
| Loans in repayment — delinquent greater than 90 days |
299 | 204 | 175 | 132 | 208 | — | 1,018 | |||||||||||||||||||||
|
|
|
|
|
|
|
|
|
|
|
|
|
|
|
|||||||||||||||
| Total |
$ | 2,734 | $ | 3,161 | $ | 4,259 | $ | 4,404 | $ | 13,450 | $ | 3,053 | 31,061 | |||||||||||||||
|
|
|
|
|
|
|
|
|
|
|
|
|
|||||||||||||||||
| Unamortized discount |
(594 | ) | ||||||||||||||||||||||||||
| Receivable for partially charged-off loans |
1,245 | |||||||||||||||||||||||||||
| Allowance for loan losses |
(1,916 | ) | ||||||||||||||||||||||||||
|
|
|
|||||||||||||||||||||||||||
| Total Private Education Loans, net |
$ | 29,796 | ||||||||||||||||||||||||||
|
|
|
|||||||||||||||||||||||||||
| Loans in forbearance as a percentage of loans in repayment and forbearance |
16.0 | % | 5.3 | % | 3.5 | % | 2.7 | % | 1.4 | % | — | % | 3.8 | % | ||||||||||||||
|
|
|
|
|
|
|
|
|
|
|
|
|
|
|
|||||||||||||||
| Loans in repayment — delinquent greater than 90 days as a percentage of loans in repayment |
13.0 | % | 6.8 | % | 4.3 | % | 3.1 | % | 1.6 | % | — | % | 3.8 | % | ||||||||||||||
|
|
|
|
|
|
|
|
|
|
|
|
|
|
|
|||||||||||||||
| Net charge-offs as a percentage of average loans in repayment |
8.8 | % | 3.3 | % | 2.2 | % | 1.5 | % | .9 | % | — | % | 2.5 | % | ||||||||||||||
|
|
|
|
|
|
|
|
|
|
|
|
|
|
|
|||||||||||||||
“Core Earnings” Basis:
| (Dollars in millions) |
Monthly Scheduled Payments Received | Not Yet in Repayment |
||||||||||||||||||||||||||
| December 31, 2016 |
0 to 12 | 13 to 24 | 25 to 36 | 37 to 48 | More than 48 | Total | ||||||||||||||||||||||
| Loans in-school/grace/deferment |
$ | — | $ | — | $ | — | $ | — | $ | — | $ | 1,393 | $ | 1,393 | ||||||||||||||
| Loans in forbearance |
239 | 98 | 95 | 99 | 259 | — | 790 | |||||||||||||||||||||
| Loans in repayment — current |
860 | 973 | 1,565 | 2,363 | 14,745 | — | 20,506 | |||||||||||||||||||||
| Loans in repayment — delinquent 31-60 days |
65 | 56 | 69 | 81 | 251 | — | 522 | |||||||||||||||||||||
| Loans in repayment — delinquent 61-90 days |
45 | 37 | 48 | 51 | 140 | — | 321 | |||||||||||||||||||||
| Loans in repayment — delinquent greater than 90 days |
131 | 107 | 131 | 129 | 303 | — | 801 | |||||||||||||||||||||
|
|
|
|
|
|
|
|
|
|
|
|
|
|
|
|||||||||||||||
| Total |
$ | 1,340 | $ | 1,271 | $ | 1,908 | $ | 2,723 | $ | 15,698 | $ | 1,393 | 24,333 | |||||||||||||||
|
|
|
|
|
|
|
|
|
|
|
|
|
|||||||||||||||||
| Unamortized discount |
(457 | ) | ||||||||||||||||||||||||||
| Receivable for partially charged-off loans |
815 | |||||||||||||||||||||||||||
| Allowance for loan losses |
(1,351 | ) | ||||||||||||||||||||||||||
|
|
|
|||||||||||||||||||||||||||
| Total Private Education Loans, net |
$ | 23,340 | ||||||||||||||||||||||||||
|
|
|
|||||||||||||||||||||||||||
| Loans in forbearance as a percentage of loans in repayment and forbearance |
17.8 | % | 7.7 | % | 5.0 | % | 3.6 | % | 1.6 | % | — | % | 3.4 | % | ||||||||||||||
|
|
|
|
|
|
|
|
|
|
|
|
|
|
|
|||||||||||||||
| Loans in repayment — delinquent greater than 90 days as a percentage of loans in repayment |
11.9 | % | 9.1 | % | 7.2 | % | 4.9 | % | 2.0 | % | — | % | 3.6 | % | ||||||||||||||
|
|
|
|
|
|
|
|
|
|
|
|
|
|
|
|||||||||||||||
| Net charge-offs as a percentage of average loans in repayment |
12.6 | % | 5.7 | % | 4.1 | % | 2.5 | % | 1.0 | % | — | % | 2.3 | % | ||||||||||||||
|
|
|
|
|
|
|
|
|
|
|
|
|
|
|
|||||||||||||||
87
Table of Contents
| (Dollars in millions) |
Monthly Scheduled Payments Received | Not Yet in Repayment |
||||||||||||||||||||||||||
| December 31, 2015 |
0 to 12 | 13 to 24 | 25 to 36 | 37 to 48 | More than 48 | Total | ||||||||||||||||||||||
| Loans in-school/grace/deferment |
$ | — | $ | — | $ | — | $ | — | $ | — | $ | 2,040 | $ | 2,040 | ||||||||||||||
| Loans in forbearance |
341 | 134 | 136 | 119 | 243 | — | 973 | |||||||||||||||||||||
| Loans in repayment — current |
1,088 | 1,576 | 2,543 | 3,407 | 14,117 | — | 22,731 | |||||||||||||||||||||
| Loans in repayment — delinquent 31-60 days |
97 | 76 | 92 | 87 | 225 | — | 577 | |||||||||||||||||||||
| Loans in repayment — delinquent 61-90 days |
64 | 52 | 56 | 51 | 125 | — | 348 | |||||||||||||||||||||
| Loans in repayment — delinquent greater than 90 days |
186 | 139 | 155 | 123 | 243 | — | 846 | |||||||||||||||||||||
|
|
|
|
|
|
|
|
|
|
|
|
|
|
|
|||||||||||||||
| Total |
$ | 1,776 | $ | 1,977 | $ | 2,982 | $ | 3,787 | $ | 14,953 | $ | 2,040 | 27,515 | |||||||||||||||
|
|
|
|
|
|
|
|
|
|
|
|
|
|||||||||||||||||
| Unamortized discount |
(531 | ) | ||||||||||||||||||||||||||
| Receivable for partially charged-off loans |
881 | |||||||||||||||||||||||||||
| Allowance for loan losses |
(1,471 | ) | ||||||||||||||||||||||||||
|
|
|
|||||||||||||||||||||||||||
| Total Private Education Loans, net |
$ | 26,394 | ||||||||||||||||||||||||||
|
|
|
|||||||||||||||||||||||||||
| Loans in forbearance as a percentage of loans in repayment and forbearance |
19.2 | % | 6.8 | % | 4.6 | % | 3.1 | % | 1.6 | % | — | % | 3.8 | % | ||||||||||||||
|
|
|
|
|
|
|
|
|
|
|
|
|
|
|
|||||||||||||||
| Loans in repayment — delinquent greater than 90 days as a percentage of loans in repayment |
13.0 | % | 7.5 | % | 5.4 | % | 3.3 | % | 1.7 | % | — | % | 3.4 | % | ||||||||||||||
|
|
|
|
|
|
|
|
|
|
|
|
|
|
|
|||||||||||||||
| Net charge-offs as a percentage of average loans in repayment, excluding the net adjustment resulting from the change in the charge-off rate(1) |
13.1 | % | 5.1 | % | 2.9 | % | 1.8 | % | .9 | % | — | % | 2.6 | % | ||||||||||||||
|
|
|
|
|
|
|
|
|
|
|
|
|
|
|
|||||||||||||||
| (1) | In the second quarter of 2015, the portion of the loan amount charged off at default increased from 73 percent to 79 percent. This did not impact the provision for loan losses as previously this had been reserved through the allowance for loan losses. This change resulted in a $330 million reduction to the balance of the receivable for partially charged-off loans. |
| (Dollars in millions) |
Monthly Scheduled Payments Received | Not Yet in Repayment |
||||||||||||||||||||||||||
| December 31, 2014 |
0 to 12 | 13 to 24 | 25 to 36 | 37 to 48 | More than 48 | Total | ||||||||||||||||||||||
| Loans in-school/grace/deferment |
$ | — | $ | — | $ | — | $ | — | $ | — | $ | 3,053 | $ | 3,053 | ||||||||||||||
| Loans in forbearance |
438 | 168 | 148 | 121 | 184 | — | 1,059 | |||||||||||||||||||||
| Loans in repayment — current |
1,732 | 2,586 | 3,734 | 3,982 | 12,727 | — | 24,761 | |||||||||||||||||||||
| Loans in repayment — delinquent 31-60 days |
163 | 122 | 124 | 107 | 218 | — | 734 | |||||||||||||||||||||
| Loans in repayment — delinquent 61-90 days |
102 | 81 | 78 | 62 | 113 | — | 436 | |||||||||||||||||||||
| Loans in repayment — delinquent greater than 90 days |
299 | 204 | 175 | 132 | 208 | — | 1,018 | |||||||||||||||||||||
|
|
|
|
|
|
|
|
|
|
|
|
|
|
|
|||||||||||||||
| Total |
$ | 2,734 | $ | 3,161 | $ | 4,259 | $ | 4,404 | $ | 13,450 | $ | 3,053 | 31,061 | |||||||||||||||
|
|
|
|
|
|
|
|
|
|
|
|
|
|||||||||||||||||
| Unamortized discount |
(594 | ) | ||||||||||||||||||||||||||
| Receivable for partially charged-off loans |
1,245 | |||||||||||||||||||||||||||
| Allowance for loan losses |
(1,916 | ) | ||||||||||||||||||||||||||
|
|
|
|||||||||||||||||||||||||||
| Total Private Education Loans, net |
$ | 29,796 | ||||||||||||||||||||||||||
|
|
|
|||||||||||||||||||||||||||
| Loans in forbearance as a percentage of loans in repayment and forbearance |
16.0 | % | 5.3 | % | 3.5 | % | 2.7 | % | 1.4 | % | — | % | 3.8 | % | ||||||||||||||
|
|
|
|
|
|
|
|
|
|
|
|
|
|
|
|||||||||||||||
| Loans in repayment — delinquent greater than 90 days as a percentage of loans in repayment |
13.0 | % | 6.8 | % | 4.3 | % | 3.1 | % | 1.6 | % | — | % | 3.8 | % | ||||||||||||||
|
|
|
|
|
|
|
|
|
|
|
|
|
|
|
|||||||||||||||
| Net charge-offs as a percentage of average loans in repayment |
11.2 | % | 3.8 | % | 2.3 | % | 1.5 | % | .9 | % | — | % | 2.6 | % | ||||||||||||||
|
|
|
|
|
|
|
|
|
|
|
|
|
|
|
|||||||||||||||
88
Table of Contents
Private Education Loan Repayment Options
Certain loan programs allow customers to select from a variety of repayment options depending on their loan type and their enrollment/loan status, which include the ability to extend their repayment term or change their monthly payment. The chart below provides the optional repayment offerings in addition to the standard level principal and interest payments as of December 31, 2016.
| Loan Program |
||||||||||
| (Dollars in millions) |
Signature and Other |
Smart Option |
Career Training |
Total | ||||||
| $ in repayment |
$18,047 | $3,485 | $ 618 | $ | 22,150 | |||||
| $ in total |
$19,895 | $3,799 | $639 | $ | 24,333 | |||||
| Payment method by enrollment status: |
||||||||||
| In-school/grace |
Deferred(1) | Deferred(1), interest-only or fixed $25/month |
Interest-only or fixed $25/month | |||||||
| Repayment |
Level principal and interest or graduated | Level principal and interest | Level principal and interest | |||||||
| (1) | “Deferred” includes loans for which no payments are required and interest charges are capitalized into the loan balance. |
The graduated repayment program that is part of Signature and Other Loans includes an interest-only payment feature that may be selected at the option of the customer. Customers elect to participate in this program at the time they enter repayment following their grace period. This program is available to customers in repayment, after their grace period, who would like a temporary lower payment from the required principal and interest payment amount. Customers participating in this program pay monthly interest with no amortization of their principal balance for up to 48 payments after entering repayment (dependent on the loan product type). The maturity date of the loan is not extended when a customer participates in this program. As of December 31, 2016 and 2015, customers in repayment owing approximately $0.8 billion (4 percent of loans in repayment) and $1.9 billion (8 percent of loans in repayment), respectively, were enrolled in the interest-only program.
Liquidity and Capital Resources
Funding and Liquidity Risk Management
The following “Liquidity and Capital Resources” discussion concentrates on our FFELP Loans and Private Education Loans segments. Our Business Services and Other segments require minimal capital and funding.
We define liquidity as cash and high-quality liquid assets that we can use to meet our cash requirements. Our two primary liquidity needs are: (1) servicing our debt and (2) our ongoing ability to meet our cash needs for running the operations of our businesses (including derivative collateral requirements) throughout market cycles, including during periods of financial stress. Secondary liquidity needs, which can be adjusted as needed, include acquisitions of Private Education Loan and FFELP Loan portfolios, acquisitions of companies, the payment of common stock dividends and the repurchase of common stock under common share repurchase programs. To achieve these objectives, we analyze and monitor our liquidity needs, maintain excess liquidity and access diverse funding sources including the issuance of unsecured debt and the issuance of secured debt primarily through asset-backed securitizations and/or other financing facilities.
We define our liquidity risk as the potential inability to meet our obligations when they become due without incurring unacceptable losses or invest in future asset growth and business operations at reasonable market rates. Our primary liquidity risk relates to our ability to service our debt, meet our other business obligations and to continue to grow our business. The ability to access the capital markets is impacted by general market and
89
Table of Contents
economic conditions, our credit ratings, as well as the overall availability of funding sources in the marketplace. In addition, credit ratings may be important to customers or counterparties when we compete in certain markets and when we seek to engage in certain transactions, including over-the-counter derivatives.
Credit ratings and outlooks are opinions subject to ongoing review by the ratings agencies and may change, from time to time, based on our financial performance, industry and market dynamics and other factors. Other factors that influence our credit ratings include the ratings agencies’ assessment of the general operating environment, our relative positions in the markets in which we compete, reputation, liquidity position, the level and volatility of earnings, corporate governance and risk management policies, capital position and capital management practices. A negative change in our credit rating could have a negative effect on our liquidity because it might raise the cost and availability of funding and potentially require additional cash collateral or restrict cash currently held as collateral on existing borrowings or derivative collateral arrangements. It is our objective to improve our credit ratings so that we can continue to efficiently access the capital markets even in difficult economic and market conditions.
We have unsecured debt that totaled $13.7 billion at December 31, 2016. Three credit rating agencies currently rate our long-term unsecured debt at below investment grade. From May 1, 2014 (Spin-Off) to December 31, 2016, we issued $2.8 billion of unsecured debt ($1.0 billion in fourth-quarter 2014, $500 million in first-quarter 2015 and $1.3 billion in third-quarter 2016) at an average all-in cost of one-month LIBOR plus 4.79 percent and an average term to maturity of 6.8 years.
As of June 30, 2016, Moody’s and Fitch had on credit watch $56.2 billion and $50.5 billion, respectively, of non-recourse FFELP ABS sponsored by our affiliates due to concerns that trust cash flows may not be sufficient to pay all bonds by the legal final maturity date. The credit watch actions that began in 2015 created dislocation in the FFELP ABS market, which impacted the cost and availability of FFELP ABS financing during the second half of 2015.
Since June 30, 2016, Moody’s and Fitch have taken final ratings action on $52.4 billion and $38.8 billion, respectively, of non-recourse FFELP ABS sponsored by our affiliates due to concerns that trust cash flows may not be sufficient to pay all bonds by the legal final maturity date. As of January 31, 2017, these actions have resulted in downgrades to non-investment grade rating on $4.1 billion and $6.6 billion in FFELP ABS by Moody’s and Fitch, respectively. Subsequent to the initial downgrade action, Fitch and Moody’s have upgraded $0.5 billion and $1.2 billion, respectively, of FFELP ABS to investment grade after the Company successfully extended the legal final maturity dates of these bonds. As of January 31, 2017, $11.3 billion of non-recourse FFELP ABS sponsored by our affiliates remains on credit watch by Fitch. Moody’s has completed its ratings actions.
Navient issued $5.8 billion of FFELP ABS in 2016 (in seven different transactions). As of February 23, 2017, Navient has been successful in extending the legal final maturity dates for $10.0 billion of FFELP ABS bonds in various Navient-sponsored FFELP securitizations.
We expect to fund our ongoing liquidity needs, including the repayment of $0.7 billion of senior unsecured notes that mature in 2017, primarily through our current cash, investments and unencumbered FFELP Loan portfolio, the predictable operating cash flows provided by operating activities ($1.4 billion in the year ended December 31, 2016), the repayment of principal on unencumbered education loan assets, and the distribution of overcollateralization from our securitization trusts. We may also, depending on market conditions and availability, draw down on our secured FFELP Loan and Private Education Loan facilities, issue term ABS, enter into additional Private Education Loan ABS repurchase facilities, or issue additional unsecured debt.
We no longer originate Private Education Loans or FFELP Loans and therefore no longer have liquidity requirements for new originations. We have purchased and may purchase, in future periods, Private Education Loan and FFELP Loan portfolios from third parties. These purchases, if any, will be part of our ongoing liquidity needs.
90
Table of Contents
Sources of Liquidity and Available Capacity
Ending Balances
| (Dollars in millions) |
December 31, 2016 |
December 31, 2015 |
||||||
| Sources of primary liquidity: |
||||||||
| Total unrestricted cash and liquid investments |
$ | 1,256 | $ | 1,598 | ||||
| Unencumbered FFELP Loans |
359 | 909 | ||||||
|
|
|
|
|
|||||
| Total GAAP and “Core Earnings” basis |
$ | 1,615 | $ | 2,507 | ||||
|
|
|
|
|
|||||
Average Balances
| Years Ended December 31, | ||||||||||||
| (Dollars in millions) |
2016 | 2015 | 2014 | |||||||||
| Sources of primary liquidity: |
||||||||||||
| Total unrestricted cash and liquid investments |
$ | 1,185 | $ | 1,546 | $ | 2,066 | ||||||
| Unencumbered FFELP Loans |
1,035 | 1,506 | 1,810 | |||||||||
|
|
|
|
|
|
|
|||||||
| Total “Core Earnings” basis |
2,220 | 3,052 | 3,876 | |||||||||
| SLM BankCo(1) |
— | — | 976 | |||||||||
|
|
|
|
|
|
|
|||||||
| Total GAAP basis |
$ | 2,220 | $ | 3,052 | $ | 4,852 | ||||||
|
|
|
|
|
|
|
|||||||
| (1) | For the year ended December 31, 2014, includes $515 million of cash and $461 million of FFELP Loans. |
Liquidity may also be available under secured credit facilities to the extent we have eligible collateral and capacity available. Maximum borrowing capacity under the FFELP Loan — other facilities will vary and be subject to each agreement’s borrowing conditions, including, among others, facility size, current usage and availability of qualifying collateral from unencumbered FFELP Loans. As of December 31, 2016 and 2015, the maximum additional capacity under these facilities was $2.2 billion and $3.6 billion, respectively. For the years ended December 31, 2016, 2015 and 2014, the average maximum additional capacity under these facilities was $2.6 billion, $11.2 billion and $12.2 billion, respectively. The $8.6 billion reduction in the average maximum additional capacity during 2016 primarily related to a $7.1 billion reduction in the availability under the facility with the Federal Home Loan Bank of Des Moines (“FHLB”). In December 2015, we received notice from FHLB that availability under the facility would be reduced and will mature in the first quarter of 2021. Both of these actions were taken by the FHLB in relation to the publication in January 2016 of new rules by the Federal Home Finance Agency, the primary regulator of the FHLB, governing eligibility of, and borrowing capacity for, certain insurance companies who are existing members of the Federal Home Loan Bank system. As of December 31, 2016, the maximum capacity and the amount outstanding under this facility was $3.4 billion and we do not expect to borrow more than this amount in the future.
In addition to the FFELP Loan — other facilities, liquidity may also be available from our Private Education Loan ABCP facility. On June 27, 2016, this facility was renewed and extended from its then current maturity date of June 30, 2016 to June 26, 2017. This facility’s maximum financing amount, which was originally $1 billion, is now $750 million. At December 31, 2016, the available capacity under this facility was $285 million. Borrowing under this facility will vary and is subject to the availability of qualifying collateral from unencumbered Private Education Loans and the other terms and conditions set forth in the agreement.
At December 31, 2016, we had a total of $6.8 billion of unencumbered tangible assets inclusive of those listed in the table above as sources of primary liquidity. Total unencumbered education loans comprised $3.2 billion of our unencumbered tangible assets of which $2.8 billion and $0.4 billion related to Private Education Loans and FFELP Loans, respectively. In addition, as of December 31, 2016, we had $10.8 billion of encumbered net assets (i.e., overcollateralization) in our various financing facilities (consolidated variable
91
Table of Contents
interest entities). In fourth-quarter 2015, we closed on a $550 million Private Education Loan ABS Repurchase Facility and in the second-quarter 2016, we closed on a second $478 million Private Education Loan ABS Repurchase Facility. Both repurchase facilities are collateralized by Residual Interests in previously issued Private Education Loan ABS trusts. These are examples of how we can effectively finance previously encumbered assets to generate additional liquidity in addition to the unencumbered assets we traditionally have encumbered in the past. Additionally, these repurchase facilities had a cost of funds lower than that of a new unsecured debt issuance.
The following table reconciles encumbered and unencumbered assets and their net impact on total tangible equity.
| (Dollars in billions) |
December 31, 2016 |
December 31, 2015 |
||||||
| Net assets of consolidated variable interest entities (encumbered assets) — FFELP Loans |
$ | 4.7 | $ | 5.0 | ||||
| Net assets of consolidated variable interest entities (encumbered assets) — Private Education Loans |
6.1 | 6.3 | ||||||
| Tangible unencumbered assets(1) |
6.8 | 8.8 | ||||||
| Senior unsecured debt |
(13.7 | ) | (15.1 | ) | ||||
| Mark-to-market on unsecured hedged debt(2) |
(.4 | ) | (.7 | ) | ||||
| Other liabilities, net |
(.4 | ) | (1.0 | ) | ||||
|
|
|
|
|
|||||
| Total tangible equity — GAAP Basis |
$ | 3.1 | $ | 3.3 | ||||
|
|
|
|
|
|||||
| (1) | Excludes goodwill and acquired intangible assets. |
| (2) | At December 31, 2016 and 2015, there were $403 million and $670 million, respectively, of net gains on derivatives hedging this debt in unencumbered assets, which partially offset these losses. |
2016 Financing Transactions
During 2016, Navient issued $5.8 billion in FFELP Loan ABS, $488 million in Private Education Loan ABS and $1.3 billion in unsecured debt.
In the first-quarter 2016, Navient increased and extended its FFELP Loan ABCP facility. The facility’s maturity date was extended to March 2018 from March 2017 and its maximum financing amount, which was originally scheduled to step down to $7 billion in March 2016, was increased to $7.5 billion with a step down to $6.75 billion in March 2017. This facility provides liquidity for refinancing and acquisitions of FFELP Loans.
In the second-quarter 2016, Navient extended and reduced the capacity of its Private Education Loan ABCP facility. The maturity date on our Private Education Loan ABCP facility was extended from June 2016 to June 2017 and the maximum financing amount available under the facility was reduced from $1 billion to $750 million. This facility provides liquidity for Private Education Loans.
In the second-quarter 2016, we completed a $478 million Private Education Loan ABS repurchase transaction collateralized by Residual Interests in three previously issued Private Education Loan ABS trusts.
Shareholder Distributions
In 2016, we paid four quarterly common stock dividends of $0.16 per share.
In 2016, we repurchased 59.6 million shares of common stock for $755 million, fully utilizing our previously disclosed share repurchase program. Since the Spin-Off, we repurchased 137.7 million shares.
Recent First-Quarter 2017 Transactions
In February 2017, we issued $1.0 billion in FFELP Loan ABS.
92
Table of Contents
Counterparty Exposure
Counterparty exposure related to financial instruments arises from the risk that a lending, investment or derivative counterparty will not be able to meet its obligations to us. Risks associated with our lending portfolio are discussed in the section titled “Financial Condition — FFELP Loan Portfolio Performance” and “— Private Education Loan Portfolio Performance.”
Our investment portfolio is composed of very short-term securities issued by a diversified group of highly rated issuers, limiting our counterparty exposure. Additionally, our investing activity is governed by board of director approved limits on the amount that is allowed to be invested with any one issuer based on the credit rating of the issuer, further minimizing our counterparty exposure. Counterparty credit risk is considered when valuing investments and considering impairment.
Related to derivative transactions, protection against counterparty risk is generally provided by Master Agreements, Schedules, and Credit Support Annexes (“CSAs”) developed by the International Swaps and Derivatives Association, Inc. (“ISDA documentation”). In particular, Navient’s CSAs require a counterparty to post collateral if a potential default would expose the other party to a loss. All corporate derivative contracts entered into by Navient that are not cleared through a derivatives clearing organization are covered under such agreements and require collateral to be exchanged based on the net fair value of derivatives with each counterparty. Our securitization trusts with swaps have ISDA documentation with protections against counterparty risk. The collateral calculations contemplated in the ISDA documentation of our securitization trusts require collateral based on the fair value of the derivative which may be adjusted for additional collateral based on rating agency criteria requirements considered within the collateral agreement. The trusts are not required to post collateral to the counterparties. In all cases, our exposure is limited to the value of the derivative contracts in a gain position net of any collateral we are holding. We consider counterparties’ credit risk when determining the fair value of derivative positions on our exposure net of collateral.
We have liquidity exposure related to collateral movements between us and our derivative counterparties. Movements in the value of the derivatives, which are primarily affected by changes in interest rate and foreign exchange rates, may require us to return cash collateral held or may require us to access primary liquidity to post collateral to counterparties. See “Note 7 — Derivative Financial Instruments” for more information on the amount of cash that has been received and delivered to derivative counterparties.
The table below highlights exposure related to our derivative counterparties at December 31, 2016.
| (Dollars in millions) |
Corporate Contracts |
Securitization Trust Contracts |
||||||
| Exposure, net of collateral |
$ | 110 | $ | 9 | ||||
| Percent of exposure to counterparties with credit ratings below S&P AA- or Moody’s Aa3 |
74 | % | 47 | % | ||||
| Percent of exposure to counterparties with credit ratings below S&P A- or Moody’s A3 |
19 | % | 0 | % | ||||
“Core Earnings” Basis Borrowings
The following tables present the ending balances of our “Core Earnings” basis borrowings at December 31, 2016, 2015 and 2014, and average balances and average interest rates of our “Core Earnings” basis borrowings for 2016, 2015 and 2014. The average interest rates include derivatives that are economically hedging the underlying debt but do not qualify for hedge accounting treatment (see “‘Core Earnings’ — Definition and Limitations — Differences between ‘Core Earnings’ and GAAP — Reclassification of Realized Gains (Losses) on Derivative and Hedging Activities” of this Item 7).
93
Table of Contents
Ending Balances
| December 31, 2016 | December 31, 2015 | December 31, 2014 | ||||||||||||||||||||||||||||||||||
| (Dollars in millions) |
Short Term |
Long Term |
Total | Short Term |
Long Term |
Total | Short Term |
Long Term |
Total | |||||||||||||||||||||||||||
| Unsecured borrowings: |
||||||||||||||||||||||||||||||||||||
| Senior unsecured debt |
$ | 717 | $ | 13,029 | $ | 13,746 | $ | 1,120 | $ | 13,976 | $ | 15,096 | $ | 1,066 | $ | 16,311 | $ | 17,377 | ||||||||||||||||||
|
|
|
|
|
|
|
|
|
|
|
|
|
|
|
|
|
|
|
|||||||||||||||||||
| Total unsecured borrowings |
717 | 13,029 | 13,746 | 1,120 | 13,976 | 15,096 | 1,066 | 16,311 | 17,377 | |||||||||||||||||||||||||||
| Secured borrowings: |
||||||||||||||||||||||||||||||||||||
| FFELP Loan securitizations |
— | 73,522 | 73,522 | — | 77,764 | 77,764 | — | 86,241 | 86,241 | |||||||||||||||||||||||||||
| Private Education Loan securitizations(1) |
548 | 14,125 | 14,673 | — | 16,900 | 16,900 | — | 17,997 | 17,997 | |||||||||||||||||||||||||||
| FFELP Loan — other facilities |
— | 12,443 | 12,443 | — | 16,276 | 16,276 | — | 15,358 | 15,358 | |||||||||||||||||||||||||||
| Private Education Loan — other facilities |
464 | — | 464 | 710 | — | 710 | 653 | — | 653 | |||||||||||||||||||||||||||
| Other(2) |
606 | — | 606 | 760 | — | 760 | 937 | — | 937 | |||||||||||||||||||||||||||
|
|
|
|
|
|
|
|
|
|
|
|
|
|
|
|
|
|
|
|||||||||||||||||||
| Total secured borrowings |
1,618 | 100,090 | 101,708 | 1,470 | 110,940 | 112,410 | 1,590 | 119,596 | 121,186 | |||||||||||||||||||||||||||
|
|
|
|
|
|
|
|
|
|
|
|
|
|
|
|
|
|
|
|||||||||||||||||||
| “Core Earnings” basis borrowings |
2,335 | 113,119 | 115,454 | 2,590 | 124,916 | 127,506 | 2,656 | 135,907 | 138,563 | |||||||||||||||||||||||||||
| Adjustment for GAAP accounting treatment |
(1 | ) | (751 | ) | (752 | ) | (20 | ) | (83 | ) | (103 | ) | 7 | 959 | 966 | |||||||||||||||||||||
|
|
|
|
|
|
|
|
|
|
|
|
|
|
|
|
|
|
|
|||||||||||||||||||
| GAAP basis borrowings |
$ | 2,334 | $ | 112,368 | $ | 114,702 | $ | 2,570 | $ | 124,833 | $ | 127,403 | $ | 2,663 | $ | 136,866 | $ | 139,529 | ||||||||||||||||||
|
|
|
|
|
|
|
|
|
|
|
|
|
|
|
|
|
|
|
|||||||||||||||||||
| (1) | Includes $548 million, $0 and $0 of short-term debt related to the Private Education Loan asset-backed securitization repurchase facility (“Repurchase Facility”) as of December 31, 2016, 2015 and 2014, respectively. Includes $475 million, $546 million and $0 of long-term debt related to the Repurchase Facility as of December 31, 2016, 2015 and 2014, respectively. |
| (2) | “Other” primarily includes the obligation to return cash collateral held related to derivative exposures, which includes $193 million of securities re-pledged subject to an overnight repurchase transaction. |
Secured borrowings comprised 88 percent and 88 percent of our “Core Earnings” basis debt outstanding at December 31, 2016 and 2015, respectively.
Average Balances
| Years Ended December 31, | ||||||||||||||||||||||||
| 2016 | 2015 | 2014 | ||||||||||||||||||||||
| (Dollars in millions) |
Average Balance |
Average Rate |
Average Balance |
Average Rate |
Average Balance |
Average Rate |
||||||||||||||||||
| Unsecured borrowings: |
||||||||||||||||||||||||
| Senior unsecured debt |
$ | 14,134 | 4.45 | % | $ | 16,315 | 4.00 | % | $ | 17,533 | 3.73 | % | ||||||||||||
|
|
|
|
|
|
|
|
|
|
|
|
|
|||||||||||||
| Total unsecured borrowings |
14,134 | 4.45 | 16,315 | 4.00 | 17,533 | 3.73 | ||||||||||||||||||
|
|
|
|
|
|
|
|
|
|
|
|
|
|||||||||||||
| Secured borrowings: |
||||||||||||||||||||||||
| FFELP Loan securitizations |
75,397 | 1.54 | 82,640 | 1.05 | 88,729 | .99 | ||||||||||||||||||
| Private Education Loan securitizations(1) |
15,906 | 2.61 | 17,281 | 2.10 | 18,347 | 2.00 | ||||||||||||||||||
| FFELP Loan — other facilities |
14,610 | 1.25 | 15,214 | 0.87 | 8,618 | .81 | ||||||||||||||||||
| Private Education Loan — other facilities |
389 | 2.60 | 636 | 1.86 | 780 | 1.54 | ||||||||||||||||||
|
Other(2) |
629 | 1.33 | 898 | 0.65 | 832 | .45 | ||||||||||||||||||
|
|
|
|
|
|
|
|
|
|
|
|
|
|||||||||||||
| Total secured borrowings |
106,931 | 1.66 | 116,669 | 1.19 | 117,306 | 1.14 | ||||||||||||||||||
|
|
|
|
|
|
|
|
|
|
|
|
|
|||||||||||||
| “Core Earnings” basis borrowings |
$ | 121,065 | 1.99 | % | $ | 132,984 | 1.53 | % | $ | 134,839 | 1.47 | % | ||||||||||||
|
|
|
|
|
|
|
|
|
|
|
|
|
|||||||||||||
| “Core Earnings” basis borrowings |
$ | 121,065 | 1.99 | % | $ | 132,984 | 1.53 | % | $ | 134,839 | 1.47 | % | ||||||||||||
| Adjustment for GAAP accounting treatment |
— | .03 | — | 0.03 | 2,952 | 2.50 | ||||||||||||||||||
|
|
|
|
|
|
|
|
|
|
|
|
|
|||||||||||||
| GAAP basis borrowings |
$ | 121,065 | 2.02 | % | $ | 132,984 | 1.56 | % | $ | 137,791 | 1.50 | % | ||||||||||||
|
|
|
|
|
|
|
|
|
|
|
|
|
|||||||||||||
| (1) | Includes $885 million, $45 million and $0 of debt related to the Private Education Loan asset-backed securitization repurchase facility (“Repurchase Facility”) for the years ended December 31, 2016, 2015 and 2014, respectively. |
| (2) | “Other” primarily includes the obligation to return cash collateral held related to derivative exposures. |
94
Table of Contents
Contractual Cash Obligations
The following table provides a summary of our contractual principal obligations associated with long-term notes at December 31, 2016. For further discussion of these obligations, see “Note 6 — Borrowings.”
| (Dollars in millions) |
1 Year or Less |
1 to 3 Years |
3 to 5 Years |
Over 5 Years |
Total | |||||||||||||||
| Long-term notes: |
||||||||||||||||||||
| Senior unsecured debt |
$ | — | $ | 4,408 | $ | 3,324 | $ | 5,297 | $ | 13,029 | ||||||||||
| Secured borrowings(1) |
14,221 | 18,409 | 16,508 | 50,952 | 100,090 | |||||||||||||||
|
|
|
|
|
|
|
|
|
|
|
|||||||||||
| Total contractual cash obligations(2) |
$ | 14,221 | $ | 22,817 | $ | 19,832 | $ | 56,249 | $ | 113,119 | ||||||||||
|
|
|
|
|
|
|
|
|
|
|
|||||||||||
| (1) | Includes $87.6 billion of long-term notes issued by consolidated VIEs in conjunction with our securitization transactions and included in long-term notes in the consolidated balance sheet. Timing of obligations is estimated based on our current projection of prepayment speeds of the securitized assets. |
| (2) | The aggregate principal amount of debt that matures in each period is $14.3 billion, $23.0 billion, $20.0 billion and $56.8 billion, respectively. Specifically excludes derivative market value adjustments of $(751) million for long-term notes. Interest obligations on notes are predominantly variable in nature, resetting monthly and quarterly based on LIBOR. |
Unrecognized tax benefits were $83 million and $66 million for 2016 and 2015, respectively. For additional information, see “Note 14 — Income Taxes.”
Critical Accounting Policies and Estimates
Management’s Discussion and Analysis of Financial Condition and Results of Operations addresses our consolidated financial statements, which have been prepared in accordance with generally accepted accounting principles in the United States of America (“GAAP”). “Note 2 — Significant Accounting Policies” includes a summary of the significant accounting policies and methods used in the preparation of our consolidated financial statements. The preparation of these financial statements requires management to make estimates and assumptions that affect the reported amounts of assets and liabilities and the reported amounts of income and expenses during the reporting periods. Actual results may differ from these estimates under varying assumptions or conditions. On a quarterly basis, management evaluates its estimates, particularly those that include the most difficult, subjective or complex judgments and are often about matters that are inherently uncertain. The most significant judgments, estimates and assumptions relate to the following critical accounting policies that are discussed in more detail below.
Allowance for Loan Losses
Our Private Education Loan portfolio contains TDR and non-TDR loans. For customers experiencing financial difficulty, certain Private Education Loans for which we have granted a forbearance of greater than three months, an interest rate reduction or an extended repayment plan are classified as TDRs. The allowance requirements are different based on these designations. In determining the allowance for loan losses on our non-TDR portfolio, we estimate the principal amount of loans that will default over the next two years (two years being the expected period between a loss event and default) and how much we expect to recover over time related to the defaulted amount. Expected defaults less our expected recoveries equal the allowance related to this portfolio. Our historical experience indicates that, on average, the time between the date that a customer experiences a default causing event (i.e., the loss trigger event) and the date that we charge off the unrecoverable portion of that loan is two years. Separately, for our TDR portfolio, we estimate an allowance amount sufficient to cover life-of-loan expected losses through an impairment calculation based on the difference between the loan’s basis and the present value of expected future cash flows (which would include life-of-loan default and recovery assumptions) discounted at the loan’s original effective interest rate. Our TDR portfolio is comprised mostly of loans with forbearance usage greater than three months and interest rate reductions. The separate allowance estimates for our TDR and non-TDR portfolios are combined into our total allowance for Private Education Loan losses.
95
Table of Contents
In estimating both the non-TDR and TDR allowance amounts, we start with historical experience of customer default behavior. We make judgments about which historical period to start with and then make further judgments about whether that historical experience is representative of future expectations and whether additional adjustments may be needed to those historical default rates. We also take the economic environment into consideration when calculating the allowance for loan losses. We analyze key economic statistics and the effect we expect them to have on future defaults. Key economic statistics analyzed as part of the allowance for loan losses are primarily unemployment rates. Our allowance for loan losses is estimated using an analysis of delinquent and current accounts. Our model is used to estimate the likelihood that a loan may progress through the various delinquency stages and ultimately charge off. The evaluation of the allowance for loan losses is inherently subjective, as it requires material estimates that may be susceptible to significant changes. The estimate for the allowance for loan losses is subject to a number of assumptions. If actual future performance in delinquency, charge-offs and recoveries are significantly different than estimated, this could materially affect our estimate of the allowance for loan losses and the related provision for loan losses on our income statement.
We determine the collectability of our Private Education Loan portfolio by evaluating certain risk characteristics. We consider school type, credit score (FICO), existence of a cosigner, loan status and loan seasoning as the key credit quality indicators because they have the most significant effect on our determination of the adequacy of our allowance for loan losses. The type of school customers attend can have an impact on their graduation rate and job prospects after graduation and therefore affects their ability to make payments. Credit scores are an indicator of the credit worthiness of a customer and the higher the credit score the more likely it is the customer will be able to make all of their contractual payments. Loan status affects the credit risk because a past due loan is more likely to result in a credit loss than an up-to-date loan. Additionally, loans in a deferred payment status have different credit risk profiles compared with those in current payment status. Of the portfolio in repayment, loan seasoning is an important factor. It affects credit risk because a loan with a history of making payments generally has a lower incidence of default than a loan with a history of making infrequent or no payments. The existence of a cosigner lowers the likelihood of default. We monitor and update these credit quality indicators in the analysis of the adequacy of our allowance for loan losses on a quarterly basis.
To estimate the probable credit losses incurred in the loan portfolio at the reporting date, we use historical experience of customer payment behavior in connection with the key credit quality indicators and incorporate management expectations regarding macroeconomic and collection performance factors. Our model is based upon the most recent twelve months of actual collection experience as the starting point for the non-TDR portfolio and the most recent approximate 10 years for the TDR portfolio and applies expected macroeconomic changes and collection procedure changes to estimate expected losses caused by loss events incurred as of the balance sheet date. Our model for the non-TDR portfolio places a greater emphasis on the more recent default experience rather than the default experience for older historical periods, as we believe the more recent default experience is more indicative of the probable losses incurred in the loan portfolio today that will default over the next two years. The TDR portfolio uses a longer historical default experience since we are projecting life of loan remaining losses. Similar to estimating defaults, we use historical customer payment behavior to estimate the timing and amount of future recoveries on charged-off loans. We use judgment in determining whether historical performance is representative of what we expect to collect in the future. We then apply the default and collection rate projections to each category of loans. Once the quantitative calculation is performed, we review the adequacy of the allowance for loan losses and determine if qualitative adjustments need to be considered. Additionally, we consider changes in laws and regulations that could potentially impact the allowance for loan losses. More judgment has been required over the last several years, compared with years prior, in light of the U.S. economy and its effect on our customers’ ability to pay their obligations. We believe that our model reflects recent customer behavior, loan performance, and collection performance, as well as expectations about economic factors.
Our collection policies allow for periods of nonpayment for customers requesting additional payment grace periods upon leaving school or experiencing temporary difficulty meeting payment obligations. This is referred to as forbearance status and is considered in our allowance for loan losses. The loss confirmation period is in alignment with our typical collection cycle and takes into account these periods of nonpayment.
96
Table of Contents
Our allowance for Private Education Loan losses also provides for possible additional future charge-offs as they occur related to the receivable for partially charged-off Private Education Loans. At the end of each month, for loans that are 212 days past due, we charge off the estimated loss of a defaulted loan balance. Actual recoveries are applied against the remaining loan balance that was not charged off. We refer to this remaining loan balance as the “receivable for partially charged-off loans.” If actual periodic recoveries are less than expected, the difference is immediately charged off through the allowance for loan losses with an offsetting reduction in the receivable for partially charged-off Private Education Loans. If actual periodic recoveries are greater than expected, they will be reflected as a recovery through the allowance for Private Education Loan losses once the cumulative recovery amount exceeds the cumulative amount originally expected to be recovered. Private Education Loans which defaulted between 2007 through March 31, 2015, experienced collection performance below our pre-financial crisis experience. As a result, we began building a reserve for shortfalls in recoveries until we could determine the long-term post-default recovery rate. In the second quarter of 2015, the portion of the loan amount charged off at default increased from 73 percent to 79 percent. This did not impact the provision for loan losses as previously this had been reserved through the allowance for loan losses. This change resulted in a $330 million reduction to the balance of the receivable for partially charged-off loans.
FFELP Loans are insured as to their principal and accrued interest in the event of default subject to a Risk Sharing level based on the date of loan disbursement. These insurance obligations are supported by contractual rights against the United States. For loans disbursed after October 1, 1993, and before July 1, 2006, we receive 98 percent reimbursement on all qualifying default claims. For loans disbursed on or after July 1, 2006, we receive 97 percent reimbursement. For loans disbursed prior to October 1, 1993, we receive 100 percent reimbursement.
Similar to the allowance for Private Education Loan losses, the allowance for FFELP Loan losses uses historical experience of customer default behavior and a two-year loss confirmation period to estimate the credit losses incurred in the loan portfolio at the reporting date. We apply the default rate projections, net of applicable Risk Sharing, to each category for the current period to perform our quantitative calculation. Once the quantitative calculation is performed, we review the adequacy of the allowance for loan losses and determine if qualitative adjustments need to be considered. For FFELP Loans that have lost their government insurance and have been charged off, any subsequent cash recoveries benefit the allowance for loan losses when received.
Premium and Discount Amortization
The Company has a net unamortized premium balance of $422 million in connection with its $112 billion education loan portfolio as of December 31, 2016. In 2016, the Company corrected its policy for applying the interest method used to amortize premium and discounts on the education loan portfolio. Previously, the Company amortized premium and discounts by including in its prepayment assumption forecasted payments in excess of contractually required payments as well as forecasted defaults and term extensions (deferment and forbearance or other payment modification programs). We determined that accounting rules allow only payments in excess of contractually required payments to be included in the prepayment assumption. Including defaults in estimated future prepayments has the effect of accelerating the amortization of the net premium balance related to our education loan portfolio. Including term extensions in estimated future prepayments has the effect of slowing down the amortization of the net premium balance related to our education loan portfolio.
The net impact of this error was a $2 million reduction to pre-tax net income for the year ended December 31, 2016. The Constant Prepayment Rates (“CPR”) as of December 31, 2016 under our revised policy are 5 percent, 3 percent and 5 percent for FFELP Stafford Loans, FFELP Consolidation Loans and Private Education Loans, respectively. Our prior policy’s CPRs in effect before this correction were 5 percent, 3 percent and 6 percent for FFELP Stafford Loans, FFELP Consolidation Loans and Private Education Loans, respectively. We have concluded this error had an immaterial impact to 2016 results as well as results for prior years.
The most judgmental estimate for premium and discount amortization on education loans is the CPR, which measures the rate at which loans in the portfolio pay down principal compared to their stated terms. In
97
Table of Contents
determining the CPR we only consider payments made in excess of contractually required payments. This would include loan consolidation and other early payoff activity. These activities are affected by changes in our business strategy, changes in our competitor’s business strategies, legislative changes including the ability to consolidate, interest rates and changes to the current economic and credit environment. When we determine the CPR we begin with historical prepayment rates. We make judgments about which historical period to start with and then make further judgments about whether that historical experience is representative of future expectations and whether additional adjustment may be needed to those historical prepayment rates.
In the past (prior to 2008), the consolidation of FFELP Loans and Private Education Loans significantly affected our CPRs and updating those assumptions often resulted in material adjustments to our amortization expense. As a result of the passage of the Health Care and Education Reconciliation Act of 2010 (“HCERA”), there is no longer the ability to consolidate loans under the FFELP although there are other consolidation options with ED and private refinancing options with other lenders. As a result, we expect CPRs related to our FFELP Loans to remain relatively stable over time, unless there is a legislative change by ED or by Congress to encourage or force consolidation. Some education loan companies offer private education loans which can consolidate both FFELP and Private Education Loans and we anticipate more entrants to offer similar products. In 2017, we expect to begin to consolidate FFELP and Private Education Loans as well. These products and expectations are built into the CPR assumption we use for FFELP and Private Education Loans. However, it is difficult to accurately project the timing and level at which this consolidation activity will begin and our assumption may need to be updated by a material amount in the future based on changes in the economy and marketplace.
Fair Value Measurement
The most significant assumptions used in fair value measurements, including those related to credit and liquidity risk, are as follows:
| 1. | Derivatives — When determining the fair value of derivatives, we take into account counterparty credit risk for positions where we are exposed to the counterparty on a net basis by assessing exposure net of collateral held. The net exposure for each counterparty is adjusted based on market information available for that specific counterparty, including spreads from credit default swaps. Additionally, when the counterparty has exposure to us related to our derivatives, we fully collateralize the exposure, minimizing the adjustment necessary to the derivative valuations for our own credit risk. Trusts that contain derivatives are not required to post collateral to counterparties as the credit quality and securitized nature of the trusts minimizes any adjustments for the counterparty’s exposure to the trusts. Adjustments related to credit risk did not reduce the overall value of our derivatives as of December 31, 2016. We also take into account changes in liquidity when determining the fair value of derivative positions. We adjusted the fair value of certain less liquid positions downward by approximately $31 million, to take into account a significant reduction in liquidity as of December 31, 2016, related primarily to basis swaps indexed to interest rate indices with inactive markets. A major indicator of market inactivity is the widening of the bid/ask spread in these markets. In general, the widening of counterparty credit spreads and reduced liquidity for derivative instruments as indicated by wider bid/ask spreads will reduce the fair value of derivatives. In addition, certain cross-currency interest rate swaps hedging foreign currency denominated reset rate and amortizing notes in our trusts contain extension features that coincide with the remarketing dates of the notes. The valuation of the extension feature requires significant judgment based on internally developed inputs. |
| 2. | Education Loans — Our FFELP Loans and Private Education Loans are accounted for at cost or at the lower of cost or fair value if the loan is held-for-sale. The fair values of our education loans are disclosed in “Note 12 — Fair Value Measurements.” For both FFELP Loans and Private Education Loans accounted for at cost, fair value is determined by modeling loan level cash flows using stated terms of the assets and internally-developed assumptions to determine aggregate portfolio yield, net present value and average life. The significant assumptions used to project cash flows are prepayment |
98
Table of Contents
| speeds, default rates, cost of funds, the amount funded by debt versus equity, and required return on equity. In addition, the Floor Income component of our FFELP Loan portfolio is valued through discounted cash flow and option models using both observable market inputs and internally developed inputs. Significant inputs into the models are not generally market observable. They are either derived internally through a combination of historical experience and management’s qualitative expectation of future performance (in the case of prepayment speeds, default rates, and capital assumptions) or are obtained through external broker quotes (as in the case of cost of funds). When possible, market transactions are used to validate the model. In most cases, these are either infrequent or not observable. |
For further information regarding the effect of our use of fair values on our results of operations, see “Note 12 — Fair Value Measurements.”
Transfers of Financial Assets and the Variable Interest Entity (“VIE”) Consolidation Model
If we have a variable interest in a Variable Interest Entity (“VIE”) and we have determined that we are the primary beneficiary of the VIE then we will consolidate the VIE. We are considered the primary beneficiary if we have both: (1) the power to direct the activities of the VIE that most significantly impact the VIE’s economic performance and (2) the obligation to absorb losses or receive benefits of the entity that could potentially be significant to the VIE. There can be considerable judgment that has to be used as it relates to determining the primary beneficiary of the VIEs with which we are associated. There are no “bright line” tests. Rather, the assessment of who has the power to direct the activities of the VIE that most significantly affect the VIE’s economic performance and who has the obligation to absorb losses or receive benefits of the entity that could potentially be significant to the VIE can be very qualitative and judgmental in nature. However, based on our current relationship with our securitization trusts and other financing vehicles which are considered VIEs, we believe the assessment is more straightforward. As it relates to our securitized assets, we are the servicer of those securitized assets (which means we “have the power” to direct the activities of the trust) and we own the Residual Interest (which means we “have the loss and gain obligation that could potentially be significant to the VIE”) of the securitization trusts. As a result, we are the primary beneficiary of our securitization trusts and other financing vehicles. See “Note 2 — Significant Accounting Policies” for further details.
Derivative Accounting
The most significant judgments related to derivative accounting are: (1) concluding the derivative is an effective hedge and qualifies for hedge accounting and (2) determining the fair value of certain derivatives and hedged items. To qualify for hedge accounting a derivative must be concluded to be a highly effective hedge upon designation and on an ongoing basis. There are no “bright line” tests on what is considered a highly effective hedge. We use a historical regression analysis to prove ongoing and prospective hedge effectiveness.
Risk Management
Our Approach
The loan servicing, asset recovery and business processing services Navient provides, as well as the financial markets in which Navient operates, continue to undergo dramatic competitive, technological and regulatory changes. Identifying, understanding and effectively managing the risks inherent in our business are critical to our continued success. Navient assigns risk oversight, management and assessment responsibilities at various levels within our organization and continuously coordinates these activities and responsibilities across our organization. We maintain comprehensive risk management practices to identify, measure, monitor, evaluate, control and report on our significant risks and we routinely evaluate these practices to determine whether they are functioning properly and can be improved.
99
Table of Contents
Risk Management Philosophy
Navient’s risk management philosophy is to ensure all significant risk inherent in our business is identified, measured, monitored, evaluated, controlled and reported. In furtherance of these goals, Navient:
| • | maintains a comprehensive and uniform risk management framework; |
| • | follows a “three lines of defense” structure based upon: (1) accountability and ownership at the business area level for risks inherent in their activities (first line of defense); (2) supporting areas, such as Human Resources, Legal, Compliance, Finance and Accounting, Information-Technology and Information Security, monitor, guide and advise the business areas in their respective areas of expertise (second line of defense); and (3) Internal Audit reviews both business and support areas to ensure compliance with applicable laws, regulations and internal policies and procedures (third line of defense); |
| • | provides appropriate reporting tools to management and our board of directors and their respective committees; and |
| • | trains our employees on our risk management processes and philosophy. |
Risk Oversight, Roles and Responsibilities
The Navient board of directors and its standing committees oversee our strategic direction, including setting our risk management philosophy, tolerance and parameters; and assessing the risks our businesses face as well as the risk management practices our management team develops and implements. We escalate to our board of directors any significant departures from established tolerances and parameters and review new and emerging risks with them.
Responsibility for risk management is assigned at several different levels of our organization, including our board of directors and its committees. Each business area within our organization is primarily responsible for managing its specific risks following processes and procedures developed in collaboration with our executive management team and internal risk management partners. Our Human Resources, Legal, Compliance, Finance and Accounting, Information-Technology and Information Security support areas are responsible for providing our business areas with the training, systems and specialized expertise necessary to properly perform their risk management responsibilities.
Board of Directors. Our board of directors, directly and through its standing committees, is responsible for overseeing our strategic direction and risk management approach. It approves our annual business plan, periodically reviews our strategic approach and priorities and spends significant time considering our capital requirements and our dividend and share repurchase levels and activities. Standing committees of our board of directors include Executive, Audit, Compensation and Personnel, Nominations and Governance, and Finance and Operations. Charters for each committee providing their specific responsibilities and areas of risk oversight are published on our website together with the names of the directors serving on these committees.
Chief Executive Officer. Our Chief Executive Officer is responsible for establishing our risk management culture and ensuring business areas operate within risk parameters and in accordance with our annual business plan.
Chief Risk and Compliance Officer. Our Chief Risk and Compliance Officer is responsible for ensuring proper oversight, management and reporting to our board of directors and management regarding our risk management practices, the timely escalation and complete resolution of any significant risk issues and for instilling our risk management culture in our people and our practices, ensuring business areas operate within risk parameters and in accordance with our annual business plan.
Enterprise Risk Committee. Our Enterprise Risk Committee is an executive management-level committee chaired by our Chief Risk and Compliance Officer where senior management reviews our significant risks,
100
Table of Contents
receives periodic reports on adherence to agreed risk parameters, prioritizes and provides direction on mitigation of our risks and closure of issues and supervises the continued evolution of our enterprise risk management program. This committee also oversees our Internal Controls Excellence (“ICE”) program and Sarbanes-Oxley compliance and ensures any control deficiencies are identified, understood by all relevant affected parties, and have established resolution plans supported by adequate resources. Lastly, this committee evaluates risks associated with new or modified business and makes recommendations regarding proposed business initiatives based on their inherent risks and controls. In addition to the Chair, committee membership includes our Chief Executive Officer, Group President for Asset Management and Servicing, Group President for Asset Recovery and Business Servicing, Chief Financial Officer, Chief Legal Officer, Chief Information Officer and Chief Audit Officer. The committee meets at least six times per year, usually in advance of each regularly scheduled board of directors meeting and more frequently if needed to address particular issues.
Credit and Loan Loss Committee. Our Credit and Loan Loss Committee is an executive management-level committee chaired by our Chief Risk and Compliance Officer to oversee our credit and portfolio management monitoring and strategies, the sufficiency of our loan loss reserves, and current or emerging issues affecting delinquency and default trends which may result in adjustments in our allowances for loan losses.
Compliance Committee. Our Compliance Committee is an executive management-level committee chaired by our Chief Risk and Compliance Officer to oversee regulatory compliance risk management activities including compliance regulatory training, compliance regulatory change management, compliance and operational risk assessment, transactional testing and monitoring, policies and procedures, our privacy and information sharing practices and our Code of Business Conduct.
Disclosure Committee. Our Disclosure Committee reviews our periodic SEC reporting documents, earnings releases and related disclosure policies and procedures, and evaluates whether modified or additional disclosures are required.
Critical Accounting Assumptions Committee. Our Critical Accounting Assumptions Committee oversees critical accounting assumptions, as well as key judgments and estimates involved in preparing our financial statements. These include assumptions about matters such as default, recovery and prepayment rates.
Asset and Liability Committee. Our Asset and Liability Committee oversees our investment portfolio and strategy and our compliance with our investment policy.
Information-Technology and Operations Management Committee. Our Information-Technology and Operations Management Committee oversees our business area operations and the activities of our Information-Technology support area, including Information Security.
Human Resources Committee. Our Human Resources Committee ensures that human resources projects and activities are properly reviewed and approved prior to implementation, and that the prioritization of human resources projects is appropriate for and responsive to the business, human capital and risk management needs of our company.
Incentive Compensation Plan Committee. Our Incentive Compensation Plan Committee defines the approach and practices utilized to effectively govern all Incentive Compensation Plans in order to achieve business results while preventing unreasonable risk taking.
Internal Audit Risk Assessment
Navient Internal Audit monitors our various risk management and compliance efforts, identifies areas that may require increased focus and resources, and reports significant control issues and recommendations to executive management and the Audit Committee of our board of directors. Internal Audit performs an annual risk assessment evaluating the risk of all significant components of our company and uses the results to develop an
101
Table of Contents
annual internal audit plan. The risk assessment process includes detailed measures of risk and formalized identification of auditable components of our company to ensure Internal Audit’s efforts are both properly focused and comprehensive.
Risk Appetite Framework
Navient’s Risk Appetite Framework establishes the level of risk we are willing to accept within each risk category in pursuit of our business strategy. Our Audit Committee of the board of directors reviews our Risk Appetite Framework annually, helping to ensure consistency in our business decisions, monitoring and reporting. Our management-level Enterprise Risk Committee monitors approved risk limits and thresholds to ensure our businesses are operating within approved risk limits. Through ongoing monitoring of risk exposures, management identifies potential risks and develops appropriate responses and mitigation strategies.
Risk Categories
Our Risk Appetite Framework segments Navient’s risks across nine domains: (1) credit; (2) market; (3) funding and liquidity; (4) compliance; (5) legal; (6) operational; (7) reputational/political; (8) governance; and (9) strategy.
Credit Risk. Credit risk is the risk to earnings or capital resulting from an obligor’s failure to meet the terms of any contract with us or otherwise fail to perform as agreed. Credit risk is found in all activities where success depends on counterparty, issuer or borrower performance.
Navient has credit or counterparty risk exposure with borrowers and cosigners of our Private Education Loans, the various counterparties with whom we have entered into derivative or other similar contracts and the various entities with whom we make investments. Credit and counterparty risks are overseen by our Chief Risk and Compliance Officer, our Loss Forecasting staff and the management-level Credit and Loan Loss Committee. Our Chief Risk and Compliance Officer reports regularly to our board of directors and both the Finance and Operations and Audit Committees of the board on these issues.
The credit risk related to our Private Education Loans is managed within a credit risk infrastructure which includes: (i) a well-defined asset quality and collection policy framework; (ii) an ongoing monitoring and review process of portfolio concentration and trends; (iii) assignment and management of credit and loss forecasting authorities and responsibilities; and (iv) establishment of an allowance for loan losses that covers estimated losses based upon portfolio and economic analysis.
Credit risk related to derivative contracts is managed by reviewing counterparties for credit strength on an ongoing basis and through our credit policies, which place limits on our exposure with any single counterparty and, in most cases, require collateral to secure the position. Credit and counterparty risk associated with derivatives is measured based on the replacement cost if counterparties in a gain position fail to perform under the terms of the contract.
Market Risk. Market risk is the risk to earnings or capital resulting from changes in market conditions, such as interest rates, index mismatches, credit spreads, commodity prices or volatilities. Navient is exposed to various types of market risk, in particular the risk of loss resulting in a mismatch between the maturity/duration of assets and liabilities, interest rate risk and other risks that arise through the management of our investment, debt and education loan portfolios. Market risk exposure is managed primarily through our management-level Asset and Liability Committee, which is responsible for all market risks associated with managing our assets and liabilities and recommending limits to be included in our risk appetite and investment structure. These activities are closely tied to those related to the management of our funding and liquidity risks. The Finance and Operations Committee of our board of directors periodically reviews and approves the investment, asset and liability management policies, establishes and monitors various tolerances or other risk measurements, as well as contingency funding plans developed and administered by our Asset and Liability Committee. The Finance and Operations Committee and our Chief Financial Officer report to the full board of directors on matters of market risk management.
102
Table of Contents
Funding and Liquidity Risk. Funding and liquidity risk is the risk to earnings, capital or the conduct of our business arising from the inability to meet our obligations when they become due without incurring unacceptable losses, such as the ability to fund liability maturities or invest in future asset growth and business operations at reasonable market rates. Our primary liquidity risks are any mismatch between the maturity of our assets and liabilities and the servicing of our indebtedness.
Navient’s Finance department oversees our funding and liquidity management activities and is responsible for planning and executing our funding activities and strategies, analyzing and monitoring our liquidity risk, maintaining excess liquidity and accessing diverse funding sources depending on current market conditions. Funding and liquidity risks are overseen and recommendations approved primarily through our management-level Asset and Liability Committee. The Finance and Operations Committee of our board of directors periodically reviews and approves our funding and liquidity positions and the contingency funding plan developed and administered by our Asset and Liability Committee. The Finance and Operations Committee also receives regular reports on our performance against funding and liquidity plans at each of its meetings.
Operational Risk. Operational risk is the risk to earnings or the conduct of our business resulting from inadequate or failed internal processes, people or systems or from external events. Operational risk is pervasive, existing in all business areas, functional units, legal entities and geographic locations, and it includes information technology risk, cybersecurity risk, physical security risk on tangible assets, third-party vendor risk, legal risk, compliance risk and reputational risk.
The Finance and Operations Committee of our board of directors receives operations reports (including operating metrics and performance against annual plan) from our Group President for Asset Management and Servicing, our Group President for Asset Recovery and Business Servicing, Chief Financial Officer and Chief Information Officer at each regularly scheduled meeting. The Finance & Operations Committee also receives business development updates regarding our various business initiatives providing information and metrics about each key component of our business operations. The Finance and Operations Committee of our board of directors also receives periodic information security and cyber security updates and reviews operational and systems-related matters to ensure their implementation produces no significant internal control issues.
Operational risk exposures are managed through a combination of business area management (first line of defense), support area oversight and expertise (second line of defense) and enterprise-wide oversight. Our Group President for Asset Management and Servicing and our Group President for Asset Recovery and Business Servicing are responsible for all of our business operations (servicing, asset recovery and business processing services, and our Chief Information Officer is responsible for our information technology systems and processes). Management-level committees, comprised of senior managers and subject matter experts, including our Enterprise Risk Committee, Compliance Committee, Credit and Loan Loss Committee, Information-Technology and Operations Management Committee and Human Resources Committee, focus on particular aspects of operational risk.
Compliance, Legal and Governance Risk. Compliance risk is the risk to earnings or capital or reputation arising from violations of, or non-conformance with, laws, rules, regulations, prescribed practices, internal policies and procedures, or ethical standards. Legal risk is the risk to earnings, capital or reputation manifested by claims made through the legal system and may arise from a product or service, a transaction, a business relationship, property (real, personal or intellectual), conduct of an employee or change in law or regulation. Governance risk is the risk of not establishing and maintaining a control environment that aligns with stakeholder and regulatory expectations, including tone at the top and board performance. These risks are inherent in all of our businesses. Compliance, legal and governance risk are subsets of operational risk but are recognized as a separate and complementary risk category given their importance in our business. We can be exposed to these risks in key areas such as our asset recovery or loan servicing businesses if compliance with legal and regulatory requirements is not properly implemented, maintained, documented or tested, or when an oversight program does not include appropriate audit and control features.
103
Table of Contents
The Audit Committee of our board of directors oversees our monitoring and control of legal and compliance risks and the qualifications of employees overseeing these risk management functions. The Audit Committee annually reviews our Compliance Plan and significant breaches of our Code of Business Conduct and receives regular reports from executive management responsible for the regulatory and compliance risk management functions.
Reputational/Political Risk. Reputational risk is the risk to earnings or capital arising from damage to our reputation in the view of, or loss of the trust of, customers and the general public. Political risk is the closely related risk to earnings or capital arising from damage to our relationships with governmental entities, regulators and political leaders and candidates. These risks can arise due to both our own acts and omissions (both real and perceived), and the acts and omissions of other industry participants or other third parties, and they are inherent in all of our businesses. Reputational risk and political risk are managed through a combination of business area management (first line of defense), support area oversight and expertise (second line of defense) and enterprise-wide oversight. Our Nominations and Governance Committee oversees our reputational and political risk.
Strategic Risk. Strategic risk is the risk to earnings or capital arising from our potential inability to successfully carry out our strategy. This risk can arise due to both our own acts or omissions, and the acts or omissions of other industry participants or other third parties, and it is inherent in all of our businesses. Strategic risk is managed through a combination of business area management (first line of defense), support area oversight and expertise (second line of defense) and enterprise-wide oversight.
Common Stock
The following table summarizes our common share repurchases and issuances.
| Years Ended December 31, | ||||||||||||
| 2016 | 2015 | 2014 | ||||||||||
| Common stock repurchased(1) |
59,625,325 | 56,043,711 | 30,432,689 | |||||||||
| Average purchase price per share |
$ | 12.68 | $ | 16.87 | $ | 19.72 | ||||||
| Shares repurchased related to employee stock-based compensation plans(2) |
3,197,355 | 2,404,328 | 4,171,342 | |||||||||
| Average purchase price per share |
$ | 13.21 | $ | 19.81 | $ | 20.91 | ||||||
| Common shares issued(3) |
5,476,010 | 4,924,021 | 7,389,962 | |||||||||
| (1) | Common shares purchased under our share repurchase program. |
| (2) | Comprises shares withheld from stock option exercises and vesting of restricted stock for employees’ tax withholding obligations and shares tendered by employees to satisfy option exercise costs. |
| (3) | Common shares issued under our various compensation and benefit plans. |
Our shareholders have authorized the issuance of 1.125 billion shares of common stock (par value of $0.01). At December 31, 2016, 291 million shares were issued and outstanding and 23 million shares were unissued but encumbered for outstanding stock options, restricted stock units and dividend equivalent units for employee compensation and remaining authority for stock-based compensation plans. The stock-based compensation plans are described in “Note 11 — Stock-Based Compensation Plans and Arrangements.”
In April 2014, in connection with the Spin-Off, SLM Corporation retired 127 million shares of common stock held in treasury. This retirement decreased the balance in treasury stock by $2.3 billion, with corresponding decreases of $25 million in common stock and $2.3 billion in additional paid-in capital. There was no impact to total equity from this retirement.
The closing price of our common stock on December 31, 2016 was $16.43.
Dividend and Share Repurchase Program
In 2016, we paid full-year common stock dividends of $0.64 per share, compared with $0.64 in 2015 and $0.60 in 2014.
104
Table of Contents
In 2014, we repurchased 30.4 million shares of common stock for $600 million (8.3 million shares for $200 million pre-Spin-Off, and 22.1 million shares for $400 million post-Spin-Off).
In 2015, we repurchased 56.0 million shares of common stock for $945 million.
In 2016, we repurchased 59.6 million shares of common stock for $755 million.
In December 2016, our board of directors authorized a new $600 million share repurchase program effective January 1, 2017.
105
Table of Contents
| Item 7A. | Quantitative and Qualitative Disclosures about Market Risk |
Interest Rate Sensitivity Analysis
Our interest rate risk management seeks to limit the impact of short-term movements in interest rates on our results of operations and financial position. The following tables summarize the potential effect on earnings over the next 12 months and the potential effect on fair values of balance sheet assets and liabilities at December 31, 2016 and 2015, based upon a sensitivity analysis performed by management assuming a hypothetical increase in market interest rates of 100 basis points and 300 basis points while funding spreads remain constant. Additionally, as it relates to the effect on earnings before unrealized gains (losses) on derivative and hedging activities, a sensitivity analysis was performed assuming the funding index increases 10 basis points while holding the asset index constant, if the funding index and repricing frequency are different than the asset index. These earnings sensitivities are applied only to financial assets and liabilities, including hedging instruments that existed at the balance sheet date and does not take into account new assets, liabilities or hedging instruments that may arise over the next 12 months.
| As of December 31,
2016 Impact on Annual Earnings If: |
As of December 31,
2015 Impact on Annual Earnings If: |
|||||||||||||||||||||||
| Interest Rates: | Funding Indices |
Interest Rates: | Funding Indices |
|||||||||||||||||||||
| (Dollars in millions, except per share amounts) |
Increase 100 Basis Points |
Increase 300 Basis Points |
Increase 10 Basis Points(1) |
Increase 100 Basis Points |
Increase 300 Basis Points |
Increase 10 Basis Points(1) |
||||||||||||||||||
| Effect on Earnings: |
||||||||||||||||||||||||
| Change in pre-tax net income before unrealized gains (losses) on derivative and hedging activities |
$ | (34 | ) | $ | (62 | ) | $ | (99 | ) | $ | (59 | ) | $ | (113 | ) | $ | (119 | ) | ||||||
| Unrealized gains (losses) on derivative and hedging activities |
(4 | ) | (167 | ) | — | (81 | ) | (409 | ) | — | ||||||||||||||
|
|
|
|
|
|
|
|
|
|
|
|
|
|||||||||||||
| Increase (decrease) in income before taxes |
$ | (38 | ) | $ | (229 | ) | $ | (99 | ) | $ | (140 | ) | $ | (522 | ) | $ | (119 | ) | ||||||
|
|
|
|
|
|
|
|
|
|
|
|
|
|||||||||||||
| Increase (decrease) in net income after taxes |
$ | (24 | ) | $ | (145 | ) | $ | (62 | ) | $ | (88 | ) | $ | (329 | ) | $ | (75 | ) | ||||||
|
|
|
|
|
|
|
|
|
|
|
|
|
|||||||||||||
| Increase (decrease) in diluted earnings per |
$ | (.08 | ) | $ | (.49 | ) | $ | (.21 | ) | $ | (.25 | ) | $ | (.92 | ) | $ | (.21 | ) | ||||||
|
|
|
|
|
|
|
|
|
|
|
|
|
|||||||||||||
| (1) | If an asset is not funded with the same index/frequency reset of the asset then it is assumed the funding index increases 10 basis points while holding the asset index constant. There is no sensitivity analysis related to the unrealized gains (losses) on derivative and hedging activities as part of this potential impact on earnings. |
106
Table of Contents
| At December 31, 2016 | ||||||||||||||||||||
| Fair Value | Interest Rates: | |||||||||||||||||||
| Change from Increase of 100 Basis Points |
Change from Increase of 300 Basis Points |
|||||||||||||||||||
| (Dollars in millions) |
$ | % | $ | % | ||||||||||||||||
| Effect on Fair Values |
||||||||||||||||||||
| Assets |
||||||||||||||||||||
| FFELP Loans |
$ | 86,626 | $ | (378 | ) | — | % | $ | (782 | ) | (1 | )% | ||||||||
| Private Education Loans |
23,191 | — | — | — | — | |||||||||||||||
| Other earning assets |
5,203 | — | — | — | — | |||||||||||||||
| Other assets |
4,863 | (34 | ) | (1 | ) | 304 | 6 | |||||||||||||
|
|
|
|
|
|
|
|
|
|
|
|||||||||||
| Total assets gain/(loss) |
$ | 119,883 | $ | (412 | ) | — | % | $ | (478 | ) | — | % | ||||||||
|
|
|
|
|
|
|
|
|
|
|
|||||||||||
| Liabilities |
||||||||||||||||||||
| Interest-bearing liabilities |
$ | 112,172 | $ | (607 | ) | (1 | )% | $ | (1,695 | ) | (2 | )% | ||||||||
| Other liabilities |
2,711 | 155 | 6 | 980 | 36 | |||||||||||||||
|
|
|
|
|
|
|
|
|
|
|
|||||||||||
| Total liabilities (gain)/loss |
$ | 114,883 | $ | (452 | ) | — | % | $ | (715 | ) | (1 | )% | ||||||||
|
|
|
|
|
|
|
|
|
|
|
|||||||||||
| At December 31, 2015 | ||||||||||||||||||||
| Fair Value | Interest Rates: | |||||||||||||||||||
| Change from Increase of 100 Basis Points |
Change from Increase of 300 Basis Points |
|||||||||||||||||||
| (Dollars in millions) |
$ | % | $ | % | ||||||||||||||||
| Effect on Fair Values |
||||||||||||||||||||
| Assets |
||||||||||||||||||||
| FFELP Loans |
$ | 94,281 | $ | (455 | ) | — | % | $ | (928 | ) | (1 | )% | ||||||||
| Private Education Loans |
25,772 | — | — | — | — | |||||||||||||||
| Other earning assets |
5,833 | — | — | — | — | |||||||||||||||
| Other assets |
5,387 | (281 | ) | (5 | ) | (246 | ) | (5 | ) | |||||||||||
|
|
|
|
|
|
|
|
|
|
|
|||||||||||
| Total assets gain/(loss) |
$ | 131,273 | $ | (736 | ) | (1 | )% | $ | (1,174 | ) | (1 | )% | ||||||||
|
|
|
|
|
|
|
|
|
|
|
|||||||||||
| Liabilities |
||||||||||||||||||||
| Interest-bearing liabilities |
$ | 121,040 | $ | (616 | ) | (1 | )% | $ | (1,708 | ) | (1 | )% | ||||||||
| Other liabilities |
2,710 | 96 | 4 | 980 | 36 | |||||||||||||||
|
|
|
|
|
|
|
|
|
|
|
|||||||||||
| Total liabilities (gain)/loss |
$ | 123,750 | $ | (520 | ) | — | % | $ | (728 | ) | (1 | )% | ||||||||
|
|
|
|
|
|
|
|
|
|
|
|||||||||||
A primary objective in our funding is to minimize our sensitivity to changing interest rates by generally funding our floating rate education loan portfolio with floating rate debt. However, due to the ability of some FFELP loans to earn Floor Income, we can have a fixed versus floating mismatch in funding if the education loan earns at the fixed borrower rate and the funding remains floating. In addition, we can have a mismatch in the index (including the frequency of reset) of floating rate debt versus floating rate assets.
During the years ended December 31, 2016 and 2015, certain FFELP Loans were earning Floor Income and we locked in a portion of that Floor Income through the use of derivative contracts. The result of these hedging transactions was to fix the relative spread between the education loan asset rate and the variable rate liability.
In the preceding tables, under the scenario where interest rates increase 100 and 300 basis points, the change in pre-tax net income before the unrealized gains (losses) on derivative and hedging activities is primarily due to the impact of (i) our unhedged loans being in a fixed-rate mode due to Floor Income, while being funded with variable rate debt in low interest rate environments; and (ii) a portion of our variable rate assets being funded
107
Table of Contents
with fixed rate liabilities and equity. Item (i) will generally cause income to decrease when interest rates increase from a low interest rate environment, whereas item (ii) will generally cause income to increase when interest rates increase. In both 2016 and 2015, the loss of income is due almost entirely to item (i) above. The decrease in the loss in 2016 as compared to 2015 was due to both the natural amortization of the FFELP loan portfolio as well as higher interest rates in 2016, which resulted in a loss of unhedged Floor Income during 2016. Item (ii) had very little impact in either period as the Company entered into derivative contracts in 2015 to convert a portion of fixed rate debt to variable rate debt as a part of its overall interest rate risk management strategy, thereby better match-funding its floating rate assets with variable rate debt.
In the preceding tables, under the scenario where interest rates increase 100 and 300 basis points, the change in unrealized gains (losses) on derivative and hedging activities in 2016 and 2015 are primarily due to (1) the notional amount and remaining term of our derivative portfolio and related hedged debt and (2) the interest rate environment. As of December 31, 2016 the Company’s derivative portfolio has declined in size and has a shorter remaining term than the prior year period due to the natural amortization of the education loan portfolios over the year. Both of these factors contribute to the Company losing less income in an increasing interest rate environment in the current period as compared to the prior-year period.
Under the scenario in the tables above labeled “Impact on Annual Earnings If: Funding Indices Increase 10 Basis Points,” the main driver of the decrease in pre-tax income before unrealized gains (losses) on derivative and hedging activities in both the December 31, 2016 and 2015 analyses is primarily the result of one-month LIBOR-indexed FFELP Loans being funded with three-month LIBOR and other non-discrete indexed liabilities. See “Asset and Liability Funding Gap” of this Item 3 for a further discussion.
In addition to interest rate risk addressed in the preceding tables, we are also exposed to risks related to foreign currency exchange rates. Foreign currency exchange risk is primarily the result of foreign currency denominated debt issued by us. When we issue foreign denominated corporate unsecured and securitization debt, our policy is to use cross currency interest rate swaps to swap all foreign currency denominated debt payments (fixed and floating) to U.S. dollar LIBOR using a fixed exchange rate. In the tables above, there would be an immaterial impact on earnings if exchange rates were to decrease or increase, due to the terms of the hedging instrument and hedged items matching. The balance sheet interest bearing liabilities would be affected by a change in exchange rates; however, the change would be materially offset by the cross currency interest rate swaps in other assets or other liabilities. In the current economic environment, volatility in the spread between spot and forward foreign exchange rates has resulted in material mark-to-market impacts to current-period earnings which have not been factored into the above analysis. The earnings impact is noncash, and at maturity of the instruments the cumulative mark-to-market impact will be zero.
Asset and Liability Funding Gap
The tables below present our assets and liabilities (funding) arranged by underlying indices as of December 31, 2016. In the following GAAP presentation, the funding gap only includes derivatives that qualify as effective hedges (those derivatives which are reflected in net interest margin, as opposed to those reflected in the “gains (losses) on derivatives and hedging activities, net” line on the consolidated statements of income). The difference between the asset and the funding is the funding gap for the specified index. This represents our exposure to interest rate risk in the form of basis risk and repricing risk, which is the risk that the different indices may reset at different frequencies or may not move in the same direction or at the same magnitude.
Management analyzes interest rate risk and in doing so includes all derivatives that are economically hedging our debt whether they qualify as effective hedges or not (“Core Earnings” basis). Accordingly, we are also presenting the asset and liability funding gap on a “Core Earnings” basis in the table that follows the GAAP presentation.
108
Table of Contents
GAAP Basis
| Index (Dollars in billions) |
Frequency of Variable Resets |
Assets(1) | Funding(2) | Funding Gap |
||||||||||||
| 3-month Treasury bill |
weekly | $ | 4.3 | $ | — | $ | 4.3 | |||||||||
| Prime |
annual | .4 | — | .4 | ||||||||||||
| Prime |
quarterly | 2.4 | — | 2.4 | ||||||||||||
| Prime |
monthly | 12.1 | — | 12.1 | ||||||||||||
| Prime |
daily | — | .1 | (.1 | ) | |||||||||||
| PLUS Index |
annual | .3 | — | .3 | ||||||||||||
| 3-month LIBOR |
quarterly | — | 49.8 | (49.8 | ) | |||||||||||
| 3-month LIBOR |
daily | — | 1.0 | (1.0 | ) | |||||||||||
| 1-month LIBOR |
monthly | 6.4 | 36.6 | (30.2 | ) | |||||||||||
| 1-month LIBOR daily |
daily | 82.5 | — | 82.5 | ||||||||||||
| CMT/CPI Index |
monthly/quarterly | — | .4 | (.4 | ) | |||||||||||
| Non-Discrete reset(3) |
monthly | — | 15.0 | (15.0 | ) | |||||||||||
| Non-Discrete reset(4) |
daily/weekly | 5.2 | .5 | 4.7 | ||||||||||||
| Fixed Rate(5) |
7.5 | 17.7 | (10.2 | ) | ||||||||||||
|
|
|
|
|
|
|
|||||||||||
| Total |
$ | 121.1 | $ | 121.1 | $ | — | ||||||||||
|
|
|
|
|
|
|
|||||||||||
| (1) | FFELP Loans of $27.0 billion ($24.3 billion LIBOR index and $2.7 billion Treasury bill index) are currently earning a fixed rate of interest as a result of the low interest rate environment. |
| (2) | Funding (by index) includes all derivatives that qualify as hedges. |
| (3) | Funding consists of auction rate ABS and ABCP facilities. |
| (4) | Assets include restricted and unrestricted cash equivalents and other overnight type instruments. Funding includes the obligation to return cash collateral held related to derivatives exposures. |
| (5) | Assets include receivables and other assets (including goodwill and acquired intangibles). Funding includes other liabilities and stockholders’ equity. |
The “Funding Gaps” in the above table are primarily interest rate mismatches in short-term indices between our assets and liabilities. We address this issue typically through the use of basis swaps that typically convert quarterly reset three-month LIBOR to other indices that are more correlated to our asset indices. These basis swaps do not qualify as effective hedges and, as a result, the effect on the funding index is not included in our interest margin and is therefore excluded from the GAAP presentation.
109
Table of Contents
“Core Earnings” Basis
| Index (Dollars in billions) |
Frequency of Variable Resets |
Assets(1) | Funding(2) | Funding Gap |
||||||||||||
| 3-month Treasury bill |
weekly | $ | 4.3 | $ | — | $ | 4.3 | |||||||||
| Prime |
annual | .4 | — | .4 | ||||||||||||
| Prime |
quarterly | 2.4 | — | 2.4 | ||||||||||||
| Prime |
monthly | 12.1 | — | 12.1 | ||||||||||||
| Prime |
daily | — | .1 | (.1 | ) | |||||||||||
| PLUS Index |
annual | .3 | — | .3 | ||||||||||||
| 3-month LIBOR |
quarterly | — | 50.1 | (50.1 | ) | |||||||||||
| 3-month LIBOR |
daily | — | 1.0 | (1.0 | ) | |||||||||||
| 1-month LIBOR |
monthly | 6.4 | 39.7 | (33.3 | ) | |||||||||||
| 1-month LIBOR |
daily | 82.5 | — | 82.5 | ||||||||||||
| Non-Discrete reset(3) |
monthly | — | 15.0 | (15.0 | ) | |||||||||||
| Non-Discrete reset(4) |
daily/weekly | 5.2 | .5 | 4.7 | ||||||||||||
| Fixed Rate(5) |
6.9 | 14.1 | (7.2 | ) | ||||||||||||
|
|
|
|
|
|
|
|||||||||||
| Total |
$ | 120.5 | $ | 120.5 | $ | — | ||||||||||
|
|
|
|
|
|
|
|||||||||||
| (1) | FFELP Loans of $11.0 billion ($10.2 billion LIBOR index and $0.8 billion Treasury bill index) are currently earning a fixed rate of interest as a result of the low interest rate environment. |
| (2) | Funding (by index) includes all derivatives that management considers economic hedges of interest rate risk and reflects how we internally manage our interest rate exposure. |
| (3) | Funding consists of auction rate ABS and ABCP facilities. |
| (4) | Assets include restricted and unrestricted cash equivalents and other overnight type instruments. Funding includes the obligation to return cash collateral held related to derivatives exposures. |
| (5) | Assets include receivables and other assets (including goodwill and acquired intangibles). Funding includes other liabilities and stockholders’ equity. |
We use interest rate swaps and other derivatives to achieve our risk management objectives. Our asset liability management strategy is to match assets with debt (in combination with derivatives) that have the same underlying index and reset frequency or, when economical, have interest rate characteristics that we believe are highly correlated. The use of funding with index types and reset frequencies that are different from our assets exposes us to interest rate risk in the form of basis and repricing risk. This could result in our cost of funds not moving in the same direction or with the same magnitude as the yield on our assets. While we believe this risk is low, as all of these indices are short-term with rate movements that are highly correlated over a long period of time, market disruptions (which have occurred in prior years) can lead to a temporary divergence between indices resulting in a negative impact to our earnings.
110
Table of Contents
Weighted Average Life
The following table reflects the weighted average life for our earning assets and liabilities at December 31, 2016.
| (Averages in Years) |
Weighted
Average Life |
|||
| Earning assets |
||||
| Education loans |
6.9 | |||
| Other loans |
5.8 | |||
| Cash and investments |
.1 | |||
|
|
|
|||
| Total earning assets |
6.6 | |||
|
|
|
|||
| Borrowings |
||||
| Short-term borrowings |
.5 | |||
| Long-term borrowings |
6.2 | |||
|
|
|
|||
| Total borrowings |
6.0 | |||
|
|
|
|||
| Item 8. | Financial Statements and Supplementary Data |
Reference is made to the financial statements listed under the heading “(a) 1.A. Financial Statements” of Item 15 hereof, which financial statements are incorporated by reference in response to this Item 8.
| Item 9. | Changes in and Disagreements with Accountants on Accounting and Financial Disclosure |
Nothing to report.
| Item 9A. | Controls and Procedures |
Disclosure Controls and Procedures
Our management, with the participation of our principal executive and principal financial officers, evaluated the effectiveness of our disclosure controls and procedures (as defined in Rules 13a-15(e) and 15d-15(e) under the Securities Exchange Act of 1934, as amended (the “Exchange Act”)) as of December 31, 2016. Based on this evaluation, our chief principal executive and principal financial officers concluded that, as of December 31, 2016, our disclosure controls and procedures were effective to ensure that information required to be disclosed by us in the reports that we file or submit under the Exchange Act is (a) recorded, processed, summarized and reported within the time periods specified in the SEC’s rules and forms and (b) accumulated and communicated to our management, including our chief principal executive and principal financial officers as appropriate, to allow timely decisions regarding required disclosure.
Management’s Report on Internal Control over Financial Reporting
Our management is responsible for establishing and maintaining adequate internal control over financial reporting (as defined in Rule 13a-15(f) under the Exchange Act). Under the supervision and with the participation of our management, including our Principal Executive Officer and Principal Financial Officer, we assessed the effectiveness of our internal control over financial reporting as of December 31, 2016. In making this assessment, our management used the criteria established in Internal Control — Integrated Framework (2013) issued by the Committee of Sponsoring Organizations of the Treadway Commission (“COSO”). Based on our assessment and those criteria, management concluded that, as of December 31, 2016, our internal control over financial reporting is effective.
KPMG LLP, an independent registered public accounting firm, audited the effectiveness of the Company’s internal control over financial reporting as of December 31, 2016, as stated in their report which appears below.
111
Table of Contents
Because of its inherent limitations, internal control over financial reporting may not prevent or detect misstatements. Also, projections of any evaluation of effectiveness to future periods are subject to the risk that controls may become inadequate because of changes in conditions, or that the degree of compliance with the policies or procedures may deteriorate.
No change in our internal control over financial reporting (as defined in Rules 13a-15(f) and 15d-15(f) under the Exchange Act) occurred during the fiscal quarter ended December 31, 2016 that has materially affected, or is reasonably likely to materially affect, our internal control over financial reporting.
| Item 9B. | Other Information |
Nothing to report.
112
Table of Contents
PART III.
| Item 10. | Directors, Executive Officers and Corporate Governance |
The information contained in the 2017 Proxy Statement, including information appearing in the sections titled “Proposal 1 — Election of Directors,” “Executive Officers,” “Other Matters — Section 16(a) Beneficial Ownership Reporting Compliance” and “Corporate Governance” in the 2017 Proxy Statement, is incorporated herein by reference.
| Item 11. | Executive Compensation |
The information contained in the 2017 Proxy Statement, including information appearing in the sections titled “Executive Compensation” and “Director Compensation” in the 2017 Proxy Statement, is incorporated herein by reference.
| Item 12. | Security Ownership of Certain Beneficial Owners and Management and Related Stockholder Matters |
The information contained in the 2017 Proxy Statement, including information appearing in the sections titled “Equity Compensation Plan Information,” “Ownership of Common Stock” and “Ownership of Common Stock by Directors and Executive Officers” in the 2017 Proxy Statement, is incorporated herein by reference.
| Item 13. | Certain Relationships and Related Transactions, and Director Independence |
The information contained in the 2017 Proxy Statement, including information appearing under “Other Matters — Certain Relationships and Transactions” and “Corporate Governance” in the 2017 Proxy Statement, is incorporated herein by reference.
| Item 14. | Principal Accounting Fees and Services |
The information contained in the 2017 Proxy Statement, including information appearing under “Independent Registered Public Accounting Firm” in the 2017 Proxy Statement, is incorporated herein by reference.
113
Table of Contents
PART IV.
| Item 15. | Exhibits, Financial Statement Schedules |
(a) 1. Financial Statements
A. The following consolidated financial statements of Navient Corporation and the Report of the Independent Registered Public Accounting Firm thereon are included in Item 8 above:
2. Financial Statement Schedules
All schedules are omitted because they are not applicable or the required information is shown in the consolidated financial statements or notes thereto.
3. Exhibits
The exhibits listed in the accompanying index to exhibits are filed or incorporated by reference as part of this Annual Report on Form 10-K.
We will furnish at cost a copy of any exhibit filed with or incorporated by reference into this Annual Report on Form 10-K. Oral or written requests for copies of any exhibits should be directed to the Secretary.
| Item 16. | Form 10-K Summary |
N/A
4. Appendices
Appendix A — Federal Family Education Loan Program
(b) Exhibits
| 2.1 | The Agreement and Plan of Merger, dated as of October 16, 2014, between Navient Corporation and Navient, LLC (incorporated by reference to Exhibit 2.1 to Navient Corporation’s Current Report on Form 8-K filed on October 17, 2014). | |
| 3.1 | Amended and Restated Certificate of Incorporation of Navient Corporation (incorporated by reference to Exhibit 3.1 of Amendment No. 3 to Navient Corporation’s Registration Statement on Form 10 (File No. 001-36228) filed on March 27, 2014). | |
114
Table of Contents
| 3.2 | Amended and Restated By-Laws of Navient Corporation (incorporated by reference to Exhibit 3.2 of Amendment No. 3 to Navient Corporation’s Registration Statement on Form 10 (File No. 001-36228) filed on March 27, 2014). | |
| 4.1 | The Second Supplemental Indenture, dated as of October 16, 2014, between Navient Corporation and Deutsche Trust Company Limited, as trustee (incorporated by reference to Exhibit 4.1 to Navient Corporation’s Current Report on Form 8-K filed on October 17, 2014). | |
| 4.2 | The Eighth Supplemental Indenture, dated as of October 16, 2014, between Navient Corporation and The Bank of New York Mellon, as trustee (incorporated by reference to Exhibit 4.2 to Navient Corporation’s Current Report on Form 8-K filed on October 17, 2014). | |
| 4.3 | The Third Supplemental Indenture, dated as of July 29, 2016, between Navient Corporation and The Bank of New York Mellon as trustee (incorporated by reference to Exhibit 4.2 to Navient Corporation’s Current Report on Form 8-K filed on July 29, 2016). | |
| 4.4 | The Fourth Supplemental Indenture, dated as of September 16, 2016, between Navient Corporation and The Bank of New York Mellon as trustee (incorporated by reference to Exhibit 4.2 to Navient Corporation’s Current Report on Form 8-K filed on September 16, 2016). | |
| 10.1† | Navient Corporation Executive Severance Plan for Senior Officers (incorporated by reference to Exhibit 10.1 to Navient Corporation’s Current Report on Form 8-K filed on August 19, 2014). | |
| 10.2† | Navient Corporation Change in Control Severance Plan for Senior Officers, as Amended and Restated Effective November 1, 2015 (incorporated by reference to Exhibit 10.2 to Navient Corporation’s Annual Report on Form 10-K (File No. 161456380) filed on February 25, 2016). | |
| 10.3† | Navient Deferred Compensation Plan, as amended and restated effective January 1, 2015 (incorporated by reference to Exhibit 10.1 to Navient Corporation’s Current Report on Form 8-K filed on December 23, 2014). | |
| 10.4† | Navient Supplemental 401(k) Savings Plan (incorporated by reference to Exhibit 4.3 of the Company’s Registration Statement on Form S-8 (File No. 333-195536) filed on April 28, 2014). | |
| 10.5† | Navient Deferred Compensation Plan for Key Employees (incorporated by reference to Exhibit 4.3 of the Company’s Registration Statement on Form S-8 (File No. 333-195539) filed on April 28, 2014). | |
| 10.6† | Navient Deferred Compensation Plan for Directors, as amended and restated effective October 1, 2015 (incorporated by reference to Exhibit 10.16 of the Company’s Form 10-K (File No. 001-36228) filed on October 30, 2015). | |
| 10.7† | Navient Deferred Compensation Plan for Directors (incorporated by reference to Exhibit 4.3 of the Company’s Registration Statement on Form S-8 (File No. 333-195538) filed on April 28, 2014). | |
| 10.8† | Navient Corporation 2014 Omnibus Incentive Plan, Amended and Restated as of April 6, 2015 (incorporated by reference to the Company’s Proxy Statement on Form DEF 14A (File No. 001-36228) filed on April 10, 2015). | |
| 10.9† | Navient Employee Stock Purchase Plan (incorporated by reference to Exhibit 4.3 of the Company’s Registration Statement on Form S-8 (File No. 333-195533) filed on April 28, 2014). | |
| 10.10† | Form of Navient Corporation 2014 Omnibus Incentive Plan, Restricted Stock Unit Term Sheet — 2012 PSU Conversion (incorporated by reference to Exhibit 10.9 of the Company’s Quarterly Report on Form 10-Q filed on August 1, 2014). | |
| 10.11† | Form of Navient Corporation 2014 Omnibus Incentive Plan, Restricted Stock Unit Term Sheet — 2013 PSU Conversion (incorporated by reference to Exhibit 10.10 of the Company’s Quarterly Report on Form 10-Q filed on August 1, 2014). | |
115
Table of Contents
| 10.12† | Form of Navient Corporation 2014 Omnibus Incentive Plan, Restricted Stock Unit Term Sheet — 2014 (incorporated by reference to Exhibit 10.11 of the Company’s Quarterly Report on Form 10-Q filed on August 1, 2014). | |
| 10.13† | Form of Navient Corporation 2014 Omnibus Incentive Plan, Bonus Restricted Stock Unit Term Sheet (Two-Year Restriction) — 2014 (incorporated by reference to Exhibit 10.12 of the Company’s Quarterly Report on Form 10-Q filed on August 1, 2014). | |
| 10.14† | Form of Navient Corporation 2014 Omnibus Incentive Plan, Bonus Restricted Stock Unit Term Sheet (Three-Year Restriction) — 2014 (incorporated by reference to Exhibit 10.13 of the Company’s Quarterly Report on Form 10-Q filed on August 1, 2014). | |
| 10.15† | Form of Navient Corporation 2014 Omnibus Incentive Plan, Stock Option Agreement, Net Settled Options — 2014 (incorporated by reference to Exhibit 10.14 of the Company’s Quarterly Report on Form 10-Q filed on August 1, 2014). | |
| 10.16† | Navient Corporation 2014 Omnibus Incentive Plan, Restricted Stock Unit Term Sheet for John F. Remondi — 2013 (incorporated by reference to Exhibit 10.15 of the Company’s Quarterly Report on Form 10-Q filed on August 1, 2014). | |
| 10.17† | Form of Navient Corporation 2014 Omnibus Incentive Plan, Restricted Stock Unit Term Sheet — 2013 (incorporated by reference to Exhibit 10.16 of the Company’s Quarterly Report on Form 10-Q filed on August 1, 2014). | |
| 10.18† | Form of Navient Corporation 2014 Omnibus Incentive Plan, Stock Option Agreement, Net Settled Options — 2013 (incorporated by reference to Exhibit 10.17 of the Company’s Quarterly Report on Form 10-Q filed on August 1, 2014). | |
| 10.19† | Form of Navient Corporation 2014 Omnibus Incentive Plan, Restricted Stock Unit Term Sheet — 2012 (incorporated by reference to Exhibit 10.18 of the Company’s Quarterly Report on Form 10-Q filed on August 1, 2014). | |
| 10.20† | Form of Navient Corporation 2014 Omnibus Incentive Plan, Bonus Restricted Stock Unit Term Sheet (Two-Year Restriction) — 2012 (incorporated by reference to Exhibit 10.19 of the Company’s Quarterly Report on Form 10-Q filed on August 1, 2014). | |
| 10.21† | Form of Navient Corporation 2014 Omnibus Incentive Plan, Bonus Restricted Stock Unit Term Sheet (Three-Year Restriction) — 2012 (incorporated by reference to Exhibit 10.20 of the Company’s Quarterly Report on Form 10-Q filed on August 1, 2014). | |
| 10.22† | Form of Navient Corporation 2014 Omnibus Incentive Plan, Stock Option Agreement, Net Settled Options — 2012 (incorporated by reference to Exhibit 10.21 of the Company’s Quarterly Report on Form 10-Q filed on August 1, 2014). | |
| 10.23† | Form of Navient Corporation 2014 Omnibus Incentive Plan, Stock Option Agreement, Net Settled Options — 2011 (incorporated by reference to Exhibit 10.22 of the Company’s Quarterly Report on Form 10-Q filed on August 1, 2014). | |
| 10.24† | Form of Navient Corporation 2014 Omnibus Incentive Plan, Stock Option Agreement, Net Settled Options — 2010 (incorporated by reference to Exhibit 10.23 of the Company’s Quarterly Report on Form 10-Q filed on August 1, 2014). | |
| 10.25† | Navient Corporation 2014 Omnibus Incentive Plan, Stock Option Agreement for John M. Kane — 2008 (incorporated by reference to Exhibit 10.24 of the Company’s Quarterly Report on Form 10-Q filed on August 1, 2014). | |
| 10.26† | Navient Corporation 2014 Omnibus Incentive Plan, Stock Option Agreement for Timothy J. Hynes — 2008 (incorporated by reference to Exhibit 10.25 of the Company’s Quarterly Report on Form 10-Q filed on August 1, 2014). | |
116
Table of Contents
| 10.27† | Navient Corporation 2014 Omnibus Incentive Plan, Stock Option Notice for John F. Remondi — 2008 (incorporated by reference to Exhibit 10.26 of the Company’s Quarterly Report on Form 10-Q filed on August 1, 2014). | |
| 10.28† | Navient Corporation 2014 Omnibus Incentive Plan, Additional Stock Option Notice for John F. Remondi — 2008 (incorporated by reference to Exhibit 10.27 of the Company’s Quarterly Report on Form 10-Q filed on August 1, 2014). | |
| 10.29† | Form of Navient Corporation 2014 Omnibus Incentive Plan, Independent Director Stock Award Agreement — 2014 (incorporated by reference to Exhibit 10.28 of the Company’s Quarterly Report on Form 10-Q filed on August 1, 2014). | |
| 10.30† | Form of Navient Corporation 2014 Omnibus Incentive Plan, Independent Director Stock Option Agreement — 2013 (incorporated by reference to Exhibit 10.29 of the Company’s Quarterly Report on Form 10-Q filed on August 1, 2014). | |
| 10.31† | Form of Navient Corporation 2014 Omnibus Incentive Plan, Independent Director Stock Option Agreement — 2012 (incorporated by reference to Exhibit 10.30 of the Company’s Quarterly Report on Form 10-Q filed on August 1, 2014). | |
| 10.32† | Form of Navient Corporation 2014 Omnibus Incentive Plan, Independent Director Stock Option Agreement — 2011 (incorporated by reference to Exhibit 10.31 of the Company’s Quarterly Report on Form 10-Q filed on August 1, 2014). | |
| 10.33† | Form of Navient Corporation 2014 Omnibus Incentive Plan, Independent Director Stock Option Agreement — 2010 (incorporated by reference to Exhibit 10.32 of the Company’s Quarterly Report on Form 10-Q filed on August 1, 2014). | |
| 10.34† | Form of Navient Corporation 2014 Omnibus Incentive Plan, Independent Director Stock Option Agreement — 2009 (incorporated by reference to Exhibit 10.33 of the Company’s Quarterly Report on Form 10-Q filed on August 1, 2014). | |
| 10.35† | Form of Navient Corporation 2014 Omnibus Incentive Plan, Independent Director Stock Option Agreement — 2008 (incorporated by reference to Exhibit 10.34 of the Company’s Quarterly Report on Form 10-Q filed on August 1, 2014). | |
| 10.36† | Form of Navient Corporation 2014 Omnibus Incentive Plan, Independent Director Stock Option Agreement — 2007 (incorporated by reference to Exhibit 10.35 of the Company’s Quarterly Report on Form 10-Q filed on August 1, 2014). | |
| 10.37† | Form of Navient Corporation 2014 Omnibus Incentive Plan, Independent Director Stock Option Agreement — 2006 (incorporated by reference to Exhibit 10.36 of the Company’s Quarterly Report on Form 10-Q filed on August 1, 2014). | |
| 10.38† | Form of Navient Corporation 2014 Omnibus Incentive Plan, Independent Director Stock Option Agreement — 2005 (incorporated by reference to Exhibit 10.37 of the Company’s Quarterly Report on Form 10-Q filed on August 1, 2014). | |
| 10.39† | Form of Navient Corporation 2014 Omnibus Incentive Plan One-Year Bonus Restricted Stock Unit Agreement (incorporated by reference to Exhibit 10.1 of the Company’s Quarterly Report on Form 10-Q filed on April 30, 2015) | |
| 10.40† | Form of Navient Corporation 2014 Omnibus Incentive Plan Three-Year Bonus Restricted Stock Unit Agreement (incorporated by reference to Exhibit 10.2 of the Company’s Quarterly Report on Form 10-Q filed on April 30, 2015) | |
| 10.41† | Form of Navient Corporation 2014 Omnibus Incentive Plan Performance Stock Unit Agreement (incorporated by reference to Exhibit 10.4 of the Company’s Quarterly Report on Form 10-Q filed on April 30, 2015). | |
117
Table of Contents
| 10.42† | Form of Navient Corporation 2014 Omnibus Incentive Plan Performance Stock Unit Agreement (incorporated by reference to Exhibit 10.1 of the Company’s Quarterly Report on Form 10-Q filed on April 28, 2016). | |
| 10.43† | Form of Navient Corporation 2014 Omnibus Incentive Plan, Independent Director Restricted Stock Agreement (incorporated by reference to Exhibit 10.2 of the Company’s Quarterly Report on Form 10-Q filed on April 28, 2016). | |
| 10.44† | Form of Navient Corporation 2014 Omnibus Incentive Plan Restricted Stock Unit Agreement (incorporated by reference to Exhibit 10.3 of the Company’s Quarterly Report on Form 10-Q filed on April 28, 2016). | |
| 10.45† | Form of Navient Corporation 2014 Omnibus Incentive Plan Stock Option Agreement — Net Settled Options (incorporated by reference to Exhibit 10.4 of the Company’s Quarterly Report on Form 10-Q filed on April 28, 2016). | |
| 10.46 | Underwriting Agreement, dated July 26, 2016, among Navient Corporation and Barclays Capital Inc., J.P. Morgan Securities LLC, and Merrill Lynch, Pierce, Fenner & Smith Incorporated (incorporated by reference to Exhibit 1.1 of the Company’s Current Report on Form 8-K filed on July 29, 2016). | |
| 10.47 | Underwriting Agreement, dated September 13, 2016, among Navient Corporation and J.P. Morgan Securities LLC, Merrill Lynch, Pierce, Fenner & Smith Incorporated and RBC Capital Markets, LLC, as representatives of the Underwriters named therein (incorporated by reference to Exhibit 1.1 to Navient Corporation’s Current Report on Form 8-K filed on September 16, 2016). | |
| 12.1* | Computation of Ratio of Earnings to Fixed Charges and Preferred Stock Dividends. | |
| 21.1* | List of Subsidiaries. | |
| 23.1* | Consent of KPMG LLP | |
| 31.1* | Certification Pursuant to Section 302 of the Sarbanes-Oxley Act of 2002. | |
| 31.2* | Certification Pursuant to Section 302 of the Sarbanes-Oxley Act of 2002. | |
| 32.1** | Certification Pursuant to 18 U.S.C. Section 1350, as Adopted Pursuant to Section 906 of the Sarbanes-Oxley Act of 2002. | |
| 32.2** | Certification Pursuant to 18 U.S.C. Section 1350, as Adopted Pursuant to Section 906 of the Sarbanes-Oxley Act of 2002. | |
| 101.INS* | XBRL Instance Document. | |
| 101.SCH* | XBRL Taxonomy Extension Schema Document. | |
| 101.CAL* | XBRL Taxonomy Extension Calculation Linkbase Document. | |
| 101.DEF* | XBRL Taxonomy Extension Definition Linkbase Document. | |
| 101.LAB* | XBRL Taxonomy Extension Label Linkbase Document. | |
| 101.PRE* | XBRL Taxonomy Extension Presentation Linkbase Document. | |
| † | Management Contract or Compensatory Plan or Arrangement |
| * | Filed herewith |
| ** | Furnished herewith |
118
Table of Contents
SIGNATURES
Pursuant to the requirements of Section 13 or 15(d) of the Securities Exchange Act of 1934, as amended, the Registrant has duly caused this report to be signed on its behalf by the undersigned hereunto duly authorized.
Dated: February 24, 2017
| NAVIENT CORPORATION | ||
| By: | /S/ JOHN F. REMONDI | |
| John F. Remondi President and Chief Executive Officer | ||
Pursuant to the requirement of the Securities Exchange Act of 1934, as amended, this report has been signed below by the following persons on behalf of the Registrant and in the capacities and on the dates indicated.
| Signature |
Title |
Date | ||
| /S/ JOHN F. REMONDI John F. Remondi |
President, Chief Executive Officer and Director (Principal Executive Officer) |
February 24, 2017 | ||
| /S/ SOMSAK CHIVAVIBUL Somsak Chivavibul |
Chief Financial Officer (Principal Financial and Accounting Officer) |
February 24, 2017 | ||
| /S/ WILLIAM M. DIEFENDERFER, III William M. Diefenderfer, III |
Chairman of the Board of Directors | February 24, 2017 | ||
| /S/ JOHN K. ADAMS, JR. John K. Adams, Jr. |
Director | February 24, 2017 | ||
| /S/ ANNA ESCOBEDO CABRAL Anna Escobedo Cabral |
Director | February 24, 2017 | ||
| /S/ DIANE SUITT GILLELAND Diane Suitt Gilleland |
Director | February 24, 2017 | ||
| /S/ KATHERINE A. LEHMAN Katherine A. Lehman |
Director | February 24, 2017 | ||
| /S/ LINDA A. MILLS Linda A. Mills |
Director | February 24, 2017 | ||
| /S/ BARRY A. MUNITZ Barry A. Munitz |
Director | February 24, 2017 | ||
| /S/ JANE J. THOMPSON Jane J. Thompson |
Director | February 24, 2017 | ||
| /S/ LAURA S. UNGER Laura S. Unger |
Director | February 24, 2017 | ||
| /S/ BARRY L. WILLIAMS Barry L. Williams |
Director | February 24, 2017 | ||
119
Table of Contents
CONSOLIDATED FINANCIAL STATEMENTS
| Page | ||||
| F-2 | ||||
| F-3 | ||||
| F-4 | ||||
| F-5 | ||||
| F-6 | ||||
| F-7 | ||||
| F-10 | ||||
| F-11 | ||||
F-1
Table of Contents
REPORT OF INDEPENDENT REGISTERED PUBLIC ACCOUNTING FIRM
The Board of Directors and Stockholders
Navient Corporation:
We have audited Navient Corporation and subsidiaries’ (the Company) internal control over financial reporting as of December 31, 2016, based on criteria established in Internal Control – Integrated Framework (2013) issued by the Committee of Sponsoring Organizations of the Treadway Commission (COSO). The Company’s management is responsible for maintaining effective internal control over financial reporting and for its assessment of the effectiveness of internal control over financial reporting, included in the accompanying Management’s Report on Internal Control over Financial Reporting. Our responsibility is to express an opinion on the Company’s internal control over financial reporting based on our audit.
We conducted our audit in accordance with the standards of the Public Company Accounting Oversight Board (United States). Those standards require that we plan and perform the audit to obtain reasonable assurance about whether effective internal control over financial reporting was maintained in all material respects. Our audit included obtaining an understanding of internal control over financial reporting, assessing the risk that a material weakness exists, and testing and evaluating the design and operating effectiveness of internal control based on the assessed risk. Our audit also included performing such other procedures as we considered necessary in the circumstances. We believe that our audit provides a reasonable basis for our opinion.
A company’s internal control over financial reporting is a process designed to provide reasonable assurance regarding the reliability of financial reporting and the preparation of financial statements for external purposes in accordance with generally accepted accounting principles. A company’s internal control over financial reporting includes those policies and procedures that (1) pertain to the maintenance of records that, in reasonable detail, accurately and fairly reflect the transactions and dispositions of the assets of the company; (2) provide reasonable assurance that transactions are recorded as necessary to permit preparation of financial statements in accordance with generally accepted accounting principles, and that receipts and expenditures of the company are being made only in accordance with authorizations of management and directors of the company; and (3) provide reasonable assurance regarding prevention or timely detection of unauthorized acquisition, use, or disposition of the company’s assets that could have a material effect on the financial statements.
Because of its inherent limitations, internal control over financial reporting may not prevent or detect misstatements. Also, projections of any evaluation of effectiveness to future periods are subject to the risk that controls may become inadequate because of changes in conditions, or that the degree of compliance with the policies or procedures may deteriorate.
In our opinion, the Company maintained, in all material respects, effective internal control over financial reporting as of December 31, 2016, based on criteria established in Internal Control – Integrated Framework (2013) issued by COSO.
We also have audited, in accordance with the standards of the Public Company Accounting Oversight Board (United States), the consolidated balance sheets of the Company as of December 31, 2016 and 2015, and the related consolidated statements of income, comprehensive income, changes in stockholders’ equity, and cash flows for each of the years in the three-year period ended December 31, 2016, and our report dated February 24, 2017 expressed an unqualified opinion on those consolidated financial statements.
(signed) KPMG LLP
McLean, Virginia
February 24, 2017
F-2
Table of Contents
REPORT OF INDEPENDENT REGISTERED PUBLIC ACCOUNTING FIRM
The Board of Directors and Stockholders
Navient Corporation:
We have audited the accompanying consolidated balance sheets of Navient Corporation and subsidiaries (the Company) as of December 31, 2016 and 2015, and the related consolidated statements of income, comprehensive income, changes in stockholders’ equity, and cash flows for each of the years in the three-year period ended December 31, 2016. These consolidated financial statements are the responsibility of the Company’s management. Our responsibility is to express an opinion on these consolidated financial statements based on our audits.
We conducted our audits in accordance with the standards of the Public Company Accounting Oversight Board (United States). Those standards require that we plan and perform the audit to obtain reasonable assurance about whether the financial statements are free of material misstatement. An audit includes examining, on a test basis, evidence supporting the amounts and disclosures in the financial statements. An audit also includes assessing the accounting principles used and significant estimates made by management, as well as evaluating the overall financial statement presentation. We believe that our audits provide a reasonable basis for our opinion.
In our opinion, the consolidated financial statements referred to above present fairly, in all material respects, the financial position of the Company as of December 31, 2016 and 2015, and the results of its operations and its cash flows for each of the years in the three-year period ended December 31, 2016, in conformity with U.S. generally accepted accounting principles.
We also have audited, in accordance with the standards of the Public Company Accounting Oversight Board (United States), the Company’s internal control over financial reporting as of December 31, 2016, based on criteria established in Internal Control – Integrated Framework (2013) issued by the Committee of Sponsoring Organizations of the Treadway Commission (COSO), and our report dated February 24, 2017 expressed an unqualified opinion on the effectiveness of the Company’s internal control over financial reporting.
(signed) KPMG LLP
McLean, Virginia
February 24, 2017
F-3
Table of Contents
CONSOLIDATED BALANCE SHEETS
(In millions, except per share amounts)
| December 31, 2016 |
December 31, 2015 |
|||||||
| Assets |
||||||||
| FFELP Loans (net of allowance for losses of $67 and $78, respectively) |
$ | 87,730 | $ | 96,402 | ||||
| Private Education Loans (net of allowance for losses of $1,351 and $1,471, respectively) |
23,340 | 26,394 | ||||||
| Investments |
||||||||
| Available-for-sale |
3 | 5 | ||||||
| Other |
347 | 496 | ||||||
|
|
|
|
|
|||||
| Total investments |
350 | 501 | ||||||
| Cash and cash equivalents |
1,253 | 1,594 | ||||||
| Restricted cash and investments |
3,600 | 3,738 | ||||||
| Goodwill and acquired intangible assets, net |
670 | 705 | ||||||
| Other assets |
4,193 | 4,712 | ||||||
|
|
|
|
|
|||||
| Total assets |
$ | 121,136 | $ | 134,046 | ||||
|
|
|
|
|
|||||
| Liabilities |
||||||||
| Short-term borrowings |
$ | 2,334 | $ | 2,570 | ||||
| Long-term borrowings |
112,368 | 124,833 | ||||||
| Other liabilities |
2,711 | 2,710 | ||||||
|
|
|
|
|
|||||
| Total liabilities |
117,413 | 130,113 | ||||||
|
|
|
|
|
|||||
| Commitments and contingencies |
||||||||
| Equity |
||||||||
| Common stock, par value $0.01 per share; 1.125 billion shares authorized: 436 million and 431 million shares issued, respectively |
4 | 4 | ||||||
| Additional paid-in capital |
3,022 | 2,967 | ||||||
| Accumulated other comprehensive (loss) income (net of tax (expense) benefit of $(3) and $30, respectively) |
6 | (51 | ) | |||||
| Retained earnings |
2,890 | 2,414 | ||||||
|
|
|
|
|
|||||
| Total Navient Corporation stockholders’ equity before treasury stock |
5,922 | 5,334 | ||||||
| Less: Common stock held in treasury at cost: 145 million and 82 million shares, respectively |
(2,223 | ) | (1,425 | ) | ||||
|
|
|
|
|
|||||
| Total Navient Corporation stockholders’ equity |
3,699 | 3,909 | ||||||
| Noncontrolling interest |
24 | 24 | ||||||
|
|
|
|
|
|||||
| Total equity |
3,723 | 3,933 | ||||||
|
|
|
|
|
|||||
| Total liabilities and equity |
$ | 121,136 | $ | 134,046 | ||||
|
|
|
|
|
|||||
Supplemental information — assets and liabilities of consolidated variable interest entities:
| December 31, 2016 |
December 31, 2015 |
|||||||
| FFELP Loans |
$ | 83,429 | $ | 91,516 | ||||
| Private Education Loans |
20,500 | 23,124 | ||||||
| Other loans |
79 | — | ||||||
| Restricted cash |
3,434 | 3,553 | ||||||
| Other assets, net |
(11 | ) | 293 | |||||
| Short-term borrowings |
1,078 | 710 | ||||||
| Long-term borrowings |
95,492 | 106,510 | ||||||
|
|
|
|
|
|||||
| Net assets of consolidated variable interest entities |
$ | 10,861 | $ | 11,266 | ||||
|
|
|
|
|
|||||
See accompanying notes to consolidated financial statements.
F-4
Table of Contents
CONSOLIDATED STATEMENTS OF INCOME
(In millions, except per share amounts)
| Years Ended December 31, | ||||||||||||
| 2016 | 2015 | 2014 | ||||||||||
| Interest income: |
||||||||||||
| FFELP Loans |
$ | 2,528 | $ | 2,524 | $ | 2,556 | ||||||
| Private Education Loans |
1,587 | 1,756 | 2,156 | |||||||||
| Other loans |
9 | 7 | 9 | |||||||||
| Cash and investments |
22 | 8 | 9 | |||||||||
|
|
|
|
|
|
|
|||||||
| Total interest income |
4,146 | 4,295 | 4,730 | |||||||||
| Total interest expense |
2,441 | 2,074 | 2,063 | |||||||||
|
|
|
|
|
|
|
|||||||
| Net interest income |
1,705 | 2,221 | 2,667 | |||||||||
| Less: provisions for loan losses |
429 | 581 | 647 | |||||||||
|
|
|
|
|
|
|
|||||||
| Net interest income after provisions for loan losses |
1,276 | 1,640 | 2,020 | |||||||||
|
|
|
|
|
|
|
|||||||
| Other income (loss): |
||||||||||||
| Servicing revenue |
304 | 340 | 298 | |||||||||
| Asset recovery and business processing revenue |
390 | 367 | 388 | |||||||||
| Other income |
7 | 17 | 82 | |||||||||
| Losses on sales of loans and investments |
— | (9 | ) | — | ||||||||
| Gains on debt repurchases |
1 | 21 | — | |||||||||
| Gains (losses) on derivative and hedging activities, net |
117 | 166 | 139 | |||||||||
|
|
|
|
|
|
|
|||||||
| Total other income |
819 | 902 | 907 | |||||||||
|
|
|
|
|
|
|
|||||||
| Expenses: |
||||||||||||
| Salaries and benefits |
500 | 467 | 479 | |||||||||
| Other operating expenses |
451 | 451 | 508 | |||||||||
|
|
|
|
|
|
|
|||||||
| Total operating expenses |
951 | 918 | 987 | |||||||||
| Goodwill and acquired intangible asset impairment and amortization expense |
36 | 12 | 9 | |||||||||
| Restructuring and other reorganization expenses |
— | 32 | 113 | |||||||||
|
|
|
|
|
|
|
|||||||
| Total expenses |
987 | 962 | 1,109 | |||||||||
|
|
|
|
|
|
|
|||||||
| Income from continuing operations, before income tax expense |
1,108 | 1,580 | 1,818 | |||||||||
| Income tax expense |
427 | 597 | 681 | |||||||||
|
|
|
|
|
|
|
|||||||
| Net income from continuing operations |
681 | 983 | 1,137 | |||||||||
| Income from discontinued operations, net of tax expense |
— | 1 | — | |||||||||
|
|
|
|
|
|
|
|||||||
| Net income |
681 | 984 | 1,137 | |||||||||
| Less: net income (loss) attributable to noncontrolling interest |
— | — | — | |||||||||
|
|
|
|
|
|
|
|||||||
| Net income attributable to Navient Corporation |
681 | 984 | 1,137 | |||||||||
| Preferred stock dividends |
— | — | 6 | |||||||||
|
|
|
|
|
|
|
|||||||
| Net income attributable to Navient Corporation common stock |
$ | 681 | $ | 984 | $ | 1,131 | ||||||
|
|
|
|
|
|
|
|||||||
| Basic earnings per common share attributable to Navient Corporation |
$ | 2.15 | $ | 2.62 | $ | 2.71 | ||||||
|
|
|
|
|
|
|
|||||||
| Average common shares outstanding |
316 | 376 | 417 | |||||||||
|
|
|
|
|
|
|
|||||||
| Diluted earnings per common share attributable to Navient Corporation |
$ | 2.12 | $ | 2.58 | $ | 2.66 | ||||||
|
|
|
|
|
|
|
|||||||
| Average common and common equivalent shares outstanding |
322 | 382 | 425 | |||||||||
|
|
|
|
|
|
|
|||||||
| Dividends per common share attributable to Navient Corporation |
$ | .64 | $ | .64 | $ | .60 | ||||||
|
|
|
|
|
|
|
|||||||
See accompanying notes to consolidated financial statements.
F-5
Table of Contents
CONSOLIDATED STATEMENTS OF COMPREHENSIVE INCOME
(In millions)
| Years Ended December 31, | ||||||||||||
| 2016 | 2015 | 2014 | ||||||||||
| Net income |
$ | 681 | $ | 984 | $ | 1,137 | ||||||
| Other comprehensive income (loss): |
||||||||||||
| Unrealized gains (losses) on derivatives: |
||||||||||||
| Unrealized hedging gains (losses) on derivatives |
91 | (93 | ) | (11 | ) | |||||||
| Reclassification adjustments for derivative (gains) losses included in net income (interest expense) |
(1 | ) | (1 | ) | 3 | |||||||
|
|
|
|
|
|
|
|||||||
| Total unrealized gains (losses) on derivatives |
90 | (94 | ) | (8 | ) | |||||||
| Unrealized gains (losses) on investments |
— | — | 2 | |||||||||
| Income tax (expense) benefit |
(33 | ) | 34 | 2 | ||||||||
|
|
|
|
|
|
|
|||||||
| Other comprehensive income (loss), net of tax expense (benefit) |
57 | (60 | ) | (4 | ) | |||||||
|
|
|
|
|
|
|
|||||||
| Total comprehensive income attributable to Navient Corporation |
$ | 738 | $ | 924 | $ | 1,133 | ||||||
|
|
|
|
|
|
|
|||||||
See accompanying notes to consolidated financial statements.
F-6
Table of Contents
CONSOLIDATED STATEMENTS OF CHANGES IN STOCKHOLDERS’ EQUITY
(In millions, except share and per share amounts)
| Preferred Stock Shares |
Common Stock Shares | Preferred Stock |
Common Stock |
Additional Paid-In Capital |
Accumulated Other Comprehensive Income (Loss) |
Retained Earnings |
Treasury Stock |
Total Stockholders’ Equity |
Noncontrolling Interest |
Total Equity |
||||||||||||||||||||||||||||||||||||||||||
| Issued | Treasury | Outstanding | ||||||||||||||||||||||||||||||||||||||||||||||||||
| Balance at December 31, 2013 |
7,300,000 | 545,210,941 | (116,262,066 | ) | 428,948,875 | $ | 565 | $ | 109 | $ | 4,399 | $ | 13 | $ | 2,542 | $ | (2,033 | ) | $ | 5,595 | $ | 5 | $ | 5,600 | ||||||||||||||||||||||||||||
| Comprehensive income: |
||||||||||||||||||||||||||||||||||||||||||||||||||||
| Net income |
— | — | — | — | — | — | — | — | 1,137 | — | 1,137 | — | 1,137 | |||||||||||||||||||||||||||||||||||||||
| Other comprehensive loss, net of tax |
— | — | — | — | — | — | — | (4 | ) | — | — | (4 | ) | — | (4 | ) | ||||||||||||||||||||||||||||||||||||
|
|
|
|
|
|
|
|||||||||||||||||||||||||||||||||||||||||||||||
| Total comprehensive income |
— | — | — | — | — | — | — | — | — | — | 1,133 | — | 1,133 | |||||||||||||||||||||||||||||||||||||||
| Cash dividends: |
||||||||||||||||||||||||||||||||||||||||||||||||||||
| Common stock ($.60 per share) |
— | — | — | — | — | — | — | — | (249 | ) | — | (249 | ) | — | (249 | ) | ||||||||||||||||||||||||||||||||||||
| Preferred stock, series A ($1.74 per share) |
— | — | — | — | — | — | — | — | (4 | ) | — | (4 | ) | — | (4 | ) | ||||||||||||||||||||||||||||||||||||
| Preferred stock, series B ($.98 per share) |
— | — | — | — | — | — | — | — | (2 | ) | — | (2 | ) | — | (2 | ) | ||||||||||||||||||||||||||||||||||||
| Dividend equivalent units related to employee stock-based compensation plans |
— | — | — | — | — | — | — | — | (3 | ) | — | (3 | ) | — | (3 | ) | ||||||||||||||||||||||||||||||||||||
| Issuance of common shares |
— | 7,389,962 | — | 7,389,962 | — | (80 | ) | 138 | — | — | — | 58 | — | 58 | ||||||||||||||||||||||||||||||||||||||
| Retirement of common stock in treasury |
— | (126,963,268 | ) | 126,963,268 | — | — | (25 | ) | (2,263 | ) | — | — | 2,288 | — | — | — | ||||||||||||||||||||||||||||||||||||
| Tax impact of employee stock-based compensation plans |
— | — | — | — | — | — | 15 | — | — | — | 15 | — | 15 | |||||||||||||||||||||||||||||||||||||||
| Stock-based compensation expense |
— | — | — | — | — | — | 39 | — | — | — | 39 | — | 39 | |||||||||||||||||||||||||||||||||||||||
| Common stock repurchased |
— | — | (30,432,689 | ) | (30,432,689 | ) | — | — | — | — | — | (600 | ) | (600 | ) | — | (600 | ) | ||||||||||||||||||||||||||||||||||
| Shares repurchased related to employee stock-based compensation plans |
— | — | (4,171,342 | ) | (4,171,342 | ) | — | — | — | — | — | (87 | ) | (87 | ) | — | (87 | ) | ||||||||||||||||||||||||||||||||||
| Deconsolidation of subsidiary |
— | — | — | — | — | — | — | — | — | — | — | (5 | ) | (5 | ) | |||||||||||||||||||||||||||||||||||||
| Distribution of consumer banking business |
(7,300,000 | ) | — | — | — | (565 | ) | — | 565 | — | (1,751 | ) | — | (1,751 | ) | — | (1,751 | ) | ||||||||||||||||||||||||||||||||||
|
|
|
|
|
|
|
|
|
|
|
|
|
|
|
|
|
|
|
|
|
|
|
|
|
|
|
|||||||||||||||||||||||||||
| Balance at December 31, 2014 |
— | 425,637,635 | (23,902,829 | ) | 401,734,806 | $ | — | $ | 4 | $ | 2,893 | $ | 9 | $ | 1,670 | $ | (432 | ) | $ | 4,144 | $ | — | $ | 4,144 | ||||||||||||||||||||||||||||
|
|
|
|
|
|
|
|
|
|
|
|
|
|
|
|
|
|
|
|
|
|
|
|
|
|
|
|||||||||||||||||||||||||||
See accompanying notes to consolidated financial statements.
F-7
Table of Contents
NAVIENT CORPORATION
CONSOLIDATED STATEMENTS OF CHANGES IN STOCKHOLDERS’ EQUITY
(In millions, except share and per share amounts)
| Common Stock Shares | Common Stock |
Additional Paid-In Capital |
Accumulated Other Comprehensive Income (Loss) |
Retained Earnings |
Treasury Stock |
Total Stockholders’ Equity |
Noncontrolling Interest |
Total Equity |
||||||||||||||||||||||||||||||||||||
| Issued | Treasury | Outstanding | ||||||||||||||||||||||||||||||||||||||||||
| Balance at December 31, 2014 |
425,637,635 | (23,902,829 | ) | 401,734,806 | $ | 4 | $ | 2,893 | $ | 9 | $ | 1,670 | $ | (432 | ) | $ | 4,144 | $ | — | $ | 4,144 | |||||||||||||||||||||||
| Comprehensive income: |
||||||||||||||||||||||||||||||||||||||||||||
| Net income |
— | — | — | — | — | — | 984 | — | 984 | — | 984 | |||||||||||||||||||||||||||||||||
| Other comprehensive loss, net of tax |
— | — | — | — | — | (60 | ) | — | — | (60 | ) | — | (60 | ) | ||||||||||||||||||||||||||||||
|
|
|
|
|
|
|
|||||||||||||||||||||||||||||||||||||||
| Total comprehensive income |
— | — | — | — | — | — | — | — | 924 | — | 924 | |||||||||||||||||||||||||||||||||
| Cash dividends: |
||||||||||||||||||||||||||||||||||||||||||||
| Common stock ($.64 per share) |
— | — | — | — | — | — | (240 | ) | — | (240 | ) | — | (240 | ) | ||||||||||||||||||||||||||||||
| Dividend equivalent units related to employee stock-based compensation plans |
— | — | — | — | — | — | — | — | — | — | — | |||||||||||||||||||||||||||||||||
| Issuance of common shares |
4,924,021 | — | 4,924,021 | — | 34 | — | — | — | 34 | — | 34 | |||||||||||||||||||||||||||||||||
| Tax impact of employee stock-based compensation plans |
— | — | — | — | 11 | — | — | — | 11 | — | 11 | |||||||||||||||||||||||||||||||||
| Stock-based compensation expense |
— | — | — | — | 29 | — | — | — | 29 | — | 29 | |||||||||||||||||||||||||||||||||
| Common stock repurchased |
— | (56,043,711 | ) | (56,043,711 | ) | — | — | — | — | (945 | ) | (945 | ) | — | (945 | ) | ||||||||||||||||||||||||||||
| Shares repurchased related to employee stock-based compensation plans |
— | (2,404,328 | ) | (2,404,328 | ) | — | — | — | — | (48 | ) | (48 | ) | — | (48 | ) | ||||||||||||||||||||||||||||
| Noncontrolling interests in businesses |
— | — | — | — | — | — | — | — | — | 24 | 24 | |||||||||||||||||||||||||||||||||
|
|
|
|
|
|
|
|
|
|
|
|
|
|
|
|
|
|
|
|
|
|
|
|||||||||||||||||||||||
| Balance at December 31, 2015 |
430,561,656 | (82,350,868 | ) | 348,210,788 | $ | 4 | $ | 2,967 | $ | (51 | ) | $ | 2,414 | $ | (1,425 | ) | $ | 3,909 | $ | 24 | $ | 3,933 | ||||||||||||||||||||||
|
|
|
|
|
|
|
|
|
|
|
|
|
|
|
|
|
|
|
|
|
|
|
|||||||||||||||||||||||
See accompanying notes to consolidated financial statements.
F-8
Table of Contents
NAVIENT CORPORATION
CONSOLIDATED STATEMENTS OF CHANGES IN STOCKHOLDERS’ EQUITY
(In millions, except share and per share amounts)
| Common Stock Shares | Common Stock |
Additional Paid-In Capital |
Accumulated Other Comprehensive Income (Loss) |
Retained Earnings |
Treasury Stock |
Total Stockholders’ Equity |
Noncontrolling Interest |
Total Equity |
||||||||||||||||||||||||||||||||||||
| Issued | Treasury | Outstanding | ||||||||||||||||||||||||||||||||||||||||||
| Balance at December 31, 2015 |
430,561,656 | (82,350,868 | ) | 348,210,788 | $ | 4 | $ | 2,967 | $ | (51 | ) | $ | 2,414 | $ | (1,425 | ) | $ | 3,909 | $ | 24 | $ | 3,933 | ||||||||||||||||||||||
| Comprehensive income: |
||||||||||||||||||||||||||||||||||||||||||||
| Net income |
— | — | — | — | — | — | 681 | — | 681 | — | 681 | |||||||||||||||||||||||||||||||||
| Other comprehensive income, net of tax |
— | — | — | — | — | 57 | — | — | 57 | — | 57 | |||||||||||||||||||||||||||||||||
|
|
|
|
|
|
|
|||||||||||||||||||||||||||||||||||||||
| Total comprehensive income |
— | — | — | — | — | — | — | — | 738 | — | 738 | |||||||||||||||||||||||||||||||||
| Cash dividends: |
||||||||||||||||||||||||||||||||||||||||||||
| Common stock ($.64 per share) |
— | — | — | — | — | — | (201 | ) | — | (201 | ) | — | (201 | ) | ||||||||||||||||||||||||||||||
| Dividend equivalent units related to employee stock-based compensation plans |
— | — | — | — | — | — | (4 | ) | — | (4 | ) | — | (4 | ) | ||||||||||||||||||||||||||||||
| Issuance of common shares |
5,476,010 | — | 5,476,010 | — | 35 | — | — | — | 35 | — | 35 | |||||||||||||||||||||||||||||||||
| Tax impact of employee stock-based compensation plans |
— | — | — | — | (6 | ) | — | — | — | (6 | ) | — | (6 | ) | ||||||||||||||||||||||||||||||
| Stock-based compensation expense |
— | — | — | — | 26 | — | — | — | 26 | — | 26 | |||||||||||||||||||||||||||||||||
| Common stock repurchased |
— | (59,625,325 | ) | (59,625,325 | ) | — | — | — | — | (755 | ) | (755 | ) | — | (755 | ) | ||||||||||||||||||||||||||||
| Shares repurchased related to employee stock-based compensation plans |
— | (3,197,355 | ) | (3,197,355 | ) | — | — | — | — | (43 | ) | (43 | ) | — | (43 | ) | ||||||||||||||||||||||||||||
|
|
|
|
|
|
|
|
|
|
|
|
|
|
|
|
|
|
|
|
|
|
|
|||||||||||||||||||||||
| Balance at December 31, 2016 | 436,037,666 | (145,173,548 | ) | 290,864,118 | $ | 4 | $ | 3,022 | $ | 6 | $ | 2,890 | $ | (2,223 | ) | $ | 3,699 | $ | 24 | $ | 3,723 | |||||||||||||||||||||||
|
|
|
|
|
|
|
|
|
|
|
|
|
|
|
|
|
|
|
|
|
|
|
|||||||||||||||||||||||
See accompanying notes to consolidated financial statements.
F-9
Table of Contents
CONSOLIDATED STATEMENTS OF CASH FLOWS
(In millions)
| Years Ended December 31, | ||||||||||||
| 2016 | 2015 | 2014 | ||||||||||
| Operating activities |
||||||||||||
| Net income |
$ | 681 | $ | 984 | $ | 1,137 | ||||||
| Adjustments to reconcile net income to net cash provided by operating activities: |
||||||||||||
| Income from discontinued operations, net of tax |
— | (1 | ) | — | ||||||||
| Losses on sales of loans and investments |
— | 9 | — | |||||||||
| Gains on debt repurchases, net |
(1 | ) | (21 | ) | — | |||||||
| Goodwill and acquired intangible asset impairment and amortization expense |
36 | 12 | 9 | |||||||||
| Stock-based compensation expense |
26 | 29 | 39 | |||||||||
| Unrealized gains on derivative and hedging activities |
(328 | ) | (781 | ) | (797 | ) | ||||||
| Provisions for loan losses |
429 | 581 | 647 | |||||||||
| Decrease (increase) in restricted cash — other |
10 | 66 | (64 | ) | ||||||||
| (Increase) decrease in accrued interest receivable |
(26 | ) | 175 | (75 | ) | |||||||
| Decrease in accrued interest payable |
(92 | ) | (42 | ) | (27 | ) | ||||||
| Decrease in other assets |
628 | 1,038 | 846 | |||||||||
| Decrease in other liabilities |
(6 | ) | (139 | ) | (51 | ) | ||||||
|
|
|
|
|
|
|
|||||||
| Total net cash provided by operating activities |
1,357 | 1,910 | 1,664 | |||||||||
|
|
|
|
|
|
|
|||||||
| Investing activities |
||||||||||||
| Education loans acquired |
(3,683 | ) | (3,736 | ) | (13,803 | ) | ||||||
| Reduction of education loans: |
||||||||||||
| Installment payments, claims and other |
14,923 | 13,933 | 12,321 | |||||||||
| Proceeds from sales of education loans |
— | 569 | — | |||||||||
| Other investing activities, net |
35 | 131 | 123 | |||||||||
| Purchases of available-for-sale securities |
— | — | (28 | ) | ||||||||
| Proceeds from maturities of available-for-sale securities |
2 | 1 | 4 | |||||||||
| Purchases of other securities |
(44 | ) | (187 | ) | (785 | ) | ||||||
| Proceeds from sales and maturities of other securities |
49 | 97 | 800 | |||||||||
| Decrease (increase) in restricted cash — variable interest entities |
129 | 220 | (285 | ) | ||||||||
| Purchase of subsidiaries, net of cash acquired |
— | (342 | ) | — | ||||||||
|
|
|
|
|
|
|
|||||||
| Total net cash provided by (used in) investing activities |
11,411 | 10,686 | (1,653 | ) | ||||||||
|
|
|
|
|
|
|
|||||||
| Financing activities |
||||||||||||
| Distribution of consumer banking business |
— | — | (2,217 | ) | ||||||||
| Borrowings collateralized by loans in trust — issued |
6,691 | 5,011 | 6,776 | |||||||||
| Borrowings collateralized by loans in trust — repaid |
(13,226 | ) | (14,706 | ) | (12,534 | ) | ||||||
| Asset-backed commercial paper conduits, net |
(4,002 | ) | 974 | 5,440 | ||||||||
| Other long-term borrowings issued |
1,231 | 493 | 1,817 | |||||||||
| Other long-term borrowings repaid |
(2,603 | ) | (2,787 | ) | (3,162 | ) | ||||||
| Other financing activities, net |
(244 | ) | (245 | ) | 251 | |||||||
| Retail and other deposits, net |
— | — | 726 | |||||||||
| Common stock repurchased |
(755 | ) | (945 | ) | (600 | ) | ||||||
| Common stock dividends paid |
(201 | ) | (240 | ) | (249 | ) | ||||||
| Preferred stock dividends paid |
— | — | (6 | ) | ||||||||
|
|
|
|
|
|
|
|||||||
| Net cash used in financing activities |
(13,109 | ) | (12,445 | ) | (3,758 | ) | ||||||
|
|
|
|
|
|
|
|||||||
| Net (decrease) increase in cash and cash equivalents |
(341 | ) | 151 | (3,747 | ) | |||||||
| Cash and cash equivalents at beginning of year |
1,594 | 1,443 | 5,190 | |||||||||
|
|
|
|
|
|
|
|||||||
| Cash and cash equivalents at end of year |
$ | 1,253 | $ | 1,594 | $ | 1,443 | ||||||
|
|
|
|
|
|
|
|||||||
| Cash disbursements made (refunds received) for: |
||||||||||||
| Interest |
$ | 2,301 | $ | 1,981 | $ | 1,983 | ||||||
|
|
|
|
|
|
|
|||||||
| Income taxes paid |
$ | 249 | $ | 88 | $ | 484 | ||||||
|
|
|
|
|
|
|
|||||||
| Income taxes received |
$ | (4 | ) | $ | (14 | ) | $ | (108 | ) | |||
|
|
|
|
|
|
|
|||||||
See accompanying notes to consolidated financial statements.
F-10
Table of Contents
NOTES TO CONSOLIDATED FINANCIAL STATEMENTS
| 1. | Organization and Business |
Navient’s Business
Navient is a Fortune 500 company that provides asset management and business processing services to education, health care and government clients at the federal, state and local levels. We help our clients and millions of Americans achieve financial success through our services and support. Headquartered in Wilmington, Delaware, Navient employs team members in Western New York, Northeastern Pennsylvania, Indiana, Tennessee, Texas, Virginia and other locations.
Navient holds the largest portfolio of education loans insured or federally guaranteed under the Federal Family Education Loan Program (“FFELP”). We also hold the largest portfolio of Private Education Loans. Navient services its own portfolio of education loans, as well as education loans owned by the United States Department of Education (“ED”), financial institutions and nonprofit education lenders. Navient is one of the largest servicers to ED under its Direct Student Loan Program (“DSLP”). Our data-driven insight, service and innovation support customers on the path to successful education loan repayment.
Navient also provides business processing services to education-related clients, such as guaranty agencies and colleges and universities.
Finally, the company leverages its scale and expertise to provide additional business processing services to a variety of other clients, including federal agencies, state and local governments, regional authorities, courts, hospitals, health care systems and other health care providers, financial service providers, and municipalities.
For all our clients, we aim to improve their financial performance, optimize their operations, and maintain compassionate, compliant service for their customers and constituents.
Spin-Off of Navient
On April 30, 2014, the spin-off of Navient from SLM Corporation (the “Spin-Off”) was completed and Navient became an independent, publicly traded company focused on asset management and business processing services. The separation was completed through the distribution of 100 percent of the outstanding shares of Navient common stock, on the basis of one share of Navient common stock for each share of SLM Corporation common stock. SLM Corporation continues operation as a separate publicly traded company and includes Sallie Mae Bank.
Due to the relative significance of Navient to SLM Corporation prior to the Spin-Off, for financial reporting purposes, Navient is treated as the “accounting spinnor” and therefore is the “accounting successor” to SLM Corporation as constituted prior to the Spin-Off, notwithstanding the legal form of the Spin-Off. Since Navient is the accounting successor, the historical financial statements of SLM Corporation prior to the Spin-Off are the historical financial statements of Navient. As a result, the GAAP financial results reported in this Annual Report on Form 10-K include the historical financial results of SLM Corporation prior to the Spin-Off on April 30, 2014 (i.e., such consolidated results include our asset management and business processing services business and the consumer banking business associated with Sallie Mae Bank (“SLM BankCo”)) and reflect the deemed distribution of SLM BankCo to SLM Corporation’s stockholders on April 30, 2014.
F-11
Table of Contents
NAVIENT CORPORATION
NOTES TO CONSOLIDATED FINANCIAL STATEMENTS (Continued)
| 1. | Organization and Business (Continued) |
The following table shows the condensed balance sheet of SLM BankCo that the financial statements of Navient reflect as a shareholder distribution on April 30, 2014:
| (Dollars in millions) |
April 30, 2014 | |||
| Assets |
||||
| FFELP Loans, net |
$ | 1,380 | ||
| Private Education Loans, net |
7,204 | |||
| Investments |
139 | |||
| Cash and cash equivalents |
2,170 | |||
| Other assets |
883 | |||
|
|
|
|||
| Total assets |
$ | 11,776 | ||
|
|
|
|||
| Liabilities |
||||
| Short-term borrowings |
$ | 6,491 | ||
| Long-term borrowings |
2,750 | |||
| Other liabilities(1) |
825 | |||
|
|
|
|||
| Total liabilities |
10,066 | |||
|
|
|
|||
| Equity |
||||
| Preferred stock |
||||
| Series A |
165 | |||
| Series B |
400 | |||
| Common equity |
1,145 | |||
|
|
|
|||
| Total equity(2) |
1,710 | |||
|
|
|
|||
| Total liabilities and equity |
$ | 11,776 | ||
|
|
|
|||
| (1) | “Other liabilities” include net income tax liabilities of $383 million, which were presented as net income tax assets within “Other assets” on the consolidated financial statements of Navient. |
| (2) | In addition to the $1,710 million of consumer banking business net assets distributed, we also removed $41 million of goodwill from our balance sheet as required under Accounting Standards Codification (“ASC”) 350, “Intangibles — Goodwill and Other,” in connection with the distribution. This goodwill was allocated to the consumer banking business based on relative fair value. This total of $1,751 million is the amount that appears on our consolidated statement of changes in stockholders’ equity in connection with the deemed distribution of the consumer banking business. |
| 2. | Significant Accounting Policies |
Use of Estimates
Our financial reporting and accounting policies conform to generally accepted accounting principles in the United States of America (“GAAP”). The preparation of financial statements in conformity with GAAP requires management to make estimates and assumptions that affect the reported amounts of assets and liabilities and disclosure of contingent assets and liabilities at the date of the financial statements and the reported amounts of revenues and expenses during the reporting period. Current market conditions increase the risk and complexity of the judgments in these estimates and actual results could differ from estimates. Key accounting policies that include the most significant judgments, estimates and assumptions include the allowance for loan losses, the effective interest rate method (amortization of education loan and debt premiums and discounts), fair value measurement, the consolidation of variable interest entities, and derivative accounting.
F-12
Table of Contents
NAVIENT CORPORATION
NOTES TO CONSOLIDATED FINANCIAL STATEMENTS (Continued)
| 2. | Significant Accounting Policies (Continued) |
Consolidation
The consolidated financial statements include the accounts of Navient Corporation and its majority-owned and controlled subsidiaries and those Variable Interest Entities (“VIEs”) for which we are the primary beneficiary, after eliminating the effects of intercompany accounts and transactions.
We consolidate any VIEs where we have determined we are the primary beneficiary. The primary beneficiary is the entity which has both: (1) the power to direct the activities of the VIE that most significantly impact the VIE’s economic performance and (2) the obligation to absorb losses or receive benefits of the entity that could potentially be significant to the VIE. As it relates to our securitizations and other secured borrowing facilities that are VIEs as of December 31, 2016, we are the servicer of the related education loan assets and own the Residual Interest of the securitization trusts and secured borrowing facilities. As a result, we are the primary beneficiary and consolidate those VIEs.
Fair Value Measurement
We use estimates of fair value in applying various accounting standards for our financial statements. Fair value measurements are used in one of four ways:
| • | In the consolidated balance sheet with changes in fair value recorded in the consolidated statement of income; |
| • | In the consolidated balance sheet with changes in fair value recorded in the accumulated other comprehensive income section of the consolidated statement of changes in stockholders’ equity; |
| • | In the consolidated balance sheet for instruments carried at lower of cost or fair value with impairment charges recorded in the consolidated statement of income; and |
| • | In the notes to the financial statements. |
Fair value is defined as the price to sell an asset or transfer a liability in an orderly transaction between willing and able market participants. In general, our policy in estimating fair value is to first look at observable market prices for identical assets and liabilities in active markets, where available. When these are not available, other inputs are used to model fair value such as prices of similar instruments, yield curves, volatilities, prepayment speeds, default rates and credit spreads, relying first on observable data from active markets. Depending on current market conditions, additional adjustments to fair value may be based on factors such as liquidity, credit, and bid/offer spreads. Transaction costs are not included in the determination of fair value. When possible, we seek to validate the model’s output to market transactions. Depending on the availability of observable inputs and prices, different valuation models could produce materially different fair value estimates. The values presented may not represent future fair values and may not be realizable.
We categorize our fair value estimates based on a hierarchical framework associated with three levels of price transparency utilized in measuring financial instruments at fair value. Classification is based on the lowest level of input that is significant to the fair value of the instrument. The three levels are as follows:
| • | Level 1 — Quoted prices (unadjusted) in active markets for identical assets or liabilities that we have the ability to access at the measurement date. The types of financial instruments included in level 1 are highly liquid instruments with quoted prices. |
| • | Level 2 — Inputs from active markets, other than quoted prices for identical instruments, are used to determine fair value. Significant inputs are directly observable from active markets for substantially the full term of the asset or liability being valued. |
F-13
Table of Contents
NAVIENT CORPORATION
NOTES TO CONSOLIDATED FINANCIAL STATEMENTS (Continued)
| 2. | Significant Accounting Policies (Continued) |
| • | Level 3 — Pricing inputs significant to the valuation are unobservable. Inputs are developed based on the best information available. However, significant judgment is required by us in developing the inputs. |
Loans
Loans, consisting primarily of federally insured education loans and Private Education Loans, that we have the ability and intent to hold for the foreseeable future are classified as held-for-investment and are carried at amortized cost. Amortized cost includes the unamortized premiums, discounts, and capitalized origination costs and fees, all of which are amortized to interest income as further discussed below. Loans which are held-for-investment also have an allowance for loan loss as needed. Any loans we have not classified as held-for-investment are classified as held-for-sale, and carried at the lower of cost or fair value. Loans are classified as held-for-sale when we have the intent and ability to sell such loans. Loans which are held-for-sale do not have the associated premium, discount, and capitalized origination costs and fees amortized into interest income. In addition, once a loan is classified as held-for-sale, there is no further adjustment to the loan’s allowance for loan losses that existed immediately prior to the reclassification to held-for-sale.
Allowance for Loan Losses
We consider a loan to be impaired when, based on current information, a loss has been incurred and it is probable that we will not receive all contractual amounts due. When making our assessment as to whether a loan is impaired, we also take into account more than insignificant delays in payment. We generally evaluate impaired loans on an aggregate basis by grouping similar loans. Impaired loans also include those loans which are individually assessed for impairment at a loan level, such as in a troubled debt restructuring (“TDR”). We maintain an allowance for loan losses at an amount sufficient to absorb losses incurred in our portfolios at the reporting date based on a projection of estimated probable credit losses incurred in the portfolio.
Our Private Education Loan portfolio contains TDR and non-TDR loans. For customers experiencing financial difficulty, certain Private Education Loans for which we have granted either a forbearance of greater than three months, an interest rate reduction or an extended repayment plan are classified as TDRs. The allowance requirements are different based on these designations. In determining the allowance for loan losses on our non-TDR portfolio, we estimate the principal amount of loans that will default over the next two years (two years being the expected period between a loss event and default) and how much we expect to recover over time related to the defaulted amount. Expected defaults less our expected recoveries equal the allowance related to this portfolio. Our historical experience indicates that, on average, the time between the date that a customer experiences a default causing event (i.e., the loss trigger event) and the date that we charge off the unrecoverable portion of that loan is two years. Separately, for our TDR portfolio, we estimate an allowance amount sufficient to cover life-of-loan expected losses through an impairment calculation based on the difference between the loan’s basis and the present value of expected future cash flows (which would include life-of-loan default and recovery assumptions) discounted at the loan’s original effective interest rate. The separate allowance estimates for our TDR and non-TDR portfolios are combined into our total Allowance for Private Education Loan losses.
In estimating both the non-TDR and TDR allowance amounts, we start with historical experience of customer default behavior. We make judgments about which historical period to start with and then make further judgments about whether that historical experience is representative of future expectations and whether additional adjustments may be needed to those historical default rates. We also take the economic environment into consideration when calculating the allowance for loan losses. We analyze key economic statistics and the effect we expect it to have on future defaults. Key economic statistics analyzed as part of the allowance for loan
F-14
Table of Contents
NAVIENT CORPORATION
NOTES TO CONSOLIDATED FINANCIAL STATEMENTS (Continued)
| 2. | Significant Accounting Policies (Continued) |
losses are primarily unemployment rates. Our allowance for loan losses is estimated using an analysis of delinquent and current accounts. Our model is used to estimate the likelihood that a loan may progress through the various delinquency stages and ultimately charge off. The evaluation of the allowance for loan losses is inherently subjective, as it requires material estimates that may be susceptible to significant changes. The estimate for the allowance for loan losses is subject to a number of assumptions. If actual future performance in delinquency, charge-offs and recoveries are significantly different than estimated, this could materially affect our estimate of the allowance for loan losses and the related provision for loan losses on our income statement.
Below we describe in further detail our policies and procedures for the allowance for loan losses as they relate to our Private Education Loan and FFELP Loan portfolios.
Allowance for Private Education Loan Losses
We determine the collectability of our Private Education Loan portfolio by evaluating certain risk characteristics. We consider school type, credit score (FICO), existence of a cosigner, loan status and loan seasoning as the key credit quality indicators because they have the most significant effect on our determination of the adequacy of our allowance for loan losses. The type of school customers attend can have an impact on their graduation rate and job prospects after graduation and therefore affects their ability to make payments. Credit scores are an indicator of the creditworthiness of a customer and generally the higher the credit score the more likely it is the customer will be able to make all of their contractual payments. Loan status affects the credit risk because generally a past due loan is more likely to result in a credit loss than an up-to-date loan. Additionally, loans in a deferred payment status have different credit risk profiles compared with those in current payment status. Loan seasoning affects credit risk because a loan with a history of making payments generally has a lower incidence of default than a loan with a history of making infrequent or no payments. The existence of a cosigner lowers the likelihood of default. We monitor and update these credit quality indicators in the analysis of the adequacy of our allowance for loan losses on a quarterly basis.
To estimate the probable credit losses incurred in the loan portfolio at the reporting date, we use historical experience of customer payment behavior in connection with the key credit quality indicators and incorporate management expectations regarding macroeconomic and collection performance factors. Our model is based upon the most recent twelve months of actual collection experience as the starting point for the non-TDR portfolio and the most recent approximate 10 years for the TDR portfolio and applies expected macroeconomic changes and collection procedure changes to estimate expected losses caused by loss events incurred as of the balance sheet date. Our model for the non-TDR portfolio places a greater emphasis on the more recent default experience rather than the default experience for older historical periods, as we believe the recent default experience is more indicative of the probable losses incurred in the loan portfolio today that will default over the next two years. The TDR portfolio uses a longer historical default experience since we are projecting life of loan remaining losses. Similar to estimating defaults, we use historical customer payment behavior to estimate the timing and amount of future recoveries on charged-off loans. We use judgment in determining whether historical performance is representative of what we expect to collect in the future. We then apply the default and collection rate projections to each category of loans. Once the quantitative calculation is performed, we review the adequacy of the allowance for loan losses and determine if qualitative adjustments need to be considered. Additionally, we consider changes in laws and regulations that could potentially impact the allowance for loan losses. More judgment has been required over the last several years, compared with years prior, in light of the U.S. economy and its effect on our customers’ ability to pay their obligations. We believe that our model reflects recent customer behavior, loan performance and collection performance, as well as expectations about economic factors.
Our collection policies allow for periods of nonpayment for customers requesting additional payment grace periods upon leaving school or experiencing temporary difficulty meeting payment obligations. This is referred
F-15
Table of Contents
NAVIENT CORPORATION
NOTES TO CONSOLIDATED FINANCIAL STATEMENTS (Continued)
| 2. | Significant Accounting Policies (Continued) |
to as forbearance status and is considered in our allowance for loan losses. The loss confirmation period is in alignment with our typical collection cycle and takes into account these periods of nonpayment.
Certain Private Education Loans do not require customers to begin repayment until six months after they have graduated or otherwise left school. Consequently, our loss estimates for these programs are generally low while the customer is in school. At December 31, 2016, 6 percent of the principal balance in the higher education Private Education Loan portfolio was related to customers who are in an in-school/grace/deferment status and not required to make payments. As this population of customers leaves school, they will be required to begin payments on their loans, and the allowance for loan losses may change accordingly.
As part of determining the adequacy of the allowance for loan losses, we review key allowance and loan metrics. The most significant of these metrics considered are the charge-off rate and delinquency and forbearance percentages and the resulting allowance coverage of charge-offs ratio, and the allowance as a percentage of total loans and of loans in repayment.
Our allowance for Private Education Loan losses also provides for possible additional future charge-offs related to the receivable for partially charged-off Private Education Loans. At the end of each month, for loans that are 212 or more days past due, we charge off the estimated loss of a defaulted loan balance. Actual recoveries are applied against the remaining loan balance that was not charged off. We refer to this remaining loan balance as the “receivable for partially charged-off loans.” If actual periodic recoveries are less than expected, the difference is immediately charged off through the allowance for Private Education Loan losses with an offsetting reduction in the receivable for partially charged-off Private Education Loans. If actual periodic recoveries are greater than expected, they will be reflected as a recovery through the allowance for Private Education Loan losses once the cumulative recovery amount exceeds the cumulative amount originally expected to be recovered. The financial crisis, which began in 2007, impacted our collections on defaulted loans and as a result, Private Education Loans which defaulted from 2007 through March 31, 2015, experienced collection performance below our pre-financial crisis experience. For that reason, until we gained enough data and experience to determine the long-term, post-default recovery rate of 21 percent in second-quarter 2015, we established a reserve for potential shortfalls in recoveries. In the second quarter of 2015, the portion of the loan amount charged off at default increased from 73 percent to 79 percent. This did not impact the provision for loan losses as previously this had been reserved through the allowance for loan losses. This change resulted in a $330 million reduction to the balance of the receivable for partially charged-off loans.
Allowance for FFELP Loan Losses
FFELP Loans are insured as to their principal and accrued interest in the event of default subject to a Risk Sharing level based on the date of loan disbursement. These insurance obligations are supported by contractual rights against the United States. For loans disbursed after October 1, 1993, and before July 1, 2006, we receive 98 percent reimbursement on all qualifying default claims. For loans disbursed on or after July 1, 2006, we receive 97 percent reimbursement. For loans disbursed prior to October 1, 1993, we receive 100 percent reimbursement.
Similar to the allowance for Private Education Loan losses, the allowance for FFELP Loan losses uses historical experience of customer default behavior and a two-year loss confirmation period to estimate the credit losses incurred in the loan portfolio at the reporting date. We apply the default rate projections, net of applicable Risk Sharing, to each category for the current period to perform our quantitative calculation. Once the quantitative calculation is performed, we review the adequacy of the allowance for loan losses and determine if qualitative adjustments need to be considered. For FFELP Loans that have lost their government insurance and have been charged off, any subsequent cash recoveries benefit the allowance for loan losses when received.
F-16
Table of Contents
NAVIENT CORPORATION
NOTES TO CONSOLIDATED FINANCIAL STATEMENTS (Continued)
| 2. | Significant Accounting Policies (Continued) |
Correction of an Immaterial Error in Prior Periods Related to FFELP Provision for Loan Losses
Under the FFELP, in the event of a borrower default, the principal balance and all unpaid accrued interest on FFELP Loans is insured for 97 percent to 100 percent of the defaulted amount. Under certain circumstances, FFELP Loans can lose their government insurance. In these cases, within our servicing systems these loans are assigned a “Permanently Uninsured” status code. When FFELP Loans become permanently uninsured, they no longer have the protection of government insurance and the owner of such loans is exposed to 100 percent of losses upon default. In the fourth quarter of 2016, the Company identified a portfolio of Permanently Uninsured FFELP Loans ($105 million as of December 31, 2015) that were correctly charged off in prior periods. Subsequent to the charge off, these loans were incorrectly accounted for as a recovery of previously defaulted loans as a result of the incorrect application of a system data field. This error understated the previously reported net charge-offs and provision for loan losses in 2015 and earlier years. The impact of this error to all prior periods was not material. The Company has revised the prior periods contained in this Form 10-K to correct this error. The table below shows the impact of this error to the years ended December 31, 2015 and 2014.
| Year Ended December 31, | ||||||||
| (Dollars in millions) |
2015 | 2014 | ||||||
| Increase to FFELP Loan charge-offs and provision for loan losses(1) |
$ | 20 | $ | 19 | ||||
| After-tax reduction to net income from increase in FFELP Loan provision for loan losses |
$ | (13 | ) | $ | (12 | ) | ||
| Reduction to diluted earnings per share from increase in FFELP Loan provision for loan losses |
$ | (.03 | ) | $ | (.03 | ) | ||
| GAAP net income — previously reported |
$ | 997 | $ | 1,149 | ||||
| GAAP net income — revised |
$ | 984 | $ | 1,137 | ||||
| (1) | In 2015 and 2014, $20 million and $19 million of FFELP Permanently Uninsured Loans, respectively, were incorrectly classified as a recovery of previously defaulted loans, which understated the net charge-offs and provision for loan losses reported for FFELP Loans. The revised results correct for this error and result in $20 million and $19 million of additional FFELP Loan charge-offs and provision for loan losses being recorded in 2015 and 2014, respectively. There were $66 million of FFELP Permanently Uninsured Loans in years prior to 2014 that were incorrectly classified as a recovery of previously defaulted loans. The impact to each of the periods prior to 2014 was not material. Retained earnings were reduced by $42 million (after tax) as of December 31, 2013, to correct for this error. |
Investments
Our available-for-sale investment portfolio consists of investments that are carried at fair value, with the temporary changes in fair value carried as a separate component of stockholders’ equity, net of taxes. The amortized cost of debt securities in this category is adjusted for premiums and accretion of discounts, which are amortized using the effective interest rate method. Other-than-temporary impairment is evaluated by considering several factors, including the length of time and extent to which the fair value has been less than the amortized cost basis, the financial condition and near-term prospects of the security (considering factors such as adverse conditions specific to the security and ratings agency actions), and the intent and ability to retain the investment to allow for an anticipated recovery in fair value. The entire fair value loss on a security that is other-than-temporary impairment is recorded in earnings if we intend to sell the security or if it is more likely than not that we will be required to sell the security before the expected recovery of the loss. However, if the impairment is other-than-temporary, and those two conditions do not exist, the portion of the impairment related to credit losses is recorded in earnings and the impairment related to other factors is recorded in other comprehensive income. Securities classified as trading are accounted for at fair value with unrealized gains and losses included in investment income. Securities that we have the intent and ability to hold to maturity are classified as held-to-maturity and are accounted for at amortized cost unless the security is determined to have an other-than-temporary impairment. In this case it is accounted for in the same manner described above.
F-17
Table of Contents
NAVIENT CORPORATION
NOTES TO CONSOLIDATED FINANCIAL STATEMENTS (Continued)
| 2. | Significant Accounting Policies (Continued) |
We also have other investments, including a receivable for cash collateral posted to derivative counterparties. These investments are accounted for at amortized cost in other investments.
Cash and Cash Equivalents
Cash and cash equivalents can include term federal funds, Eurodollar deposits, commercial paper, asset-backed commercial paper, treasuries and money market funds with original terms to maturity of less than three months.
Restricted Cash and Investments
Restricted cash primarily includes amounts held in education loan securitization trusts and other secured borrowings. This cash must be used to make payments related to trust obligations. Amounts on deposit in these accounts are primarily the result of timing differences between when principal and interest is collected on the trust assets and when principal and interest is paid on trust liabilities. As such, changes in this balance are reflected in investing activities in the statement of cash flows.
Securities pledged as collateral related to our derivative portfolio, where the counterparty has rights to replace the securities, are classified as restricted. When the counterparty does not have these rights, the security is recorded in investments and disclosed as pledged collateral in the notes. Additionally, certain counterparties require cash collateral pledged to us to be segregated and held in restricted cash accounts.
Goodwill and Acquired Intangible Assets
Goodwill is not amortized but is tested periodically for impairment. We test goodwill for impairment annually as of October 1 at the reporting unit level, which is the same as or one level below a business segment. Goodwill is also tested at interim periods if an event occurs or circumstances change that would indicate the carrying amount may be impaired.
We assess qualitative factors to determine whether it is “more-likely-than-not” that the fair value of a reporting unit is less than its carrying amount as a basis for determining whether it is necessary to perform the two-step goodwill impairment test. The “more-likely-than-not” threshold is defined as having a likelihood of more than 50 percent. If, after assessing relevant qualitative factors, we conclude that it is “more-likely-than-not” that the fair value of a reporting unit as of October 1 is less than its carrying amount, we will complete Step 1 of the goodwill impairment analysis. Step 1 consists of a comparison of the fair value of the reporting unit to the reporting unit’s carrying value, including goodwill. If the carrying value of the reporting unit exceeds the fair value, Step 2 in the goodwill impairment analysis is performed to measure the amount of impairment loss, if any. Step 2 of the goodwill impairment analysis compares the implied fair value of the reporting unit’s goodwill to the carrying value of the reporting unit’s goodwill. The implied fair value of goodwill is determined in a manner consistent with determining goodwill in a business combination. If the carrying amount of the reporting unit’s goodwill exceeds the implied fair value of the goodwill, an impairment loss is recognized in an amount equal to that excess.
Acquired intangible assets include, but are not limited to, trade names, customer and other relationships, and non-compete agreements. Acquired intangible assets with finite lives are amortized over their estimated useful lives in proportion to their estimated economic benefit. Finite-lived acquired intangible assets are reviewed for impairment using an undiscounted cash flow analysis when an event occurs or circumstances change indicating the carrying amount of a finite-lived asset or asset group may not be recoverable. If the carrying amount of the
F-18
Table of Contents
NAVIENT CORPORATION
NOTES TO CONSOLIDATED FINANCIAL STATEMENTS (Continued)
| 2. | Significant Accounting Policies (Continued) |
asset or asset groups exceeds the undiscounted cash flows, the fair value of the asset or asset group is determined using an acceptable valuation technique. An impairment loss would be recognized if the carrying amount of the asset (or asset group) exceeds the fair value of the asset or asset group. The impairment loss recognized would be the difference between the carrying amount and fair value. Indefinite-life acquired intangible assets are not amortized. We test these indefinite-life acquired intangible assets for impairment annually as of October 1 or at interim periods if an event occurs or circumstances change that would indicate the carrying value of these assets may be impaired. The annual or interim impairment test of indefinite-life acquired intangible assets is based primarily on a discounted cash flow analysis.
Securitization Accounting
Our securitizations use a two-step structure with a special purpose entity that legally isolates the transferred assets from us, even in the event of bankruptcy. Transactions receiving sale treatment are also structured to ensure that the holders of the beneficial interests issued are not constrained from pledging or exchanging their interests, and that we do not maintain effective control over the transferred assets. If these criteria are not met, then the transaction is accounted for as an on-balance sheet secured borrowing. In all cases, irrespective of whether they qualify as accounting sales our securitizations are legally structured to be sales of assets that isolate the transferred assets from us. If a securitization qualifies as a sale, we then assess whether we are the primary beneficiary of the securitization trust and are required to consolidate such trust. If we are the primary beneficiary, then no gain or loss is recognized. See “Consolidation” of this Note 2 for additional information regarding the accounting rules for consolidation when we are the primary beneficiary of these trusts.
Irrespective of whether a securitization receives sale or on-balance sheet treatment, our continuing involvement with our securitization trusts is generally limited to:
| • | Owning the equity certificates of certain trusts. |
| • | The servicing of the education loan assets within the securitization trusts, on both a pre- and post-default basis. |
| • | Our acting as administrator for the securitization transactions we sponsored, which includes remarketing certain bonds at future dates. |
| • | Our responsibilities relative to representation and warranty violations. |
| • | Temporarily advancing to the trust certain borrower benefits afforded the borrowers of education loans that have been securitized. These advances subsequently are returned to us in the next quarter. |
| • | Certain back-to-back derivatives entered into by us contemporaneously with the execution of derivatives by certain Private Education Loan securitization trusts. |
| • | The option held by us to buy certain delinquent loans from certain Private Education Loan securitization trusts. |
| • | The option to exercise the clean-up call and purchase the education loans from the trust when the asset balance is 10 percent or less of the original loan balance. |
| • | The option, on some trusts, to purchase education loans aggregating up to 10 percent of the trust’s initial pool balance. |
| • | The option (in certain trusts) to call rate reset notes in instances where the remarketing process has failed. |
F-19
Table of Contents
NAVIENT CORPORATION
NOTES TO CONSOLIDATED FINANCIAL STATEMENTS (Continued)
| 2. | Significant Accounting Policies (Continued) |
The investors of the securitization trusts have no recourse to our other assets should there be a failure of the trusts to pay when due. Generally, the only arrangements under which we have to provide financial support to the trusts are representation and warranty violations requiring the buyback of loans.
Under the terms of the transaction documents of certain trusts, we have, from time to time, exercised our options to purchase delinquent loans from Private Education Loan trusts, to purchase the remaining loans from trusts once the loan balance falls below 10 percent of the original amount, to purchase education loans up to 10 percent of the trust’s initial balance, or to call rate reset notes. Certain trusts maintain financial arrangements with third parties also typical of securitization transactions, such as derivative contracts (swaps) and bond insurance policies that, in the case of a counterparty failure, could adversely impact the value of any Residual Interest.
We do not record servicing assets or servicing liabilities when our securitization trusts are accounted for as on-balance sheet secured financings. As of December 31, 2016 and 2015, all of our securitization trusts are on-balance sheet, except as discussed in the next paragraph, and as a result we do not have servicing assets or liabilities recorded on the consolidated balance sheet related to these securitization trusts.
As of December 31, 2016, we have $11 million of servicing assets on our balance sheet related to Residual Interests in FFELP Loan securitization trusts we sold in 2013. See “Note 3 — Education Loans” for further details.
Education Loan Interest Income
The Company has a net unamortized premium balance of $422 million in connection with its $112 billion education loan portfolio as of December 31, 2016. In 2016, the Company corrected its policy for applying the interest method used to amortize premium and discounts on the education loan portfolio. Previously, the Company amortized premium and discounts by including in its prepayment assumption forecasted payments in excess of contractually required payments as well as forecasted defaults and term extensions (deferment and forbearance or other payment modification programs). We determined that accounting rules allow only payments in excess of contractually required payments to be included in the prepayment assumption. Including defaults in estimated future prepayments has the effect of accelerating the amortization of the net premium balance related to our education loan portfolio. Including term extensions in estimated future prepayments has the effect of slowing down the amortization of the net premium balance related to our education loan portfolio.
The net impact of this error was a $2 million reduction to pre-tax net income for the year ended December 31, 2016. The Constant Prepayment Rates (“CPR”) as of December 31, 2016 under our revised policy are 5 percent, 3 percent and 5 percent for FFELP Stafford Loans, FFELP Consolidation Loans and Private Education Loans, respectively. Our prior policy’s CPRs as of December 31, 2016 would have been 5 percent, 3 percent and 6 percent for FFELP Stafford Loans, FFELP Consolidation Loans and Private Education Loans, respectively. We have concluded this error had an immaterial impact to 2016 results as well as results for prior years.
For loans classified as held-for-investment, we recognize education loan interest income as earned, adjusted for the amortization of premiums (which includes capitalized direct origination costs), discounts and Repayment Borrower Benefits. These adjustments result in income being recognized based upon the expected yield of the loan over its life after giving effect to expected prepayments and to estimates related to Repayment Borrower Benefits. We amortize premium and discount on education loans using a CPR which measures the rate at which loans in the portfolio pay down principal compared to their stated terms. In determining the CPR, we only
F-20
Table of Contents
NAVIENT CORPORATION
NOTES TO CONSOLIDATED FINANCIAL STATEMENTS (Continued)
| 2. | Significant Accounting Policies (Continued) |
consider payments made in excess of contractually required payments. This would include loan consolidation and other early payoff activity. For Repayment Borrower Benefits, the estimates of their effect on education loan yield are based on analyses of historical payment behavior of customers who are eligible for the incentives and its effect on the ultimate qualification rate for these incentives. We regularly evaluate the assumptions used to estimate the prepayment speeds and the qualification rates used for Repayment Borrower Benefits. In instances where there are changes to the assumptions, amortization is adjusted on a cumulative basis to reflect the change since the acquisition of the loan. Additionally, interest earned on education loans reflects potential non-payment adjustments in accordance with our uncollectible interest recognition policy as discussed further in “Allowance for Loan Losses” of this Note 2. We do not amortize any premiums, discounts or other adjustments to the basis of education loans when they are classified as held-for-sale.
Interest Expense
Interest expense is based upon contractual interest rates adjusted for the amortization of debt issuance costs, premiums and discounts. Our interest expense may also be adjusted for net payments/receipts related to interest rate and foreign currency swap agreements that qualify and are designated as hedges. Interest expense also includes the amortization of deferred gains and losses on closed hedge transactions that qualified as hedges. Amortization of debt issuance costs, premiums, discounts and terminated hedge-basis adjustments are recognized using the effective interest rate method.
Servicing Revenue
We perform loan servicing functions for third-parties in return for a servicing fee. Our compensation is typically based on a per-unit fee arrangement or a percentage of the loans outstanding. We recognize servicing revenues associated with these activities based upon the contractual arrangements as the services are rendered. We recognize late fees on third-party serviced loans as well as on loans in our portfolio according to the contractual provisions of the promissory notes, as well as our expectation of collectability.
Asset Recovery and Business Processing Revenue
Asset recovery fees are received for collections or rehabilitation of delinquent or defaulted debt on behalf of clients performed on a contingency basis. Revenue is earned and recognized upon the completion of rehabilitation activities or upon receipt of the delinquent customer funds.
We also receive fees from Guarantor agencies for performing default aversion services on delinquent loans prior to default. The fee is received when the loan is initially placed with us and we are obligated to provide such services for the remaining life of the loan for no additional fee. In the event that the loan defaults, in accordance with certain contracts, we are obligated to rebate a portion of the fee to the Guarantor agency in proportion to the principal and interest outstanding when the loan defaults. We recognize fees received, net of an estimate of future rebates owed due to subsequent defaults, over the service period which is estimated to be the life of the loan. As of December 31, 2016, our balance sheet includes $105 million of liabilities attributed to deferred revenue and rebate reserves related to these default aversion services.
Business processing fees are received generally based on processing transactions. Revenue is earned and recognized upon the completion of processing the transaction and in some cases also upon the processing of a payment.
F-21
Table of Contents
NAVIENT CORPORATION
NOTES TO CONSOLIDATED FINANCIAL STATEMENTS (Continued)
| 2. | Significant Accounting Policies (Continued) |
Transfer of Financial Assets and Extinguishments of Liabilities
We account for loan sales and debt repurchases in accordance with the applicable accounting guidance. Our securitizations and other secured borrowings are accounted for as on-balance sheet secured borrowings. See “Securitization Accounting” of this Note 2 for further discussion on the criteria assessed to determine whether a transfer of financial assets is a sale or a secured borrowing. If a transfer of loans qualifies as a sale, we derecognize the loan and recognize a gain or loss as the difference between the carrying basis of the loan sold and liabilities retained and the compensation received.
We periodically repurchase our outstanding debt in the open market or through public tender offers. We record a gain or loss on the early extinguishment of debt based upon the difference between the carrying cost of the debt and the amount paid to the third party and is net of hedging gains and losses when the debt is in a qualifying hedge relationship.
We recognize the results of a transfer of loans and the extinguishment of debt based upon the settlement date of the transaction.
Derivative Accounting
The accounting guidance for our derivative instruments, which primarily includes interest rate swaps, cross-currency interest rate swaps and Floor Income Contracts, requires that every derivative instrument, including certain derivative instruments embedded in other contracts, be recorded at fair value on the balance sheet as either an asset or liability. Derivative positions are recorded as net positions by counterparty based on master netting arrangements exclusive of accrued interest and cash collateral held or pledged.
Many of our derivatives, mainly fixed to variable or variable to fixed interest rate swaps and cross-currency interest rate swaps, qualify as effective hedges. For these derivatives, the relationship between the hedging instrument and the hedged items (including the hedged risk and method for assessing effectiveness), as well as the risk management objective and strategy for undertaking various hedge transactions at the inception of the hedging relationship, is documented. Each derivative is designated to either a specific (or pool of) asset(s) or liability(ies) on the balance sheet or expected future cash flows, and designated as either a “fair value” or a “cash flow” hedge. Fair value hedges are designed to hedge our exposure to changes in fair value of a fixed rate or foreign denominated asset or liability, while cash flow hedges are designed to hedge our exposure to variability of either a floating rate asset’s or liability’s cash flows or an expected fixed rate debt issuance. For effective fair value hedges, both the derivative and the hedged item (for the risk being hedged) are marked-to-market with any difference reflecting ineffectiveness and recorded immediately in the statement of income. For effective cash flow hedges, the change in the fair value of the derivative is recorded in other comprehensive income, net of tax, and recognized in earnings in the same period as the earnings effects of the hedged item. The ineffective portion of a cash flow hedge is recorded immediately through earnings. The assessment of the hedge’s effectiveness is performed at inception and on an ongoing basis, generally using regression testing. For hedges of a pool of assets or liabilities, tests are performed to demonstrate the similarity of individual instruments of the pool. When it is determined that a derivative is not currently an effective hedge, ineffectiveness is recognized for the full change in value of the derivative with no offsetting mark-to-market of the hedged item for the current period. If it is also determined the hedge will not be effective in the future, we discontinue the hedge accounting prospectively, cease recording changes in the fair value of the hedged item, and begin amortization of any basis adjustments that exist related to the hedged item.
We also have derivatives, primarily Floor Income Contracts and certain basis swaps, that we believe are effective economic hedges but do not qualify for hedge accounting treatment. These derivatives are classified as “trading” and as a result they are marked-to-market through earnings with no consideration for the fair value fluctuation of the economically hedged item.
F-22
Table of Contents
NAVIENT CORPORATION
NOTES TO CONSOLIDATED FINANCIAL STATEMENTS (Continued)
| 2. | Significant Accounting Policies (Continued) |
The “gains (losses) on derivative and hedging activities, net” line item in the consolidated statements of income includes the unrealized changes in the fair value of our derivatives (except effective cash flow hedges which are recorded in other comprehensive income), the unrealized changes in fair value of hedged items in qualifying fair value hedges, as well as the realized changes in fair value related to derivative net settlements and dispositions that do not qualify for hedge accounting. Net settlement income/expense on derivatives that qualify as hedges are included with the income or expense of the hedged item (mainly interest expense).
Accounting for Stock-Based Compensation
We recognize stock-based compensation cost in our consolidated statements of income using the fair value based method. Under this method we determine the fair value of the stock-based compensation at the time of the grant and recognize the resulting compensation expense over the grant’s vesting period. We record stock-based compensation expense net of estimated forfeitures and as such, only those stock-based awards that we expect to vest are recorded. We estimate the forfeiture rate based on historical forfeitures of equity awards and adjust the rate to reflect changes in facts and circumstances, if any. Ultimately, the total expense recognized over the vesting period will equal the fair value of awards that actually vest.
Restructuring and Other Reorganization Expenses
From time to time we implement plans to restructure our business. In conjunction with these restructuring plans, involuntary benefit arrangements, disposal costs (including contract termination costs and other exit costs), as well as certain other costs that are incremental and incurred as a direct result of our restructuring plans, are classified as restructuring expenses in the consolidated statements of income.
The Company administers the Navient Corporation Employee Severance Plan and the Navient Corporation Executive Severance Plan for Senior Officers (collectively, “the Severance Plan”). The Severance Plan provides severance benefits in the event of termination of the Company’s full-time employees and part-time employees who work at least 24 hours per week. The Severance Plan establishes specified benefits based on base salary, job level immediately preceding termination and years of service upon involuntary termination of employment. The benefits payable under the Severance Plan relate to past service, and they accumulate and vest. Accordingly, we recognize severance expenses to be paid pursuant to the Severance Plan when payment of such benefits is probable and can be reasonably estimated in accordance with ASC 712, “Compensation — Nonretirement Postemployment Benefits.” Such benefits, including severance pay calculated based on the Severance Plan, medical and dental benefits, and outplacement services expenses are classified as restructuring and other reorganization expenses in the consolidated statements of income.
Contract termination costs are expensed at the earlier of (1) the contract termination date or (2) the cease use date under the contract. Other exit costs are expensed as incurred and classified as restructuring expenses if (1) the cost is incremental to and incurred as a direct result of planned restructuring activities and (2) the cost is not associated with or incurred to generate revenues subsequent to our consummation of the related restructuring activities.
Other reorganization expenses include internal costs and third-party costs incurred in connection with our April 30, 2014 Spin-Off transaction.
During the second quarter of 2015, the Company launched an initiative to simplify and streamline its management structure following the Spin-Off of SLM BankCo to improve the operating efficiency and effectiveness of the organization. As part of the Company’s streamlining efforts, restructuring and other reorganization expenses of $29 million were recognized in 2015, primarily related to severance and other related costs.
F-23
Table of Contents
NAVIENT CORPORATION
NOTES TO CONSOLIDATED FINANCIAL STATEMENTS (Continued)
| 2. | Significant Accounting Policies (Continued) |
Income Taxes
We account for income taxes under the asset and liability approach which requires the recognition of deferred tax liabilities and assets for the expected future tax consequences of temporary differences between the carrying amounts and tax basis of our assets and liabilities. To the extent tax laws change, deferred tax assets and liabilities are adjusted in the period that the tax change is enacted.
“Income tax expense/(benefit)” includes (i) deferred tax expense/(benefit), which represents the net change in the deferred tax asset or liability balance during the year plus any change in a valuation allowance and (ii) current tax expense/(benefit), which represents the amount of tax currently payable to or receivable from a tax authority plus amounts accrued for unrecognized tax benefits. Income tax expense/(benefit) excludes the tax effects related to adjustments recorded in equity.
If we have an uncertain tax position, then that tax position is recognized only if it is more likely than not to be sustained upon examination based on the technical merits of the position. The amount of tax benefit recognized in the financial statements is the largest amount of benefit that is more than 50 percent likely of being sustained upon ultimate settlement of the uncertain tax position. We recognize interest related to unrecognized tax benefits in income tax expense/(benefit) and penalties, if any, in operating expenses.
Discontinued Operations
A disposal of a “Component” or group of components of a business resulting in a strategic shift that has or will have a major impact on the company’s operations and financial results is presented as discontinued operations. This may include strategic shifts such as a disposal of a major geographic area, a major line of business or a major equity method investment. When we determine that a Component of our business has been disposed of or has met the criteria to be classified as held-for-sale such Component is presented separately as discontinued operations. If a Component is classified as held-for-sale, then it is carried at the lower of its cost basis or fair value.
Earnings (Loss) per Common Share
We compute earnings (loss) per common share (“EPS”) by dividing net income allocated to common shareholders by the weighted average common shares outstanding. Net income allocated to common shareholders represents net income applicable to common shareholders (net income adjusted for preferred stock dividends). Diluted earnings per common share is computed by dividing income allocated to common shareholders by the weighted average common shares outstanding plus amounts representing the dilutive effect of stock options outstanding, restricted stock, restricted stock units, and the outstanding commitment to issue shares under the Employee Stock Purchase Plan. See “Note 10 — Earnings (Loss) per Common Share” for further discussion.
Reclassifications
Certain reclassifications have been made to the balances as of and for the years ended December 31, 2015 and 2014, to be consistent with classifications adopted for 2016, which had no effect on net income, total assets or total liabilities.
F-24
Table of Contents
NAVIENT CORPORATION
NOTES TO CONSOLIDATED FINANCIAL STATEMENTS (Continued)
| 2. | Significant Accounting Policies (Continued) |
Recently Issued Accounting Pronouncements
Revenue Recognition
On May 28, 2014, the Financial Accounting Standards Board (the “FASB”) issued Accounting Standards Update (“ASU”) No 2014-09, “Revenue from Contracts with Customers,” which requires an entity to recognize the amount of revenue to which it expects to be entitled for the transfer of promised goods or services to customers. The new guidance supersedes current U.S. GAAP guidance on revenue recognition and requires the use of more estimates and judgements than the current revenue standards. The new guidance does not apply to revenue associated with financial instruments, including loans, that are accounted for under other U.S. GAAP. Accordingly, we do not expect the new revenue recognition guidance to have a material impact on our consolidated results of operations associated with our loan portfolios including net interest income.
We plan to adopt the new standard as of January 1, 2018, the effective date. The new standard permits the use of either the retrospective or cumulative effect transition method. Our implementation efforts to date include the identification of revenue and review of related contracts within the scope of the new standard. We have not yet identified nor do we anticipate material changes in the timing of revenue recognition. However, our review is ongoing as we continue to evaluate both contract revenue and certain contract costs.
Classification and Measurement
On January 5, 2016, the FASB issued ASU No. 2016-01, “Recognition and Measurement of Financial Assets and Financial Liabilities,” which reconsiders the classification and measurement of financial instruments. The new standard requires certain equity instruments be measured at fair value, with fair value changes recognized in earnings. In addition, the standard requires a cumulative-effect adjustment to retained earnings as of the beginning of the reporting period of adoption. It will be effective for the Company as of January 1, 2018. We are currently assessing the impact that adopting this new accounting standard will have on our consolidated financial statements and footnote disclosures, but expect it to be immaterial.
Leases
On February 25, 2016, the FASB issued ASU No. 2016-02, “Leases,” which requires the identification of arrangements that should be accounted for as leases by lessees. In general, for lease arrangements exceeding a twelve-month term, these arrangements must be recognized as assets and liabilities on the balance sheet of the lessee. A right-of-use asset and lease obligation will be recorded for all leases, whether operating or financing, while the income statement will reflect lease expense for operating leases and amortization/interest expense for financing leases. The balance sheet amount recorded for existing leases at the date of adoption must be calculated using the applicable incremental borrowing rate at the date of adoption. The standard requires the use of the modified retrospective transition method, which will require adjustment to all comparative periods presented. It will be effective for the Company as of January 1, 2019. Early adoption is permitted. We are currently assessing the impact that adopting this new accounting standard will have on our consolidated financial statements and footnote disclosures, but expect it to be immaterial.
Stock Compensation
On March 30, 2016, the FASB issued ASU No. 2016-09, “Compensation — Stock Compensation,” which identifies areas for simplification involving several aspects of accounting for share-based payment transactions, including the income tax consequences, classification of awards as either equity or liabilities, an option to recognize gross stock compensation expense with actual forfeitures recognized as they occur, as well as certain
F-25
Table of Contents
NAVIENT CORPORATION
NOTES TO CONSOLIDATED FINANCIAL STATEMENTS (Continued)
| 2. | Significant Accounting Policies (Continued) |
classifications on the statement of cash flows. The new standard also requires that all excess tax benefits and tax deficiencies that pertain to employee stock-based incentive payments be recognized within income tax expense in the consolidated statements of income, rather than as previously reported within additional paid-in capital. The new standard was adopted on January 1, 2017 and is expected to have an immaterial impact on our consolidated financial statements and footnote disclosures.
Allowance for Loan Losses
On June 16, 2016, the FASB issued ASU No. 2016-13, “Financial Instruments — Credit Losses,” which requires measurement and recognition of an allowance for loan loss that estimates remaining expected credit losses for financial assets held at the reporting date. Our current allowance for loan loss is an incurred loss model. As a result, we expect the new guidance will result in an increase to our allowance for loan losses. The standard is to be applied through a cumulative-effect adjustment to retained earnings as of the beginning of the first reporting period in which the guidance is effective. The standard is effective for the Company as of January 1, 2020, and will primarily impact the allowance for loan losses related to our Private Education Loans and FFELP Loans. Early adoption is permitted on January 1, 2019. This standard represents a significant departure from existing GAAP, and may result in material changes to the Company’s accounting for the allowance for loan losses. We are currently evaluating the impact of adopting this accounting standard on our consolidated financial statements and footnote disclosures.
Intra-Entity Transfer of Assets
On October 24, 2016, the FASB issued ASU No. 2016-16, “Income Taxes — Intra-Entity Transfer of Assets Other and Inventory,” which requires recognition of the income tax consequences of an intra-entity transfer of non-inventory assets when the transfer occurs. The new standard is effective for the Company as of January 1, 2018. We are currently assessing the impact that adopting this new accounting standard will have on our consolidated financial statements and footnote disclosures, but expect it to be immaterial.
| 3. | Education Loans |
Education loans consist of FFELP and Private Education Loans.
There are three principal categories of FFELP Loans: Stafford, PLUS, and FFELP Consolidation Loans. Generally, Stafford and PLUS Loans have repayment periods of between five and ten years. FFELP Consolidation Loans have repayment periods of twelve to thirty years. FFELP Loans do not require repayment, or have modified repayment plans, while the customer is in-school and during the grace period immediately upon leaving school. The customer may also be granted a deferment or forbearance for a period of time based on need, during which time the customer is not considered to be in repayment. Interest continues to accrue on loans in the in-school, deferment and forbearance period. FFELP Loans obligate the customer to pay interest at a stated fixed rate or a variable rate reset annually (subject to a cap) on July 1 of each year depending on when the loan was originated and the loan type. FFELP Loans disbursed before April 1, 2006 earn interest at the greater of the borrower’s rate or a floating rate based on the Special Allowance Payment (“SAP”) formula, with the interest earned on the floating rate that exceeds the interest earned from the customer being paid directly by ED. In low or certain declining interest rate environments when education loans are earning at the fixed borrower rate and the interest on the funding for the loans is variable and declining, we can earn additional spread income that we refer to as Floor Income. For loans disbursed after April 1, 2006, FFELP Loans effectively only earn at the SAP rate, as the excess interest earned when the borrower rate exceeds the SAP rate (Floor Income) is required to be rebated to ED.
F-26
Table of Contents
NAVIENT CORPORATION
NOTES TO CONSOLIDATED FINANCIAL STATEMENTS (Continued)
| 3. | Education Loans (Continued) |
FFELP Loans are insured as to their principal and accrued interest in the event of default subject to a Risk Sharing level based on the date of loan disbursement. These insurance obligations are supported by contractual rights against the United States. For loans disbursed after October 1, 1993 and before July 1, 2006, we receive 98 percent reimbursement on all qualifying default claims. For loans disbursed on or after July 1, 2006, we receive 97 percent reimbursement.
Private Education Loans bear the full credit risk of the customer. Private Education Loans generally carry a variable rate indexed to LIBOR or Prime indices. The majority of loans in our portfolio are cosigned. Similar to FFELP loans, Private Education Loans are generally non-dischargeable in bankruptcy. Most loans have repayment terms of 10 to 15 years or more, and for loans made prior to 2009, payments are typically deferred until after graduation. However, since 2009 we began to encourage interest-only or fixed payment options while the customer is enrolled in school.
The estimated weighted average life of education loans in our portfolio was approximately 7 years at both December 31, 2016 and 2015. The following table reflects the distribution of our education loan portfolio by program.
| December 31, 2016 |
Year Ended December 31, 2016 |
|||||||||||||||
| (Dollars in millions) |
Ending Balance |
% of Balance |
Average Balance |
Average Effective Interest Rate |
||||||||||||
| FFELP Stafford and Other Education Loans, net(1) |
$ | 32,319 | 29 | % | $ | 34,710 | 2.31 | % | ||||||||
| FFELP Consolidation Loans, net |
55,411 | 50 | 57,787 | 2.98 | ||||||||||||
| Private Education Loans, net |
23,340 | 21 | 25,361 | 6.26 | ||||||||||||
|
|
|
|
|
|
|
|
|
|||||||||
| Total education loans, net |
$ | 111,070 | 100 | % | $ | 117,858 | 3.49 | % | ||||||||
|
|
|
|
|
|
|
|
|
|||||||||
| December 31, 2015 |
Year Ended December 31, 2015 |
|||||||||||||||
| (Dollars in millions) |
Ending Balance |
% of Balance |
Average Balance |
Average Effective Interest Rate |
||||||||||||
| FFELP Stafford and Other Education Loans, net(1) |
$ | 36,854 | 30 | % | $ | 38,932 | 2.05 | % | ||||||||
| FFELP Consolidation Loans, net |
59,548 | 48 | 61,489 | 2.80 | ||||||||||||
| Private Education Loans, net |
26,394 | 22 | 28,803 | 6.10 | ||||||||||||
|
|
|
|
|
|
|
|
|
|||||||||
| Total education loans, net |
$ | 122,796 | 100 | % | $ | 129,224 | 3.31 | % | ||||||||
|
|
|
|
|
|
|
|
|
|||||||||
| (1) | Primarily Stafford Loans, but also includes federally guaranteed PLUS and HEAL Loans. |
As of December 31, 2016 and 2015, 83 percent and 80 percent, respectively, of our education loan portfolio was in repayment.
Loan Sales
In 2015, we sold $412 million of FFELP Loans for a $12 million gain and $178 million of low-interest rate Private Education Loans for a $21 million loss. There were no loan sales in 2016.
F-27
Table of Contents
NAVIENT CORPORATION
NOTES TO CONSOLIDATED FINANCIAL STATEMENTS (Continued)
| 4. | Allowance for Loan Losses |
Our provisions for loan losses represent the periodic expense of maintaining an allowance sufficient to absorb incurred probable losses, net of expected recoveries, in the held-for-investment loan portfolios. The evaluation of the provisions for loan losses is inherently subjective, as it requires material estimates that may be susceptible to significant changes. We believe that the allowance for loan losses is appropriate to cover probable losses incurred in the loan portfolios.
We segregate our Private Education Loan portfolio into two classes of loans — traditional and non-traditional. Non-traditional loans are loans to (i) customers attending for-profit schools with an original Fair Isaac and Company (“FICO”) score of less than 670 and (ii) customers attending not-for-profit schools with an original FICO score of less than 640. The FICO score used in determining whether a loan is non-traditional is the greater of the customer or cosigner FICO score at origination. Traditional loans are defined as all other Private Education Loans that are not classified as non-traditional.
Allowance for Loan Losses Metrics
| Year Ended December 31, 2016 | ||||||||||||||||
| (Dollars in millions) |
FFELP Loans | Private Education Loans |
Other Loans |
Total | ||||||||||||
| Allowance for Loan Losses |
||||||||||||||||
| Beginning balance |
$ | 78 | $ | 1,471 | $ | 15 | $ | 1,564 | ||||||||
| Total provision |
43 | 383 | 3 | 429 | ||||||||||||
| Charge-offs(1) |
(54 | ) | (513 | ) | (3 | ) | (570 | ) | ||||||||
| Reclassification of interest reserve(2) |
— | 10 | — | 10 | ||||||||||||
|
|
|
|
|
|
|
|
|
|||||||||
| Ending balance |
$ | 67 | $ | 1,351 | $ | 15 | $ | 1,433 | ||||||||
|
|
|
|
|
|
|
|
|
|||||||||
| Allowance: |
||||||||||||||||
| Ending balance: individually evaluated for impairment |
$ | — | $ | 1,190 | $ | 11 | $ | 1,201 | ||||||||
| Ending balance: collectively evaluated for impairment |
$ | 67 | $ | 161 | $ | 4 | $ | 232 | ||||||||
| Loans: |
||||||||||||||||
| Ending balance: individually evaluated for impairment |
$ | — | $ | 11,165 | $ | 32 | $ | 11,197 | ||||||||
| Ending balance: collectively evaluated for impairment |
$ | 86,918 | $ | 13,983 | $ | 132 | $ | 101,033 | ||||||||
| Charge-offs as a percentage of average loans in repayment |
.07 | % | 2.20 | % | 2.10 | % | ||||||||||
| Allowance coverage of charge-offs |
1.2 | 2.6 | 7.0 | |||||||||||||
| Allowance as a percentage of the ending total loan balance |
.08 | % | 5.37 | % | 9.35 | % | ||||||||||
| Allowance as a percentage of the ending loans in repayment |
.09 | % | 6.10 | % | 9.35 | % | ||||||||||
| Ending total loans(3) |
$ | 86,918 | $ | 25,148 | $ | 164 | ||||||||||
| Average loans in repayment |
$ | 72,714 | $ | 23,275 | $ | 104 | ||||||||||
| Ending loans in repayment |
$ | 70,557 | $ | 22,150 | $ | 164 | ||||||||||
| (1) | Charge-offs are reported net of expected recoveries. For Private Education Loans, the expected recovery amount is transferred to the receivable for partially charged-off loan balance. Charge-offs include charge-offs against the receivable for partially charged-off loans which represents the difference between what was expected to be recovered and any shortfalls in what was actually recovered in the period. See “Receivable for Partially Charged-Off Private Education Loans” for further discussion. |
| (2) | Represents the additional allowance related to the amount of uncollectible interest reserved within interest income that is transferred in the period to the allowance for loan losses when interest is capitalized to a loan’s principal balance. |
| (3) | Ending total loans for Private Education Loans includes the receivable for partially charged-off loans. |
F-28
Table of Contents
NAVIENT CORPORATION
NOTES TO CONSOLIDATED FINANCIAL STATEMENTS (Continued)
| 4. | Allowance for Loan Losses (Continued) |
| Year Ended December 31, 2015 | ||||||||||||||||
| (Dollars in millions) |
FFELP Loans | Private Education Loans |
Other Loans |
Total | ||||||||||||
| Allowance for Loan Losses |
||||||||||||||||
| Beginning balance |
$ | 93 | $ | 1,916 | $ | 24 | $ | 2,033 | ||||||||
| Total provision |
46 | 538 | (3 | ) | 581 | |||||||||||
| Net adjustment resulting from the change in the charge-off rate(1) |
— | (330 | ) | — | (330 | ) | ||||||||||
| Net charge-offs remaining(2) |
(61 | ) | (659 | ) | (6 | ) | (726 | ) | ||||||||
|
|
|
|
|
|
|
|
|
|||||||||
| Total net charge-offs |
(61 | ) | (989 | ) | (6 | ) | (1,056 | ) | ||||||||
| Reclassification of interest reserve(3) |
— | 11 | — | 11 | ||||||||||||
| Loan sales |
— | (5 | ) | — | (5 | ) | ||||||||||
|
|
|
|
|
|
|
|
|
|||||||||
| Ending balance |
$ | 78 | $ | 1,471 | $ | 15 | $ | 1,564 | ||||||||
|
|
|
|
|
|
|
|
|
|||||||||
| Allowance: |
||||||||||||||||
| Ending balance: individually evaluated for impairment |
$ | — | $ | 1,209 | $ | 12 | $ | 1,221 | ||||||||
| Ending balance: collectively evaluated for impairment |
$ | 78 | $ | 262 | $ | 3 | $ | 343 | ||||||||
| Loans: |
||||||||||||||||
| Ending balance: individually evaluated for impairment(4) |
$ | — | $ | 10,965 | $ | 37 | $ | 11,002 | ||||||||
| Ending balance: collectively evaluated for impairment(4) |
$ | 95,393 | $ | 17,431 | $ | 49 | $ | 112,873 | ||||||||
| Net charge-offs as a percentage of average loans in repayment, excluding the net adjustment resulting from the change in the charge-off rate (annualized)(1) |
.08 | % | 2.55 | % | 6.17 | % | ||||||||||
| Net adjustment resulting from the change in the charge-off rate as a percentage of average loans in repayment (annualized)(1) |
— | % | 1.28 | % | — | % | ||||||||||
| Allowance coverage of net charge-offs, excluding the net adjustment resulting from the change in the charge-off rate (annualized)(1) |
1.3 | 2.2 | 2.5 | |||||||||||||
| Allowance as a percentage of the ending total loan balance |
.08 | % | 5.18 | % | 17.28 | % | ||||||||||
| Allowance as a percentage of the ending loans in repayment |
.11 | % | 6.00 | % | 17.28 | % | ||||||||||
| Ending total loans(4) |
$ | 95,393 | $ | 28,396 | $ | 86 | ||||||||||
| Average loans in repayment |
$ | 75,925 | $ | 25,802 | $ | 97 | ||||||||||
| Ending loans in repayment |
$ | 73,838 | $ | 24,502 | $ | 86 | ||||||||||
| (1) | In the second quarter of 2015, the portion of the loan amount charged off at default on Private Education Loans increased from 73 percent to 79 percent. This did not impact the provision for loan losses as previously this had been reserved through the allowance for loan losses. This change resulted in a $330 million reduction to the balance of the receivable for partially charged-off loans. |
| (2) | Charge-offs are reported net of expected recoveries. For Private Education Loans, the expected recovery amount is transferred to the receivable for partially charged-off loan balance. Charge-offs include charge-offs against the receivable for partially charged-off loans which represents the difference between what was expected to be recovered and any shortfalls in what was actually recovered in the period. See “Receivable for Partially Charged-Off Private Education Loans” for further discussion. |
| (3) | Represents the additional allowance related to the amount of uncollectible interest reserved within interest income that is transferred in the period to the allowance for loan losses when interest is capitalized to a loan’s principal balance. |
| (4) | Ending total loans for Private Education Loans includes the receivable for partially charged-off loans. |
F-29
Table of Contents
NAVIENT CORPORATION
NOTES TO CONSOLIDATED FINANCIAL STATEMENTS (Continued)
| 4. | Allowance for Loan Losses (Continued) |
| Year Ended December 31, 2014 | ||||||||||||||||
| (Dollars in millions) |
FFELP Loans | Private Education Loans |
Other Loans |
Total | ||||||||||||
| Allowance for Loan Losses |
||||||||||||||||
| Beginning balance |
$ | 119 | $ | 2,097 | $ | 28 | $ | 2,244 | ||||||||
| Total provision |
59 | 588 | — | 647 | ||||||||||||
| Charge-offs(1) |
(79 | ) | (717 | ) | (4 | ) | (800 | ) | ||||||||
| Reclassification of interest reserve(2) |
— | 17 | — | 17 | ||||||||||||
| Distribution of SLM BankCo |
(6 | ) | (69 | ) | — | (75 | ) | |||||||||
|
|
|
|
|
|
|
|
|
|||||||||
| Ending balance |
$ | 93 | $ | 1,916 | $ | 24 | $ | 2,033 | ||||||||
|
|
|
|
|
|
|
|
|
|||||||||
| Allowance: |
||||||||||||||||
| Ending balance: individually evaluated for impairment |
$ | — | $ | 1,132 | $ | 19 | $ | 1,151 | ||||||||
| Ending balance: collectively evaluated for impairment |
$ | 93 | $ | 784 | $ | 5 | $ | 882 | ||||||||
| Loans: |
||||||||||||||||
| Ending balance: individually evaluated for impairment |
$ | — | $ | 10,609 | $ | 45 | $ | 10,654 | ||||||||
| Ending balance: collectively evaluated for impairment |
$ | 103,362 | $ | 21,697 | $ | 62 | $ | 125,121 | ||||||||
| Charge-offs as a percentage of average loans in repayment |
.11 | % | 2.51 | % | 3.31 | % | ||||||||||
| Allowance coverage of charge-offs |
1.2 | 2.7 | 6.1 | |||||||||||||
| Allowance as a percentage of the ending total loan balance |
.09 | % | 5.93 | % | 22.23 | % | ||||||||||
| Allowance as a percentage of the ending loans in repayment |
.12 | % | 7.11 | % | 22.23 | % | ||||||||||
| Ending total loans(3) |
$ | 103,362 | $ | 32,306 | $ | 107 | ||||||||||
| Average loans in repayment |
$ | 72,811 | $ | 28,577 | $ | 117 | ||||||||||
| Ending loans in repayment |
$ | 78,135 | $ | 26,949 | $ | 107 | ||||||||||
| (1) | Charge-offs are reported net of expected recoveries. For Private Education Loans, the expected recovery amount is transferred to the receivable for partially charged-off loan balance. Charge-offs include charge-offs against the receivable for partially charged-off loans which represents the difference between what was expected to be recovered and any shortfalls in what was actually recovered in the period. See “Receivable for Partially Charged-Off Private Education Loans” for further discussion. |
| (2) | Represents the additional allowance related to the amount of uncollectible interest reserved within interest income that is transferred in the period to the allowance for loan losses when interest is capitalized to a loan’s principal balance. |
| (3) | Ending total loans for Private Education Loans includes the receivable for partially charged-off loans. |
F-30
Table of Contents
NAVIENT CORPORATION
NOTES TO CONSOLIDATED FINANCIAL STATEMENTS (Continued)
| 4. | Allowance for Loan Losses (Continued) |
Key Credit Quality Indicators
FFELP Loans are substantially insured and guaranteed as to their principal and accrued interest in the event of default; therefore, the key credit quality indicator for this portfolio is loan status. The impact of changes in loan status is incorporated quarterly into the allowance for loan losses calculation.
For Private Education Loans, the key credit quality indicators are school type, FICO scores, the existence of a cosigner, the loan status and loan seasoning. The school type/FICO score are assessed at origination and maintained through the traditional/non-traditional loan designation. The other Private Education Loan key quality indicators can change and are incorporated quarterly into the allowance for loan losses calculation. The following table highlights the principal balance (excluding the receivable for partially charged-off loans) of our Private Education Loan portfolio stratified by the key credit quality indicators.
| Private Education Loans Credit Quality Indicators |
||||||||||||||||
| December 31, 2016 | December 31, 2015 | |||||||||||||||
| (Dollars in millions) |
Balance(3) | % of Balance | Balance(3) | % of Balance | ||||||||||||
| Credit Quality Indicators |
||||||||||||||||
| School Type/FICO Scores: |
||||||||||||||||
| Traditional |
$ | 22,367 | 92 | % | $ | 25,280 | 92 | % | ||||||||
| Non-Traditional(1) |
1,966 | 8 | 2,235 | 8 | ||||||||||||
|
|
|
|
|
|
|
|
|
|||||||||
| Total |
$ | 24,333 | 100 | % | $ | 27,515 | 100 | % | ||||||||
|
|
|
|
|
|
|
|
|
|||||||||
| Cosigners: |
||||||||||||||||
| With cosigner |
$ | 15,610 | 64 | % | $ | 17,738 | 64 | % | ||||||||
| Without cosigner |
8,723 | 36 | 9,777 | 36 | ||||||||||||
|
|
|
|
|
|
|
|
|
|||||||||
| Total |
$ | 24,333 | 100 | % | $ | 27,515 | 100 | % | ||||||||
|
|
|
|
|
|
|
|
|
|||||||||
| Seasoning(2): |
||||||||||||||||
| 1-12 payments |
$ | 1,340 | 5 | % | $ | 1,776 | 7 | % | ||||||||
| 13-24 payments |
1,271 | 5 | 1,977 | 7 | ||||||||||||
| 25-36 payments |
1,908 | 8 | 2,982 | 11 | ||||||||||||
| 37-48 payments |
2,723 | 11 | 3,787 | 14 | ||||||||||||
| More than 48 payments |
15,698 | 65 | 14,953 | 54 | ||||||||||||
| Not yet in repayment |
1,393 | 6 | 2,040 | 7 | ||||||||||||
|
|
|
|
|
|
|
|
|
|||||||||
| Total |
$ | 24,333 | 100 | % | $ | 27,515 | 100 | % | ||||||||
|
|
|
|
|
|
|
|
|
|||||||||
| (1) | Defined as loans to customers attending for-profit schools (with a FICO score of less than 670 at origination) and customers attending not-for-profit schools (with a FICO score of less than 640 at origination). |
| (2) | Number of months in active repayment for which a scheduled payment was received. |
| (3) | Balance represents gross Private Education Loans. |
F-31
Table of Contents
NAVIENT CORPORATION
NOTES TO CONSOLIDATED FINANCIAL STATEMENTS (Continued)
| 4. | Allowance for Loan Losses (Continued) |
The following tables provide information regarding the loan status and aging of past due loans.
| FFELP Loan Delinquencies | ||||||||||||||||||||||||
| December 31, | ||||||||||||||||||||||||
| 2016 | 2015 | 2014 | ||||||||||||||||||||||
| (Dollars in millions) |
Balance | % | Balance | % | Balance | % | ||||||||||||||||||
| Loans in-school/grace/deferment(1) |
$ | 5,871 | $ | 8,257 | $ | 10,861 | ||||||||||||||||||
| Loans in forbearance(2) |
10,490 | 13,298 | 14,366 | |||||||||||||||||||||
| Loans in repayment and percentage of each status: |
||||||||||||||||||||||||
| Loans current |
61,977 | 87.8 | % | 62,651 | 84.8 | % | 65,221 | 83.5 | % | |||||||||||||||
| Loans delinquent 31-60 days(3) |
2,820 | 4.0 | 3,285 | 4.5 | 3,942 | 5.0 | ||||||||||||||||||
| Loans delinquent 61-90 days(3) |
1,325 | 1.9 | 1,856 | 2.5 | 2,451 | 3.1 | ||||||||||||||||||
| Loans delinquent greater than 90 days(3) |
4,435 | 6.3 | 6,046 | 8.2 | 6,521 | 8.4 | ||||||||||||||||||
|
|
|
|
|
|
|
|
|
|
|
|
|
|||||||||||||
| Total FFELP Loans in repayment |
70,557 | 100 | % | 73,838 | 100 | % | 78,135 | 100 | % | |||||||||||||||
|
|
|
|
|
|
|
|
|
|
|
|
|
|||||||||||||
| Total FFELP Loans, gross |
86,918 | 95,393 | 103,362 | |||||||||||||||||||||
| FFELP Loan unamortized premium |
879 | 1,087 | 1,176 | |||||||||||||||||||||
|
|
|
|
|
|
|
|||||||||||||||||||
| Total FFELP Loans |
87,797 | 96,480 | 104,538 | |||||||||||||||||||||
| FFELP Loan allowance for losses |
(67 | ) | (78 | ) | (93 | ) | ||||||||||||||||||
|
|
|
|
|
|
|
|||||||||||||||||||
| FFELP Loans, net |
$ | 87,730 | $ | 96,402 | $ | 104,445 | ||||||||||||||||||
|
|
|
|
|
|
|
|||||||||||||||||||
| Percentage of FFELP Loans in repayment |
81.2 | % | 77.4 | % | 75.6 | % | ||||||||||||||||||
|
|
|
|
|
|
|
|||||||||||||||||||
| Delinquencies as a percentage of FFELP Loans in repayment |
12.2 | % | 15.2 | % | 16.5 | % | ||||||||||||||||||
|
|
|
|
|
|
|
|||||||||||||||||||
| FFELP Loans in forbearance as a percentage of loans in repayment and forbearance |
12.9 | % | 15.3 | % | 15.5 | % | ||||||||||||||||||
|
|
|
|
|
|
|
|||||||||||||||||||
| (1) | Loans for customers who may still be attending school or engaging in other permitted educational activities and are not required to make payments on the loans, e.g., residency periods for medical students or a grace period for bar exam preparation, as well as loans for customers who have requested and qualify for other permitted program deferments such as military, unemployment or economic hardships. |
| (2) | Loans for customers who have used their allowable deferment time or do not qualify for deferment, that need additional time to obtain employment or who have temporarily ceased making full payments due to hardship or other factors. |
| (3) | The period of delinquency is based on the number of days scheduled payments are contractually past due. |
F-32
Table of Contents
NAVIENT CORPORATION
NOTES TO CONSOLIDATED FINANCIAL STATEMENTS (Continued)
| 4. | Allowance for Loan Losses (Continued) |
| Traditional Private Education Loan Delinquencies | ||||||||||||||||||||||||
| December 31, | ||||||||||||||||||||||||
| 2016 | 2015 | 2014 | ||||||||||||||||||||||
| (Dollars in millions) |
Balance | % | Balance | % | Balance | % | ||||||||||||||||||
| Loans in-school/grace/deferment(1) |
$ | 1,271 | $ | 1,859 | $ | 2,777 | ||||||||||||||||||
| Loans in forbearance(2) |
700 | 863 | 935 | |||||||||||||||||||||
| Loans in repayment and percentage of each status: |
||||||||||||||||||||||||
| Loans current |
19,020 | 93.3 | % | 21,085 | 93.5 | % | 23,012 | 92.7 | % | |||||||||||||||
| Loans delinquent 31-60 days(3) |
444 | 2.2 | 491 | 2.2 | 624 | 2.5 | ||||||||||||||||||
| Loans delinquent 61-90 days(3) |
269 | 1.3 | 292 | 1.3 | 363 | 1.5 | ||||||||||||||||||
| Loans delinquent greater than 90 days(3) |
663 | 3.2 | 690 | 3.0 | 816 | 3.3 | ||||||||||||||||||
|
|
|
|
|
|
|
|
|
|
|
|
|
|||||||||||||
| Total traditional loans in repayment |
20,396 | 100 | % | 22,558 | 100 | % | 24,815 | 100 | % | |||||||||||||||
|
|
|
|
|
|
|
|
|
|
|
|
|
|||||||||||||
| Total traditional loans, gross |
22,367 | 25,280 | 28,527 | |||||||||||||||||||||
| Traditional loans unamortized discount |
(402 | ) | (470 | ) | (526 | ) | ||||||||||||||||||
|
|
|
|
|
|
|
|||||||||||||||||||
| Total traditional loans |
21,965 | 24,810 | 28,001 | |||||||||||||||||||||
| Traditional loans receivable for partially charged-off loans |
526 | 560 | 775 | |||||||||||||||||||||
| Traditional loans allowance for losses |
(1,138 | ) | (1,236 | ) | (1,515 | ) | ||||||||||||||||||
|
|
|
|
|
|
|
|||||||||||||||||||
| Traditional loans, net |
$ | 21,353 | $ | 24,134 | $ | 27,261 | ||||||||||||||||||
|
|
|
|
|
|
|
|||||||||||||||||||
| Percentage of traditional loans in repayment |
91.2 | % | 89.2 | % | 87.0 | % | ||||||||||||||||||
|
|
|
|
|
|
|
|||||||||||||||||||
| Delinquencies as a percentage of traditional loans in repayment |
6.7 | % | 6.5 | % | 7.3 | % | ||||||||||||||||||
|
|
|
|
|
|
|
|||||||||||||||||||
| Loans in forbearance as a percentage of traditional loans in repayment and forbearance |
3.3 | % | 3.7 | % | 3.6 | % | ||||||||||||||||||
|
|
|
|
|
|
|
|||||||||||||||||||
| (1) | Deferment includes customers who have returned to school or are engaged in other permitted educational activities and are not required to make payments on the loans, e.g., residency periods for medical students or a grace period for bar exam preparation. |
| (2) | Loans for customers who have requested extension of grace period generally during employment transition or who have temporarily ceased making full payments due to hardship or other factors, consistent with established loan program servicing policies and procedures. |
| (3) | The period of delinquency is based on the number of days scheduled payments are contractually past due. |
F-33
Table of Contents
NAVIENT CORPORATION
NOTES TO CONSOLIDATED FINANCIAL STATEMENTS (Continued)
| 4. | Allowance for Loan Losses (Continued) |
| Non-Traditional Private Education
Loan Delinquencies |
||||||||||||||||||||||||
| December 31, | ||||||||||||||||||||||||
| 2016 | 2015 | 2014 | ||||||||||||||||||||||
| (Dollars in millions) |
Balance | % | Balance | % | Balance | % | ||||||||||||||||||
| Loans in-school/grace/deferment(1) |
$ | 122 | $ | 181 | $ | 276 | ||||||||||||||||||
| Loans in forbearance(2) |
90 | 110 | 124 | |||||||||||||||||||||
| Loans in repayment and percentage of each status: |
||||||||||||||||||||||||
| Loans current |
1,486 | 84.8 | % | 1,646 | 84.7 | % | 1,749 | 81.9 | % | |||||||||||||||
| Loans delinquent 31-60 days(3) |
78 | 4.5 | 86 | 4.4 | 110 | 5.2 | ||||||||||||||||||
| Loans delinquent 61-90 days(3) |
52 | 2.9 | 56 | 2.9 | 73 | 3.4 | ||||||||||||||||||
| Loans delinquent greater than 90 days(3) |
138 | 7.8 | 156 | 8.0 | 202 | 9.5 | ||||||||||||||||||
|
|
|
|
|
|
|
|
|
|
|
|
|
|||||||||||||
| Total non-traditional loans in repayment |
1,754 | 100 | % | 1,944 | 100 | % | 2,134 | 100 | % | |||||||||||||||
|
|
|
|
|
|
|
|
|
|
|
|
|
|||||||||||||
| Total non-traditional loans, gross |
1,966 | 2,235 | 2,534 | |||||||||||||||||||||
| Non-traditional loans unamortized discount |
(55 | ) | (61 | ) | (68 | ) | ||||||||||||||||||
|
|
|
|
|
|
|
|||||||||||||||||||
| Total non-traditional loans |
1,911 | 2,174 | 2,466 | |||||||||||||||||||||
| Non-traditional loans receivable for partially charged-off loans |
289 | 321 | 470 | |||||||||||||||||||||
| Non-traditional loans allowance for losses |
(213 | ) | (235 | ) | (401 | ) | ||||||||||||||||||
|
|
|
|
|
|
|
|||||||||||||||||||
| Non-traditional loans, net |
$ | 1,987 | $ | 2,260 | $ | 2,535 | ||||||||||||||||||
|
|
|
|
|
|
|
|||||||||||||||||||
| Percentage of non-traditional loans in repayment |
89.2 | % | 87.0 | % | 84.2 | % | ||||||||||||||||||
|
|
|
|
|
|
|
|||||||||||||||||||
| Delinquencies as a percentage of non-traditional loans in repayment |
15.2 | % | 15.3 | % | 18.1 | % | ||||||||||||||||||
|
|
|
|
|
|
|
|||||||||||||||||||
| Loans in forbearance as a percentage of non-traditional loans in repayment and forbearance |
4.9 | % | 5.4 | % | 5.5 | % | ||||||||||||||||||
|
|
|
|
|
|
|
|||||||||||||||||||
| (1) | Deferment includes customers who have returned to school or are engaged in other permitted educational activities and are not required to make payments on the loans, e.g., residency periods for medical students or a grace period for bar exam preparation. |
| (2) | Loans for customers who have requested extension of grace period generally during employment transition or who have temporarily ceased making full payments due to hardship or other factors, consistent with established loan program servicing policies and procedures. |
| (3) | The period of delinquency is based on the number of days scheduled payments are contractually past due. |
F-34
Table of Contents
NAVIENT CORPORATION
NOTES TO CONSOLIDATED FINANCIAL STATEMENTS (Continued)
| 4. | Allowance for Loan Losses (Continued) |
Receivable for Partially Charged-Off Private Education Loans
At the end of each month, for loans that are 212 or more days past due, we charge off the estimated loss of a defaulted loan balance. Actual recoveries are applied against the remaining loan balance that was not charged off. We refer to this remaining loan balance as the “receivable for partially charged-off loans.” If actual periodic recoveries are less than expected, the difference is immediately charged off through the allowance for Private Education Loan losses with an offsetting reduction in the receivable for partially charged-off Private Education Loans. If actual periodic recoveries are greater than expected, they will be reflected as a recovery through the allowance for Private Education Loan losses once the cumulative recovery amount exceeds the cumulative amount originally expected to be recovered. The financial crisis, which began in 2007, impacted our collections on defaulted loans and as a result, Private Education Loans which defaulted from 2007 through March 31, 2015, experienced collection performance below our pre-financial crisis experience. For that reason, until we gained enough data and experience to determine the long-term, post-default recovery rate of 21 percent in second-quarter 2015, we established a reserve for potential shortfalls in recoveries. In the second quarter of 2015, the portion of the loan amount charged off at default increased from 73 percent to 79 percent. This did not impact the provision for loan losses as previously this had been reserved through the allowance for loan losses. This change resulted in a $330 million reduction to the balance of the receivable for partially charged-off loans.
The following table summarizes the activity in the receivable for partially charged-off loans.
| Years Ended December 31, | ||||||||||||
| (Dollars in millions) |
2016 | 2015 | 2014 | |||||||||
| Receivable at beginning of period |
$ | 881 | $ | 1,245 | $ | 1,313 | ||||||
| Expected future recoveries of current period defaults(1) |
128 | 183 | 233 | |||||||||
| Recoveries(2) |
(181 | ) | (191 | ) | (215 | ) | ||||||
| Net adjustment resulting from the change in the charge-off rate(3) |
— | (330 | ) | — | ||||||||
| Net charge-offs remaining(4) |
(13 | ) | (26 | ) | (86 | ) | ||||||
|
|
|
|
|
|
|
|||||||
| Total net charge-offs(5) |
(13 | ) | (356 | ) | (86 | ) | ||||||
|
|
|
|
|
|
|
|||||||
| Receivable at end of period |
815 | 881 | 1,245 | |||||||||
| Allowance for estimated recovery shortfalls(6) |
— | — | (385 | ) | ||||||||
|
|
|
|
|
|
|
|||||||
| Net receivable at end of period |
$ | 815 | $ | 881 | $ | 860 | ||||||
|
|
|
|
|
|
|
|||||||
| (1) | Represents the difference between the defaulted loan balance and our estimate of the amount to be collected in the future. |
| (2) | Current period cash collections. |
| (3) | In the second quarter of 2015, the portion of the loan amount charged off at default increased from 73 percent to 79 percent. This change resulted in a $330 million reduction to the balance of the receivable for partially charged-off loans. |
| (4) | Represents the current period recovery shortfall — the difference between what was expected to be collected and what was actually collected. |
| (5) | These amounts are included in total charge-offs as reported in the “Allowance for Private Education Loan Losses” table. |
| (6) | The allowance for estimated recovery shortfalls of the receivable for partially charged-off Private Education Loans is a component of the $1.9 billion overall allowance for Private Education Loan losses as of December 31, 2014. This component of the allowance was removed in the second quarter of 2015 due to the increase in the charge-off rate discussed above. |
Troubled Debt Restructurings (“TDRs”)
We sometimes modify the terms of loans for certain customers when we believe such modifications may increase the ability and willingness of a customer to make payments and thus increase the ultimate overall
F-35
Table of Contents
NAVIENT CORPORATION
NOTES TO CONSOLIDATED FINANCIAL STATEMENTS (Continued)
| 4. | Allowance for Loan Losses (Continued) |
amount collected on a loan. These modifications generally take the form of a forbearance, a temporary interest rate reduction or an extended repayment plan. For customers experiencing financial difficulty, certain Private Education Loans for which we have granted either a forbearance of greater than three months, an interest rate reduction or an extended repayment plan are classified as TDRs. Approximately 61 percent and 56 percent of the loans granted forbearance have qualified as a TDR loan at December 31, 2016, and 2015, respectively. The unpaid principal balance of TDR loans that were in an interest rate reduction plan as of December 31, 2016 and 2015 was $2.6 billion and $2.5 billion, respectively.
At December 31, 2016 and 2015, all of our TDR loans had a related allowance recorded. The following table provides the recorded investment, unpaid principal balance and related allowance for our TDR loans.
| TDR Loans | ||||||||||||
| (Dollars in millions) |
Recorded Investment(1) |
Unpaid Principal Balance |
Related Allowance |
|||||||||
| December 31, 2016 |
||||||||||||
| Private Education Loans — Traditional |
$ | 9,386 | $ | 9,429 | $ | 1,003 | ||||||
| Private Education Loans — Non-Traditional |
1,373 | 1,376 | 187 | |||||||||
|
|
|
|
|
|
|
|||||||
| Total |
$ | 10,759 | $ | 10,805 | $ | 1,190 | ||||||
|
|
|
|
|
|
|
|||||||
| December 31, 2015 |
||||||||||||
| Private Education Loans — Traditional |
$ | 9,134 | $ | 9,200 | $ | 995 | ||||||
| Private Education Loans — Non-Traditional |
1,441 | 1,442 | 214 | |||||||||
|
|
|
|
|
|
|
|||||||
| Total |
$ | 10,575 | $ | 10,642 | $ | 1,209 | ||||||
|
|
|
|
|
|
|
|||||||
| (1) | The recorded investment is equal to the unpaid principal balance and accrued interest receivable net of unamortized deferred fees and costs. |
The following table provides the average recorded investment and interest income recognized for our TDR loans.
| Years Ended December 31, | ||||||||||||||||||||||||
| 2016 | 2015 | 2014 | ||||||||||||||||||||||
| (Dollars in millions) |
Average Recorded Investment |
Interest Income Recognized |
Average Recorded Investment |
Interest Income Recognized |
Average Recorded Investment |
Interest Income Recognized |
||||||||||||||||||
| Private Education Loans — Traditional |
$ | 9,326 | $ | 560 | $ | 8,976 | $ | 539 | $ | 8,139 | $ | 497 | ||||||||||||
| Private Education Loans — Non-Traditional |
1,409 | 107 | 1,461 | 114 | 1,456 | 116 | ||||||||||||||||||
|
|
|
|
|
|
|
|
|
|
|
|
|
|||||||||||||
| Total |
$ | 10,735 | $ | 667 | $ | 10,437 | $ | 653 | $ | 9,595 | $ | 613 | ||||||||||||
|
|
|
|
|
|
|
|
|
|
|
|
|
|||||||||||||
F-36
Table of Contents
NAVIENT CORPORATION
NOTES TO CONSOLIDATED FINANCIAL STATEMENTS (Continued)
| 4. | Allowance for Loan Losses (Continued) |
The following table provides information regarding the loan status and aging of TDR loans that are past due.
| TDR Loan Delinquencies | ||||||||||||||||||||||||
| December 31, | ||||||||||||||||||||||||
| 2016 | 2015 | 2014 | ||||||||||||||||||||||
| (Dollars in millions) |
Balance | % | Balance | % | Balance | % | ||||||||||||||||||
| Loans in deferment(1) |
$ | 579 | $ | 706 | $ | 825 | ||||||||||||||||||
| Loans in forbearance(2) |
588 | 694 | 745 | |||||||||||||||||||||
| Loans in repayment and percentage of each status: |
||||||||||||||||||||||||
| Loans current |
8,273 | 85.8 | % | 7,887 | 85.3 | % | 7,187 | 82.7 | % | |||||||||||||||
| Loans delinquent 31-60 days(3) |
412 | 4.3 | 414 | 4.5 | 464 | 5.3 | ||||||||||||||||||
| Loans delinquent 61-90 days(3) |
267 | 2.8 | 263 | 2.9 | 299 | 3.4 | ||||||||||||||||||
| Loans delinquent greater than 90 days(3) |
686 | 7.1 | 678 | 7.3 | 746 | 8.6 | ||||||||||||||||||
|
|
|
|
|
|
|
|
|
|
|
|
|
|||||||||||||
| Total TDR loans in repayment |
9,638 | 100 | % | 9,242 | 100 | % | 8,696 | 100 | % | |||||||||||||||
|
|
|
|
|
|
|
|
|
|
|
|
|
|||||||||||||
| Total TDR loans, gross |
$ | 10,805 | $ | 10,642 | $ | 10,266 | ||||||||||||||||||
|
|
|
|
|
|
|
|||||||||||||||||||
| (1) | Deferment includes customers who have returned to school or are engaged in other permitted educational activities and are not required to make payments on the loans, e.g., residency periods for medical students or a grace period for bar exam preparation. |
| (2) | Loans for customers who have requested extension of grace period generally during employment transition or who have temporarily ceased making full payments due to hardship or other factors, consistent with established loan program servicing policies and procedures. |
| (3) | The period of delinquency is based on the number of days scheduled payments are contractually past due. |
The following table provides the amount of loans modified in the periods presented that resulted in a TDR. Additionally, the table summarizes charge-offs occurring in the TDR portfolio, as well as TDRs for which a payment default occurred in the current period within 12 months of the loan first being designated as a TDR. We define payment default as 60 days past due for this disclosure.
| Years Ended December 31, | ||||||||||||||||||||||||||||||||||||
| 2016 | 2015 | 2014 | ||||||||||||||||||||||||||||||||||
| (Dollars in millions) |
Modified Loans(1) |
Charge- Offs(2) |
Payment- Default |
Modified Loans(1) |
Charge- Offs(2) |
Payment- Default |
Modified Loans(1) |
Charge- Offs(2) |
Payment- Default |
|||||||||||||||||||||||||||
| Private Education Loans — Traditional |
$ | 1,079 | $ | 302 | $ | 226 | $ | 1,464 | $ | 351 | $ | 342 | $ | 1,858 | $ | 332 | $ | 449 | ||||||||||||||||||
| Private Education Loans — Non-Traditional |
90 | 80 | 39 | 140 | 108 | 61 | 206 | 107 | 100 | |||||||||||||||||||||||||||
|
|
|
|
|
|
|
|
|
|
|
|
|
|
|
|
|
|
|
|||||||||||||||||||
| Total |
$ | 1,169 | $ | 382 | $ | 265 | $ | 1,604 | $ | 459 | $ | 403 | $ | 2,064 | $ | 439 | $ | 549 | ||||||||||||||||||
|
|
|
|
|
|
|
|
|
|
|
|
|
|
|
|
|
|
|
|||||||||||||||||||
| (1) | Represents period ending balance of loans that have been modified during the period and resulted in a TDR. |
| (2) | Represents loans that charged off that were classified as TDRs. |
F-37
Table of Contents
NAVIENT CORPORATION
NOTES TO CONSOLIDATED FINANCIAL STATEMENTS (Continued)
| 4. | Allowance for Loan Losses (Continued) |
Accrued Interest Receivable
The following table provides information regarding accrued interest receivable on our Private Education Loans.
| Accrued Interest Receivable As of December 31, |
||||||||||||
| (Dollars in millions) |
Total | Greater Than 90 Days Past Due |
Allowance for Uncollectible Interest |
|||||||||
| 2016 |
||||||||||||
| Private Education Loans — Traditional |
$ | 344 | $ | 26 | $ | 23 | ||||||
| Private Education Loans — Non-Traditional |
47 | 7 | 7 | |||||||||
|
|
|
|
|
|
|
|||||||
| Total |
$ | 391 | $ | 33 | $ | 30 | ||||||
|
|
|
|
|
|
|
|||||||
| 2015 |
||||||||||||
| Private Education Loans — Traditional |
$ | 433 | $ | 27 | $ | 26 | ||||||
| Private Education Loans — Non-Traditional |
57 | 8 | 9 | |||||||||
|
|
|
|
|
|
|
|||||||
| Total |
$ | 490 | $ | 35 | $ | 35 | ||||||
|
|
|
|
|
|
|
|||||||
| 2014 |
||||||||||||
| Private Education Loans — Traditional |
$ | 542 | $ | 31 | $ | 29 | ||||||
| Private Education Loans — Non-Traditional |
70 | 10 | 11 | |||||||||
|
|
|
|
|
|
|
|||||||
| Total |
$ | 612 | $ | 41 | $ | 40 | ||||||
|
|
|
|
|
|
|
|||||||
| 5. | Business Combinations, Goodwill and Acquired Intangible Assets |
Business Combinations
Acquisitions are accounted for under the acquisition method of accounting as defined in ASC 805, “Business Combinations.” The Company allocates the purchase price to the fair value of the acquired tangible assets, liabilities and identifiable intangible assets as of the acquisition date as determined by an independent appraiser.
Acquisition of Gila LLC
During February 2015, the Company acquired a 98 percent majority controlling interest in Gila LLC for approximately $185 million. Gila LLC is an asset recovery and business processing firm. The firm provides services to state governments, agencies, court systems and municipalities. The results of operations of Gila LLC have been included in Navient’s consolidated financial statements since the acquisition date and are reflected in Navient’s Business Services segment. Navient has not disclosed the pro forma impact of this acquisition to the results of operations for the years ended December 31, 2016 and 2015, as the pro forma impact was deemed immaterial.
As of September 2015, the Company finalized its purchase price allocation for Gila LLC which resulted in an excess purchase price over the fair value of net assets acquired, or goodwill, of $97 million.
Identifiable intangible assets at the acquisition date included the Gila LLC trade name, initially classified as an indefinite life intangible asset, with an aggregate fair value of approximately $13 million as of the acquisition
F-38
Table of Contents
NAVIENT CORPORATION
NOTES TO CONSOLIDATED FINANCIAL STATEMENTS (Continued)
| 5. | Business Combinations, Goodwill and Acquired Intangible Assets (Continued) |
date. Definite life intangible assets with an estimated aggregate fair value of approximately $71 million as of the acquisition date consist primarily of customer relationships. These intangible assets will be amortized over 7 to 16 years depending on the estimated economic benefit derived from each of the underlying assets.
Acquisition of Xtend Healthcare
During October 2015, Navient acquired an 89 percent controlling interest in Xtend Healthcare for approximately $164 million. Xtend Healthcare is a health care revenue cycle management company that provides health insurance claims billing and account resolution, as well as patient billing and customer service. The results of operations of Xtend Healthcare have been included in Navient’s consolidated financial statements since the acquisition date and are reflected in Navient’s Business Services segment. Navient has not disclosed the pro forma impact of this acquisition to the results of operations for the years ended December 31, 2016 and 2015, as the pro forma impact was deemed immaterial.
As of June 2016, the Company finalized its purchase price allocation for Xtend Healthcare which resulted in an excess purchase price over the fair value of net assets acquired, or goodwill, of $102 million.
Identifiable intangible assets at the acquisition date included definite life intangible assets with an estimated aggregate fair value of approximately $65 million primarily including customer relationships, developed technology, and the Xtend Healthcare trade name. These intangible assets will be amortized over a period of 10 to 15 years based on the estimated economic benefit derived from each of the underlying assets.
Goodwill
All acquisitions must be assigned to a reporting unit or units. A reporting unit is the same as, or one level below, an operating segment. We have four reportable segments: FFELP Loans, Private Education Loans, Business Services and Other. The following table summarizes our goodwill, accumulated impairments and net goodwill for our reporting units and reportable segments.
| As of December 31, 2016 | As of December 31, 2015 | |||||||||||||||||||||||
| (Dollars in millions) |
Gross | Accumulated Impairments and Other Adjustments(1) |
Net | Gross | Accumulated Impairments and Other Adjustments(1) |
Net | ||||||||||||||||||
| FFELP Loans reportable segment |
$ | 194 | $ | (4 | ) | $ | 190 | $ | 194 | $ | (4 | ) | $ | 190 | ||||||||||
| Private Education Loans reportable segment(1) |
147 | (41 | ) | 106 | 147 | (41 | ) | 106 | ||||||||||||||||
| Business Services reportable segment: |
||||||||||||||||||||||||
| Servicing |
50 | — | 50 | 50 | — | 50 | ||||||||||||||||||
| Asset Recovery — Contingency |
136 | (136 | ) | 0 | 136 | (129 | ) | 7 | ||||||||||||||||
| Asset Recovery — Gila LLC |
97 | — | 97 | 97 | — | 97 | ||||||||||||||||||
| Asset Recovery — Xtend Healthcare |
102 | — | 102 | 101 | — | 101 | ||||||||||||||||||
|
|
|
|
|
|
|
|
|
|
|
|
|
|||||||||||||
| Total Business Services reportable segment |
385 | (136 | ) | 249 | 384 | (129 | ) | 255 | ||||||||||||||||
|
|
|
|
|
|
|
|
|
|
|
|
|
|||||||||||||
| Total |
$ | 726 | $ | (181 | ) | $ | 545 | $ | 725 | $ | (174 | ) | $ | 551 | ||||||||||
|
|
|
|
|
|
|
|
|
|
|
|
|
|||||||||||||
| (1) | In conjunction with our Separation from SLM BankCo in 2014, we removed $41 million of goodwill from our balance sheet as required under ASC 350, “Intangibles — Goodwill and Other.” This goodwill was allocated to the consumer banking business retained by SLM BankCo based on relative fair value. |
F-39
Table of Contents
NAVIENT CORPORATION
NOTES TO CONSOLIDATED FINANCIAL STATEMENTS (Continued)
| 5. | Business Combinations, Goodwill and Acquired Intangible Assets (Continued) |
Annual Goodwill Impairment Testing — October 1, 2016
We perform our goodwill impairment testing annually in the fourth quarter as of October 1. As part of the 2016 annual impairment testing, we retained a third-party appraisal firm to assist in the valuations required to perform Step 1 impairment testing of goodwill associated with our FFELP Loans, Private Education Loans and Servicing reporting units. The income approach was the primary approach used to estimate the fair value of these reporting units. No goodwill was deemed impaired in 2016 in conjunction with these reporting units.
The income approach measures the value of each reporting unit’s future economic benefit determined by its discounted cash flows derived from our projections plus an assumed terminal growth rate adjusted for what we believe a market participant would assume in an acquisition. These projections are generally five-year projections that reflect the anticipated cash flow fluctuations of the respective reporting units. If a component of a reporting unit is winding down or is assumed to wind down, the projections extend through the anticipated wind-down period and no residual value is ascribed.
Under our guidance, the third-party appraisal firm developed the discount rate for each reporting unit incorporating such factors as the risk free rate, a market rate of return, a measure of volatility (Beta) and a company-specific and capital markets risk premium, as appropriate, to adjust for volatility and uncertainty in the economy and to capture specific risk related to the respective reporting units. We considered whether an asset sale or an equity sale would be the most likely sale structure for each reporting unit and valued each reporting unit based on the more likely hypothetical scenario. The discount rates reflect market-based estimates of capital costs and are adjusted for our assessment of a market participant’s view with respect to execution, source concentration and other risks associated with the projected cash flows of individual reporting units. We reviewed and approved the discount rates provided by the third-party appraiser including the factors incorporated to develop the discount rates for each reporting unit.
We and the third-party appraisal firm also considered a market approach for each reporting unit. Market-based multiples for comparable publicly traded companies and similar transactions were evaluated as an indicator of the value of the reporting units to assess the reasonableness of the estimated fair value derived from the income approach. As of October 1, 2016 and December 31, 2016, our market capitalization was 20 percent and 28 percent higher than book equity, respectively,
The following table illustrates the carrying value of equity for our FFELP Loans, Private Education Loans and Servicing reporting units and the percentage by which the estimated fair value determined in conjunction with Step 1 impairment testing in the fourth quarter of 2016 exceeds the carrying value of equity.
| (Dollars in millions) |
Carrying Value of Equity |
% of Fair Value in Excess of Carrying Value |
||||||
| FFELP Loans |
$ | 773 | 95 | % | ||||
| Private Education Loans |
2,380 | 14 | % | |||||
| Servicing |
71 | 1,263 | % | |||||
With respect to the Contingency, Gila and Xtend reporting units, we considered factors associated with Navient as a whole, such as market capitalization in excess of our book equity, our 2016 earnings, 2017 expectations and analyst’s expectations regarding our stock price. We also considered factors specific to the individual reporting units including but not limited to 2016 earnings, 2017 expectations, current customer base and revenue backlog as well as short and long term outlook. No goodwill was deemed impaired for the Gila and Xtend reporting units after assessing these relevant qualitative factors. With respect to the Contingency reporting
F-40
Table of Contents
NAVIENT CORPORATION
NOTES TO CONSOLIDATED FINANCIAL STATEMENTS (Continued)
| 5. | Business Combinations, Goodwill and Acquired Intangible Assets (Continued) |
unit, further assessment was warranted due primarily to revenue declines stemming from the wind-down nature of the Contingency reporting unit’s existing education loan asset recovery business. As a result, the Contingency reporting unit’s remaining goodwill of $7 million was impaired.
We acknowledge that a downturn in the economy coupled with liquidity constraints, and changes in legislation and the regulatory environment could adversely affect the operating results of our reporting units. If the forecasted performance of our reporting units is not achieved, or if our stock price declines resulting in deterioration in our total market capitalization, the fair value of one or more of the reporting units could be significantly reduced, and we may be required to record a charge, which could be material, for an impairment of goodwill associated with these reporting units.
Acquired Intangible Assets
Acquired intangible assets include the following:
| As of December 31, 2016 | As of December 31, 2015 | |||||||||||||||||||||||
| (Dollars in millions) |
Cost Basis(1) |
Accumulated Impairment and Amortization(1) |
Net | Cost Basis(1) |
Accumulated Impairment and Amortization(1) |
Net | ||||||||||||||||||
| Customer, services and lending relationships |
$ | 292 | $ | (219 | ) | $ | 73 | $ | 305 | $ | (202 | ) | $ | 103 | ||||||||||
| Favorable lease |
1 | — | 1 | 1 | — | 1 | ||||||||||||||||||
| Non-competes |
2 | (2 | ) | — | 2 | (1 | ) | 1 | ||||||||||||||||
| Software and technology |
101 | (82 | ) | 19 | 91 | (78 | ) | 13 | ||||||||||||||||
| Trade names and trademarks(2) |
44 | (13 | ) | 31 | 42 | (6 | ) | 36 | ||||||||||||||||
|
|
|
|
|
|
|
|
|
|
|
|
|
|||||||||||||
| Total acquired intangible assets |
$ | 440 | $ | (316 | ) | $ | 124 | $ | 441 | $ | (287 | ) | $ | 154 | ||||||||||
|
|
|
|
|
|
|
|
|
|
|
|
|
|||||||||||||
| (1) | Accumulated impairment and amortization includes impairment amounts only if the acquired intangible asset has been deemed partially impaired. When an acquired intangible asset is considered fully impaired and no longer in use, the cost basis and any accumulated amortization related to the asset is written off. |
| (2) | During 2016 we reclassified certain trade names from indefinite life to definite life intangible assets and began to amortize these assets over their expected benefit period. |
We recorded amortization of acquired intangible assets from continuing operations totaling $29 million, $12 million and $9 million in 2016, 2015 and 2014, respectively. We will continue to amortize our intangible assets with definite useful lives over their remaining estimated useful lives. We estimate amortization expense associated with these intangible assets will be $23 million, $20 million, $17 million, $14 million and $51 million in 2017, 2018, 2019, 2020 and after 2020, respectively.
| 6. | Borrowings |
Borrowings consist of secured borrowings issued through our securitization program, borrowings through secured facilities, unsecured notes issued by us, and other interest-bearing liabilities related primarily to obligations to return cash collateral held. To match the interest rate and currency characteristics of our borrowings with the interest rate and currency characteristics of our assets, we enter into interest rate and foreign currency swaps with independent parties. Under these agreements, we make periodic payments, generally indexed to the related asset rates or rates which are highly correlated to the asset rates, in exchange for periodic payments which generally match our interest obligations on fixed or variable rate notes (see “Note 7 —Derivative Financial Instruments”). Payments and receipts on our interest rate and currency swaps are not reflected in the following tables.
F-41
Table of Contents
NAVIENT CORPORATION
NOTES TO CONSOLIDATED FINANCIAL STATEMENTS (Continued)
| 6. | Borrowings (Continued) |
The following table summarizes our borrowings.
| December 31, 2016 | December 31, 2015 | |||||||||||||||||||||||
| (Dollars in millions) |
Short Term |
Long Term |
Total | Short Term |
Long Term |
Total | ||||||||||||||||||
| Unsecured borrowings: |
||||||||||||||||||||||||
| Senior unsecured debt |
$ | 717 | $ | 13,029 | $ | 13,746 | $ | 1,120 | $ | 13,976 | $ | 15,096 | ||||||||||||
|
|
|
|
|
|
|
|
|
|
|
|
|
|||||||||||||
| Total unsecured borrowings |
717 | 13,029 | 13,746 | 1,120 | 13,976 | 15,096 | ||||||||||||||||||
| Secured borrowings: |
||||||||||||||||||||||||
| FFELP Loan securitizations |
— | 73,522 | 73,522 | — | 77,764 | 77,764 | ||||||||||||||||||
| Private Education Loan securitizations(1) |
548 | 14,125 | 14,673 | — | 16,900 | 16,900 | ||||||||||||||||||
| FFELP Loan — other facilities |
— | 12,443 | 12,443 | — | 16,276 | 16,276 | ||||||||||||||||||
| Private Education Loan — other facilities |
464 | — | 464 | 710 | — | 710 | ||||||||||||||||||
|
Other(2) |
606 | — | 606 | 760 | — | 760 | ||||||||||||||||||
|
|
|
|
|
|
|
|
|
|
|
|
|
|||||||||||||
| Total secured borrowings |
1,618 | 100,090 | 101,708 | 1,470 | 110,940 | 112,410 | ||||||||||||||||||
|
|
|
|
|
|
|
|
|
|
|
|
|
|||||||||||||
| Total before hedge accounting adjustments |
2,335 | 113,119 | 115,454 | 2,590 | 124,916 | 127,506 | ||||||||||||||||||
| Hedge accounting adjustments |
(1 | ) | (751 | ) | (752 | ) | (20 | ) | (83 | ) | (103 | ) | ||||||||||||
|
|
|
|
|
|
|
|
|
|
|
|
|
|||||||||||||
| Total |
$ | 2,334 | $ | 112,368 | $ | 114,702 | $ | 2,570 | $ | 124,833 | $ | 127,403 | ||||||||||||
|
|
|
|
|
|
|
|
|
|
|
|
|
|||||||||||||
| (1) | Includes $548 million and $0 of short-term debt related to the Private Education Loan asset-backed securitization repurchase facility (“Repurchase Facility”) as of December 31, 2016 and 2015, respectively. Includes $475 million and $546 million of long-term debt related to the Repurchase Facility as of December 31, 2016 and 2015, respectively. |
| (2) | “Other” primarily includes the obligation to return cash collateral held related to derivative exposures, which includes $193 million of securities re-pledged subject to an overnight repurchase transaction. |
Short-term Borrowings
Short-term borrowings have a remaining term to maturity of one year or less. The following tables summarize outstanding short-term borrowings (secured and unsecured), the weighted average interest rates at the end of each period, and the related average balances and weighted average interest rates during the periods.
| December 31, 2016 | Year Ended December 31, 2016 | |||||||||||||||
| (Dollars in millions) |
Ending Balance | Weighted Average Interest Rate |
Average Balance | Weighted Average Interest Rate |
||||||||||||
| Private Education Loan securitizations |
$ | 548 | 3.72 | % | $ | 42 | 3.81 | % | ||||||||
| FFELP Loan — other facilities |
— | — | — | — | ||||||||||||
| Private Education Loan — other facilities |
464 | 2.02 | 389 | 1.83 | ||||||||||||
| Senior unsecured debt |
716 | 4.22 | 1,032 | 5.01 | ||||||||||||
| Other interest-bearing liabilities |
606 | .96 | 629 | .48 | ||||||||||||
|
|
|
|
|
|
|
|
|
|||||||||
| Total short-term borrowings |
$ | 2,334 | 2.82 | % | $ | 2,092 | 3.03 | % | ||||||||
|
|
|
|
|
|
|
|
|
|||||||||
| Maximum outstanding at any month end |
$ | 2,637 | ||||||||||||||
|
|
|
|||||||||||||||
F-42
Table of Contents
NAVIENT CORPORATION
NOTES TO CONSOLIDATED FINANCIAL STATEMENTS (Continued)
| 6. | Borrowings (Continued) |
| December 31, 2015 | Year Ended December 31, 2015 | |||||||||||||||
| (Dollars in millions) |
Ending Balance | Weighted Average Interest Rate |
Average Balance | Weighted Average Interest Rate |
||||||||||||
| Private Education Loan securitizations |
$ | — | — | % | $ | — | — | % | ||||||||
| FFELP Loan — other facilities |
— | — | 8 | .28 | ||||||||||||
| Private Education Loan —other facilities |
710 | 1.47 | 636 | 1.29 | ||||||||||||
| Senior unsecured debt |
1,100 | 5.97 | 1,625 | 5.42 | ||||||||||||
| Other interest-bearing liabilities |
760 | .20 | 898 | .13 | ||||||||||||
|
|
|
|
|
|
|
|
|
|||||||||
| Total short-term borrowings |
$ | 2,570 | 3.02 | % | $ | 3,167 | 3.08 | % | ||||||||
|
|
|
|
|
|
|
|
|
|||||||||
| Maximum outstanding at any month end |
$ | 4,710 | ||||||||||||||
|
|
|
|||||||||||||||
Long-term Borrowings
The following tables summarize outstanding long-term borrowings, the weighted average interest rates at the end of the periods, and the related average balances during the periods.
| December 31, 2016 | Year Ended December 31, 2016 |
|||||||||||
| Weighted Average |
||||||||||||
| (Dollars in millions) |
Ending Balance(1) |
Interest Rate(2) |
Average Balance |
|||||||||
| Floating rate notes: |
||||||||||||
| U.S. dollar-denominated: |
||||||||||||
| Interest bearing, due 2017-2083 |
$ | 88,575 | 1.65 | % | $ | 93,881 | ||||||
| Non-U.S. dollar-denominated: |
||||||||||||
| Interest bearing, due 2023-2041 |
7,265 | .28 | 8,761 | |||||||||
|
|
|
|
|
|
|
|||||||
| Total floating rate notes |
95,840 | 1.54 | 102,642 | |||||||||
| Fixed rate notes: |
||||||||||||
| U.S. dollar-denominated: |
||||||||||||
| Interest bearing, due 2018-2058 |
16,271 | 5.65 | 16,050 | |||||||||
| Non-U.S.-dollar denominated: |
||||||||||||
| Interest bearing, due 2034-2035 |
257 | 2.82 | 281 | |||||||||
|
|
|
|
|
|
|
|||||||
| Total fixed rate notes |
16,528 | 5.60 | 16,331 | |||||||||
|
|
|
|
|
|
|
|||||||
| Total long-term borrowings |
$ | 112,368 | 2.14 | % | $ | 118,973 | ||||||
|
|
|
|
|
|
|
|||||||
F-43
Table of Contents
NAVIENT CORPORATION
NOTES TO CONSOLIDATED FINANCIAL STATEMENTS (Continued)
| 6. | Borrowings (Continued) |
| December 31, 2015 | Year Ended December 31, 2015 |
|||||||||||
| Weighted Average |
||||||||||||
| (Dollars in millions) |
Ending Balance(1) |
Interest Rate(2) |
Average Balance |
|||||||||
| Floating rate notes: |
||||||||||||
| U.S. dollar-denominated: |
||||||||||||
| Interest bearing, due 2017-2058 |
$ | 98,926 | 1.13 | % | $ | 103,037 | ||||||
| Non-U.S. dollar-denominated: |
||||||||||||
| Interest bearing, due 2023-2041 |
8,169 | .47 | 8,601 | |||||||||
|
|
|
|
|
|
|
|||||||
| Total floating rate notes |
107,095 | 1.08 | 111,638 | |||||||||
| Fixed rate notes: |
||||||||||||
| U.S. dollar-denominated: |
||||||||||||
| Interest bearing, due 2017-2047 |
17,488 | 5.52 | 17,252 | |||||||||
| Non-U.S.-dollar denominated: |
||||||||||||
| Interest bearing, due 2034-2035 |
250 | 2.89 | 927 | |||||||||
|
|
|
|
|
|
|
|||||||
| Total fixed rate notes |
17,738 | 5.48 | 18,179 | |||||||||
|
|
|
|
|
|
|
|||||||
| Total long-term borrowings |
$ | 124,833 | 1.71 | % | $ | 129,817 | ||||||
|
|
|
|
|
|
|
|||||||
| (1) | Ending balance is expressed in U.S. dollars using the spot currency exchange rate. Includes fair value adjustments under hedge accounting for notes designated as the hedged item in a fair value hedge. |
| (2) | Weighted average interest rate is stated rate relative to currency denomination of debt. |
As of December 31, 2016, the stated maturities of our long-term borrowings are shown in the following table.
| Stated Maturity | ||||||||||||
| (Dollars in millions) |
Senior Unsecured Debt |
Secured Borrowings(1) |
Total(2) | |||||||||
| Year of Maturity |
||||||||||||
| 2017 |
$ | — | $ | 14,221 | $ | 14,221 | ||||||
| 2018 |
2,047 | 10,747 | 12,794 | |||||||||
| 2019 |
2,361 | 7,662 | 10,023 | |||||||||
| 2020 |
2,036 | 9,010 | 11,046 | |||||||||
| 2021 |
1,288 | 7,498 | 8,786 | |||||||||
| 2022-2083 |
5,297 | 50,952 | 56,249 | |||||||||
|
|
|
|
|
|
|
|||||||
| 13,029 | 100,090 | 113,119 | ||||||||||
| Hedge accounting adjustments |
450 | (1,201 | ) | (751 | ) | |||||||
|
|
|
|
|
|
|
|||||||
| Total |
$ | 13,479 | $ | 98,889 | $ | 112,368 | ||||||
|
|
|
|
|
|
|
|||||||
| (1) | We view our securitization trust debt as long-term based on the contractual maturity dates and have projected the expected principal paydowns based on our current estimates regarding the securitized loans’ prepayment speeds. The projected principal paydowns in year 2017 include $14.2 billion related to the securitization trust debt. |
| (2) | The aggregate principal amount of debt that matures in each period is $14.3 billion in 2017, $12.9 billion in 2018, $10.1 billion in 2019, $11.1 billion in 2020, $8.9 billion in 2021 and $56.8 billion in 2022-2083. |
F-44
Table of Contents
NAVIENT CORPORATION
NOTES TO CONSOLIDATED FINANCIAL STATEMENTS (Continued)
| 6. | Borrowings (Continued) |
Variable Interest Entities
We consolidate the following financing VIEs as of December 31, 2016 and 2015, as we are the primary beneficiary. As a result, these VIEs are accounted for as secured borrowings.
| December 31, 2016 | ||||||||||||||||||||||||||||
| Debt Outstanding | Carrying Amount of Assets Securing Debt Outstanding |
|||||||||||||||||||||||||||
| (Dollars in millions) |
Short Term |
Long Term |
Total | Loans | Cash | Other Assets, Net |
Total | |||||||||||||||||||||
| Secured Borrowings — VIEs: |
||||||||||||||||||||||||||||
| FFELP Loan securitizations |
$ | — | $ | 73,522 | $ | 73,522 | $ | 74,197 | $ | 2,676 | $ | 778 | $ | 77,651 | ||||||||||||||
| Private Education Loan securitizations(1) |
548 | 14,125 | 14,673 | 19,815 | 455 | 260 | 20,530 | |||||||||||||||||||||
| FFELP Loan — other facilities |
— | 9,046 | 9,046 | 9,232 | 289 | 172 | 9,693 | |||||||||||||||||||||
| Private Education Loan — other facilities |
464 | — | 464 | 685 | 10 | 14 | 709 | |||||||||||||||||||||
| Other |
66 | — | 66 | 79 | 4 | — | 83 | |||||||||||||||||||||
|
|
|
|
|
|
|
|
|
|
|
|
|
|
|
|||||||||||||||
| Total before hedge accounting adjustments |
1,078 | 96,693 | 97,771 | 104,008 | 3,434 | 1,224 | 108,666 | |||||||||||||||||||||
| Hedge accounting adjustments |
— | (1,201 | ) | (1,201 | ) | — | — | (1,235 | ) | (1,235 | ) | |||||||||||||||||
|
|
|
|
|
|
|
|
|
|
|
|
|
|
|
|||||||||||||||
| Total |
$ | 1,078 | $ | 95,492 | $ | 96,570 | $ | 104,008 | $ | 3,434 | $ | (11 | ) | $ | 107,431 | |||||||||||||
|
|
|
|
|
|
|
|
|
|
|
|
|
|
|
|||||||||||||||
| December 31, 2015 | ||||||||||||||||||||||||||||
| Debt Outstanding | Carrying Amount of Assets Securing Debt Outstanding |
|||||||||||||||||||||||||||
| (Dollars in millions) |
Short Term |
Long Term |
Total | Loans | Cash | Other Assets, Net |
Total | |||||||||||||||||||||
| Secured Borrowings — VIEs: |
||||||||||||||||||||||||||||
| FFELP Loan securitizations |
$ | — | $ | 77,764 | $ | 77,764 | $ | 78,358 | $ | 2,760 | $ | 682 | $ | 81,800 | ||||||||||||||
| Private Education Loan securitizations |
— | 16,900 | 16,900 | 22,014 | 452 | 323 | 22,789 | |||||||||||||||||||||
| FFELP Loan — other facilities |
— | 12,676 | 12,676 | 13,158 | 324 | 168 | 13,650 | |||||||||||||||||||||
| Private Education Loan — other facilities |
710 | — | 710 | 1,110 | 17 | 31 | 1,158 | |||||||||||||||||||||
|
|
|
|
|
|
|
|
|
|
|
|
|
|
|
|||||||||||||||
| Total before hedge accounting adjustments |
710 | 107,340 | 108,050 | 114,640 | 3,553 | 1,204 | 119,397 | |||||||||||||||||||||
| Hedge accounting adjustments |
— | (830 | ) | (830 | ) | — | — | (911 | ) | (911 | ) | |||||||||||||||||
|
|
|
|
|
|
|
|
|
|
|
|
|
|
|
|||||||||||||||
| Total |
$ | 710 | $ | 106,510 | $ | 107,220 | $ | 114,640 | $ | 3,553 | $ | 293 | $ | 118,486 | ||||||||||||||
|
|
|
|
|
|
|
|
|
|
|
|
|
|
|
|||||||||||||||
| (1) | Includes $548 million of short-term debt, $475 million of long-term debt and $49 million of restricted cash related to the Repurchase Facility as of December 31, 2016. Includes $546 million of long-term debt and $41 million of restricted cash related to the Repurchase Facility as of December 31, 2015. |
Securitizations
Private Education Loan ABS Repurchase Facilities
In fourth-quarter 2015, we closed on a $550 million Private Education Loan ABS Repurchase Facility that matures in December 2017, and in second-quarter 2016, we closed on a second $478 million Private Education
F-45
Table of Contents
NAVIENT CORPORATION
NOTES TO CONSOLIDATED FINANCIAL STATEMENTS (Continued)
| 6. | Borrowings (Continued) |
Loan ABS Repurchase Facility that matures in April 2018. Both repurchase facilities are collateralized by Residual Interests in previously issued Private Education Loan ABS trusts. The lenders also have unsecured recourse to Navient Corporation as guarantor for any shortfall in amounts payable. Because these facilities are secured by the Residual Interests in previous securitizations, we show the debt and assets as part of Private Education Loan securitizations in the Secured Borrowings table above.
FFELP Loans — Other Secured Borrowing Facilities
We have various secured borrowing facilities that we use to finance our FFELP Loans. Liquidity is available under these secured credit facilities to the extent we have eligible collateral and available capacity. The maximum borrowing capacity under these facilities will vary and is subject to each agreement’s borrowing conditions. These include but are not limited to the facility’s size, current usage and the availability and fair value of qualifying unencumbered FFELP Loan collateral. Our borrowings under these facilities are non-recourse. The maturity dates on these facilities range from March 2018 to December 2020. The interest rate on certain facilities can increase under certain circumstances. The facilities are subject to termination under certain circumstances. As of December 31, 2016, there was approximately $12.4 billion outstanding under these facilities, with approximately $13.8 billion of assets securing these facilities. As of December 31, 2016, the maximum unused capacity under these facilities was $2.2 billion. As of December 31, 2016, we had $0.4 billion of unencumbered FFELP Loans.
On December 22, 2015, we received notice from the Federal Home Loan Bank of Des Moines (“FHLB”) that availability under their facility would be reduced from approximately $10.7 billion to approximately $5 billion from December 22, 2015 to October 31, 2016, and to approximately $3.6 billion thereafter. In addition, in January 2016 we were informed this facility will mature in the first quarter of 2021. Both of these actions were taken by the FHLB in relation to the publication in January 2016 of new rules by the Federal Home Finance Agency, the primary regulator of the FHLB, governing eligibility of, and borrowing capacity for, certain insurance companies who are existing members of the Federal Home Loan Bank system. As of December 31, 2016, the maximum capacity and the amount outstanding under this facility was $3.4 billion and we do not expect to borrow more than this amount in the future.
Private Education Loans — Other Secured Borrowing Facilities
In addition to the FFELP Loan — other facilities, liquidity may also be available from our Private Education Loan asset-backed commercial paper (“ABCP”) facility. This facility provides liquidity for Private Education Loan acquisitions and for the refinancing of loans presently on our balance sheet or in other short-term facilities. On June 27, 2016, this facility was renewed and extended from its original maturity date of June 30, 2016 to June 26, 2017. This facility’s maximum financing amount, which was originally $1 billion, is now $750 million. At December 31, 2016, the available capacity under this facility was $285 million. Borrowing under this facility will vary and is subject to the availability of qualifying collateral from unencumbered Private Education Loans.
Other Funding Sources
Senior Unsecured Debt
We issued $1.3 billion, $500 million and $1.9 billion of unsecured debt in 2016, 2015 and 2014, respectively.
F-46
Table of Contents
NAVIENT CORPORATION
NOTES TO CONSOLIDATED FINANCIAL STATEMENTS (Continued)
| 6. | Borrowings (Continued) |
Debt Repurchases
The following table summarizes activity related to our senior unsecured debt and ABS repurchases. “Gains on debt repurchases” is shown net of hedging-related gains and losses.
| Years Ended December 31, | ||||||||||||
| (Dollars in millions) |
2016 | 2015 | 2014 | |||||||||
| Debt principal repurchased |
$ | 1,467 | $ | 1,744 | $ | 548 | ||||||
| Gains on debt repurchases |
1 | 21 | — | |||||||||
| 7. | Derivative Financial Instruments |
Risk Management Strategy
We maintain an overall interest rate risk management strategy that incorporates the use of derivative instruments to minimize the economic effect of interest rate changes. Our goal is to manage interest rate sensitivity by modifying the repricing frequency and underlying index characteristics of certain balance sheet assets and liabilities so the net interest margin is not, on a material basis, adversely affected by movements in interest rates. We do not use derivative instruments to hedge credit risk. As a result of interest rate fluctuations, hedged assets and liabilities will appreciate or depreciate in market value. Income or loss on the derivative instruments that are linked to the hedged assets and liabilities will generally offset the effect of this unrealized appreciation or depreciation for the period the item is being hedged. We view this strategy as a prudent management of interest rate sensitivity. In addition, we utilize derivative contracts to minimize the economic impact of changes in foreign currency exchange rates on certain debt obligations that are denominated in foreign currencies. As foreign currency exchange rates fluctuate, these liabilities will appreciate and depreciate in value. These fluctuations, to the extent the hedge relationship is effective, are offset by changes in the value of the cross-currency interest rate swaps executed to hedge these instruments. Management believes certain derivative transactions entered into as hedges, primarily Floor Income Contracts and basis swaps, are economically effective; however, those transactions generally do not qualify for hedge accounting under GAAP (as discussed below) and thus may adversely impact earnings.
Although we use derivatives to offset (or minimize) the risk of interest rate and foreign currency changes, the use of derivatives does expose us to both market and credit risk. Market risk is the chance of financial loss resulting from changes in interest rates, foreign exchange rates and market liquidity. Credit risk is the risk that a counterparty will not perform its obligations under a contract and it is limited to the loss of the fair value gain in a derivative that the counterparty owes us. When the fair value of a derivative contract is negative, we owe the counterparty and, therefore, have no credit risk exposure to the counterparty; however, the counterparty has exposure to us. We minimize the credit risk in derivative instruments by entering into transactions with highly rated counterparties that are reviewed regularly by our Credit Department. We also maintain a policy of requiring that all derivative contracts be governed by an International Swaps and Derivative Association Master Agreement. Depending on the nature of the derivative transaction, bilateral collateral arrangements related to Navient Corporation contracts generally are required as well. When we have more than one outstanding derivative transaction with the counterparty, and there exists legally enforceable netting provisions with the counterparty (i.e., a legal right to offset receivable and payable derivative contracts), the “net” mark-to-market exposure, less collateral the counterparty has posted to us, represents exposure with the counterparty. When there is a net negative exposure, we consider our exposure to the counterparty to be zero. At December 31, 2016 and 2015, we had a net positive exposure (derivative gain positions to us less collateral which has been posted by counterparties to us) related to Navient Corporation derivatives of $110 million and $85 million, respectively.
F-47
Table of Contents
NAVIENT CORPORATION
NOTES TO CONSOLIDATED FINANCIAL STATEMENTS (Continued)
| 7. | Derivative Financial Instruments (Continued) |
Our on-balance sheet securitization trusts have $8.5 billion of Euro and British Pound Sterling denominated bonds outstanding as of December 31, 2016. To convert these non-U.S. dollar denominated bonds into U.S. dollar liabilities, the trusts have entered into foreign-currency swaps with highly — rated counterparties. In addition, the trusts have entered into $10.2 billion notional of interest rates swaps which are primarily used to convert Prime received on securitized education loans to LIBOR paid on the bonds. Our securitization trusts with swaps have ISDA documentation with protections against counterparty risk. The collateral calculations contemplated in the ISDA documentation of our securitization trusts require collateral based on the fair value of the derivative which may be adjusted for additional collateral based on rating agency criteria requirements considered within the collateral agreement. The trusts are not required to post collateral to the counterparties. At December 31, 2016 and 2015, the net positive exposure on swaps in securitization trusts was $9 million and $8 million, respectively.
Accounting for Derivative Instruments
Derivative instruments that are used as part of our interest rate and foreign currency risk management strategy include interest rate swaps, basis swaps, cross-currency interest rate swaps, and interest rate floor contracts with indices that relate to the pricing of specific balance sheet assets and liabilities. The accounting for derivative instruments requires that every derivative instrument, including certain derivative instruments embedded in other contracts, be recorded on the balance sheet as either an asset or liability measured at its fair value. As more fully described below, if certain criteria are met, derivative instruments are classified and accounted for by us as either fair value or cash flow hedges. If these criteria are not met, the derivative financial instruments are accounted for as trading.
Fair Value Hedges
Fair value hedges are generally used by us to hedge the exposure to changes in fair value of a recognized fixed rate asset or liability. We enter into interest rate swaps to economically convert fixed rate assets into variable rate assets and fixed rate debt into variable rate debt. We also enter into cross-currency interest rate swaps to economically convert foreign currency denominated fixed and floating debt to U.S. dollar denominated variable debt. For fair value hedges, we generally consider all components of the derivative’s gain and/or loss when assessing hedge effectiveness and generally hedge changes in fair values due to interest rates or interest rates and foreign currency exchange rates.
Cash Flow Hedges
We use cash flow hedges to hedge the exposure to variability in cash flows for a forecasted debt issuance and for exposure to variability in cash flows of floating rate debt. This strategy is used primarily to minimize the exposure to volatility from future changes in interest rates. Gains and losses on the effective portion of a qualifying hedge are recorded in accumulated other comprehensive income and ineffectiveness is recorded immediately to earnings. In the case of a forecasted debt issuance, gains and losses are reclassified to earnings over the period which the stated hedged transaction affects earnings. If we determine it is not probable that the anticipated transaction will occur, gains and losses are reclassified immediately to earnings. In assessing hedge effectiveness, generally all components of each derivative’s gains or losses are included in the assessment. We generally hedge exposure to changes in cash flows due to changes in interest rates or total changes in cash flow.
F-48
Table of Contents
NAVIENT CORPORATION
NOTES TO CONSOLIDATED FINANCIAL STATEMENTS (Continued)
| 7. | Derivative Financial Instruments (Continued) |
Trading Activities
When derivative instruments do not qualify as hedges, they are accounted for as trading instruments where all changes in fair value are recorded through earnings. We sell interest rate floors (Floor Income Contracts) to hedge the embedded Floor Income options in education loan assets. The Floor Income Contracts are written options which have a more stringent hedge effectiveness hurdle to meet. Specifically, our Floor Income Contracts do not qualify for hedge accounting treatment because the pay down of principal of the education loans underlying the Floor Income embedded in those education loans does not exactly match the change in the notional amount of our written Floor Income Contracts. Additionally, the term, the interest rate index and the interest rate index reset frequency of the Floor Income Contracts can be different from that of the education loans. Therefore, Floor Income Contracts do not qualify for hedge accounting treatment, and are recorded as trading instruments. Regardless of the accounting treatment, we consider these contracts to be economic hedges for risk management purposes. We use this strategy to minimize our exposure to changes in interest rates.
We use basis swaps to minimize earnings variability caused by having different reset characteristics on our interest-earning assets and interest-bearing liabilities. The specific terms and notional amounts of the swaps are determined based on a review of our asset/liability structure, our assessment of future interest rate relationships, and on other factors such as short-term strategic initiatives. Hedge accounting requires that when using basis swaps, the change in the cash flows of the hedge effectively offset both the change in the cash flows of the asset and the change in the cash flows of the liability. Our basis swaps hedge variable interest rate risk; however, they generally do not meet this effectiveness criterion because the index of the swap does not exactly match the index of the hedged assets. Additionally, some of our FFELP Loans can earn at either a variable or a fixed interest rate depending on market interest rates and, therefore, swaps economically hedging these FFELP Loans do not meet the criteria for hedge accounting treatment. As a result, these swaps are recorded at fair value with changes in fair value reflected currently in the statement of income.
Summary of Derivative Financial Statement Impact
The following tables summarize the fair values and notional amounts or number of contracts of all derivative instruments at December 31, 2016 and 2015, and their impact on other comprehensive income and earnings for 2016, 2015 and 2014.
F-49
Table of Contents
NAVIENT CORPORATION
NOTES TO CONSOLIDATED FINANCIAL STATEMENTS (Continued)
| 7. | Derivative Financial Instruments (Continued) |
Impact of Derivatives on Consolidated Balance Sheet
| Cash Flow | Fair Value | Trading | Total | |||||||||||||||||||||||||||||||||
| (Dollars in millions) |
Hedged Risk Exposure |
Dec. 31, 2016 |
Dec. 31, 2015 |
Dec. 31, 2016 |
Dec. 31, 2015 |
Dec. 31, 2016 |
Dec. 31, 2015 |
Dec. 31, 2016 |
Dec. 31, 2015 |
|||||||||||||||||||||||||||
| Fair Values(1) |
||||||||||||||||||||||||||||||||||||
| Derivative Assets: |
||||||||||||||||||||||||||||||||||||
| Interest rate swaps |
Interest rate | $ | 78 | $ | — | $ | 465 | $ | 694 | $ | 22 | $ | 32 | $ | 565 | $ | 726 | |||||||||||||||||||
| Cross-currency interest rate swaps |
|
Foreign currency and interest rate |
|
— | — | — | 2 | — | — | — | 2 | |||||||||||||||||||||||||
|
|
|
|
|
|
|
|
|
|
|
|
|
|
|
|
|
|||||||||||||||||||||
| Total derivative assets(2) |
78 | — | 465 | 696 | 22 | 32 | 565 | 728 | ||||||||||||||||||||||||||||
| Derivative Liabilities: |
||||||||||||||||||||||||||||||||||||
| Interest rate swaps |
Interest rate | (76 | ) | (89 | ) | (62 | ) | (3 | ) | (70 | ) | (68 | ) | (208 | ) | (160 | ) | |||||||||||||||||||
| Floor Income Contracts |
Interest rate | — | — | — | — | (184 | ) | (365 | ) | (184 | ) | (365 | ) | |||||||||||||||||||||||
| Cross-currency interest rate swaps |
|
Foreign currency and interest rate |
|
— | — | (1,243 | ) | (926 | ) | (53 | ) | (62 | ) | (1,296 | ) | (988 | ) | |||||||||||||||||||
|
Other(3) |
Interest rate | — | — | — | — | (13 | ) | (2 | ) | (13 | ) | (2 | ) | |||||||||||||||||||||||
|
|
|
|
|
|
|
|
|
|
|
|
|
|
|
|
|
|||||||||||||||||||||
| Total derivative liabilities(2) |
(76 | ) | (89 | ) | (1,305 | ) | (929 | ) | (320 | ) | (497 | ) | (1,701 | ) | (1,515 | ) | ||||||||||||||||||||
|
|
|
|
|
|
|
|
|
|
|
|
|
|
|
|
|
|||||||||||||||||||||
| Net total derivatives |
$ | 2 | $ | (89 | ) | $ | (840 | ) | $ | (233 | ) | $ | (298 | ) | $ | (465 | ) | $ | (1,136 | ) | $ | (787 | ) | |||||||||||||
|
|
|
|
|
|
|
|
|
|
|
|
|
|
|
|
|
|||||||||||||||||||||
| (1) | Fair values reported are exclusive of collateral held and pledged and accrued interest. Assets and liabilities are presented without consideration of master netting agreements. Derivatives are carried on the balance sheet based on net position by counterparty under master netting agreements, and classified in other assets or other liabilities depending on whether in a net positive or negative position. |
| (2) | The following table reconciles gross positions with the impact of master netting agreements to the balance sheet classification: |
| Other Assets | Other Liabilities | |||||||||||||||
| (Dollar in millions) |
December 31, 2016 |
December 31, 2015 |
December 31, 2016 |
December 31, 2015 |
||||||||||||
| Gross position |
$ | 565 | $ | 728 | $ | (1,701 | ) | $ | (1,515 | ) | ||||||
| Impact of master netting agreements |
(31 | ) | (50 | ) | 31 | 50 | ||||||||||
|
|
|
|
|
|
|
|
|
|||||||||
| Derivative values with impact of master netting |
534 | 678 | (1,670 | ) | (1,465 | ) | ||||||||||
| Cash collateral (held) pledged |
(345 | ) | (759 | ) | 319 | 466 | ||||||||||
|
|
|
|
|
|
|
|
|
|||||||||
| Net position, as presented on the balance sheet |
$ | 189 | $ | (81 | ) | $ | (1,351 | ) | $ | (999 | ) | |||||
|
|
|
|
|
|
|
|
|
|||||||||
| (3) | “Other” includes embedded derivatives bifurcated from securitization debt as well as derivatives related to our Total Return Swap Facility. |
F-50
Table of Contents
NAVIENT CORPORATION
NOTES TO CONSOLIDATED FINANCIAL STATEMENTS (Continued)
| 7. | Derivative Financial Instruments (Continued) |
The above fair values include adjustments for counterparty credit risk for both when we are exposed to the counterparty, net of collateral postings, and when the counterparty is exposed to us, net of collateral postings. The net adjustments decreased the overall net asset positions at December 31, 2016 and 2015 by $0 and $1 million, respectively. In addition, the above fair values reflect adjustments for illiquid derivatives as indicated by a wide bid/ask spread in the interest rate indices to which the derivatives are indexed. These adjustments decreased the overall net asset positions at December 31, 2016 and 2015 by $31 million and $31 million, respectively.
| Cash Flow | Fair Value | Trading | Total | |||||||||||||||||||||||||||||
| (Dollars in billions) |
Dec. 31, 2016 |
Dec. 31, 2015 |
Dec. 31, 2016 |
Dec. 31, 2015 |
Dec. 31, 2016 |
Dec. 31, 2015 |
Dec. 31, 2016 |
Dec. 31, 2015 |
||||||||||||||||||||||||
| Notional Values: |
||||||||||||||||||||||||||||||||
| Interest rate swaps |
$ | 15.2 | $ | 9.5 | $ | 11.8 | $ | 12.6 | $ | 23.8 | $ | 33.8 | $ | 50.8 | $ | 55.9 | ||||||||||||||||
| Floor Income Contracts |
— | — | — | — | 18.5 | 35.1 | 18.5 | 35.1 | ||||||||||||||||||||||||
| Cross-currency interest rate swaps |
— | — | 8.5 | 9.1 | .3 | .3 | 8.8 | 9.4 | ||||||||||||||||||||||||
|
Other(1) |
— | — | — | — | 2.6 | 3.2 | 2.6 | 3.2 | ||||||||||||||||||||||||
|
|
|
|
|
|
|
|
|
|
|
|
|
|
|
|
|
|||||||||||||||||
| Total derivatives |
$ | 15.2 | $ | 9.5 | $ | 20.3 | $ | 21.7 | $ | 45.2 | $ | 72.4 | $ | 80.7 | $ | 103.6 | ||||||||||||||||
|
|
|
|
|
|
|
|
|
|
|
|
|
|
|
|
|
|||||||||||||||||
| (1) | “Other” includes embedded derivatives bifurcated from securitization debt, as well as derivatives related to our Total Return Swap Facility. |
F-51
Table of Contents
NAVIENT CORPORATION
NOTES TO CONSOLIDATED FINANCIAL STATEMENTS (Continued)
| 7. | Derivative Financial Instruments (Continued) |
Impact of Derivatives on Consolidated Statements of Income
| Years Ended December 31, | ||||||||||||||||||||||||||||||||||||||||||||||||
| Unrealized Gain (Loss) on Derivatives(1)(2) |
Realized Gain (Loss) on Derivatives(3) |
Unrealized Gain (Loss) on Hedged Item(1) |
Total Gain (Loss) | |||||||||||||||||||||||||||||||||||||||||||||
| (Dollars in millions) |
2016 | 2015 | 2014 | 2016 | 2015 | 2014 | 2016 | 2015 | 2014 | 2016 | 2015 | 2014 | ||||||||||||||||||||||||||||||||||||
| Fair Value Hedges: |
||||||||||||||||||||||||||||||||||||||||||||||||
| Interest rate swaps |
$ | (288 | ) | $ | (115 | ) | $ | 213 | $ | 259 | $ | 345 | $ | 389 | $ | 302 | $ | 140 | $ | (185 | ) | $ | 273 | $ | 370 | $ | 417 | |||||||||||||||||||||
| Cross-currency interest rate swaps |
(319 | ) | (794 | ) | (1,159 | ) | (86 | ) | (7 | ) | 52 | 350 | 921 | 1,264 | (55 | ) | 120 | 157 | ||||||||||||||||||||||||||||||
|
|
|
|
|
|
|
|
|
|
|
|
|
|
|
|
|
|
|
|
|
|
|
|
|
|||||||||||||||||||||||||
| Total fair value derivatives |
(607 | ) | (909 | ) | (946 | ) | 173 | 338 | 441 | 652 | 1,061 | 1,079 | 218 | 490 | 574 | |||||||||||||||||||||||||||||||||
| Cash Flow Hedges: |
||||||||||||||||||||||||||||||||||||||||||||||||
| Interest rate swaps |
— | — | — | (50 | ) | — | (3 | ) | — | — | — | (50 | ) | — | (3 | ) | ||||||||||||||||||||||||||||||||
|
|
|
|
|
|
|
|
|
|
|
|
|
|
|
|
|
|
|
|
|
|
|
|
|
|||||||||||||||||||||||||
| Total cash flow derivatives |
— | — | — | (50 | ) | — | (3 | ) | — | — | — | (50 | ) | — | (3 | ) | ||||||||||||||||||||||||||||||||
| Trading: |
||||||||||||||||||||||||||||||||||||||||||||||||
| Interest rate swaps |
(13 | ) | 61 | 54 | 42 | 42 | 46 | — | — | — | 29 | 103 | 100 | |||||||||||||||||||||||||||||||||||
| Floor Income Contracts |
297 | 557 | 633 | (246 | ) | (650 | ) | (699 | ) | — | — | — | 51 | (93 | ) | (66 | ) | |||||||||||||||||||||||||||||||
| Cross-currency interest rate swaps |
9 | 2 | (33 | ) | (4 | ) | (4 | ) | (2 | ) | — | — | — | 5 | (2 | ) | (35 | ) | ||||||||||||||||||||||||||||||
| Other |
(10 | ) | 9 | 9 | (3 | ) | (3 | ) | (2 | ) | — | — | — | (13 | ) | 6 | 7 | |||||||||||||||||||||||||||||||
|
|
|
|
|
|
|
|
|
|
|
|
|
|
|
|
|
|
|
|
|
|
|
|
|
|||||||||||||||||||||||||
| Total trading derivatives |
283 | 629 | 663 | (211 | ) | (615 | ) | (657 | ) | — | — | — | 72 | 14 | 6 | |||||||||||||||||||||||||||||||||
|
|
|
|
|
|
|
|
|
|
|
|
|
|
|
|
|
|
|
|
|
|
|
|
|
|||||||||||||||||||||||||
| Total |
(324 | ) | (280 | ) | (283 | ) | (88 | ) | (277 | ) | (219 | ) | 652 | 1,061 | 1,079 | 240 | 504 | 577 | ||||||||||||||||||||||||||||||
| Less: realized gains (losses) recorded in interest expense |
— | — | — | 123 | 338 | 438 | — | — | — | 123 | 338 | 438 | ||||||||||||||||||||||||||||||||||||
|
|
|
|
|
|
|
|
|
|
|
|
|
|
|
|
|
|
|
|
|
|
|
|
|
|||||||||||||||||||||||||
| Gains (losses) on derivative and hedging activities, net |
$ | (324 | ) | $ | (280 | ) | $ | (283 | ) | $ | (211 | ) | $ | (615 | ) | $ | (657 | ) | $ | 652 | $ | 1,061 | $ | 1,079 | $ | 117 | $ | 166 | $ | 139 | ||||||||||||||||||
|
|
|
|
|
|
|
|
|
|
|
|
|
|
|
|
|
|
|
|
|
|
|
|
|
|||||||||||||||||||||||||
| (1) | Recorded in “Gains (losses) on derivative and hedging activities, net” in the consolidated statements of income. |
| (2) | Represents ineffectiveness related to cash flow hedges. |
| (3) | For fair value and cash flow hedges, recorded in interest expense. For trading derivatives, recorded in “Gains (losses) on derivative and hedging activities, net.” |
F-52
Table of Contents
NAVIENT CORPORATION
NOTES TO CONSOLIDATED FINANCIAL STATEMENTS (Continued)
| 7. | Derivative Financial Instruments (Continued) |
Impact of Derivatives on Consolidated Statements of Changes in Stockholders’ Equity (net of tax)
| Years Ended December 31, |
||||||||||||
| (Dollars in millions) |
2016 | 2015 | 2014 | |||||||||
| Total gains (losses) on cash flow hedges |
$ | 26 | $ | (59 | ) | $ | (7 | ) | ||||
| Realized (gains) losses recognized in interest expense(1)(2)(3) |
31 | (1 | ) | 2 | ||||||||
|
|
|
|
|
|
|
|||||||
| Total change in stockholders’ equity for unrealized gains (losses) on derivatives |
$ | 57 | $ | (60 | ) | $ | (5 | ) | ||||
|
|
|
|
|
|
|
|||||||
| (1) | Amounts included in “Realized gain (loss) on derivatives” in the “Impact of Derivatives on Consolidated Statements of Income” table above. |
| (2) | Includes net settlement income/expense. |
| (3) | We expect to reclassify $1 million of after-tax net losses from accumulated other comprehensive income to earnings during the next 12 months related to amortization of terminated hedge relationships. |
Collateral
The following table details collateral held and pledged related to derivative exposure between us and our derivative counterparties.
| (Dollars in millions) |
December 31, 2016 |
December 31, 2015 |
||||||
| Collateral held: |
||||||||
| Cash (obligation to return cash collateral is recorded in short-term borrowings)(1) |
$ | 345 | $ | 759 | ||||
| Securities at fair value — corporate derivatives (not recorded in financial statements)(2) |
193 | — | ||||||
| Securities at fair value — on-balance sheet securitization derivatives (not recorded in financial statements)(3) |
230 | 301 | ||||||
|
|
|
|
|
|||||
| Total collateral held |
$ | 768 | $ | 1,060 | ||||
|
|
|
|
|
|||||
| Derivative asset at fair value including accrued interest |
$ | 689 | $ | 896 | ||||
|
|
|
|
|
|||||
| Collateral pledged to others: |
||||||||
| Cash (right to receive return of cash collateral is recorded in investments) |
$ | 319 | $ | 466 | ||||
|
|
|
|
|
|||||
| Total collateral pledged |
$ | 319 | $ | 466 | ||||
|
|
|
|
|
|||||
| Derivative liability at fair value including accrued interest and premium receivable |
$ | 1,670 | $ | 1,395 | ||||
|
|
|
|
|
|||||
| (1) | At December 31, 2016 and 2015, $0 and $2 million, respectively, were held in restricted cash accounts. |
| (2) | The Company has the ability to sell or re-pledge securities it holds as collateral. |
| (3) | The trusts do not have the ability to sell or re-pledge securities they hold as collateral. |
Our corporate derivatives contain credit contingent features. At our current unsecured credit rating, we have fully collateralized our corporate derivative liability position (including accrued interest and net of premiums receivable) of $408 million with our counterparties. Downgrades in our unsecured credit rating would not result in any additional collateral requirements, except to increase the frequency of collateral calls. Trust related derivatives do not contain credit contingent features related to our or the trusts’ credit ratings.
F-53
Table of Contents
NAVIENT CORPORATION
NOTES TO CONSOLIDATED FINANCIAL STATEMENTS (Continued)
| 8. | Other Assets |
The following table provides the detail of our other assets.
| (Dollars in millions) |
December 31, 2016 |
December 31, 2015 |
||||||
| Accrued interest receivable, net |
$ | 1,663 | $ | 1,637 | ||||
| Income tax asset, net current and deferred |
725 | 945 | ||||||
| Derivatives at fair value |
534 | 678 | ||||||
| Benefit and insurance-related investments |
488 | 491 | ||||||
| Fixed assets, net |
160 | 162 | ||||||
| Other loans, net |
148 | 70 | ||||||
| Accounts receivable |
95 | 329 | ||||||
| Other |
380 | 400 | ||||||
|
|
|
|
|
|||||
| Total |
$ | 4,193 | $ | 4,712 | ||||
|
|
|
|
|
|||||
| 9. | Stockholders’ Equity |
Common Stock
Our shareholders have authorized the issuance of 1.125 billion shares of common stock. The par value of Navient common stock is $0.01 per share. At December 31, 2016, 291 million shares were issued and outstanding and 23 million shares were unissued but encumbered for outstanding stock options, restricted stock units and dividend equivalent units for employee compensation and remaining authority for stock-based compensation plans. The stock-based compensation plans are described in “Note 11 — Stock-Based Compensation Plans and Arrangements.”
In April 2014, in connection with the Spin-Off, SLM Corporation retired 127 million shares of common stock held in treasury. This retirement decreased the balance in treasury stock by $2.3 billion, with corresponding decreases of $25 million in common stock and $2.3 billion in additional paid-in capital. There was no impact to total equity from this retirement.
Dividend and Share Repurchase Program
In 2016, we paid full-year common stock dividends of $0.64 per share, compared with $0.64 in 2015 and $0.60 in 2014.
In 2014, we repurchased 30.4 million shares of common stock for $600 million (8.3 million shares for $200 million pre-Spin-Off, and 22.1 million shares for $400 million post-Spin-Off).
In 2015, we repurchased 56.0 million shares of common stock for $945 million.
In 2016, we repurchased 59.6 million shares of common stock for $755 million, fully utilizing our share repurchase programs. In December 2016, our board of directors authorized a new $600 million share repurchase program effective January 1, 2017.
F-54
Table of Contents
NAVIENT CORPORATION
NOTES TO CONSOLIDATED FINANCIAL STATEMENTS (Continued)
| 9. | Stockholders’ Equity (Continued) |
The following table summarizes our common share repurchases and issuances.
| Years Ended December 31, | ||||||||||||
| 2016 | 2015 | 2014 | ||||||||||
| Common stock repurchased(1) |
59,625,325 | 56,043,711 | 30,432,689 | |||||||||
| Average purchase price per share |
$ | 12.68 | $ | 16.87 | $ | 19.72 | ||||||
| Shares repurchased related to employee stock-based compensation plans(2) |
3,197,355 | 2,404,328 | 4,171,342 | |||||||||
| Average purchase price per share |
$ | 13.21 | $ | 19.81 | $ | 20.91 | ||||||
| Common shares issued(3) |
5,476,010 | 4,924,021 | 7,389,962 | |||||||||
| (1) | Common shares purchased under our share repurchase program. |
| (2) | Comprises shares withheld from stock option exercises and vesting of restricted stock for employees’ tax withholding obligations and shares tendered by employees to satisfy option exercise costs. |
| (3) | Common shares issued under our various compensation and benefit plans. |
The closing price of our common stock on December 31, 2016 was $16.43.
| 10. | Earnings (Loss) per Common Share |
Basic earnings (loss) per common share (“EPS”) are calculated using the weighted average number of shares of common stock outstanding during each period. A reconciliation of the numerators and denominators of the basic and diluted EPS calculations follows.
| Years Ended December 31, | ||||||||||||
| (In millions, except per share data) |
2016 | 2015 | 2014 | |||||||||
| Numerator: |
||||||||||||
| Net income attributable to Navient Corporation |
$ | 681 | $ | 984 | $ | 1,137 | ||||||
| Preferred stock dividends |
— | — | 6 | |||||||||
|
|
|
|
|
|
|
|||||||
| Net income attributable to Navient Corporation common stock |
$ | 681 | $ | 984 | $ | 1,131 | ||||||
|
|
|
|
|
|
|
|||||||
| Denominator: |
||||||||||||
| Weighted average shares used to compute basic EPS |
316 | 376 | 417 | |||||||||
| Effect of dilutive securities: |
||||||||||||
| Dilutive effect of stock options, restricted stock, restricted stock units and Employee Stock Purchase Plan (“ESPP”)(1) |
6 | 6 | 8 | |||||||||
|
|
|
|
|
|
|
|||||||
| Dilutive potential common shares(2) |
6 | 6 | 8 | |||||||||
|
|
|
|
|
|
|
|||||||
| Weighted average shares used to compute diluted EPS |
322 | 382 | 425 | |||||||||
|
|
|
|
|
|
|
|||||||
| Basic earnings per common share attributable to Navient Corporation |
$ | 2.15 | $ | 2.62 | $ | 2.71 | ||||||
|
|
|
|
|
|
|
|||||||
| Diluted earnings per common share attributable to Navient Corporation |
$ | 2.12 | $ | 2.58 | $ | 2.66 | ||||||
|
|
|
|
|
|
|
|||||||
| (1) | Includes the potential dilutive effect of additional common shares that are issuable upon exercise of outstanding stock options, restricted stock, restricted stock units, and the outstanding commitment to issue shares under the ESPP, determined by the treasury stock method. |
| (2) | For the years ended December 31, 2016, 2015 and 2014, stock options covering approximately 4 million, 6 million and 3 million shares, respectively, were outstanding but not included in the computation of diluted earnings per share because they were anti-dilutive. |
F-55
Table of Contents
NAVIENT CORPORATION
NOTES TO CONSOLIDATED FINANCIAL STATEMENTS (Continued)
| 11. | Stock-Based Compensation Plans and Arrangements |
In connection with the Spin-Off, SLM BankCo assumed the equity incentive plans of SLM Corporation and outstanding awards granted thereunder, as well as the ESPP of SLM Corporation. Following the Spin-Off, Navient established a new equity incentive plan and a new ESPP with respect to its common stock. In order to maintain the intrinsic value of outstanding equity awards prior to the distribution, certain adjustments to the exercise price and number of awards were made. In general, holders of awards granted prior to 2014 received both adjusted SLM BankCo and new Navient equity awards, and holders of awards granted in 2014 received solely equity awards of their post-distribution employer. Outstanding stock options, restricted stock, restricted stock units and dividend equivalent units were adjusted into equity in the new companies by a specific conversion ratio per company, which was based upon the volume weighted average prices for each company leading up to the time of the separation, to keep the intrinsic value of the equity awards constant. These adjustments were accounted for as modifications to the original awards. In general, the SLM BankCo and Navient awards are subject to substantially the same terms and conditions as the original SLM Corporation awards. A comparison of the fair value of the modified awards with the fair value of the original awards immediately before the modification resulted in an immaterial amount of incremental compensation expense which was recorded immediately.
We have one active stock-based incentive plan that provides for grants of equity awards to our employees and non-employee directors in various forms including stock options, restricted stock awards, restricted stock units and performance stock units. We also maintain an ESPP. Shares issued under these plans may be either shares reacquired by us or shares that are authorized but unissued. Our Navient Corporation 2014 Omnibus Incentive Plan was effective on April 7, 2014 and 45 million shares are authorized to be issued from this plan as of December 31, 2016. Our Navient Corporation ESPP was effective on May 1, 2014 and 1 million shares are authorized to be issued from this plan as of December 31, 2016.
For most awards, expense generally is recognized ratably over the vesting period net of estimated forfeitures, unless the employee meets certain retirement eligibility criteria. For employee awards that meet retirement eligibility criteria, we record the expense generally upon grant and for employees that become retirement eligible during the vesting period, we recognize expense from the grant date to the date on which the employee becomes retirement eligible. The total stock-based compensation cost recognized in 2016, 2015 and 2014 was $26 million, $29 million and $39 million, respectively. As of December 31, 2016, there was $18 million of total unrecognized compensation expense related to unvested stock awards, which is expected to be recognized over a weighted average period of 1.7 years.
Stock Options
The exercise price of stock options equals the fair market value of our common stock on the date of grant. The maximum contractual term for stock options is 5 years for grants made since 2012, and 10 years for grants made prior to 2012. Most stock options are time-vested, with one-third vesting per year beginning with the first anniversary of the grant date.
F-56
Table of Contents
NAVIENT CORPORATION
NOTES TO CONSOLIDATED FINANCIAL STATEMENTS (Continued)
| 11. | Stock-Based Compensation Plans and Arrangements (Continued) |
The fair values of the options granted in the years ended December 31, 2016, 2015 and 2014 were estimated as of the grant date using a Black-Scholes option pricing model with the following weighted average assumptions (information for the 2014 period prior to the Spin-Off is based on stock option awards for SLM Corporation common stock):
| Years Ended December 31, | ||||||||||||||||
| 2016 | 2015 | 2014 Post-Spin-Off | 2014 Pre-Spin-Off | |||||||||||||
| Expected life of the option |
3.0 years | 2.9 years | 2.9 years | 2.9 years | ||||||||||||
| Expected volatility |
30 | % | 22 | % | 27 | % | 26 | % | ||||||||
| Risk-free interest rate |
.90 | % | .95 | % | .81 | % | .76 | % | ||||||||
| Expected dividend rate |
6.97 | % | 2.99 | % | 3.53 | % | 2.48 | % | ||||||||
| Weighted average fair value of options granted |
$ | 1.01 | $ | 2.22 | $ | 2.29 | $ | 3.48 | ||||||||
The expected life is based in general on observed historical exercise patterns of SLM Corporation’s employees pre-Spin-Off (excluding employees who transitioned to SLM Bank) and Navient’s employees post-Spin-Off. The expected volatility is based in general on implied volatility from publicly-traded options on our stock at the grant date and historical volatility of both our stock and our peer group consistent with the expected life of the option. The risk-free interest rate is based on the U.S. Treasury spot rate at the grant date consistent with the expected life of the option. The dividend yield is based on the projected annual dividend payment per share based on the dividend amount at the grant date, divided by the stock price at the grant date.
The following table summarizes Navient’s stock option activity in 2016.
| (Dollars in millions, except per share data) |
Number of Options |
Weighted Average Exercise Price per Share |
Weighted Average Remaining Contractual Term |
Aggregate Intrinsic Value(1) |
||||||||||||
| Outstanding at December 31, 2015 |
15,761,488 | $ | 14.56 | |||||||||||||
| Granted |
3,837,609 | 9.18 | ||||||||||||||
| Exercised(2) |
(2,988,087 | ) | 10.17 | |||||||||||||
| Canceled |
(1,699,006 | ) | 28.63 | |||||||||||||
|
|
|
|
|
|||||||||||||
| Outstanding at December 31, 2016(3) |
14,912,004 | 12.45 | 2.5 yrs. | $ | 76 | |||||||||||
|
|
|
|
|
|
|
|
|
|||||||||
| Exercisable at December 31, 2016 |
9,228,819 | $ | 12.27 | 1.8 yrs. | $ | 48 | ||||||||||
|
|
|
|
|
|
|
|
|
|||||||||
| (1) | The aggregate intrinsic value represents the total intrinsic value (the aggregate difference between our closing stock price on December 31, 2016 and the exercise price of in-the-money options) that would have been received by the option holders if all in-the-money options had been exercised on December 31, 2016. |
| (2) | The total intrinsic value of SLM Corporation stock options exercised during periods prior to the Spin-Off was $23 million for 2014. The total intrinsic value of Navient stock options exercised subsequent to the Spin-Off was $13 million, $19 million and $23 million for 2016, 2015 and 2014, respectively. |
| (3) | As of December 31, 2016, there was $1 million of unrecognized compensation cost related to stock options, which is expected to be recognized over a weighted average period of 1.8 years. |
Restricted Stock
Restricted stock awards generally are granted to non-employee directors and generally vest upon the director’s election to the board. Outstanding restricted stock is entitled to dividend equivalent units that vest subject to the same vesting requirements or lapse of transfer restrictions, as applicable, as the underlying restricted stock award. The fair value of restricted stock awards is based on our stock price at the grant date.
F-57
Table of Contents
NAVIENT CORPORATION
NOTES TO CONSOLIDATED FINANCIAL STATEMENTS (Continued)
| 11. | Stock-Based Compensation Plans and Arrangements (Continued) |
The following table summarizes Navient’s restricted stock activity in 2016.
| Number of Shares |
Weighted Average Grant Date Fair Value |
|||||||
| Non-vested at December 31, 2015 |
— | $ | — | |||||
| Granted |
87,144 | 9.18 | ||||||
| Vested(1) |
(76,251 | ) | 9.18 | |||||
| Canceled |
(10,893 | ) | 9.18 | |||||
|
|
|
|
|
|||||
| Non-vested at December 31, 2016(2) |
— | $ | — | |||||
|
|
|
|
|
|||||
| (1) | The total fair value of SLM Corporation shares that vested during periods prior to the Spin-Off was $1 million for 2014. The total fair value of Navient shares that vested subsequent to the Spin-Off was $1 million, $1 million and $1 million for 2016, 2015 and 2014, respectively. |
| (2) | As of December 31, 2016, there was no unrecognized compensation cost related to restricted stock. |
Restricted Stock Units and Performance Stock Units
Restricted stock units (“RSUs”) and performance stock units (“PSUs”) are equity awards granted to employees that entitle the holder to shares of our common stock when the award vests. RSUs generally are time-vested, with one-third vesting per year beginning with the first anniversary of the grant date, while PSUs vest based on achieving certain corporate performance goals over a three-year performance period. Outstanding RSUs and PSUs are entitled to dividend equivalent units that vest subject to the same vesting requirements or lapse of transfer restrictions, as applicable, as the underlying award. The fair value of RSUs and PSUs is based on our stock price at the grant date.
The following table summarizes Navient’s RSU and PSU activity in 2016.
| Number of RSUs/ PSUs |
Weighted Average Grant Date Fair Value |
|||||||
| Outstanding at December 31, 2015 |
3,672,229 | $ | 16.15 | |||||
| Granted |
2,864,435 | 9.23 | ||||||
| Vested and converted to common stock(1) |
(2,109,162 | ) | 14.30 | |||||
| Canceled |
(55,126 | ) | 12.11 | |||||
|
|
|
|
|
|||||
| Outstanding at December 31, 2016(2) |
4,372,376 | $ | 12.56 | |||||
|
|
|
|
|
|||||
| (1) | The total fair value of SLM Corporation RSUs and PSUs that vested and converted to common stock during periods prior to the Spin-Off was $35 million for 2014. The total fair value of Navient RSUs and PSUs that vested and converted to common stock subsequent to the Spin-Off was $30 million, $29 million and $1 million for 2016, 2015 and 2014, respectively. |
| (2) | As of December 31, 2016, there was $16 million of unrecognized compensation cost related to RSUs and PSUs, which is expected to be recognized over a weighted average period of 1.7 years. |
| 12. | Fair Value Measurements |
We use estimates of fair value in applying various accounting standards for our financial statements. We categorize our fair value estimates based on a hierarchical framework associated with three levels of price transparency utilized in measuring financial instruments at fair value.
F-58
Table of Contents
NAVIENT CORPORATION
NOTES TO CONSOLIDATED FINANCIAL STATEMENTS (Continued)
| 12. | Fair Value Measurements (Continued) |
Education Loans
Our FFELP Loans and Private Education Loans are accounted for at cost or at the lower of cost or market if the loan is held-for-sale. Fair values were determined by modeling loan cash flows using stated terms of the assets and internally-developed assumptions to determine aggregate portfolio yield, net present value and average life.
FFELP Loans
The significant assumptions used to determine fair value of our FFELP Loans are prepayment speeds, default rates, cost of funds, capital levels and expected Repayment Borrower Benefits to be earned. In addition, the Floor Income component of our FFELP Loan portfolio is valued with option models using both observable market inputs and internally developed inputs. A number of significant inputs into the models are internally derived and not observable to market participants. While the resulting fair value can be validated against market transactions where we are a participant, these markets are not considered active. As such, these are level 3 valuations.
Private Education Loans
The significant assumptions used to determine fair value of our Private Education Loans are prepayment speeds, default rates, recovery rates, cost of funds and capital levels. A number of significant inputs into the models are internally derived and not observable to market participants nor can the resulting fair values be validated against market transactions. While the resulting fair value can be validated against market transactions where we are a participant, these markets are not considered active. As such, these are level 3 valuations.
Cash and Investments (Including “Restricted Cash and Investments”)
Cash and cash equivalents are carried at cost. Carrying value approximates fair value. Investments classified as trading or available-for-sale are carried at fair value in the financial statements. Investments in mortgage-backed securities are valued using observable market prices. These securities are primarily collateralized by real estate properties and are guaranteed by either a government sponsored enterprise or the U.S. government. Other investments for which observable prices from active markets are not available were valued through standard bond pricing models using observable market yield curves adjusted for credit and liquidity spreads. These valuations are immaterial to the overall investment portfolio. The fair value of investments in commercial paper, asset-backed commercial paper, or demand deposits that have a remaining term of less than 90 days when purchased are estimated to equal their cost and, when needed, adjustments for liquidity and credit spreads are made depending on market conditions and counterparty credit risks. No additional adjustments were deemed necessary. These are level 2 valuations.
Borrowings
Borrowings are accounted for at cost in the financial statements except when denominated in a foreign currency or when designated as the hedged item in a fair value hedge relationship. When the hedged risk is the benchmark interest rate (which for us is LIBOR) and not full fair value, the cost basis is adjusted for changes in value due to benchmark interest rates only. Foreign currency-denominated borrowings are re-measured at current spot rates in the financial statements. The full fair value of all borrowings is disclosed. Fair value was determined through standard bond pricing models and option models (when applicable) using the stated terms of the borrowings, observable yield curves, foreign currency exchange rates, volatilities from active markets or from
F-59
Table of Contents
NAVIENT CORPORATION
NOTES TO CONSOLIDATED FINANCIAL STATEMENTS (Continued)
| 12. | Fair Value Measurements (Continued) |
quotes from broker-dealers. Fair value adjustments for unsecured corporate debt are made based on indicative quotes from observable trades and spreads on credit default swaps specific to the Company. Fair value adjustments for secured borrowings are based on indicative quotes from broker-dealers. These adjustments for both secured and unsecured borrowings are material to the overall valuation of these items and, currently, are based on inputs from inactive markets. As such, these are level 3 valuations.
Derivative Financial Instruments
All derivatives are accounted for at fair value in the financial statements. The fair value of a majority of derivative financial instruments was determined by standard derivative pricing and option models using the stated terms of the contracts and observable market inputs. In some cases, we utilized internally developed inputs that are not observable in the market, and as such, classified these instruments as level 3 fair values. Complex structured derivatives or derivatives that trade in less liquid markets require significant estimates and judgment in determining fair value that cannot be corroborated with market transactions.
When determining the fair value of derivatives, we take into account counterparty credit risk for positions where there is exposure to the counterparty on a net basis by assessing exposure net of collateral held. The net exposures for each counterparty are adjusted based on market information available for the specific counterparty, including spreads from credit default swaps. When the counterparty has exposure to us under derivatives with us, we fully collateralize the exposure, minimizing the adjustment necessary to the derivative valuations for our credit risk. While trusts that contain derivatives are not required to post collateral, when the counterparty is exposed to the trust the credit quality and securitized nature of the trusts minimizes any adjustments for the counterparty’s exposure to the trusts. The net credit risk adjustment (adjustments for our exposure to counterparties net of adjustments for the counterparties’ exposure to us) did not decrease the valuations at December 31, 2016.
Inputs specific to each class of derivatives disclosed in the table below are as follows:
| • | Interest rate swaps — Derivatives are valued using standard derivative cash flow models. Derivatives that swap fixed interest payments for LIBOR interest payments (or vice versa) and derivatives swapping quarterly reset LIBOR for daily reset LIBOR or one-month LIBOR were valued using the LIBOR swap yield curve which is an observable input from an active market. These derivatives are level 2 fair value estimates in the hierarchy. Other derivatives swapping LIBOR interest payments for another variable interest payment (primarily Prime) or swapping interest payments based on the Consumer Price Index for LIBOR interest payments are valued using the LIBOR swap yield curve and observable market spreads for the specified index. The markets for these swaps are generally illiquid as indicated by a wide bid/ask spread. The adjustment made for liquidity decreased the valuations by $31 million at December 31, 2016. These derivatives are level 3 fair value estimates. |
| • | Cross-currency interest rate swaps — Derivatives are valued using standard derivative cash flow models. Derivatives hedging foreign-denominated bonds are valued using the LIBOR swap yield curve (for both USD and the foreign-denominated currency), cross-currency basis spreads and forward foreign currency exchange rates. The derivatives are primarily British Pound Sterling and Euro denominated. These inputs are observable inputs from active markets. Therefore, the resulting valuation is a level 2 fair value estimate. Amortizing notional derivatives (derivatives whose notional amounts change based on changes in the balance of, or pool of, assets or debt) hedging trust debt use internally derived assumptions for the trust assets’ prepayment speeds and default rates to model the notional amortization. Management makes assumptions concerning the extension features of derivatives hedging rate-reset notes denominated in a foreign currency. These inputs are not market observable; therefore, these derivatives are level 3 fair value estimates. |
F-60
Table of Contents
NAVIENT CORPORATION
NOTES TO CONSOLIDATED FINANCIAL STATEMENTS (Continued)
| 12. | Fair Value Measurements (Continued) |
| • | Floor Income Contracts — Derivatives are valued using an option pricing model. Inputs to the model include the LIBOR swap yield curve and LIBOR interest rate volatilities. The inputs are observable inputs in active markets and these derivatives are level 2 fair value estimates. |
The carrying value of borrowings designated as the hedged item in a fair value hedge is adjusted for changes in fair value due to benchmark interest rates and foreign-currency exchange rates. These valuations are determined through standard bond pricing models and option models (when applicable) using the stated terms of the borrowings, and observable yield curves, foreign currency exchange rates and volatilities.
The following table summarizes the valuation of our financial instruments that are marked-to-market on a recurring basis. During 2016 and 2015, there were no significant transfers of financial instruments between levels.
| Fair Value Measurements on a Recurring Basis | ||||||||||||||||||||||||||||||||
| December 31, 2016 | December 31, 2015 | |||||||||||||||||||||||||||||||
| (Dollars in millions) |
Level 1 | Level 2 | Level 3 | Total | Level 1 | Level 2 | Level 3 | Total | ||||||||||||||||||||||||
| Assets |
||||||||||||||||||||||||||||||||
| Available-for-sale investments: |
||||||||||||||||||||||||||||||||
| Agency residential mortgage-backed securities |
$ | — | $ | 1 | $ | — | $ | 1 | $ | — | $ | 1 | $ | — | $ | 1 | ||||||||||||||||
| Other |
— | 2 | — | 2 | — | 4 | — | 4 | ||||||||||||||||||||||||
|
|
|
|
|
|
|
|
|
|
|
|
|
|
|
|
|
|||||||||||||||||
| Total available-for-sale investments |
— | 3 | — | 3 | — | 5 | — | 5 | ||||||||||||||||||||||||
| Derivative instruments:(1) |
||||||||||||||||||||||||||||||||
| Interest rate swaps |
— | 553 | 12 | 565 | — | 709 | 17 | 726 | ||||||||||||||||||||||||
| Cross-currency interest rate swaps |
— | — | — | — | — | — | 2 | 2 | ||||||||||||||||||||||||
| Other |
— | — | — | — | — | — | — | — | ||||||||||||||||||||||||
|
|
|
|
|
|
|
|
|
|
|
|
|
|
|
|
|
|||||||||||||||||
| Total derivative assets(2) |
— | 553 | 12 | 565 | — | 709 | 19 | 728 | ||||||||||||||||||||||||
|
|
|
|
|
|
|
|
|
|
|
|
|
|
|
|
|
|||||||||||||||||
| Total |
$ | — | $ | 556 | $ | 12 | $ | 568 | $ | — | $ | 714 | $ | 19 | $ | 733 | ||||||||||||||||
|
|
|
|
|
|
|
|
|
|
|
|
|
|
|
|
|
|||||||||||||||||
| Liabilities(3) |
||||||||||||||||||||||||||||||||
| Derivative instruments(1) |
||||||||||||||||||||||||||||||||
| Interest rate swaps |
$ | — | $ | (150 | ) | $ | (58 | ) | $ | (208 | ) | $ | — | $ | (99 | ) | $ | (61 | ) | $ | (160 | ) | ||||||||||
| Floor Income Contracts |
— | (184 | ) | — | (184 | ) | — | (365 | ) | — | (365 | ) | ||||||||||||||||||||
| Cross-currency interest rate swaps |
— | (53 | ) | (1,243 | ) | (1,296 | ) | — | (83 | ) | (905 | ) | (988 | ) | ||||||||||||||||||
| Other |
— | — | (13 | ) | (13 | ) | — | — | (2 | ) | (2 | ) | ||||||||||||||||||||
|
|
|
|
|
|
|
|
|
|
|
|
|
|
|
|
|
|||||||||||||||||
| Total derivative liabilities(2) |
— | (387 | ) | (1,314 | ) | (1,701 | ) | — | (547 | ) | (968 | ) | (1,515 | ) | ||||||||||||||||||
|
|
|
|
|
|
|
|
|
|
|
|
|
|
|
|
|
|||||||||||||||||
| Total |
$ | — | $ | (387 | ) | $ | (1,314 | ) | $ | (1,701 | ) | $ | — | $ | (547 | ) | $ | (968 | ) | $ | (1,515 | ) | ||||||||||
|
|
|
|
|
|
|
|
|
|
|
|
|
|
|
|
|
|||||||||||||||||
| (1) | Fair value of derivative instruments excludes accrued interest and the value of collateral. |
| (2) | See “Note 7 — Derivative Financial Instruments” for a reconciliation of gross positions without the impact of master netting agreements to the balance sheet classification. |
| (3) | Borrowings which are the hedged items in a fair value hedge relationship and which are adjusted for changes in value due to benchmark interest rates only are not carried at full fair value and are not reflected in this table. |
F-61
Table of Contents
NAVIENT CORPORATION
NOTES TO CONSOLIDATED FINANCIAL STATEMENTS (Continued)
| 12. | Fair Value Measurements (Continued) |
The following tables summarize the change in balance sheet carrying value associated with level 3 financial instruments carried at fair value on a recurring basis.
| Year Ended December 31, 2016 | ||||||||||||||||
| Derivative Instruments | ||||||||||||||||
| (Dollars in millions) |
Interest Rate Swaps |
Cross Currency Interest Rate Swaps |
Other | Total Derivative Instruments |
||||||||||||
| Balance, beginning of period |
$ | (44 | ) | $ | (903 | ) | $ | (2 | ) | $ | (949 | ) | ||||
| Total gains/(losses) (realized and unrealized): |
||||||||||||||||
| Included in earnings(1) |
3 | (428 | ) | (14 | ) | (439 | ) | |||||||||
| Included in other comprehensive income |
— | — | — | — | ||||||||||||
| Settlements |
3 | 88 | 3 | 94 | ||||||||||||
| Transfers in and/or out of level 3(2) |
(8 | ) | — | — | (8 | ) | ||||||||||
|
|
|
|
|
|
|
|
|
|||||||||
| Balance, end of period |
$ | (46 | ) | $ | (1,243 | ) | $ | (13 | ) | $ | (1,302 | ) | ||||
|
|
|
|
|
|
|
|
|
|||||||||
| Change in unrealized gains/(losses) relating to instruments still held at the reporting date(3) |
$ | 7 | $ | (340 | ) | $ | (11 | ) | $ | (344 | ) | |||||
|
|
|
|
|
|
|
|
|
|||||||||
| Year Ended December 31, 2015 | ||||||||||||||||
| Derivative Instruments | ||||||||||||||||
| (Dollars in millions) |
Interest Rate Swaps |
Cross Currency Interest Rate Swaps |
Other | Total Derivative Instruments |
||||||||||||
| Balance, beginning of period |
$ | (88 | ) | $ | (117 | ) | $ | (11 | ) | $ | (216 | ) | ||||
| Total gains/(losses) (realized and unrealized): |
||||||||||||||||
| Included in earnings(1) |
39 | (796 | ) | 6 | (751 | ) | ||||||||||
| Included in other comprehensive income |
— | — | — | — | ||||||||||||
| Settlements |
5 | 10 | 3 | 18 | ||||||||||||
| Transfers in and/or out of level 3 |
— | — | — | — | ||||||||||||
|
|
|
|
|
|
|
|
|
|||||||||
| Balance, end of period |
$ | (44 | ) | $ | (903 | ) | $ | (2 | ) | $ | (949 | ) | ||||
|
|
|
|
|
|
|
|
|
|||||||||
| Change in unrealized gains/(losses) relating to instruments still held at the reporting date(3) |
$ | 37 | $ | (783 | ) | $ | 9 | $ | (737 | ) | ||||||
|
|
|
|
|
|
|
|
|
|||||||||
F-62
Table of Contents
NAVIENT CORPORATION
NOTES TO CONSOLIDATED FINANCIAL STATEMENTS (Continued)
| 12. | Fair Value Measurements (Continued) |
| Year Ended December 31, 2014 | ||||||||||||||||
| Derivative Instruments | ||||||||||||||||
| (Dollars in millions) |
Interest Rate Swaps |
Cross Currency Interest Rate Swaps |
Other | Total Derivative Instruments |
||||||||||||
| Balance, beginning of period |
$ | (87 | ) | $ | 1,007 | $ | (21 | ) | $ | 899 | ||||||
| Total gains/(losses) (realized and unrealized): |
||||||||||||||||
| Included in earnings(1) |
1 | (1,081 | ) | 8 | (1,072 | ) | ||||||||||
| Included in other comprehensive income |
— | — | — | — | ||||||||||||
| Settlements |
(2 | ) | (43 | ) | 2 | (43 | ) | |||||||||
| Transfers in and/or out of level 3 |
— | — | — | — | ||||||||||||
|
|
|
|
|
|
|
|
|
|||||||||
| Balance, end of period |
$ | (88 | ) | $ | (117 | ) | $ | (11 | ) | $ | (216 | ) | ||||
|
|
|
|
|
|
|
|
|
|||||||||
| Change in unrealized gains/(losses) relating to instruments still held at the reporting date(3) |
$ | — | $ | (1,225 | ) | $ | 10 | $ | (1,215 | ) | ||||||
|
|
|
|
|
|
|
|
|
|||||||||
| (1) | “Included in earnings” is comprised of the following amounts recorded in the specified line item in the consolidated statements of income: |
| Years Ended December 31, | ||||||||||||
| (Dollars in millions) |
2016 | 2015 | 2014 | |||||||||
| Gains (losses) on derivative and hedging activities, net |
$ | (351 | ) | $ | (741 | ) | $ | (1,116 | ) | |||
| Interest expense |
(88 | ) | (10 | ) | 44 | |||||||
|
|
|
|
|
|
|
|||||||
| Total |
$ | (439 | ) | $ | (751 | ) | $ | (1,072 | ) | |||
|
|
|
|
|
|
|
|||||||
| (2) | Consumer Price Index/LIBOR basis swaps were transferred from level 3 to level 2 as of the beginning of the fourth quarter of 2016 due to the conclusion that these swaps now trade in an active market. |
| (3) | Recorded in “gains (losses) on derivative and hedging activities, net” in the consolidated statements of income. |
The following table presents the significant inputs that are unobservable or from inactive markets used in the recurring valuations of the level 3 financial instruments detailed above.
| (Dollars in millions) |
Fair Value at December 31, 2016 |
Valuation Technique |
Input | Range (Weighted Average) |
||||||||||||
| Derivatives |
||||||||||||||||
| Prime/LIBOR basis swaps |
$ | (46 | ) | Discounted cash flow | Constant Prepayment Rate | 4.9% | ||||||||||
| |
Bid/ask adjustment to discount rate |
|
|
.05% — .05% (.05%) |
| |||||||||||
| Cross-currency interest rate swaps |
(1,243 | ) | Discounted cash flow | Constant Prepayment Rate | 3.3% | |||||||||||
| Other |
(13 | ) | ||||||||||||||
|
|
|
|||||||||||||||
| Total |
$ | (1,302 | ) | |||||||||||||
|
|
|
|||||||||||||||
The significant inputs that are unobservable or from inactive markets related to our level 3 derivatives detailed in the table above would be expected to have the following impacts to the valuations:
| • | Prime/LIBOR basis swaps — These swaps do not actively trade in the markets as indicated by a wide bid/ask spread. A wider bid/ask spread will result in a decrease in the overall valuation. In addition, the unobservable inputs include Constant Prepayment Rates of the underlying securitization trust the swap |
F-63
Table of Contents
NAVIENT CORPORATION
NOTES TO CONSOLIDATED FINANCIAL STATEMENTS (Continued)
| 12. | Fair Value Measurements (Continued) |
| references. A decrease in this input will result in a longer weighted average life of the swap which will increase the value for swaps in a gain position and decrease the value for swaps in a loss position, everything else equal. The opposite is true for an increase in the input. |
| • | Cross-currency interest rate swaps — The unobservable inputs used in these valuations are Constant Prepayment Rates of the underlying securitization trust the swap references. A decrease in this input will result in a longer weighted average life of the swap. All else equal in a typical currency market, this will result in a decrease to the valuation due to the delay in the cash flows of the currency exchanges as well as diminished liquidity in the forward exchange markets as you increase the term. The opposite is true for an increase in the input. |
The following table summarizes the fair values of our financial assets and liabilities, including derivative financial instruments.
| December 31, 2016 | December 31, 2015 | |||||||||||||||||||||||
| (Dollars in millions) |
Fair Value |
Carrying Value |
Difference | Fair Value |
Carrying Value |
Difference | ||||||||||||||||||
| Earning assets |
||||||||||||||||||||||||
| FFELP Loans |
$ | 86,626 | $ | 87,730 | $ | (1,104 | ) | $ | 94,281 | $ | 96,402 | $ | (2,121 | ) | ||||||||||
| Private Education Loans |
23,191 | 23,340 | (149 | ) | 25,772 | 26,394 | (622 | ) | ||||||||||||||||
| Cash and investments(1) |
5,203 | 5,203 | — | 5,833 | 5,833 | — | ||||||||||||||||||
|
|
|
|
|
|
|
|
|
|
|
|
|
|||||||||||||
| Total earning assets |
115,020 | 116,273 | (1,253 | ) | 125,886 | 128,629 | (2,743 | ) | ||||||||||||||||
|
|
|
|
|
|
|
|
|
|
|
|
|
|||||||||||||
| Interest-bearing liabilities |
||||||||||||||||||||||||
| Short-term borrowings |
2,346 | 2,334 | (12 | ) | 2,569 | 2,570 | 1 | |||||||||||||||||
| Long-term borrowings |
109,826 | 112,368 | 2,542 | 118,471 | 124,833 | 6,362 | ||||||||||||||||||
|
|
|
|
|
|
|
|
|
|
|
|
|
|||||||||||||
| Total interest-bearing liabilities |
112,172 | 114,702 | 2,530 | 121,040 | 127,403 | 6,363 | ||||||||||||||||||
|
|
|
|
|
|
|
|
|
|
|
|
|
|||||||||||||
| Derivative financial instruments |
||||||||||||||||||||||||
| Floor Income Contracts |
(184 | ) | (184 | ) | — | (365 | ) | (365 | ) | — | ||||||||||||||
| Interest rate swaps |
357 | 357 | — | 566 | 566 | — | ||||||||||||||||||
| Cross-currency interest rate swaps |
(1,296 | ) | (1,296 | ) | — | (986 | ) | (986 | ) | — | ||||||||||||||
| Other |
(13 | ) | (13 | ) | — | (2 | ) | (2 | ) | — | ||||||||||||||
|
|
|
|
|
|||||||||||||||||||||
| Excess of net asset fair value over carrying value |
$ | 1,277 | $ | 3,620 | ||||||||||||||||||||
|
|
|
|
|
|||||||||||||||||||||
| (1) | “Cash and investments” includes available-for-sale investments whose cost basis is $3 million and $4 million at December 31, 2016 and 2015, respectively, versus a fair value of $3 million and $5 million at December 31, 2016 and 2015, respectively. |
| 13. | Commitments, Contingencies and Guarantees |
Legal Proceedings
The Company has been named as defendant in a number of putative class action cases alleging violations of various state and federal consumer protection laws. One of these putative class action suits is Randy Johnson v. Navient Solutions, Inc. On May 4, 2015, Randy Johnson filed a putative class action in the United States District Court for the Southern District of Indiana alleging violations of the Telephone Consumer Protection Act (“TCPA”). During the fourth quarter of 2016, the parties entered into a settlement agreement and on December 23, 2016, filed a Motion to Approve the Class Action Settlement with the Court. The Court preliminarily approved the settlement on January 26, 2017. We have denied all claims asserted against the Company, but agreed to settle the case to avoid the burden, expense, risk and uncertainty of continued litigation. A reserve has been established for this matter as of December 31, 2016.
F-64
Table of Contents
NAVIENT CORPORATION
NOTES TO CONSOLIDATED FINANCIAL STATEMENTS (Continued)
| 13. | Commitments, Contingencies and Guarantees (Continued) |
On January 18, 2017, the CFPB and Attorneys General for the State of Illinois and the State of Washington (collectively the “Attorneys General”) initiated civil actions naming Navient Corporation and several of its subsidiaries as defendants alleging violations of Federal and State consumer protection statutes, including the Consumer Financial Protection Act of 2010, the Fair Credit Reporting Act, the Fair Debt Collection Practices Act and various State consumer protection laws. For additional information on these civil actions, please refer to section entitled “Regulatory Matters” below.
Regulatory Matters
On May 2, 2014, Navient Solutions, Inc., now known as Navient Solutions, LLC (“Solutions”), a wholly-owned subsidiary of Navient, and Sallie Mae Bank entered into consent orders, without admitting any wrongdoing, with the Federal Deposit Insurance Corporation (the “FDIC”) (respectively, the “Solutions Order” and the “Bank Order”; collectively, the “FDIC Orders”) to settle matters related to certain cited violations of Section 5 of the Federal Trade Commission Act, including the disclosures and assessments of certain late fees, as well as alleged violations under the Servicemembers Civil Relief Act (the “SCRA”). The FDIC Orders, which became effective upon the signing of the consent order with the United States Department of Justice (the “DOJ”) by Solutions and SLM BankCo on May 13, 2014, required Solutions to pay $3.3 million in civil monetary penalties. Solutions paid its civil monetary penalties. In addition, the FDIC Orders required the establishment of a restitution reserve account totaling $30 million to provide restitution with respect to loans owned or originated by Sallie Mae Bank, from November 28, 2005 until the effective date of the FDIC Orders. Pursuant to the Separation and Distribution Agreement among SLM Corporation, SLM BankCo and Navient dated as of April 28, 2014 (the “Separation Agreement”), Navient funded the restitution reserve account in May 2014. While the FDIC issued its final exam report in December 2016, we are unable at this point in time to predict the timing of when the FDIC will lift the consent order.
The Solutions Order also required Solutions to ensure proper servicing for service members and proper application of SCRA benefits under a revised and broader definition of eligibility than previously required by the statute and regulatory guidance and to make changes to billing statements and late fee practices. These changes to billing statements and late fee practices have already been implemented. Solutions also decided to voluntarily make restitution of certain late fees to all other customers whose loans were neither owned nor originated by Sallie Mae Bank. They were calculated in the same manner as that which was required under the FDIC Orders and are estimated to be $42 million. The process to refund these fees as well as distribute amounts from the restitution fund is complete.
With respect to alleged civil violations of the SCRA, Solutions and Sallie Mae Bank entered into a consent order with the DOJ in May 2014. The DOJ consent order (the “DOJ Order”) covers all loans either owned by Sallie Mae Bank or serviced by Solutions from November 28, 2005 until the effective date of the settlement. The DOJ Order required Solutions to fund a $60 million settlement fund, which represents the total amount of compensation due to service members under the DOJ agreement, and to pay $55,000 in civil penalties. The DOJ Order was approved by the United States District Court in Delaware on September 29, 2014 and has a term of four years. Shortly thereafter, Navient funded the settlement fund and paid the civil money penalties pursuant to the terms of the order. The funds were disbursed beginning in the second quarter of 2015. In the third quarter of 2016, the Company completed the distributions from the fund by distributing the remaining funds to charities approved by the DOJ.
The total reserves established by the Company in 2013 and 2014 to cover these costs were $177 million, and as of December 31, 2016, substantially all of this amount had been paid or credited or refunded to customer accounts. The final cost of these proceedings will remain uncertain until all of the work under the various consent orders has been completed and the consent orders are lifted.
F-65
Table of Contents
NAVIENT CORPORATION
NOTES TO CONSOLIDATED FINANCIAL STATEMENTS (Continued)
| 13. | Commitments, Contingencies and Guarantees (Continued) |
As previously disclosed, the Company and various of its subsidiaries have been subject to the following investigations and inquiries:
| • | In December 2013, Navient received Civil Investigative Demands (“CIDs”) issued by the State of Illinois Office of Attorney General and the State of Washington Office of the Attorney General and multiple other state Attorneys General. According to the CIDs, the investigations were initiated to ascertain whether any practices declared to be unlawful under the Consumer Fraud and Deceptive Business Practices Act have occurred or are about to occur. |
| • | In April 2014, Solutions received a CID from the Consumer Financial Protection Bureau (the “CFPB”) as part of the CFPB’s separate investigation regarding allegations relating to Navient’s disclosures and assessment of late fees and other matters. Navient has received a series of supplemental CIDs on these matters. On August 19, 2015, Solutions received a letter from the CFPB notifying Solutions that, in accordance with the CFPB’s discretionary Notice and Opportunity to Respond and Advise (“NORA”) process, the CFPB’s Office of Enforcement is considering recommending that the CFPB take legal action against Solutions. The NORA letter relates to a previously disclosed investigation into Solutions’ disclosures and assessment of late fees and other matters and states that, in connection with any action, the CFPB may seek restitution, civil monetary penalties and corrective action against Solutions. The Company responded to the NORA letter on September 10, 2015. |
| • | In November 2014, Navient’s subsidiary, Pioneer Credit Recovery, Inc. (“Pioneer”), received a CID from the CFPB as part of the CFPB’s investigation regarding Pioneer’s activities relating to rehabilitation loans and collection of defaulted student debt. The CFPB has informed the Company that they have combined this matter with the aforementioned servicing matter. |
| • | In December 2014, Solutions received a subpoena from the New York Department of Financial Services (the “NY DFS”) as part of the NY DFS’s inquiry with regard to whether persons or entities have engaged in fraud or misconduct with respect to a financial product or service under New York Financial Services Law or other laws. |
On January 18, 2017, the CFPB and Attorneys General for the State of Illinois and the State of Washington (collectively the “Attorneys General”) initiated civil actions naming Navient Corporation (the “Company”) and several of its subsidiaries as defendants alleging violations of Federal and State consumer protection statutes, including the Consumer Financial Protection Act of 2010, the Fair Credit Reporting Act, the Fair Debt Collection Practices Act and various state consumer protection laws. These civil actions are related to the aforementioned CIDs and the NORA letter that were previously issued by the CFPB and the Attorneys General. In addition to these matters, a number of lawsuits have been or may be filed by additional governmental or nongovernmental parties seeking damages or other remedies related to similar issues raised by the CFPB and the Attorneys General. As the Company has previously stated, we believe the suit improperly seeks to impose penalties on Navient based on new servicing standards applied retroactively and applied only against one servicer and that the allegations are false. We intend to vigorously defend against the allegations. At this point in time, the Company is unable to anticipate the timing of a resolution or the ultimate impact that these legal proceedings may have on the Company’s consolidated financial position, liquidity, results of operation or cash flows. As a result, it is not possible at this time to estimate a range of potential exposure, if any, for amounts that may be payable in connection with these matters and reserves have not been established. It is possible that an adverse ruling or rulings may have a material adverse impact on the Company.
In addition, Navient and its subsidiaries are subject to examination or regulation by the SEC, CFPB, FDIC, ED and various state agencies as part of its ordinary course of business. Items or matters similar to or different from those described above may arise during the course of those examinations. We also routinely receive inquiries or requests from various regulatory entities or bodies or government agencies concerning our business or our assets. The Company endeavors to cooperate with each such inquiry or request.
F-66
Table of Contents
NAVIENT CORPORATION
NOTES TO CONSOLIDATED FINANCIAL STATEMENTS (Continued)
| 13. | Commitments, Contingencies and Guarantees (Continued) |
Under the terms of the Separation Agreement, Navient has agreed to indemnify SLM BankCo for all claims, actions, damages, losses or expenses that may arise from the conduct of all activities of pre-Spin-Off SLM BankCo occurring prior to the Spin-Off other than those specifically excluded in the Separation and Distribution Agreement. As a result, liabilities arising out of the regulatory matters and CFPB and State Attorneys General lawsuits mentioned above, other than fines or penalties directly levied against Sallie Mae Bank and other matters specifically excluded, are the responsibility of, or assumed by, Navient or one of its subsidiaries, and Navient has agreed to indemnify and hold harmless Sallie Mae and its subsidiaries, including Sallie Mae Bank, therefrom. Navient has no additional reserves related to indemnification matters with SLM BankCo as of December 31, 2016.
OIG Audit
The Office of the Inspector General (the “OIG”) of ED commenced an audit regarding Special Allowance Payments (“SAP”) on September 10, 2007. On September 25, 2013, we received the final audit determination of Federal Student Aid (the “Final Audit Determination”) on the final audit report issued by the OIG on August 3, 2009 related to this audit. The Final Audit Determination concurred with the final audit report issued by the OIG and instructed us to make adjustment to our government billing to reflect the policy determination. In August 2016, we filed our notice of appeal relating to this Final Audit Determination to the Administrative Actions and Appeals Service Group of ED. This matter remains open. We continue to believe that our SAP billing practices were proper, considering then-existing ED guidance and lack of applicable regulations. The Company established a reserve for this matter in 2014 as part of the total reserve for pending regulatory matters discussed previously and does not believe, at this time, that an adverse ruling would have a material effect on the Company as a whole.
Contingencies
In the ordinary course of business, we and our subsidiaries are defendants in or parties to pending and threatened legal actions and proceedings including actions brought on behalf of various classes of claimants. These actions and proceedings may be based on alleged violations of consumer protection, securities, employment and other laws. In certain of these actions and proceedings, claims for substantial monetary damage are asserted against us and our subsidiaries.
In the ordinary course of business, we and our subsidiaries are subject to regulatory examinations, information gathering requests, inquiries and investigations. In connection with formal and informal inquiries in these cases, we and our subsidiaries receive numerous requests, subpoenas and orders for documents, testimony and information in connection with various aspects of our regulated activities.
In view of the inherent difficulty of predicting the outcome of such litigation and regulatory matters, we cannot predict what the eventual outcome of the pending matters will be, what the timing or the ultimate resolution of these matters will be, or what the eventual loss, fines or penalties related to each pending matter may be.
We are required to establish reserves for litigation and regulatory matters where those matters present loss contingencies that are both probable and estimable. When loss contingencies are not both probable and estimable, we do not establish reserves.
Based on current knowledge, reserves have been established for certain litigation or regulatory matters where the loss is both probable and estimable. Based on current knowledge, management does not believe that loss contingencies, if any, arising from pending investigations, litigation or regulatory matters will have a material adverse effect on our consolidated financial position, liquidity, results of operations or cash flows, except as otherwise disclosed.
F-67
Table of Contents
NAVIENT CORPORATION
NOTES TO CONSOLIDATED FINANCIAL STATEMENTS (Continued)
| 14. | Income Taxes |
Reconciliations of the statutory U.S. federal income tax rates to our effective tax rate for continuing operations follow:
| Years Ended December 31, | ||||||||||||
| 2016 | 2015 | 2014 | ||||||||||
| Statutory rate |
35.0 | % | 35.0 | % | 35.0 | % | ||||||
| State tax, net of federal benefit |
3.8 | 2.6 | 2.0 | |||||||||
| Other, net |
(.3 | ) | .1 | .5 | ||||||||
|
|
|
|
|
|
|
|||||||
| Effective tax rate |
38.5 | % | 37.7 | % | 37.5 | % | ||||||
|
|
|
|
|
|
|
|||||||
The effective tax rate varies from the statutory U.S. federal rate of 35 percent primarily due to the impact of state taxes, net of federal benefit.
Income tax expense consists of:
| December 31, | ||||||||||||
| (Dollars in millions) |
2016 | 2015 | 2014 | |||||||||
| Current provision/(benefit): |
||||||||||||
| Federal |
$ | 246 | $ | 136 | $ | 440 | ||||||
| State |
47 | 22 | 41 | |||||||||
| Foreign |
1 | — | — | |||||||||
|
|
|
|
|
|
|
|||||||
| Total current provision/(benefit) |
294 | 158 | 481 | |||||||||
| Deferred provision/(benefit): |
||||||||||||
| Federal |
115 | 398 | 186 | |||||||||
| State |
18 | 41 | 14 | |||||||||
| Foreign |
— | — | — | |||||||||
|
|
|
|
|
|
|
|||||||
| Total deferred provision/(benefit) |
133 | 439 | 200 | |||||||||
|
|
|
|
|
|
|
|||||||
| Provision for income tax expense/(benefit) |
$ | 427 | $ | 597 | $ | 681 | ||||||
|
|
|
|
|
|
|
|||||||
The tax effect of temporary differences that give rise to deferred tax assets and liabilities include the following:
| December 31, | ||||||||
| (Dollars in millions) |
2016 | 2015 | ||||||
| Deferred tax assets: |
||||||||
| Loan reserves |
$ | 581 | $ | 648 | ||||
| Education loan premiums and discounts, net |
74 | 95 | ||||||
| Market value adjustments on education loans, investments and derivatives |
65 | 126 | ||||||
| Deferred revenue |
37 | 46 | ||||||
| Accrued expenses not currently deductible |
33 | 24 | ||||||
| Stock-based compensation plans |
32 | 43 | ||||||
| Unrealized derivative and investment gains and losses, net |
— | 30 | ||||||
| Other |
45 | 29 | ||||||
|
|
|
|
|
|||||
| Total deferred tax assets |
867 | 1,041 | ||||||
|
|
|
|
|
|||||
| Deferred tax liabilities: |
||||||||
| Original issue discount on borrowings |
27 | 23 | ||||||
| Other |
38 | 46 | ||||||
|
|
|
|
|
|||||
| Total deferred tax liabilities |
65 | 69 | ||||||
|
|
|
|
|
|||||
| Net deferred tax assets |
$ | 802 | $ | 972 | ||||
|
|
|
|
|
|||||
F-68
Table of Contents
NAVIENT CORPORATION
NOTES TO CONSOLIDATED FINANCIAL STATEMENTS (Continued)
| 14. | Income Taxes (Continued) |
Included in other deferred tax assets is a valuation allowance of $7 million and $7 million as of December 31, 2016 and 2015, respectively, against a portion of the Company’s federal and state deferred tax assets. The valuation allowance is primarily attributable to deferred tax assets for state net operating loss carryforwards that management believes it is more likely than not will expire prior to being realized. The ultimate realization of the deferred tax assets is dependent upon the generation of future taxable income of the appropriate character (i.e. capital or ordinary) during the period in which the temporary differences become deductible. Management considers, among other things, the economic slowdown, the scheduled reversals of deferred tax liabilities, and the history of positive taxable income available for net operating loss carrybacks in evaluating the realizability of the deferred tax assets.
As of December 31, 2016, we have apportioned state net operating loss carryforwards of $204 million which begin to expire in 2022.
Accounting for Uncertainty in Income Taxes
The following table summarizes changes in unrecognized tax benefits:
| December 31, | ||||||||||||
| (Dollars in millions) |
2016 | 2015 | 2014 | |||||||||
| Unrecognized tax benefits at beginning of year |
$ | 56.3 | $ | 51.9 | $ | 56.0 | ||||||
| Increases resulting from tax positions taken during a prior period |
19.9 | 1.6 | 1.0 | |||||||||
| Decreases resulting from tax positions taken during a prior period |
(5.6 | ) | (1.8 | ) | (12.4 | ) | ||||||
| Increases resulting from tax positions taken during the current period |
4.4 | 6.9 | 8.4 | |||||||||
| Decreases related to settlements with taxing authorities |
(.1 | ) | — | (.6 | ) | |||||||
| Increases related to settlements with taxing authorities |
— | — | — | |||||||||
| Reductions related to the lapse of statute of limitations |
(1.9 | ) | (2.3 | ) | (.5 | ) | ||||||
|
|
|
|
|
|
|
|||||||
| Unrecognized tax benefits at end of year |
$ | 73.0 | $ | 56.3 | $ | 51.9 | ||||||
|
|
|
|
|
|
|
|||||||
As of December 31, 2016, the gross unrecognized tax benefits are $73.0 million. Included in the $73.0 million are $45.5 million of unrecognized tax benefits that, if recognized, would favorably impact the effective tax rate.
The Company or one of its subsidiaries files income tax returns at the U.S. federal level, in most U.S. states, and various foreign jurisdictions. All periods prior to 2013 are closed for federal examination purposes. Various combinations of subsidiaries, tax years, and jurisdictions remain open for review, subject to statute of limitations periods (typically 3 to 4 prior years). We do not expect the resolution of open audits to have a material impact on our unrecognized tax benefits.
| 15. | Segment Reporting |
We monitor and assess our ongoing operations and results by three primary operating segments — the FFELP Loans operating segment, the Private Education Loans operating segment and the Business Services operating segment. These three operating segments meet the quantitative thresholds for reportable segments. Accordingly, the results of operations of our FFELP Loans, Private Education Loans and Business Services segments are presented separately. We have smaller operating segments that consist of business operations that are winding down. These operating segments do not meet the quantitative thresholds to be considered reportable segments. As a result, the results of operations for these operating segments are combined with gains/losses from
F-69
Table of Contents
NAVIENT CORPORATION
NOTES TO CONSOLIDATED FINANCIAL STATEMENTS (Continued)
| 15. | Segment Reporting (Continued) |
the repurchase of debt, the financial results of our corporate liquidity portfolio, unallocated overhead and regulatory-related costs within the Other reportable segment. The management reporting process measures the performance of our operating segments based on our management structure, as well as the methodology we used to evaluate performance and allocate resources. Management, including our chief operating decision makers, evaluates the performance of our operating segments based on their profitability. As discussed further below, we measure the profitability of our operating segments based on “Core Earnings.” Accordingly, information regarding our reportable segments is provided based on a “Core Earnings” basis.
FFELP Loans Segment
In the FFELP Loans segment, we acquire and finance FFELP Loans. Although FFELP Loans are no longer originated, we continue to pursue acquisitions of FFELP Loan portfolios. These acquisitions leverage our servicing scale and generate incremental earnings and cash flow. In this segment, we generate revenue primarily through net interest income on the FFELP Loan portfolio (after provision for loan losses). This segment is expected to generate significant amounts of earnings and cash flow as the portfolio amortizes.
We are currently the largest holder of FFELP Loans. Navient’s portfolio of FFELP Loans as of December 31, 2016 was $87.7 billion and we anticipate that this FFELP Loan portfolio will have an amortization period in excess of 20 years and a 7-year remaining weighted average life. Navient’s goal is to maximize and optimize the timing of the cash flows generated by its FFELP Loan portfolio. Navient also seeks to acquire FFELP Loan portfolios from third parties to add net interest income and servicing revenue. During the year ended December 31, 2016, Navient acquired $3.5 billion of FFELP Loans. FFELP Loans are insured or guaranteed by state or not-for-profit agencies and are protected by contractual rights to recovery from the United States pursuant to guaranty agreements among ED and these agencies. These guaranty agreements generally cover at least 97 percent of a FFELP Loan’s principal and accrued interest for loans disbursed. For more discussion of the FFELP and related credit support mechanisms, see Appendix A “Description of Federal Family Education Loan Program.”
As a result of the long-term funding strategy used for our FFELP Loan portfolio and the insurance and guarantees provided on these loans, the portfolio generates consistent and predictable cash flows. As of December 31, 2016, approximately 81 percent of the FFELP Loans held by Navient were funded to term with non-recourse, long-term securitization debt.
The Higher Education Act of 1965 (“HEA”) continues to regulate every aspect of FFELP Loans, including ongoing communications with borrowers and default aversion requirements. Failure to service FFELP Loans properly could jeopardize the insurance, guarantees and federal support on these loans. The insurance and guarantees on Navient’s existing FFELP Loans were not affected by the termination of FFELP originations.
The following table includes asset information for our FFELP Loans segment.
| December 31, | ||||||||
| (Dollars in millions) |
2016 | 2015 | ||||||
| FFELP Loans, net |
$ | 87,730 | $ | 96,402 | ||||
| Cash and investments(1) |
3,212 | 3,572 | ||||||
| Other |
1,907 | 2,045 | ||||||
|
|
|
|
|
|||||
| Total assets |
$ | 92,849 | $ | 102,019 | ||||
|
|
|
|
|
|||||
| (1) | Includes restricted cash and investments. |
F-70
Table of Contents
NAVIENT CORPORATION
NOTES TO CONSOLIDATED FINANCIAL STATEMENTS (Continued)
| 15. | Segment Reporting (Continued) |
Private Education Loans Segment
In this segment, we acquire, finance, and service our Private Education Loans. Private Education Loans primarily bridge the gap between the cost of higher education and the amount funded through financial aid, federal loans. or students’ and families’ resources. They also allow borrowers to refinance existing education loans at a lower rate. We pursue acquisitions of Private Education Loan portfolios. These acquisitions leverage our servicing scale and generate incremental earnings and cash flow. In this segment, we generate revenue primarily through net interest income on the Private Education Loan portfolio (after provision for loan losses). This segment is expected to generate significant amounts of earnings and cash flow as the portfolio amortizes.
We are currently the largest holder of Private Education Loans. Navient’s portfolio of Private Education Loans as of December 31, 2016 was $23.3 billion and we anticipate that this Private Education Loan portfolio will have an amortization period in excess of 20 years and a 6-year remaining weighted average life. Navient’s goal is to maximize and optimize the timing of the cash flows generated by its Private Education Loan portfolio. As of December 31, 2016, approximately 61 percent of the Private Education Loans held by Navient were funded to term with non-recourse, long-term securitization debt.
Unlike FFELP Loans, the holder of a Private Education Loan bears the full credit risk of the borrower and any cosigner. Navient believes the credit risk of the Private Education Loans it owns is well managed through the rigorous underwriting practices and risk-based pricing applied when the loans were originated, the continued high levels of qualified cosigners, our internal servicing and risk mitigation practices, and our careful use of forbearance and loan modification programs. Navient believes that these elements and practices reduce the risk of payment interruptions and defaults on its Private Education Loan portfolio.
The following table includes asset information for our Private Education Loans segment.
| December 31, | ||||||||
| (Dollars in millions) |
2016 | 2015 | ||||||
| Private Education Loans, net |
$ | 23,340 | $ | 26,394 | ||||
| Cash and investments(1) |
667 | 596 | ||||||
| Other |
1,567 | 1,988 | ||||||
|
|
|
|
|
|||||
| Total assets |
$ | 25,574 | $ | 28,978 | ||||
|
|
|
|
|
|||||
| (1) | Includes restricted cash and investments. |
Business Services Segment
Our Business Services segment generates revenue from business processing services related to servicing, asset recovery and other business processing activities. Within this segment, we generate revenue primarily through servicing our FFELP Loan portfolio as well as servicing education loans for Guarantors of FFELP Loans and other institutions, including ED. We provide asset recovery services for loans and receivables on behalf of Guarantors of FFELP Loans and higher education institutions. In addition, we provide asset recovery and other business processing services for federal, state, court, and municipal clients, public authorities, and health care organizations.
We provide business processing services for over 1,000 clients, working with a broad spectrum of services and asset classes. This market is highly fragmented and provides attractive organic growth opportunities. As of December 31, 2016, Navient had an outstanding inventory of asset recovery receivables of approximately
F-71
Table of Contents
NAVIENT CORPORATION
NOTES TO CONSOLIDATED FINANCIAL STATEMENTS (Continued)
| 15. | Segment Reporting (Continued) |
$20.0 billion, of which $10.1 billion was attributable to asset classes unrelated to education loans. Non-education related asset recovery revenues increased 77 percent, from $99 million in 2015 to $174 million in 2016.
Federal Education Loan Related Revenues
In 2016, federal education loan (FFELP and ED) related revenues in the Business Services segment accounted for 80 percent of total Business Services segment revenues compared with 87 percent in 2015. Total Business Services segment revenues were $1.01 billion for the year ended December 31, 2016, compared to $1.02 billion for the year ended December 31, 2015.
Navient is currently the largest servicer and collector of loans made under the FFELP program, and the majority of our income has been derived, directly or indirectly, from our portfolio of FFELP Loans and the servicing and asset recovery we have provided for Guarantors and third-party owners of FFELP Loans. In 2010, Congress passed legislation ending the origination of education loans under FFELP. The terms and conditions of existing FFELP Loans were not affected by this legislation. We anticipate that the revenue we earn from providing servicing and asset recovery services on FFELP Loans will decline over time.
| • | Servicing revenues from the FFELP Loans we own represent intercompany charges to the FFELP Loans segment at rates paid to us by the securitization trusts which own the loans. These fees are contractually the first payment priority of the trusts after the payment of the trustee fees and exceed the actual cost of servicing the loans. Intercompany loan servicing revenues declined to $389 million in 2016 from $427 million in 2015. Intercompany loan servicing revenues will continue to decline as our FFELP Loan portfolio amortizes. |
| • | In 2016, we earned account maintenance fees on FFELP Loans serviced for Guarantors of $21 million, down from $33 million in 2015. These fees will continue to decline as the underlying FFELP Loan portfolio serviced for Guarantors amortizes. |
| • | As of December 31, 2016, we provide asset recovery (default aversion, post-default collections and claims processing) to 11 of the 26 Guarantor agencies that serve as intermediaries between the U.S. federal government and FFELP lenders and are responsible for paying the claims made on defaulted loans. In 2016, asset recovery revenue from Guarantor clients totaled $194 million, compared to $209 million the prior year. As FFELP Loans are no longer originated, these revenues will decline over time unless we add additional Guarantor clients. The rate at which these revenues will decrease has also been affected by the Bipartisan Budget Act (the “Budget Act”) enacted on December 26, 2013 and effective on July 1, 2014, which reduced the amount to be paid to Guarantor agencies for assisting customers to rehabilitate their defaulted FFELP Loans under Section 428F of the HEA. This aspect of the Budget Act reduced our revenue by approximately $79 million in 2015 compared to 2014. |
Since 2009 when we were selected through a competitive bidding process, Navient has been one of four TIVAS that provides loan servicing for federal loans owned by ED. This contract has been extended through 2019. Under the terms of the contract extension, the allocation of new borrower volume is determined twice each year based on the relative performance of the servicers on five metrics: borrowers in current repayment status (30 percent), borrowers more than 90 but less than 271 days delinquent (15 percent), borrowers 271 days or more but less than 360 days delinquent (15 percent), a survey of borrowers (35 percent), and a survey of ED personnel (5 percent). Under this servicing contract as of December 31, 2016, we service approximately 6.2 million accounts or $197.0 billion in loans. We earned $151 million of revenue under the contract for the year ended December 31, 2016. We continually strive to help our customers succeed and seek to improve on the performance metrics that determine the allocation of new accounts under the servicing contract with ED.
F-72
Table of Contents
NAVIENT CORPORATION
NOTES TO CONSOLIDATED FINANCIAL STATEMENTS (Continued)
| 15. | Segment Reporting (Continued) |
On April 4, 2016, ED published the first part of a two-part RFP related to a new servicing platform for the Direct Student Loan Program. The first part of the RFP focused on screening candidates’ capabilities relative to certain published criteria. In July 2016, Navient was selected as one of three companies eligible to submit responses in the second part of the RFP process. On October 26, 2016, ED published the second part of the RFP. On January 9, 2017, Navient submitted its bid for ED’s single servicing solution contract. We have been informed that one of the two other bidders filed a bid protest in relation to this RFP on January 5, 2017.
At December 31, 2016 and 2015, the Business Services segment had total assets of $587 million and $657 million, respectively.
Other Segment
Our Other segment primarily consists of activities of our holding company, including the repurchase of debt, our corporate liquidity portfolio, unallocated overhead and regulatory-related costs. We also include results from certain smaller wind-down operations within this segment.
At December 31, 2016 and 2015, the Other segment had total assets of $2.1 billion and $2.4 billion, respectively.
Measure of Profitability
We prepare financial statements and present financial results in accordance with GAAP. However, we also evaluate our business segments and present financial results on a basis that differs from GAAP. We refer to this different basis of presentation as “Core Earnings.” We provide this “Core Earnings” basis of presentation on a consolidated basis for each business segment because this is what we review internally when making management decisions regarding our performance and how we allocate resources. We also refer to this information in our presentations with credit rating agencies, lenders and investors. Because our “Core Earnings” basis of presentation corresponds to our segment financial presentations, we are required by GAAP to provide “Core Earnings” disclosure in the notes to our consolidated financial statements for our business segments.
F-73
Table of Contents
NAVIENT CORPORATION
NOTES TO CONSOLIDATED FINANCIAL STATEMENTS (Continued)
| 15. | Segment Reporting (Continued) |
“Core Earnings” are not a substitute for reported results under GAAP. We use “Core Earnings” to manage each business segment because “Core Earnings” reflect adjustments to GAAP financial results for three items, discussed below, that are either related to the Spin-Off or create significant volatility mostly due to timing factors generally beyond the control of management. Accordingly, we believe that “Core Earnings” provide management with a useful basis from which to better evaluate results from ongoing operations against the business plan or against results from prior periods. Consequently, we disclose this information because we believe it provides investors with additional information regarding the operational and performance indicators that are most closely assessed by management. When compared to GAAP results, the three items we remove to result in our “Core Earnings” presentations are:
| 1. | The financial results attributable to the operations of SLM BankCo prior to the Spin-Off and related restructuring and reorganization expense incurred in connection with the Spin-Off, including the restructuring expenses related to the restructuring initiative launched in second-quarter 2015 to simplify and streamline the Company’s management structure post-Spin-Off. For GAAP purposes, Navient reflected the deemed distribution of SLM BankCo on April 30, 2014. For “Core Earnings,” we exclude the consumer banking business (SLM BankCo) as if it had never been a part of Navient’s historical results prior to the deemed distribution of SLM BankCo on April 30, 2014; |
| 2. | Unrealized mark-to-market gains/losses resulting from our use of derivative instruments to hedge our economic risks that do not qualify for hedge accounting treatment or do qualify for hedge accounting treatment but result in ineffectiveness; and |
| 3. | The accounting for goodwill and acquired intangible assets. |
While GAAP provides a uniform, comprehensive basis of accounting, for the reasons described above, our “Core Earnings” basis of presentation does not. “Core Earnings” are subject to certain general and specific limitations that investors should carefully consider. For example, there is no comprehensive, authoritative guidance for management reporting. Our “Core Earnings” are not defined terms within GAAP and may not be comparable to similarly titled measures reported by other companies. Accordingly, our “Core Earnings” presentation does not represent a comprehensive basis of accounting. Investors, therefore, may not be able to compare our performance with that of other financial services companies based upon “Core Earnings.” “Core Earnings” results are only meant to supplement GAAP results by providing additional information regarding the operational and performance indicators that are most closely used by management, our board of directors, credit rating agencies, lenders and investors to assess performance.
F-74
Table of Contents
NAVIENT CORPORATION
NOTES TO CONSOLIDATED FINANCIAL STATEMENTS (Continued)
| 15. | Segment Reporting (Continued) |
Segment Results and Reconciliations to GAAP
| Year Ended December 31, 2016 | ||||||||||||||||||||||||||||||||||||||||
| (Dollars in millions) |
FFELP Loans |
Private Education Loans |
Business Services |
Other | Eliminations(1) | Total “Core Earnings” |
Adjustments | Total GAAP |
||||||||||||||||||||||||||||||||
| Reclassifications | Additions/ (Subtractions) |
Total Adjustments(2) |
||||||||||||||||||||||||||||||||||||||
| Interest income: |
||||||||||||||||||||||||||||||||||||||||
| Education loans |
$ | 2,395 | $ | 1,587 | $ | — | $ | — | $ | — | $ | 3,982 | $ | 247 | $ | (114 | ) | $ | 133 | $ | 4,115 | |||||||||||||||||||
| Other loans |
— | — | — | 9 | — | 9 | — | — | — | 9 | ||||||||||||||||||||||||||||||
| Cash and investments |
16 | 2 | — | 4 | — | 22 | — | — | — | 22 | ||||||||||||||||||||||||||||||
|
|
|
|
|
|
|
|
|
|
|
|
|
|
|
|
|
|
|
|
|
|||||||||||||||||||||
| Total interest income |
2,411 | 1,589 | — | 13 | — | 4,013 | 247 | (114 | ) | 133 | 4,146 | |||||||||||||||||||||||||||||
| Total interest expense |
1,592 | 705 | — | 113 | — | 2,410 | 31 | — | 31 | 2,441 | ||||||||||||||||||||||||||||||
|
|
|
|
|
|
|
|
|
|
|
|
|
|
|
|
|
|
|
|
|
|||||||||||||||||||||
| Net interest income (loss) |
819 | 884 | — | (100 | ) | — | 1,603 | 216 | (114 | ) | 102 | 1,705 | ||||||||||||||||||||||||||||
| Less: provisions for loan losses |
43 | 383 | — | 3 | — | 429 | — | — | — | 429 | ||||||||||||||||||||||||||||||
|
|
|
|
|
|
|
|
|
|
|
|
|
|
|
|
|
|
|
|
|
|||||||||||||||||||||
| Net interest income (loss) after provisions for loan losses |
776 | 501 | — | (103 | ) | — | 1,174 | 216 | (114 | ) | 102 | 1,276 | ||||||||||||||||||||||||||||
| Other income (loss): |
||||||||||||||||||||||||||||||||||||||||
| Servicing revenue |
55 | 14 | 624 | — | (389 | ) | 304 | — | — | — | 304 | |||||||||||||||||||||||||||||
| Asset recovery and business processing revenue |
— | — | 390 | — | — | 390 | — | — | — | 390 | ||||||||||||||||||||||||||||||
| Other income |
— | — | — | 14 | — | 14 | (216 | ) | 326 | 110 | 124 | |||||||||||||||||||||||||||||
| Gains on debt repurchases |
— | — | — | 1 | — | 1 | — | — | — | 1 | ||||||||||||||||||||||||||||||
|
|
|
|
|
|
|
|
|
|
|
|
|
|
|
|
|
|
|
|
|
|||||||||||||||||||||
| Total other income (loss) |
55 | 14 | 1,014 | 15 | (389 | ) | 709 | (216 | ) | 326 | 110 | 819 | ||||||||||||||||||||||||||||
| Expenses: |
||||||||||||||||||||||||||||||||||||||||
| Direct operating expenses |
401 | 167 | 524 | 28 | (389 | ) | 731 | — | — | — | 731 | |||||||||||||||||||||||||||||
| Overhead expenses |
— | — | — | 220 | — | 220 | — | — | — | 220 | ||||||||||||||||||||||||||||||
|
|
|
|
|
|
|
|
|
|
|
|
|
|
|
|
|
|
|
|
|
|||||||||||||||||||||
| Operating expenses |
401 | 167 | 524 | 248 | (389 | ) | 951 | — | — | — | 951 | |||||||||||||||||||||||||||||
| Goodwill and acquired intangible asset impairment and amortization |
— | — | — | — | — | — | — | 36 | 36 | 36 | ||||||||||||||||||||||||||||||
| Restructuring and other reorganization expenses |
— | — | — | — | — | — | — | — | — | — | ||||||||||||||||||||||||||||||
|
|
|
|
|
|
|
|
|
|
|
|
|
|
|
|
|
|
|
|
|
|||||||||||||||||||||
| Total expenses |
401 | 167 | 524 | 248 | (389 | ) | 951 | — | 36 | 36 | 987 | |||||||||||||||||||||||||||||
|
|
|
|
|
|
|
|
|
|
|
|
|
|
|
|
|
|
|
|
|
|||||||||||||||||||||
| Income (loss) from continuing operations, before income tax expense (benefit) |
430 | 348 | 490 | (336 | ) | — | 932 | — | 176 | 176 | 1,108 | |||||||||||||||||||||||||||||
| Income tax expense (benefit)(3) |
158 | 129 | 182 | (124 | ) | — | 345 | — | 82 | 82 | 427 | |||||||||||||||||||||||||||||
|
|
|
|
|
|
|
|
|
|
|
|
|
|
|
|
|
|
|
|
|
|||||||||||||||||||||
| Net income (loss) from continuing operations |
272 | 219 | 308 | (212 | ) | — | 587 | — | 94 | 94 | 681 | |||||||||||||||||||||||||||||
| Income (loss) from discontinued operations, net of tax expense (benefit) |
— | — | — | — | — | — | — | — | — | — | ||||||||||||||||||||||||||||||
|
|
|
|
|
|
|
|
|
|
|
|
|
|
|
|
|
|
|
|
|
|||||||||||||||||||||
| Net income (loss) |
$ | 272 | $ | 219 | $ | 308 | $ | (212 | ) | $ | — | $ | 587 | $ | — | $ | 94 | $ | 94 | $ | 681 | |||||||||||||||||||
|
|
|
|
|
|
|
|
|
|
|
|
|
|
|
|
|
|
|
|
|
|||||||||||||||||||||
| (1) | The eliminations in servicing revenue and direct operating expense represent the elimination of intercompany servicing revenue where the Business Services segment performs the loan servicing function for the FFELP Loans segment. |
| (2) | “Core Earnings” adjustments to GAAP: |
| Year Ended December 31, 2016 | ||||||||||||||||
| (Dollars in millions) |
Net Impact from Spin-Off of SLM BankCo |
Net Impact of Derivative Accounting |
Net Impact of Acquired Intangibles |
Total | ||||||||||||
| Net interest income after provisions for loan losses |
$ | — | $ | 102 | $ | — | $ | 102 | ||||||||
| Total other income (loss) |
— | 110 | — | 110 | ||||||||||||
| Operating expenses |
— | — | — | — | ||||||||||||
| Goodwill and acquired intangible asset impairment and amortization |
— | — | 36 | 36 | ||||||||||||
| Restructuring and other reorganization expenses |
— | — | — | — | ||||||||||||
|
|
|
|
|
|
|
|
|
|||||||||
| Total “Core Earnings” adjustments to GAAP |
$ | — | $ | 212 | $ | (36 | ) | 176 | ||||||||
|
|
|
|
|
|
|
|||||||||||
| Income tax expense (benefit) |
82 | |||||||||||||||
|
|
|
|||||||||||||||
| Net income (loss) |
$ | 94 | ||||||||||||||
|
|
|
|||||||||||||||
| (3) | Income taxes are based on a percentage of net income before tax for the individual reportable segment. |
F-75
Table of Contents
NAVIENT CORPORATION
NOTES TO CONSOLIDATED FINANCIAL STATEMENTS (Continued)
| 15. | Segment Reporting (Continued) |
| Year Ended December 31, 2015 | ||||||||||||||||||||||||||||||||||||||||
| (Dollars in millions) |
FFELP Loans |
Private Education Loans |
Business Services |
Other | Eliminations(1) | Total “Core Earnings” |
Adjustments | Total GAAP |
||||||||||||||||||||||||||||||||
| Reclassifications | Additions/ (Subtractions) |
Total Adjustments(2) |
||||||||||||||||||||||||||||||||||||||
| Interest income: |
||||||||||||||||||||||||||||||||||||||||
| Education loans |
$ | 2,112 | $ | 1,756 | $ | — | $ | — | $ | — | $ | 3,868 | $ | 650 | $ | (238 | ) | $ | 412 | $ | 4,280 | |||||||||||||||||||
| Other loans |
— | — | — | 7 | — | 7 | — | — | — | 7 | ||||||||||||||||||||||||||||||
| Cash and investments |
6 | — | — | 2 | — | 8 | — | — | — | 8 | ||||||||||||||||||||||||||||||
|
|
|
|
|
|
|
|
|
|
|
|
|
|
|
|
|
|
|
|
|
|||||||||||||||||||||
| Total interest income |
2,118 | 1,756 | — | 9 | — | 3,883 | 650 | (238 | ) | 412 | 4,295 | |||||||||||||||||||||||||||||
| Total interest expense |
1,245 | 680 | — | 112 | — | 2,037 | 37 | — | 37 | 2,074 | ||||||||||||||||||||||||||||||
|
|
|
|
|
|
|
|
|
|
|
|
|
|
|
|
|
|
|
|
|
|||||||||||||||||||||
| Net interest income (loss) |
873 | 1,076 | — | (103 | ) | — | 1,846 | 613 | (238 | ) | 375 | 2,221 | ||||||||||||||||||||||||||||
| Less: provisions for loan losses |
46 | 538 | — | (3 | ) | — | 581 | — | — | — | 581 | |||||||||||||||||||||||||||||
|
|
|
|
|
|
|
|
|
|
|
|
|
|
|
|
|
|
|
|
|
|||||||||||||||||||||
| Net interest income (loss) after provisions for loan losses |
827 | 538 | — | (100 | ) | — | 1,265 | 613 | (238 | ) | 375 | 1,640 | ||||||||||||||||||||||||||||
| Other income (loss): |
||||||||||||||||||||||||||||||||||||||||
| Servicing revenue |
95 | 21 | 651 | — | (427 | ) | 340 | — | — | — | 340 | |||||||||||||||||||||||||||||
| Asset recovery and business processing revenue |
— | — | 367 | — | — | 367 | — | — | — | 367 | ||||||||||||||||||||||||||||||
| Other income |
— | — | 4 | 11 | — | 15 | (613 | ) | 781 | 168 | 183 | |||||||||||||||||||||||||||||
| Gains (losses) on sales of loans and investments |
12 | (21 | ) | — | — | — | (9 | ) | — | — | — | (9 | ) | |||||||||||||||||||||||||||
| Gains on debt repurchases |
— | — | — | 21 | — | 21 | — | — | — | 21 | ||||||||||||||||||||||||||||||
|
|
|
|
|
|
|
|
|
|
|
|
|
|
|
|
|
|
|
|
|
|||||||||||||||||||||
| Total other income (loss) |
107 | — | 1,022 | 32 | (427 | ) | 734 | (613 | ) | 781 | 168 | 902 | ||||||||||||||||||||||||||||
| Expenses: |
||||||||||||||||||||||||||||||||||||||||
| Direct operating expenses |
443 | 168 | 485 | 30 | (427 | ) | 699 | — | — | — | 699 | |||||||||||||||||||||||||||||
| Overhead expenses |
— | — | — | 219 | — | 219 | — | — | — | 219 | ||||||||||||||||||||||||||||||
|
|
|
|
|
|
|
|
|
|
|
|
|
|
|
|
|
|
|
|
|
|||||||||||||||||||||
| Operating expenses |
443 | 168 | 485 | 249 | (427 | ) | 918 | — | — | — | 918 | |||||||||||||||||||||||||||||
| Goodwill and acquired intangible asset impairment and amortization |
— | — | — | — | — | — | — | 12 | 12 | 12 | ||||||||||||||||||||||||||||||
| Restructuring and other reorganization expenses |
— | — | — | — | — | — | — | 32 | 32 | 32 | ||||||||||||||||||||||||||||||
|
|
|
|
|
|
|
|
|
|
|
|
|
|
|
|
|
|
|
|
|
|||||||||||||||||||||
| Total expenses |
443 | 168 | 485 | 249 | (427 | ) | 918 | — | 44 | 44 | 962 | |||||||||||||||||||||||||||||
|
|
|
|
|
|
|
|
|
|
|
|
|
|
|
|
|
|
|
|
|
|||||||||||||||||||||
| Income (loss) from continuing operations, before income tax expense (benefit) |
491 | 370 | 537 | (317 | ) | — | 1,081 | — | 499 | 499 | 1,580 | |||||||||||||||||||||||||||||
| Income tax expense (benefit)(3) |
183 | 137 | 199 | (118 | ) | — | 401 | — | 196 | 196 | 597 | |||||||||||||||||||||||||||||
|
|
|
|
|
|
|
|
|
|
|
|
|
|
|
|
|
|
|
|
|
|||||||||||||||||||||
| Net income (loss) from continuing operations |
308 | 233 | 338 | (199 | ) | — | 680 | — | 303 | 303 | 983 | |||||||||||||||||||||||||||||
| Income (loss) from discontinued operations, net of tax expense (benefit) |
— | — | — | 1 | — | 1 | — | — | — | 1 | ||||||||||||||||||||||||||||||
|
|
|
|
|
|
|
|
|
|
|
|
|
|
|
|
|
|
|
|
|
|||||||||||||||||||||
| Net income (loss) |
$ | 308 | $ | 233 | $ | 338 | $ | (198 | ) | $ | — | $ | 681 | $ | — | $ | 303 | $ | 303 | $ | 984 | |||||||||||||||||||
|
|
|
|
|
|
|
|
|
|
|
|
|
|
|
|
|
|
|
|
|
|||||||||||||||||||||
| (1) | The eliminations in servicing revenue and direct operating expense represent the elimination of intercompany servicing revenue where the Business Services segment performs the loan servicing function for the FFELP Loans segment. |
| (2) | “Core Earnings” adjustments to GAAP: |
| Year Ended December 31, 2015 | ||||||||||||||||
| (Dollars in millions) |
Net Impact from Spin-Off of SLM BankCo |
Net Impact of Derivative Accounting |
Net Impact of Acquired Intangibles |
Total | ||||||||||||
| Net interest income after provisions for loan losses |
$ | — | $ | 375 | $ | — | $ | 375 | ||||||||
| Total other income (loss) |
— | 168 | — | 168 | ||||||||||||
| Operating expenses |
— | — | — | — | ||||||||||||
| Goodwill and acquired intangible asset impairment and amortization |
— | — | 12 | 12 | ||||||||||||
| Restructuring and other reorganization expenses |
32 | — | — | 32 | ||||||||||||
|
|
|
|
|
|
|
|
|
|||||||||
| Total “Core Earnings” adjustments to GAAP |
$ | (32 | ) | $ | 543 | $ | (12 | ) | 499 | |||||||
|
|
|
|
|
|
|
|||||||||||
| Income tax expense (benefit) |
196 | |||||||||||||||
|
|
|
|||||||||||||||
| Net income (loss) |
$ | 303 | ||||||||||||||
|
|
|
|||||||||||||||
| (3) | Income taxes are based on a percentage of net income before tax for the individual reportable segment. |
F-76
Table of Contents
NAVIENT CORPORATION
NOTES TO CONSOLIDATED FINANCIAL STATEMENTS (Continued)
| 15. | Segment Reporting (Continued) |
| Year Ended December 31, 2014 | ||||||||||||||||||||||||||||||||||||||||
| (Dollars in millions) |
FFELP Loans |
Private Education Loans |
Business Services |
Other | Elimina- tions(1) |
Total “Core Earnings” |
Adjustments | Total GAAP |
||||||||||||||||||||||||||||||||
| Reclassi- fications |
Additions/ (Subtractions) |
Total Adjustments(2) |
||||||||||||||||||||||||||||||||||||||
| Interest income: |
||||||||||||||||||||||||||||||||||||||||
| Education loans |
$ | 2,097 | $ | 1,958 | $ | — | $ | — | $ | — | $ | 4,055 | $ | 699 | $ | (42 | ) | $ | 657 | $ | 4,712 | |||||||||||||||||||
| Other loans |
— | — | — | 9 | — | 9 | — | — | — | 9 | ||||||||||||||||||||||||||||||
| Cash and investments |
4 | — | — | 4 | — | 8 | — | 1 | 1 | 9 | ||||||||||||||||||||||||||||||
|
|
|
|
|
|
|
|
|
|
|
|
|
|
|
|
|
|
|
|
|
|||||||||||||||||||||
| Total interest income |
2,101 | 1,958 | — | 13 | — | 4,072 | 699 | (41 | ) | 658 | 4,730 | |||||||||||||||||||||||||||||
| Total interest expense |
1,168 | 708 | — | 114 | — | 1,990 | 42 | 31 | 73 | 2,063 | ||||||||||||||||||||||||||||||
|
|
|
|
|
|
|
|
|
|
|
|
|
|
|
|
|
|
|
|
|
|||||||||||||||||||||
| Net interest income (loss) |
933 | 1,250 | — | (101 | ) | — | 2,082 | 657 | (72 | ) | 585 | 2,667 | ||||||||||||||||||||||||||||
| Less: provisions for loan losses |
59 | 539 | — | — | — | 598 | — | 49 | 49 | 647 | ||||||||||||||||||||||||||||||
|
|
|
|
|
|
|
|
|
|
|
|
|
|
|
|
|
|
|
|
|
|||||||||||||||||||||
| Net interest income (loss) after provisions for loan losses |
874 | 711 | — | (101 | ) | — | 1,484 | 657 | (121 | ) | 536 | 2,020 | ||||||||||||||||||||||||||||
| Other income (loss): |
||||||||||||||||||||||||||||||||||||||||
| Servicing revenue |
62 | 25 | 668 | — | (456 | ) | 299 | — | (1 | ) | (1 | ) | 298 | |||||||||||||||||||||||||||
| Asset recovery and business processing revenue |
— | — | 388 | — | — | 388 | — | — | — | 388 | ||||||||||||||||||||||||||||||
| Other income |
— | — | 6 | 26 | — | 32 | (657 | ) | 846 | 189 | 221 | |||||||||||||||||||||||||||||
| Gains on debt repurchases |
— | — | — | — | — | — | — | — | — | — | ||||||||||||||||||||||||||||||
|
|
|
|
|
|
|
|
|
|
|
|
|
|
|
|
|
|
|
|
|
|||||||||||||||||||||
| Total other income (loss) |
62 | 25 | 1,062 | 26 | (456 | ) | 719 | (657 | ) | 845 | 188 | 907 | ||||||||||||||||||||||||||||
| Expenses: |
||||||||||||||||||||||||||||||||||||||||
| Direct operating expenses |
478 | 181 | 389 | 132 | (456 | ) | 724 | — | 36 | 36 | 760 | |||||||||||||||||||||||||||||
| Overhead expenses |
— | — | — | 200 | — | 200 | — | 27 | 27 | 227 | ||||||||||||||||||||||||||||||
|
|
|
|
|
|
|
|
|
|
|
|
|
|
|
|
|
|
|
|
|
|||||||||||||||||||||
| Operating expenses |
478 | 181 | 389 | 332 | (456 | ) | 924 | — | 63 | 63 | 987 | |||||||||||||||||||||||||||||
| Goodwill and acquired intangible asset impairment and amortization |
— | — | — | — | — | — | — | 9 | 9 | 9 | ||||||||||||||||||||||||||||||
| Restructuring and other reorganization expenses |
— | — | — | — | — | — | — | 113 | 113 | 113 | ||||||||||||||||||||||||||||||
|
|
|
|
|
|
|
|
|
|
|
|
|
|
|
|
|
|
|
|
|
|||||||||||||||||||||
| Total expenses |
478 | 181 | 389 | 332 | (456 | ) | 924 | — | 185 | 185 | 1,109 | |||||||||||||||||||||||||||||
| Income (loss) from continuing operations, before income tax expense (benefit) |
458 | 555 | 673 | (407 | ) | — | 1,279 | — | 539 | 539 | 1,818 | |||||||||||||||||||||||||||||
| Income tax expense (benefit)(3) |
171 | 204 | 248 | (150 | ) | — | 473 | — | 208 | 208 | 681 | |||||||||||||||||||||||||||||
|
|
|
|
|
|
|
|
|
|
|
|
|
|
|
|
|
|
|
|
|
|||||||||||||||||||||
| Net income (loss) from continuing operations |
$ | 287 | $ | 351 | $ | 425 | $ | (257 | ) | $ | — | $ | 806 | $ | — | $ | 331 | $ | 331 | $ | 1,137 | |||||||||||||||||||
| Income (loss) from discontinued operations, net of tax expense (benefit) |
— | — | — | — | — | — | — | — | — | — | ||||||||||||||||||||||||||||||
|
|
|
|
|
|
|
|
|
|
|
|
|
|
|
|
|
|
|
|
|
|||||||||||||||||||||
| Net income (loss) |
$ | 287 | $ | 351 | $ | 425 | $ | (257 | ) | $ | — | $ | 806 | $ | — | $ | 331 | $ | 331 | $ | 1,137 | |||||||||||||||||||
|
|
|
|
|
|
|
|
|
|
|
|
|
|
|
|
|
|
|
|
|
|||||||||||||||||||||
| (1) | The eliminations in servicing revenue and direct operating expense represent the elimination of intercompany servicing revenue where the Business Services segment performs the loan servicing function for the FFELP Loans segment. |
| (2) | “Core Earnings” adjustments to GAAP: |
| Year Ended December 31, 2014 | ||||||||||||||||
| (Dollars in millions) |
Net Impact from Spin-Off of SLM BankCo |
Net Impact of Derivative Accounting |
Net Impact of Acquired Intangibles |
Total | ||||||||||||
| Net interest income after provisions for loan losses |
$ | 136 | $ | 400 | $ | — | $ | 536 | ||||||||
| Total other income (loss) |
15 | 173 | — | 188 | ||||||||||||
| Operating expenses |
63 | — | — | 63 | ||||||||||||
| Goodwill and acquired intangible asset impairment and amortization |
— | — | 9 | 9 | ||||||||||||
| Restructuring and other reorganization expenses |
113 | — | — | 113 | ||||||||||||
|
|
|
|
|
|
|
|
|
|||||||||
| Total “Core Earnings” adjustments to GAAP |
$ | (25 | ) | $ | 573 | $ | (9 | ) | 539 | |||||||
|
|
|
|
|
|
|
|||||||||||
| Income tax expense (benefit) |
208 | |||||||||||||||
|
|
|
|||||||||||||||
| Net income (loss) |
$ | 331 | ||||||||||||||
|
|
|
|||||||||||||||
| (3) | Income taxes are based on a percentage of net income before tax for the individual reportable segment. |
F-77
Table of Contents
NAVIENT CORPORATION
NOTES TO CONSOLIDATED FINANCIAL STATEMENTS (Continued)
| 15. | Segment Reporting (Continued) |
Summary of “Core Earnings” Adjustments to GAAP
| Years Ended December 31, | ||||||||||||
| (Dollars in millions) |
2016 | 2015 | 2014 | |||||||||
| “Core Earnings” adjustments to GAAP: |
||||||||||||
| Net impact of the removal of SLM BankCo’s operations and restructuring and reorganization expense in connection with the Spin-Off(1) |
$ | — | $ | (32 | ) | $ | (25 | ) | ||||
| Net impact of derivative accounting(2) |
212 | 543 | 573 | |||||||||
| Net impact of goodwill and acquired intangible assets(3) |
(36 | ) | (12 | ) | (9 | ) | ||||||
| Net tax effect(4) |
(82 | ) | (196 | ) | (208 | ) | ||||||
|
|
|
|
|
|
|
|||||||
| Total “Core Earnings” adjustments to GAAP |
$ | 94 | $ | 303 | $ | 331 | ||||||
|
|
|
|
|
|
|
|||||||
| (1) | SLM BankCo’s operations and restructuring and other reorganization expense in connection with the Spin-Off: For “Core Earnings,” we have assumed the consumer banking business (SLM BankCo) was never a part of Navient’s historical results prior to the deemed distribution of SLM BankCo on April 30, 2014 and we have removed the restructuring and other reorganization expense incurred in connection with the Spin-Off, including the restructuring expenses related to the restructuring initiative launched in second-quarter 2015 to simplify and streamline the Company’s management structure post-Spin-Off. Excluding these items provides management with a useful basis from which to better evaluate results from ongoing operations against results from prior periods. The adjustment relates to the exclusion of the consumer banking business and represents the operations, assets, liabilities and equity of SLM BankCo, which is comprised of Sallie Mae Bank, Upromise Rewards, the Insurance Business, and the Private Education Loan origination functions. Included in these amounts are also certain general corporate overhead expenses related to the consumer banking business. General corporate overhead consists of costs primarily associated with accounting, finance, legal, human resources, certain information technology costs, stock compensation, and executive management and the board of directors. These costs were generally allocated to the consumer banking business based on the proportionate level of effort provided to the consumer banking business relative to SLM Corporation using a relevant allocation driver (e.g., in proportion to the number of employees by function that were being transferred to SLM BankCo as opposed to remaining at Navient). All intercompany transactions between SLM BankCo and Navient have been eliminated. In addition, all preferred stock dividends have been removed as SLM BankCo succeeded SLM Corporation as the issuer of the preferred stock in connection with the Spin-Off. The restructuring and other reorganization expense incurred in connection with the Spin-Off includes the restructuring expenses related to the restructuring initiative launched in second-quarter 2015 to simplify and streamline the Company’s management structure post-Spin-Off. |
| (2) | Derivative accounting: “Core Earnings” exclude periodic unrealized gains and losses that are caused by the mark-to-market valuations on derivatives that do not qualify for hedge accounting treatment under GAAP as well as the periodic unrealized gains and losses that are a result of ineffectiveness recognized related to effective hedges under GAAP. These unrealized gains and losses occur in our FFELP Loans, Private Education Loans and Other business segments. Under GAAP, for our derivatives that are held to maturity, the cumulative net unrealized gain or loss over the life of the contract will equal $0 except for Floor Income Contracts where the cumulative unrealized gain will equal the amount for which we sold the contract. In our “Core Earnings” presentation, we recognize the economic effect of these hedges, which generally results in any net settlement cash paid or received being recognized ratably as an interest expense or revenue over the hedged item’s life. |
| (3) | Goodwill and acquired intangible assets: Our “Core Earnings” exclude goodwill and intangible asset impairment and amortization of acquired intangible assets. |
| (4) | Net Tax Effect: Such tax effect is based upon our “Core Earnings” effective tax rate for the year. |
F-78
Table of Contents
NAVIENT CORPORATION
NOTES TO CONSOLIDATED FINANCIAL STATEMENTS (Continued)
| 16. | Quarterly Financial Information (unaudited) |
| 2016 | ||||||||||||||||
| (Dollars in millions, except per share data) |
First Quarter |
Second Quarter |
Third Quarter |
Fourth Quarter |
||||||||||||
| Net interest income |
$ | 486 | $ | 429 | $ | 412 | $ | 378 | ||||||||
| Less: provisions for loan losses |
111 | 110 | 106 | 102 | ||||||||||||
|
|
|
|
|
|
|
|
|
|||||||||
| Net interest income after provisions for loan losses |
375 | 319 | 306 | 276 | ||||||||||||
| Other income |
159 | 151 | 174 | 218 | ||||||||||||
| Gains (losses) on derivative and hedging activities, net |
1 | (28 | ) | 137 | 6 | |||||||||||
| Operating expenses |
247 | 230 | 228 | 246 | ||||||||||||
| Goodwill and acquired intangible asset impairment and amortization expense |
4 | 6 | 12 | 13 | ||||||||||||
| Restructuring and other reorganization expenses |
— | — | — | — | ||||||||||||
| Income tax expense |
103 | 81 | 147 | 96 | ||||||||||||
|
|
|
|
|
|
|
|
|
|||||||||
| Net income from continuing operations |
181 | 125 | 230 | 145 | ||||||||||||
| Income from discontinued operations, net of tax expense |
— | — | — | — | ||||||||||||
|
|
|
|
|
|
|
|
|
|||||||||
| Net income |
181 | 125 | 230 | 145 | ||||||||||||
| Less: net income (loss) attributable to noncontrolling interest |
— | — | — | — | ||||||||||||
|
|
|
|
|
|
|
|
|
|||||||||
| Net income attributable to Navient Corporation |
$ | 181 | $ | 125 | $ | 230 | $ | 145 | ||||||||
|
|
|
|
|
|
|
|
|
|||||||||
| Basic earnings per common share attributable to Navient Corporation |
$ | .53 | $ | .39 | $ | .74 | $ | .49 | ||||||||
|
|
|
|
|
|
|
|
|
|||||||||
| Diluted earnings per common share attributable to Navient Corporation |
$ | .53 | $ | .38 | $ | .73 | $ | .48 | ||||||||
|
|
|
|
|
|
|
|
|
|||||||||
F-79
Table of Contents
NAVIENT CORPORATION
NOTES TO CONSOLIDATED FINANCIAL STATEMENTS (Continued)
| 16. | Quarterly Financial Information (unaudited) (Continued) |
| 2015 | ||||||||||||||||
| (Dollars in millions, except per share data) |
First Quarter |
Second Quarter |
Third Quarter |
Fourth Quarter |
||||||||||||
| Net interest income |
$ | 583 | $ | 549 | $ | 553 | $ | 536 | ||||||||
| Less: provisions for loan losses |
130 | 203 | 128 | 120 | ||||||||||||
|
|
|
|
|
|
|
|
|
|||||||||
| Net interest income after provisions for loan losses |
453 | 346 | 425 | 416 | ||||||||||||
| Other income |
178 | 219 | 161 | 178 | ||||||||||||
| Gains (losses) on derivative and hedging activities, net |
71 | (18 | ) | 20 | 93 | |||||||||||
| Operating expenses |
230 | 225 | 228 | 235 | ||||||||||||
| Goodwill and acquired intangible asset impairment and amortization expense |
1 | 3 | 3 | 5 | ||||||||||||
| Restructuring and other reorganization expenses |
3 | 29 | — | — | ||||||||||||
| Income tax expense |
179 | 111 | 142 | 164 | ||||||||||||
|
|
|
|
|
|
|
|
|
|||||||||
| Net income from continuing operations |
289 | 179 | 233 | 283 | ||||||||||||
| Income from discontinued operations, net of tax expense |
— | — | 1 | — | ||||||||||||
|
|
|
|
|
|
|
|
|
|||||||||
| Net income |
289 | 179 | 234 | 283 | ||||||||||||
| Less: net income (loss) attributable to noncontrolling interest |
— | — | — | — | ||||||||||||
|
|
|
|
|
|
|
|
|
|||||||||
| Net income attributable to Navient Corporation |
$ | 289 | $ | 179 | $ | 234 | $ | 283 | ||||||||
|
|
|
|
|
|
|
|
|
|||||||||
| Basic earnings per common share attributable to Navient Corporation |
$ | .73 | $ | .47 | $ | .63 | $ | .80 | ||||||||
|
|
|
|
|
|
|
|
|
|||||||||
| Diluted earnings per common share attributable to Navient Corporation |
$ | .71 | $ | .46 | $ | .63 | $ | .78 | ||||||||
|
|
|
|
|
|
|
|
|
|||||||||
F-80
Table of Contents
DESCRIPTION OF FEDERAL FAMILY EDUCATION LOAN PROGRAM
On March 30, 2010, the President of the United States signed into law the Health Care and Education Reconciliation Act of 2010 (“HCERA”) which terminated as of July 1, 2010 the Federal Family Education Loan Program (“FFELP”) under Title IV of the Higher Education Act. This appendix presents a summary of the program prior to its termination date. The new law does not alter or affect the terms and conditions of existing education loans made under the FFELP prior to July 1, 2010.
This appendix describes or summarizes the material provisions of Title IV of the Higher Education Act, the FFELP and related statutes and regulations. It, however, is not complete and is qualified in its entirety by reference to each actual statute and regulation. Both the Higher Education Act and the related regulations have been the subject of extensive amendments over the years. We cannot predict whether future amendments or modifications might materially change any of the programs described in this appendix or the statutes and regulations that implement them.
General
The FFELP provided for loans to students who were enrolled in eligible institutions, or to parents of dependent students who were enrolled in eligible institutions, to finance their educational costs. As further described below, payment of principal and interest on the education loans is insured by a state or not-for-profit guaranty agency against:
| • | default of the borrower; |
| • | the death, bankruptcy or permanent, total disability of the borrower; |
| • | closing of the borrower’s school prior to the end of the academic period; |
| • | false certification of the borrower’s eligibility for the loan by the school; and |
| • | an unpaid school refund. |
Claims are paid from federal assets, known as “federal student loan reserve funds,” which are maintained and administered by state and not-for-profit guaranty agencies. In addition, the holders of education loans are entitled to receive interest subsidy payments and special allowance payments from the United States Department of Education (which we refer to as the Department of Education) on eligible education loans.
Special allowance payments raise the yield to education loan lenders when the statutory borrower interest rate is below an indexed market value. Subject to certain conditions, a program of federal reinsurance under the Higher Education Act entitles guaranty agencies to reimbursement from the Department of Education for between 75% and 100% of the amount of each guarantee payment.
Four types of education loans were authorized under the Higher Education Act:
| • | Subsidized Stafford Loans to students who demonstrated requisite financial need; |
| • | Unsubsidized Stafford Loans to students who either did not demonstrate financial need or required additional loans to supplement their Subsidized Stafford Loans; |
| • | Parent Loans for Undergraduate Students, known as “PLUS Loans,” to parents of dependent students whose estimated costs of attending school exceeded other available financial aid; and |
| • | Consolidation Loans, which consolidated into a single loan a borrower’s obligations under various federally authorized education loan programs. |
Before July 1, 1994, the Higher Education Act also authorized loans called “Supplemental Loans to Students” or “SLS Loans” to independent students and, under some circumstances, dependent undergraduate students, to supplement their Subsidized Stafford Loans. The Unsubsidized Stafford Loan program replaced the SLS program.
A-1
Table of Contents
Legislative Matters
The federal education loan programs are subject to frequent statutory and regulatory changes. The most significant change to the FFELP was with the enactment of the HCERA, which terminated the FFELP as of July 1, 2010.
On December 23, 2011, the President of the United States signed the Consolidated Appropriations Act of 2012 into law. This law includes changes that permit FFELP lenders or beneficial holders to change the index on which the special allowance payments are calculated for FFELP loans first disbursed on or after January 1, 2000. The law allows owners of FFELP loans to elect to change the applicable index from the three-month commercial paper rate to the one-month LIBOR index. Such elections must have been made by April 1, 2012.
Eligible Lenders, Students and Educational Institutions
Lenders who were eligible to make loans under the FFELP generally included banks, savings and loan associations, credit unions, pension funds and, under some conditions, schools and guaranty agencies. FFELP loans were required to be made to, or on behalf of, a “qualified student.” A “qualified student” is an individual who:
| • | is a United States citizen, national or permanent resident; |
| • | has been accepted for enrollment or is enrolled and is maintaining satisfactory academic progress at a participating educational institution; |
| • | is carrying at least one-half of the normal full-time academic workload for the course of study the student is pursuing; and |
| • | meets the financial need requirements for the particular loan program. |
Eligible schools include institutions of higher education, including proprietary institutions, meeting the standards provided in the Higher Education Act. For a school to participate in the program, the Department of Education had to approve its eligibility under standards established by regulation.
Financial Need Analysis
Subject to program limits and conditions, education loans generally were made in amounts sufficient to cover the student’s estimated costs of attending school, including tuition and fees, books, supplies, room and board, transportation and miscellaneous personal expenses as determined by the institution. Generally, each loan applicant (and parents in the case of a dependent child) underwent a financial need analysis.
Special Allowance Payments
The Higher Education Act provides for quarterly special allowance payments to be made by the Department of Education to holders of education loans to the extent necessary to ensure that they receive at least specified market interest rates of return. The rates for special allowance payments depend on formulas that vary according to the type of loan, the date the loan was made and the type of funds, tax-exempt or taxable, used to finance the loan. The Department of Education makes a special allowance payment for each calendar quarter, generally within 45 to 60 days after the receipt of a bill from the lender.
The special allowance payment equals the average unpaid principal balance, including interest which has been capitalized, of all eligible loans held by a holder during the quarterly period multiplied by the special allowance percentage.
For education loans disbursed before January 1, 2000, the special allowance percentage is computed by:
(1) determining the average of the bond equivalent rates of 91-day Treasury bills auctioned for that quarter;
(2) subtracting the applicable borrower interest rate;
A-2
Table of Contents
(3) adding the applicable special allowance margin described in the table below; and
(4) dividing the resultant percentage by 4.
If the result is negative, the special allowance payment is zero.
| Date of First Disbursement |
Special Allowance Margin | |
| Before 10/17/86 |
3.50% | |
| From 10/17/86 through 09/30/92 |
3.25% | |
| From 10/01/92 through 06/30/95 |
3.10% | |
| From 07/01/95 through 06/30/98 |
2.50% for Stafford Loans that are in In-School, Grace or Deferment | |
| 3.10% for Stafford Loans that are in Repayment and all other loans | ||
| From 07/01/98 through 12/31/99 |
2.20% for Stafford Loans that are in In-School, Grace or Deferment | |
| 2.80% for Stafford Loans that are in Repayment and Forbearance | ||
| 3.10% for PLUS, SLS and Consolidation Loans |
For education loans disbursed after January 1, 2000, the special allowance percentage is computed by:
(1) determining the average of the bond equivalent rates of 3-month commercial paper (financial) rates or one-month London Inter-Bank Offered Rates (LIBOR), as applicable, quoted for that quarter;
(2) subtracting the applicable borrower interest rate;
(3) adding the applicable special allowance margin described in the table below; and
(4) dividing the resultant percentage by 4.
If the result is negative, the special allowance payment is zero.
| Date of First Disbursement |
Special Allowance Margin | |
| From 01/01/00 through 09/30/07 |
1.74% for Stafford Loans that are in In-School, Grace or Deferment | |
| 2.34% for Stafford Loans that are in Repayment and Forbearance | ||
| 2.64% for PLUS and Consolidation Loans | ||
| From 10/01/07 and after |
1.19% for Stafford Loans that are In-School, Grace or Deferment | |
| 1.79% for Stafford Loans that are in Repayment and PLUS | ||
| 2.09% for Consolidation Loans |
For education loans disbursed on or after April 1, 2006, lenders are required to pay the Department of Education any interest paid by borrowers on education loans that exceeds the special allowance support levels applicable to such loans.
Special allowance payments are available on variable rate PLUS Loans and SLS Loans only if the variable rate, which is reset annually, exceeds the applicable maximum borrower rate. The variable rate is based on the weekly average one-year constant maturity Treasury yield for loans made before July 1, 1998 and based on the 91-day Treasury bill for loans made on or after July 1, 1998. The maximum borrower rate for these loans is between 9% and 12%. Effective July 1, 2006, this limitation on special allowance payments for PLUS Loans made on and after January 1, 2000 was repealed.
A-3
Table of Contents
Fees
Origination Fee. An origination fee was required to be paid to the Department of Education for all Stafford and PLUS Loans originated in the FFELP. An origination fee was not required on a Consolidation Loan. A 3% origination fee was required to be deducted from the amount of each PLUS Loan.
An origination fee may have been, but was not required to be, deducted from the amount of a Stafford Loan according to the following table:
| Date of First Disbursement |
Maximum Origination Fee | |||
| Before 07/01/06 |
3.0 | % | ||
| From 07/01/06 through 06/30/07 |
2.0 | % | ||
| From 07/01/07 through 06/30/08 |
1.5 | % | ||
| From 07/01/08 through 06/30/09 |
1.0 | % | ||
| From 07/01/09 through 06/30/10 |
0.5 | % | ||
| From 07/01/10 and after |
0.0 | % | ||
Federal Default Fee. A federal default fee up to 1% (previously called an insurance premium) may have been, but was not required to be, deducted from the amount of a Stafford or PLUS Loan. A federal default fee was not deducted from the amount of a Consolidation Loan.
Lender Loan Fee. A lender loan fee was required to be paid to the Department of Education on the amount of each loan disbursement of all FFELP loans. For loans disbursed from October 1, 1993 to September 30, 2007, the fee was 0.50% of the loan amount. The fee increased to 1% of the loan amount for loans disbursed on or after October 1, 2007.
Loan Rebate Fee. A loan rebate fee of 1.05% is paid annually on the unpaid principal and interest of each Consolidation Loan disbursed on or after October 1, 1993. This fee was reduced to 0.62% for loans made from October 1, 1998 to January 31, 1999.
Stafford Loan Program
For Stafford Loans, the Higher Education Act provided for:
| • | federal reimbursement of Stafford Loans made by eligible lenders to qualified students; |
| • | federal interest subsidy payments on Subsidized Stafford Loans paid by the Department of Education to holders of the loans in lieu of the borrowers’ making interest payments during in-school, grace and deferment periods or, in certain cases, during enrollment in an income-based repayment plan; and |
| • | special allowance payments representing an additional subsidy paid by the Department of Education to the holders of eligible Stafford Loans. |
We refer to all three types of assistance as “federal assistance.”
A-4
Table of Contents
Interest. The borrower’s interest rate on a Stafford Loan can be fixed or variable. Stafford Loan interest rates are presented below.
| Trigger Date |
Borrower Rate |
Maximum Borrower Rate |
Interest Rate Margin | |||
| Before 10/01/81 |
7% | N/A | N/A | |||
| From 01/01/81 through 09/12/83 |
9% | N/A | N/A | |||
| From 09/13/83 through 06/30/88 |
8% | N/A | N/A | |||
| From 07/01/88 through 09/30/92 |
8% for 48 months; thereafter, 91-day Treasury + Interest Rate Margin |
8% for 48 months, then 10% |
3.25% for loans made before 7/23/92 and for loans made on or before 10/1/92 to new student borrowers; 3.10% for loans made after 7/23/92 and before 7/1/94 to borrowers with outstanding FFELP loans | |||
| From 10/01/92 through 06/30/94 |
91-day Treasury + Interest Rate Margin | 9% | 3.10% | |||
| From 07/01/94 through 06/30/95 |
91-day Treasury + Interest Rate Margin | 8.25% | 3.10% | |||
| From 07/01/95 through 06/30/98 |
91-day Treasury + Interest Rate Margin | 8.25% | 2.50% (In-School, Grace or Deferment); 3.10% (Repayment) | |||
| From 07/01/98 through 06/30/06 |
91-day Treasury + Interest Rate Margin | 8.25% | 1.70% (In-School, Grace or Deferment); 2.30% (Repayment) | |||
| From 07/01/06 through 06/30/08 |
6.8% | N/A | N/A | |||
| From 07/01/08 through 06/30/09 |
6.0% for undergraduate subsidized loans; and 6.8% for unsubsidized loans and graduate subsidized loans | 6.0%, 6.8% | N/A | |||
| From 07/01/09 through 06/30/10 |
5.6% for undergraduate subsidized loans; and 6.8% for unsubsidized loans and graduate loans |
5.6%, 6.8% | N/A |
The rate for variable rate Stafford Loans applicable for any 12-month period beginning on July 1 and ending on June 30 is determined on the preceding June 1 and is equal to the lesser of:
| • | the applicable maximum borrower rate |
and
| • | the sum of |
| • | the bond equivalent rate of 91-day Treasury bills auctioned at the final auction held before that June 1, |
and
| • | the applicable interest rate margin. |
A-5
Table of Contents
Interest Subsidy Payments. The Department of Education is responsible for paying interest on Subsidized Stafford Loans:
| • | while the borrower is a qualified student, |
| • | during the grace period, |
| • | during prescribed deferment periods, and |
| • | in certain cases, during a borrower’s enrollment in an income-based repayment plan. |
The Department of Education makes quarterly interest subsidy payments to the owner of a Subsidized Stafford Loan in an amount equal to the interest that accrues on the unpaid balance of that loan before repayment begins or during any deferment periods. The Department of Education also makes quarterly interest subsidy payments to the owner of a Subsidized Stafford Loan in an amount equal to the unpaid interest payable during up to three consecutive calendar years of a period of financial hardship during enrollment in an income-based repayment plan. The Higher Education Act provides that the owner of an eligible Subsidized Stafford Loan has a contractual right against the United States to receive interest subsidy and special allowance payments. However, receipt of interest subsidy and special allowance payments is conditioned on compliance with the requirements of the Higher Education Act, including the following:
| • | satisfaction of need criteria, and |
| • | continued eligibility of the loan for federal insurance or reinsurance. |
If the loan is not held by an eligible lender in accordance with the requirements of the Higher Education Act and the applicable guarantee agreement, the loan may lose its eligibility for federal assistance.
Lenders generally receive interest subsidy payments within 45 days to 60 days after the submission of the applicable data for any given calendar quarter to the Department of Education. However, there can be no assurance that payments will, in fact, be received from the Department of Education within that period.
Loan Limits. The Higher Education Act generally required that lenders disburse education loans in at least two equal disbursements. The Higher Education Act limited the amount a student could borrow in any academic year. The following chart shows current and historic loan limits.
| Dependent Students | Independent Students | |||||||||||||||||||||||||||
| Borrower’s Academic Level |
Subsidized and Unsubsidized on or after 10/1/93 |
Subsidized and Unsubsidized on or after 7/1/07 |
Subsidized and Unsubsidized on or after 7/1/08 |
Additional Unsubsidized only on or after 7/1/94 |
Additional Unsubsidized only on or after 7/1/07 |
Additional Unsubsidized only on or after 7/1/08 |
Maximum Annual Total Amount |
|||||||||||||||||||||
| Undergraduate (per year): |
||||||||||||||||||||||||||||
| 1st year |
$ | 2,625 | $ | 3,500 | $ | 5,500 | $ | 4,000 | $ | 4,000 | $ | 4,000 | $ | 9,500 | ||||||||||||||
| 2nd year |
$ | 3,500 | $ | 4,500 | $ | 6,500 | $ | 4,000 | $ | 4,000 | $ | 4,000 | $ | 10,500 | ||||||||||||||
| 3rd year and above |
$ | 5,500 | $ | 5,500 | $ | 7,500 | $ | 5,000 | $ | 5,000 | $ | 5,000 | $ | 12,500 | ||||||||||||||
| Graduate (per year) |
$ | 8,500 | $ | 8,500 | $ | 8,500 | $ | 10,000 | $ | 12,000 | $ | 12,000 | $ | 20,500 | ||||||||||||||
| Aggregate Limit: |
||||||||||||||||||||||||||||
| Undergraduate |
$ | 23,000 | $ | 23,000 | $ | 31,000 | $ | 23,000 | $ | 23,000 | $ | 26,500 | $ | 57,500 | ||||||||||||||
| Graduate (including undergraduate) |
$ | 65,500 | $ | 65,500 | $ | 65,500 | $ | 73,000 | $ | 73,000 | $ | 73,000 | $ | 138,500 | ||||||||||||||
For the purposes of the table above:
| • | The loan limits include both FFELP and Federal Direct Lending Program (FDLP) loans. |
| • | The amounts in the final column represent the combined maximum loan amount per year for Subsidized and Unsubsidized Stafford Loans. Accordingly, the maximum amount that a student may borrow under an Unsubsidized Stafford Loan is the difference between the combined maximum loan amount and the amount the student received in the form of a Subsidized Stafford Loan. |
A-6
Table of Contents
| • | Independent undergraduate students, graduate students and professional students were permitted to borrow the additional amounts shown in the third and fourth columns. Dependent undergraduate students were also permitted to receive these additional loan amounts if their parents were unable to provide the family contribution amount and could not qualify for a PLUS Loan. |
| • | Students attending certain medical schools were eligible for $38,500 annually and $189,000 in the aggregate. |
| • | The annual loan limits were sometimes reduced when the student was enrolled in a program of less than one academic year or had less than a full academic year remaining in his program. |
Repayment. Repayment of principal on a Stafford Loan does not begin while the borrower remains a qualified student, but only after a 6-month grace period. In general, each loan must be scheduled for repayment over a period of not more than 10 years after repayment begins. New borrowers on or after October 7, 1998 who accumulated FFELP loans totaling more than $30,000 in principal and unpaid interest are entitled to extend repayment for up to 25 years, subject to minimum repayment amounts. Consolidation Loan borrowers may be scheduled for repayment up to 30 years depending on the borrower’s indebtedness. Outlined in the table below are the maximum repayment periods available based on the outstanding FFELP indebtedness.
| Outstanding FFELP Indebtedness |
Maximum Repayment Period | |
| $7,500-$9,999 |
12 Years | |
| $10,000-$19,999 |
15 Years | |
| $20,000-$30,000 |
20 Years | |
| $30,001-$59,999 |
25 Years | |
| $60,000 or more |
30 Years |
Note: Maximum repayment period excludes authorized periods of deferment and forbearance.
In addition to the outstanding FFELP indebtedness requirements described above, the Higher Education Act currently requires minimum annual payments of $600, unless the borrower and the lender agree to lower payments, except that negative amortization is not allowed. The Higher Education Act and related regulations require lenders to offer a choice among standard, graduated, income-driven and extended repayment schedules, if applicable, to all borrowers entering repayment. The 2007 legislation introduced an income-based repayment plan on July 1, 2009 that a student borrower may elect during a period of partial financial hardship and have annual payments that do not exceed 15% of the amount by which adjusted gross income exceeds 150% of the poverty line. The Secretary repays or cancels any outstanding principal and interest under certain criteria after 25 years.
Grace Periods, Deferment Periods and Forbearance Periods. After the borrower stops pursuing at least a half-time course of study, he generally must begin to repay principal of a Stafford Loan following the grace period. However, no principal repayments need be made, subject to some conditions, during deferment and forbearance periods.
For borrowers whose first loans are disbursed on or after July 1, 1993, repayment of principal may be deferred while the borrower returns to school at least half-time. Additional deferments are available, when the borrower is:
| • | enrolled in an approved graduate fellowship program or rehabilitation program; |
| • | seeking, but unable to find, full-time employment, subject to a maximum deferment of three years; or |
| • | having an economic hardship, as defined in the Higher Education Act, subject to a maximum deferment of three years; or |
| • | serving on active duty during a war or other military operation or national emergency, or performing qualifying National Guard duty during a war or other military operation or national emergency, subject to a maximum deferment period of three years, and effective July 1, 2006 on loans made on or after July 1, 2001. |
A-7
Table of Contents
The Higher Education Act also permits, and in some cases requires, “forbearance” periods from loan collection in some circumstances. Interest that accrues during a forbearance period is never subsidized. When a borrower ends forbearance and enters repayment, the account is considered current. When a borrower exits grace, deferment or forbearance, any interest that has not been subsidized is generally capitalized and added to the outstanding principal amount.
PLUS and SLS Loan Programs
The Higher Education Act authorized PLUS Loans to be made to parents of eligible dependent students and graduate and professional students and originally authorized SLS Loans to be made to the categories of students later served by the Unsubsidized Stafford Loan program. Borrowers who had no adverse credit history or who were able to secure an endorser without an adverse credit history were eligible for PLUS Loans, as well as some borrowers with extenuating circumstances. The basic provisions applicable to PLUS and SLS Loans are similar to those of Stafford Loans for federal insurance and reinsurance. However, interest subsidy payments are not available under the PLUS and SLS programs and, in some instances, special allowance payments are more restricted.
Loan Limits. PLUS and SLS Loans disbursed before July 1, 1993 were limited to $4,000 per academic year with a maximum aggregate amount of $20,000. The annual loan limits for SLS Loans disbursed on or after July 1, 1993 range from $4,000 for first and second year undergraduate borrowers to $10,000 for graduate borrowers, with a maximum aggregate amount of $23,000 for undergraduate borrowers and $73,000 for graduate and professional borrowers.
The annual and aggregate amounts of PLUS Loans first disbursed on or after July 1, 1993 were limited only to the difference between the cost of the student’s education and other financial aid received, including scholarship, grants and other education loans.
Interest. The interest rates for PLUS Loans and SLS Loans are presented in the chart below.
For PLUS or SLS Loans that bear interest based on a variable rate, the rate is set annually for 12-month periods, from July 1 through June 30, on the preceding June 1 and is equal to the lesser of:
| • | the applicable maximum borrower rate |
and
| • | the sum of: |
| • | the applicable 1-year Index or the bond equivalent rate of 91-day Treasury bills, as applicable, |
and
| • | the applicable interest rate margin. |
Under current law, PLUS Loans with a first disbursement on or after July 1, 2006 will return to a fixed annual interest rate of 8.5%.
A-8
Table of Contents
Until July 1, 2001, the 1-year index was the bond equivalent rate of 52-week Treasury bills auctioned at the final auction held prior to each June 1. Beginning July 1, 2001, the 1-year index is the weekly average 1-year constant maturity Treasury, as published by the Board of Governors of the Federal Reserve System, for the last calendar week ending on or before the June 26 immediately preceding the July 1 reset date.
| Trigger Date |
Borrower Rate |
Maximum Borrower Rate |
Interest Rate Margin | |||
| Before 10/01/81 |
9% | N/A | N/A | |||
| From 10/01/81 through 10/30/82 |
14% | N/A | N/A | |||
| From 11/01/82 through 06/30/87 |
12% | N/A | N/A | |||
| From 07/01/87 through 09/30/92 |
1-year Index + Interest Rate Margin | 12% | 3.25% | |||
| From 10/01/92 through 06/30/94 |
1-year Index + Interest Rate Margin | PLUS 10%, SLS 11% |
3.10% | |||
| From 07/01/94 through 06/30/98 |
1-year Index + Interest Rate Margin | 9% | 3.10% | |||
| From 07/01/98 through 06/30/06 |
91-day Treasury + Interest Rate Margin | 9% | 3.10% | |||
| From 07/01/06 |
8.5% | 8.5% | N/A |
A holder of a PLUS or SLS Loan is eligible to receive special allowance payments during any quarter if:
| • | the borrower rate is set at the maximum borrower rate and |
| • | the sum of the average of the bond equivalent rates of 91-day Treasury bills auctioned during that quarter and the applicable interest rate margin exceeds the maximum borrower rate. |
Effective July 1, 2006, this limitation on special allowance payments for PLUS Loans made on or after January 1, 2000 was repealed.
Repayment; Deferments. Borrowers begin to repay principal on their PLUS and SLS Loans no later than 60 days after the final disbursement, unless they use deferment available for the in-school period and the six-month post enrollment period. Deferment and forbearance provisions, maximum loan repayment periods, repayment plans and minimum payment amounts for PLUS and SLS loans are generally the same as those for Stafford Loans.
Consolidation Loan Program
The enactment of HCERA ended new originations under the FFELP consolidation program, effective July 1, 2010. Previously, the Higher Education Act authorized a program under which borrowers could consolidate one or more of their education loans into a single Consolidation Loan that is insured and reinsured on a basis similar to Stafford and PLUS Loans. Consolidation Loans were made in an amount sufficient to pay outstanding principal, unpaid interest, late charges and collection costs on all federally reinsured education loans incurred under the FFELP that the borrower selects for consolidation, as well as loans made under various other federal education loan programs and loans made by different lenders. In general, a borrower’s eligibility to consolidate federal education loans ends upon receipt of a Consolidation Loan. With the end of new FFELP originations, borrowers with multiple loans, including FFELP loans, may only consolidate their loans under the FDLP.
Consolidation Loans made on or after July 1, 1994 had no minimum loan amount. Consolidation Loans for which an application was received on or after January 1, 1993 but before July 1, 1994 were available only to borrowers who had aggregate outstanding education loan balances of at least $7,500. For applications received before January 1, 1993, Consolidation Loans were available only to borrowers who had aggregate outstanding education loan balances of at least $5,000.
To obtain a FFELP Consolidation Loan, the borrower was required to be either in repayment status or in a grace period before repayment begins. For applications received on or after January 1, 1993, delinquent or defaulted borrowers were eligible to obtain Consolidation Loans if they re-entered repayment through loan
A-9
Table of Contents
consolidation. Prior to July 1, 2006, married couples who agreed to be jointly and severally liable could apply for one Consolidation Loan. In some cases, borrowers could enter repayment status while still in school and thereby become eligible to obtain a Consolidation Loan.
Consolidation Loans bear interest at a fixed rate equal to the greater of the weighted average of the interest rates on the unpaid principal balances of the consolidated loans rounded up to the nearest whole percent and 9% for loans originated before July 1, 1994. For Consolidation Loans made on or after July 1, 1994 and for which applications were received before November 13, 1997, the weighted average interest rate is rounded up to the nearest whole percent. Consolidation Loans made on or after July 1, 1994 for which applications were received on or after November 13, 1997 through September 30, 1998 bear interest at the annual variable rate applicable to Stafford Loans subject to a cap of 8.25%. Consolidation Loans for which the application is received on or after October 1, 1998 bear interest at a fixed rate equal to the lesser of (i) the weighted average interest rate of the loans being consolidated rounded up to the nearest one-eighth of one percent or (ii) 8.25%.
The 1998 reauthorization maintained interest rates for borrowers of Federal Direct Consolidation Loans whose applications were received prior to February 1, 1999 at 7.46%, which rates are adjusted annually based on a formula equal to the 91-day Treasury bill rate plus 2.3%. The borrower interest rates on Federal Direct Consolidation Loans for borrowers whose applications were received on or after February 1, 1999 and before July 1, 2006 is a fixed rate equal to the lesser of the weighted average of the interest rates of the loans consolidated, adjusted up to the nearest one-eighth of one percent, and 8.25%. This is the same rate that the 1998 legislation set on FFELP Consolidation Loans for borrowers whose applications were received on or after October 1, 1998 and before July 1, 2006. The 1998 legislation, as modified by the 1999 act and in 2002, set the special allowance payment rate for FFELP Consolidation Loans at the three-month commercial paper (financial) rate plus 2.64% for loans disbursed on or after January 1, 2000 and before July 1, 2006. Public Law 112-74, dated December 23, 2011, allowed FFELP lenders to make an election to permanently change the index for special allowance payment calculations on all FFELP loans in the lender’s portfolio (with certain exceptions) disbursed after January 1, 2000 from the three-month commercial paper (financial) rate to the one-month LIBOR index, commencing with the special allowance payment calculations for the calendar quarter beginning on April 1, 2012. Lenders of FFELP Consolidation Loans pay a reinsurance fee to the Department of Education. All other guarantee fees may be passed on to the borrower.
Interest on Consolidation Loans accrues and, for applications received before January 1, 1993, is paid without interest subsidy by the Department of Education. For Consolidation Loans for which applications were received between January 1, 1993 and August 10, 1993, all interest of the borrower is paid during all deferment periods. Consolidation Loans for which applications were received on or after August 10, 1993 are subsidized only if all of the underlying loans being consolidated were Subsidized Stafford Loans. In the case of Consolidation Loans made on or after November 13, 1997, the portion of a Consolidation Loan that is comprised of Subsidized Stafford Loans retains subsidy benefits.
No insurance premium was charged to a borrower or a lender in connection with a Consolidation Loan. However, FFELP lenders were required to pay an origination fee to the Department of Education of 0.50% on principal of Consolidation Loans disbursed and a monthly rebate fee to the Department of Education at an annualized rate of 1.05% on principal of and interest on Consolidation Loans disbursed on or after October 1, 1993, or at an annualized rate of 0.62% for Consolidation Loan applications received between October 1, 1998 and January 31, 1999. The rate for special allowance payments for Consolidation Loans is determined in the same manner as for other FFELP loans.
A borrower must begin to repay his Consolidation Loan within 60 days after his consolidated loans have been disbursed. For applications received on or after January 1, 1993, repayment schedule options include graduated or income-driven repayment plans. Loans are repaid over periods determined by the sum of the Consolidation Loan and the amount of the borrower’s other eligible education loans outstanding. The lender may, at its option, include graduated and income-driven repayment plans in connection with education loans for which the applications were received before that date. The maximum maturity schedule is 30 years for indebtedness of $60,000 or more.
A-10
Table of Contents
Guaranty Agencies under the FFELP
Under the FFELP, guaranty agencies guarantee loans made by eligible lending institutions, paying claims from “federal student loan reserve funds.” These loans are guaranteed as to 100% of principal and accrued interest against death or discharge. The guaranty agency also pays 100% of the unpaid principal and accrued interest on PLUS Loans, where the student on whose behalf the loan was borrowed dies.
FFELP loans are also insured against default, with the percent insured dependent on the date of the related loan’s disbursement. For loans made prior to October 1, 1993, lenders are insured against default for 100% of principal and accrued interest. For loans disbursed from October 1, 1993 through June 30, 2006, lenders are insured against default for 98% of principal and accrued interest. For loans disbursed on or after July 1, 2006, lenders are insured against default for 97% of principal and accrued interest.
The Department of Education reinsures guaranty agencies for amounts paid to lenders on loans that are discharged or defaulted. The reimbursement rate on discharged loans is for 100% of the amount paid to the holder. The reimbursement rate for defaulted loans decreases as a guaranty agency’s default rate increases. The first trigger for a lower reinsurance rate is when the amount of defaulted loan reimbursements exceeds 5% of the amount of all loans guaranteed by the agency in repayment status at the beginning of the federal fiscal year. The second trigger is when the amount of defaults exceeds 9% of the loans in repayment. Guaranty agency reinsurance rates are presented in the table below.
| Claims Paid Date |
Maximum | 5% Trigger | 9% Trigger | |||||||||
| Before October 1, 1993 |
100 | % | 90 | % | 80 | % | ||||||
| October 1, 1993 — September 30, 1998 |
98 | % | 88 | % | 78 | % | ||||||
| On or after October 1, 1998 |
95 | % | 85 | % | 75 | % | ||||||
After the Department of Education reimburses a guaranty agency for a default claim, the guaranty agency attempts to collect the loan from the borrower. However, the Department of Education requires that the defaulted loans be assigned to it when the guaranty agency is not successful. A guaranty agency also refers defaulted loans to the Department of Education to “offset” any federal income tax refunds or other federal reimbursement that may be due the borrowers. Some states have similar offset programs.
To be eligible for federal reinsurance, FFELP loans must meet the requirements of the Higher Education Act and the regulations issued thereunder. Generally, these regulations require that lenders determine whether the applicant is an eligible borrower attending an eligible institution, explain to borrowers their responsibilities under the loan, ensure that the promissory notes evidencing the loan are executed by the borrower, and disburse the loan proceeds as required. After the loan is made, the lender must establish repayment terms with the borrower, properly administer deferments and forbearances, credit the borrower for payments made, and report the loan’s status to credit reporting agencies. If a borrower becomes delinquent in repaying a loan, a lender must perform collection procedures that vary depending upon the length of time a loan is delinquent. The collection procedures consist of telephone calls, demand letters, skiptracing procedures and requesting assistance from the guaranty agency.
A lender may submit a default claim to the guaranty agency after the related education loan has been delinquent for at least 270 days. The guaranty agency must review and pay the claim within 90 days after the lender filed it. The guaranty agency will pay the lender interest accrued on the loan for up to 450 days after delinquency. The guaranty agency must file a reimbursement claim with the Secretary within 30 days after the guaranty agency paid the lender for the default claim. Following payment of claims, the guaranty agency endeavors to collect the loan. Guaranty agencies also must meet statutory and regulatory requirements for collecting loans.
Education Loan Discharges
FFELP loans are not generally dischargeable in bankruptcy. Under the United States Bankruptcy Code, before an education loan may be discharged, the borrower must demonstrate that repaying it would cause the
A-11
Table of Contents
borrower or his family undue hardship. When a FFELP borrower files for bankruptcy, collection of the loan is suspended during the time of the proceeding. If the borrower files under the “wage earner” provisions of the United States Bankruptcy Code or files a petition for discharge on the grounds of undue hardship, then the lender transfers the loan to the guaranty agency which guaranteed that loan and that agency then participates in the bankruptcy proceeding. When the proceeding is complete, unless there was a finding of undue hardship, the loan is transferred back to the lender and collection resumes.
Education loans are discharged if the borrower dies or becomes totally and permanently disabled. If a school closes while a student is enrolled, or within 120 days after the student withdrew, loans made for that enrollment period are discharged. If a school falsely certifies that a borrower is eligible for the loan, the loan may be discharged, and if a school fails to make a refund to which a student is entitled, the loan is discharged to the extent of the unpaid refund. Effective July 1, 2006, a loan is also eligible for discharge if it is determined that the borrower’s eligibility for the loan was falsely certified as a result of a crime of identity theft.
Rehabilitation of Defaulted Loans
The Department of Education is authorized to enter into agreements with a guaranty agency under which such guaranty agency may sell defaulted loans that are eligible for rehabilitation to an eligible lender. For a loan to be eligible for rehabilitation the related guaranty agency must have received reasonable and affordable payments originally for 12 months which was reduced to 9 payments in 10 months effective July 1, 2006, and then the borrower may request that the loan be rehabilitated. Because monthly payments are usually greater after rehabilitation, not all borrowers opt for rehabilitation. Upon rehabilitation, a borrower is again eligible for all the benefits under the Higher Education Act for which he or she is not eligible as a borrower on a defaulted loan, such as new federal aid, and the negative credit record is expunged. No education loan may be rehabilitated more than once.
The July 1, 2009 technical corrections made to the Higher Education Act under H.R. 1777, Public Law 111-39 provide authority, between July 1, 2009 through September 30, 2011, for a guaranty agency to assign a defaulted loan to the Department of Education depending on market conditions.
The Bipartisan Budget Act of 2013 reduced the charge that a guaranty agency may assess to a borrower to defray the collection cost for assisting a borrower with the rehabilitation of a defaulted FFELP loan. The change was effective for loans sold by a guaranty agency to an eligible lender on or after July 1, 2014
Guarantor Funding
In addition to administering the federal reserve funds, from which claims are paid, guaranty agencies are charged with responsibility for maintaining records on all loans which they have insured (“account maintenance”), assisting lenders to prevent default by delinquent borrowers (“default aversion”), post-default loan administration and collections and program awareness and oversight. These activities are funded by revenues from the following statutorily prescribed sources plus earnings on investments.
| Source |
Basis | |
| Insurance Premium |
Up to 1% of the principal amount guaranteed, withheld from the proceeds of each loan disbursement | |
| Loan Processing and Issuance Fee |
0.40% of the principal amount guaranteed, paid by the Department of Education | |
| Account Maintenance Fee |
Originally 0.10%, which was reduced to 0.06% on October 1, 2007, of the original principal amount of loans outstanding, paid by the Department of Education |
A-12
Table of Contents
| Default Aversion Fee |
1% of the outstanding amount of loans submitted by a lender for default aversion assistance, minus 1% of the unpaid principal and interest paid on default claims, which is paid once per loan by transfers out of the Student Loan Reserve Fund | |
| Collection Retention Fee |
16% of the amount collected on loans on which reinsurance has been paid (10% or 18.5% of the amount collected for a defaulted loan that is purchased by a lender for consolidation or rehabilitation, respectively), withheld from gross receipts |
The Higher Education Act requires guaranty agencies to establish two funds: a Federal Student Loan Reserve Fund and an Agency Operating Fund. The Federal Student Loan Reserve Fund contains the payments received from the Department of Education and insurance premiums. The fund is federal property and its assets may be used only to pay Default Aversion Fees. Collection fees on defaulted loans are deposited into the Agency Operating Fund. The Agency Operating Fund is the guaranty agency’s property and is not subject to strict limitations on its use.
Department of Education Oversight
If the Department of Education determines that a guaranty agency is unable to meet its insurance obligations, the holders of loans insured by that guaranty agency may submit claims directly to the Department of Education and the Department of Education is required to pay the full reimbursement amounts due, in accordance with claim processing standards no more stringent than those applied by the affected guaranty agency. However, the Department of Education’s obligation to pay guarantee claims directly in this fashion is contingent upon the Department of Education determining a guaranty agency is unable to meet its obligations. While there have been situations where the Department of Education has made such determinations regarding affected guaranty agencies, there can be no assurances as to whether the Department of Education must make such determinations in the future or whether payments of reimbursement amounts would be made in a timely manner.
A-13
Table of Contents
Listed below are definitions of key terms that are used throughout this document. See also Appendix A “Description of Federal Family Education Loan Program” for a further discussion of the FFELP.
Consolidation Loan Rebate Fee — All holders of FFELP Consolidation Loans are required to pay to the U.S. Department of Education an annual 1.05 percent Consolidation Loan Rebate Fee on all outstanding principal and accrued interest balances of FFELP Consolidation Loans purchased or originated after October 1, 1993, except for loans for which consolidation applications were received between October 1, 1998 and January 31, 1999, where the Consolidation Loan Rebate Fee is 62 basis points.
Constant Prepayment Rate (“CPR”) — A variable in life-of-loan estimates that measures the rate at which loans in the portfolio prepay before their stated maturity. The CPR is directly correlated to the average life of the portfolio. CPR equals the percentage of loans that prepay annually as a percentage of the beginning of period balance.
“Core Earnings” — We prepare financial statements in accordance with generally accepted accounting principles in the United States of America (“GAAP”). In addition to evaluating our GAAP-based financial information, management evaluates the business segments on a basis that, as allowed under the Financial Accounting Standards Board’s (“FASB”) Accounting Standards Codification (“ASC”) 280, “Segment Reporting,” differs from GAAP. We refer to management’s basis of evaluating its segment results as “Core Earnings” presentations for each business segment and refer to these performance measures in its presentations with credit rating agencies and lenders. While “Core Earnings” results are not a substitute for reported results under GAAP, we rely on “Core Earnings” performance measures in operating each business segment because we believe these measures provide additional information regarding the operational and performance indicators that are most closely assessed by management.
“Core Earnings” performance measures are the primary financial performance measures used by management to evaluate performance and to allocate resources. Accordingly, financial information is reported to management on a “Core Earnings” basis by reportable segment, as these are the measures used regularly by our chief operating decision makers. “Core Earnings” performance measures are used in developing our financial plans, tracking results, and establishing corporate performance targets and incentive compensation. Management believes this information provides additional insight into the financial performance of our core business activities. “Core Earnings” performance measures are not defined terms within GAAP and may not be comparable to similarly titled measures reported by other companies. Our “Core Earnings” presentation does not represent another comprehensive basis of accounting.
See “Note 15 — Segment Reporting” and Item 7. “Management’s Discussion and Analysis of Financial Condition and Results of Operations — ‘Core Earnings’ — Definition and Limitations — Differences between ‘Core Earnings’ and GAAP” for further discussion of the differences between “Core Earnings” and GAAP, as well as reconciliations between “Core Earnings” and GAAP.
DSLP — The William D. Ford Federal Direct Loan Program.
DSLP Loans — Educational loans provided by the DSLP (see definition above) to students and parent borrowers directly through ED (see definition below) rather than through a bank or other lender. Also referred to as Direct Loans.
ED — The U.S. Department of Education.
FFELP — The Federal Family Education Loan Program, formerly the Guaranteed Education Loan Program, a program that was discontinued in 2010.
G-1
Table of Contents
FFELP Consolidation Loans — Under the FFELP, borrowers with multiple eligible education loans may have consolidated them into a single education loan with one lender at a fixed rate for the life of the loan. The new loan is considered a FFELP Consolidation Loan. The borrower rate on a FFELP Consolidation Loan is fixed for the term of the loan and was set by the weighted average interest rate of the loans being consolidated, rounded up to the nearest 1/8th of a percent, not to exceed 8.25 percent. Holders of FFELP Consolidation Loans are eligible to earn interest under the Special Allowance Payment (“SAP”) formula. In April 2008, we suspended originating new FFELP Consolidation Loans.
FFELP Stafford and Other Education Loans — Education loans to students or parents of students that are guaranteed or reinsured under the FFELP. The loans are primarily Stafford loans but also include PLUS and HEAL loans. The FFELP was discontinued in 2010.
Fixed Rate Floor Income — Fixed Rate Floor Income is Floor Income associated with education loans with borrower rates that are fixed to term (primarily FFELP Consolidation Loans and Stafford Loans originated on or after July 1, 2006).
Floor Income — For loans disbursed before April 1, 2006, FFELP Loans generally earn interest at the higher of either the borrower rate, which is fixed over a period of time, or a floating rate based on the SAP formula. We generally finance our education loan portfolio with floating rate debt whose interest is matched closely to the floating nature of the applicable SAP formula. If interest rates decline to a level at which the borrower rate exceeds the SAP formula rate, we continue to earn interest on the loan at the fixed borrower rate while the floating rate interest on our debt continues to decline. In these interest rate environments, we refer to the additional spread it earns between the fixed borrower rate and the SAP formula rate as Floor Income. Depending on the type of education loan and when it was originated, the borrower rate is either fixed to term or is reset to a market rate each July 1. As a result, for loans where the borrower rate is fixed to term, we may earn Floor Income for an extended period of time, and for those loans where the borrower interest rate is reset annually on July 1, we may earn Floor Income to the next reset date. In accordance with legislation enacted in 2006, lenders are required to rebate Floor Income to ED for all FFELP Loans disbursed on or after April 1, 2006.
The following example shows the mechanics of Floor Income for a typical fixed rate FFELP Consolidation Loan (with a LIBOR-based SAP spread of 2.64 percent):
| Fixed Borrower Rate |
4.25 | % | ||
| SAP Spread over LIBOR |
(2.64 | ) | ||
|
|
|
|||
| Floor Strike Rate(1) |
1.61 | % | ||
|
|
|
|||
|
(1) The interest rate at which the underlying index (LIBOR, Treasury bill or commercial paper) plus the fixed SAP spread equals the fixed borrower rate. Floor Income is earned anytime the interest rate of the underlying index declines below this rate. |
| |||
Based on this example, if the quarterly average LIBOR rate is over 1.61 percent, the holder of the education loan will earn at a floating rate based on the SAP formula, which in this example is a fixed spread to LIBOR of 2.64 percent. On the other hand, if the quarterly average LIBOR rate is below 1.61 percent, the SAP formula will produce a rate below the fixed borrower rate of 4.25 percent and the loan holder earns at the borrower rate of 4.25 percent.
G-2
Table of Contents
Graphic Depiction of Floor Income:
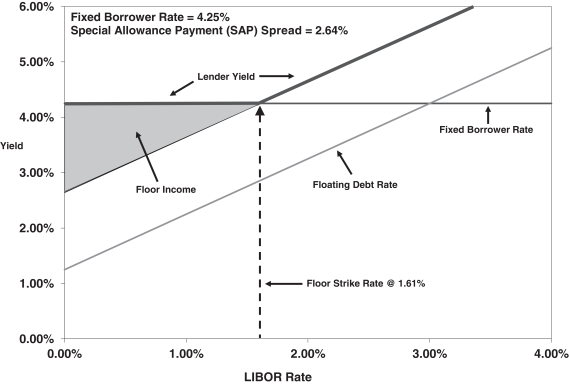
Floor Income Contracts — We enter into contracts with counterparties under which, in exchange for an upfront contractual payment representing the present value of the Floor Income that we expect to earn on a notional amount of underlying education loans being economically hedged, we will pay the counterparties the Floor Income earned on that notional amount over the life of the Floor Income Contract. Specifically, we agree to pay the counterparty the difference, if positive, between the fixed borrower rate less the SAP (see definition below) spread and the average of the applicable interest rate index on that notional amount, regardless of the actual balance of underlying education loans, over the life of the contract. The contracts generally do not extend over the life of the underlying education loans. This contract effectively locks in the amount of Floor Income we will earn over the period of the contract. Floor Income Contracts are not considered effective hedges under ASC 815, “Derivatives and Hedging,” and each quarter we must record the change in fair value of these contracts through income.
GAAP — Generally accepted accounting principles in the United States of America.
Guarantor(s) — State agencies or non-profit companies that guarantee (or insure) FFELP Loans made by eligible lenders under The Higher Education Act of 1965 (“HEA”), as amended.
HCERA — The Health Care and Education Reconciliation Act of 2010.
Private Education Loans — Education loans to students or their families that bear the full credit risk of the customer and any cosigner. Private Education Loans are made primarily to bridge the gap between the cost of higher education and the amount funded through financial aid, federal loans or students’ and families’ resources. Private Education Loans include loans for higher education (undergraduate and graduate degrees) and for alternative education, such as career training, private kindergarten through secondary education schools and tutorial schools. Certain higher education loans have repayment terms similar to FFELP Loans, whereby repayments begin after the borrower leaves school while others require repayment of interest or a fixed pay
G-3
Table of Contents
amount while the borrower is still in school. Our higher education Private Education Loans are not dischargeable in bankruptcy, except in certain limited circumstances.
In the context of our Private Education Loan business, we use the term “non-traditional loans” to describe education loans made to certain customers that have or are expected to have a high default rate as a result of a number of factors, including having a lower tier credit rating, low program completion and graduation rates or, where the customer is expected to graduate, a low expected income relative to the customer’s cost of attendance. Non-traditional loans are loans to customers attending for-profit schools with an original FICO score of less than 670 and customers attending not-for-profit schools with an original FICO score of less than 640. The FICO score used in determining whether a loan is non-traditional is the greater of the customer or cosigner FICO score at origination.
Repayment Borrower Benefits — Financial incentives offered to borrowers based on pre-determined qualifying factors, which are generally tied directly to making on-time monthly payments. The impact of Repayment Borrower Benefits is dependent on the estimate of the number of borrowers who will eventually qualify for these benefits and the amount of the financial benefit offered to the borrower.
Residual Interest — When we securitize education loans, we retain the right to receive cash flows from the education loans sold to trusts that we sponsor in excess of amounts needed to pay derivative costs (if any), other fees, and the principal and interest on the bonds backed by the education loans.
Risk Sharing — When a FFELP Loan first disbursed on and after July 1, 2006 defaults, the federal government guarantees 97 percent of the principal balance plus accrued interest (98 percent on loans disbursed before July 1, 2006) and the holder of the loan is at risk for the remaining amount not guaranteed as a Risk Sharing loss on the loan. FFELP Loans originated after October 1, 1993 are subject to Risk Sharing on loan default claim payments unless the default results from the borrower’s death, disability or bankruptcy.
Special Allowance Payment (“SAP”) — FFELP Loans disbursed prior to April 1, 2006 (with the exception of certain PLUS and Supplemental Loans to Students (“SLS”) loans discussed below) generally earn interest at the greater of the borrower rate or a floating rate determined by reference to the average of the applicable floating rates (LIBOR, 91-day Treasury bill rate or commercial paper) in a calendar quarter, plus a fixed spread that is dependent upon when the loan was originated and the loan’s repayment status. If the resulting floating rate exceeds the borrower rate, ED pays the difference directly to us. This payment is referred to as the Special Allowance Payment or SAP and the formula used to determine the floating rate is the SAP formula. We refer to the fixed spread to the underlying index as the SAP spread. For loans disbursed after April 1, 2006, FFELP Loans effectively only earn at the SAP rate, as the excess interest earned when the borrower rate exceeds the SAP rate (Floor Income) must be refunded to ED.
Variable rate PLUS Loans and SLS Loans earn SAP only if the variable rate, which is reset annually, exceeds the applicable maximum borrower rate. For PLUS Loans disbursed on or after January 1, 2000, this limitation on SAP was repealed effective April 1, 2006.
TDR — Troubled Debt Restructuring. The accounting and reporting standards for loan modifications and TDRs are primarily found in FASB’s ASC 310-40, “Troubled Debt Restructurings by Creditors.”
TIVAS — Title IV Additional Servicers. These are four large education loan servicers awarded a contract with ED to service federal loans owned by ED.
Variable Rate Floor Income — Variable Rate Floor Income is Floor Income that is earned only through the next date at which the borrower interest rate is reset to a market rate. For FFELP Stafford Loans whose borrower interest rate resets annually on July 1, we may earn Floor Income based on a calculation of the difference between the borrower rate and the then current interest rate.
G-4