Attached files
| file | filename |
|---|---|
| EX-32.1 - EXHIBIT 32.1 - MACERICH CO | mac-2016x1231x10kxex321.htm |
| EX-31.2 - EXHIBIT 31.2 - MACERICH CO | mac-2016x1231x10kxex312.htm |
| EX-31.1 - EXHIBIT 31.1 - MACERICH CO | mac-2016x1231x10kxex311.htm |
| EX-23.1 - EXHIBIT 23.1 - MACERICH CO | mac-2016x12x31x10kex231xco.htm |
| EX-21.1 - EXHIBIT 21.1 - MACERICH CO | mac-2016x1231x10kxex211xsu.htm |
UNITED STATES
SECURITIES AND EXCHANGE COMMISSION
Washington, D.C. 20549
FORM 10-K
ANNUAL REPORT PURSUANT TO SECTION 13 OR 15(d)
OF THE SECURITIES EXCHANGE ACT OF 1934
FOR THE FISCAL YEAR ENDED DECEMBER 31, 2016
Commission File No. 1-12504
THE MACERICH COMPANY
(Exact name of registrant as specified in its charter)
MARYLAND (State or other jurisdiction of incorporation or organization) | 95-4448705 (I.R.S. Employer Identification Number) | |
401 Wilshire Boulevard, Suite 700, Santa Monica, California 90401 (Address of principal executive office, including zip code) | ||
Registrant's telephone number, including area code (310) 394-6000
Securities registered pursuant to Section 12(b) of the Act
Title of each class | Name of each exchange on which registered | |
Common Stock, $0.01 Par Value | New York Stock Exchange | |
Securities registered pursuant to Section 12(g) of the Act: None
Indicate by check mark if the registrant is a well-known seasoned issuer, as defined in Rule 405 of the Securities Act YES ý NO o
Indicate by check mark if the registrant is not required to file reports pursuant to Section 13 or Section 15(d) of the Act YES o NO ý
Indicate by check mark whether the registrant (1) has filed all reports required to be filed by Section 13 or 15(d) of the Securities Exchange Act of 1934 during the preceding 12 months (or for such shorter period that the registrant was required to file such reports) and (2) has been subject to such filing requirements for the past 90 days. YES ý NO o
Indicate by check mark whether the registrant has submitted electronically and posted on its corporate Web site, if any, every Interactive Data File required to be submitted and posted pursuant to Rule 405 of Regulation S-T (§ 232.405 of this chapter) during the preceding 12 months (or for such shorter period that the registrant was required to submit and post such files). YES ý NO o
Indicate by check mark if disclosure of delinquent filers pursuant to Item 405 of Regulation S-K is not contained herein, and will not be contained, to the best of registrant's knowledge, in definitive proxy or information statements incorporated by reference in Part III of this Form 10-K or any amendment on to this Form 10-K. o
Indicate by check mark whether the registrant is a large accelerated filer, an accelerated filer, a non-accelerated filer, or a smaller reporting company. See definitions of "large accelerated filer," "accelerated filer," and "smaller reporting company" in Rule 12b-2 of the Exchange Act. (Check one):
Large accelerated filer ý | Accelerated filer o | Non-accelerated filer o (Do not check if a smaller reporting company) | Smaller reporting company o | |||
Indicate by check mark whether the registrant is a shell company (as defined in Rule 12b-2 of the Exchange Act). YES o NO ý
The aggregate market value of voting and non-voting common equity held by non-affiliates of the registrant was approximately $12.3 billion as of the last business day of the registrant's most recently completed second fiscal quarter based upon the price at which the common shares were last sold on that day.
Number of shares outstanding of the registrant's common stock, as of February 21, 2017: 143,904,832 shares
DOCUMENTS INCORPORATED BY REFERENCE
Portions of the proxy statement for the annual stockholders meeting to be held in 2017 are incorporated by reference into Part III of this Form 10-K.
THE MACERICH COMPANY
ANNUAL REPORT ON FORM 10-K
FOR THE YEAR ENDED DECEMBER 31, 2016
INDEX
Page | ||
2
PART I
IMPORTANT FACTORS RELATED TO FORWARD-LOOKING STATEMENTS
This Annual Report on Form 10-K of The Macerich Company (the "Company") contains statements that constitute forward-looking statements within the meaning of the federal securities laws. Any statements that do not relate to historical or current facts or matters are forward-looking statements. You can identify some of the forward-looking statements by the use of forward-looking words, such as "may," "will," "could," "should," "expects," "anticipates," "intends," "projects," "predicts," "plans," "believes," "seeks," "estimates," "scheduled" and variations of these words and similar expressions. Statements concerning current conditions may also be forward-looking if they imply a continuation of current conditions. Forward-looking statements appear in a number of places in this Form 10-K and include statements regarding, among other matters:
• | expectations regarding the Company's growth; |
• | the Company's beliefs regarding its acquisition, redevelopment, development, leasing and operational activities and opportunities, including the performance of its retailers; |
• | the Company's acquisition, disposition and other strategies; |
• | regulatory matters pertaining to compliance with governmental regulations; |
• | the Company's capital expenditure plans and expectations for obtaining capital for expenditures; |
• | the Company's expectations regarding income tax benefits; |
• | the Company's expectations regarding its financial condition or results of operations; and |
• | the Company's expectations for refinancing its indebtedness, entering into and servicing debt obligations and entering into joint venture arrangements. |
Stockholders are cautioned that any such forward-looking statements are not guarantees of future performance and involve risks, uncertainties and other factors that may cause actual results, performance or achievements of the Company or the industry to differ materially from the Company's future results, performance or achievements, or those of the industry, expressed or implied in such forward-looking statements. Such factors include, among others, general industry, as well as national, regional and local economic and business conditions, which will, among other things, affect demand for retail space or retail goods, availability and creditworthiness of current and prospective tenants, anchor or tenant bankruptcies, closures, mergers or consolidations, lease rates, terms and payments, interest rate fluctuations, availability, terms and cost of financing and operating expenses; adverse changes in the real estate markets including, among other things, competition from other companies, retail formats and technology, risks of real estate development and redevelopment, acquisitions and dispositions; the liquidity of real estate investments, governmental actions and initiatives (including legislative and regulatory changes); environmental and safety requirements; and terrorist activities or other acts of violence which could adversely affect all of the above factors. You are urged to carefully review the disclosures we make concerning risks and other factors that may affect our business and operating results, including those made in "Item 1A. Risk Factors" of this Annual Report on Form 10-K, as well as our other reports filed with the Securities and Exchange Commission ("SEC"). You are cautioned not to place undue reliance on these forward-looking statements, which speak only as of the date of this document. The Company does not intend, and undertakes no obligation, to update any forward-looking information to reflect events or circumstances after the date of this document or to reflect the occurrence of unanticipated events, unless required by law to do so.
ITEM 1. BUSINESS
General
The Company is involved in the acquisition, ownership, development, redevelopment, management and leasing of regional and community/power shopping centers located throughout the United States. The Company is the sole general partner of, and owns a majority of the ownership interests in, The Macerich Partnership, L.P., a Delaware limited partnership (the "Operating Partnership"). As of December 31, 2016, the Operating Partnership owned or had an ownership interest in 50 regional shopping centers and seven community/power shopping centers. These 57 regional and community/power shopping centers (which include any related office space) consist of approximately 56 million square feet of gross leasable area (“GLA”) and are referred to herein as the “Centers”. The Centers consist of consolidated Centers (“Consolidated Centers”) and unconsolidated joint venture Centers (“Unconsolidated Joint Venture Centers”) as set forth in “Item 2. Properties,” unless the context otherwise requires.
3
The Company is a self-administered and self-managed real estate investment trust ("REIT") and conducts all of its operations through the Operating Partnership and the Company's management companies, Macerich Property Management Company, LLC, a single member Delaware limited liability company, Macerich Management Company, a California corporation, Macerich Arizona Partners LLC, a single member Arizona limited liability company, Macerich Arizona Management LLC, a single member Delaware limited liability company, Macerich Partners of Colorado LLC, a single member Colorado limited liability company, MACW Mall Management, Inc., a New York corporation, and MACW Property Management, LLC, a single member New York limited liability company. All seven of the management companies are owned by the Company and are collectively referred to herein as the "Management Companies."
The Company was organized as a Maryland corporation in September 1993. All references to the Company in this Annual Report on Form 10-K include the Company, those entities owned or controlled by the Company and predecessors of the Company, unless the context indicates otherwise.
Financial information regarding the Company for each of the last three fiscal years is contained in the Company's Consolidated Financial Statements included in "Item 15. Exhibits and Financial Statement Schedule."
Recent Developments
Acquisitions and Dispositions:
On January 6, 2016, the Company sold a 40% ownership interest in Arrowhead Towne Center, a 1,197,000 square foot regional shopping center in Glendale, Arizona, for $289.5 million, resulting in a gain on the sale of assets of $101.6 million. The sales price was funded by a cash payment of $129.5 million and the assumption of a pro rata share of the mortgage note payable on the property of $160.0 million. The Company used the cash proceeds from the sale to pay down its line of credit and for general corporate purposes, which included funding the Special Dividend (See "Other Transactions and Events" in Recent Developments).
On January 14, 2016, the Company formed a joint venture, whereby the Company sold a 49% ownership interest in Deptford Mall, a 1,039,000 square foot regional shopping center in Deptford, New Jersey; FlatIron Crossing, a 1,431,000 square foot regional shopping center in Broomfield, Colorado; and Twenty Ninth Street, an 847,000 square foot regional shopping center in Boulder, Colorado (the "MAC Heitman Portfolio"), for $771.5 million, resulting in a gain on the sale of assets of $340.7 million. The sales price was funded by a cash payment of $478.6 million and the assumption of a pro rata share of the mortgage notes payable on the properties of $292.9 million. The Company used the cash proceeds from the sale to pay down its line of credit and for general corporate purposes.
On March 1, 2016, the Company through a 50/50 joint venture, acquired Country Club Plaza, a 1,246,000 square foot regional shopping center in Kansas City, Missouri, for a purchase price of $660.0 million. The Company funded its pro rata share of $330.0 million with borrowings under its line of credit.
On April 13, 2016, the Company sold Capitola Mall, a 586,000 square foot regional shopping center in Capitola, California, for $93.0 million, resulting in a gain on the sale of assets of $24.9 million. The Company used the proceeds from the sale to pay down its line of credit and for general corporate purposes.
On May 31, 2016, the Company sold a former Mervyn's store in Yuma, Arizona, for $3.2 million, resulting in a loss on the sale of assets of $3.1 million. The Company used the proceeds from the sale to pay down its line of credit and for general corporate purposes.
On January 18, 2017, the Company sold Cascade Mall, a 589,000 square foot regional shopping center in Burlington, Washington; and Northgate Mall, a 750,000 square foot regional shopping center in San Rafael, California, in a combined transaction for $170.0 million. The proceeds from the sale were used to pay off the mortgage note payable on Northgate Mall, pay down the Company's line of credit and for general corporate purposes. Consequently, Cascade Mall and Northgate Mall have been excluded from certain 2016 performance metrics and related discussions in this "Item 1. Business," including major tenants, average base rents, cost of occupancy, lease expirations and anchors (See "Major Tenants," "Mall Stores and Freestanding Stores," "Cost of Occupancy," "Lease Expirations" and "Anchors" below). In addition, Cascade Mall and Northgate Mall have been excluded from the Company's list of properties and related computations of GLA and occupancy (See "Item 2. Properties").
4
Financing Activity:
On January 6, 2016, the Company replaced the existing loan on Arrowhead Towne Center with a new $400.0 million loan that bears interest at an effective rate of 4.05% and matures on February 1, 2028, which resulted in a loss of $3.6 million on the early extinguishment of debt. Concurrently, a 40% interest in the loan was assumed by a third party in connection with the sale of a 40% ownership interest in the underlying property (See "Acquisitions and Dispositions" in Recent Developments). The Company used the proceeds to pay down its line of credit and for general corporate purposes.
On January 14, 2016, the Company placed a $150.0 million loan on Twenty Ninth Street that bears interest at an effective rate of 4.10% and matures on February 6, 2026. Concurrently, a 49% interest in the loan was assumed by a third party in connection with the sale of a 49% ownership interest in the MAC Heitman Portfolio (See "Acquisitions and Dispositions" in Recent Developments). The Company used the proceeds to pay down its line of credit and for general corporate purposes.
On March 28, 2016, the Company's joint venture in Country Club Plaza placed a $320.0 million loan on the property that bears interest at an effective rate of 3.88% and matures on April 1, 2026. The Company used its share of the proceeds to pay down its line of credit and for general corporate purposes.
On May 27, 2016, the Company's joint venture in The Shops at North Bridge replaced the existing loan on the property with a new $375.0 million loan that bears interest at an effective rate of 3.71% and matures on June 1, 2028. The Company used its share of the excess proceeds to pay down its line of credit and for general corporate purposes.
On July 6, 2016, the Company modified and amended its line of credit. The amended $1.5 billion line of credit bears interest at LIBOR plus a spread of 1.30% to 1.90%, depending on the Company's overall leverage level, and matures on July 6, 2020 with a one-year extension option. Based on the Company's leverage level as of the amendment date, the initial borrowing rate on the facility was LIBOR plus 1.33%. The line of credit can be expanded, depending on certain conditions, up to a total facility of $2.0 billion.
On August 5, 2016, the Company’s joint venture in The Village at Corte Madera replaced the existing loan on the property with a new $225.0 million loan that bears interest at an effective rate of 3.53% and matures on September 1, 2028. The Company used its share of the excess proceeds to pay down its line of credit and for general corporate purposes.
On October 6, 2016, the Company placed a $325.0 million loan on Fresno Fashion Fair that bears interest at an effective rate of 3.67% and matures on November 1, 2026. The Company used the proceeds to pay down its line of credit and for general corporate purposes.
On February 1, 2017, the Company's joint venture in West Acres replaced the existing loan on the property with a new $80.0 million loan that bears interest at an effective rate of 4.61% and matures on March 1, 2032. The Company used its share of the excess proceeds to pay down its line of credit and for general corporate purposes.
On February 2, 2017, the Company's joint venture in Kierland Commons entered into a loan commitment with a lender to replace the existing loan on the property with a new $225.0 million loan that will bear interest at a fixed rate of 3.95% for ten-years. The new loan is expected to close in March 2017. The Company expects to use its share of the excess proceeds to pay down its line of credit and for general corporate purposes.
Redevelopment and Development Activity:
In February 2014, the Company's joint venture in Broadway Plaza started construction on the 235,000 square foot expansion of the 923,000 square foot regional shopping center in Walnut Creek, California. The joint venture completed a portion of the first phase of the project in November 2015 and the remaining portion of the first phase was completed in September 2016. The second phase will be completed through Summer 2018. The total cost of the project is estimated to be $305.0 million, with $152.5 million estimated to be the Company's pro rata share. The Company has funded $127.7 million of the total $255.4 million incurred by the joint venture as of December 31, 2016.
In July 2015, the Company started construction on a 335,000 square foot expansion of Green Acres Mall, a 2,089,000 square foot regional shopping center in Valley Stream, New York. The Company completed the project in October 2016. As of December 31, 2016, the Company has incurred $104.9 million in costs.
The Company's joint venture is proceeding with the development of Fashion Outlets of Philadelphia, a redevelopment of an 850,000 square foot regional shopping center in Philadelphia, Pennsylvania. The project is expected to be completed in 2018. The total cost of the project is estimated to be between $305.0 million and $365.0 million, with $152.5 million to $182.5 million estimated to be the Company's pro rata share. The Company has funded $46.9 million of the total $93.7 million incurred by the joint venture as of December 31, 2016.
5
The Company is currently in the process of redeveloping the 250,000 square foot former Sears store at Kings Plaza Shopping Center. The Company expects to complete the project in Summer 2018. As of December 31, 2016, the Company has incurred $10.0 million in costs and anticipates the total cost of the project to be between $95.0 million and $100.0 million.
Other Transactions and Events:
On January 6, 2016, the Company paid a Special Dividend (See "Item 7. Management's Discussion and Analysis of Financial Condition and Results of Operations—Other Transactions and Events") of $2.00 per share of common stock and per Operating Partnership ("OP") Unit to common stockholders and OP Unit holders of record on November 12, 2015. The Special Dividend was funded from borrowings under its line of credit.
On September 30, 2015, the Company's Board of Directors authorized the repurchase of up to $1.2 billion of the Company's outstanding common shares over the period ending September 30, 2017, as market conditions warranted (the "2015 Stock Buyback Program"). On November 12, 2015, the Company entered into an accelerated share repurchase program ("ASR") to repurchase $400.0 million of the Company's common stock. In accordance with the ASR, the Company made a prepayment of $400.0 million and received an initial share delivery of 4,140,788 shares. On January 19, 2016, the ASR was completed and the Company received an additional delivery of 970,609 shares. The average price of the 5,111,397 shares repurchased under the ASR was $78.26 per share. The ASR was funded from proceeds in connection to the recently completed PPR Portfolio transaction (See "Item 7. Management's Discussion and Analysis of Financial Condition and Results of Operations—Management's Overview and Summary").
On February 17, 2016, the Company entered into an ASR to repurchase $400.0 million of the Company's common stock. In accordance with the ASR, the Company made a prepayment of $400.0 million and received an initial share delivery of 4,222,193 shares. On April 19, 2016, the ASR was completed and the Company received delivery of an additional 861,235 shares. The average price of the 5,083,428 shares repurchased under the ASR was $78.69 per share. The ASR was funded from borrowings under the Company's line of credit, which had been paid down from the proceeds from the recently completed PPR Portfolio, Arrowhead Towne Center and MAC Heitman Portfolio transactions (See "Acquisitions and Dispositions" and "Financing Activity" in Recent Developments), collectively referred to herein as the "Joint Venture Transactions".
On May 9, 2016, the Company entered into an ASR to repurchase the remaining $400.0 million of the Company's common stock authorized for repurchase. In accordance with the ASR, the Company made a prepayment of $400.0 million and received an initial share delivery of 3,964,812 shares. On July 11, 2016, the ASR was completed and the Company received delivery of an additional 1,104,162 shares. The average price of the 5,068,974 shares repurchased under the ASR was $78.91 per share. The ASR was funded from borrowings under the Company's line of credit, which had been paid down from the proceeds from the recently completed Joint Venture Transactions. The total number of shares repurchased under the 2015 Stock Buyback Program was 15,263,799 at an average price of $78.62.
On July 15, 2016, the Company conveyed Flagstaff Mall, a 347,000 square foot regional shopping center in Flagstaff, Arizona, to the mortgage lender by a deed-in-lieu of foreclosure and was discharged from the mortgage note payable. The mortgage note payable was a non-recourse loan. As a result, the Company recognized a gain of $5.3 million on the extinguishment of debt.
On February 13, 2017, the Company announced that the Board of Directors has authorized the repurchase of up to $500.0 million of its outstanding common shares as market conditions and the Company’s liquidity warrant. Repurchases may be made through open market purchases, privately negotiated transactions, structured or derivative transactions, including ASR transactions, or other methods of acquiring shares and pursuant to Rule 10b5-1 of the Securities Act of 1934, from time to time as permitted by securities laws and other legal requirements.
The Shopping Center Industry
General:
There are several types of retail shopping centers, which are differentiated primarily based on size and marketing strategy. Regional shopping centers generally contain in excess of 400,000 square feet of GLA and are typically anchored by two or more department or large retail stores ("Anchors") and are referred to as "Regional Shopping Centers" or "Malls." Regional Shopping Centers also typically contain numerous diversified retail stores ("Mall Stores"), most of which are national or regional retailers typically located along corridors connecting the Anchors. "Strip centers", "urban villages" or "specialty centers" ("Community/Power Shopping Centers") are retail shopping centers that are designed to attract local or neighborhood customers and are typically anchored by one or more supermarkets, discount department stores and/or drug stores. Community/Power Shopping Centers typically contain 100,000 to 400,000 square feet of GLA. Outlet Centers generally contain a wide variety of designer and manufacturer stores, often located in an open-air center, and typically range in size from 200,000 to 850,000 square feet of GLA ("Outlet Centers"). In addition, freestanding retail stores are located along the perimeter of the
6
shopping centers ("Freestanding Stores"). Mall Stores and Freestanding Stores over 10,000 square feet of GLA are also referred to as "Big Box." Anchors, Mall Stores, Freestanding Stores and other tenants typically contribute funds for the maintenance of the common areas, property taxes, insurance, advertising and other expenditures related to the operation of the shopping center.
Regional Shopping Centers:
A Regional Shopping Center draws from its trade area by offering a variety of fashion merchandise, hard goods and services and entertainment, often in an enclosed, climate controlled environment with convenient parking. Regional Shopping Centers provide an array of retail shops and entertainment facilities and often serve as the town center and a gathering place for community, charity and promotional events.
Regional Shopping Centers have generally provided owners with relatively stable income despite the cyclical nature of the retail business. This stability is due both to the diversity of tenants and to the typical dominance of Regional Shopping Centers in their trade areas.
Regional Shopping Centers have different strategies with regard to price, merchandise offered and tenant mix, and are generally tailored to meet the needs of their trade areas. Anchors are located along common areas in a configuration designed to maximize consumer traffic for the benefit of the Mall Stores. Mall GLA, which generally refers to GLA contiguous to the Anchors for tenants other than Anchors, is leased to a wide variety of smaller retailers. Mall Stores typically account for the majority of the revenues of a Regional Shopping Center.
Business of the Company
Strategy:
The Company has a long-term four-pronged business strategy that focuses on the acquisition, leasing and management, redevelopment and development of Regional Shopping Centers.
Acquisitions. The Company principally focuses on well-located, quality Regional Shopping Centers that can be dominant in their trade area and have strong revenue enhancement potential. In addition, the Company pursues other opportunistic acquisitions of property that include retail and will complement the Company's portfolio such as Outlet Centers. The Company subsequently seeks to improve operating performance and returns from these properties through leasing, management and redevelopment. Since its initial public offering, the Company has acquired interests in shopping centers nationwide. The Company believes that it is geographically well positioned to cultivate and maintain ongoing relationships with potential sellers and financial institutions and to act quickly when acquisition opportunities arise (See "Acquisitions and Dispositions" in Recent Developments).
Leasing and Management. The Company believes that the shopping center business requires specialized skills across a broad array of disciplines for effective and profitable operations. For this reason, the Company has developed a fully integrated real estate organization with in-house acquisition, accounting, development, finance, information technology, leasing, legal, marketing, property management and redevelopment expertise. In addition, the Company emphasizes a philosophy of decentralized property management, leasing and marketing performed by on-site professionals. The Company believes that this strategy results in the optimal operation, tenant mix and drawing power of each Center, as well as the ability to quickly respond to changing competitive conditions of the Center's trade area.
The Company believes that on-site property managers can most effectively operate the Centers. Each Center's property manager is responsible for overseeing the operations, marketing, maintenance and security functions at the Center. Property managers focus special attention on controlling operating costs, a key element in the profitability of the Centers, and seek to develop strong relationships with and be responsive to the needs of retailers.
The Company generally utilizes regionally located leasing managers to better understand the market and the community in which a Center is located. The Company continually assesses and fine tunes each Center's tenant mix, identifies and replaces underperforming tenants and seeks to optimize existing tenant sizes and configurations.
On a selective basis, the Company provides property management and leasing services for third parties. The Company currently manages two regional shopping centers and three community centers for third party owners on a fee basis.
Redevelopment. One of the major components of the Company's growth strategy is its ability to redevelop acquired properties. For this reason, the Company has built a staff of redevelopment professionals who have primary responsibility for identifying redevelopment opportunities that they believe will result in enhanced long-term financial returns and market position for the Centers. The redevelopment professionals oversee the design and construction of the projects in addition to obtaining required governmental approvals (See "Redevelopment and Development Activity" in Recent Developments).
7
Development. The Company pursues ground-up development projects on a selective basis. The Company has supplemented its strong acquisition, operations and redevelopment skills with its ground-up development expertise to further increase growth opportunities (See "Redevelopment and Development Activity" in Recent Developments).
The Centers:
As of December 31, 2016, the Centers primarily included 48 Regional Shopping Centers, excluding Cascade Mall and Northgate Mall, and seven Community/Power Shopping Centers totaling approximately 54 million square feet of GLA. These 55 Centers average approximately 929,000 square feet of GLA and range in size from 3.5 million square feet of GLA at Tysons Corner Center to 185,000 square feet of GLA at Boulevard Shops. As of December 31, 2016, excluding Cascade Mall and Northgate Mall, the Centers primarily included 193 Anchors totaling approximately 26.5 million square feet of GLA and approximately 5,400 Mall Stores and Freestanding Stores totaling approximately 25.1 million square feet of GLA.
Competition:
Numerous owners, developers and managers of malls, shopping centers and other retail-oriented real estate compete with the Company for the acquisition of properties and in attracting tenants or Anchors to occupy space. There are seven other publicly traded mall companies and several large private mall companies in the United States, any of which under certain circumstances could compete against the Company for an Anchor or a tenant. In addition, these companies, as well as other REITs, private real estate companies or investors compete with the Company in terms of property acquisitions. This results in competition both for the acquisition of properties or centers and for tenants or Anchors to occupy space. Competition for property acquisitions may result in increased purchase prices and may adversely affect the Company's ability to make suitable property acquisitions on favorable terms. The existence of competing shopping centers could have a material adverse impact on the Company's ability to lease space and on the level of rents that can be achieved. There is also increasing competition from other retail formats and technologies, such as lifestyle centers, power centers, outlet centers, Internet shopping, home shopping networks, catalogs, telemarketing and discount shopping clubs that could adversely affect the Company's revenues.
In making leasing decisions, the Company believes that retailers consider the following material factors relating to a center: quality, design and location, including consumer demographics; rental rates; type and quality of Anchors and retailers at the center; and management and operational experience and strategy of the center. The Company believes it is able to compete effectively for retail tenants in its local markets based on these criteria in light of the overall size, quality and diversity of its Centers.
8
Major Tenants:
The Centers, excluding Cascade Mall and Northgate Mall, derived approximately 76% of their total rents for the year ended December 31, 2016 from Mall Stores and Freestanding Stores under 10,000 square feet, and Big Box and Anchor tenants accounted for 24% of total rents for the year ended December 31, 2016. Total rents as set forth in "Item 1. Business" include minimum rents and percentage rents.
The following retailers (including their subsidiaries) represent the 10 largest tenants in the Centers, excluding Cascade Mall and Northgate Mall, based upon total rents in place as of December 31, 2016:
Tenant | Primary DBAs | Number of Locations in the Portfolio | % of Total Rents | |||||
L Brands, Inc. | Victoria's Secret, Bath and Body Works, PINK | 94 | 2.7 | % | ||||
Forever 21, Inc. | Forever 21, XXI Forever, Love21 | 34 | 2.5 | % | ||||
Foot Locker, Inc. | Champs Sports, Foot Locker, Kids Foot Locker, Lady Foot Locker, Foot Action, House of Hoops SIX:02 and others | 93 | 1.9 | % | ||||
Gap, Inc., The | Athleta, Banana Republic, Gap, Gap Kids, Old Navy and others | 57 | 1.9 | % | ||||
Signet Jewelers | Gordon's Jewelers, Jared Jewelry, Kay Jewelers, Piercing Pagoda, Rogers Jewelers, Shaw's Jewelers, Weisfield Jewelers and Zales | 102 | 1.6 | % | ||||
Dick's Sporting Goods, Inc. | Dick's Sporting Goods, Chelsea Collective | 16 | 1.5 | % | ||||
H & M Hennes & Mauritz AB | H & M | 24 | 1.5 | % | ||||
Golden Gate Capital | Payless ShoeSource, Eddie Bauer, California Pizza Kitchen, PacSun | 78 | 1.2 | % | ||||
American Eagle Outfitters, Inc. | American Eagle Outfitters, aerie | 36 | 1.1 | % | ||||
Sears Holdings Corporation | Sears | 22 | 1.0 | % | ||||
Mall Stores and Freestanding Stores:
Mall Store and Freestanding Store leases generally provide for tenants to pay rent comprised of a base (or "minimum") rent and a percentage rent based on sales. In some cases, tenants pay only minimum rent, and in other cases, tenants pay only percentage rent. The Company generally enters into leases for Mall Stores and Freestanding Stores that also require tenants to pay a stated amount for operating expenses, generally excluding property taxes, regardless of the expenses the Company actually incurs at any Center. However, certain leases for Mall Stores and Freestanding Stores contain provisions that only require tenants to pay their pro rata share of maintenance of the common areas, property taxes, insurance, advertising and other expenditures related to the operations of the Center.
Tenant space of 10,000 square feet and under in the Company's portfolio at December 31, 2016, excluding Cascade Mall and Northgate Mall, comprises approximately 76% of all Mall Store and Freestanding Store space. The Company uses tenant spaces of 10,000 square feet and under for comparing rental rate activity because this space is more consistent in terms of shape and configuration and, as such, the Company is able to provide a meaningful comparison of rental rate activity for this space. Mall Store and Freestanding Store space greater than 10,000 square feet is inconsistent in size and configuration throughout the Company's portfolio and as a result does not lend itself to a meaningful comparison of rental rate activity with the Company's other space. Most of the non-Anchor space over 10,000 square feet is not physically connected to the mall, does not share the same common area amenities and does not benefit from the foot traffic in the mall. As a result, space greater than 10,000 square feet has a unique rent structure that is inconsistent with mall space under 10,000 square feet.
9
The following tables set forth the average base rent per square foot for the Centers, as of December 31 for each of the past five years:
Mall Stores and Freestanding Stores under 10,000 square feet:
For the Years Ended December 31, | Avg. Base Rent Per Sq. Ft.(1)(2) | Avg. Base Rent Per Sq. Ft. on Leases Executed During the Year(2)(3) | Avg. Base Rent Per Sq. Ft. on Leases Expiring During the Year(2)(4) | ||||||||
Consolidated Centers: | |||||||||||
2016 | $ | 53.51 | $ | 53.48 | $ | 44.77 | |||||
2015 | $ | 52.64 | $ | 53.99 | $ | 49.02 | |||||
2014 | $ | 49.68 | $ | 49.55 | $ | 41.20 | |||||
2013 | $ | 44.51 | $ | 45.06 | $ | 40.00 | |||||
2012 | $ | 40.98 | $ | 44.01 | $ | 38.00 | |||||
Unconsolidated Joint Venture Centers (at the Company's pro rata share): | |||||||||||
2016 | $ | 57.90 | $ | 64.78 | $ | 57.29 | |||||
2015 | $ | 60.74 | $ | 80.18 | $ | 60.85 | |||||
2014 | $ | 63.78 | $ | 82.47 | $ | 64.59 | |||||
2013 | $ | 62.47 | $ | 63.44 | $ | 48.43 | |||||
2012 | $ | 55.64 | $ | 55.72 | $ | 48.74 | |||||
Big Box and Anchors:
For the Years Ended December 31, | Avg. Base Rent Per Sq. Ft.(1)(2) | Avg. Base Rent Per Sq. Ft. on Leases Executed During the Year(2)(3) | Number of Leases Executed During the Year | Avg. Base Rent Per Sq. Ft. on Leases Expiring During the Year(2)(4) | Number of Leases Expiring During the Year | ||||||||||||
Consolidated Centers: | |||||||||||||||||
2016 | $ | 13.34 | $ | 22.23 | 20 | $ | 19.12 | 8 | |||||||||
2015 | $ | 12.72 | $ | 19.87 | 19 | $ | 8.96 | 14 | |||||||||
2014 | $ | 11.26 | $ | 18.28 | 22 | $ | 15.16 | 14 | |||||||||
2013 | $ | 10.94 | $ | 14.61 | 29 | $ | 14.08 | 21 | |||||||||
2012 | $ | 9.34 | $ | 15.54 | 21 | $ | 8.85 | 22 | |||||||||
Unconsolidated Joint Venture Centers (at the Company's pro rata share): | |||||||||||||||||
2016 | $ | 15.76 | $ | 29.41 | 13 | $ | 28.00 | 1 | |||||||||
2015 | $ | 14.48 | $ | 33.00 | 14 | $ | 9.30 | 8 | |||||||||
2014 | $ | 18.51 | $ | 33.62 | 11 | $ | 27.27 | 6 | |||||||||
2013 | $ | 13.36 | $ | 37.45 | 22 | $ | 24.58 | 10 | |||||||||
2012 | $ | 12.52 | $ | 23.25 | 21 | $ | 8.88 | 10 | |||||||||
_____________________
(1) | Average base rent per square foot is based on spaces occupied as of December 31 for each of the Centers and gives effect to the terms of each lease in effect, as of such date, including any concessions, abatements and other adjustments or allowances that have been granted to the tenants. |
(2) | Centers under development and redevelopment are excluded from average base rents. As a result, the leases for Broadway Plaza, Fashion Outlets of Philadelphia, Paradise Valley Mall and Westside Pavilion are excluded for the years ended December 31, 2016, 2015, and 2014. The leases for Fashion Outlets of Niagara Falls, USA and SouthPark Mall are excluded for the years ended December 31, 2015 and 2014. The leases for Paradise Valley Mall are excluded for the year ended December 31, 2013. The leases for The Shops at Atlas Park and Southridge Center are excluded for the year ended December 31, 2012. |
10
The leases for Cascade Mall and Northgate Mall, which were sold on January 18, 2017, are excluded for the year ended December 31, 2016. Flagstaff Mall was conveyed to the mortgage lender by a deed-in-lieu of foreclosure on July 15, 2016 and is excluded for the year ended December 31, 2015. On June 30, 2015, Great Northern Mall was conveyed to the mortgage lender by a deed-in-lieu of foreclosure. Consequently, Great Northern Mall is excluded for the year ended December 31, 2014. The leases for Rotterdam Square, which was sold on January 15, 2014, are excluded for the year ended December 31, 2013.
(3) | The average base rent per square foot on leases executed during the year represents the actual rent paid on a per square foot basis during the first twelve months of the lease. |
(4) | The average base rent per square foot on leases expiring during the year represents the actual rent to be paid on a per square foot basis during the final twelve months of the lease. |
Cost of Occupancy:
A major factor contributing to tenant profitability is cost of occupancy, which consists of tenant occupancy costs charged by the Company. Tenant expenses included in this calculation are minimum rents, percentage rents and recoverable expenditures, which consist primarily of property operating expenses, real estate taxes and repair and maintenance expenditures. These tenant charges are collectively referred to as tenant occupancy costs. These tenant occupancy costs are compared to tenant sales. A low cost of occupancy percentage shows more potential capacity for the Company to increase rents at the time of lease renewal than a high cost of occupancy percentage. The following table summarizes occupancy costs for Mall Store and Freestanding Store tenants in the Centers as a percentage of total Mall Store sales for the last five years:
For the Years Ended December 31, | ||||||||||||||
2016 (1) | 2015 (2) | 2014 (3) | 2013 (4) | 2012 | ||||||||||
Consolidated Centers: | ||||||||||||||
Minimum rents | 9.4 | % | 9.0 | % | 8.7 | % | 8.4 | % | 8.1 | % | ||||
Percentage rents | 0.4 | % | 0.4 | % | 0.4 | % | 0.4 | % | 0.4 | % | ||||
Expense recoveries(5) | 4.3 | % | 4.5 | % | 4.3 | % | 4.5 | % | 4.2 | % | ||||
14.1 | % | 13.9 | % | 13.4 | % | 13.3 | % | 12.7 | % | |||||
Unconsolidated Joint Venture Centers: | ||||||||||||||
Minimum rents | 8.6 | % | 8.1 | % | 8.7 | % | 8.8 | % | 8.9 | % | ||||
Percentage rents | 0.3 | % | 0.4 | % | 0.4 | % | 0.4 | % | 0.4 | % | ||||
Expense recoveries(5) | 3.9 | % | 4.0 | % | 4.5 | % | 4.0 | % | 3.9 | % | ||||
12.8 | % | 12.5 | % | 13.6 | % | 13.2 | % | 13.2 | % | |||||
_____________________________
(1) | Cascade Mall and Northgate Mall were sold on January 18, 2017 and are excluded for the year ended December 31, 2016. |
(2) | Flagstaff Mall was conveyed to the mortgage lender by a deed-in-lieu of foreclosure on July 15, 2016 and is excluded for the year ended December 31, 2015. |
(3) | Great Northern Mall was conveyed to the mortgage lender by a deed-in-lieu of foreclosure on June 30, 2015 and is excluded for the year ended December 31, 2014. |
(4) | Rotterdam Square was sold on January 15, 2014 and is excluded for the year ended December 31, 2013. |
(5) | Represents real estate tax and common area maintenance charges. |
11
Lease Expirations:
The following tables show scheduled lease expirations for Centers owned as of December 31, 2016, excluding Cascade Mall and Northgate Mall, for the next ten years, assuming that none of the tenants exercise renewal options:
Mall Stores and Freestanding Stores under 10,000 square feet:
Year Ending December 31, | Number of Leases Expiring | Approximate GLA of Leases Expiring(1) | % of Total Leased GLA Represented by Expiring Leases(1) | Ending Base Rent per Square Foot of Expiring Leases(1) | % of Base Rent Represented by Expiring Leases(1) | |||||||||||
Consolidated Centers: | ||||||||||||||||
2017 | 348 | 627,096 | 11.06 | % | $ | 53.71 | 10.78 | % | ||||||||
2018 | 346 | 761,539 | 13.43 | % | $ | 49.98 | 12.18 | % | ||||||||
2019 | 318 | 764,628 | 13.49 | % | $ | 48.82 | 11.95 | % | ||||||||
2020 | 248 | 518,447 | 9.15 | % | $ | 54.00 | 8.96 | % | ||||||||
2021 | 231 | 532,982 | 9.40 | % | $ | 53.46 | 9.12 | % | ||||||||
2022 | 164 | 382,108 | 6.74 | % | $ | 54.10 | 6.62 | % | ||||||||
2023 | 165 | 381,975 | 6.74 | % | $ | 54.39 | 6.65 | % | ||||||||
2024 | 180 | 495,723 | 8.75 | % | $ | 61.62 | 9.78 | % | ||||||||
2025 | 176 | 453,145 | 7.99 | % | $ | 65.28 | 9.47 | % | ||||||||
2026 | 145 | 456,989 | 8.06 | % | $ | 61.58 | 9.01 | % | ||||||||
Unconsolidated Joint Venture Centers (at the Company's pro rata share): | ||||||||||||||||
2017 | 235 | 298,552 | 11.83 | % | $ | 56.79 | 11.13 | % | ||||||||
2018 | 213 | 277,612 | 11.00 | % | $ | 61.71 | 11.24 | % | ||||||||
2019 | 199 | 228,138 | 9.04 | % | $ | 62.31 | 9.33 | % | ||||||||
2020 | 180 | 238,392 | 9.44 | % | $ | 58.84 | 9.21 | % | ||||||||
2021 | 215 | 278,582 | 11.03 | % | $ | 59.18 | 10.82 | % | ||||||||
2022 | 136 | 193,629 | 7.67 | % | $ | 57.48 | 7.30 | % | ||||||||
2023 | 120 | 208,759 | 8.27 | % | $ | 55.25 | 7.57 | % | ||||||||
2024 | 117 | 194,844 | 7.72 | % | $ | 58.58 | 7.49 | % | ||||||||
2025 | 124 | 207,729 | 8.23 | % | $ | 63.91 | 8.71 | % | ||||||||
2026 | 136 | 213,645 | 8.46 | % | $ | 75.78 | 10.63 | % | ||||||||
12
Big Boxes and Anchors:
Year Ending December 31, | Number of Leases Expiring | Approximate GLA of Leases Expiring(1) | % of Total Leased GLA Represented by Expiring Leases(1) | Ending Base Rent per Square Foot of Expiring Leases(1) | % of Base Rent Represented by Expiring Leases(1) | |||||||||||
Consolidated Centers: | ||||||||||||||||
2017 | 21 | 541,354 | 4.87 | % | $ | 14.85 | 4.97 | % | ||||||||
2018 | 18 | 541,672 | 4.87 | % | $ | 10.41 | 3.48 | % | ||||||||
2019 | 25 | 1,024,177 | 9.22 | % | $ | 10.46 | 6.62 | % | ||||||||
2020 | 23 | 908,840 | 8.18 | % | $ | 9.31 | 5.23 | % | ||||||||
2021 | 32 | 1,514,030 | 13.63 | % | $ | 8.98 | 8.40 | % | ||||||||
2022 | 30 | 1,129,808 | 10.17 | % | $ | 17.91 | 12.50 | % | ||||||||
2023 | 19 | 608,892 | 5.48 | % | $ | 14.63 | 5.50 | % | ||||||||
2024 | 21 | 646,036 | 5.81 | % | $ | 24.17 | 9.65 | % | ||||||||
2025 | 23 | 776,630 | 6.99 | % | $ | 23.12 | 11.09 | % | ||||||||
2026 | 14 | 642,015 | 5.78 | % | $ | 13.86 | 5.50 | % | ||||||||
Unconsolidated Joint Venture Centers (at the Company's pro rata share): | ||||||||||||||||
2017 | 8 | 81,013 | 1.59 | % | $ | 33.25 | 3.20 | % | ||||||||
2018 | 20 | 308,128 | 6.05 | % | $ | 16.35 | 5.98 | % | ||||||||
2019 | 11 | 202,221 | 3.97 | % | $ | 25.16 | 6.04 | % | ||||||||
2020 | 24 | 901,156 | 17.69 | % | $ | 11.83 | 12.65 | % | ||||||||
2021 | 19 | 268,669 | 5.27 | % | $ | 18.01 | 5.75 | % | ||||||||
2022 | 17 | 571,611 | 11.22 | % | $ | 8.55 | 5.80 | % | ||||||||
2023 | 12 | 220,042 | 4.32 | % | $ | 21.91 | 5.72 | % | ||||||||
2024 | 19 | 264,001 | 5.18 | % | $ | 34.00 | 10.66 | % | ||||||||
2025 | 20 | 926,165 | 18.18 | % | $ | 13.53 | 14.87 | % | ||||||||
2026 | 20 | 384,418 | 7.55 | % | $ | 24.33 | 11.10 | % | ||||||||
_______________________________________________________________________________
(1) | The ending base rent per square foot on leases expiring during the period represents the final year minimum rent, on a cash basis, for tenant leases expiring during the year. Currently, 57% of leases have provisions for future consumer price index increases that are not reflected in ending base rent. The leases for Centers currently under development and redevelopment are excluded from this table. |
Anchors:
Anchors have traditionally been a major factor in the public's identification with Regional Shopping Centers. Anchors are generally department stores whose merchandise appeals to a broad range of shoppers. Although the Centers receive a smaller percentage of their operating income from Anchors than from Mall Stores and Freestanding Stores, strong Anchors play an important part in maintaining customer traffic and making the Centers desirable locations for Mall Store and Freestanding Store tenants.
Anchors either own their stores, the land under them and in some cases adjacent parking areas, or enter into long-term leases with an owner at rates that are lower than the rents charged to tenants of Mall Stores and Freestanding Stores. Each Anchor that owns its own store and certain Anchors that lease their stores enter into reciprocal easement agreements with the owner of the Center covering, among other things, operational matters, initial construction and future expansion.
Anchors accounted for approximately 7.9% of the Company's total rents for the year ended December 31, 2016, excluding Cascade Mall and Northgate Mall.
13
The following table identifies each Anchor, each parent company that owns multiple Anchors and the number of square feet owned or leased by each such Anchor or parent company in the Company's portfolio, excluding Cascade Mall and Northgate Mall, at December 31, 2016.
Name | Number of Anchor Stores | GLA Owned by Anchor | GLA Leased by Anchor | Total GLA Occupied by Anchor | ||||||||
Macy's Inc. | ||||||||||||
Macy's(1) | 37 | 4,922,000 | 1,931,000 | 6,853,000 | ||||||||
Bloomingdale's | 2 | — | 355,000 | 355,000 | ||||||||
39 | 4,922,000 | 2,286,000 | 7,208,000 | |||||||||
JCPenney | 27 | 1,744,000 | 2,204,000 | 3,948,000 | ||||||||
Sears(1) | 22 | 811,000 | 2,336,000 | 3,147,000 | ||||||||
Dillard's | 14 | 2,205,000 | 257,000 | 2,462,000 | ||||||||
Nordstrom(1) | 13 | 739,000 | 1,477,000 | 2,216,000 | ||||||||
Dick's Sporting Goods | 15 | — | 952,000 | 952,000 | ||||||||
Forever 21 | 7 | 155,000 | 574,000 | 729,000 | ||||||||
Target | 4 | 304,000 | 273,000 | 577,000 | ||||||||
The Bon-Ton Stores, Inc. | ||||||||||||
Younkers | 3 | — | 317,000 | 317,000 | ||||||||
Bon-Ton, The | 1 | — | 71,000 | 71,000 | ||||||||
Herberger's | 1 | 188,000 | — | 188,000 | ||||||||
5 | 188,000 | 388,000 | 576,000 | |||||||||
Hudson Bay Company | ||||||||||||
Lord & Taylor | 3 | 121,000 | 199,000 | 320,000 | ||||||||
Saks Fifth Avenue | 1 | — | 92,000 | 92,000 | ||||||||
4 | 121,000 | 291,000 | 412,000 | |||||||||
Home Depot | 3 | — | 395,000 | 395,000 | ||||||||
Costco | 2 | — | 321,000 | 321,000 | ||||||||
Burlington | 3 | 187,000 | 127,000 | 314,000 | ||||||||
Kohl's | 3 | 89,000 | 200,000 | 289,000 | ||||||||
Neiman Marcus | 2 | — | 188,000 | 188,000 | ||||||||
Von Maur | 2 | 187,000 | — | 187,000 | ||||||||
Walmart | 1 | — | 173,000 | 173,000 | ||||||||
Century 21 | 2 | — | 171,000 | 171,000 | ||||||||
La Curacao | 1 | — | 165,000 | 165,000 | ||||||||
Boscov's | 1 | — | 161,000 | 161,000 | ||||||||
Belk | 2 | — | 139,000 | 139,000 | ||||||||
Primark(2) | 2 | — | 137,000 | 137,000 | ||||||||
BJ's Wholesale Club | 1 | — | 123,000 | 123,000 | ||||||||
Lowe's | 1 | — | 114,000 | 114,000 | ||||||||
Mercado de los Cielos | 1 | — | 78,000 | 78,000 | ||||||||
L.L. Bean | 1 | — | 75,000 | 75,000 | ||||||||
Best Buy | 1 | 66,000 | — | 66,000 | ||||||||
Des Moines Area Community College | 1 | 64,000 | — | 64,000 | ||||||||
Bealls | 1 | — | 40,000 | 40,000 | ||||||||
Vacant Anchors(2)(3) | 8 | — | 755,000 | 755,000 | ||||||||
189 | 11,782,000 | 14,400,000 | 26,182,000 | |||||||||
Anchors at Centers not owned by the Company(4): | ||||||||||||
Forever 21 | 2 | — | 154,000 | 154,000 | ||||||||
Kohl's | 1 | — | 83,000 | 83,000 | ||||||||
Vacant Anchors(3) | 1 | — | 41,000 | 41,000 | ||||||||
Total | 193 | 11,782,000 | 14,678,000 | 26,460,000 | ||||||||
_______________________________
14
(1) | The Anchor has announced its intention of closing one of the locations. |
(2) | The Company anticipates that Primark will open a store at Kings Plaza Shopping Center in 2018 in a portion of the space vacated by Sears. |
(3) | The Company is seeking replacement tenants and/or contemplating redevelopment opportunities for these vacant sites. The Company continues to collect rent under the terms of an agreement regarding two of these vacant Anchor locations. |
(4) | The Company owns an office building and seven stores located at shopping centers not owned by the Company. Of these seven stores, two have been leased to Forever 21, one has been leased to Kohl's, one is vacant and three have been leased for non-Anchor usage. |
Environmental Matters
Each of the Centers has been subjected to an Environmental Site Assessment—Phase I (which involves review of publicly available information and general property inspections, but does not involve soil sampling or ground water analysis) completed by an environmental consultant.
Based on these assessments, and on other information, the Company is aware of the following environmental issues, which may result in potential environmental liability and cause the Company to incur costs in responding to these liabilities or in other costs associated with future investigation or remediation:
• | Asbestos. The Company has conducted asbestos-containing materials ("ACM") surveys at various locations within the Centers. The surveys indicate that ACMs are present or suspected in certain areas, primarily vinyl floor tiles, mastics, roofing materials, drywall tape and joint compounds. The identified ACMs are generally non-friable, in good condition, and possess low probabilities for disturbance. At certain Centers where ACMs are present or suspected, however, some ACMs have been or may be classified as "friable," and ultimately may require removal under certain conditions. The Company has developed and implemented an operations and maintenance ("O&M") plan to manage ACMs in place. |
• | Underground Storage Tanks. Underground storage tanks ("USTs") are or were present at certain Centers, often in connection with tenant operations at gasoline stations or automotive tire, battery and accessory service centers located at such Centers. USTs also may be or have been present at properties neighboring certain Centers. Some of these tanks have either leaked or are suspected to have leaked. Where leakage has occurred, investigation, remediation, and monitoring costs may be incurred by the Company if responsible current or former tenants, or other responsible parties, are unavailable to pay such costs. |
• | Chlorinated Hydrocarbons. The presence of chlorinated hydrocarbons such as perchloroethylene ("PCE") and its degradation byproducts have been detected at certain Centers, often in connection with tenant dry cleaning operations. Where PCE has been detected, the Company may incur investigation, remediation and monitoring costs if responsible current or former tenants, or other responsible parties, are unavailable to pay such costs. |
See "Item 1A. Risk Factors—Possible environmental liabilities could adversely affect us."
Insurance
Each of the Centers has comprehensive liability, fire, extended coverage and rental loss insurance with insured limits customarily carried for similar properties. The Company does not insure certain types of losses (such as losses from wars), because they are either uninsurable or not economically insurable. In addition, while the Company or the relevant joint venture, as applicable, carry specific earthquake insurance on the Centers located in California, the policies are subject to a deductible equal to 5% of the total insured value of each Center, a $100,000 per occurrence minimum and a combined annual aggregate loss limit of $150 million on these Centers. The Company or the relevant joint venture, as applicable, carry specific earthquake insurance on the Centers located in the Pacific Northwest and in the New Madrid Seismic Zone. However, the policies are subject to a deductible equal to 2% of the total insured value of each Center, a $50,000 per occurrence minimum and a combined annual aggregate loss limit of $200 million on these Centers. While the Company or the relevant joint venture also carries standalone terrorism insurance on the Centers, the policies are subject to a $50,000 deductible and a combined annual aggregate loss limit of $1.2 billion. Each Center has environmental insurance covering eligible third‑party losses, remediation and non-owned disposal sites, subject to a $100,000 retention and a $50 million three-year aggregate loss limit, with the exception of one Center, which has a $5 million ten-year aggregate loss limit and another Center, which has a $20 million ten-year aggregate loss limit. Some environmental losses are not covered by this insurance because they are uninsurable or not economically insurable. Furthermore, the Company carries title insurance on substantially all of the Centers for generally less than their full value.
15
Qualification as a Real Estate Investment Trust
The Company elected to be taxed as a REIT under the Internal Revenue Code of 1986, as amended (the "Code"), commencing with its first taxable year ended December 31, 1994, and intends to conduct its operations so as to continue to qualify as a REIT under the Code. As a REIT, the Company generally will not be subject to federal and state income taxes on its net taxable income that it currently distributes to stockholders. Qualification and taxation as a REIT depends on the Company's ability to meet certain dividend distribution tests, share ownership requirements and various qualification tests prescribed in the Code.
Supplemental Tax Disclosures - Updates to REIT Rules
The “Protecting Americans from Tax Hikes Act of 2015” (the “PATH Act”) was enacted on December 18, 2015 and contains several provisions pertaining to REIT qualification and taxation, which are briefly summarized below:
• | Prior to the PATH Act, no more than 25% of the value of the Company's assets may consist of stock or securities of one or more Taxable REIT Subsidiaries ("TRSs"). For taxable years beginning after December 31, 2017, the Act reduces this limit to 20%. |
• | For purposes of the REIT asset tests, the PATH Act provides that debt instruments issued by publicly offered REITs will constitute “real estate assets.” However, unless such a debt instrument is secured by a mortgage or otherwise would have qualified as a real estate asset under prior law, (i) interest income and gain from such a debt instrument is not qualifying income for purposes of the 75% gross income test and (ii) all such debt instruments may represent no more than 25% of the value of the Company's total assets. |
• | For taxable years beginning after December 31, 2015, certain obligations secured by a mortgage on both real property and personal property will be treated as a qualifying real estate asset and give rise to qualifying income for purposes of the 75% gross income test if the fair market value of such personal property does not exceed 15% of the total fair market value of all such property. |
• | A 100% excise tax is imposed on “redetermined TRS service income,” which is income of a TRS attributable to services provided to, or on behalf of its associated REIT and which would otherwise be increased on distribution, apportionment, or allocation under Section 482 of the Code. |
• | For distributions made in taxable years beginning after December 31, 2014, the preferential dividend rules no longer apply to the Company. |
• | Additional exceptions to the rules under the Foreign Investment in Real Property Act (“FIRPTA”) were introduced for non-U.S. persons that constitute “qualified shareholders” (within the meaning of Section 897(k)(3) of the Code) or “qualified foreign pension funds” (within the meaning of Section 897(l)(2) of the Code). |
• | After February 16, 2016, the FIRPTA withholding rate under Section 1445 of the Code for dispositions of U.S. real property interests is increased from 10% to 15%. |
• | The PATH Act increases from 5% to 10% the maximum stock ownership of the REIT that a non-U.S. shareholder may have held to avail itself of the FIRPTA exception for shares regularly traded on an established securities market. |
• | For taxable years beginning after December 31, 2015, personal property shall be treated as a qualifying real estate asset for purposes of the 75% asset test to the extent rent attributable to such personal property is qualifying income under the 75% income test (though any gain attributable to such personal property would still be non-qualifying income for purposes of both the 75% and 95% income tests). |
In addition, the IRS recently issued guidance delaying the imposition of withholding under FATCA to the gross proceeds from a disposition of property that can produce U.S. source interest or dividends. Such withholding will apply only to dispositions occurring after December 31, 2018.
Employees
As of December 31, 2016, the Company had approximately 851 employees, of which approximately 845 were full-time. The Company believes that relations with its employees are good.
16
Seasonality
For a discussion of the extent to which the Company's business may be seasonal, see "Item 7. Management's Discussion and Analysis of Financial Condition and Results of Operations—Management's Overview and Summary—Seasonality."
Available Information; Website Disclosure; Corporate Governance Documents
The Company's corporate website address is www.macerich.com. The Company makes available free-of-charge through this website its reports on Forms 10-K, 10-Q and 8-K and all amendments thereto, as soon as reasonably practicable after the reports have been filed with, or furnished to, the SEC. These reports are available under the heading "Investors—Financial Information—SEC Filings", through a free hyperlink to a third-party service. Information provided on our website is not incorporated by reference into this Form 10-K.
The following documents relating to Corporate Governance are available on the Company's website at www.macerich.com under "Investors—Corporate Governance":
Guidelines on Corporate Governance
Code of Business Conduct and Ethics
Code of Ethics for CEO and Senior Financial Officers
Audit Committee Charter
Compensation Committee Charter
Executive Committee Charter
Nominating and Corporate Governance Committee Charter
You may also request copies of any of these documents by writing to:
Attention: Corporate Secretary
The Macerich Company
401 Wilshire Blvd., Suite 700
Santa Monica, CA 90401
17
ITEM 1A. RISK FACTORS
The following factors could cause our actual results to differ materially from those contained in forward-looking statements made in this Annual Report on Form 10-K and presented elsewhere by our management from time to time. This list should not be considered to be a complete statement of all potential risks or uncertainties as it does not describe additional risks of which we are not presently aware or that we do not currently consider material. We may update our risk factors from time to time in our future periodic reports. Any of these factors may have a material adverse effect on our business, financial condition, operating results and cash flows. For purposes of this “Risk Factor” section, Centers wholly owned by us are referred to as “Wholly Owned Centers” and Centers that are partly but not wholly owned by us are referred to as “Joint Venture Centers.”
RISKS RELATED TO OUR BUSINESS AND PROPERTIES
We invest primarily in shopping centers, which are subject to a number of significant risks that are beyond our control.
Real property investments are subject to varying degrees of risk that may affect the ability of our Centers to generate sufficient revenues to meet operating and other expenses, including debt service, lease payments, capital expenditures and tenant improvements, and to make distributions to us and our stockholders. A number of factors may decrease the income generated by the Centers, including:
• | the national economic climate; |
• | the regional and local economy (which may be negatively impacted by rising unemployment, declining real estate values, increased foreclosures, higher taxes, plant closings, industry slowdowns, union activity, adverse weather conditions, natural disasters and other factors); |
• | local real estate conditions (such as an oversupply of, or a reduction in demand for, retail space or retail goods, decreases in rental rates, declining real estate values and the availability and creditworthiness of current and prospective tenants); |
• | decreased levels of consumer spending, consumer confidence, and seasonal spending (especially during the holiday season when many retailers generate a disproportionate amount of their annual sales); |
• | increasing use by customers of e-commerce and online store sites and the impact of internet sales on the demand for retail space; |
• | negative perceptions by retailers or shoppers of the safety, convenience and attractiveness of a Center; |
• | acts of violence, including terrorist activities; and |
• | increased costs of maintenance, insurance and operations (including real estate taxes). |
Income from shopping center properties and shopping center values are also affected by applicable laws and regulations, including tax, environmental, safety and zoning laws.
A significant percentage of our Centers are geographically concentrated and, as a result, are sensitive to local economic and real estate conditions.
A significant percentage of our Centers are located in California and Arizona. Nine Centers in the aggregate are located in New York, New Jersey and Connecticut. To the extent that weak economic or real estate conditions or other factors affect California, Arizona, New York, New Jersey or Connecticut (or their respective regions) more severely than other areas of the country, our financial performance could be negatively impacted.
We are in a competitive business.
Numerous owners, developers and managers of malls, shopping centers and other retail-oriented real estate compete with us for the acquisition of properties and in attracting tenants or Anchors to occupy space. There are seven other publicly traded mall companies and several large private mall companies in the United States, any of which under certain circumstances could compete against us for an Anchor or a tenant. In addition, these companies, as well as other REITs, private real estate companies or investors compete with us in terms of property acquisitions. This results in competition both for the acquisition of properties or centers and for tenants or Anchors to occupy space. Competition for property acquisitions may result in increased purchase prices and may adversely affect our ability to make suitable property acquisitions on favorable terms. The existence of competing shopping centers could have a material adverse impact on our ability to lease space and on the level of rents that can
18
be achieved. There is also increasing competition from other retail formats and technologies, such as lifestyle centers, power centers, outlet centers, Internet shopping, home shopping networks, catalogs, telemarketing and discount shopping clubs that could adversely affect our revenues.
We may be unable to renew leases, lease vacant space or re-let space as leases expire on favorable terms or at all, which could adversely affect our financial condition and results of operations.
There are no assurances that our leases will be renewed or that vacant space in our Centers will be re-let at net effective rental rates equal to or above the current average net effective rental rates or that substantial rent abatements, tenant improvements, early termination rights or below‑market renewal options will not be offered to attract new tenants or retain existing tenants. If the rental rates at our Centers decrease, if our existing tenants do not renew their leases or if we do not re-let a significant portion of our available space and space for which leases will expire, our financial condition and results of operations could be adversely affected.
If Anchors or other significant tenants experience a downturn in their business, close or sell stores or declare bankruptcy, our financial condition and results of operations could be adversely affected.
Our financial condition and results of operations could be adversely affected if a downturn in the business of, or the bankruptcy or insolvency of, an Anchor or other significant tenant leads them to close retail stores or terminate their leases after seeking protection under the bankruptcy laws from their creditors, including us as lessor. In recent years a number of companies in the retail industry, including some of our tenants, have declared bankruptcy, have gone out of business or have significantly reduced the number of their retail stores. We may be unable to re-let stores vacated as a result of voluntary closures or the bankruptcy of a tenant. Furthermore, certain department stores and other national retailers have experienced, and may continue to experience, decreases in customer traffic in their retail stores, increased competition from alternative retail options such as those accessible via the Internet and other forms of pressure on their business models. If the store sales of retailers operating at our Centers decline significantly due to adverse economic conditions or for any other reason, tenants might be unable to pay their minimum rents or expense recovery charges. In the event of a default by a lessee, the affected Center may experience delays and costs in enforcing its rights as lessor.
In addition, Anchors and/or tenants at one or more Centers might terminate their leases as a result of mergers, acquisitions, consolidations or dispositions in the retail industry. The sale of an Anchor or store to a less desirable retailer may reduce occupancy levels, customer traffic and rental income. Depending on economic conditions, there is also a risk that Anchors or other significant tenants may sell stores operating in our Centers or consolidate duplicate or geographically overlapping store locations. Store closures by an Anchor and/or a significant number of tenants may allow other Anchors and/or certain other tenants to terminate their leases, receive reduced rent and/or cease operating their stores at the Center or otherwise adversely affect occupancy at the Center.
Our real estate acquisition, development and redevelopment strategies may not be successful.
Our historical growth in revenues, net income and funds from operations has been in part tied to the acquisition, development and redevelopment of shopping centers. Many factors, including the availability and cost of capital, our total amount of debt outstanding, our ability to obtain financing on attractive terms, if at all, interest rates and the availability of attractive acquisition targets, among others, will affect our ability to acquire, develop and redevelop additional properties in the future. We may not be successful in pursuing acquisition opportunities, and newly acquired properties may not perform as well as expected. Expenses arising from our efforts to complete acquisitions, develop and redevelop properties or increase our market penetration may have a material adverse effect on our business, financial condition and results of operations. We face competition for acquisitions primarily from other REITs, as well as from private real estate companies or investors. Some of our competitors have greater financial and other resources. Increased competition for shopping center acquisitions may result in increased purchase prices and may impact adversely our ability to acquire additional properties on favorable terms. We cannot guarantee that we will be able to implement our growth strategy successfully or manage our expanded operations effectively and profitably.
We may not be able to achieve the anticipated financial and operating results from newly acquired assets. Some of the factors that could affect anticipated results are:
• | our ability to integrate and manage new properties, including increasing occupancy rates and rents at such properties; |
• | the disposal of non-core assets within an expected time frame; and |
19
• | our ability to raise long-term financing to implement a capital structure at a cost of capital consistent with our business strategy. |
Our business strategy also includes the selective development and construction of retail properties. Any development, redevelopment and construction activities that we may undertake will be subject to the risks of real estate development, including lack of financing, construction delays, environmental requirements, budget overruns, sunk costs and lease-up. Furthermore, occupancy rates and rents at a newly completed property may not be sufficient to make the property profitable. Real estate development activities are also subject to risks relating to the inability to obtain, or delays in obtaining, all necessary zoning, land-use, building, and occupancy and other required governmental permits and authorizations. If any of the above events occur, our ability to pay dividends to our stockholders and service our indebtedness could be adversely affected.
Real estate investments are relatively illiquid and we may be unable to sell properties at the time we desire and on favorable terms.
Investments in real estate are relatively illiquid, which limits our ability to adjust our portfolio in response to changes in economic, market or other conditions. Moreover, there are some limitations under federal income tax laws applicable to REITs that limit our ability to sell assets. In addition, because our properties are generally mortgaged to secure our debts, we may not be able to obtain a release of a lien on a mortgaged property without the payment of the associated debt and/or a substantial prepayment penalty, which restricts our ability to dispose of a property, even though the sale might otherwise be desirable. Furthermore, the number of prospective buyers interested in purchasing shopping centers is limited. Therefore, if we want to sell one or more of our Centers, we may not be able to dispose of it in the desired time period and may receive less consideration than we originally invested in the Center.
Our success depends, in part, on our ability to attract and retain talented employees, and the loss of any one of our key personnel could adversely impact our business.
The success of our business depends, in part, on the leadership and performance of our executive management team and key employees, and our ability to attract, retain and motivate talented employees could significantly impact our future performance. Competition for these individuals is intense, and we cannot assure you that we will retain our executive management team and key employees or that we will be able to attract and retain other highly qualified individuals for these positions in the future. Losing any one or more of these persons could have a material adverse effect on our results of operations, financial condition and cash flows.
Possible environmental liabilities could adversely affect us.
Under various federal, state and local environmental laws, ordinances and regulations, a current or previous owner or operator of real property may be liable for the costs of removal or remediation of hazardous or toxic substances on, under or in that real property. These laws often impose liability whether or not the owner or operator knew of, or was responsible for, the presence of hazardous or toxic substances. The costs of investigation, removal or remediation of hazardous or toxic substances may be substantial. In addition, the presence of hazardous or toxic substances, or the failure to remedy environmental hazards properly, may adversely affect the owner's or operator's ability to sell or rent affected real property or to borrow money using affected real property as collateral.
Persons or entities that arrange for the disposal or treatment of hazardous or toxic substances may also be liable for the costs of removal or remediation of hazardous or toxic substances at the disposal or treatment facility, whether or not that facility is owned or operated by the person or entity arranging for the disposal or treatment of hazardous or toxic substances. Laws exist that impose liability for release of asbestos containing materials (“ACMs”) into the air, and third parties may seek recovery from owners or operators of real property for personal injury associated with exposure to ACMs. In connection with our ownership, operation, management, development and redevelopment of the Centers, or any other centers or properties we acquire in the future, we may be potentially liable under these laws and may incur costs in responding to these liabilities.
20
Some of our properties are subject to potential natural or other disasters.
Some of our Centers are located in areas that are subject to natural disasters, including our Centers in California or in other areas with higher risk of earthquakes, our Centers in flood plains or in areas that may be adversely affected by tornados, as well as our Centers in coastal regions that may be adversely affected by increases in sea levels or in the frequency or severity of hurricanes, tropical storms or other severe weather conditions. The occurrence of natural disasters can delay redevelopment or development projects, increase investment costs to repair or replace damaged properties, increase future property insurance costs and negatively impact the tenant demand for lease space. If insurance is unavailable to us or is unavailable on acceptable terms, or our insurance is not adequate to cover losses from these events, our financial condition and results of operations could be adversely affected.
Uninsured losses could adversely affect our financial condition.
Each of our Centers has comprehensive liability, fire, extended coverage and rental loss insurance with insured limits customarily carried for similar properties. We do not insure certain types of losses (such as losses from wars), because they are either uninsurable or not economically insurable. In addition, while we or the relevant joint venture, as applicable, carry specific earthquake insurance on the Centers located in California, the policies are subject to a deductible equal to 5% of the total insured value of each Center, a $100,000 per occurrence minimum and a combined annual aggregate loss limit of $150 million on these Centers. We or the relevant joint venture, as applicable, carry specific earthquake insurance on the Centers located in the Pacific Northwest and in the New Madrid Seismic Zone. However, the policies are subject to a deductible equal to 2% of the total insured value of each Center, a $50,000 per occurrence minimum and a combined annual aggregate loss limit of $200 million on these Centers. While we or the relevant joint venture also carries standalone terrorism insurance on the Centers, the policies are subject to a $50,000 deductible and a combined annual aggregate loss limit of $1.2 billion. Each Center has environmental insurance covering eligible third‑party losses, remediation and non-owned disposal sites, subject to a $100,000 retention and a $50 million three-year aggregate loss limit, with the exception of one Center, which has a $5 million ten-year aggregate loss limit and another Center has a $20 million ten-year aggregate loss limit. Some environmental losses are not covered by this insurance because they are uninsurable or not economically insurable. Furthermore, we carry title insurance on substantially all of the Centers for generally less than their full value.
If an uninsured loss or a loss in excess of insured limits occurs, we could lose all or a portion of the capital we have invested in a property, as well as the anticipated future revenue from the property, but may remain obligated for any mortgage debt or other financial obligations related to the property.
We face risks associated with security breaches through cyber attacks, cyber intrusions or otherwise, as well as other significant disruptions of our information technology (IT) networks and related systems.
We face risks associated with security breaches, whether through cyber attacks or cyber intrusions over the Internet, malware, computer viruses, attachments to e-mails, persons inside our organization or persons with access to systems inside our organization, and other significant disruptions of our IT networks and related systems. The risk of a security breach or disruption, particularly through cyber attack or cyber intrusion, including by computer hackers, foreign governments and cyber terrorists, has generally increased as the number, intensity and sophistication of attempted attacks and intrusions from around the world have increased. Our IT networks and related systems are essential to the operation of our business and our ability to perform day-to-day operations and, in some cases, may be critical to the operations of certain of our tenants. Although we make efforts to maintain the security and integrity of these types of IT networks and related systems, and we have implemented various measures to manage the risk of a security breach or disruption, there can be no assurance that our security efforts and measures will be effective or that attempted security breaches or disruptions would not be successful or damaging. A security breach or other significant disruption involving our IT networks and related systems could disrupt the proper functioning of our networks and systems; result in misstated financial reports, violations of loan covenants and/or missed reporting deadlines; result in our inability to properly monitor our compliance with the rules and regulations regarding our qualification as a REIT; result in the unauthorized access to, and destruction, loss, theft, misappropriation or release of proprietary, confidential, sensitive or otherwise valuable information of ours or others, which others could use to compete against us or for disruptive, destructive or otherwise harmful purposes and outcomes; require significant management attention and resources to remedy any damages that result; subject us to claims for breach of contract, damages, credits, penalties or termination of leases or other agreements; or damage our reputation among our tenants and investors generally. Moreover, cyber attacks perpetrated against our Anchors and tenants, including unauthorized access to customers’ credit card data and other confidential information, could diminish consumer confidence and consumer spending and negatively impact our business.
21
Possible terrorist activity or other acts or threats of violence and threats to public safety could adversely affect our financial condition and results of operations.
Terrorist attacks and threats of terrorist attacks in the United States or other acts or threats of violence may result in declining economic activity, which could harm the demand for goods and services offered by our tenants and the value of our properties and might adversely affect the value of an investment in our securities. Such a resulting decrease in retail demand could make it difficult for us to renew or re-lease our properties.
Terrorist activities or violence also could directly affect the value of our properties through damage, destruction or loss, and the availability of insurance for such acts, or of insurance generally, might be reduced or cost more, which could increase our operating expenses and adversely affect our financial condition and results of operations. To the extent that our tenants are affected by such attacks and threats of attacks, their businesses similarly could be adversely affected, including their ability to continue to meet obligations under their existing leases. These acts and threats might erode business and consumer confidence and spending and might result in increased volatility in national and international financial markets and economies. Any one of these events might decrease demand for real estate, decrease or delay the occupancy of our new or redeveloped properties, and limit our access to capital or increase our cost of raising capital.
Inflation may adversely affect our financial condition and results of operations.
If inflation increases in the future, we may experience any or all of the following:
• | Difficulty in replacing or renewing expiring leases with new leases at higher rents; |
• | Decreasing tenant sales as a result of decreased consumer spending which could adversely affect the ability of our tenants to meet their rent obligations and/or result in lower percentage rents; and |
• | An inability to receive reimbursement from our tenants for their share of certain operating expenses, including common area maintenance, real estate taxes and insurance. |
Inflation also poses a risk to us due to the possibility of future increases in interest rates. Such increases would adversely impact us due to our outstanding floating-rate debt as well as result in higher interest rates on new fixed-rate debt. In certain cases, we may limit our exposure to interest rate fluctuations related to a portion of our floating-rate debt by the use of interest rate cap and swap agreements. Such agreements, subject to current market conditions, allow us to replace floating-rate debt with fixed-rate debt in order to achieve our desired ratio of floating-rate to fixed-rate debt. However, in an increasing interest rate environment the fixed rates we can obtain with such replacement fixed-rate cap and swap agreements or the fixed-rate on new debt will also continue to increase.
We have substantial debt that could affect our future operations.
Our total outstanding loan indebtedness at December 31, 2016 was $7.6 billion (consisting of $5.0 billion of consolidated debt, less $0.2 billion attributable to noncontrolling interests, plus $2.8 billion of our pro rata share of unconsolidated joint venture mortgage notes and $60.0 million of our pro rata share of an unconsolidated joint venture term loan). Approximately $99.5 million of such indebtedness (at our pro rata share) matures in 2017 after giving effect to refinancing transactions and loan commitments that occurred after December 31, 2016 (See "Item 1. Business—Recent Developments—Acquisitions and Dispositions and Financing Activity"). As a result of this substantial indebtedness, we are required to use a material portion of our cash flow to service principal and interest on our debt, which limits the amount of cash available for other business opportunities. We are also subject to the risks normally associated with debt financing, including the risk that our cash flow from operations will be insufficient to meet required debt service and that rising interest rates could adversely affect our debt service costs. In addition, our use of interest rate hedging arrangements may expose us to additional risks, including that the counterparty to the arrangement may fail to honor its obligations and that termination of these arrangements typically involves costs such as transaction fees or breakage costs. Furthermore, most of our Centers are mortgaged to secure payment of indebtedness, and if income from the Center is insufficient to pay that indebtedness, the Center could be foreclosed upon by the mortgagee resulting in a loss of income and a decline in our total asset value. Certain Centers also have debt that could become recourse debt to us if the Center is unable to discharge such debt obligation and, in certain circumstances, we may incur liability with respect to such debt greater than our legal ownership.
22
We are obligated to comply with financial and other covenants that could affect our operating activities.
Our unsecured credit facilities contain financial covenants, including interest coverage requirements, as well as limitations on our ability to incur debt, make dividend payments and make certain acquisitions. These covenants may restrict our ability to pursue certain business initiatives or certain transactions that might otherwise be advantageous. In addition, failure to meet certain of these financial covenants could cause an event of default under and/or accelerate some or all of such indebtedness which could have a material adverse effect on us.
We depend on external financings for our growth and ongoing debt service requirements.
We depend primarily on external financings, principally debt financings and, in more limited circumstances, equity financings, to fund the growth of our business and to ensure that we can meet ongoing maturities of our outstanding debt. Our access to financing depends on the willingness of banks, lenders and other institutions to lend to us based on their underwriting criteria which can fluctuate with market conditions and on conditions in the capital markets in general. In addition, levels of market disruption and volatility could materially adversely impact our ability to access the capital markets for equity financings. There are no assurances that we will continue to be able to obtain the financing we need for future growth or to meet our debt service as obligations mature, or that the financing will be available to us on acceptable terms, or at all. Any debt refinancing could also impose more restrictive terms.
RISKS RELATED TO OUR ORGANIZATIONAL STRUCTURE
Certain individuals have substantial influence over the management of both us and the Operating Partnership, which may create conflicts of interest.
Under the limited partnership agreement of the Operating Partnership, we, as the sole general partner, are responsible for the management of the Operating Partnership's business and affairs. Two of the principals of the Operating Partnership serve as our executive officers and as members of our board of directors. Accordingly, these principals have substantial influence over our management and the management of the Operating Partnership. As a result, certain decisions concerning our operations or other matters affecting us may present conflicts of interest for these individuals.
Outside partners in Joint Venture Centers result in additional risks to our stockholders.
We own partial interests in property partnerships that own 25 Joint Venture Centers as well as several development sites. We may acquire partial interests in additional properties through joint venture arrangements. Investments in Joint Venture Centers involve risks different from those of investments in Wholly Owned Centers.
We have fiduciary responsibilities to our joint venture partners that could affect decisions concerning the Joint Venture Centers. Third parties in certain Joint Venture Centers (notwithstanding our majority legal ownership) share control of major decisions relating to the Joint Venture Centers, including decisions with respect to sales, refinancings and the timing and amount of additional capital contributions, as well as decisions that could have an adverse impact on us.
In addition, we may lose our management and other rights relating to the Joint Venture Centers if:
• | we fail to contribute our share of additional capital needed by the property partnerships; or |
• | we default under a partnership agreement for a property partnership or other agreements relating to the property partnerships or the Joint Venture Centers. |
Furthermore, the bankruptcy of one of the other investors in our Joint Venture Centers could materially and adversely affect the respective property or properties. Pursuant to the bankruptcy code, we could be precluded from taking some actions affecting the estate of the other investor without prior court approval which would, in most cases, entail prior notice to other parties and a hearing. At a minimum, the requirement to obtain court approval may delay the actions we would or might want to take. If the relevant joint venture through which we have invested in a Joint Venture Center has incurred recourse obligations, the discharge in bankruptcy of one of the other investors might result in our ultimate liability for a greater portion of those obligations than would otherwise be required.
Our legal ownership interest in a joint venture vehicle may, at times, not equal our economic interest in the entity because of various provisions in certain joint venture agreements regarding distributions of cash flow based on capital account balances, allocations of profits and losses and payments of preferred returns. As a result, our actual economic interest (as distinct from our legal ownership interest) in certain of the Joint Venture Centers could fluctuate from time to time and may not
23
wholly align with our legal ownership interests. Substantially all of our joint venture agreements contain rights of first refusal, buy-sell provisions, exit rights, default dilution remedies and/or other break up provisions or remedies which are customary in real estate joint venture agreements and which may, positively or negatively, affect the ultimate realization of cash flow and/or capital or liquidation proceeds.
Our holding company structure makes us dependent on distributions from the Operating Partnership.
Because we conduct our operations through the Operating Partnership, our ability to service our debt obligations and pay dividends to our stockholders is strictly dependent upon the earnings and cash flows of the Operating Partnership and the ability of the Operating Partnership to make distributions to us. Under the Delaware Revised Uniform Limited Partnership Act, the Operating Partnership is prohibited from making any distribution to us to the extent that at the time of the distribution, after giving effect to the distribution, all liabilities of the Operating Partnership (other than some non-recourse liabilities and some liabilities to the partners) exceed the fair value of the assets of the Operating Partnership. An inability to make cash distributions from the Operating Partnership could jeopardize our ability to maintain qualification as a REIT.
An ownership limit and certain of our Charter and bylaw provisions could inhibit a change of control or reduce the value of our common stock.
The Ownership Limit. In order for us to maintain our qualification as a REIT, not more than 50% in value of our outstanding stock (after taking into account certain options to acquire stock) may be owned, directly or indirectly or through the application of certain attribution rules, by five or fewer individuals (as defined in the Internal Revenue Code to include some entities that would not ordinarily be considered “individuals”) at any time during the last half of a taxable year. To assist us in maintaining our qualification as a REIT, among other purposes, our Charter restricts ownership of more than 5% (the “Ownership Limit”) of the lesser of the number or value of our outstanding shares of stock by any single stockholder or a group of stockholders (with limited exceptions). In addition to enhancing preservation of our status as a REIT, the Ownership Limit may:
• | have the effect of delaying, deferring or preventing a change in control of us or other transaction without the approval of our board of directors, even if the change in control or other transaction is in the best interests of our stockholders; and |
• | limit the opportunity for our stockholders to receive a premium for their common stock or preferred stock that they might otherwise receive if an investor were attempting to acquire a block of stock in excess of the Ownership Limit or otherwise effect a change in control of us. |
Our board of directors, in its sole discretion, may waive or modify (subject to limitations and upon any conditions as it may direct) the Ownership Limit with respect to one or more of our stockholders, if it is satisfied that ownership in excess of this limit will not jeopardize our status as a REIT.
Selected Provisions of our Charter, Bylaws and Maryland Law. Some of the provisions of our Charter, bylaws and Maryland law may have the effect of delaying, deferring or preventing a third party from making an acquisition proposal for us and may inhibit a change in control that holders of some, or a majority, of our shares might believe to be in their best interests or that could give our stockholders the opportunity to realize a premium over the then-prevailing market prices for our shares. These provisions include the following:
• | advance notice requirements for stockholder nominations of directors and stockholder proposals to be considered at stockholder meetings; |
• | the obligation of our directors to consider a variety of factors with respect to a proposed business combination or other change of control transaction; |
• | the authority of our directors to classify or reclassify unissued shares and cause the Company to issue shares of one or more classes or series of common stock or preferred stock; |
• | the authority of our directors to create and cause the Company to issue rights entitling the holders thereof to purchase shares of stock or other securities from us; and |
• | limitations on the amendment of our Charter and bylaws, the change in control of us, and the liability of our directors and officers. |
24
In addition, the Maryland General Corporation Law prohibits business combinations between a Maryland corporation and an interested stockholder (which includes any person who beneficially holds 10% or more of the voting power of the corporation's outstanding voting stock or any affiliate or associate of ours who was the beneficial owner, directly or indirectly, of 10% or more of the voting power of the corporation's outstanding stock at any time within the two-year period prior to the date in question) or its affiliates for five years following the most recent date on which the interested stockholder became an interested stockholder and, after the five-year period, requires the recommendation of the board of directors and two supermajority stockholder votes to approve a business combination unless the stockholders receive a minimum price determined by the statute. As permitted by Maryland law, our Charter exempts from these provisions any business combination between us and the principals and their respective affiliates and related persons. Maryland law also allows the board of directors to exempt particular business combinations before the interested stockholder becomes an interested stockholder. Furthermore, a person is not an interested stockholder if the transaction by which he or she would otherwise have become an interested stockholder is approved in advance by the board of directors.
The Maryland General Corporation Law also provides that the acquirer of certain levels of voting power in electing directors of a Maryland corporation (one-tenth or more but less than one-third, one-third or more but less than a majority and a majority or more) is not entitled to vote the shares in excess of the applicable threshold, unless voting rights for the shares are approved by holders of two-thirds of the disinterested shares or unless the acquisition of the shares has been specifically or generally approved or exempted from the statute by a provision in our Charter or bylaws adopted before the acquisition of the shares. Our Charter exempts from these provisions voting rights of shares owned or acquired by the principals and their respective affiliates and related persons. Our bylaws also contain a provision exempting from this statute any acquisition by any person of shares of our common stock. There can be no assurance that this bylaw will not be amended or eliminated in the future. The Maryland General Corporation Law and our Charter also contain supermajority voting requirements with respect to our ability to amend certain provisions of our Charter, merge, or sell all or substantially all of our assets. Furthermore, the Maryland General Corporation Law permits our board of directors, without stockholder approval and regardless of what is currently provided in our Charter or bylaws, to adopt certain Charter and bylaw provisions, such as a classified board, that may have the effect of delaying or preventing a third party from making an acquisition proposal for us.
FEDERAL INCOME TAX RISKS
The tax consequences of the sale of some of the Centers and certain holdings of the principals may create conflicts of interest.
The principals will experience negative tax consequences if some of the Centers are sold. As a result, the principals may not favor a sale of these Centers even though such a sale may benefit our other stockholders. In addition, the principals may have different interests than our stockholders because they are significant holders of limited partnership units in the Operating Partnership.
If we were to fail to qualify as a REIT, we would have reduced funds available for distributions to our stockholders.
We believe that we currently qualify as a REIT. No assurance can be given that we will remain qualified as a REIT. Qualification as a REIT involves the application of highly technical and complex Internal Revenue Code provisions for which there are only limited judicial or administrative interpretations. The complexity of these provisions and of the applicable income tax regulations is greater in the case of a REIT structure like ours that holds assets through the Operating Partnership and joint ventures. The determination of various factual matters and circumstances not entirely within our control, including determinations by our partners in the Joint Venture Centers, may affect our continued qualification as a REIT. In addition, legislation, new regulations, administrative interpretations or court decisions could significantly change the tax laws with respect to our qualification as a REIT or the U.S. federal income tax consequences of that qualification.
In addition, we currently hold certain of our properties through subsidiaries that have elected to be taxed as REITs and we may in the future determine that it is in our best interests to hold one or more of our other properties through one or more subsidiaries that elect to be taxed as REITs. If any of these subsidiaries fails to qualify as a REIT for U.S. federal income tax purposes, then we may also fail to qualify as a REIT for U.S. federal income tax purposes.
If in any taxable year we were to fail to qualify as a REIT, we will suffer the following negative results:
• | we will not be allowed a deduction for distributions to stockholders in computing our taxable income; and |
• | we will be subject to U.S. federal income tax on our taxable income at regular corporate rates. |
25
In addition, if we were to lose our REIT status, we would be prohibited from qualifying as a REIT for the four taxable years following the year during which the qualification was lost, absent relief under statutory provisions. As a result, net income and the funds available for distributions to our stockholders would be reduced for at least five years and the fair market value of our shares could be materially adversely affected. Furthermore, the Internal Revenue Service could challenge our REIT status for past periods. Such a challenge, if successful, could result in us owing a material amount of tax, interest and penalties for prior periods. It is possible that future economic, market, legal, tax or other considerations might cause our board of directors to revoke our REIT election.
Even if we remain qualified as a REIT, we might face other tax liabilities that reduce our cash flow. Further, we might be subject to federal, state and local taxes on our income and property. Any of these taxes would decrease cash available for distributions to stockholders.
Complying with REIT requirements might cause us to forego otherwise attractive opportunities.
In order to qualify as a REIT for U.S. federal income tax purposes, we must satisfy tests concerning, among other things, our sources of income, the nature of our assets, the amounts we distribute to our stockholders and the ownership of our stock. We may also be required to make distributions to our stockholders at disadvantageous times or when we do not have funds readily available for distribution. Thus, compliance with REIT requirements may cause us to forego opportunities we would otherwise pursue.
In addition, the REIT provisions of the Internal Revenue Code impose a 100% tax on income from “prohibited transactions.” Prohibited transactions generally include sales of assets that do not qualify for a statutory safe harbor if such assets constitute inventory or other property held for sale in the ordinary course of business, other than foreclosure property. This 100% tax could impact our desire to sell assets and other investments at otherwise opportune times if we believe such sales could be considered prohibited transactions.
Complying with REIT requirements may force us to borrow or take other measures to make distributions to our stockholders.
As a REIT, we generally must distribute 90% of our annual taxable income (subject to certain adjustments) to our stockholders. From time to time, we might generate taxable income greater than our net income for financial reporting purposes, or our taxable income might be greater than our cash flow available for distributions to our stockholders. If we do not have other funds available in these situations, we might be unable to distribute 90% of our taxable income as required by the REIT rules. In that case, we would need to borrow funds, liquidate or sell a portion of our properties or investments (potentially at disadvantageous or unfavorable prices), in certain limited cases distribute a combination of cash and stock (at our stockholders' election but subject to an aggregate cash limit established by the Company) or find another alternative source of funds. These alternatives could increase our costs or reduce our equity. In addition, to the extent we borrow funds to pay distributions, the amount of cash available to us in future periods will be decreased by the amount of cash flow we will need to service principal and interest on the amounts we borrow, which will limit cash flow available to us for other investments or business opportunities.
We may face risks in connection with Section 1031 Exchanges.
If a transaction intended to qualify as a Section 1031 Exchange is later determined to be taxable, we may face adverse consequences, and if the laws applicable to such transactions are amended or repealed, we may not be able to dispose of properties on a tax deferred basis.
If our Operating Partnership fails to maintain its status as a partnership for tax purposes, we would face adverse tax consequences.
We intend to maintain the status of the Operating Partnership as a partnership for federal income tax purposes. However, if the Internal Revenue Service were to successfully challenge the status of the Operating Partnership as an entity taxable as a partnership, the Operating Partnership would be taxable as a corporation. This would reduce the amount of distributions that the Operating Partnership could make to us. This could also result in our losing REIT status, and becoming subject to a corporate level tax on our income. This would substantially reduce the cash available to us to make distributions and the return on your investment. In addition, if any of the partnerships or limited liability companies through which the Operating Partnership owns its property, in whole or in part, loses its characterization as a partnership or disregarded entity for federal income tax purposes, it would be subject to taxation as a corporation, thereby reducing distributions to the Operating Partnership. Such a recharacterization of an underlying entity could also threaten our ability to maintain REIT status.
26
Tax legislative or regulatory action could adversely affect us or our investors.
In recent years, numerous legislative, judicial and administrative changes have been made to the U.S. federal income tax laws applicable to investments similar to an investment in our stock. Additional changes to tax laws are likely to continue in the future, and we cannot assure you that any such changes will not adversely affect the taxation of us or our stockholders. Any such changes could have an adverse effect on an investment in our stock or on the market value or the resale potential of our properties. In addition, according to publicly released statements, a top legislative priority of the Trump administration and the current Congress may be significant reform of the Code, including significant changes to taxation of business entities and the deductibility of interest expense. There is a substantial lack of clarity around the likelihood, timing and details of any such tax reform and the impact of any potential tax reform on our business and on the price of our common stock.
ITEM 1B. UNRESOLVED STAFF COMMENTS
None.
27
ITEM 2. PROPERTIES
The following table sets forth certain information regarding the Centers and other locations that are wholly owned or partly owned by the Company as of December 31, 2016, excluding Cascade Mall and Northgate Mall, which were sold on January 18, 2017.
Count | Company's Ownership(1) | Name of Center/Location(2) | Year of Original Construction/ Acquisition | Year of Most Recent Expansion/ Renovation | Total GLA(3) | Mall and Freestanding GLA | Percentage of Mall and Freestanding GLA Leased | Non-Owned Anchors (3) | Company-Owned Anchors (3) | |||||||||||||
CONSOLIDATED CENTERS: | ||||||||||||||||||||||
1 | 50.1% | Chandler Fashion Center | 2001/2002 | - | 1,319,000 | 634,000 | 95.2 | % | Dillard's, Macy's, Nordstrom | Sears | ||||||||||||
Chandler, Arizona | ||||||||||||||||||||||
2 | 100% | Danbury Fair Mall | 1986/2005 | 2016 | 1,269,000 | 524,000 | 95.9 | % | JCPenney, Macy's | Dick's Sporting Goods, Forever 21, Lord & Taylor, Primark, Sears | ||||||||||||
Danbury, Connecticut | ||||||||||||||||||||||
3 | 100% | Desert Sky Mall | 1981/2002 | 2007 | 890,000 | 279,000 | 97.5 | % | Burlington, Dillard's, Sears | La Curacao, Mercado de los Cielos | ||||||||||||
Phoenix, Arizona | ||||||||||||||||||||||
4 | 100% | Eastland Mall(4) | 1978/1998 | 1996 | 1,044,000 | 555,000 | 96.3 | % | Dillard's, Macy's | JCPenney | ||||||||||||
Evansville, Indiana | ||||||||||||||||||||||
5 | 100% | Fashion Outlets of Chicago | 2013/— | - | 538,000 | 538,000 | 97.7 | % | — | — | ||||||||||||
Rosemont, Illinois | ||||||||||||||||||||||
6 | 100% | Fashion Outlets of Niagara Falls USA | 1982/2011 | 2014 | 686,000 | 686,000 | 92.9 | % | — | — | ||||||||||||
Niagara Falls, New York | ||||||||||||||||||||||
7 | 50.1% | Freehold Raceway Mall | 1990/2005 | 2007 | 1,674,000 | 776,000 | 97.8 | % | JCPenney, Lord & Taylor, Macy's, Nordstrom | Dick's Sporting Goods, Primark, Sears | ||||||||||||
Freehold, New Jersey | ||||||||||||||||||||||
8 | 100% | Fresno Fashion Fair | 1970/1996 | 2006 | 963,000 | 403,000 | 95.6 | % | Macy's | Forever 21, JCPenney, Macy's | ||||||||||||
Fresno, California | ||||||||||||||||||||||
9 | 100% | Green Acres Mall(4) | 1956/2013 | 2016 | 2,089,000 | 901,000 | 93.5 | % | — | BJ's Wholesale Club, Dick's Sporting Goods, Century 21, JCPenney, Kohl's, Macy's (two), Sears, Walmart | ||||||||||||
Valley Stream, New York | ||||||||||||||||||||||
10 | 100% | Inland Center(4) | 1966/2004 | 2016 | 866,000 | 204,000 | 98.1 | % | Macy's, Sears | Forever 21, JCPenney | ||||||||||||
San Bernardino, California | ||||||||||||||||||||||
11 | 100% | Kings Plaza Shopping Center(4)(5)(6) | 1971/2012 | 2002 | 1,189,000 | 460,000 | 95.2 | % | Macy's | Lowe's | ||||||||||||
Brooklyn, New York | ||||||||||||||||||||||
12 | 100% | La Cumbre Plaza(4) | 1967/2004 | 1989 | 491,000 | 174,000 | 85.2 | % | Macy's | Sears | ||||||||||||
Santa Barbara, California | ||||||||||||||||||||||
13 | 100% | NorthPark Mall | 1973/1998 | 2001 | 1,035,000 | 385,000 | 87.7 | % | Dillard's, JCPenney, Sears, Von Maur | Younkers | ||||||||||||
Davenport, Iowa | ||||||||||||||||||||||
14 | 100% | Oaks, The | 1978/2002 | 2009 | 1,191,000 | 589,000 | 95.6 | % | JCPenney, Macy's (two) | Dick's Sporting Goods, Nordstrom | ||||||||||||
Thousand Oaks, California | ||||||||||||||||||||||
15 | 100% | Pacific View | 1965/1996 | 2001 | 1,021,000 | 372,000 | 94.5 | % | JCPenney, Sears, Target | Macy's | ||||||||||||
Ventura, California | ||||||||||||||||||||||
16 | 100% | Queens Center(4) | 1973/1995 | 2004 | 963,000 | 407,000 | 98.5 | % | JCPenney, Macy's | — | ||||||||||||
Queens, New York | ||||||||||||||||||||||
17 | 100% | Santa Monica Place | 1980/1999 | 2015 | 517,000 | 294,000 | 86.5 | % | — | Bloomingdale's, Nordstrom | ||||||||||||
Santa Monica, California | ||||||||||||||||||||||
18 | 84.9% | SanTan Village Regional Center | 2007/— | 2009 | 1,057,000 | 650,000 | 97.5 | % | Dillard's, Macy's | Dick's Sporting Goods | ||||||||||||
Gilbert, Arizona | ||||||||||||||||||||||
28
Count | Company's Ownership(1) | Name of Center/Location(2) | Year of Original Construction/ Acquisition | Year of Most Recent Expansion/ Renovation | Total GLA(3) | Mall and Freestanding GLA | Percentage of Mall and Freestanding GLA Leased | Non-Owned Anchors (3) | Company-Owned Anchors (3) | |||||||||||||
19 | 100% | SouthPark Mall | 1974/1998 | 2015 | 862,000 | 348,000 | 83.1 | % | Dillard's, Von Maur | Dick's Sporting Goods, JCPenney, Younkers | ||||||||||||
Moline, Illinois | ||||||||||||||||||||||
20 | 100% | Stonewood Center(4) | 1953/1997 | 1991 | 932,000 | 359,000 | 94.0 | % | — | JCPenney, Kohl's, Macy's, Sears | ||||||||||||
Downey, California | ||||||||||||||||||||||
21 | 100% | Superstition Springs Center(5) | 1990/2002 | 2002 | 1,040,000 | 388,000 | 92.9 | % | Dillard's, JCPenney, Macy's, Sears | — | ||||||||||||
Mesa, Arizona | ||||||||||||||||||||||
22 | 100% | Towne Mall | 1985/2005 | 1989 | 350,000 | 179,000 | 87.2 | % | — | Belk, JCPenney, Sears | ||||||||||||
Elizabethtown, Kentucky | ||||||||||||||||||||||
23 | 100% | Tucson La Encantada | 2002/2002 | 2005 | 243,000 | 243,000 | 94.6 | % | — | — | ||||||||||||
Tucson, Arizona | ||||||||||||||||||||||
24 | 100% | Valley Mall | 1978/1998 | 1992 | 505,000 | 190,000 | 99.0 | % | Target | Belk, Dick's Sporting Goods, JCPenney | ||||||||||||
Harrisonburg, Virginia | ||||||||||||||||||||||
25 | 100% | Valley River Center(5) | 1969/2006 | 2007 | 921,000 | 344,000 | 99.0 | % | Macy's | JCPenney | ||||||||||||
Eugene, Oregon | ||||||||||||||||||||||
26 | 100% | Victor Valley, Mall of | 1986/2004 | 2012 | 577,000 | 254,000 | 97.8 | % | Macy's | Dick's Sporting Goods, JCPenney, Sears | ||||||||||||
Victorville, California | ||||||||||||||||||||||
27 | 100% | Vintage Faire Mall | 1977/1996 | 2008 | 1,140,000 | 406,000 | 95.4 | % | Forever 21, Macy's | Dick's Sporting Goods, JCPenney, Macy's, Sears | ||||||||||||
Modesto, California | ||||||||||||||||||||||
28 | 100% | Wilton Mall | 1990/2005 | 1998 | 737,000 | 452,000 | 97.1 | % | JCPenney | Bon-Ton, Dick's Sporting Goods, Sears | ||||||||||||
Saratoga Springs, New York | ||||||||||||||||||||||
Total Consolidated Centers | 26,109,000 | 11,994,000 | 94.8 | % | ||||||||||||||||||
UNCONSOLIDATED JOINT VENTURE CENTERS: | ||||||||||||||||||||||
29 | 60% | Arrowhead Towne Center | 1993/2002 | 2015 | 1,197,000 | 389,000 | 94.7 | % | Dillard's, JCPenney, Macy's | Dick's Sporting Goods, Forever 21, Sears | ||||||||||||
Glendale, Arizona | ||||||||||||||||||||||
30 | 50% | Biltmore Fashion Park | 1963/2003 | 2006 | 517,000 | 212,000 | 98.4 | % | — | Macy's, Saks Fifth Avenue | ||||||||||||
Phoenix, Arizona | ||||||||||||||||||||||
31 | 50.1% | Corte Madera, The Village at | 1985/1998 | 2005 | 461,000 | 224,000 | 90.1 | % | Macy's, Nordstrom | — | ||||||||||||
Corte Madera, California | ||||||||||||||||||||||
32 | 50% | Country Club Plaza | 1922/2016 | 2015 | 1,004,000 | 1,004,000 | n/a | — | — | |||||||||||||
Kansas City, Missouri | ||||||||||||||||||||||
33 | 51% | Deptford Mall | 1975/2006 | 1990 | 1,039,000 | 342,000 | 95.3 | % | JCPenney, Macy's | Boscov's, Sears | ||||||||||||
Deptford, New Jersey | ||||||||||||||||||||||
34 | 51% | FlatIron Crossing | 2000/2002 | 2009 | 1,431,000 | 787,000 | 95.1 | % | Dillard's, Macy's, Nordstrom | Dick's Sporting Goods | ||||||||||||
Broomfield, Colorado | ||||||||||||||||||||||
35 | 50% | Kierland Commons | 1999/2005 | 2003 | 436,000 | 436,000 | 97.6 | % | — | — | ||||||||||||
Scottsdale, Arizona | ||||||||||||||||||||||
36 | 60% | Lakewood Center(5) | 1953/1975 | 2008 | 2,064,000 | 956,000 | 98.3 | % | — | Costco, Forever 21, Home Depot, JCPenney, Macy's, Target | ||||||||||||
Lakewood, California | ||||||||||||||||||||||
37 | 60% | Los Cerritos Center(4) | 1971/1999 | 2016 | 1,298,000 | 538,000 | 94.9 | % | Macy's, Nordstrom | Dick's Sporting Goods, Forever 21, Sears | ||||||||||||
Cerritos, California | ||||||||||||||||||||||
38 | 50% | North Bridge, The Shops at(4) | 1998/2008 | - | 671,000 | 411,000 | 99.3 | % | — | Nordstrom | ||||||||||||
Chicago, Illinois | ||||||||||||||||||||||
39 | 50% | Scottsdale Fashion Square(5) | 1961/2002 | 2015 | 1,812,000 | 791,000 | 96.4 | % | Dillard's | Dick's Sporting Goods, Macy's, Neiman Marcus, Nordstrom | ||||||||||||
Scottsdale, Arizona | ||||||||||||||||||||||
40 | 60% | South Plains Mall | 1972/1998 | 2016 | 1,127,000 | 469,000 | 90.1 | % | — | Bealls, Dillard's (two), JCPenney, Sears | ||||||||||||
Lubbock, Texas | ||||||||||||||||||||||
41 | 51% | Twenty Ninth Street(4) | 1963/1979 | 2007 | 847,000 | 555,000 | 98.1 | % | Macy's | Home Depot | ||||||||||||
Boulder, Colorado | ||||||||||||||||||||||
29
Count | Company's Ownership(1) | Name of Center/Location(2) | Year of Original Construction/ Acquisition | Year of Most Recent Expansion/ Renovation | Total GLA(3) | Mall and Freestanding GLA | Percentage of Mall and Freestanding GLA Leased | Non-Owned Anchors (3) | Company-Owned Anchors (3) | |||||||||||||
42 | 50% | Tysons Corner Center | 1968/2005 | 2014 | 1,974,000 | 1,089,000 | 98.4 | % | — | Bloomingdale's, L.L. Bean, Lord & Taylor, Macy's, Nordstrom | ||||||||||||
Tysons Corner, Virginia | ||||||||||||||||||||||
43 | 60% | Washington Square | 1974/1999 | 2005 | 1,440,000 | 505,000 | 99.5 | % | Macy's | Dick's Sporting Goods, JCPenney, Nordstrom, Sears | ||||||||||||
Portland, Oregon | ||||||||||||||||||||||
44 | 19% | West Acres | 1972/1986 | 2001 | 971,000 | 418,000 | 98.9 | % | Herberger's, Macy's | JCPenney, Sears(7) | ||||||||||||
Fargo, North Dakota | ||||||||||||||||||||||
Total Unconsolidated Joint Ventures | 18,289,000 | 9,126,000 | 96.2 | % | ||||||||||||||||||
REGIONAL SHOPPING CENTERS UNDER REDEVELOPMENT | ||||||||||||||||||||||
45 | 50% | Broadway Plaza(4)(8) | 1951/1985 | 2016 | 923,000 | 375,000 | (9) | Macy's | Neiman Marcus, Nordstrom | |||||||||||||
Walnut Creek, California | ||||||||||||||||||||||
46 | 50% | Fashion Outlets of Philadelphia(8) | 1977/2014 | ongoing | 850,000 | 624,000 | (9) | — | Burlington, Century 21 | |||||||||||||
Philadelphia, Pennsylvania | ||||||||||||||||||||||
47 | 100% | Paradise Valley Mall(10) | 1979/2002 | 2009 | 1,203,000 | 424,000 | (9) | Dillard's, JCPenney, Macy's | Costco, Sears | |||||||||||||
Phoenix, Arizona | ||||||||||||||||||||||
48 | 100% | Westside Pavilion(10) | 1985/1998 | 2007 | 755,000 | 397,000 | (9) | Macy's(7) | Nordstrom(7) | |||||||||||||
Los Angeles, California | ||||||||||||||||||||||
48 | Total Regional Shopping Centers | 48,129,000 | 22,940,000 | 95.4 | % | |||||||||||||||||
COMMUNITY/POWER SHOPPING CENTERS | ||||||||||||||||||||||
1 | 50% | Atlas Park, The Shops at(8) | 2006/2011 | 2013 | 371,000 | 371,000 | 76.6 | % | — | — | ||||||||||||
Queens, New York | ||||||||||||||||||||||
2 | 50% | Boulevard Shops(8) | 2001/2002 | 2004 | 185,000 | 185,000 | 98.2 | % | — | — | ||||||||||||
Chandler, Arizona | ||||||||||||||||||||||
3 | Various | Estrella Falls, The Market at(8) | 2009/— | 2016 | 355,000 | 355,000 | 97.6 | % | — | — | ||||||||||||
Goodyear, Arizona | ||||||||||||||||||||||
4 | 89.4% | Promenade at Casa Grande(5)(10) | 2007/— | 2009 | 761,000 | 431,000 | 92.9 | % | Dillard's, JCPenney, Kohl's | — | ||||||||||||
Casa Grande, Arizona | ||||||||||||||||||||||
5 | 100% | Southridge Center(5)(10) | 1975/1998 | 2013 | 823,000 | 434,000 | 81.6 | % | Des Moines Area Community College | Target, Younkers | ||||||||||||
Des Moines, Iowa | ||||||||||||||||||||||
6 | 100.0% | Superstition Springs Power Center(10) | 1990/2002 | - | 206,000 | 53,000 | 100.0 | % | Best Buy, Burlington | — | ||||||||||||
Mesa, Arizona | ||||||||||||||||||||||
7 | 100% | The Marketplace at Flagstaff(4)(10) | 2007/— | - | 268,000 | 147,000 | 100.0 | % | — | Home Depot | ||||||||||||
Flagstaff, Arizona | ||||||||||||||||||||||
7 | Total Community/Power Shopping Centers | 2,969,000 | 1,976,000 | |||||||||||||||||||
55 | Total before Other Assets | 51,098,000 | 24,916,000 | |||||||||||||||||||
OTHER ASSETS: | ||||||||||||||||||||||
100% | Various(10)(11) | 447,000 | 169,000 | 100.0 | % | — | Forever 21, Kohl's | |||||||||||||||
100% | 500 North Michigan Avenue(10) | 326,000 | — | — | — | — | ||||||||||||||||
Chicago, Illinois | ||||||||||||||||||||||
50% | Valencia Place at Country Club Plaza(8) | 242,000 | — | — | — | — | ||||||||||||||||
Kansas City, Missouri | ||||||||||||||||||||||
50% | Fashion Outlets of Philadelphia-Office(8) | 526,000 | — | — | — | — | ||||||||||||||||
Philadelphia, Pennsylvania | ||||||||||||||||||||||
50% | Scottsdale Fashion Square-Office(8) | 123,000 | — | — | — | — | ||||||||||||||||
Scottsdale, Arizona | ||||||||||||||||||||||
30
Count | Company's Ownership(1) | Name of Center/Location(2) | Year of Original Construction/ Acquisition | Year of Most Recent Expansion/ Renovation | Total GLA(3) | Mall and Freestanding GLA | Percentage of Mall and Freestanding GLA Leased | Non-Owned Anchors (3) | Company-Owned Anchors (3) | |||||||||||||
50% | Tysons Corner Center-Office(8) | 174,000 | — | — | — | — | ||||||||||||||||
Tysons Corner, Virginia | ||||||||||||||||||||||
50% | Hyatt Regency Tysons Corner Center(8) | 290,000 | — | — | — | — | ||||||||||||||||
Tysons Corner, Virginia | ||||||||||||||||||||||
50% | VITA Tysons Corner Center(8) | 510,000 | — | — | — | — | ||||||||||||||||
Tysons Corner, Virginia | ||||||||||||||||||||||
50% | Tysons Tower(8) | 528,000 | — | — | — | — | ||||||||||||||||
Tysons Corner, Virginia | ||||||||||||||||||||||
Total Other Assets | 3,166,000 | 169,000 | ||||||||||||||||||||
Grand Total | 54,264,000 | 25,085,000 | ||||||||||||||||||||
________________________
(1) | The Company's ownership interest in this table reflects its direct or indirect legal ownership interest. Legal ownership may, at times, not equal the Company's economic interest in the listed properties because of various provisions in certain joint venture agreements regarding distributions of cash flow based on capital account balances, allocations of profits and losses and payments of preferred returns. As a result, the Company's actual economic interest (as distinct from its legal ownership interest) in certain of the properties could fluctuate from time to time and may not wholly align with its legal ownership interests. Substantially all of the Company's joint venture agreements contain rights of first refusal, buy-sell provisions, exit rights, default dilution remedies and/or other break up provisions or remedies which are customary in real estate joint venture agreements and which may, positively or negatively, affect the ultimate realization of cash flow and/or capital or liquidation proceeds. See “Item 1A.-Risks Related to Our Organizational Structure-Outside partners in Joint Venture Centers result in additional risks to our stockholders.” |
(2) | With respect to 43 Centers, the underlying land controlled by the Company is owned in fee entirely by the Company or, in the case of Joint Venture Centers, by the joint venture property partnership or limited liability company. With respect to the remaining 12 Centers, portions of the underlying land controlled by the Company are owned by third parties and leased to the Company, or the joint venture property partnership or limited liability company, pursuant to long-term ground leases. Under the terms of a typical ground lease, the Company, or the joint venture property partnership or limited liability company, has an option or right of first refusal to purchase the land. The termination dates of the ground leases range from 2017 to 2098. |
(3) | Total GLA includes GLA attributable to Anchors (whether owned or non-owned) and Mall and Freestanding Stores as of December 31, 2016. “Non-owned Anchors” is space not owned by the Company (or, in the case of Joint Venture Centers, by the joint venture property partnership or limited liability company) which is occupied by Anchor tenants. “Company-owned Anchors” is space owned (or leased) by the Company (or, in the case of Joint Venture Centers, by the joint venture property partnership or limited liability company) and leased (or subleased) to Anchor tenants. |
(4) | Portions of the land on which the Center is situated are subject to one or more long-term ground leases. |
(5) | These Centers have vacant Anchor locations. The Company is seeking replacement tenants and/or contemplating redevelopment opportunities for these vacant sites. The Company continues to collect rent under the terms of an agreement regarding two of these vacant Anchor locations. |
(6) | The Company anticipates that Primark will open a store at Kings Plaza Shopping Center in 2018. |
(7) | The anchor tenant has announced its intent to close this location. |
(8) | Included in Unconsolidated Joint Venture Centers. |
(9) | Tenant spaces have been intentionally held off the market and remain vacant because of redevelopment plans. As a result, the Company believes the percentage of mall and freestanding GLA leased at this redevelopment property is not meaningful data. |
(10) | Included in Consolidated Centers. |
(11) | The Company owns an office building and seven stores located at shopping centers not owned by the Company. Of the seven stores, two have been leased to Forever 21, one has been leased to Kohl's, one is vacant and three have been leased for non-Anchor usage. With respect to the office building and four of the seven stores, the underlying land is owned in fee entirely by the Company. With respect to the remaining three stores, the underlying land is owned by third parties and leased to the Company pursuant to long-term building or ground leases. Under the terms of a typical building or ground lease, the Company pays rent for the use of the building or land and is generally responsible for all costs and expenses associated with the building and improvements. In some cases, the Company has an option or right of first refusal to purchase the land. The termination dates of the ground leases range from 2018 to 2027. |
31
Mortgage Debt
The following table sets forth certain information regarding the mortgages encumbering the Centers, including those Centers in which the Company has less than a 100% interest. The information set forth below is as of December 31, 2016 (dollars in thousands):
Property Pledged as Collateral | Fixed or Floating | Carrying Amount(1) | Effective Interest Rate(2) | Annual Debt Service(3) | Maturity Date(4) | Balance Due on Maturity | Earliest Date Notes Can Be Defeased or Be Prepaid | ||||||||||||||
Consolidated Centers: | |||||||||||||||||||||
Chandler Fashion Center(5) | Fixed | $ | 199,833 | 3.77 | % | $ | 7,500 | 7/1/19 | $ | 200,000 | Any Time | ||||||||||
Danbury Fair Mall(6) | Fixed | 215,857 | 5.53 | % | 18,456 | 10/1/20 | 188,854 | Any Time | |||||||||||||
Fashion Outlets of Chicago(7) | Floating | 198,966 | 2.43 | % | 4,536 | 3/31/20 | 200,000 | Any Time | |||||||||||||
Fashion Outlets of Niagara Falls USA | Fixed | 115,762 | 4.89 | % | 8,724 | 10/6/20 | 103,810 | Any Time | |||||||||||||
Freehold Raceway Mall(5) | Fixed | 220,643 | 4.20 | % | 13,584 | 1/1/18 | 216,258 | Any Time | |||||||||||||
Fresno Fashion Fair(8) | Fixed | 323,062 | 3.67 | % | 11,652 | 11/1/26 | 325,000 | 2/28/19 | |||||||||||||
Green Acres Mall | Fixed | 297,798 | 3.61 | % | 17,364 | 2/3/21 | 269,922 | Any Time | |||||||||||||
Kings Plaza Shopping Center | Fixed | 456,958 | 3.67 | % | 26,748 | 12/3/19 | 427,423 | Any Time | |||||||||||||
Northgate Mall(9) | Floating | 63,434 | 3.50 | % | 2,472 | 3/1/17 | 63,350 | Any Time | |||||||||||||
Oaks, The | Fixed | 201,235 | 4.14 | % | 12,768 | 6/5/22 | 174,433 | Any Time | |||||||||||||
Pacific View | Fixed | 127,311 | 4.08 | % | 8,016 | 4/1/22 | 110,597 | 4/12/2017 | |||||||||||||
Queens Center | Fixed | 600,000 | 3.49 | % | 20,928 | 1/1/25 | 600,000 | Any Time | |||||||||||||
Santa Monica Place | Fixed | 219,564 | 2.99 | % | 12,048 | 1/3/18 | 214,118 | Any Time | |||||||||||||
SanTan Village Regional Center | Fixed | 127,724 | 3.14 | % | 7,068 | 6/1/19 | 120,238 | Any Time | |||||||||||||
Stonewood Center | Fixed | 99,520 | 1.80 | % | 7,680 | 11/1/17 | 94,471 | Any Time | |||||||||||||
Towne Mall | Fixed | 21,570 | 4.48 | % | 1,404 | 11/1/22 | 18,886 | Any Time | |||||||||||||
Tucson La Encantada(10) | Fixed | 68,513 | 4.23 | % | 4,416 | 3/1/22 | 59,788 | Any Time | |||||||||||||
Victor Valley, Mall of | Fixed | 114,559 | 4.00 | % | 4,560 | 9/1/24 | 115,000 | Any Time | |||||||||||||
Vintage Faire Mall | Fixed | 269,228 | 3.55 | % | 15,072 | 3/6/26 | 210,825 | 3/26/2017 | |||||||||||||
Westside Pavilion | Fixed | 143,881 | 4.49 | % | 9,396 | 10/1/22 | 125,489 | Any Time | |||||||||||||
$ | 4,085,418 | ||||||||||||||||||||
32
Property Pledged as Collateral | Fixed or Floating | Carrying Amount(1) | Effective Interest Rate(2) | Annual Debt Service(3) | Maturity Date(4) | Balance Due on Maturity | Earliest Date Notes Can Be Defeased or Be Prepaid | ||||||||||||||
Unconsolidated Joint Venture Centers (at Company's Pro Rata Share): | |||||||||||||||||||||
Arrowhead Towne Center(60.0%)(11) | Fixed | $ | 240,000 | 4.05 | % | $ | 9,720 | 2/1/28 | $ | 212,719 | 2/1/22 | ||||||||||
Atlas Park, The Shops at(50.0%)(12) | Floating | 23,665 | 2.98 | % | 602 | 10/28/20 | 24,651 | Any Time | |||||||||||||
Boulevard Shops(50.0%)(13) | Floating | 9,557 | 2.50 | % | 417 | 12/16/18 | 9,133 | Any Time | |||||||||||||
Corte Madera, The Village at(50.1%)(14) | Fixed | 112,327 | 3.53 | % | 3,945 | 9/1/28 | 98,753 | 9/30/19 | |||||||||||||
Country Club Plaza(50.0%)(15) | Fixed | 159,561 | 3.88 | % | 6,160 | 4/1/26 | 137,525 | 4/1/21 | |||||||||||||
Deptford Mall(51.0%)(16) | Fixed | 97,762 | 3.55 | % | 5,795 | 4/3/23 | 81,750 | Any Time | |||||||||||||
Estrella Falls, The Market at(40.1%)(17) | Floating | 10,325 | 2.60 | % | 330 | 2/5/20 | 10,087 | Any Time | |||||||||||||
FlatIron Crossing(51.0%)(16) | Fixed | 131,361 | 2.81 | % | 8,525 | 1/5/21 | 110,538 | Any Time | |||||||||||||
Kierland Commons(50.0%)(18) | Floating | 65,273 | 2.78 | % | 2,502 | 1/2/18 | 64,281 | Any Time | |||||||||||||
Lakewood Center(60.0%) | Fixed | 225,655 | 4.15 | % | 13,144 | 6/1/26 | 185,306 | 8/6/17 | |||||||||||||
Los Cerritos Center(60.0%) | Fixed | 315,000 | 4.00 | % | 12,600 | 11/1/27 | 278,711 | 11/1/21 | |||||||||||||
North Bridge, The Shops at(50.0%)(19) | Fixed | 186,882 | 3.71 | % | 6,900 | 6/1/28 | 159,785 | Any Time | |||||||||||||
Scottsdale Fashion Square(50.0%) | Fixed | 241,581 | 3.02 | % | 13,281 | 4/3/23 | 201,331 | Any Time | |||||||||||||
South Plains Mall(60.0%) | Fixed | 120,000 | 4.22 | % | 5,065 | 11/6/25 | 120,000 | 3/6/18 | |||||||||||||
Twenty Ninth Street(51.0%)(20) | Fixed | 76,500 | 4.10 | % | 3,137 | 2/6/26 | 76,500 | 6/7/18 | |||||||||||||
Tysons Corner Center(50.0%)(21) | Fixed | 398,795 | 4.13 | % | 24,643 | 1/1/24 | 333,233 | Any Time | |||||||||||||
Washington Square(60.0%) | Fixed | 330,000 | 3.65 | % | 12,045 | 11/1/22 | 311,863 | 11/1/18 | |||||||||||||
West Acres(19.0%)(22) | Fixed | 10,213 | 6.41 | % | 1,069 | 2/1/17 | 10,179 | Any Time | |||||||||||||
$ | 2,754,457 | ||||||||||||||||||||
_______________________________________________________________________________
(1) | The mortgage notes payable balances include the unamortized debt premiums (discounts). Debt premiums (discounts) represent the excess (deficiency) of the fair value of debt over (under) the principal value of debt assumed in various acquisitions. The debt premiums (discounts) are being amortized into interest expense over the term of the related debt in a manner which approximates the effective interest method. |
The debt premiums (discounts) as of December 31, 2016 consisted of the following:
Property Pledged as Collateral | |||
Consolidated Centers | |||
Fashion Outlets of Niagara Falls USA | $ | 3,558 | |
Stonewood Center | 2,349 | ||
$ | 5,907 | ||
Unconsolidated Joint Venture Center (at Company's Pro Rata Share) | |||
Deptford Mall | $ | 977 | |
FlatIron Crossing | 5,030 | ||
Lakewood Center | (13,333 | ) | |
$ | (7,326 | ) | |
The mortgage notes payable balances also include unamortized deferred finance costs that are amortized into interest expense over the remaining term of the related debt in a manner that approximates the effective interest method. Unamortized deferred finance costs at December 31, 2016 were $12,716 for Consolidated Centers and $4,151 for Unconsolidated Joint Ventures (at Company's pro rata share).
(2) | The interest rate disclosed represents the effective interest rate, including the debt premiums (discounts) and deferred finance costs. |
(3) | The annual debt service represents the annual payment of principal and interest. |
(4) | The maturity date assumes that all extension options are fully exercised and that the Company does not opt to refinance the debt prior to these dates. These extension options are at the Company's discretion, subject to certain conditions, which the Company believes will be met. |
(5) | A 49.9% interest in the loan has been assumed by a third party in connection with a co-venture arrangement. |
(6) | Northwestern Mutual Life ("NML") is the lender of 50% of the loan. NML is considered a related party as it is a joint venture partner with the Company in Broadway Plaza. |
33
(7) | The loan bears interest at LIBOR plus 1.50%. |
(8) | On October 6, 2016, the Company placed a $325,000 loan on the property that bears interest at an effective rate of 3.67% and matures on November 1, 2026. |
(9) | On January 18, 2017, the Company paid off the loan in full in connection with the sale of the underlying property (See "Item 1. Business—Recent Developments—Acquisitions and Dispositions"). |
(10) | NML is the lender of this loan. |
(11) | On January 6, 2016, the Company replaced the existing loan on the property with a new $400,000 loan that bears interest at an effective rate of 4.05% and matures on February 1, 2028. Concurrently, a 40% interest in the loan was assumed by a third party in connection with the sale of a 40% ownership interest in the underlying property (See "Item 1. Business—Recent Developments—Acquisitions and Dispositions"). |
(12) | The loan bears interest at LIBOR plus 2.25%. |
(13) | The loan bears interest at LIBOR plus 1.75%. |
(14) | On August 5, 2016, the Company’s joint venture in The Village at Corte Madera replaced the existing loan on the property with a new $225,000 loan that bears interest at an effective rate of 3.53% and matures on September 1, 2028. |
(15) | On March 28, 2016, the Company's joint venture in Country Club Plaza placed a $320,000 loan on the property that bears interest at an effective rate of 3.88% and matures on April 1, 2026. |
(16) | On January 14, 2016, a 49% interest in the loan was assumed by a third party in connection with the sale of a 49% ownership interest in the MAC Heitman Portfolio (See "Item 1. Business—Recent Developments—Acquisitions and Dispositions"). |
(17) | The loan bears interest at LIBOR plus 1.70%. |
(18) | The loan bears interest at LIBOR plus 1.9%. On February 2, 2017, the Company's joint venture in Kierland Commons entered into a loan commitment with a lender to replace this loan with a new $225.0 million loan on the property. The new 3.95% ten-year loan is expected to close in March 2017. |
(19) | On May 27, 2016, the Company's joint venture in The Shops at North Bridge replaced the existing loan on the property with a new $375,000 loan that bears interest at an effective rate of 3.71% and matures on June 1, 2028. |
(20) | On January 14, 2016, the Company placed a $150,000 loan on the property that bears interest at an effective rate of 4.10% and matures on February 6, 2026. Concurrently, a 49% interest in the loan was assumed by a third party in connection with the sale of a 49% ownership interest in the MAC Heitman Portfolio. |
(21) | NML is the lender of 33.3% of the loan. |
(22) | On February 1, 2017, the Company's joint venture in West Acres replaced the existing loan on the property with a new $80.0 million loan that bears interest at 4.61% and matures on March 1, 2032. The Company used its share of the excess proceeds to pay down its line of credit and for general corporate purposes. |
ITEM 3. LEGAL PROCEEDINGS
None of the Company, the Operating Partnership, the Management Companies or their respective affiliates is currently involved in any material legal proceedings.
ITEM 4. MINE SAFETY DISCLOSURES
Not applicable.
34
PART II
ITEM 5. MARKET FOR REGISTRANT'S COMMON EQUITY, RELATED STOCKHOLDER MATTERS AND ISSUER PURCHASES OF EQUITY SECURITIES
The common stock of the Company is listed and traded on the New York Stock Exchange under the symbol "MAC". The common stock began trading on March 10, 1994 at a price of $19 per share. In 2016, the Company's shares traded at a high of $94.51 and a low of $66.00.
As of February 21, 2017, there were approximately 540 stockholders of record. The following table shows high and low sales prices per share of common stock during each quarter in 2016 and 2015 and dividends per share of common stock declared and paid by the Company during each quarter:
Market Quotation Per Share | ||||||||||||||||
Dividends (1) | ||||||||||||||||
Quarter Ended | High | Low | Declared | Paid | ||||||||||||
March 31, 2016 | $ | 82.88 | $ | 72.99 | $ | 0.68 | $ | 2.68 | ||||||||
June 30, 2016 | $ | 85.39 | $ | 71.82 | $ | 0.68 | $ | 0.68 | ||||||||
September 30, 2016 | $ | 94.51 | $ | 78.76 | $ | 0.68 | $ | 0.68 | ||||||||
December 31, 2016 | $ | 80.54 | $ | 66.00 | $ | 0.71 | $ | 0.71 | ||||||||
March 31, 2015 | $ | 95.93 | $ | 81.61 | $ | 0.65 | $ | 0.65 | ||||||||
June 30, 2015 | $ | 86.31 | $ | 74.51 | $ | 0.65 | $ | 0.65 | ||||||||
September 30, 2015 | $ | 81.52 | $ | 71.98 | $ | 0.65 | $ | 0.65 | ||||||||
December 31, 2015 | $ | 86.29 | $ | 74.55 | $ | 4.68 | $ | 2.68 | ||||||||
_______________________________________________________________________________
(1) | The dividends declared for the quarter ended December 31, 2015 include a special dividend/distribution of $2.00 per share of common stock and per OP Unit that was paid on January 6, 2016 (See "Item 1. Business—Recent Developments—Other Transactions and Events"). |
To maintain its qualification as a REIT, the Company is required each year to distribute to stockholders at least 90% of its net taxable income after certain adjustments. The Company paid all of its 2016 and 2015 quarterly dividends in cash. The timing, amount and composition of future dividends will be determined in the sole discretion of the Company's board of directors and will depend on actual and projected cash flow, financial condition, funds from operations, earnings, capital requirements, annual REIT distribution requirements, contractual prohibitions or other restrictions, applicable law and such other factors as the board of directors deems relevant. For example, under the Company's existing financing arrangements, the Company may pay cash dividends and make other distributions based on a formula derived from funds from operations (See "Item 7. Management's Discussion and Analysis of Financial Condition and Results of Operations—Funds From Operations ("FFO")") and only if no default under the financing agreements has occurred, unless, under certain circumstances, payment of the distribution is necessary to enable the Company to continue to qualify as a REIT under the Code.
Stock Performance Graph
The following graph provides a comparison, from December 31, 2011 through December 31, 2016, of the yearly percentage change in the cumulative total stockholder return (assuming reinvestment of dividends) of the Company, the Standard & Poor's ("S&P") 500 Index, the S&P Midcap 400 Index and the FTSE NAREIT All Equity REITs Index, an industry index of publicly-traded REITs (including the Company).
The graph assumes that the value of the investment in each of the Company's common stock and the indices was $100 at the close of the market on December 31, 2011.
Upon written request directed to the Secretary of the Company, the Company will provide any stockholder with a list of the REITs included in the FTSE NAREIT All Equity REITs Index. The historical information set forth below is not necessarily indicative of future performance.
35
Data for the FTSE NAREIT All Equity REITs Index, the S&P 500 Index and the S&P Midcap 400 Index were provided by Research Data Group.
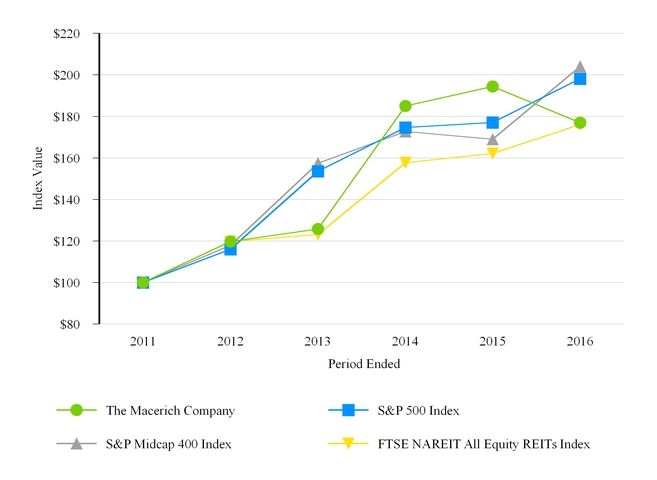
Copyright© 2017 S&P, a division of The McGraw-Hill Companies Inc. All rights reserved.
12/31/11 | 12/31/12 | 12/31/13 | 12/31/14 | 12/31/15 | 12/31/16 | |||||||||||||||||||
The Macerich Company | $ | 100.00 | $ | 119.75 | $ | 125.74 | $ | 185.00 | $ | 194.36 | $ | 176.93 | ||||||||||||
S&P 500 Index | 100.00 | 116.00 | 153.58 | 174.60 | 177.01 | 198.18 | ||||||||||||||||||
S&P Midcap 400 Index | 100.00 | 117.88 | 157.37 | 172.74 | 168.98 | 204.03 | ||||||||||||||||||
FTSE NAREIT All Equity REITs Index | 100.00 | 119.70 | 123.12 | 157.63 | 162.08 | 176.07 | ||||||||||||||||||
Recent Sales of Unregistered Securities
During the fourth quarter of 2016, the Company, as general partner of the Operating Partnership, issued an aggregate of 65,000 shares of common stock to limited partners of the Operating Partnership in exchange for an equal number of units pursuant to the partnership agreement of the Operating Partnership, as follows: 58,000 shares on November 30, 2016, 2,500 shares on December 12, 2016, 2,500 shares on December 15, 2016, and 2,000 shares on December 22, 2016.
In each case, the issuance of the shares of common stock was exempt from registration pursuant to Section 4(a)(2) of the Securities Act of 1933, as amended.
Issuer Purchases of Equity Securities
None.
36
ITEM 6. SELECTED FINANCIAL DATA
The following sets forth selected financial data for the Company on a historical basis. The following data should be read in conjunction with the consolidated financial statements (and the notes thereto) of the Company and "Management's Discussion and Analysis of Financial Condition and Results of Operations," each included elsewhere in this Form 10-K. All dollars and share amounts are in thousands, except per share data.
Years Ended December 31, | |||||||||||||||||||
2016 | 2015 | 2014 | 2013 | 2012 | |||||||||||||||
OPERATING DATA: | |||||||||||||||||||
Revenues: | |||||||||||||||||||
Minimum rents (1) | $ | 616,295 | $ | 759,603 | $ | 633,571 | $ | 578,113 | $ | 447,321 | |||||||||
Percentage rents | 20,902 | 25,693 | 24,350 | 23,156 | 21,388 | ||||||||||||||
Tenant recoveries | 305,282 | 415,129 | 361,119 | 337,772 | 247,593 | ||||||||||||||
Other | 59,328 | 61,470 | 52,226 | 50,242 | 39,980 | ||||||||||||||
Management Companies | 39,464 | 26,254 | 33,981 | 40,192 | 41,235 | ||||||||||||||
Total revenues | 1,041,271 | 1,288,149 | 1,105,247 | 1,029,475 | 797,517 | ||||||||||||||
Expenses: | |||||||||||||||||||
Shopping center and operating expenses | 307,623 | 379,815 | 353,505 | 329,795 | 251,923 | ||||||||||||||
Management Companies' operating expenses | 98,323 | 92,340 | 88,424 | 93,461 | 85,610 | ||||||||||||||
REIT general and administrative expenses | 28,217 | 29,870 | 29,412 | 27,772 | 20,412 | ||||||||||||||
Costs related to unsolicited takeover offer (2) | — | 25,204 | — | — | — | ||||||||||||||
Depreciation and amortization | 348,488 | 464,472 | 378,716 | 357,165 | 277,621 | ||||||||||||||
Interest expense | 163,675 | 211,943 | 190,689 | 197,247 | 164,392 | ||||||||||||||
(Gain) loss on early extinguishment of debt, net (3) | (1,709 | ) | (1,487 | ) | 9,551 | (1,432 | ) | — | |||||||||||
Total expenses | 944,617 | 1,202,157 | 1,050,297 | 1,004,008 | 799,958 | ||||||||||||||
Equity in income of unconsolidated joint ventures (4) | 56,941 | 45,164 | 60,626 | 167,580 | 79,281 | ||||||||||||||
Co-venture expense | (13,382 | ) | (11,804 | ) | (9,490 | ) | (8,864 | ) | (6,523 | ) | |||||||||
Income tax (expense) benefit (5) | (722 | ) | 3,223 | 4,269 | 1,692 | 4,159 | |||||||||||||
Gain (loss) on sale or write down of assets, net (6) | 415,348 | 378,248 | 73,440 | (78,057 | ) | 28,734 | |||||||||||||
Gain on remeasurement of assets (7) | — | 22,089 | 1,423,136 | 51,205 | 199,956 | ||||||||||||||
Income from continuing operations | 554,839 | 522,912 | 1,606,931 | 159,023 | 303,166 | ||||||||||||||
Discontinued operations: (8) | |||||||||||||||||||
Gain on disposition of assets, net | — | — | — | 286,414 | 50,811 | ||||||||||||||
Income from discontinued operations | — | — | — | 3,522 | 12,412 | ||||||||||||||
Total income from discontinued operations | — | — | — | 289,936 | 63,223 | ||||||||||||||
Net income | 554,839 | 522,912 | 1,606,931 | 448,959 | 366,389 | ||||||||||||||
Less net income attributable to noncontrolling interests | 37,844 | 35,350 | 107,889 | 28,869 | 28,963 | ||||||||||||||
Net income attributable to the Company | $ | 516,995 | $ | 487,562 | $ | 1,499,042 | $ | 420,090 | $ | 337,426 | |||||||||
Earnings per common share ("EPS") attributable to the Company—basic: | |||||||||||||||||||
Income from continuing operations | $ | 3.52 | $ | 3.08 | $ | 10.46 | $ | 1.07 | $ | 2.07 | |||||||||
Discontinued operations | — | — | — | 1.94 | 0.44 | ||||||||||||||
Net income attributable to common stockholders | $ | 3.52 | $ | 3.08 | $ | 10.46 | $ | 3.01 | $ | 2.51 | |||||||||
EPS attributable to the Company—diluted: (9)(10) | |||||||||||||||||||
Income from continuing operations | $ | 3.52 | $ | 3.08 | $ | 10.45 | $ | 1.06 | $ | 2.07 | |||||||||
Discontinued operations | — | — | — | 1.94 | 0.44 | ||||||||||||||
Net income attributable to common stockholders | $ | 3.52 | $ | 3.08 | $ | 10.45 | $ | 3.00 | $ | 2.51 | |||||||||
37
As of December 31, | |||||||||||||||||||
2016 | 2015 | 2014 | 2013 | 2012 | |||||||||||||||
BALANCE SHEET DATA: | |||||||||||||||||||
Investment in real estate (before accumulated depreciation) | $ | 9,209,211 | $ | 10,689,656 | $ | 12,777,882 | $ | 9,181,338 | $ | 9,012,706 | |||||||||
Total assets | $ | 9,958,148 | $ | 11,235,584 | $ | 13,094,948 | $ | 9,038,972 | $ | 9,280,997 | |||||||||
Total mortgage and notes payable | $ | 4,965,900 | $ | 5,260,750 | $ | 6,265,570 | $ | 4,546,449 | $ | 5,231,158 | |||||||||
Equity (11) | $ | 4,427,168 | $ | 5,071,239 | $ | 6,039,849 | $ | 3,718,717 | $ | 3,416,251 | |||||||||
OTHER DATA: | |||||||||||||||||||
Funds from operations ("FFO")—diluted (12) | $ | 642,304 | $ | 642,268 | $ | 542,754 | $ | 527,574 | $ | 577,862 | |||||||||
Cash flows provided by (used in): | |||||||||||||||||||
Operating activities | $ | 417,506 | $ | 540,377 | $ | 400,706 | $ | 422,035 | $ | 351,296 | |||||||||
Investing activities | $ | 443,113 | $ | (101,024 | ) | $ | (255,791 | ) | $ | 271,867 | $ | (963,374 | ) | ||||||
Financing activities | $ | (853,083 | ) | $ | (437,750 | ) | $ | (129,723 | ) | $ | (689,980 | ) | $ | 610,623 | |||||
Number of Centers at year end | 57 | 58 | 60 | 64 | 70 | ||||||||||||||
Regional Shopping Centers portfolio occupancy (13) | 95.4 | % | 96.1 | % | 95.8 | % | 94.6 | % | 93.8 | % | |||||||||
Regional Shopping Centers portfolio sales per square foot (14) | $ | 630 | $ | 635 | $ | 587 | $ | 562 | $ | 517 | |||||||||
Weighted average number of shares outstanding—EPS basic | 146,599 | 157,916 | 143,144 | 139,598 | 134,067 | ||||||||||||||
Weighted average number of shares outstanding—EPS diluted(10) | 146,711 | 158,060 | 143,291 | 139,680 | 134,148 | ||||||||||||||
Distributions declared per common share (15) | $ | 2.75 | $ | 6.63 | $ | 2.51 | $ | 2.36 | $ | 2.23 | |||||||||
_______________________________________________________________________________
(1) | Minimum rents were increased by amortization of above and below-market leases of $12.8 million, $16.5 million, $9.1 million, $6.6 million and $5.2 million for the years ended December 31, 2016, 2015, 2014, 2013 and 2012, respectively. |
(2) | Costs related to unsolicited takeover offer from Simon. See "Item 7. Management's Discussion and Analysis of Financial Condition and Results of Operations—Other Transactions and Events." |
(3) | The (gain) loss on early extinguishment of debt, net for the years ended December 31, 2016, 2015, 2014 and 2013 includes the (gain) loss on the extinguishment of mortgage notes payable of $(1.7) million, $(2.1) million, $9.6 million and $(1.4) million, respectively. The (gain) loss on early extinguishment of debt, net for the year ended December 31, 2015 also includes the loss on the extinguishment of a term loan of $0.6 million. |
(4) | On March 30, 2012, the Company sold its 50% ownership interest in Chandler Village Center for a total sales price of $14.8 million, resulting in a gain on the sale of assets of $8.2 million. The sales price was funded by a cash payment of $6.0 million and the assumption of the Company's share of the mortgage note payable on the property of $8.8 million. The Company used the cash proceeds from the sale to pay down its line of credit and for general corporate purposes. |
On March 30, 2012, the Company sold its 50% ownership interest in Chandler Festival for a total sales price of $31.0 million, resulting in a gain on the sale of assets of $12.3 million. The sales price was funded by a cash payment of $16.2 million and the assumption of the Company's share of the mortgage note payable on the property of $14.8 million. The Company used the cash proceeds from the sale to pay down its line of credit and for general corporate purposes.
On March 30, 2012, the Company's joint venture in SanTan Village Power Center sold the property for $54.8 million, resulting in a gain on the sale of assets of $23.3 million for the joint venture. The Company's pro rata share of the gain recognized was $7.9 million, net of noncontrolling interests of $3.6 million. The Company used its share of the proceeds from the sale to pay down its line of credit and for general corporate purposes.
On May 31, 2012, the Company sold its 50% ownership interest in Chandler Gateway for a total sales price of $14.3 million, resulting in a gain on the sale of assets of $3.4 million. The sales price was funded by a cash payment of $4.9 million and the assumption of the Company's share of the mortgage note payable on the property of $9.4 million. The Company used the cash proceeds from the sale to pay down its line of credit and for general corporate purposes.
On August 10, 2012, the Company was bought out of its ownership interest in NorthPark Center for $118.8 million, resulting in a gain on the sale of assets of $24.6 million. The Company used the cash proceeds from the sale to pay down its line of credit.
On October 3, 2012, the Company acquired the remaining 75% ownership interest in FlatIron Crossing that it did not previously own for $310.4 million. The purchase price was funded by a cash payment of $195.9 million and the assumption of the third party's pro rata share of the mortgage note payable on the property of $114.5 million. As a result of this transaction, the Company recognized a remeasurement gain of $84.2 million.
38
On October 26, 2012, the Company acquired the remaining 33.3% ownership interest in Arrowhead Towne Center that it did not previously own for $144.4 million. The purchase price was funded by a cash payment of $69.0 million and the assumption of the third party's pro rata share of the mortgage note payable on the property of $75.4 million. As a result of this transaction, the Company recognized a remeasurement gain of $115.7 million.
On May 29, 2013, the Company's joint venture in Pacific Premier Retail LLC sold Redmond Town Center Office for $185.0 million, resulting in a gain on the sale of assets of $89.2 million to the joint venture. The Company's share of the gain was $44.4 million. The Company used its share of the proceeds from the sale to pay down its line of credit and for general corporate purposes.
On June 12, 2013, the Company's joint venture in Pacific Premier Retail LLC sold Kitsap Mall for $127.0 million, resulting in a gain on the sale of assets of $55.2 million to the joint venture. The Company's share of the gain was $28.1 million. The Company used its share of the proceeds from the sale to pay down its line of credit and for general corporate purposes.
On August 1, 2013, the Company's joint venture in Pacific Premier Retail LLC sold Redmond Town Center for $127.0 million, resulting in a gain on the sale of assets of $38.4 million to the joint venture. The Company's share of the gain was $18.3 million. The Company used its share of the proceeds from the sale to pay down its line of credit and for general corporate purposes.
On September 17, 2013, the Company’s joint venture in Camelback Colonnade was restructured. As a result of the restructuring, the Company’s ownership interest in Camelback Colonnade decreased from 73.2% to 67.5%. Prior to the restructuring, the Company had accounted for its investment in Camelback Colonnade under the equity method of accounting due to substantive participation rights held by the outside partners. Upon completion of the restructuring, these substantive participation rights were terminated and the Company obtained voting control of the joint venture. As a result of this transaction, the Company recognized a remeasurement gain of $36.3 million. Since the date of the restructuring, the Company included Camelback Colonnade in its consolidated financial statements until it was sold on December 29, 2014.
On October 8, 2013, the Company's joint venture in Ridgmar Mall sold the property for $60.9 million, which resulted in a gain on the sale of assets of $6.2 million to the joint venture. The Company's share of the gain was $3.1 million. The cash proceeds from the sale were used to pay off the $51.7 million mortgage loan on the property and the remaining $9.2 million net of closing costs was distributed to the partners. The Company used its share of the proceeds from the sale to pay down its line of credit and for general corporate purposes.
On October 24, 2013, the Company acquired the remaining 33.3% ownership interest in Superstition Springs Center that it did not previously own for $46.2 million. The purchase price was funded by a cash payment of $23.7 million and the assumption of the third party's pro rata share of the mortgage note payable on the property of $22.5 million. Prior to the acquisition, the Company had accounted for its investment in Superstition Springs Center under the equity method of accounting. As a result of this transaction, the Company recognized a remeasurement gain of $14.9 million. Since the date of acquisition, the Company has included Superstition Springs Center in its consolidated financial statements.
On June 4, 2014, the Company acquired the remaining 49.0% ownership interest in Cascade Mall that it did not previously own for a cash payment of $15.2 million. The Company purchased Cascade Mall from its joint venture in Pacific Premier Retail LLC. Prior to the acquisition, the Company had accounted for its investment in Cascade Mall under the equity method of accounting. Since the date of acquisition, the Company has included Cascade Mall in its consolidated financial statements.
On July 30, 2014, the Company formed a joint venture to redevelop Fashion Outlets of Philadelphia. The Company invested $106.8 million for a 50% ownership interest in the joint venture, which was funded by borrowings under its line of credit.
On August 28, 2014, the Company sold its 30% ownership interest in Wilshire Boulevard for a total sales price of $17.1 million, resulting in a gain on the sale of assets of $9.0 million. The sales price was funded by a cash payment of $15.4 million and the assumption of the Company's share of the mortgage note payable on the property of $1.7 million. The Company used the cash proceeds from the sale to pay down its line of credit and for general corporate purposes.
On November 14, 2014, the Company acquired the remaining 49% ownership interest that it did not previously own in two separate joint ventures, Pacific Premier Retail LLC and Queens JV LP, which together owned five Centers: Lakewood Center, Los Cerritos Center, Queens Center, Stonewood Center and Washington Square (collectively referred to herein as the "PPR Queens Portfolio.") The total consideration of approximately $1.8 billion was funded by the direct issuance of approximately $1.2 billion of common stock of the Company and the assumption of the third party's pro rata share of the mortgage notes payable on the properties of $672.1 million. The Company has included Stonewood Center and Queens Center in its consolidated financial statements since the date of acquisition and has included Lakewood Center, Los Cerritos Center and Washington Square in its consolidated financial statements from the date of acquisition until the Company sold a 40% interest in Pacific Premier Retail LLC (the "PPR Portfolio") on October 30, 2015 as provided below.
On February 17, 2015, the Company acquired the remaining 50% ownership interest in Inland Center that it did not previously own for $51.3 million. The purchase price was funded by a cash payment of $26.3 million and the assumption of the third party's share of the mortgage note payable on the property of $25.0 million. Concurrent with the purchase of the joint venture interest, the Company paid off the $50.0 million mortgage note payable on the property. The cash payment was funded by borrowings under the Company's line of credit.
On April 30, 2015, the Company entered into a 50/50 joint venture with Sears to own nine freestanding stores located at Arrowhead Towne Center, Chandler Fashion Center, Danbury Fair Mall, Deptford Mall, Freehold Raceway Mall, Los Cerritos Center, South Plains Mall, Vintage Faire Mall and Washington Square. The Company invested $150.0 million for a 50% interest in the joint venture, which was funded by borrowings under the Company's line of credit.
On October 30, 2015, the Company sold a 40% ownership interest in the PPR Portfolio, which owns Lakewood Center, Los Cerritos Center, South Plains Mall and Washington Square for a total sales price of $1.3 billion, resulting in a gain on sale of assets of $311.2 million. The sales price was funded by a cash payment of $545.6 million and the assumption of the pro rata share of the mortgage and other notes payable on the properties of $713.0 million. The Company used the cash proceeds from the sale to pay down its line of credit and for general corporate purposes, which included funding the accelerated share repurchase program ("ASR") and Special Dividend (See "Item 7. Management's Discussion and Analysis of Financial Condition and Results of Operations—Other Transactions and Events"). Upon completion of the sale of the ownership interest, the Company has accounted for its investment in the PPR Portfolio under the equity method of accounting.
39
On January 6, 2016, the Company sold a 40% ownership interest in Arrowhead Towne Center for $289.5 million, resulting in a gain on the sale of assets of $101.6 million. The sales price was funded by a cash payment of $129.5 million and the assumption of a pro rata share of the mortgage note payable on the property of $160.0 million. The Company used the cash proceeds from the sale to pay down its line of credit and for general corporate purposes, which included funding the Special Dividend (See "Item 7. Management's Discussion and Analysis of Financial Condition and Results of Operations—Other Transactions and Events"). Upon completion of the sale of the ownership interest, the Company has accounted for its investment in Arrowhead Towne Center under the equity method of accounting.
On January 14, 2016, the Company formed a joint venture, whereby the Company sold a 49% ownership interest in Deptford Mall, FlatIron Crossing and Twenty Ninth Street (the "MAC Heitman Portfolio"), for $771.5 million, resulting in a gain on the sale of assets of $340.7 million. The sales price was funded by a cash payment of $478.6 million and the assumption of a pro rata share of the mortgage notes payable on the properties of $292.9 million. The Company used the cash proceeds from the sale to pay down its line of credit and for general corporate purposes. Upon completion of the sale of the ownership interest, the Company has accounted for its investment in the MAC Heitman Portfolio under the equity method of accounting.
On March 1, 2016, the Company, through a 50/50 joint venture, acquired Country Club Plaza for a purchase price of $660.0 million. The Company funded its pro rata share of the purchase price of $330.0 million from borrowings under its line of credit. On March 28, 2016, the joint venture placed a $320.0 million loan on the property that bears interest at an effective rate of 3.88% and matures on April 1, 2026. The Company used its pro rata share of the proceeds to pay down its line of credit.
(5) | The Company's taxable REIT subsidiaries are subject to corporate level income taxes (See Note 20—Income Taxes in the Company's Notes to the Consolidated Financial Statements). |
(6) | Gain (loss) on sale or write down of assets, net includes the gain of $340.7 million from the sale of a 49% ownership interest in the MAC Heitman Portfolio and $101.6 million from the sale of a 40% ownership interest in the Arrowhead Towne Center during the year ended December 31, 2016. Gain (loss) on sale or write down of assets, net includes the gain of $311.2 million from the sale of a 40% ownership interest in the PPR Portfolio and $73.7 million from the sale of Panorama Mall during the year ended December 31, 2015 and the gain of $121.9 million from the sale of South Towne Center during the year ended December 31, 2014. |
(7) | Gain on remeasurement of assets includes $22.1 million from the acquisition of Inland Center during the year ended December 31, 2015, $1.4 billion from the acquisition of the PPR Queens Portfolio during the year ended December 31, 2014, $36.3 million from the acquisition of Camelback Colonnade and $14.9 million from the acquisition of Superstition Springs Center during the year ended December 31, 2013, $84.2 million from the acquisition of FlatIron Crossing and $115.7 million from the acquisition of Arrowhead Towne Center during the year ended December 31, 2012. |
(8) | Discontinued operations include the following: |
In March 2012, the Company recorded an impairment charge of $54.3 million related to Valley View Center. As a result of the sale of the property on April 23, 2012, the Company wrote down the carrying value of the long-lived assets to their estimated fair value of $33.5 million, which was equal to the sales price of the property. On April 23, 2012, the property was sold by a court appointed receiver, which resulted in a gain on the extinguishment of debt of $104.0 million.
On April 30, 2012, the Company sold The Borgata for $9.2 million, resulting in a loss on the sale of assets of $1.3 million. The Company used the proceeds from the sale to pay down its line of credit and for general corporate purposes.
On May 11, 2012, the Company sold a former Mervyn's store in Montebello, California for $20.8 million, resulting in a loss on the sale of assets of $0.4 million. The proceeds from the sale were used for general corporate purposes.
On May 17, 2012, the Company sold Hilton Village for $24.8 million, resulting in a gain on the sale of assets of $3.1 million. The Company used the proceeds from the sale to pay down its line of credit and for general corporate purposes.
On May 31, 2012, the Company conveyed Prescott Gateway to the mortgage note lender by a deed-in-lieu of foreclosure. As a result of the conveyance, the Company recognized a gain on the extinguishment of debt of $16.3 million.
On June 28, 2012, the Company sold Carmel Plaza for $52.0 million, resulting in a gain on the sale of assets of $7.8 million. The Company used the proceeds from the sale to pay down its line of credit.
On May 31, 2013, the Company sold Green Tree Mall for $79.0 million, resulting in a gain on the sale of assets of $59.8 million. The Company used the proceeds from the sale to pay down its line of credit and for general corporate purposes.
On June 4, 2013, the Company sold Northridge Mall and Rimrock Mall in a combined transaction for $230.0 million, resulting in a gain on the sale of assets of $82.2 million. The Company used the proceeds from the sale to pay down its line of credit and for general corporate purposes.
On September 11, 2013, the Company sold a former Mervyn's store in Milpitas, California for $12.0 million, resulting in a loss on the sale of assets of $2.6 million. The Company used the proceeds from the sale to pay down its line of credit and for general corporate purposes.
On September 30, 2013, the Company conveyed Fiesta Mall to the mortgage note lender by a deed-in-lieu of foreclosure. The mortgage loan was non-recourse. As a result of the conveyance, the Company recognized a gain on the extinguishment of debt of $1.3 million.
On October 15, 2013, the Company sold a former Mervyn's store in Midland, Texas for $5.7 million, resulting in a loss on the sale of assets of $2.0 million. The Company used the proceeds from the sale to pay down its line of credit and for general corporate purposes.
On October 23, 2013, the Company sold a former Mervyn's store in Grand Junction, Colorado for $5.4 million, resulting in a gain on the sale of assets of $1.7 million. The Company used the proceeds from the sale to pay down its line of credit and for general corporate purposes.
On December 4, 2013, the Company sold a former Mervyn's store in Livermore, California for $10.5 million, resulting in a loss on the sale of assets of $5.3 million. The Company used the proceeds from the sale to pay down its line of credit and for general corporate purposes.
40
On December 11, 2013, the Company sold Chesterfield Towne Center and Centre at Salisbury in a combined transaction for $292.5 million, resulting in a gain on the sale of assets of $151.5 million. The sales price was funded by a cash payment of $67.8 million, the assumption of the $109.7 million mortgage note payable on Chesterfield Towne Center and the assumption of the $115.0 million mortgage note payable on Centre at Salisbury. The Company used the proceeds from the sale to pay down its line of credit and for general corporate purposes.
The Company has classified the results of operations and gain or loss on sale for all of the above dispositions as discontinued operations for the years ended December 31, 2013 and 2012. On April 10, 2014, the Financial Accounting Standards Board issued Accounting Standards Update 2014-08, which amended the definition of discontinued operations and requires additional disclosures for disposal transactions that do not meet the revised discontinued operations criteria. The Company adopted this pronouncement on January 1, 2014. As a result, properties sold after 2013 have been included in gain (loss) on sale or write down of assets, net in continuing operations.
(9) | Assumes the conversion of Operating Partnership units to the extent they are dilutive to the EPS computation. It also assumes the conversion of MACWH, LP common and preferred units to the extent that they are dilutive to the EPS computation. |
(10) | Includes the dilutive effect, if any, of share and unit-based compensation plans and the senior convertible notes then outstanding calculated using the treasury stock method and the dilutive effect, if any, of all other dilutive securities calculated using the "if converted" method. |
(11) | Equity includes the noncontrolling interests in the Operating Partnership, nonredeemable noncontrolling interests in consolidated joint ventures and common and non-participating convertible preferred units of MACWH, LP. |
(12) | See "Item 7. Management's Discussion and Analysis of Financial Condition and Results of Operations—Funds From Operations ("FFO")". |
(13) | Occupancy is the percentage of Mall and Freestanding GLA leased as of the last day of the reporting period. Centers under development and redevelopment are excluded from occupancy. As a result, occupancy for the year ended December 31, 2016 excluded Broadway Plaza, Fashion Outlets of Philadelphia, Paradise Valley Mall and Westside Pavilion. Occupancy for the years ended December 31, 2015 and 2014 excluded Broadway Plaza, Fashion Outlets of Niagara Falls USA, Fashion Outlets of Philadelphia, Paradise Valley Mall, SouthPark Mall and Westside Pavilion. Occupancy for the year ended December 31, 2013 excluded Paradise Valley Mall. Occupancy for the year ended December 31, 2012 excluded The Shops at Atlas Park and Southridge Center. |
In addition, occupancy for the year ended December 31, 2016 excluded Cascade Mall and Northgate Mall, which were sold on January 18, 2017. Occupancy for the year ended December 31, 2015 excluded Flagstaff Mall, which was conveyed to the mortgage lender by a deed-in-lieu of foreclosure on July 15, 2016. Occupancy for the year ended December 31, 2014 excluded Great Northern Mall, which was conveyed to the mortgage lender by a deed-in-lieu of foreclosure in 2015. Occupancy for the year ended December 31, 2013 excluded Rotterdam Square, which was sold on January 15, 2014.
(14) | Sales per square foot are based on reports by retailers leasing Mall Stores and Freestanding Stores for the trailing twelve months for tenants which have occupied such stores for a minimum of twelve months. Sales per square foot also are based on tenants 10,000 square feet and under for Regional Shopping Centers. The sales per square foot exclude Centers under development and redevelopment. As a result, sales per square foot for the years ended December 31, 2016 excluded Broadway Plaza, Fashion Outlets of Philadelphia, Paradise Valley Mall and Westside Pavilion. Sales per square foot for the years ended December 31, 2015 and 2014 excluded Broadway Plaza, Fashion Outlets of Niagara Falls USA, Fashion Outlets of Philadelphia, Paradise Valley Mall, SouthPark Mall and Westside Pavilion. Sales per square foot for the year ended December 31, 2013 excluded Paradise Valley Mall. |
In addition, sales per square foot for the year ended December 31, 2016 excluded Cascade Mall and Northgate Mall, which were sold on January 18, 2017. Sales per square foot for the year ended December 31, 2015 excluded Flagstaff Mall, which was conveyed to the mortgage lender by a deed-in-lieu of foreclosure on July 15, 2016. Sales per square foot for the year ended December 31, 2014 excluded Great Northern Mall, which was conveyed to the mortgage lender by a deed-in-lieu of foreclosure in 2015. Sales per square foot for the year ended December 31, 2013 excluded Rotterdam Square, which was sold on January 15, 2014.
(15) | On October 30, 2015, the Company declared two special dividends/distributions ("Special Dividend"), each of $2.00 per share of common stock and per OP Unit to stockholders and OP Unit holders of record on November 12, 2015. The first Special Dividend was paid on December 8, 2015 and the second Special Dividend was paid on January 6, 2016. The Special Dividends were funded from proceeds in connection with the financing and sale of ownership interests in the PPR Portfolio and Arrowhead Towne Center. |
41
ITEM 7. MANAGEMENT'S DISCUSSION AND ANALYSIS OF FINANCIAL CONDITION AND RESULTS OF OPERATIONS
Management's Overview and Summary
The Company is involved in the acquisition, ownership, development, redevelopment, management and leasing of regional and community/power shopping centers located throughout the United States. The Company is the sole general partner of, and owns a majority of the ownership interests in, the Operating Partnership. As of December 31, 2016, the Operating Partnership owned or had an ownership interest in 50 regional shopping centers and seven community/power shopping centers. These 57 regional and community/power shopping centers (which include any related office space) consist of approximately 56 million square feet of gross leasable area (“GLA”) and are referred to herein as the “Centers”. The Centers consist of consolidated Centers (“Consolidated Centers”) and unconsolidated joint venture Centers (“Unconsolidated Joint Venture Centers”) as set forth in “Item 2. Properties,” unless the context otherwise requires. The Company is a self-administered and self-managed REIT and conducts all of its operations through the Operating Partnership and the Management Companies.
The following discussion is based primarily on the consolidated financial statements of the Company for the years ended December 31, 2016, 2015 and 2014. It compares the results of operations and cash flows for the year ended December 31, 2016 to the results of operations and cash flows for the year ended December 31, 2015. Also included is a comparison of the results of operations and cash flows for the year ended December 31, 2015 to the results of operations and cash flows for the year ended December 31, 2014. This information should be read in conjunction with the accompanying consolidated financial statements and notes thereto.
Acquisitions and Dispositions:
The financial statements reflect the following acquisitions, dispositions and changes in ownership subsequent to the occurrence of each transaction.
On January 15, 2014, the Company sold Rotterdam Square, a 585,000 square foot regional shopping center in Schenectady, New York, for $8.5 million, resulting in a loss on the sale of assets of $0.5 million. The Company used the proceeds from the sale to pay down its line of credit and for general corporate purposes.
On February 14, 2014, the Company sold Somersville Towne Center, a 348,000 square foot regional shopping center in Antioch, California, for $12.3 million, resulting in a loss on the sale of assets of $0.3 million. The Company used the proceeds from the sale to pay down its line of credit and for general corporate purposes.
On March 17, 2014, the Company sold Lake Square Mall, a 559,000 square foot regional shopping center in Leesburg, Florida, for $13.3 million, resulting in a loss on the sale of assets of $0.9 million. The sales price was funded by a cash payment of $3.7 million and the issuance of two notes receivable totaling $9.6 million. The Company used the cash proceeds from the sale to pay down its line of credit and for general corporate purposes.
On June 4, 2014, the Company acquired the remaining 49% ownership interest in Cascade Mall, a 589,000 square foot regional shopping center in Burlington, Washington, that it did not previously own for a cash payment of $15.2 million. The Company purchased Cascade Mall from its joint venture partner in Pacific Premier Retail LLC. The cash payment was funded by borrowings under the Company's line of credit. Since the date of acquisition, the Company has included Cascade Mall in its consolidated financial statements (See Note 13—Acquisitions).
On July 7, 2014, the Company sold a former Mervyn's store in El Paso, Texas for $3.6 million, resulting in a loss on the sale of assets of $0.2 million. The Company used the proceeds from the sale to pay down its line of credit and for general corporate purposes.
On July 30, 2014, the Company formed a joint venture to redevelop Fashion Outlets of Philadelphia, a 1,376,000 square foot regional shopping center in Philadelphia, Pennsylvania. The Company invested $106.8 million for a 50% interest in the joint venture, which was funded by borrowings under its line of credit.
On August 28, 2014, the Company sold a former Mervyn's store in Thousand Oaks, California for $3.5 million, resulting in a loss on the sale of assets of $0.1 million. The Company used the proceeds from the sale to pay down its line of credit and for general corporate purposes.
On August 28, 2014, the Company sold its 30% ownership interest in Wilshire Boulevard, a 40,000 square foot freestanding store in Santa Monica, California, for a total sales price of $17.1 million, resulting in a gain on the sale of assets of $9.0 million. The sales price was funded by a cash payment of $15.4 million and the assumption of the Company's share of the mortgage note payable on the property of $1.7 million. The Company used the cash proceeds from the sale to pay down its line of credit and for general corporate purposes.
42
On September 11, 2014, the Company sold a leasehold interest in a former Mervyn's store in Laredo, Texas for $1.2 million, resulting in a gain on the sale of assets of $0.3 million. The Company used the proceeds from the sale to pay down its line of credit and for general corporate purposes.
On October 10, 2014, the Company sold a former Mervyn's store in Marysville, California for $1.9 million. The Company used the proceeds from the sale to pay down its line of credit and for general corporate purposes.
On October 31, 2014, the Company sold South Towne Center, a 1,278,000 square foot regional shopping center in Sandy, Utah, for $205.0 million, resulting in a gain on the sale of assets of $121.9 million. The Company used the proceeds from the sale to pay down its line of credit and for general corporate purposes.
On October 31, 2014, the Company acquired the remaining 40% ownership interest in Fashion Outlets of Chicago, a 538,000 square foot outlet center in Rosemont, Illinois, that it did not previously own for $70.0 million. The purchase price was funded by a cash payment of $55.9 million and the settlement of $14.1 million in notes receivable. The cash payment was funded by borrowings under the Company's line of credit. The purchase agreement included contingent consideration based on the financial performance of Fashion Outlets of Chicago at an agreed upon date in 2016. On August 19, 2016, the Company paid $23.8 million in full settlement of the contingent consideration obligation.
On November 13, 2014, the Company formed a joint venture to develop Fashion Outlets of San Francisco, a 500,000 square foot outlet center, in San Francisco, California. In connection with the formation of the joint venture, the Company issued a note receivable for $65.1 million to its joint venture partner that bears interest at LIBOR plus 2.0% and matures upon the completion of certain milestones in connection with the development of Fashion Outlets of San Francisco. The note receivable was funded by borrowings under the Company's line of credit.
On November 14, 2014, the Company acquired the remaining 49% ownership interest that it did not previously own in two separate joint ventures, Pacific Premier Retail LLC and Queens JV LP, which together owned five Centers: Lakewood Center, a 2,064,000 square foot regional shopping center in Lakewood, California; Los Cerritos Center, a 1,298,000 square foot regional shopping center in Cerritos, California; Queens Center, a 963,000 square foot regional shopping center in Queens, New York; Stonewood Center, a 932,000 square foot regional shopping center in Downey, California; and Washington Square, a 1,440,000 square foot regional shopping center in Portland, Oregon (collectively referred to herein as the "PPR Queens Portfolio"). The total consideration of approximately $1.8 billion was funded by the direct issuance of approximately $1.2 billion of common stock of the Company and the assumption of the third party's pro rata share of the mortgage notes payable on the properties of $672.1 million. As a result of the acquisition, the Company recognized a gain on remeasurement of assets of $1.4 billion. The Company has included Stonewood Center and Queens Center in its consolidated financial statements since the date of acquisition and has included Lakewood Center, Los Cerritos Center and Washington Square in its consolidated financial statements from the date of acquisition until the Company sold a 40% interest in the PPR Portfolio on October 30, 2015, as provided below.
On November 20, 2014, the Company purchased a 45% ownership interest in 443 North Wabash Avenue, a 65,000 square foot undeveloped site adjacent to the Company's joint venture in The Shops at North Bridge in Chicago, Illinois, for a cash payment of $18.9 million. The cash payment was funded by borrowings under the Company's line of credit.
On December 29, 2014, the Company sold its 67.5% ownership interest in its consolidated joint venture in Camelback Colonnade, a 619,000 square foot community center in Phoenix, Arizona, for $92.9 million, resulting in a gain on the sale of assets of $24.6 million. The sales price was funded by a cash payment of $61.2 million and the assumption of the Company's share of the mortgage note payable on the property of $31.7 million. The Company used the cash proceeds from the sale to pay down its line of credit and for general corporate purposes.
On February 17, 2015, the Company acquired the remaining 50% ownership interest in Inland Center, an 866,000 square foot regional shopping center in San Bernardino, California, that it did not previously own for $51.3 million. The purchase price was funded by a cash payment of $26.3 million and the assumption of the third party's share of the mortgage note payable on the property of $25.0 million. Concurrent with the purchase of the joint venture interest, the Company paid off the $50.0 million loan on the property. The cash payment was funded by borrowings under the Company's line of credit. As a result of the acquisition, the Company recognized a gain on the remeasurement of assets of $22.1 million. Since the date of acquisition, the Company has included Inland Center in its consolidated financial statements (See Note 13—Acquisitions).
On April 30, 2015, the Company entered into a 50/50 joint venture with Sears to own nine freestanding stores located at Arrowhead Towne Center, Chandler Fashion Center, Danbury Fair Mall, Deptford Mall, Freehold Raceway Mall, Los Cerritos Center, South Plains Mall, Vintage Faire Mall and Washington Square. The Company invested $150.0 million for a 50% ownership interest in the joint venture, which was funded by borrowings under the Company's line of credit.
43
On October 30, 2015, the Company sold a 40% ownership interest in Pacific Premier Retail LLC (the "PPR Portfolio"), which owns Lakewood Center, a 2,064,000 square foot regional shopping center in Lakewood, California; Los Cerritos Center, a 1,298,000 square foot regional shopping center in Cerritos, California; South Plains Mall, a 1,127,000 square foot regional shopping center in Lubbock, Texas; and Washington Square, a 1,440,000 square foot regional shopping center in Portland, Oregon, for a total sales price of $1.3 billion, resulting in a gain on the sale of assets of $311.2 million. The sales price was funded by a cash payment of $545.6 million and the assumption of a pro rata share of the mortgage and other notes payable on the properties of $713.0 million. The Company used the cash proceeds from the sale to pay down its line of credit and for general corporate purposes, which included funding the ASR and Special Dividend (See "Other Transactions and Events"). Upon completion of the sale of the ownership interest, the Company no longer has a controlling interest in the joint venture due to the substantive participation rights of the outside partner. Accordingly, the Company accounts for its investment in the PPR Portfolio under the equity method of accounting.
On November 19, 2015, the Company sold Panorama Mall, a 312,000 square foot community center in Panorama City, California, for $98.0 million, resulting in a gain on the sale of assets of $73.7 million. The Company used the proceeds from the sale to pay down its line of credit and for general corporate purposes.
On January 6, 2016, the Company sold a 40% ownership interest in Arrowhead Towne Center, a 1,197,000 square foot regional shopping center in Glendale, Arizona, for $289.5 million, resulting in a gain on the sale of assets of $101.6 million. The sales price was funded by a cash payment of $129.5 million and the assumption of a pro rata share of the mortgage note payable on the property of $160.0 million. The Company used the cash proceeds from the sale to pay down its line of credit and for general corporate purposes, which included funding the Special Dividend (See "Other Transactions and Events"). Upon completion of the sale of the ownership interest, the Company no longer has a controlling interest in the joint venture due to the substantive participation rights of the outside partner. Accordingly, the Company accounts for its investment in Arrowhead Towne Center under the equity method of accounting.
On January 14, 2016, the Company formed a joint venture, whereby the Company sold a 49% ownership interest in Deptford Mall, a 1,039,000 square foot regional shopping center in Deptford, New Jersey; FlatIron Crossing, a 1,431,000 square foot regional shopping center in Broomfield, Colorado; and Twenty Ninth Street, an 847,000 square foot regional shopping center in Boulder, Colorado (the "MAC Heitman Portfolio"), for $771.5 million, resulting in a gain on the sale of assets of $340.7 million. The sales price was funded by a cash payment of $478.6 million and the assumption of a pro rata share of the mortgage notes payable on the properties of $292.9 million. The Company used the cash proceeds from the sale to pay down its line of credit and for general corporate purposes. Upon completion of the sale of the ownership interest, the Company no longer has a controlling interest in the joint venture due to the substantive participation rights of the outside partner. Accordingly, the Company accounts for its investment in the MAC Heitman Portfolio under the equity method of accounting.
The sale of ownership interests in the PPR Portfolio, Arrowhead Towne Center and the MAC Heitman Portfolio are collectively referred to herein as the Joint Venture Transactions.
On March 1, 2016, the Company through a 50/50 joint venture, acquired Country Club Plaza, a 1,246,000 square foot regional shopping center in Kansas City, Missouri, for a purchase price of $660.0 million. The Company funded its pro rata share of $330.0 million with borrowings under its line of credit.
On April 13, 2016, the Company sold Capitola Mall, a 586,000 square foot regional shopping center in Capitola, California, for $93.0 million, resulting in a gain on the sale of assets of $24.9 million. The Company used the proceeds from the sale to pay down its line of credit and for general corporate purposes.
On May 31, 2016, the Company sold a former Mervyn's store in Yuma, Arizona, for $3.2 million, resulting in a loss on the sale of assets of $3.1 million. The Company used the proceeds from the sale to pay down its line of credit and for general corporate purposes.
On January 18, 2017, the Company sold Cascade Mall, a 589,000 square foot regional shopping center in Burlington, Washington; and Northgate Mall, a 750,000 square foot regional shopping center in San Rafael, California, in a combined transaction for $170.0 million. The proceeds from the sale were used to pay off the mortgage note payable on Northgate Mall, pay down the Company's line of credit and for general corporate purposes.
Financing Activity:
On August 28, 2014, the Company replaced the existing loan on Mall of Victor Valley with a new $115.0 million loan that bears interest at an effective rate of 4.00% and matures on September 1, 2024.
44
On November 14, 2014, in connection with the acquisition of the PPR Queens Portfolio (See “Acquisitions and Dispositions”), the Company assumed the loans on the following Centers: Lakewood Center with a fair value of $254.9 million that bore interest at an effective rate of 1.80% and was to mature on June 1, 2015, Los Cerritos Center with a fair value of $207.5 million that bore interest at an effective rate of 1.65% and was to mature on July 1, 2018, Queens Center with a fair value of $600.0 million that bears interest at an effective rate of 3.49% and matures on January 1, 2025, Stonewood Center with a fair value of $111.9 million that bears interest at an effective rate of 1.80% and matures on November 1, 2017, and Washington Square with a fair value of $240.3 million that bore interest at an effective rate of 1.65% and was to mature on January 1, 2016.
On December 22, 2014, the Company prepaid a total of $254.2 million of mortgage debt on Fresno Fashion Fair and Vintage Faire Mall with a weighted average interest rate of 6.4%. The Company incurred a charge of $9.0 million in connection with the early extinguishment of debt.
On February 3, 2015, the Company’s joint venture in The Market at Estrella Falls replaced the existing loan on the property with a new $26.5 million loan that bears interest at LIBOR plus 1.70% and matures on February 5, 2020, including the exercise of a one-year extension option.
On February 19, 2015, the Company placed a $280.0 million loan on Vintage Faire Mall that bears interest at an effective rate of 3.55% and matures on March 6, 2026.
On March 2, 2015, the Company paid off in full the loan on Lakewood Center, which resulted in a gain of $2.2 million on the early extinguishment of debt as a result of writing off the related debt premium. On May 12, 2015, the Company placed a new $410.0 million loan on the property that bears interest at an effective rate of 4.15% and matures on June 1, 2026. On October 30, 2015, a 40% interest in the loan was assumed by a third party in connection with the sale of a 40% ownership interest in the PPR Portfolio (See "Acquisitions and Dispositions").
On March 3, 2015, the Company amended the loan on Fashion Outlets of Chicago. The amended $200.0 million loan bears interest at LIBOR plus 1.50% and matures on March 31, 2020.
On October 5, 2015, the Company paid off in full the existing loan on Washington Square. On October 29, 2015, the Company placed a new $550.0 million loan on the property that bears interest at an effective rate of 3.65% and matures on November 1, 2022. On October 30, 2015, a 40% interest in the loan was assumed by a third party in connection with the sale of a 40% ownership interest in the PPR Portfolio (See "Acquisitions and Dispositions").
On October 23, 2015, the Company placed a $200.0 million loan on South Plains Mall that bears interest at an effective rate of 4.22% and matures on November 6, 2025. On October 30, 2015, a 40% interest in the loan was assumed by a third party in connection with the sale of a 40% ownership interest in the PPR Portfolio (See "Acquisitions and Dispositions").
On October 28, 2015, the Company's joint venture in The Shops at Atlas Park placed a $57.8 million loan on the property that bears interest at LIBOR plus 2.25% and matures on October 22, 2020, including two one-year extension options.
On October 30, 2015, the Company replaced the existing loan on Los Cerritos Center with a new $525.0 million loan that bears interest at an effective rate of 4.00% and matures on November 1, 2027, which resulted in a loss of $0.9 million on the early extinguishment of debt. Concurrently, a 40% interest in the loan was assumed by a third party in connection with the sale of a 40% ownership interest in the PPR Portfolio (See "Acquisitions and Dispositions").
On October 30, 2015, the Company obtained a $100.0 million term loan ("PPR Term Loan") that bears interest at LIBOR plus 1.20% and matures on October 31, 2022. Concurrently, a 40% interest in the loan was assumed by a third party in connection with the sale of a 40% ownership interest in the PPR Portfolio (See "Acquisitions and Dispositions").
On January 6, 2016, the Company replaced the existing loan on Arrowhead Towne Center with a new $400.0 million loan that bears interest at an effective rate of 4.05% and matures on February 1, 2028, which resulted in a loss of $3.6 million on the early extinguishment of debt. Concurrently, a 40% interest in the loan was assumed by a third party in connection with the sale of a 40% ownership interest in the underlying property (See "Acquisitions and Dispositions").
On January 14, 2016, the Company placed a $150.0 million loan on Twenty Ninth Street that bears interest at an effective rate of 4.10% and matures on February 6, 2026. Concurrently, a 49% interest in the loan was assumed by a third party in connection with the sale of a 49% ownership interest in the MAC Heitman Portfolio (See "Acquisitions and Dispositions").
On March 28, 2016, the Company's joint venture in Country Club Plaza placed a $320.0 million loan on the property that bears interest at an effective rate of 3.88% and matures on April 1, 2026. The Company used its share of the proceeds to pay down its line of credit and for general corporate purposes.
45
On May 27, 2016, the Company's joint venture in The Shops at North Bridge replaced the existing loan on the property with a new $375.0 million loan that bears interest at an effective rate of 3.71% and matures on June 1, 2028. The Company used its share of the excess proceeds to pay down its line of credit and for general corporate purposes.
On July 6, 2016, the Company modified and amended its line of credit. The amended $1.5 billion line of credit bears interest at LIBOR plus a spread of 1.30% to 1.90%, depending on the Company's overall leverage level, and matures on July 6, 2020 with a one-year extension option. Based on the Company's leverage level as of the amendment date, the initial borrowing rate on the facility was LIBOR plus 1.33%. The line of credit can be expanded, depending on certain conditions, up to a total facility of $2.0 billion.
On August 5, 2016, the Company’s joint venture in The Village at Corte Madera replaced the existing loan on the property with a new $225.0 million loan that bears interest at an effective rate of 3.53% and matures on September 1, 2028. The Company used its share of the excess proceeds to pay down its line of credit and for general corporate purposes.
On October 6, 2016, the Company placed a $325.0 million loan on Fresno Fashion Fair that bears interest at an effective rate of 3.67% and matures on November 1, 2026. The Company used the proceeds to pay down its line of credit and for general corporate purposes.
On February 1, 2017, the Company's joint venture in West Acres replaced the existing loan on the property with a new $80.0 million loan that bears interest at an effective rate of 4.61% and matures on March 1, 2032. The Company used its share of the excess proceeds to pay down its line of credit and for general corporate purposes.
On February 2, 2017, the Company's joint venture in Kierland Commons entered into a loan commitment with a lender to replace the existing loan on the property with a new $225.0 million loan that will bear interest at a fixed rate of 3.95% for ten-years. The new loan is expected to close in March 2017. The Company expects to use its share of the excess proceeds to pay down its line of credit and for general corporate purposes.
Redevelopment and Development Activity:
In February 2014, the Company's joint venture in Broadway Plaza started construction on the 235,000 square foot expansion of the 923,000 square foot regional shopping center in Walnut Creek, California. The joint venture completed a portion of the first phase of the project in November 2015 and the remaining portion of the first phase was completed in September 2016. The second phase will be completed through Summer 2018. The total cost of the project is estimated to be $305.0 million, with $152.5 million estimated to be the Company's pro rata share. The Company has funded $127.7 million of the total $255.4 million incurred by the joint venture as of December 31, 2016.
In July 2015, the Company started construction on a 335,000 square foot expansion of Green Acres Mall, a 2,089,000 square foot regional shopping center in Valley Stream, New York. The Company completed the project in October 2016. As of December 31, 2016, the Company has incurred $104.9 million in costs.
The Company's joint venture is proceeding with the development of Fashion Outlets of Philadelphia, a redevelopment of an 850,000 square foot regional shopping center in Philadelphia, Pennsylvania. The project is expected to be completed in 2018. The total cost of the project is estimated to be between $305.0 million and $365.0 million, with $152.5 million to $182.5 million estimated to be the Company's pro rata share. The Company has funded $46.9 million of the total $93.7 million incurred by the joint venture as of December 31, 2016.
The Company is currently in the process of redeveloping the 250,000 square foot former Sears store at Kings Plaza Shopping Center. The Company expects to complete the project in Summer 2018. As of December 31, 2016, the Company has incurred $10.0 million in costs and anticipates the total cost of the project to be between $95.0 million and $100.0 million.
Other Transactions and Events:
On March 9, 2015, the Company received an unsolicited, conditional proposal from Simon Property Group, Inc. (“Simon”) to acquire the Company. The Company’s Board of Directors, after consulting with its financial, real estate and legal advisors, unanimously determined that the Simon proposal substantially undervalued the Company and was not in the best interests of the Company and its stockholders. On March 20, 2015, the Company received a revised, unsolicited proposal to acquire the Company from Simon, which Simon described as its best and final proposal. The Company’s Board of Directors carefully reviewed the revised proposal with the assistance of its financial, real estate and legal advisors, and determined that the revised proposal continued to substantially undervalue the Company and that pursuing the proposed transaction at that time was not in the best interests of the Company and its stockholders.
46
On June 30, 2015, the Company conveyed Great Northern Mall, an 895,000 square foot regional shopping center in Clay, New York, to the mortgage lender by a deed-in-lieu of foreclosure and was discharged from the mortgage note payable. The mortgage note payable was a non-recourse loan. As a result, the Company recognized a loss of $1.6 million on the extinguishment of debt.
On September 30, 2015, the Company's Board of Directors authorized the repurchase of up to $1.2 billion of the Company's outstanding common shares over the period ending September 30, 2017, as market conditions warranted (the "2015 Stock Buyback Program"). On November 12, 2015, the Company entered into an accelerated share repurchase program ("ASR") to repurchase $400.0 million of the Company's common stock. In accordance with the ASR, the Company made a prepayment of $400.0 million and received an initial share delivery of 4,140,788 shares. On January 19, 2016, the ASR was completed and the Company received an additional delivery of 970,609 shares. The average price of the 5,111,397 shares repurchased under the ASR was $78.26 per share. The ASR was funded from proceeds in connection with the financing and sale of the ownership interest in the PPR Portfolio (See "Acquisitions and Dispositions" and "Financing Activity").
On October 30, 2015, the Company declared two special dividends/distributions ("Special Dividend"), each of $2.00 per share of common stock and per OP Unit. The first Special Dividend was paid on December 8, 2015 to stockholders and OP Unit holders of record on November 12, 2015. The second Special Dividend was paid on January 6, 2016 to common stockholders and OP Unit holders of record on November 12, 2015. The Special Dividends were funded from proceeds in connection with the financing and sale of ownership interests in the PPR Portfolio and Arrowhead Towne Center (See "Acquisitions and Dispositions" and "Financing Activity").
On February 17, 2016, the Company entered into an ASR to repurchase $400.0 million of the Company's common stock. In accordance with the ASR, the Company made a prepayment of $400.0 million and received an initial share delivery of 4,222,193 shares. On April 19, 2016, the ASR was completed and the Company received delivery of an additional 861,235 shares. The average price of the 5,083,428 shares repurchased under the ASR was $78.69 per share. The ASR was funded from borrowings under the Company's line of credit, which had been paid down from the proceeds from the recently completed Joint Venture Transactions (See "Acquisitions and Dispositions" and "Financing Activity").
On May 9, 2016, the Company entered into an ASR to repurchase the remaining $400.0 million of the Company's common stock authorized for repurchase. In accordance with the ASR, the Company made a prepayment of $400.0 million and received an initial share delivery of 3,964,812 shares. On July 11, 2016, the ASR was completed and the Company received delivery of an additional 1,104,162 shares. The average price of the 5,068,974 shares repurchased under the ASR was $78.91 per share. The ASR was funded from borrowings under the Company's line of credit, which had been recently paid down from the proceeds from the recently completed Joint Venture Transactions (See "Acquisitions and Dispositions" and "Financing Activity"). The total number of shares repurchased under the 2015 Stock Buyback Program was 15,263,799 at an average price of $78.62.
On July 15, 2016, the Company conveyed Flagstaff Mall, a 347,000 square foot regional shopping center in Flagstaff, Arizona, to the mortgage lender by a deed-in-lieu of foreclosure and was discharged from the mortgage note payable. The mortgage note payable was a non-recourse loan. As a result, the Company recognized a gain of $5.3 million on the extinguishment of debt.
On February 13, 2017, the Company announced that the Board of Directors has authorized the repurchase of up to $500.0 million of its outstanding common shares as market conditions and the Company’s liquidity warrant (the "2017 Stock Buyback Program"). Repurchases may be made through open market purchases, privately negotiated transactions, structured or derivative transactions, including ASR transactions, or other methods of acquiring shares and pursuant to Rule 10b5-1 of the Securities Act of 1934, from time to time as permitted by securities laws and other legal requirements.
Inflation:
In the last five years, inflation has not had a significant impact on the Company because of a relatively low inflation rate. Most of the leases at the Centers have rent adjustments periodically throughout the lease term. These rent increases are either in fixed increments or based on using an annual multiple of increases in the Consumer Price Index ("CPI"). In addition, approximately 6% to 13% of the leases for spaces 10,000 square feet and under expire each year, which enables the Company to replace existing leases with new leases at higher base rents if the rents of the existing leases are below the then existing market rate. The Company has generally entered into leases that require tenants to pay a stated amount for operating expenses, generally excluding property taxes, regardless of the expenses actually incurred at any Center, which places the burden of cost control on the Company. Additionally, certain leases require the tenants to pay their pro rata share of operating expenses.
47
Seasonality:
The shopping center industry is seasonal in nature, particularly in the fourth quarter during the holiday season when retailer occupancy and retail sales are typically at their highest levels. In addition, shopping malls achieve a substantial portion of their specialty (temporary retailer) rents during the holiday season and the majority of percentage rent is recognized in the fourth quarter. As a result of the above, earnings are generally higher in the fourth quarter.
Critical Accounting Policies
The preparation of financial statements in conformity with generally accepted accounting principles ("GAAP") in the United States of America requires management to make estimates and assumptions that affect the reported amounts of assets and liabilities and disclosure of contingent assets and liabilities at the date of the financial statements and the reported amounts of revenues and expenses during the reporting period. Actual results could differ from those estimates.
Some of these estimates and assumptions include judgments on revenue recognition, estimates for common area maintenance and real estate tax accruals, provisions for uncollectible accounts, impairment of long-lived assets, the allocation of purchase price between tangible and intangible assets, capitalization of costs and fair value measurements. The Company's significant accounting policies are described in more detail in Note 2—Summary of Significant Accounting Policies in the Company's Notes to the Consolidated Financial Statements. However, the following policies are deemed to be critical.
Revenue Recognition:
Minimum rental revenues are recognized on a straight-line basis over the term of the related lease. The difference between the amount of rent due in a year and the amount recorded as rental income is referred to as the "straight line rent adjustment." Currently, 57% of the leases contain provisions for CPI rent increases periodically throughout the term of the lease. The Company believes that using an annual multiple of CPI increases, rather than fixed contractual rent increases, results in revenue recognition that more closely matches the cash revenue from each lease and will provide more consistent rent growth throughout the term of the leases. Percentage rents are recognized when the tenants' specified sales targets have been met. Estimated recoveries from certain tenants for their pro rata share of real estate taxes, insurance and other shopping center operating expenses are recognized as revenues in the period the applicable expenses are incurred. Other tenants pay a fixed rate and these tenant recoveries are recognized as revenues on a straight-line basis over the term of the related leases.
Property:
Maintenance and repair expenses are charged to operations as incurred. Costs for major replacements and betterments, which includes HVAC equipment, roofs, parking lots, etc., are capitalized and depreciated over their estimated useful lives. Gains and losses are recognized upon disposal or retirement of the related assets and are reflected in earnings.
Property is recorded at cost and is depreciated using a straight-line method over the estimated useful lives of the assets as follows:
Buildings and improvements | 5 - 40 years |
Tenant improvements | 5 - 7 years |
Equipment and furnishings | 5 - 7 years |
Capitalization of Costs:
The Company capitalizes costs incurred in redevelopment, development, renovation and improvement of properties. The capitalized costs include pre-construction costs essential to the development of the property, development costs, construction costs, interest costs, real estate taxes, salaries and related costs and other costs incurred during the period of development. These capitalized costs include direct and certain indirect costs clearly associated with the project. Indirect costs include real estate taxes, insurance and certain shared administrative costs. In assessing the amounts of direct and indirect costs to be capitalized, allocations are made to projects based on estimates of the actual amount of time spent on each activity. Indirect costs not clearly associated with specific projects are expensed as period costs. Capitalized indirect costs are allocated to development and redevelopment activities based on the square footage of the portion of the building not held available for immediate occupancy. If costs and activities incurred to ready the vacant space cease, then cost capitalization is also discontinued until such activities are resumed. Once work has been completed on a vacant space, project costs are no longer capitalized. For projects with extended lease-up periods, the Company ends the capitalization when significant activities have ceased, which does not exceed the shorter of a one-year period after the completion of the building shell or when the construction is substantially complete.
48
Acquisitions:
The Company allocates the estimated fair value of acquisitions to land, building, tenant improvements and identified intangible assets and liabilities, based on their estimated fair values. In addition, any assumed mortgage notes payable are recorded at their estimated fair values. The estimated fair value of the land and buildings is determined utilizing an “as if vacant” methodology. Tenant improvements represent the tangible assets associated with the existing leases valued on a fair value basis at the acquisition date prorated over the remaining lease terms. The tenant improvements are classified as an asset under property and are depreciated over the remaining lease terms. Identifiable intangible assets and liabilities relate to the value of in-place operating leases which come in three forms: (i) leasing commissions and legal costs, which represent the value associated with “cost avoidance” of acquiring in-place leases, such as lease commissions paid under terms generally experienced in the Company's markets; (ii) value of in-place leases, which represents the estimated loss of revenue and of costs incurred for the period required to lease the “assumed vacant” property to the occupancy level when purchased; and (iii) above or below-market value of in-place leases, which represents the difference between the contractual rents and market rents at the time of the acquisition, discounted for tenant credit risks. Leasing commissions and legal costs are recorded in deferred charges and other assets and are amortized over the remaining lease terms. The value of in-place leases are recorded in deferred charges and other assets and amortized over the remaining lease terms plus any below-market fixed rate renewal options. Above or below-market leases are classified in deferred charges and other assets or in other accrued liabilities, depending on whether the contractual terms are above or below-market, and the asset or liability is amortized to minimum rents over the remaining terms of the leases. The remaining lease terms of below-market leases may include certain below-market fixed-rate renewal periods. In considering whether or not a lessee will execute a below-market fixed-rate lease renewal option, the Company evaluates economic factors and certain qualitative factors at the time of acquisition such as tenant mix in the Center, the Company's relationship with the tenant and the availability of competing tenant space. The initial allocation of purchase price is based on management's preliminary assessment, which may change when final information becomes available. Subsequent adjustments made to the initial purchase price allocation are made within the allocation period, which does not exceed one year. The purchase price allocation is described as preliminary if it is not yet final. The use of different assumptions in the allocation of the purchase price of the acquired assets and liabilities assumed could affect the timing of recognition of the related revenues and expenses.
The Company immediately expenses costs associated with business combinations as period costs.
Remeasurement gains are recognized when the Company obtains control of an existing equity method investment to the extent that the fair value of the existing equity investment exceeds the carrying value of the investment.
Asset Impairment:
The Company assesses whether an indicator of impairment in the value of its properties exists by considering expected future operating income, trends and prospects, as well as the effects of demand, competition and other economic factors. Such factors include projected rental revenue, operating costs and capital expenditures as well as estimated holding periods and capitalization rates. If an impairment indicator exists, the determination of recoverability is made based upon the estimated undiscounted future net cash flows, excluding interest expense. The amount of impairment loss, if any, is determined by comparing the fair value, as determined by a discounted cash flows analysis, with the carrying value of the related assets. The Company generally holds and operates its properties long-term, which decreases the likelihood of their carrying values not being recoverable. Properties classified as held for sale are measured at the lower of the carrying amount or fair value less cost to sell.
The Company reviews its investments in unconsolidated joint ventures for a series of operating losses and other factors that may indicate that a decrease in the value of its investments has occurred which is other-than-temporary. The investment in each unconsolidated joint venture is evaluated periodically, and as deemed necessary, for recoverability and valuation declines that are other-than-temporary.
Fair Value of Financial Instruments:
The fair value hierarchy distinguishes between market participant assumptions based on market data obtained from sources independent of the reporting entity and the reporting entity's own assumptions about market participant assumptions.
Level 1 inputs utilize quoted prices in active markets for identical assets or liabilities that the Company has the ability to access. Level 2 inputs are inputs other than quoted prices included in Level 1 that are observable for the asset or liability, either directly or indirectly. Level 2 inputs may include quoted prices for similar assets and liabilities in active markets, as well as inputs that are observable for the asset or liability (other than quoted prices), such as interest rates, foreign exchange rates and yield curves that are observable at commonly quoted intervals. Level 3 inputs are unobservable inputs for the asset or liability, which is typically based on an entity's own assumptions, as there is little, if any, related market activity. In instances where the determination of the fair value measurement is based on inputs from different levels of the fair value hierarchy, the level in the
49
fair value hierarchy within which the entire fair value measurement falls is based on the lowest level input that is significant to the fair value measurement in its entirety. The Company's assessment of the significance of a particular input to the fair value measurement in its entirety requires judgment, and considers factors specific to the asset or liability.
The Company calculates the fair value of financial instruments and includes this additional information in the notes to consolidated financial statements when the fair value is different than the carrying value of those financial instruments. When the fair value reasonably approximates the carrying value, no additional disclosure is made.
Deferred Charges:
Costs relating to obtaining tenant leases are deferred and amortized over the initial term of the agreement using the straight-line method. As these deferred leasing costs represent productive assets incurred in connection with the Company's provision of leasing arrangements at the Centers, the related cash flows are classified as investing activities within the Company's consolidated statements of cash flows. Costs relating to financing of shopping center properties are deferred and amortized over the life of the related loan using the straight-line method, which approximates the effective interest method. The ranges of the terms of the agreements are as follows:
Deferred lease costs | 1 - 15 years |
Deferred financing costs | 1 - 15 years |
Results of Operations
Many of the variations in the results of operations, discussed below, occurred because of the transactions affecting the Company's properties described above, including those related to the Redevelopment Properties, the Joint Venture Centers and the Disposition Properties (as defined below).
For purposes of the discussion below, the Company defines "Same Centers" as those Centers that are substantially complete and in operation for the entirety of both periods of the comparison. Non-Same Centers for comparison purposes include those Centers or properties that are going through a substantial redevelopment often resulting in the closing of a portion of the Center (“Redevelopment Properties”), those properties that have recently transitioned to or from equity method joint ventures to consolidated assets ("Joint Venture Centers") and properties that have been disposed of ("Disposition Properties"). The Company moves a Center in and out of Same Centers based on whether the Center is substantially complete and in operation for the entirety of both periods of the comparison. Accordingly, the Same Centers consist of all consolidated Centers, excluding the Redevelopment Properties, the Joint Venture Centers and the Disposition Properties for the periods of comparison.
For the comparison of the year ended December 31, 2016 to the year ended December 31, 2015, the Redevelopment Properties are the expansion portion of Green Acres Mall, Paradise Valley Mall and Westside Pavilion. For the comparison of the year ended December 31, 2015 to the year ended December 31, 2014, the Redevelopment Properties are Paradise Valley Mall, the expansion portion of Fashion Outlets of Niagara Falls USA, SouthPark Mall and Westside Pavilion.
For the comparison of the year ended December 31, 2016 to the year ended December 31, 2015, the Joint Venture Centers are Inland Center, the PPR Portfolio, Arrowhead Towne Center and the MAC Heitman Portfolio. For the comparison of the year ended December 31, 2015 to the year ended December 31, 2014, the Joint Venture Centers are Inland Center, Lakewood Center, Los Cerritos Center, South Plains Mall, Washington Square, Stonewood Center, Queens Center and Cascade Mall. The change in revenues and expenses at the Joint Venture Centers for the comparison of the year ended December 31, 2016 to the year ended December 31, 2015 is primarily due to the conversion of the PPR Portfolio, Arrowhead Towne Center and the MAC Heitman Portfolio from consolidated Centers to unconsolidated joint ventures. The change in revenues and expenses at the Joint Venture Centers for the comparison of the year ended December 31, 2015 to the year ended December 31, 2014 is primarily due to the conversion of the PPR Queens Portfolio from unconsolidated joint ventures to consolidated Centers in 2014.
For comparison of the year ended December 31, 2016 to the year ended December 31, 2015, the Disposition Properties are Flagstaff Mall, Capitola Mall, Panorama Mall and Great Northern Mall. For the comparison of the year ended December 31, 2015 to the year ended December 31, 2014, the Disposition Properties are Panorama Mall, Great Northern Mall, Rotterdam Square, Somersville Towne Center, Lake Square Mall, South Towne Center and Camelback Colonnade.
50
Unconsolidated joint ventures are reflected using the equity method of accounting. The Company's pro rata share of the results from these Centers is reflected in the consolidated statements of operations as equity in income of unconsolidated joint ventures.
The Company considers tenant annual sales per square foot (for tenants in place for a minimum of 12 months or longer and 10,000 square feet and under) for regional shopping centers, occupancy rates (excluding large retail stores or "Anchors") for the Centers and releasing spreads (i.e. a comparison of initial average base rent per square foot on leases executed during the trailing twelve months to average base rent per square foot at expiration for the leases expiring during the year based on the spaces 10,000 square feet and under) to be key performance indicators of the Company's internal growth.
Tenant sales per square foot decreased from $635 for the twelve months ended December 31, 2015 to $630 for the twelve months ended December 31, 2016. Occupancy rate decreased from 96.1% at December 31, 2015 to 95.4% at December 31, 2016. Releasing spreads increased 17.7% for the twelve months ended December 31, 2016. These calculations exclude Centers under development or redevelopment and property dispositions (See "Acquisitions and Dispositions" and "Other Transactions and Events" in Management's Overview and Summary).
Releasing spreads remained positive as the Company was able to lease available space at average higher rents than the expiring rental rates, resulting in a releasing spread of $8.49 per square foot ($56.57 on new and renewal leases executed compared to $48.08 on leases expiring), representing a 17.7% increase for the trailing twelve months ended December 31, 2016. The Company expects that releasing spreads will continue to be positive for 2017 as it renews or relets leases that are scheduled to expire. These leases that are scheduled to expire represent approximately 900,000 square feet of the Centers, accounting for 11.3% of the GLA of mall stores and freestanding stores, for spaces 10,000 square feet and under, as of December 31, 2016.
During the trailing twelve months ended December 31, 2016, the Company signed 231 new leases and 406 renewal leases comprising approximately 1.2 million square feet of GLA, of which 0.9 million square feet related to the consolidated Centers. The annual initial average base rent for new and renewal leases was $56.57 per square foot for the trailing twelve months ended December 31, 2016 with an average tenant allowance of $16.29 per square foot.
Comparison of Years Ended December 31, 2016 and 2015
Revenues:
Minimum and percentage rents (collectively referred to as "rental revenue") decreased by $148.1 million, or 18.9%, from 2015 to 2016. The decrease in rental revenue is attributed to a decrease of $179.3 million from the Joint Venture Centers and $15.4 million from the Disposition Properties offset in part by an increase of $44.9 million from the Same Centers and $1.7 million from the Redevelopment Properties. The increase in rental revenue at the Same Centers is primarily due to an increase in lease termination income, as provided below, and an increase in leasing spreads.
Rental revenue includes the amortization of above and below-market leases, the amortization of straight-line rents and lease termination income. The amortization of above and below-market leases decreased from $16.5 million in 2015 to $12.8 million in 2016 primarily due to the Joint Venture Centers. The amortization of straight-line rents decreased from $7.2 million in 2015 to $5.2 million in 2016. Lease termination income increased from $9.7 million in 2015 to $20.4 million in 2016.
Tenant recoveries decreased $109.8 million, or 26.5%, from 2015 to 2016. The decrease in tenant recoveries is attributed to a decrease of $88.5 million from the Joint Venture Centers, $13.6 million from the Same Centers, $6.8 million from the Disposition Properties and $0.9 million from the Redevelopment Properties.
Management Companies' revenue increased from $26.3 million in 2015 to $39.5 million in 2016. The increase in Management Companies' revenue is due to an increase in management fees as a result of the conversion of the PPR Portfolio, Arrowhead Towne Center and the MAC Heitman Portfolio from consolidated Centers to unconsolidated joint ventures (See "Acquisitions and Dispositions" in Management's Overview and Summary) and an increase in development and leasing fees from other joint ventures.
Shopping Center and Operating Expenses:
Shopping center and operating expenses decreased $72.2 million, or 19.0%, from 2015 to 2016. The decrease in shopping center and operating expenses is attributed to a decrease of $69.5 million from the Joint Venture Centers and $8.1 million from the Disposition Properties offset in part by an increase of $5.1 million from the Same Centers and $0.3 million from the Redevelopment Properties. The increase in shopping center and operating expenses at the Same Centers is primarily due to an increase in property tax expense.
51
Management Companies' Operating Expenses:
Management Companies' operating expenses increased $6.0 million from 2015 to 2016 due to the conversion of the PPR Portfolio, Arrowhead Towne Center and the MAC Heitman Portfolio from consolidated Centers to unconsolidated joint ventures (See "Acquisitions and Dispositions" in Management's Overview and Summary) and an increase in share and unit-based compensation costs.
REIT General and Administrative Expenses:
REIT general and administrative expenses decreased by $1.7 million from 2015 to 2016.
Costs related to Unsolicited Takeover Offer:
The Company incurred $25.2 million in costs in 2015 related to evaluating and responding to an unsolicited takeover offer (See "Other Transactions and Events" in Management's Overview and Summary).
Depreciation and Amortization:
Depreciation and amortization decreased $116.0 million from 2015 to 2016. The decrease in depreciation and amortization is primarily attributed to a decrease of $116.8 million from the Joint Venture Centers and $5.5 million from the Disposition Properties offset in part by an increase of $4.3 million from the Same Centers and $2.0 million from the Redevelopment Properties.
Interest Expense:
Interest expense decreased $48.3 million from 2015 to 2016. The decrease in interest expense is primarily attributed to a decrease of $34.9 million from the Joint Venture Centers, $9.3 million from the Same Centers, $2.3 million from a term loan, $1.9 million from the Disposition Properties and $1.0 million from the Redevelopment Properties offset in part by an increase of $1.1 million from borrowings under the line of credit. The decrease in interest expense at the Same Centers is primarily due to the payoff of the mortgage notes payable on Eastland Mall, Valley Mall and Valley River Center in 2015 offset in part by the new loan on Fresno Fashion Fair in 2016 (See "Financing Activity" in Management's Overview and Summary).
The above interest expense items are net of capitalized interest, which decreased from $13.1 million in 2015 to $10.3 million in 2016.
Equity in Income of Unconsolidated Joint Ventures:
Equity in income of unconsolidated joint ventures increased $11.8 million from 2015 to 2016. The increase is primarily due the opening of the Hyatt Regency Tysons Corner Center and VITA Tysons Corner Center in 2015 and the conversion of the PPR Portfolio, Arrowhead Towne Center and the MAC Heitman Portfolio from consolidated Centers to unconsolidated joint ventures (See "Acquisitions and Dispositions" in Management's Overview and Summary).
Gain on Sale or Write down of Assets, net:
Gain on sale or write down of assets, net increased $37.1 million from 2015 to 2016. The increase in gain on sale of assets is primarily due to the increase in gain of $82.4 million on the Joint Venture Transactions and the sale of properties (See "Acquisitions and Dispositions" in Management's Overview and Summary) offset in part by an increase in impairment loss of $29.0 million and a charge of $12.2 million from the settlement of a contingent consideration obligation in 2016.
Gain on Remeasurement of Assets:
The gain on remeasurement of assets of $22.1 million in 2015 is attributed to the purchase of the remaining 50% ownership interest in Inland Center that the Company did not previously own (See "Acquisitions and Dispositions" in Management's Overview and Summary).
Net Income:
Net income increased $31.9 million from 2015 to 2016. The increase in net income is primarily attributed to an increase of $37.1 million from gain on sale or write down of assets as discussed above.
Funds From Operations ("FFO"):
Primarily as a result of the factors mentioned above, FFO—diluted was $642.3 million in 2015 and 2016. For a reconciliation of FFO and FFO—diluted to net income available to common stockholders, the most directly comparable GAAP financial measure, see "Funds From Operations ("FFO")" below.
52
Operating Activities:
Cash provided by operating activities decreased from $540.4 million in 2015 to $417.5 million in 2016. The decrease is primarily due to the conversion of the PPR Portfolio, Arrowhead Towne Center and the MAC Heitman Portfolio from consolidated Centers to unconsolidated joint ventures (See "Acquisitions and Dispositions" in Management's Overview and Summary), changes in assets and liabilities and the results as discussed above.
Investing Activities:
Cash provided by investing activities increased $544.1 million from 2015 to 2016. The increase in cash provided by investing activities was primarily due to an increase in distributions from unconsolidated joint ventures of $338.5 million, an increase in proceeds from the sale of assets of $77.4 million, a decrease in development, redevelopment and renovations of $60.7 million, a decrease in acquisition of property of $26.3 million and a decrease in restricted cash of $19.9 million.
The increase in distributions from unconsolidated joint ventures is primarily due to the receipt of the Company's share of the net proceeds from the loans placed on Country Club Plaza, The Shops at North Bridge and The Village at Corte Madera in 2016 (See "Financing Activity" in Management's Overview and Summary).
Financing Activities:
Cash used in financing activities increased $415.3 million from 2015 to 2016. The increase in cash used in financing activities was primarily due to a decrease in proceeds from mortgages, bank and other notes payable of $879.5 million and an increase in the repurchases of the Company's common stock of $399.9 million (See "Other Transactions" in Management's Overview and Summary) offset in part by a decrease in payments on mortgages, bank and other notes payable of $846.3 million.
Comparison of Years Ended December 31, 2015 and 2014
Revenues:
Rental revenue increased by $127.4 million, or 19.4%, from 2014 to 2015. The increase in rental revenue is attributed to an increase of $150.4 million from the Joint Venture Centers, $2.4 million from the Redevelopment Properties and $0.3 million from the Same Centers offset in part by a decrease of $25.7 million from the Disposition Properties.
The amortization of above and below-market leases increased from $9.1 million in 2014 to $16.5 million in 2015 primarily due to the Joint Venture Centers. The amortization of straight-line rents increased from $5.8 million in 2014 to $7.2 million in 2015. Lease termination income increased from $9.1 million in 2014 to $9.7 million in 2015.
Tenant recoveries increased $54.0 million, or 15.0%, from 2014 to 2015. The increase in tenant recoveries is attributed to an increase of $63.8 million from the Joint Venture Centers and $4.8 million from the Same Centers offset in part by a decrease of $13.3 million from the Disposition Properties and $1.3 million from the Redevelopment Properties.
Other revenues increased $9.2 million from 2014 to 2015. The increase in other revenues is attributed to an increase of $12.5 million from the Joint Venture Centers offset in part by a decrease of $1.7 million from the Same Centers, $1.1 million from the Disposition Properties and $0.5 million from the Redevelopment Properties.
Management Companies' revenue decreased from $34.0 million in 2014 to $26.3 million in 2015. The decrease in Management Companies' revenue is primarily due to a reduction in management fees as a result of the conversion from unconsolidated joint ventures to consolidated Centers of Cascade Mall and the PPR Queens Portfolio in 2014 and Inland Center in 2015 (See "Acquisitions and Dispositions" in Management's Overview and Summary).
Shopping Center and Operating Expenses:
Shopping center and operating expenses increased $26.3 million, or 7.4%, from 2014 to 2015. The increase in shopping center and operating expenses is attributed to an increase of $59.9 million from the Joint Venture Centers offset in part by a decrease of $18.0 million from the Same Centers, $14.3 million from the Disposition Properties and $1.3 million from the Redevelopment Properties. The decrease in shopping center and operating expenses at the Same Centers is primarily due to a reduction in maintenance and utility costs offset in part by an increase in property tax expense.
Management Companies' Operating Expenses:
Management Companies' operating expenses increased $3.9 million from 2014 to 2015 due to an increase in share and unit-based compensation costs.
53
REIT General and Administrative Expenses:
REIT general and administrative expenses increased by $0.5 million from 2014 to 2015.
Costs related to Unsolicited Takeover Offer:
The Company incurred $25.2 million in costs in 2015 related to evaluating and responding to an unsolicited takeover offer (See "Other Transactions and Events" in Management's Overview and Summary).
Depreciation and Amortization:
Depreciation and amortization increased $85.8 million from 2014 to 2015. The increase in depreciation and amortization is primarily attributed to an increase of $99.5 million from the Joint Venture Centers and $4.0 million from the Redevelopment Properties offset in part by a decrease of $12.5 million from the Disposition Properties and $5.2 million from the Same Centers.
Interest Expense:
Interest expense increased $21.3 million from 2014 to 2015. The increase in interest expense is primarily attributed to an increase of $27.5 million from the Joint Venture Centers, $8.6 million from borrowings under the line of credit and $3.0 million from the Redevelopment Properties offset in part by a decrease of $16.1 million from the Same Centers, $1.5 million from the Disposition Properties and $0.2 million from the term loan. The decrease in interest expense at the Same Centers is due to the early payoff of the mortgage notes payable on Fresno Fashion Fair in 2014 and Valley River Center in 2015.
The above interest expense items are net of capitalized interest, which increased from $12.6 million in 2014 to $13.1 million in 2015.
(Gain) Loss on Early Extinguishment of Debt, net:
The change in (gain) loss on early extinguishment of debt was $11.0 million from 2014 to 2015, resulting from a gain on early extinguishment of debt of $1.5 million in 2015 compared to a loss on early extinguishment of debt of $9.6 million in 2014. This change is primarily due to the one-time charge of $9.0 million in connection with the early extinguishment of the mortgage notes payable on Fresno Fashion Fair and Vintage Faire Mall in 2014 (See "Financing Activities" in Management's Overview and Summary).
Equity in Income of Unconsolidated Joint Ventures:
Equity in income of unconsolidated joint ventures decreased $15.5 million from 2014 to 2015. The decrease is primarily due to the conversion of the PPR Queens Portfolio from unconsolidated joint ventures to consolidated Centers in 2014 offset in part by the acquisition of the Sears Portfolio in 2015 (See "Acquisitions and Dispositions" in Management's Overview and Summary).
Gain on Sale or Write down of Assets, net:
The gain on sale or write down of assets, net increased $304.8 million from 2014 to 2015. This increase is primarily attributed to the gain on sale of the 40% interest in the PPR Portfolio of $311.2 million in 2015, the gain on the sale of Panorama Mall of $73.7 million in 2015, a decrease in development write down of $40.3 million in 2015 and a decrease in impairment losses of $30.6 million in 2015 offset in part by the gain on the sale of South Towne Center of $121.9 million in 2014 (See "Acquisitions and Dispositions" in Management's Overview and Summary).
Gain on Remeasurement of Assets:
Gain on remeasurement of assets decreased $1.4 billion from 2014 to 2015. The decrease is due to the remeasurement gain of $1.4 billion from the acquisition of the PPR Queens Portfolio in 2014 offset in part by the remeasurement gain of $22.1 million from the acquisition of the remaining 50% ownership interest in Inland Center in 2015 (See "Acquisitions and Dispositions" in Management's Overview and Summary).
Net Income:
Net income decreased $1.1 billion from 2014 to 2015. The decrease in net income is primarily attributed to a decrease of$1.4 billion from gain on remeasurement of assets offset in part by an increase of $304.8 million from gain on sale or write down of assets as discussed above.
54
Funds From Operations:
Primarily as a result of the factors mentioned above, FFO—diluted increased 18.3% from $542.8 million in 2014 to $642.3 million in 2015. For a reconciliation of FFO and FFO—diluted to net income available to common stockholders, the most directly comparable GAAP financial measure, see "Funds From Operations ("FFO")" below.
Operating Activities:
Cash provided by operating activities increased from $400.7 million in 2014 to $540.4 million in 2015. The increase was primarily due to changes in assets and liabilities and the results as discussed above.
Investing Activities:
Cash used in investing activities decreased $154.8 million from 2014 to 2015. The decrease in cash used in investing activities was primarily due to an increase in proceeds from the sale of assets of $326.8 million offset in part by an increase in contributions to unconsolidated joint ventures of $89.6 million and an increase in development, redevelopment and renovations of $86.9 million.
The increase in cash proceeds from the sale of assets is primarily attributed to the sale of a 40% interest in the PPR Portfolio and the sale of Panorama Mall in 2015 (See "Acquisitions and Dispositions" in Management's Overview and Summary). The increase in contributions to unconsolidated joint ventures is primarily due to the acquisition of the 50% ownership interest in the Sears Portfolio in 2015 (See "Acquisitions and Dispositions" in Management's Overview and Summary).
Financing Activities:
Cash used in financing activities increased $308.0 million from 2014 to 2015. The increase in cash used in financing activities was primarily due to an increase in payments on mortgages, bank and other notes payable of $2.4 billion, an increase in dividends and distributions of $401.4 million and the repurchase of the Company's common stock of $400.1 million (See "Other Transactions and Events" in Management's Overview and Summary) offset in part by an increase in proceeds from mortgages, bank and other notes payable of $2.9 billion.
Liquidity and Capital Resources
The Company anticipates meeting its liquidity needs for its operating expenses and debt service and dividend requirements for the next twelve months through cash generated from operations, working capital reserves and/or borrowings under its unsecured line of credit.
The following tables summarize capital expenditures and lease acquisition costs incurred at the Centers for the years ended December 31:
(Dollars in thousands) | 2016 | 2015 | 2014 | ||||||||
Consolidated Centers: | |||||||||||
Acquisitions of property and equipment (1) | $ | 56,759 | $ | 79,753 | $ | 97,919 | |||||
Development, redevelopment, expansion and renovation of Centers | 183,220 | 218,741 | 197,934 | ||||||||
Tenant allowances | 19,229 | 30,368 | 30,464 | ||||||||
Deferred leasing charges | 24,845 | 26,835 | 26,605 | ||||||||
$ | 284,053 | $ | 355,697 | $ | 352,922 | ||||||
Joint Venture Centers (at Company's pro rata share): | |||||||||||
Acquisitions of property and equipment | $ | 349,819 | $ | 160,001 | $ | 158,792 | |||||
Development, redevelopment, expansion and renovation of Centers | 101,124 | 132,924 | 201,843 | ||||||||
Tenant allowances | 11,271 | 6,285 | 4,847 | ||||||||
Deferred leasing charges | 7,070 | 3,348 | 2,965 | ||||||||
$ | 469,284 | $ | 302,558 | $ | 368,447 | ||||||
_______________________________________________________________________________
(1) | Acquisitions of property and equipment excludes the acquisition of the PPR Queens Portfolio in 2014, which was funded by the direct issuance of approximately $1.2 billion of common stock of the Company and the assumption of the third party's pro rata share of the mortgage notes payable on the properties of $672.1 million (See "Acquisitions and Dispositions" in Management's Overview and Summary). |
55
The Company expects amounts to be incurred during the next twelve months for tenant allowances and deferred leasing charges to be comparable or less than 2016 and that capital for those expenditures will be available from working capital, cash flow from operations, borrowings on property specific debt or unsecured corporate borrowings. The Company expects to incur between $200 million and $300 million during the next twelve months for development, redevelopment, expansion and renovations. Capital for these major expenditures, developments and/or redevelopments has been, and is expected to continue to be, obtained from a combination of debt or equity financings, which are expected to include borrowings under the Company's line of credit and construction loans.
The Company has also generated liquidity in the past through equity offerings and issuances, property refinancings, joint venture transactions and the sale of non-core assets. For example, the Company recently completed the Joint Venture Transactions to which the Company sold ownership interests in eight properties with total cash proceeds to the Company of approximately $2.3 billion (See "Acquisitions and Dispositions" in Management's Overview and Summary), which included new debt or refinancings of existing debt on these properties with excess financing proceeds of approximately $1.1 billion (See "Financing Activity" in Management's Overview and Summary). The Company used these proceeds to pay down its line of credit, fund the Special Dividend (See "Other Transactions and Events" in Management's Overview and Summary) and for other general corporate purposes, which included the repurchases of the Company's common stock under the 2015 Stock Buyback Program, which was completed in May 2016 (See "Other Transactions and Events" in Management's Overview and Summary). Furthermore, the Company has filed a shelf registration statement, which registered an unspecified amount of common stock, preferred stock, depositary shares, debt securities, warrants, rights, stock purchase contracts and units that may be sold from time to time by the Company. The Company expects any repurchases of the Company's common stock under the recently authorized 2017 Stock Buyback Program (See "Other Transactions and Events" in Management's Overview and Summary) to be funded by future sales of non-core assets, borrowings under its line of credit and/or refinancing transactions.
The capital and credit markets can fluctuate and, at times, limit access to debt and equity financing for companies. As demonstrated by the Company's recent activity as discussed below and its recently amended $1.5 billion line of credit, the Company has been able to access capital; however, there is no assurance the Company will be able to do so in future periods or on similar terms and conditions. Many factors impact the Company's ability to access capital, such as its overall debt level, interest rates, interest coverage ratios and prevailing market conditions. In the event that the Company has significant tenant defaults as a result of the overall economy and general market conditions, the Company could have a decrease in cash flow from operations, which could result in increased borrowings under its line of credit. These events could result in an increase in the Company's proportion of floating rate debt, which would cause it to be subject to interest rate fluctuations in the future.
The Company has an equity distribution agreement with a number of sales agents (the "ATM Program") to issue and sell, from time to time, shares of common stock, par value $0.01 per share, having an aggregate offering price of up to $500 million (the “ATM Shares”). Sales of the ATM Shares can be made in privately negotiated transactions and/or any other method permitted by law, including sales deemed to be an “at the market” offering, which includes sales made directly on the New York Stock Exchange or sales made to or through a market maker other than on an exchange. The Company did not sell any shares under the ATM Program during the year ended December 31, 2016.
As of December 31, 2016, $500 million of the ATM Shares were available to be sold under the ATM Program. Actual future sales of the ATM Shares will depend upon a variety of factors including but not limited to market conditions, the trading price of the Company's common stock and the Company's capital needs. The Company has no obligation to sell the ATM Shares under the ATM Program.
The Company's total outstanding loan indebtedness at December 31, 2016 was $7.6 billion (consisting of $5.0 billion of consolidated debt, less $0.2 billion of noncontrolling interests, plus $2.8 billion of its pro rata share of unconsolidated joint venture mortgage notes and $60.0 million of its pro rata share of the PPR Term Loan (See "Financing Activity" in Management's Overview and Summary). The majority of the Company's debt consists of fixed-rate conventional mortgage notes collateralized by individual properties. The Company expects that all of the maturities during the next twelve months will be refinanced, restructured, extended and/or paid off from the Company's line of credit or cash on hand.
The Company believes that the pro rata debt provides useful information to investors regarding its financial condition because it includes the Company’s share of debt from unconsolidated joint ventures and, for consolidated debt, excludes the Company’s partners’ share from consolidated joint ventures, in each case presented on the same basis. The Company has several significant joint ventures and presenting its pro rata share of debt in this manner can help investors better understand the Company’s financial condition after taking into account our economic interest in these joint ventures. The Company’s pro rata share of debt should not be considered as a substitute for the Company’s total consolidated debt determined in accordance with GAAP or any other GAAP financial measures and should only be considered together with and as a supplement to the Company’s financial information prepared in accordance with GAAP.
56
The Company has a $1.5 billion revolving line of credit facility that bore interest at LIBOR plus a spread of 1.38% to 2.0%, depending on the Company's overall leverage level, and was to mature on August 6, 2018. On July 6, 2016, the Company amended its line of credit. The amended $1.5 billion line of credit bears interest at LIBOR plus a spread of 1.30% to 1.90%, depending on the Company's overall leverage level, and matures on July 6, 2020 with a one-year extension option. The line of credit can be expanded, depending on certain conditions, up to a total facility of $2.0 billion. All obligations under the facility are unconditionally guaranteed only by the Company. Based on the Company's leverage level as of December 31, 2016, the borrowing rate on the facility was LIBOR plus 1.45%. At December 31, 2016, total borrowings under the line of credit were $885.0 million less unamortized deferred finance costs of $10.0 million with a total interest rate of 2.40%.
Cash dividends and distributions for the year ended December 31, 2016 were $779.3 million, which included $337.7 million of the Special Dividend (See "Other Transactions and Events" in Management's Overview and Summary). A total of $417.5 million was funded by operations. The remaining $361.8 million was funded from proceeds from the sale of assets, which were included in the cash flows from investing activities section of the Company's Consolidated Statement of Cash Flows.
At December 31, 2016, the Company was in compliance with all applicable loan covenants under its agreements.
At December 31, 2016, the Company had cash and cash equivalents of $94.0 million.
Off-Balance Sheet Arrangements:
The Company accounts for its investments in joint ventures that it does not have a controlling interest or is not the primary beneficiary using the equity method of accounting and those investments are reflected on the consolidated balance sheets of the Company as investments in unconsolidated joint ventures.
Additionally, as of December 31, 2016, the Company is contingently liable for $61.0 million in letters of credit guaranteeing performance by the Company of certain obligations relating to the Centers. The Company does not believe that these letters of credit will result in a liability to the Company.
Contractual Obligations:
The following is a schedule of contractual obligations as of December 31, 2016 for the consolidated Centers over the periods in which they are expected to be paid (in thousands):
Payment Due by Period | ||||||||||||||||||||
Contractual Obligations | Total | Less than 1 year | 1 - 3 years | 3 - 5 years | More than five years | |||||||||||||||
Long-term debt obligations (includes expected interest payments)(1) | $ | 5,707,918 | $ | 225,658 | $ | 1,325,079 | $ | 2,313,438 | $ | 1,843,743 | ||||||||||
Operating lease obligations(2) | 239,969 | 13,712 | 17,263 | 15,335 | 193,659 | |||||||||||||||
Purchase obligations(2) | 41,906 | 41,906 | — | — | — | |||||||||||||||
Other liabilities | 340,437 | 305,029 | 3,652 | 4,044 | 27,712 | |||||||||||||||
$ | 6,330,230 | $ | 586,305 | $ | 1,345,994 | $ | 2,332,817 | $ | 2,065,114 | |||||||||||
_______________________________________________________________________________
(1) | Interest payments on floating rate debt were based on rates in effect at December 31, 2016. |
(2) | See Note 16—Commitments and Contingencies in the Company's Notes to the Consolidated Financial Statements. |
57
Funds From Operations ("FFO")
The Company uses FFO in addition to net income to report its operating and financial results and considers FFO and FFO-diluted as supplemental measures for the real estate industry and a supplement to Generally Accepted Accounting Principles ("GAAP") measures. The National Association of Real Estate Investment Trusts ("NAREIT") defines FFO as net income (loss) (computed in accordance with GAAP), excluding gains (or losses) from extraordinary items and sales of depreciated operating properties, plus real estate related depreciation and amortization, impairment write-downs of real estate and write-downs of investments in an affiliate where the write-downs have been driven by a decrease in the value of real estate held by the affiliate and after adjustments for unconsolidated joint ventures. Adjustments for unconsolidated joint ventures are calculated to reflect FFO on the same basis. The Company also presents FFO excluding early extinguishment of debt, net and costs related to unsolicited takeover offer.
FFO and FFO on a diluted basis are useful to investors in comparing operating and financial results between periods. This is especially true since FFO excludes real estate depreciation and amortization, as the Company believes real estate values fluctuate based on market conditions rather than depreciating in value ratably on a straight-line basis over time. The Company believes that such a presentation also provides investors with a more meaningful measure of its operating results in comparison to the operating results of other REITs. The Company believes that FFO excluding early extinguishment of debt, net and costs related to unsolicited take over offer provides useful supplemental information regarding the Company's performance as it shows a more meaningful and consistent comparison of the Company's operating performance and allows investors to more easily compare the Company's results. The Company believes that FFO on a diluted basis is a measure investors find most useful in measuring the dilutive impact of outstanding convertible securities.
The Company believes that FFO does not represent cash flow from operations as defined by GAAP, should not be considered as an alternative to net income as defined by GAAP, and is not indicative of cash available to fund all cash flow needs. The Company also cautions that FFO, as presented, may not be comparable to similarly titled measures reported by other real estate investment trusts.
Management compensates for the limitations of FFO by providing investors with financial statements prepared according to GAAP, along with this detailed discussion of FFO and a reconciliation of FFO and FFO-diluted to net income available to common stockholders. Management believes that to further understand the Company's performance, FFO should be compared with the Company's reported net income as presented in the Company's consolidated financial statements.
58
The following reconciles net income attributable to the Company to FFO and FFO-diluted for the years ended December 31, 2016, 2015, 2014, 2013 and 2012 (dollars and shares in thousands):
2016 | 2015 | 2014 | 2013 | 2012 | |||||||||||||||
Net income attributable to the Company | $ | 516,995 | $ | 487,562 | $ | 1,499,042 | $ | 420,090 | $ | 337,426 | |||||||||
Adjustments to reconcile net income attributable to the Company to FFO attributable to common stockholders and unit holders—basic: | |||||||||||||||||||
Noncontrolling interests in the Operating Partnership | 37,780 | 32,615 | 105,584 | 29,637 | 27,359 | ||||||||||||||
(Gain) loss on sale or write down of consolidated assets, net | (415,348 | ) | (378,248 | ) | (73,440 | ) | (207,105 | ) | 40,381 | ||||||||||
Gain on remeasurement of consolidated assets | — | (22,089 | ) | (1,423,136 | ) | (51,205 | ) | (199,956 | ) | ||||||||||
Add: gain (loss) on undepreciated assets—consolidated assets | 3,717 | 1,326 | 1,396 | 2,546 | (390 | ) | |||||||||||||
Add: noncontrolling interests share of (loss) gain on sale of assets—consolidated assets | (1,662 | ) | 481 | 146 | (2,082 | ) | 1,899 | ||||||||||||
Loss (gain) on sale or write down of assets—unconsolidated joint ventures(1) | 189 | (4,392 | ) | 1,237 | (94,372 | ) | (2,019 | ) | |||||||||||
Add: (loss) gain on sale of undepreciated assets—unconsolidated joint ventures(1) | (2 | ) | 4,395 | 2,621 | 602 | 1,163 | |||||||||||||
Depreciation and amortization on consolidated assets | 348,488 | 464,472 | 378,716 | 374,425 | 307,193 | ||||||||||||||
Less: noncontrolling interests in depreciation and amortization—consolidated assets | (15,023 | ) | (14,962 | ) | (20,700 | ) | (19,928 | ) | (18,561 | ) | |||||||||
Depreciation and amortization—unconsolidated joint ventures(1) | 179,600 | 84,160 | 82,570 | 86,866 | 96,228 | ||||||||||||||
Less: depreciation on personal property | (12,430 | ) | (13,052 | ) | (11,282 | ) | (11,900 | ) | (12,861 | ) | |||||||||
FFO attributable to common stockholders and unit holders—basic and diluted | 642,304 | 642,268 | 542,754 | 527,574 | 577,862 | ||||||||||||||
(Gain) loss on early extinguishment of debt, net—consolidated assets | (1,709 | ) | (1,487 | ) | 9,551 | (2,684 | ) | — | |||||||||||
Gain on early extinguishment of debt, net—unconsolidated joint ventures(1) | — | — | — | (352 | ) | — | |||||||||||||
FFO attributable to common stockholders and unit holders excluding early extinguishment of debt, net—diluted | 640,595 | 640,781 | 552,305 | 524,538 | 577,862 | ||||||||||||||
Costs related to unsolicited takeover offer | — | 25,204 | — | — | — | ||||||||||||||
FFO attributable to common stockholders and unit holders excluding early extinguishment of debt, net and costs related to unsolicited takeover offer—diluted | $ | 640,595 | $ | 665,985 | $ | 552,305 | $ | 524,538 | $ | 577,862 | |||||||||
Weighted average number of FFO shares outstanding for: | |||||||||||||||||||
FFO attributable to common stockholders and unit holders—basic(2) | 157,320 | 168,478 | 153,224 | 149,444 | 144,937 | ||||||||||||||
Adjustments for the impact of dilutive securities in computing FFO—diluted: | |||||||||||||||||||
Share and unit-based compensation plans | 112 | 144 | 147 | 82 | — | ||||||||||||||
FFO attributable to common stockholders and unit holders—diluted(3) | 157,432 | 168,622 | 153,371 | 149,526 | 144,937 | ||||||||||||||
_______________________________________________________________________________
(1) | Unconsolidated assets are presented at the Company's pro rata share. |
(2) | Calculated based upon basic net income as adjusted to reach basic FFO. During the years ended December 31, 2016, 2015, 2014, 2013 and 2012, there were 10.7 million, 10.6 million, 10.1 million, 9.8 million and 10.9 million OP Units outstanding, respectively. |
(3) | The computation of FFO—diluted shares outstanding includes the effect of share and unit-based compensation plans and the convertible senior notes using the treasury stock method. It also assumes the conversion of MACWH, LP common and preferred units to the extent that they are dilutive to the FFO-diluted computation. |
59
ITEM 7A. QUANTITATIVE AND QUALITATIVE DISCLOSURES ABOUT MARKET RISK
The Company's primary market risk exposure is interest rate risk. The Company has managed and will continue to manage interest rate risk by (1) maintaining a ratio of fixed rate, long-term debt to total debt such that floating rate exposure is kept at an acceptable level, (2) reducing interest rate exposure on certain long-term floating rate debt through the use of interest rate caps and/or swaps with matching maturities where appropriate, (3) using treasury rate locks where appropriate to fix rates on anticipated debt transactions, and (4) taking advantage of favorable market conditions for long-term debt and/or equity.
The following table sets forth information as of December 31, 2016 concerning the Company's long term debt obligations, including principal cash flows by scheduled maturity, weighted average interest rates and estimated fair value (dollars in thousands):
Expected Maturity Date | |||||||||||||||||||||||||||||||
For the years ending December 31, | |||||||||||||||||||||||||||||||
2017 | 2018 | 2019 | 2020 | 2021 | Thereafter | Total | Fair Value | ||||||||||||||||||||||||
CONSOLIDATED CENTERS: | |||||||||||||||||||||||||||||||
Long term debt: | |||||||||||||||||||||||||||||||
Fixed rate | $ | 155,885 | $ | 480,999 | $ | 797,460 | $ | 329,371 | $ | 293,867 | $ | 1,776,708 | $ | 3,834,290 | $ | 3,867,921 | |||||||||||||||
Average interest rate | 2.63 | % | 3.65 | % | 3.64 | % | 5.19 | % | 3.65 | % | 3.77 | % | 3.80 | % | |||||||||||||||||
Floating rate | 63,458 | — | — | 200,000 | 885,000 | — | 1,148,458 | 1,130,605 | |||||||||||||||||||||||
Average interest rate | 3.50 | % | — | % | — | % | 2.43 | % | 2.40 | % | — | % | 2.47 | % | |||||||||||||||||
Total debt—Consolidated Centers | $ | 219,343 | $ | 480,999 | $ | 797,460 | $ | 529,371 | $ | 1,178,867 | $ | 1,776,708 | $ | 4,982,748 | $ | 4,998,526 | |||||||||||||||
UNCONSOLIDATED JOINT VENTURE CENTERS: | |||||||||||||||||||||||||||||||
Long term debt (at Company's pro rata share): | |||||||||||||||||||||||||||||||
Fixed rate | $ | 35,423 | $ | 26,149 | $ | 29,543 | $ | 37,038 | $ | 146,023 | $ | 2,381,843 | $ | 2,656,019 | $ | 2,648,514 | |||||||||||||||
Average interest rate | 4.43 | % | 3.63 | % | 3.64 | % | 3.65 | % | 3.04 | % | 3.85 | % | 3.80 | % | |||||||||||||||||
Floating rate | 1,299 | 73,755 | 114 | 38,497 | 15,000 | 41,250 | 169,915 | 165,583 | |||||||||||||||||||||||
Average interest rate | 2.69 | % | 2.75 | % | 2.63 | % | 2.77 | % | 1.82 | % | 1.82 | % | 2.44 | % | |||||||||||||||||
Total debt—Unconsolidated Joint Venture Centers | $ | 36,722 | $ | 99,904 | $ | 29,657 | $ | 75,535 | $ | 161,023 | $ | 2,423,093 | $ | 2,825,934 | $ | 2,814,097 | |||||||||||||||
The Consolidated Centers' total fixed rate debt at December 31, 2016 and 2015 was $3.8 billion and $4.3 billion, respectively. The average interest rate on such fixed rate debt at December 31, 2016 and 2015 was 3.80%. The Consolidated Centers' total floating rate debt at December 31, 2016 and 2015 was $1.1 billion and $1.0 billion, respectively. The average interest rate on such floating rate debt at December 31, 2016 and 2015 was 2.47% and 2.03%, respectively.
The Company's pro rata share of the Unconsolidated Joint Venture Centers' fixed rate debt at December 31, 2016 and 2015 was $2.7 billion and $1.8 billion, respectively. The average interest rate on such fixed rate debt at December 31, 2016 and 2015 was 3.80% and 4.13%, respectively. The Company's pro rata share of the Unconsolidated Joint Venture Centers' floating rate debt at December 31, 2016 and 2015 was $169.9 million and $170.5 million, respectively. The average interest rate on such floating rate debt at December 31, 2016 and 2015 was 2.44% and 2.06%, respectively.
The Company has used derivative financial instruments in the normal course of business to manage or hedge interest rate risk and records all derivatives on the balance sheet at fair value. Interest rate cap agreements offer protection against floating rates on the notional amount from exceeding the rates noted in the above schedule, and interest rate swap agreements effectively replace a floating rate on the notional amount with a fixed rate as noted above. As of December 31, 2016, the Company did not have any interest rate cap or swap agreements in place.
In addition, the Company has assessed the market risk for its floating rate debt and believes that a 1% increase in interest rates would decrease future earnings and cash flows by approximately $13.2 million per year based on $1.3 billion of floating rate debt outstanding at December 31, 2016.
The fair value of the Company's long-term debt is estimated based on a present value model utilizing interest rates that reflect the risks associated with long-term debt of similar risk and duration. In addition, the method of computing fair value for mortgage notes payable included a credit value adjustment based on the estimated value of the property that serves as collateral for the underlying debt (See Note 8—Mortgage Notes Payable and Note 9—Bank and Other Notes Payable in the Company's Notes to the Consolidated Financial Statements).
60
ITEM 8. FINANCIAL STATEMENTS AND SUPPLEMENTARY DATA
Refer to the Financial Statements and Financial Statement Schedules for the required information appearing in Item 15.
ITEM 9. CHANGES IN AND DISAGREEMENTS WITH ACCOUNTANTS ON ACCOUNTING AND FINANCIAL DISCLOSURE
None.
ITEM 9A. CONTROLS AND PROCEDURES
Conclusion Regarding Effectiveness of Disclosure Controls and Procedures
As required by Rule 13a-15(b) under the Securities and Exchange Act of 1934, as amended (the "Exchange Act"), management carried out an evaluation, under the supervision and with the participation of the Company's Chief Executive Officer and Chief Financial Officer, of the effectiveness of the Company's disclosure controls and procedures as of the end of the period covered by this Annual Report on Form 10-K. Based on their evaluation as of December 31, 2016, the Company's Chief Executive Officer and Chief Financial Officer have concluded that the Company's disclosure controls and procedures (as defined in Rule 13a-15(e) and 15d-15(e) under the Exchange Act) were effective to ensure that the information required to be disclosed by the Company in the reports that it files or submits under the Exchange Act is (a) recorded, processed, summarized, and reported within the time periods specified in the SEC's rules and forms and (b) accumulated and communicated to the Company's management, including its Chief Executive Officer and Chief Financial Officer, or persons performing similar functions, as appropriate to allow timely decisions regarding required disclosure.
Management's Report on Internal Control Over Financial Reporting
The Company's management is responsible for establishing and maintaining adequate internal control over financial reporting (as defined in Rule 13a-15(f) under the Exchange Act). The Company's management assessed the effectiveness of the Company's internal control over financial reporting as of December 31, 2016. In making this assessment, the Company's management used the criteria set forth by the Committee of Sponsoring Organizations of the Treadway Commission in Internal Control—Integrated Framework (2013). The Company's management concluded that, as of December 31, 2016, its internal control over financial reporting was effective based on this assessment.
KPMG LLP, the independent registered public accounting firm that audited the Company's 2016 consolidated financial statements included in this Annual Report on Form 10-K, has issued a report on the Company's internal control over financial reporting which follows below.
Changes in Internal Control over Financial Reporting
There were no changes in the Company's internal control over financial reporting during the quarter ended December 31, 2016 that have materially affected, or are reasonably likely to materially affect, the Company's internal control over financial reporting.
61
Report of Independent Registered Public Accounting Firm
The Board of Directors and Stockholders of
The Macerich Company:
We have audited The Macerich Company’s (the “Company”) internal control over financial reporting as of December 31, 2016, based on criteria established in Internal Control - Integrated Framework (2013) issued by the Committee of Sponsoring Organizations of the Treadway Commission (COSO). The Company’s management is responsible for maintaining effective internal control over financial reporting and for its assessment of the effectiveness of internal control over financial reporting, included in the accompanying Management’s Report on Internal Control over Financial Reporting. Our responsibility is to express an opinion on the Company’s internal control over financial reporting based on our audit.
We conducted our audit in accordance with the standards of the Public Company Accounting Oversight Board (United States). Those standards require that we plan and perform the audit to obtain reasonable assurance about whether effective internal control over financial reporting was maintained in all material respects. Our audit included obtaining an understanding of internal control over financial reporting, assessing the risk that a material weakness exists, and testing and evaluating the design and operating effectiveness of internal control based on the assessed risk. Our audit also included performing such other procedures as we considered necessary in the circumstances. We believe that our audit provides a reasonable basis for our opinion.
A company’s internal control over financial reporting is a process designed to provide reasonable assurance regarding the reliability of financial reporting and the preparation of financial statements for external purposes in accordance with generally accepted accounting principles. A company’s internal control over financial reporting includes those policies and procedures that (1) pertain to the maintenance of records that, in reasonable detail, accurately and fairly reflect the transactions and dispositions of the assets of the company; (2) provide reasonable assurance that transactions are recorded as necessary to permit preparation of financial statements in accordance with generally accepted accounting principles, and that receipts and expenditures of the company are being made only in accordance with authorizations of management and directors of the company; and (3) provide reasonable assurance regarding prevention or timely detection of unauthorized acquisition, use, or disposition of the company’s assets that could have a material effect on the financial statements.
Because of its inherent limitations, internal control over financial reporting may not prevent or detect misstatements. Also, projections of any evaluation of effectiveness to future periods are subject to the risk that controls may become inadequate because of changes in conditions, or that the degree of compliance with the policies or procedures may deteriorate.
In our opinion, The Macerich Company maintained, in all material respects, effective internal control over financial reporting as of December 31, 2016, based on criteria established in Internal Control - Integrated Framework (2013) issued by the Committee of Sponsoring Organizations of the Treadway Commission.
We also have audited, in accordance with the standards of the Public Company Accounting Oversight Board (United States), the consolidated balance sheets of the Company as of December 31, 2016 and 2015, and the related consolidated statements of operations, equity and cash flows for each of the years in the three‑year period ended December 31, 2016, and our report dated February 24, 2017 expressed an unqualified opinion on those consolidated financial statements. Our report refers to a change in method of reporting discontinued operations.
/s/ KPMG LLP
Los Angeles, California
February 24, 2017
62
ITEM 9B. OTHER INFORMATION
None.
PART III
ITEM 10. DIRECTORS AND EXECUTIVE OFFICERS AND CORPORATE GOVERNANCE
There is hereby incorporated by reference the information which appears under the captions "Information Regarding our Director Nominees," "Executive Officers," "Section 16(a) Beneficial Ownership Reporting Compliance" and "Audit Committee Matters" in the Company's definitive proxy statement for its 2017 Annual Meeting of Stockholders that is responsive to the information required by this Item.
The Company has adopted a Code of Business Conduct and Ethics that provides principles of conduct and ethics for its directors, officers and employees. This Code complies with the requirements of the Sarbanes-Oxley Act of 2002 and applicable rules of the Securities and Exchange Commission and the New York Stock Exchange. In addition, the Company has adopted a Code of Ethics for CEO and Senior Financial Officers which supplements the Code of Business Conduct and Ethics applicable to all employees and complies with the additional requirements of the Sarbanes-Oxley Act of 2002 and applicable rules of the Securities and Exchange Commission for those officers. To the extent required by applicable rules of the Securities and Exchange Commission and the New York Stock Exchange, the Company intends to promptly disclose future amendments to certain provisions of these Codes or waivers of such provisions granted to directors and executive officers, including the Company’s principal executive officer, principal financial officer, principal accounting officer or persons performing similar functions, on the Company’s website at www.macerich.com under "Investors—Corporate Governance-Code of Ethics." Each of these Codes of Conduct is available on the Company’s website at www.macerich.com under "Investors—Corporate Governance."
During 2016, there were no material changes to the procedures described in the Company's proxy statement relating to the 2016 Annual Meeting of Stockholders by which stockholders may recommend director nominees to the Company.
ITEM 11. EXECUTIVE COMPENSATION
There is hereby incorporated by reference the information which appears under the captions "Compensation of Non-Employee Directors," "Compensation Committee Report," "Compensation Discussion and Analysis," "Executive Compensation" and "Compensation Committee Interlocks and Insider Participation" in the Company's definitive proxy statement for its 2017 Annual Meeting of Stockholders that is responsive to the information required by this Item.
ITEM 12. SECURITY OWNERSHIP OF CERTAIN BENEFICIAL OWNERS AND MANAGEMENT AND RELATED STOCKHOLDER MATTERS
There is hereby incorporated by reference the information which appears under the captions "Principal Stockholders," "Information Regarding Our Director Nominees," "Executive Officers" and "Equity Compensation Plan Information" in the Company's definitive proxy statement for its 2017 Annual Meeting of Stockholders that is responsive to the information required by this Item.
ITEM 13. CERTAIN RELATIONSHIPS AND RELATED TRANSACTIONS, AND DIRECTOR INDEPENDENCE
There is hereby incorporated by reference the information which appears under the captions "Certain Transactions" and "The Board of Directors and its Committees" in the Company's definitive proxy statement for its 2017 Annual Meeting of Stockholders that is responsive to the information required by this Item.
ITEM 14. PRINCIPAL ACCOUNTANT FEES AND SERVICES
There is hereby incorporated by reference the information which appears under the captions "Principal Accountant Fees and Services" and "Audit Committee Pre-Approval Policy" in the Company's definitive proxy statement for its 2017 Annual Meeting of Stockholders that is responsive to the information required by this Item.
63
PART IV
ITEM 15. EXHIBITS AND FINANCIAL STATEMENT SCHEDULE
Page | ||||
(a) and (c) | 1 | Financial Statements | ||
2 | Financial Statement Schedule | |||
ITEM 16. FORM 10-K SUMMARY
Not applicable.
64
Report of Independent Registered Public Accounting Firm
The Board of Directors and Stockholders of
The Macerich Company:
We have audited the accompanying consolidated balance sheets of The Macerich Company and subsidiaries (the “Company”) as of December 31, 2016 and 2015, and the related consolidated statements of operations, equity and cash flows for each of the years in the three‑year period ended December 31, 2016. In connection with our audits of the consolidated financial statements, we have also audited the financial statement schedule III - Real Estate and Accumulated Depreciation. These consolidated financial statements and the financial statement schedule are the responsibility of the Company’s management. Our responsibility is to express an opinion on these consolidated financial statements and financial statement schedule based on our audits.
We conducted our audits in accordance with the standards of the Public Company Accounting Oversight Board (United States). Those standards require that we plan and perform the audit to obtain reasonable assurance about whether the financial statements are free of material misstatement. An audit includes examining, on a test basis, evidence supporting the amounts and disclosures in the financial statements. An audit also includes assessing the accounting principles used and significant estimates made by management, as well as evaluating the overall financial statement presentation. We believe that our audits provide a reasonable basis for our opinion.
In our opinion, the consolidated financial statements referred to above present fairly, in all material respects, the financial position of The Macerich Company and subsidiaries as of December 31, 2016 and 2015, and the results of their operations and their cash flows for each of the years in the three‑year period ended December 31, 2016, in conformity with U.S. generally accepted accounting principles. Also, in our opinion, the related financial statement schedule III - Real Estate and Accumulated Depreciation, when considered in relation to the basic consolidated financial statements taken as a whole, presents fairly, in all material respects, the information set forth therein.
We also have audited, in accordance with the standards of the Public Company Accounting Oversight Board (United States), the Company’s internal control over financial reporting as of December 31, 2016, based on criteria established in Internal Control ‑ Integrated Framework (2013) issued by the Committee of Sponsoring Organizations of the Treadway Commission (COSO), and our report dated February 24, 2017, expressed an unqualified opinion on the effectiveness of the Company’s internal control over financial reporting.
/s/ KPMG LLP
Los Angeles, California
February 24, 2017
65
THE MACERICH COMPANY
CONSOLIDATED BALANCE SHEETS
(Dollars in thousands, except par value)
December 31, | |||||||
2016 | 2015 | ||||||
ASSETS: | |||||||
Property, net | $ | 7,357,310 | $ | 8,796,912 | |||
Cash and cash equivalents | 94,046 | 86,510 | |||||
Restricted cash | 49,951 | 41,389 | |||||
Tenant and other receivables, net | 136,998 | 130,002 | |||||
Deferred charges and other assets, net | 478,058 | 564,291 | |||||
Due from affiliates | 68,227 | 83,928 | |||||
Investments in unconsolidated joint ventures | 1,773,558 | 1,532,552 | |||||
Total assets | $ | 9,958,148 | $ | 11,235,584 | |||
LIABILITIES AND EQUITY: | |||||||
Mortgage notes payable: | |||||||
Related parties | $ | 176,442 | $ | 181,069 | |||
Others | 3,908,976 | 4,427,518 | |||||
Total | 4,085,418 | 4,608,587 | |||||
Bank and other notes payable | 880,482 | 652,163 | |||||
Accounts payable and accrued expenses | 61,316 | 74,398 | |||||
Accrued dividend | — | 337,703 | |||||
Other accrued liabilities | 366,165 | 403,281 | |||||
Distributions in excess of investments in unconsolidated joint ventures | 78,626 | 24,457 | |||||
Co-venture obligation | 58,973 | 63,756 | |||||
Total liabilities | 5,530,980 | 6,164,345 | |||||
Commitments and contingencies | |||||||
Equity: | |||||||
Stockholders' equity: | |||||||
Common stock, $0.01 par value, 250,000,000 shares authorized, 143,985,036 and 154,404,986 shares issued and outstanding at December 31, 2016 and 2015, respectively | 1,440 | 1,544 | |||||
Additional paid-in capital | 4,593,229 | 4,926,630 | |||||
Accumulated deficit | (488,782 | ) | (212,760 | ) | |||
Total stockholders' equity | 4,105,887 | 4,715,414 | |||||
Noncontrolling interests | 321,281 | 355,825 | |||||
Total equity | 4,427,168 | 5,071,239 | |||||
Total liabilities and equity | $ | 9,958,148 | $ | 11,235,584 | |||
The accompanying notes are an integral part of these consolidated financial statements.
66
THE MACERICH COMPANY
CONSOLIDATED STATEMENTS OF OPERATIONS
(Dollars in thousands, except per share amounts)
For The Years Ended December 31, | |||||||||||
2016 | 2015 | 2014 | |||||||||
Revenues: | |||||||||||
Minimum rents | $ | 616,295 | $ | 759,603 | $ | 633,571 | |||||
Percentage rents | 20,902 | 25,693 | 24,350 | ||||||||
Tenant recoveries | 305,282 | 415,129 | 361,119 | ||||||||
Other | 59,328 | 61,470 | 52,226 | ||||||||
Management Companies | 39,464 | 26,254 | 33,981 | ||||||||
Total revenues | 1,041,271 | 1,288,149 | 1,105,247 | ||||||||
Expenses: | |||||||||||
Shopping center and operating expenses | 307,623 | 379,815 | 353,505 | ||||||||
Management Companies' operating expenses | 98,323 | 92,340 | 88,424 | ||||||||
REIT general and administrative expenses | 28,217 | 29,870 | 29,412 | ||||||||
Costs related to unsolicited takeover offer | — | 25,204 | — | ||||||||
Depreciation and amortization | 348,488 | 464,472 | 378,716 | ||||||||
782,651 | 991,701 | 850,057 | |||||||||
Interest expense: | |||||||||||
Related parties | 8,973 | 10,515 | 15,134 | ||||||||
Other | 154,702 | 201,428 | 175,555 | ||||||||
163,675 | 211,943 | 190,689 | |||||||||
(Gain) loss on extinguishment of debt, net | (1,709 | ) | (1,487 | ) | 9,551 | ||||||
Total expenses | 944,617 | 1,202,157 | 1,050,297 | ||||||||
Equity in income of unconsolidated joint ventures | 56,941 | 45,164 | 60,626 | ||||||||
Co-venture expense | (13,382 | ) | (11,804 | ) | (9,490 | ) | |||||
Income tax (expense) benefit | (722 | ) | 3,223 | 4,269 | |||||||
Gain on sale or write down of assets, net | 415,348 | 378,248 | 73,440 | ||||||||
Gain on remeasurement of assets | — | 22,089 | 1,423,136 | ||||||||
Net income | 554,839 | 522,912 | 1,606,931 | ||||||||
Less net income attributable to noncontrolling interests | 37,844 | 35,350 | 107,889 | ||||||||
Net income attributable to the Company | $ | 516,995 | $ | 487,562 | $ | 1,499,042 | |||||
Earnings per common share attributable to common stockholders: | |||||||||||
Basic | $ | 3.52 | $ | 3.08 | $ | 10.46 | |||||
Diluted | $ | 3.52 | $ | 3.08 | $ | 10.45 | |||||
Weighted average number of common shares outstanding: | |||||||||||
Basic | 146,599,000 | 157,916,000 | 143,144,000 | ||||||||
Diluted | 146,711,000 | 158,060,000 | 143,291,000 | ||||||||
The accompanying notes are an integral part of these consolidated financial statements.
67
THE MACERICH COMPANY
CONSOLIDATED STATEMENTS OF EQUITY
(Dollars in thousands, except per share data)
Stockholders' Equity | ||||||||||||||||||||||||||
Common Stock | Additional Paid-in Capital | Retained Earnings (Accumulated Deficit) | Total Stockholders' Equity | |||||||||||||||||||||||
Shares | Par Value | Noncontrolling Interests | Total Equity | |||||||||||||||||||||||
Balance at January 1, 2014 | 140,733,683 | $ | 1,407 | $ | 3,906,148 | $ | (548,806 | ) | $ | 3,358,749 | $ | 359,968 | $ | 3,718,717 | ||||||||||||
Net income | — | — | — | 1,499,042 | 1,499,042 | 107,889 | 1,606,931 | |||||||||||||||||||
Amortization of share and unit-based plans | 168,379 | 2 | 34,871 | — | 34,873 | — | 34,873 | |||||||||||||||||||
Employee stock purchases | 25,007 | — | 1,231 | — | 1,231 | — | 1,231 | |||||||||||||||||||
Stock issued to acquire properties | 17,140,845 | 172 | 1,161,102 | — | 1,161,274 | — | 1,161,274 | |||||||||||||||||||
Distributions paid ($2.51) per share | — | — | — | (353,495 | ) | (353,495 | ) | — | (353,495 | ) | ||||||||||||||||
Distributions to noncontrolling interests | — | — | — | — | — | (32,230 | ) | (32,230 | ) | |||||||||||||||||
Change in noncontrolling interests due to acquisition/disposition of consolidated entities | — | — | (3,858 | ) | — | (3,858 | ) | (93,358 | ) | (97,216 | ) | |||||||||||||||
Conversion of noncontrolling interests to common shares | 134,082 | 1 | 2,409 | — | 2,410 | (2,410 | ) | — | ||||||||||||||||||
Redemption of noncontrolling interests | — | — | (157 | ) | — | (157 | ) | (79 | ) | (236 | ) | |||||||||||||||
Adjustment of noncontrolling interests in Operating Partnership | — | — | (59,949 | ) | — | (59,949 | ) | 59,949 | — | |||||||||||||||||
Balance at December 31, 2014 | 158,201,996 | $ | 1,582 | $ | 5,041,797 | $ | 596,741 | $ | 5,640,120 | $ | 399,729 | $ | 6,039,849 | |||||||||||||
The accompanying notes are an integral part of these consolidated financial statements.
68
THE MACERICH COMPANY
CONSOLIDATED STATEMENTS OF EQUITY (Continued)
(Dollars in thousands, except per share data)
Stockholders' Equity | ||||||||||||||||||||||||||
Common Stock | Additional Paid-in Capital | Retained Earnings (Accumulated Deficit) | Total Stockholders' Equity | |||||||||||||||||||||||
Shares | Par Value | Noncontrolling Interests | Total Equity | |||||||||||||||||||||||
Balance at December 31, 2014 | 158,201,996 | $ | 1,582 | $ | 5,041,797 | $ | 596,741 | $ | 5,640,120 | $ | 399,729 | $ | 6,039,849 | |||||||||||||
Net income | — | — | — | 487,562 | 487,562 | 35,350 | 522,912 | |||||||||||||||||||
Amortization of share and unit-based plans | 241,186 | 2 | 34,373 | — | 34,375 | — | 34,375 | |||||||||||||||||||
Employee stock purchases | 23,036 | — | 1,512 | — | 1,512 | — | 1,512 | |||||||||||||||||||
Stock repurchase | (4,140,788 | ) | (41 | ) | (153,602 | ) | (246,501 | ) | (400,144 | ) | — | (400,144 | ) | |||||||||||||
Distributions declared ($6.63) per share | — | — | — | (1,050,562 | ) | (1,050,562 | ) | — | (1,050,562 | ) | ||||||||||||||||
Distributions to noncontrolling interests | — | — | — | — | — | (74,677 | ) | (74,677 | ) | |||||||||||||||||
Contributions from noncontrolling interests | — | — | — | — | — | 23 | 23 | |||||||||||||||||||
Other | — | — | (1,593 | ) | — | (1,593 | ) | — | (1,593 | ) | ||||||||||||||||
Conversion of noncontrolling interests to common shares | 79,556 | 1 | 1,558 | — | 1,559 | (1,559 | ) | — | ||||||||||||||||||
Redemption of noncontrolling interests | — | — | (343 | ) | — | (343 | ) | (113 | ) | (456 | ) | |||||||||||||||
Adjustment of noncontrolling interests in Operating Partnership | — | — | 2,928 | — | 2,928 | (2,928 | ) | — | ||||||||||||||||||
Balance at December 31, 2015 | 154,404,986 | $ | 1,544 | $ | 4,926,630 | $ | (212,760 | ) | $ | 4,715,414 | $ | 355,825 | $ | 5,071,239 | ||||||||||||
The accompanying notes are an integral part of these consolidated financial statements.
69
THE MACERICH COMPANY
CONSOLIDATED STATEMENTS OF EQUITY (Continued)
(Dollars in thousands, except per share data)
Stockholders' Equity | |||||||||||||||||||||||||||
Common Stock | Additional Paid-in Capital | Accumulated Deficit | Total Stockholders' Equity | ||||||||||||||||||||||||
Shares | Par Value | Noncontrolling Interests | Total Equity | ||||||||||||||||||||||||
Balance at December 31, 2015 | 154,404,986 | $ | 1,544 | $ | 4,926,630 | $ | (212,760 | ) | $ | 4,715,414 | $ | 355,825 | $ | 5,071,239 | |||||||||||||
Net income | — | — | — | 516,995 | 516,995 | 37,844 | 554,839 | ||||||||||||||||||||
Amortization of share and unit-based plans | 139,671 | 2 | 40,527 | — | 40,529 | — | 40,529 | ||||||||||||||||||||
Employee stock purchases | 28,147 | — | 1,697 | — | 1,697 | — | 1,697 | ||||||||||||||||||||
Stock repurchases | (11,123,011 | ) | (111 | ) | (412,391 | ) | (387,516 | ) | (800,018 | ) | — | (800,018 | ) | ||||||||||||||
Distributions declared ($2.75) per share | — | — | — | (405,501 | ) | (405,501 | ) | — | (405,501 | ) | |||||||||||||||||
Distributions to noncontrolling interests | — | — | — | — | — | (35,677 | ) | (35,677 | ) | ||||||||||||||||||
Contributions from noncontrolling interests | — | — | — | — | — | 90 | 90 | ||||||||||||||||||||
Conversion of noncontrolling interests to common shares | 535,243 | 5 | 12,443 | — | 12,448 | (12,448 | ) | — | |||||||||||||||||||
Redemption of noncontrolling interests | — | — | (23 | ) | — | (23 | ) | (7 | ) | (30 | ) | ||||||||||||||||
Adjustment of noncontrolling interests in Operating Partnership | — | — | 24,346 | — | 24,346 | (24,346 | ) | — | |||||||||||||||||||
Balance at December 31, 2016 | 143,985,036 | $ | 1,440 | $ | 4,593,229 | $ | (488,782 | ) | $ | 4,105,887 | $ | 321,281 | $ | 4,427,168 | |||||||||||||
The accompanying notes are an integral part of these consolidated financial statements.
70
THE MACERICH COMPANY
CONSOLIDATED STATEMENTS OF CASH FLOWS
(Dollars in thousands)
For the Years Ended December 31, | |||||||||||
2016 | 2015 | 2014 | |||||||||
Cash flows from operating activities: | |||||||||||
Net income | $ | 554,839 | $ | 522,912 | $ | 1,606,931 | |||||
Adjustments to reconcile net income to net cash provided by operating activities: | |||||||||||
(Gain) loss on early extinguishment of debt, net | (13,737 | ) | (16,066 | ) | 526 | ||||||
Gain on sale or write down of assets, net | (415,348 | ) | (378,248 | ) | (73,440 | ) | |||||
Gain on remeasurement of assets | — | (22,089 | ) | (1,423,136 | ) | ||||||
Depreciation and amortization | 355,358 | 471,320 | 387,785 | ||||||||
Amortization of net premium on mortgage notes payable | (4,048 | ) | (20,232 | ) | (8,906 | ) | |||||
Amortization of share and unit-based plans | 33,288 | 28,367 | 29,463 | ||||||||
Straight-line rent adjustment | (5,237 | ) | (7,192 | ) | (5,825 | ) | |||||
Amortization of above and below-market leases | (12,815 | ) | (16,510 | ) | (9,083 | ) | |||||
Provision for doubtful accounts | 3,586 | 4,698 | 3,962 | ||||||||
Income tax expense (benefit) | 722 | (3,223 | ) | (4,269 | ) | ||||||
Equity in income of unconsolidated joint ventures | (56,941 | ) | (45,164 | ) | (60,626 | ) | |||||
Co-venture expense | 13,382 | 11,804 | 9,490 | ||||||||
Distributions of income from unconsolidated joint ventures | 7,248 | 4,541 | 2,412 | ||||||||
Changes in assets and liabilities, net of acquisitions and dispositions: | |||||||||||
Tenant and other receivables | (7,585 | ) | 1,908 | (12,356 | ) | ||||||
Other assets | (20,033 | ) | 13,892 | (15,594 | ) | ||||||
Due from affiliates | 15,983 | (7,025 | ) | (1,770 | ) | ||||||
Accounts payable and accrued expenses | (8,929 | ) | (4,014 | ) | (123 | ) | |||||
Other accrued liabilities | (22,227 | ) | 698 | (24,735 | ) | ||||||
Net cash provided by operating activities | 417,506 | 540,377 | 400,706 | ||||||||
Cash flows from investing activities: | |||||||||||
Acquisition of properties | — | (26,250 | ) | (15,233 | ) | ||||||
Development, redevelopment, expansion and renovation of properties | (211,616 | ) | (272,334 | ) | (185,412 | ) | |||||
Property improvements | (47,863 | ) | (53,335 | ) | (66,718 | ) | |||||
Cash acquired from acquisitions | — | — | 28,890 | ||||||||
Proceeds from note receivable | 3,677 | 1,833 | 4,825 | ||||||||
Issuance of notes receivable | — | — | (65,130 | ) | |||||||
Deposit on acquisition of property | — | (12,500 | ) | — | |||||||
Deferred leasing costs | (28,074 | ) | (33,902 | ) | (28,019 | ) | |||||
Distributions from unconsolidated joint ventures | 444,095 | 105,640 | 78,222 | ||||||||
Contributions to unconsolidated joint ventures | (430,428 | ) | (426,186 | ) | (336,621 | ) | |||||
Collections of loans to unconsolidated joint ventures, net | — | — | 2,756 | ||||||||
Proceeds from sale of assets | 724,275 | 646,898 | 320,123 | ||||||||
Restricted cash | (10,953 | ) | (30,888 | ) | 6,526 | ||||||
Net cash provided by (used in) investing activities | 443,113 | (101,024 | ) | (255,791 | ) | ||||||
The accompanying notes are an integral part of these consolidated financial statements.
71
THE MACERICH COMPANY
CONSOLIDATED STATEMENTS OF CASH FLOWS (Continued)
(Dollars in thousands)
For the Years Ended December 31, | |||||||||||
2016 | 2015 | 2014 | |||||||||
Cash flows from financing activities: | |||||||||||
Proceeds from mortgages, bank and other notes payable | 3,201,138 | 4,080,671 | 1,204,946 | ||||||||
Payments on mortgages, bank and other notes payable | (2,437,891 | ) | (3,284,213 | ) | (853,080 | ) | |||||
Deferred financing costs | (10,584 | ) | (11,805 | ) | (1,267 | ) | |||||
Payment of finance deposits, net of refunds received | — | (11,138 | ) | — | |||||||
Proceeds from share and unit-based plans | 1,697 | 1,512 | 1,231 | ||||||||
Payment of stock issuance costs | — | — | (5,503 | ) | |||||||
Stock repurchases | (800,018 | ) | (400,144 | ) | — | ||||||
Redemption of noncontrolling interests | (30 | ) | (456 | ) | (236 | ) | |||||
Contributions from noncontrolling interests | 90 | 23 | — | ||||||||
Purchase of noncontrolling interest | — | (1,593 | ) | (55,867 | ) | ||||||
Settlement of contingent consideration | (10,012 | ) | — | (18,667 | ) | ||||||
Dividends and distributions | (779,308 | ) | (787,109 | ) | (385,725 | ) | |||||
Distributions to co-venture partner | (18,165 | ) | (23,498 | ) | (15,555 | ) | |||||
Net cash used in financing activities | (853,083 | ) | (437,750 | ) | (129,723 | ) | |||||
Net increase in cash and cash equivalents | 7,536 | 1,603 | 15,192 | ||||||||
Cash and cash equivalents, beginning of year | 86,510 | 84,907 | 69,715 | ||||||||
Cash and cash equivalents, end of year | $ | 94,046 | $ | 86,510 | $ | 84,907 | |||||
Supplemental cash flow information: | |||||||||||
Cash payments for interest, net of amounts capitalized | $ | 153,838 | $ | 231,106 | $ | 186,877 | |||||
Non-cash investing and financing activities: | |||||||||||
Accrued development costs included in accounts payable and accrued expenses and other accrued liabilities | $ | 49,484 | $ | 52,983 | $ | 83,108 | |||||
Acquisition of property by issuance of common stock | $ | — | $ | — | $ | 1,166,777 | |||||
Conversion of Operating Partnership Units to common stock | $ | 12,448 | $ | 1,559 | $ | 2,410 | |||||
Accrued dividend | $ | — | $ | 337,703 | $ | — | |||||
Acquisition of properties by assumption of mortgage note payable and other accrued liabilities | $ | — | $ | — | $ | 1,414,659 | |||||
Mortgage notes payable settled in deed-in-lieu of foreclosure | $ | 37,000 | $ | 34,149 | $ | — | |||||
Mortgage notes payable assumed by buyers in sales of properties | $ | — | $ | — | $ | 31,725 | |||||
Mortgage notes payable assumed by buyer in exchange for investment in unconsolidated joint venture | $ | 997,695 | $ | 1,782,455 | $ | — | |||||
Note receivable issued in connection with sale of property | $ | — | $ | — | $ | 9,603 | |||||
Acquisition of property in exchange for settlement of notes receivable | $ | — | $ | — | $ | 14,120 | |||||
Acquisition of property in exchange for investment in unconsolidated joint venture | $ | — | $ | 76,250 | $ | 15,767 | |||||
Contingent consideration in acquisition of property | $ | — | $ | — | $ | 10,012 | |||||
Assumption of mortgage notes payable and other liabilities from unconsolidated joint ventures | $ | — | $ | 50,000 | $ | — | |||||
The accompanying notes are an integral part of these consolidated financial statements.
72
THE MACERICH COMPANY
NOTES TO CONSOLIDATED FINANCIAL STATEMENTS
(Dollars in thousands, except per share amounts)
1. Organization:
The Macerich Company (the "Company") is involved in the acquisition, ownership, development, redevelopment, management and leasing of regional and community/power shopping centers (the "Centers") located throughout the United States.
The Company commenced operations effective with the completion of its initial public offering on March 16, 1994. As of December 31, 2016, the Company was the sole general partner of and held a 93% ownership interest in The Macerich Partnership, L.P. (the "Operating Partnership"). The Company was organized to qualify as a real estate investment trust ("REIT") under the Internal Revenue Code of 1986, as amended (the "Code").
The property management, leasing and redevelopment of the Company's portfolio is provided by the Company's management companies, Macerich Property Management Company, LLC, a single member Delaware limited liability company, Macerich Management Company, a California corporation, Macerich Arizona Partners LLC, a single member Arizona limited liability company, Macerich Arizona Management LLC, a single member Delaware limited liability company, Macerich Partners of Colorado, LLC, a single member Colorado limited liability company, MACW Mall Management, Inc., a New York corporation, and MACW Property Management, LLC, a single member New York limited liability company. All seven of the management companies are owned by the Company and are collectively referred to herein as the "Management Companies."
2. Summary of Significant Accounting Policies:
Basis of Presentation:
These consolidated financial statements have been prepared in accordance with generally accepted accounting principles ("GAAP") in the United States of America. The accompanying consolidated financial statements include the accounts of the Company and the Operating Partnership. Investments in entities in which the Company has a controlling financial interest or entities that meet the definition of a variable interest entity in which the Company has, as a result of ownership, contractual or other financial interests, both the power to direct activities that most significantly impact the economic performance of the variable interest entity and the obligation to absorb losses or the right to receive benefits that could potentially be significant to the variable interest entity are consolidated; otherwise they are accounted for under the equity method of accounting and are reflected as investments in unconsolidated joint ventures. All intercompany accounts and transactions have been eliminated in the consolidated financial statements.
On January 1, 2016, the Company adopted Accounting Standards Update (“ASU”) 2015-02, “Consolidation (Topic 810): Amendments to the Consolidation Analysis,” which made certain changes to both the variable interest model and the voting model, including changes to (1) the identification of variable interests (fees paid to a decision maker or service provider), (2) the variable interest entity ("VIE") characteristics for a limited partnership or similar entity and (3) the primary beneficiary determination. The Company evaluated the new standard and determined that no change was required to its accounting for variable interest entities. However, under the guidance of the new standard, all of the Company's consolidated joint ventures, including the Operating Partnership, now meet the definition and criteria as VIEs and the Company is the primary beneficiary of each VIE.
The Company's sole significant asset is its investment in the Operating Partnership and as a result, substantially all of the Company's assets and liabilities represent the assets and liabilities of the Operating Partnership. In addition, the Operating Partnership has investments in a number of VIEs.
73
THE MACERICH COMPANY
NOTES TO CONSOLIDATED FINANCIAL STATEMENTS (Continued)
(Dollars in thousands, except per share amounts)
2. Summary of Significant Accounting Policies: (Continued)
The Operating Partnership's VIEs included the following assets and liabilities:
December 31, | |||||||
2016 | 2015 | ||||||
Assets: | |||||||
Properties, net | $ | 307,582 | $ | 362,129 | |||
Other assets | 68,863 | 74,075 | |||||
Total assets | $ | 376,445 | $ | 436,204 | |||
Liabilities: | |||||||
Mortgage notes payable | $ | 133,245 | $ | 139,767 | |||
Other liabilities | 75,913 | 79,984 | |||||
Total liabilities | $ | 209,158 | $ | 219,751 | |||
Cash and Cash Equivalents and Restricted Cash:
The Company considers all highly liquid investments with an original maturity of three months or less when purchased to be cash equivalents, for which cost approximates fair value. Restricted cash includes impounds of property taxes and other capital reserves required under loan agreements.
Revenues:
Minimum rental revenues are recognized on a straight-line basis over the terms of the related leases. The difference between the amount of rent due in a year and the amount recorded as rental income is referred to as the "straight-line rent adjustment." Minimum rents were increased by $5,237, $7,192 and $5,825 due to the straight-line rent adjustment during the years ended December 31, 2016, 2015 and 2014, respectively. Percentage rents are recognized and accrued when tenants' specified sales targets have been met.
Estimated recoveries from certain tenants for their pro rata share of real estate taxes, insurance and other shopping center operating expenses are recognized as revenues in the period the applicable expenses are incurred. Other tenants pay a fixed rate and these tenant recoveries are recognized as revenues on a straight-line basis over the term of the related leases.
The Management Companies provide property management, leasing, corporate, development, redevelopment and acquisition services to affiliated and non-affiliated shopping centers. In consideration for these services, the Management Companies receive monthly management fees generally ranging from 1.5% to 5% of the gross monthly rental revenue of the properties managed.
Property:
Maintenance and repair expenses are charged to operations as incurred. Costs for major replacements and betterments, which includes HVAC equipment, roofs, parking lots, etc., are capitalized and depreciated over their estimated useful lives. Gains and losses are recognized upon disposal or retirement of the related assets and are reflected in earnings.
Property is recorded at cost and is depreciated using a straight-line method over the estimated useful lives of the assets as follows:
Buildings and improvements | 5 - 40 years |
Tenant improvements | 5 - 7 years |
Equipment and furnishings | 5 - 7 years |
74
THE MACERICH COMPANY
NOTES TO CONSOLIDATED FINANCIAL STATEMENTS (Continued)
(Dollars in thousands, except per share amounts)
2. Summary of Significant Accounting Policies: (Continued)
Capitalization of Costs:
The Company capitalizes costs incurred in redevelopment, development, renovation and improvement of properties. The capitalized costs include pre-construction costs essential to the development of the property, development costs, construction costs, interest costs, real estate taxes, salaries and related costs and other costs incurred during the period of development. These capitalized costs include direct and certain indirect costs clearly associated with the project. Indirect costs include real estate taxes, insurance and certain shared administrative costs. In assessing the amounts of direct and indirect costs to be capitalized, allocations are made to projects based on estimates of the actual amount of time spent on each activity. Indirect costs not clearly associated with specific projects are expensed as period costs. Capitalized indirect costs are allocated to development and redevelopment activities based on the square footage of the portion of the building not held available for immediate occupancy. If costs and activities incurred to ready the vacant space cease, then cost capitalization is also discontinued until such activities are resumed. Once work has been completed on a vacant space, project costs are no longer capitalized. For projects with extended lease-up periods, the Company ends the capitalization when significant activities have ceased, which does not exceed the shorter of a one-year period after the completion of the building shell or when the construction is substantially complete.
Investment in Unconsolidated Joint Ventures:
The Company accounts for its investments in joint ventures using the equity method of accounting unless the Company has a controlling financial interest in the joint venture or the joint venture meets the definition of a variable interest entity in which the Company is the primary beneficiary through both its power to direct activities that most significantly impact the economic performance of the variable interest entity and the obligation to absorb losses or the right to receive benefits that could potentially be significant to the variable interest entity. Although the Company has a greater than 50% interest in Candlestick Center LLC, Corte Madera Village, LLC, Macerich HHF Centers LLC, New River Associates LLC and Pacific Premier Retail LLC, the Company does not have controlling financial interests in these joint ventures due to the substantive participation rights of the outside partners in these joint ventures and, therefore, accounts for its investments in these joint ventures using the equity method of accounting.
Equity method investments are initially recorded on the balance sheet at cost and are subsequently adjusted to reflect the Company’s proportionate share of net earnings and losses, distributions received, additional contributions and certain other adjustments, as appropriate. The Company separately reports investments in joint ventures when accumulated distributions have exceeded the Company’s investment, as distributions in excess of investments in unconsolidated joint ventures. The net investment of certain joint ventures is less than zero because of financing or operating distributions that are usually greater than net income, as net income includes charges for depreciation and amortization.
Acquisitions:
The Company allocates the estimated fair value of acquisitions to land, building, tenant improvements and identified intangible assets and liabilities, based on their estimated fair values. In addition, any assumed mortgage notes payable are recorded at their estimated fair values. The estimated fair value of the land and buildings is determined utilizing an “as if vacant” methodology. Tenant improvements represent the tangible assets associated with the existing leases valued on a fair value basis at the acquisition date prorated over the remaining lease terms. The tenant improvements are classified as an asset under property and are depreciated over the remaining lease terms. Identifiable intangible assets and liabilities relate to the value of in-place operating leases which come in three forms: (i) leasing commissions and legal costs, which represent the value associated with “cost avoidance” of acquiring in-place leases, such as lease commissions paid under terms generally experienced in the Company's markets; (ii) value of in-place leases, which represents the estimated loss of revenue and of costs incurred for the period required to lease the “assumed vacant” property to the occupancy level when purchased; and (iii) above or below-market value of in-place leases, which represents the difference between the contractual rents and market rents at the time of the acquisition, discounted for tenant credit risks. Leasing commissions and legal costs are recorded in deferred charges and other assets and are amortized over the remaining lease terms. The value of in-place leases are recorded in deferred charges and other assets and amortized over the remaining lease terms plus any below-market fixed rate renewal options. Above or below-market leases are classified in deferred charges and other assets or in other accrued liabilities, depending on whether the contractual terms are above or below-market, and the asset or liability is amortized to minimum rents over the remaining terms of the leases. The remaining lease terms of below-market leases may include certain below-market fixed-rate renewal periods. In considering whether or not a lessee will execute a below-market fixed-rate lease renewal option, the Company evaluates
75
THE MACERICH COMPANY
NOTES TO CONSOLIDATED FINANCIAL STATEMENTS (Continued)
(Dollars in thousands, except per share amounts)
2. Summary of Significant Accounting Policies: (Continued)
economic factors and certain qualitative factors at the time of acquisition such as tenant mix in the Center, the Company's relationship with the tenant and the availability of competing tenant space. The initial allocation of purchase price is based on management's preliminary assessment, which may change when final information becomes available. Subsequent adjustments made to the initial purchase price allocation are made within the allocation period, which does not exceed one year. The purchase price allocation is described as preliminary if it is not yet final. The use of different assumptions in the allocation of the purchase price of the acquired assets and liabilities assumed could affect the timing of recognition of the related revenues and expenses.
The Company immediately expenses costs associated with business combinations as period costs.
Remeasurement gains are recognized when the Company obtains control of an existing equity method investment to the extent that the fair value of the existing equity investment exceeds the carrying value of the investment.
Deferred Charges:
Costs relating to obtaining tenant leases are deferred and amortized over the initial term of the lease agreement using the straight-line method. As these deferred leasing costs represent productive assets incurred in connection with the Company's leasing arrangements at the Centers, the related cash flows are classified as investing activities within the accompanying Consolidated Statements of Cash Flows. Costs relating to financing of shopping center properties are deferred and amortized over the life of the related loan using the straight-line method, which approximates the effective interest method.
The range of the terms of the agreements is as follows:
Deferred lease costs | 1 - 15 years |
Deferred financing costs | 1 - 15 years |
Accounting for Impairment:
The Company assesses whether an indicator of impairment in the value of its properties exists by considering expected future operating income, trends and prospects, as well as the effects of demand, competition and other economic factors. Such factors include projected rental revenue, operating costs and capital expenditures as well as estimated holding periods and capitalization rates. If an impairment indicator exists, the determination of recoverability is made based upon the estimated undiscounted future net cash flows, excluding interest expense. The amount of impairment loss, if any, is determined by comparing the fair value, as determined by a discounted cash flows analysis, with the carrying value of the related assets. The Company generally holds and operates its properties long-term, which decreases the likelihood of their carrying values not being recoverable. Properties classified as held for sale are measured at the lower of the carrying amount or fair value less cost to sell.
The Company reviews its investments in unconsolidated joint ventures for a series of operating losses and other factors that may indicate that a decrease in the value of its investments has occurred which is other-than-temporary. The investment in each unconsolidated joint venture is evaluated periodically, and as deemed necessary, for recoverability and valuation declines that are other-than-temporary.
Share and Unit-based Compensation Plans:
The cost of share and unit-based compensation awards is measured at the grant date based on the calculated fair value of the awards and is recognized on a straight-line basis over the requisite service period, which is generally the vesting period of the awards. For market-indexed LTIP awards, compensation cost is recognized under the graded attribution method.
76
THE MACERICH COMPANY
NOTES TO CONSOLIDATED FINANCIAL STATEMENTS (Continued)
(Dollars in thousands, except per share amounts)
2. Summary of Significant Accounting Policies: (Continued)
Income Taxes:
The Company elected to be taxed as a REIT under the Code commencing with its taxable year ended December 31, 1994. To qualify as a REIT, the Company must meet a number of organizational and operational requirements, including a requirement that it distribute at least 90% of its taxable income to its stockholders. It is management's current intention to adhere to these requirements and maintain the Company's REIT status. As a REIT, the Company generally will not be subject to corporate level federal income tax on taxable income it distributes currently to its stockholders. If the Company fails to qualify as a REIT in any taxable year, then it will be subject to federal income taxes at regular corporate rates (including any applicable alternative minimum tax) and may not be able to qualify as a REIT for four subsequent taxable years. Even if the Company qualifies for taxation as a REIT, the Company may be subject to certain state and local taxes on its income and property and to federal income and excise taxes on its undistributed taxable income, if any.
Each partner is taxed individually on its share of partnership income or loss, and accordingly, no provision for federal and state income tax is provided for the Operating Partnership in the consolidated financial statements. The Company's taxable REIT subsidiaries ("TRSs") are subject to corporate level income taxes, which are provided for in the Company's consolidated financial statements.
Deferred tax assets and liabilities are recognized for the expected future tax consequences of events that have been included in the financial statements or tax returns. Under this method, deferred tax assets and liabilities are determined based on the differences between the financial reporting and tax bases of assets and liabilities using enacted tax rates in effect for the year in which the differences are expected to reverse. The deferred tax assets and liabilities of the TRSs relate primarily to differences in the book and tax bases of property and to operating loss carryforwards for federal and state income tax purposes. A valuation allowance for deferred tax assets is provided if the Company believes it is more likely than not that all or some portion of the deferred tax assets will not be realized. Realization of deferred tax assets is dependent on the Company generating sufficient taxable income in future periods.
Segment Information:
The Company currently operates in one business segment, the acquisition, ownership, development, redevelopment, management and leasing of regional and community shopping centers. Additionally, the Company operates in one geographic area, the United States.
Fair Value of Financial Instruments:
The fair value hierarchy distinguishes between market participant assumptions based on market data obtained from sources independent of the reporting entity and the reporting entity's own assumptions about market participant assumptions.
Level 1 inputs utilize quoted prices in active markets for identical assets or liabilities that the Company has the ability to access. Level 2 inputs are inputs other than quoted prices included in Level 1 that are observable for the asset or liability, either directly or indirectly. Level 2 inputs may include quoted prices for similar assets and liabilities in active markets, as well as inputs that are observable for the asset or liability (other than quoted prices), such as interest rates, foreign exchange rates and yield curves that are observable at commonly quoted intervals. Level 3 inputs are unobservable inputs for the asset or liability, which are typically based on an entity's own assumptions, as there is little, if any, related market activity. In instances where the determination of the fair value measurement is based on inputs from different levels of the fair value hierarchy, the level in the fair value hierarchy within which the entire fair value measurement falls is based on the lowest level input that is significant to the fair value measurement in its entirety. The Company's assessment of the significance of a particular input to the fair value measurement in its entirety requires judgment, and considers factors specific to the asset or liability.
The Company calculates the fair value of financial instruments and includes this additional information in the notes to consolidated financial statements when the fair value is different than the carrying value of those financial instruments. When the fair value reasonably approximates the carrying value, no additional disclosure is made.
77
THE MACERICH COMPANY
NOTES TO CONSOLIDATED FINANCIAL STATEMENTS (Continued)
(Dollars in thousands, except per share amounts)
2. Summary of Significant Accounting Policies: (Continued)
The fair values of interest rate agreements are determined using the market standard methodology of discounting the future expected cash receipts that would occur if variable interest rates fell below or rose above the strike rate of the interest rate agreements. The variable interest rates used in the calculation of projected receipts on the interest rate agreements are based on an expectation of future interest rates derived from observable market interest rate curves and volatilities. The Company incorporates credit valuation adjustments to appropriately reflect both its own nonperformance risk and the respective counterparty's nonperformance risk in the fair value measurements. In adjusting the fair value of its derivative contracts for the effect of nonperformance risk, the Company has considered the impact of netting and any applicable credit enhancements, such as collateral postings, thresholds, mutual puts and guarantees.
Concentration of Risk:
The Company maintains its cash accounts in a number of commercial banks. Accounts at these banks are guaranteed by the Federal Deposit Insurance Corporation ("FDIC") up to $250. At various times during the year, the Company had deposits in excess of the FDIC insurance limit.
No Center or tenant generated more than 10% of total revenues during the years ended December 31, 2016, 2015 or 2014.
Management Estimates:
The preparation of financial statements in conformity with GAAP requires management to make estimates and assumptions that affect the reported amounts of assets and liabilities and disclosure of contingent assets and liabilities at the date of the financial statements and the reported amounts of revenues and expenses during the reporting period. Actual results could differ from those estimates.
Recent Accounting Pronouncements:
In May 2014, the Financial Accounting Standards Board (“FASB”) issued ASU 2014-09, “Revenue From Contracts With Customers,” which outlines a comprehensive model for entities to use in accounting for revenue arising from contracts with customers. ASU 2014-09 states that “an entity recognizes revenue to depict the transfer of promised goods or services to customers in an amount that reflects the consideration to which the entity expects to be entitled in exchange for those goods or services.” While ASU 2014-09 specifically references contracts with customers, it may apply to certain other transactions such as the sale of real estate or equipment. ASU 2014-09 is effective for the Company beginning January 1, 2018, with early adoption permitted beginning January 1, 2017. The Company is evaluating each of its revenue streams and related accounting policies under the standard. Rental revenues and tenant recoveries will be evaluated with the adoption of the new lease accounting standard (discussed below). The Company does not believe ASU 2014-09 will significantly impact its accounting for minimum rents, percentage rents, tenant recoveries and other revenues. The Company expects to adopt this standard on a modified retrospective basis.
In April 2015, the FASB issued ASU 2015-03, “Simplifying the Presentation of Debt Issuance Costs,” which requires that debt issuance costs related to a recognized debt liability be presented in the balance sheet as a direct deduction from the carrying amount of that debt liability, consistent with debt discounts. The recognition and measurement guidance for debt issuance costs are not affected. The Company's adoption of ASU 2015-03 on January 1, 2016 resulted in an adjustment of its consolidated balance sheet at December 31, 2015 to reflect the new presentation required by the standard.
In September 2015, the FASB issued ASU 2015-16, "Simplifying the Accounting for Measurement-Period Adjustments," which requires adjustments to provisional amounts used in business combinations during the measurement period to be recognized in the reporting period in which the adjustment amounts are determined. It also requires the disclosure of the impact on changes in estimates on earnings, depreciation, amortization and other income effects. The Company's adoption of this standard on January 1, 2016 did not have an impact on its consolidated financial statements.
78
THE MACERICH COMPANY
NOTES TO CONSOLIDATED FINANCIAL STATEMENTS (Continued)
(Dollars in thousands, except per share amounts)
2. Summary of Significant Accounting Policies: (Continued)
In February 2016, the FASB issued ASU 2016-02, "Leases (Topic 842)," which sets out principles for the recognition, measurement, presentation and disclosure of leases for both parties to a contract (i.e. lessees and lessors). The standard requires that lessors expense, on an as-incurred basis, certain initial direct costs that are not incremental in negotiating a lease. Under existing standards, certain of these costs are capitalizable and therefore this new standard may result in certain of these costs being expensed as incurred after adoption. This standard may also impact the timing, recognition and disclosures related to the Company's tenant recoveries from tenants earned from leasing its operating properties.
Under ASU 2016-02, lessees apply a dual approach, classifying leases as either finance or operating leases. A lessee is required to record a right-of-use asset and a lease liability for all leases with a term of greater than twelve months, regardless of their lease classification. The Company is a lessee on ground leases at certain properties and on certain office space leases. ASU 2016-02 will impact the accounting and disclosure requirements for these leases. ASU 2016-02 is effective for the Company under a modified retrospective approach beginning January 1, 2019. The Company is evaluating the impact of the adoption of this standard on its consolidated financial statements.
In March 2016, the FASB issued ASU 2016-09, "Compensation-Stock Compensation (Topic 718)," which amends the accounting for share-based payments, including the income tax consequences, classification of awards and classification on the statement of cash flows. The Company's adoption of this standard on January 1, 2017 did not have a significant impact on its consolidated financial statements.
In August 2016, the FASB issued ASU 2016-15, "Statement of Cash flows (Topic 230)," which amends the accounting for the statement of cash flows by providing guidance on how certain cash receipts and cash payments are presented and classified in the statement of cash flows. The Company's adoption of this standard on January 1, 2017 did not have a significant impact on its consolidated financial statements.
79
THE MACERICH COMPANY
NOTES TO CONSOLIDATED FINANCIAL STATEMENTS (Continued)
(Dollars in thousands, except per share amounts)
3. Earnings Per Share ("EPS"):
The following table reconciles the numerator and denominator used in the computation of earnings per share for the years ended December 31 (shares in thousands):
2016 | 2015 | 2014 | |||||||||
Numerator | |||||||||||
Net Income | $ | 554,839 | $ | 522,912 | $ | 1,606,931 | |||||
Net income attributable to noncontrolling interests | (37,844 | ) | (35,350 | ) | (107,889 | ) | |||||
Net income attributable to the Company | 516,995 | 487,562 | 1,499,042 | ||||||||
Allocation of earnings to participating securities | (779 | ) | (1,493 | ) | (1,576 | ) | |||||
Numerator for basic and diluted EPS—net income attributable to common stockholders | $ | 516,216 | $ | 486,069 | $ | 1,497,466 | |||||
Denominator | |||||||||||
Denominator for basic EPS—weighted average number of common shares outstanding | 146,599 | 157,916 | 143,144 | ||||||||
Effect of dilutive securities (1) | |||||||||||
Share and unit based compensation | 112 | 144 | 147 | ||||||||
Denominator for diluted EPS—weighted average number of common shares outstanding | 146,711 | 158,060 | 143,291 | ||||||||
Earnings per common share—net income attributable to common stockholders: | |||||||||||
Basic | $ | 3.52 | $ | 3.08 | $ | 10.46 | |||||
Diluted | $ | 3.52 | $ | 3.08 | $ | 10.45 | |||||
____________________________________
(1) | Diluted EPS excludes 133,366, 139,186 and 179,667 convertible preferred units for the years ended December 31, 2016, 2015 and 2014, respectively, as their impact was antidilutive. |
Diluted EPS excludes 10,721,271 and 10,562,154 and 10,079,935 Operating Partnership units ("OP Units") for the years ended December 31, 2016, 2015 and 2014, respectively, as their effect was antidilutive.
80
THE MACERICH COMPANY
NOTES TO CONSOLIDATED FINANCIAL STATEMENTS (Continued)
(Dollars in thousands, except per share amounts)
4. Investments in Unconsolidated Joint Ventures:
The following are the Company's direct or indirect investments in various joint ventures with third parties. The Company's direct or indirect ownership interest in each joint venture as of December 31, 2016 was as follows:
Joint Venture | Ownership %(1) | |
443 Wabash MAB LLC | 45.0 | % |
AM Tysons LLC | 50.0 | % |
Biltmore Shopping Center Partners LLC | 50.0 | % |
Candlestick Center LLC—Fashion Outlets of San Francisco | 50.1 | % |
Coolidge Holding LLC | 37.5 | % |
Corte Madera Village, LLC | 50.1 | % |
Country Club Plaza KC Partners LLC | 50.0 | % |
Fashion Outlets of Philadelphia—Various Entities | 50.0 | % |
Jaren Associates #4 | 12.5 | % |
Kierland Commons Investment LLC | 50.0 | % |
Macerich HHF Centers LLC—Various Properties | 51.0 | % |
Macerich Northwestern Associates—Broadway Plaza | 50.0 | % |
MS Portfolio LLC | 50.0 | % |
New River Associates LLC—Arrowhead Towne Center | 60.0 | % |
North Bridge Chicago LLC | 50.0 | % |
One Scottsdale Investors LLC | 50.0 | % |
Pacific Premier Retail LLC—Various Properties | 60.0 | % |
Propcor II Associates, LLC—Boulevard Shops | 50.0 | % |
Scottsdale Fashion Square Partnership | 50.0 | % |
The Market at Estrella Falls LLC | 40.1 | % |
TM TRS Holding Company LLC—Valencia Place at Country Club Plaza | 50.0 | % |
Tysons Corner LLC | 50.0 | % |
Tysons Corner Hotel I LLC | 50.0 | % |
Tysons Corner Property Holdings II LLC | 50.0 | % |
Tysons Corner Property LLC | 50.0 | % |
West Acres Development, LLP | 19.0 | % |
Westcor/Gilbert, L.L.C. | 50.0 | % |
Westcor/Queen Creek LLC | 38.1 | % |
Westcor/Surprise Auto Park LLC | 33.3 | % |
WMAP, L.L.C.—Atlas Park, The Shops at | 50.0 | % |
_______________________________________________________________________________
(1) | The Company's ownership interest in this table reflects its direct or indirect legal ownership interest. Legal ownership may, at times, not equal the Company’s economic interest in the listed entities because of various provisions in certain joint venture agreements regarding distributions of cash flow based on capital account balances, allocations of profits and losses and payments of preferred returns. As a result, the Company’s actual economic interest (as distinct from its legal ownership interest) in certain of the properties could fluctuate from time to time and may not wholly align with its legal ownership interests. Substantially all of the Company’s joint venture agreements contain rights of first refusal, buy-sell provisions, exit rights, default dilution remedies and/or other break up provisions or remedies which are customary in real estate joint venture agreements and which may, positively or negatively, affect the ultimate realization of cash flow and/or capital or liquidation proceeds. |
81
THE MACERICH COMPANY
NOTES TO CONSOLIDATED FINANCIAL STATEMENTS (Continued)
(Dollars in thousands, except per share amounts)
4. Investments in Unconsolidated Joint Ventures: (Continued)
The Company has made the following investments and dispositions in unconsolidated joint ventures during the years ended December 31, 2016, 2015 and 2014:
On June 4, 2014, the Company acquired the remaining 49% ownership interest in Cascade Mall, a 589,000 square foot regional shopping center in Burlington, Washington, that it did not previously own for a cash payment of $15,233. The Company purchased Cascade Mall from its joint venture in Pacific Premier Retail LLC. The cash payment was funded by borrowings under the Company's line of credit. Prior to the acquisition, the Company had accounted for its investment in Cascade Mall under the equity method of accounting. Since the date of acquisition, the Company has included Cascade Mall in its consolidated financial statements (See Note 13—Acquisitions).
On July 30, 2014, the Company formed a joint venture to redevelop Fashion Outlets of Philadelphia, a 1,376,000 square foot regional shopping center in Philadelphia, Pennsylvania. The Company invested $106,800 for a 50% interest in the joint venture, which was funded by borrowings under its line of credit.
On August 28, 2014, the Company sold its 30% ownership interest in Wilshire Boulevard, a 40,000 square foot freestanding store in Santa Monica, California, for a total sales price of $17,100, resulting in a gain on the sale of assets of $9,033, which was included in gain (loss) on sale or write down of assets, net. The sales price was funded by a cash payment of $15,386 and the assumption of the Company's share of the mortgage note payable on the property of $1,714. The Company used the cash proceeds from the sale to pay down its line of credit and for general corporate purposes.
On November 13, 2014, the Company formed a joint venture to develop Fashion Outlets of San Francisco, a 500,000 square foot outlet center in San Francisco, California. In connection with the formation of the joint venture, the Company issued a note receivable for $65,130 to its joint venture partner that bears interest at LIBOR plus 2.0% and matures upon the completion of certain milestones in connection with the development of Fashion Outlets of San Francisco (See Note 17—Related Party Transactions).
On November 14, 2014, the Company acquired the remaining 49% ownership interest that it did not previously own in two separate joint ventures, Pacific Premier Retail LLC and Queens JV LP, which together owned five Centers: Lakewood Center, a 2,064,000 square foot regional shopping center in Lakewood, California; Los Cerritos Center, a 1,298,000 square foot regional shopping center in Cerritos, California; Queens Center, a 963,000 square foot regional shopping center in Queens, New York; Stonewood Center, a 932,000 square foot regional shopping center in Downey, California; and Washington Square, a 1,440,000 square foot regional shopping center in Portland, Oregon (collectively referred to herein as the "PPR Queens Portfolio"). The total consideration of $1,838,886 was funded by the direct issuance of $1,166,777 of common stock of the Company (See Note 12—Stockholders' Equity) and the assumption of the third party's pro rata share of the mortgage notes payable on the properties of $672,109. Prior to the acquisition, the Company had accounted for its investment in these joint ventures under the equity method of accounting. The Company has included Stonewood Center and Queens Center in its consolidated financial statements since the date of acquisition (See Note 13—Acquisitions) and has included Lakewood Center, Los Cerritos Center and Washington Square in its consolidated financial statements from the date of acquisition until the Company sold a 40% interest in the PPR Portfolio on October 30, 2015 as provided below.
On November 20, 2014, the Company purchased a 45% interest in 443 North Wabash Avenue, a 65,000 square foot undeveloped site adjacent to the Company's joint venture in The Shops at North Bridge in Chicago, Illinois, for a cash payment of $18,900. The cash payment was funded by borrowings under the Company's line of credit.
On February 17, 2015, the Company acquired the remaining 50% ownership interest in Inland Center, an 866,000 square foot regional shopping center in San Bernardino, California, that it did not previously own for $51,250. The purchase price was funded by a cash payment of $26,250 and the assumption of the third party's share of the mortgage note payable on the property of $25,000. Concurrent with the purchase of the joint venture interest, the Company paid off the $50,000 mortgage note payable on the property. The cash payment was funded by borrowings under the Company's line of credit. Prior to the acquisition, the Company had accounted for its investment in Inland Center under the equity method of accounting. Since the date of acquisition, the Company has included Inland Center in its consolidated financial statements (See Note 13—Acquisitions).
82
THE MACERICH COMPANY
NOTES TO CONSOLIDATED FINANCIAL STATEMENTS (Continued)
(Dollars in thousands, except per share amounts)
4. Investments in Unconsolidated Joint Ventures: (Continued)
On April 30, 2015, the Company entered into a 50/50 joint venture with Sears to own nine freestanding stores located at Arrowhead Towne Center, Chandler Fashion Center, Danbury Fair Mall, Deptford Mall, Freehold Raceway Mall, Los Cerritos Center, South Plains Mall, Vintage Faire Mall and Washington Square. The Company invested $150,000 for a 50% ownership interest in the joint venture, which was funded by borrowings under the Company's line of credit.
On October 30, 2015, the Company sold a 40% ownership interest in Pacific Premier Retail LLC (the "PPR Portfolio"), which owns Lakewood Center, a 2,064,000 square foot regional shopping center in Lakewood, California; Los Cerritos Center, a 1,298,000 square foot regional shopping center in Cerritos, California; South Plains Mall, a 1,127,000 square foot regional shopping center in Lubbock, Texas; and Washington Square, a 1,440,000 square foot regional shopping center in Portland, Oregon, for a total sales price of $1,258,643, resulting in a gain on sale of assets of $311,194. The sales price was funded by a cash payment of $545,643 and the assumption of a pro rata share of the mortgage and other notes payable on the properties of $713,000. The Company used the cash proceeds from the sales to pay down its line of credit and for general corporate purposes, which included funding the ASR and Special Dividend (See Note 12—Stockholders' Equity). Upon completion of the sale of the ownership interest, the Company no longer has a controlling interest in the joint venture due to the substantive participation rights of the outside partner. Accordingly, the Company accounts for its investment in the PPR Portfolio under the equity method of accounting.
On January 6, 2016, the Company sold a 40% ownership interest in Arrowhead Towne Center, a 1,197,000 square foot regional shopping center in Glendale, Arizona, for $289,496, resulting in a gain on the sale of assets of $101,629. The sales price was funded by a cash payment of $129,496 and the assumption of a pro rata share of the mortgage note payable on the property of $160,000. The Company used the cash proceeds from the sale to pay down its line of credit and for general corporate purposes, which included funding the Special Dividend (See Note 12—Stockholders' Equity). Upon completion of the sale of the ownership interest, the Company no longer has a controlling interest in the joint venture due to the substantive participation rights of the outside partner. Accordingly, the Company accounts for its investment in Arrowhead Towne Center under the equity method of accounting.
On January 14, 2016, the Company formed a joint venture, whereby the Company sold a 49% ownership interest in Deptford Mall, a 1,039,000 square foot regional shopping center in Deptford, New Jersey; FlatIron Crossing, a 1,431,000 square foot regional shopping center in Broomfield, Colorado; and Twenty Ninth Street, an 847,000 square foot regional shopping center in Boulder, Colorado (the "MAC Heitman Portfolio"), for $771,478, resulting in a gain on the sale of assets of $340,734. The sales price was funded by a cash payment of $478,608 and the assumption of a pro rata share of the mortgage notes payable on the properties of $292,870. The Company used the cash proceeds from the sale to pay down its line of credit and for general corporate purposes. Upon completion of the sale of the ownership interest, the Company no longer has a controlling interest in the joint venture due to the substantive participation rights of the outside partner. Accordingly, the Company accounts for its investment in the MAC Heitman Portfolio under the equity method of accounting.
On March 1, 2016, the Company, through a 50/50 joint venture, acquired Country Club Plaza, a 1,246,000 square foot regional shopping center in Kansas City, Missouri, for a purchase price of $660,000. The Company funded its pro rata share of the purchase price of $330,000 from borrowings under its line of credit. On March 28, 2016, the joint venture placed a $320,000 loan on the property that bears interest at an effective rate of 3.88% and matures on April 1, 2026. The Company used its pro rata share of the proceeds to pay down its line of credit and for general corporate purposes.
83
THE MACERICH COMPANY
NOTES TO CONSOLIDATED FINANCIAL STATEMENTS (Continued)
(Dollars in thousands, except per share amounts)
4. Investments in Unconsolidated Joint Ventures: (Continued)
Combined and condensed balance sheets and statements of operations are presented below for all unconsolidated joint ventures.
Combined and Condensed Balance Sheets of Unconsolidated Joint Ventures as of December 31:
2016 | 2015 | ||||||
Assets(1): | |||||||
Properties, net | $ | 9,176,642 | $ | 6,334,442 | |||
Other assets | 614,607 | 507,718 | |||||
Total assets | $ | 9,791,249 | $ | 6,842,160 | |||
Liabilities and partners' capital(1): | |||||||
Mortgage and other notes payable(2) | $ | 5,224,713 | $ | 3,607,588 | |||
Other liabilities | 403,369 | 355,634 | |||||
Company's capital | 2,279,819 | 1,585,796 | |||||
Outside partners' capital | 1,883,348 | 1,293,142 | |||||
Total liabilities and partners' capital | $ | 9,791,249 | $ | 6,842,160 | |||
Investment in unconsolidated joint ventures: | |||||||
Company's capital | $ | 2,279,819 | $ | 1,585,796 | |||
Basis adjustment(3) | (584,887 | ) | (77,701 | ) | |||
$ | 1,694,932 | $ | 1,508,095 | ||||
Assets—Investments in unconsolidated joint ventures | $ | 1,773,558 | $ | 1,532,552 | |||
Liabilities—Distributions in excess of investments in unconsolidated joint ventures | (78,626 | ) | (24,457 | ) | |||
$ | 1,694,932 | $ | 1,508,095 | ||||
_______________________________________________________________________________
(1) | These amounts include the assets of $3,179,255 and $3,283,702 of Pacific Premier Retail LLC as of December 31, 2016 and 2015, respectively, and liabilities of $1,887,952 and $1,938,241 of Pacific Premier Retail LLC as of December 31, 2016 and 2015, respectively. |
(2) | Included in mortgage and other notes payable are amounts due to affiliates of Northwestern Mutual Life ("NML") of $265,863 and $460,872 as of December 31, 2016 and 2015, respectively. NML is considered a related party because it is a joint venture partner with the Company in Macerich Northwestern Associates—Broadway Plaza. Interest expense incurred on these borrowings amounted to $16,898, $29,372 and $38,113 for the years ended December 31, 2016, 2015 and 2014, respectively. |
(3) | The Company amortizes the difference between the cost of its investments in unconsolidated joint ventures and the book value of the underlying equity into income on a straight-line basis consistent with the lives of the underlying assets. The amortization of this difference was $17,610, $5,619 and $5,109 for the years ended December 31, 2016, 2015 and 2014, respectively. |
84
THE MACERICH COMPANY
NOTES TO CONSOLIDATED FINANCIAL STATEMENTS (Continued)
(Dollars in thousands, except per share amounts)
4. Investments in Unconsolidated Joint Ventures: (Continued)
Combined and Condensed Statements of Operations of Unconsolidated Joint Ventures:
Pacific Premier Retail LLC(1) | Other Joint Ventures | Total | |||||||||||
Year Ended December 31, 2016 | |||||||||||||
Revenues: | |||||||||||||
Minimum rents | $ | 129,145 | $ | 471,139 | $ | 600,284 | |||||||
Percentage rents | 5,437 | 15,480 | 20,917 | ||||||||||
Tenant recoveries | 47,856 | 187,288 | 235,144 | ||||||||||
Other | 6,303 | 49,937 | 56,240 | ||||||||||
Total revenues | 188,741 | 723,844 | 912,585 | ||||||||||
Expenses: | |||||||||||||
Shopping center and operating expenses | 39,804 | 234,704 | 274,508 | ||||||||||
Interest expense | 64,626 | 123,043 | 187,669 | ||||||||||
Depreciation and amortization | 108,880 | 251,498 | 360,378 | ||||||||||
Total operating expenses | 213,310 | 609,245 | 822,555 | ||||||||||
Loss on sale of assets | — | (375 | ) | (375 | ) | ||||||||
Net (loss) income | $ | (24,569 | ) | $ | 114,224 | $ | 89,655 | ||||||
Company's equity in net (loss) income | $ | (3,088 | ) | $ | 60,029 | $ | 56,941 | ||||||
Year Ended December 31, 2015 | |||||||||||||
Revenues: | |||||||||||||
Minimum rents | $ | 21,172 | $ | 293,921 | $ | 315,093 | |||||||
Percentage rents | 2,569 | 13,188 | 15,757 | ||||||||||
Tenant recoveries | 8,408 | 129,059 | 137,467 | ||||||||||
Other | 1,182 | 33,931 | 35,113 | ||||||||||
Total revenues | 33,331 | 470,099 | 503,430 | ||||||||||
Expenses: | |||||||||||||
Shopping center and operating expenses | 6,852 | 165,795 | 172,647 | ||||||||||
Interest expense | 10,448 | 78,279 | 88,727 | ||||||||||
Depreciation and amortization | 16,919 | 133,707 | 150,626 | ||||||||||
Total operating expenses | 34,219 | 377,781 | 412,000 | ||||||||||
Gain on sale of assets | — | 9,850 | 9,850 | ||||||||||
Loss on early extinguishment of debt | — | (3 | ) | (3 | ) | ||||||||
Net (loss) income | $ | (888 | ) | $ | 102,165 | $ | 101,277 | ||||||
Company's equity in net income | $ | 1,409 | $ | 43,755 | $ | 45,164 | |||||||
85
THE MACERICH COMPANY
NOTES TO CONSOLIDATED FINANCIAL STATEMENTS (Continued)
(Dollars in thousands, except per share amounts)
4. Investments in Unconsolidated Joint Ventures: (Continued)
Pacific Premier Retail LLC(1) | Other Joint Ventures | Total | |||||||||||
Year Ended December 31, 2014 | |||||||||||||
Revenues: | |||||||||||||
Minimum rents | $ | 88,831 | $ | 299,532 | $ | 388,363 | |||||||
Percentage rents | 2,652 | 14,509 | 17,161 | ||||||||||
Tenant recoveries | 40,118 | 146,623 | 186,741 | ||||||||||
Other | 4,090 | 36,615 | 40,705 | ||||||||||
Total revenues | 135,691 | 497,279 | 632,970 | ||||||||||
Expenses: | |||||||||||||
Shopping center and operating expenses | 37,113 | 178,299 | 215,412 | ||||||||||
Interest expense | 34,113 | 102,974 | 137,087 | ||||||||||
Depreciation and amortization | 29,688 | 114,715 | 144,403 | ||||||||||
Total operating expenses | 100,914 | 395,988 | 496,902 | ||||||||||
(Loss) gain on sale of assets | (7,044 | ) | 10,687 | 3,643 | |||||||||
Net income | $ | 27,733 | $ | 111,978 | $ | 139,711 | |||||||
Company's equity in net income | $ | 9,743 | $ | 50,883 | $ | 60,626 | |||||||
_______________________________________________________________________________
(1) | These amounts exclude the results of operations from November 14, 2014 to October 29, 2015, as Pacific Premier Retail LLC became wholly-owned as a result of the PPR Queens Portfolio acquisition. Pacific Premier Retail LLC was converted from wholly-owned to an unconsolidated joint venture effective October 30, 2015, as a result of the PPR Portfolio transaction, as discussed above. |
Significant accounting policies used by the unconsolidated joint ventures are similar to those used by the Company.
5. Property, net:
Property at December 31, 2016 and 2015 consists of the following:
2016 | 2015 | ||||||
Land | $ | 1,607,590 | $ | 1,894,717 | |||
Buildings and improvements | 6,511,741 | 7,752,892 | |||||
Tenant improvements | 622,878 | 637,355 | |||||
Equipment and furnishings | 177,036 | 169,841 | |||||
Construction in progress | 289,966 | 234,851 | |||||
9,209,211 | 10,689,656 | ||||||
Less accumulated depreciation | (1,851,901 | ) | (1,892,744 | ) | |||
$ | 7,357,310 | $ | 8,796,912 | ||||
Depreciation expense for the years ended December 31, 2016, 2015 and 2014 was $277,270, $354,977 and $289,178, respectively.
86
THE MACERICH COMPANY
NOTES TO CONSOLIDATED FINANCIAL STATEMENTS (Continued)
(Dollars in thousands, except per share amounts)
5. Property, net: (Continued)
The gain on sale or write down of assets, net for the year ended December 31, 2016 includes a gain of $101,629 on the sale of a 40% ownership interest in Arrowhead Towne Center (See Note 4—Investments in Unconsolidated Joint Ventures), $340,734 on the sale of a 49% ownership interest in the MAC Heitman Portfolio (See Note 4—Investments in Unconsolidated Joint Ventures), $24,894 on the sale of Capitola Mall (See Note 14—Dispositions) and $4,546 on the sale of land. These gains were offset in part by a loss of $39,671 on impairment, a charge of $12,180 from a contingent consideration obligation, a loss of $3,066 on the sale of a former Mervyn's store (See Note 14—Dispositions) and $1,538 on the write-off of development costs. The loss on impairment was due to the reduction of the estimated holding periods of Cascade Mall (See Note 22—Subsequent Events), Promenade at Casa Grande, The Marketplace at Flagstaff and a freestanding store.
The gain on sale or write down of assets, net for the year ended December 31, 2015 includes the gain of $311,194 on the sale of a 40% ownership interest in the PPR Portfolio (See Note 4—Investments in Unconsolidated Joint Ventures), $73,726 on the sale of Panorama Mall (See Note 14—Dispositions), $2,336 on the sale of assets and $1,807 on the sale of land offset in part by a loss of $10,633 on impairment and $182 on the write-off of development costs. The loss on impairment was due to the reduction of the estimated holding periods of Flagstaff Mall (See Note 14—Dispositions) and a freestanding store.
The gain on sale or write down of assets, net for the year ended December 31, 2014 includes the gain of $144,927 on the sales of Rotterdam Square, Somersville Towne Center, Lake Square Mall, South Towne Center, Camelback Colonnade and four former Mervyn's stores (See Note 14—Dispositions), $9,033 on the sale of Wilshire Boulevard (See Note 4—Investments in Unconsolidated Joint Ventures) and $1,257 on the sale of assets offset in part by a loss of $41,216 on impairment and $40,561 on the write-off of development costs. The loss on impairment was due to the reduction in the estimated holding periods of the long-lived assets of several properties including Great Northern Mall, Cascade Mall, a property adjacent to Fiesta Mall and three former Mervyn's stores sold in 2014 (See Note 14—Dispositions).
The following table summarizes certain of the Company's assets that were measured on a nonrecurring basis as a result of impairment charges recorded for the years ended December 31, 2016, 2015 and 2014 as described above:
Years ended December, 31 | Total Fair Value Measurement | Quoted Prices in Active Markets for Identical Assets | Significant Other Unobservable Inputs | Significant Unobservable Inputs | ||||||||||||
(Level 1) | (Level 2) | (Level 3) | ||||||||||||||
2016 | $ | 86,100 | $ | — | $ | — | $ | 86,100 | ||||||||
2015 | $ | 33,300 | $ | — | $ | — | $ | 33,300 | ||||||||
2014 | $ | 44,500 | $ | — | $ | — | $ | 44,500 | ||||||||
The fair value relating to impairment assessments were based upon a discounted cash flow model that includes all cash inflows and outflows over a specific holding period. Such projected cash flows are comprised of contractual rental revenues and forecasted rental revenues and expenses based upon market conditions and expectations for growth. Terminal capitalization rates and discount rates utilized in these models are based on a reasonable range of current market rates for each property analyzed. Based upon these inputs, the Company determined that its valuations of properties using a discounted cash flow model are classified within Level 3 of the fair value hierarchy.
The following table sets forth quantitative information about the unobservable inputs of the Company’s Level 3 real estate recorded as of December 31, 2016, 2015 and 2014:
Unobservable Inputs | 2016 | 2015 | 2014 | |||
Terminal capitalization rate | 7.0% - 10.0% | 9.0% | 8.0% - 9.0% | |||
Discount rate | 8.0% - 15.0% | 9.5% | 9.0% - 10.5% | |||
Market rents per square foot | $2.00 - $20.00 | $5.00 - $150.00 | $6.00 - $160.00 | |||
87
THE MACERICH COMPANY
NOTES TO CONSOLIDATED FINANCIAL STATEMENTS (Continued)
(Dollars in thousands, except per share amounts)
6. Tenant and Other Receivables, net:
Included in tenant and other receivables, net is an allowance for doubtful accounts of $1,991 and $3,072 at December 31, 2016 and 2015, respectively. Also included in tenant and other receivables, net are accrued percentage rents of $9,509 and $10,940 at December 31, 2016 and 2015, respectively, and a deferred rent receivable due to straight-line rent adjustments of $56,761 and $60,790 at December 31, 2016 and 2015, respectively.
On March 17, 2014, in connection with the sale of Lake Square Mall (See Note 14—Dispositions), the Company issued a note receivable for $6,500 that bears interest at an effective rate of 6.5% and matures on March 17, 2018 ("LSM Note A") and a note receivable for $3,103 that bore interest at 5.0% and was to mature on December 31, 2014 ("LSM Note B"). On September 2, 2014, the balance of LSM Note B was paid in full. The balance of LSM Note A at December 31, 2016 and 2015 was $6,284 and $6,351, respectively. LSM Note B is collateralized by a trust deed on Lake Square Mall.
7. Deferred Charges and Other Assets, net:
Deferred charges and other assets, net at December 31, 2016 and 2015 consist of the following:
2016 | 2015 | ||||||
Leasing | $ | 239,983 | $ | 248,709 | |||
Intangible assets: | |||||||
In-place lease values(1) | 140,437 | 196,969 | |||||
Leasing commissions and legal costs(1) | 32,384 | 52,000 | |||||
Above-market leases | 181,851 | 220,847 | |||||
Deferred tax assets | 38,301 | 38,847 | |||||
Deferred compensation plan assets | 42,711 | 37,341 | |||||
Other assets | 72,206 | 70,070 | |||||
747,873 | 864,783 | ||||||
Less accumulated amortization(2) | (269,815 | ) | (300,492 | ) | |||
$ | 478,058 | $ | 564,291 | ||||
_______________________________
(1) | The estimated amortization of these intangible assets for the next five years and thereafter is as follows: |
Year Ending December 31, | |||
2017 | $ | 18,700 | |
2018 | 14,606 | ||
2019 | 12,170 | ||
2020 | 9,221 | ||
2021 | 7,379 | ||
Thereafter | 21,960 | ||
$ | 84,036 | ||
(2) | Accumulated amortization includes $88,785 and $109,453 relating to in-place lease values, leasing commissions and legal costs at December 31, 2016 and 2015, respectively. Amortization expense for in-place lease values, leasing commissions and legal costs was $33,048, $69,460 and $52,668 for the years ended December 31, 2016, 2015 and 2014, respectively. |
88
THE MACERICH COMPANY
NOTES TO CONSOLIDATED FINANCIAL STATEMENTS (Continued)
(Dollars in thousands, except per share amounts)
7. Deferred Charges and Other Assets, net: (Continued)
The allocated values of above-market leases and below-market leases consist of the following:
2016 | 2015 | ||||||
Above-Market Leases | |||||||
Original allocated value | $ | 181,851 | $ | 220,847 | |||
Less accumulated amortization | (57,505 | ) | (73,520 | ) | |||
$ | 124,346 | $ | 147,327 | ||||
Below-Market Leases(1) | |||||||
Original allocated value | $ | 144,713 | $ | 227,063 | |||
Less accumulated amortization | (58,400 | ) | (101,872 | ) | |||
$ | 86,313 | $ | 125,191 | ||||
_______________________________
(1) | Below‑market leases are included in other accrued liabilities. |
The allocated values of above and below-market leases will be amortized into minimum rents on a straight-line basis over the individual remaining lease terms. The estimated amortization of these values for the next five years and thereafter is as follows:
Year Ending December 31, | Above Market | Below Market | ||||||
2017 | $ | 14,369 | $ | 14,094 | ||||
2018 | 12,152 | 13,191 | ||||||
2019 | 10,087 | 11,639 | ||||||
2020 | 8,720 | 9,146 | ||||||
2021 | 7,503 | 6,883 | ||||||
Thereafter | 71,515 | 31,360 | ||||||
$ | 124,346 | $ | 86,313 | |||||
89
THE MACERICH COMPANY
NOTES TO CONSOLIDATED FINANCIAL STATEMENTS (Continued)
(Dollars in thousands, except per share amounts)
8. Mortgage Notes Payable:
Mortgage notes payable at December 31, 2016 and 2015 consist of the following:
Carrying Amount of Mortgage Notes(1) | ||||||||||||||||||||||||||
2016 | 2015 | Effective Interest Rate(2) | Monthly Debt Service(3) | Maturity Date(4) | ||||||||||||||||||||||
Property Pledged as Collateral | Related Party | Other | Related Party | Other | ||||||||||||||||||||||
Arrowhead Towne Center(5) | $ | — | $ | — | $ | — | $ | 221,194 | — | $ | — | — | ||||||||||||||
Chandler Fashion Center(6) | — | 199,833 | — | 199,766 | 3.77 | % | 625 | 2019 | ||||||||||||||||||
Danbury Fair Mall | 107,929 | 107,928 | 111,078 | 111,079 | 5.53 | % | 1,538 | 2020 | ||||||||||||||||||
Deptford Mall(7) | — | — | — | 193,337 | — | — | — | |||||||||||||||||||
Deptford Mall(8) | — | — | — | 13,999 | — | — | — | |||||||||||||||||||
Fashion Outlets of Chicago(9) | — | 198,966 | — | 198,653 | 2.43 | % | 378 | 2020 | ||||||||||||||||||
Fashion Outlets of Niagara Falls USA | — | 115,762 | — | 117,708 | 4.89 | % | 727 | 2020 | ||||||||||||||||||
Flagstaff Mall(10) | — | — | — | 37,000 | — | — | — | |||||||||||||||||||
FlatIron Crossing(7) | — | — | — | 254,075 | — | — | — | |||||||||||||||||||
Freehold Raceway Mall(6) | — | 220,643 | — | 224,836 | 4.20 | % | 1,132 | 2018 | ||||||||||||||||||
Fresno Fashion Fair(11) | — | 323,062 | — | — | 3.67 | % | 971 | 2026 | ||||||||||||||||||
Green Acres Mall | — | 297,798 | — | 303,960 | 3.61 | % | 1,447 | 2021 | ||||||||||||||||||
Kings Plaza Shopping Center | — | 456,958 | — | 466,266 | 3.67 | % | 2,229 | 2019 | ||||||||||||||||||
Northgate Mall(12) | — | 63,434 | — | 63,783 | 3.50 | % | 206 | 2017 | ||||||||||||||||||
Oaks, The | — | 201,235 | — | 205,555 | 4.14 | % | 1,064 | 2022 | ||||||||||||||||||
Pacific View | — | 127,311 | — | 130,108 | 4.08 | % | 668 | 2022 | ||||||||||||||||||
Queens Center | — | 600,000 | — | 600,000 | 3.49 | % | 1,744 | 2025 | ||||||||||||||||||
Santa Monica Place | — | 219,564 | — | 224,815 | 2.99 | % | 1,004 | 2018 | ||||||||||||||||||
SanTan Village Regional Center | — | 127,724 | — | 130,638 | 3.14 | % | 589 | 2019 | ||||||||||||||||||
Stonewood Center | — | 99,520 | — | 105,494 | 1.80 | % | 640 | 2017 | ||||||||||||||||||
Superstition Springs Center(13) | — | — | — | 67,749 | — | — | — | |||||||||||||||||||
Towne Mall | — | 21,570 | — | 21,956 | 4.48 | % | 117 | 2022 | ||||||||||||||||||
Tucson La Encantada | 68,513 | — | 69,991 | — | 4.23 | % | 368 | 2022 | ||||||||||||||||||
Victor Valley, Mall of | — | 114,559 | — | 114,500 | 4.00 | % | 380 | 2024 | ||||||||||||||||||
Vintage Faire Mall | — | 269,228 | — | 274,417 | 3.55 | % | 1,256 | 2026 | ||||||||||||||||||
Westside Pavilion | — | 143,881 | — | 146,630 | 4.49 | % | 783 | 2022 | ||||||||||||||||||
$ | 176,442 | $ | 3,908,976 | $ | 181,069 | $ | 4,427,518 | |||||||||||||||||||
90
THE MACERICH COMPANY
NOTES TO CONSOLIDATED FINANCIAL STATEMENTS (Continued)
(Dollars in thousands, except per share amounts)
8. Mortgage Notes Payable: (continued)
(1) | The mortgage notes payable balances include the unamortized debt premiums (discounts). Debt premiums (discounts) represent the excess (deficiency) of the fair value of debt over (under) the principal value of debt assumed in various acquisitions and are amortized into interest expense over the remaining term of the related debt in a manner that approximates the effective interest method. |
The debt premiums (discounts) as of December 31, 2016 and 2015 consist of the following:
Property Pledged as Collateral | 2016 | 2015 | ||||||
Arrowhead Towne Center | $ | — | $ | 8,494 | ||||
Deptford Mall | — | (3 | ) | |||||
Fashion Outlets of Niagara Falls USA | 3,558 | 4,486 | ||||||
Stonewood Center | 2,349 | 5,168 | ||||||
Superstition Springs Center | — | 263 | ||||||
$ | 5,907 | $ | 18,408 | |||||
The mortgage notes payable balances also include unamortized deferred finance costs that are amortized into interest expense over the remaining term of the related debt in a manner that approximates the effective interest method. Unamortized deferred finance costs were $12,716 and $16,025 at December 31, 2016 and 2015, respectively.
(2) | The interest rate disclosed represents the effective interest rate, including the debt premiums (discounts) and deferred finance costs. |
(3) | The monthly debt service represents the payment of principal and interest. |
(4) | The maturity date assumes that all extension options are fully exercised and that the Company does not opt to refinance the debt prior to these dates. These extension options are at the Company's discretion, subject to certain conditions, which the Company believes will be met. |
(5) | On January 6, 2016, the Company replaced the existing loan on the property with a new $400,000 loan that bears interest at an effective rate of 4.05% and matures on February 1, 2028, which resulted in a loss of $3,575 on early extinguishment of debt. Concurrently, a 40% interest in the loan was assumed by a third party in connection with the sale of a 40% ownership interest in the underlying property (See Note 4—Investments in Unconsolidated Joint Ventures). |
(6) | A 49.9% interest in the loan has been assumed by a third party in connection with a co-venture arrangement (See Note 10—Co-Venture Arrangement). |
(7) | On January 14, 2016, a 49% interest in the loan was assumed by a third party in connection with the sale of a 49% ownership interest in the MAC Heitman Portfolio (See Note 4—Investments in Unconsolidated Joint Ventures). |
(8) | On March 1, 2016, the Company paid off in full the loan on the property. |
(9) | The loan bears interest at LIBOR plus 1.50% and matures on March 31, 2020. At December 31, 2016 and 2015, the total interest rate was 2.43% and 1.84%, respectively. |
(10) | On July 15, 2016, the Company conveyed the property to the mortgage lender by a deed-in-lieu of foreclosure, which resulted in a gain of $5,284 on the extinguishment of debt (See Note 14—Dispositions). |
(11) | On October 6, 2016, the Company placed a new $325,000 loan on the property that bears interest at an effective rate of 3.67% and matures on November 1, 2026. |
(12) | The loan bore interest at LIBOR plus 2.25% and was to mature on March 1, 2017. At December 31, 2016 and 2015, the total interest rate was 3.50% and 3.30%, respectively. On January 18, 2017, the Company paid off the loan in full in connection with the sale of the underlying property (See Note 22—Subsequent Events). |
(13) | On October 14, 2016, the Company paid off in full the loan on the property. |
Most of the mortgage loan agreements contain a prepayment penalty provision for the early extinguishment of the debt.
As of December 31, 2016, all of the Company's mortgage notes payable are secured by the properties on which they are placed and are non-recourse to the Company.
The Company expects all loan maturities during the next twelve months, will be refinanced, restructured, extended and/or paid-off from the Company's line of credit or with cash on hand.
91
THE MACERICH COMPANY
NOTES TO CONSOLIDATED FINANCIAL STATEMENTS (Continued)
(Dollars in thousands, except per share amounts)
8. Mortgage Notes Payable: (continued)
Total interest expense capitalized during the years ended December 31, 2016, 2015 and 2014 was $10,316, $13,052 and $12,559, respectively.
Related party mortgage notes payable are amounts due to affiliates of NML. See Note 17—Related Party Transactions for interest expense associated with loans from NML.
The estimated fair value (Level 2 measurement) of mortgage notes payable at December 31, 2016 and 2015 was $4,126,819 and $4,628,781, respectively, based on current interest rates for comparable loans. Fair value was determined using a present value model and an interest rate that included a credit value adjustment based on the estimated value of the property that serves as collateral for the underlying debt.
The future maturities of mortgage notes payable are as follows:
Year Ending December 31, | |||
2017 | $ | 218,562 | |
2018 | 480,176 | ||
2019 | 796,592 | ||
2020 | 528,456 | ||
2021 | 291,733 | ||
Thereafter | 1,776,708 | ||
4,092,227 | |||
Debt premium, net | 5,907 | ||
Deferred finance cost, net | (12,716 | ) | |
$ | 4,085,418 | ||
The future maturities reflected above reflect the extension options that the Company believes will be exercised.
9. Bank and Other Notes Payable:
Bank and other notes payable at December 31, 2016 and 2015 consist of the following:
Line of Credit:
The Company has a $1,500,000 revolving line of credit that bore interest at LIBOR plus a spread of 1.38% to 2.0%, depending on the Company's overall leverage level, and was to mature on August 6, 2018. On July 6, 2016, the Company amended its line of credit. The amended $1,500,000 line of credit bears interest at LIBOR plus a spread of 1.30% to 1.90%, depending on the Company's overall leverage level, and matures on July 6, 2020 with a one-year extension option. The line of credit can be expanded, depending on certain conditions, up to a total facility of $2,000,000.
Based on the Company's leverage level as of December 31, 2016, the borrowing rate on the facility was LIBOR plus 1.45%. As of December 31, 2016 and 2015, borrowings under the line of credit, were $885,000 and $650,000, respectively, less unamortized deferred finance costs of $10,039 and $6,967, respectively, at a total interest rate of 2.40% and 1.95%, respectively. The estimated fair value (Level 2 measurement) of the line of credit at December 31, 2016 and 2015 was $865,921 and $640,260, respectively, based on a present value model using a credit interest rate spread offered to the Company for comparable debt.
92
THE MACERICH COMPANY
NOTES TO CONSOLIDATED FINANCIAL STATEMENTS (Continued)
(Dollars in thousands, except per share amounts)
9. Bank and Other Notes Payable: (Continued)
Term Loan:
On December 8, 2011, the Company obtained a $125,000 unsecured term loan under the line of credit that bore interest at LIBOR plus a spread of 1.95% to 3.20%, depending on the Company's overall leverage level, and was to mature on December 8, 2018. On October 23, 2015, the Company paid off in full the term loan, which resulted in a loss of $578 on the early extinguishment of debt.
Prasada Note:
On March 29, 2013, the Company issued a $13,330 note payable that bears interest at 5.25% and was to mature on May 30, 2016. The maturity date of the note was extended to May 30, 2021. The note payable is collateralized by a portion of a development reimbursement agreement with the City of Surprise, Arizona. At December 31, 2016 and 2015, the note had a balance of $5,521 and $9,130, respectively. The estimated fair value (Level 2 measurement) of the note at December 31, 2016 and 2015 was $5,786 and $9,168, respectively, based on current interest rates for comparable notes. Fair value was determined using a present value model and an interest rate that included a credit value adjustment based on the estimated value of the collateral for the underlying debt.
As of December 31, 2016 and 2015, the Company was in compliance with all applicable financial loan covenants.
The future maturities of bank and other notes payable are as follows:
Year Ending December 31, | |||
2017 | $ | 781 | |
2018 | 823 | ||
2019 | 868 | ||
2020 | 915 | ||
2021 | 887,134 | ||
Thereafter | — | ||
890,521 | |||
Deferred finance cost | (10,039 | ) | |
$ | 880,482 | ||
10. Co-Venture Arrangement:
On September 30, 2009, the Company formed a joint venture, whereby a third party acquired a 49.9% interest in Freehold Raceway Mall, a 1,674,000 square foot regional shopping center in Freehold, New Jersey, and Chandler Fashion Center, a 1,319,000 square foot regional shopping center in Chandler, Arizona. As part of this transaction, the Company issued a warrant in favor of the third party to purchase 935,358 shares of common stock of the Company at an exercise price of $46.68 per share (See "Stock Warrants" in Note 12—Stockholders' Equity). The Company received approximately $174,650 in cash proceeds for the overall transaction, of which $6,496 was attributed to the warrants. The Company used the proceeds from this transaction to pay down its line of credit and for general corporate purposes.
As a result of the Company having certain rights under the agreement to repurchase the assets after the seventh year of the venture formation, the transaction did not qualify for sale treatment. The Company, however, is not obligated to repurchase the assets. The transaction has been accounted for as a profit-sharing arrangement, and accordingly the assets, liabilities and operations of the properties remain on the books of the Company and a co-venture obligation was established for the amount of $168,154, representing the net cash proceeds received from the third party less costs allocated to the warrant. The co-venture obligation is increased for the allocation of income to the co-venture partner and decreased for distributions to the co-venture partner. The co-venture obligation was $58,973 and $63,756 at December 31, 2016 and 2015, respectively.
93
THE MACERICH COMPANY
NOTES TO CONSOLIDATED FINANCIAL STATEMENTS (Continued)
(Dollars in thousands, except per share amounts)
11. Noncontrolling Interests:
The Company allocates net income of the Operating Partnership based on the weighted-average ownership interest during the period. The net income of the Operating Partnership that is not attributable to the Company is reflected in the consolidated statements of operations as noncontrolling interests. The Company adjusts the noncontrolling interests in the Operating Partnership periodically to reflect its ownership interest in the Company. The Company had a 93% ownership interest in the Operating Partnership as of December 31, 2016 and 2015. The remaining 7% limited partnership interest as of December 31, 2016 and 2015, was owned by certain of the Company's executive officers and directors, certain of their affiliates, and other third party investors in the form of OP Units. The OP Units may be redeemed for shares of registered or unregistered stock or cash, at the Company's option. The redemption value for each OP Unit as of any balance sheet date is the amount equal to the average of the closing price per share of the Company's common stock, par value $0.01 per share, as reported on the New York Stock Exchange for the ten trading days ending on the respective balance sheet date. Accordingly, as of December 31, 2016 and 2015, the aggregate redemption value of the then-outstanding OP Units not owned by the Company was $733,141 and $870,625, respectively.
The Company issued common and cumulative preferred units of MACWH, LP in April 2005 in connection with the acquisition of the Wilmorite portfolio. The common and preferred units of MACWH, LP are redeemable at the election of the holder, the Company may redeem them for cash or shares of the Company's stock at the Company's option, and they are classified as permanent equity.
Included in permanent equity are outside ownership interests in various consolidated joint ventures. The joint ventures do not have rights that require the Company to redeem the ownership interests in either cash or stock.
12. Stockholders' Equity:
Stock Buyback Program:
On September 30, 2015, the Company's Board of Directors authorized the repurchase of up to $1,200,000 of the Company's outstanding common shares over the period ending September 30, 2017, as market conditions warranted.
On November 12, 2015, the Company entered into an accelerated share repurchase program ("ASR") to repurchase $400,000 of the Company's common stock. In accordance with the ASR, the Company made a prepayment of $400,000 and received an initial share delivery of 4,140,788 shares. On January 19, 2016, the ASR was completed and the Company received delivery of an additional 970,609 shares. The average price of the 5,111,397 shares repurchased under the ASR was $78.26 per share. The ASR was funded from proceeds in connection with the financing and sale of the ownership interest in the PPR Portfolio (See Note 4—Investments in Unconsolidated Joint Ventures).
On February 17, 2016, the Company entered into an ASR to repurchase an additional $400,000 of the Company's common stock. In accordance with the ASR, the Company made a prepayment of $400,000 and received an initial share delivery of 4,222,193 shares. On April 19, 2016, the ASR was completed and the Company received delivery of an additional 861,235 shares. The average price of the 5,083,428 shares repurchased under the ASR was $78.69 per share. The ASR was funded from borrowings under the Company's line of credit, which had been recently paid down from the proceeds from the recently completed financings and sale of ownership interests (See Note 4—Investments in Unconsolidated Joint Ventures).
On May 9, 2016, the Company entered into an ASR to repurchase the remaining $400,000 of the Company's common stock authorized for repurchase. In accordance with the ASR, the Company made a prepayment of $400,000 and received an initial share delivery of 3,964,812 shares. On July 11, 2016, the ASR was completed and the Company received delivery of an additional 1,104,162 shares. The average price of the 5,068,974 shares repurchased under the ASR was $78.91 per share. The ASR was funded from borrowings under the Company's line of credit, which had been recently paid down from the proceeds from the recently completed financings and sale of ownership interests (See Note 4—Investments in Unconsolidated Joint Ventures).
94
THE MACERICH COMPANY
NOTES TO CONSOLIDATED FINANCIAL STATEMENTS (Continued)
(Dollars in thousands, except per share amounts)
12. Stockholders' Equity: (Continued)
Special Dividends:
On October 30, 2015, the Company declared two special dividends/distributions ("Special Dividend"), each of $2.00 per share of common stock and per OP Unit. The first Special Dividend was paid on December 8, 2015 to stockholders and OP Unit holders of record on November 12, 2015. The second Special Dividend was paid on January 6, 2016 to common stockholders and OP Unit holders of record on November 12, 2015. The Special Dividends were funded from proceeds in connection with the financing and sale of ownership interests in the PPR Portfolio and Arrowhead Towne Center (See Note 4—Investments in Unconsolidated Joint Ventures).
At-The-Market Stock Offering Program ("ATM Program"):
On August 17, 2012, the Company entered into an equity distribution agreement ("2012 ATM Program") with a number of sales agents to issue and sell, from time to time, shares of common stock, par value $0.01 per share, having an aggregate offering price of up to $500,000 (the “2012 ATM Shares”). Sales of the 2012 ATM Shares, could have been made in privately negotiated transactions and/or any other method permitted by law, including sales deemed to be an “at the market” offering, which includes sales made directly on the New York Stock Exchange or sales made to or through a market maker other than on an exchange. The Company agreed to pay each sales agent a commission that was not to exceed, but could have been lower than, 2% of the gross proceeds of the 2012 ATM Shares sold through such sales agent under the 2012 Distribution Agreement.
During the year ended December 31, 2012, the Company sold 2,961,903 shares of common stock under the 2012 ATM Program in exchange for aggregate gross proceeds of $177,896 and net proceeds of $175,649 after commissions and other transaction costs. During the year ended December 31, 2013, the Company sold 2,456,956 shares of common stock under the 2012 ATM Program in exchange for aggregate gross proceeds of $173,011 and net proceeds of $171,102 after commissions and other transaction costs. The proceeds from the sales were used to pay down the Company's line of credit.
On August 20, 2014, the Company terminated and replaced the 2012 ATM Program with a new ATM Program (the "2014 ATM Program") to sell, from time to time, shares of common stock, par value $0.01 per share, having an aggregate offering price of up to $500,000 (the "ATM Shares"). The terms of the 2014 ATM Program are substantially the same as the 2012 ATM Program. The Company did not sell any shares under the 2014 ATM Program during the year ended December 31, 2016.
As of December 31, 2016, $500,000 of the ATM Shares were available to be sold under the 2014 ATM Program. The unsold 2012 ATM Shares are no longer available for issuance. Actual future sales of the ATM Shares under the 2014 ATM Program will depend upon a variety of factors including but not limited to market conditions, the trading price of the Company's common stock and the Company's capital needs. The Company has no obligation to sell the ATM Shares under the 2014 ATM Program.
Stock Issued to Acquire Property:
On November 14, 2014, the Company issued 17,140,845 shares of common stock in connection with the acquisition of the PPR Queens Portfolio (See Note 13—Acquisitions) for a value of $1,166,777, based on the closing price of the Company's common stock on the date of the transaction.
95
THE MACERICH COMPANY
NOTES TO CONSOLIDATED FINANCIAL STATEMENTS (Continued)
(Dollars in thousands, except per share amounts)
13. Acquisitions:
Cascade Mall:
On June 4, 2014, the Company acquired the remaining 49% ownership interest in Cascade Mall that it did not previously own for $15,233. Prior to the acquisition, the Company had accounted for its investment under the equity method of accounting (See Note 4—Investments in Unconsolidated Joint Ventures). As a result of this transaction, the Company obtained 100% ownership of Cascade Mall. The acquisition was completed in order to obtain 100% ownership and control over this asset.
The following is a summary of the allocation of the fair value of Cascade Mall:
Property | $ | 28,924 | |
Deferred charges | 6,660 | ||
Other assets | 202 | ||
Total assets acquired | 35,786 | ||
Other accrued liabilities | 4,786 | ||
Total liabilities assumed | 4,786 | ||
Fair value of acquired net assets (at 100% ownership) | $ | 31,000 | |
The Company determined that the purchase price represented the fair value of the additional ownership interest in Cascade Mall that was acquired.
The following is the reconciliation of the purchase price to the fair value of the acquired net assets:
Purchase price | $ | 15,233 | |
Distributions in excess of investment | 15,767 | ||
Fair value of acquired net assets (at 100% ownership) | $ | 31,000 | |
Since the date of acquisition, the Company has included Cascade Mall in its consolidated financial statements.
Fashion Outlets of Chicago:
On October 31, 2014, the Company purchased AWE/Talisman's ownership interest in its consolidated joint venture in Fashion Outlets of Chicago, for $69,987. The purchase price was funded by a cash payment of $55,867 and the settlement of the balance on the Talisman Notes of $14,120 (See Note 17—Related Party Transactions). The cash payment was funded by borrowings under the Company's line of credit. The purchase agreement included contingent consideration based on the financial performance of Fashion Outlets of Chicago at an agreed upon date in 2016. On August 19, 2016, the Company paid $23,800 in full settlement of the contingent consideration obligation.
PPR Queens Portfolio:
On November 14, 2014, the Company acquired the remaining 49% ownership interest in the PPR Queens Portfolio that it did not previously own for $1,838,886. The acquisition was completed in order to gain 100% ownership and control over this portfolio of prominent shopping centers. The purchase price was funded by the assumption of the third party's pro rata share of the mortgage notes payable on the property of $672,109 and the issuance of $1,166,777 in common stock of the Company. Prior to the acquisition, the Company had accounted for its investment under the equity method of accounting (See Note 4—Investments in Unconsolidated Joint Ventures). As a result of this transaction, the Company obtained 100% ownership of the PPR Queens Portfolio.
96
THE MACERICH COMPANY
NOTES TO CONSOLIDATED FINANCIAL STATEMENTS (Continued)
(Dollars in thousands, except per share amounts)
13. Acquisitions: (Continued)
The following is a summary of the allocation of the fair value of the PPR Queens Portfolio:
Property | $ | 3,711,819 | |
Deferred charges | 155,892 | ||
Cash and cash equivalents | 28,890 | ||
Restricted cash | 5,113 | ||
Tenant receivables | 5,438 | ||
Other assets | 127,244 | ||
Total assets acquired | 4,034,396 | ||
Mortgage notes payable | 1,414,659 | ||
Accounts payable | 5,669 | ||
Due to affiliates | 2,680 | ||
Other accrued liabilities | 230,210 | ||
Total liabilities assumed | 1,653,218 | ||
Fair value of acquired net assets (at 100% ownership) | $ | 2,381,178 | |
The Company determined that the purchase price represented the fair value of the additional ownership interest in the PPR Queens Portfolio that was acquired.
Fair value of existing ownership interest (at 51% ownership) | $ | 1,214,401 | |
Distributions in excess of investment | 208,735 | ||
Gain on remeasurement of assets | $ | 1,423,136 | |
The following is the reconciliation of the purchase price to the fair value of the acquired net assets:
Purchase price | $ | 1,838,886 | |
Less debt assumed | (672,109 | ) | |
Distributions in excess of investment | (208,735 | ) | |
Gain on remeasurement of assets | 1,423,136 | ||
Fair value of acquired net assets (at 100% ownership) | $ | 2,381,178 | |
The Company has included Lakewood Center, Los Cerritos Center and Washington Square in its consolidated financial statements until the Company sold a 40% ownership interest in the PPR Portfolio on October 30, 2015 (See Note 4—Investments in Unconsolidated Joint Ventures). The remaining properties of the PPR Queens Portfolio have been included in the Company's consolidated financial statements from the date of acquisition.
Inland Center:
On February 17, 2015, the Company acquired the remaining 50% ownership interest in Inland Center that it did not previously own for $51,250. The purchase price was funded by a cash payment of $26,250 and the assumption of the third party's share of the mortgage note payable on the property of $25,000. Prior to the acquisition, the Company had accounted for its investment in Inland Center under the equity method of accounting (See Note 4—Investments in Unconsolidated Joint Ventures). As a result of this transaction, the Company obtained 100% ownership of Inland Center. The acquisition was completed in order to obtain 100% ownership and control over this asset.
97
THE MACERICH COMPANY
NOTES TO CONSOLIDATED FINANCIAL STATEMENTS (Continued)
(Dollars in thousands, except per share amounts)
13. Acquisitions: (Continued)
The following is a summary of the allocation of the fair value of Inland Center:
Property | $ | 91,871 | |
Deferred charges | 9,752 | ||
Other assets | 5,782 | ||
Total assets acquired | 107,405 | ||
Mortgage note payable | 50,000 | ||
Other accrued liabilities | 4,905 | ||
Total liabilities assumed | 54,905 | ||
Fair value of acquired net assets (at 100% ownership) | $ | 52,500 | |
The Company determined that the purchase price represented the fair value of the additional ownership interest in Inland Center that was acquired.
Fair value of existing ownership interest (at 50% ownership) | $ | 26,250 | |
Carrying value of investment | (4,161 | ) | |
Gain on remeasurement of assets | $ | 22,089 | |
The following is the reconciliation of the purchase price to the fair value of the acquired net assets:
Purchase price | $ | 51,250 | |
Less debt assumed | (25,000 | ) | |
Carrying value of investment | 4,161 | ||
Gain on remeasurement of assets | 22,089 | ||
Fair value of acquired net assets (at 100% ownership) | $ | 52,500 | |
From the date of acquisition, the Company has included Inland Center in its consolidated financial statements.
14. Dispositions:
On January 15, 2014, the Company sold Rotterdam Square, a 585,000 square foot regional shopping center in Schenectady, New York, for $8,500, resulting in a loss on the sale of assets of $472. The Company used the proceeds from the sale to pay down its line of credit and for general corporate purposes.
On February 14, 2014, the Company sold Somersville Towne Center, a 348,000 square foot regional shopping center in Antioch, California, for $12,337, resulting in a loss on the sale of assets of $263. The Company used the proceeds from the sale to pay down its line of credit and for general corporate purposes.
On March 17, 2014, the Company sold Lake Square Mall, a 559,000 square foot regional shopping center in Leesburg, Florida, for $13,280, resulting in a loss on the sale of assets of $876. The sales price was funded by a cash payment of $3,677 and the issuance of two notes receivable totaling $9,603 (See Note 6—Tenant and Other Receivables, net). The Company used the cash proceeds from the sale to pay down its line of credit and for general corporate purposes.
On July 7, 2014, the Company sold a former Mervyn's store in El Paso, Texas for $3,560, resulting in a loss on the sale of assets of $158. The Company used the proceeds from the sale to pay down its line of credit and for general corporate purposes.
98
THE MACERICH COMPANY
NOTES TO CONSOLIDATED FINANCIAL STATEMENTS (Continued)
(Dollars in thousands, except per share amounts)
14. Dispositions: (Continued)
On August 28, 2014, the Company sold a former Mervyn's store in Thousand Oaks, California for $3,500, resulting in a loss on the sale of assets of $80. The Company used the proceeds from the sale to pay down its line of credit and for general corporate purposes.
On September 11, 2014, the Company sold a leasehold interest in a former Mervyn's store in Laredo, Texas for $1,200, resulting in a gain on the sale of assets of $315. The Company used the proceeds from the sale to pay down its line of credit and for general corporate purposes.
On October 10, 2014, the Company sold a former Mervyn's store in Marysville, California for $1,900, resulting in a loss on the sale of assets of $3. The Company used the proceeds from the sale to pay down its line of credit and for general corporate purposes.
On October 31, 2014, the Company sold South Towne Center, a 1,278,000 square foot regional shopping center in Sandy, Utah, for $205,000, resulting in a gain on the sale of assets of $121,873. The Company used the proceeds from the sale to pay down its line of credit and for general corporate purposes.
On December 29, 2014, the Company sold its 67.5% ownership interest in its consolidated joint venture in Camelback Colonnade, a 619,000 square foot community center in Phoenix, Arizona, for $92,898, resulting in a gain on the sale of assets of $24,554. The sales price was funded by a cash payment of $61,173 and the assumption of the Company's share of the mortgage note payable on the property of $31,725. The Company used the cash proceeds from the sale to pay down its line of credit and for general corporate purposes. As a result of the sale, the Company was discharged of the $47,946 mortgage note payable on the property and $17,217 of noncontrolling interest was reversed.
On June 30, 2015, the Company conveyed Great Northern Mall, an 895,000 square foot regional shopping center in Clay, New York, to the mortgage lender by a deed-in-lieu of foreclosure and was discharged from the mortgage note payable. The loan was nonrecourse to the Company. As a result, the Company recognized a loss on the extinguishment of debt of $1,627.
On November 19, 2015, the Company sold Panorama Mall, a 312,000 square foot community center in Panorama City, California, for $98,000, resulting in a gain on the sale of assets of $73,726. The Company used the proceeds from the sale to pay down its line of credit and for general corporate purposes.
On April 13, 2016, the Company sold Capitola Mall, a 586,000 square foot regional shopping center in Capitola, California, for $93,000, resulting in a gain on the sale of assets of $24,894. The Company used the proceeds from the sale to pay down its line of credit and for general corporate purposes.
On May 31, 2016, the Company sold a former Mervyn's store in Yuma, Arizona, for $3,200, resulting in a loss on the sale of assets of $3,066. The Company used the proceeds from the sale to pay down its line of credit and for general corporate purposes.
On July 15, 2016, the Company conveyed Flagstaff Mall, a 347,000 square foot regional shopping center in Flagstaff, Arizona, to the mortgage lender by a deed-in-lieu of foreclosure and was discharged from the mortgage note payable. The loan was non-recourse to the Company. As a result, the Company recognized a gain on the extinguishment of debt of $5,284 (See Note 8—Mortgage Notes Payable).
99
THE MACERICH COMPANY
NOTES TO CONSOLIDATED FINANCIAL STATEMENTS (Continued)
(Dollars in thousands, except per share amounts)
15. Future Rental Revenues:
Under existing non-cancelable operating lease agreements, tenants are committed to pay the following minimum rental payments to the Company:
Year Ending December 31, | |||
2017 | $ | 536,826 | |
2018 | 456,976 | ||
2019 | 396,405 | ||
2020 | 349,394 | ||
2021 | 298,641 | ||
Thereafter | 989,259 | ||
$ | 3,027,501 | ||
16. Commitments and Contingencies:
The Company has certain properties subject to non-cancelable operating ground leases. The leases expire at various times through 2098, subject in some cases to options to extend the terms of the lease. Certain leases provide for contingent rent payments based on a percentage of base rental income, as defined in the lease. Ground lease rent expenses were $9,894, $11,870 and $10,968 for the years ended December 31, 2016, 2015 and 2014, respectively. No contingent rent was incurred for the years ended December 31, 2016, 2015 or 2014.
Minimum future rental payments required under the leases are as follows:
Year Ending December 31, | |||
2017 | $ | 13,712 | |
2018 | 9,423 | ||
2019 | 7,840 | ||
2020 | 7,848 | ||
2021 | 7,487 | ||
Thereafter | 193,659 | ||
$ | 239,969 | ||
As of December 31, 2016, the Company was contingently liable for $61,002 in letters of credit guaranteeing performance by the Company of certain obligations relating to the Centers. The Company does not believe that these letters of credit will result in a liability to the Company.
The Company has entered into a number of construction agreements related to its redevelopment and development activities. Obligations under these agreements are contingent upon the completion of the services within the guidelines specified in the relevant agreement. At December 31, 2016, the Company had $41,906 in outstanding obligations, which it believes will be settled in the next twelve months.
100
THE MACERICH COMPANY
NOTES TO CONSOLIDATED FINANCIAL STATEMENTS (Continued)
(Dollars in thousands, except per share amounts)
17. Related Party Transactions:
Certain unconsolidated joint ventures have engaged the Management Companies to manage the operations of the Centers. Under these arrangements, the Management Companies are reimbursed for compensation paid to on-site employees, leasing agents and project managers at the Centers, as well as insurance costs and other administrative expenses. The following are fees charged to unconsolidated joint ventures for the years ended December 31:
2016 | 2015 | 2014 | |||||||||
Management fees | $ | 17,937 | $ | 10,064 | $ | 16,751 | |||||
Development and leasing fees | 13,907 | 9,615 | 10,528 | ||||||||
$ | 31,844 | $ | 19,679 | $ | 27,279 | ||||||
Certain mortgage notes on the properties are held by NML (See Note 8—Mortgage Notes Payable). Interest expense in connection with these notes was $8,973, $10,515 and $15,134 for the years ended December 31, 2016, 2015 and 2014, respectively. Included in accounts payable and accrued expenses is interest payable to this related party of $736 and $756 at December 31, 2016 and 2015, respectively.
During the year ended December 31, 2014, the Company had loans to unconsolidated joint ventures to fund development stage projects prior to construction loan funding. Correspondingly, loan payables in the same amount have been accrued as an obligation by the various joint ventures. Interest income associated with these notes was $164 for the year ended December 31, 2014.
Due (to) from affiliates includes $(6,809) and $7,467 of (prepaid) unreimbursed costs and fees due (to) from unconsolidated joint ventures under management agreements at December 31, 2016 and 2015, respectively.
Due from affiliates at December 31, 2013 also included two notes receivable from principals of AWE/Talisman ("Talisman Notes") that bore interest at 5.0% and were to mature based on the refinancing or sale of Fashion Outlets of Chicago, a 538,000 square foot outlet center in Rosemont, Illinois, or certain other specified events. AWE/Talisman was considered a related party because it had a 40% noncontrolling ownership interest in Fashion Outlets of Chicago. On October 31, 2014, in connection with the Company's acquisition of AWE/Talisman's ownership interest in Fashion Outlets of Chicago, the balance of the Talisman Notes were settled (See Note 13—Acquisitions). Interest income earned on these notes was $516 for the year ended December 31, 2014.
In addition, due from affiliates at December 31, 2016 and 2015 includes a note receivable from RED/303 LLC ("RED") that bears interest at 5.25% and was to mature on May 30, 2016. The maturity date of the note was extended to May 30, 2021. Interest income earned on this note was $366, $520 and $614 for the years ended December 31, 2016, 2015 and 2014, respectively. The balance on this note receivable was $5,593 and $9,252 at December 31, 2016 and 2015, respectively. RED is considered a related party because it is a partner in a joint venture development project. The note is collateralized by RED's interest in a development agreement.
Also included in due from affiliates is a note receivable from Lennar Corporation that bears interest at LIBOR plus 2% and matures upon the completion of certain milestones in connection with the development of Fashion Outlets of San Francisco (See Note 4—Investments in Unconsolidated Joint Ventures). Interest income earned on this note was $2,234, $1,872 and $206 for the years ended December 31, 2016, 2015 and 2014, respectively. The balance on this note was $69,443 and $67,209 at December 31, 2016 and 2015, respectively. Lennar Corporation is considered a related party because it has an ownership interest in Fashion Outlets of San Francisco.
101
THE MACERICH COMPANY
NOTES TO CONSOLIDATED FINANCIAL STATEMENTS (Continued)
(Dollars in thousands, except per share amounts)
18. Share and Unit-based Plans:
The Company has established share and unit-based compensation plans for the purpose of attracting and retaining executive officers, directors and key employees.
2003 Equity Incentive Plan:
The 2003 Equity Incentive Plan ("2003 Plan") authorizes the grant of stock awards, stock options, stock appreciation rights, stock units, stock bonuses, performance-based awards, dividend equivalent rights and OP Units or other convertible or exchangeable units. As of December 31, 2016, stock awards, stock units, LTIP Units (as defined below), stock appreciation rights ("SARs") and stock options have been granted under the 2003 Plan. All stock options or other rights to acquire common stock granted under the 2003 Plan have a term of 10 years or less. These awards were generally granted based on the performance of the Company and the employees. None of the awards have performance requirements other than a service condition of continued employment unless otherwise provided. All awards are subject to restrictions determined by the Company's compensation committee. The aggregate number of shares of common stock that may be issued under the 2003 Plan is 19,825,428 shares. As of December 31, 2016, there were 6,791,618 shares available for issuance under the 2003 Plan.
Stock Awards:
The value of the stock awards was determined by the market price of the Company's common stock on the date of the grant. The following table summarizes the activity of non-vested stock awards during the years ended December 31, 2016, 2015 and 2014:
2016 | 2015 | 2014 | ||||||||||||||||||
Shares | Weighted Average Grant Date Fair Value | Shares | Weighted Average Grant Date Fair Value | Shares | Weighted Average Grant Date Fair Value | |||||||||||||||
Balance at beginning of year | 1,612 | $ | 62.01 | 9,189 | $ | 59.25 | 19,001 | $ | 56.77 | |||||||||||
Granted | — | — | — | — | — | — | ||||||||||||||
Vested | (1,612 | ) | 62.01 | (7,577 | ) | 58.67 | (9,812 | ) | 54.45 | |||||||||||
Balance at end of year | — | $ | — | 1,612 | $ | 62.01 | 9,189 | $ | 59.25 | |||||||||||
Stock Units:
The stock units represent the right to receive upon vesting one share of the Company's common stock for one stock unit. The value of the stock units was determined by the market price of the Company's common stock on the date of the grant. The following table summarizes the activity of non-vested stock units during the years ended December 31, 2016, 2015 and 2014:
2016 | 2015 | 2014 | ||||||||||||||||||
Units | Weighted Average Grant Date Fair Value | Units | Weighted Average Grant Date Fair Value | Units | Weighted Average Grant Date Fair Value | |||||||||||||||
Balance at beginning of year | 132,086 | $ | 74.58 | 144,374 | $ | 59.94 | 137,318 | $ | 57.24 | |||||||||||
Granted | 85,601 | 79.22 | 77,282 | 86.53 | 75,309 | 60.50 | ||||||||||||||
Vested | (69,259 | ) | 71.82 | (86,761 | ) | 61.29 | (68,253 | ) | 55.14 | |||||||||||
Forfeited | — | — | (2,809 | ) | 86.72 | — | — | |||||||||||||
Balance at end of year | 148,428 | $ | 78.53 | 132,086 | $ | 74.58 | 144,374 | $ | 59.94 | |||||||||||
102
THE MACERICH COMPANY
NOTES TO CONSOLIDATED FINANCIAL STATEMENTS (Continued)
(Dollars in thousands, except per share amounts)
18. Share and Unit-Based Plans: (Continued)
SARs:
The executives and key employees have up to 10 years from the grant date to exercise the SARs. Upon exercise, the executives and key employees will receive unrestricted common shares for the appreciation in value of the SARs from the grant date to the exercise date.
The Company determined the value of each SAR awarded during the year ended December 31, 2012 to be $9.67 using the Black‑Scholes Option Pricing Model based upon the following assumptions: volatility of 25.85%, dividend yield of 3.69%, risk free rate of 1.20%, current value of $59.57 and an expected term of 8 years. The value of each of the other outstanding SARs was determined at the grant date to be $7.68 based upon the following assumptions: volatility of 22.52%, dividend yield of 5.23%, risk free rate of 3.15%, current value of $61.17 and an expected term of 8 years. The assumptions for volatility and dividend yield were based on the Company's historical experience as a publicly traded company, the current value was based on the closing price on the date of grant and the risk free rate was based upon the interest rate of the 10-year Treasury bond on the date of grant.
In connection with the payment of the Special Dividend (See Note 12—Stockholders' Equity), the compensation committee approved an adjustment to all outstanding SARs. The exercise price and number of outstanding SARs were adjusted such that each SAR had the same fair value to the holder before and after giving effect to the payment of the special dividend. As a result, the 407,823 outstanding SARs on December 8, 2015 with a weighted-average price of $56.49 were adjusted to 417,783 outstanding SARs with a weighted average price of $55.13 and the 417,783 outstanding SARs on January 6, 2016 with a weighted-average price of $55.13 were adjusted to 427,968 outstanding SARs with a weighted average price of $53.85.
The following table summarizes the activity of SARs awards during the years ended December 31, 2016, 2015 and 2014:
2016 | 2015 | 2014 | ||||||||||||||||||
Units | Weighted Average Exercise Price | Units | Weighted Average Exercise Price | Units | Weighted Average Exercise Price | |||||||||||||||
Balance at beginning of year | 417,783 | $ | 55.13 | 772,639 | $ | 56.67 | 1,070,991 | $ | 56.66 | |||||||||||
Granted | — | — | — | — | — | — | ||||||||||||||
Exercised | (143,822 | ) | 53.73 | (364,807 | ) | 56.86 | (298,352 | ) | 56.63 | |||||||||||
Special dividend adjustment | 10,185 | 53.88 | 9,951 | 55.13 | — | — | ||||||||||||||
Balance at end of year | 284,146 | $ | 53.85 | 417,783 | $ | 55.13 | 772,639 | $ | 56.67 | |||||||||||
Long-Term Incentive Plan Units:
Under the Long-Term Incentive Plan ("LTIP"), each award recipient is issued a form of operating partnership units ("LTIP Units") in the Operating Partnership. Upon the occurrence of specified events and subject to the satisfaction of applicable vesting conditions, LTIP Units (after conversion into OP Units) are ultimately redeemable for common stock of the Company, or cash at the Company's option, on a one-unit for one-share basis. LTIP Units receive cash dividends based on the dividend amount paid on the common stock of the Company. The LTIP may include both market-indexed awards and service-based awards.
The market-indexed LTIP Units vest over the service period of the award based on the percentile ranking of the Company in terms of total return to stockholders (the "Total Return") per common stock share relative to the Total Return of a group of peer REITs, as measured at the end of the measurement period.
The fair value of the market-indexed LTIP Units are estimated on the date of grant using a Monte Carlo Simulation model. The stock price of the Company, along with the stock prices of the group of peer REITs (for market-indexed awards), is assumed to follow the Multivariate Geometric Brownian Motion Process. Multivariate Geometric Brownian Motion is a common assumption when modeling in financial markets, as it allows the modeled quantity (in this case, the stock price) to vary randomly from its current value and take any value greater than zero. The volatilities of the returns on the share price of
103
THE MACERICH COMPANY
NOTES TO CONSOLIDATED FINANCIAL STATEMENTS (Continued)
(Dollars in thousands, except per share amounts)
18. Share and Unit-Based Plans: (Continued)
the Company and the peer group REITs were estimated based on a look-back period. The expected growth rate of the stock prices over the "derived service period" is determined with consideration of the risk free rate as of the grant date.
On January 1, 2014, the Company granted 70,042 LTIP Units with a grant date fair value of $58.89 that vested in equal annual installments over a service period ending December 31, 2016. Concurrently, the Company granted 272,930 market-indexed LTIP Units ("2014 LTIP Units") at a grant date fair value of $45.34 per LTIP Unit that vested over a service period ending December 31, 2014. The 2014 LTIP Units were equally divided between two types of awards. The terms of both types of awards were the same, except one award had an additional 3% absolute Total Return requirement, which if it was not met, then such LTIP Units would not have vested. On January 12, 2015, the compensation committee determined that the 2014 LTIP Units had vested at a 150% level, based on the Company's percentile ranking in terms of Total Return per common stock share compared to the Total Return of a group of peer REITs during the period of January 1, 2014 to December 31, 2014. In addition, the compensation committee determined that the applicable 3% absolute Total Return requirement was exceeded. As a result, an additional 136,465 fully-vested LTIP Units were granted on December 31, 2014.
On March 7, 2014, the Company granted 246,471 LTIP Units at a fair value of $60.25 per LTIP Unit that were fully vested on the grant date.
On January 1, 2015, the Company granted 49,451 LTIP Units with a grant date fair value of $83.41 per LTIP Unit that will vest in equal annual installments over a service period ending December 31, 2017. Concurrently, the Company granted 186,450 market-indexed LTIP Units ("2015 LTIP Units") at a grant date fair value of $66.37 per LTIP Unit that vested over a service period ending December 31, 2015. The 2015 LTIP Units were equally divided between two types of awards. The terms of both types of awards were the same, except one award has an additional 3% absolute Total Return requirement, which if it is not met, then such LTIP Units would not have vested. The grant date fair value of the 2015 LTIP Units assumed a risk free interest rate of 0.25% and an expected volatility of 16.81%. On January 7, 2016, the compensation committee determined that the 2015 LTIP Units had vested at a 130% level, based on the Company's percentile ranking in terms of Total Return per common stock share compared to the Total Return of a group of peer REITs during the period of January 1, 2015 to December 31, 2015. In addition, the compensation committee determined that the applicable 3% absolute Total Return requirement was exceeded. As a result, an additional 55,934 fully-vested LTIP Units were granted on December 31, 2015.
On March 6, 2015, the Company granted 132,607 LTIP Units at a fair value of $86.72 per LTIP Unit that were fully vested on the grant date.
On January 1, 2016, the Company granted 58,786 LTIP Units with a grant date fair value of $80.69 per LTIP Unit that will vest in equal annual installments over a service period ending December 31, 2018. Concurrently, the Company granted 266,899 market-indexed LTIP Units ("2016 LTIP Units") at a grant date fair value of $53.32 per LTIP Unit that vest over a service period ending December 31, 2018. The fair value of the 2016 LTIP Units was estimated on the date of grant using a Monte Carlo Simulation model that assumed a risk free interest rate of 1.32% and an expected volatility of 20.31%.
On March 4, 2016, the Company granted 154,686 LTIP Units at a fair value of $79.20 per LTIP Unit that were fully vested on the grant date.
104
THE MACERICH COMPANY
NOTES TO CONSOLIDATED FINANCIAL STATEMENTS (Continued)
(Dollars in thousands, except per share amounts)
18. Share and Unit-Based Plans: (Continued)
The following table summarizes the activity of the non-vested LTIP Units during the years ended December 31, 2016, 2015 and 2014:
2016 | 2015 | 2014 | ||||||||||||||||||
Units | Weighted Average Grant Date Fair Value | Units | Weighted Average Grant Date Fair Value | Units | Weighted Average Grant Date Fair Value | |||||||||||||||
Balance at beginning of year | 56,315 | $ | 73.24 | 46,695 | $ | 58.89 | — | $ | — | |||||||||||
Granted | 480,371 | 65.00 | 424,442 | 74.71 | 725,908 | 51.71 | ||||||||||||||
Vested | (214,114 | ) | 77.45 | (414,822 | ) | 73.13 | (679,213 | ) | 51.22 | |||||||||||
Forfeited | — | — | — | — | — | — | ||||||||||||||
Balance at end of year | 322,572 | $ | 58.18 | 56,315 | $ | 73.24 | 46,695 | $ | 58.89 | |||||||||||
Stock Options:
The Company measured the value of each option awarded during the year ended December 31, 2012 to be $9.67 using the Black-Scholes Option Pricing Model based upon the following assumptions: volatility of 25.85%, dividend yield of 3.69%, risk free rate of 1.20%, current value of $59.57 and an expected term of 8 years. The assumptions for volatility and dividend yield were based on the Company's historical experience as a publicly traded company, the current value was based on the closing price on the date of grant and the risk free rate was based upon the interest rate of the 10-year Treasury bond on the date of grant.
In connection with the payment of the Special Dividend (See Note 12—Stockholders' Equity), the compensation committee approved an adjustment to all outstanding stock options. The exercise price and number of outstanding stock options were adjusted such that each stock option had the same fair value to the holder before and after giving effect to the payment of the Special Dividend. As a result, the 10,068 outstanding stock options on December 8, 2015 with a weighted-average price of $59.57 were adjusted to 10,314 outstanding stock options with a weighted average price of $58.15 and the 10,314 outstanding stock options on January 6, 2016 with a weighted-average price of $58.15 were adjusted to 10,565 outstanding stock options with a weighted average price of $56.77.
The following table summarizes the activity of stock options for the years ended December 31, 2016, 2015 and 2014:
2016 | 2015 | 2014 | ||||||||||||||||||
Options | Weighted Average Exercise Price | Options | Weighted Average Exercise Price | Options | Weighted Average Exercise Price | |||||||||||||||
Balance at beginning of year | 10,314 | $ | 58.15 | 10,068 | $ | 59.57 | 10,068 | $ | 59.57 | |||||||||||
Granted | — | — | — | — | — | — | ||||||||||||||
Exercised | — | — | — | — | — | — | ||||||||||||||
Special dividend adjustment | 251 | 56.77 | 246 | 58.15 | — | — | ||||||||||||||
Balance at end of year | 10,565 | $ | 56.77 | 10,314 | $ | 58.15 | 10,068 | $ | 59.57 | |||||||||||
105
THE MACERICH COMPANY
NOTES TO CONSOLIDATED FINANCIAL STATEMENTS (Continued)
(Dollars in thousands, except per share amounts)
18. Share and Unit-Based Plans: (Continued)
Directors' Phantom Stock Plan:
The Directors' Phantom Stock Plan offers non-employee members of the board of directors ("Directors") the opportunity to defer their cash compensation and to receive that compensation in common stock rather than in cash after termination of service or a predetermined period. Compensation generally includes the annual retainers payable by the Company to the Directors. Deferred amounts are generally credited as units of phantom stock at the beginning of each three-year deferral period by dividing the present value of the deferred compensation by the average fair market value of the Company's common stock at the date of award. Compensation expense related to the phantom stock awards was determined by the amortization of the value of the stock units on a straight-line basis over the applicable service period. The stock units (including dividend equivalents) vest as the Directors' services (to which the fees relate) are rendered. Vested phantom stock units are ultimately paid out in common stock on a one-unit for one-share basis. To the extent elected by a Director, stock units receive dividend equivalents in the form of additional stock units based on the dividend amount paid on the common stock. The aggregate number of phantom stock units that may be granted under the Directors' Phantom Stock Plan is 500,000. As of December 31, 2016, there were 178,515 stock units available for grant under the Directors' Phantom Stock Plan.
The following table summarizes the activity of the non-vested phantom stock units for the years ended December 31, 2016, 2015 and 2014:
2016 | 2015 | 2014 | ||||||||||||||||||
Stock Units | Weighted Average Grant Date Fair Value | Stock Units | Weighted Average Grant Date Fair Value | Stock Units | Weighted Average Grant Date Fair Value | |||||||||||||||
Balance at beginning of year | — | $ | — | 9,269 | $ | 58.35 | 17,575 | $ | 58.66 | |||||||||||
Granted | 21,088 | 80.21 | 13,351 | 78.72 | 10,747 | 65.54 | ||||||||||||||
Vested | (15,243 | ) | 79.73 | (20,162 | ) | 72.17 | (19,053 | ) | 62.69 | |||||||||||
Forfeited | — | — | (2,458 | ) | 55.62 | — | — | |||||||||||||
Balance at end of year | 5,845 | $ | 81.47 | — | $ | — | 9,269 | $ | 58.35 | |||||||||||
Employee Stock Purchase Plan ("ESPP"):
The ESPP authorizes eligible employees to purchase the Company's common stock through voluntary payroll deductions made during periodic offering periods. Under the ESPP common stock is purchased at a 15% discount from the lesser of the fair value of common stock at the beginning and end of the offering period. A maximum of 750,000 shares of common stock is available for purchase under the ESPP. The number of shares available for future purchase under the plan at December 31, 2016 was 489,138.
Compensation:
The following summarizes the compensation cost under the share and unit-based plans for the years ended December 31, 2016, 2015 and 2014:
2016 | 2015 | 2014 | |||||||||
Stock awards | $ | 20 | $ | 252 | $ | 365 | |||||
Stock units | 6,305 | 6,041 | 4,689 | ||||||||
LTIP units | 32,957 | 26,622 | 28,598 | ||||||||
Stock options | 16 | 16 | 16 | ||||||||
Phantom stock units | 1,231 | 1,444 | 1,205 | ||||||||
$ | 40,529 | $ | 34,375 | $ | 34,873 | ||||||
106
THE MACERICH COMPANY
NOTES TO CONSOLIDATED FINANCIAL STATEMENTS (Continued)
(Dollars in thousands, except per share amounts)
18. Share and Unit-Based Plans: (Continued)
The Company capitalized share and unit-based compensation costs of $7,241, $6,008 and $5,410 for the years ended December 31, 2016, 2015 and 2014, respectively.
The fair value of the stock awards and stock units that vested during the years ended December 31, 2016, 2015 and 2014 was $5,644, $8,794 and $4,685, respectively. Unrecognized compensation costs of share and unit-based plans at December 31, 2016 consisted of $2,397 from LTIP Units, $4,380 from stock units, $11 from stock options and $476 from phantom stock units.
19. Employee Benefit Plans:
401(k) Plan:
The Company has a defined contribution retirement plan that covers its eligible employees (the "Plan"). The Plan is a defined contribution retirement plan covering eligible employees of the Macerich Property Management Company, LLC and participating affiliates. The Plan is qualified in accordance with section 401(a) of the Code. Effective January 1, 1995, the Plan was amended to constitute a qualified cash or deferred arrangement under section 401(k) of the Code, whereby employees can elect to defer compensation subject to Internal Revenue Service withholding rules. This Plan was further amended effective as of February 1, 1999 to add The Macerich Company Common Stock Fund as a new investment alternative under the Plan. A total of 150,000 shares of common stock were reserved for issuance under the Plan, which was subsequently increased by an additional 500,000 shares in February 2013. On January 1, 2004, the Plan adopted the "Safe Harbor" provision under Sections 401(k)(12) and 401(m)(11) of the Code. In accordance with adopting these provisions, the Company makes matching contributions equal to 100 percent of the first three percent of compensation deferred by a participant and 50 percent of the next two percent of compensation deferred by a participant. During the years ended December 31, 2016, 2015 and 2014, these matching contributions made by the Company were $3,384, $3,299 and $3,253, respectively. Contributions and matching contributions to the Plan by the plan sponsor and/or participating affiliates are recognized as an expense of the Company in the period that they are made.
Deferred Compensation Plans:
The Company has established deferred compensation plans under which executives and key employees of the Company may elect to defer receiving a portion of their cash compensation otherwise payable in one calendar year until a later year. The Company may, as determined by the Board of Directors in its sole discretion prior to the beginning of the plan year, credit a participant's account with a matching amount equal to a percentage of the participant's deferral. The Company contributed $1,032, $933 and $845 to the plans during the years ended December 31, 2016, 2015 and 2014, respectively. Contributions are recognized as compensation in the periods they are made.
107
THE MACERICH COMPANY
NOTES TO CONSOLIDATED FINANCIAL STATEMENTS (Continued)
(Dollars in thousands, except per share amounts)
20. Income Taxes:
For income tax purposes, distributions paid to common stockholders consist of ordinary income, capital gains, unrecaptured Section 1250 gain and return of capital or a combination thereof. The following table details the components of the distributions, on a per share basis, for the years ended December 31, 2016, 2015 and 2014 are as follows:
2016 (1) | 2015 (1) | 2014 | ||||||||||||||||||
Ordinary income | $ | 0.94 | 20.8 | % | $ | 1.20 | 24.8 | % | $ | 1.92 | 76.5 | % | ||||||||
Capital gains | 3.60 | 79.2 | % | 3.64 | 75.2 | % | 0.16 | 6.4 | % | |||||||||||
Unrecaptured Section 1250 gain | — | — | % | — | — | % | 0.05 | 2.0 | % | |||||||||||
Return of capital | — | — | % | — | — | % | 0.38 | 15.1 | % | |||||||||||
Dividends paid | $ | 4.54 | 100.0 | % | $ | 4.84 | 100.0 | % | $ | 2.51 | 100.0 | % | ||||||||
_______________________________________________________________________________
(1) | During the year ended December 31, 2015, the Company paid cash dividends of $4.63 per common share. In addition, the Company declared a $2.00 special cash dividend to shareholders of record as of November 12, 2015 which was paid on January 6, 2016 (See Note 12—Stockholders' Equity). Pursuant to relevant U.S. tax rules, $0.21 per common share of this dividend is treated as having been paid by the Company on December 31, 2015, and received by each shareholder of record as of November 12, 2015 on December 31, 2015. The balance of the special cash dividend has been included in the amount of dividends paid for the year ended December 31, 2016. |
The Company has made Taxable REIT Subsidiary elections for all of its corporate subsidiaries other than its Qualified REIT Subsidiaries. The elections, effective for the year beginning January 1, 2001 and future years, were made pursuant to Section 856(l) of the Code.
The income tax provision of the TRSs for the years ended December 31, 2016, 2015 and 2014 are as follows:
2016 | 2015 | 2014 | |||||||||
Current | $ | (176 | ) | $ | — | $ | — | ||||
Deferred | (546 | ) | 3,223 | 4,269 | |||||||
Income tax (expense) benefit | $ | (722 | ) | $ | 3,223 | $ | 4,269 | ||||
The income tax provision of the TRSs for the years ended December 31, 2016, 2015 and 2014 are reconciled to the amount computed by applying the Federal Corporate tax rate as follows:
2016 | 2015 | 2014 | |||||||||
Book loss for TRSs | $ | 5,254 | $ | 10,681 | $ | 10,785 | |||||
Tax at statutory rate on earnings from continuing operations before income taxes | $ | 1,786 | $ | 3,632 | $ | 3,667 | |||||
Other | (2,508 | ) | (409 | ) | 602 | ||||||
Income tax (expense) benefit | $ | (722 | ) | $ | 3,223 | $ | 4,269 | ||||
The net operating loss carryforwards are currently scheduled to expire through 2035, beginning in 2024. Net deferred tax assets of $38,301 and $38,847 were included in deferred charges and other assets, net at December 31, 2016 and 2015, respectively.
108
THE MACERICH COMPANY
NOTES TO CONSOLIDATED FINANCIAL STATEMENTS (Continued)
(Dollars in thousands, except per share amounts)
20. Income Taxes: (Continued)
The tax effects of temporary differences and carryforwards of the TRSs included in the net deferred tax assets at December 31, 2016 and 2015 are summarized as follows:
2016 | 2015 | ||||||
Net operating loss carryforwards | $ | 22,335 | $ | 25,340 | |||
Property, primarily differences in depreciation and amortization, the tax basis of land assets and treatment of certain other costs | 12,720 | 10,600 | |||||
Other | 3,246 | 2,907 | |||||
Net deferred tax assets | $ | 38,301 | $ | 38,847 | |||
For the years ended December 31, 2016, 2015 and 2014 there were no unrecognized tax benefits.
The tax years 2012 through 2016 remain open to examination by the taxing jurisdictions to which the Company is subject. The Company does not expect that the total amount of unrecognized tax benefit will materially change within the next 12 months.
21. Quarterly Financial Data (Unaudited):
The following is a summary of quarterly results of operations for the years ended December 31, 2016 and 2015:
2016 Quarter Ended | 2015 Quarter Ended | ||||||||||||||||||||||||||||||
Dec 31 | Sep 30 | Jun 30 | Mar 31 | Dec 31 | Sep 30 | Jun 30 | Mar 31 | ||||||||||||||||||||||||
Revenues | $ | 272,000 | $ | 253,367 | $ | 259,904 | $ | 256,000 | $ | 320,758 | $ | 326,262 | $ | 322,794 | $ | 318,335 | |||||||||||||||
Net income attributable to the Company(1) | $ | 37,128 | $ | 13,730 | $ | 45,222 | $ | 420,915 | $ | 414,959 | $ | 33,597 | $ | 14,395 | $ | 24,611 | |||||||||||||||
Net income attributable to common stockholders per share-basic | $ | 0.26 | $ | 0.09 | $ | 0.31 | $ | 2.77 | $ | 2.65 | $ | 0.21 | $ | 0.09 | $ | 0.15 | |||||||||||||||
Net income attributable to common stockholders per share-diluted | $ | 0.26 | $ | 0.09 | $ | 0.31 | $ | 2.76 | $ | 2.65 | $ | 0.21 | $ | 0.09 | $ | 0.15 | |||||||||||||||
_____________________
(1) | Net income attributable to the Company for the quarter ended March 31, 2016 includes the gain on sale of assets of $101,629 from the Arrowhead Towne Center transaction (See Note 4—Investments in Unconsolidated Joint Ventures) and $340,734 from the MAC Heitman Portfolio transaction (See Note 4—Investments in Unconsolidated Joint Ventures). Net income attributable to the Company for the quarter ended December 31, 2015 includes the gain on sale of assets of $311,194 from the sale of the PPR Portfolio transaction (See Note 4—Investments in Unconsolidated Joint Ventures) and $73,726 from the sale of Panorama Mall (See Note 14—Dispositions). |
109
THE MACERICH COMPANY
NOTES TO CONSOLIDATED FINANCIAL STATEMENTS (Continued)
(Dollars in thousands, except per share amounts)
22. Subsequent Events:
On January 18, 2017, the Company sold Cascade Mall, a 589,000 square foot regional shopping center in Burlington, Washington; and Northgate Mall, a 750,000 square foot regional shopping center in San Rafael, California, in a combined transaction for $170,000. The proceeds were used to payoff the mortgage note payable on Northgate Mall, pay down the Company's line of credit and for general corporate purposes.
On February 1, 2017, the Company's joint venture in West Acres replaced the existing loan on the property with a new $80,000 loan that bears interest at an effective rate of 4.61% and matures on March 1, 2032. The Company used its share of the excess proceeds to pay down its line of credit and for general corporate purposes.
On February 2, 2017, the Company's joint venture in Kierland Commons entered into a loan commitment with a lender to replace the existing loan on the property with a new $225,000 loan that will bear interest at a fixed rate of 3.95% for ten-years. The new loan is expected to close in March 2017. The Company expects to use its share of the excess proceeds to pay down its line of credit and for general corporate purposes.
On February 9, 2017, the Company announced a dividend/distribution of $0.71 per share for common stockholders and OP Unit holders of record on February 21, 2017. All dividends/distributions will be paid 100% in cash on March 3, 2017.
On February 13, 2017, the Company announced that the Board of Directors has authorized the repurchase of up to $500,000 of its outstanding common shares as market conditions and the Company’s liquidity warrant. Repurchases may be made through open market purchases, privately negotiated transactions, structured or derivative transactions, including ASR transactions, or other methods of acquiring shares and pursuant to Rule 10b5-1 of the Securities Act of 1934, from time to time as permitted by securities laws and other legal requirements.
110
THE MACERICH COMPANY
Schedule III—Real Estate and Accumulated Depreciation
December 31, 2016
(Dollars in thousands)
Initial Cost to Company | Gross Amount at Which Carried at Close of Period | ||||||||||||||||||||||||||||||||||||||||||
Shopping Centers/Entities | Land | Building and Improvements | Equipment and Furnishings | Cost Capitalized Subsequent to Acquisition | Land | Building and Improvements | Equipment and Furnishings | Construction in Progress | Total | Accumulated Depreciation | Total Cost Net of Accumulated Depreciation | ||||||||||||||||||||||||||||||||
Cascade Mall | $ | 19,253 | $ | 9,671 | $ | — | $ | (8,495 | ) | $ | 12,728 | $ | 7,616 | $ | 85 | $ | — | $ | 20,429 | $ | 1,250 | $ | 19,179 | ||||||||||||||||||||
Chandler Fashion Center | 24,188 | 223,143 | — | 17,987 | 24,188 | 235,804 | 5,326 | — | 265,318 | 98,095 | 167,223 | ||||||||||||||||||||||||||||||||
Danbury Fair Mall | 130,367 | 316,951 | — | 105,275 | 142,751 | 402,975 | 6,682 | 185 | 552,593 | 130,195 | 422,398 | ||||||||||||||||||||||||||||||||
Desert Sky Mall | 9,447 | 37,245 | 12 | 4,364 | 9,082 | 40,869 | 1,117 | — | 51,068 | 8,534 | 42,534 | ||||||||||||||||||||||||||||||||
Eastland Mall | 22,050 | 151,605 | — | 9,944 | 22,066 | 160,374 | 1,041 | 118 | 183,599 | 23,376 | 160,223 | ||||||||||||||||||||||||||||||||
Estrella Falls | 10,550 | — | — | 69,998 | 10,747 | 13,874 | — | 55,927 | 80,548 | 231 | 80,317 | ||||||||||||||||||||||||||||||||
Fashion Outlets of Chicago | — | — | — | 259,054 | 40,575 | 215,298 | 3,020 | 161 | 259,054 | 34,610 | 224,444 | ||||||||||||||||||||||||||||||||
Fashion Outlets of Niagara Falls USA | 18,581 | 210,139 | — | 111,293 | 22,963 | 314,797 | 2,218 | 35 | 340,013 | 50,599 | 289,414 | ||||||||||||||||||||||||||||||||
The Marketplace at Flagstaff | — | — | — | 45,887 | — | 45,885 | 2 | — | 45,887 | 20,613 | 25,274 | ||||||||||||||||||||||||||||||||
Freehold Raceway Mall | 164,986 | 362,841 | — | 107,159 | 168,098 | 460,606 | 6,281 | 1 | 634,986 | 164,369 | 470,617 | ||||||||||||||||||||||||||||||||
Fresno Fashion Fair | 17,966 | 72,194 | — | 40,263 | 17,966 | 109,817 | 2,393 | 247 | 130,423 | 49,038 | 81,385 | ||||||||||||||||||||||||||||||||
Green Acres Mall | 156,640 | 321,034 | — | 161,617 | 176,464 | 442,960 | 7,850 | 12,017 | 639,291 | 57,449 | 581,842 | ||||||||||||||||||||||||||||||||
Inland Center | 8,321 | 83,550 | — | 22,217 | 8,280 | 100,189 | 23 | 5,596 | 114,088 | 7,298 | 106,790 | ||||||||||||||||||||||||||||||||
Kings Plaza Shopping Center | 209,041 | 485,548 | 20,000 | 83,783 | 198,066 | 451,167 | 26,936 | 122,203 | 798,372 | 57,537 | 740,835 | ||||||||||||||||||||||||||||||||
La Cumbre Plaza | 18,122 | 21,492 | — | 24,017 | 17,280 | 45,691 | 361 | 299 | 63,631 | 22,331 | 41,300 | ||||||||||||||||||||||||||||||||
Macerich Management Co. | 1,150 | 10,475 | 26,562 | 42,629 | 3,878 | 11,856 | 64,612 | 470 | 80,816 | 54,147 | 26,669 | ||||||||||||||||||||||||||||||||
MACWH, LP | — | 25,771 | — | 17,807 | 11,557 | 27,455 | — | 4,566 | 43,578 | 8,411 | 35,167 | ||||||||||||||||||||||||||||||||
Northgate Mall | 8,400 | 34,865 | 841 | 104,911 | 13,414 | 132,373 | 3,095 | 135 | 149,017 | 72,362 | 76,655 | ||||||||||||||||||||||||||||||||
NorthPark Mall | 7,746 | 74,661 | — | 9,852 | 7,885 | 83,894 | 480 | — | 92,259 | 14,256 | 78,003 | ||||||||||||||||||||||||||||||||
Oaks, The | 32,300 | 117,156 | — | 260,689 | 56,387 | 350,481 | 3,031 | 246 | 410,145 | 125,906 | 284,239 | ||||||||||||||||||||||||||||||||
Pacific View | 8,697 | 8,696 | — | 129,548 | 7,854 | 136,674 | 2,332 | 81 | 146,941 | 63,783 | 83,158 | ||||||||||||||||||||||||||||||||
Paradise Valley Mall | 33,445 | 128,485 | — | 35,982 | 39,382 | 155,283 | 2,416 | 831 | 197,912 | 69,249 | 128,663 | ||||||||||||||||||||||||||||||||
Promenade at Casa Grande | 15,089 | — | — | 61,137 | 5,382 | 70,779 | 65 | — | 76,226 | 38,130 | 38,096 | ||||||||||||||||||||||||||||||||
Queens Center | 251,474 | 1,039,922 | — | 17,307 | 256,786 | 1,049,545 | 2,063 | 309 | 1,308,703 | 58,875 | 1,249,828 | ||||||||||||||||||||||||||||||||
Santa Monica Place | 26,400 | 105,600 | — | 326,644 | 48,374 | 401,826 | 7,903 | 541 | 458,644 | 100,790 | 357,854 | ||||||||||||||||||||||||||||||||
SanTan Adjacent Land | 29,414 | — | — | 7,498 | 30,506 | — | — | 6,406 | 36,912 | — | 36,912 | ||||||||||||||||||||||||||||||||
SanTan Village Regional Center | 7,827 | — | — | 197,498 | 6,344 | 197,552 | 1,402 | 27 | 205,325 | 82,599 | 122,726 | ||||||||||||||||||||||||||||||||
SouthPark Mall | 7,035 | 38,215 | — | 24,628 | 7,479 | 61,668 | 408 | 323 | 69,878 | 9,371 | 60,507 | ||||||||||||||||||||||||||||||||
Southridge Center | 6,764 | — | — | 20,674 | 6,422 | 20,721 | 130 | 165 | 27,438 | 3,937 | 23,501 | ||||||||||||||||||||||||||||||||
Stonewood Center | 4,948 | 302,527 | — | 6,344 | 4,935 | 308,712 | 64 | 108 | 313,819 | 19,891 | 293,928 | ||||||||||||||||||||||||||||||||
Superstition Springs Center | 10,928 | 112,718 | — | 7,214 | 10,928 | 119,566 | 366 | — | 130,860 | 11,623 | 119,237 | ||||||||||||||||||||||||||||||||
See accompanying report of independent registered public accounting firm. | |||||||||||||||||||||||||||||||||||||||||||
THE MACERICH COMPANY
Schedule III—Real Estate and Accumulated Depreciation (Continued)
December 31, 2016
(Dollars in thousands)
Initial Cost to Company | Gross Amount at Which Carried at Close of Period | ||||||||||||||||||||||||||||||||||||||||||
Shopping Centers/Entities | Land | Building and Improvements | Equipment and Furnishings | Cost Capitalized Subsequent to Acquisition | Land | Building and Improvements | Equipment and Furnishings | Construction in Progress | Total | Accumulated Depreciation | Total Cost Net of Accumulated Depreciation | ||||||||||||||||||||||||||||||||
Superstition Springs Power Center | 1,618 | 4,420 | — | 290 | 1,618 | 4,627 | 83 | — | 6,328 | 1,739 | 4,589 | ||||||||||||||||||||||||||||||||
Tangerine (Marana), The Shops at | 36,158 | — | — | (8,852 | ) | 16,922 | — | — | 10,384 | 27,306 | — | 27,306 | |||||||||||||||||||||||||||||||
The Macerich Partnership, L.P. | — | 2,534 | — | 26,237 | — | 5 | 10,823 | 17,943 | 28,771 | 2,126 | 26,645 | ||||||||||||||||||||||||||||||||
Towne Mall | 6,652 | 31,184 | — | 4,587 | 6,877 | 35,011 | 506 | 29 | 42,423 | 13,960 | 28,463 | ||||||||||||||||||||||||||||||||
Tucson La Encantada | 12,800 | 19,699 | — | 55,372 | 12,800 | 74,492 | 558 | 21 | 87,871 | 40,241 | 47,630 | ||||||||||||||||||||||||||||||||
Valley Mall | 16,045 | 26,098 | — | 12,048 | 15,616 | 37,359 | 364 | 852 | 54,191 | 6,203 | 47,988 | ||||||||||||||||||||||||||||||||
Valley River Center | 24,854 | 147,715 | — | 22,820 | 24,854 | 168,547 | 1,969 | 19 | 195,389 | 54,723 | 140,666 | ||||||||||||||||||||||||||||||||
Victor Valley, Mall of | 15,700 | 75,230 | — | 52,659 | 20,080 | 121,458 | 2,051 | — | 143,589 | 44,179 | 99,410 | ||||||||||||||||||||||||||||||||
Vintage Faire Mall | 14,902 | 60,532 | — | 57,668 | 17,647 | 113,955 | 1,435 | 65 | 133,102 | 66,308 | 66,794 | ||||||||||||||||||||||||||||||||
Westside Pavilion | 34,100 | 136,819 | — | 72,966 | 34,100 | 201,441 | 5,827 | 2,517 | 243,885 | 100,870 | 143,015 | ||||||||||||||||||||||||||||||||
Wilton Mall | 19,743 | 67,855 | — | 26,198 | 19,810 | 92,834 | 1,152 | — | 113,796 | 32,064 | 81,732 | ||||||||||||||||||||||||||||||||
500 North Michigan Avenue | 12,851 | 55,358 | — | 9,313 | 10,991 | 51,370 | 205 | 14,956 | 77,522 | 9,699 | 67,823 | ||||||||||||||||||||||||||||||||
Other freestanding stores | 5,926 | 43,180 | — | 10,153 | 5,926 | 52,972 | 361 | — | 59,259 | 19,177 | 40,082 | ||||||||||||||||||||||||||||||||
Other land and development properties | 33,795 | — | — | 34,211 | 31,582 | 4,241 | — | 32,183 | 68,006 | 1,757 | 66,249 | ||||||||||||||||||||||||||||||||
$ | 1,496,273 | $ | 4,965,128 | $ | 47,415 | $ | 2,700,395 | $ | 1,607,590 | $ | 7,134,619 | $ | 177,036 | $ | 289,966 | $ | 9,209,211 | $ | 1,851,901 | $ | 7,357,310 | ||||||||||||||||||||||
See accompanying report of independent registered public accounting firm.
THE MACERICH COMPANY
Schedule III—Real Estate and Accumulated Depreciation (Continued)
December 31, 2016
(Dollars in thousands)
Depreciation of the Company's investment in buildings and improvements reflected in the consolidated statements of operations are calculated over the estimated useful lives of the asset as follows:
Buildings and improvements | 5 - 40 years |
Tenant improvements | 5 - 7 years |
Equipment and furnishings | 5 - 7 years |
The changes in total real estate assets for the three years ended December 31, 2016 are as follows:
2016 | 2015 | 2014 | |||||||||
Balances, beginning of year | $ | 10,689,656 | $ | 12,777,882 | $ | 9,181,338 | |||||
Additions | 254,604 | 392,575 | 4,042,409 | ||||||||
Dispositions and retirements | (1,735,049 | ) | (2,480,801 | ) | (445,865 | ) | |||||
Balances, end of year | $ | 9,209,211 | $ | 10,689,656 | $ | 12,777,882 | |||||
The aggregate gross cost of the property included in the table above for federal income tax purposes was $6,079,675 (unaudited) at December 31, 2016.
The changes in accumulated depreciation for the three years ended December 31, 2016 are as follows:
2016 | 2015 | 2014 | |||||||||
Balances, beginning of year | $ | 1,892,744 | $ | 1,709,992 | $ | 1,559,572 | |||||
Additions | 277,270 | 354,977 | 289,178 | ||||||||
Dispositions and retirements | (318,113 | ) | (172,225 | ) | (138,758 | ) | |||||
Balances, end of year | $ | 1,851,901 | $ | 1,892,744 | $ | 1,709,992 | |||||
See accompanying report of independent registered public accounting firm.
113
SIGNATURES
Pursuant to the requirements of Section 13 or 15(d) of the Securities Exchange Act of 1934, the registrant has duly caused this report to be signed on its behalf by the undersigned, thereunto duly authorized, on February 24, 2017.
THE MACERICH COMPANY | |||
/s/ ARTHUR M. COPPOLA | |||
By | |||
Arthur M. Coppola | |||
Chairman and Chief Executive Officer | |||
114
Pursuant to the requirements of the Securities Exchange Act of 1934, this report has been signed below by the following persons on behalf of the registrant and in the capacities and on the dates indicated.
Signature | Capacity | Date | ||
/s/ ARTHUR M. COPPOLA | Chairman and Chief Executive Officer and Director | February 24, 2017 | ||
Arthur M. Coppola | (Principal Executive Officer) | |||
/s/ EDWARD C. COPPOLA | President and Director | February 24, 2017 | ||
Edward C. Coppola | ||||
/s/ JOHN H. ALSCHULER | Director | February 24, 2017 | ||
John H. Alschuler | ||||
/s/ STEVEN R. HASH | Director | February 24, 2017 | ||
Steven R. Hash | ||||
/s/ FREDERICK S. HUBBELL | Director | February 24, 2017 | ||
Frederick S. Hubbell | ||||
/s/ DIANA M. LAING | Director | February 24, 2017 | ||
Diana M. Laing | ||||
/s/ MASON G. ROSS | Director | February 24, 2017 | ||
Mason G. Ross | ||||
/s/ STEVEN L. SOBOROFF | Director | February 24, 2017 | ||
Steven L. Soboroff | ||||
/s/ ANDREA M. STEPHEN | Director | February 24, 2017 | ||
Andrea M. Stephen | ||||
/s/ JOHN M. SULLIVAN | Director | February 24, 2017 | ||
John M. Sullivan | ||||
/s/ THOMAS E. O'HERN | Senior Executive Vice President, Treasurer and Chief Financial and Accounting Officer (Principal Financial and Accounting Officer) | February 24, 2017 | ||
Thomas E. O'Hern | ||||
115
EXHIBIT INDEX
Exhibit Number | Description | ||
2.1 | Master Agreement, dated November 14, 2014, by and among Pacific Premier Retail LLC, MACPT LLC, Macerich PPR GP LLC, Queens JV LP, Macerich Queens JV LP, Queens JV GP LLC, 1700480 Ontario Inc. and the Company (incorporated by reference as an exhibit to the Company’s Current Report on Form 8-K, event date November 14, 2014). | ||
3.1 | Articles of Amendment and Restatement of the Company (incorporated by reference as an exhibit to the Company's Registration Statement on Form S-11, as amended (No. 33-68964)). | ||
3.1.1 | Articles Supplementary of the Company (incorporated by reference as an exhibit to the Company's Current Report on Form 8-K, event date May 30, 1995). | ||
3.1.2 | Articles Supplementary of the Company (with respect to the first paragraph) (incorporated by reference as an exhibit to the Company's 1998 Form 10-K). | ||
3.1.3 | Articles Supplementary of the Company (Series D Preferred Stock) (incorporated by reference as an exhibit to the Company's Current Report on Form 8-K, event date July 26, 2002). | ||
3.1.4 | Articles Supplementary of the Company (incorporated by reference as an exhibit to the Company's Registration Statement on Form S-3, as amended (No. 333-88718)). | ||
3.1.5 | Articles of Amendment of the Company (declassification of Board) (incorporated by reference as an exhibit to the Company's 2008 Form 10-K). | ||
3.1.6 | Articles Supplementary of the Company (incorporated by reference as an exhibit to the Company's Current Report on Form 8-K, event date February 5, 2009). | ||
3.1.7 | Articles of Amendment of the Company (increased authorized shares) (incorporated by reference as an exhibit to the Company's Quarterly Report on Form 10-Q for the quarter ended June 30, 2009). | ||
3.1.8 | Articles of Amendment of the Company (to eliminate the supermajority vote requirement to amend the charter and to clarify a reference in Article NINTH) (incorporated by reference as an exhibit to the Company’s Current Report on Form 8-K, event date May 30, 2014). | ||
3.1.9 | Articles Supplementary (election to be subject to Section 3-803 of the Maryland General Corporation Law) (incorporated by reference as an exhibit to the Company's Current Report on Form 8-K, event date March 17, 2015). | ||
3.1.10 | Articles Supplementary (designation of Series E Preferred Stock) (incorporated by reference as an exhibit to the Company's Current Report on Form 8-K, event date March 18, 2015). | ||
3.1.11 | Articles Supplementary (reclassification of Series E Preferred Stock to preferred stock) (incorporated by reference as an exhibit to the Company's Current Report on Form 8-K, event date May 7, 2015). | ||
3.1.12 | Articles Supplementary (repeal of election to be subject to Section 3-803 of the Maryland General Corporation Law (incorporated by reference as an exhibit to the Company's Current Report on Form 8-K, event date May 28, 2015). | ||
3.2 | Amended and Restated Bylaws of the Company (incorporated by reference as an exhibit to the Company's Current Report on Form 8-K, event date April 21, 2016). | ||
116
Exhibit Number | Description | ||
4.1 | Form of Common Stock Certificate (incorporated by reference as an exhibit to the Company's Current Report on Form 8-K, as amended, event date November 10, 1998). | ||
4.2 | Form of Preferred Stock Certificate (Series D Preferred Stock) (incorporated by reference as an exhibit to the Company's Registration Statement on Form S-3 (No. 333-107063)). | ||
10.1 | Amended and Restated Limited Partnership Agreement for the Operating Partnership dated as of March 16, 1994 (incorporated by reference as an exhibit to the Company's 1996 Form 10-K). | ||
10.1.1 | Amendment to Amended and Restated Limited Partnership Agreement for the Operating Partnership dated June 27, 1997 (incorporated by reference as an exhibit to the Company's Current Report on Form 8-K, event date June 20, 1997). | ||
10.1.2 | Amendment to Amended and Restated Limited Partnership Agreement for the Operating Partnership dated November 16, 1997 (incorporated by reference as an exhibit to the Company's 1997 Form 10-K). | ||
10.1.3 | Fourth Amendment to Amended and Restated Limited Partnership Agreement for the Operating Partnership dated February 25, 1998 (incorporated by reference as an exhibit to the Company's 1997 Form 10-K). | ||
10.1.4 | Fifth Amendment to Amended and Restated Limited Partnership Agreement for the Operating Partnership dated February 26, 1998 (incorporated by reference as an exhibit to the Company's 1997 Form 10-K). | ||
10.1.5 | Sixth Amendment to Amended and Restated Limited Partnership Agreement for the Operating Partnership dated June 17, 1998 (incorporated by reference as an exhibit to the Company's 1998 Form 10-K). | ||
10.1.6 | Seventh Amendment to Amended and Restated Limited Partnership Agreement for the Operating Partnership dated December 23, 1998 (incorporated by reference as an exhibit to the Company's 1998 Form 10-K). | ||
10.1.7 | Eighth Amendment to Amended and Restated Limited Partnership Agreement for the Operating Partnership dated November 9, 2000 (incorporated by reference as an exhibit to the Company's 2000 Form 10-K). | ||
10.1.8 | Ninth Amendment to Amended and Restated Limited Partnership Agreement for the Operating Partnership dated July 26, 2002 (incorporated by reference as an exhibit to the Company's Current Report on Form 8-K event date July 26, 2002). | ||
10.1.9 | Tenth Amendment to Amended and Restated Limited Partnership Agreement for the Operating Partnership dated October 26, 2006 (incorporated by reference as an exhibit to the Company's 2006 Form 10-K). | ||
10.1.10 | Eleventh Amendment to Amended and Restated Limited Partnership Agreement for the Operating Partnership dated as of March 16, 2007 (incorporated by reference as an exhibit to the Company's Current Report on Form 8-K, event date March 16, 2007). | ||
10.1.11 | Twelfth Amendment to the Amended and Restated Limited Partnership Agreement of the Operating Partnership dated as of April 30, 2009 (incorporated by reference as an exhibit to the Company's Quarterly Report on Form 10-Q for the quarter ended June 30, 2009). | ||
10.1.12 | Thirteenth Amendment to the Amended and Restated Limited Partnership Agreement of the Operating Partnership dated as of October 29, 2009 (incorporated by reference as an exhibit to the Company's 2009 Form 10-K). | ||
10.1.13 | Form of Fourteenth Amendment to Amended and Restated Limited Partnership Agreement for the Operating Partnership (incorporated by reference as an exhibit to the Company's Current Report on Form 8-K, event date April 25, 2005). | ||
117
Exhibit Number | Description | ||
10.2 | * | Amended and Restated Deferred Compensation Plan for Executives (2003) (incorporated by reference as an exhibit to the Company's 2003 Form 10-K). | |
10.2.1 | * | Amendment Number 1 to Amended and Restated Deferred Compensation Plan for Executives (October 30, 2008) (incorporated by reference as an exhibit to the Company's 2008 Form 10-K). | |
10.2.2 | * | Amendment Number 2 to Amended and Restated Deferred Compensation Plan for Executives (May 1, 2011) (incorporated by reference as an exhibit to the Company's Quarterly Report on Form 10-Q for the quarter ended June 30, 2011). | |
10.2.3 | * | Amendment Number 3 to Amended and Restated Deferred Compensation Plan for Executives (September 27, 2012) (incorporated by reference as an exhibit to the Company's Quarterly Report on Form 10-Q for the quarter ended September 30, 2012). | |
10.3 | * | Amended and Restated Deferred Compensation Plan for Senior Executives (2003) (incorporated by reference as an exhibit to the Company's 2003 Form 10-K). | |
10.3.1 | * | Amendment Number 1 to Amended and Restated Deferred Compensation Plan for Senior Executives (October 30, 2008) (incorporated by reference as an exhibit to the Company's 2008 Form 10-K). | |
10.3.2 | * | Amendment Number 2 to Amended and Restated Deferred Compensation Plan for Senior Executives (May 1, 2011) (incorporated by reference as an exhibit to the Company's Quarterly Report on Form 10‑Q for the quarter ended June 30, 2011). | |
10.3.3 | * | Amendment Number 3 to Amended and Restated Deferred Compensation Plan for Senior Executives (September 27, 2012) (incorporated by reference as an exhibit to the Company's Quarterly Report on Form 10-Q for the quarter ended September 30, 2012). | |
10.4 | * | Eligible Directors' Deferred Compensation/Phantom Stock Plan (as amended and restated as of January 1, 2013) (incorporated by reference as an exhibit to the Company's Quarterly Report on Form 10-Q for the quarter ended June 30, 2013). | |
10.5 | * | Amended and Restated 2013 Deferred Compensation Plan for Executives effective (January 1, 2016). | |
10.6 | Deferred Compensation Plan Rabbi Trust between the Company and Wilmington Trust, National Association, effective as of October 1, 2012 (incorporated by reference as an exhibit to the Company's Quarterly Report on Form 10-Q for the quarter ended September 30, 2012). | ||
10.7 | Registration Rights Agreement, dated as of March 16, 1994, among the Company and Mace Siegel, Dana K. Anderson, Arthur M. Coppola and Edward C. Coppola (incorporated by reference as an exhibit to the Company's 1996 Form 10-K). | ||
10.8 | Registration Rights Agreement, dated as of March 16, 1994, between the Company and The Northwestern Mutual Life Insurance Company (incorporated by reference as an exhibit to the Company’s 1996 Form 10-K). | ||
10.9 | Registration Rights Agreement dated as of December 18, 2003 by the Operating Partnership, the Company and Taubman Realty Group Limited Partnership (Registration rights assigned by Taubman to three assignees) (incorporated by reference as an exhibit to the Company's 2003 Form 10-K). | ||
10.1 | Incidental Registration Rights Agreement dated March 16, 1994 (incorporated by reference as an exhibit to the Company's 1996 Form 10-K). | ||
118
Exhibit Number | Description | ||
10.11 | Incidental Registration Rights Agreement dated as of July 21, 1994 (incorporated by reference as an exhibit to the Company's 1997 Form 10-K). | ||
10.12 | Incidental Registration Rights Agreement dated as of August 15, 1995 (incorporated by reference as an exhibit to the Company's 1997 Form 10-K). | ||
10.13 | Incidental Registration Rights Agreement dated as of December 21, 1995 (incorporated by reference as an exhibit to the Company's 1997 Form 10-K). | ||
10.14 | List of Omitted Incidental/Demand Registration Rights Agreements (incorporated by reference as an exhibit to the Company's 1997 Form 10-K). | ||
10.15 | Redemption, Registration Rights and Lock-Up Agreement dated as of July 24, 1998 between the Company and Harry S. Newman, Jr. and LeRoy H. Brettin (incorporated by reference as an exhibit to the Company's 1998 Form 10-K). | ||
10.16 | Form of Indemnification Agreement between the Company and its executive officers and directors (incorporated by reference as an exhibit to the Company's 2008 Form 10-K). | ||
10.17 | Form of Registration Rights Agreement with Series D Preferred Unit Holders (incorporated by reference as an exhibit to the Company's Current Report on Form 8-K, event date July 26, 2002). | ||
10.17.1 | List of Omitted Registration Rights Agreements (incorporated by reference as an exhibit to the Company's Current Report on Form 8-K, event date July 26, 2002). | ||
10.18 | Registration Rights Agreement between the Company and 1700480 Ontario Inc. dated as of November 14, 2014 (incorporated by reference as an exhibit to the Company’s Current Report on Form 8-K, event date November 14, 2014). | ||
10.19 | Second Amended and Restated Credit Agreement, dated as of July 6, 2016, by and among the Company, The Macerich Partnership, L.P., Deutsche Bank AG New York Branch, as administrative agent; Deutsche Bank Securities Inc., JPMorgan Chase Bank, N.A., Wells Fargo Securities, LLC, Goldman Sachs Bank USA and U.S.Bank National Association, as joint lead arrangers and joint bookrunning managers; JPMorgan Chase Bank, N.A., Wells Fargo Bank, National Association, Goldman Sachs Bank USA and U.S.Bank National Association, N.A. as co-syndication agents, PNC Bank, National Association, as documentation agent, and various lenders party thereto (incorporated by reference as an exhibit to the Company's Current Report on Form 8-K, event date July 6, 2016). | ||
10.20 | Guaranty, dated as of July 6, 2016, by the Company in favor of Deutsche Bank AG New York Branch, as administrative agent (incorporated by reference as an exhibit to the Company's Current Report on Form 8-K, event date July 6, 2016). | ||
10.21 | Tax Matters Agreement (Wilmorite) (incorporated by reference as an exhibit to the Company's Current Report on Form 8-K, event date April 25, 2005). | ||
10.22 | * | 2003 Equity Incentive Plan, as amended and restated as of May 26, 2016 (incorporated by reference as an exhibit to the Company's Current Report on Form 8-K, event date May 26, 2016). | |
10.22.1 | * | Amended and Restated Cash Bonus/Restricted Stock/Stock Unit and LTIP Unit Award Program under the 2003 Equity Incentive Plan (incorporated by reference as an exhibit to the Company's 2010 Form 10-K). | |
10.22.2 | * | Form of Restricted Stock Award Agreement under 2003 Equity Incentive Plan (incorporated by reference as an exhibit to the Company's 2008 Form 10-K). | |
119
Exhibit Number | Description | ||
10.22.3 | * | Form of Stock Unit Award Agreement under 2003 Equity Incentive Plan (incorporated by reference as an exhibit to the Company's 2014 Form 10-K). | |
10.22.4 | * | Form of Employee Stock Option Agreement under 2003 Equity Incentive Plan (incorporated by reference as an exhibit to the Company's 2008 Form 10-K). | |
10.22.5 | * | Form of Non-Qualified Stock Option Grant under 2003 Equity Incentive Plan (incorporated by reference as an exhibit to the Company's 2008 Form 10-K). | |
10.22.6 | * | Form of Restricted Stock Award Agreement for Non-Management Directors (incorporated by reference as an exhibit to the Company's 2008 Form 10-K). | |
10.22.7 | * | Form of Stock Unit Award Agreement under 2003 Equity Incentive Plan for Non-Employee Directors (incorporated by reference as an exhibit to the Company's 2015 Form 10-K). | |
10.22.8 | * | Form of Stock Appreciation Right under 2003 Equity Incentive Plan (incorporated by reference as an exhibit to the Company's 2008 Form 10-K). | |
10.22.9 | * | Form of LTIP Unit Award Agreement under 2003 Equity Incentive Plan (service-based) (incorporated by reference as an exhibit to the Company’s Quarterly Report on Form 10-Q for the quarter ended March 31, 2016). | |
10.22.10 | * | Form of LTIP Unit Award Agreement under 2003 Equity Incentive Plan (performance-based) (incorporated by reference as an exhibit to the Company’s Quarterly Report on Form 10-Q for the quarter ended March 31, 2016). | |
10.22.11 | * | Form of LTIP Unit Award Agreement under 2003 Equity Incentive Plan (fully-vested) (incorporated by reference as an exhibit to the Company’s Quarterly Report on Form 10-Q for the quarter ended March 31, 2014). | |
10.23 | * | Amendment and Restatement of the Employee Stock Purchase Plan (as amended and restated as of June 1, 2013) (incorporated by reference as an exhibit to the Company's Quarterly Report on Form 10-Q for the quarter ended June 30, 2013). | |
10.24.1 | * | First Amendment to Amended and Restated Employee Stock Purchase Plan (October 23, 2014) (incorporated by reference as an exhibit to the Company’s Quarterly Report on Form 10-Q for the quarter ended September 30, 2014). | |
10.25 | * | Management Continuity Agreement between the Company and Thomas J. Leanse, effective January 1, 2013 (incorporated by reference as an exhibit to the Company's Quarterly Report on Form 10-Q for the quarter ended September 30, 2012). | |
10.26 | 2005 Amended and Restated Agreement of Limited Partnership of MACWH, LP dated as of April 25, 2005 (incorporated by reference as an exhibit to the Company's Current Report on Form 8-K, event date April 25, 2005). | ||
10.27 | Registration Rights Agreement dated as of April 25, 2005 among the Company and the persons names on Exhibit A thereto (incorporated by reference as an exhibit to the Company's Current Report on Form 8-K, event date April 25, 2005). | ||
21.1 | List of Subsidiaries | ||
23.1 | Consent of Independent Registered Public Accounting Firm (KPMG LLP) | ||
31.1 | Section 302 Certification of Arthur Coppola, Chief Executive Officer | ||
120
Exhibit Number | Description | ||
31.2 | Section 302 Certification of Thomas O'Hern, Chief Financial Officer | ||
32.1 | ** | Section 906 Certifications of Arthur Coppola and Thomas O'Hern | |
101.INS | XBRL Instance Document | ||
101.SCH | XBRL Taxonomy Extension Schema Document | ||
101.CAL | XBRL Taxonomy Extension Calculation Linkbase Document | ||
101.LAB | XBRL Taxonomy Extension Label Linkbase Document | ||
101.PRE | XBRL Taxonomy Extension Presentation Linkbase Document | ||
101.DEF | XBRL Taxonomy Extension Definition Linkbase Document | ||
* Represents a management contract, or compensatory plan, contract or arrangement required to be filed pursuant to Regulation S-K.
** Furnished herewith.
121