Attached files
UNITED STATES SECURITIES AND EXCHANGE COMMISSION
Washington, D.C. 20549
Form 10-K
x | ANNUAL REPORT PURSUANT TO SECTION 13 or 15(d) OF THE SECURITIES EXCHANGE ACT OF 1934 |
For the fiscal year ended December 31, 2016 | |
or | |
o | TRANSITION REPORT PURSUANT TO SECTION 13 or 15(d) OF THE SECURITIES EXCHANGE ACT OF 1934 |
For the transition period from________to | |
Commission file number 001-34963
LPL Financial Holdings Inc.
(Exact name of registrant as specified in its charter)
Delaware | 20-3717839 |
(State or other jurisdiction of incorporation or organization) | (I.R.S. Employer Identification No.) |
75 State Street, Boston, MA 02109
(Address of principal executive offices; including zip code)
800-877-7210
(Registrant’s telephone number, including area code)
Securities registered pursuant to Section 12(b) of the Act:
Title of Each Class | Name of Each Exchange on Which Registered |
Common Stock — $0.001 par value per share | NASDAQ Global Select Market |
Securities registered pursuant to Section 12(g) of the Act:
None
Indicate by check mark if the registrant is a well-known seasoned issuer, as defined in Rule 405 of the Securities Act. Yes x No o
Indicate by check mark if the registrant is not required to file reports pursuant to Section 13 or 15(d) of the Exchange Act. Yes o No x
Indicate by check mark whether the registrant (1) has filed all reports required to be filed by Section 13 or 15(d) of the Securities Exchange Act of 1934 during the preceding 12 months (or for such shorter period that the registrant was required to file such reports), and (2) has been subject to such filing requirements for the past 90 days. Yes x No o
Indicate by check mark whether the registrant has submitted electronically and posted on its corporate web site, if any, every Interactive Data File required to be submitted and posted pursuant to Rule 405 of Regulation S-T (§ 232.405 of this chapter) during the preceding 12 months (or for such shorter period that the registrant was required to submit and post such files). Yes x No o
Indicate by check mark if disclosure of delinquent filers pursuant to Item 405 of Regulation S-K (§ 229.405 of this chapter) is not contained herein, and will not be contained, to the best of registrant’s knowledge, in definitive proxy or information statements incorporated by reference in Part III of this Form 10-K or any amendment to this Form 10-K. o
Indicate by check mark whether the registrant is a large accelerated filer, an accelerated filer, a non-accelerated filer, or a smaller reporting company. See the definitions of “large accelerated filer,” “accelerated filer” and “smaller reporting company” in Rule 12b-2 of the Exchange Act. (Check one):
Large accelerated filer x | Accelerated filer o | Non-accelerated filer o | Smaller reporting company o |
(Do not check if a smaller reporting company) | |||
Indicate by check mark whether the registrant is a shell company (as defined in Rule 12b-2 of the Act). Yes o No x
As of June 30, 2016, the aggregate market value of the voting stock held by non-affiliates of the registrant was $1.8 billion. For purposes of this information, the outstanding shares of Common Stock owned by directors and executive officers of the registrant were deemed to be shares of the voting stock held by affiliates.
The number of shares of common stock, par value $0.001 per share, outstanding as of February 17, 2017 was 90,070,194.
DOCUMENTS INCORPORATED BY REFERENCE
Portions of the definitive Proxy Statement to be delivered to stockholders in connection with the Annual Meeting of Stockholders are incorporated by reference into Part III.
TABLE OF CONTENTS
Page | ||
i
WHERE YOU CAN FIND MORE INFORMATION
We file annual, quarterly, and current reports, proxy statements, and other information required by the Securities Exchange Act of 1934, as amended (“Exchange Act”), with the Securities and Exchange Commission ("SEC"). You may read and copy any document we file with the SEC at the SEC’s public reference room located at 100 F Street, N.E., Washington, D.C. 20549, U.S.A. Please call the SEC at 1-800-SEC-0330 for further information on the public reference room. Our SEC filings are also available to the public from the SEC’s internet site at http://www.sec.gov.
On our internet site, http://www.lpl.com, we post the following filings as soon as reasonably practicable after they are electronically filed with or furnished to the SEC: our annual reports on Form 10-K, our proxy statements, our quarterly reports on Form 10-Q, our current reports on Form 8-K, and any amendments to those reports filed or furnished pursuant to Section 13(a) or 15(d) of the Exchange Act. Hard copies of all such filings are available free of charge by request via email (investor.relations@lpl.com), telephone (800) 877-7210, or mail (LPL Financial Investor Relations at 75 State Street, 22nd Floor, Boston, MA 02109). The information contained or incorporated on our website is not a part of this Annual Report on Form 10-K.
When we use the terms “LPLFH”, "LPL", "LPL Financial", “we”, “us”, “our”, and the “Company” we mean LPL Financial Holdings Inc., a Delaware corporation, and its consolidated subsidiaries, taken as a whole, unless the context otherwise indicates.
SPECIAL NOTE REGARDING FORWARD-LOOKING STATEMENTS
Statements in Item 7 - “Management's Discussion and Analysis of Financial Condition and Results of Operations” and other sections of this Annual Report on Form 10-K regarding the Company's future financial and operating results, outlook, growth, plans, business strategies, liquidity, future indebtedness, future share repurchases, and future dividends, including statements regarding future resolution of regulatory matters, legal proceedings, and related costs, future revenue and expenses, and projected savings and anticipated improvements to the Company's operating model, services, and technologies as a result of its initiatives and programs, as well as any other statements that are not related to present facts or current conditions or that are not purely historical, constitute forward-looking statements. These forward-looking statements are based on the Company's historical performance and its plans, estimates, and expectations as of February 24, 2017. The words “anticipates,” “believes,” “expects,” “may,” “plans,” “predicts,” “will,” and similar expressions are intended to identify forward-looking statements, although not all forward-looking statements contain these identifying words. Forward-looking statements are not guarantees that the future results, plans, intentions, or expectations expressed or implied by the Company will be achieved. Matters subject to forward-looking statements involve known and unknown risks and uncertainties, including economic, legislative, regulatory, competitive, and other factors, which may cause actual financial or operating results, levels of activity, or the timing of events, to be materially different than those expressed or implied by forward-looking statements. Important factors that could cause or contribute to such differences include: changes in general economic and financial market conditions, including retail investor sentiment; fluctuations in the value of brokerage and advisory assets; fluctuations in levels of net new assets and the related impact on revenue; fluctuations in the number of retail investors served by the Company; effects of competition in the financial services industry; changes in the number of the Company's financial advisors and institutions, and their ability to market effectively financial products and services; the success of the Company in attracting and retaining financial advisors and institutions; changes in interest rates and fees payable by banks participating in the Company's cash sweep program, including the Company's success in negotiating agreements with current or additional counterparties; the Company's strategy in managing cash sweep program fees; changes in the growth and profitability of the Company’s fee-based business; the effect of current, pending, and future legislation, regulation, and regulatory actions, including the United States Department of Labor ("DOL") final rule on conflicts of interest (Definition of the Term "Fiduciary"; Conflict of Interest Rule—Retirement Investment Advice, the "DOL Rule"), which becomes applicable on April 10, 2017, unless otherwise delayed or changed, and disciplinary actions imposed by federal and state regulators and self-regulatory organizations; the costs of settling and remediating issues related to pending or future regulatory matters or legal proceedings; changes made to the Company's offerings and services in response to current, pending, and future legislation, regulation, and regulatory actions, including the DOL Rule, and the effect that such changes may have on the Company's gross profit streams and costs; execution of the Company's capital management plans, including its compliance with the terms of its credit agreement; the price, the availability of shares, and trading volumes of the Company's common stock, which will affect the timing and size of future share repurchases by the Company; execution of the Company's plans and its success in realizing the expense savings and service improvements and efficiencies expected to result from its initiatives and programs, particularly its expense plans and technological initiatives; the Company's success in
ii
negotiating and developing commercial arrangements with third-party service providers; the performance of third-party service providers to which business processes are transitioned from the Company; the Company's ability to control operating risks, information technology systems risks, cybersecurity risks, and sourcing risks; and the other factors set forth in Part I, Item 1A - “Risk Factors”. Except as required by law, the Company specifically disclaims any obligation to update any forward-looking statements as a result of developments occurring after the date of this annual report, even if its estimates change, and you should not rely on statements contained herein as representing the Company's views as of any date subsequent to the date of this annual report.
iii
PART I
Item 1. Business
General Corporate Overview
We are a leader in the retail financial advice market, the nation's largest independent broker-dealer (based on total revenues, Financial Planning magazine June 1996-2016), a top custodian for registered investment advisors ("RIAs"), and a leading independent consultant to retirement plans. We provide an integrated platform of brokerage and investment advisory services to more than 14,000 independent financial advisors (our "advisors"), including financial advisors at more than 700 financial institutions across the country, enabling them to provide their retail investors ("clients") with objective financial advice through a lower conflict model. We also support approximately 4,000 financial advisors who are affiliated and licensed with insurance companies that use our customized clearing, advisory platforms, and technology solutions.
Through our advisors, we are one of the largest distributors of financial products and services in the United States, and we believe we are one of the top five firms in the United States, ranked by number of advisors.
We believe that objective financial guidance is a fundamental need for everyone. We enable our advisors to focus on what they do best—create the personal, long-term relationships that are the foundation for turning life’s aspirations into financial realities. We do that through a singular focus on providing our advisors with the front-, middle-, and back-office support they need to serve the large and growing market for independent investment advice. We believe that LPL Financial is the only company that offers advisors the unique combination of an integrated technology platform, comprehensive self-clearing services, and open architecture access to a wide range of non-proprietary products, all delivered in an environment unencumbered by conflicts from product manufacturing, underwriting, and market-making.
We believe investors achieve better outcomes when working with a financial advisor. LPL strives to make it easy for advisors to do what is best for their clients, while protecting advisors and investors and promoting independence and choice through access to a wide range of diligently evaluated non-proprietary products.
We began operations through LPL Financial LLC, our broker-dealer subsidiary, in 1989. LPL Financial Holdings Inc., which is the parent company of our collective businesses, was incorporated in Delaware in 2005. LPL Financial LLC is a clearing broker-dealer and an investment advisor that primarily transacts business as an agent for our advisors on behalf of their clients by providing access to a broad array of financial products and services. Fortigent Holdings Company, Inc. and its subsidiaries (“Fortigent”) provides solutions and consulting services to registered investment advisors, banks, and trust companies serving high-net-worth clients. Through our subsidiary The Private Trust Company, N.A. ("PTC"), we offer trust administration, investment management oversight, and Individual Retirement Account ("IRA") custodial services for estates and families. Our subsidiary, LPL Insurance Associates, Inc. ("LPLIA"), operates as a brokerage general agency that offers life, long-term care, and disability insurance sales and services.
Our Business
Our Advisor Relationships
Our business is dedicated exclusively to our advisors; we are not a market-maker nor do we offer investment banking or underwriting services. We offer no proprietary products of our own. Because we do not offer proprietary products, we enable the independent financial advisors, banks, and credit unions that we support to offer their clients lower-conflict advice.
We work alongside advisors to navigate complex market and regulatory environments and strive to empower them to create the best outcomes for investors. In addition, we make meaningful investments in technology and services to support the growth, productivity, and efficiency of advisors across a broad spectrum of business models as their practices evolve. Our advisors are a community of diverse, entrepreneurial financial services professionals. They build long-term relationships with their clients in communities across the United States by guiding them through the complexities of investment decisions, retirement solutions, financial planning, and wealth-management. Our advisors support approximately 4.7 million client accounts. Our services are designed to support the evolution of our advisors’ businesses over time and to adapt as our advisors' needs change.
We believe we offer a compelling economic value proposition to independent advisors, which is a key factor in our ability to attract and retain advisors and their practices. The independent channels pay advisors a greater share of brokerage commissions and advisory fees than the captive channels — generally 80-90% compared to
1
30-50%. Through our scale and operating efficiencies, we are able to offer our advisors what we believe to be the highest average payout ratios among the five largest United States broker-dealers, ranked by number of advisors.
Furthermore, we believe that our technology and service platforms enable our advisors to operate their practices with a greater focus on serving investors while generating revenue opportunities and at a lower cost than other independent advisors. As a result, we believe that our advisors who own practices earn more pre-tax profit than practice owners affiliated with other independent brokerage firms. Finally, as business owners, our independent financial advisors, unlike captive advisors, also have the opportunity to build equity in their own businesses.
Our advisors average over 15 years of industry experience, which allows us to focus on supporting and enhancing our advisors’ businesses without needing to provide basic training or subsidizing advisors who are new to the industry. Our flexible business platform allows our advisors to choose the most appropriate business model to support their clients, whether they conduct brokerage business, offer brokerage and fee-based services on our corporate RIA platforms, or provide fee-based services through their own RIA practices.
The majority of our advisors are entrepreneurial independent contractors who are primarily located in rural and suburban areas and, as such, are viewed as local providers of independent advice. Many of our advisors operate under their own business name, and we may assist these advisors with their own branding, marketing and promotion, and regulatory review.
Advisors licensed with LPL Financial as registered representatives and as investment advisory representatives are able to conduct both commission-based business on our brokerage platform and fee-based business on our corporate RIA platform. In order to be licensed with LPL Financial, advisors must be approved through our assessment process, which includes a review of each advisor’s education, experience, and credit and compliance history. Approved advisors become registered with LPL Financial and enter into a representative agreement that establishes the duties and responsibilities of each party. Pursuant to the representative agreement, each advisor makes a series of representations, including that the advisor will disclose to all clients and prospective clients that the advisor is acting as LPL Financial's registered representative or investment advisory representative, that all orders for securities will be placed through LPL Financial, that the advisor will sell only products that LPL Financial has approved, and that the advisor will comply with LPL Financial policies and procedures as well as securities rules and regulations. These advisors also agree not to engage in any outside business activity without prior approval from us and not to act in competition with us.
LPL Financial also supports over 420 independent RIA firms that conduct their business through separate entities ("Hybrid RIAs") with over 4,700 advisors who conduct their advisory business through these separate entities, rather than through LPL Financial. Hybrid RIAs operate pursuant to the Investment Advisers Act of 1940, as amended (the "Advisers Act") or their respective states' investment advisory licensing rules. These Hybrid RIAs engage us for technology, clearing, and custody services, as well as access to our investment platforms. Advisors associated with Hybrid RIAs retain 100% of their advisory fees. In return, we charge separate fees for custody, trading, administrative, and support services. In addition, most financial advisors associated with Hybrid RIAs carry their brokerage license with LPL Financial and access our fully-integrated brokerage platform under standard terms, although some financial advisors associated with Hybrid RIAs do not carry a brokerage license with us.
We believe we are the market leader in providing support to over 2,200 financial advisors at approximately 700 banks and credit unions nationwide. For these institutions, the core capabilities of which may not include investment and financial planning services, or that find the technology, infrastructure, and regulatory requirements of supporting such services to be cost-prohibitive, we provide their financial advisors with the infrastructure and services they need to be successful, allowing the institutions to focus more energy and capital on their core businesses.
A subset of our advisors provides advice and serves group retirement plans primarily for small and mid-size businesses. These advisors serve over 34,000 retirement plans representing $90.2 billion in retirement plan assets custodied at various custodians. LPL Financial provides these advisors with marketing tools and technology capabilities that are designed for retirement solutions.
We also provide support to approximately 4,000 additional financial advisors who are affiliated and licensed with insurance companies. These arrangements allow us to provide outsourced customized clearing, advisory platforms, and technology solutions that enable the financial advisors at these insurance companies to offer a breadth of services to their client base in an efficient manner.
2
Our Value Proposition
The core of our business is dedicated to meeting the evolving needs of our advisors and providing the platform and tools to grow and enhance the profitability of their businesses. We are dedicated to continuously improving the processes, systems, and resources we leverage to meet these needs.
We support our advisors by providing front-, middle-, and back-office solutions through our distinct value proposition: integrated technology solutions, comprehensive clearing and compliance services, consultive practice management programs and training, and independent research. The comprehensive and increasingly automated nature of our offering enables our advisors to focus on their clients while successfully and efficiently managing the complexities of running their own practice.
Integrated Technology Solutions
We provide our technology and service to advisors through an integrated technology platform that is server-based and web-accessible. Our technology offerings are designed to permit our advisors to effectively manage all critical aspects of their businesses in an efficient manner while remaining responsive to their clients’ needs. We continue to automate time-consuming processes, such as account opening and management, document imaging, transaction execution, and account rebalancing, in an effort to improve our advisors' efficiency and accuracy.
Comprehensive Clearing and Compliance Services
We provide custody and clearing services for the majority of our advisors’ transactions, providing a simplified and streamlined advisor experience and expedited processing capabilities. Our self-clearing platform enables us to better control client data, more efficiently process and report trades, facilitate platform development, reduce costs, and ultimately enhance the service experience for our advisors and their clients. Our self-clearing platform also enables us to serve a wider range of advisors, including Hybrid RIAs and their associated advisors.
We continue to make substantial investments in our compliance function to provide our advisors with a strong framework through which to understand and operate within regulatory guidelines, as well as guidelines that we establish. Protecting the best interests of investors and our affiliated advisors is of utmost importance to us. As the financial industry and regulatory environment evolve and become more complex, we remain devoted to serving our clients ethically and exceedingly well. We have made a long-term commitment to enhancing our risk management and compliance structure. Our technology-based compliance and risk management tools further enhance the overall effectiveness and scalability of our control environment.
Our team of risk and compliance employees assists our advisors through:
• | training and advising advisors on new products, new regulatory guidelines, compliance and risk management tools, security policies and procedures, and best practices; |
• | advising on sales practice activities and facilitating the supervision of activities by branch managers; |
• | conducting technology-enabled surveillance of trading activities and sales practices; |
• | for advisors on our corporate RIA platform, monitoring of registered investment advisory activities; and |
• | inspecting branch offices and advising on how to strengthen compliance procedures. |
Practice Management Programs and Training
Our practice management programs are designed to help financial advisors in independent practices and financial institutions, as well as all levels of financial institution leadership, enhance and grow their businesses. Our experience gives us the ability to benchmark the best practices of successful advisors and develop customized recommendations to meet the specific needs of an advisor’s business and market, and our scale allows us to dedicate a team of experienced professionals to this effort. Our practice management and training services include:
• | personalized business consulting that helps eligible advisors and program leadership enhance the value and operational efficiency of their businesses; |
• | advisory and brokerage consulting and financial planning to support advisors in growing their businesses through our broad range of products and fee-based offerings, as well as wealth management services, to assist advisors serving high-net-worth clients with comprehensive estate, tax, philanthropic, and financial planning processes; |
• | marketing strategies, including campaign templates, to enable advisors to build awareness of their services and capitalize on opportunities in their local markets; |
3
• | succession planning and an advisor loan program for advisors looking to either sell their own or buy another practice; |
• | transition services to help advisors establish independent practices and migrate client accounts to us; and |
• | in-person and virtual training and educational programs on topics including technology, use of advisory platforms, and business development. |
Independent Research
We provide our advisors with integrated access to comprehensive research on a broad range of investments and market analysis on macro-economic events, capital markets assumptions, and strategic and tactical asset allocation. Our research team provides advice that is designed to empower our advisors to provide their clients with thoughtful advice in a timely manner, including the creation of discretionary portfolios for which we serve as a portfolio manager that are available through our turnkey advisory asset management platforms. Our research team actively works with our product due diligence group to review the financial products offered through our platform. This includes third-party asset manager search, selection, and monitoring services for both traditional and alternative strategies across all investment access points (exchange-traded funds, mutual funds, separately managed accounts, unified managed accounts, and other products and services). We believe our lack of proprietary products or investment banking services better enables us to provide research that is unbiased and objective.
Our Product and Solution Access
We do not manufacture any financial products. Instead, we provide our advisors with open architecture access to a broad range of commission, fee-based, cash, and money market products and services. Our product due diligence group conducts a review on substantially all of our product offerings.
The sales and administration of these products are facilitated through our technology solutions that allow our advisors to access client accounts, product information, asset allocation models, investment recommendations, and economic insight as well as to perform trade execution.
Commission-Based Products
Commission-based products are those for which we and our advisors receive an upfront commission and, for certain products, a trailing commission, or a mark-up or mark-down. Our brokerage offerings include variable and fixed annuities, mutual funds, equities, alternative investments such as non-traded real estate investment trusts and business development companies, retirement and 529 education savings plans, fixed income, and insurance. As of December 31, 2016, the total assets in our commission-based products were $297.8 billion. We regularly review the structure and fees of our commission-based products in the context of retail investor preferences and the changing regulatory environment, including in connection with the DOL Rule.
Fee-Based Advisory Platforms and Support
LPL Financial has various fee-based advisory platforms that provide centrally managed or customized solutions from which advisors can choose to meet the investment needs of their clients. The fee structure enables our advisors to provide their clients with higher levels of service, while establishing a recurring revenue stream for the advisor and for us. Our fee-based platforms provide access to mutual funds, exchange-traded funds, stocks, bonds, certain option strategies, unit investment trusts, and institutional money managers and no-load multi-manager variable annuities. As of December 31, 2016, the total advisory assets under custody in these platforms, through our Corporate RIAs or Hybrid RIAs, were $211.6 billion.
Cash Sweep Programs
We assist our advisors in managing their clients’ cash balances through three primary cash sweep programs depending on account type: a money market sweep vehicle involving money market fund providers and two insured sweep vehicles involving banks. As of December 31, 2016, the total assets in our cash sweep programs, which are held within brokerage and advisory accounts, were approximately $31.3 billion. Our sweep programs with banks held $22.8 billion in insured cash account vehicles and $4.4 billion in a deposit cash account vehicles. The balance in money market funds was $4.1 billion.
Retirement Services
We offer retirement solutions for commission- and fee-based services that allow advisors to provide brokerage services, consultation, and advice to plan sponsors using LPL Financial. Our advisors, whether through
4
LPL Financial or through a Hybrid RIA, serve over 34,000 retirement plans representing at least $90.2 billion in retirement plan assets. These retirement plan assets are custodied with LPL Financial or various third-party providers of retirement plan administrative services that provide us with direct reporting feeds. There are additional retirement plan assets supported by our advisors that are custodied with third-party providers that do not provide reporting feeds to us. Including those plans for which we receive no reporting feed, we estimate there are over 46,000 retirement plans served by our advisors with total retirement plan assets of approximately $127.3 billion. We earn revenue from retirement plan assets that are custodied with LPL Financial and from those that are not custodied with LPL Financial, but which are serviced by advisors through LPL Financial. Only retirement plan assets that are custodied with LPL Financial are included in our reported advisory and brokerage assets.
Other Services
We provide a number of tools and services that enable advisors to maintain and grow their practices. Through our subsidiary PTC, we provide custodial services to trusts for estates and families. Under our unique model, an advisor may provide a trust with investment management services, while administrative services for the trust are provided by PTC.
Our Financial Model
Our overall financial performance is a function of the following dynamics of our business:
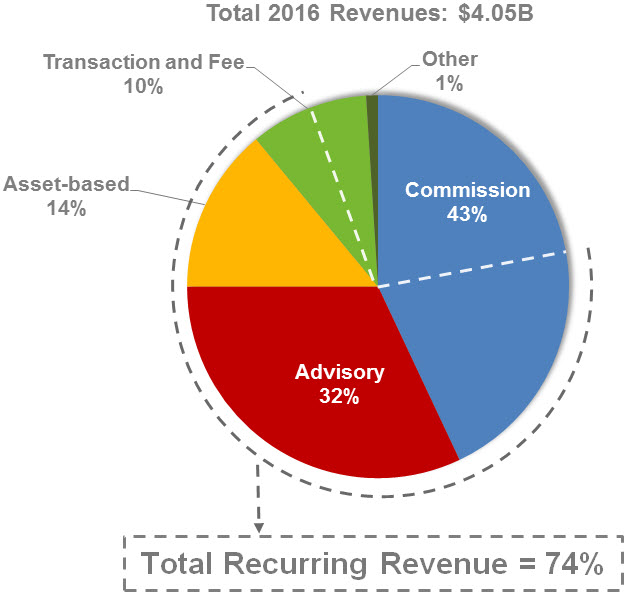
• | Our revenues stem from diverse sources, including advisor-generated commission and advisory fees, as well as other asset-based fees from product manufacturers, omnibus, networking services, cash sweep balances, and transaction and other fees for other ancillary services that we provide. Revenues are not concentrated by advisor, product, or geography. For the year ended December 31, 2016, no single relationship with our independent advisor practices, banks, credit unions, or insurance companies accounted for more than 7% of our net revenues, and no single advisor accounted for more than 2% of our net revenues. |
• | The largest variable component of our cost base, advisor payout percentages, is directly linked to revenues generated by our advisors. |
• | A portion of our revenues, such as software licensing and account and client fees, are not correlated with the equity financial markets. |
• | Our operating model is scalable and is capable of delivering expanding profit margins over time. |
• | We have been able to operate with low capital expenditures and limited capital requirements, and as a result have been able to invest in our business as well as return value to shareholders. |
The majority of our revenue base is recurring in nature, with approximately 74% recurring revenue in 2016.
5
Our Competitive Strengths
Market Leadership Position and Significant Scale
We are the established leader in the independent advisor market, which is our core business focus. We use our scale and position as an industry leader to champion the independent business model and the rights of our advisors.
Our scale enables us to benefit from the following dynamics:
• | Continual Reinvestment — We actively reinvest in our comprehensive technology platform and practice management support, which further improves the productivity of our advisors. |
• | Economies of Scale — As one of the largest distributors of financial products in the United States, we have been able to obtain attractive economics from product manufacturers. |
• | Payout Ratios to Advisors — Among the five largest United States broker-dealers by number of advisors, we believe that we offer the highest average payout ratios to our advisors. |
The combination of our ability to reinvest in our business and maintain highly competitive payout ratios has enabled us to attract and retain advisors. This, in turn, has driven our growth and led to a continuous cycle of reinvestment that reinforces our established scale advantage.
Value Proposition
Our differentiator is the combination of our capabilities across research, technology, risk management, and practice management. LPL makes meaningful investments to support the growth, productivity, and efficiency of advisors across a broad spectrum of models as their practices evolve. Our focus is working alongside advisors to navigate complex environments in order to create the best outcomes for their clients.
We believe we offer a compelling value proposition to independent financial advisors and financial institutions. This value proposition is built upon the delivery of our services through our scale, independence, and integrated technology, the sum of which we believe is not replicated in the industry. As a result we believe that we do not have any direct competitors that offer our business model at the scale at which we offer it. For example, because we do not have any proprietary manufactured financial products, we do not view firms that manufacture asset management products and other financial products as direct competitors.
We provide comprehensive solutions to financial institutions, such as regional banks, credit unions, and insurers that seek to provide a broad array of services for their clients. We believe many institutions find the technology, infrastructure, and regulatory requirements associated with delivering financial advice to be cost-prohibitive. The solutions we provide enable financial advisors at these institutions to deliver their services on a cost-effective basis.
Flexibility of Our Business Model
Our business model allows our advisors the freedom to choose how they conduct their business, subject to certain regulatory parameters, which has helped us attract and retain advisors from multiple channels, including wire houses, regional broker-dealers, and other independent broker-dealers. Our platform can accommodate a variety of independent advisor business models, including independent financial advisors and Hybrid RIAs. The flexibility of our business model enables our advisors to transition among the independent advisor business models and product mix as their business evolves and preferences change within the market. Our own business model provides advisors with a multitude of customizable service and technology offerings that allow them to increase their efficiency, focus on their clients, and grow their practice.
Ability to Serve a Large Majority of Retail Assets
Our historic focus has been on advisors who serve the mass-affluent market and we believe there continues to be an attractive opportunity in this market. Although we have grown through our focus in this area, the flexibility of our platform allows us to expand our breadth of services to better support the high-net-worth market. As of December 31, 2016, our advisors supported accounts with more than $1 million in assets that in the aggregate represented $102.4 billion in advisory and brokerage assets, which is 20.1% of our total assets custodied. Our array of integrated technology and services is capable of supporting advisors with significant production and can compete directly with wire houses and custodians. We are able to support our advisors to meet the needs of their mass market clients up through the high-net-worth market, which, according to Cerulli Associates, accounts for approximately 88% of all retail assets in the United States.
6
Our Sources of Growth
We believe we can increase our revenue and profitability by benefiting from favorable industry trends and by executing strategies to accelerate our growth beyond that of the broader markets in which we operate.
Favorable Industry Trends
Growth in Investable Assets
According to Cerulli Associates, over the past five years assets serviced in the market segments in the United States that we address grew 7.0% per year, while retirement assets are expected to grow 5.7% per year over the next five years (in part due to the retirement of the baby boomer generation and the resulting assets that are projected to flow out of retirement plans and into IRAs). In addition, IRA assets are projected to grow from $7.9 trillion as of 2016 to $10.8 trillion by 2020.
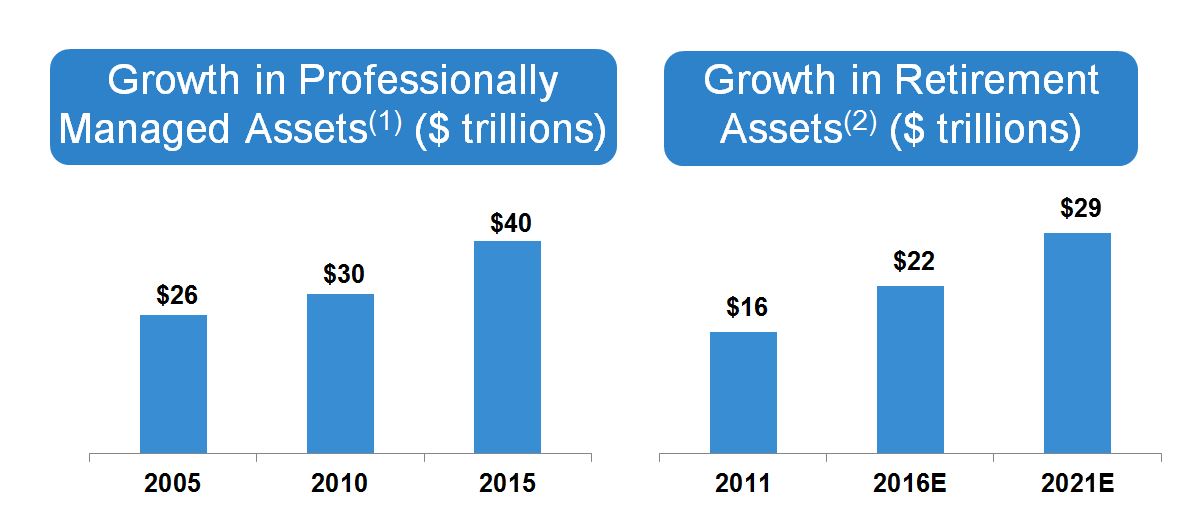
(1) | The Cerulli Report: The State of U.S. Retail and Institutional Asset Management 2016. |
(2) | The Cerulli Report: U.S. Retirement Markets 2016. |
Increasing Demand for Independent Financial Advice
Retail investors, particularly in the mass-affluent market, are increasingly seeking financial advice from independent sources. We are highly focused on helping independent advisors meet the needs of the mass-affluent market, which constitutes a significant and underserved portion of investable assets.
Advisor Migration to Independent Channels
Independent channels continue to gain market share from captive channels. We believe that we are not just a beneficiary of this secular shift, but an active catalyst in the movement to independence. There is an increased shift towards advisors seeking complete independence by forming an RIA firm and registering directly with the SEC or state securities regulators. However, the clients of these advisors are generally interested in retaining assets in brokerage accounts. This shift has led to significant growth in the number of advisors associated with Hybrid RIAs.
Macroeconomic Trends
While the current macroeconomic environment has exhibited short-term volatility, we anticipate an appreciation in asset prices and a rise in interest rates over the long term. We expect that our business will benefit from growth in advisory and brokerage assets as well as increasing interest rates.
7
Executing Our Growth Strategies
Attracting New Advisors to Our Platform
We intend to grow the number of advisors who are served by our platform — either those who are independent or who are aligned with financial institutions. Cerulli Associates estimates there are 313,024 financial advisors in the United States, of which we have a 4.6% market share, and we believe that we are uniquely positioned to attract seasoned advisors of any practice size and from any of the channels listed below.
Channel | Advisors | % of Market | ||
Independent Broker-Dealer(1) | 65,740 | 21.0% | ||
Insurance Broker-Dealer | 75,970 | 24.3% | ||
Wire House | 47,154 | 15.1% | ||
National and Regional Broker-Dealer | 39,812 | 12.7% | ||
Independent RIA(1) | 34,363 | 11.0% | ||
Retail Bank Broker-Dealer | 23,099 | 7.3% | ||
Hybrid RIAs(1) | 26,886 | 8.6% | ||
Total | 313,024 | 100.0% | ||
___________________
(1) The 26,886 advisors classified as "Hybrid RIAs" are advisors who are both licensed through independent broker-dealers and registered as investment advisors. The Hybrid RIAs are excluded from the Independent Broker-Dealer and Independent RIA categories in the table above.
Increasing Productivity of Existing Advisor Base
We believe that the productivity of our advisors will increase over time as we continue to develop solutions designed to enable them to add new clients, manage more of their clients’ investable assets, and expand their existing practices with additional advisors. We can facilitate these productivity improvements by helping our advisors better manage their practices in an increasingly complex external environment, which we believe will result in assets per advisor growing over time.
Competition
We compete with a variety of financial firms to attract and retain experienced and productive advisors:
•Within the independent channel, the industry is highly fragmented, comprised primarily of regional firms that rely on third-party custodians and technology providers to support their operations. Some of the competitors in this space include:
◦Commonwealth Financial Network
◦Cetera Financial Group
◦Cambridge
•The captive wire house channel tends to consist of large nationwide firms with multiple lines of business that have a focus on the highly competitive high-net-worth investor market. Competitors in this channel include:
◦Morgan Stanley
◦Bank of America Merrill Lynch
◦UBS Financial Services Inc.
◦Wells Fargo Advisors, LLC
•Competition for advisors also includes regional firms, such as Edward D. Jones & Co., L.P., and Raymond James Financial Services, Inc.
•Independent RIA firms, which are registered with the SEC or though their respective states' investment advisory regulator and not through a broker-dealer, may choose from a number of third-party firms to provide custodial services. Our significant competitors in this space include:
◦Charles Schwab & Co.
◦Fidelity Brokerage Services LLC
◦TD Ameritrade
8
Those competitors that do not offer a complete clearing solution for advisors are frequently supported by third-party clearing and custody oriented firms. Pershing LLC, a subsidiary of Bank of New York Mellon, National Financial Services LLC, a subsidiary of Fidelity Investments, and J.P. Morgan Clearing Corp., a subsidiary of J.P. Morgan Chase & Co., offer custodial services and technology solutions to independent firms and RIAs that are not self-clearing. These clearing firms and their affiliates and other providers also offer an array of service, technology and reporting tools. Albridge Solutions, a subsidiary of Bank of New York Mellon, Advent Software, Inc., Envestnet, Inc., and Morningstar, Inc., provide an array of research, analytics, and reporting solutions.
Our advisors compete for clients with financial advisors of brokerage firms, banks, insurance companies, asset management, and investment advisory firms. In addition, they also compete with a number of firms offering direct-to-investor online financial services and discount brokerage services, such as Charles Schwab & Co. and Fidelity Brokerage Services LLC.
Employees
As of December 31, 2016, we had 3,288 full-time employees. None of our employees is subject to collective bargaining agreements governing their employment with us. We build deep expertise by attracting talented employees from a variety of fields and developing that talent into future leaders of our business and our industry. Our continued growth is dependent, in part, on our ability to be an employer of choice and an organization that recruits and retains talented employees who best fit our culture and business needs. We offer ongoing learning opportunities and programs that empower employees to grow in their professional development and careers. We provide comprehensive compensation and benefits packages, as well as financial education tools to assist our employees as they plan for their future.
Regulation
The financial services industry is subject to extensive regulation by United States federal, state, and international government agencies as well as various self-regulatory organizations. We take an active leadership role in the development of the rules and regulations that govern our industry. We have been investing in our compliance functions to monitor our adherence to the numerous legal and regulatory requirements applicable to our business.
Broker-Dealer Regulation
LPL Financial LLC is a broker-dealer registered with the SEC, a member of the Financial Industry Regulatory Authority ("FINRA") and various other self-regulatory organizations, and a participant in various clearing organizations including the Depository Trust Company, the National Securities Clearing Corporation, and the Options Clearing Corporation. LPL Financial LLC is registered as a broker-dealer in each of the 50 states, the District of Columbia, Puerto Rico, and the U.S. Virgin Islands.
Broker-dealers are subject to rules and regulations covering all aspects of the securities business, including sales and trading practices, public offerings, publication of research reports, use and safekeeping of clients’ funds and securities, capital adequacy, recordkeeping and reporting, the conduct of directors, officers, and employees, qualification and licensing of supervisory and sales personnel, marketing practices, supervisory and organizational procedures intended to ensure compliance with securities laws and to prevent improper trading on material nonpublic information, limitations on extensions of credit in securities transactions, clearance and settlement procedures, and rules designed to promote high standards of commercial honor and just and equitable principles of trade. Broker-dealers are also regulated by state securities administrators in those jurisdictions where they do business. Compliance with many of the rules and regulations applicable to us involves a number of risks because rules and regulations are subject to varying interpretations, among other reasons. Regulators make periodic examinations and review annual, monthly, and other reports on our operations, track record, and financial condition. Violations of rules and regulations governing a broker-dealer’s actions could result in censures, penalties and fines, disgorgement of profits or remediation to customers, the issuance of cease-and-desist orders, the restriction, suspension, or expulsion from the securities industry of such broker-dealer, its financial advisor(s), or its officers or employees, or other similar adverse consequences. The rules of the Municipal Securities Rulemaking Board, which are enforced by the SEC and FINRA, apply to the municipal securities activities of LPL Financial LLC.
LPL Financial LLC's margin lending is regulated by the Federal Reserve Board’s restrictions on lending in connection with client purchases and short sales of securities, and FINRA rules also require LPL Financial LLC to impose maintenance requirements based on the value of securities contained in margin accounts. In many cases, our margin policies are more stringent than these rules.
9
Significant new rules and regulations continue to arise as a result of the Dodd-Frank Wall Street Reform and Consumer Protection Act (the “Dodd-Frank Act”), which was enacted in July 2010. Provisions of the Dodd-Frank Act that have not been implemented, but may affect our business in the future include, but are not limited to, the potential implementation of a more stringent fiduciary standard for broker-dealers (in addition to the DOL Rule) and the potential establishment of a new self-regulatory organization for investment advisors. Compliance with these provisions would likely result in increased costs. Moreover, to the extent the Dodd-Frank Act affects the operations, financial condition, liquidity, and capital requirements of financial institutions with whom we do business, those institutions may seek to pass on increased costs, reduce their capacity to transact, or otherwise present inefficiencies in their interactions with us. The ultimate impact that the Dodd-Frank Act will have on us, the financial industry, and the economy cannot be known until all applicable regulations called for under the Dodd-Frank Act have been finalized and implemented.
Investment Advisor Regulation
As investment advisors registered with the SEC, our subsidiaries LPL Financial LLC and Fortigent, LLC are subject to the requirements of the Advisers Act, and the regulations promulgated thereunder, including examination by the SEC’s staff. Such requirements relate to, among other things, fiduciary duties to clients, performance fees, maintaining an effective compliance program, solicitation arrangements, conflicts of interest, advertising, limitations on agency cross and principal transactions between the advisor and advisory clients, recordkeeping and reporting requirements, disclosure requirements, and general anti-fraud provisions. In 2016, the SEC proposed new business continuity and transition planning requirements for investment advisors. If such rules are adopted, investment advisors will face heightened regulatory scrutiny associated with, among other matters, the integrity and resilience of their technology, cybersecurity, and other information security systems. Further, the Treasury Department’s Financial Crimes Enforcement Network (“FinCEN”) proposed an anti-money laundering program rule for certain investment advisors. Should this rule be adopted, investment advisors subject to the rule would be required to devote significant resources to developing related compliance programs.
The SEC is authorized to institute proceedings and impose sanctions for violations of the Advisers Act and associated regulations, ranging from fines and censure to termination of an investment advisor’s registration. Investment advisors also are subject to certain state securities laws and regulations. Failure to comply with the Advisers Act or other federal and state securities laws and regulations could result in investigations, sanctions, profit disgorgement, client remediation, fines, or other similar consequences.
Retirement Plan Services Regulation
Certain of our subsidiaries, including LPL Financial LLC, PTC, and LPLIA, are subject to the Employee Retirement Income Security Act of 1974, as amended ("ERISA") and Section 4975 of the Internal Revenue Code of 1986, as amended (the "Code"), and to regulations promulgated under ERISA or the Code, insofar as the subsidiaries provide services with respect to plan clients, or otherwise deal with plan clients that are subject to ERISA or the Code. ERISA imposes certain duties on persons who are "fiduciaries" (as defined in Section 3(21) of ERISA) and prohibits certain transactions involving plans subject to ERISA and fiduciaries or other service providers to such plans. Non-compliance with or breaches of these provisions may expose an ERISA fiduciary or other service provider to liability under ERISA, which may include monetary and criminal penalties as well as equitable remedies for the affected plan. Section 4975 of the Code prohibits certain transactions involving "plans" (as defined in Section 4975(e)(1), which include, for example, IRAs and certain Keogh plans) and service providers, including fiduciaries (as defined in Section 4975(e)(3)), to such plans. Section 4975 imposes excise taxes for violations of these prohibitions.
The DOL Rule, if not delayed or changed, would significantly broaden the circumstance in which we and our advisors may be considered an “investment advice fiduciary” under ERISA and Section 4975 of the Code, extending fiduciary status to many investment professionals and activities that have historically not been considered to be fiduciary, and impose new requirements on our various business lines. In addition to the DOL Rule, the DOL published two new prohibited transaction exemptions—the Best Interest Contract Exemption and the Class Exemption for Principal Transactions in Certain Assets—as well as amendments to and partial revocations of pre-existing exemptions. These regulations and exemptions focus in large part on conflicts of interest concerning financial professionals’ investment recommendations and marketing practices relating to retirement investors. We are continuing to analyze and evaluate the impact of the DOL Rule and related exemptions on our clients, potential clients, and our business. However, because ERISA plans and IRAs comprise a significant portion of our business, we expect that compliance with the DOL Rule and reliance on new and amended prohibited transaction exemptions will require increased legal, compliance, information technology, and other costs and could lead to a greater risk of class action lawsuits and other litigation. In addition, the DOL Rule creates increased risk of private arbitration and
10
litigation, including potential class action litigation, based on violations of the DOL Rule. The full effect of the DOL Rule, once phased in, on us, our advisors, and the broader financial industry, is not fully known at this time. Political changes at the federal level may also impact the degree and timing of the effect of the DOL Rule on our business in ways which cannot now be anticipated or planned for, which may have further impacts on our products and services, and results of operations.
Commodities and Futures Regulation
LPL Financial LLC is registered as an introducing broker with the Commodity Futures Trading Commission (“CFTC”) and is a member of the National Futures Association (“NFA”). LPL Financial LLC introduces commodities and futures products to ADM Investor Services, Inc. (“ADM”), and all commodities accounts and related client positions are held by ADM. LPL Financial LLC is regulated by the CFTC and NFA. Violations of the rules of the CFTC and the NFA could result in remedial actions including fines, registration terminations, or revocations of exchange memberships.
Trust Regulation
Through our subsidiary, PTC, we offer trust, investment management oversight, and custodial services for estates and families. PTC is chartered as a non-depository national banking association. As a limited purpose national bank, PTC is regulated and regularly examined by the Office of the Comptroller of the Currency (“OCC”). PTC files reports with the OCC within 30 days after the conclusion of each calendar quarter. Because the powers of PTC are limited to providing fiduciary services and investment advice, it does not have the power or authority to accept deposits or make loans. For this reason, trust assets under PTC’s management are not insured by the FDIC.
Because of its limited purpose, PTC is not a “bank” as defined under the Bank Holding Company Act of 1956. Consequently, neither its immediate parent, PTC Holdings, Inc., nor its ultimate parent, LPLFH, is regulated by the Board of Governors of the Federal Reserve System as a bank holding company. However, PTC is subject to regulation by the OCC and to various laws and regulations enforced by the OCC, such as capital adequacy, change of control restrictions and regulations governing fiduciary duties, conflicts of interest, self-dealing, and anti-money laundering. For example, the Change in Bank Control Act of 1978, as implemented by OCC supervisory policy, imposes restrictions on parties who wish to acquire a controlling interest in a limited purpose national bank such as PTC or the holding company of a limited purpose national bank such as LPLFH. In general, an acquisition of 10% or more of our common stock, or another acquisition of “control” as defined in OCC regulations, may require OCC approval. These laws and regulations are designed to serve specific bank regulatory and supervisory purposes and are not meant for the protection of PTC, PTC Holdings, Inc., LPLFH, or their stockholders.
Regulatory Capital
The SEC, FINRA, CFTC, and NFA have stringent rules and regulations with respect to the maintenance of specific levels of net capital by regulated entities. Generally, a broker-dealer’s net capital is calculated as net worth plus qualified subordinated debt less deductions for certain types of assets. The net capital rule under the Exchange Act requires a broker-dealer maintain a minimum net capital, and applies certain discounts to the value of its assets based on the liquidity of such assets. LPL Financial LLC is also subject to the NFA's financial requirements and is required to maintain net capital that is in excess of or equal to the greatest of the NFA's minimum financial requirements. Under these requirements, LPL Financial LLC is currently required to maintain minimum net capital that is in excess of or equal to the minimum net capital calculated and required pursuant to the SEC's Net Capital Rule.
The SEC, FINRA, CFTC, and NFA impose rules that require notification when net capital falls below certain predefined criteria. These broker-dealer capital rules also dictate the ratio of debt to equity in regulatory capital composition, and constrain the ability of a broker-dealer to expand its business under certain circumstances. If a broker-dealer fails to maintain the required net capital, then certain notice requirements to the regulators are required and the broker-dealer may be subject to suspension or revocation of registration by the applicable regulatory agency, and suspension or expulsion by these regulators ultimately could lead to the broker-dealer’s liquidation. Additionally, the net capital rule and certain FINRA rules impose requirements that may have the effect of prohibiting a broker-dealer from distributing or withdrawing capital, and that require prior notice to the SEC and FINRA for certain capital withdrawals. LPL Financial LLC, which is subject to net capital rules, has been and currently is in compliance with those rules and has net capital in excess of the minimum requirements.
11
Anti-Money Laundering and Sanctions Compliance
The USA PATRIOT Act of 2001 (the “PATRIOT Act”), which amended the Bank Secrecy Act, contains anti-money laundering and financial transparency laws and mandates the implementation of various regulations applicable to broker-dealers, futures commission merchants, and other financial services companies. Financial institutions subject to these requirements generally must have an anti-money laundering program in place, which includes monitoring for and reporting suspicious activity, implementing specialized employee training programs, designating an anti-money laundering compliance officer, and annually conducting an independent test of the effectiveness of its program. In addition, sanctions administered by the United States Office of Foreign Asset Control prohibit United States persons from doing business with blocked persons and entities or certain sanctioned countries. We have established policies, procedures, and systems designed to comply with these regulations and
we work continuously to improve and strengthen our regulatory compliance mechanisms.
Security and Privacy
Regulatory activity in the areas of privacy and data protection continues to grow worldwide and is generally being driven by the growth of technology and related concerns about the rapid and widespread dissemination and use of information. To the extent they are applicable to us, we must comply with these federal and state information-related laws and regulations, including, for example, those in the United States, such as the Gramm-Leach-Bliley Act of 1999, SEC Regulation S-P, the Fair Credit Reporting Act of 1970, as amended, and Regulation S-ID. In 2016, the SEC proposed regulations related to business continuity and transition planning which, if adopted, would impose additional requirements and potential liability related to security and privacy standards that must be observed by investment advisors.
Financial Information about Geographic Areas
Our revenues for the periods presented were derived from our operations in the United States.
Trademarks
Access Overlay®, BranchNet®, CLIENTWORKS®, DO IT SMARTER®, Fortigent®, LPL®, LPL Career Match®, LPL Financial (& Design)®, Manager Access Network®, Manager Access Select®, OMP®, and SPONSORWORKS® are our registered trademarks. THE PRIVATE TRUST COMPANY, N.A. (& Design) is among our service marks.
12
Item 1A. Risk Factors
Risks Related to Our Business and Industry
We depend on our ability to attract and retain experienced and productive advisors.
We derive a large portion of our revenues from commissions and fees generated by our advisors. Our ability to attract and retain experienced and productive advisors has contributed significantly to our growth and success, and our strategic plan is premised upon continued growth in the number of our advisors and the assets they serve. If we fail to attract new advisors or to retain and motivate our current advisors, replace our advisors who retire, or assist our retiring advisors with transitioning their practices to existing advisors, or if advisor migration away from wire houses and to independent channels decreases or slows, our business may suffer.
The market for experienced and productive advisors is highly competitive, and we devote significant resources to attracting and retaining the most qualified advisors. In attracting and retaining advisors, we compete directly with a variety of financial institutions such as wire houses, regional broker-dealers, banks, insurance companies, and other independent broker-dealers. If we are not successful in retaining highly qualified advisors, we may not be able to recover the expense involved in attracting and training these individuals. There can be no assurance that we will be successful in our efforts to attract and retain the advisors needed to achieve our growth objectives.
Our financial condition and results of operations may be adversely affected by market fluctuations and other economic factors.
Significant downturns and volatility in equity and other financial markets have had and could continue to have an adverse effect on our financial condition and results of operations.
General economic and market factors can affect our commission and fee revenue. For example, a decrease in market levels or market volatility can:
• | reduce new investments by both new and existing clients in financial products that are linked to the equity markets, such as variable life insurance, variable annuities, mutual funds, and managed accounts; |
• | reduce trading activity, thereby affecting our brokerage commissions and our transaction revenue; |
• | reduce the value of advisory and brokerage assets, thereby reducing advisory fee revenue and asset-based fee income; and |
• | motivate clients to withdraw funds from their accounts, reducing advisory and brokerage assets, advisory fee revenue, and asset-based fee income. |
Other more specific trends may also affect our financial condition and results of operations, including, for example: changes in the mix of products preferred by investors may result in increases or decreases in our fee revenues associated with such products, depending on whether investors gravitate towards or away from such products. The timing of such trends, if any, and their potential impact on our financial condition and results of operations are beyond our control.
In addition, because certain of our expenses are fixed, our ability to reduce them in response to market factors over short periods of time is limited, which could negatively impact our profitability.
Significant interest rate changes could affect our profitability and financial condition.
Our revenues are exposed to interest rate risk primarily from changes in fees payable to us from banks participating in our cash sweep programs, which are based on prevailing interest rates. In the prevailing relatively low interest rate environment, our revenue from our cash sweep programs has declined, and our revenue may decline further due to the expiration of contracts with favorable pricing terms, less favorable terms in future contracts with participants in our cash sweep programs, decreases in interest rates, or clients moving assets out of our cash sweep programs. Our revenues from our cash sweep programs also depend on our ability to manage the terms of both our agreements with banks and money market fund providers participating in our programs, as well as competitive program fees and interest rates payable to clients. A sustained relatively low interest rate environment may have a negative impact upon our ability to negotiate contracts with new banks or renegotiate existing contracts on comparable terms with banks participating in our cash sweep programs. If interest rates do not rise in accordance with management and market expectations, future revenues from our cash sweep programs may be lower than expected.
13
Lack of liquidity or access to capital could impair our business and financial condition.
Liquidity, or ready access to funds, is essential to our business. We expend significant resources investing in our business, particularly with respect to our technology and service platforms. In addition, we must maintain certain levels of required capital. As a result, reduced levels of liquidity could have a significant negative effect on us. Some potential conditions that could negatively affect our liquidity include:
• | illiquid or volatile markets; |
• | diminished access to debt or capital markets; |
• | unforeseen cash or capital requirements; or |
• | regulatory penalties or fines, or adverse legal settlements or judgments. |
The capital and credit markets continue to experience varying degrees of volatility and disruption. In some cases, the markets have exerted downward pressure on availability of liquidity and credit capacity for businesses similar to ours. Without sufficient liquidity, we could be required to limit or curtail our operations or growth plans, and our business would suffer.
Notwithstanding the self-funding nature of our operations, we may sometimes be required to fund timing differences arising from the delayed receipt of client funds associated with the settlement of client transactions in securities markets. These timing differences are funded either with internally generated cash flow or, if needed, with funds drawn under our revolving credit facility, or uncommitted lines of credit at our broker-dealer subsidiary LPL Financial LLC. We may also need access to capital in connection with the growth of our business, through acquisitions or otherwise.
In the event current resources are insufficient to satisfy our needs, we may need to rely on financing sources such as bank debt. The availability of additional financing will depend on a variety of factors such as:
• | market conditions; |
• | the general availability of credit; |
• | the volume of trading activities; |
• | the overall availability of credit to the financial services industry; |
• | our credit ratings and credit capacity; and |
• | the possibility that our lenders could develop a negative perception of our long- or short-term financial prospects is a result of industry- or company-specific considerations. Similarly, our access to funds may be impaired if regulatory authorities or rating organizations take negative actions against us. |
Disruptions, uncertainty or volatility in the capital and credit markets may also limit our access to capital required to operate our business. Such market conditions may limit our ability to satisfy statutory capital requirements, generate commission, fee and other market-related revenue to meet liquidity needs and access the capital necessary to grow our business. As such, we may be forced to delay raising capital, issue different types of capital than we would otherwise, less effectively deploy such capital, or bear an unattractive cost of capital, which could decrease our profitability and significantly reduce our financial flexibility.
A loss of our marketing relationships with manufacturers of financial products could harm our relationship with our advisors and, in turn, their clients.
We operate on an open architecture product platform offering no proprietary financial products. To help our advisors meet their clients’ needs with suitable investment options, we have relationships with many of the industry-leading providers of financial and insurance products. We have sponsorship agreements with some manufacturers of fixed and variable annuities and mutual funds that, subject to the survival of certain terms and conditions, may be terminated by the manufacturer upon notice. If we lose our relationships with one or more of these manufacturers, our ability to serve our advisors and, in turn, their clients, and our business may be materially adversely affected. As an example, certain variable annuity product sponsors have ceased offering and issuing new variable annuity contracts. If this trend continues, we could experience a loss in the revenue currently generated from the sale of such products. In addition, certain features of such contracts have been eliminated by variable annuity product sponsors. If this trend continues, the attractiveness of these products would be reduced, potentially reducing the revenue we currently generate from the sale of such products.
14
Our business could be materially adversely affected as a result of the risks associated with acquisitions and investments.
We have made acquisitions and investments in the past and may pursue further acquisitions and investments in the future. These transactions are accompanied by risks. For instance, an acquisition could have a negative effect on our financial and strategic position and reputation or the acquired business could fail to further our strategic goals. Moreover, we may not be able to successfully integrate acquired businesses into ours, and therefore we may not be able to realize the intended benefits from an acquisition. We may have a lack of experience in new markets, products or technologies brought on by the acquisition and we may have an initial dependence on unfamiliar supply or distribution partners. An acquisition may create an impairment of relationships with customers or suppliers of the acquired business or our advisors or suppliers. All of these and other potential risks may serve as a diversion of our management's attention from other business concerns, and any of these factors could have a material adverse effect on our business.
Risks Related to Our Regulatory Environment
Regulatory developments and our failure to comply with regulations could adversely affect our business by increasing our costs and exposure to litigation and regulatory actions, affecting our reputation and making our business less profitable.
Our business, including securities and investment advisory services, is subject to extensive regulation under both federal and state laws. Our broker-dealer subsidiary, LPL Financial LLC, is:
• | registered as a broker-dealer with the SEC, each of the 50 states, and the District of Columbia, Puerto Rico, and the U.S. Virgin Islands; |
• | registered as an investment adviser with the SEC; |
• | a member of FINRA and various other self-regulatory organizations, and a participant in various clearing organizations including the Depository Trust Company, the National Securities Clearing Corporation, and the Options Clearing Corporation; and |
• | regulated by the CFTC with respect to the futures and commodities trading activities it conducts as an introducing broker. |
The primary self-regulator of LPL Financial LLC is FINRA. LPL Financial LLC is also subject to the rules of Municipal Securities Rulemaking Board for its municipal securities activities. The CFTC has designated the NFA as LPL Financial LLC’s primary regulator for futures and commodities trading activities.
The SEC, FINRA, CFTC, OCC, various securities and futures exchanges, and other United States and state-level governmental or regulatory authorities continuously review legislative and regulatory initiatives and may adopt new or revised laws, regulations, or interpretations. There can also be no assurance that other federal or state agencies will not attempt to further regulate our business. These legislative and regulatory initiatives may affect the way in which we conduct our business and may make our business model less profitable.
Our ability to conduct business in the jurisdictions in which we currently operate depends on our compliance with the laws, rules, and regulations promulgated by federal regulatory bodies and the regulatory authorities in each of the states and other jurisdictions in which we do business. Our ability to comply with all applicable laws, rules and regulations, and interpretations is largely dependent on our establishment and maintenance of compliance, audit, and reporting systems and procedures, as well as our ability to attract and retain qualified compliance, audit, and risk management personnel. While we believe that we have adopted policies and procedures reasonably designed to comply with all applicable laws, rules and regulations, and interpretations these systems and procedures may not be fully effective, and there can be no assurance that regulators or third-parties will not raise concerns with respect to our past or future compliance with applicable regulations. Violations of laws, rules or regulations have in the past and could in the future result in penalties, fines, disgorgement of profits or remediation to customers, which could negatively impact our financial results, and/or business reputation.
Our profitability could also be affected by rules and regulations that impact the business and financial communities generally and, in particular, our advisors’ and their clients, including changes to the interpretation or enforcement of laws governing taxation (including the classification of independent contractor status of our advisors), trading, electronic commerce, privacy, data protection, and anti-money laundering. Failure to comply with these rules and regulations could subject us to regulatory actions or litigation and it could have a material adverse effect on our business, results of operations, cash flows, or financial condition.
New rules and regulations could also result in limitations on the lines of business we conduct, modifications to our business practices, increased capital requirements, and additional costs. For example, as discussed above, in
15
2016 the DOL adopted the DOL Rule and related exemptions that impose new requirements on our various business lines. The DOL Rule is currently generally applicable in April 2017, with certain requirements becoming applicable on January 1, 2018; however, the DOL Rule could be delayed. The DOL also finalized certain prohibited transactions for broker-dealers regarding receipt of compensation for providing investment advice under arrangements that would constitute conflicts of interest. We are analyzing and evaluating the impact of the DOL Rule and related exemptions on our business, clients, and potential clients. However, because qualified retirement accounts and IRAs make up a significant portion of our business, we expect that implementation of the DOL Rule and related exemptions will negatively impact our results, including the impact of increased expenditures related to legal, compliance, information technology and other costs. These changes have also affected (and will likely continue to affect) the products and services we provide to accounts and the compensation that we and our advisors receive in connection with such products and services. Please consult the Retirement Plan Services Regulation section within Part I, "Item 1. Business" for more information about the risks associated with the DOL Rule and related exemptions and their potential impact on our operations.
In addition, the Dodd-Frank Act has enacted wide-ranging changes in the supervision and regulation of the financial industry designed to provide for greater oversight of financial industry participants, reduce risk in banking practices and in securities and derivatives trading, enhance public company corporate governance practices and executive compensation disclosures, and provide for greater protections to individual consumers and investors. Certain elements of the Dodd-Frank Act became effective immediately, while the details of some provisions remain subject to implementing regulations that are yet to be adopted by the applicable regulatory agencies. Provisions of the Dodd-Frank Act that have not been acted upon, but yet may affect our business include but are not limited to the potential implementation of a more stringent fiduciary standard for broker-dealers (in addition to the DOL Rule) and the potential establishment of a new self-regulatory organization ("SRO") for investment advisors. Compliance with these new regulations would likely result in increased costs. Moreover, to the extent the Dodd-Frank Act affects the operations, financial condition, liquidity, and capital requirements of financial institutions with which we do business, those institutions may seek to pass on increased costs, reduce their capacity to transact, or otherwise present inefficiencies in their interactions with us. The ultimate impact that the Dodd-Frank Act will have on us, the financial industry and the economy cannot be known until all such applicable regulations called for under the Dodd-Frank Act have been finalized and implemented.
In addition to the DOL Rule and Dodd-Frank Act rule promulgation, other proposals are currently under consideration by federal banking regulators that may have an impact upon our profitability. Global regulators are engaged in ongoing efforts to build upon the Basel capital accords, which set new capital and liquidity standards for global banking institutions (“Basel III”). Basel III is designed to strengthen bank capital requirements and introduce new regulatory requirements on bank liquidity. In October 2013, United States banking regulators issued a final rule implementing Basel III capital standards in the United States. In September 2014, United States banking regulators issued a final rule to implement the liquidity coverage ratio standards to address Basel III liquidity standards in the United States. These new rules and proposals could negatively impact the attractiveness of cash deposits to banks who participate in our cash sweep programs, making it more difficult for us to renew existing contracts and negotiate new arrangements.
We are subject to various regulatory requirements, which, if not complied with, could result in the restriction of the ongoing conduct or growth, or even liquidation of, parts of our business.
The business activities that we may conduct are limited by various regulatory agencies. Our membership agreement with FINRA may be amended by application to include additional business activities. This application process is time-consuming and may not be successful. As a result, we may be prevented from entering new potentially profitable businesses in a timely manner, or at all. In addition, as a member of FINRA, we are subject to certain regulations regarding changes in control. Rule 1017 of the National Association of Securities Dealers (the predecessor to FINRA) generally provides, among other things, that FINRA approval must be obtained in connection with any transaction resulting in a change in our equity ownership that results in one person or entity directly or indirectly owning or controlling 25% or more of our equity capital. Similarly, the OCC imposes advance approval requirements for a change of control, and control is presumed to exist if a person acquires 10% or more of our common stock. These regulatory approval processes can result in delay, increased costs or impose additional transaction terms in connection with a proposed change of control, such as capital contributions to the regulated entity. As a result of these regulations, our future efforts to sell shares or raise additional capital may be delayed or prohibited.
In addition, the SEC, FINRA, CFTC, OCC, and NFA have extensive rules and regulations with respect to capital requirements. As a registered broker-dealer, LPL Financial LLC is subject to Rule 15c3-1 (“Net Capital Rule”) under the Exchange Act, and related requirements of SROs. The CFTC and NFA also impose net capital
16
requirements. The Net Capital Rule specifies minimum capital requirements that are intended to ensure the general soundness and liquidity of broker-dealers. Because our holding companies are not registered broker-dealers, they are not subject to the Net Capital Rule. However, the ability of our holding companies to withdraw capital from our broker-dealer subsidiary could be restricted, which in turn could limit our ability to repay debt, redeem or purchase shares of our outstanding stock, or pay dividends. A large operating loss or charge against net capital could adversely affect our ability to expand or even maintain our present levels of business.
The requirement to ensure accessibility of our websites and web-based applications to persons with rights under the Americans with Disabilities Act and other state or federal laws may result in increased cost and difficulty of compliance with evolving regulatory standards.
The Americans with Disabilities Act is a federal law that prohibits discrimination on the basis of disability in public accommodations and employment. As federal and state standards evolve to require an ever-increasing number of public spaces, including web-based applications, to be made accessible to the disabled, we could be required to make modifications to our internet-based applications or to our other client-facing technologies, including our website, to provide enhanced or accessible service to, or make reasonable accommodations for, disabled persons. This adaptation of our websites and web-based applications and materials could result in increased costs and may affect the products and services we provide to clients. Failure to comply with federal or state standards could result in litigation, including class action lawsuits.
Failure to comply with ERISA regulations and certain retirement plan regulations could result in penalties against us.
As discussed above, we are subject to ERISA and Section 4975 of the Code, and to regulations promulgated thereunder, insofar as we provide services with respect to plan clients, or otherwise deal with plan clients that are subject to ERISA or the Code. ERISA imposes certain duties on persons who are "fiduciaries" (as defined in Section 3(21) of ERISA) and prohibits certain transactions involving plans subject to ERISA and fiduciaries or other service providers to such plans. Non-compliance with or breaches of these provisions may expose an ERISA fiduciary or other service provider to liability under ERISA, which may include monetary and criminal penalties as well as equitable remedies for the affected plan. Section 4975 of the Code prohibits certain transactions involving “plans” (as defined in Section 4975(e)(1)), which include, for example, IRAs, and service providers, including fiduciaries (as defined in Section 4975(e)(3)) to such plans. Section 4975 also imposes excises taxes for violations of these prohibitions.
Our failure to comply with ERISA and the Code could result in significant penalties against us that could have a material adverse effect on our business (or, in a worst case, severely limit the extent to which we could act as fiduciaries for or provide services to these plans).
Risks Related to Our Competition
We operate in an intensely competitive industry, which could cause us to lose advisors and their assets, thereby reducing our revenues and net income.
We are subject to competition in all aspects of our business, including competition for our advisors and their clients, from:
• | asset management firms; |
• | commercial banks and thrift institutions; |
• | insurance companies; |
• | other clearing/custodial technology companies; and |
• | brokerage and investment banking firms. |
Many of our competitors have substantially greater resources than we do and may offer a broader range of services, including financial products, across more markets. Some operate in a different regulatory environment than we do, which may give them certain competitive advantages in the services they offer. For example, certain of our competitors only provide clearing services and consequently would not have any supervision or oversight liability relating to actions of their financial advisors. We believe that competition within our industry will intensify as a result of consolidation and acquisition activity and because new competitors face few barriers to entry, which could adversely affect our ability to recruit new advisors and retain existing advisors.
If we fail to continue to attract highly qualified advisors or advisors licensed with us leave us to pursue other opportunities, or if current or potential clients of our advisors decide to use one of our competitors, we could face a significant decline in market share, commission and fee revenues and net income. If we are required to increase
17
our payout of commissions and fees to our advisors in order to remain competitive, our net income could be significantly reduced.
Poor service or performance of the financial products that we offer or competitive pressures on pricing of such services or products may cause clients of our advisors to withdraw their assets on short notice.
Clients of our advisors control their assets under management with us. Poor service or performance of the financial products that we offer, the emergence of new financial products or services from others, or competitive pressures on pricing of such services or products may result in the loss of accounts. In addition, we must monitor the pricing of our services and financial products in relation to competitors and periodically may need to adjust commission and fee rates, interest rates on deposits and margin loans, and other fee structures to remain competitive. Competition from other financial services firms, such as reduced commissions to attract clients or trading volume, direct-to-investor online financial services, or higher deposit rates to attract client cash balances, could adversely impact our business. The decrease in revenue that could result from such an event could have a material adverse effect on our business.
We face competition in attracting and retaining key talent.
Our success and future growth depends upon our ability to attract and retain qualified employees. There is significant competition for qualified employees in the broker-dealer industry. Each of our executive officers is an employee at will and none has an employment agreement. We may not be able to retain our existing employees or fill new positions or vacancies created by expansion or turnover. The loss or unavailability of these individuals could have a material adverse effect on our business.
Moreover, our success depends upon the continued services of our key senior management personnel, including our executive officers and senior managers. The loss of one or more of our key senior management personnel, and the failure to recruit a suitable replacement or replacements, could have a material adverse effect on our business.
Risks Related to Our Debt
Our indebtedness could adversely affect our financial health and may limit our ability to use debt to fund future capital needs.
At December 31, 2016, we had total indebtedness of $2.2 billion. Our level of indebtedness could increase our vulnerability to general adverse economic and industry conditions. It could also require us to dedicate a substantial portion of our cash flow from operations to payments on our indebtedness, thereby reducing the availability of our cash flow to fund working capital, capital expenditures, and other general corporate purposes. In addition, our level of indebtedness may limit our flexibility in planning for changes in our business and the industry in which we operate, and limit our ability to borrow additional funds.
If our cash flows and capital resources are insufficient to fund our debt service obligations, we could face substantial liquidity problems and could be forced to sell assets, seek additional capital or seek to restructure or refinance our indebtedness. These alternative measures may not be successful or feasible. Our senior secured credit agreement restricts our ability to sell assets. Even if we could consummate those sales, the proceeds that we realize from them may not be adequate to meet any debt service obligations then due. Furthermore, if an event of default were to occur with respect to our senior secured credit agreement or other future indebtedness, our creditors could, among other things, accelerate the maturity of our indebtedness.
Our senior secured credit agreement permits us to incur additional indebtedness. Although our senior secured credit agreement contains restrictions on the incurrence of additional indebtedness, these restrictions are subject to a number of significant qualifications and exceptions, and the indebtedness incurred in compliance with these restrictions could be substantial. Also, these restrictions do not prevent us from incurring obligations that do not constitute “indebtedness” as defined in our senior secured credit agreement. To the extent new debt or other obligations are added to our currently anticipated debt levels, the substantial indebtedness risks described above would increase.
A credit rating downgrade would not impact the terms of our repayment obligations under our senior secured credit agreement. However, any such downgrade would negatively impact our ability to obtain comparable rates and terms on any future refinancing of our debt and could restrict our ability to incur additional indebtedness.
18
Restrictions under our senior secured credit agreement may prevent us from taking actions that we believe would be in the best interest of our business.
Our senior secured credit agreement contains customary restrictions on our activities, including covenants that may restrict us from:
• | incurring additional indebtedness or issuing disqualified stock or preferred stock; |
• | paying dividends on, redeeming or repurchasing our capital stock; |
• | making investments or acquisitions; |
• | creating liens; |
• | selling assets; |
• | guaranteeing indebtedness; |
• | engaging in transactions with affiliates; and |
• | consolidating, merging, or transferring all or substantially all of our assets. |
We are also required to meet specified leverage ratio and interest coverage ratio tests. These restrictions may prevent us from taking actions that we believe would be in the best interest of our business. Our ability to comply with these restrictive covenants will depend on our future performance, which may be affected by events beyond our control. If we violate any of these covenants and are unable to obtain waivers, we would be in default under our senior secured credit agreement and payment of the indebtedness could be accelerated. Acceleration of our indebtedness under our senior secured credit agreement may permit acceleration of indebtedness under other agreements that contain cross-default or cross-acceleration provisions. If our indebtedness is accelerated, we may not be able to repay that indebtedness or borrow sufficient funds to refinance it. Even if we are able to obtain new financing, it may not be on commercially reasonable terms or on terms that are acceptable to us. If our indebtedness is in default for any reason, our business could be materially and adversely affected. In addition, complying with these covenants may also cause us to take actions that are not favorable to holders of our common stock and may make it more difficult for us to successfully execute our business strategy and compete against companies that are not subject to such restrictions.
Provisions of our senior secured credit agreement could discourage an acquisition of us by a third party.
Certain provisions of our senior secured credit agreement could make it more difficult or more expensive for a third party to acquire us, and any of our future debt agreements may contain similar provisions. Upon the occurrence of certain transactions constituting a change of control, all indebtedness under our senior secured credit agreement may be accelerated and become due and payable. A potential acquirer may not have sufficient financial resources to purchase our outstanding indebtedness in connection with a change of control.
Risks Related to Our Technology
We rely on technology in our business, and technology and execution failures could subject us to losses, litigation, and regulatory actions.
Our business relies extensively on electronic data processing and communications systems. In addition to better serving our advisors and their clients, the effective use of technology increases efficiency and enables firms like ours to reduce costs and support our regulatory compliance and reporting functions. Our continued success will depend, in part, upon:
• | our ability to successfully maintain and upgrade the capability of our systems; |
• | our ability to address the needs of our advisors and their clients by using technology to provide products and services that satisfy their demands; |
• | our ability to use technology effectively to support our regulatory compliance and reporting functions; and |
• | our ability to retain skilled information technology employees. |
Extraordinary trading volumes, beyond reasonably foreseeable spikes in volumes, could cause our computer systems to operate at an unacceptably slow speed or even fail. Failure of our systems, which could result from these or other events beyond our control, or an inability or failure to effectively upgrade those systems or implement new technology-driven products or services, could result in financial losses, unanticipated disruptions in service to clients, liability to our advisors' clients, regulatory sanctions, and damage to our reputation.
Our operations rely on the secure processing, storage, and transmission of confidential and other information in our computer systems and networks, including personally identifiable information of advisors and their clients.
19
Although we take protective measures and endeavor to modify them as circumstances warrant, the computer systems, software, and networks may be vulnerable to unauthorized access, human error, computer viruses, denial-of-service attacks, malicious code, and other events that could impact the security, reliability, and availability of our systems. If one or more of these events occur, this could jeopardize our own, our advisors’ or their clients’, or counterparties’ confidential and other information processed, stored in and transmitted through our computer systems and networks, or otherwise cause interruptions or malfunctions in our own, our advisors’ or their clients’, our counterparties’, or third parties’ operations. We may be required to expend significant additional resources to modify our protective measures, to investigate and remediate vulnerabilities or other exposures, to make required notifications, or to update our technologies, websites and web-based applications to comply with industry and regulatory standards (including under the Americans with Disabilities Act) and we may be subject to litigation, regulatory sanctions, and financial losses that are either not insured or are not fully covered through any insurance we maintain. Cybersecurity requires ongoing investment and diligence against evolving threats and is subject to federal and state regulation relating to the protection of confidential information. New regulations may be promulgated by relevant federal and state authorities at any time and compliance with regulatory expectations may become increasingly complex as more state regulatory authorities issue or amend regulations governing handling of confidential information by companies within their jurisdiction. Compliance with these regulations also could be costly and disruptive to our operations and we cannot provide assurance that the impact of these regulations would not, either individually or collectively, be material to our business. See also "Our networks may be vulnerable to security risks" below.
The securities settlement process exposes us to risks that may expose our advisors and us to adverse movements in price.
LPL Financial LLC provides clearing services and trade processing for our advisors and their clients and certain financial institutions. Broker-dealers that clear their own trades are subject to substantially more regulatory requirements than brokers that outsource these functions to third-party providers. Errors in performing clearing functions, including clerical, technological, and other errors related to the handling of funds and securities held by us on behalf of our advisors' clients, could lead to censures, fines, or other sanctions imposed by applicable regulatory authorities as well as losses and liability in related lawsuits and proceedings brought by our advisors’ clients and others. Any unsettled securities transactions or wrongly executed transactions may expose our advisors and us to losses resulting from adverse movements in the prices of such securities.
Our information technology systems may be vulnerable to security risks.
The secure transmission of confidential information over public networks is a critical element of our operations. As part of our normal operations, we maintain and transmit confidential information about clients of our advisors as well as proprietary information relating to our business operations. The risks related to transmitting data and using service providers outside of and storing or processing data within our network are increasing based on escalating and malicious cyber activity, including activity that originates outside of the United States.
Our application service provider systems maintain and process confidential data on behalf of advisors and their clients, some of which is critical to our advisors’ business operations. If our application service provider systems are disrupted or fail for any reason, or if our systems or facilities are infiltrated or damaged by unauthorized persons, we or our advisors could experience data loss, financial loss, harm to reputation, regulatory violations, class action and commercial litigation, and significant business interruption. In addition, vulnerabilities of our external service providers could pose security risks to client information. If any such disruption or failure occurs, we or our advisors may be exposed to unexpected liability, advisors or their clients may withdraw assets, our reputation may be tarnished, and there could be a material adverse effect on our business.
Our information technology systems may be vulnerable to unauthorized access, computer viruses, and other security problems in the future. We rely on our advisors and employees to comply with our policies and procedures to safeguard confidential data. The failure of our advisors and employees to comply with such policies and procedures could result in the loss or wrongful use of their clients’ confidential information or other sensitive information. In addition, even if we and our advisors comply with our policies and procedures, persons who circumvent security measures could infiltrate or damage our systems or facilities and wrongfully use our confidential information or clients’ confidential information or cause interruptions or malfunctions in our operations. Cyber-attacks can be designed to collect information, manipulate or corrupt data, applications, or accounts, and to disable the functioning or use of applications or technology assets. Such activity could, among other things:
• | seriously damage our reputation; |
• | allow competitors access to our proprietary business information; |
20
• | subject us to liability for a failure to safeguard client data; |
• | result in the termination of relationships with our advisors; |
• | subject us to regulatory sanctions or burdens, based on state law or the authority of the SEC and FINRA to enforce regulations regarding business continuity planning or cybersecurity; |
• | subject us to litigation by consumers, advisors, or other business partners that may suffer damages as a result of such activity; |
• | result in inaccurate financial data reporting; and |
• | require significant capital and operating expenditures to investigate and remediate the breach. |
As malicious cyber activity escalates, including activity that originates outside of the United States, the risks we face relating to transmission of data and our use of service providers outside of our network, as well as the storing or processing of data within our network, intensify. While we maintain cyber liability insurance, this insurance may not be sufficient to cover us for all losses and may not be sufficient to protect us against all such losses.
Failure to maintain technological capabilities, flaws in existing technology, difficulties in upgrading our technology platform, or the introduction of a competitive platform could have a material adverse effect on our business.
We believe that our future success will depend in part on our ability to anticipate and adapt to technological advancements required to meet the changing demands of our advisors. We depend on highly specialized and, in many cases, proprietary technology to support our business functions, including among others:
• | securities trading and custody; |
• | portfolio management; |
• | performance reporting; |
• | customer service; |
• | accounting and internal financial processes and controls; and |
• | regulatory compliance and reporting. |
Our continued success depends on our ability to effectively adopt new or adapt existing technologies to meet changing client, industry, and regulatory demands. The emergence of new industry standards and practices could render our existing systems obsolete or uncompetitive. There cannot be any assurance that another company will not design a similar or better platform that affects our competitive advantage.
Maintaining competitive technology requires us to make significant capital expenditures, both in the near term and longer-term. There cannot be any assurance that we will have sufficient funds to adequately update and expand our information technology systems, nor can there be any assurance that any upgrade or expansion efforts will be sufficiently timely, successful, and accepted by our current and prospective advisors. The process of upgrading and expanding our systems has at times caused, and may in the future cause, us to suffer system degradations, outages and failures. If our technology systems were to fail and we were unable to recover in a timely way, we would be unable to fulfill critical business functions, which could lead to a loss of advisors and could harm our reputation. A technological breakdown could also interfere with our ability to comply with financial reporting and other regulatory requirements, exposing us to disciplinary action and to liability to our advisors and their clients. Security, stability, and regulatory risks also may result from the use of infrastructure or software that is beyond their manufacturer’s stated end of life, leading to security, stability, and regulatory risks. We work to mitigate such risks through additional controls and increased modernization spending, although we cannot assure that our risk mitigation efforts will be effective, in whole or in part.
Inadequacy or disruption of our business continuity and disaster recovery plans and procedures in the event of a catastrophe could adversely affect our business.
We have made a significant investment in our infrastructure, and our operations are dependent on our ability to protect the continuity of our infrastructure against damage from catastrophe or natural disaster, breach of security, loss of power, telecommunications failure, or other natural or man-made events. A catastrophic event could have a direct negative impact on us by adversely affecting our advisors, employees, or facilities, or an indirect impact on us by adversely affecting the financial markets or the overall economy. While we have implemented business continuity and disaster recovery plans and maintain business interruption insurance, it is impossible to fully anticipate and protect against all potential catastrophes. If our business continuity and disaster recovery plans and procedures were disrupted or unsuccessful in the event of a catastrophe, we could experience a material adverse interruption of our operations.
21
We rely on outsourced service providers to perform technology, processing, and support functions.
We rely on outsourced service providers to perform certain technology, processing and support functions. For example, we have an agreement with Thomson Reuters BETA Systems, a division of Thomson Reuters ("BETA Systems"), under which they provide us key operational support, including data processing services for securities transactions and back office processing support. Our use of third-party service providers may decrease our ability to control operating risks and information technology systems risks. Any significant failures by BETA Systems or our other service providers could cause us to sustain serious operational disruptions and incur losses and could harm our reputation. If we had to change these service providers unexpectedly, we would also experience a disruption to our business, and we cannot predict the costs or time that would be required to find alternative service providers. We cannot provide any assurance that the disruption caused by a significant failure by, or change in, our service providers would not have a material adverse effect on our business. We have transitioned additional business processes to third-party service providers, which increases our reliance on outsourced providers, including off-shore providers, and the related risks described above. For example, we rely on several off-shore service providers for functions related to cash management, account transfers, information technology infrastructure and support, and document imaging, among others. To the extent third-party service providers are located in foreign jurisdictions, we are exposed to risks inherent in conducting business outside of the United States, including international economic and political conditions, and the additional costs associated with complying with foreign laws and fluctuations in currency values.
Risks Related to Our Business Generally
Any damage to our reputation could harm our business and lead to a loss of revenues and net income.
We have spent many years developing our reputation for integrity and superior client service, which is built upon our four pillars of support for our advisors: enabling technology, comprehensive clearing and compliance services, practice management programs and training, and independent research. Our ability to attract and retain advisors and employees is highly dependent upon external perceptions of our level of service, business practices, and financial condition. Damage to our reputation could cause significant harm to our business and prospects and may arise from numerous sources, including:
• | litigation or regulatory actions; |
• | failing to deliver minimum standards of service and quality; |
• | compliance failures; and |
• | unethical behavior and the misconduct of employees, advisors, or counterparties. |
Negative perceptions or publicity regarding these matters could damage our reputation among existing and potential advisors and employees. Adverse developments with respect to our industry may also, by association, negatively impact our reputation or result in greater regulatory or legislative scrutiny or litigation against us. These occurrences could lead to loss of revenue and net income.
Our business is subject to risks related to litigation, arbitration actions, and governmental and SRO investigations.
From time to time, we have been subjected to and are currently subject to legal proceedings, investigations, examinations, and inquiries arising out of our business operations, including lawsuits, arbitration claims, governmental subpoenas, regulatory, governmental or SRO inquiries or investigations, and other actions and claims. Many of our legal claims are initiated by clients of our advisors and involve the purchase or sale of investment securities, but other claims may be, and have been, initiated by state-level and federal regulatory authorities and SROs, including the SEC, FINRA, CFTC, OCC, and NFA.
The outcome of any such litigation, arbitration, and governmental and SRO investigations, including regulatory proceedings, examinations, and inquiries, cannot be predicted, and a negative outcome in such a matter has resulted and could in the future result in substantial legal liability, regulatory fines or monetary penalties, censure, loss of intellectual property rights, and injunctive or other equitable relief against us. Further, such outcome may cause us significant reputational harm and could have a material adverse effect on our business, results of operations, cash flows, or financial condition.
In our investment advisory programs, we have fiduciary obligations that require us and our advisors to act in the best interests of our advisors' clients. We may face liabilities for actual or alleged breaches of legal duties to our advisors' clients, in respect of issues related to the suitability of the financial products we make available in our open architecture product platform or the investment advice of our advisors based on their clients' investment
22
objectives (including, for example, alternative investments or exchange-traded funds). Among other considerations, the DOL Rule promulgated in 2016 and applicable beginning in 2017 (if not delayed) will establish new regulatory requirements that may introduce new grounds for legal claims, including class action litigation, against us in the future. We may also become subject to claims, allegations and legal proceedings that we infringe or misappropriate intellectual property or other proprietary rights of others. In addition, we may be subject to legal proceedings related to employment matters, including wage and hour, discrimination or harassment claims.
Our risk management policies and procedures may not be fully effective in mitigating our risk exposure in all market environments or against all types of risks.
We have adopted policies and procedures to identify, monitor and manage our operational risk. These policies and procedures, however, may not be fully effective. Some of our risk evaluation methods depend upon information provided by others and public information regarding markets, clients, or other matters that are otherwise accessible by us. In some cases, however, that information may not be accurate, complete, or up-to-date. Also, because our advisors work in decentralized offices, additional risk management challenges may exist. In addition, our existing policies and procedures and staffing levels may be insufficient to support a significant increase in our advisor population; such an increase may require us to increase our costs in order to maintain our compliance and risk management obligations or put a strain on our existing policies and procedures as we evolve to support a larger advisor population. If our policies and procedures are not fully effective or if we are not always successful in capturing all risks to which we are or may be exposed, we may suffer harm to our reputation or be subject to litigation or regulatory actions that could have a material adverse effect on our business and financial condition.
Misconduct and errors by our employees and our advisors, who operate in a decentralized environment, could harm our business.
Misconduct and errors by our employees and our advisors could result in violations of law by us, regulatory sanctions, or serious reputational or financial harm. We cannot always prevent misconduct and errors by our employees and our advisors, and the precautions we take to prevent and detect these activities may not be effective in all cases. Prevention and detection among our advisors, who are not our direct employees and some of whom tend to be located in small, decentralized offices, present additional challenges. There cannot be any assurance that misconduct and errors by our employees and advisors will not lead to a material adverse effect on our business.
Our insurance coverage may be inadequate or expensive.
We are subject to claims in the ordinary course of business. These claims may involve substantial amounts of money and involve significant defense costs. It is not always possible to prevent or detect activities giving rise to claims, and the precautions we take may not be effective in all cases.
We maintain voluntary and required insurance coverage, including, among others, general liability, property, director and officer, excess-SIPC, business interruption, cyber and data breach, errors and omissions, and fidelity bond insurance. We have self-insurance for certain potential liabilities through a wholly-owned captive insurance subsidiary. While we endeavor to self-insure and purchase coverage that is appropriate to our assessment of our risk, we are unable to predict with certainty the frequency, nature, or magnitude of claims for direct or consequential damages. In addition, certain types of potential claims for damages cannot be insured. Our business may be negatively affected if in the future some or all of our insurance proves to be inadequate or unavailable. In addition, insurance claims may harm our reputation or divert management resources away from operating our business.
Changes in United States federal income tax law could make some of the products distributed by our advisors less attractive to clients.
Some of the financial products distributed by our advisors, such as variable annuities, enjoy favorable treatment under current United States federal income tax law. Changes in United States federal income tax law, in particular with respect to variable annuity products, or with respect to tax rates on capital gains or dividends, could make some of these products less attractive to clients and, as a result, could have a material adverse effect on our business, results of operations, cash flows, or financial condition.
23
Risks Related to Ownership of Our Common Stock
The price of our common stock may be volatile and fluctuate substantially, which could result in substantial losses for our investors.
The market price of our common stock is likely to be highly volatile and may fluctuate substantially due to the following factors (in addition to the other risk factors described in this Item 1A):
• | actual or anticipated fluctuations in our results of operations, including with regard to interest rates or revenues associated with our cash sweep programs or key business lines; |
• | variance in our financial performance from the expectations of equity research analysts; |
• | conditions and trends in the markets we serve; |
• | announcements of significant new services or products by us or our competitors; |
• | additions or changes to key personnel; |
• | the commencement or outcome of litigation or regulatory actions; |
• | changes in market valuation or earnings of our competitors; |
• | the trading volume of our common stock; |
• | future sale of our equity securities; |
• | changes in the estimation of the future size and growth rate of our markets; |
• | legislation or regulatory policies, practices or actions, including developments related to the DOL Rule; |
• | political developments; and |
• | general economic conditions. |
In addition, the equity markets in general have experienced extreme price and volume fluctuations that have often been unrelated or disproportionate to the operating performance of the particular companies affected. These broad market and industry factors may materially harm the market price of our common stock irrespective of our operating performance. In addition, in the past, following periods of volatility in the overall market and the market price of a company’s securities, securities class action litigation has often been instituted against the affected company. A putative class action lawsuit has been filed against us and certain of our executive officers in federal district court alleging certain misstatements and omissions related to our share repurchases and financial performance in late 2015. This type of litigation could result in substantial costs and a diversion of our management’s attention and resources.
We are a holding company and rely on dividends, distributions, and other payments, advances, and transfers of funds from our subsidiaries to meet our debt service and other obligations.
We have no direct operations and derive all of our cash flow from our subsidiaries. Because we conduct our operations through our subsidiaries, we depend on those entities for dividends and other payments or distributions to meet any existing or future debt service and other obligations. The deterioration of the earnings from, or other available assets of, our subsidiaries for any reason could limit or impair their ability to pay dividends or other distributions to us. In addition, FINRA regulations restrict dividends in excess of 10% of a member firm’s excess net capital without FINRA’s prior approval. Compliance with this regulation may impede our ability to receive dividends from our broker-dealer subsidiary.
Our future ability to pay regular dividends to holders of our common stock or repurchase shares are subject to the discretion of our board of directors and will be limited by our ability to generate sufficient earnings and cash flows.
Our board of directors declared quarterly cash dividends on our outstanding common stock in 2016 and has from time to time authorized us to repurchase shares of the Company’s issued and outstanding shares of common stock. The declaration and payment of any future quarterly cash dividend or any additional repurchase authorizations will be subject to the board of directors' continuing determination that the declaration of future dividends or repurchase of our shares are in the best interests of our stockholders and are in compliance with applicable law. Such determinations will depend upon a number of factors that the board of directors deems relevant, including future earnings, the success of our business activities, capital requirements, alternative uses of capital, the general financial condition and future prospects of our business, and general business conditions.
The future payment of dividends or repurchases of shares will also depend on our ability to generate earnings and cash flows. If we are unable to generate sufficient earnings and cash flows from our business, we may not be able to pay dividends on our common stock or repurchase additional shares. In addition, our ability to pay cash
24
dividends on our common stock and repurchase shares is dependent on the ability of our subsidiaries to pay dividends, including compliance with limitations under our senior secured credit agreement. Our broker-dealer subsidiary is subject to requirements of the SEC, FINRA, the CFTC, and other regulators relating to liquidity, capital standards, and the use of client funds and securities, which may limit funds available for the payment of dividends to us.
Anti-takeover provisions in our certificate of incorporation and bylaws could prevent or delay a change in control of our company.
Our certificate of incorporation and our bylaws contain certain provisions that may discourage, delay, or prevent a change in our management or control over us that stockholders may consider favorable, including the following:
• | the sole ability of the board of directors to fill a vacancy created by the expansion of the board of directors; |
• | advance notice requirements for stockholder proposals and director nominations; |
• | limitations on the ability of stockholders to call special meetings and to take action by written consent; |
• | the approval of holders of at least two-thirds of the shares entitled to vote generally on the making, alteration, amendment, or repeal of our certificate of incorporation or bylaws will be required to adopt, amend, or repeal our bylaws, or amend or repeal certain provisions of our certificate of incorporation; |
• | the required approval of holders of at least two-thirds of the shares entitled to vote at an election of the directors to remove directors; and |
• | the ability of our board of directors to designate the terms of and issue new series of preferred stock, without stockholder approval, which could be used to institute a rights plan, or a poison pill, that would work to dilute the stock ownership of a potential hostile acquirer, likely preventing acquisitions that have not been approved by our board of directors. |
The existence of the foregoing provisions and anti-takeover measures could limit the price that investors might be willing to pay in the future for shares of our common stock. They could also deter potential acquirers of our company, thereby reducing the likelihood that you could receive a premium for your common stock in the acquisition.
25
Item 1B. Unresolved Staff Comments
None.
Item 2. Properties
Our corporate offices are located in Boston, Massachusetts where we lease approximately 69,000 square feet of space under a lease agreement that expires on June 30, 2023, with two five-year extensions at our option; in San Diego, California where we lease approximately 420,000 square feet of office space under a lease agreement that expires on April 30, 2029; in Fort Mill, South Carolina where we lease approximately 452,000 square feet of office space under a lease agreement that expires on November 30, 2036; and in Charlotte, North Carolina where we lease a total of approximately 174,000 square feet of space under lease agreements that expire on February 28, 2017.
We also lease smaller administrative and operational offices in various locations throughout the United States. We believe that our existing properties are adequate for the current operating requirements of our business and that additional space will be available as needed.
Item 3. Legal Proceedings
From time to time, we have been subjected to and are currently subject to legal proceedings, investigations, examinations, and inquiries arising out of our business operations, including lawsuits, arbitration claims, governmental subpoenas, regulatory, governmental or SRO inquiries or investigations, and other actions and claims. In the opinion of management, there are no matters outstanding that would have a material adverse impact on our operations, financial condition, or cash flows.
A putative class action lawsuit has been filed against the Company and certain of its executive officers in federal district court alleging certain misstatements and omissions related to the Company’s share repurchases and financial performance in late 2015. The Company intends to defend vigorously against the lawsuit.
For a discussion of legal proceedings, see Note 12. Commitments and Contingencies, within the notes to consolidated financial statements in this Annual Report on Form 10-K. Please also see “Risk Factors – Our business is subject to risks related to litigation, arbitration actions, and governmental and SRO investigations.”
Item 4. Mine Safety Disclosures
Not applicable.
26
PART II
Item 5. | Market for Registrant’s Common Equity, Related Stockholder Matters, and Issuer Purchases of Equity Securities |
Market Information
Our common stock is traded on the NASDAQ under the symbol “LPLA.” The closing sale price as of December 31, 2016 was $35.21 per share. As of that date there were 840 common stockholders of record based on information provided by our transfer agent. The number of stockholders of record does not reflect the number of individual or institutional stockholders that beneficially own the Company's stock because most stock is held in the name of nominees.
The following table shows the high and low sales prices for our common stock for the periods indicated, as reported by the NASDAQ. The prices reflect inter-dealer prices and do not include retail markups, markdowns, or commissions.
High | Low | ||||||
2016 | |||||||
Fourth Quarter | $ | 42.86 | $ | 29.09 | |||
Third Quarter | $ | 30.56 | $ | 20.51 | |||
Second Quarter | $ | 28.77 | $ | 20.95 | |||
First Quarter | $ | 43.89 | $ | 15.38 | |||
2015 | |||||||
Fourth Quarter | $ | 48.00 | $ | 36.41 | |||
Third Quarter | $ | 48.18 | $ | 37.72 | |||
Second Quarter | $ | 48.00 | $ | 39.41 | |||
First Quarter | $ | 47.38 | $ | 39.83 | |||
27
Performance Graph
The following graph compares the cumulative total stockholder return (rounded to the nearest whole dollar) of the Company's common stock, the Standard & Poor’s 500 Financial Sector Index (the "S&P 500 Financial"), and the Dow Jones U.S. Financial Services Index (the "Dow Jones Financial") for the last five years. The graph assumes a $100 investment at the closing price on December 31, 2011 and reinvestment of the dividends on the respective dividend payment dates without commissions. This graph does not forecast future performance of the Company's stock.
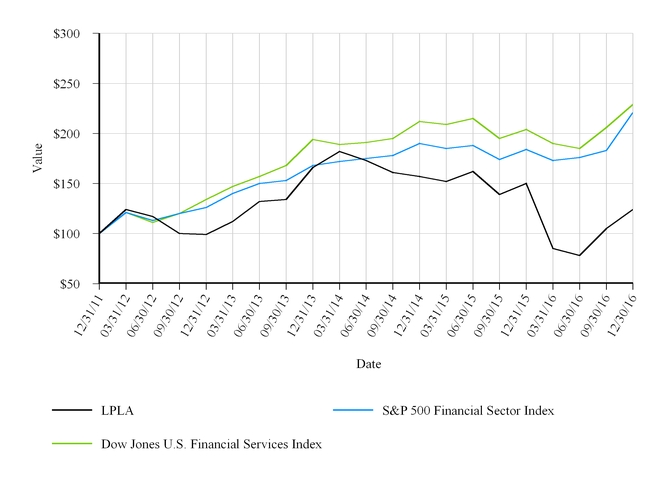
28
Dividends
Cash dividends declared per share of common stock and total cash dividends paid during each quarter for the years ended December 31, 2016 and 2015 were as follows (in millions, except per share data):
Dividend per Share Declared | Total Cash Dividend Paid | ||||||
2016 | |||||||
Fourth quarter | $ | 0.25 | $ | 22.3 | |||
Third quarter | $ | 0.25 | $ | 22.3 | |||
Second quarter | $ | 0.25 | $ | 22.3 | |||
First quarter | $ | 0.25 | $ | 22.2 | |||
2015 | |||||||
Fourth quarter | $ | 0.25 | $ | 23.8 | |||
Third quarter | $ | 0.25 | $ | 23.8 | |||
Second quarter | $ | 0.25 | $ | 24.1 | |||
First quarter | $ | 0.25 | $ | 24.2 | |||
Any future determination relating to the declaration and payment of dividends will be made at the discretion of our Board of Directors and will depend on a number of factors, including future earnings and cash flows, capital requirements, alternative uses of capital, general business conditions, our future prospects, contractual restrictions and covenants, and other factors that our board of directors may deem relevant. Our senior secured credit agreement contains restrictions on our activities, including paying dividends on our capital stock. For an explanation of these restrictions, see “Management’s Discussion and Analysis of Financial Condition and Results of Operations - Debt”. In addition, FINRA regulations restrict dividends in excess of 10% of a member firm’s excess net capital without FINRA’s prior approval, potentially impeding our ability to receive dividends from LPL Financial LLC.
Securities Authorized for Issuance Under Equity Compensation Plans
The table below sets forth information on compensation plans under which our equity securities are authorized for issuance as of December 31, 2016:
Plan category | Number of securities to be issued upon exercise of outstanding options, warrants and rights | Weighted-average exercise price of outstanding options, warrants, and rights | Number of securities remaining available for future issuance under equity compensation plans (excluding securities reflected in column (a))(1) | |||||||
(a) | (b) | (c) | ||||||||
Equity compensation plans approved by security holders | 7,126,179 | $ | 30.43 | 9,696,652 | ||||||
Equity compensation plans not approved by security holders | 27,803 | $ | 22.47 | — | ||||||
Total | 7,153,982 | $ | 30.40 | 9,696,652 | ||||||
___________________
(1) | Includes shares available for future issuance under our amended and restated 2010 Omnibus Equity Incentive Plan. |
As of December 31, 2016, we had 27,803 warrants outstanding to purchase common stock under our 2008 LPL Investment Holdings Inc. Financial Institution Incentive Plan (the “Financial Institution Incentive Plan”), which has not been approved by security holders. Grants have not been made under this plan since our initial public offering in 2010. The exercise price of the outstanding warrants is equal to the fair market value on the grant date. Warrant awards vested in equal increments over a five-year period and expire on the 10th anniversary following the date of grant.
29
Purchases of Equity Securities by the Issuer
The table below sets forth information regarding repurchases on a monthly basis during the fourth quarter of 2016:
Period | Total Number of Shares Purchased | Weighted-Average Price Paid per Share | Total Number of Shares Purchased as Part of Publicly Announced Programs(1) | Approximate Dollar Value of Shares That May Yet Be Purchased Under the Programs | ||||||||||
October 1, 2016 through October 31, 2016 | — | $ | — | — | $ | 225,000,000 | ||||||||
November 1, 2016 through November 30, 2016 | — | $ | — | — | $ | 225,000,000 | ||||||||
December 1, 2016 through December 31, 2016 | — | $ | — | — | $ | 225,000,000 | ||||||||
Total | — | $ | — | — | $ | 225,000,000 | ||||||||
_____________________
(1) | See Note 13. Stockholders' Equity, within the notes to consolidated financial statements for additional information. |
30
Item 6. Selected Financial Data
The following table sets forth selected historical financial information for the past five fiscal years. The selected historical financial information presented below should be read in conjunction with the information included under the heading “Management’s Discussion and Analysis of Financial Condition and Results of Operations” and our consolidated financial statements and related notes included elsewhere in this Annual Report on Form 10-K. We have derived the consolidated statements of income data for the years ended December 31, 2016, 2015, and 2014 and the consolidated statements of financial condition data as of December 31, 2016 and 2015 from our audited financial statements included in this Annual Report on Form 10-K. We have derived the consolidated statements of income data for the years ended December 31, 2013 and 2012 and consolidated statements of financial condition data as of December 31, 2014, 2013, and 2012 from our audited financial statements not included in this Annual Report on Form 10-K. Our historical results for any prior period are not necessarily indicative of results to be expected in any future period.
Years Ended December 31, | |||||||||||||||||||
2016 | 2015 | 2014 | 2013 | 2012 | |||||||||||||||
Consolidated statements of income data (In thousands, except per share data): | |||||||||||||||||||
Net revenues | $ | 4,049,383 | $ | 4,275,054 | $ | 4,373,662 | $ | 4,140,858 | $ | 3,661,088 | |||||||||
Total expenses | $ | 3,751,867 | $ | 3,992,499 | $ | 4,078,965 | $ | 3,849,555 | $ | 3,410,497 | |||||||||
Income before provision for income taxes | $ | 297,516 | $ | 282,555 | $ | 294,697 | $ | 291,303 | $ | 250,591 | |||||||||
Provision for income taxes | $ | 105,585 | $ | 113,771 | $ | 116,654 | $ | 109,446 | $ | 98,673 | |||||||||
Net income | $ | 191,931 | $ | 168,784 | $ | 178,043 | $ | 181,857 | $ | 151,918 | |||||||||
Per share data: | |||||||||||||||||||
Earnings per basic share | $ | 2.15 | $ | 1.77 | $ | 1.78 | $ | 1.74 | $ | 1.39 | |||||||||
Earnings per diluted share | $ | 2.13 | $ | 1.74 | $ | 1.75 | $ | 1.72 | $ | 1.37 | |||||||||
Cash dividends paid per share | $ | 1.00 | $ | 1.00 | $ | 0.96 | $ | 0.65 | $ | 2.24 | |||||||||
December 31, | |||||||||||||||||||
2016 | 2015 | 2014 | 2013 | 2012 | |||||||||||||||
Consolidated statements of financial condition data (In thousands): | |||||||||||||||||||
Cash and cash equivalents | $ | 747,709 | $ | 724,529 | $ | 412,332 | $ | 516,584 | $ | 466,261 | |||||||||
Total assets | $ | 4,834,926 | $ | 4,521,061 | $ | 4,041,930 | $ | 4,027,114 | $ | 3,968,007 | |||||||||
Total debt, net | $ | 2,175,436 | $ | 2,188,240 | $ | 1,625,195 | $ | 1,519,379 | $ | 1,297,308 | |||||||||
31
Item 7. Management’s Discussion and Analysis of Financial Condition and Results of Operations
The following discussion of our financial condition and results of operations should be read in conjunction with our consolidated financial statements and the notes to those consolidated financial statements included in Item 8 of this Form 10-K. This discussion contains forward-looking statements that involve significant risks and uncertainties. As a result of many factors, such as those set forth under “Risk Factors” and elsewhere in this Form 10-K, our actual results may differ materially from those anticipated in these forward-looking statements. Please also refer to the section under heading "Special Note Regarding Forward-Looking Statements."
Overview
We are a leader in the retail financial advice market, the nation's largest independent broker-dealer (based on total revenues, Financial Planning magazine June 1996-2016), a top custodian for registered investment advisors ("RIAs"), and a leading independent consultant to retirement plans. We provide an integrated platform of brokerage and investment advisory services to more than 14,000 independent financial advisors (our "advisors"), including financial advisors at more than 700 financial institutions across the country, enabling them to provide their retail investors ("clients") with objective financial advice through a lower conflict model. We also support approximately 4,000 financial advisors who are affiliated and licensed with insurance companies with customized clearing, advisory platforms, and technology solutions.
Through our advisors, we are one of the largest distributors of financial products and services in the United States, and we believe that we are one of the top five firms in terms of largest overall advisor base in the United States.
We believe that objective financial guidance is a fundamental need for everyone. We enable our advisors to focus on what they do best—create the personal, long-term relationships that are the foundation for turning life’s aspirations into financial realities. We do that through a singular focus on providing our advisors with the front-, middle-, and back-office support they need to serve the large and growing market for independent investment advice. We believe that LPL Financial is the only company that offers advisors the unique combination of an integrated technology platform, comprehensive self-clearing services, and open architecture access to a wide range of non-proprietary products, all delivered in an environment unencumbered by conflicts from product manufacturing, underwriting, and market-making.
We believe investors achieve better outcomes when working with a financial advisor. LPL strives to make it easy for advisors to do what is best for their clients, while protecting advisors and investors and promoting independence and choice through access to a wide range of diligently evaluated non-proprietary products.
Executive Summary
Financial Highlights
Results for the year ended December 31, 2016 included net income of $191.9 million, or $2.13 per share, which compares to $168.8 million, or $1.74 per share, for the year ended 2015. Earnings per share growth for the year benefited from increased cash sweep revenue and transaction and fee revenue, staying disciplined on expenses to create operating leverage, and a lower share count.
Asset Growth Trends
Total assets served were $509.4 billion as of December 31, 2016, up 7.1% from $475.6 billion as of December 31, 2015. Total net new assets were $5.9 billion for the year ended December 31, 2016, compared to $9.1 billion for the same period in 2015. In September 2016, an institutional client was acquired by a bank, with its own broker-dealer, and departed, which resulted in a departure of approximately $4.8 billion of net new assets.
Net new advisory assets were $13.7 billion for the year ended December 31, 2016, compared to $16.7 billion in 2015. As of December 31, 2016, our advisory assets had grown to $211.6 billion from the prior year end balance of $187.2 billion and represented 41.5% of total advisory and brokerage assets served. In addition to our corporate RIA platform, we offer a platform that serves independent RIA firms that conduct their advisory business through separate entities (“Hybrid RIAs”) operating pursuant to the Investment Advisers Act of 1940, as amended ("Advisers Act") or through their respective states' investment advisory laws and regulations, rather than through LPL Financial.
As of December 31, 2016, brokerage and advisory assets custodied on our Hybrid RIA platform had grown to $149.3 billion, compared to $118.7 billion as of the prior year end, and represented 29.3% of our total advisory and brokerage assets served.
32
Net new brokerage assets totaled outflows of ($7.8) billion for the year ended December 31, 2016, compared to outflows of ($7.6) billion in 2015. As of December 31, 2016, our brokerage assets had grown to $297.8 billion from the prior year end balance of $288.4 billion. The decrease in net new brokerage assets were a result of a departure of an institutional client, which resulted in the departure of approximately $4.1 billion of net new brokerage assets.
Gross Profit Trends
Gross profit, a non-GAAP measure, of $1,394.3 million for the year ended December 31, 2016, increased 2.7% in comparison to $1,357.7 million for the year ended December 31, 2015. Management presents gross profit, which is calculated as net revenues less commission and advisory expenses and brokerage, clearing, and exchange fees, because we believe that measure may be useful to investors in evaluating the Company’s core operating performance before indirect costs that are general and administrative in nature. See footnote 9 to the Financial Metrics table within the "How We Evaluate Our Business" section for additional information on gross profit. The increase in year-over-year gross profit was primarily due to increases in cash sweep revenue from the impact of the increases in the target range for the federal funds effective rate announcements in December 2015 and 2016, higher average cash balances, increase in transaction and fee revenues due to greater market volatility, and an increase in account termination fees that resulted from the departure of an institutional client due to an acquisition by a bank with its own broker-dealer. These increases were partially offset by decreases in commissions and advisory revenues, net of the correlated reduction in commission and advisory expenses and brokerage, clearing, and exchange fees.
Capital Management Activity
We returned $114.1 million of capital to shareholders during the year, including $89.1 million of dividends and $25.0 million of share buy backs (representing 634,651 shares).
Our Sources of Revenue
Our revenues are derived primarily from fees and commissions from products and advisory services offered by our advisors to their clients, a substantial portion of which we pay out to our advisors, as well as fees we receive from our advisors for the use of our technology, custody, clearing, trust, and reporting platforms. We also generate asset-based revenues through our cash sweep programs and the access that we provide to over 750 product providers with the following product lines:
• Alternative Investments | • Retirement Plan Products | |
• Annuities | • Separately Managed Accounts | |
• Exchange Traded Products | • Structured Products | |
• Insurance Based Products | • Unit Investment Trusts | |
• Mutual Funds | ||
Under our self-clearing platform, we custody the majority of client assets invested in these financial products, for which we provide statements, transaction processing, and ongoing account management. In return for these services, mutual funds, insurance companies, banks, and other financial product manufacturers pay us fees based on asset levels or number of accounts managed. We also earn interest from margin loans made to our advisors’ clients.
We track recurring revenue, a characterization of net revenue and a statistical measure, which we define to include our revenues from asset-based fees, advisory fees, trailing commissions, cash sweep programs, and certain other fees that are based upon accounts and advisors. Because certain recurring revenues are associated with asset balances, they will fluctuate depending on the market values and current interest rates. Accordingly, our recurring revenue can be negatively impacted by adverse external market conditions. However, recurring revenue is meaningful to us despite these fluctuations because it is not dependent upon transaction volumes or other activity-based revenues, which are more difficult to predict, particularly in declining or volatile markets.
33
The table below summarizes the sources and drivers of our revenue:
For the Year Ended December 31, 2016 | ||||||
Sources of Revenue | Primary Drivers | Net Revenues (millions) | % of Total Net Revenue | Recurring Revenues (millions) | % Recurring | |
Advisor-driven revenue with ~85%-90% payout ratio | Commission | - Sales - Transactions - Brokerage asset levels | $1,737 | 42.9% | 919 | 52.9% |
Advisory | - Corporate advisory asset levels | $1,290 | 31.9% | 1,284 | 99.5% | |
Attachment revenue retained by us | Asset-Based - Cash Sweep Fees - Sponsorship Fees - Record Keeping | - Cash balances - Interest rates - Number of accounts - Client asset levels | $556 | 13.7% | 539 | 96.9% |
Transaction and Fee - Trades - Client (Investor) Accounts - Advisor Seat and Technology | - Client activity - Number of clients - Number of advisors - Number of accounts - Premium technology subscribers | $416 | 10.3% | 248 | 59.6% | |
Other | - Margin accounts - Alternative investment transactions | $50 | 1.2% | 24 | 48.0% | |
Total | $4,049 | 100.0% | $3,014 | 74.4% | ||
We regularly review various aspects of our operations and service offerings, including our policies, procedures, and platforms, in response to marketplace developments. As needed, we implement changes to aspects of our operations and service offerings in order to position our advisors for long-term growth and to align with competitive and regulatory developments. For example, we regularly review the structure and fees of our advisory programs, including related disclosures, in the context of the changing regulatory environment for retirement accounts.
34
How We Evaluate Our Business
We focus on several business and key financial metrics in evaluating the success of our business relationships and our resulting financial position and operating performance. Our business and key financial metrics are as follows:
December 31, | |||||||||||
Business Metrics | 2016 | 2015 | 2014 | ||||||||
Brokerage and advisory assets (in billions)(1) | $ | 509.4 | $ | 475.6 | $ | 475.1 | |||||
Total brokerage and advisory net new assets (in billions)(2) | $ | 5.9 | $ | 9.1 | N/A | ||||||
Brokerage assets (in billions)(1)(3) | $ | 297.8 | $ | 288.4 | $ | 299.3 | |||||
Net new brokerage assets (in billions)(4) | $ | (7.8 | ) | $ | (7.6 | ) | N/A | ||||
Advisory assets under custody (in billions)(1)(5) | $ | 211.6 | $ | 187.2 | $ | 175.8 | |||||
Net new advisory assets (in billions)(6) | $ | 13.7 | $ | 16.7 | $ | 17.5 | |||||
Insured cash account balances (in billions)(1) | $ | 22.8 | $ | 20.9 | $ | 18.6 | |||||
Deposit cash account balances (in billions)(1) | $ | 4.4 | $ | — | $ | — | |||||
Money market account balances (in billions)(1) | $ | 4.1 | $ | 8.1 | $ | 7.4 | |||||
Advisors(7) | 14,377 | 14,054 | 14,036 | ||||||||
Years Ended December 31, | |||||||||||
Financial Metrics | 2016 | 2015 | 2014 | ||||||||
Revenue (in millions) | $ | 4,049.4 | $ | 4,275.1 | $ | 4,373.7 | |||||
Revenue increase (decrease) | (5.3 | )% | (2.3 | )% | 5.6 | % | |||||
Recurring revenue as a % of net revenue | 74.4 | % | 71.5 | % | 68.3 | % | |||||
Pre-Tax income (in millions) | $ | 297.5 | $ | 282.6 | $ | 294.7 | |||||
Net income (in millions) | $ | 191.9 | $ | 168.8 | $ | 178.0 | |||||
Earnings per share (diluted) | $ | 2.13 | $ | 1.74 | $ | 1.75 | |||||
Non-GAAP Measures:(8) | |||||||||||
Gross profit (in millions)(9) | $ | 1,394.3 | $ | 1,357.7 | $ | 1,325.9 | |||||
Gross Profit growth from prior period(9) | 2.7 | % | 2.4 | % | 6.2 | % | |||||
Gross profit as a % of net revenue(9) | 34.4 | % | 31.8 | % | 30.3 | % | |||||
____________________
(1) | Brokerage and advisory assets are comprised of assets that are custodied, networked, and non-networked and reflect market movement in addition to new assets, inclusive of new business development and net of attrition. Insured cash account balances, money market account balances, and beginning in July 2016, deposit cash account balances are also included in brokerage and advisory assets served. Set forth below are other client assets at December 31 of 2016, 2015, and 2014, including retirement plan assets and certain trust and high-net-worth assets that are custodied with third-party providers and therefore excluded from brokerage and advisory assets served (in billions): |
December 31, | |||||||||||
2016 | 2015 | 2014 | |||||||||
Retirement plan assets(a) | $ | 90.2 | $ | 83.0 | $ | 80.3 | |||||
Trust assets | $ | 1.1 | $ | 1.0 | $ | 3.0 | |||||
High-net-worth assets | $ | 84.2 | $ | 88.9 | $ | 87.3 | |||||
_______________________
(a) Retirement plan assets are held in retirement plans that are supported by advisors licensed with LPL Financial. At December 31, 2016, 2015, and 2014, our retirement plan assets represent those assets that are custodied with third-party providers of retirement plan administrative services who provide reporting feeds. Including those plans for which we receive no reporting feed, we estimate the total assets in retirement plans supported to be approximately $127.3 billion at December 31, 2016. If we receive reporting feeds in the future from providers for whom we do not currently receive feeds, we intend to include and identify such additional assets in this metric. Such additional feeds since December 31, 2015 accounted for $0.2 billion of the total retirement plan assets.
35
(2) | Represents net new assets for the twelve months ended 2016 and 2015 consisting of total inflow of funds deposited into new brokerage and advisory accounts and additional funds deposited into existing brokerage accounts that are serviced by advisors licensed with the Company's broker-dealer subsidiary, LPL Financial LLC, that are custodied, networked, and non-networked and into existing advisory accounts that are custodied in the Company's fee-based advisory platform and total outflows from all closed and existing brokerage and advisory accounts on such platforms during the period. |
(3) | Brokerage assets consists of assets serviced by advisors licensed with LPL Financial that are custodied, networked, and non-networked, and reflect market movement in addition to new assets, inclusive of new business development and net of attrition. |
(4) | Represents net new assets for the twelve months ended December 31, 2016 and 2015 consisting of total inflow of funds deposited into new brokerage accounts and additional funds deposited into existing brokerage accounts that are serviced by advisors licensed with LPL Financial that are custodied, networked, and non-networked and total outflows from all closed and existing brokerage accounts on such platforms during the same period. |
(5) | Advisory assets under custody consist of advisory assets under management in our corporate advisory platform, and Hybrid RIA assets in advisory accounts custodied at the Company. See “Results of Operations” for a tabular presentation of advisory assets under custody. |
(6) | Represents net new assets for the twelve months ended December 31, 2016, 2015, and 2014 consisting of total inflow of funds deposited into new advisory accounts and additional funds deposited into existing advisory accounts that are custodied in our fee-based advisory platforms and total outflows from all closed and existing advisory accounts custodied on such platforms during the period. |
(7) | Advisors are defined as those independent financial advisors and financial advisors at financial institutions who are licensed to do business with LPL Financial. |
(8) | Our management believes that presenting certain non-GAAP measures by excluding or including certain items can be helpful to investors and analysts who may wish to use some or all of this information to analyze our current performance, prospects, and valuation. Our management uses this non-GAAP information internally to evaluate operating performance and in formulating the budget for future periods. Our management believes that the non-GAAP measures and metrics discussed below are appropriate for evaluating the performance of the Company. |
(9) | Gross profit is calculated as net revenues less commission and advisory expenses and brokerage, clearing, and exchange fees. All other expense categories, including depreciation and amortization of fixed assets and amortization of intangible assets, are considered general and administrative in nature. Because our gross profit amounts do not include any depreciation and amortization expense, we consider our gross profit amounts to be non-GAAP measures that may not be comparable to those of others in our industry. We believe that gross profit amounts can be useful to investors because they show the Company's core operating performance before indirect costs that are general administrative in nature. |
Legal & Regulatory Matters
As a regulated entity, we are subject to regulatory oversight and inquiries related to, among other items, our compliance and supervisory systems and procedures and other controls, as well as our disclosures, supervision and reporting. The environment of additional regulation, increased regulatory compliance obligations, and enhanced regulatory enforcement has resulted in additional operational and compliance costs, as well as increased costs in the form of fines, restitution, and remediation related to regulatory matters. In the ordinary course of business, we periodically identify or become aware of purported inadequacies, deficiencies, and other issues. It is our policy to evaluate these matters for potential securities law or regulatory violations, and other potential compliance issues. It is also our policy to self-report known violations and issues as required by applicable law and regulation. When deemed probable that matters may result in financial losses, we accrue for those losses based on an estimate of possible fines, customer restitution, and losses related to the repurchase of sold securities and other losses, as applicable. Certain regulatory and other legal claims and losses may be covered through our wholly-owned captive insurance subsidiary, which is chartered with the insurance commissioner in the state of Tennessee. Our ability to estimate such costs may vary based on the current stage of evaluation and status of discussion with regulators, as applicable.
Our accruals, including those established through the captive insurance company at December 31, 2016, include estimated costs for significant regulatory matters, generally relating to the adequacy of our compliance and supervisory systems and procedures and other controls, for which we believe losses are both probable and reasonably estimable. One of the matters relates to sales of certain securities over several years, and our accrual at
36
December 31, 2016, includes an estimate for the loss we expect to incur in resolving this matter including if we were to repurchase certain affected securities at their original sales prices.
The outcome of regulatory matters could result in legal liability, regulatory fines, or monetary penalties in excess of our accruals and insurance, which could have a material adverse effect on our business, results of operations, cash flows, or financial condition. For more information on management’s loss contingency policies, see Note 12. Commitments and Contingencies, within the notes to the consolidated financial statements.
As discussed above, in April 2016, the United States Department of Labor issued the DOL Rule and related exemptions, which broaden the circumstances under which we may be considered a “fiduciary” with respect to certain accounts that are subject to ERISA, and the prohibited transaction rules of section 4975 of the Code, including many employer-sponsored retirement plans and IRAs. The DOL also finalized certain prohibited transaction exemptions that allow investment advisors to receive compensation for providing investment advice under arrangements that would otherwise be prohibited due to conflicts of interest. We are continuing to analyze and evaluate the impact of the DOL Rule and related amendments to exemptions on our clients, potential clients, and our business, if the DOL Rule becomes applicable. However, because ERISA plans and IRAs comprise a significant portion of our business, we expect that compliance with the DOL Rule and reliance on new and amended prohibited transaction exemptions will require increased legal, compliance, information technology, and other costs. Please consult the Retirement Plan Services Regulation section within Part I, "Item 1. Business" for more information about the risks associated with the DOL Rule and related exemptions and their potential impact on our operations.
Derivative Financial Instruments
In May 2013, we entered into a long-term contractual obligation (the "Agreement") with a third-party provider to enhance the quality and speed and reduce the cost of our processes by outsourcing certain functions. The Agreement provides that, on each annual anniversary date of the signing of the Agreement, the price for services (as denominated in U.S. dollars) is to be adjusted for the then-current exchange rate between the U.S. dollars and the Indian rupee. We bear the risk of currency movement at each annual reset date.
We use derivative financial instruments consisting solely of non-deliverable foreign currency contracts, all of which have been designated as cash flow hedges. Through these instruments, we believe we have mitigated foreign currency risk arising from a substantial portion of our contract obligation with the third-party provider arising from annual anniversary adjustments. We will continue to assess the effectiveness of our use of cash flow hedges to mitigate risk from foreign currency contracts.
See Note 2. Summary of Significant Accounting Policies and Note 8. Derivative Financial Instruments, within the notes to consolidated financial statements for additional information regarding our derivative financial instruments.
Acquisitions, Integrations, and Divestitures
From time to time we undertake acquisitions or divestitures based on opportunities in the competitive landscape. These activities are part of our overall growth strategy, but can distort comparability when reviewing revenue and expense trends for periods presented. There have been no material acquisitions, integrations, or divestitures during the twelve months ended December 31, 2016.
37
Economic Overview and Impact of Financial Market Events
Our business is directly and indirectly sensitive to several macroeconomic factors and the state of the United States financial markets. In the United States, economic data continues to point to fairly steady economic growth. According to the most recent estimate by the Bureau of Economic Analysis, real gross domestic product (“GDP”) growth decelerated to a 1.9% in the fourth quarter of 2016 from 3.5% in the third quarter, putting the overall growth rate over the last four quarters at 1.9%. A largely healthy labor market, relatively strong United States consumer spending, and an accommodative Federal Reserve ("Fed") have all been supportive of growth. In addition, stabilizing oil prices have helped manufacturing to rebound modestly, while services sector activity remains steady. Although there are nascent signs that economies in Europe and China may be reaccelerating, a lack of support from global growth continues to be a concern.
The economic impact of the U.K.'s vote to leave the European Union in mid-2016 has had a muted impact on the United States economy thus far. However, there are potential major policy initiatives as a result of the 2016 United States presidential election that may impact the economy in the near future. On balance, while growth of 2-3% is modest by historical standards, such a growth rate, should it continue, would still be above the Congressional Budget Office’s estimate of forecasted GDP growth, and therefore could be enough to continue to slowly tighten the labor market, push wages higher, and increase the probability of the Fed raising rates several times in 2017.
Equity market volatility increased somewhat in the fourth quarter of 2016, especially in the weeks around the United States election, but remained low relative to levels seen in early 2016. Despite the election and a Fed interest rate increase in December, measures of financial stress, while not at cycle lows, remained considerably better than levels seen early in 2016. The S&P 500 Index advanced in the fourth quarter of 2016, with virtually all of the gains coming between Election Day (November 8, 2016) and mid-December 2016. The Index hit a new all-time high in late November 2016 and continued to make new highs through mid-December 2016 before a very modest pull back into year end. The S&P 500 finished the year with a 9.5% gain for 2016 (12.0% with dividends reinvested). After the election, there was some evidence that investor confidence had improved but fund flow data and investor sentiment surveys continue to indicate caution among retail investors. Equity market leadership shifted after the election, rewarding sectors that market participants anticipated will benefit from policies enacted by the incoming Congress and new administration.
The change in sector leadership-post election in part reflected a change in interest rate behavior during the fourth quarter 2016 after the United States presidential election. Treasury yields, which started the second half of 2016 at depressed levels in response to the U.K. referendum vote rose steadily but at a modest pace over the third quarter and through Election Day. After the election, yields moved higher reflecting forecasts for better United States economic growth, less monetary policy stimulus, higher inflation and additional Fed rates increases. By mid-December 2016, the yield on the 10-year Treasury note reached as high as 2.60%, the highest reading in more than two years, and yields moved substantially higher across the yield curve during the fourth quarter.
Our business is also sensitive to current and expected short-term interest rates, which are largely driven by Fed policy. In particular, low short-term rates can depress the profitability of our cash sweep program, due to the fee compression needed to keep our rates competitive. Low current United States interest rates but with the prospect of rising rates over the long term can also have an impact on demand for fixed and variable annuity products. As was widely anticipated, at its final meeting of 2016 in December, the Fed’s policymaking arm, the Federal Open Market Committee (FOMC) raised its target for the Fed funds rate by 0.25%, putting the new target range at between 0.50% and 0.75%. The expected path of rates continues to be moderately upward according to the updated projections of FOMC members that accompanied the December 2016 meeting. If the economy, labor market, and inflation continue to track to the FOMC members’ forecast, the Fed funds effective rate would be at 1.375% by year-end 2017 and 2.125% by year-end 2018. The Fed signaled that any decision to raise rates in 2017 and beyond would be data dependent.
38
Results of Operations
The following discussion presents an analysis of our results of operations for the years ended December 31, 2016, 2015, and 2014. Where appropriate, we have identified specific events and changes that affect comparability or trends, and where possible and practical, have quantified the impact of such items.
Years Ended December 31, | Percentage Change | ||||||||||||||||
2016 | 2015 | 2014 | 2016 vs. 2015 | 2015 vs. 2014 | |||||||||||||
(In thousands) | |||||||||||||||||
Revenues | |||||||||||||||||
Commission | $ | 1,737,435 | $ | 1,976,845 | $ | 2,118,494 | (12.1 | )% | (6.7 | )% | |||||||
Advisory | 1,289,681 | 1,352,454 | 1,337,959 | (4.6 | )% | 1.1 | % | ||||||||||
Asset-based | 556,475 | 493,687 | 476,595 | 12.7 | % | 3.6 | % | ||||||||||
Transaction and fee | 415,715 | 401,948 | 369,821 | 3.4 | % | 8.7 | % | ||||||||||
Interest income, net of interest expense | 21,282 | 19,192 | 18,982 | 10.9 | % | 1.1 | % | ||||||||||
Other | 28,795 | 30,928 | 51,811 | (6.9 | )% | (40.3 | )% | ||||||||||
Net revenues | 4,049,383 | 4,275,054 | 4,373,662 | (5.3 | )% | (2.3 | )% | ||||||||||
Expenses | |||||||||||||||||
Commission and advisory | 2,600,624 | 2,864,813 | 2,998,702 | (9.2 | )% | (4.5 | )% | ||||||||||
Compensation and benefits | 436,557 | 440,049 | 421,829 | (0.8 | )% | 4.3 | % | ||||||||||
Promotional | 148,612 | 139,198 | 124,677 | 6.8 | % | 11.6 | % | ||||||||||
Depreciation and amortization | 75,928 | 73,383 | 57,977 | 3.5 | % | 26.6 | % | ||||||||||
Amortization of intangible assets | 38,035 | 38,239 | 38,868 | (0.5 | )% | (1.6 | )% | ||||||||||
Occupancy and equipment | 92,956 | 84,112 | 82,430 | 10.5 | % | 2.0 | % | ||||||||||
Professional services | 67,128 | 64,522 | 62,184 | 4.0 | % | 3.8 | % | ||||||||||
Brokerage, clearing, and exchange | 54,509 | 52,516 | 49,015 | 3.8 | % | 7.1 | % | ||||||||||
Communications and data processing | 44,453 | 46,871 | 43,823 | (5.2 | )% | 7.0 | % | ||||||||||
Restructuring charges | — | 11,967 | 34,652 | (100.0 | )% | (65.5 | )% | ||||||||||
Other | 96,587 | 117,693 | 109,327 | (17.9 | )% | 7.7 | % | ||||||||||
Total operating expenses | 3,655,389 | 3,933,363 | 4,023,484 | (7.1 | )% | (2.2 | )% | ||||||||||
Non-operating interest expense | 96,478 | 59,136 | 51,538 | 63.1 | % | 14.7 | % | ||||||||||
Loss on extinguishment of debt | — | — | 3,943 | — | % | (100.0 | )% | ||||||||||
Total expenses | 3,751,867 | 3,992,499 | 4,078,965 | (6.0 | )% | (2.1 | )% | ||||||||||
Income before provision for income taxes | 297,516 | 282,555 | 294,697 | 5.3 | % | (4.1 | )% | ||||||||||
Provision for income taxes | 105,585 | 113,771 | 116,654 | (7.2 | )% | (2.5 | )% | ||||||||||
Net income | $ | 191,931 | $ | 168,784 | $ | 178,043 | 13.7 | % | (5.2 | )% | |||||||
39
Revenues
In May 2014, the Financial Accounting Standards Board ("FASB") issued Accounting Standards Update("ASU") 2014-09, Revenue from Contracts with Customers: Topic 606, to supersede nearly all existing revenue recognition guidance under United States GAAP. In August 2015, the FASB deferred the effective date for implementation of ASU 2014-09 by one year and is now effective for annual reporting periods beginning after December 15, 2017. We expect to adopt the provisions of this guidance on January 1, 2018 using the modified retrospective approach. The adoption is expected to have no material impact on our consolidated financial statements but will impact the disclosures within the notes to the consolidated financial statements.
Commission Revenues
We generate two types of commission revenues: sales-based commissions and trailing commissions. Sales-based commission revenues, which occur whenever clients trade securities or purchase various types of investment products, primarily represent gross commissions generated by our advisors. The levels of sales-based commission revenues can vary from period to period based on the overall economic environment, number of trading days in the reporting period, and investment activity of our advisors' clients. Trailing commission revenues are recurring in nature and are earned based on the market value of investment holdings in trail-eligible assets. We earn trailing commission revenues (a commission that is paid over time, such as 12(b)-1 fees) primarily on mutual funds and variable annuities held by clients of our advisors.
The following table sets forth our commission revenue, by product category, included in our consolidated statements of income (dollars in thousands):
Years Ended December 31, | 2016 vs. 2015 | 2015 vs. 2014 | |||||||||||||||||||||||
2016 | 2015 | 2014 | $ Change | % Change | $ Change | % Change | |||||||||||||||||||
Variable annuities | $ | 686,667 | $ | 774,610 | $ | 807,634 | $ | (87,943 | ) | (11.4 | )% | $ | (33,024 | ) | (4.1 | )% | |||||||||
Mutual funds | 538,490 | 591,049 | 610,310 | (52,559 | ) | (8.9 | )% | (19,261 | ) | (3.2 | )% | ||||||||||||||
Alternative investments | 34,927 | 133,092 | 211,638 | (98,165 | ) | (73.8 | )% | (78,546 | ) | (37.1 | )% | ||||||||||||||
Fixed annuities | 185,060 | 157,975 | 160,287 | 27,085 | 17.1 | % | (2,312 | ) | (1.4 | )% | |||||||||||||||
Equities | 83,696 | 97,505 | 112,091 | (13,809 | ) | (14.2 | )% | (14,586 | ) | (13.0 | )% | ||||||||||||||
Fixed income | 86,364 | 90,940 | 85,882 | (4,576 | ) | (5.0 | )% | 5,058 | 5.9 | % | |||||||||||||||
Insurance | 74,910 | 81,108 | 78,659 | (6,198 | ) | (7.6 | )% | 2,449 | 3.1 | % | |||||||||||||||
Group annuities | 46,526 | 49,890 | 51,250 | (3,364 | ) | (6.7 | )% | (1,360 | ) | (2.7 | )% | ||||||||||||||
Other | 795 | 676 | 743 | 119 | 17.6 | % | (67 | ) | (9.0 | )% | |||||||||||||||
Total commission revenue | $ | 1,737,435 | $ | 1,976,845 | $ | 2,118,494 | $ | (239,410 | ) | (12.1 | )% | $ | (141,649 | ) | (6.7 | )% | |||||||||
40
The following table sets forth our commission revenue, by sales-based and trailing commission revenue (dollars in thousands):
Years Ended December 31, | 2016 vs. 2015 | 2015 vs. 2014 | |||||||||||||||||||||||
Sales-based | 2016 | 2015 | 2014 | $ Change | % Change | $ Change | % Change | ||||||||||||||||||
Variable annuities | $ | 245,393 | $ | 320,552 | $ | 359,547 | $ | (75,159 | ) | (23.4 | )% | $ | (38,995 | ) | (10.8 | )% | |||||||||
Mutual funds | 144,199 | 171,622 | 196,567 | (27,423 | ) | (16.0 | )% | (24,945 | ) | (12.7 | )% | ||||||||||||||
Alternative investments | 28,304 | 125,428 | 209,975 | (97,124 | ) | (77.4 | )% | (84,547 | ) | (40.3 | )% | ||||||||||||||
Fixed annuities | 174,271 | 151,450 | 157,338 | 22,821 | 15.1 | % | (5,888 | ) | (3.7 | )% | |||||||||||||||
Equities | 83,696 | 97,505 | 112,091 | (13,809 | ) | (14.2 | )% | (14,586 | ) | (13.0 | )% | ||||||||||||||
Fixed income | 66,647 | 70,430 | 66,572 | (3,783 | ) | (5.4 | )% | 3,858 | 5.8 | % | |||||||||||||||
Insurance | 69,162 | 74,370 | 71,120 | (5,208 | ) | (7.0 | )% | 3,250 | 4.6 | % | |||||||||||||||
Group annuities | 5,920 | 7,569 | 7,236 | (1,649 | ) | (21.8 | )% | 333 | 4.6 | % | |||||||||||||||
Other | 795 | 676 | 743 | 119 | 17.6 | % | (67 | ) | (9.0 | )% | |||||||||||||||
Total sales-based revenue | $ | 818,387 | $ | 1,019,602 | $ | 1,181,189 | $ | (201,215 | ) | (19.7 | )% | $ | (161,587 | ) | (13.7 | )% | |||||||||
Trailing | |||||||||||||||||||||||||
Variable annuities | $ | 441,274 | $ | 454,058 | $ | 448,087 | $ | (12,784 | ) | (2.8 | )% | $ | 5,971 | 1.3 | % | ||||||||||
Mutual funds | 394,291 | 419,427 | 413,743 | (25,136 | ) | (6.0 | )% | 5,684 | 1.4 | % | |||||||||||||||
Alternative investments | 6,623 | 7,664 | 1,663 | (1,041 | ) | (13.6 | )% | 6,001 | 360.9 | % | |||||||||||||||
Fixed annuities | 10,789 | 6,525 | 2,949 | 4,264 | 65.3 | % | 3,576 | 121.3 | % | ||||||||||||||||
Fixed income | 19,717 | 20,510 | 19,310 | (793 | ) | (3.9 | )% | 1,200 | 6.2 | % | |||||||||||||||
Insurance | 5,748 | 6,738 | 7,539 | (990 | ) | (14.7 | )% | (801 | ) | (10.6 | )% | ||||||||||||||
Group annuities | 40,606 | 42,321 | 44,014 | (1,715 | ) | (4.1 | )% | (1,693 | ) | (3.8 | )% | ||||||||||||||
Total Trailing revenue | $ | 919,048 | $ | 957,243 | $ | 937,305 | $ | (38,195 | ) | (4.0 | )% | $ | 19,938 | 2.1 | % | ||||||||||
Total commission revenue | $ | 1,737,435 | $ | 1,976,845 | $ | 2,118,494 | $ | (239,410 | ) | (12.1 | )% | $ | (141,649 | ) | (6.7 | )% | |||||||||
The decrease in sales-based commission revenue in 2016 compared with 2015 was primarily due to a decrease in activity for alternative investments, variable annuities, and mutual funds. Alternative investment sales commissions were primarily challenged by marketplace uncertainties in response to regulatory changes. Significant market volatility and investor uncertainty in the low interest rate environment led to a decline in demand for variable annuities and mutual funds and shifted investors' focus from portfolio growth to income streams with minimal risk to principal. This led to the increase in sales of fixed annuities, which pay guaranteed rates of interest and can appeal to investors wary of market volatility.
Trailing revenues are recurring in nature and the slight decrease in 2016 revenue reflects a decrease in the market value of the underlying assets.
The decrease in commission revenue in 2015 compared to 2014 was primarily due to a decrease in sales-based activity for alternative investments, fixed and variable annuities, mutual funds, and equities. Alternative investment sales commissions were challenged throughout the year, in particular non-traded real estate investment trusts (REITs), due to a maturing real estate cycle and uncertainties regarding upcoming regulatory changes. Significant market volatility and investor uncertainty in the low interest rate environment continued the decline in demand for fixed and variable annuities, mutual funds, and equities.
The slight increase in trailing revenues in 2015 compared to 2014 reflects an increase in the market value of the underlying assets.
41
The following table summarizes activity in brokerage assets that are custodied, networked, and non-networked for the periods presented (in billions):
Years Ended December 31, | |||||||||||
2016 | 2015 | 2014 | |||||||||
Beginning balance at January 1 | $ | 288.4 | $ | 299.3 | $ | 286.8 | |||||
Net new brokerage assets | (7.8 | ) | (7.6 | ) | N/A | ||||||
Market impact (1) | 17.2 | (3.3 | ) | N/A | |||||||
Ending balance at December 31 | $ | 297.8 | $ | 288.4 | $ | 299.3 | |||||
(1) | Market impact is the difference between the beginning and ending asset balance less the net new asset amounts, with the remainder representing the implied growth or decline in asset balances due to market changes over the same period of time. |
Advisory Revenues
Advisory revenues primarily represent fees charged on our corporate RIA platform provided through LPL Financial to clients of our advisors based on the value of their advisory assets. Advisory fees are billed to clients on either a calendar quarter or non-calendar quarter basis of their choice, at the beginning of that period, and are recognized as revenue ratably during the quarter. The majority of our accounts are billed in advance using values as of the last business day of each calendar quarter. The value of the assets in an advisory account on the billing date determines the amount billed, and accordingly, the revenues earned in the following three month period. Advisory revenues collected on our corporate RIA platform are proposed by the advisor and agreed to by the client and average 1.0% of the underlying assets, and can range anywhere from 0.5% to 3.0%.
We also support Hybrid RIAs, through our Hybrid RIA platform, which allows advisors to engage us for technology, clearing, and custody services, as well as access to the capabilities of our investment platforms. Most financial advisors associated with Hybrid RIAs carry their brokerage license with LPL Financial and access our fully-integrated brokerage platform under standard terms, although some financial advisors associated with Hybrid RIAs do not carry a brokerage license with us. The assets held under a Hybrid RIA's investment advisory accounts custodied with LPL Financial are included in our total advisory and brokerage assets, net new advisory assets, and advisory assets under custody metrics. However, the advisory revenue generated by a Hybrid RIA is earned by the Hybrid RIA, and accordingly is not included in our advisory revenue. We charge separate fees to Hybrid RIAs for technology, clearing, administrative, and custody services. The administrative fees collected on our Hybrid RIA platform vary and can reach a maximum of 0.6% of the underlying assets.
Furthermore, we support certain financial advisors at broker-dealers affiliated with insurance companies through our customized advisory platforms and charge fees to these advisors based on the value of assets within these advisory accounts.
The following table summarizes activity in advisory assets under custody for the periods presented (in billions):
Years Ended December 31, | |||||||||||
2016 | 2015 | 2014 | |||||||||
Beginning balance at January 1 | $ | 187.2 | $ | 175.8 | $ | 151.6 | |||||
Net new advisory assets | 13.7 | 16.7 | 17.5 | ||||||||
Market impact (1) | 10.7 | (5.3 | ) | 6.7 | |||||||
Ending balance at December 31 | $ | 211.6 | $ | 187.2 | $ | 175.8 | |||||
(1) | Market impact is the difference between the beginning and ending asset balance less the net new asset amounts, with the remainder representing the implied growth or decline in asset balances due to market changes over the same period of time. |
Net new advisory assets for the years ended December 31, 2016, 2015, and 2014 had a limited impact on advisory fee revenue for those respective periods. Rather, net new advisory assets are a primary driver of future advisory fee revenue and have resulted from recruiting of new advisors to our Hybrid RIA platform and the continued shift by our existing advisors from brokerage towards more advisory business. With advisory fees for the period calculated based on the ending market value of the immediately preceding period, revenues for any particular quarter are primarily driven by each of the prior quarter's month-end advisory assets under management. The growth in advisory revenue from 2014 to 2015 and then again in 2016 was due to net new advisory assets
42
resulting from our recruiting efforts and strong advisor productivity, as well as market gains as represented by higher levels of the S&P 500 index.
Assets on our Hybrid RIA platform have been growing rapidly through the recruiting of new advisors and the transition of existing advisors onto that platform. This continued shift of advisors to our Hybrid RIA platform has caused the growth in advisory revenue to appear to lag behind the rate of growth of advisory assets under custody, as we earn administrative and other fees discussed above as opposed to earning advisory fees.
The following table summarizes the composition of total advisory assets under custody for the periods noted (in billions):
December 31, | 2016 vs. 2015 | 2015 vs. 2014 | |||||||||||||||||||||||
2016 | 2015 | 2014 | $ Change | % Change | $ Change | % Change | |||||||||||||||||||
Advisory assets under management(1) | $ | 127.0 | $ | 121.4 | $ | 125.1 | $ | 5.6 | 4.6 | % | $ | (3.7 | ) | (3.0 | )% | ||||||||||
Hybrid RIA assets in advisory accounts custodied by LPL Financial | 84.6 | 65.8 | 50.7 | 18.8 | 28.6 | % | 15.1 | 29.8 | % | ||||||||||||||||
Total advisory assets under custody | $ | 211.6 | $ | 187.2 | $ | 175.8 | $ | 24.4 | 13.0 | % | $ | 11.4 | 6.5 | % | |||||||||||
_______________________________
(1) | Consists of advisory assets under management on our corporate advisory platform. |
Asset-Based Revenues
Asset-based revenues are comprised of our sponsorship programs with financial product manufacturers, omnibus processing and networking services, and fees from cash sweep programs. We receive fees from certain financial product manufacturers in connection with sponsorship programs that support our marketing and sales education and training efforts. Omnibus processing revenues are paid to us by mutual fund product sponsors and are based on the value of custodied assets in advisory accounts and the number of brokerage accounts in which the related mutual fund positions are held. Networking revenues on brokerage assets are correlated to the number of positions we administer and are paid to us by mutual fund and annuity product manufacturers. Pursuant to contractual arrangements, uninvested cash balances in our advisors’ client accounts are swept into either insured cash accounts at various banks or third-party money market funds for which we receive fees, including administrative and recordkeeping fees based on account type and the invested balances.
Asset-based revenues for the year ended December 31, 2016, increased to $556.5 million, or 12.7%, from $493.7 million compared with the same period in 2015. The increase is due primarily to increased revenues from our cash sweep programs. Cash sweep revenues increased to $173.7 million for the year ended December 31, 2016, from $95.3 million for the year ended December 31, 2015, due primarily to the impact of the increase in the target range for the federal funds effective rate and an increase in average assets in our cash sweep program as investors increased the balances of their assets held in cash in response to the volatility in the financial markets. Our average assets in our cash sweep assets had grown to $29.9 billion from $25.8 billion, an increase of 15.9%, for the years ended December 31, 2016 and 2015, respectively. The increase in cash sweep revenue was partially offset by a 3.9% decrease in other asset-based revenues, due in part to lower average billable assets.
Asset-based revenues for the year ended December 31, 2015 increased to $493.7 million, or 3.6%, from $476.6 million for the year ended December 31, 2014. The increase was due to increased fees from omnibus processing services resulting from higher average market indices on the value of those underlying assets and increased revenues from product sponsors related to favorable terms on renegotiated contracts, partially offset by decreased revenues from our cash sweep programs. Cash sweep revenue decreased to $95.3 million in 2015 from $99.7 million in 2014 due to fee compression that resulted from a repricing of certain underlying contracts, partially offset by an increase in average assets in our cash sweep programs as investors increased the balances of their assets held in cash in response to the volatility in the financial markets. As of December 31, 2015, our cash sweep assets had grown to $29.0 billion from $26.0 billion as of December 31, 2014, with average cash sweep assets of $25.8 billion and $23.9 billion during the years ended December 31, 2015 and 2014, respectively. The increases in average asset balances were offset by a slight decrease in our average cash sweep yield from 42 basis points to 37 basis points for the years ended December 31, 2015 and 2014, respectively.
43
Transaction and Fee Revenues
Transaction revenues primarily include fees we charge to our advisors and their clients for executing certain transactions in brokerage and fee-based advisory accounts. Fee revenues primarily include IRA custodian fees, contract and licensing fees, and other client account fees. In addition, we host certain advisor conferences that serve as training, education, sales, and marketing events, for which we charge a fee for attendance.
Transaction and fee revenues increased in 2016 compared to 2015 primarily due to higher transaction volumes on eligible trades and fees generated from advisory programs due to greater market volatility as well as the increase in account termination fees which resulted from the departure of an institutional client due to an acquisition by a bank with its own broker-dealer during the year.
Transaction and fee revenues increased in 2015 compared to 2014 primarily due to higher transaction volumes on eligible trades and fees generated from the introduction of our home office supervisory program.
Interest Income, Net of Interest Expense
We earn interest income, net from client margin accounts and cash equivalents. Period-over-period variances are not material and correspond to changes in the average balances of assets in margin accounts and cash equivalents.
Other Revenues
Other revenues primarily include marketing allowances received from certain financial product manufacturers, primarily those who offer alternative investments, such as non-traded REITs and business development companies, mark-to-market gains or losses on assets held by us for the advisor non-qualified deferred compensation plan and our model research portfolios, interest income from client margin accounts and cash equivalents, net of operating interest expense, and other miscellaneous revenues.
Other revenues decreased for the year ended December 31, 2016, compared to the same period in 2015 primarily due to decreases in alternative investment marketing allowances of $18.1 million associated with a decline in related sales due to marketplace uncertainties in response to regulatory changes, which were offset by the increase of $13.1 million in realized and unrealized gains on assets held in our advisor non-qualified deferred compensation plan, which are based on the market performance of the underlying investment allocations chosen by advisors in the plan.
Other revenues decreased in 2015 compared to 2014 primarily due to decreases in alternative investment marketing allowances of $14.8 million associated with a 37% decline in related sales. The remainder of the decrease was primarily the result of a change to a $3.0 million loss in 2015 from a $2.1 million gain in 2014 in realized and unrealized gains/losses on approximately $100.7 million of assets held in our advisor non-qualified deferred compensation plan. The primary driver of the loss was market performance on the underlying investment allocations chosen by advisors in the plan.
Expenses
Commission and Advisory Expenses
Commission and advisory expenses are comprised of the following: base payout amounts that are earned by and paid out to advisors and institutions based on commission and advisory revenues earned on each client's account (referred to as gross dealer concessions, or “GDC”); production bonuses earned by advisors and institutions based on the levels of commission and advisory revenues they produce; the recognition of share-based compensation expense from equity awards granted to advisors and financial institutions based on the fair value of the awards at each reporting period; and the deferred commissions and advisory fee expenses associated with mark-to-market gains or losses on the non-qualified deferred compensation plan offered to our advisors.
44
Our production payout ratio is calculated as commission and advisory expenses divided by GDC. We calculate GDC as the sum of our commission and advisory revenues, as set forth on our audited consolidated statements of income. The following table shows the components of our production payout and total payout ratios, each of which is a statistical or operating measure:
Years Ended December 31, | Change | |||||||||||||
2016 | 2015 | 2014 | 2016 vs. 2015 | 2015 vs. 2014 | ||||||||||
Base payout rate(1) | 82.77 | % | 83.22 | % | 83.71 | % | (45) bps | (49) bps | ||||||
Production based bonuses | 2.64 | % | 2.72 | % | 2.79 | % | (8) bps | (7) bps | ||||||
GDC sensitive payout | 85.41 | % | 85.94 | % | 86.50 | % | (53) bps | (56) bps | ||||||
Non-GDC sensitive payout(2) | 0.50 | % | 0.11 | % | 0.26 | % | 39 bps | (15) bps | ||||||
Total Payout Ratio | 85.91 | % | 86.05 | % | 86.76 | % | (14) bps | (71) bps | ||||||
(1) | Our production payout ratio is calculated as commission and advisory expenses, divided by GDC (see description above). |
(2) | Non-GDC sensitive payout includes share-based compensation expense from equity awards granted to advisors and financial institutions and mark-to-market gains or losses on amounts designated by advisors as deferred. |
Our total payout ratio, a statistical or operating measure, for the year ended December 31, 2016 compared with the same period in 2015 remained relatively unchanged but was primarily affected by the ongoing transition of advisors to our Hybrid RIA platform, a decrease in our production bonuses correlating to lower sales during the period, offset by higher advisor share-based compensation following increases in our stock price. Production based bonuses are based on qualified levels of commission and advisory revenues produced by advisors during a calendar year.
The decrease in our total payout ratio, a statistical or operating measure, for the year ended December 31, 2015 compared to the same period in 2014, was primarily driven by the continued transition of advisors to our Hybrid RIA platform and a decrease in our production bonuses correlating to lower sales during the period.
Compensation and Benefits Expense
Compensation and benefits expense includes salaries and wages and related employee benefits and taxes for our employees (including share-based compensation), as well as compensation for temporary employees and consultants.
Years Ended December 31, | Change | ||||||||
2016 | 2015 | 2014 | 2016 vs. 2015 | 2015 vs. 2014 | |||||
Average Number of Employees | 3,320 | 3,382 | 3,337 | (1.8)% | 1.3% | ||||
The decrease in compensation and benefits for 2016 compared with 2015, was primarily driven by the decrease in salaries associated with the decline in our average number of full-time employees combined with an increase in capitalized salary and benefits associated with technology projects, which were offset by increased bonus funding in 2016 compared with 2015.
The increase in compensation and benefits for 2015 compared with 2014, was primarily driven by increases in salary that reflects our annual merit pay increase cycle and group health insurance costs combined with the increase in the average number of employees.
Promotional Expense
Promotional expenses include costs related to our hosting of certain advisor conferences that serve as training, sales, and marketing events, as well as business development costs related to recruiting, such as transition assistance and amortization related to forgivable loans issued to advisors.
The increase in promotional expense for 2016 compared with 2015, was primarily driven by increases in business development expense associated with advisor transition assistance and advisor referral bonuses, partially offset by reduced expenses related to our annual national advisor conference.
45
The increase in promotional expense for 2015 compared with the same period in 2014, was primarily driven by increases in business development expense associated with advisor transition assistance and broker training and education.
Depreciation and Amortization Expense
Depreciation and amortization expense represents the benefits received for using long-lived assets. Those assets consist of fixed assets, which include internally developed software, hardware, leasehold improvements, and other equipment.
The increase in depreciation and amortization of $2.5 million in 2016 compared to 2015, was primarily due to increases in internally developed software and purchased hardware and software combined with the depreciation expense associated with our new office building in Fort Mill, South Carolina which completed construction in October 2016.
The increase in depreciation and amortization of $15.4 million in 2015 compared to 2014, was due to the capital expenditures in 2014 related to the relocation to our San Diego office building and the increased levels of continuing development of capitalized software.
Amortization of Intangible assets
Amortization of intangible assets is consistent over prior periods and represents the benefits received for using long-lived assets, which consist of intangible assets established through our acquisitions.
Occupancy and Equipment Expense
Occupancy and equipment expense includes the costs of leasing and maintaining our office spaces, software licensing and maintenance costs, and maintenance expenses on computer hardware and other equipment.
The increase in occupancy and equipment expense of $8.8 million in 2016 compared to 2015, was primarily due to an increase in costs related to repairs and maintenance of computer hardware and equipment as well as an increase in software licensing fees in support of our service and technology investments.
The increase in occupancy and equipment expense of $1.7 million in 2015 compared to 2014, was primarily due to an increase in non-capitalized costs related to service and technology enhancements related to software licensing fees and repairs and maintenance of computer hardware and equipment, partially offset by a decrease in rental expense.
Professional Services
Professional services includes costs paid to outside firms for assistance with legal, accounting, technology, regulatory, marketing, and general corporate matters, as well as non-capitalized costs related to service and technology enhancements.
The increase in professional services of $2.6 million in 2016 compared to 2015, was primarily due to an increase in costs associated with legal matters, partially offset by a decrease in costs related to outsourced service and technology enhancements.
The increase in professional services of $2.3 million in 2015 compared to 2014, was primarily due to an increase in non-capitalized costs related to service and technology enhancements, partially offset by an decrease in costs associated with legal matters.
Brokerage, Clearing, and Exchange Fees
Brokerage, clearing, and exchange fees include expenses originating from trading or clearing operations as well as any exchange membership fees. Changes in brokerage, clearing and exchange fees fluctuate largely in line with the volume of sales and trading activity.
Brokerage, clearing, and exchange fees have remained relatively flat and consistent with the volume of sales and trading activity in 2016 compared to 2015 and 2015 compared to 2014, respectively.
Communications and Data Processing
Communications expense consists primarily of the cost of voice and data telecommunication lines supporting our business, including connectivity to data centers, exchanges, and markets. Data processing expense consists primarily of customer statement processing and postage costs.
46
The decrease in communications and data processing expenses of $2.4 million in 2016 compared to 2015, was primarily due to reduced data and conferencing services as well as reduced customer statement processing costs.
The increase in communications and data processing expenses of $3.0 million in 2015 compared to 2014, was primarily due to an increase in customer statement processing costs.
Restructuring Charges
The restructuring charges for the year ended December 31, 2015, primarily represent expenses incurred as a result of our Service Value Commitment initiative, which was completed in 2015. These charges relate primarily to consulting fees paid to support our technology transformation as well as employee severance obligations and other related costs and non-cash charges for impairment. Also included in the 2015 restructuring charges are expenses incurred as part of the restructuring of our subsidiary, Fortigent Holdings Company, Inc. (together with its subsidiaries, "Fortigent"), which was completed in 2015.
Other Expenses
Other expenses include the estimated costs of the investigation, settlement, and resolution of regulatory matters, licensing fees, insurance, broker-dealer regulator fees, and other miscellaneous expenses.
The decrease in other expenses of $21.1 million in 2016 compared to 2015, was primarily driven by lower costs of the investigation, settlement, and resolution of regulatory matters as well as reduced travel expenses.
The increase in other expenses of $8.4 million in 2015 compared to 2014, was primarily driven by increases in our captive insurance expense.
Non-Operating Interest Expense
Non-operating interest expense represents expense for our senior secured credit facilities. Period over period variances correspond to changes in the level of outstanding indebtedness relating to these facilities.
Loss on Extinguishment of Debt
In October 2014, we amended the maturity date of certain credit facilities in our previous credit agreement and effectively increased our revolving credit facility by $150.0 million. The amendment was accounted for as a partial modification and debt extinguishment, which required that we accelerate the recognition of $3.9 million of related unamortized debt issuance costs that had no future economic benefit, and recognize that amount as a loss on extinguishment of debt.
Provision for Income Taxes
Our effective income tax rate was 35.5%, 40.3%, and 39.6% for 2016, 2015, and 2014, respectively. The decrease in our effective tax rate and income tax expense in 2016 compared to 2015 was primarily due to tax benefits associated with internally developed software that we determined in 2016.
The increase in our effective tax rate and income tax expense for 2015 compared to 2014 was primary due to change in estimates in unrecognized tax positions.
Liquidity and Capital Resources
Senior management establishes our liquidity and capital policies. These policies include senior management’s review of short- and long-term cash flow forecasts, review of monthly capital expenditures, and daily monitoring of liquidity for our subsidiaries. Decisions on the allocation of capital are based upon, among other things, projected profitability and cash flow, risks of the business, regulatory capital requirements, and future liquidity needs for strategic activities. Our Treasury Department assists in evaluating, monitoring, and controlling the business activities that impact our financial condition, liquidity and capital structure and maintains relationships with various lenders. The objectives of these policies are to support the execution of business strategies while ensuring ongoing and sufficient liquidity.
47
A summary of changes in cash flow data is provided below (in thousands):
Years Ended December 31, | |||||||||||
2016 | 2015 | 2014 | |||||||||
Net cash flows provided by (used in): | |||||||||||
Operating activities | $ | 274,837 | $ | 279,451 | $ | 232,242 | |||||
Investing activities | (125,286 | ) | (74,948 | ) | (93,132 | ) | |||||
Financing activities | (126,371 | ) | 107,694 | (243,362 | ) | ||||||
Net increase (decrease) in cash and cash equivalents | 23,180 | 312,197 | (104,252 | ) | |||||||
Cash and cash equivalents — beginning of year | 724,529 | 412,332 | 516,584 | ||||||||
Cash and cash equivalents — end of year | $ | 747,709 | $ | 724,529 | $ | 412,332 | |||||
Cash requirements and liquidity needs are primarily funded through our cash flow from operations and our capacity for additional borrowing.
Net cash provided by or used in operating activities includes changes in operating assets and liabilities, including balances related to settlement and funding of client transactions, receivables from product sponsors, and accrued commission and advisory expenses due to our advisors. Operating assets and liabilities that arise from the settlement and funding of transactions by our advisors’ clients are the principal cause of changes to our net cash from operating activities and can fluctuate significantly from day to day and period to period depending on overall trends and clients' behaviors.
Cash flows provided by operating activities decreased in 2016 when compared to 2015 primarily due to increases in clients receivable, an increase in receivable from product sponsors, and an increase in advisor loans, , partially offset by an increase in payables to clients, an increase in payables to broker-dealers and clearing organizations and accounts payable and accrued liabilities.
Cash flows provided by operating activities increased in 2015 when compared to 2014 primarily due to increases in accounts payable and accrued liabilities relating to advisor deferred compensation, self-insurance, and deferred commissions, partially offset by uses of cash associated with advisor loans.
Cash flows used in investing activities for 2016 increased when compared to 2015 primarily due to an increase in capital expenditure related to the construction of the Company's new campus in Fort Mill, South Carolina and an increase in capital expenditures for technology to support growth .
Cash flows used in investing activities during 2015 decreased in comparison to 2014 primarily due to a decrease in capital expenditures.
Cash flows used in financing activities for 2016 increased compared to the same period in 2015 were due to an increase in repayment of senior secured credit facilities, a decrease in proceeds from our revolving credit facility, and a decrease in proceeds from stock option exercises, partially offset by a decrease in repurchase of our common stock under our repurchase programs approved by our board of directors and a decrease in dividends due to lower number of shares outstanding in the current period compared to the prior period.
Cash flows provided by financing activities in 2015 increased in comparison to 2014 due to proceeds from our senior secured term loan, partially offset by repurchases of common stock.
We believe that based on current levels of operations and anticipated growth, cash flow from operations, together with other available sources of funds, which include three uncommitted lines of credit available and the revolving credit facility established through our senior secured credit agreement, will be adequate to satisfy our working capital needs, the payment of all of our obligations, and the funding of anticipated capital expenditures for the foreseeable future. In addition, we have certain capital adequacy requirements due to our registered broker-dealer subsidiary and bank trust subsidiary and have met all such requirements and expect to continue to do so for the foreseeable future. We regularly evaluate our existing indebtedness, including refinancing thereof, based on a number of factors, including our capital requirements, future prospects, contractual restrictions, the availability of refinancing on attractive terms, and general market conditions.
Share Repurchases
The Board of Directors has approved several share repurchase programs pursuant to which we may repurchase issued and outstanding shares of our common stock. Purchases may be effected in open market or privately negotiated transactions, including transactions with our affiliates, with the timing of purchases and the
48
amount of stock purchased generally determined at our discretion within the constraints of our senior secured credit agreement and general operating needs. See Note 13. Stockholders' Equity, within the notes to consolidated financial statements for additional information regarding our share repurchases.
Dividends
The payment, timing, and amount of any dividends are subject to approval by our Board as well as certain limits under our credit facilities. See Note 13. Stockholders' Equity, within the notes to consolidated financial statements for additional information regarding our dividends.
Operating Capital Requirements
Our primary requirement for working capital relates to funds we loan to our advisors’ clients for trading conducted on margin and funds we are required to maintain for regulatory capital and reserves based on the requirements of our regulators and clearing organizations, which also consider client balances and trading activities. We have several sources of funds that enable us to meet increases in working capital requirements that relate to increases in client margin activities and balances. These sources include cash and cash equivalents on hand, cash and securities segregated under federal and other regulations, and proceeds from re-pledging or selling client securities in margin accounts. When an advisor's client purchases securities on margin or uses securities as collateral to borrow from us on margin, we are permitted, pursuant to the applicable securities industry regulations, to repledge, loan, or sell securities, up to 140% of the client's margin loan balance, that collateralize those margin accounts. As of December 31, 2016, we had approximately $219.1 million of client margin loans, collateralized with securities having a fair value of approximately $306.7 million that we can repledge, loan, or sell. Of these securities, approximately $37.6 million were client-owned securities pledged to the Options Clearing Corporation as collateral to secure client obligations related to options positions. As of December 31, 2016 there were no restrictions that materially limited our ability to repledge, loan, or sell the remaining $269.1 million of client collateral.
Our other working capital needs are primarily related to advisor loans and timing associated with receivables and payables, which we have satisfied in the past from internally generated cash flows.
Notwithstanding the self-funding nature of our operations, we may sometimes be required to fund timing differences arising from the delayed receipt of client funds associated with the settlement of client transactions in securities markets. These timing differences are funded either with internally generated cash flow or, if needed, with funds drawn on our uncommitted lines of credit at our broker-dealer subsidiary LPL Financial LLC, or under our revolving credit facility.
Our registered broker-dealer, LPL Financial LLC, is subject to the SEC’s Net Capital Rule, which requires the maintenance of minimum net capital. LPL Financial LLC computes net capital requirements under the alternative method, which requires firms to maintain minimum net capital, as defined, equal to the greater of $250,000 or 2.0% of aggregate debit balances arising from client transactions. At December 31, 2016, LPL Financial LLC had net capital of $116.2 million with a minimum net capital requirement of $6.4 million.
LPL Financial LLC's ability to pay dividends greater than 10% of its excess net capital during any 35 day rolling period requires approval from FINRA. In addition, payment of dividends is restricted if LPL Financial LLC's net capital would be less than 5.0% of aggregate customer debit balances.
LPL Financial LLC also acts as an introducing broker for commodities and futures. Accordingly, its trading activities are subject to the NFA's financial requirements and it is required to maintain net capital that is in excess of or equal to the greatest of NFA's minimum financial requirements. The NFA was designated by the CFTC as LPL Financial LLC's primary regulator for such activities. Currently, the highest NFA requirement is the minimum net capital calculated and required pursuant to the SEC's Net Capital Rule.
Our subsidiary, PTC, is also subject to various regulatory capital requirements. Failure to meet the respective minimum capital requirements can initiate certain mandatory and possible additional discretionary actions by regulators that, if undertaken, could have substantial monetary and non-monetary impacts on PTC's operations.
Debt and Related Covenants
We are party to a credit agreement with our wholly-owned subsidiary, LPL Holdings, Inc., and the other parties thereto (the "Credit Agreement"). See Note 10. Debt, within the notes to consolidated financial statements for further detail.
49
The Credit Agreement contains a number of covenants that, among other things, restrict, subject to certain exceptions, our ability to:
• | incur additional indebtedness; |
• | create liens; |
• | enter into sale and leaseback transactions; |
• | engage in mergers or consolidations; |
• | sell or transfer assets; |
• | pay dividends and distributions or repurchase our capital stock; |
• | make investments, loans, or advances; |
• | prepay certain subordinated indebtedness; |
• | engage in certain transactions with affiliates; |
• | amend material agreements governing certain subordinated indebtedness; and |
• | change our lines of business. |
Credit Agreement EBITDA, a non-GAAP measure, is defined in, and calculated by management in accordance with, the Credit Agreement as “Consolidated EBITDA”, which is Consolidated Net Income (as defined in the Credit Agreement) plus interest expense, tax expense, depreciation and amortization, and adjusted to exclude certain non-cash charges and other adjustments (including unusual or non-recurring charges) and gains. We present Credit Agreement EBITDA because we believe that it can be a useful financial metric in understanding our debt capacity and covenant compliance. However, Credit Agreement EBITDA is not a measure of our financial performance under GAAP and should not be considered as an alternative to net income or any other performance measure derived in accordance with GAAP, or as an alternative to cash flows from operating activities as a measure of profitability or liquidity. In addition, our Credit Agreement-defined EBITDA measure can differ significantly from adjusted EBITDA calculated by other companies, depending on long-term strategic decisions regarding capital structure, the tax jurisdictions in which companies operate, and capital investments.
Set forth below is a reconciliation from our net income to Credit Agreement EBITDA for the twelve months ended December 31, 2016 (in thousands):
Net income | $ | 191,931 | |
Non-operating interest expense | 96,478 | ||
Provision for income taxes | 105,585 | ||
Depreciation and amortization | 75,928 | ||
Amortization of intangible assets | 38,035 | ||
EBITDA | 507,957 | ||
Credit Agreement Adjustments: | |||
Employee share-based compensation expense(1) | 20,352 | ||
Advisor share-based compensation expense(2) | 4,544 | ||
Other(3) | 19,619 | ||
Credit Agreement EBITDA(4) | $ | 552,472 | |
(1) | Represents share-based compensation for equity awards granted to employees, officers, and directors. Such awards are measured based on the grant-date fair value and recognized over the requisite service period of the individual awards, which generally equals the vesting period. |
(2) | Represents share-based compensation for equity awards granted to advisors and to financial institutions based on the fair value of the awards at each reporting period. |
(3) | Represents other items that are adjustable in accordance with our Credit Agreement to arrive at Credit Agreement EBITDA including employee severance costs, employee signing costs, employee retention or completion bonuses, and other non-recurring costs. |
(4) | Under the Credit Agreement, management calculates Credit Agreement EBITDA for a four-quarter period at the end of each fiscal quarter, and in so doing may make further adjustments to prior quarters. |
50
Our Credit Agreement prohibits us from paying dividends and distributions or repurchasing our capital stock except for limited purposes. In addition, our financial covenants consist of a total leverage ratio test and an interest coverage ratio test. Under our total leverage ratio test, we covenant not to allow the ratio of our consolidated total debt (as defined in the Credit Agreement) to our consolidated Credit Agreement EBITDA exceed certain prescribed levels set forth in the Credit Agreement. Under our interest coverage ratio test, we covenant not to allow the ratio of our consolidated EBITDA to our consolidated interest expense (as defined in the Credit Agreement) to be less than certain prescribed levels set forth in the Credit Agreement. Each of our financial ratios is measured at the end of each fiscal quarter.
As of December 31, 2016 we were in compliance with both of our financial covenants. The maximum permitted ratios under our financial covenants and actual ratios were as follows:
December 31, 2016 | ||||
Financial Ratio | Covenant Requirement* | Actual Ratio | ||
Leverage Test (Maximum) | 5.0 | 3.43 | ||
Interest Coverage (Minimum) | 3.0 | 6.05 | ||
* Beginning 01/01/2017 our leverage test covenant requirement is 4.75.
Off-Balance Sheet Arrangements
We enter into various off-balance-sheet arrangements in the ordinary course of business, primarily to meet the needs of our advisors’ clients. These arrangements include Company commitments to extend credit. For information on these arrangements, see Note 12. Commitments and Contingencies and Note 19. Financial Instruments with Off-Balance-Sheet Credit Risk and Concentrations of Credit Risk, within the notes to consolidated financial statements.
Contractual Obligations
The following table provides information with respect to our commitments and obligations as of December 31, 2016:
Payments Due by Period | |||||||||||||||||||
Total | < 1 Year | 1-3 Years | 4-5 Years | > 5 Years | |||||||||||||||
(In thousands) | |||||||||||||||||||
Leases and other obligations(1)(2) | $ | 518,914 | $ | 57,935 | $ | 95,198 | $ | 64,060 | $ | 301,721 | |||||||||
Senior secured credit facilities(3) | 2,197,360 | 26,290 | 893,323 | 619,747 | 658,000 | ||||||||||||||
Variable interest payments(4) | 375,953 | 89,481 | 160,688 | 97,422 | 28,362 | ||||||||||||||
Commitment and other fees(5) | 6,191 | 2,277 | 3,836 | 63 | 15 | ||||||||||||||
Total contractual cash obligations | $ | 3,098,418 | $ | 175,983 | $ | 1,153,045 | $ | 781,292 | $ | 988,098 | |||||||||
____________________
(1) | Includes a long-term contractual obligation with a third-party service provider for the outsourcing of certain functions. The table above includes the minimum payments due over the duration of the contract. The contractual obligation may be canceled, subject to a termination penalty that is approximately equal to the initial annual minimum payment. The amount of the termination penalty steps down ratably through the passage of time. Future minimum payments have not been reduced by this termination penalty. |
(2) | Future minimum payments for applicable leases have not been reduced by minimum sublease rental income of $8.6 million due in the future under noncancelable subleases. See Note 12. Commitment and Contingencies, within the notes to consolidated financial statements for further detail on operating lease obligations and obligations under noncancelable service contracts. |
(3) | Represents principal payments under our Credit Agreement. See Note 10. Debt, within the notes to consolidated financial statements for further detail. |
(4) | Represents variable interest payments under our Credit Agreement. Variable interest payments assume the applicable interest rates at December 31, 2016 remain unchanged. See Note 10. Debt, within the notes to consolidated financial statements for further detail. |
(5) | Represents commitment fees for unused borrowings on the revolving credit facility under our Credit Agreement and interest payments for our letter of credit. See Note 10. Debt, within the notes to consolidated financial statements for further detail. |
51
As of December 31, 2016, we have a liability for unrecognized tax benefits of $39.8 million, which we have included in income taxes payable in the consolidated statements of financial condition. This amount has been excluded from the contractual obligations table because we are unable to reasonably predict the ultimate amount or timing of future tax payments.
Fair Value of Financial Instruments
We use fair value measurements to record certain financial assets and liabilities at fair value and to determine fair value disclosures. See Note 3. Fair Value Measurements, within the notes to consolidated financial statements for a detail discussion regarding our fair value measurements.
Critical Accounting Estimates
Our consolidated financial statements are prepared in accordance with GAAP, which require management to make estimates, judgments, and assumptions that affect the amounts reported in the consolidated financial statements and accompanying notes. We believe that of our critical accounting policies, the following are noteworthy because they require management to make estimates regarding matters that are uncertain and susceptible to change where such change may result in a material adverse impact on our financial position and reported financial results:
• | Revenue Recognition |
• | Commitments and Contingencies |
• | Valuation of Goodwill and Other Intangible Assets |
• | Income Taxes |
• | Share-Based Compensation |
See Note 2. Summary of Significant Accounting Policies, within the notes to consolidated financial statements for discussion of each of these accounting policies.
Recent Accounting Pronouncements
Refer to Note 2. Summary of Significant Accounting Policies, within the notes to consolidated financial statements for a discussion of recent accounting pronouncements or changes in accounting pronouncements that are of significance or potential significance to us.
52
Item 7A. Quantitative and Qualitative Disclosures About Market Risk
Market Risk
We maintain trading securities owned and securities sold, but not yet purchased in order to facilitate client transactions, to meet a portion of our clearing deposit requirements at various clearing organizations, and to track the performance of our research models. These securities could include mutual funds, debt securities issued by the United States government, money market funds, corporate debt securities, certificates of deposit, and equity securities.
Changes in the value of our trading inventory may result from fluctuations in interest rates, credit ratings of the issuer, equity prices and the correlation among these factors. We manage our trading inventory by product type. Our activities to facilitate client transactions generally involve mutual fund activities, including dividend reinvestments. The balances are based upon pending client activities which are monitored by our Service, Trading, and Operations ("STO") department. Because these positions arise from pending client transactions, there are no specific trading or position limits. Positions held to meet clearing deposit requirements consist of United States government securities. The amount of securities deposited depends upon the requirements of the clearing organization. The level of securities deposited is monitored by the settlement area within our STO department. Our research department develops model portfolios that are used by advisors in developing client portfolios. We currently maintain approximately 216 accounts based on model portfolios. At the time a portfolio is developed, we purchase the securities in that model portfolio in an amount equal to the account minimum for a client. Account minimums vary by product and can range from $5,000 to $250,000 per model. We utilize these positions to track the performance of the research department. The limits on this activity are based at the inception of each new model.
At December 31, 2016, the fair value of our trading securities owned was $11.4 million. Securities sold, but not yet purchased were $183 thousand at December 31, 2016. The fair value of securities included within other assets was $142.0 million at December 31, 2016. See Note 3. Fair Value Measurements, within the notes to consolidated financial statements for information regarding the fair value of trading securities owned, securities sold, but not yet purchased and other assets associated with our client facilitation activities. See Note 4. Held to Maturity Securities, within the notes to consolidated financial statements for information regarding the fair value of securities held to maturity.
We do not enter into contracts involving derivatives or other similar financial instruments for trading or proprietary purposes.
In addition, we have market risk resulting from system incidents and human error, which can require trade corrections for our customers. We also have market risk on the fees we earn that are based on the market value of advisory and brokerage assets, assets on which trail commissions are paid, and assets eligible for sponsor payments.
Interest Rate Risk
We are exposed to risk associated with changes in interest rates. As of December 31, 2016, all of the outstanding debt under our Credit Agreement, $2.2 billion, was subject to floating interest rate risk. While our senior secured term loans are subject to increases in interest rates, we do not believe that a short-term change in interest rates would have a material impact on our income before taxes given assets owned, which are subject to the same, but off-setting interest rate risk
The following table summarizes the impact of increasing interest rates on our interest expense from the variable portion of our debt outstanding at December 31, 2016 (in thousands):
Outstanding at | Annual Impact of an Interest Rate Increase of | |||||||||||||||||||
Variable Interest | 10 Basis | 25 Basis | 50 Basis | 100 Basis | ||||||||||||||||
Senior Secured Term Loans | Rates | Points | Points | Points | Points | |||||||||||||||
Term Loan A | $ | 459,375 | $ | 457 | $ | 1,143 | $ | 2,286 | $ | 4,572 | ||||||||||
Term Loan B | 1,737,985 | 1,732 | 4,328 | 8,657 | 17,314 | |||||||||||||||
Variable Rate Debt Outstanding | $ | 2,197,360 | $ | 2,189 | $ | 5,471 | $ | 10,943 | $ | 21,886 | ||||||||||
See Note 10. Debt, within the notes to consolidated financial statements for additional information.
As of December 31, 2016, we offer our advisors and their clients three primary cash sweep vehicles that are interest rate sensitive: our insured cash account ("ICA") for individuals, trusts and sole proprietorships, an insured
53
deposit cash account ("DCA") for advisory IRAs, and a money market sweep vehicle involving multiple money market fund providers. While clients earn interest for balances on deposit in ICA and DCA, we earn a fee. Our fees from ICAs are based on prevailing interest rates in the current interest rate environment. Changes in interest rates and fees for the two insured bank deposit sweep vehicles are monitored by our Rate Setting Committee (the "RSC"), which governs and approves any changes to our fees. By meeting promptly around the time of Federal Open Market Committee meetings, or for other market or non-market reasons, the RSC considers financial risk of the insured bank deposit sweep vehicle relative to other products into which clients may move cash balances. The fees that we receive from the DCA vehicle are calculated as a per account fee; such fees increase as the federal funds target rate increases, subject to a cap.
Credit Risk
Credit risk is the risk of loss due to adverse changes in a borrower’s, issuer’s, or counterparty’s ability to meet its financial obligations under contractual or agreed upon terms. Credit risk includes the risk that loans we extend to advisors to facilitate their transition to our platform or to fund their business development activities are not repaid in full or on time. Credit risk also includes the risk that collateral posted with LPL by clients to support margin lending or derivative trading is insufficient to meet client’s contractual obligations to LPL. We bear credit risk on the activities of our advisors’ clients, including the execution, settlement, and financing of various transactions on behalf of these clients.
These activities are transacted on either a cash or margin basis. Our credit exposure in these transactions consists primarily of margin accounts, through which we extend credit to advisors' clients collateralized by securities in the client’s account. Under many of these agreements, we are permitted to sell, re-pledge, or loan these securities held as collateral and use these securities to enter into securities lending arrangements or to deliver to counterparties to cover short positions.
As our advisors execute margin transactions on behalf of their clients, we may incur losses if clients do not fulfill their obligations, the collateral in the client’s account is insufficient to fully cover losses from such investments, and our advisors fail to reimburse us for such losses. Our loss on margin accounts did not exceed $0.3 million during any of the years ended December 31, 2016, 2015, and 2014. We monitor exposure to industry sectors and individual securities and perform analyses on a regular basis in connection with our margin lending activities. We adjust our margin requirements if we believe our risk exposure is not appropriate based on market conditions.
We are subject to concentration risk if we extend large loans to or have large commitments with a single counterparty, borrower, or group of similar counterparties or borrowers (e.g., in the same industry), or if we accept a concentrated position as collateral for a margin loan. Receivables from and payables to clients and stock borrowing and lending activities are conducted with a large number of clients and counterparties and potential concentration is carefully monitored. We seek to limit this risk through careful review of the underlying business and the use of limits established by senior management, taking into consideration factors including the financial strength of the counterparty, the size of the position or commitment, the expected duration of the position or commitment, and other positions or commitments outstanding.
Operational Risk
Operational risk is defined as the risk of loss resulting from failed or inadequate processes or systems, actions by people, or external events. We operate in diverse markets and are reliant on the ability of our employees and information technology systems, as well as third-party service providers and their systems, to manage a large number of transactions effectively. These risks are less direct and quantifiable than credit and market risk, but managing them is critical, particularly in a rapidly changing operating environment with increasing transaction volumes and in light of increasing reliance on systems capabilities and performance as well as third-party service providers. In the event of the breakdown, obsolescence, or improper operation of systems or improper action by employees, advisors, or third-party service providers, we could suffer business disruptions, financial loss, data loss, regulatory sanctions, and damage to our reputation. Although we have developed technology business continuity and disaster recovery plans, those plans could be inadequate, disrupted, or otherwise unsuccessful in maintaining the competitiveness, stability, security, or continuity of critical systems as result of, among other things, obsolescence, improper operation, or other limitations of our current technology.
In order to assist in the mitigation and control of operational risk, we have an operational risk framework that enables assessment and reporting on operational risk across the firm. This framework helps ensure policies and procedures are in place and appropriately designed to identify and manage operational risk at appropriate levels throughout our organization and within various departments. These control mechanisms attempt to ensure that operational policies and procedures are being followed and that our employees and advisors operate within
54
established corporate policies and limits. Notwithstanding the foregoing, please consult the Risks Related to our Technology section within Part I, “Item 1A. Risk Factors” for more information about the risks associated with our technology, including risks related to security, and the potential related effects on our operations.
Regulatory and Legal Risk
The regulatory environment in which we operate is discussed in detail within Part I, “Item 1, Business Section” of this Annual Report on Form 10-K. In recent years, and during the period presented in this Annual Report on Form 10-K, we have observed regulators broaden the scope, frequency, and depth of their examinations to include greater emphasis on the quality and consistency of the industry’s execution of policies and procedures. Please consult the Risks Related to Our Regulatory Environment section within Part I, “Item 1A. Risk Factors” for more information about the risks associated with operating within our regulatory environment, and the potential related effects on our operations.
Risk Management
We employ an enterprise risk management framework ("ERM") that is intended to address key risks and responsibilities, enable us to execute our business strategy, and protect our Company and its franchise. Our framework is designed to promote clear lines of risk management accountability and a structured escalation process for key risk information and events.
We operate a three lines of defense model whereby the primary ownership and responsibility for risk and control processes is the responsibility of business and control owners who are the "first line" of defense in effectively managing risks. The first line is responsible for risk process ownership and is comprised of the business units, whose primary responsibility is for day-to-day compliance and risk management, including execution of desktop and supervisory procedures. These business owners and certain control owners implement and execute controls to manage risk, execute risk assessments, identify emerging risks, and comply with risk management policies. The second line of defense is comprised of departments within Governance, Risk, and Compliance ("GRC"), STO, Business Technology Services ("BTS"), Finance, and Human Capital and this second line of defense provides risk and control assessment and oversight. The third line of defense is independent verification of the effectiveness of internal controls and is conducted by Internal Audit or in third-party reviews.
Our risk management governance approach includes our Board of Directors (the “Board”) and certain of its committees; the Risk Oversight Committee of LPL Financial (the “ROC”) and its subcommittees; the Internal Audit Department and the GRC Department of LPL Financial; and business line management. We regularly reevaluate and, when necessary, modify our processes to improve the identification and escalation of risks and events.
Audit Committee of the Board
In addition to its other responsibilities, the Audit Committee of the Board (the “Audit Committee”) reviews our policies with respect to risk assessment and risk management, as well as our major financial risk exposures and the steps management has undertaken to control them. The Audit Committee provides reports to the Board at each of the Board’s regularly scheduled quarterly meetings.
Compensation and Human Resources Committee of the Board
In addition to its other responsibilities, the Compensation and Human Resources Committee of the Board assesses whether our compensation arrangements encourage inappropriate risk-taking, and whether risks arising from our compensation arrangements are reasonably likely to have a material adverse effect on the Company.
Risk Oversight Committee of LPL Financial
The Audit Committee has mandated that the ROC oversee our risk management activities, including those of our subsidiaries. The Chief Risk Officer of LPL Financial serves as chair, and the Deputy Chief Risk Officer serves as vice chair, of the ROC, which generally meets on a monthly basis with ad hoc meetings as necessary. Membership is comprised of the firm's Management Committee and additional Managing Directors ("members") as needed. Other members of the Company’s senior management team are also included as ex-officio members, representing the key control areas of the Company. These individuals include, but are not limited to, the Chief Compliance Officer, Brokerage; the Chief Compliance Officer, Advisory; the Chief Information Security Officer; and the Chief Privacy Officer of LPL Financial. Participation in the ROC by senior officers is intended to ensure that the ROC covers the key risk areas of the Company, including its subsidiaries, and that the ROC thoroughly reviews significant matters relating to risk priorities, policies, control procedures and related exceptions, certain new and
55
complex products and business arrangements, transactions with significant risk elements, and identified emerging risks.
The chair of the ROC provides reports to the Audit Committee at each of the Audit Committee’s regularly scheduled quarterly meetings and, as necessary or requested, to the Board. The reports generally cover topics addressed by the ROC at its meetings since the preceding report. If warranted, matters of material risk are escalated to the Audit Committee or Board more frequently.
Subcommittees of the Risk Oversight Committee
The ROC has established multiple subcommittees that cover key areas of risk. The subcommittees meet regularly and are responsible for keeping the ROC informed and escalating issues in accordance with the Company’s escalation policies. The responsibilities of such subcommittees include, for example, oversight of the approval of new and complex investment products offered to advisors’ clients; oversight of the firm's technology; issues and trends related to advisor compliance and examination findings; whistle-blower and tips hotline allegations; and oversight of disclosures related to our financial reporting.
Internal Audit Department
The Internal Audit Department provides independent verification of the effectiveness of the Company’s internal controls by conducting risk assessments and audits designed to identify and cover important risk categories. The Internal Audit Department provides regular reports to the ROC and reports to the Audit Committee at least as often as quarterly.
Control Groups
The GRC Department provides compliance oversight and guidance, and conducts various risk and other assessments to address regulatory and Company-specific risks and requirements. The GRC Department reports to the Chief Risk Officer, who reviews the results of the Company’s risk management process with the ROC, the Audit Committee, and the Board as necessary. Another key control group is the STO Risk Management team. This team identifies, defines, and remediates risk-related items within STO and acts as the liaison between STO and GRC. We also consider the Internal Audit Department to be a control group.
Business Line Management
Each business line is responsible for managing its risk, and business line management is responsible for keeping senior management, including the members of the ROC, informed of operational risk and escalating risk matters (as defined by the Company’s escalation policies). We have conducted Company-wide escalation training for our employees. Certain business lines, including STO and BTS, have dedicated personnel with responsibilities for monitoring and managing risk-related matters. Business lines are subject to oversight by the control groups, and the Finance, Legal, BTS, and Human Capital Departments also execute certain control functions and report matters to the ROC, Audit Committee, and Board as appropriate.
Policy Committee and Advisor Policies
In addition to the ERM framework, the Management Committee of LPL Financial has established a Policy Committee to provide a centralized decision-making process for material policy issues that may arise on an ad hoc basis. The membership of the Policy Committee consists of a subset of the Management Committee and currently includes: the Chief Executive Officer and President, who serves as chair of the Policy Committee, and the Managing Director, Chief Risk Officer. The Managing Director, Legal & Government Relations, serves as a non-voting member. Among other issues, the Policy Committee addresses policy conflicts and potential conflicts that may arise from time to time from legal and regulatory requirements, business proposals, and practices throughout the Company as they relate to advisor-facing or public-facing issues. The Policy Committee is responsible for analyzing such issues, and either facilitating the policy decision or conflict resolution, or making the policy decision. The Policy Committee reports the results of its decisions or other resolutions to the Management Committee on an ad hoc basis
We also have written policies and procedures that govern the conduct of business by our advisors, employees, and the terms and conditions of our relationships with product manufacturers. Our client and advisor policies address the extension of credit for client accounts, data and physical security, compliance with industry regulations, and codes of conduct and ethics to govern employee and advisor conduct, among other matters.
56
Item 8. Financial Statements and Supplementary Data
The Consolidated Financial Statements and Supplementary Data are included as an annex to this Annual Report on Form 10-K. See the Index to Consolidated Financial Statements and Supplementary Data on page F-1.
Item 9. Changes in and Disagreements with Accountants on Accounting and Financial Disclosure
None.
Item 9B. Other Information
On February 23, 2017, the Compensation and Human Resources Committee of the Board of Directors (the “Compensation Committee”) adopted the Amended and Restated LPL Financial LLC Executive Severance Plan, attached hereto as Exhibit 10.19 (the “Severance Plan”). Among other things, the Severance Plan includes revised definitions of “Cause” and “Good Reason” and provides for post-employment severance benefits relating to performance-based equity awards. The Compensation Committee also adopted on February 23, 2017 a form of employee performance stock unit award agreement, attached hereto as Exhibit 10.21, for use in granting performance share unit awards to executive officers beginning in 2017.
On February 24, 2017, the Board of Directors declared a cash dividend of $0.25 per share on the Company's outstanding common stock to be paid on March 24, 2017 to all stockholders of record on March 10, 2017.
Item 9A. Controls and Procedures
Evaluation of Disclosure Controls and Procedures
Our Disclosure Committee, with the participation of our Chief Executive Officer and Chief Financial Officer, evaluated the effectiveness of our disclosure controls and procedures, as defined in Rules 13a-15(e) and 15d-15(e) under the Securities Exchange Act of 1934, as amended, as of the end of the period covered by this report. Based on that evaluation, the Chief Executive Officer and Chief Financial Officer concluded that our disclosure controls and procedures as of the end of the period covered by this report were effective.
Change in Internal Control over Financial Reporting
There were no changes in our internal control over financial reporting that occurred during the fourth quarter ended December 31, 2016, that have materially affected, or are reasonably likely to materially affect, our internal control over financial reporting.
Management’s Annual Report on Internal Control Over Financial Reporting
Our management is responsible for establishing and maintaining adequate internal control over our financial reporting. Internal control over financial reporting is defined in Rules 13a-15(f) and 15d-15(f) under the Exchange Act as the process designed by, or under the supervision of, our Chief Executive Officer and Chief Financial Officer, and effected by our board of directors, management, and other personnel, to provide reasonable assurance regarding the reliability of our financial reporting process and the preparation of our consolidated financial statements for external purposes in accordance with generally accepted accounting principles.
Our internal control over financial reporting includes policies and procedures that pertain to the maintenance of records that, in reasonable detail, accurately and fairly reflect transactions and dispositions of assets; provide reasonable assurances that transactions are recorded as necessary to permit preparation of the consolidated financial statements in accordance with accounting principles generally accepted in the United States, and that receipts and expenditures are being made only in accordance with authorizations of management and the directors of the Company; and provide reasonable assurance regarding prevention or timely detection of unauthorized acquisition, use, or disposition of the Company’s assets that could have a material effect on our consolidated financial statements.
As of December 31, 2016, management conducted an assessment of the effectiveness of our internal control over financial reporting based on the framework established in Internal Control – Integrated Framework (2013) issued by the Committee of Sponsoring Organizations of the Treadway Commission. Based on this assessment, management has determined that our internal control over financial reporting as of December 31, 2016 was effective.
Deloitte & Touche LLP, our independent registered public accounting firm, has issued an audit report appearing on the following page on the effectiveness of our internal control over financial reporting as of December 31, 2016.
57
REPORT OF INDEPENDENT REGISTERED PUBLIC ACCOUNTING FIRM
To the Board of Directors and Stockholders of
LPL Financial Holdings Inc.
Boston, Massachusetts
We have audited the internal control over financial reporting of LPL Financial Holdings Inc. and subsidiaries (the "Company") as of December 31, 2016, based on criteria established in Internal Control — Integrated Framework (2013) issued by the Committee of Sponsoring Organizations of the Treadway Commission. The Company's management is responsible for maintaining effective internal control over financial reporting and for its assessment of the effectiveness of internal control over financial reporting, included in the accompanying management’s annual report on internal control over financial reporting. Our responsibility is to express an opinion on the Company's internal control over financial reporting based on our audit.
We conducted our audit in accordance with the standards of the Public Company Accounting Oversight Board (United States). Those standards require that we plan and perform the audit to obtain reasonable assurance about whether effective internal control over financial reporting was maintained in all material respects. Our audit included obtaining an understanding of internal control over financial reporting, assessing the risk that a material weakness exists, testing and evaluating the design and operating effectiveness of internal control based on the assessed risk, and performing such other procedures as we considered necessary in the circumstances. We believe that our audit provides a reasonable basis for our opinion.
A company's internal control over financial reporting is a process designed by, or under the supervision of, the company's principal executive and principal financial officers, or persons performing similar functions, and effected by the company's board of directors, management, and other personnel to provide reasonable assurance regarding the reliability of financial reporting and the preparation of financial statements for external purposes in accordance with generally accepted accounting principles. A company's internal control over financial reporting includes those policies and procedures that (1) pertain to the maintenance of records that, in reasonable detail, accurately and fairly reflect the transactions and dispositions of the assets of the company; (2) provide reasonable assurance that transactions are recorded as necessary to permit preparation of financial statements in accordance with generally accepted accounting principles, and that receipts and expenditures of the company are being made only in accordance with authorizations of management and directors of the company; and (3) provide reasonable assurance regarding prevention or timely detection of unauthorized acquisition, use, or disposition of the company's assets that could have a material effect on the financial statements.
Because of the inherent limitations of internal control over financial reporting, including the possibility of collusion or improper management override of controls, material misstatements due to error or fraud may not be prevented or detected on a timely basis. Also, projections of any evaluation of the effectiveness of the internal control over financial reporting to future periods are subject to the risk that the controls may become inadequate because of changes in conditions, or that the degree of compliance with the policies or procedures may deteriorate.
In our opinion, the Company maintained, in all material respects, effective internal control over financial reporting as of December 31, 2016, based on the criteria established in Internal Control — Integrated Framework (2013) issued by the Committee of Sponsoring Organizations of the Treadway Commission.
We have also audited, in accordance with the standards of the Public Company Accounting Oversight Board (United States), the consolidated financial statements as of and for the year ended December 31, 2016 of the Company and our report dated February 24, 2017 expressed an unqualified opinion on those consolidated financial statements.
/s/ DELOITTE & TOUCHE LLP
San Diego, California
February 24, 2017
58
PART III
Item 10. Directors, Executive Officers, and Corporate Governance
Other than the information relating to our executive officers provided below, the information required to be furnished pursuant to this item is incorporated by reference to the Company’s definitive proxy statement for the 2017 Annual Meeting of Stockholders.
The following table provides certain information about each of the Company’s current executive officers as of the date this Annual Report on Form 10-K has been filed with the SEC:
Name | Age | Position |
Dan H. Arnold | 52 | President and Chief Executive Officer |
Matthew J. Audette | 42 | Chief Financial Officer |
David P. Bergers | 49 | Managing Director, Legal and Government Relations, General Counsel |
Tracy Calder | 57 | Managing Director, Deputy Chief Risk Officer |
Victor P. Fetter | 48 | Managing Director, Chief Information Officer |
Thomas Gooley | 52 | Managing Director, Service, Trading, and Operations |
J. Andrew Kalbaugh | 53 | Managing Director, Divisional President, National Sales and Consulting |
Sallie R. Larsen | 63 | Managing Director, Chief Human Capital Officer |
William P. Morrissey, Jr. | 52 | Managing Director, Divisional President, Business Development |
Michelle Oroschakoff | 55 | Managing Director, Chief Risk Officer |
George B. White | 47 | Managing Director, Investor and Investment Solutions and Chief Investment Officer |
Executive Officers
Dan H. Arnold — President and Chief Executive Officer
Mr. Arnold is our president and chief executive officer. He has served as our chief executive officer since January 2017. He has served as our president since March 2015, with responsibility for our primary client-facing functions and long-term strategy for growth. In this role he led the Advisor and Institution Solutions business unit that focuses on business development, existing advisor and institution growth, enhancing the client experience, research and corporate strategy, and sponsor partnerships. Prior to that role, Mr. Arnold served as our chief financial officer from November 2012 to March 2015 and was responsible for formulating financial policy, leading the company’s capital management efforts, and ensuring the effectiveness of the organization’s financial functions. Prior to 2012, he was managing director, head of strategy, with responsibility for long-term strategic planning for the firm, product and platform development, and strategic investments, including acquisitions. He has also served as divisional president of our Institution Services business. Mr. Arnold joined our Company in January 2007 following our acquisition of UVEST. Prior to joining us, Mr. Arnold worked at UVEST for 13 years, serving most recently as president and chief operating officer. Mr. Arnold earned a B.S. in electrical engineering from Auburn University and holds an M.B.A. in finance from Georgia State University.
Matthew J. Audette — Chief Financial Officer
Mr. Audette is our chief financial officer. He is responsible for the Company’s core financial functions including: financial planning and analysis, controllership, tax, internal audit, treasury, corporate development, and investor relations. Prior to joining LPL in September 2015, he served as executive vice president and chief financial officer of E*TRADE Financial Corporation ("E*Trade") from January 2011 until June 2015. During his 16 years with E*TRADE, he led the formation of the firm’s Finance department and was a key contributor in the growth of the franchise, leading a variety of corporate transactions and capital activities. Mr. Audette began his career in the financial services practice at KPMG. Mr. Audette earned a B.S. in accounting from Virginia Polytechnic Institute and State University, popularly known as Virginia Tech.
59
David P. Bergers — Managing Director, Legal and Government Relations
Mr. Bergers is general counsel of LPL Financial Holdings Inc. and managing director of legal and government relations at LPL Financial. Mr. Bergers has more than 20 years of experience as a practicing attorney, corporate counsel and government regulator. He joined us in August 2013 from the Securities and Exchange Commission, where he served 13 years, including as director of the SEC’s Boston regional office from 2006 to 2013. During 2013 he also served as acting deputy director of the SEC's enforcement division in Washington, DC. Previously, Mr. Bergers was vice president and assistant general counsel at Tucker Anthony, an independent investment banking and brokerage firm that was later acquired by Royal Bank of Canada, and counsel to Freedom Capital Management, an affiliated investment adviser. He also was a litigator for several years with law firms in the Boston and Philadelphia areas. Mr. Bergers earned a B.A. in history from Eastern Nazarene College in Massachusetts and a J.D. from Yale Law School.
Tracy Calder - Managing Director, Deputy Chief Risk Officer
Ms. Calder is managing director, deputy chief risk officer, with oversight of the compliance and operational market and credit risk management functions. She joined us in January 2016 and is responsible for furthering our efforts to foster an environment that identifies and mitigates risk for LPL and our clients. Ms. Calder worked most recently at J.P. Morgan Securities LLC, where she served as managing director, chief compliance officer from May 2015 until December 2015. At J.P. Morgan, she led a compliance program that spanned the firm’s institutional and private client broker/dealer and registered investment advisor (RIA) businesses. She joined J.P. Morgan as managing director and head of brokerage and fiduciary compliance in August 2013. Prior to J.P. Morgan, she served as senior vice president at Wells Fargo Advisors from March 2012 to July 2013, where she led the retail compliance program for the firm’s broker/dealer. Previously, Ms. Calder spent 18 years with UBS Wealth Management Americas in a variety of legal and compliance roles, including as head of legal for the Wealth Management Advisor Group and as chief compliance officer and senior deputy general counsel for UBS Financial Services Inc. Ms. Calder earned a Bachelor of Arts from Fordham University and a J.D. from the University of North Carolina School of Law.
Victor P. Fetter — Managing Director, Chief Information Officer
Managing director and chief information officer since 2012, Mr. Fetter has oversight of our Business Technology Services business unit. He is responsible for bringing to life our commitment to invest in the people and processes necessary to deliver the best technologies in the industry for our advisors and employees. Mr. Fetter has responsibility for product development, digital transformation and technology support, security, and innovation. He also serves on the Management Committee and the Risk Oversight Committee for LPL and chairs the Technology Investment and Strategy Committee. Combined, these efforts ensure alignment of technology initiatives with strategic business priorities. Prior to joining us in December 2012, Mr. Fetter was vice president and chief information officer for Dell Online from March 2007 to December 2012, where he led the digital transformation of Dell's approach to providing global, multi-channel solutions for consumers and commercial customers. Earlier, Mr. Fetter worked at Mercer Human Resource Consulting, where he served as director of global applications development, chief information officer, and ultimately global chief information officer during his tenure. He held previous positions at Hewitt Associates LLC and Electronic Data Systems. Mr. Fetter has a B.S. in computer information systems from Spring Hill College in Mobile, AL.
Thomas Gooley — Managing Director, Service, Trading, and Operations
Mr. Gooley is the managing director of Service, Trading, and Operations at LPL Financial. In this role, he is responsible for leading our service, trading, and client-facing operations organizations, while mitigating risk, increasing efficiency, and improving the client experience. He also is responsible for driving the strategy, governance, and execution of the firm’s business process outsourcing activities in India. Prior to joining us in June 2015, he was senior managing director and chief risk officer for the Retirement and Individual Financial Services division at TIAA-CREF from August 2014 to June 2015. Previously, he worked as managing director and head of Operations for the Global Wealth and Asset Management divisions of Morgan Stanley. Earlier in his career, Mr. Gooley led equities and futures operations for Bank of America Securities after spending 12 years with Goldman Sachs in a variety of leadership roles in equities operations. Mr. Gooley holds a B.A. in political economies of industrial societies from the University of California at Berkeley and an M.B.A. from The Wharton School at the University of Pennsylvania. Mr. Gooley is also a graduate and instructor of the Securities Industry and Financial Markets Association (SIFMA) Wharton Program.
60
J. Andrew Kalbaugh — Managing Director, Divisional President, National Sales and Consulting
Mr. Kalbaugh has served as managing director and divisional president for national sales and consulting, since January 2016. He is responsible for the long-term growth, satisfaction, and retention of financial advisors and institutions and also oversees the teams supporting high net worth and registered investment advisor solutions. Previously, Mr. Kalbaugh served as managing director and divisional president of Institution Services and led business development and business consulting for all financial institutions from November 2011 to January 2016. Prior to being named managing director in 2011, Mr. Kalbaugh served as executive vice president, business consulting, for Independent Advisor Services, responsible for providing support to advisors and their practices. He joined the Company in July 2007 following the acquisition of Mutual Service Corporation ("MSC") and served as chief executive officer for MSC as well as for Associated Securities Corporation. Prior to that, he held senior positions at several financial services firms. Mr. Kalbaugh is a Certified Financial Planner and has a B.A. in business and economics from the University of Maryland.
Sallie R. Larsen — Managing Director, Chief Human Capital Officer
Ms. Larsen is our managing director, chief human capital officer. She is responsible for overseeing compensation and benefits, corporate communication, corporate real estate, human resources operations, human resources client consulting, and advisor and employee learning and development. Ms. Larsen joined us in May 2012 from the Federal Home Loan Bank/Office of Finance, where she served as the chief human resources officer from November 2009 to April 2012. In earlier roles, Ms. Larsen was a managing vice president of human resources for Capital One Financial Corporation, senior vice president of human resources for Marriott International, and vice president of human resources and communications for TRW Inc. Ms. Larsen earned a M.A. in communications from Purdue University, a B.A. in sociology from California Lutheran University, and a certificate in executive leadership coaching from Georgetown University.
William P. Morrissey, Jr. — Managing Director, Divisional President, Business Development
Mr. Morrissey has served as managing director and divisional president since January 2016. In this role, he has responsibility for attracting and recruiting new financial advisors and institutions to the firm and for driving the exploration of new markets and capabilities for growth across client groups. He also oversees the process for integrating new advisors into the firm. Prior to assuming this role, Mr. Morrissey served as managing director and divisional president of Independent Advisor Services and led business development and business consulting for all independent advisors and registered investment advisors from April 2014 to January 2016. Prior to being named managing director, Mr. Morrissey served as executive vice president of business development, Independent Advisor Services, responsible for recruiting new advisors and their practices from March 2004 to April 2014. He joined the Company in March 2004 as senior vice president of Advisory Consulting Services, responsible for overseeing and successfully building the sales, marketing, and development of LPL's advisory platforms. Before joining LPL Financial, Mr. Morrissey worked at Fidelity Investments for 17 years, most recently as senior vice president of institutional services. He received a B.A. in political science from Boston College.
Michelle Oroschakoff — Managing Director, Chief Risk Officer
Ms. Oroschakoff is managing director, chief risk officer for LPL Financial and serves as chair of our Risk Oversight Committee. She is responsible for company-wide risk management processes and controls, manages compliance and governance, and has a leading role in the Company's ongoing focus on enhancing its corporate risk profile. Ms. Oroschakoff has more than 20 years of financial services industry experience deeply rooted in legal, compliance, and risk management. She joined LPL Financial in September 2013 from Morgan Stanley, where she most recently served as managing director and Global Chief Risk Officer of the firm’s Global Wealth Management Group from 2011 to 2013. Previously, while with Morgan Stanley, she served as chief administrative officer from 2010 to 2011, as well as Chief Compliance Officer from 2006 to 2010. Earlier in her career, Ms. Oroschakoff spent 11 years in a variety of legal and compliance roles at Morgan Stanley, including associate general counsel and head of the firm’s San Francisco litigation department. She also served as the general counsel for a large and successful RIA firm, where she became familiar with the independent model. She also serves on a variety of industry committees. Ms. Oroschakoff earned a B.A. in English literature from the University of Oregon and a J.D. cum laude, Order of the Coif, from the University of Michigan.
George B. White — Managing Director, Investor and Investment Solutions and Chief Investment Officer
Mr. White has served as our managing director, investor and investment solutions and chief investment officer since January 2017. He served as managing director, research, and chief investment officer from 2009 to December 2016. He is responsible for the strategic direction and continued growth of LPL Financial's research,
61
marketing, products, and investment platforms and in 2015 he also became responsible for corporate strategy. His role includes setting the vision for superior research capabilities and enabling the delivery of conflict-free, objective investment advice for LPL Financial advisors. Prior to joining us in November 2007, Mr. White served as a managing director and director of research for Wachovia Securities for 10 years. Mr. White also was an investment analyst for Mercer Investment Consulting, where he provided investment advice to institutional clients. He started his financial services career on the buy side of the business as a research analyst for Thompson, Siegel, and Walmsley, a value-oriented asset manager. Mr. White received a B.B.A. from the College of William and Mary.
Items 11, 12, 13, and 14.
The information required by Items 11, 12, 13, and 14 is incorporated by reference from the Company’s definitive proxy statement for the 2017 Annual Meeting of Stockholders, which the Company intends to file with the SEC within 120 days of the end of the fiscal year end to which this report relates.
62
PART IV
Item 15. Exhibits and Financial Statement Schedules
(a) Consolidated Financial Statements
Our consolidated financial statements appearing on pages F-1 through F-33 are incorporated herein by reference.
(b) Exhibits
Exhibit No. | Description of Exhibit |
3.1 | Amended and Restated Certificate of Incorporation of LPL Investment Holdings Inc., dated November 23, 2010. (1) |
3.2 | Certificate of Ownership and Merger Merging LPL Financial Holdings Inc. with and into LPL Investment Holdings Inc., dated June 14, 2012. (2) |
3.3 | Certificate of Amendment to the Amended and Restated Certificate of Incorporation of LPL Financial Holdings Inc., dated May 8, 2014. (3) |
3.4 | Fifth Amended and Restated Bylaws of LPL Financial Holdings Inc. (4) |
4.1 | Stockholders’ Agreement, dated as of December 28, 2005, among LPL Investment Holdings Inc., LPL Holdings, Inc., and other stockholders party thereto. (5) |
4.2 | First Amendment to Stockholders’ Agreement dated December 28, 2005, among LPL Investment Holdings Inc., LPL Holdings, Inc. and other stockholders party thereto, dated November 23, 2010. (6) |
4.3 | Stockholders’ Agreement among the Company and Hellman & Friedman Capital Partners V, L.P., Hellman & Friedman Capital Partners V (Parallel), L.P., Hellman & Friedman Capital Associates V, L.P., TPG Partners IV, L.P., and other parties thereto, dated November 23, 2010. (7) |
4.4 | First Amendment to Stockholders’ Agreement, entered into as of September 24, 2014, by and between LPL Financial Holdings Inc., a Delaware corporation (f/k/a LPL Investment Holdings Inc., “LPL”), and TPG Partners IV, L.P., a Delaware limited partnership. (8) |
4.5 | Fifth Amended and Restated LPL Investment Holdings Inc. 2000 Stock Bonus Plan. (9) |
10.1 | Form of Indemnification Agreement. (1) |
10.2 | 2005 LPL Investment Holdings Inc. Stock Option Plan for Incentive Stock Options. (10) |
10.3 | 2005 LPL Investment Holdings Inc. Stock Option Plan for Non-Qualified Stock Options. (10) |
10.4 | LPL Investment Holdings Inc. 2008 Stock Option Plan. (11) |
10.5 | Form of LPL Investment Holdings Inc. Stock Option Agreement granted under the LPL Investment Holdings Inc. 2008 Stock Option Plan. (12) |
10.6 | LPL Investment Holdings Inc. Advisor Incentive Plan. (13) |
10.7 | LPL Investment Holdings Inc. Financial Institution Incentive Plan. (11) |
10.8 | LPL Investment Holdings Inc. 2010 Omnibus Equity Incentive Plan. (14) |
10.9 | Form of Senior Executive Stock Option Award granted under the LPL Investment Holdings Inc. 2010 Omnibus Equity Incentive Plan. (15) |
10.10 | Form of Senior Management Stock Option Award granted under the LPL Investment Holdings Inc. 2010 Omnibus Equity Incentive Plan. (15) |
10.11 | Form of Senior Executive Restricted Stock Unit Award granted under the LPL Investment Holdings Inc. 2010 Omnibus Equity Incentive Plan. (15) |
10.12 | Form of Senior Management Restricted Stock Unit Award granted under the LPL Investment Holdings Inc. 2010 Omnibus Equity Incentive Plan. (15) |
10.13 | Form of Employee Stock Option Award granted under the LPL Financial Holdings Inc. Amended and Restated 2010 Omnibus Equity Incentive Plan.* |
10.14 | Form of Employee Restricted Stock Unit Award granted under the LPL Financial Holdings Inc., Amended and Restated 2010 Omnibus Equity Incentive Plan.* |
10.15 | Form of Advisor Restricted Stock Unit Award granted under the LPL Financial Holdings Inc., 2010 Omnibus Equity Incentive Plan. (16) |
10.16 | Form of Financial Institution Restricted Stock Unit Award granted under the LPL Financial Holdings Inc., 2010 Omnibus Equity Incentive Plan. (16) |
63
Exhibit No. | Description of Exhibit |
10.17 | Amended and Restated LPL Financial Holdings Inc. 2010 Omnibus Equity Incentive Plan. (17) |
10.18 | Amended and Restated LPL Financial Holdings Inc. Corporate Executive Bonus Plan. (17) |
10.19 | LPL Financial LLC Executive Severance Plan, amended and restated as of February 23, 2017.* |
10.20 | Form of Supplemental Restricted Stock Unit Award granted under the 2010 LPL Financial Holdings Inc. 2010 Omnibus Equity Incentive Plan. (16) |
10.21 | Form of Employee Performance Stock Unit Award granted under the LPL Financial Holdings Inc. Amended and Restated 2010 Omnibus Equity Incentive Plan.* |
10.22 | LPL Financial Holdings Inc. Non-Employee Director Compensation Policy.* |
10.23 | LPL Financial Holdings Inc. Non-Employee Director Deferred Compensation Plan. (18) |
10.24 | Credit Agreement, dated as of March 29, 2012, by and among LPL Investment Holdings, Inc., LPL Holdings, Inc., the several lenders from time to time party thereto, and Bank of America, N.A. as Administrative Agent Collateral Agent, Letter of Credit Issuer, and Swingline Lender. (19) |
10.25 | First Amendment and Incremental Assumption Agreement, dated as of May 13, 2013, by and among LPL Financial Holdings, Inc., LPL Holdings, Inc., certain subsidiaries, the several lenders from time to time party thereto, and Bank of America, N.A. as Administrative Agent. (20) |
10.26 | Second Amendment and Incremental Assumption Agreement, dated as of October 1, 2014, by and among LPL Financial Holdings, Inc., LPL Holdings, Inc., certain subsidiaries, the several lenders from time to time party thereto, and Bank of America, N.A. as Administrative Agent. (8) |
10.27 | Third Amendment, Extension, and Incremental Assumption Agreement, dated as of November 20, 2015 by and among LPL Financial Holdings, Inc., LPL Holdings, Inc., certain subsidiaries, the several lenders from time to time party thereto, and JPMorgan Chase Bank, N.A. as Administrative Agent. (18) |
10.28 | Thomson Transaction Services Master Subscription Agreement dated as of January 5, 2009 between LPL Financial Corporation and Thomson Financial LLC. (21)† |
10.29 | First Amendment dated July 28, 2014 to Master Subscription Agreement dated as of January 5, 2009 between LPL Financial Corporation and Thomson Financial LLC(18)† |
21.1 | List of Subsidiaries of LPL Financial Holdings Inc.* |
23.1 | Consent of Deloitte & Touche LLP, independent registered public accounting firm.* |
31.1 | Certification of the Chief Executive Officer pursuant to Rule 13a-14(a).* |
31.2 | Certification of the Chief Financial Officer pursuant to Rule 13a-14(a).* |
32.1 | Certification of the Chief Executive Officer pursuant to 18 U.S.C. Section 1350, as adopted pursuant to Section 906 of the Sarbanes-Oxley Act of 2002.* |
32.2 | Certification of the Chief Financial Officer pursuant to 18 U.S.C. Section 1350, as adopted pursuant to Section 906 of the Sarbanes-Oxley Act of 2002.* |
101.INS | XBRL Instance Document* |
101.SCH | XBRL Taxonomy Extension Schema* |
101.CAL | XBRL Taxonomy Extension Calculation* |
101.DEF | XBRL Taxonomy Extension Definition* |
101.LAB | XBRL Taxonomy Extension Label* |
101.PRE | XBRL Taxonomy Extension Presentation* |
___________________
64
* | Filed herewith. | |
† | Confidential treatment granted by the Securities and Exchange Commission. | |
(1 | ) | Incorporated by reference to Amendment No. 2 to the Registration Statement on Form S-1 filed on July 9, 2010. |
(2 | ) | Incorporated by reference to the Form 8-K filed on June 19, 2012. |
(3 | ) | Incorporated by reference to the Form 8-K filed on May 9, 2014. |
(4 | ) | Incorporated by reference to the Form 8-K filed on March 12, 2014. |
(5 | ) | Incorporated by reference to Amendment No. 1 to the Registration Statement on Form 10 filed on July 10, 2007. |
(6 | ) | Incorporated by reference to the Form 10-K filed on March 9, 2011. |
(7 | ) | Incorporated by reference to the Form 10-K filed on February 27, 2012. |
(8 | ) | Incorporated by reference to the Form 10-Q filed on October 30, 2014. |
(9 | ) | Incorporated by reference to the Form 8-K filed on December 18, 2008. |
(10 | ) | Incorporated by reference to the Registration Statement on Form 10 filed on April 30, 2007. |
(11 | ) | Incorporated by reference to the Form 8-K filed on February 21, 2008. |
(12 | ) | Incorporated by reference to the Registration Statement on Form S-1 filed on June 4, 2010. |
(13 | ) | Incorporated by reference to the Form S-8 filed on June 5, 2008. |
(14 | ) | Incorporated by reference to Amendment No. 4 to the Registration Statement on Form S-1 filed on November 3, 2010. |
(15 | ) | Incorporated by reference to the Form 10-K filed on February 26, 2013. |
(16 | ) | Incorporated by reference to the Form 10-K filed on February 25, 2014. |
(17 | ) | Incorporated by reference to the Form 8-K filed on May 15, 2015. |
(18 | ) | Incorporated by reference to the Form 10-K filed on February 26, 2016 |
(19 | ) | Incorporated by reference to the Form 8-K filed on April 2, 2012. |
(20 | ) | Incorporated by reference to the Form 8-K filed on May 13, 2013. |
(21 | ) | Incorporated by reference to Amendment No. 1 to the Registration Statement on Form S-1 filed on June 22, 2010. |
Item 16. Form 10-K Summary
None.
65
SIGNATURES
Pursuant to the requirements of Section 13 or 15(d) of the Securities Exchange Act of 1934, as amended, the registrant has duly caused this Annual Report on Form 10-K to be signed on its behalf by the undersigned, thereunto duly authorized.
LPL Financial Holdings Inc. | ||
By: | /s/ Dan H. Arnold | |
Dan H. Arnold | ||
President and Chief Executive Officer | ||
Dated: February 24, 2017
Pursuant to the requirements of the Securities and Exchange Act of 1934, as amended, this report has been signed below by the following persons on behalf of the Registrant and in the capacities and on the dates indicated.
Signature | Title | Date | |
/s/ Dan H. Arnold | |||
Dan H. Arnold | President, Chief Executive Officer, and Director (Principal Executive Officer) | February 24, 2017 | |
/s/ Matthew J. Audette | |||
Matthew J. Audette | Chief Financial Officer (Principal Financial Officer and Principal Accounting Officer) | February 24, 2017 | |
/s/ John J. Brennan | |||
John J. Brennan | Director | February 24, 2017 | |
/s/ Mark S. Casady | |||
Mark S. Casady | Director | February 24, 2017 | |
/s/ Viet D. Dinh | |||
Viet D. Dinh | Director | February 24, 2017 | |
/s/ Paulett Eberhart | |||
Paulett Eberhart | Director | February 24, 2017 | |
/s/ Marco W. Hellman | |||
Marco W. Hellman | Director | February 24, 2017 | |
/s/ Anne M. Mulcahy | |||
Anne M. Mulcahy | Director | February 24, 2017 | |
/s/ James S. Putnam | |||
James S. Putnam | Director | February 24, 2017 | |
/s/ James S. Riepe | |||
James S. Riepe | Director | February 24, 2017 | |
/s/ Richard P. Schifter | |||
Richard P. Schifter | Director | February 24, 2017 | |
66
LPL FINANCIAL HOLDINGS INC.
INDEX TO CONSOLIDATED FINANCIAL STATEMENTS AND SUPPLEMENTARY DATA
The following consolidated financial statements of LPL Financial Holdings Inc. are included in response to Item 8:
Page | |
Report of Independent Registered Public Accounting Firm | |
Consolidated Statements of Income for the years ended December 31, 2016, 2015, and 2014 | |
Consolidated Statements of Comprehensive Income for the years ended December 31, 2016, 2015, and 2014 | |
Consolidated Statements of Financial Condition as of December 31, 2016 and 2015 | |
Consolidated Statements of Stockholders’ Equity for the years ended December 31, 2016, 2015, and 2014 | |
Consolidated Statements of Cash Flows for the years ended December 31, 2016, 2015, and 2014 | |
Notes to Consolidated Financial Statements | |
F-1
REPORT OF INDEPENDENT REGISTERED PUBLIC ACCOUNTING FIRM
To the Board of Directors and Stockholders of
LPL Financial Holdings Inc.
Boston, Massachusetts
We have audited the accompanying consolidated statements of financial condition of LPL Financial Holdings Inc. and subsidiaries (the "Company") as of December 31, 2016 and 2015 and the related consolidated statements of income, comprehensive income, stockholders’ equity, and cash flows for each of the three years in the period ended December 31, 2016. These consolidated financial statements are the responsibility of the Company's management. Our responsibility is to express an opinion on these financial statements based on our audits.
We conducted our audits in accordance with the standards of the Public Company Accounting Oversight Board (United States). Those standards require that we plan and perform the audit to obtain reasonable assurance about whether the consolidated financial statements are free of material misstatement. An audit includes examining, on a test basis, evidence supporting the amounts and disclosures in the consolidated financial statements. An audit also includes assessing the accounting principles used and significant estimates made by management, as well as evaluating the overall financial statement presentation. We believe that our audits provide a reasonable basis for our opinion.
In our opinion, such consolidated financial statements present fairly, in all material respects, the consolidated financial position of the Company as of December 31, 2016 and 2015, and the results of their operations and their cash flows for each of the three years in the period ended December 31, 2016, in conformity with accounting principles generally accepted in the United States of America. Also, in our opinion, such financial statement schedules, when considered in relation to the basic consolidated financial statements taken as a whole, present fairly, in all material respects, the information set forth therein.
We have also audited, in accordance with the standards of the Public Company Accounting Oversight Board (United States), the Company's internal control over financial reporting as of December 31, 2016, based on the criteria established in Internal Control — Integrated Framework (2013) issued by the Committee of Sponsoring Organizations of the Treadway Commission and our report dated February 24, 2017 expressed an unqualified opinion on the Company’s internal control over financial reporting.
/s/ DELOITTE & TOUCHE LLP
San Diego, California
February 24, 2017
F-2
LPL FINANCIAL HOLDINGS INC. AND SUBSIDIARIES
Consolidated Statements of Income
(In thousands, except per share data)
Years Ended December 31, | ||||||||||||
2016 | 2015 | 2014 | ||||||||||
REVENUES: | ||||||||||||
Commission | $ | 1,737,435 | $ | 1,976,845 | $ | 2,118,494 | ||||||
Advisory | 1,289,681 | 1,352,454 | 1,337,959 | |||||||||
Asset-based | 556,475 | 493,687 | 476,595 | |||||||||
Transaction and fee | 415,715 | 401,948 | 369,821 | |||||||||
Interest income, net of interest expense | 21,282 | 19,192 | 18,982 | |||||||||
Other | 28,795 | 30,928 | 51,811 | |||||||||
Total net revenues | 4,049,383 | 4,275,054 | 4,373,662 | |||||||||
EXPENSES: | ||||||||||||
Commission and advisory | 2,600,624 | 2,864,813 | 2,998,702 | |||||||||
Compensation and benefits | 436,557 | 440,049 | 421,829 | |||||||||
Promotional | 148,612 | 139,198 | 124,677 | |||||||||
Depreciation and amortization | 75,928 | 73,383 | 57,977 | |||||||||
Amortization of intangible assets | 38,035 | 38,239 | 38,868 | |||||||||
Professional services | 67,128 | 64,522 | 62,184 | |||||||||
Occupancy and equipment | 92,956 | 84,112 | 82,430 | |||||||||
Brokerage, clearing, and exchange | 54,509 | 52,516 | 49,015 | |||||||||
Communications and data processing | 44,453 | 46,871 | 43,823 | |||||||||
Restructuring charges | — | 11,967 | 34,652 | |||||||||
Other | 96,587 | 117,693 | 109,327 | |||||||||
Total operating expenses | 3,655,389 | 3,933,363 | 4,023,484 | |||||||||
Non-operating interest expense | 96,478 | 59,136 | 51,538 | |||||||||
Loss on extinguishment of debt | — | — | 3,943 | |||||||||
INCOME BEFORE PROVISION FOR INCOME TAXES | 297,516 | 282,555 | 294,697 | |||||||||
PROVISION FOR INCOME TAXES | 105,585 | 113,771 | 116,654 | |||||||||
NET INCOME | $ | 191,931 | $ | 168,784 | $ | 178,043 | ||||||
EARNINGS PER SHARE (NOTE 15) | ||||||||||||
Earnings per share, basic | $ | 2.15 | $ | 1.77 | $ | 1.78 | ||||||
Earnings per share, diluted | $ | 2.13 | $ | 1.74 | $ | 1.75 | ||||||
Weighted-average shares outstanding, basic | 89,072 | 95,273 | 99,847 | |||||||||
Weighted-average shares outstanding, diluted | 90,013 | 96,786 | 101,651 | |||||||||
See notes to consolidated financial statements.
F-3
LPL FINANCIAL HOLDINGS INC. AND SUBSIDIARIES
Consolidated Statements of Comprehensive Income
(In thousands)
Years Ended December 31, | ||||||||||||
2016 | 2015 | 2014 | ||||||||||
NET INCOME | $ | 191,931 | $ | 168,784 | $ | 178,043 | ||||||
Other comprehensive income, net of tax: | ||||||||||||
Unrealized gain on cash flow hedges, net of tax expense of $95, $132, and $722 for the years ended December 31, 2016, 2015, and 2014, respectively | 150 | 179 | 1,137 | |||||||||
Reclassification adjustment for realized gain on cash flow hedges included in professional services in the consolidated statements of income, net of tax expense (benefit) of $252, $353, and $198 for the years ended December 31, 2016, 2015, and 2014, respectively | (388 | ) | (563 | ) | (315 | ) | ||||||
Total other comprehensive income, net of tax | (238 | ) | (384 | ) | 822 | |||||||
TOTAL COMPREHENSIVE INCOME | $ | 191,693 | $ | 168,400 | $ | 178,865 | ||||||
See notes to consolidated financial statements.
F-4
LPL FINANCIAL HOLDINGS INC. AND SUBSIDIARIES
Consolidated Statements of Financial Condition
(Dollars in thousands, except par value)
December 31, | ||||||||
2016 | 2015 | |||||||
ASSETS | ||||||||
Cash and cash equivalents | $ | 747,709 | $ | 724,529 | ||||
Cash and securities segregated under federal and other regulations | 768,219 | 671,339 | ||||||
Restricted cash | 42,680 | 27,839 | ||||||
Receivables from: | ||||||||
Clients, net | 341,199 | 339,089 | ||||||
Product sponsors, broker-dealers, and clearing organizations | 175,122 | 161,224 | ||||||
Advisor loans, net | 194,526 | 148,978 | ||||||
Others, net | 189,632 | 180,161 | ||||||
Securities owned: | ||||||||
Trading — at fair value | 11,404 | 11,995 | ||||||
Held-to-maturity | 8,862 | 9,847 | ||||||
Securities borrowed | 5,559 | 6,001 | ||||||
Fixed assets, net | 387,368 | 275,419 | ||||||
Goodwill | 1,365,838 | 1,365,838 | ||||||
Intangible assets, net | 353,996 | 392,031 | ||||||
Other assets | 242,812 | 206,771 | ||||||
Total assets | $ | 4,834,926 | $ | 4,521,061 | ||||
LIABILITIES AND STOCKHOLDERS’ EQUITY | ||||||||
LIABILITIES: | ||||||||
Drafts payable | $ | 198,839 | $ | 189,083 | ||||
Payables to clients | 863,765 | 747,421 | ||||||
Payables to broker-dealers and clearing organizations | 63,032 | 48,032 | ||||||
Accrued commission and advisory expenses payable | 128,476 | 129,512 | ||||||
Accounts payable and accrued liabilities | 385,545 | 332,492 | ||||||
Income taxes payable | 4,607 | 8,680 | ||||||
Unearned revenue | 62,785 | 65,480 | ||||||
Securities sold, but not yet purchased — at fair value | 183 | 268 | ||||||
Senior secured credit facilities, net | 2,175,436 | 2,188,240 | ||||||
Leasehold financing obligation | 105,649 | 59,940 | ||||||
Deferred income taxes, net | 25,614 | 36,303 | ||||||
Total liabilities | 4,013,931 | 3,805,451 | ||||||
Commitments and contingencies (Note 12) | ||||||||
STOCKHOLDERS’ EQUITY: | ||||||||
Common stock, $0.001 par value; 600,000,000 shares authorized; 119,917,854 shares and 119,572,352 shares issued at December 31, 2016 and 2015, respectively | 120 | 119 | ||||||
Additional paid-in capital | 1,445,256 | 1,418,298 | ||||||
Treasury stock, at cost — 30,621,270 shares and 30,048,027 shares at December 31, 2016 and 2015, respectively | (1,194,645 | ) | (1,172,490 | ) | ||||
Accumulated other comprehensive income | 315 | 553 | ||||||
Retained earnings | 569,949 | 469,130 | ||||||
Total stockholders’ equity | 820,995 | 715,610 | ||||||
Total liabilities and stockholders’ equity | $ | 4,834,926 | $ | 4,521,061 | ||||
See notes to consolidated financial statements.
F-5
LPL FINANCIAL HOLDINGS INC. AND SUBSIDIARIES
Consolidated Statements of Stockholders’ Equity
(In thousands)
Additional Paid-In Capital | Accumulated Other Comprehensive Income (Loss) | Retained Earnings | Total Stockholders' Equity | ||||||||||||||||||||||||||
Common Stock | Treasury Stock | ||||||||||||||||||||||||||||
Shares | Amount | Shares | Amount | ||||||||||||||||||||||||||
BALANCE — December 31, 2013 | 117,112 | $ | 117 | $ | 1,292,374 | 15,216 | $ | (506,205 | ) | $ | 115 | $ | 313,570 | $ | 1,099,971 | ||||||||||||||
Net income and other comprehensive income, net of tax expense | 822 | 178,043 | 178,865 | ||||||||||||||||||||||||||
Issuance of common stock to settle restricted stock units | 50 | 1 | 17 | (869 | ) | (868 | ) | ||||||||||||||||||||||
Treasury stock purchases | 5,899 | (275,079 | ) | (275,079 | ) | ||||||||||||||||||||||||
Cash dividends on common stock | (95,616 | ) | (95,616 | ) | |||||||||||||||||||||||||
Stock option exercises and other | 1,073 | 26,914 | (42 | ) | 1,492 | 124 | 28,530 | ||||||||||||||||||||||
Excess tax benefits from share-based compensation | 8,218 | 8,218 | |||||||||||||||||||||||||||
Share-based compensation | 27,579 | 27,579 | |||||||||||||||||||||||||||
BALANCE — December 31, 2014 | 118,235 | $ | 118 | $ | 1,355,085 | 21,090 | $ | (780,661 | ) | $ | 937 | $ | 396,121 | $ | 971,600 | ||||||||||||||
Net income and other comprehensive loss, net of tax expense | (384 | ) | 168,784 | 168,400 | |||||||||||||||||||||||||
Issuance of common stock to settle restricted stock units | 184 | 1 | 68 | (3,019 | ) | (3,018 | ) | ||||||||||||||||||||||
Treasury stock purchases | 8,947 | (390,835 | ) | (390,835 | ) | ||||||||||||||||||||||||
Cash dividends on common stock | (95,814 | ) | (95,814 | ) | |||||||||||||||||||||||||
Stock option exercises and other | 1,153 | 30,966 | (57 | ) | 2,025 | 39 | 33,030 | ||||||||||||||||||||||
Excess tax benefits from share-based compensation | 3,034 | 3,034 | |||||||||||||||||||||||||||
Share-based compensation | 29,213 | 29,213 | |||||||||||||||||||||||||||
BALANCE — December 31, 2015 | 119,572 | $ | 119 | $ | 1,418,298 | 30,048 | $ | (1,172,490 | ) | $ | 553 | $ | 469,130 | $ | 715,610 | ||||||||||||||
Net income and other comprehensive loss, net of tax expense | (238 | ) | 191,931 | 191,693 | |||||||||||||||||||||||||
Issuance of common stock to settle restricted stock units | 154 | 1 | — | 53 | (1,242 | ) | (1,241 | ) | |||||||||||||||||||||
Treasury stock purchases | 635 | (25,013 | ) | (25,013 | ) | ||||||||||||||||||||||||
Cash dividends on common stock | (89,081 | ) | (89,081 | ) | |||||||||||||||||||||||||
Stock option exercises and other | 192 | — | 4,796 | (115 | ) | 4,100 | (2,031 | ) | 6,865 | ||||||||||||||||||||
Excess tax benefits from share-based compensation | (2,734 | ) | (2,734 | ) | |||||||||||||||||||||||||
Share-based compensation | — | 24,896 | 24,896 | ||||||||||||||||||||||||||
BALANCE — December 31, 2016 | 119,918 | $ | 120 | $ | 1,445,256 | 30,621 | $ | (1,194,645 | ) | $ | 315 | $ | 569,949 | $ | 820,995 | ||||||||||||||
See notes to consolidated financial statements.
F-6
LPL FINANCIAL HOLDINGS INC. AND SUBSIDIARIES
Consolidated Statements of Cash Flows
(Dollars in thousands)
Years Ended December 31, | ||||||||||||
2016 | 2015 | 2014 | ||||||||||
CASH FLOWS FROM OPERATING ACTIVITIES: | ||||||||||||
Net income | $ | 191,931 | $ | 168,784 | $ | 178,043 | ||||||
Adjustments to reconcile net income to net cash provided by operating activities: | ||||||||||||
Noncash items: | ||||||||||||
Depreciation and amortization | 75,928 | 73,383 | 57,977 | |||||||||
Amortization of intangible assets | 38,035 | 38,239 | 38,868 | |||||||||
Amortization of debt issuance costs | 5,752 | 3,405 | 3,973 | |||||||||
Share-based compensation | 24,896 | 29,213 | 27,579 | |||||||||
Excess tax benefits related to share-based compensation | (65 | ) | (3,810 | ) | (8,685 | ) | ||||||
Provision for bad debts | 4,057 | 2,542 | 2,432 | |||||||||
Deferred income taxes | (11,550 | ) | (30,153 | ) | (24,100 | ) | ||||||
Loss on extinguishment of debt | — | — | 3,943 | |||||||||
Loan forgiveness | 45,163 | 37,658 | 28,409 | |||||||||
Other | (3,805 | ) | 1,304 | 594 | ||||||||
Changes in operating assets and liabilities: | ||||||||||||
Cash and securities segregated under federal and other regulations | (96,880 | ) | (102,409 | ) | (56,579 | ) | ||||||
Deposit of restricted cash related to captive insurance subsidiary | (20,628 | ) | (32,139 | ) | — | |||||||
Release of restricted cash related to captive insurance subsidiary | 4,407 | 6,550 | — | |||||||||
Receivables from clients | (2,226 | ) | 26,081 | 7,628 | ||||||||
Receivables from product sponsors, broker-dealers, and clearing organizations | (13,899 | ) | 16,247 | (3,400 | ) | |||||||
Advisor Loans | (91,866 | ) | (66,312 | ) | (49,146 | ) | ||||||
Receivables from others | (12,466 | ) | (10,514 | ) | (469 | ) | ||||||
Securities owned | 835 | 144 | (4,638 | ) | ||||||||
Securities borrowed | 442 | (966 | ) | 2,067 | ||||||||
Other assets | (30,013 | ) | (30,714 | ) | (45,523 | ) | ||||||
Drafts payable | 9,757 | 8,984 | (14,872 | ) | ||||||||
Payables to clients | 116,344 | 94,707 | 87,510 | |||||||||
Payables to broker-dealers and clearing organizations | 15,000 | 2,605 | 2,270 | |||||||||
Accrued commission and advisory expenses payable | (1,036 | ) | (16,992 | ) | 11,355 | |||||||
Accounts payable and accrued liabilities | 33,512 | 50,077 | (8,109 | ) | ||||||||
Income taxes receivable/payable | (4,008 | ) | 12,574 | 4,281 | ||||||||
Unearned revenue | (2,695 | ) | 998 | (9,257 | ) | |||||||
Securities sold, but not yet purchased | (85 | ) | (35 | ) | 91 | |||||||
Net cash provided by operating activities | 274,837 | 279,451 | 232,242 | |||||||||
Continued on following page | ||||||||||||
F-7
LPL FINANCIAL HOLDINGS INC. AND SUBSIDIARIES
Consolidated Statements of Cash Flows - Continued
(Dollars in thousands)
Years Ended December 31, | ||||||||||||
2016 | 2015 | 2014 | ||||||||||
CASH FLOWS FROM INVESTING ACTIVITIES: | ||||||||||||
Capital expenditures | (127,646 | ) | (72,565 | ) | (89,648 | ) | ||||||
Purchase of goodwill and other intangible assets | — | — | (9,000 | ) | ||||||||
Proceeds from disposal of fixed assets | — | 10 | 7,123 | |||||||||
Purchase of securities classified as held-to-maturity | (4,020 | ) | (4,602 | ) | (7,498 | ) | ||||||
Proceeds from maturity of securities classified as held-to-maturity | 5,000 | 3,350 | 5,750 | |||||||||
Deposits of restricted cash | (65 | ) | (1,750 | ) | (4,679 | ) | ||||||
Release of restricted cash | 1,445 | 609 | 4,820 | |||||||||
Net cash used in investing activities | (125,286 | ) | (74,948 | ) | (93,132 | ) | ||||||
CASH FLOWS FROM FINANCING ACTIVITIES: | ||||||||||||
Proceeds from revolving credit facility | — | 456,000 | 150,000 | |||||||||
Repayments of revolving credit facility | — | (566,000 | ) | (40,000 | ) | |||||||
Repayment of senior secured term loans | (17,677 | ) | (9,221 | ) | (10,838 | ) | ||||||
Proceeds from senior secured term loans | — | 693,000 | — | |||||||||
Payment of debt issuance costs | — | (13,258 | ) | (4,876 | ) | |||||||
Payment of contingent consideration | — | — | (3,300 | ) | ||||||||
Tax payments related to settlement of restricted stock units | (1,241 | ) | (3,018 | ) | (868 | ) | ||||||
Repurchase of common stock | (25,013 | ) | (390,835 | ) | (275,079 | ) | ||||||
Dividends on common stock | (89,081 | ) | (95,814 | ) | (95,616 | ) | ||||||
Excess tax benefits related to share-based compensation | 65 | 3,810 | 8,685 | |||||||||
Proceeds from stock option exercises and other | 6,865 | 33,030 | 28,530 | |||||||||
Payment of leasehold financing obligation | (289 | ) | — | — | ||||||||
Net cash provided by (used in) financing activities | (126,371 | ) | 107,694 | (243,362 | ) | |||||||
NET INCREASE (DECREASE) IN CASH AND CASH EQUIVALENTS | 23,180 | 312,197 | (104,252 | ) | ||||||||
CASH AND CASH EQUIVALENTS — Beginning of year | 724,529 | 412,332 | 516,584 | |||||||||
CASH AND CASH EQUIVALENTS — End of year | $ | 747,709 | $ | 724,529 | $ | 412,332 | ||||||
SUPPLEMENTAL DISCLOSURES OF CASH FLOW INFORMATION: | ||||||||||||
Interest paid | $ | 92,344 | $ | 51,114 | $ | 51,588 | ||||||
Income taxes paid | $ | 122,909 | $ | 131,833 | $ | 139,315 | ||||||
NONCASH DISCLOSURES: | ||||||||||||
Capital expenditures included in accounts payable and accrued liabilities | $ | 24,339 | $ | 11,462 | $ | 8,184 | ||||||
Fixed assets acquired under build-to-suit lease | $ | — | $ | — | $ | 8,114 | ||||||
Finance Obligation related to real estate projects | $ | 45,998 | $ | 59,940 | $ | — | ||||||
Discount on proceeds from senior secured credit facilities recorded as debt issuance costs | $ | — | $ | 7,000 | $ | — | ||||||
See notes to consolidated financial statements.
F-8
LPL FINANCIAL HOLDINGS INC. AND SUBSIDIARIES
Notes to Consolidated Financial Statements
1. Organization and Description of the Company
LPL Financial Holdings Inc. (“LPLFH”), a Delaware holding corporation, together with its consolidated subsidiaries (collectively, the “Company”) provides an integrated platform of brokerage and investment advisory services to independent financial advisors and financial advisors at financial institutions (collectively “advisors”) in the United States. Through its custody and clearing platform, using both proprietary and third-party technology, the Company provides access to diversified financial products and services, enabling its advisors to offer independent financial advice and brokerage services to retail investors (their “clients”).
Description of Subsidiaries
LPL Holdings, Inc. (“LPLH”), a Massachusetts holding corporation, owns 100% of the issued and outstanding common stock or other ownership interest in each of LPL Financial LLC, Fortigent Holdings Company, Inc., Independent Advisers Group Corporation (“IAG”), LPL Insurance Associates, Inc. (“LPLIA”), LPL Independent Advisor Services Group LLC (“IASG”), and UVEST Financial Services Group, Inc. (“UVEST”). LPLH is also the majority stockholder in PTC Holdings, Inc. (“PTCH”), and owns 100% of the issued and outstanding voting common stock. Each member of PTCH's board of directors meets the direct equity ownership interest requirements that are required by the Office of the Comptroller of the Currency. The Company has established a wholly-owned series captive insurance entity that underwrites insurance for various legal and regulatory risks.
LPL Financial, with primary offices in Boston, Massachusetts; San Diego, California; and Fort Mill, South Carolina, is a clearing broker-dealer and an investment adviser that principally transacts business as an agent for its advisors and financial institutions on behalf of their clients in a broad array of financial products and services. LPL Financial is licensed to operate in all 50 states, Washington D.C., Puerto Rico, and the U.S. Virgin Islands.
Fortigent Holdings Company, Inc. and its subsidiaries (“Fortigent”) provides solutions and consulting services to registered investment advisors, banks, and trust companies serving high-net-worth clients.
PTCH is a holding company for The Private Trust Company, N.A. (“PTC”). PTC is chartered as a non-depository limited purpose national bank, providing a wide range of trust, investment management oversight, and custodial services for estates and families. PTC also provides Individual Retirement Account custodial services for LPL Financial.
LPLIA operates as an insurance brokerage general agency that offers life, long-term care, and disability insurance products and services for LPL Financial advisors.
2. Summary of Significant Accounting Policies
Basis of Presentation
These consolidated financial statements are prepared in accordance with accounting principles generally accepted in the United States (“GAAP”), which require the Company to make estimates and assumptions regarding the valuation of certain financial instruments, intangible assets, allowance for doubtful accounts, share-based compensation, accruals for liabilities, income taxes, revenue and expense accruals, and other matters that affect the consolidated financial statements and related disclosures. Actual results could differ from those estimates under different assumptions or conditions and the differences may be material to the consolidated financial statements.
Consolidation
These consolidated financial statements include the accounts of LPLFH and its subsidiaries. Intercompany transactions and balances have been eliminated. Equity investments in which the Company exercises significant influence, but does not exercise control and is not the primary beneficiary, are accounted for using the equity method.
Reportable Segment
Management has determined that our company operates in one segment, given the similarities in economic characteristics between our operations and the common nature of our products and services, production and distribution process, and regulatory environment.
F-9
LPL FINANCIAL HOLDINGS INC. AND SUBSIDIARIES
Notes to Consolidated Financial Statements
Revenue Recognition
Substantially all of the Company's revenues are based on contractual arrangements. In determining the appropriate recognition of commissions, the Company reviews the terms and conditions of the brokerage account agreements between the Company and its advisors' clients, representative agreements with its advisors, which include payout rates and terms, and selling agreements with product sponsors for packaged investment products such as mutual funds, annuities, insurance, and alternative investments. In determining the appropriate recognition of advisory revenues, the Company reviews the terms and conditions of the advisory agreements between the advisors' clients and the applicable registered investment advisor (“RIA”), representative agreements with its advisors, and agreements with third parties who provide specific investment management or investment strategies.
Revenues are recognized in the periods in which the related services are performed provided that persuasive evidence of an arrangement exists, the fee is fixed or determinable, and collectability is reasonably assured. Payments received by the Company in advance of the performance of service are deferred and recognized as revenue when earned.
Management considers the nature of the Company's contractual arrangements in determining whether to recognize certain types of revenue on the basis of the gross amount billed or net amount retained after payments are made to providers of certain services related to the product or service offering.
The main factors the Company uses to determine whether to record revenue on a gross or net basis are whether:
• | the Company is primarily responsible for the service to the advisor and their client; |
• | the Company has discretion in establishing fees paid by the client and fees due to the third-party service provider; and |
• | the Company is involved in the determination of product or service specifications. |
When client fees include a portion of charges that are paid to another party and the Company is primarily responsible for providing the service to the client, revenue is recognized on a gross basis in an amount equal to the fee paid by the client. The cost of revenues recognized is the amount due to the other party and is recorded as commission and advisory expense in the consolidated statements of income.
In instances in which another party is primarily responsible for providing the service to the client, revenue is recognized in the net amount retained by the Company. The portion of the fees that are collected from the client by the Company and remitted to the other party are considered pass-through amounts and accordingly are not a component of revenues or cost of revenues.
Commission Revenues
Commission revenues represent commissions generated by the Company's advisors for their clients' purchases and sales of securities on exchanges and over-the-counter, as well as purchases of various investment products such as mutual funds, variable and fixed annuities, alternative investments including non-traded real estate investment trusts and business development companies, fixed income, insurance, group annuities, and option and commodity transactions. The Company generates two types of commission revenues: transaction-based sales commissions that occur at the point of sale, as well as trailing commissions for which the Company provides ongoing support, awareness, and education to clients of its advisors.
Transaction-based sales commissions are recognized as revenue on a trade-date basis, which is when the Company's performance obligations in generating the commissions have been substantially completed. The Company settles a significant volume of transactions that are initiated directly between its advisors and product sponsors, particularly with regard to mutual fund, 529 education savings plan, fixed and variable annuity, and insurance products. As a result, management must estimate a portion of its commission revenues earned from clients for purchases and sales of these products for each accounting period for which the proceeds have not yet been received. These estimates are based on the amount of commissions earned from transactions in these products in prior periods.
Trailing commission revenues include mutual fund, 529 education savings plan, and fixed and variable product trailing fees that are recurring in nature. These trailing fees are earned by the Company based on a percentage of the current market value of clients' investment holdings in trail-eligible assets, and recognized over the period during which services are performed. Because trailing commission revenues are generally paid in
F-10
LPL FINANCIAL HOLDINGS INC. AND SUBSIDIARIES
Notes to Consolidated Financial Statements
arrears, management estimates the majority of trailing commission revenues earned during each period. These estimates are based on a number of factors, including market levels and the amount of trailing commission revenues received in prior periods. Commission revenue accruals are classified within receivables from product sponsors, broker-dealers, and clearing organizations in the consolidated statements of financial condition.
A substantial portion of the commission revenue is ultimately paid to the advisors. The Company records an estimate for commissions payable based upon average payout ratios for each product for which the Company has accrued commission revenue. Such amounts are classified as accrued commission and advisory expenses payable in the consolidated statements of financial condition and commission and advisory expense in the consolidated statements of income.
Advisory Revenues
The Company records fees charged to clients as advisory revenues in advisory accounts where LPL Financial is the RIA. A substantial portion of these advisory fees are paid to the related advisor and these payments are classified as commission and advisory expense in the consolidated statements of income.
Certain advisors conduct their advisory business through separate entities by establishing their own RIA firm pursuant to the Advisers Act or through their respective states' investment advisory licensing rules, rather than using the Company's corporate RIA platform. These independent entities, or Hybrid RIAs, engage the Company for clearing, regulatory, and custody services, as well as access to the Company's investment advisory platforms. The advisory revenue generated by these Hybrid RIAs is earned by the advisors, and accordingly not included in the Company's advisory revenues.
The Company charges separate fees to Hybrid RIAs for technology, custody, administrative, and clearing services, primarily based on the value of assets within these advisory accounts, which are classified as advisory revenues in the consolidated statements of income.
Asset-Based Revenues
Asset-based revenues are comprised of fees from cash sweep programs, financial product manufacturer sponsorship programs, and omnibus processing and networking services and are recognized ratably over the period in which services are provided.
Transaction and Fee Revenues
The Company charges fees for executing certain transactions in client accounts. Transaction related charges are recognized on a trade-date basis. Other fees relate to services provided and other account charges generally outlined in agreements with clients, advisors, and financial institutions. Such fees are recognized as services are performed or as earned, as applicable. In addition, the Company offers various services for which fees are charged on a subscription basis and recognized over the subscription period.
Interest Income, Net of Interest Expense
The Company earns interest income from its cash equivalents and client margin balances, less interest expense on related transactions. Because interest expense incurred in connection with cash equivalents and client margin balances is completely offset by revenue on related transactions, the Company considers such interest to be an operating expense. Interest expense from operations for the years ended December 31, 2016, 2015, and 2014 did not exceed $1.0 million.
Compensation and Benefits
The Company records compensation and benefits expense for all cash and deferred compensation, benefits, and related taxes as earned by its employees. Compensation and benefits expense also includes fees earned by temporary employees and contractors who perform similar services to those performed by the Company’s employees, primarily software development and project management activities.
F-11
LPL FINANCIAL HOLDINGS INC. AND SUBSIDIARIES
Notes to Consolidated Financial Statements
Share-Based Compensation
Certain employees, officers, directors, advisors, and financial institutions of the Company participate in various long-term incentive plans that provide for granting stock options, warrants, restricted stock awards, restricted stock units, and deferred stock units. Stock options and warrants generally vest in equal increments over a three- to five-year period and expire on the tenth anniversary following the date of grant. Restricted stock awards, restricted stock units, and deferred stock units generally vest over a one- to four-year period.
The Company recognizes share-based compensation for equity awards granted to employees, officers, and directors as compensation and benefits expense on the consolidated statements of income. The fair value of stock options is estimated using a Black-Scholes valuation model on the date of grant. The fair value of restricted stock awards, restricted stock units, and deferred stock units is equal to the closing price of the Company’s stock on the date of grant. Share-based compensation is recognized over the requisite service period of the individual awards, which generally equals the vesting period.
The Company recognizes share-based compensation for equity awards granted to advisors and financial institutions as commissions and advisory expense on the consolidated statements of income. The fair value of stock options and warrants is estimated using a Black-Scholes valuation model on the date of grant and is revalued at each reporting period. The fair value of restricted stock units is equal to the closing price of the Company’s stock on the date of grant and on the last day of each reporting period. Share-based compensation is recognized over the requisite service period of the individual awards, which generally equals the vesting period.
The Company must also make assumptions regarding the number of stock options, warrants, restricted stock awards, restricted stock units, and deferred stock units that will be forfeited. The forfeiture assumption is ultimately adjusted to the actual forfeiture rate. Therefore, changes in the forfeiture assumptions do not impact the total amount of expense ultimately recognized over the vesting period. Rather, different forfeiture assumptions would only impact the timing of expense recognition over the vesting period. See Note 14. Share-Based Compensation, for additional information regarding share-based compensation for equity awards granted.
Earnings Per Share
Basic earnings per share is computed by dividing net income available to common shareholders by the basic weighted-average number of shares of common stock outstanding during the period. The computation of diluted earnings per share is similar to the computation of basic earnings per share, except that the denominator is increased to include the number of additional shares of common stock that would have been outstanding if dilutive potential shares of common stock had been issued.
Income Taxes
In preparing the consolidated financial statements, the Company estimates income tax expense based on various jurisdictions where it conducts business. The Company then must assess the likelihood that the deferred tax assets will be realized. A valuation allowance is established to the extent that it is more-likely-than-not that such deferred tax assets will not be realized. When the Company establishes a valuation allowance or modifies the existing allowance in a certain reporting period, it generally records a corresponding increase or decrease to tax expense in the consolidated statements of income. Management makes significant judgments in determining the provision for income taxes, the deferred tax assets and liabilities, and any valuation allowances recorded against the deferred tax asset. Changes in the estimate of these taxes occur periodically due to changes in the tax rates, changes in the business operations, implementation of tax planning strategies, resolution with taxing authorities of issues where the Company had previously taken certain tax positions, and newly enacted statutory, judicial, and regulatory guidance. These changes could have a material effect on the Company’s consolidated statements of income, financial condition, or cash flows in the period or periods in which they occur. Income tax credits are accounted for using the flow-through method as a reduction of income tax in the years utilized.
The Company recognizes the tax effects of a position in the consolidated financial statements only if it is more-likely-than-not to be sustained based solely on its technical merits; otherwise no benefits of the position are to be recognized. The more-likely-than-not threshold must continue to be met in each reporting period to support continued recognition of a benefit. Moreover, each tax position meeting the recognition threshold is required to be measured as the largest amount that is greater than 50 percent likely to be realized upon ultimate settlement with a taxing authority that has full knowledge of all relevant information.
F-12
LPL FINANCIAL HOLDINGS INC. AND SUBSIDIARIES
Notes to Consolidated Financial Statements
Cash and Cash Equivalents
Cash equivalents are highly liquid investments with an original maturity of 90 days or less that are not required to be segregated under federal or other regulations. The Company's cash and cash equivalents are composed of interest and noninterest-bearing deposits, money market funds, and United States government obligations.
Cash and Securities Segregated Under Federal and Other Regulations
The Company's subsidiary, LPL Financial LLC, is subject to requirements related to maintaining cash or qualified securities in a segregated reserve account for the exclusive benefit of its customers in accordance with Rule 15c3-3 of the Security Exchange Act of 1934, as amended, and other regulations. Held within this account is approximately $100,000 for the proprietary accounts of introducing brokers.
Restricted Cash
Restricted cash primarily represents cash held by and for use by the Company’s captive insurance subsidiary.
Receivables From and Payables to Clients
Receivables from clients include amounts due on cash and margin transactions. The Company extends credit to clients of its advisors to finance their purchases of securities on margin and receives income from interest charged on such extensions of credit. Payables to clients represent credit balances in client accounts arising from deposits of funds, proceeds from sales of securities, and dividend and interest payments received on securities held in client accounts at LPL Financial. At December 31, 2016 and 2015, $836.6 million and $747.4 million, respectively, of the balance represent free credit balances that are held pending re-investment by the clients. The Company pays interest on certain client payable balances.
To the extent that margin loans and other receivables from clients are not fully collateralized by client securities, management establishes an allowance that it believes is sufficient to cover any probable losses. When establishing this allowance, management considers a number of factors, including its ability to collect from the client or the client’s advisor and the Company’s historical experience in collecting on such transactions.
The following schedule reflects the Company’s activity in providing for an allowance for uncollectible amounts due from clients (in thousands):
December 31, | ||||||||
2016 | 2015 | |||||||
Beginning balance — January 1 | $ | 1,464 | $ | 1,245 | ||||
Provision for doubtful accounts | 116 | 219 | ||||||
Ending balance — December 31 | $ | 1,580 | $ | 1,464 | ||||
Advisor Loans
The Company periodically extends credit to its advisors in the form of recruiting loans, commission advances, and other loans. The decisions to extend credit to advisors are generally based on the advisors’ credit history and their ability to generate future commissions. Certain loans made in connection with recruiting are forgivable over terms ranging from three to eight years provided that the advisor remains licensed through LPL Financial. At December 31, 2016, $136.7 million of the advisor loan balance was forgivable. If an advisor terminates their arrangement with the Company prior to the forgivable loan term date or repayment of another loan, an allowance for uncollectible amounts is recorded using an analysis that takes into account the advisors’ registration status and the specific type of receivable. The aging thresholds and specific percentages used represent management’s best estimates of probable losses. Management monitors the adequacy of these estimates through periodic evaluations against actual trends experienced.
F-13
LPL FINANCIAL HOLDINGS INC. AND SUBSIDIARIES
Notes to Consolidated Financial Statements
The following schedule reflects the Company’s activity in providing for an allowance for uncollectible amounts for advisor loans (in thousands):
December 31, | ||||||||
2016 | 2015 | |||||||
Beginning balance — January 1 | $ | 697 | $ | 697 | ||||
Provision for doubtful accounts | 1,155 | — | ||||||
Ending balance — December 31 | $ | 1,852 | $ | 697 | ||||
Receivables From Others
Receivables from others primarily consist of accrued fees from product sponsors and amounts due from advisors. Management maintains an allowance for uncollectible amounts using an aging analysis that takes into account the specific type of receivable. The aging thresholds and specific percentages used represent management’s best estimates of probable losses. Management monitors the adequacy of these estimates through periodic evaluations against actual trends experienced.
The following schedule reflects the Company’s activity in providing for an allowance for uncollectible amounts due from others (in thousands):
December 31, | ||||||||
2016 | 2015 | |||||||
Beginning balance — January 1 | $ | 9,856 | $ | 8,379 | ||||
Provision for doubtful accounts | 2,786 | 2,322 | ||||||
Charge-offs, net of recoveries | 209 | (845 | ) | |||||
Ending balance — December 31 | $ | 12,851 | $ | 9,856 | ||||
Securities Owned and Securities Sold, But Not Yet Purchased
Securities owned and securities sold, but not yet purchased include trading and held-to-maturity securities. The Company generally classifies its investments in debt and equity instruments (including mutual funds, annuities, corporate bonds, government bonds, and municipal bonds) as trading securities, except for United States government notes held by PTC, which are classified as held-to-maturity securities. The Company has not classified any investments as available-for-sale. Investment classifications are subject to ongoing review and can change.
Securities classified as trading are carried at fair value, while securities classified as held-to-maturity are carried at amortized cost. The Company uses prices obtained from independent third-party pricing services to measure the fair value of its trading securities. Prices received from the pricing services are validated using various methods including comparison to prices received from additional pricing services, comparison to available quoted market prices, and review of other relevant market data including implied yields of major categories of securities. In general, these quoted prices are derived from active markets for identical assets or liabilities. When quoted prices in active markets for identical assets and liabilities are not available, the quoted prices are based on similar assets and liabilities or inputs other than the quoted prices that are observable, either directly or indirectly. For certificates of deposit and treasury securities, the Company utilizes market-based inputs, including observable market interest rates that correspond to the remaining maturities or the next interest reset dates. At December 31, 2016, the Company did not adjust prices received from the independent third-party pricing services.
Interest income is accrued as earned. Premiums and discounts are amortized using a method that approximates the effective yield method over the term of the security and are recorded as an adjustment to the investment yield. The Company makes estimates about the fair value of investments and the timing for recognizing losses based on market conditions and other factors. If these estimates change, the Company may recognize additional losses. Both unrealized and realized gains and losses on trading securities are recognized in other revenue on a net basis in the consolidated statements of income.
Securities Borrowed
The Company borrows securities from other broker-dealers to make deliveries or to facilitate customer short sales. Securities borrowed are accounted for as collateralized financings and are recorded at contract value,
F-14
LPL FINANCIAL HOLDINGS INC. AND SUBSIDIARIES
Notes to Consolidated Financial Statements
representing the amount of cash provided for securities borrowed transactions (generally in excess of market values). The adequacy of the collateral deposited, which is determined by comparing the market value of the securities borrowed to the cash loaned, is continuously monitored and is adjusted when considered necessary to minimize the risk associated with this activity.
The Company borrows securities from other broker-dealers to make deliveries or to facilitate customer short sales. As of December 31, 2016, the contract and collateral market values of borrowed securities were $5.6 million and $5.4 million, respectively. As of December 31, 2015, the contract and collateral market values of borrowed securities were $6.0 million and $5.8 million, respectively.
Fixed Assets
Internally developed software, leasehold improvements, computers and software, and furniture and equipment are recorded at historical cost, net of accumulated depreciation and amortization. Depreciation is recognized using the straight-line method over the estimated useful lives of the assets. The Company charges software development costs to operations as incurred during the preliminary project stage, while capitalizing costs at the point at which the conceptual formulation, design, and testing of possible software project alternatives are complete and management authorizes and commits to funding the project. The costs of internally developed software that qualify for capitalization are capitalized as fixed assets and subsequently amortized over the estimated useful life of the software, which is generally three years. The Company does not capitalize pilot projects and projects for which it believes that the future economic benefits are less than probable. Leasehold improvements are amortized over the lesser of their useful lives or the terms of the underlying leases. Computers and software, as well as furniture and equipment, are depreciated over a period of three to seven years. Land is not depreciated.
Management reviews fixed assets for impairment whenever events or changes in circumstances indicate the carrying amount of the assets may not be recoverable. No material impairment occurred for the years ended December 31, 2016, 2015, and 2014.
Goodwill and Other Intangible Assets
Goodwill and other indefinite-lived assets are not amortized; however, intangible assets that are deemed to have definite lives are amortized over their useful lives, generally ranging from 5 - 20 years. See Note 7. Goodwill and Other Intangible Assets, for additional information regarding the Company's goodwill and other intangible assets.
Goodwill and other indefinite-lived intangible assets are tested annually for impairment in the fourth fiscal quarter and between annual tests if certain events occur indicating that the carrying amounts may be impaired. If a qualitative assessment is used and the Company determines that the fair value of a reporting unit or indefinite-lived intangible asset is more likely than not (i.e., a likelihood of more than 50%) less than its carrying amount, a quantitative impairment test will be performed. If goodwill or other indefinite-lived assets are quantitatively assessed for impairment, a two-step approach is applied. First, the Company compares the estimated fair value of the reporting unit in which the asset resides to its carrying value. The second step, if necessary, measures the amount of such impairment by comparing the implied fair value of the asset to its carrying value. No impairment of goodwill or other indefinite-lived intangible assets was recognized during the years ended December 31, 2016, 2015, or 2014.
Long-lived assets, such as intangible assets subject to amortization, are reviewed for impairment when there is evidence that events or changes in circumstances indicate that the carrying amount of an asset or asset group may not be recoverable. Recoverability of assets to be held and used is measured by comparing the carrying amount of an asset or asset group to estimated undiscounted future cash flows expected to be generated by the asset or asset group. If the carrying amount of an asset or asset group exceeds its estimated future cash flows, an impairment charge is recognized for the amount by which the carrying amount of the asset or asset group exceeds the estimated fair value of the asset or asset group. Long-lived assets to be disposed of by sale are reported at the lower of their carrying amounts or their estimated fair values less costs to sell and are not depreciated. There was No material impairment of definite-lived intangible assets recognized during the years ended December 31, 2016, 2015, and 2014, respectively.
F-15
LPL FINANCIAL HOLDINGS INC. AND SUBSIDIARIES
Notes to Consolidated Financial Statements
Debt Issuance Costs
Debt issuance and amendment costs have been capitalized and are being amortized as additional interest expense over the expected terms of the related debt agreements. Debt issuance costs are presented as a direct deduction from the carrying amount of the related debt liability. Costs incurred while obtaining the revolving credit facility are included in other assets and subsequently amortized ratably over the term of the revolving credit facility, regardless of whether there are any outstanding borrowings on the revolving credit facility.
Derivative Financial Instruments
The Company uses derivative financial instruments, primarily consisting of non-deliverable foreign currency forward contracts, to mitigate foreign currency exchange rate risk related to operating expenses that are subject to repricing. The Company has designated these derivative financial instruments as cash flow hedges, all of which qualify for hedge accounting. The Company assesses the ongoing effectiveness of its cash flow hedges. Changes in the fair value for the effective portion of the Company's cash flow hedges are presented in other comprehensive income and reclassified into earnings to match the timing of the underlying hedged item. Hedge ineffectiveness is measured at the end of each fiscal quarter, with any gains or losses realized into earnings in the current period. See Note 8. Derivative Financial Instruments, for additional information regarding the Company's derivative financial instruments.
Fair Value of Financial Instruments
The Company’s financial assets and liabilities are carried at fair value or at amounts that, because of their short-term nature, approximate current fair value, with the exception of its held-to-maturity securities and indebtedness, which are carried at amortized cost. The Company measures the implied fair value of its debt instruments using trading levels obtained from a third-party service provider. Accordingly, the debt instruments qualify as Level 2 fair value measurements. See Note 3. Fair Value Measurements, for additional information regarding the Company's fair value measurements. As of December 31, 2016, the carrying amount and fair value of the Company’s indebtedness was approximately $2,197.4 million and $2,218.9 million, respectively. As of December 31, 2015, the carrying amount and fair value was approximately $2,215.0 million and $2,200.0 million, respectively.
Commitments and Contingencies
The Company recognizes a liability with regard to loss contingencies when it believes it is probable a liability has occurred and the amount can be reasonably estimated. If some amount within a range of loss appears at the time to be a better estimate than any other amount within the range, the Company accrues that amount. When no amount within the range is a better estimate than any other amount, however, the Company accrues the minimum amount in the range.
The Company has established an accrual for those legal proceedings and regulatory matters for which a loss is both probable and the amount can be reasonably estimated, except as otherwise covered by third-party insurance or self-insurance through the Company's Captive Insurance subsidiary.
Leasehold Financing Obligation
The Company was involved in a build-to-suit lease arrangement in Fort Mill, South Carolina, under which it served as the construction agent on behalf of the landlord and bore substantially all of the risks and rewards of ownership as measured under GAAP. The Company were therefore required to report the landlord's costs of construction as a fixed asset during the construction period as if the Company owned such asset and an equal and off-setting leasehold financing obligation on our consolidated statements of financial condition. The construction was completed in October 2016 and it was determined that the asset did not qualify for sale-leaseback accounting treatment. As such, the Company account for this arrangement as a capital lease in which the asset is depreciated and the lease payments are recognized as a reduction of the financing obligation and interest expense over the lease term on our consolidated statements of income.
Recently Issued Accounting Pronouncements
In May 2014, the Financial Accounting Standards Board ("FASB") issued Accounting Standards Update("ASU") 2014-09, Revenue from Contracts with Customers: Topic 606, to supersede nearly all existing revenue recognition guidance under GAAP. In August 2015, the FASB issued ASU 2015-14, Revenue from Contracts with
F-16
LPL FINANCIAL HOLDINGS INC. AND SUBSIDIARIES
Notes to Consolidated Financial Statements
Customers: Deferral of the Effective Date, which deferred the effective date for implementation of ASU 2014-09 by one year and is now effective for annual reporting periods beginning after December 15, 2017, with early adoption permitted but not earlier than the original effective date. The Company expects to adopt the provisions of this guidance on January 1, 2018 using the modified retrospective approach; however, the adoption is expected to have no material impact on its consolidated financial statements but will impact the Company's disclosures.
In February 2016, the FASB issued ASU 2016-02, Leases, which establishes a right-of-use model that requires a lessee to record a right-of-use asset and a lease liability on the balance sheet for all leases with terms longer than 12 months. Leases will be classified as either finance or operating, with classification affecting the pattern of expense recognition in the statement of operations. The Company expects to adopt the provisions of this guidance on January 1, 2019. The Company is currently evaluating the impact that ASU 2016-02 will have on its consolidated financial statements and related disclosures.
In March 2016, the FASB issued ASU 2016-09, Improvements to Employee Share-Based Payment Accounting. The ASU is designed to identify areas for simplification involving several aspects of accounting for share-based payment transactions, including the income tax consequences, classification of awards as either equity or liabilities, an option to recognize gross stock compensation expense with actual forfeitures recognized as they occur, as well as certain classifications on the statement of cash flows. The Company adopted the new rule on January 1, 2017. The adoption of ASU 2016-09 is expected to have no material impact on its consolidated financial statements.
In June 2016, the FASB issued ASU 2016-13, “Financial Instruments-Credit Losses (Topic 326)”, which requires entities to measure all expected credit losses for financial assets held at the reporting date based on historical experience, current conditions, and reasonable and supportable forecasts. Entities will now use forward-looking information to better form their credit loss estimates. The ASU also requires enhanced disclosures to help financial statement users better understand significant estimates and judgments used in estimating credit losses, as well as the credit quality and underwriting standards of an entity’s portfolio. The Company expects to adopt the provisions of this guidance on January 1, 2020. The Company is currently evaluating the impact of the adoption on its consolidated financial statements and related disclosures.
In August 2016, the FASB issued ASU 2016-15, Statement of Cash Flows (Topic 230): Classification of Certain Cash Receipts and Cash Payments, which clarifies how companies present and classify certain cash receipts and cash payments in the statement of cash flows. The Company expects to adopt the provisions of this guidance on January 1, 2018. The Company is currently evaluating the impact the new rule will have on its consolidated financial statements and related disclosures.
In November 2016, the FASB issued ASU 2016-18, Statements of Cash Flows (Topic 230): Classification and Presentation of Restricted Cash in the Statements of Cash Flows, which requires that restricted cash and restricted cash equivalents be included as components of total cash and cash equivalents in the statement of cash flows. The Company expects to adopt the provisions of this guidance on January 1, 2018. The adoption is not expected to have a material impact on its consolidated financial statements but will impact the presentation of the cash flow statement and the Company's disclosures.
3. Fair Value Measurements
Fair value is defined as the exchange price that would be received for an asset or paid to transfer a liability (an exit price) in the principal or most advantageous market for the asset or liability in an orderly transaction between market participants at the measurement date. Inputs used to measure fair value are prioritized within a three-level fair value hierarchy. This hierarchy requires entities to maximize the use of observable inputs and minimize the use of unobservable inputs. The three levels of inputs used to measure fair value are as follows:
Level 1 — Quoted prices in active markets for identical assets or liabilities.
Level 2 — Observable inputs other than quoted prices included in Level 1, such as quoted prices for similar assets and liabilities in active markets; quoted prices for identical or similar assets and liabilities in markets that are not active; or other inputs that are observable or can be corroborated by observable market data.
Level 3 — Unobservable inputs that are supported by little or no market activity and that are significant to the fair value of the assets or liabilities. This includes certain pricing models, discounted cash flow methodologies, and similar techniques that use significant unobservable inputs.
F-17
LPL FINANCIAL HOLDINGS INC. AND SUBSIDIARIES
Notes to Consolidated Financial Statements
There have been no transfers of assets or liabilities between these fair value measurement classifications during the years ended December 31, 2016 and 2015.
The Company’s fair value measurements are evaluated within the fair value hierarchy, based on the nature of inputs used to determine the fair value at the measurement date. At December 31, 2016, the Company had the following financial assets and liabilities that are measured at fair value on a recurring basis:
Cash Equivalents — The Company’s cash equivalents include money market funds, which are short term in nature with readily determinable values derived from active markets.
Securities Owned and Securities Sold, But Not Yet Purchased — The Company’s trading securities consist of house account model portfolios established and managed for the purpose of benchmarking the performance of its fee-based advisory platforms and temporary positions resulting from the processing of client transactions. Examples of these securities include money market funds, United States treasury obligations, mutual funds, certificates of deposit, and traded equity and debt securities.
The Company uses prices obtained from independent third-party pricing services to measure the fair value of its trading securities. Prices received from the pricing services are validated using various methods including comparison to prices received from additional pricing services, comparison to available quoted market prices, and review of other relevant market data including implied yields of major categories of securities. In general, these quoted prices are derived from active markets for identical assets or liabilities. When quoted prices in active markets for identical assets and liabilities are not available, the quoted prices are based on similar assets and liabilities or inputs other than the quoted prices that are observable, either directly or indirectly. For certificates of deposit and treasury securities, the Company utilizes market-based inputs, including observable market interest rates that correspond to the remaining maturities or the next interest reset dates. At December 31, 2016, the Company did not adjust prices received from the independent third-party pricing services.
Other Assets — The Company’s other assets include: (1) deferred compensation plan assets that are invested in money market and other mutual funds, which are actively traded and valued based on quoted market prices; (2) certain non-traded real estate investment trusts and auction rate notes, which are valued using quoted prices for identical or similar securities and other inputs that are observable or can be corroborated by observable market data; and (3) cash flow hedges, which are measured using quoted prices for similar cash flow hedges, taking into account counterparty credit risk and the Company's own non-performance risk.
Accounts Payable and Accrued Liabilities — The Company's accounts payable and accrued liabilities include hedges that are measured using Level 2 inputs and contingent consideration liabilities that are measured using Level 3 inputs.
Level 3 Recurring Fair Value Measurements
The Company determines the fair value for its contingent consideration obligations using an income approach whereby the Company assesses the expected future performance of the acquired assets. The contingent payment is estimated using a discounted cash flow of the expected payment amount to calculate the fair value as of the valuation date. The Company's management evaluates the underlying projections and other related factors used in determining fair value each period and makes updates when there have been significant changes in management's expectations.
F-18
LPL FINANCIAL HOLDINGS INC. AND SUBSIDIARIES
Notes to Consolidated Financial Statements
The following table summarizes the Company’s financial assets and financial liabilities measured at fair value on a recurring basis at December 31, 2016 (in thousands):
Level 1 | Level 2 | Level 3 | Total | ||||||||||||
Assets | |||||||||||||||
Cash equivalents | $ | 168,320 | $ | — | $ | — | $ | 168,320 | |||||||
Securities owned — trading: | |||||||||||||||
Money market funds | 474 | — | — | 474 | |||||||||||
Mutual funds | 7,585 | — | — | 7,585 | |||||||||||
Equity securities | 35 | — | — | 35 | |||||||||||
Debt securities | — | 314 | — | 314 | |||||||||||
U.S. treasury obligations | 2,996 | — | — | 2,996 | |||||||||||
Total securities owned — trading | 11,090 | 314 | — | 11,404 | |||||||||||
Other assets | 134,914 | 7,105 | — | 142,019 | |||||||||||
Total assets at fair value | $ | 314,324 | $ | 7,419 | $ | — | $ | 321,743 | |||||||
Liabilities | |||||||||||||||
Securities sold, but not yet purchased: | |||||||||||||||
Equity securities | $ | 168 | $ | — | $ | — | $ | 168 | |||||||
Debt securities | — | 15 | — | 15 | |||||||||||
Total securities sold, but not yet purchased | 168 | 15 | — | 183 | |||||||||||
Accounts payable and accrued liabilities | — | 86 | 527 | 613 | |||||||||||
Total liabilities at fair value | $ | 168 | $ | 101 | $ | 527 | $ | 796 | |||||||
The following table summarizes the Company’s financial assets and liabilities measured at fair value on a recurring basis at December 31, 2015 (in thousands):
Level 1 | Level 2 | Level 3 | Total | ||||||||||||
Assets | |||||||||||||||
Cash equivalents | $ | 252,393 | $ | — | $ | — | $ | 252,393 | |||||||
Securities owned — trading: | |||||||||||||||
Money market funds | 261 | — | — | 261 | |||||||||||
Mutual funds | 7,267 | — | — | 7,267 | |||||||||||
Equity securities | 56 | — | — | 56 | |||||||||||
Debt securities | — | 103 | — | 103 | |||||||||||
U.S. treasury obligations | 4,308 | — | — | 4,308 | |||||||||||
Total securities owned — trading | 11,892 | 103 | — | 11,995 | |||||||||||
Other assets | 99,962 | 3,350 | — | 103,312 | |||||||||||
Total assets at fair value | $ | 364,247 | $ | 3,453 | $ | — | $ | 367,700 | |||||||
Liabilities | |||||||||||||||
Securities sold, but not yet purchased: | |||||||||||||||
Mutual funds | $ | 1 | $ | — | $ | — | $ | 1 | |||||||
Equity securities | 267 | — | — | 267 | |||||||||||
Total securities sold, but not yet purchased | 268 | — | — | 268 | |||||||||||
Accounts payable and accrued liabilities | — | — | 527 | 527 | |||||||||||
Total liabilities at fair value | $ | 268 | $ | — | $ | 527 | $ | 795 | |||||||
4. Held-to-Maturity Securities
The Company holds certain investments in securities, primarily United States government notes, which are recorded at amortized cost because the Company has both the intent and the ability to hold these investments to maturity. Interest income is accrued as earned. Premiums and discounts are amortized using a method that approximates the effective yield method over the term of the security and are recorded as an adjustment to the investment yield.
F-19
LPL FINANCIAL HOLDINGS INC. AND SUBSIDIARIES
Notes to Consolidated Financial Statements
The amortized cost, gross unrealized loss, and fair value of securities held-to-maturity were as follows (in thousands):
December 31, | |||||||
2016 | 2015 | ||||||
Amortized cost | $ | 8,862 | $ | 9,847 | |||
Gross unrealized loss | (31 | ) | (26 | ) | |||
Fair value | $ | 8,831 | $ | 9,821 | |||
At December 31, 2016, the securities held-to-maturity were scheduled to mature as follows (in thousands):
Within one year | After one but within five years | After five but within ten years | Total | ||||||||||||
U.S. government notes — at amortized cost | $ | 3,000 | $ | 5,362 | $ | 500 | $ | 8,862 | |||||||
U.S. government notes — at fair value | $ | 3,000 | $ | 5,335 | $ | 496 | $ | 8,831 | |||||||
5. | Receivables from Product Sponsors, Broker-Dealers, and Clearing Organizations and Payables to Broker-Dealers and Clearing Organizations |
Receivables from product sponsors, broker-dealers, and clearing organizations and payables to broker-dealers and clearing organizations were as follows (in thousands):
December 31, | ||||||||
2016 | 2015 | |||||||
Receivables: | ||||||||
Commissions receivable from product sponsors and others | $ | 116,218 | $ | 115,413 | ||||
Receivable from clearing organizations | 50,656 | 35,991 | ||||||
Receivable from broker-dealers | 1,309 | 4,719 | ||||||
Securities failed-to-deliver | 6,939 | 5,101 | ||||||
Total receivables | $ | 175,122 | $ | 161,224 | ||||
Payables: | ||||||||
Payable to clearing organizations | $ | 26,517 | $ | 17,046 | ||||
Payable to broker-dealers | 32,065 | 27,455 | ||||||
Securities failed-to-receive | 4,450 | 3,531 | ||||||
Total payables | $ | 63,032 | $ | 48,032 | ||||
F-20
LPL FINANCIAL HOLDINGS INC. AND SUBSIDIARIES
Notes to Consolidated Financial Statements
6. Fixed Assets
The components of fixed assets were as follows (in thousands):
December 31, | ||||||||
2016 | 2015 | |||||||
Internally developed software | $ | 293,997 | $ | 266,899 | ||||
Leasehold improvements | 86,171 | 77,473 | ||||||
Computers and software | 122,442 | 102,909 | ||||||
Real estate development | — | 59,940 | ||||||
Buildings | 105,939 | — | ||||||
Furniture and equipment | 74,492 | 47,111 | ||||||
Land | 4,678 | 4,678 | ||||||
Construction in progress | 55,568 | 45,289 | ||||||
Total fixed assets | 743,287 | 604,299 | ||||||
Accumulated depreciation and amortization | (355,919 | ) | (328,880 | ) | ||||
Fixed assets, net | $ | 387,368 | $ | 275,419 | ||||
Depreciation and amortization expense was $75.9 million, $73.4 million, and $58.0 million for the years ended December 31, 2016, 2015, and 2014, respectively.
The Company has classified certain assets as construction in process to more accurately describe the status of those assets.The prior period amounts have been reclassified to conform to the current period presentation. The reclassification has no impact in the net fixed asset balance presented in the consolidated statements of financial condition.
7. Goodwill and Other Intangible Assets
A summary of the activity in goodwill is presented below (in thousands):
Balance at December 31, 2014 | $ | 1,365,838 | |
Goodwill acquired | — | ||
Balance at December 31, 2015 | $ | 1,365,838 | |
Goodwill acquired | — | ||
Balance at December 31, 2016 | $ | 1,365,838 | |
The components of intangible assets were as follows at December 31, 2016 (dollars in thousands):
Weighted-Average Life Remaining (in years) | Gross Carrying Value | Accumulated Amortization | Net Carrying Value | ||||||||||
Definite-lived intangible assets: | |||||||||||||
Advisor and financial institution relationships | 9.0 | $ | 440,533 | $ | (244,540 | ) | $ | 195,993 | |||||
Product sponsor relationships | 9.1 | 234,086 | (125,620 | ) | 108,466 | ||||||||
Client relationships | 7.7 | 19,133 | (10,055 | ) | 9,078 | ||||||||
Trade names | 5.3 | 1,200 | (560 | ) | 640 | ||||||||
Total definite-lived intangible assets | $ | 694,952 | $ | (380,775 | ) | $ | 314,177 | ||||||
Indefinite-lived intangible assets: | |||||||||||||
Trademark and trade name | 39,819 | ||||||||||||
Total intangible assets | $ | 353,996 | |||||||||||
F-21
LPL FINANCIAL HOLDINGS INC. AND SUBSIDIARIES
Notes to Consolidated Financial Statements
The components of intangible assets were as follows at December 31, 2015 (dollars in thousands):
Weighted-Average Life Remaining (in years) | Gross Carrying Value | Accumulated Amortization | Net Carrying Value | ||||||||||
Definite-lived intangible assets: | |||||||||||||
Advisor and financial institution relationships | 10.0 | $ | 440,533 | $ | (220,214 | ) | $ | 220,319 | |||||
Product sponsor relationships | 10.1 | 234,086 | (113,530 | ) | 120,556 | ||||||||
Client relationships | 8.6 | 19,133 | (8,556 | ) | 10,577 | ||||||||
Trade names | 6.3 | 1,200 | (440 | ) | 760 | ||||||||
Total definite-lived intangible assets | $ | 694,952 | $ | (342,740 | ) | $ | 352,212 | ||||||
Indefinite-lived intangible assets: | |||||||||||||
Trademark and trade name | 39,819 | ||||||||||||
Total intangible assets | $ | 392,031 | |||||||||||
Total amortization expense of intangible assets was $38.0 million, $38.2 million, and $38.9 million for the years ended December 31, 2016, 2015, and 2014, respectively. Future amortization expense is estimated as follows (in thousands):
2017 | $ | 37,218 | |
2018 | 34,786 | ||
2019 | 34,750 | ||
2020 | 34,358 | ||
2021 | 34,201 | ||
Thereafter | 138,864 | ||
Total | $ | 314,177 | |
8. Derivative Financial Instruments
In May 2013, in conjunction with its Service Value Commitment initiative, the Company entered into a long-term contractual obligation (the “Agreement”) with a third-party provider to enhance the quality, speed, and cost of its processes by outsourcing certain functions. The Agreement provides that on each annual anniversary date of the signing of the Agreement, the price for services (denominated in U.S. dollars) is to be adjusted for the then-current exchange rate between the U.S. dollar (“USD”) and the Indian rupee (“INR”). The Company bears the risk of currency movement at each of the annual reset dates.
To mitigate foreign currency risk arising from these annual anniversary events, the Company entered into four non-deliverable foreign currency contracts, all of which have been designated as cash flow hedges. The first two cash flow hedges settled in 2014 and 2015 and have been fully recognized in net income. The third cash flow hedge, with a notional amount of 560.4 million INR, or $7.8 million, settled in June 2016. The Company received a settlement of $0.6 million, which will be reclassified out of accumulated other comprehensive income and recognized in net income ratably over a 12-month period ending May 31, 2017 to match the timing of the underlying hedged item.
The details related to the non-deliverable foreign currency contract at December 31, 2016 are as follows:
Settlement Date | Hedged Notional Amount (INR) (in millions) | Contractual INR/USD Foreign Exchange Rate | Hedged Notional Amount (USD) (in millions) | ||||||||
Cash flow hedge #4 | 6/2/2017 | 560.4 | 74.20 | 7.5 | |||||||
Total hedged amount | $ | 7.5 | |||||||||
F-22
LPL FINANCIAL HOLDINGS INC. AND SUBSIDIARIES
Notes to Consolidated Financial Statements
The fair value of the derivative instrument, included in other assets in the consolidated statements of financial condition, was as follows (in thousands):
December 31, | |||||||
2016 | 2015 | ||||||
Cash flow hedge | $ | 466 | $ | 741 | |||
9. Accounts Payable and Accrued Liabilities
Accounts payable and accrued liabilities were as follows (in thousands):
December 31, | |||||||
2016 | 2015 | ||||||
Advisor deferred compensation plan liability | $ | 133,632 | $ | 98,828 | |||
Accrued compensation | 63,741 | 61,468 | |||||
Deferred rent | 43,817 | 45,003 | |||||
Accounts payable | 23,284 | 19,883 | |||||
Other accrued liabilities | 121,071 | 107,310 | |||||
Total accounts payable and accrued liabilities | $ | 385,545 | $ | 332,492 | |||
10. Debt
Senior Secured Credit Facilities
In November 2015, LPLFH and LPLH entered into a third amendment, extension, and incremental assumption agreement with respect to its existing credit agreement (as amended, the "Credit Agreement") for purposes of raising capital, increasing the leverage allowable under the Credit Agreement and extending the maturity of a portion of the existing Term Loan B.
The Company’s outstanding borrowings were as follows (dollars in thousands):
December 31, | |||||||||||||||
2016 | 2015 | ||||||||||||||
Senior Secured Credit Facilities | Maturity | Principal | Interest Rate | Principal | Interest Rate | ||||||||||
Term Loan A | 9/30/2019 | $ | 459,375 | 3.27 | % | (1) | $ | 459,375 | 2.74 | % | |||||
Existing Term Loan B | 3/29/2019 | 420,309 | 3.25 | % | (2) | 424,676 | 3.25 | % | |||||||
Extended Term Loan B | 3/29/2021 | 624,676 | 4.25 | % | (3) | 630,986 | 4.25 | % | |||||||
New Term Loan B | 11/20/2022 | 693,000 | 4.80 | % | (4) | 700,000 | 4.75 | % | |||||||
Total borrowings | 2,197,360 | 2,215,037 | |||||||||||||
Less: Unamortized Debt Issuance Cost | 21,924 | 26,797 | |||||||||||||
Long-term borrowings — net of unamortized debt issuance cost | $ | 2,175,436 | $ | 2,188,240 | |||||||||||
(1) | The variable interest rate per annum is either (a) 150 bps over the base rate or (b) 250 bps over the LIBOR rate (subject to a leverage based grid) |
(2) | The variable interest rate per annum is either (a) 150 bps over the base rate or (b) 250 bps over the LIBOR rate (subject to a LIBOR floor of 75 bps) |
(3) | The variable interest rate per annum is either (a) 250 bps over the base rate or (b) 350 bps over the LIBOR rate (subject to a LIBOR floor of 75 bps) |
(4) | The variable interest rate per annum is either (a) 300 bps over the base rate or (b) 400 bps over the LIBOR rate (subject to a LIBOR floor of 75 bps) |
The Company is required to make quarterly payments on Term Loan B, with a payment of the remaining balance due at maturity.
The Company also has a revolving credit facility, with borrowing capacity of $400.0 million maturing on September 30, 2019.
As of December 31, 2016, the Borrower had $14.6 million of irrevocable letters of credit, with an applicable interest rate margin of 2.50%, which were supported by the credit facility.
The Credit Agreement subjects the Company to certain financial and non-financial covenants. As of December 31, 2016, the Company was in compliance with such covenants.
F-23
LPL FINANCIAL HOLDINGS INC. AND SUBSIDIARIES
Notes to Consolidated Financial Statements
Bank Loans Payable
The Company maintains three uncommitted lines of credit. Two of the lines have unspecified limits, which are primarily dependent on the Company’s ability to provide sufficient collateral. The third line has a $200.0 million limit and allows for both collateralized and uncollateralized borrowings. During the year ended December 31, 2016, the Company drew a total of $105.0 million on one of the lines of credit, which was outstanding for one day at a weighted average interest rate of 1.59%. During the year ended December 31, 2015, the Company drew $55.0 million on one of the line of credit, which was outstanding for one day at an interest rate of 1.50%. The lines were not otherwise utilized in 2016 and 2015. There were no balances outstanding at December 31, 2016 or 2015.
The minimum calendar year payments and maturities of the senior secured borrowings as of December 31, 2016 are as follows (in thousands):
2017 | $ | 26,290 | |
2018 | 52,130 | ||
2019 | 841,193 | ||
2020 | 13,310 | ||
2021 | 606,437 | ||
Thereafter | 658,000 | ||
Total | $ | 2,197,360 | |
11. Income Taxes
The Company’s provision for income taxes was as follows (in thousands):
December 31, | |||||||||||
2016 | 2015 | 2014 | |||||||||
Current provision: | |||||||||||
Federal | $ | 102,133 | $ | 123,633 | $ | 120,995 | |||||
State | 15,002 | 20,291 | 19,759 | ||||||||
Total current provision | 117,135 | 143,924 | 140,754 | ||||||||
Deferred benefit: | |||||||||||
Federal | (10,767 | ) | (24,972 | ) | (20,800 | ) | |||||
State | (783 | ) | (5,181 | ) | (3,300 | ) | |||||
Total deferred benefit | (11,550 | ) | (30,153 | ) | (24,100 | ) | |||||
Provision for income taxes | $ | 105,585 | $ | 113,771 | $ | 116,654 | |||||
A reconciliation of the United States federal statutory income tax rates to the Company’s effective income tax rates is set forth below:
Years Ended December 31, | ||||||||
2016 | 2015 | 2014 | ||||||
Federal statutory income tax rates | 35.0 | % | 35.0 | % | 35.0 | % | ||
State income taxes, net of federal benefit | 3.5 | 3.6 | 3.6 | |||||
Non-deductible expenses | 0.3 | 0.7 | 0.7 | |||||
Share-based compensation | 0.1 | — | (0.1 | ) | ||||
Contingent consideration obligations | — | — | (0.1 | ) | ||||
Domestic production activities deduction | (2.2 | ) | — | — | ||||
Research & development credits | (1.1 | ) | — | — | ||||
Other | (0.1 | ) | 1.0 | 0.5 | ||||
Effective income tax rates | 35.5 | % | 40.3 | % | 39.6 | % | ||
The decrease in the Company's effective tax rate and income tax expense in 2016 compared to 2015 was primarily due to tax benefits associated with internally developed software that we determined in 2016.
F-24
LPL FINANCIAL HOLDINGS INC. AND SUBSIDIARIES
Notes to Consolidated Financial Statements
The increase in the Company's effective tax rate and income tax expense in 2015 compared to 2014 was primarily due to change in estimates in unrecognized tax positions.
The components of the net deferred income taxes included in the consolidated statements of financial condition were as follows (in thousands):
December 31, | |||||||
2016 | 2015 | ||||||
Deferred tax assets: | |||||||
Accrued liabilities | $ | 75,907 | $ | 66,750 | |||
Share-based compensation | 31,715 | 26,774 | |||||
State taxes | 9,345 | 8,387 | |||||
Deferred rent | 49,544 | 4,755 | |||||
Provision for bad debts | 7,520 | 5,316 | |||||
Net operating losses | (10 | ) | 404 | ||||
Forgivable loans | 9,381 | 8,741 | |||||
Captive Insurance | 1,689 | 1,590 | |||||
Other | 956 | 3,126 | |||||
Total deferred tax assets | 186,047 | 125,843 | |||||
Deferred tax liabilities: | |||||||
Amortization of intangible assets | (122,482 | ) | (128,646 | ) | |||
Depreciation of fixed assets | (88,960 | ) | (33,125 | ) | |||
Other | (219 | ) | (375 | ) | |||
Total deferred tax liabilities | (211,661 | ) | (162,146 | ) | |||
Deferred income taxes, net | $ | (25,614 | ) | $ | (36,303 | ) | |
The following table reflects a reconciliation of the beginning and ending balances of the total amounts of gross unrecognized tax benefits, including interest and penalties (in thousands):
December 31, | |||||||||||
2016 | 2015 | 2014 | |||||||||
Balance — Beginning of year | $ | 24,747 | $ | 20,987 | $ | 19,522 | |||||
Increases for tax positions taken during the current year | 17,787 | 4,404 | 4,656 | ||||||||
Reductions as a result of a lapse of the applicable statute of limitations | (2,768 | ) | (644 | ) | (3,191 | ) | |||||
Balance — End of year | $ | 39,766 | $ | 24,747 | $ | 20,987 | |||||
At December 31, 2016 and 2015, the gross unrecognized tax benefits included $31.4 million and $17.6 million (net of the federal benefit on state issues), respectively, that if recognized would favorably affect the effective income tax rate in any future periods. Increases for tax positions taken during the current year increased compared to the prior year primarily because of tax benefits associated with our internally developed software.
The Company accrues interest and penalties related to unrecognized tax benefits in its provision for income taxes within the consolidated statements of financial condition. At December 31, 2016 and 2015, the liability for unrecognized tax benefits included accrued interest of $3.9 million and $3.0 million, respectively, and penalties of $4.5 million and $4.3 million, respectively.
The Company and its subsidiaries file income tax returns in the federal jurisdiction, as well as most state jurisdictions, and are subject to routine examinations by the respective taxing authorities. The Company has concluded all federal income tax matters for years through 2011 and all state income tax matters for years through 2006.
The tax years of 2012 to 2016 remain open to examination in the federal jurisdiction. The tax years of 2007 to 2016 remain open to examination in the state jurisdictions. In the next 12 months, it is reasonably possible that the Company expects a reduction in unrecognized tax benefits of $4.4 million primarily related to the statute of limitations expiration in various state jurisdictions.
F-25
LPL FINANCIAL HOLDINGS INC. AND SUBSIDIARIES
Notes to Consolidated Financial Statements
12. Commitments and Contingencies
Leases
The Company leases office space and equipment under various operating leases. These leases are generally subject to scheduled base rent and maintenance cost increases, which are recognized on a straight-line basis over the period of the leases. Total rental expense for all operating leases was approximately $24.7 million, $25.6 million, and $30.1 million for the years ended December 31, 2016, 2015, and 2014, respectively.
Service and Development Contracts
The Company is party to certain long-term contracts for systems and services that enable back office trade processing and clearing for its product and service offerings.
Future minimum payments under leases, lease commitments, service, development, and agency contracts, and other contractual obligations with initial terms greater than one year were as follows at December 31, 2016 (in thousands):
2017 | $ | 57,935 | |
2018 | 56,840 | ||
2019 | 38,358 | ||
2020 | 33,201 | ||
2021 | 30,859 | ||
Thereafter | 301,721 | ||
Total(1) | $ | 518,914 | |
_____________________
(1) | Future minimum payments have not been reduced by minimum sublease rental income of $8.6 million due in the future under noncancellable subleases. |
Guarantees
The Company occasionally enters into certain types of contracts that contingently require it to indemnify certain parties against third-party claims. The terms of these obligations vary and, because a maximum obligation is not explicitly stated, the Company has determined that it is not possible to make an estimate of the amount that it could be obligated to pay under such contracts.
The Company’s subsidiary, LPL Financial LLC, provides guarantees to securities clearing houses and exchanges under their standard membership agreements, which require a member to guarantee the performance of other members. Under these agreements, if a member becomes unable to satisfy its obligations to the clearing houses and exchanges, all other members would be required to meet any shortfall. The Company’s liability under these arrangements is not quantifiable and may exceed the cash and securities it has posted as collateral. However, the potential requirement for the Company to make payments under these agreements is remote. Accordingly, no liability has been recognized for these transactions.
Loan Commitments
From time to time, LPL Financial makes loans to its advisors, primarily to newly recruited advisors to assist in the transition process, which may be forgivable. Due to timing differences, LPL Financial may make commitments to issue such loans prior to actually funding them. These commitments are generally contingent upon certain events occurring, including but not limited to the advisor joining LPL Financial. LPL Financial had no significant unfunded commitments at December 31, 2016.
Legal & Regulatory Matters
The Company is subject to extensive regulation and supervision by United States federal and state agencies and various self-regulatory organizations. The Company and its advisors periodically engage with such agencies and organizations, in the context of examinations or otherwise, to respond to inquiries, informational requests, and investigations. From time to time, such engagements result in regulatory complaints or other matters, the resolution of which can include fines and other remediation. Assessing the probability of a loss occurring and the amount of any loss related to a legal proceeding or regulatory matter is inherently difficult. While the Company exercises
F-26
LPL FINANCIAL HOLDINGS INC. AND SUBSIDIARIES
Notes to Consolidated Financial Statements
significant and complex judgments to make certain estimates presented in its consolidated financial statements, there are particular uncertainties and complexities involved when assessing the potential outcomes of legal proceedings and regulatory matters. The Company's assessment process considers a variety of factors and assumptions, which may include the procedural status of the matter and any recent developments; prior experience and the experience of others in similar matters; the size and nature of potential exposures; available defenses; the progress of fact discovery; the opinions of counsel and experts; potential opportunities for settlement and the status of any settlement discussions; as well as the potential for insurance coverage and indemnification, if available. The Company monitors these factors and assumptions for new developments and re-assesses the likelihood that a loss will occur and the estimated range or amount of loss, if those amounts can be reasonably determined. The Company has established an accrual for those legal proceedings and regulatory matters for which a loss is both probable and the amount can be reasonably estimated, except as otherwise covered by third-party insurance or self-insurance through the captive insurance subsidiary, as discussed below.
A putative class action lawsuit has been filed against the Company and certain of its executive officers in federal district court alleging certain misstatements and omissions related to the Company’s share repurchases and financial performance in late 2015.
Third-Party Insurance
The Company maintains third-party insurance coverage for certain potential legal proceedings, including those involving client claims. With respect to client claims, the estimated losses on many of the pending matters are less than the applicable deductibles of the insurance policies.
Self-Insurance
The Company has self-insurance for certain potential liabilities, including various errors and omissions liabilities, through a wholly-owned captive insurance subsidiary. Liabilities associated with the risks that are retained by the Company are not discounted and are estimated by considering, in part, historical claims experience, severity factors, and other actuarial assumptions. The estimated accruals for these potential liabilities could be significantly affected if future occurrences and claims differ from such assumptions and historical trends. As of December 31, 2016, these self-insurance liabilities are included in accounts payable and accrued liabilities in the consolidated statements of financial condition. Self-insurance related charges are included in other expenses in the consolidated statements of income for the year ended December 31, 2016.
Other Commitments
As of December 31, 2016, the Company had approximately $219.1 million of client margin loans that were collateralized with securities having a fair value of approximately $306.7 million that it can repledge, loan, or sell. Of these securities, approximately $37.6 million were client-owned securities pledged to the Options Clearing Corporation as collateral to secure client obligations related to options positions. As of December 31, 2016 there were no restrictions that materially limited the Company's ability to repledge, loan, or sell the remaining $269.1 million of client collateral.
Trading securities on the consolidated statements of financial condition includes $3.0 million and $4.3 million pledged to clearing organizations at December 31, 2016 and 2015, respectively.
F-27
LPL FINANCIAL HOLDINGS INC. AND SUBSIDIARIES
Notes to Consolidated Financial Statements
13. Stockholders' Equity
Dividends
The payment, timing and amount of any dividends are subject to approval by the Board of Directors as well as certain limits under the Company's credit facilities. Cash dividends per share of common stock and total cash dividends paid on a quarterly basis were as follows (in millions, except per share data):
2016 | 2015 | ||||||||||||||
Dividend per Share | Total Cash Dividend | Dividend per Share | Total Cash Dividend | ||||||||||||
First quarter | $ | 0.25 | $ | 22.2 | $ | 0.25 | $ | 24.2 | |||||||
Second quarter | $ | 0.25 | $ | 22.3 | $ | 0.25 | $ | 24.1 | |||||||
Third quarter | $ | 0.25 | $ | 22.3 | $ | 0.25 | $ | 23.8 | |||||||
Fourth quarter | $ | 0.25 | $ | 22.3 | $ | 0.25 | $ | 23.8 | |||||||
Share Repurchases
The Company engages in share repurchase programs, which are approved by the Board of Directors, pursuant to which the Company may repurchase its issued and outstanding shares of common stock from time to time. Repurchased shares are included in treasury stock on the consolidated statements of financial condition. Purchases may be effected in open market or privately negotiated transactions, including transactions with affiliates, with the timing of purchases and the amount of stock purchased generally determined at the discretion of the Company's management within the constraints of the Credit Agreement and general liquidity needs.
On October 25, 2015 the Board of Directors authorized an increase to the share repurchase program of up to $500.0 million of shares of common stock. During the year ended December 31, 2016 the Company purchased a total of 634,651 shares of its common stock at a weighted-average price of $39.41, for a total cost of $25.0 million. As of December 31, 2016, the Company was authorized to purchase up to an additional $225.0 million of shares pursuant to share repurchase programs approved by the Board of Directors.
14. Share-Based Compensation
Certain employees, advisors, institutions, officers, and directors of the Company participate in various long-term incentive plans, which provide for granting stock options, warrants, restricted stock awards, restricted stock units, and deferred stock units. Stock options and warrants outstanding generally vest in equal increments over a three- to five-year period and expire on the tenth anniversary following the date of grant. Restricted stock awards, restricted stock units, and deferred stock units generally vest over a one- to four-year period.
In November 2010, the Company adopted the 2010 Omnibus Equity Incentive Plan (as amended and restated in May 2015, the “2010 Plan”), which provides for the granting of stock options, warrants, restricted stock awards, restricted stock units, deferred stock units, and other equity-based compensation. The 2010 Plan serves as the successor to the 2005 Stock Option Plan for Incentive Stock Options, the 2005 Stock Option Plan for Non-qualified Stock Options, the 2008 Advisor and Institution Incentive Plan, the 2008 Stock Option Plan, and the Director Restricted Stock Plan (collectively, the “Predecessor Plans”). Upon adoption of the 2010 Plan, awards were no longer made under the Predecessor Plans; however, awards previously granted under the Predecessor Plans remain outstanding until exercised or forfeited.
As of December 31, 2016, there are 20,055,945 shares authorized for grant under the 2010 Plan. There were 8,364,542 shares reserved for exercise or conversion of outstanding awards granted, and 9,696,652 shares remaining available for future issuance, under the 2010 plan as of December 31, 2016.
Stock Options and Warrants
The following table presents the weighted-average assumptions used in the Black-Scholes valuation model by the Company in calculating the fair value of its employee and officer stock options that have been granted during the year ended December 31, 2016:
Years Ended December 31, | ||||||||||||
2016 | 2015 | 2014 | ||||||||||
Expected life (in years) | 5.26 | 5.30 | 6.02 | |||||||||
Expected stock price volatility | 33.38 | % | 25.78 | % | 44.25 | % | ||||||
Expected dividend yield | 2.87 | % | 2.30 | % | 1.77 | % | ||||||
Risk-free interest rate | 1.16 | % | 1.58 | % | 2.17 | % | ||||||
Fair value of options | $ | 4.60 | $ | 8.81 | $ | 20.51 | ||||||
The fair value of each stock option or warrant awarded to advisors and financial institutions is estimated on the date of grant and revalued at each reporting period using the Black-Scholes valuation model with the following weighted-average assumptions used during the year ended December 31, 2016:
Years Ended December 31, | ||||||||||||
2016 | 2015 | 2014 | ||||||||||
Expected life (in years) | 5.90 | 5.25 | 6.82 | |||||||||
Expected stock price volatility | 35.19 | % | 25.91 | % | 25.87 | % | ||||||
Expected dividend yield | 2.87 | % | 2.35 | % | 2.24 | % | ||||||
Risk-free interest rate | 2.13 | % | 1.84 | % | 1.96 | % | ||||||
Fair value of options | $ | 11.72 | $ | 12.12 | $ | 15.12 | ||||||
F-28
LPL FINANCIAL HOLDINGS INC. AND SUBSIDIARIES
Notes to Consolidated Financial Statements
The following table summarizes the Company’s stock option and warrant activity as of and for the year ended December 31, 2016:
Number of Shares | Weighted- Average Exercise Price | Weighted- Average Remaining Contractual Term (Years) | Aggregate Intrinsic Value (In thousands) | ||||||||||
Outstanding — December 31, 2015 | 5,716,488 | $ | 34.31 | ||||||||||
Granted | 2,116,199 | $ | 20.01 | ||||||||||
Exercised | (180,832 | ) | $ | 26.53 | |||||||||
Forfeited | (497,873 | ) | $ | 32.56 | |||||||||
Outstanding — December 31, 2016 | 7,153,982 | $ | 30.40 | 6.27 | $ | 53,404 | |||||||
Exercisable — December 31, 2016 | 4,035,892 | $ | 31.97 | 4.54 | $ | 22,135 | |||||||
Exercisable and expected to vest — December 31, 2016 | 6,991,691 | $ | 30.56 | 6.20 | $ | 51,252 | |||||||
The following table summarizes information about outstanding stock options and warrants as of December 31, 2016:
Outstanding | Exercisable | |||||||||||||||
Range of Exercise Prices | Total Number of Shares | Weighted- Average Remaining Life (Years) | Weighted- Average Exercise Price | Number of Shares | Weighted- Average Exercise Price | |||||||||||
$18.04 - $23.02 | 2,763,985 | 7.10 | $ | 20.32 | 854,123 | $ | 21.36 | |||||||||
$23.41 - $30.00 | 1,176,879 | 4.23 | $ | 28.09 | 1,037,106 | $ | 28.26 | |||||||||
$31.60 - $32.33 | 972,024 | 5.68 | $ | 31.88 | 743,002 | $ | 31.89 | |||||||||
$34.01 - $39.60 | 797,642 | 4.22 | $ | 34.60 | 781,538 | $ | 34.54 | |||||||||
$42.60 - $54.81 | 1,443,452 | 7.89 | $ | 48.26 | 620,123 | $ | 49.68 | |||||||||
7,153,982 | 6.27 | $ | 30.40 | 4,035,892 | $ | 31.97 | ||||||||||
The Company recognizes share-based compensation for stock options awarded to employees and officers based on the grant date fair value over the requisite service period of the award, which generally equals the vesting period. The Company recognized share-based compensation related to the vesting of these awards of $10.7 million, $14.5 million, and $14.7 million during the years ended December 31, 2016, 2015, and 2014, respectively, which is included in compensation and benefits expense in the consolidated statements of income. As of December 31, 2016, total unrecognized compensation cost related to non-vested stock options granted to employees, officers, and directors was $7.7 million, which is expected to be recognized over a weighted-average period of 1.72 years.
During 2011 and 2012, the Company granted stock options and warrants to its advisors and financial institutions. Share-based compensation for these awards is based on the fair value of the awards at each reporting period. The Company recognized share based compensation of $1.8 million, $3.4 million, and $5.3 million during the years ended December 31, 2016, 2015, and 2014, respectively, related to the vesting of stock options and warrants awarded to its advisors and financial institutions, which is classified within commission and advisory expense on the consolidated statements of income. As of December 31, 2016, total unrecognized compensation cost related to non-vested stock options and warrants granted to advisors and financial institutions was $0.8 million, which is expected to be recognized over a weighted-average period of 0.92 years.
F-29
LPL FINANCIAL HOLDINGS INC. AND SUBSIDIARIES
Notes to Consolidated Financial Statements
Restricted Stock
The following summarizes the Company’s activity in its restricted stock awards and stock units, which include restricted stock units and deferred stock units, for the year ended December 31, 2016:
Restricted Stock Awards | Stock Units | |||||||||||||
Number of Shares | Weighted-Average Grant-Date Fair Value | Number of Shares | Weighted-Average Grant-Date Fair Value | |||||||||||
Nonvested — December 31, 2015 | 41,476 | $ | 43.99 | 636,701 | $ | 43.32 | ||||||||
Granted | 13,872 | $ | 35.85 | 592,766 | $ | 20.64 | ||||||||
Vested | (41,759 | ) | $ | 43.56 | (162,653 | ) | $ | 42.70 | ||||||
Forfeited | (3,185 | ) | $ | 40.81 | (84,561 | ) | $ | 33.17 | ||||||
Nonvested — December 31, 2016 | 10,404 | $ | 35.85 | 982,253 | $ | 30.61 | ||||||||
Expected to vest — December 31, 2016 | 10,404 | $ | 35.85 | 930,720 | $ | 30.97 | ||||||||
The Company grants restricted stock awards and deferred stock units to its directors and restricted stock units to its employees and officers. Restricted stock awards, restricted stock units, and deferred stock units must vest or else are subject to forfeiture; however, restricted stock awards are included in our shares outstanding upon grant and have the same dividend and voting rights as our common stock. Share-based compensation is based on the grant date fair value and recognized over the requisite service period of the award, which generally equals the vesting period. The Company recognized $8.9 million, $8.3 million, and $6.1 million of share-based compensation related to the vesting of these restricted stock awards, restricted stock units, and deferred stock units during the years ended December 31, 2016, 2015, and 2014, respectively, which is included in compensation and benefits expense on the consolidated statements of income. As of December 31, 2016, total unrecognized compensation cost for restricted stock awards and deferred stock units granted to directors and restricted stock units granted to employees and officers was $10.3 million, which is expected to be recognized over a weighted-average remaining period of 1.65 years.
The Company also grants restricted stock units to its advisors and to financial institutions. Share-based compensation is based on the fair value of the awards at each reporting period. The Company recognized share-based compensation of $2.7 million, $2.5 million and $1.0 million related to the vesting of these awards during the years ended December 31, 2016, 2015, and 2014 respectively, which is classified within commission and advisory expense on the consolidated statements of income. As of December 31, 2016, total unrecognized compensation cost for restricted stock units granted to advisors and financial institutions was $5.5 million, which is expected to be recognized over a weighted-average remaining period of 1.89 years.
15. Earnings per Share
Basic earnings per share is computed by dividing net income available to common stockholders by the weighted-average number of shares of common stock outstanding during the period. The computation of diluted earnings per share is similar to the computation of basic earnings per share, except that the denominator is increased to include the number of additional shares of common stock that would have been outstanding if dilutive potential shares of common stock had been issued. The calculation of basic and diluted earnings per share for the years noted was as follows (in thousands, except per share data):
Years Ended December 31, | ||||||||||||
2016 | 2015 | 2014 | ||||||||||
Net income | $ | 191,931 | $ | 168,784 | $ | 178,043 | ||||||
Basic weighted-average number of shares outstanding | 89,072 | 95,273 | 99,847 | |||||||||
Dilutive common share equivalents | 941 | 1,513 | 1,804 | |||||||||
Diluted weighted-average number of shares outstanding | 90,013 | 96,786 | 101,651 | |||||||||
Basic earnings per share | $ | 2.15 | $ | 1.77 | $ | 1.78 | ||||||
Diluted earnings per share | $ | 2.13 | $ | 1.74 | $ | 1.75 | ||||||
The computation of diluted earnings per share excludes stock options, warrants, and restricted stock units that are anti-dilutive. For the years ended December 31, 2016, 2015, and 2014, stock options, warrants, and restricted stock units representing common share equivalents of 4,054,972 shares, 2,223,886 shares, and 864,488 shares, respectively, were anti-dilutive.
16. Employee and Advisor Benefit Plans
The Company participates in a 401(k) defined contribution plan sponsored by LPL Financial. All employees meeting minimum age and length of service requirements are eligible to participate. The Company has an employer matching program whereby employer contributions are made to the 401(k) plan, and employees are eligible for matching contributions after completing one year of service. The Company's contributions were made in an amount equal to 65% of the first 8% of an employee's designated deferral of their eligible compensation. The Company’s total cost related to the 401(k) plan was $10.1 million, $9.9 million, and $8.7 million for the years ended December 31, 2016, 2015, and 2014, respectively, which is classified as compensation and benefits expense in the consolidated statements of income.
In August 2012, the Company established the 2012 Employee Stock Purchase Plan (the “ESPP”) as a benefit to enable eligible employees to purchase common stock of LPLFH at a discount from the market price through payroll deductions, subject to limitations. Eligible employees may elect to participate in the ESPP only during an open enrollment period. The offering period immediately follows the open enrollment window, upon which time ESPP contributions are withheld from the participant's regular paycheck. The ESPP provides for a 15%
F-30
LPL FINANCIAL HOLDINGS INC. AND SUBSIDIARIES
Notes to Consolidated Financial Statements
discount on the market value of the stock at the lower of the grant date price (first day of the offering period) and the purchase date price (last day of the offering period).
In January 2008, the Company adopted a non-qualified deferred compensation plan for the purpose of attracting and retaining advisors who operate, for tax purposes, as independent contractors, by providing an opportunity for participating advisors to defer receipt of a portion of their gross commissions generated primarily from commissions earned on the sale of various products. The deferred compensation plan has been fully funded to date by participant contributions. Plan assets are invested in mutual funds, which are held by the Company in a Rabbi Trust. The liability for benefits accrued under the non-qualified deferred compensation plan totaled $133.6 million at December 31, 2016, which is included in accounts payable and accrued liabilities in the consolidated statements of financial condition. The cash values of the related trust assets was $133.4 million at December 31, 2016, which is measured at fair value and included in other assets in the consolidated statements of financial condition.
Certain employees and advisors of the Company’s subsidiaries participated in non-qualified deferred compensation plans (the “Plans”) that permitted participants to defer portions of their compensation and earn interest on the deferred amounts. The Plans have been closed to new participants and no contributions have been made since the acquisition date. Plan assets are held by the Company in a Rabbi Trust and accounted for in the manner described above. As of December 31, 2016, the Company has recorded assets of $2.9 million and liabilities of $1.5 million, which are included in other assets and accounts payable and accrued liabilities, respectively, in the consolidated statements of financial condition.
17. Related Party Transactions
The Company has related party transactions with certain portfolio companies of TPG Capital, a 3.7% shareholder of the Company's common stock and a firm of which one of our directors previously served as a partner. Additionally, through its subsidiary LPL Financial LLC, the Company provides services and charitable contributions to the LPL Financial Foundation, an organization that provides volunteer and financial support within the Company's local communities. During the years ended December 31, 2016, 2015, and 2014, the Company recognized revenue for services provided to these related parties of $0.1 million, $0.6 million, and $1.0 million, respectively. The Company incurred expenses for the services provided by certain of the TPG portfolio companies and the LPL Foundation of $1.5 million, $6.8 million, and $4.2 million, during the years ended December 31, 2016, 2015, and 2014 respectively. As of December 31, 2016 and 2015, receivables and payables to related parties were not material.
18. Net Capital and Regulatory Requirements
The Company’s registered broker-dealer, LPL Financial LLC, is subject to the SEC’s Net Capital Rule (Rule 15c3-1 under the Exchange Act), which requires the maintenance of minimum net capital, as defined. Under the alternative method permitted by the rules, LPL Financial LLC must maintain minimum net capital equal to the greater of $250,000 or 2% of aggregate debit items arising from client transactions. The net capital rules also provide that the broker-dealer's capital may not be withdrawn if resulting net capital would be less than minimum requirements. Additionally, certain withdrawals require the approval of the SEC and FINRA to the extent they exceed defined levels, even though such withdrawals would not cause net capital to be less than minimum requirements. Net capital and the related net capital requirement may fluctuate on a daily basis. LPL Financial LLC is a clearing broker-dealer and, as of December 31, 2016, had net capital of $116.2 million with a minimum net capital requirement of $6.4 million.
The Company's subsidiary, PTC, also operates in a highly regulated industry and is subject to various regulatory capital requirements. Failure to meet minimum capital requirements can initiate certain mandatory and possible additional discretionary actions by regulators that if undertaken, could have substantial monetary and non-monetary impacts to PTC's operations.
As of December 31, 2016 and 2015, LPL Financial LLC and PTC met all capital adequacy requirements to which they were subject.
F-31
LPL FINANCIAL HOLDINGS INC. AND SUBSIDIARIES
Notes to Consolidated Financial Statements
19. Financial Instruments with Off-Balance-Sheet Credit Risk and Concentrations of Credit Risk
LPL Financial’s client securities activities are transacted on either a cash or margin basis. In margin transactions, LPL Financial extends credit to the advisor's client, subject to various regulatory and internal margin requirements, collateralized by cash and securities in the client’s account. As clients write options contracts or sell securities short, LPL Financial may incur losses if the clients do not fulfill their obligations and the collateral in the clients’ accounts is not sufficient to fully cover losses that clients may incur from these strategies. To control this risk, LPL Financial monitors margin levels daily and clients are required to deposit additional collateral, or reduce positions, when necessary.
LPL Financial is obligated to settle transactions with brokers and other financial institutions even if its advisors' clients fail to meet their obligation to LPL Financial. Clients are required to complete their transactions on the settlement date, generally three business days after the trade date. If clients do not fulfill their contractual obligations, LPL Financial may incur losses. In addition, the Company occasionally enters into certain types of contracts to fulfill its sale of when, as, and if issued securities. When, as, and if issued securities have been authorized but are contingent upon the actual issuance of the security. LPL Financial has established procedures to reduce this risk by generally requiring that clients deposit cash or securities into their account prior to placing an order.
LPL Financial may at times hold equity securities on both a long and short basis that are recorded on the consolidated statements of financial condition at market value. While long inventory positions represent LPL Financial’s ownership of securities, short inventory positions represent obligations of LPL Financial to deliver specified securities at a contracted price, which may differ from market prices prevailing at the time of completion of the transaction. Accordingly, both long and short inventory positions may result in losses or gains to LPL Financial as market values of securities fluctuate. To mitigate the risk of losses, long and short positions are marked-to-market daily and are continuously monitored by LPL Financial.
20. Selected Quarterly Financial Data (Unaudited)
2016 | |||||||||||||||
(In thousands, except per share data) | |||||||||||||||
First Quarter | Second Quarter | Third Quarter | Fourth Quarter | ||||||||||||
Net revenues | $ | 1,005,305 | $ | 1,019,181 | $ | 1,017,440 | $ | 1,007,457 | |||||||
Net income | $ | 50,392 | $ | 47,849 | $ | 51,954 | $ | 41,736 | |||||||
Basic earnings per share | $ | 0.57 | $ | 0.54 | $ | 0.58 | $ | 0.47 | |||||||
Diluted earnings per share | $ | 0.56 | $ | 0.53 | $ | 0.58 | $ | 0.46 | |||||||
Dividends declared per share | $ | 0.25 | $ | 0.25 | $ | 0.25 | $ | 0.25 | |||||||
2015 | |||||||||||||||
(In thousands, except per share data) | |||||||||||||||
First Quarter | Second Quarter | Third Quarter | Fourth Quarter | ||||||||||||
Net revenues | $ | 1,109,302 | $ | 1,090,661 | $ | 1,054,745 | $ | 1,020,346 | |||||||
Net income | $ | 50,678 | $ | 50,242 | $ | 41,052 | $ | 26,812 | |||||||
Basic earnings per share | $ | 0.52 | $ | 0.52 | $ | 0.43 | $ | 0.29 | |||||||
Diluted earnings per share | $ | 0.52 | $ | 0.52 | $ | 0.43 | $ | 0.28 | |||||||
Dividends declared per share | $ | 0.25 | $ | 0.25 | $ | 0.25 | $ | 0.25 | |||||||
21. Subsequent Event
On February 24, 2017, the Board of Directors declared a cash dividend of $0.25 per share on the Company's outstanding common stock to be paid on March 24, 2017 to all stockholders of record on March 10, 2017.
******
F-32