Attached files
| file | filename |
|---|---|
| EX-32.2 - EXHIBIT 32.2 CFO CERTIFICATION SECTION 906 - HSN, Inc. | exhibit322certificationofc.htm |
| EX-32.1 - EXHIBIT 32.1 CEO CERTIFICATION SECTION 906 - HSN, Inc. | exhibit321certificationofc.htm |
| EX-31.2 - EXHIBIT 31.2 CFO CERTIFICATION SECTION 302 - HSN, Inc. | exhibit312chieffinancialof.htm |
| EX-31.1 - EXHIBIT 31.1 CEO CERTIFICATION SECTION 302 - HSN, Inc. | exhibit311chiefexecutiveof.htm |
| EX-23.1 - EXHIBIT 23.1 CONSENT OF INDEPENDENT REGISTERED CERTIFIED PUBLIC ACCOUNTING FIRM - HSN, Inc. | exhibit231consentofindepen.htm |
| EX-21.1 - EXHIBIT 21.1 SUBSIDIARIES OF HSN, INC. - HSN, Inc. | exhibit211subsidiariesofhs.htm |
| EX-12.1 - EXHIBIT 12.1 COMPUTATION OF RATIO OF EARNINGS TO FIXED CHARGES - HSN, Inc. | exhibit121computationofrat.htm |
| EX-10.15 - EXHIBIT 10.15 FORM OF STOCK APPRECIALTION RIGHT AGREEMENT - HSN, Inc. | exhibit1015formofstockappr.htm |
UNITED STATES
SECURITIES AND EXCHANGE COMMISSION
WASHINGTON, D.C. 20549
______________________________________________________________________________________________
FORM 10-K
______________________________________________________________________________________________
ANNUAL REPORT PURSUANT TO SECTION 13 OR 15(d) OF THE
SECURITIES EXCHANGE ACT OF 1934
FOR THE FISCAL YEAR ENDED DECEMBER 31, 2016
Commission File No. 001-34061
________________________________________________________________________________________________
HSN, INC.
(Exact name of registrant as specified in its charter)
________________________________________________________________________________________________
Delaware |  | 26-2590893 |
(State or other jurisdiction of incorporation or organization) | (I.R.S. Employer Identification No.) | |
1 HSN Drive, St. Petersburg, Florida | 33729 | |
(Address of principal executive offices) | (Zip Code) | |
(727) 872-1000
(Registrant’s telephone number, including area code)
________________________________________________________________________________________________
Securities registered pursuant to Section 12(b) of the Act:
Title of each class | Name of exchange on which registered | |
Common Stock, par value $0.01 Series A Junior Participating Preferred Stock Purchase Rights | NASDAQ Global Select Market NASDAQ Global Select Market | |
Securities registered pursuant to Section 12(g) of the Act: None
________________________________________________________________________________________________
Indicate by check mark if the registrant is a well-known seasoned issuer, as defined in Rule 405 of the Securities Act. Yes x No ¨
Indicate by check mark if the registrant is not required to file reports pursuant to Section 13 or Section 15(d) of the Act. Yes ¨ No x
Indicate by check mark whether the registrant (1) has filed all reports required to be filed by Section 13 or 15(d) of the Securities Exchange Act of 1934 during the preceding 12 months (or for such shorter period that the registrant was required to file such reports), and (2) has been subject to such filing requirements for the past 90 days. Yes x No ¨
Indicate by check mark whether the registrant has submitted electronically and posted on its corporate Website, if any, an Interactive Data File required to be submitted and posted pursuant to Rule 405 of Regulation S-T during the preceding 12 months (or for such shorter period that the registration was required to submit and post such files). Yes x No ¨
Indicate by check mark if disclosure of delinquent filers pursuant to Item 405 of Regulation S-K is not contained herein, and will not be contained, to the best of the registrant’s knowledge, in definitive proxy or information statements incorporated by reference in Part III of this Form 10-K or any amendment to this Form 10-K. ¨
Indicate by check mark whether the registrant is a large accelerated filer, an accelerated filer, a non-accelerated filer or a smaller reporting company as defined in Rule 12b-2 of the Exchange Act.
Large accelerated filer | x | Accelerated filer | ¨ | |||||
Non-accelerated filer | ¨ | Smaller reporting company | ¨ | |||||
Indicate by check mark whether the registrant is a shell company (as defined in Rule 12b-2 of the Exchange Act). Yes ¨ No x
The aggregate market value of the registrant’s outstanding common stock held by non-affiliates as of June 30, 2016 (the registrant’s most recently completed second fiscal quarter), was $1,559,375,075 (based on a closing price of $48.93 per share for the registrant’s common stock on the NASDAQ Global Select Market).
As of February 23, 2017, the registrant had 52,367,930 shares of common stock, $0.01 par value per share, outstanding.
DOCUMENTS INCORPORATED BY REFERENCE
Portions of the definitive Proxy Statement for the 2017 Annual Meeting of Shareholders to be filed with the U.S. Securities and Exchange Commission no later than 120 days after the end of the registrant’s 2016 fiscal year end are incorporated by reference into Items 10, 11, 12, 13 and 14 of Part III of this Form 10-K.
TABLE OF CONTENTS
Page | ||
PART I | ||
ITEM 1. | ||
ITEM 1A. | ||
ITEM 1B. | ||
ITEM 2. | ||
ITEM 3. | ||
ITEM 4. | ||
PART II | ||
ITEM 5. | ||
ITEM 6. | ||
ITEM 7. | ||
ITEM 7A. | ||
ITEM 8. | ||
ITEM 9. | ||
ITEM 9A. | ||
ITEM 9B. | ||
PART III | ||
ITEM 10. | ||
ITEM 11. | ||
ITEM 12. | ||
ITEM 13. | ||
ITEM 14. | ||
PART IV | ||
ITEM 15. | ||
FORWARD-LOOKING STATEMENTS
This annual report on Form 10-K contains certain “forward-looking statements” within the meaning of Section 27A of the Securities Act of 1933, as amended (the “Securities Act”), and Section 21E of the Securities Exchange Act of 1934 (the “Exchange Act”), which are based on management’s exercise of business judgment, as well as assumptions made by and information currently available to management. When used in this document, the words “may,” “will,” “anticipate,” “believe,” “estimate,” “expect,” “intend” and words of similar import, are intended to identify any forward-looking statements. These forward-looking statements include, among other things, statements relating to the following: HSN, Inc.’s ("HSNi's") future financial performance, HSNi’s business prospects and strategy, anticipated trends and prospects in the various markets in which HSNi’s businesses operate and other similar matters. These forward-looking statements relate to expectations concerning matters that are not historical fact and are based on management’s current expectations and assumptions about future events, which are inherently subject to uncertainties, risks and changes in circumstances that are difficult to predict. Although we believe our expectations are based on reasonable estimates and assumptions, they are not guarantees of performance.
Should one or more of these uncertainties, risks or changes in circumstances materialize, or should underlying assumptions prove incorrect, our actual results could differ materially from those anticipated in these forward-looking statements. Factors that could cause or contribute to such differences include but are not limited to those described under “Risk Factors,” and the following:
• | our ability to attract new and retain existing customers in a cost-effective manner; |
• | our exposure to intense competition and our ability to effectively compete for customers; |
• | changes in our relationships with pay television operators, vendors, manufacturers and other third parties; |
• | the influence of the macroeconomic environment and its impact on consumer confidence and spending levels; |
• | failure to attract and retain television viewers and/or changes in consumer viewing habits of our programming; |
• | consolidation and/or divestiture in the cable industry, increases in on-air distribution costs and failure to secure a suitable programming tier of carriage and channel placement for the HSN television network programming; |
• | changes to international and national trade laws, regulations and policies (particularly those related to or restricting global trade) could significantly impair HSNi’s profitability; |
• | interruption, lack of redundancy or difficulties implementing new or upgraded technology in our systems or infrastructure could affect our ability to broadcast, operate websites, process and fulfill transactions, respond to customer inquiries and/or maintain cost efficient operations; |
• | risks associated with possible systems failures and/or security breaches, including, any security breach that results in the theft, transfer or unauthorized disclosure of customer, employee or company information, or the failure to comply with various laws applicable to HSNi in the event of such a breach; |
• | any technological or regulatory developments that could negatively impact the way we do business, including developments requiring us to collect and remit state and local sales and use taxes in states where we do not currently do so; |
• | changes in product shipping and handling costs particularly if we are unable to offset them; and changes in consumer expectations for reduced shipping charges and faster delivery times particularly if we are unable to meet them; |
• | HSNi’s business prospects and strategy, including whether HSNi’s initiatives will be effective; |
• | our ability to offer new or innovative products and services through various platforms in a cost effective manner and consumer acceptance of these products and services; |
• | risks associated with litigation, audits, claims and assessments; |
• | risks associated with acquisitions including the ability to successfully integrate new businesses and achieve expected benefits and results; and |
• | the loss of any key member of our senior management team. |
Other unknown or unpredictable factors that could also adversely affect HSNi’s business, financial condition and results of operations may arise from time to time.
You should not place undue reliance on these forward-looking statements. All written or oral forward-looking statements that are made or are attributable to us are expressly qualified in their entirety by this cautionary notice. Such forward-looking
1
statements speak only to the date such statements are made and we do not undertake to update, revise or otherwise publicly release any revisions to these forward-looking statements to reflect events or circumstances after the date hereof, or to reflect the occurrence of any unanticipated events. Although we believe that our expectations are based on reasonable assumptions, we can give no assurance that our expectations will materialize. Historical results should not be considered an indication of future performance.
2
PART I
ITEM 1. | BUSINESS |
Unless otherwise indicated in this Annual Report or the context otherwise requires, all references in this Annual Report to “HSNi,” the “Company,” “us,” “our” or “we” are to HSN, Inc. and/or its subsidiaries and affiliates.
Business Overview
HSNi is an interactive multi-channel retailer offering customers innovative and differentiated experiences through various platforms including television, online, mobile, catalogs and in retail and outlet stores through the six brands of its two operating segments, HSN and Cornerstone.
HSN is an interactive entertainment and lifestyle retailer offering a curated assortment of exclusive products and top brand names to its customers primarily through television home shopping programming on the HSN television networks, through its business-to-consumer digital commerce sites HSN.com and joymangano.com, through mobile applications, through its outlet stores and through its wholesale distribution of certain proprietary products to other retailers. HSN incorporates entertainment, inspiration and personalities to provide an entirely unique shopping experience.
Cornerstone is comprised of interactive, aspirational home and apparel lifestyle brands, including Ballard Designs, Frontgate, Garnet Hill, Grandin Road, and Improvements. Cornerstone operates five separate digital sales sites, distributes approximately 300 million catalogs annually and operates 16 retail and outlet stores.
For financial information about our operating segments, please refer to Note 6 to our audited consolidated financial statements, as well as to Item 7 "Management's Discussion and Analysis of Financial Condition and Results of Operations," each of which are included elsewhere in this document. Our principal offices are located at 1 HSN Drive, St. Petersburg, Florida 33729 and our main telephone number is 727-872-1000. Our website is located at http://www.hsni.com.
History
HSNi’s predecessor company began broadcasting television home shopping programming from its studios in St. Petersburg, Florida in 1981 and, by 1985, was broadcasting this programming through a national network of cable and local television stations 24 hours a day, seven days a week. The company's national distribution network consists of a combination of cable, satellite and broadcast systems and, as of December 31, 2016, the HSN television networks reached approximately 91.1 million residential homes in the United States.
The company began conducting business online in 1994 and formally launched HSN.com, the online shopping portal for the HSN television network, in 1999.
The company acquired Improvements, a catalog featuring thousands of innovative home, patio and outdoor products, in June 2001, and significantly grew its catalog business through the acquisition of Cornerstone Brands, Inc., with its portfolio of leading print catalogs and related websites, in April 2005.
HSNi was incorporated in Delaware in May 2008 in connection with the spin-off of several businesses previously owned by IAC/InterActiveCorp, or IAC. HSNi was formed to hold HSN and Cornerstone, the businesses that previously comprised most of IAC’s retailing segment. The spin-off from IAC (the "Spin-off") occurred on August 20, 2008 and, in connection with the Spin-off, HSNi's shares began trading on the NASDAQ Global Select Market under the symbol "HSNI."
In April 2012, it acquired Chasing Fireflies, a direct-to-consumer premium children's and family's lifestyle brand.
HSNi regularly assesses its businesses in an effort to continuously strengthen its product and brand portfolio. HSNi divested of Smith+Noble, a brand specializing in window treatments, in May 2012 and The Territory Ahead, a brand specializing in casual apparel for men and women, in July 2012. HSNi then divested of Chasing Fireflies and TravelSmith, two of the apparel brands in the Cornerstone portfolio, in September 2016.
What We Do
HSNi markets and sells a wide range of third party and proprietary private label merchandise directly to consumers through HSN, which includes the HSN television networks and digital platforms, including mobile, as well as through Cornerstone’s portfolio of catalogs and digital platforms, including mobile.
3
HSNi is committed to providing customers with an evolving variety of quality products and from brands that resonate with its customers. Products offered through HSN include jewelry, fashion (apparel & accessories), beauty & health (beauty, wellness and fitness), and home & other (including home, electronics, culinary and other). Featured products include proprietary label products and third party-branded products, some of which are produced exclusively for HSN, as well as merchandise generally available through other retailers. Cornerstone primarily offers home and outdoor furnishings, in addition to women and children's apparel, with the majority produced exclusively for its Cornerstone brands.
HSN
Overview
HSN includes the HSN television networks; its related website, HSN.com; its mobile applications, a limited number of outlet stores and its wholesale distribution of certain proprietary products to other retailers. The HSN television network broadcasts customer interactive home shopping programming 24 hours a day, seven days a week. HSN2, which debuted in August 2010, is a network that primarily distributes taped programming. HSN’s programming is intended to promote sales and customer loyalty through a combination of product quality, value and selection, coupled with product information, entertainment and interactive experiences. Programming is divided into separately televised segments, most of which have hosts who present and convey information regarding featured products, sometimes with the assistance of a celebrity, industry expert, representative from the product vendor or someone retained to aid in the sale of the products. HSN also produces entertainment such as live concerts to entertain and engage with customers and promote certain products. HSN.com is a business-to-consumer digital commerce site that sells all of the merchandise offered on the HSN television networks, together with complementary products and select merchandise sold exclusively on HSN.com. HSN provides seamless experiences across all digital platforms and optimizes each unique platform by delivering exclusive content both at HSN.com and on mobile phones and tablets, including the iPad, iPhone, Android and Windows devices. The HSN strategy is to create immersive experiences, offer differentiated products and leverage technology to build seamless relationships with its customers across all of its platforms. HSN fosters social communities as part of the HSN experience to encourage customers to share their product finds, thoughts and reviews with their friends via Facebook, Twitter, Pinterest and Instagram.
Reach
HSN produces both live and recorded programming for the HSN television network primarily from its studios in St. Petersburg, Florida, and distributes this programming by means of satellite uplink facilities, which it owns and operates, to a satellite transponder which service is leased for a multi-year term. The satellite transponder agreement provides for continued carriage of the HSN television networks on a replacement transponder and/or replacement satellite, as applicable, in the event of a failure of the transponder and/or satellite.
As of December 31, 2016 and 2015, HSN's live broadcast reached approximately 91.4 million and 93.7 million homes of the approximately 114.7 million and 113.3 million homes, respectively, in the United States with a television set. Television households reached by the HSN television network as of December 31, 2016 and 2015 primarily include approximately 61.1 million and 63.5 million households capable of receiving cable and/or telephone company ("Telco") transmissions, respectively, and approximately 30.0 million and 30.1 million direct broadcast satellite system ("DBS") households, respectively. As of December 31, 2016 and 2015, HSN2 reached approximately 47.5 million and 49.8 million homes, respectively. Television households reached by HSN2 as of December 31, 2016 and 2015 primarily include approximately 37.3 million and 38.3 million households capable of receiving cable and/or Telco transmissions, respectively, and approximately 10.2 million and 11.5 million DBS households, respectively.
Pay Television Distribution
HSN has entered into distribution and affiliation agreements with cable television, Telco and DBS operators, collectively referred to in this document as pay television operators, in the United States to carry the HSN television networks, as well as to promote the networks by carrying related commercials and distributing related marketing materials to their respective subscriber bases. HSN currently has contracts with many local and national pay television operators to distribute HSN television programming.
HSN’s larger pay television operators include Comcast, AT&T/DirecTV, Charter Communications and Echostar/DISH.
4
In exchange for this carriage and related promotional and other efforts, HSN generally pays these pay television operators a fee consisting of commissions based on a percentage of the net merchandise sales to their subscriber bases and/or a per subscriber fee. In some cases, pay television operators receive additional compensation in the form of commission guarantees in exchange for their commitments to deliver a specified number of subscribers, channel placement incentives and advertising insertion time on the HSN television network.
HSN typically negotiates agreements that require HSN to pay monthly or annual fees. Distribution and affiliation agreements with pay television operators expire from time to time and renewal and negotiation processes may be lengthy. At any given time in the ordinary course of business HSN is likely to be engaged in renewal and/or negotiation processes with multiple pay television operators. In some cases, renewals are not agreed upon prior to the expiration of a given agreement and the HSN television networks continue to be carried by the relevant pay television operator without an effective affiliation agreement in place or via month-to-month contracts. HSN expects that any extension of agreements that have expired will be on terms that, when taken as a whole, are commercially reasonable.
Broadcast Television Distribution
As of December 31, 2016, HSN also had affiliation agreements with 102 broadcast television stations for leased carriage of the HSN television networks with terms ranging from several weeks to several years. In exchange for this carriage, HSN pays the broadcast television stations hourly or monthly fixed rates or commissions based on a percentage of the net merchandise sales to their viewership bases. As of December 31, 2016, HSNi’s subsidiary, Ventana Television, Inc. also owned 25 broadcast television stations that carry the HSN television networks on a full-time basis.
HSN.com
HSN also includes HSN.com, a transactional e-commerce site that sells merchandise offered on the HSN television networks, as well as select merchandise sold exclusively on HSN.com. HSN.com provides customers with additional content to support and enhance HSN television programming. For example, HSN.com provides users with an online program guide, value-added video of product demonstrations, live streaming video of the HSN television network, customer-generated product reviews and additional information about HSN show hosts and guest personalities. HSN.com offers customers a content-rich experience that houses more than 50,000 product and how-to videos.
Mobile Distribution
HSN has applications for the iPhone, iPad, Android and Windows devices. These applications are highly video-centric, customized experiences that allow users to order merchandise, stream live video from HSN and watch previously-aired content from the network’s video library while simultaneously browsing related products. Among other things, these applications also allow customers to create their own personalized channels, select their favorite brands or categories of merchandise and compile videos focused on these preferences. Mobile devices represent our fastest growing sales channel.
Cornerstone
Cornerstone consists of a portfolio of aspirational home and apparel brands, prominent in the direct marketing and retail space, including catalog distribution and related websites. Although there is some overlap in the product offerings, the home brands are comprised of Frontgate, Ballard Designs, Grandin Road and Improvements. Garnet Hill focuses primarily on apparel and accessories and is categorized by HSNi as an apparel brand. There are also 16 retail and outlet stores located throughout the United States.
Frontgate features premium, high quality indoor (including bed, bath, kitchen, dining and living room) and outdoor (including patio, garden and pool) furnishings and accessories. Ballard Designs features European‑inspired bed, bath, dining, outdoor and office furnishings and accessories, as well as rugs, shelving and architectural accents for the home. Grandin Road offers an affordable style assortment of products ranging from occasional furniture, accessories, holiday décor and outdoor furniture and Improvements features thousands of innovative home, patio and outdoor products. Garnet Hill offers apparel and accessories for women and children as well as bed and bath furnishings and soft goods.
The Cornerstone brands generally incorporate on-site photography and real-life settings, coupled with related editorial content describing the merchandise and depicting situations in which it may be used. Branded catalogs are designed and produced in-house, which enables each individual brand to control the production process and reduces the amount of lead time required to produce a given catalog.
5
New editions of full-color catalogs are mailed to customers several times each year, with a total annual circulation in 2016 of approximately 313 million catalogs. The timing and frequency of catalog circulation varies by brand and depends upon a number of factors, including the timing of the introduction of new products, marketing campaigns and promotions and inventory levels, among other factors.
Cornerstone also operates websites for each of its featured brands, such as Frontgate.com, BallardDesigns.com, GarnetHill.com, GrandinRoad.com and Improvementscatalog.com. These websites serve as additional storefronts for products featured in related print catalogs, as well as provide customers with additional content and product assortments to support and enhance their shopping experience. Additional content provided by these websites, which differs across the various websites, includes decorating tips, measuring information, online design centers, gift registries and travel centers, as well as a feature that allows customers to browse the related catalog online. In addition, a growing number of customers use mobile devices to shop the Cornerstone brands.
Supply
HSN and Cornerstone purchase products from numerous foreign and domestic manufactures and importers by way of short- and long-term contracts and purchase orders, including products made to their respective specifications, as well as name brand merchandise and lines from third party partners, typically with certain exclusive rights. The terms of these contracts and purchase orders vary depending upon the underlying products, the retail channel in which the products will ultimately be sold and the method of sale. In some cases, these contracts provide for the payment of additional amounts to partners in the form of commissions, the amount of which is based upon the achievement of agreed upon sales targets, among other milestones. In addition, in the case of some purchases, HSNi may have certain return, extended payment and/or termination rights. The mix and source of products generally depends upon a variety of factors, including price and availability, and HSNi manages inventory levels through periodic, ongoing analyses of anticipated and current sales. No single vendor accounted for more than 10% of HSNi’s consolidated net sales in 2016, 2015 or 2014.
Marketing and Merchandising
HSNi offers our customers a broad assortment of differentiated products in a compelling, informative and entertaining format that will inspire them to regularly engage and shop with us. For example, HSN frequently collaborates with experts from a variety of fields to present special events on the HSN television network featuring HSN products and relevant expert content. HSN produces live entertainment as a way to further engage with our customers. These events are staged at HSN’s television studios or elsewhere. Certain special events are also featured on HSN.com and HSN2 for a limited period of time following their live broadcast on the HSN television network. HSN also has integrated a gamification strategy into its e-commerce platform to promote customer loyalty and engagement. In addition, HSN.com has over 50,000 video demonstrations of products and how-to videos.
In an effort to promote its own differentiated brand, HSN seeks to provide its customers with unique products that can only be purchased through HSN. HSN frequently partners with leading personalities and brands to develop product lines exclusive to HSN and believes that these affiliations enhance the awareness of the HSN brand among consumers, as well as increase the extent to which HSN and/or products sold through HSN are featured in the media. In some cases, vendors have agreed to market their HSN affiliation to their existing customers (e.g., notifying customers when their products will be featured on the HSN television network).
Digital commerce, representing almost half of HSN's business, is an essential part of HSN's overall strategy to optimize its content across multiple distributed commerce platforms. We are able to utilize digital marketing efforts to prospect for new customers and re-engage former customers. HSN continues to invest in digital marketing strategies including online search engines, digital display ads and social media marketing.
HSN engages in co-promotional partnerships with major media companies. These are done primarily because they offer us editorial authority while they also secure print advertising in national fashion, style and/or lifestyle publications to market HSN to prospective customers in its target demographics. HSN also engages in targeted offline advertising. As part of HSN's entertainment strategy, it participates in innovative joint marketing and promotional partnerships with major motion picture companies as well as well-known recording artists. HSN also creates strategic alliances with world-class, consumer brands in an effort to reach new prospects through relevant brand integrations and occasion-based event marketing. These promotions are designed to not only generate additional revenue and create brand awareness, but to also provide unique experiences for our customers in our continued effort to drive customer engagement as well as position HSN as a proven and powerful marketing vehicle.
6
HSN's credit card program offers eligible customers a private label credit card. All cardholders receive certain rewards and benefits which are designed to recognize and promote customer loyalty. HSN designs, executes and administers marketing programs to promote usage of the card to current and potential customers. These marketing programs are funded largely by the sponsoring bank. Typically, customers using the HSN private label credit card shop with HSN more frequently, as well as spend more money per visit, than customers not using the card. In addition to fostering greater customer loyalty and driving more sales, HSN also saves on interchange fees that it would incur if its customers used third-party cards. Purchases made through the private label credit card represented 36%, 34% and 31% of HSN's business in 2016, 2015 and 2014, respectively. Certain brands in the Cornerstone portfolio also offer their customers private label credit cards with purchases representing approximately 4% of Cornerstone's sales in 2016.
The Cornerstone brands differentiate themselves by offering customers an assortment of innovative proprietary and branded apparel and home products. In many cases, Cornerstone seeks to secure exclusive distribution rights for certain products. Cornerstone employs in-house designers and partners with leading manufacturers and designers to aid in the development of its unique, exclusive product assortment. The Cornerstone brands use their respective websites and e-mail marketing to promote special offers, including cross-promotions for other Cornerstone brands. In addition, Cornerstone partners with third parties to offer promotional events such as sweepstakes and/or enter into other advertising agreements. HSNi believes that these affiliations enhance the awareness of the Cornerstone brands among consumers as well as strengthen its various brands overall. Cornerstone has also been extending its distributed commerce platform through both its experiential and more traditional retail and outlet stores, as a marketing tool to increase demand in the overall regions where the stores reside.
Order Entry, Fulfillment and Customer Service
HSNi provides customers with convenient options in connection with the purchase, payment and shipment of merchandise, some of which may vary by brand, business or product. Merchandise may be purchased online, through mobile devices, or ordered using toll free phone numbers through live sales and service agents. HSN also offers the convenience of an automated attendant system and, in limited markets, remote control ordering capabilities through pay television set-top boxes. Cornerstone’s catalog orders can also be made via submission of traditional catalog sales order forms.
HSNi allows the customer to pay using traditional payment options (credit and certain debit cards), as well as evolving payment alternatives such as PayPal, VISA Checkout and Apple Pay. HSNi also offers other payment options including private label and co-branded credit cards and, in the case of HSN, Flexpay. By utilizing Flexpay, customers may pay for select merchandise in two to six interest-free, monthly credit or debit card payments. HSN also offers its customers the convenience of ordering products under its Autoship program, through which customers may arrange to have products automatically shipped and billed at scheduled intervals. Standard and express shipping options are available and customers may generally return most merchandise for a full refund or exchange in accordance with applicable return policies (which vary by brand and business). Returns generally must be received within specified time periods after purchase, ranging from a minimum of thirty days to a maximum of one year, depending upon the applicable policy.
HSNi seeks to fulfill customer orders and process returns quickly and accurately from a network of fulfillment centers. For HSN, these centers are located in Tennessee, California, Virginia and New York, and for Cornerstone, the fulfillment centers are located in Ohio and Arizona. As part of its supply chain optimization initiative, HSNi will be consolidating two of its fulfillment centers, resulting in the expected closure of the Virgina facility and transfer of its operations to its Tennessee fulfillment center. HSNi contracts with several third party carriers and other fulfillment partners for the delivery of products to its customers and processing of returns.
Through HSN.com and the various websites operated by Cornerstone or through HSNi’s common carriers, customers can also generally track the status of their orders, confirm information regarding shipping and, in some cases, confirm the availability of inventory and establish and manage personal accounts. Customers may communicate directly with customer service via e-mail or by telephone with call center representatives available seven days a week.
Government Regulation
We market and offer a broad range of merchandise through television, online, catalogs and other channels. The manner in which we promote and sell merchandise, including claims and representations made in connection with these efforts, is regulated by a wide variety of federal, state and local laws, regulations, rules, policies and procedures. Some examples of these that affect the manner in which we sell and promote merchandise or otherwise operate our businesses include, but are not limited to, the following:
• | The Federal Trade Commission’s regulations related to the sale of products and/or commercial contacts with our customers or potential customers, such as the Telemarketing Sales Rule and Do Not Call; |
7
• | The Food and Drug Administration’s regulations regarding marketing claims that can be made about cosmetic beauty products and over-the-counter drugs, which include products for treating acne or medical products, and claims that can be made about food products; |
• | Regulations related to product safety issues and product recalls including, but not limited to, the Consumer Product Safety Act, the Consumer Product Safety Improvement Act of 2008, the Federal Hazardous Substance Act, the Flammable Fabrics Act and regulations promulgated pursuant to these acts; and |
• | Various state laws, regulations and interpretations regarding the obligations of retailers with respect to the collection of sales tax on internet sales. |
These laws, regulations, rules, policies and procedures are subject to change at any time. Unfavorable changes applicable to us could decrease demand for our merchandise, increase costs which we may not be able to offset, subject us to additional liabilities and/or otherwise adversely affect our businesses.
Since October 1996, HSN has been subject to a consent order issued by the Federal Trade Commission, or FTC, which terminates on the later of April 15, 2019, or 20 years from the most recent date that the United States or the FTC files a complaint in federal court alleging any violation thereunder. Pursuant to this consent order, we are prohibited from making claims for specified categories of products, including claims that a given product can cure, treat or prevent any disease or have an effect on the structure or function of the human body, unless we have competent and reliable scientific evidence to substantiate such claims. Violation of this consent order may result in the imposition of significant civil penalties for non-compliance and related redress to consumers and/or the issuance of an injunction enjoining us from engaging in prohibited activities. The FTC may periodically investigate our business and operations on an ongoing basis for purposes of determining our compliance with the consent order.
Online sales must comply with a variety of federal and state laws dealing with, amongst other things, privacy, intellectual property, taxation, the provision of online payment services and electronic contracts. While U.S. Supreme Court decisions generally restrict the imposition of obligations to collect state and local sales and use taxes with respect to sales from out-of-state retailers, an increasing number of states have adopted or are considering laws that would impose obligations on out-of-state retailers to collect taxes on their behalf. Congress is also considering legislation allowing states to require out-of-state sellers to collect sales and use taxes. An unfavorable change in U.S. Supreme Court guidance related to sales tax or a successful assertion by one or more states may result in material tax liabilities, interest and penalties. A change in state law or federal laws, our business model, business strategy or marketing initiatives may require us to collect sales tax in states for which we do not currently collect such tax. These developments, should they occur, may result in a decrease in future sales, may limit our ability to compete effectively or may otherwise harm our business.
Programming and Interactive Television Services
Although HSN markets and sells consumer products through a variety of outlets, it does so, in large part, through live video programming services distributed by cable television systems, satellite systems and over-the-air broadcasters. Consequently, regulation of programming services and the entities that distribute them can affect HSN. In the United States, the Federal Communications Commission ("FCC") regulates broadcasters, the providers of satellite communications services and facilities for the transmission of programming services, the cable television systems and other multichannel video programming distributors ("MVPDs") that distribute such services, and, to some extent, the availability of the programming services themselves through its regulation of program licensing. Cable television systems in the United States are also regulated by municipalities or other state and local government authorities. Regulatory carriage requirements also could adversely affect the number of channels available to HSN.
Through Liberty Interactive Corporation's ownership interests in HSNi and in Charter Communications, Inc., the FCC attributes an ownership interest of Charter Communications, Inc. to HSNi, thereby subjecting us to various FCC rules regarding the distribution of video programming to MVPDs. These include, for example, the FCC's program access rules, which, in general, prohibit various unfair practices involving the distribution of video programming to MVPDs and its program carriage rules, which, among other things, prohibit cable operators from favoring affiliated programmers so as to restrain unreasonably the ability of unaffiliated programmers to compete. The FCC program access and program carriage rules also make provision for enforcement of alleged violations through complaint proceedings initiated by aggrieved entities.
While we believe that the practices of our businesses have been structured in a manner to ensure compliance with these laws and regulations; federal, state or local regulatory authorities may take a contrary position. Our failure to comply with these laws and regulations could result in proceedings against us, tax assessments, fines and penalties and/or a diminution of our reputation, each of which could adversely affect our financial condition, results of operations and businesses.
8
Intellectual Property
We regard our intellectual property rights, including patents, service marks, trademarks, domain names, copyrights and trade secrets, as important to our success. Our businesses also rely heavily upon software, informational databases and other systemic components that are necessary to manage and support our operations. We rely on a combination of laws and contractual restrictions with employees, customers, suppliers, licensees, affiliates and other third parties to establish and protect these proprietary rights. Despite these precautions, it may be possible for a third party to copy or otherwise obtain and use trade secrets or copyrighted intellectual property without authorization which, if discovered, might require legal action to correct. In addition, third parties may independently and lawfully develop substantially similar intellectual properties.
We have generally registered and continue to apply to register, or secure by contract when appropriate, our trademarks and service marks as they are developed and used, and reserve and register domain names as we deem appropriate. We consider the protection of our trademarks to be important for purposes of brand maintenance and reputation. While we vigorously protect our trademarks, service marks and domain names, effective trademark protection may not be available or may not be sought in every country in which products and services are made available, and contractual disputes may affect the use of marks governed by private contract. Similarly, not every variation of a domain name may be available or be registered, even if available. Our failure to protect our intellectual property rights in a meaningful manner or challenges to related contractual rights could result in dilution of brand names and/or limit our ability to control marketing on or through the internet using our various domain names either of which could adversely affect our business, financial condition and results of operations.
Some of our businesses have been granted patents and/or have patent applications pending with the United States Patent and Trademark Office and/or foreign patent authorities for various proprietary technologies and other inventions. We consider applying for patents or for other appropriate statutory protection when we develop or identify new or improved proprietary technologies or inventions, and will continue to consider the appropriateness of filing for patents to protect future proprietary technologies and inventions as circumstances may warrant. The issuance or assessment of the validity of any patent involves complex legal and factual questions, and the breadth of claims allowed is uncertain. Accordingly, any patent application filed may not result in a patent being issued or existing or future patents may not be adjudicated valid by a court or be afforded adequate protection against competitors with similar technology. In addition, third parties may create new products or methods that achieve similar results without infringing upon patents that we own. Likewise, the issuance of a patent to us does not mean that our processes or inventions will not be found to infringe upon patents or other rights previously issued to third parties.
From time to time, we are subject to legal proceedings and claims in the ordinary course of business, including claims of alleged infringement of the trademarks, copyrights, patents and other intellectual property rights of third parties. In addition, litigation may be necessary in the future to enforce our intellectual property rights, protect trade secrets or determine the validity and scope of proprietary rights claimed by others. Any litigation of this nature, regardless of outcome or merit, could result in substantial costs and diversion of management and technical resources, any of which could adversely affect our business, financial condition and results of operations. Patent litigation tends to be particularly protracted and expensive.
Competition
HSNi brands and businesses operate in a highly competitive environment. These brands and businesses are in direct competition for consumers with traditional and online retailers (both television and digital retailers), ranging from large department stores to specialty shops, electronic retailers, direct marketing retailers, mail order and catalog companies, infomercial retailers, wholesale clubs and discount retailers. In addition, the HSN television networks compete for access to customers and audience share with other conventional forms of entertainment and content. The price and availability of programming for pay television systems affect the availability of distribution for HSN television programming. Principal competitive factors for HSNi brands and businesses include: (i) brand recognition, (ii) value, quality and selection of merchandise, (iii) customer experience, including customer service and reliability of fulfillment and delivery services and (iv) convenience and accessibility of sales channels.
Employees
As of January 19, 2017, HSNi employed approximately 6,500 employees. No HSNi employees are represented by unions or other similar organizations and HSNi considers its relations with its employees to be good.
Available Information
We file annual reports on Form 10-K, quarterly reports on Form 10-Q, current reports on Form 8-K, proxy and information statements and amendments to reports filed or furnished pursuant to Sections 13(a), 14 and 15(d) of the Securities Exchange Act of 1934, as amended. The public may read and copy these materials at the SEC’s Public Reference Room at 100 F Street, N.E., Washington, D.C. 20549. The public may obtain information on the operation of the Public Reference Room by
9
calling the SEC at 1-800-SEC-0330. The SEC also maintains a website at www.sec.gov that contains reports, proxy and information statements and other information regarding HSN, Inc. and other companies that file materials with the SEC electronically.
Our website is located at http://www.hsni.com. We make available free of charge, on or through the website, our annual, quarterly and current reports, and any amendments to those reports, as soon as reasonably practicable after electronically filing such reports with the SEC.
Information relating to corporate governance, including our Code of Business Conduct and Ethics and our Corporate Governance Guidelines, is also available on our website at http://www.hsni.com/governance.cfm. The code of conduct complies with Item 406 of SEC Regulation S-K and the rules of the NASDAQ Global Select Market. Any changes to the code of conduct that affect the provisions required by Item 406 of Regulation S-K, and any waivers of the code of conduct for our executive officers, directors or senior financial officers, will also be disclosed on our website.
The content of our website is not a part of this Annual Report or any other report filed with the SEC.
ITEM 1A. | RISK FACTORS |
The risks and uncertainties described below are not the only risks that may have a material adverse effect on HSNi. There exist additional risks and uncertainties that could adversely affect our business and our results. If any of the following risks actually occur, our business, financial condition or results of operations could be negatively affected, and the market price for our shares could decline. Further, to the extent that any of the information contained in this Annual Report on Form 10-K constitutes forward-looking statements, the risk factors set forth below also are cautionary statements identifying important factors that could cause the actual results of HSNi to differ materially from those expressed in any forward-looking statements made by or on behalf of HSNi.
Risks Related to Our Business
Our long-term success depends, in large part, on our continued ability to attract new and retain existing customers in a cost-effective manner.
In an effort to attract and retain customers, we engage in various marketing and merchandising initiatives, which involve the expenditure of considerable funds and resources, particularly in the case of the production and distribution of HSN television programming, Cornerstone catalogs and continuously updating our digital strategy. We have spent, and expect to continue to spend, increasing amounts of money on, and devote greater resources to, certain of these initiatives, particularly in connection with the growth and maintenance of our brands generally, as well as in the continuing efforts of our businesses to increasingly engage customers through digital channels. These initiatives, however, may not resonate with existing customers or consumers generally or may not be cost-effective. In addition, we believe that costs associated with the production and distribution of HSN television programming, paper and printing costs for Cornerstone catalogs and costs associated with digital marketing, including search engine marketing (primarily the purchase of relevant keywords) are likely to increase in the foreseeable future and, if significant, could have an adverse effect on our business, financial condition and results of operations to the extent that they do not result in corresponding increases in sales.
The retail business environment is subject to intense competition, and we may not be able to effectively compete for customers.
We operate in a rapidly evolving and highly competitive retail business environment. The continuing migration and evolution of retailing to online and mobile channels has increased the challenges in differentiating ourselves from other retailers. In particular, consumers are able to quickly and conveniently comparison shop and determine real-time product availability using digital tools, which can lead to decisions based solely on price, the functionality of the digital tools or a combination of those and other factors. We have numerous and varied competitors at the national and local levels, ranging from large department stores to specialty shops, electronic retailers, direct marketing retailers, wholesale clubs, discount retailers, other televised shopping retailers such as QVC and EVINE, infomercial retailers, internet retailers, and mail-order and catalog companies. Many of our current and potential competitors are larger, have greater resources, longer histories, more customers and greater brand recognition than we do. They may secure better terms from vendors, adopt more aggressive pricing, offer free or subsidized shipping and devote more resources to technology, fulfillment and marketing. Other companies also may enter into business combinations or alliances that strengthen their competitive positions.
10
We also compete for access to customers and audience share with other providers of televised, online and hard copy entertainment and content. Our inability to compete effectively with regard to the assortment, price, shipping terms and quality of the merchandise we offer for sale or to keep pace with competitors in our marketing, service, location, reputation, credit availability and technologies, could have a material adverse effect.
We depend on relationships with pay television operators and adverse changes in these relationships could result in an interruption, material decrease or even the cessation of carriage of the HSN television networks.
We are dependent upon the pay television operators with whom we enter into distribution and affiliation agreements to carry the HSN television networks. We currently have contracts with many local and national pay television operators to distribute HSN television programming. Some of HSN’s larger pay television operators include Comcast, AT&T/DirecTV, Charter Communications and Echostar/DISH. The two largest pay television operators represent 49% of our subscribers. The cessation of carriage of the HSN television networks by a major pay television operator or a significant number of smaller pay television operators for a prolonged period of time could adversely affect our business, financial condition and results of operations. Additionally, the continued consolidation of the pay television operator industry could cause us to lose leverage when negotiating new agreements or result in less favorable terms for HSN. While we believe that we will be able to continue to successfully manage the distribution process in the future, certain changes in distribution levels, as well as increases in fees payable for carriage, could occur notwithstanding these efforts.
We typically seek to enter into long-term distribution and affiliation agreements with these major pay television operators; however, in some cases, renewals are not agreed upon prior to the expiration of a given agreement and the HSN television networks continue to be carried by the relevant pay television operator without an effective agreement in place. We currently provide service to approximately 51% of our total subscribers pursuant to month-to-month contracts or contracts that have expired. In addition, another 32% of our total subscribers are represented by contracts that expire within one year. Renewal and negotiation processes with pay television operators are typically lengthy. No assurance can be given that we will be successful in negotiating renewals with all these operators or that the financial and other terms of renewal will be on acceptable terms. The failure to successfully renew or negotiate new distribution and affiliation agreements covering a material portion of the existing cable and satellite households on acceptable terms could adversely affect our growth, sales revenue and earnings.
Our revenues and profit margin are negatively influenced by economic conditions that impact consumer spending. If macroeconomic conditions do not continue to improve or if conditions worsen, our business could be adversely affected.
Retailers generally are particularly sensitive to adverse economic and business conditions, in particular to the extent they result in a loss of consumer confidence, rising unemployment, increased taxes and decreases in consumer spending, particularly discretionary spending. Our customers anticipate and respond to adverse changes in economic conditions. If macroeconomic conditions do not continue to improve or if conditions worsen, our business could be adversely affected.
The failure to attract and retain television viewers and secure a suitable programming tier of carriage and channel placement for the HSN television network programming could result in a decrease in revenue.
We are dependent, in part, upon the continued ability of HSN to compete effectively for television viewers. Effectively competing for television viewers is dependent, in substantial part, on the ability of HSN to secure placement of the HSN television networks within a suitable programming tier and to effectively compete against others for the leisure and entertainment time of consumers. The advent of digital compression technologies and the adoption of digital cable has resulted in increased channel capacity. In addition, there are now more programming options available to the viewing public in the form of new television networks and alternative distribution platforms and time-shifted viewing options (e.g., personal video recorders, video-on-demand, interactive television and streaming video over broadband internet connections as well as increased access to various media through wireless devices). These have the potential to reduce the viewing of our content. New technologies have been and will continue to be developed that increase the number of entertainment choices available and the manners in which they are delivered. Our failure to effectively anticipate or adapt to emerging technologies or changes in consumer behavior could have an adverse impact on our competitive position, business and results of operations.
A prolonged or permanent inability to broadcast the HSN television networks would result in lost customers and lost sales.
Our success is dependent upon the continued ability of HSN to transmit the HSN television networks to broadcast and pay television operators from its satellite uplink facilities, which transmission is subject to the FCC compliance. HSN has entered into a satellite transponder agreement to provide for continued carriage of the HSN television networks on a replacement transponder and/or replacement satellite, as applicable, in the event of a failure of the transponder and/or satellite. Any such disruption could have a material adverse effect on our competitive position, business and results of operations.
11
International and national trade laws, regulations and policies (particularly those related to or restricting global trade) could significantly impair HSNi’s profitability and growth prospects.
International and national laws, regulations and policies directly or indirectly related to or restricting the import of HSNi’s products could harm HSNi’s business. Restricted access to global markets impairs HSNi’s ability to import its products at competitive prices on a timely basis. These restrictions may affect HSNi’s competitive position. Additionally, HSNi’s competitive position and results could be adversely affected by changes in-or uncertainty surrounding-U.S. trade policy. A majority of HSNi's inventory is currently imported. Major developments in tax policy or trade relations, such as the disallowance of tax deductions for imported merchandise or the imposition of unilateral tariffs on imported products, could have a material adverse effect on our business, results of operations and liquidity.
Interruption and the lack of integration and redundancy in our systems and infrastructures may adversely affect our ability to broadcast, operate websites, process and fulfill transactions, respond to customer inquiries and generally maintain cost-efficient operations.
We use the internet, mobile devices, social networking and other online activities to connect with our customers. Our success depends, in part, on our ability to maintain the integrity of our systems and infrastructures, including websites, information and related systems, call centers and fulfillment facilities. We may experience occasional system interruptions, including those caused by system conversions, that make some or all systems or data unavailable or prevent our businesses from efficiently providing services or fulfilling orders. We also rely on affiliate and third-party computer systems, broadband and other communications systems and service providers in connection with the provision of services generally, as well as to facilitate, process and fulfill transactions. Any interruptions, outages or delays in our systems and infrastructures, our businesses, our affiliates and/or third parties, or deterioration in the performance of these systems and infrastructures, could impair our ability to provide services, fulfill orders and/or process transactions. Fire, flood, power loss, telecommunications failure, hurricanes, tornadoes, earthquakes, acts of war or terrorism, acts of God and similar events or disruptions may damage or interrupt broadcast, computer, broadband or other communications systems and infrastructures at any time. In addition, we have observed an increase in the number of cyber attacks that include gaining access to digital systems for purposes of corrupting data or causing operational disruption. Any of these events could cause system interruption, delays and loss of critical data, and could prevent us from providing services, fulfilling orders and/or processing transactions which could have an adverse impact on our competitive position, business and results of operations. While we have backup systems for certain aspects of our operations, these systems are not fully redundant and disaster recovery planning is not sufficient for all eventualities. In addition, we may not have adequate insurance coverage to compensate for losses from a major interruption.
We operate a limited number of distribution facilities. Our ability to meet the needs of our customers depends on the proper operation of these distribution facilities. If any of these distribution facilities were to shut down or otherwise become inoperable or inaccessible for any reason, we could suffer a substantial loss of inventory and/or disruptions of deliveries to our customers. In addition, we could incur significantly higher costs and longer lead times associated with the distribution of our products during the time it takes to reopen or replace the damaged facility. Any of the foregoing factors could result in decreased sales and have a material adverse effect on our business, financial condition and operating results. In addition, we have been implementing new warehouse management systems to further support our efforts to operate with increased efficiency and flexibility. There are risks inherent in operating in new distribution environments and implementing new warehouse management systems, including operational difficulties that may arise with such transitions. We may experience shipping delays should there be any disruptions in our new warehouse management systems or warehouses themselves.
The processing, storage, use and disclosure of personal data could give rise to liabilities as a result of governmental regulation, conflicting legal requirements or differing views of personal privacy rights.
In the processing of consumer transactions, we receive, transmit and store a large volume of personally identifiable information and other user data. The storing, sharing, use, disclosure and protection of this information are governed by federal, state and international laws as well as the privacy and data security policies maintained by us. Specifically, personally identifiable information is increasingly subject to legislation and regulations in numerous jurisdictions around the world, the intent of which is to protect the privacy of personal information that is collected, processed and transmitted in or from the governing jurisdiction. As a merchant who accepts credit and debit cards, we are subject to heightened payment card industry standards. These standards primarily pertain to the processes and procedures for secure storage of customer data. Failure to comply with these standards, as required by card issuers, could result in card brand fines and/or the possible inability for us to accept a card brand. We could be adversely affected if legislation or regulations are expanded to require changes in business practices or privacy policies, or if governing jurisdictions interpret or implement their legislation or regulations in ways that negatively affect our business, financial condition and results of operations.
12
We are subject to online and other cyber security risks and cyber incidents, including security and data breaches and identity theft.
To succeed, we must be able to provide for secure transmission of confidential information over public networks. We have observed an increased number of cyber attacks that include attempts to gain unauthorized access to digital systems for purposes of misappropriating assets or sensitive information. Our failure, and/or the failure by the various third party vendors and service providers with which we do business, to comply with applicable privacy policies or federal, state or similar international laws and regulations or any compromise of security that results in the unauthorized release of personally identifiable information or other user data could damage the reputation of our businesses, discourage potential users from trying our products and services and/or result in fines and/or proceedings by governmental agencies and/or consumers, one or all of which could adversely affect our business, financial condition and results of operations. Any penetration of network security or other misappropriation or misuse of personal consumer information could cause interruptions in the operations of our businesses and subject us to increased costs, litigation and other liabilities. Security and data breaches could also significantly damage our reputation with consumers and third parties with whom we do business. We may be required to expend significant capital and other resources to protect against and remedy any potential or existing security and data breaches and their consequences. We also face risks associated with security and data breaches affecting third parties with which we are affiliated or otherwise conduct business online.
We could be subject to additional sales tax, property tax or unclaimed property liabilities.
Federal and state law governs the imposition of obligations related to sales tax, property tax and unclaimed property. An unfavorable change in these laws or a successful assertion by one or more states may result in material liabilities including penalties and interest.
The imposition of obligations to collect state and local sales tax with respect to sales from out-of-state retailers is restricted by U.S. Supreme Court decisions as well as state law. As a result, approximately 33% of our revenue is not currently subject to sales tax or its equivalent. However, an increasing number of states have adopted or are considering laws that attempt to impose obligations on out-of-state retailers to collect sales tax on their behalf. Congress is also considering legislation allowing states to require out-of-state sellers to collect sales and use taxes. It is not possible to predict with any degree of certainty the outcome of these initiatives or the impact of these initiatives on our business and marketing strategies that we are considering or may consider in the future.
An unfavorable change in the U.S. Supreme Court guidance related to sales tax, or a successful assertion by one or more states may result in material tax liabilities, interest and penalties. A change in state or federal laws, or our business model, business strategy, or marketing initiatives may require us to collect sales tax on transactions in which we do not currently collect such tax. These developments, should they occur, may result in a decrease in future sales, may decrease our ability to compete, or otherwise harm our business.
Increased delivery costs, particularly if we are unable to offset them by increasing prices without a detrimental effect on customer demand, and the extent to which we offer shipping promotions to our customers, could adversely impact our profits.
We are impacted by increases in shipping rates charged by various shipping vendors relating to the procurement of merchandise from vendors and manufacturers, the shipment of merchandise to customers and the mailing of catalogs, which over the past few years have experienced volatility in comparison to historical levels. Variations in the mix and quantity of products we sell impact the cost to ship our products as do the shipping promotions we frequently offer to drive revenues. We currently expect that shipping and postal rates will continue to increase as well as the trend towards free shipping in the direct-to-consumer marketplace. As online and multi-channel retailers continue to focus on delivery services, we expect customers will continue to expect faster delivery times with a reduced price or free. In the case of deliveries to customers, we believe we have negotiated favorable shipping rates, which increase at agreed upon levels over time, with one independent, third party shipping company. If this relationship were to terminate or if the shipping company was unable to fulfill its obligations under the contract for any reason, particularly during peak shipping seasons, we would have to work with other shipping companies to deliver merchandise to customers, which could be at less favorable rates and could cause a disruption in our business. A significant increase in shipping promotions as well as any increase in shipping rates and related fuel and other surcharges passed on to us by our shipping company may adversely impact profits given that we may not be able to pass these increased costs directly to customers or offset them by increasing prices without a detrimental effect on customer demand. Our ability to be competitive on delivery times and delivery costs depends on many factors, and our failure to successfully manage these factors and offer competitive delivery options could negatively impact the demand for our products and our profit margins.
13
We depend on relationships with vendors, manufacturers and other third parties; any adverse changes in these relationships could result in a failure to meet customer expectations which could result in lost sales.
We purchase merchandise from a wide variety of third party vendors, manufacturers and other sources pursuant to short- and long-term contracts and purchase orders. Our ability to identify and establish relationships with these parties, as well as access quality merchandise in a timely and efficient manner on acceptable terms and at acceptable costs, can be challenging. In particular, we purchase a significant amount of merchandise from vendors and manufacturers abroad and have experienced (and expect to continue to experience) increased costs for goods sourced in these markets. We depend on the ability of vendors and manufacturers in the U.S. and abroad to produce and deliver goods that meet applicable quality standards, which is impacted by a number of factors not within the control of these parties, such as political or financial instability, trade restrictions, tariffs, currency exchange rates, transport capacity, labor actions and costs, among others. In particular, Cornerstone is dependent, in significant part, upon independent, third party manufacturers to produce its private label merchandise.
Our failure to identify new vendors and manufacturers, maintain relationships with a significant number of existing vendors and manufacturers and/or access quality merchandise in a timely and efficient manner could cause us to miss customer delivery dates or delay scheduled promotions, which would result in the failure to meet customer expectations and could cause customers to cancel orders or cause us to be unable to source merchandise in sufficient quantities, which could result in lost sales.
The unanticipated loss of certain larger vendors could negatively impact our sales and profitability on a short term basis.
It is possible that one or more of our larger vendors could experience financial difficulties, including bankruptcy, or otherwise could elect to cease doing business with us. While we have periodically experienced the loss of a major vendor, if a major vendor or a number of our current larger vendors ceased doing business with us, or did not perform consistently with past practice, this could materially and adversely impact our sales and profitability.
We may not be able to accurately predict and/or respond in a timely manner to evolving customer preferences and trends and industry standards, which could result in excess inventory, related markdowns and lost sales.
Our success depends, in significant part, on our ability to accurately predict, and respond in a timely manner to, changes in customer preferences and fashion, lifestyle and other trends and industry standards. While product mix and price points are continuously monitored and adjusted in an attempt to satisfy consumer demand and respond to changing economic and business conditions, we may not be successful in these efforts, and any sustained failure could result in excess inventory and related markdowns.
In addition, e-commerce is characterized by evolving industry standards, frequent new service and product introductions and enhancements, as well as changing customer demands and increasing privacy and data security needs. If we are not able to adapt quickly enough and/or in a cost-effective manner to these changes it could result in lost sales which would negatively impact our results of operations.
We are currently the subject of a consent order issued by the FTC and violation of this consent order could result in significant civil penalties and/or an injunction enjoining HSN from engaging in prohibited activities, among other penalties or remedies.
In October 1996, HSN became subject to a consent order issued by the FTC which terminates on the later of April 15, 2019, or 20 years from the most recent date that the United States or the FTC files a complaint in federal court alleging any violation thereunder. Pursuant to this consent order, HSNi (including its subsidiaries and affiliates) is prohibited from making claims for specified categories of products, including claims that a given product can cure, treat or prevent any disease or have an effect on the structure or function of the human body, unless it has competent and reliable scientific evidence to substantiate such claims. Violation of this consent order may result in the imposition of significant civil penalties for non-compliance and related redress to consumers and/or the issuance of an injunction enjoining us from engaging in prohibited activities. The FTC periodically investigates our business and operations on an ongoing basis for purposes of determining its compliance with the consent order.
14
We may be subject to claims for representations made in connection with the sale and promotion of merchandise or for harm experienced by customers who purchase merchandise from us.
The manner in which we sell and promote merchandise and related claims and representations made in connection with these efforts is regulated by federal, state and local law. We may be exposed to potential liability from claims by consumers or from federal, state and local regulators and law enforcement agencies, including, but not limited to, for personal injury, product safety, wrongful death and damage to personal property relating to merchandise sold and/or misrepresentation of merchandise features and/or benefits. In certain instances, we have the right to seek indemnification for related liabilities from our vendors and may require such vendors to carry minimum levels of product liability and errors and omissions insurance. These vendors, however, may be unable to obtain suitable coverage or maintain this coverage on acceptable terms; this insurance may provide inadequate coverage against all potential claims or may not even be available with respect to a particular claim. If insurance is insufficient or unavailable, our vendor may have insufficient resources to cover their indemnification obligations, or if our vendor ceases to do business, our results of operations could be negatively impacted. Even if vendors can satisfy their financial obligations, our brand and reputation could be negatively impacted.
Failure to effectively manage our Flexpay program could result in unplanned losses.
HSN offers Flexpay, a program which customers may pay for certain merchandise in two to six interest-free, monthly credit or debit card installments. This is an effective tool for driving sales, primarily for higher-priced items. We maintain allowances for estimated losses resulting from the inability of customers to make required payments. Actual losses due to the inability of customers to make required payments may increase in a given period or exceed related estimates. As Flexpay usage continues to grow, we may experience these losses at greater rates, which will require us to maintain greater allowances for doubtful accounts of estimated losses than we have historically. To the extent that Flexpay losses exceed historical levels, our results of operations may be negatively impacted.
We may fail to protect our intellectual property rights within the full scope and manner available to us under applicable law or statute or may be accused of infringing upon the intellectual property rights of third parties.
We regard our intellectual property rights, including patents, service marks, trademarks and domain names, copyrights and trade secrets, as critical to our success. We rely heavily upon software, databases and other systemic components that are necessary to manage and support our business operations.
We are subject to legal proceedings and claims in the ordinary course of business, including claims of alleged infringement of the trademarks, copyrights, patents and other intellectual property rights of third parties. In addition, litigation may be necessary in the future to enforce our intellectual property rights, protect trade secrets or to determine the validity and scope of proprietary rights claimed by others. Any litigation of this nature, regardless of outcome or merit, could result in substantial costs and diversion of management and technical resources, any of which could adversely affect our business, financial condition and results of operations. Patent litigation tends to be particularly protracted and expensive. Our failure to protect our intellectual property rights in a meaningful manner or challenges to related contractual rights could result in erosion of brand names and limit our ability to control marketing on or through the internet using our various domain names or otherwise, which could adversely affect our business, financial condition and results of operations.
Failure to comply with existing laws, rules and regulations, or to obtain and maintain required licenses and rights could subject us to additional liabilities.
We market and provide a broad range of merchandise through television, digital, catalogs and other channels. As a result, we are subject to a wide variety of statutes, rules, regulations, policies and procedures in various jurisdictions which are subject to change at any time, including laws regarding product safety, consumer protection, privacy, the regulation of retailers generally, the importation, sale and promotion of merchandise and the operation of retail stores and warehouse facilities, as well as laws and regulations applicable to the internet and businesses engaged in digital commerce, such as those regulating the sending of unsolicited, commercial electronic mail. Our failure to comply with these laws and regulations could result in fines and/or proceedings against us by governmental agencies and/or consumers, which could adversely affect our business, financial condition and results of operations. Moreover, unfavorable changes in the laws, rules and regulations applicable to us could decrease demand for merchandise offered by us, negatively impact our marketing efforts, increase costs, subject us to additional liabilities and/or otherwise adversely affect our businesses.
15
Our leveraged capital structure may adversely affect our financial condition, results of operations and earnings per share.
We completed a leveraged recapitalization transaction during the fiscal quarter ending March 31, 2015, which included increasing our level of indebtedness and the payment of a special cash dividend of approximately $524 million. The existence of increased debt could have important consequences including, among other things:
• | require a more substantial portion of our cash flows from operations to be dedicated to the payment of principal and interest on our indebtedness; |
• | limit our ability to use cash flow or obtain additional financing for future working capital, capital expenditures, acquisitions, investments, dividends, stock repurchases or other general corporate purposes; |
• | increase our vulnerability to general economic and industry conditions; or |
• | expose us to the risk of increased interest rates for that portion of our borrowings under our credit facilities that are at variable interest rates. |
Our credit facility includes restrictive financial and non-financial covenants. Limitations imposed as a part of the debt, such as the availability of credit and the existence of restrictive covenants may, among other things, make it difficult for us to satisfy our financial obligations; and/or limit our ability to respond to business opportunities.
There are risks associated with our acquisitions.
Mergers and acquisitions entail a number of risks including, among other things, higher than anticipated acquisition costs and expenses, the difficulty and expense of integrating the operations and personnel of the companies and the potential loss of key employees and customers as a result of changes in management. We may not be successful in overcoming these risks or any other problems encountered in connection with any acquisition.
Acquisition valuations require us to make certain estimates and assumptions to determine the fair value of the acquired entities (including the underlying assets and liabilities). If our estimates or assumptions used to value acquired assets and liabilities are not accurate, we may be exposed to losses that may be material.
Risks Related to Our Common Stock
The shareholders’ rights plan adopted by the Board of Directors in December 2008 may inhibit takeovers that would otherwise be beneficial to shareholders.
In the fourth quarter of 2008, our Board of Directors approved the creation of a Series A Junior Participating Preferred Stock, adopted a shareholders’ rights plan and declared a dividend of one right for each outstanding share of common stock held by our shareholders. Initially, these rights, which trade with the shares of our common stock, are not exercisable. Under the rights plan, these rights will be exercisable if a person or group acquires or commences a tender or exchange offer for 15% or more of our common stock (except for certain grandfathered persons to which higher thresholds apply). If the rights become exercisable, each right will permit the holder, other than the “acquiring person,” to purchase from us shares of common stock at a 50% discount to the then prevailing market price. As a result, the rights will cause substantial dilution to a person or group that becomes an “acquiring person” on terms not approved by our Board of Directors. The existence of these rights may prevent, discourage or delay us from being acquired, even if such acquisition would be beneficial to our shareholders.
16
The market price and trading volume of our common stock may be volatile and may face negative pressure.
Our stock price has experienced, and could continue to experience in the future, substantial volatility as a result of many factors, including persistent adverse macroeconomic conditions, broad market fluctuations and public perception of the prospects for the retail industry. Our failure to meet market expectations would also likely result in a decline in the market price of our stock. These and other factors may result in short-term or long-term negative pressure on the value of our common stock.
ITEM 1B. | UNRESOLVED STAFF COMMENTS |
Not applicable.
ITEM 2. | PROPERTIES |
HSNi owns its corporate headquarters in St. Petersburg, Florida, which consist of approximately 600,000 square feet of office space and include executive offices, television studios, showrooms, broadcast facilities and administrative offices for HSN. HSN owns its fulfillment center in Piney Flats, Tennessee. HSN leases its fulfillment centers in Fontana, California; Roanoke, Virginia; Ronkonkoma, New York and Greeneville, Tennessee; as well as five outlet stores and other properties in various locations in the United States for administrative offices and data centers pursuant to leases that expire in 2017 through 2026. In 2015, HSNi announced it will be closing its distribution center in Roanoke, Virginia and intends to exit the facility by the end of its lease term in April 2018. Cornerstone owns an office and storage facility in Franconia, New Hampshire. Cornerstone leases its fulfillment centers in West Chester, Ohio; Monroe, Ohio and Phoenix, Arizona. It also leases other properties consisting of administrative offices, 16 retail stores and outlets, and photo centers in various locations throughout the United States, all pursuant to leases with expiration dates ranging from 2017 to 2027.
HSNi believes that the duration of each lease is adequate and does not anticipate any future problems renewing or obtaining suitable leases for its principal properties. HSNi believes that its principal properties, whether owned or leased, are currently adequate for the purposes for which they are used and are suitably maintained for these purposes. From time to time, HSNi considers various alternatives related to its long term facilities needs. While HSNi management believes existing facilities are adequate to meet its short term needs, it may become necessary to lease or acquire additional or alternative space to accommodate future growth.
ITEM 3. | LEGAL PROCEEDINGS |
In the ordinary course of business, we are involved in various legal matters arising out of our operations. These matters may relate to claims involving property, personal injury, contract, intellectual property (including patent infringement), sales tax, regulatory compliance, employment matters and other claims. As of the date of this filing, we are not a party to any legal proceedings that are reasonably expected to have a material adverse effect on our business, results of operations, financial condition or cash flows; however, litigation matters are subject to inherent uncertainties and the results of these matters cannot be predicted with certainty. An unfavorable resolution of one or more of these matters could have a material adverse effect on our business, results of operations, financial condition or cash flows. Moreover, any claims or regulatory actions against us, whether meritorious or not, could be time consuming, result in costly litigation, require significant amounts of management time and result in the diversion of significant operational resources.
See Note 13 – Commitments and Contigencies in Part II, Item 8 for additional information regarding legal matters in which we are involved.
ITEM 4. | MINE SAFETY DISCLOSURES |
Not Applicable.
17
PART II
ITEM 5. | MARKET FOR REGISTRANT’S COMMON EQUITY, RELATED SHAREHOLDER MATTERS AND ISSUER PURCHASES OF EQUITY SECURITIES |
Market and Dividend Information
Our common stock trades on the NASDAQ Global Select Market under the symbol HSNI. The table below sets forth the high and low per share sales prices of our common stock, as reported by the NASDAQ Global Select Market, and the dividends declared for the periods indicated.
Sales Price | |||||||||||||
Fiscal 2016 | High | Low | Dividends | ||||||||||
Fourth Quarter | $ | 40.95 | $ | 30.75 | $ | 0.35 | |||||||
Third Quarter | $ | 54.03 | $ | 37.34 | $ | 0.35 | |||||||
Second Quarter | $ | 54.79 | $ | 45.57 | $ | 0.35 | |||||||
First Quarter | $ | 55.87 | $ | 40.83 | $ | 0.35 | |||||||
Fiscal 2015 | |||||||||||||
Fourth Quarter | $ | 63.44 | $ | 49.43 | $ | 0.35 | |||||||
Third Quarter | $ | 75.43 | $ | 57.17 | $ | 0.35 | |||||||
Second Quarter | $ | 71.46 | $ | 61.74 | $ | 0.35 | |||||||
First Quarter | $ | 79.80 | $ | 64.13 | $ | 10.35 | (a) | ||||||
(a) In January 2015, our Board of Directors approved a special cash dividend of $10.00 per share payable February 19, 2015 to shareholders of record as of February 9, 2015. | |||||||||||||
In February 2017, our Board of Directors approved a quarterly cash dividend of $0.35 per share payable March 22, 2017 to shareholders of record as of March 8, 2017. We currently expect to continue to declare and pay quarterly dividends of an amount similar to our past quarterly declaration. However, any determination to pay cash dividends will be at the discretion of our Board of Directors and will depend upon our operating results, financial condition and capital requirements, general business conditions and such other factors that the Board of Directors considers relevant. Our credit agreement limits the amount of and our ability to pay cash dividends. Refer to Note 7 to the Notes to Consolidated Financial Statements and the Liquidity and Capital Resources section of Management's Discussion and Analysis for a discussion of restrictions on the payment of dividends.
Holders
As of January 19, 2017, there were approximately 1,300 shareholders of record of our common stock. Because many of our shares of common stock are held by brokers and other institutions on behalf of shareholders, we are not able to estimate the total number of beneficial shareholders represented by these record holders.
Issuer Purchases of Equity Securities
On September 27, 2011, our Board of Directors authorized us to repurchase up to 10 million shares of our common stock. In July 2014, HSNi completed the 10 million share repurchase program at an aggregate cost of $451.0 million, representing an average cost of $45.10 per share.
On January 27, 2015, our Board of Directors authorized a new share repurchase program allowing us to repurchase up to 4 million shares of our common stock, principally to offset dilution related to HSNi's equity compensation programs. Under the terms of the share repurchase program, HSNi will repurchase its common stock from time to time through privately negotiated or open market transactions, including pursuant to a trading plan in accordance with Rule 10b5-1 and Rule 10b-18 under the Securities Exchange Act of 1934, as amended, or by any combination of such methods. The timing of any repurchases and actual number of shares repurchased will depend on a variety of factors, including the stock price, corporate and regulatory requirements, restrictions under the company’s debt obligations and other market and economic conditions. The repurchase program may be suspended or discontinued by HSNi at any time.
As of December 31, 2016, there were 2,695,579 shares available for repurchase. During the fourth quarter, there were no repurchases.
18
Performance Graph
The graph depicted below compares the five-year performance of our common stock with the cumulative total return on the Russell 2000 Index and the S&P Retail Select Industry Index from December 31, 2011 through December 31, 2016.
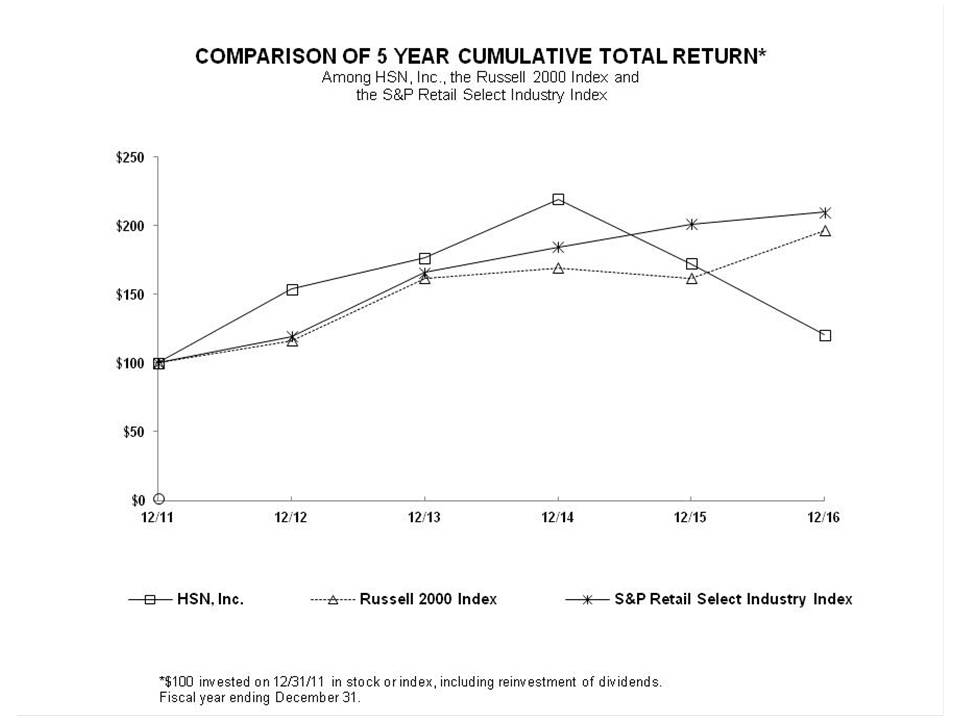
12/31/2011 | 12/31/2012 | 12/31/2013 | 12/31/2014 | 12/31/2015 | 12/31/2016 | |||||||||||||
HSN, Inc. | 100.00 | 153.87 | 176.54 | 219.24 | 172.57 | 120.50 | ||||||||||||
Russell 2000 Index | 100.00 | 116.35 | 161.52 | 169.43 | 161.95 | 196.45 | ||||||||||||
S&P Retail Select Industry Index | 100.00 | 119.32 | 165.95 | 184.29 | 201.31 | 209.85 | ||||||||||||
19
ITEM 6. | SELECTED FINANCIAL DATA |
The following table presents selected consolidated financial data for HSNi. The information in this table is not necessarily indicative of future performance and should be read in conjunction with “Management's Discussion and Analysis of Financial Condition and Results of Operations,” and our audited consolidated financial statements and related notes included herein.
Year Ended December 31, | |||||||||||||||||||||
2016 | 2015 | 2014 | 2013 | 2012 (a) | |||||||||||||||||
(In thousands, except per share data) | |||||||||||||||||||||
Statement of Operations Data: | |||||||||||||||||||||
Net sales | $ | 3,567,485 | $ | 3,690,575 | $ | 3,587,995 | $ | 3,403,983 | $ | 3,266,739 | |||||||||||
Loss on sale of businesses and asset impairments (b) | 31,232 | 6,660 | — | 3,040 | — | ||||||||||||||||
Operating income | 205,807 | 284,034 | 284,609 | 282,654 | 258,744 | ||||||||||||||||
Income from continuing operations | 118,708 | 169,239 | 172,984 | 178,449 | 136,497 | ||||||||||||||||
Net income | 118,708 | 169,239 | 172,984 | 178,449 | 130,675 | ||||||||||||||||
Income from continuing operations per share: | |||||||||||||||||||||
Basic | $ | 2.27 | $ | 3.22 | $ | 3.28 | $ | 3.33 | $ | 2.42 | |||||||||||
Diluted | $ | 2.25 | $ | 3.16 | $ | 3.23 | $ | 3.25 | $ | 2.36 | |||||||||||
Net income per share: | |||||||||||||||||||||
Basic | $ | 2.27 | $ | 3.22 | $ | 3.28 | $ | 3.33 | $ | 2.32 | |||||||||||
Diluted | $ | 2.25 | $ | 3.16 | $ | 3.23 | $ | 3.25 | $ | 2.25 | |||||||||||
Shares used in computing earnings per share: | |||||||||||||||||||||
Basic | 52,359 | 52,627 | 52,736 | 53,640 | 56,314 | ||||||||||||||||
Diluted | 52,863 | 53,505 | 53,633 | 54,857 | 57,956 | ||||||||||||||||
Dividends declared per common share | $ | 1.40 | $ | 11.40 | $ | 1.10 | $ | 0.79 | $ | 0.555 | |||||||||||
Balance Sheet Data (end of period): | |||||||||||||||||||||
Working capital | $ | 268,937 | $ | 329,182 | $ | 407,654 | $ | 361,386 | $ | 357,265 | |||||||||||
Total assets | 1,304,533 | 1,341,463 | 1,399,526 | 1,308,162 | 1,304,349 | ||||||||||||||||
Total debt, including current maturities | 515,000 | 640,000 | 228,126 | 240,625 | 250,000 | ||||||||||||||||
Other long-term liabilities, including deferred income taxes | 80,088 | 65,155 | 72,698 | 74,845 | 67,385 | ||||||||||||||||
(a) | The Territory Ahead and Smith+Noble, two brands sold by Cornerstone in 2012, were presented as discontinued operations. | ||||||||||||||||||||
(b) | Includes the loss on sale of businesses and asset impairment charges related to Chasing Fireflies and TravelSmith, two brands sold by Cornerstone in 2016. | ||||||||||||||||||||
20
ITEM 7. | MANAGEMENT’S DISCUSSION AND ANALYSIS OF FINANCIAL CONDITION AND RESULTS OF OPERATIONS |
The following discussion should be read in conjunction with the consolidated financial statements and notes thereto appearing elsewhere in this annual report. Historical results and trends which might appear should not be taken as indicative of future operations. Our results of operations and financial condition, as reflected in the accompanying consolidated financial statements and related notes, are subject to management’s evaluation and interpretations of business conditions, changing market conditions and other factors.
Business Overview
HSNi offers innovative, differentiated retail experiences and markets and sells a wide range of third party and proprietary merchandise directly to consumers through its two operating segments, HSN and Cornerstone. HSN's business platforms include (i) the television home shopping programming broadcast on the HSN television networks; (ii) the HSN.com and joymangano.com websites; (iii) mobile applications; (iv) outlet stores; (v) direct-response television marketing; and (vi) wholesale distribution of certain proprietary products to other retailers. Cornerstone's business platforms include (i) catalogs, consisting primarily of the Cornerstone portfolio of leading print catalogs which includes Ballard Designs, Frontgate, Garnet Hill, Grandin Road and Improvements; (ii) websites, consisting primarily of the five branded websites operated by Cornerstone; (iii) retail and outlet stores; and (iv) mobile applications.
Sources of Revenue
HSN revenue includes merchandise sales originating from the live television broadcasts of its programming 24 hours per day, seven days a week; HSN2, a network that primarily distributes taped programming; the HSN.com and joymangano.com websites; mobile applications; outlet stores; direct-response television marketing; and wholesale distribution of certain proprietary products to other retailers. HSN also sells merchandise through its "Autoship" program under which customers receive scheduled merchandise shipments according to a pre-determined calendar.
Cornerstone sells private label and third party merchandise through its assortment of catalogs, digital sites, mobile applications and retail and outlet stores. Cornerstone consists of the brands of Ballard Designs, Frontgate, Garnet Hill, Grandin Road and Improvements.
Products
HSNi sells a wide array of merchandise across its various channels of distribution. HSN merchandise categories primarily consist of jewelry, fashion (apparel & accessories), beauty & health (beauty, wellness and fitness), and home & other (including home, electronics, culinary and other). HSN manages its product mix to provide a balance between satisfying existing customer demand, generating interest from potential viewers and customers, providing new merchandise to its viewership and maximizing airtime and internet efficiency. Cornerstone merchandise categories generally consist of home and outdoor furnishings and apparel & accessories.
HSNi management believes that merchandise diversification, combined with an interactive multi-channel distribution strategy, appeals to a broader segment of potential customers and is an important part of its overall business strategy. HSNi is continually developing new merchandise offerings from existing, potential and future suppliers, to supplement its existing product lines.
Overview of Results
HSNi’s net sales in 2016 decreased 3% to $3.6 billion. Net sales at HSN decreased 3% to $2.5 billion and Cornerstone’s net sales decreased 5% to $1.1 billion. Both segments were impacted by a challenging retail environment that was highly promotional with intense competition that experienced distractions from a disruptive political climate. We had increased pressure on shipping and handling revenues as the trend in the industry towards free or reduced price shipping promotions continued, a trend we expect to continue in 2017. As a result, we implemented more aggressive and strategic shipping and handling pricing incentives in mid-2016 at HSN that we believe will make us more competitive in the marketplace.
Digital remains an essential part of our strategy to optimize the content of all our brands across multiple distributed commerce platforms. HSNi digital sales penetration now represents 53% of our business. Sales from a mobile device, including smart phones and tablets, grew 17% and represent 22% of our total business. We will continue to invest in our digital
21
technologies to enable us to offer a highly personalized and engaging experience based on customer profile, preferences and usage.
On September 8, 2016, HSNi divested of TravelSmith and Chasing Fireflies, two of the under-performing apparel brands within the Cornerstone portfolio, allowing us to exclusively focus on improving the performance of our strategic brands. The sale resulted in a loss and asset impairment charges totaling $31.2 million. The results of TravelSmith and Chasing Fireflies are included in the results of HSNi and Cornerstone through the date of the divestiture.
As part of our distributed commerce strategies, we continued to invest in Cornerstone's experiential retail stores in key markets to expand consumer touch points with our brands. We have seen increased demand and higher lifetime-value customers in the regions where our retail stores are located. In 2016, we opened two Ballard Designs retail stores and have plans to open three more Ballard Designs and one Frontgate retail store in 2017.
As a part of HSNi’s supply chain optimization which includes the automation and consolidation of certain HSNi distribution centers, HSN began phasing in its expanded automation capabilities in its Piney Flats, Tennessee distribution center in the third quarter of 2016. In October, the center experienced issues in its ability to satisfy order fulfillment within traditional shipping time frames resulting in delays in merchandise deliveries. The implementation impacted fourth quarter results by approximately $16 million primarily in the form of higher shipping and handling costs, due to expedited shipping and operational inefficiencies, and increased consulting costs included in operating expenses. Despite the delays experienced in its Piney Flats facility, the Company continued to ship substantially all of its orders within its normal time frames. We expect that approximately $8 million to $10 million of incremental related charges will be incurred primarily in the first half of 2017, $4 million to $5 million of which will affect gross profit. Once fully operational, we expect to realize financial and operational benefits of the supply chain optimization initiative in the form of increased labor efficiencies, more efficient space utilization, lower transportation costs and faster customer deliveries upon the project's completion.
HSNi's net income in 2016, which included a charge of $31.2 million related to the divestitures and impairment of TravelSmith and Chasing Fireflies, decreased 30% to $118.7 million. The decrease in net income was primarily due to gross profit compression as a result of the lower sales and heightened promotional activity, particularly in shipping and handling, as well as the impact of the $31.2 million divestiture loss. The decrease was partially offset by lower operating expenses as we focused on cost containment initiatives, including Cornerstone's catalog circulation rationalization and talent realignment, and effectively managing HSN's Flexpay program. Although the utilization of HSN's Flexpay program increased in 2016, HSN's experienced lower credit losses than the prior year. The results in 2016 were also negatively impacted by the implementation issues of the supply chain optimization.
In 2017, HSNi's priorities include restoring sales growth by expanding our proprietary merchandising pipeline; driving customer acquisition; optimizing our digital platforms, particularly mobile; and extending our distributed commerce platforms, including further expansion of Cornerstone's experiential retail stores. We will also continue to invest in operational execution, including our supply chain optimization, while also focusing on expense management.
Results of Operations
Net Sales
Net sales primarily relate to the sale of merchandise, including shipping and handling fees, and are reduced by incentive discounts and actual and estimated sales returns. Sales taxes collected are not included in net sales. Digital sales include sales placed through our websites and our mobile applications, including tablets and smart phones.
Revenue is recorded when delivery to the customer has occurred. Delivery is considered to have occurred when the customer takes title and assumes the risks and rewards of ownership, which is on the date of shipment. HSNi’s sales policy allows customers to return virtually all merchandise for a full refund or exchange, subject to pre-established time restrictions.
Year Ended December 31, | ||||||||||||||||
2016 | Change | 2015 | Change | 2014 | ||||||||||||
(Dollars in thousands) | ||||||||||||||||
HSN | $ | 2,474,554 | (3)% | $ | 2,542,107 | 3% | $ | 2,476,088 | ||||||||
Cornerstone | 1,092,931 | (5)% | 1,148,468 | 3% | 1,111,907 | |||||||||||
Total HSNi net sales | $ | 3,567,485 | (3)% | $ | 3,690,575 | 3% | $ | 3,587,995 | ||||||||
22
Net sales for HSNi in 2016 decreased 3%, or $123.1 million, due to 3% sales declines at HSN and 5% sales declines at Cornerstone. Digital sales grew 3% with penetration increasing 310 basis points to 53.1%, up from 50.0% in the prior year. Mobile sales grew 17% and as a percentage of digital sales were 42.0%, up from 37.0% in the prior year. The number of units shipped in 2016 decreased 2% to 63.1 million and the average price point decreased 2% to $62.85. HSNi's net sales include the results of TravelSmith and Chasing Fireflies through the date of the divestitures on September 8, 2016 and its 2016 results include Cornerstone's 53-week period compared to a 52-week period in the prior year. Excluding the results of the divested businesses and additional week, net sales would have decreased approximately 2%.
HSNi | Cornerstone | |||||||||||||||
Annual net sales (in millions) | 2016 | 2015 | Change | 2016 | 2015 | Change | ||||||||||
As reported | $3,567.5 | $3,690.6 | (3)% | $1,092.9 | $1,148.5 | (5)% | ||||||||||
TravelSmith and Chasing Fireflies | (43.6 | ) | (99.2 | ) | (43.6 | ) | (99.2 | ) | ||||||||
Additional week | (15.0 | ) | — | (15.0 | ) | — | ||||||||||
Net sales, comparable basis | $3,508.9 | $3,591.4 | (2)% | $1,034.3 | $1,049.3 | (1)% | ||||||||||
Net sales for HSNi in 2015 increased 3%, or $102.6 million, due to 3% sales growth at HSN and 3% sales growth at Cornerstone. Digital sales grew 7% with penetration increasing 200 basis points to 50.0%, up from 48.0% in the prior year. The number of units shipped in 2015 increased 1% to 64.3 million and the average price point increased 1% to $64.03.
HSN
Net sales for HSN in 2016 decreased 3%, or $67.6 million. Approximately one-third of the decline in net sales was attributable to the conclusion of a direct-response television marketing campaign during the first quarter of 2016. Sales grew in wellness, electronics and culinary, offset by decreases in other categories and as well as in shipping and handling revenues. Shipping and handling revenues decreased primarily due to an increase in shipping promotions and a reduction in HSN's standard shipping rates which became effective in August 2016. Digital sales grew 6% with penetration increasing 380 basis points to 45.2%. Mobile sales grew 20.5% and as a percentage of digital sales were 52.1%, up from 46.0% in the prior year. The return rate decreased 80 basis points to 16.3% from 17.1% in the prior year primarily due to a shift in sales mix to categories with lower return rates. Units shipped in 2016 were up slightly to 50.0 million. The average price point decreased 3% to $56.61 largely due to increased promotional activity and changes in product mix.
Net sales for HSN in 2015 increased 3%, or $66.0 million. Sales grew in electronics and apparel and accessories, offset by decreases in jewelry and home. Strength in electronics was driven by partnerships with key brands while jewelry sales continued to be pressured this year as we repositioned this business. Digital sales grew 8% with penetration increasing 200 basis points to 41.4%. The return rate decreased 60 basis points to 17.1% from 17.7% in the prior year primarily due to a shift from merchandise with historically higher return rates, such as jewelry, to merchandise with lower return rates, such as electronics. Units shipped in 2015 increased 3% to 49.8 million. The average price point decreased 1% to $58.61. Sales from HSN's wholesale business increased in 2015 driven by an expanded product assortment sold to additional retail stores. Overall, the wholesale business represented 1% of HSN's net sales.
During 2014, we recognized $5.0 million of revenue related to unused customer credits where we determined it was not probable we have an obligation to escheat the value of the credits under unclaimed property laws and the likelihood of redemption was considered remote (“breakage”). This was the first year in which we were able to estimate and recognize customer credit breakage and, therefore, it included the breakage revenue related to customer credits issued since inception of this program. While we expect to continue to recognize customer credit breakage in future periods, the amounts will be significantly less than in 2014 due to the one-time multi-year inclusion in 2014.
Divisional product sales mix at HSN is provided in the table below:
Year Ended December 31, | |||||||||
2016 | 2015 | 2014 | |||||||
Jewelry | 7.9 | % | 8.4 | % | 9.7 | % | |||
Fashion (apparel & accessories) | 15.3 | % | 14.7 | % | 14.0 | % | |||
Beauty & Health (including beauty, wellness and fitness) | 23.3 | % | 23.7 | % | 24.5 | % | |||
Home & Other (including home, electronics, culinary and other) (a) | 53.5 | % | 53.2 | % | 51.8 | % | |||
Total | 100.0 | % | 100.0 | % | 100.0 | % | |||
(a) Includes product sold through direct-response television marketing. | |||||||||
23
Cornerstone
Net sales for Cornerstone for the 53-week period in 2016 compared to the 52-week period in 2015 decreased 5%, or $55.5 million. Excluding the results of TravelSmith and Chasing Fireflies from both periods and the benefit of the additional week in 2016, net sales would have decreased approximately 1%. The decrease in net sales was due to weakness in the home brands offset by an increase in Garnet Hill. The home brands were impacted by a highly competitive environment leading to increased promotional activity to drive sales demand. Digital sales declined 2%, but penetration increased 200 basis points to 71.0%. Mobile sales grew 8% and as a percentage of digital sales were 27.6%, up from 25.0% in the prior year. The return rate decreased 30 basis points to 12.8%. Catalog circulation decreased 5% to 312.6 million due to the strategic decision to reduce catalog circulation in certain brands and due to the divestitures of TravelSmith and Chasing Fireflies. Cornerstone added one retail and one outlet store during 2016 with a total of 16 stores open as of December 31, 2016 compared to a total of 14 stores as of December 31, 2015. Cornerstone expects to open an additional four retail stores in 2017.
Net sales for Cornerstone in 2015 increased 3%, or $36.6 million. The increase in net sales was due to sales growth in the home brands and Garnet Hill, partially offset by lower sales in Chasing Fireflies and TravelSmith. Digital sales grew 6% with penetration increasing 200 basis points to 69.0%. The return rate was 13.1%, consistent with the prior year. Catalog circulation increased 2% to 330.6 million compared to the prior year.
The brand mix at Cornerstone is provided in the table below:
Year Ended December 31, | |||||||||
2016 | 2015 | 2014 | |||||||
Home brands (Ballard Designs, Frontgate, Grandin Road and Improvements) (a) | 81.1 | % | 78.3 | % | 76.5 | % | |||
Apparel brands (Chasing Fireflies, Garnet Hill and TravelSmith) (a)(b) | 18.9 | % | 21.7 | % | 23.5 | % | |||
Total | 100.0 | % | 100.0 | % | 100.0 | % | |||
(a) Classification is based on the brands' primary product category which it sells; however, each brand sells products from other categories, to a lesser extent. | |||||||||
(b) Includes the results of Chasing Fireflies and TravelSmith through the date of the divestitures on September 8, 2016. | |||||||||
Cost of Sales and Gross Profit
Cost of sales consists primarily of the cost of products sold, shipping and handling costs and compensation and other employee-related costs for personnel engaged in warehouse functions. Cost of products sold includes merchandise cost, inbound freight and duties and certain allocable general and administrative costs, including certain warehouse costs.
Year Ended December 31, | ||||||||||||||||
2016 | Change | 2015 | Change | 2014 | ||||||||||||
(Dollars in thousands) | ||||||||||||||||
Gross profit: | ||||||||||||||||
HSN | $ | 816,045 | (7)% | $ | 873,507 | 3% | $ | 852,046 | ||||||||
As a percentage of HSN net sales | 33.0 | % | (140 bp) | 34.4 | % | - | 34.4 | % | ||||||||
Cornerstone | $ | 400,623 | (9)% | $ | 441,056 | 5% | $ | 421,016 | ||||||||
As a percentage of Cornerstone net sales | 36.7 | % | (170 bp) | 38.4 | % | 50 bp | 37.9 | % | ||||||||
HSNi | $ | 1,216,668 | (7)% | $ | 1,314,563 | 3% | $ | 1,273,062 | ||||||||
As a percentage of HSNi net sales | 34.1 | % | (150 bp) | 35.6 | % | 10 bp | 35.5 | % | ||||||||
bp = basis points
HSN
Gross profit for HSN in 2016 decreased 7% or $57.5 million. Gross profit as a percentage of net sales declined 140 basis points to 33.0% primarily due to lower shipping revenues and higher shipping and handling costs. Shipping and handling revenues decreased primarily due to an increase in shipping and handling promotions and a reduction in HSN's standard shipping rates which became effective in August 2016. The increase in shipping and handling costs was largely due to the issues with the implementation of HSNi's supply chain optimization. Shipping and handling costs were also impacted by changes in product mix and increased shipping cost rates. The implementation issues reduced gross profit by approximately $13 million, or 50 basis points, largely due to expedited shipping costs and operational inefficiencies.
24
The company estimates it will incur an additional $4 million to $5 million in costs impacting gross profit in the first half of 2017 related to the supply chain optimization implementation. Additionally, if HSN continues to carry excess inventories in certain product categories, it could expect to realize future margin pressure in the form of higher inventory reserves.
Gross profit for HSN in 2015 increased 3% or $21.5 million, while gross profit as a percentage of net sales was 34.4%, consistent with the prior year. There was an increase in net shipping expense driven by higher shipping promotions that was offset by higher product margins, both of which were impacted by product mix.
Cornerstone
Gross profit for Cornerstone in 2016 decreased 9%, or $40.4 million, compared to the prior year. Gross profit as a percentage of net sales decreased 170 basis points to 36.7% primarily due to lower product and shipping margins driven by higher promotional activity in the home brands.
Gross profit for Cornerstone in 2015 increased 5%, or $20.0 million, compared to the prior year. Gross profit as a percentage of net sales increased 50 basis points to 38.4% primarily due to improvement in overall product and shipping margins, particularly at Garnet Hill. The increases in the product and shipping margins were primarily due to lower promotional activity and selective price increases in the first half of the year.
Selling and Marketing Expense
Selling and marketing expense consists primarily of advertising and promotional expenditures, compensation and other employee-related costs (including stock-based compensation) for personnel engaged in customer service, sales and merchandising, production and programming functions; on-air distribution costs, including costs to purchase media for direct-response television marketing; and marketing partnership programs. Advertising and promotional expenditures primarily include catalog production and distribution costs and online marketing, including fees paid to search engine companies and third-party distribution partners, as well as other advertising and promotional campaigns. Certain prior period amounts previously included in general and administrative expense have been reclassified to selling and marketing expense to conform to the current year's presentation.
Year Ended December 31, | ||||||||||||||||
2016 | Change | 2015 | Change | 2014 | ||||||||||||
(Dollars in thousands) | ||||||||||||||||
HSN | $ | 424,381 | —% | $ | 424,233 | 2% | $ | 414,742 | ||||||||
As a percentage of HSN net sales | 17.1 | % | 40 bp | 16.7 | % | - | 16.7 | % | ||||||||
Cornerstone | $ | 319,087 | (6)% | $ | 338,837 | 5% | $ | 322,682 | ||||||||
As a percentage of Cornerstone net sales | 29.2 | % | (30 bp) | 29.5 | % | 50 bp | 29.0 | % | ||||||||
HSNi | $ | 743,468 | (3)% | $ | 763,070 | 3% | $ | 737,424 | ||||||||
As a percentage of HSNi net sales | 20.8 | % | 10 bp | 20.7 | % | 10 bp | 20.6 | % | ||||||||
HSNi's selling and marketing expense in 2016 decreased 3%, or $19.6 million, and was 20.8% of net sales compared to 20.7% in the prior year. HSNi's selling and marketing expense in 2015 increased 3%, or $25.6 million, and was 20.7% of net compared to 20.6% the prior year.
HSN
HSN's selling and marketing expense in 2016 was relatively unchanged from the prior year and was 17.1% of net sales compared to 16.7%. Included in selling and marketing expenses in 2016 were higher on-air distribution costs driven by expanded carriage of HSN2, increased digital marketing expense, fewer marketing partnerships and increased advertising costs related to the expansion of HSN's wholesale business in early 2016, offset by a decrease in media expense related to direct-response television marketing and lower employee compensation expense.
HSN's selling and marketing expense in 2015 increased 2%, or $9.5 million, due to higher employee-related costs, primarily for wages and healthcare, media spend for direct-response television marketing and digital marketing. These increases were partially offset by the benefit of certain marketing partnerships in 2015 as well as lower on-air distribution costs. Selling and marketing expense was 16.7% of net sales, consistent with the prior year.
25
Cornerstone
Cornerstone's selling and marketing expense in 2016 decreased 6%, or $19.8 million, and was 29.2% of net sales compared to 29.5% in the prior year. The decrease was primarily due to a 5% decrease in catalog circulation, partially offset by an increase in expenses related to Cornerstone's additional retail and outlet stores and higher digital marketing costs.
Cornerstone's selling and marketing expense in 2015 increased 5%, or $16.2 million, and was 29.5% of net sales compared to 29.0% in the prior year. The increase was due to higher employee-related costs, primarily for wages and healthcare, catalog costs associated with a 2% increase in circulation and digital marketing costs.
General and Administrative Expense
General and administrative expense consists primarily of compensation and other employee-related costs (including stock-based compensation) for personnel engaged in finance, legal, tax, human resources, information technology and executive management functions, bad debts, facilities costs and fees for professional services. Certain prior period amounts previously included in general and administrative expense have been reclassified to selling and marketing expense to conform to the current year's presentation.
Year Ended December 31, | ||||||||||||||||
2016 | Change | 2015 | Change | 2014 | ||||||||||||
(Dollars in thousands) | ||||||||||||||||
HSN | $ | 146,035 | (12)% | $ | 166,281 | 7% | $ | 155,444 | ||||||||
As a percentage of HSN net sales | 5.9 | % | (60 bp) | 6.5 | % | 20 bp | 6.3 | % | ||||||||
Cornerstone | $ | 47,414 | (7)% | $ | 51,100 | (1)% | $ | 51,651 | ||||||||
As a percentage of Cornerstone net sales | 4.3 | % | (10 bp) | 4.4 | % | (20 bp) | 4.6 | % | ||||||||
HSNi | $ | 193,449 | (11)% | $ | 217,381 | 5% | $ | 207,095 | ||||||||
As a percentage of HSNi net sales | 5.4 | % | (50 bp) | 5.9 | % | 10 bp | 5.8 | % | ||||||||
HSNi’s general and administrative expense in 2016 decreased 11%, or $23.9 million, and was 5.4% of sales compared to 5.9% in the prior year. HSNi’s general and administrative expense in 2015 increased 5%, or $10.3 million, and was 5.9% of net sales compared to 5.8% in the prior period.
HSN
HSN’s general and administrative expense in 2016 decreased 12%, or $20.2 million, and was 5.9% of net sales compared to 6.5% in the prior year. The decrease is due to a $10.5 million decline in bad debt expense driven by higher loss rates from HSN's Flexpay program in the prior year. The decrease is also due to lower employee costs for performance-based incentives of $10.2 million and a $6.6 million decrease in severance, including $3.2 million in costs accrued in the prior year for the planned closure of HSN's Virginia distribution center and $2.0 million related to the HSN reorganization in the fourth quarter of 2015. These decreases were partially offset by higher consulting costs, including $2 million for the supply chain optimization.
HSN’s general and administrative expense in 2015 increased 7%, or $10.8 million, and was 6.5% of net sales compared to 6.3% in the prior year. The increase in expense was primarily due to an $8.7 million increase in bad debt expense as a result of changes in sales mix towards electronics, which typically result in higher write-offs of Flexpay receivables. The increase was also attributable to an increase of $6.4 million in severance costs, including $3.2 million accrued for the planned closure of HSN's Virginia distribution center and $2.0 million associated with a reorganization in the fourth quarter of 2015. These increases were partially offset by a $5.2 million decrease in performance-based incentive compensation.
HSN’s general and administrative expenses for 2015 include approximately $3.2 million related to the planned closure of its Roanoke, Virginia distribution center. The facility closure is planned to occur in 2017 as part of HSNi’s supply chain optimization initiative that will include the consolidation of two distribution centers. Additional information regarding HSNi's supply chain optimization initiative is included in the section "Operating Income (Loss)" within Management's Discussion and Analysis of Financial Condition and Results of Operations. As part of this initiative, HSNi will be expanding the capabilities of its Piney Flats, Tennessee distribution center through automation of the facility. HSNi expects to incur approximately $4 million to $5 million in total charges related to the closure of the Virginia facility. These charges include approximately $3 million to $4 million in employee-related expenses, including severance payments and retention incentives. See Note 19 of Notes to Consolidated Financial Statements for further discussion of the planned closure of the Roanoke, Virginia distribution center.
26
Cornerstone
Cornerstone’s general and administrative expense in 2016 decreased 7%, or $3.7 million, and was 4.3% of net sales compared to 4.4% in the prior year. The decrease in expense was primarily due to decreases in employee-related costs, primarily performance-based incentives.
Cornerstone’s general and administrative expense in 2015 decreased 1%, or $0.6 million, and was 4.4% of net sales compared to 4.6% in the prior year. The increase in expense was primarily due to an increase in employee-related costs and costs associated with its expanded retail strategy; offset by a $3.1 million charge related to a settlement in the prior year with the Consumer Product Safety Commission ("CPSC").
Depreciation and Amortization
Year Ended December 31, | ||||||||||||||||
2016 | Change | 2015 | Change | 2014 | ||||||||||||
(Dollars in thousands) | ||||||||||||||||
HSN | $ | 29,328 | —% | $ | 29,371 | (1)% | $ | 29,762 | ||||||||
Cornerstone | 13,384 | (5)% | 14,047 | (1)% | 14,172 | |||||||||||
HSNi | $ | 42,712 | (2)% | $ | 43,418 | (1)% | $ | 43,934 | ||||||||
As a percentage of HSNi net sales | 1.2 | % | - | 1.2 | % | - | 1.2 | % | ||||||||
Depreciation and amortization in 2016 decreased 2%, or $0.7 million, compared to the prior year. Approximately $40.9 million in capital assets related to HSN's warehouse automation project were placed into service in 2016.
Loss on Sale of Businesses and Asset Impairments
During the second quarter of 2016, HSNi committed to a plan to sell Chasing Fireflies and TravelSmith, two of the apparel brands included within the Cornerstone segment. The assets and liabilities of the two brands were classified as held for sale as of June 30, 2016 and measured at their fair values less the estimated selling costs. As a result, Cornerstone recorded a non-cash asset impairment charge of $20.4 million in the second quarter of 2016.
On September 8, 2016, Cornerstone completed the divestitures of TravelSmith and Chasing Fireflies. The sale price included $1 million in cash and an additional $2 million of contingent consideration that was based on the achievement of certain performance metrics which is not expected to be earned. Cornerstone recorded a loss on sale of $10.8 million during the year ended December 31, 2016, which included $3.5 million of cash charges related to transaction costs and employee and lease liabilities.
During the year ended December 31, 2015, Cornerstone recognized a $6.7 million non-cash charge for the impairment of certain intangible assets associated with its 2012 acquisition of Chasing Fireflies. See Note 3 of Notes to Consolidated Financial Statements for further discussion of the impairment charge.
Net sales for Chasing Fireflies and TravelSmith were $43.6 million, $99.2 million and $113.4 million for the years ended December 31, 2016, 2015 and 2014, respectively. The pre-tax operating loss for the two brands, excluding asset impairment charges and the loss on sale, was approximately $13 million, $12 million and $3 million for the years ended December 31, 2016, 2015 and 2014, respectively. Included in these results were approximately $7 million in fixed costs which were wholly or partially reabsorbed by the remaining Cornerstone brands following the divestitures. See Note 20 of Notes to Consolidated Financial Statements for further discussion.
27
Operating Income
Year Ended December 31, | ||||||||||||||||
2016 | Change | 2015 | Change | 2014 | ||||||||||||
(Dollars in thousands) | ||||||||||||||||
HSN | $ | 216,301 | (15)% | $ | 253,622 | 1% | $ | 252,098 | ||||||||
As a percentage of HSN net sales | 8.7 | % | (130 bp) | 10.0 | % | (20 bp) | 10.2 | % | ||||||||
Cornerstone | $ | (10,494 | ) | (135)% | $ | 30,412 | (6)% | $ | 32,511 | |||||||
As a percentage of Cornerstone net sales | (1.0 | )% | (360 bp) | 2.6 | % | (30 bp) | 2.9 | % | ||||||||
HSNi | $ | 205,807 | (28)% | $ | 284,034 | —% | $ | 284,609 | ||||||||
As a percentage of HSNi net sales | 5.8 | % | (190 bp) | 7.7 | % | (20 bp) | 7.9 | % | ||||||||
HSNi's operating income in 2016 decreased $78.2 million to $205.8 million and was 5.8% of net sales compared to 7.7% in the prior year. The decrease was largely due to a 3% decline in net sales and 150 basis point decline in gross profit as a percentage of net sales, partially offset by a $19.7 million decrease in operating expenses. Included in operating expenses for 2016 was the loss on sale and asset impairment charge of $31.2 million related to the divestitures of TravelSmith and Chasing Fireflies compared to the prior year which included asset impairment charges of $6.7 million.
HSNi's operating income in 2015 decreased $0.6 million to $284.0 million and was 7.7% of net sales compared to 7.9% in the prior year. Operating income was favorably impacted by a 3% growth in net sales and 10 basis point improvement in gross profit as a percentage of net sales, offset by a 4% increase in operating expenses. Included in operating expenses for 2015 was the $6.7 million asset impairment charge related to Chasing Fireflies.
HSN
HSN's operating income in 2016 decreased $37.3 million to $216.3 million and was 8.7% of net sales compared to 10.0% in the prior year. The decrease was largely due to a 3% decline in net sales and 140 basis point decline in gross profit as a percentage of net sales, partially offset by a $20.1 million decrease in operating expenses. The supply chain optimization implementation issues experienced in the fourth quarter of 2016 resulted in an additional $16 million in costs, which largely impacted gross profit and, to a lesser extent, operating expenses. The decrease in operating expenses was primarily due to a $10.5 million decrease in bad debt expense, a $10.2 million decrease for employee performance-based incentives and lower severance costs of $6.6 million, including $3.2 million in costs accrued in the prior year for the planned closure of HSN's Virginia distribution center and $2.0 million related to the HSN reorganization in the fourth quarter of 2015. These decreases were partially offset by higher on-air distribution costs primarily for HSN2, increased digital marketing expenses and higher consulting costs.
HSN's operating income in 2015 increased $1.5 million to $253.6 million and was 10.0% of net sales compared to 10.2% in the prior year. The increase was due to a 3% increase in net sales, partially offset by a 3% increase in operating expenses. The increase in operating expenses was primarily due to increases in bad debt expenses, employee-related costs, including $1.7 million in stock-based compensation and $5.2 million in severance costs for the planned closure of a distribution center and for the HSN reorganization; and media spend for direct-response television marketing; partially offset by lower net marketing expense and on-air distribution costs.
Cornerstone
Cornerstone had an operating loss of $10.5 million in 2016 compared to operating income of $30.4 million in the prior year. The lower results were largely attributed to a 5% decline in net sales and a 170 basis point decline in gross profit as a percentage of net sales. Included in operating expenses for 2016 was the loss on sale and asset impairment charge of $31.2 million related to the divestitures of TravelSmith and Chasing Fireflies compared to the prior year which included asset impairment charges of $6.7 million. Additionally, operating expenses decreased due to lower catalog and employee-related costs, partially offset by increased costs associated with its expanded retail strategy and digital marketing.
Cornerstone's operating income in 2015 decreased $2.1 million to $30.4 million and was 2.6% of net sales compared to 2.9% in the prior year. The decrease was due to a 3% increase in net sales and 50 basis point increase in gross profit as a percentage of net sales that were offset by an increase in operating expenses. The increase in operating expenses was primarily due to higher employee-related costs; a $6.7 million impairment of intangibles related to Chasing Fireflies; higher catalog costs associated with a 2% increase in circulation; costs associated with its expanded retail strategy; and higher digital marketing expense, partially offset by the prior year's $3.1 million settlement with the Consumer Product Safety Commission.
28
Adjusted EBITDA
Adjusted EBITDA is a non-GAAP measure and is defined in Note 6 of Notes to Consolidated Financial Statements.
Year Ended December 31, | ||||||||||||||||
2016 | Change | 2015 | Change | 2014 | ||||||||||||
(Dollars in thousands) | ||||||||||||||||
HSN | $ | 260,836 | (14)% | $ | 302,881 | 5% | $ | 289,141 | ||||||||
As a percentage of HSN net sales | 10.5 | % | (140 bp) | 11.9 | % | 20 bp | 11.7 | % | ||||||||
Cornerstone | $ | 38,320 | (30)% | $ | 54,561 | 3% | $ | 53,199 | ||||||||
As a percentage of Cornerstone net sales | 3.5 | % | (130 bp) | 4.8 | % | - | 4.8 | % | ||||||||
HSNi | $ | 299,156 | (16)% | $ | 357,442 | 4% | $ | 342,340 | ||||||||
As a percentage of HSNi net sales | 8.4 | % | 130 bp | 9.7 | % | 20 bp | 9.5 | % | ||||||||
HSNi's Adjusted EBITDA in 2016 decreased 16%, or $58.3 million, and was 8.4% of net sales, compared to 9.7% in the prior year. The decrease in Adjusted EBITDA was due to a 3% decrease in net sales and a 150 basis point decline in gross profit as a percentage of net sales offset by a decrease in operating expenses. Operating expenses (excluding certain adjustments identified in the GAAP to Non-GAAP reconciliation included in Note 6 of Notes to Consolidated Financial Statements) decreased 4% and were 25.7% as a percentage of net sales compared to 25.9% in the prior year.
HSNi's Adjusted EBITDA in 2015 increased 4%, or $15.1 million, and was 9.7% of net sales, compared to 9.5% in the prior year. The increase in Adjusted EBITDA was due to a 3% increase in net sales and a 10 basis point increase in gross profit as a percentage of net sales, partially offset by an increase in operating expenses. Operating expenses (excluding certain adjustments identified in the GAAP to Non-GAAP reconciliation included in Note 6 of Notes to Consolidated Financial Statements) increased 3% and were 25.9% of net sales compared to 25.8% in the prior year.
HSN
HSN's Adjusted EBITDA in 2016 decreased 14%, or $42.0 million, and was 10.5% of net sales compared to 11.9% in the prior year. Adjusted EBITDA, which includes the $16 million impact related to the supply chain optimization implementation issues experienced in the fourth quarter of 2016, decreased primarily due to a 3% decrease in net sales and a 140 basis point decline in gross profit as a percentage of net sales, partially offset by a decrease in operating expenses. HSN's operating expenses (excluding certain adjustments identified in the GAAP to Non-GAAP reconciliation included in Note 6 of Notes to Consolidated Financial Statements) decreased 3% and were 22.4% of net sales, consistent with the prior year.
HSN's Adjusted EBITDA in 2015 increased 5%, or $13.7 million, and was 11.9% of net sales compared to 11.7% in the prior year. The increase in Adjusted EBITDA is primarily due to a 3% increase in net sales, partially offset by an increase in operating expenses. Operating expenses (excluding adjustments identified in the GAAP to Non-GAAP reconciliation included in Note 6 of Notes to Consolidated Financial Statements) increased 2% and were 22.4% of net sales compared to 22.6% in the prior year.
Cornerstone
Cornerstone's Adjusted EBITDA in 2016 decreased 30%, or $16.2 million, and was 3.5% of net sales, compared to 4.8% in the prior year. The decrease was due to a 5% decrease in net sales, a 170 basis point decline in gross profit as a percentage of net sales, partially offset by a 6%, or 50 basis point as a percentage of net sales, decrease in operating expenses (excluding certain adjustments identified in the GAAP to Non-GAAP reconciliation in Note 6 of Notes to Consolidated Financial Statements).
Cornerstone's Adjusted EBITDA in 2015 increased 3%, or $1.4 million, and was 4.8% of net sales, consistent with the prior year. The increase was due to a 3% increase in net sales, a 50 basis point increase in gross profit as a percentage of net sales, partially offset by a 5%, or 60 basis point as a percentage of net sales, increase in operating expenses (excluding certain adjustments identified in the GAAP to Non-GAAP reconciliation in Note 6 of Notes to Consolidated Financial Statements).
Other Income (Expense)
29
Year Ended December 31, | ||||||||||||||||
2016 | Change | 2015 | Change | 2014 | ||||||||||||
(Dollars in thousands) | ||||||||||||||||
Interest income | $ | 95 | (30)% | $ | 136 | (26)% | $ | 184 | ||||||||
Interest expense | (16,174 | ) | 6% | (15,316 | ) | 111% | (7,266 | ) | ||||||||
Total other expense, net | $ | (16,079 | ) | 6% | $ | (15,180 | ) | 114% | $ | (7,082 | ) | |||||
As a percentage of HSNi net sales | 0.5 | % | 10 bp | 0.4 | % | 20 bp | 0.2 | % | ||||||||
Interest Expense
Interest expense for the year ended December 31, 2016 increased $0.9 million to $16.2 million compared to the prior year. The increase in interest expense compared to the prior year is due to a higher average outstanding debt balance driven by the funding of a special cash dividend in February 2015 and an increase in the interest rate, partially offset by the write-off of $0.5 million of deferred financing fees in the prior year related to the credit agreement that was terminated in January 2015.
Income Tax Provision
For the years ended December 31, 2016, 2015 and 2014, HSNi recorded tax provisions from continuing operations of $71.0 million, $99.6 million and $104.5 million, respectively, which represent effective tax rates of 37.4%, 37.1% and 37.7%, respectively.
The effective tax rate in 2014 was unfavorably impacted by the non-deductibility of the $3.1 million settlement with the CPSC. Excluding the impact of this item, the 2014 effective tax rate would have been approximately 37%. The effective tax rates in 2016, 2015 and 2014, are higher than the federal statutory rate of 35% due principally to state income taxes.
Liquidity and Capital Resources
As of December 31, 2016, HSNi had $42.7 million of cash and cash equivalents, down from $63.9 million as of December 31, 2015.
Net cash provided by operating activities in 2016 was $236.5 million compared to $203.5 million in 2015, an increase of $33.0 million. The increase was primarily due to primarily due to lower investment in inventories and the timing of accounts payable that were partially offset by higher utilization of HSN's Flexpay offering. There were lower investments in inventories in 2016 driven by the higher than planned inventory levels at the end of 2015. The decrease in inventories as of December 31, 2016 compared to December 31, 2015 was impacted by the divestitures of TravelSmith and Chasing Fireflies in September 2016 which resulted in the sale of approximately $29.3 million of inventories. Cash provided by accounts receivables in 2016 decreased compared to the prior year due to higher utilization and expanded offers of HSN's Flexpay offering in 2016 and the lower outstanding accounts receivable balance at the end of 2015 compared to 2014. HSN expects to continue to use its offering of Flexpay, when appropriate, as a tool to drive profitable revenue growth.
Net cash used in investing activities in 2016 was $42.4 million. Capital expenditures in 2016 were $41.7 million and were primarily for investments in our distribution centers, including our warehouse automation project, information technology, Cornerstone's retail expansion and infrastructure.
Net cash used in financing activities in 2016 was $215.3 million. Net repayments of HSNi's long-term debt during the year, including for the term loan and revolving credit facility, were $125 million. HSNi paid quarterly cash dividends totaling $1.40 per common share in 2016, representing aggregate payments of $73.2 million. HSNi repurchased approximately 357,000 shares of common stock for $16.6 million.
On January 27, 2015, HSNi entered into a $1.25 billion five-year syndicated credit agreement ("Credit Agreement"). The Credit Agreement replaced the prior $600 million credit agreement that was set to expire in April 2017. The Credit Agreement, which includes a $750 million revolving credit facility and a $500 million term loan, may be increased up to $1.75 billion subject to certain conditions and expires January 27, 2020. HSNi drew $500 million from its term loan and $200 million under the revolving credit facility, both under the Credit Agreement, to repay in full its term loan of $228.1 million under the prior credit agreement in January 2015 and to fund the $524 million special cash dividend that was paid February 2015. As of December 31, 2016, total debt of $515.0 million was outstanding.
The Credit Agreement includes various covenants, limitations and events of default customary for similar facilities including a maximum leverage ratio of 3.50x and a minimum interest coverage ratio of 3.00x. HSNi was in compliance with all such covenants as of December 31, 2016 with a leverage ratio of 1.7x and an interest coverage ratio of 20.6x. The Credit
30
Agreement also contains covenants that limit our ability and the ability of our subsidiaries to, among other things, incur additional indebtedness, pay dividends or make other distributions to third parties, repurchase or redeem our stock, make investments, sell assets, incur liens, enter into agreements restricting our subsidiaries' ability to pay dividends, enter into transactions with affiliates and consolidate, merge or sell all or substantially all of our assets. The Credit Agreement also contains provisions that limit the ability of HSNi to make Restricted Payments, defined as cash dividends, distribution of other property, repurchase of the Company’s common stock, prepayment or redemption of debt, etc., however, so long as the Company’s leverage ratio is below 3.00x after giving pro forma effect to any proposed Restricted Payments, the amount of such Restricted Payments are not limited. In the event the Company’s leverage ratio is equal to or greater than 3.00x or after giving pro forma effect to any proposed Restricted Payments, then such Restricted Payments are limited to $150 million in any such fiscal year. The current cash dividend of $1.40 annually per share represents a Restricted Payment of approximately $73.2 million. Dividends, loans or advances to HSNi by its subsidiaries are not restricted by the Credit Agreement.
Loans under the Credit Agreement bear interest at a per annum rate equal to a LIBOR rate plus a predetermined margin that ranges from 1.25% to 2.25% or the Base Rate (as defined in the Credit Agreement) plus a predetermined margin that ranges from 0.25% to 1.25%. HSNi can elect to borrow at either a LIBOR rate or the Base Rate and the predetermined margin is determined by HSNi's leverage ratio. HSNi pays a commitment fee ranging from 0.20% to 0.40% (based on the leverage ratio) on the unused portion of the revolving credit facility.
The amount available under the credit agreements is reduced by the amount of commercial and standby letters of credit issued under the revolving credit facility, which totaled $10.2 million as of December 31, 2016. The ability to draw funds under the revolving credit facility is dependent upon meeting the aforementioned financial covenants, which may limit HSNi’s ability to draw the full amount of the facility. As of December 31, 2016, the additional amount that could be borrowed under the revolving credit facility under the prior credit agreement, in consideration of the financial covenants and outstanding letters of credit, was approximately $522.7 million.
To reduce our future exposure to rising interest rates under our credit facility, we entered into interest rate swaps that effectively convert $187.5 million of our variable rate term loan to a fixed-rate of 0.8525% through April 2017, and then increases to $250.0 million from April 2017 through January 2020 with a fixed rate of 1.05% (in both cases the swapped fixed rate is exclusive of the credit spread under the Credit Agreement). Based on HSNi's leverage ratio as of December 31, 2016, the all-in fixed rate was 2.3525%. For additional information related to our interest rate swap, refer to Note 8 of Notes to Consolidated Financial Statements.
Effective January 27, 2015, HSNi's Board of Directors authorized a new 4 million share repurchase program which allows HSNi to purchase shares of its common stock from time to time through privately negotiated and/or open market transactions. The timing of any repurchases and actual number of shares repurchased depends on a variety of factors, including the stock price, corporate and regulatory requirements, restrictions under HSNi’s debt obligations and other market and economic conditions. During 2016, HSNi repurchased approximately 357,000 shares of common stock at a cost of $16.6 million, or an average cost of $46.45 per share. As of December 31, 2016, approximately 2.7 million shares remain authorized for repurchase under the program.
HSNi anticipates it will need to make capital and other expenditures in connection with the development and expansion of its operations. Our capital expenditures for fiscal 2017 are planned at approximately $60 million and primarily relate to our investments in information technology; Cornerstone's retail store expansion; our distribution centers, including our warehouse automation project; and digital commerce. HSNi’s ability to fund its cash and capital needs will be affected by its ongoing ability to generate cash from operations, the overall capacity and terms of its financing arrangements as discussed above, and access to the capital markets. HSNi believes that its cash on hand, its anticipated operating cash flows, its available unused portion of the revolving credit facility and its access to capital markets will be sufficient to fund its operating needs, capital, investing and other commitments and contingencies for the foreseeable future.
In February 2017, HSNi's Board of Directors approved a cash dividend of $0.35 per common share. The dividend will be paid on March 22, 2017 to HSNi's record holders as of March 8, 2017.
31
Contractual Obligations and Commercial Commitments
The following table presents HSNi’s contractual obligations and commercial commitments as of December 31, 2016:
Payments Due by Period | ||||||||||||||||||||
Contractual Obligations | Total Amounts Committed | Less Than 1 Year | 1 - 3 Years | 3 - 5 Years | More Than 5 Years | |||||||||||||||
(In thousands) | ||||||||||||||||||||
Long-term debt, including current maturities | $ | 515,000 | $ | 25,000 | $ | 75,000 | $ | 415,000 | $ | — | ||||||||||
Interest on debt (a) | 38,282 | 13,466 | 24,476 | 340 | — | |||||||||||||||
Operating leases (b) | 134,944 | 28,391 | 44,938 | 23,401 | 38,214 | |||||||||||||||
Purchase obligations (c) | 40,724 | 29,240 | 11,484 | — | — | |||||||||||||||
Total contractual obligations | $ | 728,950 | $ | 96,097 | $ | 155,898 | $ | 438,741 | $ | 38,214 | ||||||||||
(a) | Includes interest on variable rate debt estimated using the rate in effect as of December 31, 2016, net of the impact of the interest rate swaps. |
(b) | HSNi leases a satellite transponder; warehouse, stores and office space; equipment and services used in connection with its operations under various operating leases, many of which contain escalation clauses. |
(c) | The purchase obligations primarily relate to contracts with pay television operators and include obligations for future cable distribution and commission guarantees. |
Amount of Commitments Expiration Per Period | ||||||||||||||||||||
Commercial Commitments | Total Amounts Committed | Less Than 1 Year | 1 - 3 Years | 3 - 5 Years | More Than 5 Years | |||||||||||||||
(In thousands) | ||||||||||||||||||||
Letters of credit and surety bonds (c) | $ | 13,301 | $ | 13,241 | $ | 60 | $ | — | $ | — | ||||||||||
(c) | The letters of credit (“LOCs”) primarily consist of trade LOCs which are used for inventory purchases. Trade LOCs are guarantees of payment based upon the delivery of goods. The surety bonds primarily consist of custom bonds which relate to the import of merchandise into the United States. |
We issue inventory purchase orders in the normal course of business, which represent authorizations to purchase that are cancelable by their terms. We do not consider purchase orders to be firm inventory commitments; therefore, they are excluded from the table above. If we choose to cancel a purchase order, we may be obligated to reimburse the vendor for unrecoverable outlays incurred prior to cancellation.
At December 31, 2016, we had $5.4 million, including penalties and interest, recorded for uncertain tax positions. We are not able to reasonably estimate the timing of payments in future periods; therefore, the liability of $5.4 million has not been included in the contractual obligations table above.
Off-Balance Sheet Arrangements
Other than the items described above, HSNi does not have any material off-balance sheet arrangements as of December 31, 2016.
Seasonality
HSNi is affected by seasonality, although historically our business has exhibited less seasonality than many other retail businesses. Our sales levels are generally higher in the fourth quarter. Reported revenues in the fourth quarter were 30%, 30% and 31% of total reported annual revenues in 2016, 2015 and 2014, respectively.
32
Non-GAAP Measure
HSNi reports Adjusted EBITDA as a supplemental measure to generally accepted accounting principles ("GAAP"). This measure is one of the primary metrics by which HSNi evaluates the performance of its businesses, on which its internal budgets are based and by which management is compensated. HSNi believes that investors should have access to the same information that it uses in analyzing its results.
Adjusted EBITDA is defined as operating income excluding, if applicable: (1) non-cash charges including: (a) stock-based compensation expense, (b) amortization of intangibles, (c) depreciation and gains and losses on asset dispositions, and (d) goodwill, long-lived asset and intangible asset impairments; (2) pro forma adjustments for significant acquisitions; and (3) other significant items. Significant items, while periodically affecting our results, may vary significantly from period to period and have a disproportionate effect in a given period, thereby affecting the comparability of results. Adjusted EBITDA is not a measure determined in accordance with GAAP, and should not be considered in isolation or as a substitute for operating income, net income or any other measure determined in accordance with GAAP. Adjusted EBITDA is used as a measurement of operating efficiency and overall financial performance and HSNi believes it to be a helpful measure for those evaluating companies in the retail and media industries. Adjusted EBITDA has certain limitations in that it does not take into account the impact to HSNi's consolidated statements of operations of certain expenses, gains and losses; including stock-based compensation, amortization of intangibles, depreciation, gains and losses on asset dispositions, asset impairment charges, acquisition-related accounting and other significant items.
Items That Are Excluded From HSNi's Non-GAAP Measure
The following items are excluded from Adjusted EBITDA, HSNi's Non-GAAP measure:
Stock-based compensation expense consists principally of expense associated with the grants of restricted stock, restricted stock units, stock options and stock appreciation rights. These expenses are not paid in cash, and HSNi includes the related shares in its calculations of diluted shares outstanding. Upon vesting of restricted stock and restricted stock units and the exercise of certain stock options and stock appreciation rights, the awards can be settled, at HSNi's discretion, on a net basis, with HSNi remitting the required tax withholding amount from its current funds.
Amortization of intangibles is a non-cash expense relating primarily to acquisitions. At the time of an acquisition, the intangible assets of the acquired company, such as distribution agreements, customer relationships and merchandise agreements, are recorded at fair value and amortized over their estimated lives.
Depreciation, gains and losses on asset dispositions and long-lived asset impairment charges are non-cash items relating to our long-lived assets.
Goodwill and intangible asset impairment charges are non-cash expenses.
Other Significant Items represent transactions that may vary significantly from period to period and have a disproportionate effect in a given period, thereby affecting the comparability of results.
Reconciliation of Adjusted EBITDA
See Note 6 of Notes to Consolidated Financial Statements for the reconciliation between Adjusted EBITDA and net income for the years ended December 31, 2016, 2015 and 2014.
Critical Accounting Policies and Estimates
The following disclosure is provided to supplement the descriptions of HSNi's accounting policies contained in Note 2 of Notes to Consolidated Financial Statements in regard to significant areas of judgment. HSNi's management is required to make certain estimates and assumptions during the preparation of its consolidated financial statements in accordance with GAAP. These estimates and assumptions impact the reported amount of assets and liabilities and disclosures of contingent assets and liabilities as of the date of the consolidated financial statements. They also impact the reported amount of net income during any period. Actual results could differ from those estimates. Because of the size of the financial statement elements to which they relate, some of HSNi's accounting policies and estimates have a more significant impact on its consolidated financial statements than others. The following is a discussion of some of HSNi's more significant accounting policies and estimates.
33
Recoverability of Long-Lived Assets
HSNi reviews the carrying value of all long-lived assets, primarily property and equipment and definite-lived intangible assets, for impairment whenever triggering events or changes in circumstances indicate that the carrying value of an asset may be impaired. Impairment is considered to have occurred whenever the carrying value of a long-lived asset exceeds the sum of the undiscounted cash flows that is expected to result from the use and eventual disposition of the asset. The impairment is measured by comparing the fair value of the asset to its carrying value. Our valuation methodologies include, but are not limited to, discounting the future cash flows from the asset being tested. Significant judgments include determining if a triggering event has occurred, determining the future cash flows from the assets and applying the appropriate discount rate when measuring the fair value. The determination of cash flows is based upon assumptions that may not occur.
Impairment of Goodwill and Indefinite-Lived Intangible Assets
HSNi assesses the impairment of goodwill and identifiable indefinite-lived intangible assets, principally trademarks and trade names, at least annually during the fourth quarter and whenever events or changes in circumstances indicate that the carrying value of an asset may be impaired. In performing this review, HSNi has the option of performing a qualitative assessment to determine whether it is more likely than not that the fair values of the reporting unit and/or indefinite-lived intangible assets are less than the carrying values. In performing the qualitative assessment, HSNi considers various factors including (but not limited to): macroeconomic, industry and market conditions; cost factors affecting the business; the overall financial performance of the business; any relevant changes in management, strategies or customers; and any sustained decreases in its stock price. If HSNi determines based on this assessment that it is not more likely that the fair value is less than its carrying value, then the goodwill and/or the indefinite-lived intangible assets are deemed to be not impaired and no further testing is required until the next annual test date (or sooner if conditions or events before that date raise concerns of potential impairment in the business). If HSNi determines that it is more likely than not that the fair value is less than its carrying value, then the quantitative goodwill and/or indefinite-lived intangible asset impairment tests must be completed.
If necessary, HSNi performs a quantitative assessment of the fair values of its goodwill and intangible assets. In performing this review, HSNi is required to make an assessment of the fair value of its intangible assets. If it is determined that the implied fair value of goodwill and/or indefinite-lived intangible assets is less than the carrying amount, an impairment charge, equal to the excess, is recorded. HSNi determines the fair value of its reporting units by using a discounted cash flow analysis with consideration of an equity analysis based on the trading value of its common stock. HSNi utilizes the relief from royalty method to assess fair values of its trademarks and trade names.
In assessing fair value, HSNi considers, among other indicators, differences between estimated and actual cash flows and revenue streams and changes in the related discount, royalty and terminal growth rates. Determining these rates requires the exercise of significant judgments. These factors used in the determination of fair value are sensitive to, among other things, changes in the retail consumer market and the general economy.
Returns Reserves
Net sales from HSNi primarily consist of merchandise sales and are reduced by incentive discounts and sales returns. HSNi's sales policy allows customers to return virtually all merchandise for a full refund or exchange, subject to pre-established time restrictions. Allowances for returned merchandise and other adjustments (including reimbursed shipping and handling costs) are provided based upon past experience. Actual levels of product returns may vary from these estimates. HSNi's estimated return rates were 15.3%, 15.9% and 16.3% in 2016, 2015 and 2014, respectively.
Allowance for Doubtful Accounts
HSNi makes judgments as to its ability to collect outstanding receivables and provide allowances when it has determined that all or a portion of the receivable will not be collected. HSNi determines its allowance by considering a number of factors, including the length of time accounts receivable are past due, its previous loss history and the condition of the general economy. HSNi writes off accounts receivable when they are determined to be uncollectible.
34
Income Taxes
Estimates of deferred income taxes and the significant items giving rise to the deferred tax assets and liabilities are shown in Note 12 of Notes to Consolidated Financial Statements, and reflect management's assessment of actual future taxes to be paid on items reflected in the consolidated financial statements, giving consideration to both timing and the probability of realization. Actual income taxes could vary from these estimates due to future changes in income tax law, state income tax apportionment, as well as actual operating results of HSNi that vary significantly from anticipated results. Valuation allowances are related to items for which it is more likely than not that the tax benefit will not be realized. In assessing the adequacy of a recorded valuation allowance, we consider all positive and negative information and a variety of factors including the scheduled reversal of deferred tax liabilities, historical and projected future taxable income and feasible tax planning strategies. HSNi recognizes liabilities for uncertain tax positions based on a two-step process. The first step is to evaluate the tax position for recognition by determining if the weight of available evidence indicates it is more likely than not that the position will be sustained on its technical merits. The second step is to measure the tax benefit as the largest amount which is more than 50% likely of being realized upon ultimate settlement. This measurement step is inherently difficult and requires subjective estimations of such amounts to determine the probability of various possible outcomes. HSNi considers many factors when evaluating and estimating its tax positions and tax benefits, which may require periodic adjustments and which may not accurately anticipate actual outcomes.
Inventory Valuation
Inventories are valued at the lower of cost or market, cost being determined based upon the first-in, first-out method. Market is determined on the basis of net realizable value, giving consideration to obsolescence and other factors. Net realizable value is estimated by HSNi based upon historical sales data, the age of inventory, the quantity of goods on hand and the ability to return merchandise to vendors. The actual net realizable value may vary from estimates due to changes in customer tastes or viewing habits, or judgmental decisions made by merchandising personnel when ordering new products.
Stock-Based Compensation
We measure compensation cost for stock-based awards at fair value and recognize compensation over the service period for awards expected to vest. We consider many factors when estimating expected forfeitures, including types of awards, employee class and historical experience. HSNi grants performance-based equity awards whose value is based on the extent to which certain pre-established performance goals are achieved during a three-year period. Each reporting period prior to the vesting of these awards, management must apply significant judgment when estimating the expected future achievement of the designated performance metrics. The estimation of stock awards that will ultimately vest and the estimation of the value of the performance-based awards require judgment, and to the extent actual results or updated estimates differ from our current estimates, such amounts will be recorded as a cumulative adjustment in the period estimates are revised. The fair value of restricted stock units is determined based on the number of shares granted and the closing price of our common stock at the grant date. The fair value of stock options, stock appreciation rights and options granted under our employee stock purchase plan are estimated on the grant date using the Black-Scholes option pricing model. This model incorporates various assumptions, including expected volatility and expected term. Expected stock price volatilities are estimated based on HSNi's historical experience and the historical and implied volatilities of comparable publicly-traded companies. The expected term of awards granted is based on analyses of historical employee termination rates and option exercise patterns, giving consideration to expectations of future employee behavior. HSNi also grants equity awards with market conditions. The fair value for these awards is determined by applying a Monte Carlo simulation pricing model. Actual results and future estimates may differ substantially from our current estimates.
ITEM 7A. | QUANTITATIVE AND QUALITATIVE DISCLOSURES ABOUT MARKET RISK |
At December 31, 2016 and 2015, HSNi’s outstanding long-term debt was $515.0 million and $640.0 million, respectively, all of which pays interest at a variable rate, generally tied to LIBOR. Changes in interest rates on our variable rate debt could affect our earnings. We are managing our future interest rate exposure through interest rate swaps with notional amounts of $187.5 million through April 2017 at a fixed rate of 0.8525% and $250.0 million from April 2017 through January 2020 at a fixed rate of 1.05%. A hypothetical 100 basis point increase in interest rates on the portion of our variable rate debt that was outstanding as of December 31, 2016 and that was not effectively hedged by the fixed-rate interest rate swaps would increase our annual interest expense by approximately $2.9 million in 2017.
35
ITEM 8. | FINANCIAL STATEMENTS AND SUPPLEMENTARY DATA |
Index to Consolidated Financial Statements
Page | |
36
Report of Independent Registered Certified Public Accounting Firm
The Board of Directors and Shareholders of HSN, Inc.
We have audited the accompanying consolidated balance sheets of HSN, Inc. and subsidiaries as of December 31, 2016 and 2015, and the related consolidated statements of operations, comprehensive income, shareholders’ equity, and cash flows for each of the three years in the period ended December 31, 2016. Our audits also included the financial statement schedule listed in the Index as Schedule II. These financial statements and the financial statement schedule are the responsibility of the Company’s management. Our responsibility is to express an opinion on these financial statements and the financial statement schedule based on our audits.
We conducted our audits in accordance with the standards of the Public Company Accounting Oversight Board (United States). Those standards require that we plan and perform the audit to obtain reasonable assurance about whether the financial statements are free of material misstatement. An audit includes examining, on a test basis, evidence supporting the amounts and disclosures in the financial statements. An audit also includes assessing the accounting principles used and significant estimates made by management, as well as evaluating the overall financial statement presentation. We believe that our audits provide a reasonable basis for our opinion.
In our opinion, the financial statements referred to above present fairly, in all material respects, the consolidated financial position of HSN, Inc. and subsidiaries at December 31, 2016 and 2015, and the consolidated results of their operations and their cash flows for each of the three years in the period ended December 31, 2016, in conformity with U.S. generally accepted accounting principles. Also, in our opinion, the related financial statement schedule, when considered in relation to the basic consolidated financial statements taken as a whole, presents fairly in all material respects the information set forth therein.
We also have audited, in accordance with the standards of the Public Company Accounting Oversight Board (United States), HSN, Inc. and subsidiaries’ internal control over financial reporting as of December 31, 2016, based on criteria established in Internal Control - Integrated Framework issued by the Committee of Sponsoring Organizations of the Treadway Commission (2013 framework) and our report dated February 24, 2017, expressed an unqualified opinion thereon.
/s/ Ernst & Young LLP
Tampa, Florida
February 24, 2017
37
HSN, INC. AND SUBSIDIARIES
CONSOLIDATED STATEMENTS OF OPERATIONS
(In thousands, except per share data)
Years Ended December 31, | ||||||||||||
2016 | 2015 | 2014 | ||||||||||
Net sales | $ | 3,567,485 | $ | 3,690,575 | $ | 3,587,995 | ||||||
Cost of sales | 2,350,817 | 2,376,012 | 2,314,933 | |||||||||
Gross profit | 1,216,668 | 1,314,563 | 1,273,062 | |||||||||
Operating expenses: | ||||||||||||
Selling and marketing | 743,468 | 763,070 | 737,424 | |||||||||
General and administrative | 193,449 | 217,381 | 207,095 | |||||||||
Depreciation and amortization | 42,712 | 43,418 | 43,934 | |||||||||
Loss on sale of businesses and asset impairments | 31,232 | 6,660 | — | |||||||||
Total operating expenses | 1,010,861 | 1,030,529 | 988,453 | |||||||||
Operating income | 205,807 | 284,034 | 284,609 | |||||||||
Other income (expense): | ||||||||||||
Interest income | 95 | 136 | 184 | |||||||||
Interest expense | (16,174 | ) | (15,316 | ) | (7,266 | ) | ||||||
Total other expense, net | (16,079 | ) | (15,180 | ) | (7,082 | ) | ||||||
Income before income taxes | 189,728 | 268,854 | 277,527 | |||||||||
Income tax provision | (71,020 | ) | (99,615 | ) | (104,543 | ) | ||||||
Net income | $ | 118,708 | $ | 169,239 | $ | 172,984 | ||||||
Net income per share: | ||||||||||||
Basic | $ | 2.27 | $ | 3.22 | $ | 3.28 | ||||||
Diluted | $ | 2.25 | $ | 3.16 | $ | 3.23 | ||||||
Shares used in computing earnings per share: | ||||||||||||
Basic | 52,359 | 52,627 | 52,736 | |||||||||
Diluted | 52,863 | 53,505 | 53,633 | |||||||||
Dividends declared per common share | $ | 1.40 | $ | 11.40 | $ | 1.10 | ||||||
The accompanying notes are an integral part of these consolidated financial statements.
38
HSN, INC. AND SUBSIDIARIES
CONSOLIDATED STATEMENTS OF COMPREHENSIVE INCOME
(In thousands)
Years Ended December 31, | ||||||||||||
2016 | 2015 | 2014 | ||||||||||
Net income | $ | 118,708 | $ | 169,239 | $ | 172,984 | ||||||
Other comprehensive income (loss), net of tax: | ||||||||||||
Change in fair value of derivative instruments | 2,315 | (222 | ) | (227 | ) | |||||||
Other comprehensive income (loss), net of tax | 2,315 | (222 | ) | (227 | ) | |||||||
Comprehensive income | $ | 121,023 | $ | 169,017 | $ | 172,757 | ||||||
The accompanying notes are an integral part of these consolidated financial statements.
39
HSN, INC. AND SUBSIDIARIES
CONSOLIDATED BALANCE SHEETS
(In thousands, except share data)
December 31, | ||||||||
2016 | 2015 | |||||||
ASSETS | ||||||||
Current assets: | ||||||||
Cash and cash equivalents | $ | 42,734 | $ | 63,926 | ||||
Accounts receivable, net of allowance of $19,086 and $20,631, respectively | 335,005 | 306,575 | ||||||
Inventories | 391,106 | 428,025 | ||||||
Prepaid expenses and other current assets | 44,173 | 45,402 | ||||||
Total current assets | 813,018 | 843,928 | ||||||
Property and equipment, net | 211,106 | 211,793 | ||||||
Intangible assets, net | 253,623 | 255,268 | ||||||
Goodwill | 9,858 | 9,858 | ||||||
Other non-current assets | 16,928 | 13,724 | ||||||
TOTAL ASSETS | $ | 1,304,533 | $ | 1,334,571 | ||||
LIABILITIES AND SHAREHOLDERS’ EQUITY | ||||||||
Current liabilities: | ||||||||
Accounts payable, trade | $ | 293,816 | $ | 254,704 | ||||
Current maturities of long-term debt | 25,000 | 25,000 | ||||||
Accrued expenses and other current liabilities | 225,265 | 235,042 | ||||||
Total current liabilities | 544,081 | 514,746 | ||||||
Long-term debt, less current maturities and net of unamortized deferred financing costs | 484,878 | 608,108 | ||||||
Deferred income taxes | 59,760 | 44,498 | ||||||
Other long-term liabilities | 20,328 | 20,657 | ||||||
Total liabilities | 1,109,047 | 1,188,009 | ||||||
Commitments and contingencies (Note 13) | ||||||||
Shareholders' Equity | ||||||||
Preferred stock $0.01 par value; 25,000,000 authorized shares; no issued shares | — | — | ||||||
Common stock $0.01 par value; 300,000,000 authorized shares; 52,239,795 and 52,377,798 issued shares at December 31, 2016 and 2015, respectively | 522 | 524 | ||||||
Additional paid-in capital | 1,013,688 | 1,085,785 | ||||||
Accumulated deficit | (820,944 | ) | (939,652 | ) | ||||
Accumulated other comprehensive income | 2,220 | (95 | ) | |||||
Total shareholders’ equity | 195,486 | 146,562 | ||||||
TOTAL LIABILITIES AND SHAREHOLDERS’ EQUITY | $ | 1,304,533 | $ | 1,334,571 | ||||
The accompanying notes are an integral part of these consolidated financial statements.
40
HSN, INC. AND SUBSIDIARIES
CONSOLIDATED STATEMENTS OF SHAREHOLDERS’ EQUITY
(In thousands)
Preferred Stock | Common Stock | Additional Paid-in Capital | Accumulated Deficit | Accumulated Other Comprehensive (Loss) Income | Total | |||||||||||||||||||||||||
Shares | Amount | Shares | Amount | |||||||||||||||||||||||||||
Balance as of December 31, 2013 | — | $ | — | 53,002 | $ | 530 | $ | 1,810,072 | $ | (1,281,875 | ) | $ | 354 | $ | 529,081 | |||||||||||||||
Net income | — | — | — | — | — | 172,984 | — | 172,984 | ||||||||||||||||||||||
Other comprehensive income | — | — | — | — | — | — | (227 | ) | (227 | ) | ||||||||||||||||||||
Stock-based compensation expense for equity awards | — | — | — | — | 15,606 | — | — | 15,606 | ||||||||||||||||||||||
Cash dividend declared on common stock | — | — | — | — | (57,824 | ) | — | — | (57,824 | ) | ||||||||||||||||||||
Issuance of common stock from stock-based compensation awards, including tax benefit of $8,293 | — | — | 435 | 4 | (1,816 | ) | — | — | (1,812 | ) | ||||||||||||||||||||
Repurchases of common stock | — | — | (1,011 | ) | (10 | ) | (55,457 | ) | — | — | (55,467 | ) | ||||||||||||||||||
Balance as of December 31, 2014 | — | — | 52,426 | 524 | 1,710,581 | (1,108,891 | ) | 127 | 602,341 | |||||||||||||||||||||
Net income | — | — | — | — | — | 169,239 | — | 169,239 | ||||||||||||||||||||||
Other comprehensive loss | — | — | — | — | — | — | (222 | ) | (222 | ) | ||||||||||||||||||||
Stock-based compensation expense for equity awards | — | — | — | — | 18,408 | — | — | 18,408 | ||||||||||||||||||||||
Cash dividend declared on common stock | — | — | — | — | (597,864 | ) | — | — | (597,864 | ) | ||||||||||||||||||||
Issuance of common stock from stock-based compensation awards, including tax benefit of $12,526 | — | — | 900 | 9 | 13,161 | — | — | 13,170 | ||||||||||||||||||||||
Repurchases of common stock | — | — | (948 | ) | (9 | ) | (58,501 | ) | — | — | (58,510 | ) | ||||||||||||||||||
Balance as of December 31, 2015 | — | — | 52,378 | 524 | 1,085,785 | (939,652 | ) | (95 | ) | 146,562 | ||||||||||||||||||||
Net income | — | — | — | — | — | 118,708 | — | 118,708 | ||||||||||||||||||||||
Other comprehensive loss | — | — | — | — | — | — | 2,315 | 2,315 | ||||||||||||||||||||||
Stock-based compensation expense for equity awards | — | — | — | — | 19,233 | — | — | 19,233 | ||||||||||||||||||||||
Cash dividend declared on common stock | — | — | — | — | (73,151 | ) | — | — | (73,151 | ) | ||||||||||||||||||||
Issuance of common stock from stock-based compensation awards, including tax effect of $658 | — | — | 219 | 2 | (1,616 | ) | — | — | (1,614 | ) | ||||||||||||||||||||
Repurchases of common stock | — | — | (357 | ) | (4 | ) | (16,563 | ) | — | — | (16,567 | ) | ||||||||||||||||||
Balance as of December 31, 2016 | — | $ | — | 52,240 | $ | 522 | $ | 1,013,688 | $ | (820,944 | ) | $ | 2,220 | $ | 195,486 | |||||||||||||||
The accompanying notes are an integral part of these consolidated financial statements.
41
HSN, INC. AND SUBSIDIARIES
CONSOLIDATED STATEMENTS OF CASH FLOWS
(In thousands)
The accompanying notes are an integral part of these consolidated financial statements.
Years Ended December 31, | ||||||||||||
2016 | 2015 | 2014 | ||||||||||
Cash flows from operating activities: | ||||||||||||
Net income | $ | 118,708 | $ | 169,239 | $ | 172,984 | ||||||
Adjustments to reconcile net income to net cash provided by operating activities: | ||||||||||||
Depreciation and amortization | 42,712 | 43,418 | 43,934 | |||||||||
Stock-based compensation expense | 19,233 | 18,408 | 15,606 | |||||||||
Loss on sale of businesses and asset impairments | 27,768 | 6,660 | — | |||||||||
Amortization of debt issuance costs | 1,770 | 1,700 | 1,107 | |||||||||
Deferred income taxes | 13,851 | (10,710 | ) | (2,045 | ) | |||||||
Bad debt expense | 22,768 | 34,012 | 23,986 | |||||||||
Excess tax benefits from stock-based awards | (324 | ) | (13,011 | ) | (8,397 | ) | ||||||
Other | 11 | 231 | 48 | |||||||||
Changes in current assets and liabilities: | ||||||||||||
Accounts receivable | (51,727 | ) | (22,804 | ) | (76,654 | ) | ||||||
Inventories | 7,630 | (29,319 | ) | (71,386 | ) | |||||||
Prepaid expenses and other assets | (2,696 | ) | (3,101 | ) | 2,243 | |||||||
Accounts payable, accrued expenses and other current liabilities | 36,814 | 8,805 | 37,285 | |||||||||
Net cash provided by operating activities | 236,518 | 203,528 | 138,711 | |||||||||
Cash flows from investing activities: | ||||||||||||
Capital expenditures | (41,742 | ) | (60,692 | ) | (47,316 | ) | ||||||
Other | (619 | ) | (1,428 | ) | (320 | ) | ||||||
Net cash used in investing activities | (42,361 | ) | (62,120 | ) | (47,636 | ) | ||||||
Cash flows from financing activities: | ||||||||||||
Borrowing under term loan | — | 500,000 | — | |||||||||
Repayments of long-term debt | (25,000 | ) | (228,125 | ) | (12,500 | ) | ||||||
Borrowings under revolving credit facility | 162,000 | 280,000 | — | |||||||||
Repayments of revolving credit facility | (262,000 | ) | (140,000 | ) | — | |||||||
Payments of debt issuance costs | — | (6,624 | ) | — | ||||||||
Repurchase of common stock | (16,567 | ) | (58,510 | ) | (55,467 | ) | ||||||
Cash dividends paid | (73,151 | ) | (597,864 | ) | (57,824 | ) | ||||||
Proceeds from issuance of common stock | 2,369 | 17,387 | 2,599 | |||||||||
Tax withholdings related to stock-based awards | (3,324 | ) | (16,742 | ) | (12,707 | ) | ||||||
Excess tax benefits from stock-based awards | 324 | 13,011 | 8,397 | |||||||||
Net cash used in financing activities | (215,349 | ) | (237,467 | ) | (127,502 | ) | ||||||
Total cash used in continuing operations | (21,192 | ) | (96,059 | ) | (36,427 | ) | ||||||
Total cash used in discontinued operations | — | — | (21 | ) | ||||||||
Net decrease in cash and cash equivalents | (21,192 | ) | (96,059 | ) | (36,448 | ) | ||||||
Cash and cash equivalents at beginning of period | 63,926 | 159,985 | 196,433 | |||||||||
Cash and cash equivalents at end of period | $ | 42,734 | $ | 63,926 | $ | 159,985 | ||||||
42
NOTES TO CONSOLIDATED FINANCIAL STATEMENTS
NOTE 1—ORGANIZATION
Company Overview
HSN, Inc. (“HSNi”) is an interactive multi-channel retailer that markets and sells a wide range of third party and proprietary merchandise directly to consumers through various platforms including (i) television home shopping programming broadcast on the HSN television networks and other direct-response television marketing; (ii) catalogs, consisting primarily of the Cornerstone portfolio of leading print catalogs which includes, Ballard Designs, Frontgate, Garnet Hill, Grandin Road, and Improvements; (iii) websites, which consist primarily of HSN.com, joymangano.com and the five branded websites operated by Cornerstone; (iv) mobile devices; (v) retail and outlet stores; and (vi) wholesale distribution of certain proprietary products to other retailers. HSNi’s television home shopping business, related digital sales, outlet stores and wholesale distribution are referred to herein as “HSN” and all catalog operations, including related digital sales and stores, are collectively referred to herein as “Cornerstone.” Chasing Fireflies and TravelSmith, two of the apparel brands in the Cornerstone portfolio, were sold in September 2016. See Note 20 for further discussion.
HSN offerings primarily consist of jewelry, fashion (apparel & accessories), beauty & health (including beauty, wellness and fitness), and home & other (including home, electronics, culinary and other). Merchandise offered by Cornerstone primarily consists of home furnishings (including indoor/outdoor furniture, home décor, tabletop, textiles and other home related goods) and apparel & accessories.
Basis of Presentation
HSNi was incorporated in Delaware in May 2008 in connection with the spin-off of several businesses previously owned by IAC/InterActiveCorp ("IAC"). The spin-off from IAC ("Spin-off") occurred August 20, 2008 and in connection with the Spin-off, HSNi's shares began trading on the NASDAQ Global Select Market under the symbol “HSNI.”
The consolidated financial statements include the accounts of HSN, Inc. and its subsidiaries. Intercompany accounts and transactions have been eliminated.
Recent Accounting Developments
Recently Adopted Accounting Standard Updates
In April 2015, the Financial Accounting Standards Board ("FASB") issued Accounting Standards Update ("ASU") No. 2015-03, Interest - Imputation of Interest (Subtopic 835-30) - Simplifying the Presentation of Debt Issuance Costs ("ASU 2015-03"). ASU 2015-03 simplifies the presentation of debt issuance costs by requiring debt issuance costs to be presented as a deduction from the corresponding debt liability. The new standard is limited to the presentation of debt issuance costs and does not affect their recognition and measurement. ASU 2015-03 is effective for periods beginning after December 15, 2015, including interim periods within that annual period. HSNi retrospectively adopted ASU 2015-03 in the first quarter of 2016 resulting in the reclassification of its debt issuance costs from "Other non-current assets" to a deduction from "Long-term debt, less current maturities and net of unamortized deferred financing costs" in the consolidated balance sheets. See Note 7 for additional information regarding the deferred issuance costs.
In April 2015, the FASB issued ASU No. 2015-05, Customer's Accounting for Fees Paid in a Cloud Computing Arrangement ("ASU 2015-05"), which provides guidance to customers about whether a cloud computing arrangement includes a software license. If a cloud computing arrangement includes a software license, the customer should account for the software license element of the arrangement consistent with the acquisition of other software licenses. If the arrangement does not include a software license, the customer should account for a cloud computing arrangement as a service contract. HSNi prospectively adopted ASU 2015-05 on January 1, 2016 and applies this guidance to all arrangements entered into or materially modified after the effective date.
In August 2016, the FASB issued ASU No. 2016-15, Statement of Cash Flows (Topic 230) ("ASU 2016-15"). The standard is intended to reduce the diversity in practice around how certain transactions are classified within the statement of cash flows. ASU 2016-15 is effective for HSNi beginning in fiscal 2019. Early adoption is permitted with retrospective application. HSNi adopted ASU 2016-15 retrospectively in the fourth quarter of 2016. Adoption of this guidance did not have a material impact on HSNi's financial statements or disclosures.
43
Accounting Standard Updates Not Yet Adopted
In May 2014, the FASB issued ASU No. 2014-09, Revenue from Contracts with Customers ("ASU 2014-09"). ASU 2014-09 outlines a single comprehensive model for entities to use in accounting for revenue arising from contracts with customers and supersedes most current revenue recognition guidance, including industry-specific guidance. The core principle of the revenue model is that revenue is recognized when a customer obtains control of a good or service. A customer obtains control when it has the ability to direct the use of and obtain the benefits from the good or service. Additionally, ASU 2014-09 will disallow the capitalization of direct-response advertising costs which will impact the timing of recognition of Cornerstone's catalog production and distribution costs. In July 2015, the FASB approved a one-year deferral of the effective date of ASU 2014-09. This standard will now become effective for HSNi in the first quarter of 2018. Early adoption is permitted in the first quarter of 2017.
In 2015, HSNi established an implementation team (“team”) to assess the overall impact the adoption of ASU 2014-09 will have on its consolidated financial statements, processes, systems and controls. The team is in the process of developing its conclusions and assessing the impact of several aspects of the standard including principal versus agent considerations, identification of performance obligations and the determination of when control of goods transfers to the company’s customers. HSNi will adopt ASU 2014-09 on January 1, 2018. HSNi is still evaluating the accounting, transition method and disclosure requirements.
In July 2015, the FASB issued ASU No. 2015-11, Simplifying the Measurement of Inventory (Topic 330) ("ASU 2015-11"). The amendments, which apply to inventory that is measured using any method other than the last-in, first-out (LIFO) or retail inventory method, require that entities measure inventory at the lower of cost or net realizable value. ASU 2015-11 is effective for fiscal years, and interim periods within those years, beginning after December 15, 2016 and should be applied on a prospective basis; however, early adoption is permitted. HSNi will adopt ASU 2015-11 on January 1, 2017. HSNi does not expect ASU 2015-11 to have a material impact to its consolidated financial statements.
In February 2016, the FASB issued ASU No. 2016-02, Leases ("ASU 2016-02"). ASU 2016-02 requires lessees to reflect most leases on their balance sheet as assets and obligations. The effective date for the standard is for interim and annual reporting periods beginning after December 15, 2018. Early adoption is permitted. The standard is to be applied on a modified retrospective method. HSNi is currently assessing the timing of adoption of ASU 2016-02 and the impact it will have on its consolidated financial statements and related disclosures.
In March 2016, the FASB issued ASU No. 2016-09, Compensation-Stock Compensation (Topic 718) ("ASU 2016-09"). This standard makes several modifications to Topic 718 related to the accounting for forfeitures, employer tax withholding on share-based compensation and the financial statement presentation of excess tax benefits or deficiencies. ASU 2016-09 also clarifies the statement of cash flows presentation for certain components of share-based awards. The effective date for the standard is for interim and annual reporting periods beginning after December 15, 2016. Early adoption is permitted. HSNi will adopt ASU 2016-09 on January 1, 2017. HSNi has elected to continue estimating forfeitures each period rather than record them as they occur. Additionally, ASU 2016-09 could cause volatility in HSNi's future effective tax rates and diluted earnings per share due to the tax effects related to share-based payments being recorded to the statement of operations. The volatility in future periods will depend on HSNi's stock price when the awards vest and/or are exercised.
In January 2017, the FASB issued ASU No. 2017-04, Intangibles - Goodwill and Other (Topic 350) ("ASU 2017-04"). ASU 2017-04 simplifies the subsequent measurement of goodwill by removing the second step of the two-step impairment test. ASU No. 2017-04 is effective for HSNi in the first quarter of 2020, with early adoption permitted on or after January 1, 2017, and is to be applied on a prospective basis. The adoption of the provisions of ASU No. 2017-04 would not materially impact HSNi's consolidated financial position or results of operations unless the first step of the annual goodwill impairment test fails.
Fiscal Year
HSNi’s consolidated financial results are reported on a calendar year basis ending on December 31. HSN’s reporting period is the same as HSNi. Cornerstone has a 4-4-5 week accounting cycle with the fiscal year ending on the Saturday on or immediately preceding December 31. Cornerstone’s 2016 fiscal year included 53 weeks while 2015 and 2014 each included 52 weeks.
44
Reclassifications
Reclassifications were made to prior period amounts to conform to the current year's presentation. Changes included the reclassification of certain operating expenses in the consolidated statement of operations to conform to the current year's presentation and deferred financing costs in the consolidated balance sheets due to the implementation of ASU 2015-3.
NOTE 2—SUMMARY OF SIGNIFICANT ACCOUNTING POLICIES
Revenue Recognition
Revenue primarily consists of merchandise sales and is reduced by incentive discounts and sales returns to arrive at net sales. Revenue is recorded when delivery to the customer has occurred. Delivery is considered to have occurred when the customer takes title and assumes the risks and rewards of ownership, which is on the date of shipment. HSNi's sales policy allows customers to return merchandise for a full refund or exchange, subject to pre-established time restrictions. Allowances for returned merchandise and other adjustments (including reimbursed shipping and handling costs) are provided based upon past experience. Actual returns of product sales have not materially varied from estimates in any of the periods presented. HSNi's estimated return rates were 15.3%, 15.9%, and 16.3% in 2016, 2015, and 2014, respectively. Sales taxes collected are not included in revenue.
HSN issues customer credits primarily for products returned outside of HSN’s normal return policy. Revenues from these credits are recognized when (1) redeemed by the customer, or (2) it is determined that it is not probable the Company has an obligation to escheat the value of the unredeemed credit to relevant jurisdictions and the likelihood of the credit being redeemed by the customer is remote (“breakage”). During the year ended December 31, 2014, the Company recognized $5.0 million of revenue for customer credit breakage. This was the first period during which the Company recognized customer credit breakage and, therefore, it included breakage income related to customer credits issued since inception of this program. Customer credit breakage recognized for the years ended December 31, 2016 and 2015 were $2.3 million and $0.5 million, respectively. Customer credit breakage is estimated based upon an analysis of actual historical redemption patterns and is included in "Net sales" in the accompanying consolidated statements of operations.
Shipping and Handling Fees and Costs
Shipping and handling fees billed to customers are recorded as revenue. The costs associated with shipping goods to customers are recorded as cost of sales.
Cash and Cash Equivalents
Cash and cash equivalents include cash and money market instruments with an original maturity of three months or less when purchased and are stated at cost.
Accounts Receivable
Accounts receivable are principally comprised of amounts due from customers and credit card companies, net of an allowance for doubtful accounts. HSNi accepts most credit and select debit cards. HSN provides extended payment terms to its qualified customers known as Flexpay. Revenue is recorded when delivery to the customer has occurred, at which time HSN collects the first payment, sales tax and all shipping and handling fees. Subsequent collections are due from customers in 30-day increments, payable automatically upon authorization of the customer’s method of payment. HSN offers Flexpay programs ranging from two to six interest-free monthly payments. Flexpay receivables consist of outstanding balances owed by customers, less a reserve for uncollectible balances.
The balance of accounts receivable, net of allowances, is as follows (in thousands):
December 31, | ||||||||
2016 | 2015 | |||||||
Flexpay and other customer-related | $ | 281,780 | $ | 260,197 | ||||
Credit card companies | 27,101 | 19,248 | ||||||
Other | 26,124 | 27,130 | ||||||
Accounts receivable, net | $ | 335,005 | $ | 306,575 | ||||
45
Accounts receivable outstanding longer than the contractual payment terms are considered past due. HSNi determines its allowance by considering a number of factors, including the length of time accounts receivable are past due, HSNi’s previous loss history and the condition of the general economy. HSNi writes off accounts receivable when they are deemed uncollectible.
Inventories
Inventories, which primarily consist of finished goods, are valued at the lower of cost or market, with the cost being determined based upon the first-in, first-out method. Cost includes inbound freight and duties and, in the case of HSN, certain allocable costs, including certain warehouse costs. Inventories include approximately $7.2 million and $6.9 million of these allocable general and administrative overhead costs at December 31, 2016 and 2015, respectively, and approximately $25.7 million, $25.2 million, and $24.0 million of such costs were included in the accompanying consolidated statements of operations for the years ended December 31, 2016, 2015 and 2014, respectively. Market is determined on the basis of net realizable value, giving consideration to obsolescence and other factors.
Property and Equipment
Property and equipment, including significant improvements, are recorded at cost. Repairs and maintenance and any gains or losses on dispositions are included in the consolidated statement of operations.
Depreciation is recorded on a straight-line basis to allocate the cost of depreciable assets to operations over the shorter of the estimated service life or lease period.
Asset Category | Depreciation Period |
Computer and broadcast equipment and capitalized software | 3 to 20 Years |
Buildings, leasehold improvements and land improvements | 3 to 40 Years |
Furniture and other equipment | 2 to 30 Years |
HSNi capitalizes certain qualified costs incurred in connection with the development of internal use software. Capitalization of internal use software costs begins when the preliminary project stage is completed; management with the relevant authority authorizes and commits to the funding of the software project; and it is probable that the project will be completed and the software will be used to perform the function intended. Capitalized internal use software is amortized on a straight-line basis over the estimated useful life of the software. Capitalized software costs, net of accumulated amortization, totaled $36.3 million and $32.8 million at December 31, 2016 and 2015, respectively, and are included in “Property and equipment, net” in the accompanying consolidated balance sheets. Amortization expense related to the capitalized software costs was $19.2 million, $18.9 million and $18.3 million for the years ended December 31, 2016, 2015 and 2014, respectively, and is included in "Depreciation and amortization" expense in the accompanying consolidated statements of operations.
Goodwill and Indefinite-Lived Intangible Assets
Goodwill acquired in business combinations is assigned to the reporting units that are expected to benefit from the combination as of the acquisition date. Goodwill and indefinite-lived intangible assets, primarily trade names and trademarks, are assessed annually for impairment as of October 1 or upon the occurrence of certain events or substantive changes in circumstances. See Note 3 for a further discussion on goodwill and indefinite-lived intangible assets.
Long-Lived Assets and Intangible Assets with Definite Lives
Long-lived assets, including property and equipment and intangible assets with definite lives, are tested for recoverability whenever events or changes in circumstances indicate that their carrying amount may not be recoverable. The carrying amount of a long-lived asset is not recoverable if it exceeds the sum of the undiscounted cash flows expected to result from the use and eventual disposition of the asset. If the carrying amount is deemed to not be recoverable, an impairment loss is recorded as the amount by which the carrying amount of the long-lived asset exceeds its fair value. Amortization of definite-lived intangible assets is generally recorded on a straight-line or accelerated basis over their estimated lives.
Cable and Satellite Distribution Fees
Cable and satellite distribution fees relate to fees paid in connection with cable and satellite contracts for carriage of HSN’s programming. Fees that are paid upfront for annual contracts are included in "Prepaid expenses and other current assets" in the accompanying consolidated balance sheets and are amortized on a straight-line basis over the terms of the respective contracts. Unpaid fees are accrued and included in the line item “Accrued expenses and other current liabilities” in the accompanying consolidated balance sheets. Cable and satellite distribution fees and amortization are included in “Selling and marketing" expense in the accompanying consolidated statements of operations.
46
Advertising
Advertising costs include catalog production and distribution costs. Advertising costs are expensed in the period incurred, except for Cornerstone’s direct costs of producing and distributing its catalogs, which are capitalized. These capitalized costs are amortized over the expected future revenue stream, which is generally three months from the date catalogs are mailed. Such capitalized costs totaled $16.5 million and $19.1 million as of December 31, 2016 and 2015, respectively, and are included in “Prepaid expenses and other current assets” in the accompanying consolidated balance sheets. Of these amounts, $10.5 million and $15.2 million as of December 31, 2016 and 2015, respectively, related to catalogs that had not yet been mailed. Advertising expense was $272.9 million, $288.5 million, and $279.6 million for the years ended December 31, 2016, 2015 and 2014, respectively, and were included in "Selling and marketing" expense in the accompanying consolidated statements of operations.
Income Taxes
HSNi accounts for income taxes under the liability method, and deferred tax assets and liabilities are recognized for the future tax consequences attributable to differences between the financial statement carrying amounts of existing assets and liabilities and their respective tax bases. Deferred tax assets and liabilities are measured using enacted tax rates in effect for the year in which those temporary differences are expected to be recovered or settled. A valuation allowance is provided on deferred tax assets if it is determined that it is more likely than not that the deferred tax asset will not be realized. HSNi records interest and penalties on potential tax contingencies as a component of income tax expense and records interest net of any applicable related income tax benefit.
HSNi recognizes liabilities for uncertain tax positions based on a two-step process. The first step is to evaluate the tax position for recognition by determining if the weight of available evidence indicates it is more likely than not that the position will be sustained on its technical merits. The second step is to measure the tax benefit as the largest amount which is more than 50% likely of being realized upon ultimate settlement.
Stock-Based Compensation
HSNi recognizes compensation expense for stock-based awards, reduced for estimated forfeitures, on a straight-line basis over the requisite service period for awards with service conditions and on a graded-vested basis for awards with market or performance conditions. Tax benefits resulting from tax deductions in excess of the stock-based compensation expense recognized in the consolidated statements of cash flows are reported as a component of financing cash flows. HSNi issues new shares to satisfy equity vestings and exercises. See Note 11 for a further description of our stock compensation plans.
Earnings Per Share
HSNi computes basic earnings per share by dividing net income by the weighted average number of common shares outstanding during the period. Diluted earnings per share is computed using the treasury stock method.
Derivative Instruments
HSNi uses derivatives in the management of interest rate risk with respect to interest expense on variable rate debt. Such instruments are not held or used for trading purposes. HSNi is party to interest rate swap agreements with major financial institutions that fix the variable benchmark component (LIBOR) of HSNi's interest rate on a portion of its variable-rate debt. See Note 8 for further discussion of derivative instruments.
Share Repurchases
Shares repurchased pursuant to HSNi's share repurchase program are immediately retired upon purchase. Repurchased common stock is reflected as a reduction of shareholders' equity. HSNi's accounting policy related to its share repurchases is to reduce its common stock based on the par value of the shares and to reduce its capital surplus for the excess of the repurchase price over the par value. Since inception of its share repurchase program in September 2011, HSNi has had an accumulated deficit balance; therefore, the excess over the par value has been applied to additional paid-in capital. Once HSNi has retained earnings, the excess will be charged entirely to retained earnings.
Private Label Credit Card
HSN's credit card program offers eligible customers a private label credit card. All cardholders receive certain rewards and benefits which are designed to recognize and promote client loyalty. HSN designs, executes and administers marketing programs to promote usage of the card to current and potential customers. These marketing programs are funded largely by the sponsoring bank. HSN also saves on interchange fees that it would incur if its customers used third-party cards. Purchases
47
made through the private label credit card represented 36%, 34% and 31% of HSN's sales in 2016, 2015 and 2014, respectively. Certain brands in the Cornerstone portfolio also offer their customers private label credit cards with purchases representing approximately 4% of Cornerstone's sales in 2016 and less than 1% in 2015.
In November 2013, HSN extended its agreement with the sponsoring bank through 2020. As with the original agreement, HSN received an upfront signing bonus from the sponsoring bank which is being amortized over the term of the agreement and also receives ongoing payments for new accounts activated as well as a share of net sales collected by the sponsoring bank. For the years ended December 31, 2016, 2015 and 2014, HSN recognized approximately $16.9 million, $16.9 million, and $16.5 million, respectively, of income from the sponsoring bank that was used to offset credit card fees included in costs of goods sold.
Accounting Estimates
HSNi prepares its financial statements in conformity with generally accepted accounting principles in the United States (“GAAP”). These principles require management to make certain estimates and assumptions during the preparation of its consolidated financial statements. These estimates and assumptions impact the reported amounts of assets and liabilities and disclosures of contingent assets and liabilities as of the date of the consolidated financial statements. They also impact the reported amount of net earnings during any period. Actual results could differ from those estimates.
Significant estimates underlying the accompanying consolidated financial statements include: the determination of the lower of cost or market adjustment for inventory; sales returns and other revenue allowances; the allowance for doubtful accounts; the recoverability of long-lived assets; the impairment of intangible assets; the annual expected effective tax rate; the determination of deferred income taxes, including related valuation allowances; the accrual for actual, pending or threatened litigation, claims and assessments; the breakage of customer credits; and assumptions related to the determination of stock-based compensation and contingent consideration related to acquisitions.
Certain Risks and Concentrations
HSNi’s business is subject to certain risks and concentrations including dependence on third-party technology providers and shipping companies, exposure to risks associated with online commerce security, consumer credit risk and credit card fraud. HSNi also depends on third-party service providers for processing certain fulfillment services.
NOTE 3—INTANGIBLE ASSETS AND GOODWILL
HSNi assesses the impairment of goodwill and indefinite-lived identifiable intangible assets, principally trademarks and trade names, at least annually during the fourth quarter and whenever events or circumstances indicate that the carrying value may not be fully recoverable. In performing this review, HSNi has the option of performing a qualitative assessment to determine whether it is more likely than not that the fair values of the reporting unit and/or indefinite-lived intangible assets are less than the carrying values. If HSNi determines that it is not more likely that the fair value is less than its carrying value, then the goodwill and/or the indefinite-lived intangible assets are deemed to be not impaired and no further testing is required until the next annual test date (or sooner if conditions or events before that date raise concerns of potential impairment in the business). If HSNi determines that it is more likely than not that the fair value is less than its carrying value, then the quantitative goodwill and/or indefinite-lived intangible asset impairment tests (as discussed below) must be completed.
If necessary, HSNi performs a quantitative assessment of the fair values of its goodwill and intangible assets. If it is determined that the implied fair value of goodwill and/or indefinite-lived intangible assets is less than the carrying amount, an impairment charge, equal to the excess, is recorded. The implied fair value of goodwill is determined in the same manner as in a business combination. The estimated fair value of the reporting unit is allocated to all of the assets and liabilities of the reporting unit (including any unrecognized intangible assets) as if the reporting unit had been acquired in a business combination and the estimated fair value of the reporting unit was the purchase price paid. The fair value of the reporting unit is determined by using a discounted cash flow analysis with consideration of an equity analysis based on the trading value of its common stock. The discounted cash flow analysis indicates the fair value of the reporting units based on the present value of the cash flows expected to be generated in the future. The equity analysis is based on the trading value of its common stock as of the valuation date or the average stock price over a range of dates prior to the valuation date, plus an estimated control premium. HSNi utilizes a relief from royalty method to assess the fair values of its trademarks and trade names.
In assessing fair value, HSNi considers, among other indicators, differences between estimated and actual cash flows and revenue streams; changes in the related discount, royalty and terminal growth rate; and the relationship between the trading price of its common stock and its per-share book value. Determining fair value requires the exercise of significant judgments.
48
These factors used in the determination of fair value are sensitive to, among other things, changes in the retail consumer market and the general economy.
Intangible Assets
Intangible assets with indefinite lives relate principally to trade names and trademarks. Definite-lived intangible assets consist primarily of patents which are amortized on a straight-line basis over their term. When definite-lived intangible assets are sold or expire, the cost of the asset and the related accumulated amortization are eliminated and any gain or loss is recognized at such time.
The total balance of HSNi's intangible assets, net, is as follows (in thousands):
December 31, | ||||||||
2016 | 2015 | |||||||
Intangible assets with indefinite lives | $ | 253,449 | $ | 255,148 | ||||
Intangible assets with definite lives, net | 174 | 120 | ||||||
Total intangible assets, net | $ | 253,623 | $ | 255,268 | ||||
During the third quarter of 2015, as a result of declines in operating performances at certain Cornerstone brands, HSNi performed a quantitative assessment of certain intangible assets and concluded a fair value adjustment was necessary. An impairment charge of $5.0 million was recorded related to its acquisition of Chasing Fireflies. During the fourth quarter of 2015, in connection with its annual assessment of impairment, HSNi performed qualitative and quantitative assessments of its intangible assets and wrote off the remaining identified intangible assets of Chasing Fireflies. An impairment charge of $1.7 million was recorded in the fourth quarter of 2015. The impairment charges were recorded within the Cornerstone segment and are included in "Loss on sale of businesses and asset impairments" expense in the accompanying consolidated statements of operations.
Amortization expense for the definite-lived intangible assets was not material for all periods presented.
Goodwill
The following tables present the balance of goodwill by reporting unit, including changes in the carrying amount of goodwill, for the years ended December 31, 2016 and 2015 (in thousands):
Gross Balance as of January 1, 2016 | Accumulated Impairment | Net Balance as of January 1, 2016 | Additions | Impairment | Net Balance as of December 31, 2016 | |||||||||||||||||||
HSN | $ | 2,391,594 | $ | (2,391,594 | ) | $ | — | $ | — | $ | — | $ | — | |||||||||||
Cornerstone | 502,464 | (492,606 | ) | 9,858 | — | — | 9,858 | |||||||||||||||||
Total | $ | 2,894,058 | $ | (2,884,200 | ) | $ | 9,858 | $ | — | $ | — | $ | 9,858 | |||||||||||
Gross Balance as of January 1, 2015 | Accumulated Impairment | Net Balance as of January 1, 2015 | Additions | Impairment | Net Balance as of December 31, 2015 | |||||||||||||||||||
HSN | $ | 2,391,594 | $ | (2,391,594 | ) | $ | — | $ | — | $ | — | $ | — | |||||||||||
Cornerstone | 502,464 | (492,606 | ) | 9,858 | — | — | 9,858 | |||||||||||||||||
Total | $ | 2,894,058 | $ | (2,884,200 | ) | $ | 9,858 | $ | — | $ | — | $ | 9,858 | |||||||||||
Based on the quantitative assessments performed in the fourth quarters of 2016 and 2015, HSNi concluded there was no impairment of its goodwill.
49
NOTE 4—PROPERTY AND EQUIPMENT
The balance of property and equipment, net, is as follows (in thousands):
December 31, | ||||||||
2016 | 2015 | |||||||
Capitalized software | $ | 252,741 | $ | 234,249 | ||||
Computer and broadcast equipment | 91,119 | 91,533 | ||||||
Buildings and leasehold improvements | 113,731 | 108,656 | ||||||
Furniture and other equipment | 124,518 | 96,512 | ||||||
Projects in progress | 27,666 | 55,294 | ||||||
Land and land improvements | 10,584 | 10,597 | ||||||
620,359 | 596,841 | |||||||
Less: accumulated depreciation and amortization | (409,253 | ) | (385,048 | ) | ||||
Total property and equipment, net | $ | 211,106 | $ | 211,793 | ||||
Long-lived assets, including projects in progress, are tested for recoverability whenever events or changes in circumstances indicate that their carrying amounts may not be recoverable. There were no impairment charges related to HSNi's long-lived assets in fiscal 2016 or 2015. As we periodically reassess estimated future cash flows and asset fair values, changes in our estimates and assumptions may cause us to realize impairment charges in the future.
NOTE 5—ACCRUED EXPENSES AND OTHER CURRENT LIABILITIES
Accrued expenses and other current liabilities consist of the following (in thousands):
December 31, | ||||||||
2016 | 2015 | |||||||
Accrued sales returns | $ | 38,904 | $ | 39,649 | ||||
Accrued cable and satellite distribution fees | 43,129 | 35,081 | ||||||
Accrued freight and fulfillment expenses | 44,188 | 35,342 | ||||||
Accrued compensation and benefits | 21,108 | 38,616 | ||||||
Other accrued expenses and current liabilities | 77,936 | 86,354 | ||||||
Total accrued expenses and other current liabilities | $ | 225,265 | $ | 235,042 | ||||
NOTE 6—SEGMENT INFORMATION
HSNi presents its operating segments and related financial information in a manner consistent with how the chief operating decision maker and executive management view the businesses, how the businesses are organized as to segment management, and the focus of the businesses with regards to the types of products or services offered and/or the target market. HSNi has two reportable segments, HSN and Cornerstone. The accounting policies of the segments are the same as those described in Note 2 – Summary of Significant Accounting Policies. Intercompany accounts and transactions have been eliminated in consolidation.
HSNi’s primary performance metric is Adjusted EBITDA, which is defined as operating income excluding, if applicable: (1) non-cash charges including: (a) stock-based compensation expense, (b) amortization of intangibles, (c) depreciation and gains and losses on asset dispositions, and (d) goodwill, long-lived asset and intangible asset impairments; (2) pro forma adjustments for significant acquisitions; and (3) other significant items. Significant items, while periodically affecting our results, may vary significantly from period to period and have a disproportionate effect in a given period, thereby affecting the comparability of results. Adjusted EBITDA is not a measure determined in accordance with GAAP, and should not be considered in isolation or as a substitute for operating income, net income or any other measure determined in accordance with GAAP. Adjusted EBITDA is used as a measurement of operating efficiency and overall financial performance and HSNi believes it to be a helpful measure for those evaluating companies in the retail and media industries. Adjusted EBITDA has certain limitations in that it does not take into account the impact to HSNi’s consolidated statements of operations of certain expenses, gains and losses; including stock-based compensation, amortization of intangibles, depreciation, gains and losses on asset dispositions, asset impairment charges, acquisition-related accounting expenses and other significant items.
50
The following tables reconcile consolidated net income to operating income for HSNi's operating segments and Adjusted EBITDA (in thousands):
Year Ended December 31, 2016 | ||||||||||||
HSN | Cornerstone | Total | ||||||||||
Net income | $ | 118,708 | ||||||||||
Income tax provision | 71,020 | |||||||||||
Income before income taxes | 189,728 | |||||||||||
Interest expense, net | 16,079 | |||||||||||
Operating income (loss) | $ | 216,301 | $ | (10,494 | ) | $ | 205,807 | |||||
Stock-based compensation expense | 15,073 | 4,160 | 19,233 | |||||||||
Depreciation and amortization | 29,328 | 13,384 | 42,712 | |||||||||
Loss on sale of businesses and asset impairments (a) | — | 31,232 | 31,232 | |||||||||
Loss on disposition of fixed assets | 134 | 38 | 172 | |||||||||
Adjusted EBITDA | $ | 260,836 | $ | 38,320 | $ | 299,156 | ||||||
(a) Non-GAAP results for the year ended December 31, 2016 exclude a loss on sale and asset impairment charges of $31.2 million for the divestitures of TravelSmith and Chasing Fireflies.
Year Ended December 31, 2015 | ||||||||||||
HSN | Cornerstone | Total | ||||||||||
Net income | $ | 169,239 | ||||||||||
Income tax provision | 99,615 | |||||||||||
Income before income taxes | 268,854 | |||||||||||
Interest expense, net | 15,180 | |||||||||||
Operating income | $ | 253,622 | $ | 30,412 | $ | 284,034 | ||||||
Stock-based compensation expense | 13,889 | 4,519 | 18,408 | |||||||||
Depreciation and amortization | 29,371 | 14,047 | 43,418 | |||||||||
Asset impairments (a) | — | 5,568 | 5,568 | |||||||||
Exit and reorganization costs (b) | 5,208 | — | 5,208 | |||||||||
Loss on disposition of fixed assets | 791 | 15 | 806 | |||||||||
Adjusted EBITDA | $ | 302,881 | $ | 54,561 | $ | 357,442 | ||||||
(a) Non-GAAP results for the year ended December 31, 2015 exclude $6.7 million of charges for the impairment of intangible assets and $1.1 million of other non-cash adjustments.
(b) Non-GAAP results for 2015 exclude $2.0 million of severance costs associated with a reorganization at HSN and $3.2 million for certain costs associated with the planned closure of one of HSN's distribution centers.
Year Ended December 31, 2014 | ||||||||||||
HSN | Cornerstone | Total | ||||||||||
Net income | $ | 172,984 | ||||||||||
Income tax provision | 104,543 | |||||||||||
Income before income taxes | 277,527 | |||||||||||
Interest expense, net | 7,082 | |||||||||||
Operating income | $ | 252,098 | $ | 32,511 | $ | 284,609 | ||||||
Stock-based compensation expense | 12,224 | 3,382 | 15,606 | |||||||||
Depreciation and amortization | 29,762 | 14,172 | 43,934 | |||||||||
Breakage income (a) | (4,962 | ) | — | (4,962 | ) | |||||||
CPSC settlement (b) | — | 3,100 | 3,100 | |||||||||
Loss on disposition of fixed assets | 19 | 34 | 53 | |||||||||
Adjusted EBITDA | $ | 289,141 | $ | 53,199 | $ | 342,340 | ||||||
(a) Non-GAAP results for the year ended December 31, 2014 exclude $5.0 million of breakage income related to the initial reversal of certain customer credits that had accumulated over many years.
(b) Non-GAAP results for the year ended December 31, 2014 exclude a $3.1 million settlement with the Consumer Product Safety Commission ("CPSC").
51
Financial information by segment is as follows (thousands):
Year Ended December 31, | ||||||||||||
2016 | 2015 | 2014 | ||||||||||
Net sales: | ||||||||||||
HSN | $ | 2,474,554 | $ | 2,542,107 | $ | 2,476,088 | ||||||
Cornerstone | 1,092,931 | 1,148,468 | 1,111,907 | |||||||||
Total | $ | 3,567,485 | $ | 3,690,575 | $ | 3,587,995 | ||||||
Identifiable assets: | ||||||||||||
HSN | $ | 1,020,531 | $ | 1,029,475 | $ | 1,107,932 | ||||||
Cornerstone | 284,002 | 305,096 | 289,154 | |||||||||
Total | 1,304,533 | 1,334,571 | 1,397,086 | |||||||||
Capital expenditures: | ||||||||||||
HSN | $ | 25,089 | $ | 44,844 | $ | 32,307 | ||||||
Cornerstone | 16,653 | 15,848 | 15,009 | |||||||||
Total | $ | 41,742 | $ | 60,692 | $ | 47,316 | ||||||
HSNi does not report revenue from external customers for each product or each group of similar products as it is impracticable to do so. HSNi maintains operations principally in the United States with no long-lived assets and insignificant net sales in all other countries.
NOTE 7—LONG-TERM DEBT
Long-term debt consists of the following (in thousands):
December 31, | ||||||||
2016 | 2015 | |||||||
Secured credit agreement expiring January 27, 2020: | ||||||||
Term loan | $ | 475,000 | $ | 500,000 | ||||
Revolving credit facility | 40,000 | 140,000 | ||||||
Long-term debt | 515,000 | 640,000 | ||||||
Unamortized deferred financing costs | (5,122 | ) | (6,892 | ) | ||||
Long-term debt, net of unamortized deferred financing costs | 509,878 | 633,108 | ||||||
Less: current maturities | (25,000 | ) | (25,000 | ) | ||||
Long-term debt, less current maturities and net of unamortized deferred financing costs | $ | 484,878 | $ | 608,108 | ||||
On January 27, 2015, HSNi entered into a $1.25 billion five-year syndicated credit agreement ("Credit Agreement") which is secured by 100% of the voting equity securities of HSNi's U.S. subsidiaries and 65% of HSNi's first-tier foreign subsidiaries. This Credit Agreement replaced the existing credit agreement that was set to expire in April 2017. Certain HSNi subsidiaries have unconditionally guaranteed HSNi's obligations under the Credit Agreement. The Credit Agreement, which includes a $750 million revolving credit facility and a $500 million term loan, may be increased up to $1.75 billion subject to certain conditions and expires January 27, 2020. HSNi drew $500 million from its term loan and $200 million under the revolving credit facility, both under the new Credit Agreement, in the first quarter of 2015 to repay its outstanding term loan of $228.1 million and to fund a $524 million special cash dividend that was paid on February 19, 2015.
In connection with the termination of the prior credit agreement, $0.5 million of the $2.4 million of unamortized deferred financing costs were expensed in the first quarter of 2015. The remaining balance of $1.9 million along with the $6.6 million in capitalized financing costs related to the Credit Agreement are being amortized to interest expense over the five-year term of the Credit Agreement.
The Credit Agreement includes various covenants, limitations and events of default customary for similar facilities
including a maximum leverage ratio of 3.50x and a minimum interest coverage ratio of 3.00x (both as defined in the Credit Agreement). HSNi was in compliance with all such covenants as of December 31, 2016 with a leverage ratio of 1.7x and an interest coverage ratio of 20.6x. The Credit Agreement also contains covenants that limit our ability and the ability of our
52
subsidiaries to, among other things, incur additional indebtedness, pay dividends or make other distributions to third parties, repurchase or redeem our stock, make investments, sell assets, incur liens, enter into agreements restricting our subsidiaries' ability to pay dividends, enter into transactions with affiliates and consolidate, merge or sell all or substantially all of our assets. The Credit Agreement also contains provisions that limit the ability of HSNi to make Restricted Payments, defined as cash dividends, distribution of other property, repurchase of the Company’s common stock, prepayment or redemption of debt, etc., however, so long as the Company’s leverage ratio is below 3.00x after giving pro forma effect to any proposed Restricted Payments, the amount of such Restricted Payments are not limited. In the event the Company’s leverage ratio is equal to or greater than 3.00x or after giving pro forma effect to any proposed Restricted Payments, then such Restricted Payments are limited to $150 million in any such fiscal year. The current cash dividend of $1.40 annually per share represents a Restricted Payment of approximately $73.2 million. Dividends, loans or advances to HSNi by its subsidiaries are not restricted by the Credit Agreement.
Loans under the Credit Agreement bear interest at a per annum rate equal to a LIBOR rate plus a predetermined margin that ranges from 1.25% to 2.25% or the Base Rate (as defined in the Credit Agreement) plus a predetermined margin that ranges from 0.25% to 1.25%. HSNi can elect to borrow at either a LIBOR or the Base Rate and the predetermined margin is based on HSNi's leverage ratio. The interest rate on the $515.0 million outstanding long-term debt balance as of December 31, 2016 was 2.75%. HSNi pays a commitment fee ranging from 0.20% to 0.40% (based on the leverage ratio) on the unused portion of the revolving credit facility.
The amount available under the revolving credit facility portion of the Credit Agreement is reduced by the amount of commercial and standby letters of credit issued under the revolving credit facility, which totaled $10.2 million as of December 31, 2016. The ability to draw funds under the revolving credit facility is dependent upon meeting the aforementioned financial covenants, which may limit HSNi’s ability to draw the full amount of the facility. As of December 31, 2016, the additional amount that could be borrowed under the revolving credit facility in consideration of the financial covenants and outstanding letters of credit, was approximately $522.7 million.
Aggregate contractual maturities of long-term debt are as follows (in thousands):
Years Ending December 31, | |||
2017 | $ | 25,000 | |
2018 | 37,500 | ||
2019 | 37,500 | ||
2020 | 415,000 | ||
2021 | — | ||
$ | 515,000 | ||
NOTE 8—DERIVATIVE INSTRUMENTS
HSNi uses derivatives in the management of its interest rate risk with respect to its variable rate debt. HSNi's strategy is to eliminate the cash flow risk on a portion of its variable rate debt caused by changes in the benchmark interest rate (LIBOR). Derivative instruments are not entered into for speculative purposes.
HSNi uses interest rate swap contracts to eliminate the cash flow risk on a portion of its variable rate debt. HSNi pays at a fixed rate and receives payments at a variable rate based on one-month LIBOR. The swaps effectively fix the floating LIBOR-based interest of our outstanding LIBOR-based debt. The interest rate swaps were designated and qualified as cash flow hedges; therefore, the effective portions of the changes in fair value are recorded in accumulated other comprehensive income (loss). Any ineffective portions of the changes in fair value of the interest rate swaps will be immediately recognized in earnings in the consolidated statements of operations.
The interest rate swaps effectively convert $187.5 million of our variable rate term loan to a fixed rate of 0.8525% through April 2017, and then increases to $250.0 million in April 2017 with a maturity date in January 2020 with a fixed rate of 1.05% (in both cases the swapped fixed rate is exclusive of the credit spread under the Credit Agreement). Based on HSNi's leverage ratio as of December 31, 2016, the all-in fixed rate was 2.3525%. The changes in fair value of the interest rate swap (inclusive of reclassifications to net income) were income of $2.3 million and a loss of $0.2 million, net of tax, for the years ended December 2016 and 2015, and were included in other comprehensive income (loss).
53
The fair value of the interest rate swaps at December 31, 2016 was $3.6 million and was recorded in "Other non-current assets." The fair value of the interest rate swap liability as of December 31, 2015 was $0.2 million and was recorded in "Other long-term liabilities" in the consolidated balance sheets. As of December 31, 2016, HSNi estimates that less than $0.1 million of unrealized losses included in accumulated other comprehensive income (loss) related to these swaps will be realized and reported in earnings within the next twelve months. See Note 9 for discussion of the fair value measurements concerning these interest rate swaps.
NOTE 9—FAIR VALUE MEASUREMENTS
Fair value is defined as the price that would be received to sell an asset or paid to transfer a liability in an orderly transaction between market participants. Fair value assumptions are made at a specific point in time and changes in underlying assumptions could significantly affect these estimates. HSNi applies the following framework for measuring fair value which is based on a three-level hierarchy:
Level 1—Valuations based on quoted prices for identical assets and liabilities in active markets.
Level 2—Valuations based on observable inputs other than quoted prices included in Level 1, such as quoted prices for similar assets and liabilities in active markets, quoted prices for identical or similar assets and liabilities in markets that are not active, or other inputs that are observable or can be corroborated by observable market data.
Level 3—Valuations based on unobservable inputs reflecting our own assumptions, consistent with reasonably available assumptions made by other market participants. These valuations require significant judgment.
The carrying amounts of cash and cash equivalents, accounts receivable and accounts payable approximate fair value because of the short maturity of these items. The following table summarizes the fair value of HSNi's other financial assets and liabilities which are measured at fair value on a recurring basis in the consolidated balance sheets (in thousands):
December 31, 2016 | ||||||||||||||||
Total Fair Value and Carrying Value on Balance Sheet | Fair Value Measurement Category | |||||||||||||||
Level 1 | Level 2 | Level 3 | ||||||||||||||
Assets: | ||||||||||||||||
Interest rate swaps | $ | 3,577 | $ | — | $ | 3,577 | $ | — | ||||||||
December 31, 2015 | ||||||||||||||||
Total Fair Value and Carrying Value on Balance Sheet | Fair Value Measurement Category | |||||||||||||||
Level 1 | Level 2 | Level 3 | ||||||||||||||
Liabilities: | ||||||||||||||||
Interest rate swap | $ | 169 | $ | — | $ | 169 | $ | — | ||||||||
HSNi's interest rate swaps were carried on the balance sheet at fair value as of December 31, 2016 and December 31, 2015. The swaps were entered into for the purpose of hedging the variability of interest expense and interest payments on HSNi's long-term variable rate debt. The fair value is based on a valuation model which utilizes interest rate yield curves and credit spreads as the significant inputs to the model. These inputs are observable in active markets (level 2 criteria). HSNi considers credit risk associated with its own standing as well as the credit standing of any counterparties involved in the valuation of its financial instruments.
54
The following table summarizes the fair value of HSNi’s financial assets and liabilities which are carried at cost (in thousands):
December 31, 2016 | ||||||||||||||||||||
Carrying Value | Fair Value | Fair Value Measurement Category | ||||||||||||||||||
Level 1 | Level 2 | Level 3 | ||||||||||||||||||
Term loan expiring January 27, 2020 | $ | 475,000 | $ | 475,000 | $ | — | $ | 475,000 | $ | — | ||||||||||
Revolving credit facility | $ | 40,000 | $ | 40,000 | $ | — | $ | 40,000 | $ | — | ||||||||||
December 31, 2015 | ||||||||||||||||||||
Carrying Value | Fair Value | Fair Value Measurement Category | ||||||||||||||||||
Level 1 | Level 2 | Level 3 | ||||||||||||||||||
Term loan expiring January 27, 2020 | $ | 500,000 | $ | 500,000 | $ | — | $ | 500,000 | $ | — | ||||||||||
Revolving credit facility | $ | 140,000 | $ | 140,000 | $ | — | $ | 140,000 | $ | — | ||||||||||
The fair value of the term loan was estimated by discounting expected cash flows at the rates currently offered to HSNi for debt of the same remaining maturities (level 2 criteria).
HSNi assesses the impairment of goodwill and indefinite-lived intangible assets at fair value at least annually during the fourth quarter and whenever events or circumstances indicate that the carrying value may not be fully recoverable. HSNi also measures certain assets, such as property and equipment and definite-lived intangible assets, at fair value on a non-recurring basis. These assets are recognized at fair value if they are deemed to be impaired.
At June 30, 2016, the assets and liabilities of Chasing Fireflies and TravelSmith were considered to be a disposal group held for sale. Therefore, the disposal group was measured at its fair value less the estimated costs to sell which resulted in a non-cash asset impairment charge of $20.4 million that was recognized during the second quarter. On September 8, 2016, Cornerstone completed the divestitures of Chasing Fireflies and TravelSmith and recorded a loss on sale of $10.8 million during the year ended December 31, 2016. The impairment charge and loss on sale were recorded within the Cornerstone segment and are included in "Loss on sale of businesses and asset impairments" expense in the accompanying consolidated statements of operations. See Note 20 for further discussion.
During the third and fourth quarters of 2015, as a result of declines in operating performances at certain Cornerstone brands, HSNi performed quantitative assessments of certain intangible assets and concluded fair value adjustments were necessary. HSNi wrote off the remaining identified intangible assets related to its 2012 acquisition of Chasing Fireflies resulting in impairment charges totaling $6.7 million. The impairment charges were recorded within the Cornerstone segment and are included in "Loss on sale of businesses and asset impairments" expense in the accompanying consolidated statements of operations. The fair value of the intangible assets, consisting of trademarks and tradenames, was determined using the relief from royalty method. Key inputs used in this calculation included revenue growth, discount, royalty and terminal growth rates.
NOTE 10—EARNINGS PER SHARE
HSNi computes basic earnings per share using the weighted average number of common shares outstanding for the period. HSNi computes diluted earnings per share using the treasury stock method, which includes the weighted average number of common shares outstanding for the period plus the potential dilution that could occur if various equity awards to issue common stock were exercised or restricted equity awards were vested resulting in the issuance of common stock that could share in HSNi’s earnings.
Basic Earnings Per Share
For the years ended December 31, 2016, 2015 and 2014, basic earnings per share was computed using the number of weighted average shares of common stock outstanding and assumed to be outstanding for the period.
55
Diluted Earnings Per Share
For the years ended December 31, 2016, 2015 and 2014, diluted earnings per share was computed using the number of shares of common stock outstanding and assumed to be outstanding for the year and, if dilutive, the incremental common stock that HSNi would issue upon the assumed exercise of stock options and stock appreciation rights and the vesting of restricted stock units using the treasury stock method.
The following table presents HSNi’s basic and diluted earnings per share (in thousands, except per share data):
Year Ended December 31, | ||||||||||||
2016 | 2015 | 2014 | ||||||||||
Net income | $ | 118,708 | $ | 169,239 | $ | 172,984 | ||||||
Weighted average number of shares outstanding: | ||||||||||||
Basic | 52,359 | 52,627 | 52,736 | |||||||||
Dilutive effect of stock-based compensation awards | 504 | 878 | 897 | |||||||||
Diluted | 52,863 | 53,505 | 53,633 | |||||||||
Net income per share: | ||||||||||||
Basic | $ | 2.27 | $ | 3.22 | $ | 3.28 | ||||||
Diluted | $ | 2.25 | $ | 3.16 | $ | 3.23 | ||||||
Unexercised employee stock options and stock appreciation rights and unvested restricted stock units excluded from the diluted EPS calculation because their effect would have been antidilutive | 2,076 | 560 | 763 | |||||||||
NOTE 11—STOCK-BASED AWARDS
Stock-based compensation expense is included in the following line items in the accompanying consolidated statements of operations (in thousands):
Year Ended December 31, | ||||||||||||
2016 | 2015 | 2014 | ||||||||||
Selling and marketing | $ | 6,412 | $ | 6,171 | $ | 4,736 | ||||||
General and administrative | 12,821 | 12,237 | 10,870 | |||||||||
Stock-based compensation expense before income taxes | 19,233 | 18,408 | 15,606 | |||||||||
Income tax benefit | (6,734 | ) | (6,563 | ) | (5,685 | ) | ||||||
Stock-based compensation expense after income taxes | $ | 12,499 | $ | 11,845 | $ | 9,921 | ||||||
As of December 31, 2016, there was approximately $22.9 million of unrecognized compensation cost, net of estimated forfeitures, related to all equity-based awards, which is currently expected to be recognized on a straight-line basis over a weighted average period of approximately 1.9 years.
Second Amended and Restated 2008 Stock and Annual Incentive Plan
The Second Amended and Restated 2008 Stock and Annual Incentive Plan, as amended (the “Plan”), authorizes the issuance of 8.0 million shares (8.8 million shares after giving effect to the anti-dilution provisions of the Plan related to the special cash dividend) of HSNi common stock for new awards granted by HSNi. The purpose of the Plan is to assist HSNi in attracting, retaining and motivating officers, employees, directors and consultants, and to provide HSNi with the ability to provide incentives more directly linked to the profitability of HSNi’s business and increases in shareholder value.
56
In connection with the special cash dividend of $10.00 per common share paid on February 19, 2015, and as required by the anti-dilution provisions of the Plan, adjustments were made to outstanding equity awards as of the ex-dividend date to preserve their value following the dividend, as follows: (i) the number of shares subject to outstanding restricted stock units was increased as a result of the reinvestment of the dividend; and (ii) the exercise prices of outstanding stock options and stock appreciation rights and the grant date fair value of market stock units were reduced and the number of shares subject to such awards was increased. These adjustments did not result in additional stock-based compensation expense as the fair value of the outstanding awards did not change. As further required by the Plan, the maximum number of shares issuable under the Plan was also proportionally adjusted, which resulted in approximately 0.8 million additional shares available to be issued. As of December 31, 2016, there were approximately 1.7 million shares of common stock available for grants under the Plan.
HSNi can grant restricted stock, restricted stock units ("RSUs"), market stock units ("MSUs"), performance share units ("PSUs"), stock options, stock appreciation rights (“SARs”), dividend equivalents and other stock-based awards under the Plan. Stock-based awards have a maximum term of 10 years. The exercise price of options and SARs granted under the Plan is required to be at, or above, the fair market value of HSNi’s stock on the date of grant. RSUs and PSUs have rights to receive dividend equivalents that vest at the same time the underlying awards vest once the requisite service has been rendered. HSNi elects to issue shares of its common stock for RSU vestings and SAR exercises net of the employees’ minimum tax withholding obligation. The payments made by HSNi to the taxing authorities for these taxes were $3.3 million, $16.7 million and $12.7 million for the years ended December 31, 2016, 2015 and 2014, respectively.
Restricted Stock Units
RSUs are awards that are denominated in a hypothetical equivalent number of shares of HSNi’s common stock. At the time of grant, HSNi determines if the RSUs will be settled in cash, stock or both. The value to the holder of the RSU is based upon the market value of HSNi’s stock when the RSUs vest. Compensation expense for RSUs granted under the Plan is measured at the grant date as the fair market value of HSNi’s common stock and expensed ratably over the vesting term. The RSUs are generally subject to service-based vesting over a term of 3 years to 5 years.
A summary of the status of the nonvested RSUs and dividend equivalents, as of December 31, 2016 and changes during the year ended December 31, 2016 is as follows:
Number of RSUs | Weighted Average Grant Date Fair Value | ||||||
Nonvested at January 1, 2016 (including 83,132 outstanding dividend equivalents) | 674,894 | $ | 57.92 | ||||
Granted | 318,228 | 44.16 | |||||
Additional units granted related to dividend equivalents due to quarterly dividends | 24,602 | — | |||||
Vested | (152,252 | ) | 58.45 | ||||
Forfeited | (102,843 | ) | 56.01 | ||||
Nonvested at December 31, 2016 (including 74,181 outstanding dividend equivalents) | 762,629 | 51.86 | |||||
The weighted average per share fair value of RSUs granted during the years ended December 31, 2016, 2015 and 2014 based on market prices of HSNi’s common stock on the grant date was $44.16, $65.89 and $55.06, respectively.
The total fair value of RSUs that vested during the years ended December 31, 2016, 2015 and 2014 and settled in HSNi common stock was $6.6 million, $12.0 million and $10.9 million, respectively. HSNi realizes a tax benefit for RSUs held by its employees in the year in which the award vests. The tax benefit realized by HSNi related to RSUs was approximately $3.4 million, $5.4 million and $4.2 million for the years ended December 31, 2016, 2015 and 2014, respectively.
As of December 31, 2016, there was approximately $16.7 million of unrecognized compensation cost, net of estimated forfeitures, related to RSUs, which is currently expected to be recognized on a straight-line basis over a weighted average period of approximately 2.1 years.
Stock Options and SARs
SARs are similar to traditional stock options, except, upon exercise, holders of SARs will only receive a value equal to the spread between the current market price per share of the common stock and the exercise price. The SARs granted by HSNi may be settled in cash or common stock of HSNi, in the sole discretion of HSNi. All SARs exercised by employees of HSNi have been settled in stock. For all SARs currently outstanding, HSNi intends to settle these awards in stock upon exercise. The exercise price for awards granted under the Plan is required to be priced at, or above, the fair market value of HSNi’s stock at the date of grant. Awards typically vest ratably over a term of 3 years.
57
A summary of the status of the outstanding stock options and SARs as of December 31, 2016 is as follows:
Number of options | Weighted Average Exercise Price | Weighted Average Remaining Contractual Term (in years) | Aggregate Intrinsic Value | ||||||||||
Outstanding at January 1, 2016 | 1,810,973 | $ | 45.80 | ||||||||||
Granted | 928,990 | 44.86 | |||||||||||
Exercised | (39,054 | ) | 23.27 | ||||||||||
Forfeited | (101,675 | ) | 49.41 | ||||||||||
Expired | (19,017 | ) | 46.25 | ||||||||||
Outstanding at December 31, 2016 | 2,580,217 | 45.66 | 6.6 | $ | 4,430,444 | ||||||||
Vested and expected to vest at December 31, 2016 | 2,437,355 | 45.47 | 6.5 | $ | 4,430,444 | ||||||||
Exercisable at December 31, 2016 | 1,308,868 | 41.69 | 4.6 | $ | 4,430,444 | ||||||||
The aggregate intrinsic value in the table above represents the pre-tax difference between the closing price of HSNi’s common stock on December 31, 2016 of $34.30 and the exercise price for all “in the money” awards at December 31, 2016. This amount changes based on the fair market value of HSNi’s common stock. The intrinsic value of the stock options and SARs exercised during the years ended December 31, 2016, 2015 and 2014 was approximately $0.8 million, $44.4 million and $23.4 million, respectively. Cash received from stock option exercises for the years ended December 31, 2016, 2015 and 2014 was $0.2 million, $15.0 million, and $0.6 million, respectively. The tax benefit realized from stock option exercises for the years ended December 31, 2016, 2015 and 2014 was $0.3 million, $12.2 million, and $8.8 million, respectively.
The fair value of each stock option and SAR award, which HSNi intends to settle in stock, is estimated on the grant date using the Black-Scholes option pricing model. The Black-Scholes option pricing model incorporates various assumptions, including expected volatility and expected term. Expected stock price volatilities are estimated based on HSNi's historical volatility and the historical and implied volatilities of comparable publicly-traded companies. The risk-free interest rates are based on U.S. Treasury yields for notes with comparable terms as the awards in effect at the grant date. The expected term of options and SARs granted is based on an analysis of historical employee termination rates and option exercise patterns, giving consideration to expectations of future employee behavior. Dividends yields are estimated based on HSNi's historical and anticipated dividend payments.
The weighted average assumptions used in the Black-Scholes option pricing model are as follows:
Year Ended December 31, | |||||||||
2016 | 2015 | 2014 | |||||||
Volatility factor | 26.3 | % | 29.2 | % | 36.4 | % | |||
Risk-free interest rate | 1.23 | % | 1.49 | % | 1.55 | % | |||
Expected term | 4.5 | 4.4 | 4.7 | ||||||
Dividend yield | 3.1 | % | 2.1 | % | 1.8 | % | |||
The weighted average fair values of stock options and SARs granted from the Plan during the years ended December 31, 2016, 2015 and 2014 at market prices equal to HSNi’s common stock on the grant date were $7.31, $13.65, and $15.24, respectively.
At the date of the Spin-off, HSNi granted stock options to its Chief Executive Officer at exercise prices greater than market value on the date of grant with a term of 10 years. The weighted average exercise price and the weighted average fair value for the 373,000 stock options that were outstanding as of December 31, 2016 were $38.89 and $3.01, respectively. All other awards granted under the Plan have exercise prices based on the fair market value of HSNi’s common stock at the date of grant.
As of December 31, 2016, there was approximately $6.2 million of unrecognized compensation cost, net of estimated forfeitures, related to stock options and SARs, which is currently expected to be recognized on a straight-line basis over a weighted average period of approximately 1.3 years.
58
The following table summarizes the information about stock options and SARs outstanding and exercisable as of December 31, 2016:
Outstanding | Exercisable | |||||||||||||||
Number Outstanding at December 31, 2016 | Weighted Average Exercise Price | Weighted Average Remaining Contractual Term in Years | Number Exercisable at December 31, 2016 | Weighted Average Exercise Price | ||||||||||||
$0.00 to $9.99 | 95,202 | $ | 4.91 | 2.0 | 95,202 | $ | 4.91 | |||||||||
$10.00 to $19.99 | 48,873 | 16.11 | 2.3 | 48,873 | 16.11 | |||||||||||
$20.00 to $29.99 | 57,541 | 25.86 | 4.1 | 57,541 | 25.86 | |||||||||||
$30.00 to $39.99 | 450,822 | 37.52 | 2.2 | 450,822 | 37.52 | |||||||||||
$40.00 to $49.99 | 1,216,719 | 45.72 | 8.5 | 236,836 | 47.73 | |||||||||||
$50.00 to $59.99 | 283,116 | 51.56 | 6.2 | 275,666 | 51.57 | |||||||||||
$60.00 to $69.99 | 427,944 | 65.24 | 8.1 | 143,928 | 65.24 | |||||||||||
2,580,217 | 1,308,868 | |||||||||||||||
Performance-Based Awards
During the third quarter of 2013, HSNi granted approximately 116,000 MSUs (after giving effect to the anti-dilution provisions of the Plan related to the special cash dividend) to its Chief Executive Officer. The MSUs vest over performance periods of 3 years and 5 years (50% for each period). Payout percentages range between 0% and 200% of the target award depending on the awards' market condition, the future price of HSNi's stock at the end of each performance period as compared to HSNi's stock price at the date of grant (as defined in the MSU agreement). The fair value of the MSUs at the grant date was $8.3 million, or an average of $82.67 per unit, and is recognized on a graded-vested basis over the performance periods. The fair value was measured on the grant date by applying a Monte Carlo simulation pricing model which estimates the potential outcome of reaching the market condition based on simulated future stock prices. The weighted average assumptions used in the valuation of the MSUs were the following: volatility factor of 39.7%, risk-free interest rate of 1.00%, expected term of 4.0 years and dividend yield of 1.1%. The fair value of the MSUs that vested during the year ended December 31, 2016 and settled in HSNi common stock was $2.4 million.
During the years ended December 31, 2016, 2015 and 2014, HSNi granted performance-based awards to certain executive employees which vest over a three-year performance period. The awards vest between 0% and 200% of the target award based on the company's Total Shareholder Return relative to an indexed peer group. For the year ended December 31, 2016, HSNi granted these awards using PSUs which represent a right to receive shares of HSNi common stock. For the years ended December 31, 2015 and 2014, HSNi granted these awards using a similar performance metric but they will be settled in cash. The aggregate target value of the performance-based awards granted during the years ended December 31, 2016, 2015 and 2014 was $5.0 million, $5.2 million and $4.4 million, respectively, with grant date fair value of $5.0 million, $4.9 million and $3.8 million, respectively, measured using a Monte-Carlo simulation.
The compensation expense for these PSUs is based on the fair value of the awards measured at the grant date and is expensed ratably over the vesting term. Performance cash awards are accounted for as liability-based awards as they will be settled in cash. The compensation expense for the cash awards is remeasured at the end of each reporting period. As of December 31, 2016 and 2015, a liability of $0.7 million and $2.3 million, respectively, was recorded for these awards.
59
A summary of the status of the nonvested MSUs, PSUs and dividend equivalents, as of December 31, 2016 and changes during the year ended December 31, 2016 is as follows:
Number of MSUs and PSUs (a) | Weighted Average Grant Date Fair Value | ||||||
Nonvested at January 1, 2016 | 231,602 | $ | 82.67 | ||||
Granted (a) | 184,580 | 54.06 | |||||
Additional units granted related to quarterly dividend equivalents | 5,810 | — | |||||
Vested | (57,049 | ) | 78.04 | ||||
Forfeited | (69,557 | ) | 74.31 | ||||
Nonvested at December 31, 2016 | 295,386 | 67.35 | |||||
(a) Shares granted are based on the achievement of certain performance criteria and represent the maximum number of shares that can vest (200%).
Employee Stock Purchase Plan
The HSN, Inc. 2010 Employee Stock Purchase Plan (“ESPP”) was approved May 2010 and 750,000 shares of HSNi common stock were reserved for issuance under the ESPP. The ESPP permits employees to purchase shares of HSNi’s common stock during semi-annual purchase periods. Under the terms of the ESPP, eligible employees accumulate funds through payroll deductions and purchase shares at a price equal to the lesser of 85% of the fair market value of the common stock at the grant date or purchase date. All shares purchased under the ESPP must be held for a period of 6 months.
For the year ended December 31, 2016, HSNi granted approximately 62,000 options under the ESPP. The fair value of each option granted under the ESPP is determined on the grant date using the Black-Scholes option pricing model. The following are the weighted average assumptions used in the valuation of the ESPP options for the years ended December 31, 2016 and 2015:
Year Ended December 31, | |||||||||
2016 | 2015 | 2014 | |||||||
Volatility factor | 32.0 | % | 21.7 | % | 22.0 | % | |||
Risk-free interest rate | 0.42 | % | 0.12 | % | 0.08 | % | |||
Expected term | 0.5 | 0.5 | 0.5 | ||||||
Dividend yield | 2.8 | % | 1.9 | % | 1.7 | % | |||
For the years ended December 31, 2016, 2015 and 2014, approximately $0.6 million, $0.6 million and $0.5 million, respectively, of expenses related to the ESPP were included in the consolidated statements of operations. For the years ended December 31, 2016, 2015 and 2014, HSNi received cash proceeds from the participating employees of approximately $2.2 million, $2.4 million and $2.0 million, respectively.
Restricted Common Equity in Cornerstone Brands
In connection with the acquisition of Cornerstone Brands by IAC in 2005 certain members of Cornerstone Brand’s management were granted restricted common equity in Cornerstone Brands. These awards were granted on April 1, 2005 and were initially measured at fair value, which was amortized to expense over the vesting period. These awards vested ratably over 4 years, or earlier based upon the occurrence of certain prescribed events. The awards vested in non-voting restricted common shares of Cornerstone Brands. As of December 31, 2016, these awards were significantly out of the money and are not expected to result in any cost should HSNi exercise its call right.
60
NOTE 12—INCOME TAXES
The components of the provision for income taxes are as follows (in thousands):
Year Ended December 31, | ||||||||||||
2016 | 2015 | 2014 | ||||||||||
Current income tax (provision) benefit: | ||||||||||||
Federal | $ | (51,616 | ) | $ | (98,496 | ) | $ | (96,269 | ) | |||
State | (5,552 | ) | (11,829 | ) | (10,289 | ) | ||||||
Current income tax (provision) benefit | (57,168 | ) | (110,325 | ) | (106,558 | ) | ||||||
Deferred income tax benefit (provision): | ||||||||||||
Federal | (12,195 | ) | 9,188 | 1,468 | ||||||||
State | (1,657 | ) | 1,522 | 547 | ||||||||
Deferred income tax benefit (provision) | (13,852 | ) | 10,710 | 2,015 | ||||||||
Income tax (provision) benefit | $ | (71,020 | ) | $ | (99,615 | ) | $ | (104,543 | ) | |||
Current income taxes payable has been reduced by $3.8 million, $17.5 million, and $12.9 million for the years ended December 31, 2016, 2015 and 2014, respectively, for tax deductions attributable to stock-based compensation. The related income tax benefits of this stock-based compensation were recorded as amounts charged or credited to the income tax provision and additional paid-in capital.
The tax effects of cumulative temporary differences that give rise to significant portions of the deferred tax assets and deferred tax liabilities at December 31, 2016 and 2015 are presented below (in thousands). The valuation allowance is related to items for which it is more likely than not that the tax benefit will not be realized.
December 31, | ||||||||
2016 | 2015 | |||||||
Deferred tax assets: | ||||||||
Provision for accrued expenses | $ | 31,659 | $ | 38,472 | ||||
Inventories | 15,166 | 14,996 | ||||||
Stock-based compensation | 15,667 | 14,132 | ||||||
Net operating losses | 556 | 652 | ||||||
Other | 3,556 | 4,160 | ||||||
Total deferred tax assets | 66,604 | 72,412 | ||||||
Less valuation allowance | (533 | ) | (528 | ) | ||||
Net deferred tax assets | 66,071 | 71,884 | ||||||
Deferred tax liabilities: | ||||||||
Intangible assets | (96,627 | ) | (91,051 | ) | ||||
Prepaid expenses | (10,682 | ) | (11,170 | ) | ||||
Property and equipment | (18,522 | ) | (14,161 | ) | ||||
Total deferred tax liabilities | (125,831 | ) | (116,382 | ) | ||||
Net deferred tax liability | $ | (59,760 | ) | $ | (44,498 | ) | ||
At December 31, 2016, HSNi had $5.3 million of net operating loss carryforwards which begin expiring in 2017. HSNi had a valuation allowance of approximately $0.5 million as of December 31, 2016 and 2015. Valuation allowances are recorded for deferred tax assets related to separate state net operating losses.
A reconciliation of the income tax provision to the amounts computed by applying the statutory federal income tax rate to earnings before income taxes is shown as follows (in thousands):
Year Ended December 31, | ||||||||||||
2016 | 2015 | 2014 | ||||||||||
Income tax provision at the federal statutory rate of 35% | $ | (66,405 | ) | $ | (94,099 | ) | $ | (97,135 | ) | |||
State income taxes, net of effect of federal tax benefit | (4,686 | ) | (6,730 | ) | (6,306 | ) | ||||||
Other, net | 71 | 1,214 | (1,102 | ) | ||||||||
Income tax provision | $ | (71,020 | ) | $ | (99,615 | ) | $ | (104,543 | ) | |||
61
A reconciliation of the beginning and ending amount of unrecognized tax benefits, excluding interest, is as follows (in thousands):
2016 | 2015 | 2014 | ||||||||||
Balance at beginning of year | $ | 3,418 | $ | 2,011 | $ | 910 | ||||||
Additions based on tax positions related to the current year | 648 | 630 | 525 | |||||||||
Additions for tax positions of prior years | 536 | 777 | 576 | |||||||||
Reductions for tax positions of prior years | (34 | ) | — | — | ||||||||
Balance at end of year | $ | 4,568 | $ | 3,418 | $ | 2,011 | ||||||
As of December 31, 2016 and 2015, the unrecognized tax benefits, including interest, were $5.4 million and $4.1 million, respectively. At December 31, 2016 and 2015, there are approximately $4.6 million and $3.3 million of unrecognized tax benefits that, if recognized, would affect the annual effective tax rate.
HSNi recognizes interest and, if applicable, penalties related to unrecognized tax benefits in income tax expense. There is no material interest on unrecognized tax benefits included in income tax expense for the years ended December 31, 2016, 2015 and 2014. At December 31, 2016 and 2015, HSNi has no material accrual for the payment of interest or penalties.
HSNi believes that it is reasonably possible that its unrecognized tax benefits could decrease by an immaterial amount within twelve months of the current reporting date due to settlement with the taxing authority.
HSNi is routinely under audit by federal, state, local and foreign tax authorities. These audits include questioning the timing and the amount of deductions and the allocation of income among various tax jurisdictions. Income taxes payable include amounts considered sufficient to pay assessments that may result from examination of prior year returns; however, the amount paid upon resolution of issues raised may differ from the amount provided. Differences between the reserves for tax contingencies and the amounts owed by HSNi are recorded in the period they become known.
The Internal Revenue Service ("IRS") has examined HSNi's consolidated federal income tax return for the year ended December 31, 2010 and performed a limited scope examination of HSNi's consolidated federal income tax return for the year ended December 31, 2011. No material adjustments resulted from these IRS examinations. New York State has completed it’s examination of income tax returns for the periods ended December 31, 2011 through December 31, 2013 without a material adjustment. The State of Florida has begun an income tax examination of HSNi’s tax returns for the years ended December 31, 2013 through December 31, 2015. HSNi does not anticipate any material adjustments to our tax liabilities resulting from this examination.
HSNi and several companies previously owned by IAC/InterActiveCorp, or IAC, were spun-off from IAC on August 20, 2008. In connection with the Spin-off, HSNi entered into a Tax Sharing Agreement with IAC. Pursuant to this agreement, each of the companies included in the Spin-off ("Spincos") was indemnified by IAC for additional tax liabilities related to consolidated or combined federal and state tax returns prepared and filed by IAC prior to the Spin-off. However, each Spinco agreed to, among other things, assume any additional tax liabilities related to their separately filed state income tax returns. All examinations have concluded or statutes of limitations have expired related to IAC's consolidated or combined federal and state tax returns for years including HSNi operations prior to the Spin-off.
The Tax Sharing Agreement also provides, among other things, that each Spinco indemnifies IAC and the other Spincos for any taxes resulting from the Spin-off of such Spinco (and any related interest, penalties, legal and professional fees, and all costs and damages associated with related shareholder litigation or controversies) to the extent such amounts result from any post Spin-off (i) act or failure to act by such Spinco described in the covenants in the Tax Sharing Agreement, (ii) acquisition of equity, securities, or assets of such Spinco or a member of its group, and (iii) breach by such Spinco or any member of its group of any representation or covenant contained in the separation documents or in the documents relating to the IRS private letter ruling and/or tax opinions. This indemnification remains effective until IAC's tax returns for the two year period after the Spin-off are no longer subject to examination.
NOTE 13—COMMITMENTS AND CONTINGENCIES
In the ordinary course of business, HSNi is a party to various audits, claims and lawsuits. These audits or litigation may relate to claims involving property, personal injury, contract, intellectual property (including patent infringement), sales tax, regulatory compliance, employment matters and other claims. HSNi establishes reserves for specific legal, tax or other compliance matters that it has determined the likelihood of an unfavorable outcome is probable and the loss is reasonably estimable. Management has also identified certain legal, tax or other matters where it believes an unfavorable outcome is not
62
probable and, therefore, no reserve is established. Although management currently believes that an unfavorable resolution of claims against HSNi, including claims where an unfavorable outcome is reasonably possible, will not have a material impact on its liquidity, results of operations, financial condition or cash flows, these matters are subject to inherent uncertainties and management’s view of these matters may change in the future and an unfavorable resolution of such a proceeding could have a material impact. Moreover, any claims or regulatory actions against HSNi, whether meritorious or not, could be time-consuming, result in costly litigation, require significant amounts of management time and result in the diversion of significant operational resources.
HSNi leases a satellite transponder, warehouse, stores and office space, equipment and services used in connection with its operations under various operating leases, many of which contain escalation clauses.
Future minimum payments under operating lease agreements are as follows (in thousands):
Years Ending December 31, | |||
2017 | $ | 28,391 | |
2018 | 23,878 | ||
2019 | 21,060 | ||
2020 | 13,838 | ||
2021 | 9,563 | ||
Thereafter | 38,214 | ||
Total | $ | 134,944 | |
Expenses charged under these agreements were $27.9 million, $27.1 million, and $25.1 million for the years ended December 31, 2016, 2015 and 2014, respectively, and were included in "General and administrative" expense in the accompanying consolidated statements of operations.
HSNi also has funding commitments that could potentially require its performance in the event of demands by third parties or contingent events, as follows (in thousands):
Amount of Commitments Expiration Per Period | ||||||||||||||||||||
Total Amounts Committed | Less Than 1 Year | 1 - 3 Years | 3 - 5 Years | More Than 5 Years | ||||||||||||||||
Letters of credit and surety bonds | $ | 13,301 | $ | 13,241 | $ | 60 | $ | — | $ | — | ||||||||||
Purchase obligations | 40,724 | 29,240 | 11,484 | — | — | |||||||||||||||
Total commercial commitments | $ | 54,025 | $ | 42,481 | $ | 11,544 | $ | — | $ | — | ||||||||||
The letters of credit (“LOCs”) primarily consist of trade LOCs, which are used for inventory purchases. Trade LOCs are guarantees of payment based upon the delivery of goods. The surety bonds primarily consist of customs bonds, which relate to the import of merchandise into the United States.
The purchase obligations primarily relate to cable contracts and include obligations for future cable distribution and commission guarantees.
NOTE 14—RELATED PARTY TRANSACTIONS
Relationship Between Liberty Media Corporation and HSNi
Spinco Agreement
In connection with the Spin-off, pursuant to a Spinco Assignment and Assumption Agreement (the “Spinco Agreement”), dated as of August 20, 2008, among HSNi, IAC, Liberty Media Corporation (“Liberty”) and a subsidiary of Liberty that held shares of IAC common stock and IAC Class B common stock (together with Liberty, the “Liberty Parties”), HSNi (i) assumed from IAC all rights and obligations providing for post-Spin-off governance and other arrangements at HSNi under the Spinco Agreement, dated May 13, 2008, among IAC, Liberty and affiliates of Liberty that held shares of IAC common stock and/or Class B common stock at the time such Spinco Agreement was entered into, and (ii) as required by the Spinco Agreement, entered into a registration rights agreement with the Liberty Parties. Following is a summary of the material terms of the Spinco Agreement:
63
Representation of Liberty on the Spinco Boards of Directors
The Spinco Agreement generally provides that so long as Liberty beneficially owns securities of HSNi representing at least 20% of the total voting power of HSNi’s equity securities, Liberty has the right to nominate up to 20% of the directors serving on HSNi’s Board of Directors (rounded up to the nearest whole number). Any director nominated by Liberty must be reasonably acceptable to a majority of the directors on HSNi’s Board who were not nominated by Liberty. All but one of Liberty’s nominees serving on the Board of Directors must qualify as “independent” under applicable stock exchange rules. In addition, the Nominating Committee of the Board may include only “Qualified Directors,” namely directors other than any who were nominated by Liberty, are officers or employees of HSNi or were not nominated by the Nominating Committee of the HSNi Board in their initial election to the Board and for whose election any Liberty Party voted shares.
Acquisition Restrictions
The Liberty Parties have agreed not to acquire beneficial ownership of any equity securities of HSNi (with specified exceptions) unless:
• | the acquisition was approved by a majority of the Qualified Directors; |
• | the acquisition is permitted under the provisions described in “Competing Offers” below; or |
• | after giving effect to the acquisition, Liberty’s ownership percentage of the equity securities of HSNi, based on voting power, would not exceed the Applicable Percentage. |
The “Applicable Percentage” is Liberty’s ownership percentage upon the Spin-off of HSNi, based on voting power (approximately 30%), plus 5%, but in no event more than 35%. Notwithstanding the foregoing, Liberty’s beneficial ownership may increase (and has increased) above the Applicable Percentage as a result of HSNi’s share repurchase program. Following the Spin-off, the Applicable Percentage for the Spinco is reduced for specified transfers of equity securities of the Spinco by the Liberty Parties. During the first two years following the Spin-off, acquisitions by the Liberty Parties were further limited to specified extraordinary transactions and, otherwise, to acquisitions representing no more than one-third of HSNi Common Stock received by the Liberty Parties in the Spin-off:
• | transfers pursuant to a third party tender or exchange offer or in connection with any merger or other business combination, which merger or business combination has been approved by HSNi; |
• | transfers in a public offering in a manner designed to result in a wide distribution, provided that no such transfer is made, to the knowledge of the Liberty Parties, to any person whose ownership percentage (based on voting power) of HSNi’s equity securities, giving effect to the transfer, would exceed 15%; |
• | a transfer of all of the equity securities of HSNi beneficially owned by the Liberty Parties and their affiliates in a single transaction if the transferee’s ownership percentage (based on voting power), after giving effect to the transfer, would not exceed the Applicable Percentage and only if the transferee assumes all of the rights and obligations (subject to limited exceptions) of the Liberty Parties under the Spinco Agreement; |
• | specified transfers in connection with changes in the beneficial ownership of the ultimate parent company of a Liberty Party or a distribution of the equity interests of a Liberty Party or certain similar events; and |
• | specified transfers relating to certain hedging transactions or stock lending transactions in respect of the Liberty Parties’ equity securities in HSNi, subject to specified restrictions. |
Competing Offers
During the period when Liberty continues to have the right to nominate directors to HSNi’s Board of Directors, if the Board of Directors determines to pursue certain types of transactions on a negotiated basis (either through an “auction” or with a single bidder), Liberty is granted certain rights to compete with the bidder or bidders, including the right to receive certain notices and information, subject to specified conditions and limitations. In connection with any such transaction that HSNi is negotiating with a single bidder, the Board of Directors must consider any offer for a transaction made in good faith by Liberty but is not obligated to accept any such offer or to enter into negotiations with Liberty.
If a third party (x) commences a tender or exchange offer for at least 35% of the capital stock of HSNi other than pursuant to an agreement with HSNi or (y) publicly discloses that its ownership percentage (based on voting power) exceeds 20% and HSNi’s Board fails to take certain actions to block such third party from acquiring an ownership percentage of HSNi (based on voting power) exceeding the Applicable Percentage, the Liberty Parties generally will be relieved of the obligations described under “Standstill Restrictions” and “Acquisition Restrictions” above to the extent reasonably necessary to permit Liberty to commence and consummate a competing offer. If Liberty’s ownership percentage (based on voting power) as a result of the consummation of a competing offer in response to a tender or exchange offer described in (x) above exceeds 50%, any
64
consent or approval requirements of the Qualified Directors in the Spinco Agreement will be terminated, and, following the later of the second anniversary of the Spin-off and the date that Liberty’s ownership percentage (based on voting power) exceeds 50%, the obligations described under “Acquisition Restrictions” will be terminated.
Other
Following the Spin-off, amendments to the Spinco Agreement and determinations required to be made thereunder (including approval of transactions between a Liberty Party and HSNi that would be reportable under the proxy rules) will require the approval of the Qualified Directors.
Registration Rights Agreement
Under the registration rights agreement, the Liberty Parties and their permitted transferees (the “Holders”) will be entitled to three demand registration rights (and unlimited piggyback registration rights) in respect of the shares of HSNi common stock received by the Liberty Parties as a result of the Spin-off and other shares of HSNi common stock acquired by the Liberty Parties consistent with the Spinco Agreement (collectively, the “Registrable Shares”). The Holders will be permitted to exercise their registration rights in connection with certain hedging transactions that they may enter into with respect to the Registrable Shares.
HSNi will be obligated to indemnify the Holders, and each selling Holder will be obligated to indemnify HSNi, against specified liabilities in connection with misstatements or omissions in any registration statement.
NOTE 15—SUPPLEMENTAL CASH FLOW INFORMATION
Supplemental Disclosure of Cash Flow Information:
Year Ended December 31, | ||||||||||||
2016 | 2015 | 2014 | ||||||||||
(in thousands) | ||||||||||||
Cash paid during the period for: | ||||||||||||
Income tax payments | $ | 68,898 | $ | 99,012 | $ | 87,787 | ||||||
Income tax refunds | (282 | ) | (102 | ) | (482 | ) | ||||||
Interest payments | 15,027 | 13,087 | 6,142 | |||||||||
Non-cash investing activities: | ||||||||||||
Capital expenditures incurred but paid in advance | — | — | 9,100 | |||||||||
Non-cash financing activities: | ||||||||||||
Effective portion of change in interest rate swap | 3,018 | (1,620 | ) | (1,581 | ) | |||||||
NOTE 16—SHAREHOLDERS’ EQUITY
Stock Purchase Rights
In December 2008, HSNi’s Board of Directors approved the creation of a Series A Junior Participating Preferred Stock, adopted a shareholders rights plan and declared a dividend of one right for each outstanding share of common stock held by our shareholders of record as of the close of business on January 5, 2009. The rights attached to any additional shares of common stock issued after January 5, 2009. Initially, these rights, which trade with the shares of HSNi’s common stock, will not be exercisable. Under the rights plan, these rights will be exercisable if a person or group acquires or commences a tender or exchange offer for 15% or more of HSNi’s common stock (except for certain grandfathered persons, such as Liberty, to which higher thresholds apply). If the rights become exercisable, each right will permit its holder, other than the “acquiring person,” to purchase from us shares of common stock at a 50% discount to the then prevailing market price. As a result, the rights will cause substantial dilution to a person or group that becomes an “acquiring person” on terms not approved by HSNi’s Board of Directors.
65
Accumulated Other Comprehensive (Loss) Income
Accumulated other comprehensive income (loss) includes the cumulative gains and losses of derivative instruments that qualify as cash flow hedges. The following table provides a rollforward of accumulated other comprehensive income (loss) for the years ended December 31, 2016, 2015 and 2014 (in thousands):
2016 | 2015 | 2014 | ||||||||||
Accumulated other comprehensive (loss) income as of January 1, | $ | (95 | ) | $ | 127 | $ | 354 | |||||
Other comprehensive income (loss) before reclassifications | 3,018 | (1,620 | ) | (1,581 | ) | |||||||
Amounts reclassified from accumulated other comprehensive income (loss) to interest expense in the consolidated statements of operations | 707 | 1,263 | 1,215 | |||||||||
Income tax (expense) benefit | (1,410 | ) | 135 | 139 | ||||||||
Other comprehensive income (loss), net of tax | 2,315 | (222 | ) | (227 | ) | |||||||
Accumulated other comprehensive income (loss) as of December 31, | $ | 2,220 | $ | (95 | ) | $ | 127 | |||||
Share Repurchase Program
On September 27, 2011, HSNi’s Board of Directors approved a share repurchase program which allowed HSNi to purchase 10 million shares of its common stock from time to time through privately negotiated and/or open market transactions. In July 2014, HSNi completed its 10 million share repurchase program at an aggregate cost of $451.0 million, representing an average cost of $45.10 per share. All shares were immediately retired upon purchase.
Effective January 27, 2015, HSNi's Board of Directors approved a new share repurchase program which allows HSNi to purchase up to 4 million shares of its common stock from time to time through privately negotiated and/or open market
transactions. The timing of repurchases and actual number of shares repurchased depends on a variety of factors, including the
stock price, corporate and regulatory requirements, restrictions under HSNi’s debt obligations and other market and economic
conditions. As of December 31, 2016, approximately 2.7 million shares remained authorized for repurchase under the program.
The following table summarizes HSNi's share repurchase activity (in thousands, except per share data):
2016 | 2015 | 2014 | ||||||||||
Number of shares repurchased and retired | 357 | 948 | 1,011 | |||||||||
Average price per share | $ | 46.45 | $ | 61.73 | $ | 54.87 | ||||||
Total cost | $ | 16,567 | $ | 58,510 | $ | 55,467 | ||||||
Dividend Policy
During the year ended December 31, 2016, HSNi's Board of Directors approved four quarterly cash dividends totaling $1.40 per common share resulting in dividend payments of approximately $73.2 million. During the year ended December 31, 2015, HSNi’s Board of Directors approved four quarterly cash dividends totaling $1.40 per common share and a special cash dividend of $10.00 per common share that was payable February 19, 2015 resulting in aggregate dividend payments of approximately $597.9 million.
In February 2017, HSNi's Board of Directors approved a quarterly cash dividend of $0.35 per common share. The dividend will be paid March 22, 2017 to HSNi's record holders as of March 8, 2017.
66
NOTE 17—QUARTERLY RESULTS (UNAUDITED)
Quarter Ended (a) | ||||||||||||||||
March 31, | June 30, | September 30, | December 31, | |||||||||||||
(b) | (c) | (d) | ||||||||||||||
(In thousands, except per share data) | ||||||||||||||||
Year Ended December 31, 2016 | ||||||||||||||||
Net sales | $ | 816,765 | $ | 854,308 | $ | 823,023 | $ | 1,073,389 | ||||||||
Gross profit | 289,478 | 311,824 | 280,076 | 335,290 | ||||||||||||
Operating income | 49,829 | 46,214 | 36,875 | 72,890 | ||||||||||||
Net income | 28,585 | 26,445 | 20,158 | 43,520 | ||||||||||||
Net income per share: | ||||||||||||||||
Basic | $ | 0.55 | $ | 0.50 | $ | 0.39 | $ | 0.83 | ||||||||
Diluted | $ | 0.54 | $ | 0.50 | $ | 0.38 | $ | 0.82 | ||||||||
Dividends declared per common share | $ | 0.35 | $ | 0.35 | $ | 0.35 | $ | 0.35 | ||||||||
Year Ended December 31, 2015 | ||||||||||||||||
Net sales | $ | 841,887 | $ | 885,642 | $ | 864,868 | $ | 1,098,178 | ||||||||
Gross profit | 300,206 | 336,537 | 306,274 | 371,546 | ||||||||||||
Operating income | 57,009 | 70,703 | 57,833 | 98,488 | ||||||||||||
Net income | 33,689 | 41,632 | 34,208 | 59,710 | ||||||||||||
Net income per share: | ||||||||||||||||
Basic | $ | 0.64 | $ | 0.79 | $ | 0.65 | $ | 1.14 | ||||||||
Diluted | $ | 0.63 | $ | 0.78 | $ | 0.64 | $ | 1.12 | ||||||||
Dividends declared per common share | $ | 10.35 | $ | 0.35 | $ | 0.35 | $ | 0.35 | ||||||||
(a) | The results of TravelSmith and Chasing Fireflies are included through the date of divestitures on September 8, 2016. |
(b) | The second quarter of 2016 includes an asset impairment charge of $20.4 million, or $0.24 per diluted share, related to the TravelSmith and Chasing Fireflies disposal group. The second quarter of 2015 includes $3.0 million, or $0.03 per diluted share, for certain costs associated with the planned closure of one of HSN's distribution centers as part of its supply chain optimization initiative. |
(c) | The third quarter of 2016 includes the loss on sale of $11.2 million, or $0.13 per diluted share, related to the divestitures of TravelSmith and Chasing Fireflies. The third quarter of 2015 includes a non-cash charge of $5.0 million, or $0.06 per diluted share, at Cornerstone for impairment of intangible assets related to Chasing Fireflies. |
(d) | The fourth quarter of 2016 includes the impact of the supply chain optimization implementation issues which decreased gross profit by approximately $13.0 million and increased operating expenses by approximately $3.0 million, having a combined impact of $0.19 per diluted share. The fourth quarter of 2015 includes $2.0 million, or $0.02 per diluted share, of severance costs associated with a reorganization at HSN. |
(e) | Cornerstone's fourth quarter of 2016 consisted of 14-weeks compared to 13-weeks in the prior year resulting in an additional $15 million in net sales in 2016. |
NOTE 18—RETIREMENT AND SAVINGS PLANS
Effective December 31, 2008, HSNi established the HSN, Inc. Retirement Savings Plan that qualifies under Section 401(k) of the Internal Revenue Code. Participating employees may contribute up to 50% of their pretax salary, up to the statutory limits. For the years ended December 31, 2016, 2015 and 2014, HSNi contributed fifty cents for each dollar a participant contributed of the first 6% of a participant's deferrals. HSNi’s matching contributions were $5.1 million, $5.0 million and $4.6 million for the years ended December 31, 2016, 2015 and 2014, respectively.
Effective January 1, 2014, HSNi initiated a nonqualified deferred compensation plan allowing salary and annual bonus deferrals for qualifying employees as permitted by the Internal Revenue Code. Participant deferrals earn investment returns based on a select number of investment options, including equity and debt mutual funds. HSNi invested comparable amounts in marketable securities through life insurance policies to mitigate the risk associated with the investment return on the employee deferrals. Assets related to the funded portion of the deferred compensation plan are held in a rabbi trust which remains subject to claims of HSNi's general creditors. HSNi remains liable to the participants for the unfunded portion of the plan. HSNi records changes in the fair value of the asset and liability in the statement of operations. As of December 31, 2016 and 2015, the company-owned life insurance policies had a cash surrender value of $3.6 million and $1.9 million, respectively and were recorded in "Other non-current assets" in the consolidated balance sheet. The Plan's deferred compensation liability as of
67
December 31, 2016 and 2015 was $3.6 million and $2.0 million, respectively and was recorded in "Other long-term liabilities" in the consolidated balance sheet.
NOTE 19—COSTS ASSOCIATED WITH AN EXIT ACTIVITY
As part of its supply chain optimization initiative, HSNi announced in June 2015 its plan to close the HSN distribution center in Roanoke, Virginia and expand the capabilities of its distribution center in Piney Flats, Tennessee. The closure will involve the eventual elimination of approximately 350 positions at the Virginia facility. HSNi expects the closure to occur in accordance with a two-year transition plan and be substantially completed in 2017.
HSN expects to incur approximately $4 million to $5 million in total charges related to the closure. These charges include approximately $3 million to $4 million in employee-related expenses, including severance payments and retention incentives. During the years ended December 31, 2016 and 2015, HSN recognized $0 and $3.2 million, respectively, in employee-related costs which are included in "General and administrative” operating expenses in the accompanying consolidated statements of operations.
A summary of HSNi’s liability associated with exit activities, which is recorded in “Accrued expenses and other current liabilities” in the accompanying consolidated balance sheets, are presented in the following table (in thousands):
Employee Related Costs | |||||||
2016 | 2015 | ||||||
Balance at January 1, | $ | 3,221 | $ | — | |||
Provisions | — | 3,132 | |||||
Payments | (121 | ) | — | ||||
Adjustments | — | 89 | |||||
Balance at December 31, | $ | 3,100 | $ | 3,221 | |||
68
NOTE 20—DIVESTITURES
On September 8, 2016, HSNi completed the sale of substantially all of the assets and certain liabilities of Chasing Fireflies and TravelSmith, two of the apparel brands included within the Cornerstone segment. The sale price included $1 million in cash and $2 million of contingent consideration that was based on the achievement of certain performance metrics in 2016 which are not expected to be achieved. During the year ended December 31, 2016, Cornerstone recorded a pre-tax loss on sale of $10.8 million. The transaction included cash charges of approximately $3.5 million related to transactions costs and employee and lease liabilities.
The assets and liabilities of the two brands were classified as held for sale as of June 30, 2016 which resulted in a non-cash asset impairment charge of $20.4 million recorded in the second quarter of 2016 within the Cornerstone segment and was included in "Loss on sale of businesses and asset impairments" expense in the accompanying consolidated statements of operations.
The loss on sale and asset impairment charges related to this sale are recorded in the consolidated statements of operations in the line item “Loss on sale of businesses and asset impairments.” The assets sold were largely represented by $29.3 million of inventory and $8.4 million of other assets, and approximately $8.6 million of current liabilities.
HSNi entered into a transition services agreement with the buyer to provide fulfillment services and various back office support services through February 2017. Charges by HSNi under this transition services agreement of approximately $4.7 million for the year ended December 31, 2016 are recorded in net sales in the consolidated statements of operations.
HSNi determined the sale of these businesses would not represent a strategic shift in its business nor will it have a major effect on its consolidated results of operations, financial position or cash flows. Accordingly, the disposal group is not presented in the consolidated financial statements as a discontinued operation.
69
Schedule II
HSN, INC. AND SUBSIDIARIES
VALUATION AND QUALIFYING ACCOUNTS
(In thousands)
Description | Balance at Beginning of Period | Charges to Earnings | Charges to Other Accounts | Deductions | Balance at End of Period | |||||||||||||||||
2016 | ||||||||||||||||||||||
Allowance for doubtful accounts | $ | 20,631 | $ | 22,768 | $ | 135 | $ | (24,448 | ) | (1) | $ | 19,086 | ||||||||||
Sales return accrual | 39,649 | 595,991 | — | (596,736 | ) | 38,904 | ||||||||||||||||
Deferred tax valuation allowance | 528 | 5 | — | — | $ | 533 | ||||||||||||||||
2015 | ||||||||||||||||||||||
Allowance for doubtful accounts | $ | 18,824 | $ | 34,012 | $ | (803 | ) | $ | (31,402 | ) | (1) | $ | 20,631 | |||||||||
Sales return accrual | 40,789 | 659,481 | — | (660,621 | ) | 39,649 | ||||||||||||||||
Deferred tax valuation allowance | 1,577 | (1,049 | ) | — | — | 528 | ||||||||||||||||
2014 | ||||||||||||||||||||||
Allowance for doubtful accounts | $ | 16,863 | $ | 23,986 | $ | 1,874 | $ | (23,899 | ) | (1) | $ | 18,824 | ||||||||||
Sales return accrual | 40,072 | 655,304 | — | (654,587 | ) | 40,789 | ||||||||||||||||
Deferred tax valuation allowance | 1,495 | 82 | — | — | 1,577 | |||||||||||||||||
(1) | Write-off of uncollectible accounts receivable |
70
ITEM 9. | CHANGES IN AND DISAGREEMENTS WITH ACCOUNTANTS ON ACCOUNTING AND FINANCIAL DISCLOSURE |
None.
ITEM 9A. | CONTROLS AND PROCEDURES |
Disclosure Controls and Procedures
We maintain a system of disclosure controls and procedures designed to provide reasonable assurance that the information required to be disclosed by HSNi in reports that it files and submits under the Exchange Act is recorded, processed, summarized and reported within the time periods specified in the SEC’s rules and forms. Disclosure controls also are designed to reasonably assure that such information is accumulated and communicated to management, including the Chief Executive Officer and Chief Financial Officer, as appropriate, to allow timely decisions regarding required disclosures. Disclosure controls include components of internal control over financial reporting, which consists of control processes designated to provide reasonable assurance regarding the reliability of financial reporting and the preparation of financial statements in accordance with United States generally accepted accounting principles.
We monitor and evaluate on an ongoing basis our disclosure controls and procedures in order to improve their overall effectiveness. In the course of these evaluations, we modify and refine our internal processes as conditions warrant.
Our management, including our Chief Executive Officer and Chief Financial Officer, evaluated the effectiveness of our “disclosure controls and procedures” (as defined in Rule 13a-15(e) promulgated under the Exchange Act) as of December 31, 2016. Based on that evaluation, management has concluded that our disclosure controls and procedures are effective to ensure that information required to be disclosed in the reports that we file or submit under the Exchange Act is recorded, processed, summarized and reported within the time periods specified in the SEC’s rules and forms, and to ensure that information is accumulated and communicated to our management, including the Chief Executive Officer and Chief Financial Officer, as appropriate to allow timely decisions regarding required disclosure.
Management’s Annual Report on Internal Control Over Financial Reporting
Management is responsible for establishing and maintaining adequate “internal control over financial reporting” (as defined in Rule 13a-15(f) under the Exchange Act) for the Company. Our internal control over financial reporting is a process designed to provide reasonable assurance regarding the reliability of financial reporting and the preparation of financial statements for external purposes in accordance with accounting principles generally accepted in the United States. Our management does not expect that our disclosure controls or our internal controls over financial reporting will prevent or detect all errors and all fraud. A control system, no matter how well designed and operated, can provide only reasonable, not absolute, assurance that the control system’s objectives will be met. The design of a control system must reflect the fact that there are resource constraints and the benefits of controls must be considered relative to their costs. The design of any system of controls is based in part on certain assumptions about the likelihood of future events, and there can be no assurance that any design will succeed in achieving its stated goals under all potential future conditions. Over time, controls may become inadequate because of changes in conditions or deterioration in the degree of compliance with policies or procedures.
As required by Rule 13a-15(b) under the Exchange Act, our management evaluated the effectiveness of our internal controls and procedures (as defined by Rule 13a-15(e) and 15d-15(e) under the Exchange Act). In making this assessment, our management used the criteria for effective internal control over financial reporting described in “Internal Control – Integrated Framework” issued by the Committee of Sponsoring Organizations of the Treadway Commission (2013 framework). Based upon that evaluation and criterion, we concluded that as December 31, 2016, our internal control over financial reporting was effective.
Our independent registered certified public accounting firm, Ernst & Young LLP, has issued an attestation report on our internal control over financial reporting. The attestation report is included herein.
Changes in Internal Control Over Financial Reporting
We regularly monitor and evaluate on an ongoing basis our internal control over financial reporting in order to improve its effectiveness. In the course of these evaluations, we modify and refine our internal processes as conditions warrant.
71
As required by Rule 13a-15(d) under the Exchange Act, our management, including our Chief Executive Officer and our Chief Financial Officer, also conducted an evaluation of our internal control over financial reporting to determine whether any changes occurred during the quarter ended December 31, 2016 that have materially affected, or are reasonably likely to materially affect, our internal control over financial reporting. Based on that evaluation, management has concluded that there were no such changes during this period.
72
Report of Independent Registered Certified Public Accounting Firm
The Board of Directors and Shareholders of HSN, Inc.
We have audited HSN, Inc. and subsidiaries’ internal control over financial reporting as of December 31, 2016, based on criteria established in Internal Control — Integrated Framework issued by the Committee of Sponsoring Organizations of the Treadway Commission (2013 framework)(the COSO criteria). HSN, Inc. and subsidiaries’ management is responsible for maintaining effective internal control over financial reporting, and for its assessment of the effectiveness of internal control over financial reporting included in the accompanying management’s annual report on internal control over financial reporting. Our responsibility is to express an opinion on the company’s internal control over financial reporting based on our audit.
We conducted our audit in accordance with the standards of the Public Company Accounting Oversight Board (United States). Those standards require that we plan and perform the audit to obtain reasonable assurance about whether effective internal control over financial reporting was maintained in all material respects. Our audit included obtaining an understanding of internal control over financial reporting, assessing the risk that a material weakness exists, testing and evaluating the design and operating effectiveness of internal control based on the assessed risk, and performing such other procedures as we considered necessary in the circumstances. We believe that our audit provides a reasonable basis for our opinion.
A company’s internal control over financial reporting is a process designed to provide reasonable assurance regarding the reliability of financial reporting and the preparation of financial statements for external purposes in accordance with generally accepted accounting principles. A company’s internal control over financial reporting includes those policies and procedures that (1) pertain to the maintenance of records that, in reasonable detail, accurately and fairly reflect the transactions and dispositions of the assets of the company; (2) provide reasonable assurance that transactions are recorded as necessary to permit preparation of financial statements in accordance with generally accepted accounting principles, and that receipts and expenditures of the company are being made only in accordance with authorizations of management and directors of the company; and (3) provide reasonable assurance regarding prevention or timely detection of unauthorized acquisition, use or disposition of the company’s assets that could have a material effect on the financial statements.
Because of its inherent limitations, internal control over financial reporting may not prevent or detect misstatements. Also, projections of any evaluation of effectiveness to future periods are subject to the risk that controls may become inadequate because of changes in conditions, or that the degree of compliance with the policies or procedures may deteriorate.
In our opinion, HSN, Inc. and subsidiaries maintained, in all material respects, effective internal control over financial reporting as of December 31, 2016, based on the COSO criteria.
We also have audited, in accordance with the standards of the Public Company Accounting Oversight Board (United States), the consolidated balance sheets of HSN, Inc. and subsidiaries as of December 31, 2016 and 2015, and the related consolidated statements of operations, comprehensive income, shareholders’ equity, and cash flows for each of the three years in the period ended December 31, 2016 of HSN, Inc. and subsidiaries and our report dated February 24, 2017 expressed an unqualified opinion thereon.
/s/ Ernst & Young LLP
Tampa, Florida
February 24, 2017
73
ITEM 9B. | OTHER INFORMATION |
None.
PART III
ITEM 10. | DIRECTORS, EXECUTIVE OFFICERS AND CORPORATE GOVERNANCE |
Incorporated by reference from our Proxy Statement for our 2017 Annual Meeting of Shareholders to be filed with the SEC within 120 days after the end of the year ended December 31, 2016.
ITEM 11. | EXECUTIVE COMPENSATION |
Incorporated by reference from our Proxy Statement for our 2017 Annual Meeting of Shareholders to be filed with the SEC within 120 days after the end of the year ended December 31, 2016.
ITEM 12. | SECURITY OWNERSHIP OF CERTAIN BENEFICIAL OWNERS AND MANAGEMENT AND RELATED SHAREHOLDER MATTERS |
Incorporated by reference from our Proxy Statement for our 2017 Annual Meeting of Shareholders to be filed with the SEC within 120 days after the end of the year ended December 31, 2016.
ITEM 13. | CERTAIN RELATIONSHIPS AND RELATED TRANSACTIONS AND DIRECTOR INDEPENDENCE |
Incorporated by reference from our Proxy Statement for our 2017 Annual Meeting of Shareholders to be filed with the SEC within 120 days after the end of the year ended December 31, 2016.
ITEM 14. | PRINCIPAL ACCOUNTANT FEES AND SERVICES |
Incorporated by reference from our Proxy Statement for our 2017 Annual Meeting of Shareholders to be filed with the SEC within 120 days after the end of the year ended December 31, 2016.
74
PART IV
ITEM 15. | EXHIBITS AND FINANCIAL STATEMENT SCHEDULES |
(a) | The following documents are filed as part of this report: |
1. | Financial Statements. |
Financial statements filed as part of this Form 10-K are listed under Item 8.
2. | Financial Statement Schedules. |
Financial statement schedules filed as part of this Form 10-K are listed under Item 8. All other schedules have been omitted because they are either not applicable or not required under the instructions contained in Regulation S-X because the information called for is contained in the financial statements and notes thereto.
3. | Exhibits. |
The documents set forth below, numbered in accordance with Item 601 of Regulation S-K, are filed herewith or incorporated herein by reference to the location indicated.
Exhibit No. | Description of Document | Method of Filing | ||
3.1 | Amended and Restated Certificate of Incorporation of HSN, Inc. | Exhibit 3.1 to the Company’s Current Report on Form 8-K filed August 25, 2008 | ||
3.2 | Amended and Restated By-laws of HSN, Inc. | Exhibit 3.1 to the Company’s Current Report on Form 8-K filed February 14, 2014 | ||
3.3 | Certificate of Designations, Preferences and Rights to Series A Junior Participating Preferred Stock | Exhibit 3.3 to the Company’s Annual Report on Form 10-K filed March 31, 2009 | ||
4.1 | Rights Agreement, dated as of December 23, 2008, between HSN, Inc. and The Bank of New York Mellon, as Rights Agent. | Exhibit 4.1 to the Company’s Current Report on Form 8-K filed December 29, 2008 | ||
10.1 | Separation and Distribution Agreement, dated August 20, 2008, by and among HSN, Inc., Interval Leisure Group, Inc., Ticketmaster, Tree.com, Inc. and IAC/InterActiveCorp | Exhibit 10.1 to the Company’s Current Report on Form 8-K filed August 25, 2008 | ||
10.2 | Tax Sharing Agreement, dated August 20, 2008, among HSN, Inc., Interval Leisure Group, Inc., Ticketmaster, Inc., Tree.com and IAC/InterActive Corp | Exhibit 10.2 to the Company’s Current Report on Form 8-K filed August 25, 2008 | ||
10.3 | Employee Matters Agreement, dated August 20, 2008, among HSN, Inc., Interval Leisure Group, Inc., Ticketmaster, Tree.com, Inc. and IAC/InterActiveCorp | Exhibit 10.3 to the Company’s Current Report on Form 8-K filed August 25, 2008 | ||
75
Exhibit No. | Description of Document | Method of Filing | ||
10.4 | Registration Rights Agreement, dated as of August 20, 2008, among Liberty Media Corporation, the Liberty Parties (as defined in the Agreement) and HSN, Inc. | Exhibit 10.5 to the Company’s Current Report on Form 8-K filed December 29, 2008 | ||
10.5 | Spinco Assignment and Assumption Agreement, dated as of August 20, 2008, by and among IAC/InterActive Corp, HSN, Inc., Liberty Media Corporation and Liberty USA Holdings, LLC | Exhibit 10.6 to the Company’s Current Report on Form 8-K filed August 25, 2008 | ||
10.6 | Spinco Agreement, dated as of May 13, 2008, between IAC/InterActiveCorp, Liberty Media Corp., LMC Silver King, Inc., Liberty HSN II, Inc., LMC USA VIII, Inc., LMC USA IX, Inc., LMC USA XI, Inc., LMC USA XII, Inc., LMC USA XIII, Inc., LMC USA XIV, Inc., LMC USA XV, Inc., Liberty Tweety, Inc., BDTV Inc., BDTV II Inc., BDTV III Inc., BDTV IV Inc. and Barry Diller | Exhibit 10.1 to IAC/InterActiveCorp’s Current Report on Form 8-K (SEC File No. 0-20570) dated May 16, 2008 and incorporated herein by reference | ||
10.7 | Credit Agreement dated as of April 24, 2012, among HSN, Inc., as Borrower; Bank of America, N.A., as Administrative Agent and Collateral Agent; JPMorgan Chase Bank, N.A., Wells Fargo Bank, National Association, and Barclays Bank PLC, each as a Syndication Agent; Branch Banking & Trust, Regions Bank, and Union Bank, each as a Documentation Agent; and Merrill Lynch, Pierce, Fenner & Smith Incorporated, J.P. Morgan Securities LLC, Wells Fargo Securities, LLC and Barclays Bank PLC, as Joint Lead Arrangers and Joint Book Managers | Exhibit 10.1 to the Company’s Current Report on Form 8-K filed April 25, 2012 | ||
10.8 | Pledge Agreement dated as of April 24, 2012, by the Credit Parties (as defined in the Credit Agreement dated April 24, 2012) and Bank of America, N.A., as Collateral Agent | Exhibit 10.2 to the Company’s Current Report on Form 8-K filed April 25, 2012 | ||
10.9 | Credit Agreement dated as of January 27, 2015 by and among HSN, Inc. and certain of its subsidiaries, Bank of America, N.A., as Administrative Agent and Collateral Agent; JPMorgan Chase Bank, N.A., and Wells Fargo Bank, National Association, each as a Syndication Agent; Fifth Third Bank, Regions Bank, MUFG Union Bank, Branch Banking and Trust Company, BBVA Compass Bank and PNC Bank, National Association, each as a Documentation Agent; and Bank of America Merrill Lynch, J.P. Morgan Securities LLC, and Wells Fargo Securities, LLC, as Joint Lead Arrangers and Joint Bookrunners | Exhibit 10.1 to the Company’s Current Report on Form 8-K filed January 28, 2015 | ||
10.10 | Pledge Agreement dated as of January 27, 2015, by the Credit Parties (as defined in the Credit Agreement dated January 27, 2015) and Bank of America, N.A, as Collateral Agent. | Exhibit 10.1 to the Company’s Current Report on Form 8-K filed January 28, 2015 | ||
10.11 | Employment Agreement between Mindy Grossman and HSN, Inc., dated as of July 29, 2008* | Exhibit 10.5 to the Company’s Registration Statement on Form S-1 (Registration No. 333-152697) filed August 1, 2008 | ||
* Reflects management contracts and management and director compensation plans. | ||||
76
Exhibit No. | Description of Document | Method of Filing | ||
10.12 | First Amendment to Employment Agreement between Mindy Grossman and HSN, Inc., dated as of August 5, 2010* | Exhibit 10.1 to the Company’s Current Report on Form 8-K filed August 9, 2010 | ||
10.13 | HSN, Inc. Second Amended and Restated 2008 Stock and Annual Incentive Plan* | Exhibit 10.13 to the Company's Annual Report on Form 10-K filed February 20, 2014 | ||
10.14 | Amended and Restated Deferred Compensation Plan for Non-Employee Directors* | Exhibit 10.14 to the Company’s Annual Report on Form 10-K filed March 31, 2009 | ||
10.15 | Form of Stock Appreciation Right Agreement* | Filed herewith | ||
10.16 | Form of Restricted Stock Unit Agreement* | Exhibit 10.16 to the Company's Annual Report on Form 10-K filed February 24, 2016 | ||
10.17 | Form of Performance Share Unit Agreement* | Exhibit 10.23 to the Company's Annual Report on Form 10-K filed February 24, 2016 | ||
10.18 | Form of Stock Option Agreement* | Exhibit 10.20 to the Company’s Annual Report on Form 10-K filed March 31, 2009 | ||
10.19 | Form of Restricted Stock Units Agreement (for Non-Employee Directors)* | Exhibit 10.22 to the Company’s Annual Report on Form 10-K filed March 31, 2009 | ||
10.20 | Form of Deferred Restricted Stock Unit Agreement* | Exhibit 10.1 to the Company’s Quarterly Report on Form 10-Q filed November 6, 2013 | ||
10.21 | Named Executive Officer and EVP Severance Plan* | Exhibit 10.1 to the Company’s Current Report on Form 8-K filed November 24, 2009 | ||
10.22 | Executive Severance Plan* | Exhibit 10.25 to the Company’s Annual Report on Form 10-K filed March 4, 2010 | ||
10.23 | Form of Performance Cash Award Agreement* | Exhibit 10.21 to the Company's Annual Report on Form 10-K filed February 21, 2013 | ||
10.24 | Employee Stock Purchase Plan | Exhibit 10.3 to the Company’s Quarterly Report on Form 10-Q filed August 4, 2010 | ||
10.25 | Form of Deferred Share Unit Agreement* | Exhibit 10.23 to the Company's Annual Report on Form 10-K filed February 23, 2012 | ||
10.26 | Form of Performance Award Agreement* | Exhibit 10.24 to the Company's Annual Report on Form 10-K filed February 21, 2013 | ||
10.27 | Form of Market Stock Unit Agreement* | Exhibit 10.2 to the Company’s Quarterly Report on Form 10-Q filed November 6, 2013 | ||
10.28 | HSN, Inc. Nonqualified Deferred Compensation Plan | Exhibit 10.27 to the Company's Annual Report on Form 10-K filed February 20, 2014 | ||
10.29 | Amendment No. 1 to the Credit Agreement dated as of May 29, 2015 by and among HSN, Inc. and certain of its subsidiaries, Bank of America, N.A., as Administrative Agent and Collateral Agent; JPMorgan Chase Bank, N.A., and Wells Fargo Bank, National Association, each as a Syndication Agent; Fifth Third Bank, Regions Bank, MUFG Union Bank, Branch Banking and Trust Company, BBVA Compass Bank and PNC Bank, National Association, each as a Documentation Agent; and Bank of America Merrill Lynch, J.P. Morgan Securities LLC, and Wells Fargo Securities, LLC, as Joint Lead Arrangers and Joint Bookrunners | Exhibit 10.1 to the Company's Quarterly Report on Form 10-Q filed August 6, 2015 | ||
12.1 | Computation of Ratio of Earnings to Fixed Charges | Filed herewith | ||
21.1 | Subsidiaries of HSN, Inc. | Filed herewith | ||
23.1 | Consent of Independent Registered Certified Public Accounting Firm | Filed herewith | ||
77
* Reflects management contracts and management and director compensation plans. | ||||
78
Exhibit No | Description of Document | Method of Filing | ||
31.1 | Certification of the Chief Executive Officer pursuant to Rule 13a-14(a) or Rule 15d-14(a) of the Securities Exchange Act of 1934 as adopted pursuant to Section 302 of the Sarbanes-Oxley Act | Filed herewith | ||
31.2 | Certification of the Chief Financial Officer pursuant to Rule 13a-14(a) or Rule 15d-14(a) of the Securities Exchange Act of 1934 as adopted pursuant to Section 302 of the Sarbanes-Oxley Act | Filed herewith | ||
32.1 | Certification of the Chief Executive Officer pursuant to 18 U.S.C. Section 1350 as adopted pursuant to Section 906 of the Sarbanes-Oxley Act | Filed herewith | ||
32.2 | Certification of the Chief Financial Officer pursuant to 18 U.S.C. Section 1350 as adopted pursuant to Section 906 of the Sarbanes-Oxley Act | Filed herewith | ||
101 | The following financial information from HSNi’s Annual Report on Form 10-K for the fiscal year ended December 31, 2016, formatted in XBRL (eXtensible Business Reporting Language) and furnished electronically herewith: (i) Consolidated Statements of Operations for the Years Ended December 31, 2016, 2015, and 2014, (ii) Consolidated Balance Sheets as of December 31, 2016 and 2015, (iii) Consolidated Statements of Shareholders’ Equity, (iv) Consolidated Statements of Cash Flows for the Years Ended December 31, 2016, 2015, and 2014, (v) Notes to the Consolidated Financial Statements, and (vi) financial statement schedule. | |||
79
SIGNATURES
Pursuant to the requirements of Section 13 or 15(d) of the Securities Exchange Act of 1934, the registrant has duly caused this report to be signed on its behalf by the undersigned, thereunto duly authorized.
HSN, INC. | ||||||
Date: February 24, 2017 | By: | /S/ Mindy Grossman | ||||
Mindy Grossman, Chief Executive Officer (Principal Executive Officer) | ||||||
Date: February 24, 2017 | By: | /S/ Rod Little | ||||
Rod Little, Chief Financial Officer (Principal Financial and Accounting Officer) | ||||||
Pursuant to the requirements of the Securities Exchange Act of 1934, this Annual Report has been signed below by the following persons on behalf of the Registrant and in the capacities indicated as of February 28, 2017.
/S/ Mindy Grossman | Chief Executive Officer and Director (Principal Executive Officer) | |||
Mindy Grossman | ||||
/S/ Rod Little | Chief Financial Officer (Principal Financial and Accounting Officer) | |||
Rod Little | ||||
/S/ Courtnee Chun | ||||
Courtnee Chun | Director | |||
/S/ William Costello | ||||
William Costello | Director | |||
/S/ Fiona Dias | ||||
Fiona Dias | Director | |||
/S/ James Follo | ||||
James Follo | Director | |||
/S/ Stephanie Kugelman | ||||
Stephanie Kugelman | Director | |||
/S/ Arthur Martinez | ||||
Arthur Martinez | Chairman of the Board of Directors | |||
/S/ Thomas McInerney | ||||
Thomas McInerney | Director | |||
/S/ Matthew Rubel | ||||
Matthew Rubel | Director | |||
/S/ Ann Sarnoff | ||||
Ann Sarnoff | Director | |||
80
EXHIBIT INDEX
Exhibit No. | Description of Document | ||
10.15 | Form of Stock Appreciation Right Agreement | ||
12.1 | Computation of Ratio of Earnings to Fixed Charges | ||
21.1 | Subsidiaries of HSN, Inc. | ||
23.1 | Consent of Independent Registered Certified Public Accounting Firm | ||
31.1 | Chief Executive Officer Certification Pursuant to Rule 13a-14 of the Securities Exchange Act of 1934, as adopted pursuant to Section 302 of the Sarbanes-Oxley Act of 2002. | ||
31.2 | Chief Financial Officer Certification Pursuant to Rule 13a-14 of the Securities Exchange Act of 1934, as adopted pursuant to Section 302 of the Sarbanes-Oxley Act of 2002. | ||
32.1 | Certification of Chief Executive Officer pursuant to Section 1350, Chapter 63 of Title 18, United States Code, as adopted pursuant to Section 906 of the Sarbanes-Oxley Act of 2002. | ||
32.2 | Certification of Chief Financial Officer pursuant to Section 1350, Chapter 63 of Title 18, United States Code, as adopted pursuant to Section 906 of the Sarbanes-Oxley Act of 2002. | ||
101 | The following financial information from HSNi’s Annual Report on Form 10-K for the fiscal year ended December 31, 2016, formatted in XBRL (eXtensible Business Reporting Language) and filed electronically herewith: (i) Consolidated Statements of Operations for the Years Ended December 31, 2016, 2015, and 2014, (ii) Consolidated Balance Sheets as of December 31, 2016 and 2015, (iii) Consolidated Statements of Shareholders’ Equity, (iv) Consolidated Statements of Cash Flows for the Years Ended December 31, 2016, 2015, and 2014, (v) Notes to the Consolidated Financial Statements, and (vi) financial statement schedule. | ||