Attached files
| file | filename |
|---|---|
| EX-32.1 - EXHIBIT 32.1 - GENERAL CABLE CORP /DE/ | bgc-20161231_ex321.htm |
| EX-31.2 - EXHIBIT 31.2 - GENERAL CABLE CORP /DE/ | bgc-20161231_ex312.htm |
| EX-31.1 - EXHIBIT 31.1 - GENERAL CABLE CORP /DE/ | bgc-20161231_ex311.htm |
| EX-24.1 - EXHIBIT 24.1 - GENERAL CABLE CORP /DE/ | bgc-20161231_ex241.htm |
| EX-23.1 - EXHIBIT 23.1 - GENERAL CABLE CORP /DE/ | bgc-20161231_ex231.htm |
| EX-21.1 - EXHIBIT 21.1 - GENERAL CABLE CORP /DE/ | bgc-20161231_ex211.htm |
| EX-12.1 - EXHIBIT 12.1 - GENERAL CABLE CORP /DE/ | bgc-20161231_ex121.htm |
| EX-10.15 - EXHIBIT 10.15 - GENERAL CABLE CORP /DE/ | bgc-20161231_ex1015.htm |
| EX-10.14 - EXHIBIT 10.14 - GENERAL CABLE CORP /DE/ | bgc-20161231_ex1014.htm |
UNITED STATES SECURITIES AND EXCHANGE COMMISSION
Washington, D.C. 20549
FORM 10-K
(Mark One)
þ | ANNUAL REPORT PURSUANT TO SECTION 13 OR 15(d) OF THE SECURITIES EXCHANGE ACT OF 1934 | |
For the fiscal year ended December 31, 2016
OR
o | TRANSITION REPORT PURSUANT TO SECTION 13 OR 15(d) OF THE SECURITIES EXCHANGE ACT OF 1934 | |
For the transition period from to .
Commission file number: 1-12983
GENERAL CABLE CORPORATION
(Exact name of registrant as specified in its charter)
Delaware | 06-1398235 | |
(State or other jurisdiction of | (I.R.S. Employer Identification No.) | |
incorporation or organization) | ||
4 Tesseneer Drive | 41076-9753 | |
Highland Heights, KY | (Zip Code) | |
(Address of principal executive offices) | ||
Registrant’s telephone number, including area code: (859) 572-8000
Securities Registered Pursuant to Section 12(b) of the Act:
Title of each class | Name of each exchange on which registered | |
Common Stock, $.01 Par Value | New York Stock Exchange | |
Securities Registered Pursuant to Section 12(g) of the Act: None
Indicate by check mark if the registrant is a well-known seasoned issuer, as defined in Rule 405 of the Securities Act. Yes þ No o
Indicate by check mark if the registrant is not required to file reports pursuant to Section 13 or Section 15(d) of the Act. Yes o No þ
Indicate by check mark whether the registrant (1) has filed all reports required to be filed by Section 13 or 15(d) of the Securities Exchange Act of 1934 during the preceding 12 months (or for such shorter period that the registrant was required to file such reports), and (2) has been subject to such filing requirements for the past 90 days. Yes þ No o
Indicate by check mark whether the registrant has submitted electronically and posted on its corporate Web site, if any, every Interactive Data File required to be submitted and posted pursuant to Rule 405 of Regulation S-T (§ 232.405 of this chapter) during the preceding 12 months (or for such shorter period that the registrant was required to submit and post such files). Yes þ No o
Indicate by check mark if disclosure of delinquent filers pursuant to Item 405 of Regulation of S-K (§229.405 of this chapter) is not contained herein, and will not be contained, to the best of the registrant’s knowledge, in definitive proxy or information statements incorporated by reference in Part III of this Form 10-K or any amendment to this Form 10-K. o
Indicate by check mark whether the registrant is a large accelerated filer, an accelerated filer, a non-accelerated filer, or a smaller reporting company. See the definitions of “large accelerated filer” “accelerated filer" and “smaller reporting company” in Rule 12b-2 of the Exchange Act.
Large accelerated filer þ | Accelerated filer o | Non-accelerated filer o | Smaller reporting company o | |||
Indicate by check mark whether the registrant is a shell company (as defined in Rule 12b-2 of the Act). Yes o No þ
The aggregate market value of the registrant’s Common Stock held by non-affiliates of the registrant was $625.3 million at July 1, 2016 (based upon non-affiliate holdings of 48,396,636 shares and a market price of $12.92 per share).
As of February 15, 2017 there were 49,571,334 shares of the registrant’s Common Stock outstanding.
DOCUMENTS INCORPORATED BY REFERENCE:
Portions of the definitive Proxy Statement for the registrant’s Annual Meeting of Shareholders to be filed with the Securities and Exchange Commission within 120 days after December 31, 2016 have been incorporated by reference into Part III of this Annual Report on Form 10-K.
GENERAL CABLE CORPORATION AND SUBSIDIARIES
INDEX TO ANNUAL REPORT
ON FORM 10-K
PAGE | |
2
PART I.
ITEM 1. | BUSINESS |
General Cable Corporation ("the Company") is a global leader in the development, design, manufacture, marketing and distribution of copper, aluminum and fiber optic wire and cable products for use in the energy, industrial, construction, specialty and communications markets. The Company additionally engages in the design, integration, and installation on a turn-key basis for products such as high and extra-high voltage terrestrial and submarine systems. The Company's guiding principles are as follows:
• | Executing the implementation of the Company's strategy to deliver increased operating income margins and returns from the Company's core strategic operations in North America, Latin America and Europe by leveraging economies of scale and capitalizing on the Company's leading positions across key markets where the Company has built long-standing customer relationships, efficient supply chains and a wide range of product offerings; |
• | Simplifying the geographic portfolio and reducing operational complexity by continuing its strategy to exit operations in Africa and Asia Pacific; |
• | Aligning organization structure to capitalize on the Company's leading market positions to benefit from key end markets, such as electric utility, industrial and communications; |
• | Strengthening and expanding customer relationships by providing high quality product lines and customer service; |
• | Continuing to increase cash flow through operational excellence by leveraging the Company's operating systems, logistical expertise, Lean Six Sigma manufacturing tools and techniques to improve the Company's cost position to increase margins and delivering improved returns through restructuring initiatives; |
• | Managing the Company's product portfolio by pursuing market share in faster growing and value added product lines; |
• | Enhancing organization capabilities by leveraging the Company's diversity and intellectual property through the sharing of best practices across the organization; and |
• | Cultivating a high performance culture with focus on operational execution, compliance, sustainability, safety, and innovation. |
By operating under these guiding principles, the Company has been able to build a strong market position in the areas in which it competes. These guiding principles are the foundation of the Company's strategic roadmap developed in 2015 that focuses on optimization of the portfolio, developing leading cost and efficiency positions, growth through innovation and cultivation of a high-performance culture. In 2016, the Company achieved significant progress in the execution of the strategic roadmap designed to transform the Company into a more focused, efficient and innovative organization.
The Company considers its key performance indicators to be volume, as measured in metal pounds sold, operating income, net income, adjusted operating income, earnings before interest, taxes, depreciation and amortization ("EBITDA"), earnings per share, operating cash flows, cash conversion, working capital efficiency and returns on capital employed and invested capital.
The Company is a Delaware corporation and was incorporated in 1994. The Company and its predecessors have served various wire and cable markets for over 150 years. The Company's immediate predecessor was a unit of American Premier Underwriters, Inc. (“American Premier”), previously known as The Penn Central Corporation. American Premier acquired the Company's existing wire and cable business in 1981. In 1994, a subsidiary of Wassall PLC acquired the predecessor by purchase of General Cable's outstanding subordinated promissory note, the General Cable common stock held by American Premier and a tender offer for the publicly-held General Cable common stock. In 1997, Wassall consummated public offerings for the sale of all of its interest in General Cable's common stock. The Company has operated as an independent public company since completion of the offerings and its common stock is traded on the New York Stock Exchange under the ticker symbol, BGC.
For purposes of this report, unless the context otherwise requires, all references herein to the “Company,” “General Cable,” “we,” “us,” and “our” shall refer to General Cable Corporation and its subsidiaries.
Business Segments
The Company's operating structure is the basis for its financial reporting. The Company's four geographic operating and reportable segments are North America, Europe, Latin America, and Africa/Asia Pacific. Additional financial information regarding the segments appears in Note 18 - Segment Information.
North America
The North America segment engages in the development, design, manufacture, marketing and distribution of copper, aluminum and fiber optic wire and cable products for the energy, industrial, construction, specialty and communications markets as well as manufacture and distribution of rod mill wire and cable products primarily in the United States and Canada. The North America segment contributed approximately 53%, 51% and 43% of the Company’s consolidated revenues for 2016, 2015 and 2014, respectively.
3
The North America segment primarily consists of 17 manufacturing facilities across the region. In 2016, the Company has continued to execute its restructuring programs in North America, including the closure and/or sale of three manufacturing facilities.
Additionally, the North America segment has regional centers of excellence and state-of-the-art laboratories for technical expertise and innovation in material technology and compounding, electrical testing, data cables, and specialty and military cables.
Europe
The Europe segment engages in the development, design, manufacture, marketing and distribution of copper, aluminum and fiber optic wire and cable products for the energy, industrial, construction, specialty and communications markets with operations in France, Germany, Norway, Portugal and Spain, and sells into markets throughout Europe, Latin America, Africa, Asia and North America. Additionally, the Europe segment engages in the design, integration, and installation on a turn-key basis of products such as high and extra-high voltage terrestrial and submarine power and communication systems around the world. The Europe segment contributed approximately 23%, 21% and 22% of the Company’s consolidated revenues for 2016, 2015 and 2014, respectively.
The Europe segment primarily consists of 6 manufacturing facilities across the region. In 2016, the Company has continued to execute its restructuring programs in Europe. The Europe segment has regional centers of excellence and state-of-the-art laboratories for high and extra-high voltage power cables and systems, submarine power and communications systems, and halogen-free flame retardant technology and compounding.
Latin America
The Latin America segment engages in the development, design, manufacture, marketing and distribution of copper and aluminum wire and cable products for use in the energy, industrial, construction, specialty and communications markets as well as manufacture and distribution of rod mill wire and cable products. The principal Latin America operations are located in Brazil, Chile, Colombia, Costa Rica and Mexico. The Latin America segment contributed approximately 17%, 16% and 19% of the Company’s consolidated revenues in 2016, 2015 and 2014, respectively.
The Latin America segment primarily consists of 6 manufacturing facilities across the region. In 2016, the Company has continued to execute its restructuring programs in Latin America, including the closure of two manufacturing facilities. The Latin America segment has regional centers of excellence and state-of-the-art laboratories for rod fabrication and drawing.
Africa/Asia Pacific
The Africa/Asia Pacific segment engages in the development, design, manufacture, marketing and distribution of copper and aluminum wire and cable products for use in the energy, industrial, construction, specialty and communications markets as well as manufacture and distribution of rod mill wire and cable products. The Africa/Asia Pacific manufacturing operations are primarily located in Algeria, Angola, China and New Zealand. The Africa/Asia Pacific segment contributed approximately 7%, 12% and 16% of the Company’s consolidated revenues in 2016, 2015 and 2014, respectively.
The Africa/Asia Pacific segment primarily consists of 4 manufacturing facilities across the region. In October 2014, the Company announced the intent to divest all of its operations in Asia Pacific and Africa. As part of the October 2014 announcement, the Company completed the following as of December 31, 2016:
Entity | Sale / Closure | Sale / Closure Date | ||
General Cable Phoenix South Africa Pty. Ltd. (" South Africa - Durban") | Closure | Fourth Quarter 2016 | ||
National Cables (Pty) Ltd. ("South Africa - National Cables") | Closure | Fourth Quarter 2016 | ||
Metal Fabricators of Zambia PLC ("Zambia") - 75.39% interest | Sale | Third Quarter 2016 | ||
General Cable S.A.E. ("Egypt") | Sale | Second Quarter 2016 | ||
General Cable Energy India Private Ltd. ("India") | Sale | First Quarter 2016 | ||
Phelps Dodge International Thailand ("Thailand") - 75.47% interest | Sale | Third Quarter 2015 | ||
Dominion Wire and Cables ("Fiji") - 51% interest | Sale | First Quarter 2015 | ||
Keystone Electric Wire and Cable ("Keystone") - 20% interest | Sale | First Quarter 2015 | ||
Phelps Dodge International Philippines, Inc. ("PDP") - 60% interest | Sale | Fourth Quarter 2014 | ||
Phelps Dodge Philippines Energy Products Corp (“PDEP”) | Sale | Fourth Quarter 2014 | ||
4
Products
The Company serves its customers through a network of manufacturing facilities with worldwide sales representation and distribution. The Company believes it has one of the most diversified product lines in the industry to meet customers' needs. The various wire and cable product lines are sold and manufactured by all geographic segments. Revenue by product line and geographic region is included in Note 18 - Segment Information. The majority of products sold by the Company's four segments include the following:
Product Category | Principal Products | Principal Markets | Principal End-Users |
Electric Utility | - low- and medium-voltage distribution cables - high- and extra-high-voltage underground transmission cables and installation - bare overhead conductors - submarine transmission and distribution cables | - electric utilities | - investor-owned utility companies - government-owned and state and local public power companies - contractors |
Electrical Infrastructure | - rubber- and plastic-jacketed wire and cables - low- and medium-voltage industrial power cables - cable wire harnesses - rail and mass transit cables - shipboard cables - oil and gas cables - armored mining cables - alternative energy power generation cables | - power generating stations; solar, nuclear and wind applications - industrial applications; marine, mining, oil and gas, transit, machine builders and entertainment - automotive - military - infrastructure - industrial power and control - medical | - industrial consumers - contractors - electrical distributors - electrical retailers - OEM (original equipment manufacturers) - DIY (do-it-yourself customers) - industrial equipment manufacturers - military customers |
Communications | - high-bandwidth twisted copper and fiber optic cables - multi-conductor and multi-pair fiber and copper networking cables - outside plant telecommunications exchange cables - coaxial cables - fiber-optic submarine cable systems - low detection profile cables - turn-key submarine networks - offshore integration systems | - telecom local loop - enterprise networking and multimedia applications - industrial instrumentation control - commercial - residential - building management - entertainment - renewable energy | - telecommunications system operators - contractors - telecommunications distributors - system integrators - OEM - DIY |
Construction | - construction cable - flexible cords; halogen-free, low-smoke and flame retardant cables | - residential and non-residential construction | - retail home centers - electricians - distributors - installation and engineering contractors - DIY |
Rod Mill | - copper rod - aluminum rod | - wire and cable industry | - wire and cable manufacturers |
Industry and Market Overview
The Company produces and sells to a variety of end markets including markets for electric utility, electrical infrastructure, communications, construction and rod mill products. The underlying growth drivers in each of these end markets are similar and dependent on healthy GDP rates and construction cycles. Additionally, the global electric utility industry is dependent on a variety of factors including electricity consumption and grid integration, housing and construction, including the urbanization of emerging economies, governmental energy and tax policy, the investment policies of electric utilities, as well as renewable energy initiatives primarily related to wind and solar power. The market for electrical infrastructure cable products has many sub-sectors and niches and is heavily influenced by the level of industrial construction spending, the level of capital equipment investment and transit, marine, and mining activity as well as renewable energy initiatives primarily related to terrestrial and offshore drilling. The market for communications products is primarily influenced by residential and non-residential construction and fiber-to-the-home initiatives as well as the level of broadband investments. The market demand for construction products is heavily influenced by the level of residential and non-residential construction spending. Rod mill product demand is principally driven by fundamental demand stemming from economic growth and development.
5
Customers
The Company has a regionally coordinated global direct sales force and in certain of its businesses operates under supply agreements of varying lengths. These agreements generally do not require a minimum level of sales and customers are not contractually obligated to buy the Company's products exclusively; however, these agreements generally provide adjustments to selling prices to reflect fluctuations in the cost of raw materials and typically have one to four year terms. The primary agreements are strategic alliances with a number of major utility customers around the world. The Company sells direct to utilities, independent distributors, retailers, contractors, and OEMs.
Raw Materials
The principal raw materials used by the Company in the manufacturing of its wire and cable products are copper and aluminum. The Company's products are material intensive with copper and aluminum comprising the major cost components for cable products. At current metal prices, material costs are approximately 85% of total product costs with copper and aluminum metal costs comprising approximately 45% of total product costs for the year ended December 31, 2016. The average price of copper and aluminum as traded on the London Metal Exchange (“LME”) and Commodity Exchange, Inc ("COMEX") per quarter for the last three years is:
Quarter 1 | Quarter 2 | Quarter 3 | Quarter 4 | Full Year | |
Copper Cathode | |||||
2016 | $2.11 | $2.13 | $2.16 | $2.39 | $2.20 |
2015 | 2.66 | 2.77 | 2.40 | 2.20 | 2.51 |
2014 | 3.24 | 3.10 | 3.16 | 2.98 | 3.12 |
Aluminum | |||||
2016 | 0.77 | 0.79 | 0.80 | 0.85 | 0.80 |
2015 | 1.04 | 0.92 | 0.80 | 0.76 | 0.88 |
2014 | 0.97 | 1.00 | 1.11 | 1.12 | 1.05 |
The price of copper and aluminum as traded on the LME and COMEX has historically been subject to considerable volatility. Volatility in the price of copper and aluminum and other raw materials, as well as fuel and energy, may in turn lead to significant fluctuations in our cost of sales or revenues. A significant portion of the Company's electric utility and telecommunications business and, to a lesser extent, the Company's electrical infrastructure business has metal escalators and de-escalators included in customer contracts under a variety of price setting and recovery formulas. The remainder of the Company's business requires that volatility in the cost of metals be recovered through negotiated price changes with customers. In these instances, the ability to change the Company's selling prices may lag the movement in metal prices by a period of time as the customer price changes are implemented.
Therefore, in the short-term, during periods of escalating raw material cost inputs, to the extent the Company is able to increase prices in the market to recover the higher raw material costs, the Company will generally experience an increase in gross profit from the sale of its relatively lower value inventory as computed under the weighted average inventory costing method. If the Company is unable to increase prices with the rise in the raw material market prices due to low levels of demand or market dynamics, the Company will experience lower gross profit. Conversely, during periods of declining raw material cost inputs, to the extent the Company has to decrease prices in the market due to competitive pressure as the current cost of metals declines, the Company will generally experience downward pressure on its gross profit due to the sale of relatively higher value inventory as computed under the weighted average inventory costing method. If the Company is able to maintain price levels in an environment in which raw material prices are declining due to high levels of demand, the Company will experience higher gross profit. There is no exact future measure of the effect to the Company's profitability of the change of raw material cost inputs due to the unique set of selling variables and the high volume of transactions in any given period, each of which involves numerous individual pricing decisions. In 2016, if there were a 10% increase in copper and aluminum costs, then our cost of sales would have increased approximately $155 million. The impact of this would directly impact gross profit if the Company was unable to increase prices with the rise in the price of copper and aluminum. To help reduce this volatility, the Company has implemented various pricing mechanisms and hedges a portion of its metal purchases when there is a firm price commitment for a future delivery but does not engage in speculative metals trading.
The Company purchases copper and aluminum from various global sources, generally through annual supply agreements. These agreements do not contractually obligate the Company to purchase products exclusively, or require the Company to purchase products for a significant period of time. Copper and aluminum raw material supply is available from many sources and supply is generally expected to remain adequate for the Company's requirements, however, unanticipated problems with the Company's copper or aluminum rod suppliers could negatively affect the Company's business. The Company has centralized purchasing of its copper, aluminum and other significant raw materials to capitalize on economies of scale and to facilitate the negotiation of purchase terms from suppliers. In 2016, the Company's largest North American supplier of copper accounted for approximately
6
70% of its total copper purchases while the largest supplier of aluminum accounted for approximately 50% of its total aluminum purchases. In Latin America, the Company’s largest supplier of copper accounted for approximately 75% of its total copper purchases while the largest supplier of aluminum accounted for approximately 50% of its total aluminum purchases. In Europe, the Company's largest supplier of copper accounted for approximately 50% of its total copper purchases while the largest supplier of aluminum accounted for approximately 40% of its total aluminum purchases.
Other raw materials utilized by the Company include nylon, polyethylene resin and compounds and plasticizers, fluoropolymer compounds, optical fiber and a variety of filling, binding and sheathing materials. The Company believes that all of these materials are available in sufficient quantities through purchases in the open market.
Foreign Currency
The Company's results are directly influenced by fluctuations in foreign currency exchange rates. Uncertainty in the global market conditions has resulted in significant volatility in foreign currency exchange rates. This volatility results in gains / losses on transactions whose terms are denominated in a currency other than the entity's functional currency and the Company's consolidated results are influenced by the translation of the international units' results to U.S. dollars. To help reduce this volatility, the Company enters into foreign currency exchange contracts principally to hedge the currency fluctuations in certain transactions denominated in foreign currencies.
Patents and Trademarks
The Company believes that the success of its business depends more on the technical competence, creativity and marketing abilities of its employees rather than on any individual patent, trademark or copyright. Nonetheless, the Company has a policy of seeking patents when appropriate on inventions concerning new products and product improvements. The Company owns numerous patents and trademarks globally, with pending applications for additional patents and trademarks, and maintains trade secret protection for certain confidential and proprietary information.
Although in the aggregate these patents are of considerable importance to the manufacturing and marketing of many of the Company's products, the Company does not consider any single patent to be material to its business as a whole. Trademarks and trade names, which are important to the Company, are Phelps Dodge International Corporation®, PDIC global symbols, General Cable®, Anaconda® Brand, Carol® Brand, GenSPEED® Brand, NextGen® Brand, NSW® Brand, NUAL® Brand, Prestolite Wire® Brand, Silec® Brand, STABILOY® Brand and the Company's triad symbol. The Company believes that products bearing these trademarks have achieved significant brand recognition within the industry.
Seasonality
The Company generally has experienced and expects to continue to experience certain seasonal trends in many products in which demand is linked with construction spending. Demand for these products during winter months in certain geographies is usually lower than demand during spring and summer months. Therefore, larger amounts of working capital are generally required during winter months in order to build inventories in anticipation of higher demand during the spring and summer months, when construction activity increases. In turn, receivables related to higher sales activity during the spring and summer months are generally collected during the fourth quarter of the year. Additionally, the Company has historically experienced changes in demand resulting from poor or unusual weather.
Competition
The markets for all of the Company's products are highly competitive and most markets include several competitors. The degree of competition varies by operating segment and product line. However, in general, the industry is mature and cost driven. Although the primary competitive factors for the Company's products vary somewhat across the different product categories, the principal factors influencing competition include, but are not limited to, price, quality, breadth of product line, inventory, delivery time, customer service, the environmental impact of the products, and the ability to meet customer's needs.
Many of the Company's products are made to industry specifications, and are therefore functionally interchangeable with those of competitors. However, the Company believes that significant opportunities exist to differentiate all of its products on the basis of quality, consistent availability, conformance to manufacturer's specifications and customer service. The Company believes its competitive strengths include breadth of product line, brand recognition, distribution and logistics, strong customer relations, operating efficiency and commitment to quality control and continuous improvement.
Advertising Expense
Advertising expense consists of expenses to promote the Company’s products, including trade shows, catalogs, and e-commerce promotions, and is charged to expense when incurred. Advertising expense was $7.9 million, $10.4 million and $14.2 million in 2016, 2015 and 2014, respectively.
7
Environmental Matters
The Company is subject to a variety of federal, state, local and foreign laws and regulations covering the storage, handling, emission and discharge of materials into the environment, including the Comprehensive Environmental Response, Compensation and Liability Act (“CERCLA”), the Clean Water Act, the Clean Air Act (including the 1990 amendments) and the Resource Conservation and Recovery Act. While it is difficult to estimate future environmental liabilities accurately, the Company does not currently anticipate any material adverse effect on its consolidated results of operations, financial position or cash flows as a result of compliance with federal, state, local or foreign environmental laws or regulations or remediation costs of the sites as discussed in Note 19 - Commitments and Contingencies.
Employees
At December 31, 2016, General Cable employed approximately 10,000 employees worldwide. Approximately 35% of our employees were covered by collective bargaining agreements, of which approximately 40% are subject to agreements that expire within one year from December 31, 2016. The Company believes it will successfully renegotiate these contracts as they come due. Generally, labor agreements are negotiated on an annual or bi-annual basis. The Company believes that its relations with its employees are generally good.
Disclosure Regarding Forward-Looking Statements
Certain statements in the 2016 Annual Report on Form 10-K for the fiscal year ended December 31, 2016 (the "2016 Annual Report on Form 10-K") including, without limitation, statements regarding future financial results and performance, plans and objectives, capital expenditures, understanding of competition, projected sources of cash flow, potential legal liability, proposed legislation and regulatory action, and our management's beliefs, expectations or opinions, are forward-looking statements, and as such, we desire to take advantage of the “safe harbor” which is afforded such statements under the Private Securities Litigation Reform Act of 1995. Forward-looking statements are those that predict or describe future events or trends and that do not relate solely to historical matters. Forward-looking statements can generally be identified as statements containing the words “believe,” “expect,” “may,” “could,” “anticipate,” “intend,” “should,” “estimate,” “project,” “will,” “plan,” “assume,” “seek to” or other similar expressions, although not all forward-looking statements contain these identifying words. In addition, forward-looking statements are subject to certain risks and uncertainties that could cause actual results to differ materially from those discussed in forward-looking statements as a result of factors, risks and uncertainties over many of which we have no control.
These factors, risks and uncertainties include, but are not limited to, the following: (1) general economic conditions, particularly those in the construction, energy and information technology sectors; (2) the volatility in the price of raw materials, particularly copper and aluminum; (3) impairment charges with respect to our long-lived assets; (4) our ability to execute our plan to exit all of our Asia Pacific and African operations; (5) our ability to achieve all of our anticipated cost savings associated with our previously announced global restructuring plan; (6) our ability to invest in product development, to improve the design and performance of our products; (7) economic, political and other risks of maintaining facilities and selling products in foreign countries; (8) domestic and local country price competition; (9) our ability to successfully integrate and identify acquisitions; (10) the impact of technology; (11) our ability to maintain relationships with our distributors and retailers; (12) the changes in tax rates and exposure to new tax laws; (13) our ability to adapt to current and changing industry standards; (14) our ability to execute large customer contracts; (15) our ability to maintain relationships with key suppliers; (16) the impact of fluctuations in foreign currency rates; (17) compliance with foreign and U.S. laws and regulations, including the Foreign Corrupt Practices Act; (18) our ability to negotiate extensions of labor agreements; (19) our ability to continue our uncommitted accounts payable confirming arrangements; (20) our exposure to counterparty risk in our hedging arrangements; (21) our ability to achieve target returns on investments in our defined benefit plans; (22) possible future environmental liabilities and asbestos litigation; (23) our ability to attract and retain key employees; (24) our ability to make payments on our indebtedness; (25) our ability to comply with covenants in our existing or future financing agreements; (26) lowering of one or more of our debt ratings; (27) our ability to maintain adequate liquidity; (28) our ability to maintain effective disclosure controls and procedures and internal control over financial reporting; (29) the trading price of our common stock; and (30) and other material factors described in Item 1A - Risk Factors and elsewhere in this 2016 Annual Report on Form 10-K and those described from time to time in our future reports filed with the Securities and Exchange Commission (the "SEC").
Forward-looking statements reflect the views and assumptions of management as of the date of this report with respect to future events. The Company does not undertake, and hereby disclaims, any obligation, unless required to do so by applicable securities laws, to update any forward-looking statements as a result of new information, future events or other factors. The inclusion of any statement in this report does not constitute an admission by the Company or any other person that the events or circumstances described in such statement are material.
8
Available Information
The Company’s principal executive offices are located at 4 Tesseneer Drive, Highland Heights, Kentucky 41076-9753 and its telephone number is (859) 572-8000. The Company’s internet address is www.generalcable.com. General Cable’s annual report on Form 10-K, quarterly reports on Form 10-Q, current reports on Form 8-K, and amendments to those reports filed or furnished pursuant to Section 13(a) or 15(d) of the Securities Exchange Act of 1934, as amended, are made available free of charge at www.generalcable.com as soon as reasonably practicable after we electronically file such material with, or furnish it to, the SEC. In addition, the Company will provide, at no cost, paper or electronic copies of our reports and other filings made with the SEC. Requests should be directed to: Investor Relations, General Cable Corporation, 4 Tesseneer Drive, Highland Heights, KY 41076-9753.
The information on the website listed above is not and should not be considered part of this 2016 Annual Report on Form 10-K and is not incorporated by reference in this document. This website address is only intended to be an inactive textual reference.
Executive Officers of the Registrant
The following table sets forth certain information concerning the executive officers of General Cable as of February 15, 2017.
Name | Age | Position | ||
Michael T. McDonnell | 59 | President and Chief Executive Officer | ||
Matti M. Masanovich | 45 | Senior Vice President and Chief Financial Officer | ||
Juan E. Picon | 47 | Senior Vice President, President and Chief Executive Officer, General Cable North America | ||
Juan B. Mogollon | 56 | Senior Vice President General Cable Latin America | ||
Roberto A. Sacasa | 41 | Senior Vice President and Chief Compliance Officer | ||
Emerson C. Moser | 40 | Senior Vice President, General Counsel and Corporate Secretary | ||
Leah S. Stark | 40 | Senior Vice President and Chief Human Resources Officer | ||
Mr. McDonnell has been President and Chief Executive Officer of General Cable Corporation since July 2015. He is also a member of the Board of Directors. Mr. McDonnell has more than 25 years of experience in management and executive roles. Most recently, Mr. McDonnell was Chairman, President and Chief Executive Officer of TPC Group, a leading processor and producer of value-add products derived from petrochemicals that are sold into a wide range of performance, specialty and intermediate markets. Prior to joining TPC Group, Mr. McDonnell served as President and Chief Executive Officer of Pregis Corporation from 2006 to 2011, a leading global specialty packaging and hospital supply products company. From 2002 to 2006, Mr. McDonnell was Group Vice President, Environmental Technologies of Engelhard Corporation; and from 1998 to 2002, he was Vice President of a chemicals division for Cytec Industries, Inc. Early in his career, Mr. McDonnell held management roles with increasing levels of responsibility at Henkel Corporation and DuPont.
Mr. Masanovich has been Senior Vice President and Chief Financial Officer since November 2016. Mr. Masanovich has over 20 years of finance, accounting and operations experience across large, international manufacturing companies. Prior to joining General Cable, Mr. Masanovich served as Vice President, Finance and Corporate Controller of International Automotive Components Group North America, LLC, a privately held global automotive interior, exterior and systems components supplier. From 2011 to 2016, Mr. Masanovich was employed by Delphi Automotive PLC, a publicly held global vehicle components manufacturer and provider of electrical and electronic, powertrain and safety technology solutions to the global automotive and commercial vehicle markets, where he served as Vice President, Finance, Packard Electrical and Electronic Architecture Division from 2013 to 2016 and as Vice President and Chief Audit Executive from 2011 to 2013. From 2010 to 2011, Mr. Masanovich was Senior Vice President, Controller and Chief Accounting Officer at Pro-Build Holdings, Inc., a privately held supplier of lumber and building materials to professional builders and contractors in the United States. Prior to 2010, Mr. Masanovich served in various executive accounting positions with both public and private companies. Mr. Masanovich began his career in public accounting at Coopers & Lybrand (from 1994 to 1997) and PricewaterhouseCoopers LLP (from 1997 to 2001).
Mr. Picon has been Senior Vice President, President and Chief Executive Officer, General Cable North America since January 2017. From 1998 to 2016, prior to joining General Cable, Mr. Picon was employed at Honeywell International, Inc., a publicly held technology and manufacturing company, serving customers worldwide with aerospace products and services, turbochargers, control, sensing and security technologies for buildings, homes and industry, specialty chemicals, electronic and advanced materials, process technology for refining and petrochemicals, and energy efficient products and solutions for homes, business and transportation, where he served in a number of executive and senior management roles in their Automation & Control Solutions, Aerospace and Transportation Systems businesses within the U.S., Mexico and Switzerland. Mr. Picon's most recent position at Honeywell was Vice President & General Manager for Honeywell's Americas Environmental & Energy Solutions ACS business.
9
Mr. Mogollon has been Senior Vice President of General Cable Latin America since August 2016. Mr. Mogollon has more than 25 years of experience across multiple industry segments in mature and emerging markets. Prior to joining General Cable, from 2012 to 2016, Mr. Mogollon served as President of the Growth Markets business at Tyco International, a publicly held global provider of security products and services, fire detection and suppression products and services and life safety products. From 2010 to 2012, Mr. Mogollon was Vice President of Global Operations at Tyco Security Services, a global provider of security equipment and services. Prior to 2010, Mr. Mogollon served in various global leadership positions at United Technology Corporation and General Electric.
Mr. Sacasa has been Senior Vice President and Chief Compliance Officer since August 2016, and has been with General Cable since March 2015. Mr. Sacasa has more than 17 years of experience conducting investigations and providing forensic accounting and auditing services in both the public and private sectors. Prior to joining General Cable, from 2004 to 2012 and again from 2014 to 2015, Mr. Sacasa held various roles of increasing responsibility with PricewaterhouseCoopers, a multinational professional services network, ultimately culminating as a Director in the Forensic Services practice. From 2012 to 2014, Mr. Sacasa led the Forensic Audit team at PPG Industries, Inc. a publicly held global supplier of paints, coatings, optical products, specialty materials, and fiber glass. Prior to joining PricewaterhouseCoopers, Mr. Sacasa served as an Officer in the U.S. Coast Guard and as a Senior Financial Investigator with the Florida Office of Financial Regulation.
Mr. Moser has been Senior Vice President, General Counsel and Corporate Secretary since January 2015. Mr. Moser joined General Cable in September 2008 as Assistant General Counsel and Assistant Corporate Secretary. He subsequently was promoted to Vice President in March 2013 and served as the interim General Counsel from July 2014 through his current appointment. Before joining General Cable, Mr. Moser was in private practice with the law firm, Dinsmore & Shohl LLP, and then served as Assistant General Counsel of NIBCO, INC., an international manufacturer of flow control products for use in industrial, commercial and residential construction markets.
Ms. Stark has been Senior Vice President and the Chief Human Resources Officer since July 2016. Ms. Stark has extensive and progressive human resources experience across multiple industries and geographies. Prior to joining General Cable, from 2006 to 2016, Ms. Stark held various human resources leadership roles of increasing responsibility in M&A, talent, and human resources business partnership at Whirlpool Corporation, a publicly held global manufacturer of major home appliances, and most recently served as the Human Resources leader for Greater China, KitchenAid’s global business, and global functions. Prior to 2006, Ms. Stark served in various human resources and labor relations positions at Schneider National and General Mills, Inc., a publicly held global manufacturer and marketer of branded consumer foods sold through retail stores and a leading supplier of branded and unbranded food products to the North American foodservice and commercial baking industries.
ITEM 1A. RISK FACTORS
We are subject to a number of risks listed below, which could have a material adverse effect on our financial condition, results of operations and the value of our securities.
Certain statements in the 2016 Annual Report on Form 10-K including, without limitation, statements regarding future financial results and performance, plans and objectives, capital expenditures, understanding of competition, projected sources of cash flow, potential legal liability, proposed legislation and regulatory action, and our management's beliefs, expectations or opinions, are forward-looking statements, and as such, we desire to take advantage of the “safe harbor” which is afforded such statements under the Private Securities Litigation Reform Act of 1995. Our forward-looking statements should be read in conjunction with our comments in this report under the heading, “Disclosure Regarding Forward-Looking Statements.” Actual results may differ materially from those statements as a result of factors, risks and uncertainties over which we have no control. These risks and uncertainties are not the only ones we face. Additional risks and uncertainties not presently known to us or that we currently believe to be immaterial may also impair our business or adversely affect our financial condition or results of operations.
• | Our net sales, net income and growth depend largely on the economic strength of the geographic markets that we serve, and if these markets become weaker, we could experience decreased sales and net income. |
Many of our customers use our products as components in their own products or in projects undertaken for their customers. Our ability to sell our products is largely dependent on general economic conditions, including end user spending on power transmission and distribution infrastructures, industrial manufacturing assets, new construction and building, information technology and maintaining or reconfiguring their communications networks. In periods of negative or no economic growth, we would likely experience a decrease in sales and net income.
• | Volatility in the price of copper and aluminum and other raw materials, as well as fuel and energy, could adversely affect our businesses. |
The costs of copper and aluminum, the most significant raw materials we use, have been subject to considerable volatility caused by supply conditions, weather, political and economic variables as well as other unknown and unpredictable variables. Other raw materials such as fuel and energy have additionally been subject to considerable volatility.
10
We typically pass these changes in copper and aluminum prices along to our customers, although there are timing delays of varying lengths depending upon the volatility of metals prices, the type of product, competitive conditions, pricing mechanisms and particular customer arrangements. Although the general trends are detailed in Item 1 - Business – Raw Materials, there is no exact future measure of the effect of the change of raw material cost inputs due to the unique set of selling variables and the high volume of transactions in any given period, each of which involves numerous individual pricing decisions.
In addition, we may be required to recognize an expense to record our inventory at market value, which would negatively impact our financial results. Although we attempt to recover copper and aluminum and other raw material price changes either in the selling price of our products or through commodity hedging programs, there is no assurance that we can do so successfully or at all in the future.
• | We have recently recorded impairment charges with respect to certain of our long-lived assets as a result of our restructuring programs and market and industry conditions, and we could recognize additional impairment charges for our long-lived assets in the future. |
As of December 31, 2016, property, plant and equipment, goodwill and other intangible assets account for approximately $569.6 million, or 25% of our total assets. In accordance with generally accepted accounting principles, we periodically assess our long-lived assets to determine if they are impaired. The testing for impairment is based on assumptions regarding our future business outlook as well as other factors. While we continue to review and analyze many factors that can impact our business, such as industry and economic trends, our analyses are subjective and are based on conditions existing at and trends leading up to the time the assumptions are made. Actual results could differ materially from these assumptions particularly in the event of disruptions to our business, unexpected significant changes or planned changes in the use of assets or divestitures or expropriations of assets.
Future impairment charges as a result of our restructuring and divestiture programs or otherwise could significantly affect our results of operations in the period recognized.
• | We may not be able to execute our plan to exit all of our Asia Pacific and African operations. |
In October 2014, we announced our plan to divest all of our Asia Pacific and African operations as described in Item 7 - Management's Discussion and Analysis of Financial Condition and Results of Operations. Our goal is to simplify our global portfolio and reduce operational complexity by focusing on core strategic operations in North America, Latin America and Europe. We may not be able to offset the dilutive impacts from the loss of revenue or operating profit associated with divested manufacturing units. In addition, we may not be able to obtain favorable selling prices of the Asia Pacific and African manufacturing units. Our plan to exit all of the Asia Pacific and African manufacturing units will take time and will involve costs and management effort to market and negotiate the sale of each of the remaining manufacturing units as well as negotiate employee separation packages, consolidate operations of certain of our facilities and make investments necessary to operate our business with a smaller number of facilities. We may not be successful in these efforts. Our failure to achieve favorable selling prices could have a material adverse effect on our results of operations and liquidity in future periods.
• | We may not be able to achieve all of our anticipated cost savings associated with our global restructuring plans. |
In the fourth quarter of 2015, the Company committed to a strategic roadmap targeting growth and improvement in market positions, developing leading cost and efficiency positions, enhancement of organizational capabilities, alignment of its organization structure and cultivation of a high-performance culture. Although we have identified key initiatives, the program will take time and management effort to execute and implement changes. These efforts have been and will continue to be launched in a phased approach and are expected to continue for several years.
In addition, in July 2014, we announced a comprehensive restructuring program which is substantially complete as of December 31, 2016. The Company also implemented initiatives to reduce selling, general and administrative ("SG&A") expenses globally.
These restructuring programs are expected to create ongoing annual savings. We may not achieve the full amount of expected cost savings, or it may take us longer to achieve them than we currently anticipate. In addition, other unexpected costs could offset any savings we achieve. Our failure to achieve our anticipated annual cost savings could have a material adverse effect on our results of operations in future periods.
• | The markets for our products are highly competitive, and if we fail to successfully invest in product development, productivity improvements and customer service and support, sales of our products could be adversely affected. |
The markets for copper, aluminum and fiber optic wire and cable products are highly competitive and some of our competitors may have greater financial resources than we have. We compete with at least one major competitor with respect to each of our business segments. Many of our products are made to common specifications and, therefore, may be interchangeable with competitors' products. Accordingly, we are subject to competition in many markets on the basis of price, quality, breadth of product line, inventory, delivery time, customer service, the environmental impact of our products, and the ability to meet customers' needs.
11
We believe the design and performance of products will improve and new products will be introduced with competitive price and performance characteristics. We expect that we will be required to continue to invest in product development, productivity improvements and customer service and support in order to compete in our markets. Furthermore, an increase in imports of competing products could adversely affect our sales on a region by region basis.
• | Our business is subject to the economic, political and other risks of maintaining facilities and selling products in foreign countries. |
During the year ended December 31, 2016, approximately 47% of our sales and approximately 58% of our assets were in markets outside of North America. Our operations outside of North America reported operating cash inflows of approximately $83.4 million during this period. Some of our facilities, in particular, certain locations such as Algeria and Angola, among others, are at higher risk of being targets of economic and political destabilization, international conflicts, restrictive actions by foreign governments, nationalizations or expropriations, changes in regulatory requirements, the difficulty of effectively managing diverse global operations, terrorist activities, natural disasters, adverse foreign tax laws and the threat posed by potential pandemics in countries that do not have the resources necessary to deal with such outbreaks. Our financial results may be adversely affected by the enactment of exchange controls or foreign governmental or regulatory restrictions on the transfer of funds. In addition, negative tax consequences relating to the repatriation of certain foreign income may adversely affect our cash flows. Over time, we may expand our foreign operations, which would serve to exacerbate these risks and their potential effect on our business, financial position and results of operations. Economic and political developments in the countries in which we have operations, including future economic changes or crises (such as inflation, currency devaluation, changes in functional currency or recession), government deadlock, political instability, political activism, terrorist activities, civil strife, international conflicts, changes in laws and regulations and expropriation or nationalization of property or other resources, could impact our operations or the market value of our common stock and have an adverse effect on our business, financial condition and results of operations.
• | In each of our markets, we face pricing pressures. Such pricing pressures could adversely affect our results of operations and financial performance. |
We face pricing pressures in each of our markets as a result of significant competition or over-capacity. In the event we are unable to implement cost reduction measures that are designed to improve our manufacturing techniques and processes, we may not achieve desired efficiency or productivity levels or reduce our manufacturing costs. In addition, productivity increases are related in part to factory utilization rates. Decreases in utilization rates may adversely impact productivity. Further pricing pressures, without offsetting cost reductions, could adversely affect our results of operations and financial performance.
• | Alternative technologies, such as fiber optic and wireless technologies, may make some of our products less competitive. |
Alternative technologies continue to have an adverse effect on elements of our business. For example, a continued increase in the rate of installations using fiber optic systems, an increase in the cost of copper-based systems, or advancing wireless technologies, as they relate to network and communications systems, may have an adverse effect on our business. While we do manufacture and sell fiber optic cables, any further acceleration in the erosion of our sales of copper cables due to increased market demand for fiber optic cables would most likely not be offset by an increase in sales of our fiber optic cables. In addition, our sales of copper premise cables currently face downward pressure from wireless and other similar technology and the increased acceptance and use of these technologies has increased this pressure and the potential negative impact on our future financial results, cash flows or financial position.
• | We are substantially dependent upon distributors and retailers for non-exclusive sales of our products and they could cease purchasing our products at any time. |
Distributors and retailers account for a material portion of our sales. These distributors and retailers are not contractually obligated to carry our product lines exclusively or for any period of time. Therefore, these distributors and retailers may purchase products that compete with our products or cease purchasing our products at any time. The loss of one or more large distributors or retailers could have a material adverse effect on our ability to bring our products to end users and on our results of operations. Moreover, a downturn in the business of one or more large distributors or retailers could adversely affect our sales and could create significant credit exposure.
• | Changes in our tax rates or exposure to new tax laws could impact our profitability. |
We are subject to income tax in the United States and in various other global jurisdictions. Our effective tax rates could be adversely affected by changes in the mix of earnings by jurisdiction and the valuation of deferred tax assets and liabilities. Our effective tax rate could also be adversely affected by changes in tax laws. For example, certain versions of recent U.S. tax reform proposals could, if enacted, significantly impact the taxation of U.S. based multinationals and could have a material impact on our tax expense and cash flows. Proposed import tariffs and/or border adjustment proposals could impact tax expense and cash flow, as well as sourcing and supply chain strategies. In addition, we are subject to audits in various jurisdictions. Although we believe that our tax estimates are reasonable and appropriate, there are significant uncertainties in these estimates and as a result of these estimates there could be material adjustments. As a result of ongoing or possible future tax audits, we may be required to pay additional
12
taxes and/or penalties as a result of such tax audits, which could have a potential negative impact on our future financial results, cash flows and financial position.
• | Changes in industry standards and regulatory requirements may adversely affect our business. |
Our global business is subject to the requirements of federal, state, local and foreign regulatory authorities as well as industry standard-setting authorities. Changes in the standards and requirements imposed by such authorities could have an adverse effect on us. In the event that we are unable to meet any such new or modified standards when adopted, our business could be adversely affected.
In addition, changes in the legislative environment could affect the growth and other aspects of important markets served by us. The wire and cable industry growth has been partially driven by energy related legislation, including alternative and renewable energy sources, investment incentives for utilities and government infrastructure spending. We cannot predict the impact of legislative efforts or changes in laws or industry standards on our future financial results, cash flows or financial position.
• | Failure to properly execute large customer projects may negatively impact our ability to obtain similar contracts in the future and may result in material financial penalties. |
In recent years, primarily in Europe, we have been awarded large turn-key projects for specific customers. These projects involve numerous challenges associated with large long-term contracts and the contracts related to these projects generally include material financial penalties for non-performance on our part. We actively seek to increase our market share through successful execution of contracts for medium-voltage infield array projects and high-voltage export projects as well as underground terrestrial and submarine high-voltage projects. In addition, the terrestrial and submarine transmission cable markets in Europe, which are being driven by large investments in grid interconnections and alternative energy such as offshore wind power, represent an attractive long-term opportunity for us. The successful execution of large turn-key projects is important to our long-term success in this market.
• | Interruptions of supplies from key suppliers may affect our results of operations and financial performance. |
Interruptions of supplies from our key suppliers, including those from catastrophes such as hurricanes, earthquakes, floods or terrorist activities, could disrupt production or impact our ability to increase or maintain production and sales. Most copper and aluminum rod used in our North American operations is externally sourced, and our largest supplier of copper rod accounted for approximately 70% of our North American purchases in 2016, while our largest supplier of aluminum rod accounted for approximately 50% of our North American purchases in 2016. Our largest supplier of copper rod accounted for approximately 75% of our Latin American purchases in 2016 while the largest supplier of aluminum rod accounted for approximately 50% of our Latin American aluminum purchases in 2016. Our largest supplier of copper rod accounted for approximately 50% of our European purchases in 2016 while the largest supplier of aluminum rod accounted for approximately 40% of our European aluminum purchases in 2016. Any unanticipated problems with our copper or aluminum rod suppliers could have a material adverse effect on our business. Additionally, we use a limited number of sources for most of the other raw materials that we do not produce. We do not have long-term or volume purchase agreements with most of our suppliers, and may have limited options in the short-term for alternative supply if these suppliers fail to continue the supply of materials or components for any reason, including their business failure, inability to obtain raw materials or financial difficulties. Moreover, identifying and accessing alternative sources may increase our costs.
• | We source and sell products globally and are exposed to fluctuations in foreign currency exchange rates. |
We manufacture and sell products and finance operations throughout the world and are exposed to the impact of foreign currency fluctuations on our results of operations. Also, our consolidated financial results are presented in U.S. dollars; therefore, a change in the value of currencies may adversely impact our financial statements after currency remeasurements and translation to U.S. dollars. In addition, devaluations of currencies could negatively affect the value of our earnings from, and the assets located in, those markets.
• | If we fail to comply with the reporting obligations of the Exchange Act or if we fail to maintain adequate internal control over financial reporting, our business, the market value of our securities and our access to capital markets could be materially adversely affected. |
As a public company, we are required to comply with the periodic reporting obligations of the Securities Exchange Act of 1934, as amended, referred to as the “Exchange Act,” including the requirement that we file annual reports and quarterly reports with the SEC. Our failure to file required information in a timely manner could subject us to penalties under federal securities laws, expose us to additional lawsuits, create a default under our existing debt instruments and facilities, and restrict our ability to access financing. In addition, our management is responsible for establishing and maintaining adequate internal control over financial reporting. Our internal control over financial reporting is a process designed to provide reasonable assurance regarding the reliability of financial reporting and the preparation of financial statements in accordance with GAAP.
13
If we identify material weaknesses or fail to maintain adequate internal controls over financial reporting in the future, we may not be able to prepare reliable financial reports and comply with our reporting obligations under the Exchange Act on a timely basis. Any such delays in the preparation of financial reports and the filing of our periodic reports may result in a loss of public confidence in the reliability of our financial statements, the commencement of additional litigation, or the commencement of regulatory action against us, which may include court actions or administrative proceedings, any of which could materially adversely affect our business, the market value of our securities and our access to the capital markets.
• | Compliance with foreign and U.S. laws and regulations applicable to our international operations, including the Foreign Corrupt Practices Act (“FCPA”), other applicable anti-corruption laws and anti-competition regulations, may increase the cost of doing business in international jurisdictions. |
Various laws and regulations associated with our current international operations are complex and increase our cost of doing business. Furthermore, these laws and regulations expose us to fines and penalties if we fail to comply with them. These laws and regulations include import and export requirements, anti-competition regulations, U.S. laws such as the FCPA, and local laws prohibiting payments to governmental officials and other corrupt practices. Although we have implemented policies and procedures designed to ensure compliance with these laws, there can be no assurance that our employees, contractors and agents will not take actions in violation of our policies. Any such violations could subject us to civil or criminal penalties, including material fines or prohibitions on our ability to offer our wire and cable products in one or more countries, and could also materially damage our reputation, brand, business and operating results.
On December 29, 2016, the Company entered into agreements with the SEC and Department of Justice (“DOJ”) that bring to a conclusion those agencies’ respective investigations relating to previously disclosed FCPA matters. The Company has entered into a non-prosecution agreement with the DOJ which will be in effect for three years. No criminal charges will be brought against the Company provided it complies with its obligations under the agreement. The Company also agreed to annual self-reporting for a period of three years. Pursuant to those agreements, the Company will pay fines, disgorgement and pre-judgment interest to the SEC and DOJ. For additional information, you should refer to the Section entitled “Item 8. - Financial Statements and Supplementary Data - Notes to Consolidated Financial Statements - Note 19 - Commitments and Contingencies - Resolution of SEC and DOJ Investigations.”
Our failure to comply with any terms or conditions of the respective settlement agreements, including notably, payment obligations or ongoing compliance obligations, could result in acceleration of the payment schedule, additional criminal and/or civil penalties, post-settlement interest and continued expenses related to additional investigations and defense costs for addressing such a default, which could have a material adverse effect on our business and operating results.
• | Failure to negotiate extensions of our labor agreements as they expire may result in a disruption of our operations. |
As of December 31, 2016, approximately 35% of our employees were represented by various labor unions, of which approximately 40% are subject to agreements that expire within the next twelve months.
We are party to labor agreements with unions that represent employees at many of our manufacturing facilities. Labor agreements are generally negotiated on an annual or bi-annual basis and the risk exists that we may not be able to renew labor agreements on reasonably satisfactory terms or at all. We cannot predict what issues may be raised by the collective bargaining units representing our employees and, if raised, whether negotiations concerning such issues will be successfully concluded. A protracted work stoppage could result in a disruption of our operations which could, in turn, adversely affect our financial results, customer satisfaction, and our ability to deliver certain products.
• | Failure or disruptions of our information systems, including a cybersecurity breach or failure of one or more key information technology systems, networks, hardware, processes, associated sites or service providers could interfere with our business and operations. |
We rely on our information systems for processing customer orders, shipment of products, billing our customers, tracking inventory, supporting accounting functions and financial statement preparation, paying our employees, and otherwise running our business. Any disruption, whether from hackers or other sources, in our information systems could have a significant impact on our business. In addition, we may need to enhance our information systems to provide additional capabilities and functionality. The implementation of new information systems and enhancements is frequently disruptive to the underlying business of an enterprise. Any disruptions affecting our ability to accurately report our financial performance on a timely basis could adversely affect our business in a number of respects. If we are unable to successfully implement potential future information systems enhancements, our financial position, results of operations, and cash flows could be negatively impacted.
Increased IT security threats and more sophisticated computer crime, including advanced persistent threats, pose a potential risk to the security of our IT systems, networks and services, as well as the confidentiality, availability and integrity of our data. If the IT systems, networks or service providers we rely upon fail to function properly, or if we suffer a loss or disclosure of business or financial information, due to any number of causes, including catastrophic events, power outages and security breaches, and our business continuity plans do not effectively address these failures on a timely basis, we may suffer interruptions in our ability
14
to manage operations, reputational, competitive and/or business harm as well as litigation and regulatory action, which may adversely impact our results of operations and/or financial condition. The costs and operational consequences of responding to breaches and implementing remediation measures could be significant.
• | The Company is exposed to counterparty risk in our hedging arrangements. |
The Company is exposed to counterparty risk in our hedging arrangements. The failure of one or more counterparties to our hedging arrangements to fulfill or renew their obligations to us could adversely affect our results of operations. At times, depending on the extent of any unrealized loss position on a derivative contract, certain counterparties may require us to post collateral to secure our derivative contract positions.
• | Declining returns in the investment portfolio of our defined benefit pension plans and changes in actuarial assumptions could increase the volatility in our pension expense and require us to increase cash contributions to the plans. |
We sponsor defined benefit pension plans around the world. Pension expense for the defined benefit pension plans sponsored by us is determined based upon a number of actuarial assumptions, including an expected long-term rate of return on assets and discount rate. The use of these assumptions makes our pension expense and our cash contributions subject to year-to-year volatility. As of December 31, 2016, 2015 and 2014, the defined benefit pension plans were underfunded by approximately $117.4 million, $121.0 million and $155.3 million, respectively, based on the actuarial methods and assumptions utilized for purposes of the applicable accounting rules and interpretations. We have experienced volatility in our pension expense and our cash contributions to our defined benefit pension plans. In 2016, pension expense was $16.2 million, an increase of approximately $0.4 million from 2015, and cash contributions were $9.5 million. We estimate our 2017 pension expense for our defined benefit plans will be approximately $5.5 million. In the event that actual results differ from the actuarial assumptions or the actuarial assumptions are changed, the funded status of our defined benefit pension plans may change and any such deficiency could result in additional charges to equity and an increase in our future pension expense and cash contributions. Refer to Note 13 - Employee Benefit Plans of this document for details.
• | Environmental liabilities could potentially adversely impact us and our affiliates. |
We are subject to federal, state, local and foreign environmental protection laws and regulations governing our operations and the use, handling, disposal and remediation of hazardous substances currently or formerly used by us and our affiliates. A risk of environmental liability is inherent in our and our affiliates' current and former manufacturing activities in the event of a release or discharge of a hazardous substance generated by us or our affiliates. Under certain environmental laws, we could be held jointly and severally responsible for the remediation of any hazardous substance contamination at our current and former facilities and at third party waste disposal sites. We could also be held liable for any consequences arising out of human exposure to such substances or other environmental damage. We and our affiliates have been named as potentially responsible parties in proceedings that involve environmental remediation. There can be no assurance that the costs of complying with environmental, health and safety laws and requirements in our current operations or the liabilities arising from past releases of, or exposure to, hazardous substances, will not result in future expenditures by us that could materially and adversely affect our financial results, cash flows or financial condition.
• | We are subject to certain asbestos litigation and unexpected judgments or settlements that could have a material adverse effect on our financial results. |
Our subsidiaries have been named as defendants in non-maritime asbestos cases which involve plaintiffs alleging exposure to asbestos-containing cable manufactured by our predecessors. Our subsidiaries have also been named, along with numerous other product manufacturers, as defendants in cases in which plaintiffs alleged that they suffered an asbestos related injury while working in the maritime industry. Refer to Note 19 - Commitments and Contingencies for a summary of our outstanding asbestos-related litigation. There can be no assurance that any judgments or settlements of the pending asbestos cases or any cases which may be filed in the future will not have a material adverse effect on our financial results, cash flows or financial position.
• | If we fail to retain our key employees and attract qualified personnel, our business may be harmed. |
Our success has been largely dependent on the skills, experience and efforts of our key employees and the loss of the services of any of key personnel, without a properly executed transition plan, could have an adverse effect on us. During 2016, we announced a number of changes in our executive leadership team. Failure to effectively integrate our new executives or failure of our new executives to implement our business strategies could materially adversely affect our future financial condition and results of operation. The future loss of any key personnel could damage customer relationships, result in the loss of vital knowledge, experience and expertise, could lead to an increase in recruitment and training costs and make it more difficult to successfully operate our business and execute our business strategy. We may not be able to find qualified potential replacements for these individuals and the integration of potential replacements may be disruptive to our business. In addition, the loss of our key employees who have intimate knowledge of our manufacturing process could lead to increased competition to the extent that those employees are hired by a competitor and are able to recreate our manufacturing process. Our future success will also depend in part upon our continuing ability to attract and retain highly qualified personnel, who are in great demand.
15
• | Our indebtedness and our ability to pay our indebtedness could adversely affect our business and financial condition. |
We have a significant amount of debt and may incur additional debt in the future. If new debt is added to our current debt levels, the risks described herein would increase. Refer to Note 10 - Long-Term Debt of this document for details on the various debt agreements.
The degree to which we are leveraged could have adverse consequences to us, limiting management's choices in responding to business, economic, regulatory and other competitive conditions. In addition, our ability to generate cash flow from operations sufficient to make scheduled payments on our debts as they become due will depend on our future performance, our ability to successfully execute our business strategy and our ability to obtain other financing, which may be influenced by economic, financial, competitive, legislative, regulatory and other factors that are beyond our control. Our material indebtedness may affect our ability to pay principal and interest on outstanding indebtedness, increase our vulnerability to adverse economic and industry conditions, limit future capital expenditures and research and development, limit our ability to fund working capital needs and general corporate requirements, decrease our flexibility to react to changes in our business and industry, and place us at a competitive disadvantage to our competitors with less debt.
Our ability to make payments on our indebtedness, to refinance our indebtedness and fund planned capital expenditures will depend on our ability to generate cash in the future. This, to a certain extent, is subject to general economic, financial, competitive, legislative, regulatory and other factors that are beyond our control. There can be no assurance that our business will generate sufficient cash flows from operations or that future borrowings will be available to us under our credit facilities in an amount sufficient to enable us to make payments with respect to our indebtedness or to fund our other liquidity needs. If this were the case, we might need to refinance all or a portion of our indebtedness on or before maturity, sell assets, reduce or delay capital expenditures or seek additional equity financing. With respect to our Subordinated Convertible Notes, the settlement amount and potential recapture of income tax deductions could be material upon a triggering event or maturity of the Subordinated Convertible Notes. There can be no assurance that we will be able to refinance any of our indebtedness on commercially reasonable terms or at all.
• | Failure to comply with covenants and other provisions in our existing or future financing agreements could result in cross-defaults under some of our financing agreements, which could jeopardize our ability to satisfy our obligations. |
Various risks, uncertainties and events beyond our control could affect our ability or the ability of our subsidiaries to comply with the covenants, financial tests and ratios required by the instruments governing our and their financing arrangements, including, without limitation, the requirement that no final judgment or judgments of a court of competent jurisdiction have been rendered against us or our subsidiaries in excess of stated amounts. Failure to comply with any of the covenants in our existing or future financing agreements could result in a default under those agreements as well as other agreements containing cross-default provisions. A default would permit lenders to cease to make further extensions of credit, accelerate the maturity of the debt under these agreements and foreclose upon any collateral securing that debt as well as restrict our ability to make certain investments and payments, pay dividends, purchase company stock, enter into transactions with affiliates, make acquisitions, merge and consolidate, or transfer or sell assets. Under these circumstances, we might not have sufficient funds or other resources to satisfy all of our obligations.
Our ability and the ability of our subsidiaries to comply with these covenants is subject to various risks and uncertainties. In addition, events beyond our control could affect our ability to comply with and maintain the financial tests and ratios required by this indebtedness. Even if we or our subsidiaries, as applicable, are able to comply with all applicable covenants, the restrictions on our ability to operate our business in our sole discretion could harm our business by, among other things, limiting our ability to take advantage of financing, mergers, acquisitions and other opportunities.
Certain portions of our debt contain prepayment or acceleration rights at the election of the holders upon a covenant default, change in control or fundamental change, which, if exercised, could constitute an event of default under other portions of our debt. It is possible that we would be unable to fulfill all of these obligations simultaneously, which could adversely affect our financial position.
• | If we fail to meet our payment or other obligations under our secured indebtedness, the lenders under this indebtedness could foreclose on, and acquire control of, substantially all of our assets. |
Indebtedness under our senior secured credit facility is secured by: (a) for US borrowings under the facility, a first priority security interest in substantially all of our domestic assets and, (b) for Canadian and European borrowings under the facility, a first priority security interest in substantially all of our domestic and Canadian assets and certain assets of our Spanish, French and German subsidiaries party to the facility. In addition, the lenders under our senior secured credit facility have received a pledge of (i) 100% of the equity interests in substantially all of our domestic subsidiaries, and (ii) 65% of the voting equity interests in and 100% of the non-voting equity interests in certain of our foreign subsidiaries, including our Canadian subsidiaries and our Spanish, French and German subsidiaries party to the facility. As a result of these pledges and liens, if we fail to meet our payment or other obligations under the facility, then the lenders under the facility would be entitled to foreclose on the assets pledged as collateral
16
to secure the facility and liquidate such assets. Under those circumstances, we may not have sufficient funds to pay our obligations, which could adversely affect our financial position.
• | Our ability to pay principal and interest on outstanding indebtedness depends upon our receipt of dividends or other intercompany transfers from our subsidiaries. |
We are a holding company and substantially all of our properties and assets are owned by, and all our operations are conducted through, our subsidiaries. As a result, we are dependent upon cash dividends and distributions or other transfers from our subsidiaries to meet our debt service obligations, including payment of the interest on and principal of our indebtedness when due, and other obligations. The ability of our subsidiaries to pay dividends and make other payments to us may be restricted by, among other things, applicable corporate, tax and other laws and regulations in the United States and abroad and agreements made by us and our subsidiaries, including under the terms of our existing and potentially future indebtedness.
In addition, claims of creditors, including trade creditors, of our subsidiaries will generally have priority with respect to the assets and earnings of such subsidiaries over the claims of our creditors, except to the extent the claims of our creditors are guaranteed by these subsidiaries. Certain of our indebtedness may be guaranteed by only some of our subsidiaries. In the event of our dissolution, bankruptcy, liquidation or reorganization, the holders of such indebtedness will not receive any amounts from our non-guarantor subsidiaries with respect to such indebtedness until after the payment in full of the claims of the creditors of those subsidiaries.
• | A downgrade in our financial strength or credit ratings could limit our ability to conduct our business or offer and sell additional debt securities. |
Nationally recognized rating agencies currently rate our debt. Ratings are not recommendations to buy or sell our securities. We may, in the future, incur indebtedness with interest rates that may be affected by changes in or other actions associated with our credit ratings. Each of the rating agencies reviews its ratings periodically and previous ratings for our debt may not be maintained in the future. Rating agencies may also place us under review for potential downgrade in certain circumstances or if we seek to take certain actions. A downgrade of our debt ratings or other negative action, such as a review for a potential downgrade, could affect the market price of our existing subordinated and senior notes. Furthermore, these events may negatively affect our ability to raise additional debt with terms and conditions similar to our current debt, and accordingly, likely increase our cost of capital. In addition, a downgrade of these ratings, or other negative action, could make it more difficult for us to raise capital to refinance any maturing debt obligations to support business growth and to maintain or improve the current financial strength of our business and operations.
• | The trading price of our common stock may be adversely affected by many factors, not all of which are within our control, as well as by future issuances of our common stock or additional series of preferred stock. |
The trading price of our common stock has been and may in the future be volatile. Our stock price could be subject to wide fluctuations in response to a variety of factors, including quarterly variations in our operating results or our competitors' operating results, announcements of new products or services by us or our competitors, adverse or unfavorable publicity about us or our services, or our competitors, timing and announcement of acquisitions by us or our competitors, technological innovations by us or our competitors, changes in our or our competitors' earnings estimates, financial strength or credit ratings of us or our competitors, changes in estimates or recommendations by security analysts for our stock or our competitors' stock, commencement of material litigation or unfavorable verdicts against us, and additions or departures of key personnel.
In addition, our trading price may be adversely affected by future issuances of our common stock. Our amended and restated certificate of incorporation provides that we have authority to issue 200 million shares of common stock. As of December 31, 2016, there were approximately 49.4 million shares of common stock outstanding (net of treasury shares), approximately 1.7 million shares of common stock are issuable upon the exercise of currently outstanding stock options and approximately 1.4 million shares of common stock are issuable upon the vesting of currently outstanding restricted stock units and performance stock units. In addition, a maximum of approximately 14.3 million shares of our common stock could be issuable upon conversion of our Subordinated Convertible Notes. All of the shares of our common stock that could be issued pursuant to the conversion of our Subordinated Convertible Notes by holders who are not our affiliates would be freely tradable by such holders.
Our trading price also may be adversely affected by future issuances of series of preferred stock. Our Board of Directors is authorized to issue series of preferred stock without any action on the part of our stockholders. Our Board of Directors also has the power, without stockholder approval, to set the terms of any such series of preferred stock that may be issued, including voting rights, conversion rights, dividend rights, preferences over our common stock with respect to dividends or if we liquidate, dissolve or wind up our business and other terms. If we issue preferred stock in the future that has preference over our common stock with respect to the payment of dividends or upon our liquidation, dissolution or winding-up, or if we issue preferred stock with voting rights that dilute the voting power of our common stock, the market price of our common stock could be adversely affected.
17
ITEM 1B. | UNRESOLVED STAFF COMMENTS |
None.
ITEM 2. PROPERTIES
The Company’s principal manufacturing facilities are listed below by country. The Company owns the building at its global headquarters located in Highland Heights, Kentucky and leases various distribution centers and sales and administrative offices around the world. Many of the domestic and international facilities produce products for multiple markets including electrical infrastructure, electric utility, communications, construction and rod mill products. The Company believes that its properties are generally well maintained and are adequate for the Company’s current level of operations.
North American Operating Segment Manufacturing Properties | |
Number of Properties by Country | Owned or Leased |
United States - 12 | 11 owned, 1 leased |
Canada - 3 | 3 owned |
Mexico - 2 | 2 leased |
European Operating Segment Manufacturing Properties | |
Number of Properties by Country | Owned or Leased |
Spain - 3 | 3 owned |
France - 1 | 1 owned |
Germany - 1 | 1 owned |
Portugal - 1 | 1 owned |
Latin American Operating Segment Manufacturing Properties | |
Number of Properties by Country | Owned or Leased |
Brazil - 1 | 1 owned |
Colombia - 1 | 1 leased |
Chile - 1 | 1 owned |
Costa Rica - 1 | 1 owned |
Ecuador - 1 | 1 leased |
Mexico - 1 | 1 owned |
Africa / Asia Pacific Operating Segment Manufacturing Properties | |
Number of Properties by Country | Owned or Leased |
Algeria - 1 | 1 owned |
Angola - 1 | 1 owned |
China - 1 | 1 leased |
New Zealand - 1 | 1 owned |
ITEM 3. | LEGAL PROCEEDINGS |
We are subject to a number of lawsuits, investigations and claims arising out of the conduct of our business. Information regarding our litigation and other legal proceedings can be found in Note 19 - Commitments and Contingencies.
ITEM 4. | MINE SAFETY DISCLOSURES |
Not applicable.
18
PART II.
ITEM 5. | MARKET FOR REGISTRANT’S COMMON EQUITY, RELATED STOCKHOLDER MATTERS AND ISSUER PURCHASES OF EQUITY SECURITIES |
Market Information and Holders
General Cable’s common stock is listed on the New York Stock Exchange under the symbol “BGC”. As of February 15, 2017, there were approximately 1,392 registered holders of the Company’s common stock. The following table sets forth the high and low daily sales prices for the Company’s common stock as reported on the New York Stock Exchange during the years ended December 31:
2016 | 2015 | ||||||||||||||
High | Low | High | Low | ||||||||||||
First Quarter | $ | 13.28 | $ | 6.22 | $ | 18.39 | $ | 10.70 | |||||||
Second Quarter | 16.41 | 11.09 | 21.31 | 15.94 | |||||||||||
Third Quarter | 16.46 | 11.65 | 19.85 | 11.34 | |||||||||||
Fourth Quarter | 20.80 | 11.70 | 16.32 | 11.77 | |||||||||||
Dividends on Common Stock
On May 20, 2013, the Company's Board of Directors authorized the payment of a regular quarterly dividend of $0.18 per share (starting in the second quarter of 2013). During the year ended December 31, 2016, the Company paid in total approximately $35.6 million to all common shareholders of record, or $0.72 per share. During the year ended December 31, 2015, the Company paid in total approximately $35.3 million to all common shareholders of record, or $0.72 per share. Future declarations of dividends and the establishment of future record dates and payment dates are subject to the final determination of our Board of Directors. In determining dividends, the Board of Directors takes into consideration items such as general business conditions, financial performance, projected cash flows and anticipated financing needs. Future payments of dividends is also subject to the requirements of the Company's Revolving Credit Facility with JP Morgan Chase Bank, NA, as administrative agent, and other lenders (“Revolving Credit Facility”), and the 5.75% Senior Notes due 2022 (“5.75% Senior Notes"), and the requirements of the Delaware General Corporation law.
Securities Authorized for Issuance under Equity Compensation Plans
Refer to Item 12 - Security Ownership of Certain Beneficial Owners and Management and Related Stockholder Matters for information related to the Company’s securities authorized for issuance under equity compensation plans, including the tabular disclosure.
19
Performance Graph
The graph below compares the annual percentage change in cumulative total shareholder return on General Cable stock in relation to cumulative total return of the Standard & Poor’s 500 Stock Index, and a peer group of companies (“2016 Peer Group”). The data shown are for the period beginning May 16, 1997, the date that General Cable (“BGC”) common stock began trading on the NYSE, through December 31, 2016.
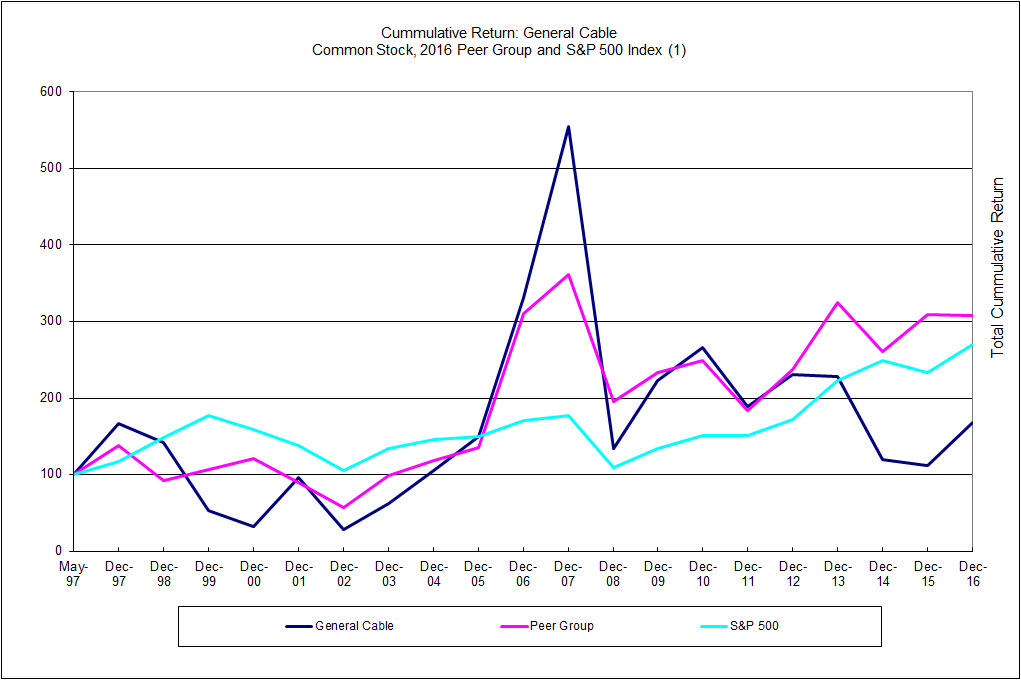
May 1997 | Dec 1997 | Dec 1998 | Dec 1999 | Dec 2000 | Dec 2001 | Dec 2002 | Dec 2003 | Dec 2004 | Dec 2005 | Dec 2006 | Dec 2007 | Dec 2008 | Dec 2009 | Dec 2010 | Dec 2011 | Dec 2012 | Dec 2013 | Dec 2014 | Dec 2015 | Dec 2016 | ||||||||||||||||||||||
General Cable | 100 | 167 | 143 | 53 | 32 | 97 | 29 | 62 | 105 | 149 | 331 | 555 | 134 | 223 | 266 | 189 | 230 | 228 | 120 | 112 | 168 | |||||||||||||||||||||
2016 Peer Group | 100 | 138 | 92 | 107 | 121 | 89 | 58 | 99 | 118 | 135 | 311 | 361 | 195 | 234 | 249 | 184 | 238 | 324 | 261 | 310 | 308 | |||||||||||||||||||||
S&P 500 | 100 | 117 | 148 | 177 | 159 | 138 | 106 | 134 | 146 | 150 | 171 | 177 | 109 | 134 | 152 | 152 | 172 | 223 | 248 | 223 | 270 | |||||||||||||||||||||
(1) | Assumes dividend reinvestment and assumes the value of the investment in General Cable common stock and each index was $100 on May 16, 1997. The 2016 Peer Group consists of Belden Inc. (NYSE: BDC), Prysmian (Italy Stock Exchange) and Nexans (Paris Stock Exchange). Returns in the 2016 Peer Group are weighted by capitalization. |
20
Purchases of Equity Securities by the Issuer and Affiliated Purchasers
The following table summarizes purchases of equity securities by the issuer during the quarter ended December 31, 2016:
Period | Total number of shares purchased (1), (2) | Average price paid per share | |||
October 1, 2016 through October 28, 2016 | 25 | $ | 14.77 | ||
October 29, 2016 through November 25, 2016 | 8 | $ | 15.35 | ||
November 26, 2016 through December 31, 2016 | 7,602 | $ | 12.51 | ||
(1) Includes 6,831 shares of common stock that were withheld for taxes on the vesting of restricted stock issued pursuant to the Company's equity compensation plans, and the average price paid per share was $11.68 during the quarter ended December 31, 2016. 157,621 shares of common stock were withheld for taxes on the vesting of restricted stock issued pursuant to the Company's equity compensation plans, and the average price paid per share was $10.31 during the year ended December 31, 2016.
(2) Includes 804 shares of common stock that were purchased through a rabbi trust as investments of participants in the Company's deferred compensation plan, and the average price paid per share was $19.66 during the quarter ended December 31, 2016. 35,334 shares of common stock were purchased through a rabbi trust as investments of participants in the Company's deferred compensation plan, and the average price paid per share was $8.69 during the year ended December 31, 2016. The Rabbi Trust (“Trust”) was established in connection with the deferred compensation plan, and the Trust assets are available to satisfy the claims of the Company’s creditors in the event of bankruptcy or insolvency of the Company.
ITEM 6. | SELECTED FINANCIAL DATA |
The selected financial information for the years ended December 31, 2016, 2015 and 2014 and as of December 31, 2016 and 2015, was derived from audited consolidated financial statements included in this filing and for the years ended December 31, 2013 and 2012 and as of December 31, 2014, 2013 and 2012 was derived from previously audited consolidated financial statements. The following selected financial data should be read in conjunction with “Management’s Discussion and Analysis of Financial Condition and Results of Operations” and the consolidated financial statements and related notes thereto, especially as the information pertains to 2016, 2015 and 2014 activity.
21
Year Ended December 31, | |||||||||||||||||||
2016 | 2015 | 2014 | 2013 | 2012 | |||||||||||||||
(in millions, except metal price and share data) | |||||||||||||||||||
Net sales | $ | 3,858.4 | $ | 4,514.5 | $ | 5,979.8 | $ | 6,421.2 | $ | 6,059.5 | |||||||||
Cost of sales | 3,451.3 | 4,082.1 | 5,586.6 | 5,717.5 | 5,434.6 | ||||||||||||||
Gross profit | 407.1 | 432.4 | 393.2 | 703.7 | 624.9 | ||||||||||||||
Selling, general and administrative expenses | 408.9 | 412.3 | 450.7 | 492.0 | 425.5 | ||||||||||||||
Goodwill impairment charges | 9.0 | 3.9 | 155.1 | — | — | ||||||||||||||
Intangible asset impairment charges | 7.5 | 1.7 | 98.8 | — | — | ||||||||||||||
Operating income (loss) | (18.3 | ) | 14.5 | (311.4 | ) | 211.7 | 199.4 | ||||||||||||
Other income (expense) | 7.2 | (71.3 | ) | (212.9 | ) | (66.7 | ) | (2.9 | ) | ||||||||||
Interest expense, net | (87.0 | ) | (94.3 | ) | (111.8 | ) | (118.0 | ) | (100.3 | ) | |||||||||
Loss on extinguishment of debt | — | — | — | — | (9.3 | ) | |||||||||||||
Income (loss) before income taxes | (98.1 | ) | (151.1 | ) | (636.1 | ) | 27.0 | 86.9 | |||||||||||
Income tax (provision) benefit | 3.7 | 14.8 | (8.3 | ) | (38.8 | ) | (78.6 | ) | |||||||||||
Equity in net earnings of affiliated companies | 0.9 | 0.5 | 1.4 | 1.7 | 1.7 | ||||||||||||||
Net income (loss) including noncontrolling interest | (93.5 | ) | (135.8 | ) | (643.0 | ) | (10.1 | ) | 10.0 | ||||||||||
Less: preferred stock dividends | — | — | — | 0.3 | 0.3 | ||||||||||||||
Less: net income (loss) attributable to noncontrolling interest | 0.3 | (13.9 | ) | (15.4 | ) | 7.7 | 5.7 | ||||||||||||
Net income (loss) attributable to Company common shareholders | $ | (93.8 | ) | $ | (121.9 | ) | $ | (627.6 | ) | $ | (18.1 | ) | $ | 4.0 | |||||
Earnings (loss) per share: Net income (loss) attributable to Company common shareholders per common share | |||||||||||||||||||
Earnings (loss) per common share-basic | $ | (1.89 | ) | $ | (2.49 | ) | $ | (12.86 | ) | $ | (0.37 | ) | $ | 0.08 | |||||
Earnings (loss) per common share-assuming dilution | $ | (1.89 | ) | $ | (2.49 | ) | $ | (12.86 | ) | $ | (0.37 | ) | $ | 0.08 | |||||
Weighted average common shares-basic | 49.6 | 48.9 | 48.8 | 49.4 | 49.7 | ||||||||||||||
Weighted average common shares-assuming dilution | 49.6 | 48.9 | 48.8 | 49.4 | 51.1 | ||||||||||||||
Dividends per common share | $ | 0.72 | $ | 0.72 | $ | 0.72 | $ | 0.54 | $ | — | |||||||||
Other Data: | |||||||||||||||||||
Depreciation and amortization | $ | 86.0 | $ | 96.4 | $ | 126.4 | $ | 133.5 | $ | 117.4 | |||||||||
Capital expenditures | 84.1 | 61.5 | 89.6 | 89.1 | 108.6 | ||||||||||||||
Average daily COMEX price per pound of copper cathode | 2.20 | 2.51 | 3.12 | 3.34 | 3.62 | ||||||||||||||
Average daily price per pound of aluminum rod | 0.80 | 0.88 | 1.05 | 0.95 | 1.02 | ||||||||||||||
Dec 31, 2016 | Dec 31, 2015 | Dec 31, 2014 | Dec 31, 2013 | Dec 31, 2012 | |||||||||||||||
Balance Sheet Data: | |||||||||||||||||||
Working capital (1,2) | $ | 698.1 | $ | 791.1 | $ | 911.7 | $ | 1,448.8 | $ | 1,237.8 | |||||||||
Total assets (2) | 2,241.6 | 2,454.6 | 3,353.0 | 4,563.3 | 4,914.9 | ||||||||||||||
Total debt | 938.6 | 1,079.7 | 1,323.7 | 1,371.3 | 1,432.4 | ||||||||||||||
Dividends to common shareholders | 35.6 | 35.3 | 35.4 | 26.7 | — | ||||||||||||||
Total equity | 168.9 | 242.9 | 513.2 | 1,379.8 | 1,488.2 | ||||||||||||||
(1) | Working capital means current assets less current liabilities. |
(2) | December 31, 2016 and 2015 amounts are not comparable to the prior periods presented due to the Company's adoption of ASU 2015-17, "Income Taxes (Topic 740): Balance Sheet Classification of Deferred Taxes" on a prospective basis for the year ended December 31, 2015. See Note 2 - Summary of Significant Accounting Policies for additional details. |
22
ITEM 7. | MANAGEMENT’S DISCUSSION AND ANALYSIS OF FINANCIAL CONDITION AND RESULTS OF OPERATIONS |
The following Management's Discussion and Analysis of Financial Condition and Results of Operations (“MD&A”) is intended to help the reader understand General Cable Corporation's financial position, changes in financial condition, and results of operations. MD&A is provided as a supplement to the Company's consolidated financial statements and the accompanying Notes to Consolidated Financial Statements ("Footnote" or “Notes”) and should be read in conjunction with the Consolidated Financial Statements and Notes.
Certain statements in this report including, without limitation, statements regarding future financial results and performance, plans and objectives, capital expenditures and the Company's or management's beliefs, expectations or opinions, are forward-looking statements, and as such, General Cable desires to take advantage of the “safe harbor” which is afforded such statements under the Private Securities Litigation Reform Act of 1995. The Company's forward-looking statements should be read in conjunction with the Company's comments in this report under the heading, “Disclosure Regarding Forward-Looking Statements.” Actual results may differ materially from those statements as a result of factors, risks and uncertainties over which the Company has no control. For a list of these factors, risks and uncertainties, refer to Item 1A - Risk Factors.
Overview
The Company is a global leader in the development, design, manufacture, marketing and distribution of copper, aluminum and fiber optic wire and cable products for use in the energy, industrial, construction, specialty and communications markets. The Company additionally engages in the design, integration, and installation on a turn-key basis for products such as high and extra-high voltage terrestrial and submarine systems. The Company analyzes its worldwide operations based on four geographical segments: North America, Europe, Latin America, and Africa/Asia Pacific. As of December 31, 2016, the Company manufactures its product lines in 33 manufacturing facilities and sells its products worldwide through its global operations. Additional financial information regarding the segments appears in Note 18 - Segment Information.
Significant Current Business Trends and Events
The wire and cable industry is competitive, mature and cost driven with minimal differentiation for many product offerings among industry participants from a manufacturing or technology standpoint. Over the last several years, the Company and the industry have experienced uneven demand with pockets of relative demand strength. In certain markets, however, global demand remains below historical levels. The following are significant trends and events that occurred in 2016:
Effect of copper and aluminum prices
The Company’s results are directly influenced by the price of copper, and to a lesser extent, aluminum. The price of copper and aluminum as traded on the London Metal Exchange (“LME”) and Commodity Exchange, Inc. ("COMEX") has historically been subject to considerable volatility. The Company continued and expects to continue to experience volatile commodity pricing, primarily copper and aluminum, as well as in other cost inputs. The Company typically passes these changes in copper and aluminum prices along to its customers, although there are timing delays of varying lengths depending upon the volatility of metal prices, the type of product, competitive conditions, pricing mechanisms and particular customer arrangements. Although the general trends are detailed in Item 1 - Business - Raw Materials, there is no exact measure of the effect of the change of raw material cost inputs due to the high volume of transactions in any given period, each of which involves a number of factors in the individual pricing decisions. To help reduce this volatility, the Company has implemented various pricing mechanisms and hedges a portion of its metal purchases when there is a firm price commitment for a future delivery, but does not engage in speculative metals trading.
23
Asia Pacific divestiture program and Africa divestiture program
As part of the Asia Pacific divestiture program and Africa divestiture program, the Company completed the following as of December 31, 2016 (amounts presented in millions):
Entity | Sale / Closure | Sale / Closure Date | Gross Proceeds | Pre-tax Gain / (Loss) | ||||||||
South Africa - Durban(1) | Closure | Fourth Quarter 2016 | $ | — | $ | 1.6 | ||||||
South Africa - National Cables(1) | Closure | Fourth Quarter 2016 | — | (29.4 | ) | |||||||
Zambia | Sale | Third Quarter 2016 | 9.8 | (14.4 | ) | |||||||
Egypt (2) | Sale | Second Quarter 2016 | 5.8 | (8.4 | ) | |||||||
India (3) | Sale | First Quarter 2016 | 10.8 | 1.6 | ||||||||
Thailand | Sale | Third Quarter 2015 | 88.0 | 16.1 | ||||||||
Fiji | Sale | First Quarter 2015 | 9.3 | (2.6 | ) | |||||||
Keystone | Sale | First Quarter 2015 | 11.0 | 3.6 | ||||||||
PDP and PDEP | Sale | Fourth Quarter 2014 | 67.1 | 17.6 | ||||||||
(1) | The gain (loss) represents foreign currency translation adjustments reclassified from accumulated other comprehensive income upon liquidation. |
(2) | Prior to the sale, the Company recorded a long-lived asset impairment loss of $6.0 million in the first quarter of 2016. |
(3) | Prior to the sale, the Company recorded a long-lived asset impairment loss of $13.6 million in the year ended December 31, 2015. |
See Note 3 - Divestitures for additional details.
New strategic roadmap - 2015 restructuring program
In the fourth quarter of 2015, the Company committed to a new strategic roadmap focused on growth and optimization of the portfolio, developing leading cost and efficiency positions, growth through innovation and cultivation of a high-performance culture. In 2016, the Company approved additional expenditures to further expand, strengthen and accelerate the Company's program targeting operational effectiveness and efficiencies. The additional costs primarily include project management costs, including consulting fees related to the supply chain redesign and the cost to change internal systems and processes to support the underlying organizational changes. In addition, the Company recorded $17.2 million of non-cash asset impairment costs due to changes in estimated future cash flows that were not anticipated prior to 2016.
Total expected costs and costs incurred to date by reportable segment are below (in millions):
North America | Europe | Latin America | Total | |||||||||
Total expected restructuring costs | $ | 65.0 | $ | 22.0 | $ | 8.0 | $ | 95.0 | ||||
Total costs incurred, December 31, 2015 | $ | 0.1 | $ | 6.7 | $ | 1.8 | $ | 8.6 | ||||
Total costs incurred, December 31, 2016 | 48.7 | 13.7 | 3.4 | 65.8 | ||||||||
Total aggregate costs to date | $ | 48.8 | $ | 20.4 | $ | 5.2 | $ | 74.4 | ||||
Estimated remaining costs | $ | 16.2 | $ | 1.6 | $ | 2.8 | $ | 20.6 | ||||
Total aggregate costs of the program to date include $12.7 million of employee separation costs, $21.3 million of asset-related costs and $40.4 million of other costs, including $24.7 million of project management costs, including consulting fees. As of December 31, 2016, total aggregate cash outlays related to the program were $52.8 million. Total estimated remaining costs of $21 million include $2 million of employee separation costs, $4 million of asset-related costs and $15 million of other costs, including $10 million of consulting fees.
These actions resulted in the elimination of approximately 370 positions globally. The Company anticipates these actions will result in savings of approximately $100 million annually with incremental savings beginning in 2017 and into 2018.
See Note 4 - Restructuring for additional details.
2014 restructuring program
In July 2014, the Company announced a comprehensive restructuring program. As of December 31, 2016, this program is substantially complete and future estimated costs are expected to be immaterial. The restructuring program was focused on the closure of certain underperforming assets as well as the consolidation and realignment of other facilities. The Company also
24
implemented initiatives to reduce SG&A expenses globally. The restructuring program generated approximately $36 million of savings in 2016. See Note 4 - Restructuring for additional details.
North America automotive ignition wire sale
As part of the strategic roadmap, in the second quarter of 2016, the Company completed the disposal of its North American Automotive Ignition Wire business for total consideration of $70.7 million. The pre-tax gain recognized in the year ended December 31, 2016 was $53.2 million. The gain is recognized in the SG&A expenses caption in the Consolidated Statements of Operations and Comprehensive Income (Loss). This disposal did not represent a strategic shift that has or will have a major effect on the Company’s operations and financial results; therefore, the results are presented as continued operations.
Events affecting Venezuela operations
In the third quarter of 2016, the Company completed the sale of its Venezuelan subsidiary for cash consideration of approximately $6 million. The pre-tax gain recognized in the year ended December 31, 2016 was $5.9 million.
Effective October 2, 2015, the Company deconsolidated its Venezuelan subsidiary and began accounting for its investment in the Venezuelan subsidiary using the cost method of accounting. Beginning in the fourth quarter of 2015, the Company's financial results only included U.S. dollar payments received from its Venezuelan subsidiary. See Note 2 - Summary of Significant Accounting Policies and additional discussion in this MD&A under Critical Accounting Policies and Estimates.
China asset impairment
In the fourth quarter of 2016, the Company recorded a long-lived asset impairment loss in costs of sales of $11.0 million related to its Chinese operations. See Note 7 - Property, Plant and Equipment for additional details.
Resolution of SEC and DOJ investigations
We announced on December 29, 2016, that we had entered into agreements with the SEC and the DOJ that bring to a conclusion those agencies’ respective investigations relating to the FCPA and the SEC’s separate accounting investigation related to our financial restatements impacting fiscal years 2012 and prior. Pursuant to those agreements, we will pay fines, disgorgement and pre-judgment interest to the SEC and DOJ in the total amount of $82.3 million.
The resolution with the SEC encompasses both the FCPA issues and the separate accounting and disclosure issues that were the subject of our prior restatements. We will disgorge profits of approximately $51.2 million and pay pre-judgment interest of approximately $4.1 million in connection with the FCPA matter, and pay a civil penalty in connection with the restatement-related matters of $6.5 million.
As part of the DOJ resolution for the FCPA matter, we will pay a penalty of approximately $20.5 million. We have entered into a non-prosecution agreement with the DOJ which will be in effect for three years. No criminal charges will be brought against us provided we comply with our obligations under the agreement. In light of the significant compliance enhancements made by us, neither the SEC nor the DOJ is requiring an independent compliance monitor. Instead, we agreed to annual self-reporting for a period of three years.
The DOJ penalty of $20.5 million was paid in a single payment in January 2017. We paid $12.4 million to the SEC in January 2017, and will pay approximately $18.5 million to the SEC within 180 days of the date of the resolution and will make a final payment of approximately $30.9 million to the SEC within 360 days of the date of the resolution. As of the third quarter of 2016, we had accrued $33 million for the FCPA-related investigations. As a result of the resolutions with the DOJ and the SEC, we recorded a charge of approximately $49.3 million in the fourth quarter of 2016. Taking this charge into account, we have recognized all costs associated with the resolution of these matters with the DOJ and SEC.
See Note 19 - Commitments and Contingencies for additional details.
Procables put option
On October 1, 2016, the Procables minority shareholders elected to exercise the put option to sell their entire 40% interest to the Company. On December 9, 2016, the Company paid $18.0 million to purchase the 40% interest. See Note 16 - Redeemable Noncontrolling Interest for more information.
Foreign currency
The Company's results are directly influenced by fluctuations in foreign currency exchange rates. Uncertainty in the global market conditions has resulted in, and may continue to cause, significant volatility in foreign currency exchange rates. This volatility results in gains / losses on transactions whose terms are denominated in a currency other than the entity's functional currency and the Company's consolidated results are influenced by the translation of the international units' results to U.S. dollars. To help reduce this volatility, the Company enters into foreign currency exchange contracts principally to hedge the currency fluctuations in certain transactions denominated in foreign currencies.
25
Seasonality
The Company generally has experienced and expects to continue to experience certain seasonal trends in many products in which demand is linked with construction spending. Demand for these products during winter months in certain geographies, primarily North America, is usually lower than demand during spring and summer months. Therefore, larger amounts of working capital are generally required during winter months in order to build inventories in anticipation of higher demand during the spring and summer months, when construction activity increases. In turn, receivables related to higher sales activity during the spring and summer months are generally collected during the fourth quarter of the year. Additionally, the Company has historically experienced changes in demand resulting from poor or unusual weather.
In addition to the factors previously mentioned, the Company is currently being affected by the following general macro-level trends:
• | Global demand and pricing are uneven as a result of macroeconomic factors, and therefore, continues to hamper growth in key end markets; |
• | Currency volatility and continued political uncertainty in certain markets; |
• | Volatility in the price of copper and aluminum; |
• | Competitive price pressures in certain markets; |
• | New commodity deposits are more difficult to find, harder and more expensive to extract, and lower in quantities; |
• | End market demand in Latin America continues to be hampered by inconsistent construction spending and electrical infrastructure investment; |
• | Recovery is slow in Europe and demand continues to be uneven for a broad spectrum of products in Europe; |
• | The U.S. market has remained relatively stable compared to the uneven and challenging operating environments of the emerging economies; |
• | New communications networks are an enabling technology, which require communication infrastructure investment; |
• | Climate change concerns are resulting in increased regulatory energy mandates, emphasizing renewable sources of energy; |
• | Project timing continues to be volatile resulting in a lag in demand in all segments; and |
• | Countries are seeking greater energy independence for political and economic reasons. |
The Company's overall financial results discussed in this section of the annual report reflect the above trends.
26
Results of Operations
The following table sets forth, for the periods indicated, consolidated statement of operations data in millions of dollars and as a percentage of net sales. Percentages may not add due to rounding.
Year Ended December 31, | ||||||||||||||||||||
2016 | 2015 | 2014 | ||||||||||||||||||
Amount | % | Amount | % | Amount | % | |||||||||||||||
Net sales | $ | 3,858.4 | 100.0 | % | $ | 4,514.5 | 100.0 | % | $ | 5,979.8 | 100.0 | % | ||||||||
Cost of sales | 3,451.3 | 89.4 | % | 4,082.1 | 90.4 | % | 5,586.6 | 93.4 | % | |||||||||||
Gross profit | 407.1 | 10.6 | % | 432.4 | 9.6 | % | 393.2 | 6.6 | % | |||||||||||
Selling, general and administrative expenses | 408.9 | 10.6 | % | 412.3 | 9.1 | % | 450.7 | 7.5 | % | |||||||||||
Goodwill impairment charges | 9.0 | 0.2 | % | 3.9 | 0.1 | % | 155.1 | 2.6 | % | |||||||||||
Intangible asset impairment charges | 7.5 | 0.2 | % | 1.7 | — | % | 98.8 | 1.7 | % | |||||||||||
Operating income (loss) | (18.3 | ) | (0.5 | )% | 14.5 | 0.3 | % | (311.4 | ) | (5.2 | )% | |||||||||
Other income (expense) | 7.2 | 0.2 | % | (71.3 | ) | (1.6 | )% | (212.9 | ) | (3.6 | )% | |||||||||
Interest expense, net | (87.0 | ) | (2.3 | )% | (94.3 | ) | (2.1 | )% | (111.8 | ) | (1.9 | )% | ||||||||
Income (loss) before income taxes | (98.1 | ) | (2.5 | )% | (151.1 | ) | (3.3 | )% | (636.1 | ) | (10.6 | )% | ||||||||
Income tax (provision) benefit | 3.7 | 0.1 | % | 14.8 | 0.3 | % | (8.3 | ) | (0.1 | )% | ||||||||||
Equity in net earnings of affiliated companies | 0.9 | — | % | 0.5 | — | % | 1.4 | — | % | |||||||||||
Net income (loss) including noncontrolling interest | (93.5 | ) | (2.4 | )% | (135.8 | ) | (3.0 | )% | (643.0 | ) | (10.8 | )% | ||||||||
Less: net income (loss) attributable to noncontrolling interest | 0.3 | — | % | (13.9 | ) | (0.3 | )% | (15.4 | ) | (0.3 | )% | |||||||||
Net income (loss) attributable to Company common shareholders | $ | (93.8 | ) | (2.4 | )% | $ | (121.9 | ) | (2.7 | )% | $ | (627.6 | ) | (10.5 | )% | |||||
Year Ended December 31, 2016 Compared with Year Ended December 31, 2015
Net Sales
The following tables set forth net sales, metal-adjusted net sales and metal pounds sold by segment, in millions. For the metal-adjusted net sales results, net sales for 2015 have been adjusted to reflect the 2016 copper average price of $2.20 per pound (a $0.31 decrease compared to 2015) and the 2016 aluminum average price of $0.80 per pound (a $0.08 decrease compared to 2015).
Net Sales Year Ended | |||||||||||||
Dec 31, 2016 | Dec 31, 2015 | ||||||||||||
Amount | % | Amount | % | ||||||||||
North America | $ | 2,041.7 | 53 | % | $ | 2,299.3 | 51 | % | |||||
Europe | 875.7 | 23 | % | 960.2 | 21 | % | |||||||
Latin America | 655.2 | 17 | % | 726.8 | 16 | % | |||||||
Africa/Asia Pacific | 285.8 | 7 | % | 528.2 | 12 | % | |||||||
Total net sales | $ | 3,858.4 | 100 | % | $ | 4,514.5 | 100 | % | |||||
27
Metal-adjusted net sales, a non-GAAP financial measure, are provided below in order to eliminate an estimate of metal price volatility from the comparison of revenues from one period to another. The comparable GAAP financial measure is set forth above. Refer to Item 1 - Business for a discussion of metal price volatility.
Metal-Adjusted Net Sales Year Ended | |||||||||||||
Dec 31, 2016 | Dec 31, 2015 | ||||||||||||
Amount | % | Amount | % | ||||||||||
North America | $ | 2,041.7 | 53 | % | $ | 2,196.9 | 51 | % | |||||
Europe | 875.7 | 23 | % | 927.6 | 22 | % | |||||||
Latin America | 655.2 | 17 | % | 672.3 | 16 | % | |||||||
Africa/Asia Pacific | 285.8 | 7 | % | 491.3 | 11 | % | |||||||
Total metal-adjusted net sales | $ | 3,858.4 | 100 | % | $ | 4,288.1 | 100 | % | |||||
Metal adjustment | — | 226.4 | |||||||||||
Total net sales | $ | 3,858.4 | $ | 4,514.5 | |||||||||
Metal pounds sold is provided below as the Company believes this metric to be an appropriate measure of sales volume since it is not impacted by metal prices or foreign currency exchange rate changes.
Metal Pounds Sold Year Ended | |||||||||||
Dec 31, 2016 | Dec 31, 2015 | ||||||||||
Pounds | % | Pounds | % | ||||||||
North America | 548.0 | 54 | % | 543.9 | 51 | % | |||||
Europe | 154.0 | 15 | % | 155.0 | 15 | % | |||||
Latin America | 239.3 | 23 | % | 239.3 | 22 | % | |||||
Africa/Asia Pacific | 85.1 | 8 | % | 130.8 | 12 | % | |||||
Total metal pounds sold | 1,026.4 | 100 | % | 1,069.0 | 100 | % | |||||
Consolidated
Net sales decreased $656.1 million, or 15%, in 2016 from 2015. The net decrease was primarily attributable to:
• | The sale or exit of operations as part of the restructuring and divestiture programs of $211.2 million |
• | Lower copper and aluminum prices of $226.4 million |
• | Unfavorable product mix and foreign currency rate changes of $125.9 million and $97.3 million, respectively |
Volume, as measured by metal pounds sold, decreased 42.6 million pounds, or 4%, in 2016 compared to 2015, principally due to the impact of businesses sold in 2016. Excluding divested businesses, volume, as measured by metal pounds sold, increased 3.0 million pounds.
North America
Net sales in the North America segment decreased $257.6 million, or 11%, in 2016 from 2015. The net decrease was primarily attributable to:
• | Net sales of $51.7 million attributable to the automotive ignition wire business that was sold in 2016 |
• | Lower copper and aluminum prices of $102.4 million |
• | Unfavorable product mix and foreign currency rate changes of $94.9 million and $15.1 million, respectively |
Volume, as measured by metal pounds sold, increased 4.1 million pounds, or 1%, in 2016 compared to 2015. The increase was primarily attributable to favorable market demand for construction and electric utility cables which was partially offset by unfavorable market demand for specialty products, particularly oil and gas.
Europe
Net sales in the Europe segment decreased $84.5 million, or 9%, in 2016 from 2015. The net decrease was primarily attributable to:
• | Lower copper and aluminum prices of $32.6 million |
• | Unfavorable product mix and foreign currency exchange rate changes of $45.0 million and $5.3 million, respectively |
28
Volume, as measured by metal pounds sold, remained relatively flat in 2016 compared to 2015. Stronger demand for electric utility products including land-based turnkey projects as well as energy cables was offset by the continued weak demand for industrial and construction products throughout the region.
Latin America
Net sales in the Latin America segment decreased $71.6 million, or 10%, in 2016 from 2015. The net decrease was primarily attributable to:
• | Lower copper and aluminum prices of $54.5 million |
• | Unfavorable foreign currency exchange rate changes of $36.1 million |
• | These trends were partially offset by favorable product mix of $18.4 million |
Volume, as measured by metal pounds sold, remained relatively flat in 2016 compared to 2015. Increased volume for aerial transmission cables was offset by a decrease of 3.9 million pounds related to the sale of Venezuela coupled with ongoing difficult economic conditions and reduced government spending.
Africa/Asia Pacific
Net sales in the Africa/Asia Pacific segment decreased $242.4 million, or 46%, in 2016 from 2015. The net decrease was primarily attributable to:
• | Net sales of $153.9 million attributable to businesses that were sold as part of the divestiture program in 2016 |
• | Lower copper and aluminum prices of $36.9 million |
• | Unfavorable foreign currency exchange rate changes of $40.8 million |
Volume, as measured by metal pounds sold, decreased by 45.7 million pounds, or 35%, in 2016 compared to 2015. The decrease in volume sold was primarily attributable to divested businesses of 41.7 million pounds.
Cost of Sales
Cost of sales decreased $630.8 million to $3,451.3 million in 2016 from $4,082.1 million in 2015. The percentage decrease in cost of sales was consistent with the percentage decrease in sales. As previously noted, cost of sales is raw material intensive with copper and aluminum comprising the major cost components for cable products. At current metal prices, material costs are approximately 85% of total product cost with copper and aluminum metal costs comprising approximately 45% of total product cost for the year ended December 31, 2016.
Gross Profit
Gross profit decreased $25.3 million, or 6% in 2016 as compared to 2015. Gross profit as a percentage of sales was 11% and 10% for the years ended December 31, 2016 and 2015, respectively.
Selling, General and Administrative Expenses
SG&A expense decreased $3.4 million, or 1%, in 2016 from 2015. The net favorable impact to SG&A expense was primarily attributable to the benefit of restructuring savings recognized in the year ended December 31, 2016. For 2016 and 2015, SG&A expense reflects the net impact of restructuring and divestiture actions as well as discrete items including the following:
• | In 2016, the Company recorded restructuring expenses of $48.8 million and SEC and DOJ related expenses of $54.3 million, which were partially offset by net divestiture activities of $21.2 million |
• | In 2015, the Company recorded restructuring expenses of $26.7 million and a Venezuela deconsolidation charge of $12.0 million, which were partially offset by net pre-tax gains on asset sales of $16.1 million |
SG&A as a percentage of net sales was approximately 11% in 2016 and 9% in 2015.
29
Operating Income (Loss)
The following table sets forth operating income (loss) by segment, in millions of dollars.
Operating Income (Loss) Year Ended | |||||||||||||
Dec 31, 2016 | Dec 31, 2015 | ||||||||||||
Amount | % | Amount | % | ||||||||||
North America | $ | 62.4 | (341 | )% | $ | 84.5 | 583 | % | |||||
Europe | 2.6 | (14 | )% | 6.6 | 45 | % | |||||||
Latin America | (14.4 | ) | 79 | % | (22.8 | ) | (157 | )% | |||||
Africa/Asia Pacific | (68.9 | ) | 376 | % | (53.8 | ) | (371 | )% | |||||
Total operating income (loss) | $ | (18.3 | ) | 100 | % | $ | 14.5 | 100 | % | ||||
North America
The decrease in operating income in North America was $22.1 million in the year ended December 31, 2016 compared to the year ended December 31, 2015. The net decrease in operating income was primarily due to the unfavorable net impact of the resolution of the SEC and DOJ investigations of $50.3 million coupled with the impact of weak end market demand for oil and gas products. The decrease was partially offset by the benefit of restructuring initiatives and by $10.5 million due to lower restructuring related charges (including gains on asset sales) and the impact of stronger demand for the electric utility and non-residential construction markets.
Europe
The decrease in operating income for the Europe segment was $4.0 million in the year ended December 31, 2016 compared to the year ended December 31, 2015. The net decrease in operating income was primarily attributable to the unfavorable impact of lower subsea project activity, the continued weak industrial and construction activity throughout the region and divestiture related charges of $8.4 million, including losses on divested businesses. The decrease was partially offset by $30.3 million due to lower restructuring related charges and the impact of divesting certain businesses, including the sale and deconsolidation of Venezuela (recorded in Europe based on the legal entity structure).
Latin America
The Latin America segment operating income improved $8.4 million in the year ended December 31, 2016 compared to the year ended December 31, 2015. The improvement in operating income was primarily driven by restructuring savings in the year ended December 31, 2016.
Africa/Asia Pacific
The increase in operating loss for the Africa/Asia Pacific segment was $15.1 million in the year ended December 31, 2016 compared to the year ended December 31, 2015. The net increase in operating loss was primarily attributable to higher costs related to divestiture activity of $18.3 million including gains and losses on sales and closures of businesses and asset-related costs.
Other Income (Expense)
Other income (expense) primarily includes foreign currency transaction gains or losses, which result from changes in exchange rates between the designated functional currency and the currency in which a transaction is denominated as well as gains and losses on derivative instruments that are not designated as cash flow hedges and Venezuela devaluation charges. During 2016 and 2015, the Company recorded other income of $7.2 million and other expense $71.3 million, respectively.
For 2016, other income was primarily attributable to $8.9 million related to gains on derivative instruments that were not designated as cash flow hedges, partially offset by $1.7 million related to foreign currency transaction losses.
For 2015, other expense was primarily attributable to the adoption of the SIMADI currency exchange system in Venezuela and ongoing remeasurement of the local balance sheet, which resulted in an expense of $22.9 million, $41.2 million related to foreign currency transaction losses, and $7.2 million related to losses on derivative instruments which were not designated as cash flow hedges.
Refer to Note 2 - Summary of Significant Accounting Policies for more information regarding the Company's Venezuelan operations.
Interest Expense
Net interest expense decreased $7.3 million in 2016 as compared to 2015 primarily due to cash proceeds from divestitures which were utilized to pay down debt and lower borrowings due to the efficient management of working capital and lower metal prices
30
in the year ended December 31, 2016 as well as the incremental interest expense recognized in the year ended December 31, 2015 on the Company's Senior Floating Rate Notes, which were paid on March 31, 2015.
Tax Provision
The Company’s effective tax rate for 2016 and 2015 was 3.8% and 9.8%, respectively. The Company’s low effective tax rate for 2016 was primarily due to the adverse impact of recognizing no tax benefit on operating losses incurred in jurisdictions where valuation allowances are recorded against net deferred tax assets, recording $6.7 million of tax expense to establish a valuation allowance against beginning of year net deferred tax assets in China, and recognizing no tax benefit on $27.8 million of foreign currency translation adjustments reclassified out of accumulated other comprehensive income into continuing operations related to the closure of our South African operations. These adverse effects were partially offset by the use of U.S. capital losses for which no tax benefit was previously recognized. This resulted in the recognition of only $2.2 million of income tax expense on $53.2 million of pre-tax gain associated with the sale of the North American Automotive Ignition Wire business. The Company’s relatively low 2015 effective tax rate was primarily due to the adverse impact of operating losses incurred in jurisdictions where valuation allowances are recorded against net deferred tax assets, partially offset by tax benefits associated with the exiting of business in India and the expiration of statutes of limitation on contingent tax liabilities in various jurisdictions.
During 2016, after weighing all positive and negative evidence, including three year cumulative loss positions, forecasted future profitability, impairments and restructuring charges, difficult market and industry conditions, and factoring in prudent and feasible tax planning strategies, a valuation allowance was recorded against $6.7 million of beginning of year net deferred tax assets associated with the business unit in China. The business unit did not have a deferred tax valuation allowance prior to 2016. Various other business units maintained full deferred tax asset valuation allowances that had been established in prior years, some for which the valuation allowance amounts increased significantly due to impairments, restructuring charges and operating losses.
During 2015, $1.4 million of valuation allowances were recorded against the December 31, 2015 deferred tax assets of the Brazilian automotive and South African units, and a $4.3 million tax benefit was recognized for the release of the valuation allowance against the German unit's deferred tax assets due to a sustained level of profitability. In addition, several other business units maintained full deferred tax asset valuation allowances that had been established in prior years, some for which the valuation allowance amounts increased significantly due to impairments, restructuring charges and operating losses.
The Company derives significant cash tax savings from the Subordinated Convertible Notes. For U.S. federal income tax purposes, the interest deduction on the Subordinated Convertible Notes is computed based on the comparable yield of a hypothetical fixed rate debt instrument with similar terms and conditions but no conversion feature. The comparable yield was determined based on independent appraisal to be 12.5%. Accordingly, annual interest deductions are calculated at 12.5% of the adjusted issue price. The adjusted issue price, and consequently the interest deduction for income tax purposes, grows over the term of the debt due to the difference between the interest deduction using a comparable yield of 12.5% on the adjusted issue price, and the coupon rate of 4.5% on the principal amount. Interest expense recognized in accordance with GAAP is calculated at 12.5% of the liability component of the Subordinated Convertible Notes, which is substantially lower than the adjusted issue price for tax purposes. The difference between the tax and GAAP interest computations results in substantially greater interest deductions for tax purposes than GAAP interest expense. The Company paid no U.S. federal income taxes for 2016 or 2015.
31
Year Ended December 31, 2015 Compared with Year Ended December 31, 2014
Net Sales
The following tables set forth net sales, metal-adjusted net sales and metal pounds sold by segment, in millions. For the metal-adjusted net sales results, net sales for 2014 have been adjusted to reflect the 2015 copper average price of $2.51 per pound (a $0.61 decrease compared to 2014) and the aluminum average price of $0.88 per pound (a $0.17 decrease compared to 2014).
Net Sales Year Ended | |||||||||||||
Dec 31, 2015 | Dec 31, 2014 | ||||||||||||
Amount | % | Amount | % | ||||||||||
North America | $ | 2,299.3 | 51 | % | $ | 2,550.1 | 43 | % | |||||
Europe | 960.2 | 21 | % | 1,330.8 | 22 | % | |||||||
Latin America | 726.8 | 16 | % | 1,143.0 | 19 | % | |||||||
Africa/Asia Pacific | 528.2 | 12 | % | 955.9 | 16 | % | |||||||
Total net sales | $ | 4,514.5 | 100 | % | $ | 5,979.8 | 100 | % | |||||
Metal-adjusted net sales, a non-GAAP financial measure, are provided below in order to eliminate an estimate of metal price volatility from the comparison of revenues from one period to another. The comparable GAAP financial measure is set forth above. Refer to Item 1 - Business for a discussion of metal price volatility.
Metal-Adjusted Net Sales Year Ended | |||||||||||||
Dec 31, 2015 | Dec 31, 2014 | ||||||||||||
Amount | % | Amount | % | ||||||||||
North America | $ | 2,299.3 | 51 | % | $ | 2,339.1 | 43 | % | |||||
Europe | 960.2 | 21 | % | 1,244.4 | 23 | % | |||||||
Latin America | 726.8 | 16 | % | 1,006.0 | 18 | % | |||||||
Africa/Asia Pacific | 528.2 | 12 | % | 854.4 | 16 | % | |||||||
Total metal-adjusted net sales | $ | 4,514.5 | 100 | % | $ | 5,443.9 | 100 | % | |||||
Metal adjustment | — | 535.9 | |||||||||||
Total net sales | $ | 4,514.5 | $ | 5,979.8 | |||||||||
Metal pounds sold is provided below as the Company believes this metric to be an appropriate measure of sales volume since it is not impacted by metal prices or foreign currency exchange rate changes.
Metal Pounds Sold Year Ended | |||||||||||
Dec 31, 2015 | Dec 31, 2014 | ||||||||||
Pounds | % | Pounds | % | ||||||||
North America | 543.9 | 51 | % | 553.4 | 44 | % | |||||
Europe | 155.0 | 15 | % | 200.4 | 16 | % | |||||
Latin America | 239.3 | 22 | % | 307.5 | 24 | % | |||||
Africa/Asia Pacific | 130.8 | 12 | % | 197.4 | 16 | % | |||||
Total metal pounds sold | 1,069.0 | 100 | % | 1,258.7 | 100 | % | |||||
Consolidated
Net sales decreased $1,465.3 million, or 25%, in 2015 from 2014. The net decrease was primarily attributable to:
• | Lower copper and aluminum prices of $535.9 million |
• | Unfavorable foreign currency exchange rate changes and lower volume of $647.4 million and $346.2 million, respectively |
• | These trends were partially offset by favorable product mix of $64.2 million |
Volume, as measured by metal pounds sold, decreased 189.7 million pounds, or 15%, in 2015 compared to 2014.
32
North America
Net sales in the North America segment decreased $250.8 million, or 10%, in 2015 from 2014. The net decrease was primarily attributable to:
• | Lower copper and aluminum prices of $211.0 million |
• | Unfavorable foreign currency exchange rate changes and lower volume of $59.9 million and $17.3 million, respectively |
• | These trends were partially offset by favorable product mix of $37.4 million |
Volume, as measured by metal pounds sold, decreased 9.5 million pounds, or 2%, in 2015 compared to 2014. The decrease was primarily attributable to unfavorable market demand for industrial and specialty products, particularly those used in oil and gas applications, partially offset by favorable market demand for aluminum rod, communication and electric utility products.
Europe
Net sales in the Europe segment decreased $370.6 million, or 28%, in 2015 from 2014. The net decrease was primarily attributable to:
• | Lower copper and aluminum prices of $86.4 million |
• | Unfavorable foreign currency exchange rate changes and lower volume of $219.4 million and $82.8 million, respectively |
• | These trends were partially offset by favorable product mix of $18.0 million |
Volume, as measured by metal pounds sold, decreased 45.4 million pounds, or 23%, in 2015 compared to 2014. The decrease in volume was primarily attributable to exiting of certain businesses as a result of the Company's July 2014 restructuring program and lower demand for low voltage construction and industrial products.
Latin America
Net sales in the Latin America segment decreased $416.2 million, or 36%, in 2015 from 2014. The net decrease was primarily attributable to:
• | Lower copper and aluminum prices of $137.0 million |
• | Unfavorable foreign currency exchange rate changes and lower volume of $265.6 million and $124.3 million, respectively |
• | These trends were partially offset by favorable product mix of $110.7 million |
Volume, as measured by metal pounds sold, decreased 68.2 million pounds, or 22%, in 2015 compared to 2014. The decrease in volume was primarily attributable to the impact related to the deconsolidation of the Company's Venezuelan subsidiary in the third quarter of 2015 and overall weak end market demand due to ongoing difficult economic conditions and reduced government spending.
Africa/Asia Pacific
Net sales in the Africa/Asia Pacific segment decreased $427.7 million, or 45%, in 2015 from 2014. The net decrease was primarily attributable to:
• | Lower copper and aluminum prices of $101.5 million |
• | Unfavorable foreign currency exchange rate changes and product mix of $102.5 million and $101.9 million, respectively, as well as lower volume of $121.8 million |
Volume, as measured by metal pounds sold, decreased 66.6 million pounds, or 34%, in 2015 compared to 2014. The decrease in volume sold was primarily attributable to divested businesses and overall weak economic conditions in Africa and Asia Pacific.
Cost of Sales
Cost of sales decreased $1,504.5 million to $4,082.1 million in 2015 from $5,586.6 million in 2014. The percentage decrease in cost of sales, 27%, was greater than the percentage decrease in sales, 25%, in 2015. In 2015, the net favorable impact as compared to 2014 was primarily attributable to:
• | In 2015, the Company recorded restructuring expenses of $23.9 million and asset impairment charges of $44.3 million |
• | In 2014, the Company recorded restructuring expenses of $161.8 million and asset impairment charges of $69.2 million |
As previously noted, cost of sales is raw material intensive with copper and aluminum comprising the major cost components in most of the Company's cable products. For the year ended December 31, 2015, material costs are approximately 85% of total product cost with copper and aluminum metal costs comprising approximately 45% of total product cost.
33
Gross Profit
Gross profit decreased $39.2 million, or 10% in 2015 as compared to 2014. Gross profit as a percentage of sales was 10% in 2015 and 7% in 2014. The increase in gross profit as a percentage of sales was primarily due to the items listed within the Cost of Sales section above.
Selling, General and Administrative Expenses
SG&A expense decreased $38.4 million, or 9%, in 2015 from 2014. The decline of SG&A expense was primarily attributable to favorable foreign currency exchange gains of $42.1 million and the benefit of restructuring savings realized in the year ended December 31, 2015. For 2015 and 2014, SG&A expense reflects the net impact of restructuring and divestiture actions as well as discrete items including the following:
• | In 2015, net pre-tax gains on asset sales of $16.1 million were partially offset by restructuring expenses of $26.7 million and a Venezuela deconsolidation charge of $12.0 million |
• | In 2014, the Company recorded restructuring expenses of $14.6 million and FCPA-related expenses of $24.0 million |
SG&A as a percentage of net sales was approximately 9% in 2015 and 8% in 2014.
Operating Income
The following table sets forth operating income by segment, in millions of dollars.
Operating Income (Loss) Year Ended | |||||||||||||
Dec 31, 2015 | Dec 31, 2014 | ||||||||||||
Amount | % | Amount | % | ||||||||||
North America | $ | 84.5 | 583 | % | $ | 118.5 | (38 | )% | |||||
Europe | 6.6 | 45 | % | (94.0 | ) | 30 | % | ||||||
Latin America | (22.8 | ) | (157 | )% | (246.6 | ) | 79 | % | |||||
Africa/Asia Pacific | (53.8 | ) | (371 | )% | (89.3 | ) | 29 | % | |||||
Total operating income | $ | 14.5 | 100 | % | $ | (311.4 | ) | 100 | % | ||||
North America
The decrease in operating income for the North America segment was $34.0 million in the year ended December 31, 2015 compared to the year ended December 31, 2014. The net decrease in operating income was primarily attributable to decreased demand for industrial and specialty products (particularly those used in oil and gas applications), lower divestiture related activity of $16.7 million and due to the negative impact of selling higher average cost inventory into a lower price environment on copper and aluminum based products in the current year, partially offset by lower restructuring costs of $4.9 million and the net impact of accruals related to the FCPA investigation of $20.0 million.
Europe
The increase in operating income for the Europe segment was $100.6 million in the year ended December 31, 2015 compared to the year ended December 31, 2014. The increase in operating income was primarily attributable to lower restructuring costs of $86.8 million, partially offset by the unfavorable impact due to the deconsolidation of the Company's Venezuelan subsidiary resulting in a charge of $12.0 million in the year ended December 31, 2015.
Latin America
The Latin America segment operating income improved $223.8 million in the year ended December 31, 2015 compared to the year ended December 31, 2014. Operating income improved primarily due to the recognition of goodwill and other indefinite-lived trade name impairment charges of $152.0 million recognized in the year ended December 31, 2014, the recognition of a long-lived asset impairment charge of $29.3 million in Venezuela in the year ended December 31, 2014, lower restructuring charges of $19.0 million, the recognition of a long-lived asset impairment charge of $13.1 million related to the Brazil rod mill in the year ended December 31, 2014 and the recognition of a $10.3 million charge for the long-term value added tax receivable from the Venezuelan government in the year ended December 31, 2014. The increase was partially offset by end market demand pressure throughout Latin America due to the difficult economic conditions and reduced government spending.
Africa/Asia Pacific
The Africa/Asia Pacific segment operating income improved $35.5 million in the year ended December 31, 2015 compared to the year ended December 31, 2014. Operating income improved primarily due to the recognition of goodwill and other indefinite-lived trade name impairment charges of $96.5 million recognized in the year ended December 31, 2014 and lower restructuring
34
costs of $15.1 million, partially offset by weak economic conditions in Africa and Asia Pacific as well as higher divestiture related activity of $22.1 million.
Other Income (Expense)
Other income (expense) primarily includes foreign currency transaction gains or losses, which result from changes in exchange rates between the designated functional currency and the currency in which a transaction is denominated as well as gains and losses on derivative instruments that are not designated as cash flow hedges and Venezuela devaluation charges. During 2015 and 2014, the Company recorded other expense of $71.3 million and $212.9 million, respectively.
For 2015, other expense was primarily attributable to the adoption of the SIMADI currency exchange system in Venezuela and ongoing remeasurement of the local balance sheet, which resulted in an expense of $22.9 million, $41.2 million related to foreign currency transaction losses, and $7.2 million related to losses on derivative instruments which were not designated as cash flow hedges.
For 2014, other expense was primarily attributable to $83.1 million related to the Venezuela currency devaluation resulting from the remeasurement of the financial results at the 6.30 BsF per U.S. dollar rate to the SICAD 1 rate, $90.2 million related to the Venezuela currency devaluation resulting from the remeasurement of the financial results at the SICAD 1 rate to the SICAD 2 rate, $30.3 million of foreign currency transaction losses, and losses of $4.0 million on derivative instruments that were not designated as cash flow hedges.
Interest Expense
Net interest expense decreased $17.5 million in 2015 as compared to 2014 primarily attributable to reductions in working capital in Latin America and applying divestiture sale proceeds to reduce debt in 2015, as well as incremental interest expense on the Company's Senior Floating Rate Notes recognized in 2014. The Senior Floating Rate Notes were repaid in March 2015.
Tax Provision
The Company’s effective tax rate for 2015 and 2014 was 9.8% and (1.3%), respectively. The Company’s relatively low 2015 effective tax rate was primarily due to the adverse impact of operating losses incurred in jurisdictions where valuation allowances are recorded against net deferred tax assets, partially offset by tax benefits associated with the exiting of business in India and the expiration of statutes of limitation on contingent tax liabilities in various jurisdictions. The Company’s low effective tax rate for 2014 was primarily due to a relatively small income tax benefit recorded on the significant pre-tax charges related to asset impairments, restructuring charges, Venezuelan currency devaluation loss, and other operating losses incurred in jurisdictions where valuation allowances are recorded against net deferred tax assets.
For the year ended December 31, 2014, the Company recognized a goodwill impairment charge of $155.1 million for which no tax benefit was recorded due to the non-deductibility of goodwill in the relevant taxing jurisdictions. In addition, due primarily to the valuation allowances recorded in various business units, relatively small tax benefits were recorded for the $93.4 million impairment charge for the indefinite-lived trade name associated with the PDIC reporting unit, the $42.4 million impairment charge related to the Company’s long-lived assets, and the $166.3 million restructuring charges related to the July 2014 restructuring plan. In addition, no tax benefits were recorded for the $173.3 million non-deductible Venezuelan currency devaluation losses.
During 2014, after weighing all positive and negative evidence, including three year cumulative loss positions, forecasted future profitability, impairments and restructuring charges, difficult market and industry conditions, and factoring in prudent and feasible tax planning strategies, valuation allowances were recorded against deferred tax assets of certain business units that did not have deferred tax valuation allowances prior to 2014. Specifically, valuation allowances have been recorded against the December 31, 2014 deferred tax assets of the following business units: Venezuela ($10.7 million), Brazil ($8.4 million), Spain ($10.9 million) and Colombia ($2.3 million). In addition, several other business units maintained full deferred tax asset valuation allowances that had been established in prior years, some for which the valuation allowance amounts increased significantly due to impairments, restructuring charges and operating losses.
During 2015, $1.4 million of valuation allowances were recorded against the December 31, 2015 deferred tax assets of the Brazilian automotive and South African units, and a $4.3 million tax benefit was recognized for the release of the valuation allowance against the NSW German unit's deferred tax assets due to a sustained level of profitability. In addition, several other business units maintained full deferred tax asset valuation allowances that had been established in prior years, some for which the valuation allowance amounts increased significantly due to impairments, restructuring charges and operating losses.
35
Liquidity and Capital Resources
Cash flows from operations as well as borrowings under the Revolving Credit Facility provide the primary source for financing operating expenses and other short term liquidity needs. As necessary, the Company incurs additional borrowings to fund working capital, debt and interest payments, as well as discretionary investment in product development, acquisitions, cash dividends and to fund tax payments. The overall cash position of the Company reflects the business results and a global cash management strategy that incorporates liquidity management, economic factors, and tax considerations.
Short term borrowings vary by period based on working capital requirements, which is dependent on incremental demand for products and changes in the price of copper, aluminum, and other raw material cost inputs. At December 31, 2016, current assets exceeded current liabilities by $698.1 million. Based upon historical experience, the cash on the balance sheet and the expected availability of funds under its credit facilities, the Company believes it has sufficient liquidity to meet funding requirements for cash dividends, working capital, capital expenditures, debt repayment, salaries and related benefits, restructuring activities, interest and taxes as well as fines, disgorgement and pre-judgment interest related to the settlement of the Company's SEC and DOJ investigations for the next twelve months and foreseeable future. The Company maintains approximately $448.4 million of excess availability under its various credit facilities around the world.
The Company generally borrows and repays its Revolving Credit Facility multiple times per week for working capital needs; borrowing on a short term basis is the most effective method to reduce interest costs based on the terms of the agreement. The Company's European and Latin American operations also participate in accounts payable confirming arrangements with several financial institutions to address working capital requirements in the business. At December 31, 2016, the arrangements had a maximum availability limit of the equivalent of approximately $136.6 million, of which approximately $130.1 million was utilized.
General Cable Corporation is a holding company with no operations of its own. All of the Company’s operations are conducted, and net sales are generated, by its subsidiaries and investments. Accordingly, the Company’s cash flow comes from the cash flows of its global operations. The Company’s ability to use cash flow from its international operations, if necessary, has historically been adversely affected by limitations on the Company’s ability to repatriate such earnings tax efficiently. As of December 31, 2016 and 2015, approximately 99% of cash and cash equivalents were held outside of the U.S. by the Company's foreign subsidiaries. If these funds are needed for the Company's operations in the U.S., repatriation of the funds would generally result in foreign withholding taxes and the recognition of U.S. taxable income. However, the Company does not foresee a need to repatriate this cash to fund U.S. operations. In addition, the Revolving Credit Facility provides the Company flexibility in financing operating expenses and any other short term liquidity needs.
On October 1, 2016, the Procables minority shareholders elected to exercise the put option to sell their entire 40% interest to the Company. On December 9, 2016, the Company paid $18.0 million to purchase the 40% interest. See Note 16 - Redeemable Noncontrolling Interest for more information.
Summary of Cash Flows
Operating cash inflow of $154.6 million in 2016 reflects a net working capital source of $143.2 million driven principally by a decrease in inventories of $52.6 million as the Company has continued to tightly manage inventory levels as well as an increase in accounts payables, accrued and other liabilities of $72.1 million primarily due to the $54.3 million increase in the SEC and DOJ investigations accrual in 2016 and a decrease in receivables of $11.2 million through timely customer collections. In addition, the operating cash inflow of $154.6 million in 2016 reflects a source of $11.4 million related to net income (loss) adjusted for depreciation and amortization, foreign currency exchange (gains) losses, deferred income taxes, non-cash asset impairment charges, non-cash interest charges, (gains) losses on disposal of subsidiaries and (gains) losses on disposal of property.
Operating cash inflow of $198.9 million in 2015 reflects a net working capital source of $121.0 million driven principally by a decrease in receivables of $133.5 million due to a decrease in volume sold and lower copper and aluminum prices in the fourth quarter of 2015 compared to the fourth quarter of 2014 and due to a decrease in inventory of $34.0 million related to the continued efficient management of inventory levels in 2015 and lower copper and aluminum prices in the fourth quarter of 2015 compared to the fourth quarter of 2014. The net working capital source was partially offset by a decrease in accounts payable, accrued and other liabilities of $69.5 million in 2015 which is primarily driven by the decrease in working capital needs. In addition, the operating cash inflow of $198.9 million in 2015 reflects a source of $77.9 million related to net income (loss) adjusted for depreciation and amortization, foreign currency exchange (gains) losses, deferred income taxes, Venezuela deconsolidation charge, non-cash asset impairment charges, non-cash interest charges, (gains) losses on disposal of subsidiaries and (gains) losses on disposal of property.
Operating cash inflow of $133.2 million in 2014 reflects a net working capital source of $55.4 million driven principally by a decrease in inventories of $110.8 million due to the achievement of an aggressive inventory reduction targeted by management in the latter portion of the year and the lower copper costs at December 31, 2014 compared to December 31, 2013, partially offset by a decrease in accounts payable, accrued and other liabilities of $79.5 million in 2014 which is primarily driven by the decrease in working capital needs partially offset by the recognition of a restructuring accrual of $33.4 million and a FCPA accrual of $24
36
million in 2014. In addition, the operating cash inflow of $133.2 million in 2014 reflects a source of $77.8 million related to net income (loss) adjusted for depreciation and amortization, amortization on restricted stock awards, foreign currency exchange (gains) losses, deferred income taxes, non-cash asset impairment charges, non-cash interest charges, (gains) losses on disposal of subsidiaries and (gains) losses on disposal of property.
The cash outflow from investing activities was $0.6 million in 2016 principally reflecting $84.1 million of capital expenditures, partially offset by $81.8 million of proceeds from the disposal of subsidiaries. The Company currently anticipates capital spending to be approximately $90 million to $110 million in 2017.
Financing activities resulted in $165.3 million of cash outflows in 2016 as compared to cash outflows of $259.3 million in 2015. During the year ended December 31, 2016, the Company paid $18.0 million to the minority shareholders for their entire 40% interest in Procables. During the years ended December 31, 2016 and 2015, the Company paid dividends in total of approximately $35.6 million and $35.3 million to all common shareholders of record, respectively. Future declarations of dividends and the establishment of future record dates and payment dates are subject to the final determination of our Board of Directors. In determining dividends, the Board of Directors takes into consideration items such as general business conditions, financial performance, projected cash flows and anticipated financing needs. Future payments of dividends are also subject to the Company's Revolving Credit Facility, the indenture governing the 5.75% Senior Notes, and the requirements of the Delaware General Corporation law.
Financing activities resulted in $259.3 million of cash outflows in 2015 as compared to cash outflows of $123.1 million in 2014. The Company decreased net borrowings due to reductions in working capital and the use of cash proceeds generated from the sale of the Company's subsidiaries related to the divestiture plan. During the year ended December 31, 2015, the Company repaid its $125.0 million of Senior Floating Rate Notes at maturity by utilizing availability under its Revolving Credit Facility. During the years ended December 31, 2015 and 2014, the Company paid dividends in total of approximately $35.3 million and $35.4 million to all common shareholders of record, respectively. Future declarations of dividends and the establishment of future record dates and payment dates are subject to the final determination of our Board of Directors. In determining dividends, the Board of Directors takes into consideration items such as general business conditions, financial performance, projected cash flows and anticipated financing needs. Future payments of dividends are also subject to the Company's Revolving Credit Facility, the indenture governing the 5.75% Senior Notes, and the requirements of the Delaware General Corporation law. In addition, the Company purchased $30.7 million, or 1,000,000 of its common shares at an average price of $30.73 per share, during the year ended December 31, 2014.
The Company evaluates various factors such as future operating cash flow requirements, other cash flow expectations, investment and financing strategic plans and the overall cost of capital to determine the appropriate levels of short and long-term debt to maintain. Refer to "Debt and Other Contractual Obligations" below for details.
Debt and Other Contractual Obligations
The Company had outstanding debt obligations of $938.6 million as of December 31, 2016 and maintained approximately $448.4 million of excess availability under its various credit facilities around the world as well as approximately $6.5 million available under foreign accounts payable confirming arrangements with financial institutions. The Company utilizes short and long-term debt to address working capital needs, restructuring payments, debt repayments and interest payments, fines, disgorgement and pre-judgment interest related to the Company's SEC and DOJ investigations as well as discretionary investments in product development, acquisitions, payment of dividends, repurchase of common stock and taxes. Short-term liquidity and working capital needs are generally supported through operating cash flows. The Company maintains ratings on its public debt; therefore, the Company has and expects to continue to obtain market rates on any new borrowings.
Failure to comply with any of the covenants, financial tests and ratios required by the Company's existing or future debt obligations could result in a default under those agreements and under other agreements containing cross-default provisions, as defined in the Company's Revolving Credit Facility, Subordinated Convertible Notes, 5.75% Senior Notes and various other credit facilities maintained by the Company's subsidiaries. A default would permit lenders to cease making further extensions of credit, accelerate the maturity of the debt under these agreements and foreclose upon any collateral securing that debt. Indebtedness under the Company's Revolving Credit Facility is secured by: (a) for US borrowings under the Revolving Credit Facility, a first priority security interest in substantially all of the Company's domestic assets and, (b) for Canadian and European borrowings under the Revolving Credit Facility, a first priority security interest in substantially all of the Company's domestic and Canadian assets and certain assets of the Company's Spanish, French and German subsidiaries party to the Revolving Credit Facility. In addition, the lenders under the Company's Revolving Credit Facility have received a pledge of (i) 100% of the equity interests in substantially all of the Company's domestic subsidiaries, and (ii) 65% of the voting equity interests in and 100% of the non-voting equity interests in certain of the Company's foreign subsidiaries, including the Company's Canadian subsidiaries and the Company's Spanish, French and German subsidiaries party to the Revolving Credit Facility. The Company also has incurred secured debt in connection with some of its European operations. The lenders under these European secured credit facilities also have liens on assets of certain of our European subsidiaries. As a result of these pledges and liens, if the Company fails to meet its payment or
37
other obligations under any of its secured indebtedness, the lenders under the applicable credit agreement would be entitled to foreclose and liquidate substantially all of the Company's assets. Broadly, cross-default provisions would permit lenders to cause such indebtedness to become due prior to its stated maturity in the event a default is not cured for a period of time under the terms of one or more financing agreements, or a change in control or a fundamental change occurs.
As of December 31, 2016 and December 31, 2015, the Company was in compliance with all debt covenants.
The Company’s defined benefit plans at December 31, 2016 and 2015 were underfunded by $117.4 million and $121.0 million, respectively. The Company recorded after-tax gains of $6.6 million and $15.1 million in 2016 and 2015, respectively, to accumulated other comprehensive income. The Company estimates its 2017 pension expense for its defined benefit pension plans will be approximately $5.5 million and cash contributions are expected to be approximately $4.3 million. In 2016, pension expense was $16.2 million and cash contributions were $9.5 million.
The Company anticipates being able to meet its obligations as they come due based on historical experience and the expected availability of funds under its credit facilities. The Company’s contractual obligations and commercial commitments as of December 31, 2016 (in millions of dollars) are summarized below:
Payments Due by Period | ||||||||||||||||||||
Less than | 1 – 3 | 4 – 5 | More than | |||||||||||||||||
Contractual obligations (1,2): | Total | 1 Year | Years | Years | 5 Years | |||||||||||||||
Total debt | $ | 938.6 | $ | 67.5 | $ | 97.0 | $ | 1.8 | $ | 772.3 | ||||||||||
Convertible debt at maturity (3) | 255.6 | — | — | — | 255.6 | |||||||||||||||
Interest payments on 5.75% Senior Notes | 198.4 | 34.5 | 69.0 | 69.0 | 25.9 | |||||||||||||||
Interest payments on Subordinated Convertible Notes | 163.0 | 19.3 | 38.6 | 29.0 | 76.1 | |||||||||||||||
Operating leases (4) | 58.2 | 15.0 | 19.1 | 12.6 | 11.5 | |||||||||||||||
Purchase obligations (5) | 49.4 | 49.4 | — | — | — | |||||||||||||||
Defined benefit pension obligations (6) | 180.2 | 17.5 | 34.9 | 36.5 | 91.3 | |||||||||||||||
Postretirement benefits | 7.7 | 0.7 | 1.5 | 1.2 | 4.3 | |||||||||||||||
Resolution of SEC and DOJ investigations (7) | 82.3 | 82.3 | — | — | — | |||||||||||||||
Restructuring activities | 23.7 | 23.7 | — | — | — | |||||||||||||||
Unrecognized tax benefits, including interest and penalties (8) | — | — | — | — | — | |||||||||||||||
Total | $ | 1,957.1 | $ | 309.9 | $ | 260.1 | $ | 150.1 | $ | 1,237.0 | ||||||||||
(1) | This table does not include interest payments on General Cable’s revolving credit facilities because the future amounts are based on variable interest rates and the amount of the borrowings under the Revolving Credit Facility fluctuate depending upon the Company’s working capital requirements. |
(2) | This table does not include derivative instruments as the ultimate cash outlays cannot be reasonably predicted. Refer to Note 11 - Financial Instruments and Item 7A - Quantitative and Qualitative Disclosures about Market Risk for additional information. |
(3) | Represents the current debt discount on the Company’s Subordinated Convertible Notes as a result of adopting provisions of ASC 470 - Debt ("ASC 470"). Refer to Note 2 - Summary of Significant Accounting Policies for additional information. |
(4) | Operating lease commitments are described under “Off Balance Sheet Assets and Obligations.” |
(5) | Represents our firm purchase commitments. |
(6) | Defined benefit pension obligations reflect actuarially projected benefit payments which may differ from funding requirements based on local laws and regulations through 2024. |
(7) | The DOJ penalty of $20.5 million was paid in a single payment in January 2017. The Company paid $12.4 million to the SEC in January 2017, and will pay approximately $18.5 million to the SEC within 180 days of the date of the resolution and will make a final payment of approximately $30.9 million to the SEC within 360 days of the date of the resolution. Refer to Note 19 - Commitments and Contingencies for additional information. |
(8) | Unrecognized tax benefits of $13.7 million have not been reflected in the above table due to the inherent uncertainty as to the amount and timing of settlement, which is contingent upon the occurrence of possible future events, such as examinations and determinations by various tax authorities. |
Off Balance Sheet Assets and Obligations
As of December 31, 2016, the Company had $23.6 million in letters of credit, $268.1 million in various performance bonds and $72.5 million in other guarantees outstanding. Other guarantees include bank guarantees and advance payment bonds. These letters of credit, performance bonds and guarantees are periodically renewed and are generally related to risk associated with self-insurance claims, defined benefit plan obligations, contract performance, quality and other various bank and financing guarantees. Advance payment bonds are often required by customers when the Company obtains advance payments to secure the production of cable for long-term contracts. The advance payment bonds provide the customer protection on their deposit in the event that the Company does not perform under the contract. See "Liquidity and Capital Resources" for excess availability under the Company’s various credit borrowings.
38
Environmental Matters
The Company’s expenditures for environmental compliance and remediation amounted to approximately $4.2 million, $2.7 million and $5.8 million in 2016, 2015 and 2014, respectively. In addition, certain General Cable subsidiaries have been named as potentially responsible parties in proceedings that involve environmental remediation. The Company has accrued $5.6 million and $3.6 million at December 31, 2016 and 2015, respectively, for all environmental liabilities. Environmental matters are described in Item 1 - Business and Note 19 - Commitments and Contingencies. While it is difficult to estimate future environmental liabilities, the Company does not currently anticipate any material adverse effect on results of operations, cash flows or financial position as a result of compliance with federal, state, local or foreign environmental laws or regulations or remediation costs.
Legal Matters
Refer to Note 19 - Commitments and Contingencies for review of the Company's litigation contingencies.
Critical Accounting Policies and Estimates
The Company’s consolidated financial statements have been prepared in accordance with accounting principles generally accepted in the United States of America. A summary of significant accounting policies is provided in Note 2 - Summary of Significant Accounting Policies. The application of these policies requires management to make estimates and judgments that affect the amounts reflected in the consolidated financial statements. Management bases its estimates and judgments on historical experience, information that is available to management about current events and actions the Company may take in the future and various other factors that are believed to be reasonable under the circumstances. Actual results may differ from these estimates under different assumptions or conditions. In addition, estimates and judgments include allowances for accounts receivable and deferred income taxes; legal, environmental, and asbestos liabilities; inventory costing and valuation; share-based compensation; uncertain tax positions; assets and obligations related to pension and other postretirement benefits; goodwill, intangible and long-lived asset valuations; financial instruments; and revenue recognized under the percentage-of-completion method. There can be no assurance that actual results will not differ from these estimates.
Principles of Consolidation
The Company’s consolidated financial statements include the accounts of wholly-owned subsidiaries and majority-owned controlled subsidiaries. The Company records its investment in each unconsolidated affiliated Company (generally 20-50 percent ownership in which it has the ability to exercise significant influence) at its respective equity in net assets. Other investments (generally less than 20 percent ownership) are recorded at cost. All intercompany transactions and balances among the consolidated companies have been eliminated.
The results of Asia Pacific are presented in continuing operations for all periods disclosed in this report. Previously, the results of these businesses were presented as discontinued operations; however, in the third quarter of 2016 management determined that the held for sale criteria was no longer met for the remaining Asia Pacific operations, primarily driven by management’s belief that the probability of a sale within one year was uncertain. The Company’s Asia Pacific businesses that have been sold to date, in the aggregate, are not considered a strategic shift; therefore, the Company no longer presents the Asia Pacific operations as discontinued operations in its financial statements for all periods presented. See Note 3 - Divestitures for additional details.
Prior to October 2, 2015, the Company included the results of the Venezuelan operations in the consolidated financial statements using the consolidation method of accounting. The Company’s Venezuelan earnings and cash flows were reflected in the historical consolidated financial statements using a combination of official exchange rates, including the SICAD 1, SICAD 2 and SIMADI rates. Evolving conditions in Venezuela, prior to the Company's sale of the business, including currency exchange regulations which reduced access to dollars through currency exchange markets and local market dynamics, resulted in an other-than-temporary lack of exchangeability between the Venezuelan bolivar and U.S. dollar, and restricted the Company's Venezuelan operations’ ability to pay dividends and satisfy certain other obligations denominated in U.S. dollars. Additionally, the existence of other governmental limitations restricted the Company's ability to control its Venezuelan operations. For accounting purposes, this lack of exchangeability and governmental restrictions on operations resulted in a lack of control. Therefore, in accordance with ASC 810 - Consolidation ("ASC 810"), the Company deconsolidated its Venezuelan subsidiary as of October 2, 2015 and began accounting for the investment in the Venezuelan subsidiary using the cost method of accounting. Since October 2, 2015, and through the date of the sale, the Company's financial results did not include the operating results of its Venezuelan subsidiary and the carrying value of the cost method investment was zero. On July 6, 2016, the Company completed the sale of its Venezuelan subsidiary. See Note 3 - Divestitures for additional details.
39
Revenue Recognition
The majority of the Company’s revenue is recognized when goods are shipped to the customer, title and risk of loss are transferred, pricing is fixed or determinable and collectability is reasonably assured. Most revenue transactions represent sales of inventory. A provision for payment discounts, product returns, warranty and customer rebates is estimated based upon historical experience and other relevant factors and is recorded within the same period that the revenue is recognized. The Company has a portion of long-term contracts for specialized products that can include installation and/or other services and is recognized based on the percentage of completion method generally based on the cost-to-cost method if there are reasonably reliable estimates of total revenue, total cost, and the extent of progress toward completion; and there is an enforceable agreement between parties who can fulfill their contractual obligations. Management reviews contract price and cost estimates periodically as the work progresses and reflects adjustments proportionate to the percentage-of-completion to income in the period when those estimates are revised. For these contracts, if a current estimate of total contract cost indicates a loss on a contract, the projected loss is recognized in full when determined.
Accounts Receivable
The accounts receivable balance is recorded at the stated amount, less allowances for doubtful accounts, price discounts, and returns. At the time of the sale and at each quarter, the Company evaluates the accounts receivable balance to determine a best estimate for doubtful accounts, price discounts, and returns. The Company reviews general historical trends in the account, customer overdue balances, high risk accounts that have been specifically identified based on historical and current customer patterns, contractual obligations, and current economic conditions to determine an estimate for these allowances.
Inventory Costing and Valuation
Approximately 85% of the Company's inventory was valued using the average cost method and all remaining inventories are valued using the first-in, first-out (FIFO) method. To determine if a lower of cost or market adjustment is required, the Company evaluates evidence to indicate if the cost will be recovered with an approximately normal profit upon sale in the ordinary course of business based on product groupings within the reportable segments. Metal costs, particularly copper and aluminum costs, are significant to our overall costs in inventory. Factors such as technological innovations, future demand trends, pricing environment, inventory levels and turns and specific identification of inventory items, such as regulatory-related changes or changes in engineering or material, are considered in the obsolete and slow moving inventory analysis.
Pension Accounting
The Company provides retirement benefits through contributory and non-contributory qualified and non-qualified defined benefit pension plans covering eligible domestic and international employees as well as through defined contribution plans and other postretirement benefits. Benefits under the Company’s qualified U.S. defined benefit pension plan generally are based on years of service multiplied by a specific fixed dollar amount, and benefits under the Company’s qualified non-U.S. defined benefit pension plans generally are based on years of service and a variety of other factors that can include a specific fixed dollar amount or a percentage of either current salary or average salary over a specific period of time. The amounts funded for any plan year for the qualified U.S. defined benefit pension plan are neither less than the minimum required under federal law nor more than the maximum amount deductible for federal income tax purposes. The Company’s non-qualified unfunded U.S. defined benefit pension plans include a plan that provides defined benefits to select senior management employees beyond those benefits provided by other programs. The Company’s non-qualified unfunded non-U.S. defined benefit pension plans include plans that provide retirement indemnities to employees. Pension obligations for the non-qualified unfunded defined benefit pension plans are provided for and are based on local practices and regulations of the respective countries. The Company makes cash contributions for the costs of the non-qualified unfunded defined benefit pension plans as the benefits are paid.
Benefit costs for the defined benefit pension plans sponsored by the Company are determined based principally upon certain actuarial assumptions, including the discount rate and the expected long-term rate of return on plan assets. The weighted-average discount rate used to determine the net pension expense for 2016 was 4.30% for the U.S. defined benefit pension plans. The weighted-average discount rate as of December 31, 2016 that was used to determine benefit obligations was 4.01% for the U.S. defined benefit pension plans, and was determined based on hypothetical yield curves developed using yields of corporate bonds across the full maturity spectrum of the projected pension benefit obligations and based on information received from actuaries. The included bonds are AA-rated (or equivalent quality) by a a recognized rating agency. The weighted-average discount rate used to determine the net pension cost for 2016 was 3.18% for the non-U.S. defined benefit pension plans. Non-U.S. defined benefit pension plans followed a similar evaluation process based on financial markets in those countries where the Company provides a defined benefit pension plan, and the weighted-average discount rate used to determine benefit obligations for the Company’s non-U.S. defined benefit pension plans was 2.55% as of December 31, 2016. The Company’s expense under both U.S. and non-U.S. defined benefit pension plans is determined using the discount rate as of the beginning of the fiscal year, and as a result, 2017 expense for the defined benefit pension plans will be based on the weighted-average discount rate of 4.01% for U.S. plans and 2.55% for non-U.S. plans.
40
The weighted-average long-term expected rate of return on assets is based on input from actuaries, including their review of historical 10-year, 20-year, and 25-year rates of inflation and real rates of return on various broad equity and bond indices in conjunction with the diversification of the asset portfolio. The Company’s overall investment strategy is to diversify its investments for the qualified U.S. defined benefit pension plan based on an asset allocation assumption of 65% allocated to equity investments, with an expected real rate of return of 6%, and 35% to fixed-income investments, with an expected real rate of return of 2%, and an assumed long-term rate of inflation of 3%. Equity investments primarily include investments in large-cap and mid-cap companies primarily located in the United States.
The determination of pension expense for the qualified defined benefit pension plans is based on the fair market value of assets as of the measurement date. Investment gains and losses are recognized in the measurement of assets immediately. Such gains and losses will be amortized and recognized as part of the annual benefit cost to the extent that unrecognized net gains and losses from all sources exceed 10% of the greater of the projected benefit obligation or the market value of assets.
The Company evaluates its actuarial assumptions at least annually, and adjusts them as necessary. The Company uses a measurement date of December 31 for all of its defined benefit pension plans. In 2016, pension expense for the Company’s defined benefit pension plans was $16.2 million. Based on a weighted-average expected rate of return on plan assets of 6.99%, a weighted-average discount rate of 3.83% and various other assumptions, the Company estimates its 2017 pension expense for its defined benefit pension plans will decrease to approximately $5.5 million. A 1% decrease in the assumed discount rate would increase pension expense by approximately $1.7 million. Future pension expense will depend on future investment performance, changes in future discount rates and various other factors related to the populations participating in the plans. In the event that actual results differ from the actuarial assumptions, the funded status of the defined benefit pension plans may change and any such change could result in a charge or credit to equity and an increase or decrease in future pension expense and cash contributions.
The Company’s investment policies and strategies, categories of plan assets, fair value measurements of plan assets, and significant concentrations of risk are described in further detail in Note 13 - Employee Benefit Plans.
Income Taxes
The Company is subject to income tax in numerous United States federal, state, and foreign jurisdictions. Significant judgments and estimates are inherent in determining the Company's consolidated income tax expense, current tax payable, deferred tax assets and liabilities, and liabilities for uncertain tax positions. Future events such as changes in business conditions, tax legislation, tax audit resolutions, or foreign earnings repatriation plans could materially impact these estimates and the Company's tax position.
In November 2015, the Financial Accounting Standards Board (“FASB”) issued ASU 2015-17, "Income Taxes (Topic 740): Balance Sheet Classification of Deferred Taxes." This update provides guidance on simplifying the presentation of deferred income taxes. Prior to the adoption of ASU 2015-17, deferred income tax liabilities and assets are separated into current and noncurrent amounts while ASU 2015-17 amends the standard to require that deferred tax liabilities and assets be classified as noncurrent. The amendments may be applied either prospectively to all deferred tax liabilities and assets or retrospectively to all periods presented with earlier application permitted as of the beginning of an interim or annual reporting period. The Company elected early adoption of the standard on a prospective basis and implemented ASU 2015-17 for the year ended December 31, 2015. Adoption of this ASU resulted in reclassifications of current deferred tax assets and current deferred tax liabilities to non-current in the Company's Consolidated Balance Sheet as of December 31, 2015. No prior periods were retrospectively adjusted. The adoption of this ASU did not have a material effect on the Company’s Consolidated Financial Statements.
Deferred tax assets and liabilities are determined based on the differences between the financial statement basis and tax basis of assets and liabilities using enacted tax rates in effect for the year in which the differences are expected to reverse. The effect of a change in tax rates on deferred tax assets and liabilities is recognized in income in the period that includes the enactment date. At December 31, 2016, the Company had recorded a net deferred tax liability of $106.3 million ($199.3 million deferred tax asset less $305.6 million deferred tax liability). The valuation of deferred tax assets is dependent on, among other things, the ability of the Company to generate a sufficient level of future taxable income. In estimating future taxable income, the Company has considered both positive and negative evidence, such as historical and forecasted results of operations, including prior losses, and has considered the implementation of prudent and feasible tax planning strategies. As of December 31, 2016, the Company recorded a valuation allowance of $177.1 million to reduce deferred tax assets to the amount judged more likely than not to be realized. The Company has and will continue to review on a quarterly basis its assumptions and tax planning strategies, and, if the amount of the estimated realizable deferred tax assets is less than the amount currently on the balance sheet, the Company will reduce its deferred tax asset, recognizing a non-cash charge against reported earnings. Likewise, if the Company determines that a valuation allowance against a deferred tax asset is no longer appropriate, the adjustment to the valuation allowance would reduce income tax expense.
The Company operates in multiple jurisdictions with complex tax policies and regulations. In certain jurisdictions, the Company has taken tax positions that it believes are supportable, but which could be subject to challenge by the tax authorities. These tax positions are evaluated and liabilities for uncertain tax positions are established in accordance with the ASC 740- Income Taxes
41
("ASC 740") tax accounting guidance. The status of uncertain tax positions is reviewed in light of changing facts and circumstances, such as tax audits, rulings, and case law, and the related liabilities are adjusted accordingly.
The Company recognizes interest and penalties related to unrecognized tax benefits within the income tax expense line in the accompanying Consolidated Statements of Operations and Comprehensive Income (Loss). Accrued interest and penalties are included within the related tax liability line item in the Consolidated Balance Sheets.
Long-Lived Assets, Goodwill and Impairment
The valuation and classification of long-lived assets and the assignment of useful depreciable and amortizable lives and salvage values involve significant judgments and the use of estimates. The testing of these long-lived assets for impairment also requires a significant amount of judgment and assumptions, particularly as it relates to identification of asset groups and the determination of fair market value. The Company periodically evaluates the recoverability of the carrying amount of long-lived assets whenever events or changes in circumstances indicate that the carrying amount of an asset may not be fully recoverable. The Company evaluates events or changes in circumstances based on historical operating results, forecasts, general and industry trends and anticipated cash flows. Impairment is assessed when the undiscounted expected future cash flows derived from an asset group are less than its carrying amount. Impairment losses are measured as the amount by which the carrying value of an asset group exceeds its fair value and are recognized in earnings. The Company also continually evaluates the estimated useful lives of all long-lived assets and, when warranted, revises such estimates based on current events. See Note 3 - Divestitures, Note 4 - Restructuring and Note 7 - Property, Plant and Equipment.
Goodwill and intangible assets with indefinite useful lives are not amortized, but are reviewed at least annually for impairment. The Company typically completes its annual impairment test within the fourth quarter of each year. In addition, the Company evaluates the carrying value between the valuations if events occur or circumstances change that would more likely than not reduce the fair value of the reporting unit below its carrying amount. Events or circumstances may include, but are not limited to, a significant change in legal factors or in the business climate, adverse action or assessment by a regulator, unanticipated competition, loss of key personnel, possible sale or disposal of a reporting unit or a significant portion of a reporting unit, significant changes in financial projections or significant changes in the market capitalization. See Note 8 - Goodwill and Other Intangible Assets, net.
Share-Based Compensation
The Company has various plans which provide for granting options and common stock to certain employees and independent directors of the Company and its subsidiaries. All share-based payments to employees, including grants of employee stock options, are recognized in the financial statements based on their fair values. The fair values of certain awards are estimated on the grant date using the Black-Scholes option pricing formula, which incorporates certain assumptions regarding the expected term of an award and expected stock price volatility. The Company will develop the expected term assumptions based on the vesting period and contractual term of an award, historical exercise and post-vesting cancellation experience, stock price history, plan provisions that require exercise or cancellation of awards after employees terminate, and the extent to which currently available information indicates that the future is reasonably expected to differ from past experience. The Company develops the expected volatility assumptions based on the monthly historical price data from the Company’s common stock and other economic data trended into future years. After calculating the aggregate fair value of an award, the Company uses an estimated forfeiture rate to discount the amount of share-based compensation costs to be recognized in the operating results over the service period of the award. The Company develops the forfeiture assumption based on its historical pre-vesting cancellation experience. Key assumptions are described in further detail in Note 15 - Share-Based Compensation.
Loss Contingencies
The Company determines whether to accrue and/or disclose for loss contingencies based on an assessment of whether the risk of loss is remote, reasonably possible or probable. The Company's assessment is developed in consultation with its outside counsel and other advisers and is based on an analysis of possible outcomes. Loss contingency assumptions involve judgments that are inherently subjective and can involve matters that are in litigation, which, by its nature is unpredictable. The Company believes that its assessment of the probability of loss contingencies is reasonable, but because of the subjectivity involved and the unpredictable nature of the subject matter at issue, the Company's assessment may prove ultimately to be incorrect, which could materially impact the consolidated financial statements. See Note 19 - Commitments and Contingencies.
New Accounting Standards
A discussion of recently issued accounting pronouncements is described in Note 2 - Summary of Significant Accounting Policies, in Item 8 - Financial Statements and Supplementary Data of this report, and we incorporate such discussion in this MD&A by reference and make it a part hereof.
42
ITEM 7A. | QUANTITATIVE AND QUALITATIVE DISCLOSURES ABOUT MARKET RISK |
The Company is exposed to various market risks, including changes in interest rates, foreign currency exchange rates and raw material (commodity) prices. To manage risk associated with the volatility of these natural business exposures, the Company enters into interest rate, commodity and foreign currency derivative agreements as well as copper and aluminum forward pricing agreements. The Company does not purchase or sell derivative instruments for trading purposes. The Company does not engage in trading activities involving commodity contracts for which a lack of marketplace quotations would necessitate the use of fair value estimation techniques.
Interest Rate Risk
The Company is subject to interest rate risk on its fixed and floating rate debt. As of December 31, 2016, $161.3 million of the Company’s debt and $130.1 million of the Company's accounts payable confirming arrangements were subject to changes in short-term interest rates.
As it relates to the Company’s variable rate debt and accounts payable confirming arrangements, assuming no changes in the Company’s financial structure, if market interest rates average 1% higher over the next twelve months than the market interest rates as of December 31, 2016, interest expense for the next twelve months would increase by approximately $2.9 million. This amount was determined by calculating the effect of the hypothetical interest rate on our variable rate debt. This calculated, hypothetical increase in interest expense for the following twelve months may be different from the actual increase in interest expense from a 1% increase in interest rates due to varying interest rate reset dates on the Company’s floating rate debt.
Raw Material Price Risk
The costs of copper and aluminum, the most significant raw materials we use, have been subject to considerable volatility caused by supply conditions, weather, political and economic variables as well as other unknown and unpredictable variables. This copper and aluminum price volatility is representative of all reportable segments. In addition, the Company has historically experienced volatility on raw materials other than copper and aluminum used in cable manufacturing, such as insulating compounds, wood reels, freight costs and energy costs. Generally, the Company attempts to adjust selling prices in most of its markets in order to offset the impact of this raw material price and other cost volatility on reported earnings. The Company’s ability to execute and ultimately realize price adjustments is influenced by competitive conditions in its markets, including manufacturing capacity utilization.
The Company enters into commodity instruments to hedge the purchase of copper, aluminum as well as other raw materials in future periods. Principal transactions hedged during the year were firm sales and purchase commitments. In 2016, the Company accounted for these commodity instruments as economic hedges. Changes in the fair value of economic hedges are recognized in current period earnings in other income (expense).
In 2016, the Company estimates that a 10% increase in copper and aluminum costs over current market prices would have increased the Company's Cost of sales by approximately $155 million. The impact of this would directly impact gross profit if the Company was unable to increase prices with the rise in the price of copper and aluminum.
Foreign Currency Exchange Rate Risk
The Company operates in multiple countries throughout the globe; therefore, the Company is exposed to fluctuations in foreign currency exchange rates. The Company is exposed to transactional foreign currency risk, the risk when transactions not denominated in the functional currency in which the Company operates are revalued. The Company enters into foreign currency exchange contracts principally to hedge the currency fluctuations in certain transactions denominated in foreign currencies, thereby limiting the Company's risk that would otherwise result from changes in exchange rates. Principal transactions hedged during the year were firm sales and purchase commitments. The fair value of foreign currency contracts represents the amount required to enter into offsetting contracts with similar remaining maturities based on quoted market prices.
In 2016, the Company accounted for these foreign currency exchange contracts as economic hedges. Changes in the fair value of economic hedges are recognized in current period earnings in other income (expense).
In addition, to mitigate these risks, the Company believes it is appropriate to finance those operations with borrowings denominated in the local currency to the extent practicable where debt financing is desirable or necessary. Considerations which influence the amount of such borrowings include long- and short-term business plans, tax implications, and the availability of borrowings with acceptable interest rates and terms. In those countries where the local currency is the designated functional currency, this strategy mitigates the risk of reported losses or gains in the event the foreign currency strengthens or weakens against the U.S. dollar.
The Company also has exposure to foreign currency exchange risk when the results of its international operating units are translated from the local currency into the U.S. dollar. At December 31, 2016 and 2015, the accumulated other comprehensive income (loss) account included in the total equity section of the Consolidated Balance Sheet included a cumulative translation loss of
43
$228.2 million and $275.6 million, respectively. A 10% increase in the value of the U.S. dollar relative to foreign currencies would increase the cumulative translation loss resulting in a reduction to recorded equity of approximately $51.5 million in 2016. This sensitivity analysis is inherently limited as it assumes that rates of multiple foreign currencies will always move in the same direction relative to the value of the U.S. dollar.
Uncertainty in the global market conditions has resulted in, and may continue to cause, significant volatility in foreign currency exchange rates which could increase these risks, particularly in the Company’s emerging or developing markets within its Latin America and Africa/Asia Pacific segments.
ITEM 8. | FINANCIAL STATEMENTS AND SUPPLEMENTARY DATA |
Page | |
ITEM 9. | CHANGES IN AND DISAGREEMENTS WITH ACCOUNTANTS ON ACCOUNTING AND FINANCIAL DISCLOSURE |
None.
44
ITEM 9A. | CONTROLS AND PROCEDURES |
The Company maintains disclosure controls and procedures that are designed to ensure that information required to be disclosed in the Company's reports under the Securities Exchange Act of 1934, as amended (the “Exchange Act”), is recorded, processed, summarized and reported within the time periods specified in the SEC's rules and forms, and that such information is accumulated and communicated to management, including the Company's Chief Executive Officer (“CEO”) and Chief Financial Officer (“CFO”) as appropriate to allow timely decisions regarding required disclosure. A control system, no matter how well conceived and operated, can provide only reasonable, not absolute, assurance that the objectives of the control system are met.
Management, under the supervision and with the participation of our CEO and CFO, evaluated the effectiveness of the Company's disclosure controls and procedures (as defined in Rule 13a-15(e) and 15d-15(e) under the Exchange Act) as of the end of the period covered by this report (the “Evaluation Date”). Based upon that evaluation, the CEO and CFO have concluded that the design and operation of the Company's disclosure controls and procedures at a reasonable assurance level were effective as of December 31, 2016.
Management's Annual Report on Internal Control over Financial Reporting
Management, under the supervision of the CEO and CFO, is responsible for establishing and maintaining adequate internal control over financial reporting. Internal control over financial reporting, as defined in Rules 13a-15(f) and 15d-15(f) promulgated under the Exchange Act, is a process designed by, or under the supervision of, the CEO and CFO and is effected by the board of directors, management and other personnel to provide reasonable assurance regarding the reliability of financial reporting and the preparation of financial statements for external reporting purposes in accordance with generally accepted accounting principles (“GAAP”). Internal control over financial reporting includes those policies and procedures that:
• | Pertain to the maintenance of records that, in reasonable detail, accurately and fairly reflect the transactions and dispositions of the assets of the Company; |
• | Provide reasonable assurance that transactions are recorded as necessary to permit preparation of financial statements in accordance with GAAP, and that the receipts and expenditures of the Company are being made only in accordance with appropriate authorization of management and the board of directors; and |
• | Provide reasonable assurance regarding prevention or timely detection of unauthorized acquisition, use or disposition of the Company's assets that could have a material effect on the financial statements. |
Because of its inherent limitations, internal control over financial reporting may not prevent or detect misstatements. Also, projections of any evaluation of effectiveness to future periods are subject to the risk that controls may become inadequate because of changes in conditions, or that the degree of compliance with the policies or procedures may deteriorate.
Management evaluated the effectiveness of the Company's internal control over financial reporting as of December 31, 2016 using the framework established in "Internal Control-Integrated Framework (2013)" issued by the Committee of Sponsoring Organizations of the Treadway Commission (“COSO”). Based on this assessment, management concluded that, as of December 31, 2016, the Company’s internal control over financial reporting was effective.
The effectiveness of the Company’s internal control over financial reporting as of December 31, 2016 has been audited by Deloitte & Touche LLP, an independent registered public accounting firm, as stated in their report which appears herein.
Changes in Internal Control Over Financial Reporting
There have been no changes in the Company’s internal control over financial reporting, as such item is defined in Exchange Act Rules 13a–15(f) and 15d–15(f), during the fiscal quarter ended December 31, 2016, that have materially affected, or are reasonably likely to materially affect, the Company’s internal control over financial reporting.
45
REPORT OF INDEPENDENT REGISTERED PUBLIC ACCOUNTING FIRM
To the Board of Directors and Shareholders of
General Cable Corporation
Highland Heights, Kentucky
We have audited the internal control over financial reporting of General Cable Corporation and subsidiaries (the "Company") as of December 31, 2016, based on criteria established in Internal Control - Integrated Framework (2013) issued by the Committee of Sponsoring Organizations of the Treadway Commission. The Company's management is responsible for maintaining effective internal control over financial reporting and for its assessment of the effectiveness of internal control over financial reporting, included in the accompanying Management's Annual Report on Internal Control over Financial Reporting. Our responsibility is to express an opinion on the Company's internal control over financial reporting based on our audit.
We conducted our audit in accordance with the standards of the Public Company Accounting Oversight Board (United States). Those standards require that we plan and perform the audit to obtain reasonable assurance about whether effective internal control over financial reporting was maintained in all material respects. Our audit included obtaining an understanding of internal control over financial reporting, assessing the risk that a material weakness exists, testing and evaluating the design and operating effectiveness of internal control based on the assessed risk, and performing such other procedures as we considered necessary in the circumstances. We believe that our audit provides a reasonable basis for our opinion.
A company's internal control over financial reporting is a process designed by, or under the supervision of, the company's principal executive and principal financial officers, or persons performing similar functions, and effected by the company's board of directors, management, and other personnel to provide reasonable assurance regarding the reliability of financial reporting and the preparation of financial statements for external purposes in accordance with generally accepted accounting principles. A company's internal control over financial reporting includes those policies and procedures that (1) pertain to the maintenance of records that, in reasonable detail, accurately and fairly reflect the transactions and dispositions of the assets of the company; (2) provide reasonable assurance that transactions are recorded as necessary to permit preparation of financial statements in accordance with generally accepted accounting principles, and that receipts and expenditures of the company are being made only in accordance with authorizations of management and directors of the company; and (3) provide reasonable assurance regarding prevention or timely detection of unauthorized acquisition, use, or disposition of the company's assets that could have a material effect on the financial statements.
Because of the inherent limitations of internal control over financial reporting, including the possibility of collusion or improper management override of controls, material misstatements due to error or fraud may not be prevented or detected on a timely basis. Also, projections of any evaluation of the effectiveness of the internal control over financial reporting to future periods are subject to the risk that the controls may become inadequate because of changes in conditions, or that the degree of compliance with the policies or procedures may deteriorate.
In our opinion, the Company maintained, in all material respects, effective internal control over financial reporting as of December 31, 2016, based on the criteria established in Internal Control - Integrated Framework (2013) issued by the Committee of Sponsoring Organizations of the Treadway Commission.
We have also audited, in accordance with the standards of the Public Company Accounting Oversight Board (United States), the consolidated financial statements and financial statement schedule as of and for the year ended December 31, 2016 of the Company and our report dated February 24, 2017 expressed an unqualified opinion on those financial statements and financial statement schedule.
/s/ Deloitte & Touche LLP
Cincinnati, Ohio
February 24, 2017
46
ITEM 9B. | OTHER INFORMATION |
None.
PART III.
ITEM 10. | DIRECTORS, EXECUTIVE OFFICERS AND CORPORATE GOVERNANCE |
See the information on the Company’s Executive Officers in Item 1 - Business – Executive Officers of the Registrant. Except as set forth in Item 1 - Business, the additional information required by this item, including information on the Directors of the Company, will be included in the definitive Proxy Statement which General Cable intends to file with the SEC within 120 days after December 31, 2016, and is incorporated herein by reference.
The Company has adopted a Code of Ethics and Business Conduct that applies to its directors, officers (including the Company’s principal executive officer, principal financial officer and principal accounting officer) and employees. A copy of the Code of Ethics and Business Conduct is available on the Company’s website, www.generalcable.com, and may be found under the “Investor Information” section by clicking on “Corporate Governance”. This document is also available in print to any shareholders who request it. The Company intends to satisfy the disclosure requirement under Item 5.05 of Form 8-K regarding an amendment to, or waiver from, a provision of our Code of Ethics and Business Conduct by posting such information on our website at the location specified above.
ITEM 11. | EXECUTIVE COMPENSATION |
The information required by this item will be included in the definitive Proxy Statement which General Cable intends to file with the SEC within 120 days after December 31, 2016, and is incorporated herein by reference.
ITEM 12. | SECURITY OWNERSHIP OF CERTAIN BENEFICIAL OWNERS AND MANAGEMENT AND RELATED STOCKHOLDER MATTERS |
The information required by this item will be included in the definitive Proxy Statement which General Cable intends to file with the SEC within 120 days after December 31, 2016, and is incorporated herein by reference.
ITEM 13. | CERTAIN RELATIONSHIPS AND RELATED TRANSACTIONS, AND DIRECTOR INDEPENDENCE |
The information required by this item will be included in the definitive Proxy Statement which General Cable intends to file with the SEC within 120 days after December 31, 2016, and is incorporated herein by reference.
ITEM 14. | PRINCIPAL ACCOUNTING FEES AND SERVICES |
The information required by this item will be included in the definitive Proxy Statement which General Cable intends to file with the SEC within 120 days after December 31, 2016, and is incorporated herein by reference.
47
PART IV.
ITEM 15. | EXHIBITS AND FINANCIAL STATEMENT SCHEDULE |
(a) Documents filed, or furnished as applicable, as part of the 2016 Annual Report on Form 10-K: |
1. Consolidated Financial Statements are included in Part II, Item 8 - Financial Statements and Supplementary Data. |
2. Financial Statement Schedule filed herewith for 2016, 2015 and 2014: |
II. Valuation and Qualifying Accounts Page 113 |
All other schedules for which provisions are made in the applicable SEC regulation have been omitted as they are not applicable, not required, or the required information is included in the Consolidated Financial Statements or Notes thereto. |
3. The exhibits listed on the accompanying Exhibit Index are filed or furnished, as applicable, herewith or incorporated herein by reference. |
Documents indicated by a double asterisk (**) are filed or furnished, as applicable, herewith; documents indicated by an asterisk (*) identify each management contract or compensatory plan. Documents not indicated by a double asterisk are incorporated by reference to the document indicated. The warranties, representations and covenants contained in any of the agreements included herein or which appear as exhibits hereto (or as exhibits, schedules, annexes or other attachments thereto) should not be relied upon by buyers, sellers or holders of the Company’s securities and are not intended as warranties, representations or covenants to any individual or entity except as specifically set forth in such agreement. |
48
Signatures
Pursuant to the requirements of Section 13 or 15(d) of the Securities Exchange Act of 1934, General Cable Corporation has duly caused this report to be signed on its behalf by the undersigned, thereunto duly authorized.
General Cable Corporation | |||||
Signed: | February 24, 2017 | By: | /s/ MICHAEL T. MCDONNELL | ||
Michael T. McDonnell | |||||
President and Chief Executive Officer | |||||
Pursuant to the requirements of the Securities Exchange Act of 1934, this report has been signed below by the following persons on behalf of General Cable Corporation and in the capacities and on the date indicated.
/s/ MICHAEL T. MCDONNELL | President, Chief Executive Officer and Director | February 24, 2017 | ||
Michael T. McDonnell | (Principal Executive Officer) | |||
/s/ MATTI M. MASANOVICH | Senior Vice President and Chief Financial Officer | February 24, 2017 | ||
Matti M. Masanovich | (Principal Financial Officer) | |||
/s/ LEONARD R. TEXTER | Senior Vice President and Global Controller | February 24, 2017 | ||
Leonard R. Texter | (Principal Accounting Officer) | |||
/s/ JOHN E. WELSH, III * | Non-executive Chairman and Director | February 24, 2017 | ||
John E. Welsh, III | ||||
/s/ SALLIE B. BAILEY* | Director | February 24, 2017 | ||
Sallie B. Bailey | ||||
/s/ NED HALL * | Director | February 24, 2017 | ||
Ned Hall | ||||
/s/ GREGORY E. LAWTON * | Director | February 24, 2017 | ||
Gregory E. Lawton | ||||
/s/ CRAIG P. OMTVEDT * | Director | February 24, 2017 | ||
Craig P. Omtvedt | ||||
/s/ PATRICK M. PREVOST * | Director | February 24, 2017 | ||
Patrick M. Prevost | ||||
* By | /s/ EMERSON C. MOSER | |
Emerson C. Moser | ||
Attorney - in - fact | ||
49
Exhibit Index
Exhibit Number | Description | |
2.1 | Purchase Agreement, dated as of June 25, 2015, by and between General Cable Corporation and MM Logistics Co., Ltd. (incorporated by reference to Exhibit 2.1 of the Company's Quarterly Report on Form 10-Q for the quarter ended July 3, 2015). | |
2.2 | Stock and Asset Purchase Agreement, dated as of May 23, 2016, among General Cable Industries, Inc., Prestolite de México, S.A. de C.V., GK Technologies, Inc., General Cable de México, S.A. de C.V., General Cable Technologies Corporation, Servicios Latinoamericanos GC S.A. de C.V., Standard Motor Products, Inc., Standard Motor Products de Mexico S. de R.L. de C.V. and Motortronics, Inc., (incorporated by reference to Exhibit 2.1 of the Company's Quarterly Report on Form 10-Q for the quarter ended July 1, 2016). | |
3.1 | Amended and Restated Certificate of Incorporation of the Company (incorporated by reference to Exhibit 3.1 of the Company’s Current Report on Form 8-K as filed with the Securities and Exchange Commission on May 14, 2010). | |
3.2 | Amended and Restated By-Laws of the Company (incorporated by reference to Exhibit 3.2 of the Company's Quarterly Report on Form 10-Q for the quarter ended October 2, 2015). | |
4.1 | Specimen Common Stock Certificate (incorporated by reference to Exhibit 4.1 of the Company’s Registration Statement on Form S-4 (File No. 333-162688) filed with the Securities and Exchange Commission on October 27, 2009). | |
4.2 | Subordinated Convertible Note Indenture, dated as of December 18, 2009, for the Subordinated Convertible Notes due 2029, by and between General Cable Corporation and U.S. Bank National Association and Form of Note (incorporated by reference to Exhibit 4.1 of the Company’s Current Report on Form 8-K as filed with the Securities and Exchange Commission on December 21, 2009). | |
4.3 | Indenture for the 5.75% Senior Notes due 2022 dated as of September 25, 2012, including Form of 5.75% Senior Note due 2022 (Rule 144A), Form of 5.75% Senior Note due 2022 (Regulation S), and Form of Guarantee of obligations under 5.75% Senior Notes due 2022 (incorporated by reference to Exhibit 4.1 of the Company's Current Report on Form 8-K as filed with the Securities and Exchange Commission on September 25, 2012). | |
4.3.1 | First Supplemental Indenture for the 5.75% Senior Notes due 2022 dated as of September 6, 2013 (incorporated by reference to Exhibit 4.3 of the Company's Current Report on Form 8-K as filed with the Securities and Exchange Commission on October 15, 2013). | |
4.3.2 | Second Supplemental Indenture for the 5.75% Senior Notes due 2022 dated as of November 8, 2013 (incorporated by reference to Exhibit 4.2 of the Company's Current Report on Form 8-K as filed with the Securities and Exchange Commission on November 13, 2013). | |
4.3.3 | Third Supplemental Indenture for the 5.75% Senior Notes due 2022 dated as of March 30, 2015 (incorporated by reference to Exhibit 4.1 of the Company’s Current Report on Form 8-K as filed with the Securities and Exchange Commission on April 7, 2015). | |
10.1* | General Cable Corporation 2008 Annual Incentive Plan, amended and restated as of January 1, 2013 (incorporated by reference to Exhibit 10.3.1 of the Company’s Annual Report on Form 10-K for the year ended December 31, 2010). | |
10.2* | General Cable Corporation Deferred Compensation Plan (Amended and Restated Effective January 1, 2008) (incorporated by reference to Exhibit 10.1 of the Company’s Current Report on Form 8-K as filed with the Securities and Exchange Commission on November 15, 2007). | |
10.3* | General Cable Corporation 2005 Stock Incentive Plan (incorporated by reference to Exhibit 10.1 of the Company’s Current Report on Form 8-K as filed with the Securities and Exchange Commission on May 16, 2005). | |
10.3.1* | Form of Nonqualified Stock Option Agreement pursuant to the General Cable Corporation 2005 Stock Incentive Plan (incorporated by reference to Exhibit 10.1 of the Company’s Current Report on Form 8-K as filed with the Securities and Exchange Commission on December 19, 2011). | |
10.3.2* | Form of the Performance-Based Stock Unit Agreement pursuant to the General Cable Corporation 2005 Stock Incentive Plan (incorporated by reference to Exhibit 10.2 of the Company’s Current Report on Form 8-K as filed with the Securities and Exchange Commission on December 19, 2011). | |
10.3.3* | Form of the Restricted Stock Agreement pursuant to the General Cable Corporation 2005 Stock Incentive Plan (incorporated by reference to Exhibit 10.3 of the Company’s Current Report on Form 8-K as filed with the Securities and Exchange Commission on December 19, 2011). | |
10.3.4* | Form of Performance-Based Stock Unit Agreement under General Cable Corporation 2005 Stock Incentive Plan (incorporated by reference to Exhibit 10 of the Company’s Current Report on Form 8-K filed with the Securities and Exchange Commission on July 30, 2013). | |
10.3.5* | Form of Global Stock Unit Agreement under General Cable Corporation 2005 Stock Incentive Plan (incorporated by reference to Exhibit 10.1 of the Company’s Current Report on Form 8-K filed with the Securities and Exchange Commission on February 14, 2014). | |
10.3.6* | Form of Global Performance Stock Unit Agreement under General Cable Corporation 2005 Stock Incentive Plan (incorporated by reference to Exhibit 10.2 of the Company’s Current Report on Form 8-K filed with the Securities and Exchange Commission on February 14, 2014). | |
10.3.7* | Form of Global Stock Unit Agreement for Executives under the General Cable Corporation 2005 Stock Incentive Plan (incorporated by reference to Exhibit 10.2 of the Company’s Quarterly Report on Form 10-Q for the quarter ended April 3, 2015). | |
10.3.8* | Form of Global Performance Stock Unit Agreement under the General Cable Corporation 2005 Stock Incentive Plan (incorporated by reference to Exhibit 10.3 of the Company’s Quarterly Report on Form 10-Q for the quarter ended April 3, 2015). | |
50
10.4* | General Cable Corporation Executive Officer Severance Benefit Plan effective January 1, 2008 (incorporated by reference to Exhibit 10.4 of the Company’s Current Report on Form 8-K as filed with the Securities and Exchange Commission on December 21, 2007). | |
10.4.1* | Amendment No. 1 to General Cable Corporation Executive Officer Severance Benefit Plan effective August 1, 2014 (incorporated by reference to Exhibit 10.6.1 of the Company's Annual Report on Form 10-K for the year ended December 31, 2014). | |
10.5* | Novation Agreement, dated as of December 19, 2007, between the Company and Brian J. Robinson (incorporated by reference to Exhibit 10.3 of the Company’s Current Report on Form 8-K as filed with the Securities and Exchange Commission on December 21, 2007). | |
10.6(†) | Amended and Restated Credit Agreement, dated as of September 6, 2013, by and among General Cable Industries, Inc., General Cable Company Ltd., Grupo General Cable Sistemas, S.L., ECN Cable Group, S.L., Silec Cable SAS, Norddeutsche Seekabelwerke GmbH, the Company and those certain other subsidiaries of the Company party thereto as guarantors, the several lenders and financial institutions party thereto, JP Morgan Chase Bank, N.A, as Administrative Agent, and J.P. Morgan Europe Limited, as European Administrative Agent (incorporated by reference to Exhibit 10.2 of the Company's Quarterly Report on Form 10-Q for the quarter ended September 27, 2013). | |
10.6.1* | Amendment No. 1 to Amended and Restated Credit Agreement, dated October 23, 2013 by and among General Cable Industries, Inc., General Cable Company Ltd., Grupo General Cable Sistemas, S.L., ECN Cable Group, S.L., Silec Cable SAS, Norddeutsche Seekabelwerke GmbH, the Company and those certain other subsidiaries of the Company party thereto as guarantors, the several lenders and financial institutions party thereto, JP Morgan Chase Bank, N.A, as Administrative Agent, and J.P. Morgan Europe Limited, as European Administrative Agent. | |
10.6.2(††) | Amendment No. 2 to Amended and Restated Credit Agreement, dated May 20, 2014 by and among General Cable Industries, Inc., General Cable Company Ltd., Grupo General Cable Sistemas, S.L., ECN Cable Group, S.L., Silec Cable SAS, Norddeutsche Seekabelwerke GmbH, the Company and those certain other subsidiaries of the Company party thereto as guarantors, the several lenders and financial institutions party thereto, JP Morgan Chase Bank, N.A, as Administrative Agent (incorporated by reference to Exhibit 10.23.5 of the Company's Quarterly Report on Form 10-Q for the quarter ended June 27, 2014). | |
10.6.3 | Amendment No. 3 to Amended and Restated Credit Agreement, dated September 23, 2014 by and among General Cable Industries, Inc., General Cable Company Ltd., Grupo General Cable Sistemas, S.L., ECN Cable Group, S.L., Silec Cable SAS, Norddeutsche Seekabelwerke GmbH, the Company and those certain other subsidiaries of the Company party thereto as guarantors, the several lenders and financial institutions party thereto, JP Morgan Chase Bank, N.A, as Administrative Agent (incorporated by reference to Exhibit 10.23.6 of the Company's Quarterly Report on Form 10-Q for the quarter ended September 26, 2014). | |
10.6.4 | Amendment No. 4 to Amended and Restated Credit Agreement, dated October 28, 2014 by and among General Cable Industries, Inc., General Cable Company Ltd., Grupo General Cable Sistemas, S.L., ECN Cable Group, S.L., Silec Cable SAS, Norddeutsche Seekabelwerke GmbH, the Company and those certain other subsidiaries of the Company party thereto as guarantors, the several lenders and financial institutions party thereto, JP Morgan Chase Bank, N.A, as Administrative Agent (incorporated by reference to Exhibit 10.23.7 of the Company's Annual Report on Form 10-K for the year ended December 31, 2014). | |
10.6.5 | Amendment No. 5 to Amended and Restated Credit Agreement, dated March 9, 2015 by and among General Cable Industries, Inc., General Cable Company Ltd., Grupo General Cable Sistemas, S.L., ECN Cable Group, S.L., Silec Cable SAS, Norddeutsche Seekabelwerke GmbH, the Company and those certain other subsidiaries of the Company party thereto, the several lenders and financial institutions party thereto, and JP Morgan Chase Bank, N.A, as Administrative Agent (incorporated by reference to Exhibit 99.1 of the Company’s Current Report on Form 8-K as filed with the Securities and Exchange Commission on March 13, 2015). | |
10.6.6 | Amendment No. 6 to Amended and Restated Credit Agreement and Limited Waiver No. 2, dated February 9, 2016 by and among General Cable Industries, Inc., General Cable Company Ltd., Grupo General Cable Sistemas, S.L., Silec Cable SAS, Norddeutsche Seekabelwerke GmbH, the Company and those certain other subsidiaries of the Company party thereto, the several lenders and financial institutions party thereto, and JP Morgan Chase Bank, N.A, as Administrative Agent (incorporated by reference to Exhibit 10.6.9 of the Company's Annual Report on Form 10-K for the year ended December 31, 2015). | |
10.6.7 | Commitment reduction notice, dated November 8, 2016, to the Amended and Restated Credit Agreement, dated as of September 6, 2013, as amended, by and among General Cable Industries, Inc., General Cable Company Ltd., Silec Cable SAS, Norddeutsche Seekabelwerke GmbH, the Company and those certain other subsidiaries of the Company party thereto as guarantors, the several lenders and financial institutions party thereto, JP Morgan Chase Bank, N.A, as Administrative Agent, and J.P. Morgan Europe Limited, as European Administrative Agent (incorporated by reference to Exhibit 10.1 of the Company’s Current Report on Form 8-K as filed with the Securities and Exchange Commission on November 15, 2016). | |
10.7* | General Cable Corporation 2014 Executive Officer Severance Plan effective August 1, 2014 (incorporated by reference to Exhibit 10.26 of the Company's Annual Report on Form 10-K for the year ended December 31, 2014). | |
10.8* | General Cable Corporation Stock Incentive Plan (incorporated by reference to Exhibit B of the Company’s Definitive Proxy Statement, as filed with the Securities and Exchange Commission on March 30, 2015). | |
10.8.1* | Form of Stock Option Grant Agreement for Executive Officers under the General Cable Corporation Stock Incentive Plan (incorporated by reference to the Company’s Current Report on Form 8-K as filed with the Securities and Exchange Commission on June 9, 2015). | |
10.8.2* | Form of Restricted Stock Unit Grant Agreement for Executive Officers under the General Cable Corporation Stock Incentive Plan (incorporated by reference to the Company’s Current Report on Form 8-K as filed with the Securities and Exchange Commission on June 9, 2015). | |
10.8.3* | Form of Performance Stock Unit Grant Agreement for Executive Officers under the General Cable Corporation Stock Incentive Plan (incorporated by reference to the Company’s Current Report on Form 8-K as filed with the Securities and Exchange Commission on June 9, 2015). | |
51
10.8.4* | Form of Long Term Incentive Cash Award Grant Agreement for Executive Officers under the General Cable Corporation Stock Incentive Plan (incorporated by reference to the Company’s Current Report on Form 8-K as filed with the Securities and Exchange Commission on June 9, 2015). | |
10.8.5* | Form of Restricted Stock Unit Grant Agreement for Non-Employee Directors under the General Cable Corporation Stock Incentive Plan (incorporated by reference to Exhibit 10.6 of the Company's Quarterly Report on Form 10-Q for the quarter ended July 3, 2015). | |
10.8.6* | Form of Restricted Stock Unit Grant Agreement for Executive Officers under the General Cable Corporation Stock Incentive Plan (incorporated by reference to Exhibit 10.8.6 of the Company's Annual Report on Form 10-K for the year ended December 31, 2015). | |
10.8.7* | Form of Performance Stock Unit Grant Agreement for Executive Officers under the General Cable Corporation Stock Incentive Plan (incorporated by reference to Exhibit 10.8.7 of the Company's Annual Report on Form 10-K for the year ended December 31, 2015). | |
10.9* | Employee Secondment Offer Letter, dated April 21, 2014, between the Company and Robert Kenny (incorporated by reference to Exhibit 10.7 of the Company's Quarterly Report on Form 10-Q for the quarter ended April 3, 2015). | |
10.10* | Offer Letter, dated June 4, 2015, by and between the Company and Michael McDonnell (incorporated by reference to the Company’s Current Report on Form 8-K as filed with the Securities and Exchange Commission on June 9, 2015). | |
10.11* | Consulting Services Agreement, dated June 29, 2015, by and between the Company and Gregory Kenny (incorporated by reference to the Company’s Current Report on Form 8-K as filed with the Securities and Exchange Commission on July 6, 2015). | |
10.12* | Offer Letter, dated January 7, 2015, by and between General Cable Corporation and Emerson Moser (incorporated by reference to Exhibit 10.1 of the Company's Quarterly Report on Form 10-Q for the quarter ended April 1, 2016). | |
10.13* | CFO Consulting Agreement, dated as of August 3, 2016, by and between the Company and Kreidler Advisory Services LLC (incorporated by reference to Exhibit 10.1 of the Company's Quarterly Report on Form 10-Q for the quarter ended September 30, 2016). | |
10.14*,** | Separation Agreement, dated as of March 21, 2016 as amended on June 14, 2016, between the Company and Brian J. Robinson. | |
10.15*,** | Separation Agreement, dated as of August 12, 2016, between the Company and Gregory J. Lampert. | |
10.16* | Offer Letter, dated October 12, 2016, by and between the Company and Matti Masanovich (incorporated by reference to Exhibit 10.1 of the Company’s Current Report on Form 8-K as filed with the Securities and Exchange Commission on November 2, 2016). | |
12.1** | Computation of Ratio of Earnings to Fixed Charges. | |
21.1** | List of Subsidiaries of General Cable. | |
23.1** | Consent of Deloitte & Touche LLP. | |
24.1** | Power of Attorney. | |
31.1** | Certification of Chief Executive Officer pursuant to Rule 13a-14(a) or 15(d)-14. | |
31.2** | Certification of Chief Financial Officer pursuant to Rule 13a-14(a) or 15(d)-14. | |
32.1** | Certification pursuant to 18 U.S.C. §1350, as adopted under Section 906 of the Sarbanes-Oxley Act of 2002. | |
101.INS** | XBRL Instance Document | |
101.SCH** | XBRL Taxonomy Extension Schema Document | |
101.CAL** | XBRL Taxonomy Extension Calculation Linkbase Document | |
101.DEF** | XBRL Taxonomy Extension Definition Linkbase Document | |
101.LAB** | XBRL Taxonomy Extension Label Linkbase Document | |
101.PRE** | XBRL Taxonomy Extension Presentation Linkbase Document | |
* | Management contract or compensatory plan. | |
** | Filed or furnished, as applicable, herewith. | |
(†) | Certain portions of this agreement have been omitted pursuant to a confidential treatment request filed separately with the SEC on January 22, 2014. | |
(††) | Certain portions of this agreement have been omitted pursuant to a confidential treatment request filed separately with the SEC on August 1, 2014. | |
52
REPORT OF INDEPENDENT REGISTERED PUBLIC ACCOUNTING FIRM
To the Board of Directors and Shareholders of
General Cable Corporation
Highland Heights, Kentucky
We have audited the accompanying consolidated balance sheets of General Cable Corporation and subsidiaries (the "Company") as of December 31, 2016 and 2015, and the related consolidated statements of operations and comprehensive income (loss), cash flows and changes in total equity for each of the three years in the period ended December 31, 2016. Our audits also included the financial statement schedule listed in the Index at Item 15. These financial statements and financial statement schedule are the responsibility of the Company's management. Our responsibility is to express an opinion on these financial statements and financial statement schedule based on our audits.
We conducted our audits in accordance with the standards of the Public Company Accounting Oversight Board (United States). Those standards require that we plan and perform the audit to obtain reasonable assurance about whether the financial statements are free of material misstatement. An audit includes examining, on a test basis, evidence supporting the amounts and disclosures in the financial statements. An audit also includes assessing the accounting principles used and significant estimates made by management, as well as evaluating the overall financial statement presentation. We believe that our audits provide a reasonable basis for our opinion.
In our opinion, such consolidated financial statements present fairly, in all material respects, the financial position of General Cable Corporation and subsidiaries as of December 31, 2016 and 2015, and the results of their operations and their cash flows for each of the three years in the period ended December 31, 2016, in conformity with accounting principles generally accepted in the United States of America. Also, in our opinion, the financial statement schedule, when considered in relation to the basic consolidated financial statements taken as a whole, presents fairly, in all material respects, the information set forth therein.
We have also audited, in accordance with the standards of the Public Company Accounting Oversight Board (United States), the Company's internal control over financial reporting as of December 31, 2016, based on the criteria established in Internal Control - Integrated Framework (2013) issued by the Committee of Sponsoring Organizations of the Treadway Commission and our report dated February 24, 2017 expressed an unqualified opinion on the Company's internal control over financial reporting.
/s/ Deloitte & Touche LLP
Cincinnati, Ohio
February 24, 2017
53
GENERAL CABLE CORPORATION AND SUBSIDIARIES
Consolidated Statements of Operations and Comprehensive Income (Loss)
(in millions, except per share data)
Year Ended | |||||||||||
Dec 31, 2016 | Dec 31, 2015 | Dec 31, 2014 | |||||||||
Net sales | $ | 3,858.4 | $ | 4,514.5 | $ | 5,979.8 | |||||
Cost of sales | 3,451.3 | 4,082.1 | 5,586.6 | ||||||||
Gross profit | 407.1 | 432.4 | 393.2 | ||||||||
Selling, general and administrative expenses | 408.9 | 412.3 | 450.7 | ||||||||
Goodwill impairment charges | 9.0 | 3.9 | 155.1 | ||||||||
Intangible asset impairment charges | 7.5 | 1.7 | 98.8 | ||||||||
Operating income (loss) | (18.3 | ) | 14.5 | (311.4 | ) | ||||||
Other income (expense) | 7.2 | (71.3 | ) | (212.9 | ) | ||||||
Interest income (expense): | |||||||||||
Interest expense | (89.5 | ) | (97.0 | ) | (116.3 | ) | |||||
Interest income | 2.5 | 2.7 | 4.5 | ||||||||
(87.0 | ) | (94.3 | ) | (111.8 | ) | ||||||
Income (loss) before income taxes | (98.1 | ) | (151.1 | ) | (636.1 | ) | |||||
Income tax (provision) benefit | 3.7 | 14.8 | (8.3 | ) | |||||||
Equity in net earnings of affiliated companies | 0.9 | 0.5 | 1.4 | ||||||||
Net income (loss) including noncontrolling interest | (93.5 | ) | (135.8 | ) | (643.0 | ) | |||||
Less: net income (loss) attributable to noncontrolling interest | 0.3 | (13.9 | ) | (15.4 | ) | ||||||
Net income (loss) attributable to Company common shareholders | $ | (93.8 | ) | $ | (121.9 | ) | $ | (627.6 | ) | ||
Earnings (loss) per share - Net income (loss) attributable to Company common shareholders per common share | |||||||||||
Earnings (loss) per common share-basic | $ | (1.89 | ) | $ | (2.49 | ) | $ | (12.86 | ) | ||
Earnings (loss) per common share-assuming dilution | $ | (1.89 | ) | $ | (2.49 | ) | $ | (12.86 | ) | ||
Dividends per common share | $ | 0.72 | $ | 0.72 | $ | 0.72 | |||||
Comprehensive income (loss): | |||||||||||
Net income (loss) | $ | (93.5 | ) | $ | (135.8 | ) | $ | (643.0 | ) | ||
Currency translation gain (loss) | 47.9 | (100.2 | ) | (97.3 | ) | ||||||
Defined benefit plan adjustments, net of tax of $3.6 million in 2016, $7.2 million in 2015 and $14.6 million in 2014 | 6.6 | 15.1 | (25.7 | ) | |||||||
Other, net of tax | — | — | (7.6 | ) | |||||||
Comprehensive income (loss), net of tax | $ | (39.0 | ) | $ | (220.9 | ) | $ | (773.6 | ) | ||
Comprehensive income (loss) attributable to noncontrolling interest, net of tax | 1.0 | (22.2 | ) | 5.3 | |||||||
Comprehensive income (loss) attributable to Company common shareholders, net of tax | $ | (40.0 | ) | $ | (198.7 | ) | $ | (778.9 | ) | ||
See accompanying Notes to Consolidated Financial Statements.
54
GENERAL CABLE CORPORATION AND SUBSIDIARIES
Consolidated Balance Sheets
(in millions, except share data)
Dec 31, 2016 | Dec 31, 2015 | ||||||
Assets | |||||||
Current Assets: | |||||||
Cash and cash equivalents | $ | 101.1 | $ | 112.4 | |||
Receivables, net of allowances of $20.2 million in 2016 and $23.0 million in 2015 | 664.5 | 715.4 | |||||
Inventories | 768.2 | 846.4 | |||||
Prepaid expenses and other | 65.4 | 66.2 | |||||
Total current assets | 1,599.2 | 1,740.4 | |||||
Property, plant and equipment, net | 529.3 | 563.2 | |||||
Deferred income taxes | 20.4 | 30.9 | |||||
Goodwill | 12.0 | 22.2 | |||||
Intangible assets, net | 28.3 | 36.6 | |||||
Unconsolidated affiliated companies | 9.0 | 8.4 | |||||
Other non-current assets | 43.4 | 52.9 | |||||
Total assets | $ | 2,241.6 | $ | 2,454.6 | |||
Liabilities and Total Equity | |||||||
Current Liabilities: | |||||||
Accounts payable | $ | 414.0 | $ | 428.7 | |||
Accrued liabilities | 419.6 | 352.5 | |||||
Current portion of long-term debt | 67.5 | 168.1 | |||||
Total current liabilities | 901.1 | 949.3 | |||||
Long-term debt | 871.1 | 911.6 | |||||
Deferred income taxes | 126.7 | 145.5 | |||||
Other liabilities | 173.8 | 187.1 | |||||
Total liabilities | 2,072.7 | 2,193.5 | |||||
Commitments and Contingencies (See Note 19) | |||||||
Redeemable noncontrolling interest | — | 18.2 | |||||
Total Equity: | |||||||
Common stock, $0.01 par value, issued and outstanding shares: | |||||||
2016 — 49,390,850 (net of 9,419,116 treasury shares) 2015 — 48,908,227 (net of 9,901,739 treasury shares) | 0.6 | 0.6 | |||||
Additional paid-in capital | 711.0 | 720.5 | |||||
Treasury stock | (169.9 | ) | (180.1 | ) | |||
Retained earnings (deficit) | (102.2 | ) | 27.2 | ||||
Accumulated other comprehensive income (loss) | (286.4 | ) | (340.2 | ) | |||
Total Company shareholders’ equity | 153.1 | 228.0 | |||||
Noncontrolling interest | 15.8 | 14.9 | |||||
Total equity | 168.9 | 242.9 | |||||
Total liabilities, redeemable noncontrolling interest and equity | $ | 2,241.6 | $ | 2,454.6 | |||
See accompanying Notes to Consolidated Financial Statements.
55
GENERAL CABLE CORPORATION AND SUBSIDIARIES
Consolidated Statements of Cash Flows (in millions)
Year Ended | |||||||||||
Dec 31, 2016 | Dec 31, 2015 | Dec 31, 2014 | |||||||||
Cash flows of operating activities: | |||||||||||
Net income (loss) including noncontrolling interest | $ | (93.5 | ) | $ | (135.8 | ) | $ | (643.0 | ) | ||
Adjustments to reconcile net income (loss) to net cash provided by operating activities: | |||||||||||
Depreciation and amortization | 86.0 | 96.4 | 125.4 | ||||||||
Amortization on restricted stock awards | — | — | 1.0 | ||||||||
Foreign currency exchange (gain) loss | 0.6 | 61.4 | 202.5 | ||||||||
Non-cash asset impairment charges | 59.5 | 67.3 | 421.7 | ||||||||
Non-cash interest charges | 5.0 | 3.6 | 1.7 | ||||||||
Deferred income taxes | (22.7 | ) | (24.4 | ) | (14.4 | ) | |||||
Venezuela deconsolidation charge | — | 12.0 | — | ||||||||
(Gain) loss on disposal of subsidiaries | (25.6 | ) | (5.1 | ) | (17.6 | ) | |||||
(Gain) loss on disposal of property | 2.1 | 2.5 | 0.5 | ||||||||
Changes in operating assets and liabilities, net of effect of acquisitions and divestitures: | |||||||||||
(Increase) decrease in receivables | 11.2 | 133.5 | (0.4 | ) | |||||||
(Increase) decrease in inventories | 52.6 | 34.0 | 110.8 | ||||||||
(Increase) decrease in other assets | 7.3 | 23.0 | 24.5 | ||||||||
Increase (decrease) in accounts payable | 2.8 | (37.6 | ) | (69.0 | ) | ||||||
Increase (decrease) in accrued and other liabilities | 69.3 | (31.9 | ) | (10.5 | ) | ||||||
Net cash flows of operating activities | 154.6 | 198.9 | 133.2 | ||||||||
Cash flows of investing activities: | |||||||||||
Capital expenditures | (84.1 | ) | (61.5 | ) | (89.6 | ) | |||||
Proceeds from properties sold | 1.5 | 1.8 | 21.4 | ||||||||
Reduction of cash due to Venezuela deconsolidation | — | (8.2 | ) | — | |||||||
Disposal of subsidiaries, net of cash disposed of | 81.8 | 78.4 | 52.4 | ||||||||
Other | 0.2 | — | (0.2 | ) | |||||||
Net cash flows of investing activities | (0.6 | ) | 10.5 | (16.0 | ) | ||||||
Cash flows of financing activities: | |||||||||||
Dividends paid to shareholders | (35.6 | ) | (35.3 | ) | (35.4 | ) | |||||
Proceeds from debt | 1,516.2 | 2,945.5 | 2,689.9 | ||||||||
Repayments of debt | (1,635.2 | ) | (3,167.2 | ) | (2,740.3 | ) | |||||
Purchase of noncontrolling interest | (18.0 | ) | — | (0.7 | ) | ||||||
Dividends paid to noncontrolling interest | (0.1 | ) | (2.5 | ) | (6.2 | ) | |||||
Proceeds from sale leaseback transaction | 6.2 | — | — | ||||||||
Repurchase of common shares | — | — | (30.7 | ) | |||||||
Proceeds from exercise of stock options | 1.2 | 0.2 | 0.3 | ||||||||
Net cash flows of financing activities | (165.3 | ) | (259.3 | ) | (123.1 | ) | |||||
Effect of exchange rate changes on cash and cash equivalents | — | (43.5 | ) | (205.8 | ) | ||||||
Cash held for sale | — | — | (1.3 | ) | |||||||
Increase (decrease) in cash and cash equivalents | (11.3 | ) | (93.4 | ) | (213.0 | ) | |||||
Cash and cash equivalents — beginning of year | 112.4 | 205.8 | 418.8 | ||||||||
Cash and cash equivalents — end of year | $ | 101.1 | $ | 112.4 | $ | 205.8 | |||||
Supplemental Information | |||||||||||
Cash paid during the year for: | |||||||||||
Income tax payments | $ | 16.3 | $ | 13.6 | $ | 22.5 | |||||
Interest paid | $ | 81.4 | $ | 87.1 | $ | 111.0 | |||||
Non-cash investing and financing activities: | |||||||||||
Capital expenditures included in accounts payable | $ | 24.1 | $ | 13.3 | $ | 20.5 | |||||
See accompanying Notes to Consolidated Financial Statements.
56
GENERAL CABLE CORPORATION AND SUBSIDIARIES
Consolidated Statements of Changes in Total Equity (dollars in millions, share amounts in thousands)
See accompanying Notes to Consolidated Financial Statements.
General Cable Total Equity | ||||||||||||||||||||||||||||||||||
Total | Common Stock | Add’l Paid in | Treasury | Retained | Accumulated Other Comprehensive | Total GCC | Noncontrolling | |||||||||||||||||||||||||||
Equity | Shares | Amount | Capital | Stock | Earnings/(Deficit) | Income/(Loss) | Equity | Interest | ||||||||||||||||||||||||||
Balance, December 31, 2013 | $ | 1,379.8 | 49,598 | $ | 0.6 | $ | 699.6 | $ | (155.3 | ) | $ | 847.4 | $ | (112.1 | ) | $ | 1,280.2 | $ | 99.6 | |||||||||||||||
Comprehensive income (loss) | (773.6 | ) | (627.6 | ) | (151.3 | ) | (778.9 | ) | 5.3 | |||||||||||||||||||||||||
Common stock dividend ($0.72 per share) | (35.4 | ) | (35.4 | ) | (35.4 | ) | ||||||||||||||||||||||||||||
Sale of subsidiaries - noncontrolling interest | (31.5 | ) | — | (31.5 | ) | |||||||||||||||||||||||||||||
Stock option and RSU expense | 14.5 | 14.5 | 14.5 | |||||||||||||||||||||||||||||||
Exercise of stock options | 0.3 | 20 | (0.1 | ) | 0.4 | 0.3 | ||||||||||||||||||||||||||||
Treasury shares related to nonvested stock vesting | (1.8 | ) | (63 | ) | (1.8 | ) | (1.8 | ) | ||||||||||||||||||||||||||
Amortization of nonvested shares | 0.2 | 0.2 | 0.2 | |||||||||||||||||||||||||||||||
Excess tax benefits (deficiencies) from stock-based compensation | (0.5 | ) | (0.5 | ) | (0.5 | ) | ||||||||||||||||||||||||||||
Purchase of noncontrolling interest | (0.7 | ) | (1.9 | ) | (1.9 | ) | 1.2 | |||||||||||||||||||||||||||
Dividends paid to noncontrolling interest | (6.2 | ) | — | (6.2 | ) | |||||||||||||||||||||||||||||
Repurchase of shares | (30.7 | ) | (1,000 | ) | (30.7 | ) | (30.7 | ) | ||||||||||||||||||||||||||
Other | (1.2 | ) | 128 | 3.0 | 3.1 | 6.1 | (7.3 | ) | ||||||||||||||||||||||||||
Balance, December 31, 2014 | $ | 513.2 | 48,683 | $ | 0.6 | $ | 714.8 | $ | (184.3 | ) | $ | 184.4 | $ | (263.4 | ) | $ | 452.1 | $ | 61.1 | |||||||||||||||
Comprehensive income (loss) | (220.9 | ) | (121.9 | ) | $ | (76.8 | ) | (198.7 | ) | (22.2 | ) | |||||||||||||||||||||||
Common stock dividend ($0.72 per share) | (35.3 | ) | (35.3 | ) | (35.3 | ) | ||||||||||||||||||||||||||||
Sale of subsidiaries - noncontrolling interest | (21.5 | ) | — | (21.5 | ) | |||||||||||||||||||||||||||||
Stock option and RSU expense | 7.5 | 7.5 | 7.5 | |||||||||||||||||||||||||||||||
Exercise of stock options | 0.2 | 18 | (0.1 | ) | 0.3 | 0.2 | ||||||||||||||||||||||||||||
Treasury shares related to nonvested stock vesting | (0.7 | ) | (56 | ) | (0.7 | ) | (0.7 | ) | ||||||||||||||||||||||||||
Excess tax benefits (deficiencies) from stock-based compensation | (1.7 | ) | (1.7 | ) | (1.7 | ) | ||||||||||||||||||||||||||||
Dividends paid to noncontrolling interest | (2.5 | ) | — | (2.5 | ) | |||||||||||||||||||||||||||||
Other | 4.6 | 263 | 4.6 | 4.6 | ||||||||||||||||||||||||||||||
Balance, December 31, 2015 | $ | 242.9 | 48,908 | $ | 0.6 | $ | 720.5 | $ | (180.1 | ) | $ | 27.2 | $ | (340.2 | ) | $ | 228.0 | $ | 14.9 | |||||||||||||||
Comprehensive income (loss) | (39.0 | ) | (93.8 | ) | $ | 53.8 | (40.0 | ) | 1.0 | |||||||||||||||||||||||||
Common stock dividend ($0.72 per share) | (35.6 | ) | (35.6 | ) | (35.6 | ) | ||||||||||||||||||||||||||||
Stock option and RSU expense | 5.4 | 5.4 | 5.4 | |||||||||||||||||||||||||||||||
Exercise of stock options | 1.2 | 60 | 0.1 | 1.1 | 1.2 | |||||||||||||||||||||||||||||
Excess tax benefits (deficiencies) from stock-based compensation | (5.0 | ) | (5.0 | ) | (5.0 | ) | ||||||||||||||||||||||||||||
Dividends paid to noncontrolling interest | (0.1 | ) | — | (0.1 | ) | |||||||||||||||||||||||||||||
Other | (0.9 | ) | 423 | (10.0 | ) | 9.1 | (0.9 | ) | ||||||||||||||||||||||||||
Balance, December 31, 2016 | $ | 168.9 | 49,391 | $ | 0.6 | $ | 711.0 | $ | (169.9 | ) | $ | (102.2 | ) | $ | (286.4 | ) | $ | 153.1 | $ | 15.8 | ||||||||||||||
57
GENERAL CABLE CORPORATION AND SUBSIDIARIES
Notes to Consolidated Financial Statements
1. General
General Cable Corporation (the "Company") is a global leader in the development, design, manufacture, marketing and distribution of copper, aluminum and fiber optic wire and cable products for use in the energy, industrial, construction, specialty and communications markets. The Company sells copper, aluminum and fiber optic wire and cable products worldwide. The Company additionally engages in the design, integration, and installation on a turn-key basis for products such as high and extra-high voltage terrestrial and submarine systems. The Company analyzes its worldwide operations based on four geographical segments: North America, Europe, Latin America, and Africa/Asia Pacific. Additional financial information regarding the segments appears in Note 18 - Segment Information. As of December 31, 2016, General Cable operated 33 manufacturing facilities in 16 countries with regional distribution centers around the world in addition to the corporate headquarters in Highland Heights, Kentucky.
2. Summary of Significant Accounting Policies
Principles of Consolidation
The Company’s consolidated financial statements include the accounts of wholly-owned subsidiaries and majority-owned controlled subsidiaries. The Company records its investment in each unconsolidated affiliated Company (generally 20-50 percent ownership in which it has the ability to exercise significant influence) at its respective equity in net assets. Other investments (generally less than 20 percent ownership) are recorded at cost. All intercompany transactions and balances among the consolidated companies have been eliminated.
The results of Asia Pacific are presented in continuing operations for all periods disclosed in this report. Previously, the results of these businesses were presented as discontinued operations; however, in the third quarter of 2016 management determined that the held for sale criteria was no longer met for the remaining Asia Pacific operations, primarily driven by management’s belief that the probability of a sale within one year is uncertain. The Company’s Asia Pacific businesses that have been sold to date, in the aggregate, are not considered a strategic shift; therefore, the Company no longer presents the Asia Pacific operations as discontinued operations in its consolidated financial statements for all periods presented. See Note 3 - Divestitures for additional details.
Prior to October 2, 2015, the Company included the results of the Venezuelan operations in the consolidated financial statements using the consolidation method of accounting. The Company’s Venezuelan earnings and cash flows were reflected in the historical consolidated financial statements using a combination of official exchange rates, including the SICAD 1, SICAD 2 and SIMADI rates. Evolving conditions in Venezuela, prior to the Company's sale of the business, including currency exchange regulations which reduced access to dollars through currency exchange markets and local market dynamics, resulted in an other-than-temporary lack of exchangeability between the Venezuelan bolivar and U.S. dollar, and restricted the Company's Venezuelan operations’ ability to pay dividends and satisfy certain other obligations denominated in U.S. dollars. Additionally, the existence of governmental limitations restricted the Company's ability to control its Venezuelan operations. For accounting purposes, this lack of exchangeability and governmental restrictions on operations resulted in a lack of control. Therefore, in accordance with ASC 810, the Company deconsolidated its Venezuelan subsidiary as of October 2, 2015 and began accounting for the investment in the Venezuelan subsidiary using the cost method of accounting. Since October 2, 2015, and through the date of the sale, the Company's financial results did not include the operating results of its Venezuelan subsidiary and the carrying value of the cost method investment was zero. On July 6, 2016, the Company completed the sale of its Venezuelan subsidiary. See Note 3 - Divestitures for additional details.
Use of Estimates
The preparation of the financial statements in conformity with accounting principles generally accepted in the United States of America requires management to make estimates and assumptions that affect the reported amounts of assets and liabilities and disclosure of contingent assets and liabilities at the date of the financial statements and the reported amounts of revenues and expenses during the reporting period. These estimates are based on historical experience and information that is available to management about current events and actions the Company may take in the future. Significant items subject to estimates and assumptions include valuation allowances for accounts receivable and deferred income taxes; legal, compliance, environmental and asbestos liabilities; uncertain tax positions; inventory costing and valuation, assets and obligations related to pension and other postretirement benefits; business combination accounting and related purchase accounting valuations; long-lived assets, goodwill and intangible valuations; financial instruments; self-insured workers’ compensation and health insurance reserves; and revenue recognized under the percentage-of-completion method. There can be no assurance that actual results will not differ from these estimates.
58
Historically, the Company has not experienced material changes in estimates as it relates to the revenue recognized under the percentage of completion method. However, in 2014, the Company completed a number of critical project milestones related to one certain submarine turnkey project at the Company's German submarine power cable manufacturing facility and resolved certain claims with the customer. As a result, the Company determined to no longer use the zero-profit method of accounting for this project, which had been used due to certain project failures. Based on this change in estimate and the resolution of certain claims, the Company's gross profit increased $18.3 million in the year ended December 31, 2014. There was no material impact to gross profit as a result of changes in estimates related to revenue recognition under the percentage of completion method in 2015 or 2016.
Revenue Recognition
The majority of the Company’s revenue is recognized when goods are shipped to the customer, title and risk of loss are transferred, pricing is fixed and determinable and collectability is reasonably assured. Most revenue transactions represent sales of inventory. A provision for payment discounts, product returns, warranty and customer rebates is estimated based upon historical experience and other relevant factors and is recorded within the same period that the revenue is recognized. A portion of the Company's revenue consists of long-term contracts for specialized products that can include installation and/or other services and is recognized based on the percentage of completion method generally based on the cost-to-cost method if there are reasonably reliable estimates of total revenue, total cost, and the extent of progress toward completion; and there is an enforceable agreement between parties who can fulfill their contractual obligations. The Company reviews contract price and cost estimates periodically as the work progresses and reflects adjustments proportionate to the percentage-of-completion to income in the period when those estimates are revised. For these contracts, if a current estimate of total contract cost indicates a loss on a contract, the projected loss is recognized in full in the period when determined.
Share-Based Compensation
The Company has various plans which provide for granting options and common stock to certain employees and independent directors of the Company and its subsidiaries. All share-based payments to employees, including grants of employee stock options, are recognized in the financial statements based on their fair values. The fair values of certain awards are estimated on the grant date using the Black-Scholes option pricing formula, which incorporates certain assumptions regarding the expected term of an award and expected stock price volatility. Key assumptions are described in further detail in Note 15 - Share-Based Compensation.
Earnings Per Share
Earnings or loss per common share-basic is determined by dividing net income applicable to common shareholders by the weighted average number of common shares-basic outstanding. Earnings per common share-assuming dilution is computed based on the weighted average number of common shares-assuming dilution outstanding which gives effect (when dilutive) to stock options, other stock-based awards, the assumed conversion of the Subordinated Convertible Notes, if applicable, and other potentially dilutive securities. Refer to discussion in Note 17 - Earnings Per Common Share.
Foreign Currency
For operations outside the United States that prepare financial statements in currencies other than the U.S. dollar, results of operations and cash flows are translated at average exchange rates during the period, and assets and liabilities are translated at spot exchange rates at the end of the period. Foreign currency translation adjustments are included as a separate component of accumulated other comprehensive income (loss) in total equity. Upon sale or upon complete or substantially complete liquidation of an investment in a foreign entity, the foreign currency translation adjustment attributable to that entity is removed from accumulated other comprehensive income (loss) and reported as part of the gain or loss on sale or liquidation of the investment for the period during which the sale or liquidation occurs. The effects of changes in exchange rates between the designated functional currency and the currency in which a transaction is denominated are recorded as foreign currency transaction gains (losses) within other income (expense) in the Consolidated Statements of Operations and Comprehensive Income (Loss).
Cash Equivalents
The Company considers all highly liquid investments with an original maturity of three months or less from the date of purchase to be cash equivalents. Cash equivalents are carried at cost, which approximates fair value.
Accounts Receivable
The accounts receivable balance is recorded at the stated amount, less allowances for doubtful accounts, price discounts, and returns. At the time of the sale and at each quarter, the Company evaluates the accounts receivable balance to determine a best estimate for doubtful accounts, price discounts, and returns. The Company reviews general historical trends in the account, customer overdue balances, high risk accounts that have been specifically identified based on historical and current customer patterns, contractual obligations, and current economic conditions to determine an estimate for these allowances.
59
Inventories
Approximately 85% of the Company's inventories are valued using the average cost method and all remaining inventories are valued using the first-in, first-out (FIFO) method. During 2014, the Venezuelan entity recorded $9.5 million of lower of cost or market charges. All inventories are stated at the lower of cost or market value.
The Company has consignment inventory at certain of its customer locations for purchase and use by the customer or other parties. General Cable retains title to the inventory and records no sale until it is ultimately sold either to the customer storing the inventory or to another party.
Property, Plant and Equipment
Property, plant and equipment are stated at cost, less accumulated depreciation. Costs assigned to property, plant and equipment relating to acquisitions are based on estimated fair values at the acquired date. Depreciation is provided using the straight-line method over the estimated useful lives of the assets: buildings, from 15 to 50 years; and machinery, equipment and office furnishings, from 2 to 20 years. Leasehold improvements are depreciated over the life of the lease or over the useful life if shorter. The Company’s manufacturing facilities perform major maintenance activities during planned shutdown periods which traditionally occur in July and December, and costs related to major maintenance activities are expensed as incurred.
The testing of these long-lived assets for impairment also requires a significant amount of judgment and assumptions, particularly as it relates to identification of asset groups and the determination of fair market value. The Company evaluates the recoverability of the carrying amount of long-lived assets (including property, plant and equipment and intangible assets with determinable lives) whenever events or changes in circumstances indicate that the carrying amount of an asset may not be fully recoverable. The Company evaluates events or changes in circumstances based mostly on actual historical operating results, but business plans, forecasts, general and industry trends and anticipated cash flows are also considered. Impairment is assessed when the undiscounted expected future cash flows derived from an asset are less than its carrying amount. Impairment losses are measured as the amount by which the carrying value of an asset exceeds its fair value and are recognized in earnings. The Company also continually evaluates the estimated useful lives of all long-lived assets and, when warranted, revises such estimates based on current events. See Note 4 - Restructuring and Note 7 - Property, Plant and Equipment.
The Company evaluates long-lived assets to be sold or abandoned to determine if the long-lived assets shall be classified as held for sale. The Company reviewed each remaining disposal group in the Company's Africa/Asia Pacific reportable segment to determine if the assets should be considered held for sale. As of December 31, 2016, the Company determined that the remaining Africa businesses and the remaining Asia Pacific Operations did not meet the held for sale criteria set forth in ASC 360, primarily driven by management’s belief that the probability of a sale within one year is uncertain. Additionally, the Company's businesses that have been sold to date, in the aggregate, are not considered a strategic shift. See Note 3 - Divestitures for additional details.
Goodwill and Intangible Assets
Goodwill and intangible assets with indefinite useful lives are not amortized, but are reviewed at least annually for impairment. Goodwill is allocated to various reporting units, which are generally an operating segment or one level below the operating segment. The Company compares the fair value of each reporting unit to its carrying amount to determine if there is potential goodwill impairment. If the fair value of a reporting unit is less than its carrying value, an impairment loss is recorded to the extent that the fair value of the goodwill within the reporting unit is less than the carrying value of the goodwill. The impairment test for the Company’s indefinite-lived intangible assets involves comparing the fair value of the intangibles to their carrying values. If the carrying amount of an intangible asset with an indefinite life exceeds its fair value, an impairment loss would be recognized in the amount equal to the excess.
With the exception of the impairment charges noted at Note 8 - Goodwill and Other Intangible Assets, net, the annual impairment test for both remaining goodwill and indefinite lived intangible assets indicated there was no impairment. However, future changes in judgments, assumptions and estimates that are used in the annual impairment testing, including discount and tax rates, future cash flow projections, or the long term growth rate could result in significantly different estimates of fair value.
Intangible assets that are not deemed to have an indefinite life, principally customer relationships and tradenames, are amortized over their useful lives based on the expected economic benefit consistent with the historical customer attrition rates. See Note 8 - Goodwill and Other Intangible Assets, net.
Severance Expenses
In 2015 and 2014, the Company announced restructuring plans. As a result, the Company has incurred restructuring costs which include employee separation costs. The charges relate to involuntary separations and the amounts are based on current salary levels and past service periods and are either considered one-time employee termination benefits in accordance with ASC 420 - Exit or Disposal Cost Obligations ("ASC 420") or as charges for contractual termination benefits under ASC 712 - Compensation - Nonretirement Postemployment Benefits ("ASC 712"). The charges are recognized when it is probable that a liability has been
60
incurred and the amount of such liability is reasonably estimable. Management estimates must be applied to determine when it is appropriate to record restructuring accruals as well as assumptions in calculating the restructuring accruals, as employees could choose to voluntarily leave the Company, forfeiting termination benefits. To the extent these assumptions and estimates change, there could be future subsequent adjustments to the accrual balance.
Long-Term Debt
In accordance with ASC 470, convertible debt instruments that may be settled in cash or other assets, or partially in cash, upon conversion, are separately accounted for as long-term debt and equity components (or conversion feature). The accounting applies to the Subordinated Convertible Notes. The debt component represents the Company’s contractual obligation to pay principal and interest and the equity component represents the Company’s option to convert the debt security into equity of the Company or the equivalent amount of cash. Upon issuance, the Company allocated the debt component on the basis of the estimated fair value of an identical debt instrument that it would issue excluding the convertible option and the remaining proceeds are allocated to the equity component. The bifurcation of the debt and equity components resulted in a debt discount for the aforementioned notes. In accordance with ASC 470, the Company uses the interest method to amortize the debt discount to interest expense over the amortization period which is the expected life of the debt.
Derivative Financial Instruments
It is the Company’s policy that derivative transactions are executed only to manage exposures arising in the normal course of business and not for the purpose of creating speculative positions or trading. Derivative financial instruments are utilized to manage commodity and foreign currency risk. In the normal course of business, the Company occasionally enters into forward pricing agreements for the purchase of copper and aluminum for delivery in a future month to match certain sales transactions. ASC 815 - Derivatives and Hedging, as amended, requires that all derivatives be recorded on the balance sheet at fair value. At December 31, 2016, there were no derivatives that were designated as cash flow hedges.
Fair Value of Financial Instruments
The Company carries derivative assets, derivative liabilities and marketable equity securities held in a rabbi trust as part of the Company’s deferred compensation plan at fair value. The Company determines the fair market value of its financial instruments based on the fair value hierarchy established in ASC 820 - Fair Value Measurement ("ASC 820").
Pension Plans
The Company provides retirement benefits through contributory and non-contributory qualified and non-qualified defined benefit pension plans covering eligible domestic and international employees as well as through defined contribution plans and other postretirement benefits. Benefits under General Cable’s qualified U.S. defined benefit pension plan generally are based on years of service multiplied by a specific fixed dollar amount, and benefits under the Company’s qualified non-U.S. defined benefit pension plans generally are based on years of service and a variety of other factors that can include a specific fixed dollar amount or a percentage of either current salary or average salary over a specific period of time. The amounts funded for any plan year for the qualified U.S. defined benefit pension plan are neither less than the minimum required under federal law nor more than the maximum amount deductible for federal income tax purposes. General Cable’s non-qualified unfunded U.S. defined benefit pension plans include a plan that provides defined benefits to select senior management employees beyond those benefits provided by other programs. The Company’s non-qualified unfunded non-U.S. defined benefit pension plans include plans that provide retirement indemnities to employees. Pension obligations for the non-qualified unfunded defined benefit pension plans are recognized in the Consolidated Balance Sheet and are based on local practices and regulations of the respective countries. General Cable makes cash contributions for the costs of the non-qualified unfunded defined benefit pension plans as the benefits are paid.
Loss Contingencies
The Company determines whether to accrue and/or disclose for loss contingencies based on an assessment of whether the risk of loss is remote, reasonably possible or probable. The Company's assessment is developed in consultation with its outside counsel and other advisers and is based on an analysis of possible outcomes. Loss contingency assumptions involve judgments that are inherently subjective and can involve matters that are in litigation, which, by its nature is unpredictable. The Company believes that its assessment of the probability of loss contingencies is reasonable, but because of the subjectivity involved and the unpredictable nature of the subject matter at issue, the Company's assessment may prove ultimately to be incorrect, which could materially impact the consolidated financial statements. See Note 19 - Commitments and Contingencies.
Self-insurance
The Company is self-insured for certain employee medical benefits, workers’ compensation benefits, environmental and asbestos-related issues. The Company has purchased stop-loss coverage in order to limit its exposure to any significant level of workers’ compensation claims. Certain insurers are also partly responsible for coverage on many of the asbestos-related issues (refer to
61
Note 19 - Commitments and Contingencies). Self-insured losses are accrued based upon estimates of the aggregate liability for uninsured claims incurred using the Company’s historical claims experience.
Concentration of Risk
General Cable sells a broad range of products globally. Concentrations of credit risk with respect to trade receivables are limited due to the large number of customers, including members of buying groups, composing General Cable’s customer base. General Cable customers generally receive a 30 to 60 day payment period on purchases from the Company, with exceptions in certain end markets. Certain automotive customers of the Company receive payment terms ranging from 45 days to 360 days, which is common in this particular market. Ongoing credit evaluations of customers’ financial condition are performed, and generally, no collateral is required. General Cable maintains reserves for potential credit losses and such losses, in the aggregate, have not exceeded management’s estimates. Certain subsidiaries also maintain credit insurance for certain customer balances. Bad debt expense associated with uncollectible accounts for the years ended December 31, 2016, 2015 and 2014 was $5.1 million, $8.1 million and $11.4 million, respectively.
The Company has centralized purchasing of copper, aluminum and other significant raw materials. In 2016, the Company's largest North American supplier of copper accounted for approximately 70% of its total copper purchases while the largest supplier of aluminum accounted for approximately 50% of its total aluminum purchases. In Latin America, the Company’s largest supplier of copper accounted for approximately 75% of its total copper purchases while the largest supplier of aluminum accounted for approximately 50% of its total aluminum purchases. In Europe, the Company's largest supplier of copper accounted for approximately 50% of its total copper purchases while the largest supplier of aluminum accounted for approximately 40% of its total aluminum purchases.
Income Taxes
The Company is subject to income tax in numerous United States federal, state, and foreign jurisdictions. Significant judgments and estimates are inherent in determining the Company's consolidated income tax expense, current tax payable, deferred tax assets and liabilities, and liabilities for uncertain tax positions. Future events such as changes in business conditions, tax legislation, tax audit resolutions, or foreign earnings repatriation plans could materially impact these estimates and the Company's tax position.
Deferred tax assets and liabilities are determined based on the differences between the financial statement basis and tax basis of assets and liabilities using enacted tax rates in effect for the year in which the differences are expected to reverse. The effect of a change in tax rates on deferred tax assets and liabilities is recognized in income in the period that includes the enactment date. At December 31, 2016, the Company had recorded a net deferred tax liability of $106.3 million ($199.3 million deferred tax asset less $305.6 million deferred tax liability). The valuation of deferred tax assets is dependent on, among other things, the ability of the Company to generate a sufficient level of future taxable income. In estimating future taxable income, the Company has considered both positive and negative evidence, such as historical and forecasted results of operations, including prior losses, and has considered the implementation of prudent and feasible tax planning strategies. As of December 31, 2016, the Company recorded a valuation allowance of $177.1 million to reduce deferred tax assets to the amount judged more likely than not to be realized. The Company has and will continue to review on a quarterly basis its assumptions and tax planning strategies, and, if the amount of the estimated realizable deferred tax assets is less than the amount currently on the balance sheet, the Company would reduce its deferred tax asset, recognizing a non-cash charge against reported earnings. Likewise, if the Company determines that a valuation allowance against a deferred tax asset is no longer appropriate, the adjustment to the valuation allowance would reduce income tax expense.
The Company operates in multiple jurisdictions with complex tax policies and regulations. In certain jurisdictions, the Company has taken tax positions that it believes are supportable, but which could be subject to challenge by the tax authorities. These tax positions are evaluated and liabilities for uncertain tax positions are established in accordance with the ASC 740 accounting guidance. The status of uncertain tax positions is reviewed in light of changing facts and circumstances, such as tax audits, rulings, and case law, and the related liabilities are adjusted accordingly.
The Company recognizes interest and penalties related to unrecognized tax benefits within the income tax expense line in the accompanying Consolidated Statements of Operations and Comprehensive Income (Loss). Accrued interest and penalties are included within the related tax liability line item in the Consolidated Balance Sheets.
Shipping and Handling Costs
All shipping and handling amounts billed to a customer in a sales transaction are classified as revenue. Shipping and handling costs associated with storage and handling of finished goods and storage and handling of shipments to customers are included in cost of sales and totaled $114.2 million, $118.0 million and $157.2 million for the years ended December 31, 2016, 2015 and 2014, respectively.
62
Advertising Expense
Advertising expense consists of expenses relating to promoting the Company’s products, including trade shows, catalogs, and e-commerce promotions, and is charged to expense when incurred. Advertising expense was $7.9 million, $10.4 million and $14.2 million in 2016, 2015 and 2014, respectively.
New Accounting Pronouncements
During the year ended December 31, 2016, the Company did not change any of its existing accounting policies that are expected to have a material effect on the consolidated financial statements.
The following accounting pronouncements were adopted and became effective with respect to the Company in 2016 and 2015:
In November 2015, the FASB issued ASU 2015-17, "Income Taxes (Topic 740): Balance Sheet Classification of Deferred Taxes." This update provides guidance on simplifying the presentation of deferred income taxes. Prior to the adoption of ASU 2015-17, deferred income tax liabilities and assets were separated into current and non-current amounts while ASU 2015-17 amends the standard to require that deferred tax liabilities and assets be classified as non-current. The amendments may be applied either prospectively to all deferred tax liabilities and assets or retrospectively to all periods presented with earlier application permitted as of the beginning of an interim or annual reporting period. The Company elected early adoption of the standard on a prospective basis and implemented ASU 2015-17 for the year ended December 31, 2015. Adoption of this ASU resulted in reclassifications of current deferred tax assets and current deferred tax liabilities to non-current in the Company's Consolidated Balance Sheet as of December 31, 2015. No prior periods were retrospectively adjusted. The adoption of this ASU did not have a material effect on the Company’s consolidated financial statements.
In May 2015, the FASB issued ASU 2015-07, "Disclosures for Investments in Certain Entities That Calculate Net Asset Value per Share (or Its Equivalent)." The amendments in this update remove the requirement to categorize within the fair value hierarchy all investments for which fair value is measured using the net asset value (“NAV”) per share practical expedient in accordance with the standard for fair value measurement. The update was effective for the Company beginning January 1, 2016 and requires retrospective application. The fair value disclosure for the Company’s defined benefit pension plan investments as of December 31, 2016 and 2015 have been updated to reflect the adoption of this standard (refer to Note 13 - Employee Benefit Plans). The adoption of this ASU did not have a material effect on the Company’s consolidated financial statements.
In April 2015, the FASB issued ASU 2015-03, “Interest - Imputation of Interest (Subtopic 835-30): Simplifying the Presentation of Debt Issuance Costs.” The update requires debt issuance costs related to a recognized debt liability be presented in the balance sheet as a direct deduction from the carrying amount of the related debt liability instead of being presented as an asset. Debt disclosures will include the face amount of the debt liability and the effective interest rate. In August 2015, the FASB issued ASU 2015-15, "Presentation and Subsequent Measurement of Debt Issuance Costs Associated with Line-of-Credit Arrangements", which clarifies the presentation and subsequent measurement of debt issuance costs associated with lines of credit. These costs may be presented as an asset and amortized ratably over the term of the line of credit arrangement, regardless of whether there are outstanding borrowings on the arrangement. The update requires retrospective application and represents a change in accounting principle. Debt issuance costs of $1.5 million, previously recorded to Prepaid expenses and other, and $10.6 million, previously recorded to Other non-current assets, are now presented as a direct deduction from the carrying amount of Long-term debt on the Company's Consolidated Balance Sheet as of December 31, 2015.
In June 2014, the FASB issued ASU 2014-12, "Compensation - Stock Compensation (Topic 718): Accounting for Share-Based Payments When the Terms of an Award Provide That a Performance Target Could be Achieved after the Requisite Service Period." This standard provides more explicit guidance for treating share-based payment awards that require a specific performance target that affects vesting and that could be achieved after the requisite service period as a performance condition. The adoption of this standard did not have a material effect on the Company's consolidated financial statements.
The following recently issued accounting pronouncements will become effective in future periods with respect to the Company:
In October 2016, the FASB issued ASU 2016-16, "Income Taxes (Topic 740): Intra-Entity Transfers of Assets Other Than Inventory." This update eliminates the prohibition in ASC 740 against the immediate recognition of the current and deferred income tax effects of intra-entity transfers of assets other than inventory. Under this update, the selling (transferring) entity is required to recognize a current tax expense or benefit upon transfer of the asset, and the purchasing (receiving) entity is required to recognize a deferred tax asset or deferred tax liability, as well as the related deferred tax benefit or expense, upon receipt of the asset. This update is effective for annual reporting periods beginning after December 15, 2017. Early adoption is permitted for all entities as of the beginning of a fiscal year for which neither the annual or interim financial statements have been issued. If an entity chooses to early adopt the amendments in this update, it must do so in the first interim period of its annual financial statements. The amendments in this update should be applied on a modified retrospective basis, recognizing the effects in retained earnings as of the beginning of the year of adoption. ASU 2016-16 is not expected to have a material impact on the Company’s consolidated financial statements.
63
In August 2016, the FASB issued ASU 2016-15, "Statement of Cash Flows (Topic 230): Classification of Certain Cash Receipts and Cash Payments." The update eliminates the current diversity in practice in how certain cash receipts and cash payments are presented and classified in the statement of cash flows by providing guidance on eight specific cash flow classification issues. This update is effective for annual and interim reporting periods beginning after December 15, 2017 and should be applied using a retrospective transition method to each period presented. Early adoption is permitted in any interim or annual period for financial statements that have not been previously issued. ASU 2016-15 is not expected to have a material impact on the Company’s consolidated financial statements.
In February 2016, the FASB issued ASU 2016-02, "Leases (Topic 842)." The standard requires lessees to recognize the assets and liabilities that arise from leases on the balance sheet. A lessee should recognize in the statement of financial position a liability to make lease payments (the lease liability) and a right-of-use asset representing its right to use the underlying asset for the lease term. The new guidance is effective for annual and interim reporting periods beginning after December 15, 2018. The amendments should be applied at the beginning of the earliest period presented using a modified retrospective approach with earlier application permitted as of the beginning of an interim or annual reporting period. The standard will impact the Company's Consolidated Balance Sheets. The Company has not determined the quantitative impact of adoption (refer to Note 19 - Commitments and Contingencies for the Company's future minimum rental payments). The standard is not expected to have a material impact on the Company's Consolidated Statements of Operations and Comprehensive Income (Loss).
In July 2015, the FASB issued ASU 2015-11, “Inventory (Topic 330): Simplifying the Measurement of Inventory.” This update provides guidance on simplifying the measurement of inventory. The current standard is to measure inventory at lower of cost or market; where market could be replacement cost, net realizable value, or net realizable value less an approximately normal profit margin. ASU 2015-11 updates this guidance to measure inventory at the lower of cost and net realizable value; where net realizable value is the estimated selling prices in the ordinary course of business, less reasonably predictable costs of completion, disposal, and transportation. This update is effective for annual reporting periods beginning after December 15, 2016. The amendments should be applied prospectively with earlier application permitted as of the beginning of an interim or annual reporting period. ASU 2015-11 is not expected to have a material impact on the Company’s consolidated financial statements.
In May 2014, the FASB issued ASU 2014-09, “Revenue from Contracts with Customers (Topic 606).” This ASU outlines a single, comprehensive model for accounting for revenue from contracts with customers which requires an entity to recognize the amount of revenue to which it expects to be entitled for the transfer of promised goods or services to customers. In August 2015, the FASB issued ASU 2015-14, “Revenue from Contracts with Customers (Topic 606)", which defers the effective date of ASU 2014-09 to annual and interim reporting periods beginning after December 15, 2017 with early application permitted for annual and interim reporting periods beginning after December 15, 2016. The standard permits the use of either the retrospective or modified retrospective (cumulative effect) transition method. The standard will accelerate the timing of when revenue is recognized for arrangements involving consignment inventory and arrangements when the Company's performance does not create an asset with an alternative use to the Company and the Company has an enforceable right to payment for performance completed to date. The Company will adopt this standard on January 1, 2018 using the modified retrospective (cumulative effect) transition method and is currently evaluating the impact of this standard on the Company's Consolidated Financial Statements.
64
3. Divestitures
October 2014 Divestiture Plan
In October 2014, the Company announced the intent to divest all of the Company's operations in Asia Pacific and Africa. The Company expects to incur a total of approximately $10 million in pre-tax charges consisting primarily of legal and transaction fees for the dispositions. Charges incurred for the years ended December 31, 2016 and 2015 were $2.1 million and $3.4 million, respectively. The charges were immaterial for the year ended December 31, 2014.
Asia Pacific
As part of the October 2014 announcement, the Company completed the following as of December 31, 2016 (in millions):
Entity | Sale / Closure | Sale / Closure Date | Gross Proceeds | Pre-tax Gain / (Loss) (1) | ||||||||
India (2) | Sale | First Quarter 2016 | $ | 10.8 | $ | 1.6 | ||||||
Thailand | Sale | Third Quarter 2015 | 88.0 | 16.1 | ||||||||
Fiji | Sale | First Quarter 2015 | 9.3 | (2.6 | ) | |||||||
Keystone | Sale | First Quarter 2015 | 11.0 | 3.6 | ||||||||
PDP and PDEP | Sale | Fourth Quarter 2014 | 67.1 | 17.6 | ||||||||
(1) | The pre-tax gain / (loss) for each sale was recorded in the SG&A expenses caption of the Consolidated Statements of Operations and Comprehensive Income (Loss); the pre-tax gain / (loss) included the reclassification of foreign currency translation adjustments upon sale of the entity. |
(2) | Prior to the sale, the Company recorded a long-lived asset impairment loss in cost of sales of $13.6 million in the year ended December 31, 2015. |
The results of the Asia Pacific operations were previously presented as discontinued operations; however, in the third quarter of 2016, management determined that the sale of these businesses within one year was uncertain, and therefore determined that the held for sale criteria was no longer met for the group of components in the remaining Asia Pacific operations. As a result and because the businesses that have been sold to date including India, Thailand, Fiji, Keystone and the Philippines, in the aggregate, are not considered a strategic shift; the Asia Pacific operations are no longer be presented as discontinued operations in the financial statements for all periods presented. The Company's results from the Asia Pacific operations are presented in continuing operations for all periods disclosed in this report.
The Company reclassified the remaining Asia Pacific operations' assets and liabilities previously presented as held for sale to held and used on its Consolidated Balance Sheets as of December 31, 2015. The remaining Asia Pacific operations are measured at the carrying amount before the assets were classified as held for sale, adjusted for depreciation and amortization expense that would have been recognized had the assets been continuously classified as held for use. The adjustments in the year ended December 31, 2016 are not material.
The sales of Thailand and PDP and PDEP are considered disposals of an individually significant component of an entity per ASC 205. The pre-tax loss of Thailand in the years ended December 31, 2015 and 2014 was $7.6 million and $84.1 million, respectively. The pre-tax loss attributable to the Company in the years ended December 31, 2015 and 2014 was $5.7 million and $63.5 million, respectively. The pre-tax profit of PDP and PDEP in the year ended December 31, 2014 was $10.4 million and the pre-tax profit attributable to the Company in the ended December 31, 2014 was $6.2 million.
Africa
The Company's Africa businesses, and disposals of related operations to date, are not considered a strategic shift that has or will have a major effect on the Company's operations and financial results. The Company has completed the following as of December 31, 2016 (in millions):
Entity | Sale / Closure | Sale / Closure Date | Gross Proceeds | Pre-tax Gain (Loss)(1) | ||||||||
South Africa - Durban(2) | Closure | Fourth Quarter 2016 | $ | — | $ | 1.6 | ||||||
South Africa - National Cables(2) | Closure | Fourth Quarter 2016 | — | (29.4 | ) | |||||||
Zambia | Sale | Third Quarter 2016 | 9.8 | (14.4 | ) | |||||||
Egypt (3) | Sale | Second Quarter 2016 | 5.8 | (8.4 | ) | |||||||
(1) | The pre-tax gain / (loss) for each sale was recorded in the SG&A expenses caption of the Consolidated Statements of Operations and Comprehensive Income (Loss); the pre-tax gain / (loss) included the reclassification of foreign currency translation adjustments upon sale of the entity. |
(2) | The gain (loss) represents foreign currency translation adjustments reclassified from accumulated other comprehensive income upon liquidation. |
(3) | Prior to the sale, the Company recorded a long-lived asset impairment loss in cost of sales of $6.0 million in the first quarter of 2016. |
65
As of December 31, 2016, the Company determined that the remaining Africa businesses did not meet the held for sale criteria set forth in ASC 360. Management’s belief is that the probability of a sale within one year is uncertain.
Venezuela Divestiture
In the third quarter of 2016, the Company completed the sale of its Venezuelan subsidiary for cash consideration of approximately $6 million. The pre-tax gain recognized in the year ended December 31, 2016 was $5.9 million, and is included in the SG&A expenses caption in the Consolidated Statements of Operations and Comprehensive Income (Loss) in the Europe segment (based on the legal entity structure).
4. Restructuring
November 2015 restructuring program
In the fourth quarter of 2015, the Company committed to a new strategic roadmap focused on growth and optimization of the portfolio, developing leading cost and efficiency positions, growth through innovation and cultivation of a high-performance culture. In 2016, the Company approved additional expenditures to further expand, strengthen and accelerate the Company's program targeting operational effectiveness and efficiencies.
Total expected costs and costs incurred to date by reportable segment are below (in millions):
North America | Europe | Latin America | Total | |||||||||
Total expected restructuring costs | $ | 65.0 | $ | 22.0 | $ | 8.0 | $ | 95.0 | ||||
Costs incurred 2015 - Cost of sales | $ | 0.1 | $ | 5.0 | $ | 1.7 | $ | 6.8 | ||||
Costs incurred 2015 - SG&A | — | 1.7 | 0.1 | 1.8 | ||||||||
Total costs incurred, December 31, 2015 | $ | 0.1 | $ | 6.7 | $ | 1.8 | $ | 8.6 | ||||
Costs incurred 2016 - Cost of sales | $ | 7.4 | $ | 10.5 | $ | 2.6 | $ | 20.5 | ||||
Costs incurred 2016 - SG&A | 41.3 | 3.2 | 0.8 | 45.3 | ||||||||
Total costs incurred, December 31, 2016 | $ | 48.7 | $ | 13.7 | $ | 3.4 | $ | 65.8 | ||||
Total aggregate costs to date | $ | 48.8 | $ | 20.4 | $ | 5.2 | $ | 74.4 | ||||
Estimated remaining costs | $ | 16.2 | $ | 1.6 | $ | 2.8 | $ | 20.6 | ||||
Changes in the restructuring reserve and activity for the years ended December 31, 2016 and 2015 are below (in millions):
Employee Separation Costs | Asset-Related Costs | Other Costs | Total | |||||||||
Total expected restructuring charges | $ | 15.0 | $ | 25.0 | $ | 55.0 | $ | 95.0 | ||||
Balance, December 31, 2014 | $ | — | $ | — | $ | — | $ | — | ||||
Net provisions | $ | 2.2 | $ | 1.9 | $ | 4.5 | $ | 8.6 | ||||
Net benefits charged against the assets and other | — | (1.9 | ) | (0.3 | ) | (2.2 | ) | |||||
Payments | (0.9 | ) | — | (1.0 | ) | (1.9 | ) | |||||
Balance, December 31, 2015 | $ | 1.3 | $ | — | $ | 3.2 | $ | 4.5 | ||||
Net provisions | $ | 10.5 | $ | 19.4 | $ | 35.9 | $ | 65.8 | ||||
Net benefits charged against the assets and other | — | (19.4 | ) | (0.7 | ) | (20.1 | ) | |||||
Payments | (5.8 | ) | — | (25.0 | ) | (30.8 | ) | |||||
Foreign currency translation | (0.1 | ) | — | (0.1 | ) | (0.2 | ) | |||||
Balance, December 31, 2016 | $ | 5.9 | $ | — | $ | 13.3 | $ | 19.2 | ||||
Total aggregate costs to date | $ | 12.7 | $ | 21.3 | $ | 40.4 | $ | 74.4 | ||||
66
Employee Separation Costs
The Company recorded employee separation costs of $10.5 million and $2.2 million for the years ended December 31, 2016 and 2015, respectively. The employee separation charges were $6.3 million and $0.1 million in North America, $3.4 million and $1.4 million in Europe and $0.8 million and $0.7 million in Latin America for the years ended December 31, 2016 and 2015, respectively.
Employee separation costs include severance and retention bonuses. As of December 31, 2016, employee separation costs included severance charges for approximately 370 employees; approximately 260 of these employees were classified as manufacturing employees and approximately 110 of these employees were classified as non-manufacturing employees. The charges relate to involuntary separations based on current salary levels and past service periods and are either considered one-time employee termination benefits in accordance with ASC 420 - Exit or Disposal Cost Obligations ("ASC 420") or charges for contractual termination benefits under ASC 712 - Compensation - Nonretirement Postemployment Benefits ("ASC 712").
Asset-Related Costs
The Company recorded asset-related costs of $19.4 million and $1.9 million for the years ended December 31, 2016 and 2015, respectively. The asset-related charges were $13.9 million in North America for the year ended December 31, 2016. The asset-related charges for the years ended December 31, 2016 and 2015 were $3.7 million and $1.0 million in Europe and $1.8 million and $0.9 million in Latin America, respectively.
Asset-related costs consist of asset write-downs and accelerated depreciation. Asset write-downs relate to the establishment of a new fair value basis for assets to be classified as held-for-sale or to be disposed of, as well as asset impairment charges for asset groups to be held-and-used in locations which are being restructured and it has been determined the undiscounted cash flows expected to result from the use and eventual disposition of the assets are less than their carrying value. Refer to Note 21 - Fair Value for additional details regarding valuation techniques used to determine fair value.
The Company notes the plan to abandon a long-lived asset before the end of its previously estimated useful life is a change in accounting estimate per ASC 250 - Accounting Changes and Error Corrections. The annual depreciation impact from the asset write-downs and changes in estimated useful lives is not material.
In 2016, as part of the new strategic plan, the Company's management evaluated alternatives for its automotive business which included the sale of its automotive ignition wire business in the second quarter as noted above. In the third quarter of 2016, the Company continued to pursue alternatives for the remaining automotive business. As a result of this change in strategy, the Company performed an impairment test in the third quarter of 2016. Using a market approach, the Company recorded a goodwill impairment charge of $7.4 million and an impairment charge on the amortized intangible assets of $4.7 million. These costs are included as asset-related costs, and were recorded in the SG&A expenses caption in the Consolidated Statements of Operations and Comprehensive Income (Loss) in the North America reportable segment. As of December 31, 2016, goodwill and intangible assets related to the acquisition of the automotive business was zero.
Other Costs
The Company recorded other restructuring-type charges of $35.9 million and $4.5 million for the years ended December 31, 2016 and 2015, respectively. The other restructuring-type charges were $28.5 million in North America for the year ended December 31, 2016, and $6.6 million and $4.3 million in Europe and $0.8 million and $0.2 million in Latin America for the years ended December 31, 2016 and 2015, respectively.
Other restructuring-type charges are incurred as a direct result of the restructuring program. These restructuring -type charges primarily include project management costs, such as consulting fees related to the supply chain redesign and the cost to change internal systems and processes to support the underlying organizational changes, as well as working capital write-downs not associated with normal operations, equipment relocation, termination of contracts and other immaterial costs.
North America automotive ignition wire sale
As part of the strategic roadmap, in the second quarter of 2016, the Company completed the sale of its North American Automotive Ignition Wire business for total consideration of $70.7 million. The pre-tax gain recognized in the year ended December 31, 2016 was $53.2 million. The gain is recognized in the SG&A expenses caption in the Consolidated Statements of Operations and Comprehensive Income (Loss). This disposal did not represent a strategic shift that has or will have a major effect on the Company’s operations and financial results; therefore, the results are presented as continued operations.
July 2014 restructuring program
In July 2014, the Company announced a comprehensive restructuring program. As of December 31, 2016, this program is substantially complete and future estimated costs are expected to be immaterial. The restructuring program was focused on the closure of certain underperforming assets as well as the consolidation and realignment of other facilities. The Company also implemented initiatives to reduce SG&A expenses globally.
67
Total costs incurred to date by reportable segment are below (in millions):
North America | Europe | Latin America | Africa/Asia Pacific | Total | |||||||||||
Costs incurred 2014 - Cost of sales | $ | 6.3 | $ | 105.2 | $ | 25.3 | $ | 14.9 | $ | 151.7 | |||||
Costs incurred 2014 - SG&A | 0.5 | 10.4 | 3.4 | 0.3 | 14.6 | ||||||||||
Total costs incurred, December 31, 2014 | $ | 6.8 | $ | 115.6 | $ | 28.7 | $ | 15.2 | $ | 166.3 | |||||
Costs incurred 2015 - Cost of sales | $ | 6.4 | $ | 7.4 | $ | 3.4 | $ | (0.1 | ) | $ | 17.1 | ||||
Costs incurred 2015 - SG&A | 5.5 | 14.7 | 4.5 | 0.2 | 24.9 | ||||||||||
Total costs incurred, December 31, 2015 | $ | 11.9 | $ | 22.1 | $ | 7.9 | $ | 0.1 | $ | 42.0 | |||||
Costs incurred 2016 - Cost of sales | $ | 5.7 | $ | 0.7 | $ | 1.7 | $ | — | $ | 8.1 | |||||
Costs incurred 2016 - SG&A | 0.3 | 2.0 | 1.2 | — | 3.5 | ||||||||||
Total costs incurred, December 31, 2016 | $ | 6.0 | $ | 2.7 | $ | 2.9 | $ | — | $ | 11.6 | |||||
Total aggregate costs to date | $ | 24.7 | $ | 140.4 | $ | 39.5 | $ | 15.3 | $ | 219.9 | |||||
Changes in the restructuring reserve and activity for the years ended December 31, 2016 and 2015 are below (in millions):
Employee Separation Costs | Asset-Related Costs | Other Costs | Total | |||||||||
Balance, December 31, 2014 | $ | 32.4 | $ | — | $ | 1.0 | $ | 33.4 | ||||
Net provisions | $ | 12.4 | $ | 15.8 | $ | 13.8 | $ | 42.0 | ||||
Net benefits charged against the assets and other | (2.8 | ) | (15.8 | ) | (4.4 | ) | (23.0 | ) | ||||
Payments | (31.2 | ) | — | (7.2 | ) | (38.4 | ) | |||||
Foreign currency translation | (3.1 | ) | — | (0.2 | ) | (3.3 | ) | |||||
Balance, December 31, 2015 | $ | 7.7 | $ | — | $ | 3.0 | $ | 10.7 | ||||
Net provisions | $ | 1.3 | $ | 2.0 | $ | 8.3 | $ | 11.6 | ||||
Net benefits charged against the assets and other | — | (2.0 | ) | 0.6 | (1.4 | ) | ||||||
Payments | (8.8 | ) | — | (7.4 | ) | (16.2 | ) | |||||
Foreign currency translation | (0.2 | ) | — | — | (0.2 | ) | ||||||
Balance, December 31, 2016 | $ | — | $ | — | $ | 4.5 | $ | 4.5 | ||||
Total aggregate costs to date | $ | 52.4 | $ | 135.3 | $ | 32.2 | $ | 219.9 | ||||
Employee Separation Costs
The Company recorded employee separation costs of $1.3 million, $12.4 million and $38.7 million for the years ended December 31, 2016, 2015 and 2014, respectively. The employee separation charges were $1.0 million, $8.2 million and $2.2 million in North America for the years ended December 31, 2016, 2015 and 2014, respectively, $2.7 million and $33.4 million in Europe for the years ended December 31, 2015 and 2014, respectively, $0.3 million, $1.0 million and $2.7 million in Latin America for the years ended December 31, 2016, 2015 and 2014, respectively, and $0.5 million and $0.4 million in Africa/Asia Pacific for the years ended December 31, 2015 and 2014, respectively.
Employee separation costs include severance, retention bonuses and pension costs. As of December 31, 2016, employee separation costs included severance charges for approximately 1,430 employees; approximately 1,110 of these employees were classified as manufacturing employees and approximately 320 of these employees were classified as non-manufacturing employees. The charges relate to involuntary separations based on current salary levels and past service periods and are either considered one-time employee termination benefits in accordance with ASC 420 or as charges for contractual termination benefits under ASC 712.
Asset-Related Costs
The Company recorded asset-related restructuring costs of $2.0 million, $15.8 million and $117.5 million for the years ended December 31, 2016, 2015 and 2014, respectively. The asset-related charges were $0.7 million, $0.6 million and $3.2 million in North America for the years ended December 31, 2016, 2015 and 2014, respectively, $10.8 million and $80.1 million in Europe for the years ended December 31, 2015 and 2014, respectively, $1.3 million, $4.4 million and $20.9 million in Latin America for
68
the years ended December 31, 2016, 2015 and 2014, respectively, and $13.3 million in Africa/Asia Pacific for the year ended December 31, 2014.
Asset-related costs consist of asset write-downs and accelerated depreciation. Asset write-downs relate to the establishment of a new fair value basis for assets to be classified as held-for-sale or to be disposed of, as well as asset impairment charges for asset groups to be held-and-used in locations which are being restructured and it has been determined the undiscounted cash flows expected to result from the use and eventual disposition of the assets are less than their carrying value. Refer to Note 21 - Fair Value for additional details regarding valuation techniques used to determine fair value.
The Company notes the plan to abandon a long-lived asset before the end of its previously estimated useful life is a change in accounting estimate per ASC 250 - Accounting Changes and Error Corrections. The annual depreciation impact from the asset write-downs and changes in estimated useful lives is immaterial.
As part of the restructuring program, in the second quarter of 2015, the Company completed the disposal of a subsidiary in Spain for cash consideration of $1.8 million. The pre-tax loss on the sale from the disposition in the second quarter of 2015 was $11.6 million. This sale did not represent a strategic shift that had or will have a major effect on the Company's operations and financial results; therefore, the results are presented as continued operations. This loss is included as asset-related restructuring costs in the Europe segment for the year ended December 31, 2015 and is recognized in the SG&A expenses caption in the Consolidated Statements of Operations and Comprehensive Income (Loss).
Other Costs
The Company recorded other restructuring-type charges of $8.3 million, $13.8 million and $10.1 million for the years ended December 31, 2016, 2015 and 2014, respectively. The other restructuring-type charges were $4.3 million, $3.1 million and $1.4 million in North America, $2.7 million, $8.6 million and $2.1 million in Europe and $1.3 million, $2.5 million and $5.1 million in Latin America for the years ended December 31, 2016, 2015 and 2014, respectively. The Company recorded a benefit of $0.4 million and charges of $1.5 million in Africa/Asia Pacific for the years ended December 31, 2015 and 2014, respectively.
Other restructuring-type charges are incurred as a direct result of the restructuring program. Such charges primarily include working capital write-downs not associated with normal operations, equipment relocation, termination of contracts, legal fees and other immaterial costs.
5. Other Income (Expense)
Other income (expense) primarily includes foreign currency transaction gains or losses, which result from changes in exchange rates between the designated functional currency and the currency in which a transaction is denominated as well as gains and losses on derivative instruments that are not designated as cash flow hedges and Venezuela devaluation charges. During 2016, 2015 and 2014, the Company recorded other income of $7.2 million and other expense of $71.3 million and $212.9 million, respectively.
For 2016, other income was primarily attributable to $8.9 million related to gains on derivative instruments that were not designated as cash flow hedges, partially offset by $1.7 million related to foreign currency transaction losses.
For 2015, other expense was primarily attributable to the adoption of the SIMADI currency exchange system in Venezuela and ongoing remeasurement of the local balance sheet, which resulted in an expense of $22.9 million, $41.2 million related to foreign currency transaction losses, and $7.2 million related to losses on derivative instruments which were not designated as cash flow hedges.
For 2014, other expense was primarily attributable to $83.1 million related to the Venezuela currency devaluation resulting from the remeasurement of the financial results at the 6.30 BsF per U.S. dollar rate to the SICAD 1 rate, $90.2 million related to the Venezuela currency devaluation resulting from the remeasurement of the financial results at the SICAD 1 rate to the SICAD 2 rate, $30.3 million of foreign currency transaction losses, and losses of $4.0 million on derivative instruments that were not designated as cash flow hedges.
Refer to Note 2 - Summary of Significant Accounting Policies for more information regarding the Company's Venezuelan operations.
69
6. Inventories
As of December 31, 2016, all inventories are stated at the lower of cost or market value and consisted of the following (in millions):
Dec 31, 2016 | Dec 31, 2015 | |||||||
Raw materials | $ | 170.7 | $ | 187.2 | ||||
Work in process | 130.3 | 127.2 | ||||||
Finished goods | 467.2 | 532.0 | ||||||
Total | $ | 768.2 | $ | 846.4 | ||||
At December 31, 2016 and 2015, the Company had $19.3 million and $19.0 million of consignment inventory at locations not operated by the Company, respectively, with approximately 80% of the consignment inventory located in the United States and Canada.
During 2014, the Venezuelan subsidiary recorded $9.5 million of lower of cost or market charges that were recognized within the Cost of sales caption in the Consolidated Statements of Operations and Comprehensive Income (Loss). These charges are due to translation of local sales at higher foreign currency exchange rates that are subject to sales price caps under the new price controls law while the Company's cost for the copper component of its inventory is based on copper purchases at rates lower than the rates used to translate the financial results at the Company's Venezuela subsidiary. Therefore, management reduced Venezuela's inventory value to expected sales price (market value), which was lower than the recorded cost basis. Refer to Note 2 - Summary of Significant Accounting Policies for more information regarding the Company's Venezuelan operations.
7. Property, Plant and Equipment
Property, plant and equipment consisted of the following (in millions):
Dec 31, 2016 | Dec 31, 2015 | ||||||
Land | $ | 44.7 | $ | 50.0 | |||
Buildings and leasehold improvements | 206.5 | 206.3 | |||||
Machinery, equipment and office furnishings | 714.4 | 786.0 | |||||
Construction in progress | 53.5 | 26.3 | |||||
Total — gross book value | 1,019.1 | 1,068.6 | |||||
Less accumulated depreciation | (489.8 | ) | (505.4 | ) | |||
Total — net book value | $ | 529.3 | $ | 563.2 | |||
Depreciation expense totaled $75.8 million, $84.1 million and $110.1 million for the years ended December 31, 2016, 2015 and 2014, respectively.
The 2016, 2015 and 2014 asset impairment tests below incorporate Level 3 inputs in determining the fair value of the underlying assets. Development of estimates of fair values in these circumstances is complex and is dependent upon, among other factors, the nature of potential sales transactions, if any, composition of assets, comparability to market transactions, negotiations with third party purchasers, etc. Such factors bear directly on the range of potential fair values and the selection of the best estimates. Refer to Note 21 - Fair Value for additional details regarding valuation techniques used to determine fair value.
2016 China Asset Impairment
In the fourth quarter of 2016, the Company updated its strategic path forward based on the current business environment and economic challenges. As a result, the performance of the business is anticipated to deteriorate such that the updated internal projections, using a probability weighted-average approach, indicated that the undiscounted expected future cash flows were less than the carrying value of the assets. A valuation of the China machinery and equipment and real property assets was performed; based on the results of the analysis, the Company recorded an impairment charge of $11.0 million in the fourth quarter of 2016. The impairment charge was recorded in the Cost of sales caption in the Consolidated Statements of Operations and Comprehensive Income (Loss). The results of the China business are reported within the Africa/Asia Pacific reportable segment.
2016 Egypt Asset Impairment
In the first quarter of 2016, the Egyptian financial outlook, including anticipated cash flows from potential sales transactions, deteriorated due to evolving political and macroeconomic conditions in Egypt. Using a probability weighted-average approach,
70
based on updated internal projections developed by management, the Company determined that the undiscounted expected future cash flows were less than the carrying value of the assets. A valuation of the Egypt machinery and equipment and real property assets was performed; based on the results of the analysis, the Company recorded an impairment charge of $6.0 million in the first quarter of 2016. The impairment charge was recorded in the Cost of sales caption in the Consolidated Statements of Operations and Comprehensive Income (Loss). The Egyptian results are reported within the Africa/Asia Pacific reportable segment.
2015 India Asset Impairment
In the third quarter of 2015, anticipated cash flows from potential sales transactions deteriorated. Using a probability weighted-average approach, based on internal financial projections developed by management and non-binding sale offers, the Company determined that the undiscounted expected future cash flows were less than the carrying value of the assets. A valuation of the India machinery and equipment and real property assets was performed. Based on the results of the analysis, the Company recorded an impairment charge of $13.6 million in the third quarter of 2015. The impairment charge was recorded in the Cost of sales caption in the Consolidated Statements of Operations and Comprehensive Income (Loss). The results of the Company's India operations are reported within the Africa/Asia Pacific reportable segment.
2015 Algeria Asset Impairment
In the fourth quarter of 2015, the Algerian financial outlook deteriorated due to a significant decline in the oil and gas market, which is a major component of the Algerian economy. Based on updated internal projections developed by management, the Company determined that the undiscounted expected future cash flows were less than the carrying value of the assets. Based on the results of the analysis, the Company recorded an impairment charge of $30.7 million in the fourth quarter of 2015. The impairment charge was recorded in the Cost of sales caption in the Consolidated Statements of Operations and Comprehensive Income (Loss). The Algerian results are reported within the Africa/Asia Pacific reportable segment.
2014 Venezuela Asset Impairment
Effective December 31, 2014, the Company expected that the majority of its Venezuelan subsidiary’s net monetary assets would be remeasured at the SICAD 2 rate since that was the rate the Company believed to be applicable for future dividend remittances. Due to the changes in the rate used to remeasure the financial statements of the Venezuelan subsidiary, the Company's estimated future operating results were determined to be lower than historical and previously projected future profit levels. The Company developed its internal forward business plans and 2015 outlook to determine the undiscounted expected future cash flows derived from the Venezuela long-lived assets. Based on the internal projections developed by management, the Company determined that the undiscounted expected future cash flows were less than the carrying value of the assets. Based on the results of the analysis, the Company recorded an impairment charge of $29.3 million in the fourth quarter of 2014. The impairment charge was recorded in the Cost of sales caption in the Consolidated Statements of Operations and Comprehensive Income (Loss). The results of the Company's Venezuela operations are reported within the Latin America reportable segment. Refer to Note 2 - Summary of Significant Accounting Policies for more information regarding the Company's Venezuelan operations.
2014 India Asset Impairment
In the second quarter of 2014, the Indian financial outlook deteriorated. Based on updated internal projections developed by management, the Company determined that the undiscounted expected future cash flows were less than the carrying value of the assets. The Company performed an asset impairment recoverability analysis in accordance with ASC 360. Based on the results of the analysis, the Company recorded an impairment charge of $16.5 million in the second quarter of 2014. The impairment charge was recorded in the Cost of sales caption in the Consolidated Statements of Operations and Comprehensive Income (Loss). The results of the Company's India operations are reported within the Africa/Asia Pacific reportable segment.
2014 Brazil Rod Mill Asset Impairment
The Brazil rod mill results are reported within the Latin America reportable segment. In the second half of 2014, the Company announced its intent to shut down the Brazil rod mill due to changes in the supply market. The change in the supply market was deemed a significant adverse change in the manner in which the Brazil rod mill would operate resulting in a change in the defined asset group. The asset group was deemed impaired as it no longer provided future benefits to the Company. Based on the results of the analysis, the Company recorded an impairment charge of $13.1 million in the year ended December 31, 2014. The impairment charge was recorded in the Cost of sales caption in the Consolidated Statements of Operations and Comprehensive Income (Loss).
71
8. Goodwill and Other Intangible Assets, net
The amounts of goodwill and indefinite-lived intangible assets were as follows (in millions):
Goodwill | Indefinite-lived intangible assets — Trade names | ||||||||||||||||||||||||||
North America | Latin America | Africa/Asia Pacific | Total | North America | Europe | Total | |||||||||||||||||||||
Balance, December 31, 2014 | $ | 17.0 | $ | 3.0 | $ | 6.1 | $ | 26.1 | $ | 0.3 | $ | 0.4 | $ | 0.7 | |||||||||||||
Currency translation and other adjustments | (0.5 | ) | 0.9 | (0.4 | ) | — | — | — | — | ||||||||||||||||||
Goodwill and indefinite-lived asset impairment | — | — | (3.9 | ) | (3.9 | ) | — | — | — | ||||||||||||||||||
Balance, December 31, 2015 | $ | 16.5 | $ | 3.9 | $ | 1.8 | $ | 22.2 | $ | 0.3 | $ | 0.4 | $ | 0.7 | |||||||||||||
Currency translation and other adjustments | (1.0 | ) | — | (0.2 | ) | (1.2 | ) | 0.4 | — | 0.4 | |||||||||||||||||
Goodwill and indefinite-lived asset impairment | (7.4 | ) | — | (1.6 | ) | (9.0 | ) | (0.3 | ) | — | (0.3 | ) | |||||||||||||||
Balance, December 31, 2016 | $ | 8.1 | $ | 3.9 | $ | — | $ | 12.0 | $ | 0.4 | $ | 0.4 | $ | 0.8 | |||||||||||||
At December 31, 2016, the total accumulated goodwill impairment charge within the North America segment was $7.4 million prior to foreign currency translation adjustments. At December 31, 2016 and 2015, the total accumulated goodwill impairment charge within the Latin America segment was $82.6 million prior to foreign currency translation adjustments. At December 31, 2016 and 2015, the total accumulated goodwill impairment charge within the Africa / Asia Pacific segment was $77.4 million and $75.8 million, respectively, prior to foreign currency translation adjustments. At December 31, 2016 and 2015, the total accumulated indefinite-lived asset trade name impairment loss was $2.1 million, prior to foreign currency translation adjustments, within the North America segment, $68.9 million, prior to foreign currency translation adjustments, within the Latin America segment and $24.2 million, prior to foreign currency translation adjustments, within the Africa / Asia Pacific segment.
The amounts of other intangible assets were as follows (in millions):
Dec 31, 2016 | Dec 31, 2015 | ||||||
Amortized intangible assets: | |||||||
Amortized intangible assets | $ | 108.9 | $ | 129.4 | |||
Accumulated amortization | (85.0 | ) | (87.9 | ) | |||
Foreign currency translation adjustment | (5.2 | ) | (5.6 | ) | |||
Total Amortized intangible assets | $ | 18.7 | $ | 35.9 | |||
Amortized intangible assets are stated at cost less accumulated amortization as of December 31, 2016 and 2015. Amortized intangible assets have been determined to have a useful life in the range of 7 to 12 years. The approximate weighted average useful life of the amortized intangible assets is 10 years. For customer relationships, the Company has accelerated the amortization expense to align with the historical customer attrition rates. All other amortized intangible assets are amortized on a straight-line basis. The amortization of intangible assets in 2016, 2015 and 2014 was $8.6 million, $11.6 million, and $14.0 million, respectively. The estimated amortization expense for the next five years in millions of dollars is: 2017 — $5.3 million, 2018 — $2.8 million, 2019 — $2.7 million, 2020 — $2.7 million, 2021 — $2.7 million and $2.5 million thereafter.
The Company capitalizes costs for internal use software incurred during the application development stage. Costs related to preliminary project activities and post implementation activities are expensed as incurred. Capitalized software will be amortized once the product is ready for its intended use, using the straight-line method over the estimated useful lives of the assets, which is three years.
2014 Goodwill and Indefinite-lived Intangible Impairment Testing
Goodwill and intangible assets with indefinite useful lives are not amortized, but are reviewed at least annually for impairment. The Company completes its annual impairment test during the fourth quarter of each year. In addition, the Company evaluates the carrying amount between such annual valuations if events occur or circumstances change that would more likely than not reduce the fair value of the reporting unit below its carrying amount. Events or circumstances may include, but are not limited to, a significant change in legal factors or in the business climate, adverse action or assessment by a regulator, unanticipated competition, loss of key personnel, possible sale or disposal of a reporting unit or a significant portion of a reporting unit, significant changes in financial projections or significant changes in the market capitalization. In the first quarter of 2014, the following events occurred which represented changes in the fair value of the PDIC reporting unit and caused the Company to perform an interim goodwill and intangible asset impairment test:
72
• | Except certain cost of sales related to copper inventory, all of the Venezuelan subsidiary's BsF denominated revenues and expenses for future periods were to reflect remeasurement using the SICAD 1 rate versus the prior official rate of 6.30 BsF per U.S. dollar. Due to this, the Company's estimated future operating results were determined to be lower than historical and previously projected future profit levels. Refer to Note 2 - Summary of Significant Accounting Policies for more information regarding the Company's Venezuelan operations. |
• | In the first quarter of 2014, the Venezuelan President used decree power to pass the Law of Costs, Earnings, and Fair Profits, which became effective in January 2014, authorizing, among other things, the Venezuelan government to set maximum pricing limits in the private sector. Therefore, the majority of the Company’s product portfolio in Venezuela became subject to price controls, which restricted the Company’s ability to increase prices more than 30% higher than product costs. Until this law would be removed or revised to allow for a higher level of pricing, the Venezuelan operating profit margin was expected to be lower than historical and previously projected future profit levels. In addition, ongoing labor negotiations and expected continuing social unrest in Venezuela were expected to result in lower than historical and previously projected future profit levels. Refer to Note 2 - Summary of Significant Accounting Policies for more information regarding the Company's Venezuelan operations. |
• | During the first quarter of 2014, the Company experienced a significant decline in its stock price, resulting in the Company’s market capitalization falling below its book value. |
Based upon the combination of the above factors, the Company concluded that goodwill impairment indicators existed as of March 28, 2014, and performed an interim goodwill impairment analysis. The Company engaged an outside valuation firm to assist in valuing the Company’s reporting unit and preparing the goodwill impairment analysis. To determine the fair value of the reporting unit (Level 3), the Company employed an income and market-based approach with each being weighted equally. Under the income approach, the Company used a discounted cash flow method to calculate the fair value based on the present value of estimated future cash flows. Assumptions used in the discounted cash flow method, such as forecasted operating results, expected growth rates, working capital needs, tax rates, and cost of capital, were based on the then current market conditions and were consistent with internal management projections. The cost of capital rate selected was based on consideration of the risks inherent in the investment and market rates of return available from alternative investments of similar type and quality as of the valuation date. The guideline public company method was used for the market approach. The approach provided an estimate of value using multiples of earnings derived from the market values of publicly traded companies in the wire and cable industry. In addition to the selection of guideline companies, the market approach included an analysis of the Company’s financial and operating performance risk, profitability, and growth as compared to the reporting unit.
The Company performed the first step (“Step 1”) of the goodwill impairment assessment at March 28, 2014. In Step 1 of the goodwill impairment test, the Company compared the fair value of the reporting unit, to its carrying amount, including goodwill of $154.5 million. Based on the results of the valuation, the carrying amount of the reporting unit exceeded the fair value. Based on the results of Step 1 of the impairment analysis and the preliminary results of Step 2, the Company believed that an impairment loss was probable and based on a preliminary estimate, after consultation with a third party valuation specialist, the Company recognized impairment charges equal to the total recorded PDIC goodwill of $82.9 million and $72.2 million in the Latin America and Africa/Asia Pacific reportable segments, respectively. The impairment charge was recorded in the goodwill impairment charge caption in the Consolidated Statements of Operations and Comprehensive Income (Loss).
In the second quarter of 2014, the Company completed Step 2 of the goodwill impairment test ("Step 2") to determine if any adjustment to the goodwill impairment charge was required. The Step 2 analysis required the Company to perform a theoretical purchase price allocation for the reporting unit to determine the implied fair value of goodwill and to compare the implied fair value of goodwill to the recorded amount of goodwill. Based on the analysis, no modification of the initial impairment estimate was required in the second quarter of 2014.
Based on the decrease of our cash flow projections for the PDIC reporting unit, the Company also completed an impairment test for the trade name in the first quarter of 2014. The fair value of the trade name was based on the discounted cash flows the trade name could be expected to generate in the future. Based on the results of the valuation, the carrying amount of the trade name exceeded the fair value. The impairment valuation resulted in $69.1 million and $24.3 million of impairment charges in the first quarter related to the PDIC trade name in the Latin America and Africa/Asia Pacific reportable segments, respectively. The impairment charge was recorded in the intangible asset impairment charges caption in the Consolidated Statements of Operations and Comprehensive Income (Loss). In the second quarter of 2014 in connection with the completion of the above mentioned Step 2 analysis, the Company reassessed the remaining life of the PDIC trade name and concluded it was no longer indefinite. In the second quarter, the Company reclassified the PDIC trade name to a definite-lived asset with an estimated remaining life of 10 years based on increased political and economic instability in countries in which the trade name is utilized.
73
9. Accrued Liabilities
Accrued liabilities consisted of the following (in millions):
Dec 31, 2016 | Dec 31, 2015 | ||||||
Payroll related accruals | $ | 79.1 | $ | 85.8 | |||
Customers deposits and prepayments | 63.6 | 81.3 | |||||
Taxes other than income | 20.0 | 20.1 | |||||
Customer rebates | 29.4 | 31.5 | |||||
Insurance claims and related expenses | 13.4 | 15.4 | |||||
Current income tax liabilities | 4.8 | 6.4 | |||||
Restructuring reserve | 23.7 | 15.0 | |||||
SEC and DOJ settlements | 82.3 | 28.0 | |||||
Other accrued liabilities | 103.3 | 69.0 | |||||
Total | $ | 419.6 | $ | 352.5 | |||
74
10. Long-Term Debt
(in millions) | Dec 31, 2016 | Dec 31, 2015 | ||||||
North America | ||||||||
5.75% Senior Notes due 2022 ("5.75% Senior Notes") | $ | 600.0 | $ | 600.0 | ||||
Subordinated Convertible Notes due 2029 ("Subordinated Convertible Notes") | 429.5 | 429.5 | ||||||
Debt discount | (255.6 | ) | (257.8 | ) | ||||
Debt issuance costs | (10.6 | ) | (12.1 | ) | ||||
Asset-Based Revolving Credit Facility ("Revolving Credit Facility") | 75.9 | 127.6 | ||||||
Other | 9.0 | 9.2 | ||||||
Europe | ||||||||
Revolving Credit Facility | — | 8.7 | ||||||
Other | 7.4 | 23.4 | ||||||
Latin America credit facilities | 82.4 | 113.8 | ||||||
Africa/Asia Pacific credit facilities | 0.6 | 37.4 | ||||||
Total debt | 938.6 | 1,079.7 | ||||||
Less current maturities | 67.5 | 168.1 | ||||||
Long-term debt | $ | 871.1 | $ | 911.6 | ||||
At December 31, 2016, maturities of long-term debt during the twelve month periods beginning December 31, 2017 through December 31, 2021 and thereafter were $67.5 million, $88.7 million, $8.3 million, $0.7 million and $1.1 million, respectively, and $772.3 million thereafter.
The fair value of the Company's long-term debt, as noted below, was estimated using observable quoted prices as well as inputs other than quoted prices that are observable, either directly or indirectly.
5.75% Senior Notes due 2022
The Company's 5.75% Senior Notes are summarized in the table below:
5.75% Senior Notes | |||||||
(in millions) | December 31, 2016 | December 31, 2015 | |||||
Face Value | $ | 600.0 | $ | 600.0 | |||
Debt issuance costs | (7.0 | ) | (8.2 | ) | |||
Book value | 593.0 | 591.8 | |||||
Fair Value (Level 1) | 579.0 | 450.0 | |||||
Stated Interest Rate | 5.75 | % | 5.75 | % | |||
Interest Payment | Semi-Annual: Apr 1 & Oct 1 | ||||||
Maturity Date | October 2022 | ||||||
Guarantee | Jointly and severally guaranteed by the Company's wholly owned U.S. subsidiaries | ||||||
5.75% Senior Notes | |||
Beginning Date | Percentage | ||
Call Option (1) | October 1, 2017 | 102.875 | % |
October 1, 2018 | 101.917 | % | |
October 1, 2019 | 100.958 | % | |
October 1, 2020 and thereafter | 100.000 | % | |
(1) | The Company may, at its option, redeem the 5.75% Senior Notes on or after the stated beginning dates at percentages noted above (plus accrued and unpaid interest). Additionally, on or prior to October 1, 2015, the Company had the right to redeem in the aggregate up to 35% of the aggregate principal amount of 5.75% Senior Notes issued with the cash proceeds from one or more equity offerings, at a redemption price in cash equal to 105.75% of the principal plus accrued and unpaid interest so long as (i) at least 65% of the aggregate principal amount of the 5.75% Senior Notes issued remained outstanding immediately after giving effect to any such redemption; and (ii) notice of any such redemption was given within 60 days after the date of the closing of any such equity |
75
offering. In addition, at any time prior to October 1, 2017, the Company may redeem some or all of the 5.75% Senior Notes at a redemption price equal to 100% of the principal amount plus accrued and unpaid interest, plus a make whole premium.
The 5.75% Senior Notes' indenture contains covenants that limit the ability of the Company and certain of its subsidiaries to (i) incur additional indebtedness and guarantee indebtedness; (ii) pay dividends or make other distributions or repurchase or redeem the Company's capital stock; (iii) purchase, redeem or retire debt; (iv) issue certain preferred stock or similar equity securities; (v) make loans and investments; (vi) sell assets; (vii) incur liens; (viii) enter into transactions with affiliates; (ix) enter into agreements restricting the Company's subsidiaries' ability to pay dividends; and (x) consolidate, merge or sell all or substantially all assets. However, these covenants are subject to exceptions and qualifications.
The 5.75% Senior Notes may also be repurchased at the option of the holders in connection with a change of control (as defined in the indenture governing the 5.75% Senior Notes) or in connection with certain asset sales.
Subordinated Convertible Notes
The Company’s Subordinated Convertible Notes due 2029 outstanding as of December 31, 2016 and 2015 are as follows:
Subordinated Convertible Notes Due 2029 | ||||||||
(in millions) | Dec 31, 2016 | Dec 31, 2015 | ||||||
Face value | $ | 429.5 | $ | 429.5 | ||||
Debt discount | (255.6 | ) | (257.8 | ) | ||||
Debt issuance costs | (3.6 | ) | (3.9 | ) | ||||
Book value | 170.3 | 167.8 | ||||||
Fair value (Level 1) | 343.8 | 265.8 | ||||||
Maturity date | Nov 2029 | |||||||
Stated annual interest rate | 4.50% until Nov 2019 2.25% until Nov 2029 | |||||||
Interest payments | Semi-annually: May 15 & Nov 15 | |||||||
The Company’s Subordinated Convertible Notes were issued on December 18, 2009 in the amount of $429.5 million. The notes and the common stock issuable upon conversion were registered on a Registration Statement on Form S-4, initially filed with the SEC on October 27, 2009, as amended and as declared effective by the SEC on December 18, 2009. At issuance, the Company separately accounted for the liability and equity components of the instrument, based on the Company’s nonconvertible debt borrowing rate on the instrument’s issuance date of 12.5%. At issuance, the liability and equity components were $162.9 million and $266.6 million, respectively. The equity component (debt discount) is being amortized to interest expense based on the effective interest method. The Subordinated Convertible Notes were issued to complete an exchange offer; therefore, all proceeds were used to extinguish the Company's previously held 1.00% Senior Convertible Notes due 2012. The Company incurred issuance fees and expenses of approximately $14.5 million as a result of the exchange offer which have been proportionately allocated to the liability and equity components of the new subordinate notes due in 2029. Additional terms have been summarized in the table below.
76
The Company’s Subordinated Convertible Notes and terms are summarized in the tables below. For a discussion of the effects on earnings per share, refer to Note 17 - Earnings Per Common Share.
Subordinated Convertible Notes due 2029 (1) | ||
Conversion Rights — The notes are convertible at the option of the holder into the Company’s common stock upon the occurrence of certain events, including | (i) during any calendar quarter commencing after March 31, 2010, in which the closing price of the Company’s common stock is greater than or equal to 130% of the conversion price for at least 20 trading days during the period of 30 consecutive trading days ending on the last trading day of the preceding calendar quarter (establishing a contingent conversion price of $47.78); | |
(ii) during any five business day period after any five consecutive trading day period in which the trading price per $1,000 principal amount of the notes for each day of that period is less than 98% of the product of the closing sale price of the Company’s common stock and the applicable conversion rate; | ||
(iii) certain distributions to holders of the Company’s common stock are made or upon specified corporate transactions including a consolidation or merger; | ||
(iv) a fundamental change as defined; | ||
(v) at any time during the period beginning on August 31, 2029 and ending on the close of business on the business day immediately preceding the stated maturity date; and | ||
(vi) on or after November 15, 2019, the Company may redeem all or a part of the notes for cash at a price equal to 100% of the principal amount of the notes, plus interest, if the price of the Company's common stock has been at least 150% of the conversion price then in effect for at least 20 trading days during the 30 consecutive trading day period immediately preceding the date on which notice is given. | ||
Initial conversion rate | $36.75 per share — approximating 27.2109 shares per $1,000 principal amount of notes | |
Upon conversion | A holder will receive, in lieu of common stock, an amount of cash equal to the lesser of (i) the principal amount of the notes, or (ii) the conversion value, determined in the manner set forth in the indenture governing the notes, of a number of shares equal to the conversion rate. | |
If the conversion value exceeds the principal amount of the notes on the conversion date, the Company will also deliver, at the Company’s election, cash or common stock or a combination of cash and common stock with respect to the conversion value upon conversion. | ||
If conversion occurs in connection with a “fundamental change” as defined in the notes indenture, the Company may be required to repurchase the notes for cash at a price equal to the principal amount plus accrued but unpaid interest. | ||
If conversion occurs in connection with certain changes in control, the Company may be required to deliver additional shares of the Company’s common stock (a “make whole” premium) by increasing the conversion rate with respect to such notes. | ||
Share issuable upon conversion | The Company may issue additional shares up to 11,686,075 under almost all conditions and up to 14,315,419 under the “make-whole” premium | |
Guarantee | None | |
(1) | In the event of a “fundamental change” or exceeding the aforementioned average pricing thresholds, the Company would be required to classify the amount outstanding as a current liability. |
77
Revolving Credit Facility
On July 21, 2011, the Company entered into a $400 million Revolving Credit Facility, which was first amended in 2012 to increase the facility size to $700 million and then subsequently amended and restated on September 6, 2013 and further amended on October 22, 2013, May 20, 2014, September 23, 2014, October 28, 2014 and February 9, 2016, to, among other things, increase the Revolving Credit Facility to $1.0 billion. The Revolving Credit Facility was subsequently amended effective November 15, 2016 to decrease the facility size to $700 million, $441 million of which may be borrowed by the U.S. borrower, $210 million of which may be borrowed by the European borrowers and $49 million of which may be borrowed by the Canadian borrower. The Revolving Credit Facility contains restrictions including limitations on, among other things, distributions and dividends, acquisitions and investments, indebtedness, liens and affiliate transactions. The Revolving Credit Facility provides the Company with financial flexibility such that restrictions in the Revolving Credit Facility generally only apply in the event that undrawn availability under the Revolving Credit Facility falls below certain specific thresholds.
The Revolving Credit Facility has a maturity date of September 6, 2018. The commitment amount under the Revolving Credit Facility may be increased by an additional $250 million, subject to certain conditions and approvals as set forth in the Revolving Credit Facility. The Revolving Credit Facility requires maintenance of a minimum fixed charge coverage ratio of 1.00 to 1.00 if availability under the Revolving Credit Facility is less than the greater of $100 million or 10% of the then existing aggregate lender commitment under the Revolving Credit Facility. As of December 31, 2016, the availability under the Revolving Credit Facility is greater than $100 million. The fair value of the Revolving Credit Facility approximates the carrying value based on Level 2 inputs based on the short-term and asset-based nature of the Revolving Credit Facility and the related variable interest rate.
Indebtedness under the Revolving Credit Facility is secured by: (a) for US borrowings under the facility, a first priority security interest in substantially all of our domestic assets and, (b) for Canadian and European borrowings under the facility, a first priority security interest in substantially all of our domestic and Canadian assets and certain assets of our Spanish, French and German subsidiaries party to the facility. In addition, the lenders under the Revolving Credit Facility have received a pledge of (i) 100% of the equity interests in substantially all of the Company's domestic subsidiaries, and (ii) 65% of the voting equity interests in and 100% of the non-voting equity interests in certain of our foreign subsidiaries, including our Canadian subsidiaries and our Spanish, French and German subsidiaries party to the Revolving Credit Facility. Borrowings under the Revolving Credit Facility bear interest at interest rate bases elected by the Company plus an applicable margin calculated quarterly based on the Company's average availability and Total Consolidated Leverage Ratio as set forth in the credit agreement. The Revolving Credit Facility also requires the payment of a commitment fee equal to the available but unused commitments multiplied by an applicable margin of either 0.25% or 0.375% based on the average daily unused commitments.
The Company's Revolving Credit Facility is summarized in the table below:
Revolving Credit Facility | |||||||
(in millions) | Dec 31, 2016 | Dec 31, 2015 | |||||
Outstanding borrowings | $ | 75.9 | $ | 136.3 | |||
Total credit under facility | 700.0 | 1,000.0 | |||||
Undrawn availability(1) | 399.0 | 347.5 | |||||
Interest rate | 2.5 | % | 2.5 | % | |||
Outstanding letters of credit | $ | 21.7 | $ | 36.7 | |||
Original issuance | Jul 2011 | ||||||
Maturity date | Sept 2018 | ||||||
(1) Total undrawn availability for the U.S. borrower, the Canadian borrower and the European borrowers at December 31, 2016 is $265.0 million, $36.6 million and $97.4 million, respectively. Total undrawn availability for the U.S. borrower, the Canadian borrower and the European borrowers at December 31, 2015 is $239.1 million, $34.8 million and $73.6 million, respectively.
78
Latin America Credit Facilities
The Company’s Latin America credit facilities are summarized in the table below:
(in millions) | Dec 31, 2016 | Dec 31, 2015 | ||||||
Outstanding borrowings | $ | 82.4 | $ | 113.8 | ||||
Undrawn availability | 38.2 | 44.4 | ||||||
Interest rate — weighted average | 11.0 | % | 8.6 | % | ||||
Maturity date | Various; $63.9 million due within one year | |||||||
The Company’s Latin America credit facilities are primarily short term loans utilized for working capital purposes. The fair value of the Latin America credit facilities approximates the carrying value due to the short term nature and variable interest rates of the facilities based on Level 2 inputs. In the first quarter 2017, the Company paid $26.0 million related to the Latin America credit facilities.
Africa/Asia Pacific Credit Facilities
The Company’s Africa/Asia Pacific credit facilities are summarized in the table below:
(in millions) | Dec 31, 2016 | Dec 31, 2015 | ||||||
Outstanding borrowings | $ | 0.6 | $ | 37.4 | ||||
Undrawn availability | 11.2 | 85.8 | ||||||
Interest rate — weighted average | 8.5 | % | 6.5 | % | ||||
Maturity date | Various; $0.6 million due within one year | |||||||
The Company’s Africa/Asia Pacific credit facilities are short term loans utilized for working capital purposes. The fair value of the Africa/Asia Pacific credit facilities approximates the carrying value due to the short term nature and variable interest rates of the facilities based on Level 2 inputs.
79
11. Financial Instruments
The Company is exposed to various market risks, including changes in interest rates, foreign currency exchange rates and raw material (commodity) prices. To manage risks associated with the volatility of these natural business exposures, the Company enters into commodity and foreign currency derivative agreements, as well as copper and aluminum forward pricing agreements. The Company does not purchase or sell derivative instruments for trading purposes. The Company does not engage in derivative contracts for which a lack of marketplace quotations would necessitate the use of fair value estimation techniques.
The Company enters into commodity instruments to hedge the purchase of copper, aluminum and lead in future periods and foreign currency exchange contracts principally to hedge the currency fluctuations in certain transactions denominated in foreign currencies, thereby limiting the Company's risk that would otherwise result from changes in exchange rates. Principal transactions hedged during the year were firm sales and purchase commitments. The fair value of foreign currency contracts represents the amount required to enter into offsetting contracts with similar remaining maturities based on quoted market prices.
The Company accounts for these commodity instruments and foreign currency exchange contracts as economic hedges. Changes in the fair value of economic hedges are recognized in current period earnings.
Fair Value of Derivatives Instruments
The notional amounts and fair values of derivatives not designated as cash flow hedges at December 31, 2016 and 2015 are shown below (in millions).
December 31, 2016 | December 31, 2015 | ||||||||||||||||||||||
Notional | Fair Value | Notional | Fair Value | ||||||||||||||||||||
(in millions) | Amount | Asset (1) | Liability (2) | Amount | Asset (1) | Liability (2) | |||||||||||||||||
Derivatives not designated as cash flow hedges: | |||||||||||||||||||||||
Commodity futures | $ | 142.5 | $ | 9.2 | $ | 1.8 | $ | 133.5 | $ | 0.3 | $ | 9.9 | |||||||||||
Foreign currency exchange | 30.7 | 0.1 | 1.1 | 88.1 | 0.6 | 2.4 | |||||||||||||||||
$ | 9.3 | $ | 2.9 | $ | 0.9 | $ | 12.3 | ||||||||||||||||
(1) | Balance recorded in “Prepaid expenses and other” and “Other non-current assets” |
(2) | Balance recorded in “Accrued liabilities” and “Other liabilities” |
As of December 31, 2016 and 2015, all financial instruments held by the Company were subject to enforceable master netting arrangements held by various financial institutions. In general, the terms of our agreements provide that in the event of an early termination the counterparties have the right to offset amounts owed or owing under that and any other agreement with the same counterparty. The Company's accounting policy is to not offset these positions in the Consolidated Balance Sheets. As of December 31, 2016 and 2015, the net positions of the enforceable master netting agreements are not significantly different from the gross positions noted in the table above. Depending on the extent of an unrealized loss position on a derivative contract held by the Company, certain counterparties may require collateral to secure the Company's derivative contract position. As of December 31, 2016 and 2015, there were no contracts held by the Company that required collateral to secure the Company’s derivative liability positions. Refer to Note 5 - Other Income (Expense) for more information.
80
12. Income Taxes
For financial reporting purposes, income before income taxes includes the following components (in millions):
Year Ended | |||||||||||
Dec 31, 2016 | Dec 31, 2015 | Dec 31, 2014 | |||||||||
United States | $ | (72.4 | ) | $ | (30.2 | ) | $ | (5.1 | ) | ||
Foreign | (25.7 | ) | (120.9 | ) | (631.0 | ) | |||||
Total | $ | (98.1 | ) | $ | (151.1 | ) | $ | (636.1 | ) | ||
The provision (benefit) for income taxes consisted of the following (in millions):
Year Ended | |||||||||||
Dec 31, 2016 | Dec 31, 2015 | Dec 31, 2014 | |||||||||
Current tax expense (benefit): | |||||||||||
Federal | $ | 0.6 | $ | (0.2 | ) | $ | (7.4 | ) | |||
State | (0.2 | ) | (1.1 | ) | 0.5 | ||||||
Foreign | 18.6 | 10.9 | 29.6 | ||||||||
Deferred tax expense (benefit): | |||||||||||
Federal | (26.9 | ) | (20.1 | ) | 15.1 | ||||||
State | (1.0 | ) | (0.5 | ) | 0.7 | ||||||
Foreign | 5.2 | (3.8 | ) | (30.2 | ) | ||||||
Total | $ | (3.7 | ) | $ | (14.8 | ) | $ | 8.3 | |||
The reconciliation of reported income tax expense (benefit) to the amount of income tax expense that would result from applying domestic federal statutory tax rates to pretax income is as follows (in millions):
Year Ended | |||||||||||
Dec 31, 2016 | Dec 31, 2015 | Dec 31, 2014 | |||||||||
Income tax expense (benefit) at Federal statutory tax rate | $ | (34.3 | ) | $ | (52.9 | ) | $ | (222.6 | ) | ||
Foreign tax rate differential | 2.5 | 13.2 | 30.6 | ||||||||
Nondeductible / nontaxable items(1) | 1.5 | 2.8 | 96.4 | ||||||||
Impact of divestitures and liquidations (net of valuation allowances) | (9.0 | ) | (14.2 | ) | 3.9 | ||||||
Change in uncertain tax positions | 9.0 | (8.8 | ) | (10.0 | ) | ||||||
Withholding tax and surcharges | 3.0 | 4.3 | 5.8 | ||||||||
Change in valuation allowance | 26.8 | 39.0 | 98.1 | ||||||||
Other (net) | (3.2 | ) | 1.8 | 6.1 | |||||||
Total | $ | (3.7 | ) | $ | (14.8 | ) | $ | 8.3 | |||
(1) For the year ended December 31, 2014, the major components consist of $40.5 million for goodwill impairments, $8.4 million for the FCPA accrual and $78.1 million for non-deductible Venezuela devaluation and functional currency adjustments, partially offset by $32.9 million for Venezuela inflation adjustments.
81
The components of deferred tax assets and liabilities were as follows (in millions):
Dec 31, 2016 | Dec 31, 2015 | ||||||
Deferred tax assets: | |||||||
Net operating loss carryforwards | $ | 238.7 | $ | 160.8 | |||
Pension and retiree benefits accruals | 33.5 | 36.3 | |||||
Inventory | 9.4 | 8.2 | |||||
Depreciation and fixed assets | 11.7 | 12.9 | |||||
Intangibles | 3.3 | 2.8 | |||||
Tax credit carryforwards | 10.3 | 8.8 | |||||
Equity compensation | 16.2 | 21.5 | |||||
Other | 53.3 | 76.5 | |||||
Valuation allowance | (177.1 | ) | (172.1 | ) | |||
Total deferred tax assets | 199.3 | 155.7 | |||||
Deferred tax liabilities: | |||||||
Convertible debt discount | 247.0 | 209.2 | |||||
Inventory | 2.4 | 1.0 | |||||
Depreciation and fixed assets | 25.7 | 28.3 | |||||
Intangibles | 4.9 | 7.4 | |||||
Other | 25.6 | 24.4 | |||||
Total deferred tax liabilities | 305.6 | 270.3 | |||||
Net deferred tax assets (liabilities) | $ | (106.3 | ) | $ | (114.6 | ) | |
The valuation of deferred tax assets is dependent on, among other things, the ability of the Company to generate a sufficient level of future taxable income in relevant taxing jurisdictions. In estimating future taxable income, the Company has considered both positive and negative evidence and has considered the implementation of prudent and feasible tax planning strategies. The Company has and will continue to review on a quarterly basis its assumptions and tax planning strategies and, if the amount of the estimated realizable net deferred tax asset is less than the amount currently on the balance sheet, the Company will reduce its deferred tax asset, recognizing a non-cash charge against reported earnings.
As of December 31, 2016, the Company has recorded approximately $177.1 million of valuation allowance to adjust deferred tax assets to the amount judged more likely than not to be realized. The valuation allowance is primarily attributable to certain foreign temporary differences and tax loss and tax credit carryforwards due to uncertainties regarding the ability to obtain future tax benefits for these tax attributes.
As of December 31, 2016, the Company has recognized deferred tax assets of approximately $93.5 million for gross tax loss carryforwards in various taxing jurisdictions as follows (in millions):
Tax Loss | ||||||
Jurisdiction | Carryforward | Expiration | ||||
United States | $ | 229.7 | 2033-2036 | |||
France | 11.6 | Indefinite | ||||
New Zealand | 7.5 | Indefinite | ||||
Angola | 3.4 | 2018-2019 | ||||
Others | 0.9 | Various | ||||
Total | $ | 253.1 | ||||
The Company also has various foreign subsidiaries with approximately $542 million of tax loss carryforwards in various jurisdictions that are subject to a valuation allowance due to statutory limitations on utilization, uncertainty of future profitability, and other relevant factors.
During 2016, after weighing all positive and negative evidence, including three year cumulative loss positions, forecasted future profitability, impairments and restructuring charges, difficult market and industry conditions, and factoring in prudent and feasible tax planning strategies, a valuation allowance was recorded against $6.7 million of beginning of year net deferred tax assets associated with the business unit in China. The business unit did not have a deferred tax valuation allowance prior to 2016. Various other business units maintained full deferred tax asset valuation allowances that had been established in prior years. $20.1 million
82
of tax expense was recorded during 2016 associated with the net increase in valuation allowances against newly created deferred tax assets resulting from operating losses and impairment charges within these units.
In general, it is the practice and intention of the Company to permanently reinvest the earnings of its non-U.S. subsidiaries in those operations. As such, historically, the Company has not provided for deferred income taxes on the excess of financial reporting over tax basis in investments in foreign subsidiaries. These basis differences would become taxable upon the repatriation of assets from the foreign subsidiaries or upon a sale or liquidation of the foreign subsidiaries.
On October 23, 2014, the Company’s Board of Directors authorized a plan to exit all of the Company’s Asia Pacific and African operations. As a result of this plan, the Company can no longer assert that the financial reporting over tax basis in investments in these foreign subsidiaries will never reverse.
As of December 31, 2016, $0.7 million of deferred income tax liabilities were recorded for the excess of financial reporting over tax basis in investments in foreign subsidiaries and equity investees in Asia Pacific and Africa. The $0.7 million of deferred income tax liabilities recorded as of December 31, 2016 relate solely to U.S. and foreign income taxes and foreign withholding taxes that would result from the future divestiture transactions. With respect to certain Asia Pacific and Africa subsidiaries and equity investees with an excess of tax over financial reporting basis, the Company has not recorded deferred tax assets since it is not apparent that these basis differences will reverse in the foreseeable future or yield a future tax benefit even if the basis differences would reverse in the foreseeable future.
During 2016, the Company recorded $0.1 million of income tax expense associated with changes in the outside basis differences of the Asia Pacific and Africa subsidiaries. Deferred taxes have not been recorded for the tax implications of repatriating cash to the U.S. from the sales proceeds of Asia Pacific and African subsidiaries that are not directly owned by the U.S., as it is the Company’s intention to redeploy these cash proceeds in its non-U.S. operations indefinitely rather than repatriating the cash proceeds to the U.S. The additional U.S. income tax and foreign withholding tax that would be incurred upon cash repatriation of the expected sales and/or liquidation proceeds from the entities that are not owned directly by the U.S. would not be material.
In the second quarter of 2016, the Company conducted a review of the cash position and forecasted cash needs of certain Central American distributor entities. The Company had historically asserted that the earnings of these entities would be indefinitely reinvested. As a result of this review and after taking into account financial and geopolitical risks, the Company reassessed the situation and decided to repatriate the earnings of these Central American distributor entities in the near future. As a result of this change in assertion, the Company has recorded a $2.4 million deferred tax expense and associated deferred tax liability to account for the expected tax that would result from repatriation back to the U.S.
The temporary difference associated with the excess of financial reporting over tax basis in investments in all foreign subsidiaries outside of the Asia Pacific and African regions and the above mentioned Central American units is estimated at approximately $370 million as of December 31, 2016. This amount was estimated based on book retained earnings as reduced for retained earnings amounts that have been previously taxed in the U.S. The Company remains committed to permanently reinvesting these earnings and does not see a need to repatriate cash to fund operations, including investing and financing activities, in the foreseeable future. Accordingly, no deferred income taxes have been recorded on the outside basis difference of foreign subsidiaries outside of the Asia Pacific and Africa regions and certain Central American distributor entities. The determination of the additional income taxes that would be incurred upon repatriation of assets or disposition of such foreign subsidiaries is not practical due to the complexities, variables, and assumptions inherent in the hypothetical calculation.
The Company applies ASC 740 in determining unrecognized tax benefits. ASC 740 prescribes a recognition threshold that a tax position is required to meet before being recognized in the financial statements and provides guidance on derecognition, measurement, classification, interest and penalties, accounting in interim periods and disclosures.
The following is a tabular reconciliation of the total amounts of unrecognized tax benefits for the year:
(in millions) | Dec 31, 2016 | Dec 31, 2015 | Dec 31, 2014 | |||||||||
Unrecognized Tax Benefit — Beginning balance | $ | 25.1 | $ | 31.9 | $ | 57.7 | ||||||
Gross Increases — Tax Positions in Prior Period | 1.6 | 2.1 | 1.6 | |||||||||
Gross Decreases — Tax Positions in Prior Period | (0.4 | ) | (0.6 | ) | (0.7 | ) | ||||||
Gross Increases — Tax Positions in Current Period | 11.1 | 2.6 | 7.3 | |||||||||
Dispositions | — | (2.2 | ) | (0.9 | ) | |||||||
Settlements | (0.4 | ) | — | (0.4 | ) | |||||||
Lapse of Statute of Limitations | (3.3 | ) | (5.3 | ) | (12.9 | ) | ||||||
Foreign Currency Translation | (0.3 | ) | (3.4 | ) | (19.8 | ) | ||||||
Unrecognized Tax Benefit — Ending Balance | $ | 33.4 | $ | 25.1 | $ | 31.9 | ||||||
83
Included in the balance of unrecognized tax benefits at December 31, 2016, 2015 and 2014 are $31.0 million, $22.7 million and $29.4 million, respectively, of tax benefits that, if recognized, would affect the effective tax rate.
The Company recognizes interest and penalties related to unrecognized tax benefits as income tax expense. Related to the unrecognized tax benefits noted above, the Company accrued penalties of $0.3 million and interest of $0.3 million during 2016 and in total, as of December 31, 2016, has recognized a liability for penalties of $1.8 million and interest of $2.9 million. During 2015 and 2014, the Company accrued penalties of $(1.4) million and $(1.1) million, respectively, and interest of $(3.0) million and $(0.2) million, respectively, and in total, as of December 31, 2015 and 2014, had recognized liabilities for penalties of $1.8 million and $3.8 million, respectively and interest of $3.5 million and $7.5 million, respectively.
The Company files income tax returns in numerous tax jurisdictions around the world. Due to uncertainties regarding the timing and outcome of various tax audits, appeals and settlements, it is difficult to reliably estimate the amount of unrecognized tax benefits that could change within the next twelve months. The Company believes it is reasonably possible that approximately $3 million of unrecognized tax benefits could change within the next twelve months due to the resolution of tax audits and statute of limitations expirations.
The Internal Revenue Service (“IRS”) proposed cumulative taxable income adjustments of approximately $50 million for the 2012-2013 tax years in February 2016. The proposed adjustments related to the Original Issue Discount (“OID”) yield claimed on the Company’s $429.5 million Subordinated Convertible Notes (“Notes”). The Company believes that the amount of the OID deductions claimed on its federal income tax returns since the 2009 issuance of the Notes is proper and appealed the IRS audit adjustment. The IRS Appeals hearing was held in October 2016 and the Company is awaiting an official response from the IRS Appeals Office. If the IRS were to sustain the proposed adjustment in full, the Company’s OID deductions claimed on the 2014 - 2016 tax returns would also be reduced. The estimated impact on income tax expense and cash taxes would not be material due to the Company’s tax loss and tax credit carry forward positions.
In February 2017, the Company received notification from the IRS that the 2015 federal income tax return will be examined. With limited exceptions, tax years prior to 2011 are no longer open for examination in major foreign, state, or local tax jurisdictions.
84
13. Employee Benefit Plans
General Cable provides retirement benefits through contributory and noncontributory qualified and non-qualified defined benefit pension plans covering eligible domestic and international employees as well as through defined contribution plans and other postretirement benefits.
Defined Benefit Pension Plans
The changes in the benefit obligation and plan assets, the funded status of the plans and the amounts recognized in the Consolidated Balance Sheets are as follows (in millions):
U.S. Plans | Non-U.S. Plans | ||||||||||||||
Dec 31, 2016 | Dec 31, 2015 | Dec 31, 2016 | Dec 31, 2015 | ||||||||||||
Changes in Benefit Obligation: | |||||||||||||||
Beginning benefit obligation | $ | 175.0 | $ | 191.0 | $ | 115.8 | $ | 151.0 | |||||||
Foreign currency exchange rate changes and other | — | — | 8.5 | (20.8 | ) | ||||||||||
Transfers | — | — | — | (8.1 | ) | ||||||||||
Service cost | 1.4 | 1.5 | 4.2 | 4.9 | |||||||||||
Interest cost | 7.3 | 7.3 | 3.7 | 3.6 | |||||||||||
Curtailment (gain) loss | — | — | (0.8 | ) | (0.3 | ) | |||||||||
Settlements | (19.3 | ) | — | — | (2.7 | ) | |||||||||
Benefits paid | (9.8 | ) | (13.8 | ) | (7.1 | ) | (8.4 | ) | |||||||
Employee contributions | — | — | 0.4 | 0.4 | |||||||||||
Amendments / Change in assumptions | — | (0.1 | ) | (1.3 | ) | 0.1 | |||||||||
Actuarial (gain) loss | (3.0 | ) | (10.9 | ) | 7.3 | (3.9 | ) | ||||||||
Ending benefit obligation | $ | 151.6 | $ | 175.0 | $ | 130.7 | $ | 115.8 | |||||||
Changes in Plan Assets: | |||||||||||||||
Beginning fair value of plan assets | $ | 132.1 | $ | 140.9 | $ | 37.7 | $ | 45.8 | |||||||
Foreign currency exchange rate changes and other | — | — | 10.1 | (7.5 | ) | ||||||||||
Employee contributions | — | — | 0.4 | 0.4 | |||||||||||
Actual return on plan assets | 6.2 | (0.1 | ) | 5.1 | 1.4 | ||||||||||
Company contributions | 3.2 | 5.1 | 6.3 | 8.7 | |||||||||||
Settlements | (19.3 | ) | — | — | (2.7 | ) | |||||||||
Benefits paid | (9.8 | ) | (13.8 | ) | (7.1 | ) | (8.4 | ) | |||||||
Ending fair value of plan assets | $ | 112.4 | $ | 132.1 | $ | 52.5 | $ | 37.7 | |||||||
Funded status at end of year | $ | (39.2 | ) | $ | (42.9 | ) | $ | (78.2 | ) | $ | (78.1 | ) | |||
Amounts Recognized in Consolidated Balance Sheets: | |||||||||||||||
Other Assets | $ | — | $ | — | $ | 1.7 | $ | 2.0 | |||||||
Accrued liabilities | $ | (0.3 | ) | $ | (0.3 | ) | $ | (2.3 | ) | $ | (3.5 | ) | |||
Other liabilities | $ | (38.9 | ) | $ | (42.6 | ) | $ | (77.6 | ) | $ | (76.6 | ) | |||
Recognized in Accumulated Other Comprehensive Income: | |||||||||||||||
Net actuarial loss | $ | 58.9 | $ | 68.8 | $ | 26.9 | $ | 25.4 | |||||||
Prior service cost | (0.2 | ) | (0.2 | ) | 1.2 | 2.0 | |||||||||
$ | 58.7 | $ | 68.6 | $ | 28.1 | $ | 27.4 | ||||||||
85
The accumulated benefit obligation for U.S. defined benefit retirement pension plans was $150.8 million and $174.2 million for 2016 and 2015, respectively. The accumulated benefit obligation for Non-U.S. defined benefit retirement pension plans was $123.3 million and $110.4 million for 2016 and 2015, respectively. Pension plans with accumulated benefit obligations in excess of plan assets consist of the following (in millions):
U.S. Plans | Non-U.S. Plans | ||||||||||||||
Dec 31, 2016 | Dec 31, 2015 | Dec 31, 2016 | Dec 31, 2015 | ||||||||||||
Projected benefit obligation | $ | 151.6 | $ | 175.0 | $ | 102.4 | $ | 100.4 | |||||||
Accumulated benefit obligation | 150.8 | 174.2 | 97.2 | 95.5 | |||||||||||
Fair value of the plan assets | 112.4 | 132.1 | 41.5 | 36.9 | |||||||||||
Pension expense included the following components (in millions):
U.S. Plans Year ended | Non-U.S. Plans Year ended | ||||||||||||||||||||||
Dec 31, 2016 | Dec 31, 2015 | Dec 31, 2014 | Dec 31, 2016 | Dec 31, 2015 | Dec 31, 2014 | ||||||||||||||||||
Pension expense: | |||||||||||||||||||||||
Service cost | $ | 1.4 | $ | 1.5 | $ | 1.6 | $ | 4.2 | $ | 4.9 | $ | 4.6 | |||||||||||
Interest cost | 7.3 | 7.3 | 8.0 | 3.7 | 3.6 | 5.4 | |||||||||||||||||
Expected return on plan assets | (9.2 | ) | (10.2 | ) | (10.4 | ) | (2.9 | ) | (2.4 | ) | (3.1 | ) | |||||||||||
Amortization of prior service cost | — | — | 0.1 | 0.7 | 0.7 | 0.9 | |||||||||||||||||
Amortization of net loss | 2.5 | 7.7 | 4.8 | 1.3 | 1.7 | 0.3 | |||||||||||||||||
Amortization of transition obligation | — | — | — | — | 0.1 | 0.3 | |||||||||||||||||
Curtailment (gain) loss | — | — | (0.1 | ) | (0.2 | ) | — | 0.3 | |||||||||||||||
Settlement loss | 7.4 | — | — | — | 0.9 | 2.7 | |||||||||||||||||
Net pension expense | $ | 9.4 | $ | 6.3 | $ | 4.0 | $ | 6.8 | $ | 9.5 | $ | 11.4 | |||||||||||
The estimated net loss for the defined benefit pension plans that will be amortized from accumulated other comprehensive income into net pension expense over the next fiscal year is $4.0 million. The prior service cost to be amortized from accumulated other comprehensive income into net pension expense over the next fiscal year is $0.6 million.
In 2016, the Company offered a one-time lump sum payment option to deferred vested participants in the U.S. defined benefit pension plan. Lump sum payments were approximately $19.3 million in 2016, which exceeded the settlement threshold, and the Company recorded a pre-tax non-cash settlement loss of approximately $7.4 million for the year ended December 31, 2016.
In 2015, the Company recorded a pre-tax non-cash settlement loss of $0.9 million for the termination of pension plans related to the closure of one North America manufacturing plant.
The Company evaluates its actuarial assumptions at least annually, and adjusts them as necessary. The Company uses a measurement date of December 31 for all of its defined benefit pension plans. The weighted average assumptions used in determining benefit obligations were:
U.S. Plans | Non-U.S. Plans | ||||||||||
Dec 31, 2016 | Dec 31, 2015 | Dec 31, 2016 | Dec 31, 2015 | ||||||||
Discount rate | 4.01 | % | 4.30 | % | 2.55 | % | 2.81 | % | |||
Expected rate of increase in future compensation levels | 2.50 | % | 2.50 | % | 2.88 | % | 3.10 | % | |||
86
The weighted average assumptions used to determine net pension expense were:
U.S. Plans | Non-U.S. Plans | ||||||||||||||||
Dec 31, 2016 | Dec 31, 2015 | Dec 31, 2014 | Dec 31, 2016 | Dec 31, 2015 | Dec 31, 2014 | ||||||||||||
Discount rate | 4.30 | % | 4.00 | % | 4.85 | % | 3.18 | % | 3.18 | % | 4.27 | % | |||||
Expected rate of increase in future compensation levels | 2.50 | % | 2.50 | % | 2.50 | % | 3.46 | % | 3.78 | % | 3.91 | % | |||||
Long-term expected rate of return on plan assets | 7.50 | % | 7.50 | % | 7.50 | % | 6.30 | % | 6.36 | % | 6.47 | % | |||||
Pension expense for the defined benefit pension plans sponsored by General Cable is determined based principally upon certain actuarial assumptions, including the discount rate and the expected long-term rate of return on assets. The discount rates for the U.S. defined benefit pension plans were determined based on hypothetical yield curves developed using yields of corporate bonds across the full maturity spectrum of the projected pension benefit obligations and based on information received from actuaries. The included bonds are AA-rated (or equivalent quality) by a recognized rating agency. Non-U.S. defined benefit pension plans followed a similar evaluation process based on financial markets in those countries where General Cable provides a defined benefit pension plan.
The weighted-average long-term expected rate of return on assets is based on input from actuaries, including their review of historical 10-year, 20-year, and 25-year rates of inflation and real rates of return on various broad equity and bond indices in conjunction with the diversification of the asset portfolio. The Company’s overall investment strategy is to diversify its investments for the qualified U.S. defined benefit pension plan based on an asset allocation assumption of 65% allocated to equity investments, with an expected real rate of return of 6%, and 35% to fixed-income investments, with an expected real rate of return of 2%, and an assumed long-term rate of inflation of 3%. Equity investments primarily include investments in large-cap and mid-cap companies primarily located in the United States. The actual asset allocations were 64% of equity investments and 36% of fixed-income investments at December 31, 2016 and 65% of equity investments and 35% of fixed-income investments at December 31, 2015. Approximately 30% and 43% of plan assets were concentrated in two mutual funds as of December 31, 2016 and 2015, respectively. The expected long-term rate of return on assets for qualified non-U.S. defined benefit plans is based on a weighted-average asset allocation assumption of 50% allocated to equity investments and 50% to fixed-income investments. The actual weighted-average asset allocations were 48% of equity investments and 52% of fixed-income investments at December 31, 2016 and 61% of equity investments and 39% of fixed-income investments at December 31, 2015. Management believes that long-term asset allocations on average and by location will approximate the Company’s assumptions and that the long-term rate of return used by each country that is included in the weighted-average long-term expected rate of return on assets is a reasonable assumption.
The Company determined the fair market values of the pension plan assets based on the fair value hierarchy established in ASC 820. The standard describes three levels of inputs that may be used to measure fair values which are provided in Note 2 - Summary of Significant Accounting Policies. The fair value of Level 1 assets are based on quoted market prices in active markets. The fair value of Level 2 assets are determined using a market approach and inputs that are primarily directly or indirectly observable. The fair value of the Company’s pension plan assets at December 31, 2016 by asset category are as follows (in millions):
Quoted prices in Active Markets for Identical | Significant Observable | Significant Unobservable | ||||||||||||||
Asset Category | Total | Assets (Level 1) | Inputs (Level 2) | Inputs (Level 3) | ||||||||||||
Equity Securities | $ | 35.9 | $ | 35.9 | $ | — | $ | — | ||||||||
Equity Securities at NAV (1) | 25.0 | — | — | — | ||||||||||||
Mutual Funds - Equity Securities | 35.8 | 35.8 | — | — | ||||||||||||
Mutual Funds - Fixed Income | 33.6 | 33.6 | — | — | ||||||||||||
Bond Funds - Fixed Income at NAV (1) | 16.5 | — | — | — | ||||||||||||
Equitable Contract | 11.0 | — | 11.0 | — | ||||||||||||
Equitable Contract at NAV (1) | 0.8 | — | — | — | ||||||||||||
Coal Lease (2) | 3.2 | — | — | 3.2 | ||||||||||||
Cash and cash equivalents | 3.1 | 3.1 | — | — | ||||||||||||
Total | $ | 164.9 | $ | 108.4 | $ | 11.0 | $ | 3.2 | ||||||||
87
The fair value of the Company’s pension plan assets at December 31, 2015 by asset category are as follows (in millions):
Quoted prices in Active Markets for Identical | Significant Observable | Significant Unobservable | ||||||||||||||
Asset Category | Total | Assets (Level 1) | Inputs (Level 2) | Inputs (Level 3) | ||||||||||||
Equity Securities | $ | 47.7 | $ | 47.7 | $ | — | $ | — | ||||||||
Equity Securities at NAV (1) | 22.3 | — | — | — | ||||||||||||
Mutual Funds - Equity Securities | 37.4 | 37.4 | — | — | ||||||||||||
Mutual Funds - Fixed Income | 39.6 | 39.6 | — | — | ||||||||||||
Bond Funds - Fixed Income at NAV (1) | 15.4 | — | — | — | ||||||||||||
Short Term Investments | 2.8 | — | 2.8 | — | ||||||||||||
Equitable Contract at NAV (1) | 1.1 | — | — | — | ||||||||||||
Coal Lease (2) | 3.5 | — | — | 3.5 | ||||||||||||
Total | $ | 169.8 | $ | 124.7 | $ | 2.8 | $ | 3.5 | ||||||||
(1) | In accordance with ASC 820, investments measured at fair value using the NAV practical expedient are excluded from the fair value hierarchy. Prior period amounts have been adjusted to conform to current year presentation. |
(2) | The Company’s interest represents approximately 26% of the lease which is currently between American Premier Underwriters (APU), the Lessor and CONSOL Energy (CONSOL), the Lessee. The lease pertains to real property mined by CONSOL located in Pennsylvania. |
The following table represents details of the fair value measurements using significant unobservable inputs (Level 3):
Coal Lease | |||
Beginning balance at January 1, 2015 | $ | 3.7 | |
Change in fair value of plan assets | (0.2 | ) | |
Ending balance December 31, 2015 | $ | 3.5 | |
Change in fair value of plan assets | (0.3 | ) | |
Ending balance at December 31, 2016 | $ | 3.2 | |
The determination of pension expense for the qualified defined benefit pension plans is based on the fair market value of assets as of the measurement date. Investment gains and losses are recognized in the measurement of assets immediately. Such gains and losses will be amortized and recognized as part of the annual benefit cost to the extent that unrecognized net gains and losses from all sources exceed 10% of the greater of the projected benefit obligation or the market value of assets.
The Company’s expense under both U.S. and non-U.S. defined benefit pension plans is determined using the discount rate as of the beginning of the fiscal year. The 2017 expense for the pension plans will be based on the weighted-average discount rate of approximately 4.01% for U.S. defined benefit pension plans and 2.55% for non-U.S. defined benefit pension plans.
The Company expects to contribute, at least the minimum required, but not more than is tax deductible, $4.3 million to its defined benefit pension plans for 2017. The estimated future benefit payments expected to be paid for the Company’s defined benefit pension plans are $17.5 million in 2017, $17.3 million in 2018, $17.6 million in 2019, $18.3 million in 2020, $18.2 million in 2021 and $91.3 million from 2022 through 2026.
Defined Contribution Plans
Expense under both U.S. and non-U.S. defined contribution plans generally equals up to six percent of each eligible employee’s covered compensation based on the location and status of the employee. The net defined contribution plan expense recognized was $11.5 million, $12.0 million and $12.8 million, respectively, for the years ended December 31, 2016, 2015 and 2014.
88
14. Equity and Accumulated Other Comprehensive Income
General Cable is authorized to issue 200 million shares of common stock and 25 million shares of preferred stock.
The components of accumulated other comprehensive income (loss) as of December 31, 2016 and 2015, respectively, consisted of the following (in millions):
Fiscal Years Ended | |||||||||||||||
December 31, 2016 | December 31, 2015 | ||||||||||||||
Company Common Shareholders | Noncontrolling Interest | Company Common Shareholders | Noncontrolling Interest | ||||||||||||
Foreign currency translation adjustment | $ | (228.2 | ) | $ | (13.0 | ) | $ | (275.6 | ) | $ | (13.5 | ) | |||
Pension adjustments, net of tax | (58.2 | ) | (1.3 | ) | (64.6 | ) | (1.5 | ) | |||||||
Accumulated other comprehensive income (loss) | $ | (286.4 | ) | $ | (14.3 | ) | $ | (340.2 | ) | $ | (15.0 | ) | |||
The following is the detail of the change in the Company's accumulated other comprehensive income (loss) from December 31, 2014 to December 31, 2016 including the effect of significant reclassifications out of accumulated other comprehensive income (in millions, net of tax):
Foreign currency translation | Change of fair value of pension benefit obligation | Total | |||||||||
Balance, December 31, 2014 | $ | (185.1 | ) | $ | (78.3 | ) | $ | (263.4 | ) | ||
Other comprehensive income (loss) before reclassifications | (122.8 | ) | 25.5 | (97.3 | ) | ||||||
Amounts reclassified from accumulated other comprehensive income (loss) | 32.3 | (11.8 | ) | 20.5 | |||||||
Net current - period other comprehensive income (loss) | (90.5 | ) | 13.7 | (76.8 | ) | ||||||
Balance, December 31, 2015 | $ | (275.6 | ) | $ | (64.6 | ) | $ | (340.2 | ) | ||
Other comprehensive income (loss) before reclassifications | (12.2 | ) | 9.3 | (2.9 | ) | ||||||
Amounts reclassified from accumulated other comprehensive income (loss) | 59.6 | (2.9 | ) | 56.7 | |||||||
Net current - period other comprehensive income (loss) | 47.4 | 6.4 | 53.8 | ||||||||
Balance, December 31, 2016 | $ | (228.2 | ) | $ | (58.2 | ) | $ | (286.4 | ) | ||
89
The following is the detail of the reclassifications out of accumulated other comprehensive income (loss) for the year ended December 31, 2016 and 2015 (in millions, net of tax):
Year Ended | Year Ended, | ||||||||
December 31, 2016 | December 31, 2015 | ||||||||
Amount reclassified from accumulated other comprehensive income (loss) | Amount reclassified from accumulated other comprehensive income (loss) | Affected line item in the Consolidated Statement of Operations and Comprehensive Income (Loss) | |||||||
Foreign currency translation | |||||||||
Exit of subsidiaries | $ | 27.8 | $ | — | SG&A | ||||
Sale of subsidiaries | 31.8 | 32.3 | SG&A | ||||||
Total - foreign currency items | $ | 59.6 | $ | 32.3 | |||||
Defined pension items | |||||||||
Amortization of prior service cost | $ | (0.6 | ) | $ | (0.6 | ) | Cost of sales | ||
Amortization of net loss | (7.0 | ) | (13.7 | ) | Cost of sales | ||||
Settlement loss | 4.7 | — | Cost of sales | ||||||
Transfers | — | 2.5 | SG&A | ||||||
Total - Pension Items | (2.9 | ) | (11.8 | ) | |||||
Total | $ | 56.7 | $ | 20.5 | |||||
Stock Repurchase Programs
On December 10, 2013, the Company's Board of Directors authorized the extension of the Company’s existing $125 million share repurchase program through the end of 2014. The share repurchase program has not been extended further. Stock purchases under this program were able to be made through the open market and privately negotiated transactions at times and in such amounts as deemed appropriate by a special committee appointed by the Board. Under the stock repurchase program, the Company purchased $30.7 million, or 1,000,000 common shares at an average price of $30.73 per share, during the year ended December 31, 2014.
15. Share-Based Compensation
The Company has various plans that provide for granting options, restricted stock units and restricted stock to certain employees and independent directors of the Company and its subsidiaries. The Company recognizes compensation expense for share-based payments based on the fair value of the awards at the grant date. The table below summarizes compensation expense for the Company’s non-qualified stock options based on the fair value method estimated using the Black-Scholes valuation model, and non-vested stock awards, including restricted stock units, and performance-based non-vested stock units based on the fair value method estimated using the Monte Carlo simulation model and the grant date stock market value for the years ended December 31, 2016, 2015 and 2014. The Company records compensation expense related to non-vested stock awards as a component of the SG&A expenses caption of the Consolidated Statements of Operations and Comprehensive Income (Loss).
Year Ended | |||||||||||
(in millions) | Dec 31, 2016 | Dec 31, 2015 | Dec 31, 2014 | ||||||||
Non-qualified stock option expense | $ | 0.6 | $ | 1.5 | $ | 2.3 | |||||
Immediately vested stock awards expense | — | — | 0.8 | ||||||||
Stock unit awards | 3.4 | 4.5 | 8.0 | ||||||||
Performance-based non-vested stock awards expense | 1.4 | 6.1 | 4.7 | ||||||||
Total pre-tax share-based compensation expense | $ | 5.4 | $ | 12.1 | $ | 15.8 | |||||
Excess tax benefit (deficiency) on share-based compensation | $ | (5.0 | ) | $ | (1.7 | ) | $ | (0.5 | ) | ||
During the years ended December 31, 2016, 2015 and 2014, cash received from stock option exercises was $1.2 million, $0.2 million and $0.3 million, respectively. The total tax benefit to be realized for tax deductions from these option exercises was less than $0.1 million for the years ended December 31, 2016 and December 31, 2015 and $0.1 million for the year ended December 31, 2014. The $6.5 million and $4.3 million tax deductions for all share-based compensation for the years ended December 31, 2016 and 2015, respectively, includes $(5.0) million and $(1.7) million of excess tax benefits (deficiencies). The 2016, 2015 and 2014
90
deficiency does not impact cash flow due to the U.S. tax loss carry forward position. The Company has elected the shortcut method to calculate the pool of excess tax benefits available to absorb tax deficiencies recognized subsequent to the adoption of ASC 718.
The Company currently has share-based compensation awards outstanding under the General Cable Corporation 2005 Stock Incentive Plan (“2005 Plan”) and the General Cable Corporation Stock Incentive Plan, as amended and restated, ("Amended Plan"). The Amended Plan is an amendment and restatement of the 2005 Plan and was effective as of May 14, 2015. These plans allow the Company to fulfill its incentive award obligations generally by granting nonqualified stock options and nonvested stock awards. New shares are issued when nonqualified stock options are exercised and when non-vested stock awards vest. The Compensation Committee of the Board of Directors will no longer grant any awards under the 2005 Plan but will continue to administer awards which were previously granted under such plan. The Amended Plan authorized a maximum of approximately 9 million shares to be granted. Shares reserved for future grants, including options, under the Amended Plan, approximated 3.2 million at December 31, 2016.
The Amended Plan authorizes the following types of awards to be granted: (i) Nonqualified Stock Options; (ii) Stock Appreciation Rights; (iii) Stock Awards; (iv) Stock Units and (v) Cash Awards, as more fully described in the Amended Plan. Stock awards, stock units and cash awards may constitute performance-based awards. Each award is subject to such terms and conditions consistent with the Amended Plan as determined by the Compensation Committee and as set forth in an award agreement.
Stock Options
All options awarded under the 2005 Plan and the Amended Plan have a term not to exceed 10 years from the grant date. The majority of the options vest ratably over three years of continued employment from the grant date. A summary of stock option activity for the year ended December 31, 2016 is as follows (options in thousands and aggregate intrinsic value in millions):
Weighted Average | Weighted Average Remaining | Aggregate | ||||||||||
Options Outstanding | Exercise Price | Contractual Term | Intrinsic Value | |||||||||
Outstanding at December 31, 2015 | 2,079.9 | $ | 31.51 | 4.9 years | $ | — | ||||||
Granted | — | — | ||||||||||
Exercised | (60.0 | ) | 19.59 | |||||||||
Forfeited or Expired | (340.3 | ) | 35.65 | |||||||||
Outstanding as of December 31, 2016 | 1,679.6 | $ | 31.01 | 4.3 years | $ | — | ||||||
Exercisable at December 31, 2016 | 1,444.8 | $ | 32.86 | 3.6 years | $ | — | ||||||
Options expected to vest in the next twelve months | 117.4 | $ | 19.65 | 8.5 years | $ | — | ||||||
During the years ended December 31, 2016 and December 31, 2014 there were no stock options granted. During the year ended December 31, 2015, there were 352.1 thousand stock options granted and the weighted average grant date fair value of options granted was $19.65. The total intrinsic value of options exercised was less than $0.1 million during the years ended December 31, 2016 and 2015 and $0.2 million during the year ended December 31, 2014. The total fair value of options vested during the years ended December 31, 2016, 2015 and 2014 was $1.0 million, $27.7 million, and $25.7 million, respectively. At December 31, 2016, 2015 and 2014, the total compensation cost related to nonvested options not yet recognized was $1.3 million, $1.5 million and $1.1 million with a weighted average expense recognition period of 1.6 years, 2.3 years and 1.2 years, respectively.
91
The fair value of each option award is estimated on the date of grant using the Black-Scholes valuation model using the following weighted-average assumptions:
Year Ended | ||||
Dec 31, 2015 | ||||
Risk-free interest rate (1) | 1.4 | % | ||
Expected dividend yield | 3.7 | % | ||
Expected option life (2) | 4.0 years | |||
Expected stock price volatility (3) | 47.2 | % | ||
Weighted average fair value of options granted | $ | 5.68 | ||
(1) | Risk-free interest rate — This is the U.S. Treasury rate at the grant date having a term approximately equal to the expected life of the option. An increase in the risk-free interest rate will increase compensation expense. |
(2) | Expected option life — This is the period of time over which the options granted are expected to remain outstanding and is based on historical experience. Options granted have a maximum term of ten years. An increase in expected life will increase compensation expense. |
(3) | Expected stock price volatility — This is a measure of the amount by which a price has fluctuated or is expected to fluctuate. The Company uses actual historical changes in the market value of the Company’s stock to calculate the volatility assumption as it is management’s belief that this is the best indicator of future volatility. An increase in the expected volatility will increase compensation expense. |
Additional information regarding options outstanding as of December 31, 2016 is as follows (options in thousands):
Range of Option Prices | Options Outstanding | Weighted Average Exercise Price | Weighted Average Remaining Contractual Life | Options Exercisable | Weighted Average Exercise Price | |||||||||||
$0 -$14 | — | $ | — | 0.0 | — | $ | — | |||||||||
$14 - $28 | 905.6 | 20.65 | 4.3 | 670.8 | 2.83 | |||||||||||
$28 -$42 | 366.0 | 33.10 | 2.0 | 366.0 | 1.97 | |||||||||||
$42 - $56 | 255.3 | 44.80 | 1.4 | 255.3 | 1.38 | |||||||||||
$56 - $70 | 152.7 | 64.40 | 1.0 | 152.7 | 1.02 | |||||||||||
Nonvested Stock
The majority of the nonvested stock and stock unit awards granted under the 2005 Plan and the Amended Plan are in the form of restricted stock units ("RSUs") and performance-based stock units ("PSUs"). The Company's RSUs include performance conditions and are restricted as to transferability and salability with these restrictions being removed in equal annual installments over a three-year or five-year period following the grant date. The vesting is contingent upon certification that the applicable performance condition has been achieved, and the performance condition operates on a rolling basis with a catch-up feature for each vesting tranche for RSU's granted in 2015 and 2014. The Company's PSUs vest upon certification of the achievement of two cumulative three-year performance metrics: relative total shareholder return (“RTSR”) and return on invested capital (“ROIC”). A minimal amount of immediately vesting restricted stock held by certain members of the Company’s Board of Directors in the Deferred Compensation Plan is included in this presentation as nonvested stock.
A summary of all nonvested stock activity for the year ended December 31, 2016, is as follows (shares in thousands):
Shares Outstanding | Weighted Average Grant Date Fair Value | |||||
Balance, December 31, 2015 | 1,590.1 | $ | 23.64 | |||
Granted | 1,150.5 | 7.96 | ||||
Vested | (530.3 | ) | 26.78 | |||
Forfeited | (771.5 | ) | 15.70 | |||
Balance, December 31, 2016 | 1,438.8 | $ | 13.87 | |||
The fair values of RSUs and PSUs are estimated based on the assumed probable outcome on the date of grant in accordance with ASC 718 - Compensation - Stock Compensation. The probable outcome is assumed to be at the target level attainment. The estimated fair value of the RSUs and the PSUs with the performance condition tied to ROIC are calculated using the closing price per share of the Company's common stock on the grant date. The estimated fair value of the PSUs with the performance condition
92
tied to RTSR are calculated using the simulated fair value per share of the Company's common stock based on the application of a Monte Carlo simulation model.
The weighted-average grant date fair value of all nonvested stock granted, the total fair value (in millions) of all nonvested stock granted, and the fair value (in millions) of all nonvested stock that have vested during each of the past three years is as follows:
Year Ended | |||||||||||
Dec 31, 2016 | Dec 31, 2015 | Dec 31, 2014 | |||||||||
Weighted-average grant date fair value of nonvested shares granted | $ | 7.96 | $ | 15.97 | $ | 30.27 | |||||
Fair value of nonvested shares granted | $ | 9.2 | $ | 15.2 | $ | 20.0 | |||||
Fair value of shares vested | $ | 14.2 | $ | 8.7 | $ | 8.1 | |||||
As of December 31, 2016, there was $6.1 million of total unrecognized compensation cost related to all nonvested stock. The cost is expected to be recognized over a weighted average period of 1.6 years. There is approximately 1.0 million nonvested stock with a weighted average grant price of $17.30 and a fair value of $17.3 million expected to vest in 2017.
16. Redeemable Noncontrolling Interest
On October 1, 2012, the Company participated in a share subscription for 60% of the outstanding and issued shares of Procables. The existing shareholders immediately prior to the subscription (the “Sellers” or “Minority Shareholders”) maintained control of the remaining 40% of the shares. The Company and the Minority Shareholders also agreed to certain put and call options with regard to the remaining 40% interest in Procables retained by the Minority Shareholders. For a 36-month period commencing on the fourth anniversary of the closing date, the Minority Shareholders may exercise a put option to sell their entire 40% interest in Procables to the Company. The Company shall be irrevocably obligated to purchase the shares (the "Put Option"). In addition, the Company has a call option (the "Call Option") to purchase the Minority Shareholders’ 40% interest in Procables, during the 36-month period commencing on the expiration of the Put Option period. The consideration to be exchanged, per share in the event of a Put Option or Call Option shall be the higher of the following (1) the final per share purchase price; or (2) a price per share based on the Company's enterprise value equal to seven times the average of its EBITDA over the two most recently audited year-end financial statements immediately prior to the option being exercised, minus the 12-month average Net Indebtedness, as defined in the agreement, of the Company for the most recent audited fiscal year (“EBITDA average”). The Company determined that the Put Option is embedded within the noncontrolling interest shares that are subject to the Put Option. The redemption feature required classification of the Minority Shareholder's interest in the Consolidated Balance Sheets outside of equity under the caption “Redeemable noncontrolling interest.”
The redeemable noncontrolling interest of Procables was recorded on the acquisition date based on the estimated fair value of the shares including the embedded Put Option. The fair value of the Put Option was estimated at the higher of the final per share purchase price or EBITDA average. On October 1, 2016, the Minority Shareholders elected to exercise the Put Option to sell their entire 40% interest in Procables to the Company. On December 9, 2016, the Company paid $18.0 million to the Minority Shareholders.
93
17. Earnings Per Common Share
The Company applies the two-class method of computing basic and diluted earnings per share. Future declarations of dividends and the establishment of future record dates and payment dates are subject to the final determination of our Board of Directors.
A reconciliation of the numerator and denominator of earnings (loss) per common share-basic to earnings (loss) per common share-assuming dilution is as follows (in millions, except per share data):
Year Ended | |||||||||||
Dec 31, 2016 | Dec 31, 2015 | Dec 31, 2014 | |||||||||
Amounts attributable to the Company — basic and diluted: | |||||||||||
Net income (loss) attributable to Company common shareholders | $ | (93.8 | ) | $ | (121.9 | ) | $ | (627.6 | ) | ||
Net income (loss) for EPS computations(1) | $ | (93.8 | ) | $ | (121.9 | ) | $ | (627.6 | ) | ||
Weighted average shares outstanding for basic EPS computation (2,3) | 49.6 | 48.9 | 48.8 | ||||||||
Earnings (loss) per common share attributable to Company common shareholders – basic(3) | $ | (1.89 | ) | $ | (2.49 | ) | $ | (12.86 | ) | ||
Weighted average shares outstanding including nonvested shares | 49.6 | 48.9 | 48.8 | ||||||||
Weighted average shares outstanding for diluted EPS computation (2) | 49.6 | 48.9 | 48.8 | ||||||||
Earnings (loss) per common share attributable to Company common shareholders – assuming dilution | $ | (1.89 | ) | $ | (2.49 | ) | $ | (12.86 | ) | ||
(1) | Numerator |
(2) | Denominator |
(3) | Under the two class method, earnings (loss) per share — basic reflects undistributed earnings per share for both common stock and unvested share-based payment awards (restricted stock). |
As of December 31, 2016, 2015 and 2014, there were approximately 3,429 thousand, 3,646 thousand, and 3,057 thousand shares excluded from the earnings per common share — assuming dilution computation because their impact was anti-dilutive, respectively.
Under ASC 260 - Earnings per Share and ASC 470 and because of the Company’s obligation to settle the par value of the Subordinated Convertible Notes in cash, the Company is not required to include any shares underlying the Subordinated Convertible Notes in its weighted average shares outstanding — assuming dilution until the average stock price per share for the quarter exceeds the $36.75 conversion price of the Subordinated Convertible Notes, respectively, and only to the extent of the additional shares that the Company may be required to issue in the event that the Company’s conversion obligation exceeds the principal amount of the Subordinated Convertible Notes.
Regarding the Subordinated Convertible Notes, the average stock price threshold conditions had not been met as of December 31, 2016 or December 31, 2015. At any such time in the future the threshold conditions are met, only the number of shares issuable under the “treasury” method of accounting for the share dilution would be included in the Company’s earnings per share — assuming dilution calculation, which is based upon the amount by which the average stock price exceeds the conversion price.
The following table provides examples of how changes in the Company’s stock price would require the inclusion of additional shares in the denominator of the weighted average shares outstanding — assuming dilution calculation for the Subordinated Convertible Notes.
Shares Underlying Subordinated Convertible Notes | Total Treasury Method Incremental Shares (1) | |||||
Share Price | ||||||
$36.75 | — | — | ||||
$38.75 | 603,152 | 603,152 | ||||
$40.75 | 1,147,099 | 1,147,099 | ||||
$42.75 | 1,640,151 | 1,640,151 | ||||
$44.75 | 2,089,131 | 2,089,131 | ||||
(1) | Represents the number of incremental shares that must be included in the calculation of fully diluted shares under U.S. GAAP. |
94
18. Segment Information
The Company conducts its operations through four geographic operating and reportable segments — North America, Europe, Latin America, and Africa/Asia Pacific. The Company’s operating and reportable segments align with the structure of the Company’s internal management organization. All four segments engage in the development, design, manufacturing, marketing and distribution of copper, aluminum, and fiber optic communication, construction, electric utility and electrical infrastructure wire and cable products. In addition to the above products, the North America and Latin America segments manufacture and distribute rod mill wire and cable products.
Net revenues as shown below represent sales to external customers for each segment. Intersegment sales have been eliminated. For the year ended December 31, 2016, intersegment sales were $38.0 million in North America, $9.9 million in Europe, $22.9 million in Latin America and $0.2 million in Africa/Asia Pacific. For the year ended December 31, 2015, intersegment sales were $29.8 million in North America, $18.3 million in Europe and $19.5 million in Latin America. For the year ended December 31, 2014, intersegment sales were $31.5 million in North America, $55.8 million in Europe, $31.7 million in Latin America and $0.5 million in Africa/Asia Pacific.
The chief operating decision maker evaluates segment performance and allocates resources based on segment operating income. Summarized financial information for the Company's reportable segments is as follows:
Year Ended | ||||||||||||
(in millions) | Dec 31, 2016 | Dec 31, 2015 | Dec 31, 2014 | |||||||||
Net Sales: | ||||||||||||
North America | $ | 2,041.7 | $ | 2,299.3 | $ | 2,550.1 | ||||||
Europe | 875.7 | 960.2 | 1,330.8 | |||||||||
Latin America | 655.2 | 726.8 | 1,143.0 | |||||||||
Africa/Asia Pacific | 285.8 | 528.2 | 955.9 | |||||||||
Total | $ | 3,858.4 | $ | 4,514.5 | $ | 5,979.8 | ||||||
Segment Operating Income (Loss): | ||||||||||||
North America | $ | 62.4 | $ | 84.5 | $ | 118.5 | ||||||
Europe | 2.6 | 6.6 | (94.0 | ) | ||||||||
Latin America | (14.4 | ) | (22.8 | ) | (246.6 | ) | ||||||
Africa/Asia Pacific | (68.9 | ) | (53.8 | ) | (89.3 | ) | ||||||
Total | $ | (18.3 | ) | $ | 14.5 | $ | (311.4 | ) | ||||
Capital Expenditures: | ||||||||||||
North America | $ | 51.3 | $ | 20.9 | $ | 38.4 | ||||||
Europe | 19.8 | 20.7 | 9.5 | |||||||||
Latin America | 12.4 | 11.1 | 25.6 | |||||||||
Africa/Asia Pacific | 0.6 | 8.8 | 16.1 | |||||||||
Total | $ | 84.1 | $ | 61.5 | $ | 89.6 | ||||||
Depreciation Expense: | ||||||||||||
North America | $ | 37.9 | $ | 37.1 | $ | 39.8 | ||||||
Europe | 22.4 | 25.2 | 33.1 | |||||||||
Latin America | 10.7 | 12.6 | 20.4 | |||||||||
Africa/Asia Pacific | 4.8 | 9.2 | 16.8 | |||||||||
Total | $ | 75.8 | $ | 84.1 | $ | 110.1 | ||||||
Total Assets: | ||||||||||||
North America | $ | 950.2 | $ | 986.9 | $ | 1,206.6 | ||||||
Europe | 624.1 | 632.0 | 751.4 | |||||||||
Latin America | 466.4 | 480.8 | 656.6 | |||||||||
Africa/Asia Pacific | 200.9 | 354.9 | 738.4 | |||||||||
Total | $ | 2,241.6 | $ | 2,454.6 | $ | 3,353.0 | ||||||
95
Revenues by Major Product Lines Revenues to external customers are attributable to sales of electric utility, electrical infrastructure, construction, communications and rod mill wire product lines.
Year Ended | ||||||||||||
(in millions) | Dec 31, 2016 | Dec 31, 2015 | Dec 31, 2014 | |||||||||
Electric Utility | $ | 1,357.1 | $ | 1,550.2 | $ | 2,006.1 | ||||||
Electrical Infrastructure | 989.7 | 1,234.6 | 1,589.5 | |||||||||
Construction | 820.8 | 962.9 | 1,440.4 | |||||||||
Communications | 473.8 | 517.0 | 570.4 | |||||||||
Rod Mill Products | 217.0 | 249.8 | 373.4 | |||||||||
Total | $ | 3,858.4 | $ | 4,514.5 | $ | 5,979.8 | ||||||
Geographic Information The following table presents net sales to unaffiliated customers by country of destination for the last three years and long-lived assets by country as of December 31:
Net Sales | Non - Current Assets | |||||||||||||||||||
Year Ended | Year Ended | |||||||||||||||||||
(in millions) | Dec 31, 2016 | Dec 31, 2015 | Dec 31, 2014 | Dec 31, 2016 | Dec 31, 2015 | |||||||||||||||
United States | $ | 1,738.4 | $ | 1,914.0 | $ | 2,049.3 | $ | 242.2 | $ | 255.4 | ||||||||||
Canada | 293.0 | 345.5 | 467.1 | 25.2 | 25.4 | |||||||||||||||
France | 284.4 | 295.2 | 383.6 | 66.8 | 61.9 | |||||||||||||||
Brazil | 222.6 | 247.4 | 457.9 | 61.4 | 57.4 | |||||||||||||||
Spain | 149.2 | 153.5 | 218.5 | 48.1 | 47.6 | |||||||||||||||
Others | 1,170.8 | 1,558.9 | 2,403.4 | 198.7 | 266.5 | |||||||||||||||
Total | $ | 3,858.4 | $ | 4,514.5 | $ | 5,979.8 | $ | 642.4 | $ | 714.2 | ||||||||||
19. Commitments and Contingencies
Environmental matters
We are subject to a variety of federal, state, local and foreign laws and regulations covering the storage, handling, emission and discharge of materials into the environment, including CERCLA, the Clean Water Act, the Clean Air Act (including the 1990 amendments) and the Resource Conservation and Recovery Act.
Our subsidiaries in the United States have been identified as potentially responsible parties with respect to several sites designated for cleanup under CERCLA or similar state laws, which impose liability for cleanup of certain waste sites and for related natural resource damages without regard to fault or the legality of waste generation or disposal. Persons liable for such costs and damages generally include the site owner or operator and persons that disposed or arranged for the disposal of hazardous substances found at those sites. Although CERCLA imposes joint and several liability on all potentially responsible parties, in application, the potentially responsible parties typically allocate the investigation and cleanup costs based upon, among other things, the volume of waste contributed by each potentially responsible party.
Settlements can often be achieved through negotiations with the appropriate environmental agency or the other potentially responsible parties. Potentially responsible parties that contributed small amounts of waste (typically less than 1% of the waste) are often given the opportunity to settle as “de minimus” parties, resolving their liability for a particular site. We do not own or operate any of the waste sites with respect to which we have been named as a potentially responsible party by the government. Based on our review and other factors, we believe that costs relating to environmental clean-up at these sites will not have a material adverse effect on our results of operations, cash flows or financial position.
On March 7, 2011, GK Technologies, Inc. (“GK Tech”) was served with a Complaint filed on February 24, 2011, by the Housing Authority of the City of Los Angeles (“HACLA”) arising under CERCLA, California statutory law, and common law in the case known as Housing Authority of the City of Los Angeles v. PCC Technical Industries, Inc., Case No. 11-CV-01626 FMO (C.D. Cal.). The Housing Authority contends that GK Tech and several other defendants are responsible for environmental contamination at property located at 9901 S. Alameda Street in Los Angeles (the “Site”), which was the location of a steel recycling mill formerly operated by a former subsidiary of GK Tech. The former subsidiary was legally dissolved in September 1993.
96
In January 2017, we, the other defendants and HACLA reached an agreement to settle the actions for $12 million (the “Settlement Payment”), with GK Tech responsible for a portion of such Settlement Payment in an immaterial amount, which has been accrued for in the quarter ended December 31, 2016. We anticipate paying GK Tech’s portion of the Settlement Payment in the first quarter of 2017.
At December 31, 2016 and 2015, we had a total accrued liability of approximately $5.6 million and $3.6 million, respectively, for various environmental-related liabilities to the extent costs are known and can be reasonably estimated as a liability. While it is difficult to estimate future environmental-related liabilities accurately, we do not currently anticipate any material adverse effect on our results of operations, financial position or cash flows as a result of compliance with federal, state, local or foreign environmental laws or regulations or cleanup costs of the sites discussed above.
Asbestos litigation
We have been a defendant in asbestos litigation for the past 28 years. Our subsidiaries have been named as defendants in lawsuits alleging exposure to asbestos in products manufactured by us. As of December 31, 2016, we were a defendant in approximately 318 cases brought in state and federal courts throughout the United States. In the calendar year 2016, 84 asbestos cases were brought against us. In the calendar year 2015, 99 asbestos cases were brought against us. In the last 28 years, we have had no cases proceed to verdict. In many of the cases, we were dismissed as a defendant before trial for lack of product identification. As of December 31, 2016, 50,958 asbestos cases have been dismissed. In the calendar year 2016, 83 asbestos cases were dismissed. As of December 31, 2015, 50,875 cases were dismissed. With regards to the approximately 318 remaining pending cases, we are aggressively defending these cases based upon either lack of product identification as to whether we manufactured asbestos-containing product and/or lack of exposure to asbestos dust from the use of our product.
As of December 31, 2016, plaintiffs have asserted monetary damages in 164 cases. In 54 of these cases, plaintiffs allege only damages in excess of some dollar amount (about $652 thousand per plaintiff); in these cases there are no claims for specific dollar amounts requested as to any defendant. In 108 other cases pending in state and federal district courts, plaintiffs seek approximately $430 million in damages from as many as 50 defendants. In two cases, plaintiffs have asserted damages related to General Cable in the amount of $20 million. In addition, in relation to these 164 cases, there are claims of $271 million in punitive damages from all of the defendants. However, many of the plaintiffs in these cases allege non-malignant injuries. As of December 31, 2016 and 2015, we had accrued, on a gross basis, approximately $4.4 million and $4.1 million, respectively, and as of December 31, 2016 and 2015, had recovered approximately $0.4 million of insurance recoveries for these lawsuits. The net amount of $4.0 million and $3.7 million, as of December 31, 2016 and 2015, respectively, represents our best estimate in order to cover resolution of current asbestos-related claims.
The components of the asbestos litigation reserve are current and future asbestos-related claims. The significant assumptions are: (1) the number of cases per state, (2) an estimate of the judgment per case per state, (3) an estimate of the percentage of cases per state that would make it to trial and (4) the estimated total liability percentage, excluding insurance recoveries, per case judgment. Management's estimates are based on the Company's historical experience with asbestos related claims. The Company's current history of asbestos claims does not provide sufficient and reasonable information to estimate a range of loss for potential future, unasserted asbestos claims because the number and the value of the alleged damages of such claims have not been consistent. As such, the Company does not believe a reasonably possible range can be estimated with respect to asbestos claims that may be filed in the future.
Settlement payments are made, and the asbestos accrual is relieved, when we receive a fully executed settlement release from the plaintiff's counsel. As of December 31, 2016 and 2015, aggregate settlement costs were $9.8 million and $9.7 million, respectively. In calendar years 2016, 2015 and 2014, the settlement costs totaled $0.1 million, $0.2 million and $0.6 million, respectively. As of December 31, 2016 and 2015, aggregate litigation costs were $27.1 million and $26.1 million, respectively. In calendar years 2016, 2015 and 2014, the costs of administering and litigating asbestos claims totaled $1.0 million, $1.4 million and $1.8 million, respectively.
In January 1994, we entered into a settlement agreement with certain principal primary insurers concerning liability for the costs of defense, judgments and settlements, if any, in all of the asbestos litigation described above. Subject to the terms and conditions of the settlement agreement, the insurers were responsible for a substantial portion of the costs and expenses incurred in the defense or resolution of this litigation. However, one of the insurers participating in the settlement that was responsible for a significant portion of the contribution under the settlement agreement entered into insurance liquidation proceedings and another became insolvent. As a result, the contribution of the insurers has been reduced and we have had to bear substantially most of the costs relating to these lawsuits.
European Commission competition matter
As part of the Company’s acquisition of Silec in December 2005, SAFRAN SA (“SAFRAN”), agreed to indemnify the Company for the full amount of losses arising from, related to or attributable to practices, if any, that are similar to previous practices investigated by the French competition authority for alleged competition law violations related to medium-and high voltage cable
97
markets. The Company has asserted a claim under this indemnity against SAFRAN related to the European Commission’s Statement of Objections, discussed below, to preserve the Company’s rights in case of an adverse European Commission decision.
On July 5, 2011, the European Commission issued a Statement of Objections in relation to its ongoing competition investigation to a number of wire and cable manufacturers in the submarine and underground power cables business, including our Spanish affiliate, Grupo General Cable Sistemas, and its French subsidiary, Silec. The Statement of Objections alleged that the two affiliates engaged in violations of competition law in the underground power cables businesses for limited periods of time. The allegations related to Grupo General Cable Sistemas claimed that it had participated in a cartel from January 2003 to May 2007, while the allegations related to Silec were for the ten month period following its December 22, 2005 acquisition from SAFRAN by Grupo General Cable Sistemas.
Following our formal responses to the Statement of Objections in October 2011 and a hearing in 2012, the European Commission issued a final decision on April 2, 2014. In the decision, the claims of infringement against Grupo General Cable Sistemas were dismissed for lack of evidence of alleged cartel activity. With regard to Silec, the European Commission’s decision imposed a fine of 1.9 million Euros related to the period Silec has been owned by us. This fine was based on participation that allegedly commenced well before Silec was acquired by us. On June 13, 2014, we filed an appeal with the General Court of the European Union challenging the European Commission’s decision as to Silec in Europe based on established precedent. We also continue to pursue our claim for full indemnification for the Silec fine under the terms of the acquisition agreement with SAFRAN executed in 2005.
Transformer damage claims
In March 2012, we received formal notice of a claim for damages arising from a transformer fire that occurred in December 2010 allegedly resulting in loss of equipment and some consequential damages at a metal processing facility in Iceland. We supplied and installed cables and terminations to the transformer, which was manufactured and installed by an independent third party, during 2006 and the first quarter of 2007. Our work was inspected and accepted by the customer in March 2007. In August 2012, the customer initiated arbitration proceedings before the ICC Tribunal with a request to arbitrate in Pennsylvania. In September 2012, we initiated litigation in Pennsylvania state court seeking a declaration that we are not liable for any damages associated with the alleged loss resulting from the transformer fire and seeking to enjoin the ICC arbitration proceedings. The customer then moved the case from state to federal district court in the Western District of Pennsylvania which determined on motion that the ICC Tribunal not the court should decide whether the claims were arbitrable in the first instance. The arbitration was conducted before the ICC Tribunal in April 2015, and the parties filed post-hearing briefs. On March 24, 2016, the ICC Tribunal issued its final order finding the Company liable for $15.7 million in damages plus prejudgment interest of $3.5 million. The Company was fully insured for the $19.2 million award. Payment from the insurers was made in the second quarter of 2016.
Brazil tax matters
One of our Brazilian subsidiaries is involved in administrative proceedings with State treasury offices regarding whether tax incentives granted to us by one Brazilian state are applicable to goods sold in another Brazilian State. We believe we correctly relied on the tax incentives granted and that we have substantial defenses to their disallowance by the Brazilian State claimant. The total amount of taxes allegedly due for the infractions including potential interest and penalties is up to $8 million. In September 2012, an Administrative Court found that we were not liable for any incentive tax payments claimed by the State treasury office, however this determination was overturned on appeal and has since been further appealed. This appeal remains pending at the Brazilian Courts. Despite the pending appeal, in October 2014, the State issued a summons to recover the approximately $8 million of contested incentives described above, and we are complying with the terms of the State’s summons while continuing to contest the Court’s ruling. We currently estimate our range of reasonably possible loss to be between $0 million and $8 million.
Our Brazilian subsidiaries have received notifications of various other claims related to disputed tax credits taken on Federal Tax Offset returns, which are in various phases of litigation. We believe we correctly applied the tax credits taken and that we have substantial defenses to these claims. The total amount of reasonably possible loss for the disputed credits, including potential interest and penalties is up to $17 million.
Resolution of SEC and DOJ investigations
As previously disclosed, we reviewed, with the assistance of external counsel, our use and payment of agents in connection with, and certain other transactions involving, our operations in Angola, Thailand, India, China and Egypt (the “Subject Countries”). Our review focused upon payments and gifts made, offered, contemplated or promised by certain employees in one or more of the Subject Countries, directly and indirectly, and at various times, to employees of public utility companies and/or other officials of state owned entities that raised concerns under the FCPA and possibly under the laws of other jurisdictions. During 2015, we substantially completed our internal review in the Subject Countries.
As previously disclosed, we also conducted internal investigations, subject to the oversight of the Audit Committee of our Board of Directors and with the assistance of external counsel, principally relating to matters resulting in restatements of a number of our previously issued financial statements. In connection with these matters, among others, our management identified control deficiencies that constituted material weaknesses in our internal control over financial reporting. These material weaknesses
98
resulted in accounting errors that caused us to issue two sets of restated financial statements. In March 2013, principally to correct inventory accounting errors, we issued restated consolidated financial statements as of December 31, 2011 and 2010 and for the years ended December 31, 2011, 2010 and 2009, and unaudited restated financial statements for interim periods in 2011 and interim periods ended on March 30, 2012 and June 29, 2012. In January 2014, principally to correct errors relating to revenue recognition with respect to bill and hold sales, we issued restated consolidated financial statements (which also encompassed matters addressed in the earlier restatement) as of December 31, 2012, 2011 and 2010 and for the years ended December 31, 2012, 2011, 2010 and 2009, and unaudited restated financial statements for interim periods in 2011 and 2012 and the interim period ended on March 29, 2013.
As previously disclosed, we voluntarily contacted the SEC and the DOJ to advise both agencies of our internal investigations. We cooperated with investigations of these matters by the SEC and the DOJ and made significant compliance enhancements.
In December 2016 we entered into agreements with the SEC and the DOJ that bring to a conclusion those agencies’ respective investigations relating to the FCPA and the SEC’s separate accounting investigation related to our financial restatements impacting fiscal years 2012 and prior. Pursuant to those agreements, we will pay fines, disgorgement and pre-judgment interest to the SEC and DOJ in the total amount of $82.3 million.
Our resolution with the SEC encompasses both the FCPA issues and the separate accounting and disclosure issues that were the subject of our prior restatements. We will disgorge profits of approximately $51.2 million and pay pre-judgment interest of approximately $4.1 million in connection with the FCPA matter, and pay a civil penalty in connection with the restatement-related matters of $6.5 million.
As part of the DOJ resolution for the FCPA matter, we will pay a penalty of approximately $20.5 million. We have entered into a non-prosecution agreement with the DOJ which will be in effect for three years. No criminal charges will be brought against us provided we comply with our obligations under the agreement. Neither the SEC nor the DOJ is requiring an independent compliance monitor. Instead, we agreed to annual self-reporting for a period of three years.
The DOJ penalty of $20.5 million was paid in a single payment in January 2017. We paid $12.4 million to the SEC in January 2017, and will pay approximately $18.5 million to the SEC within 180 days of the date of the resolution and will make a final payment of approximately $30.9 million to the SEC within 360 days of the date of the resolution. As of the third quarter of 2016, we had accrued $33 million for the FCPA-related investigations. As a result of the resolutions with the DOJ and the SEC, we recorded a charge of approximately $49.3 million in the SG&A expenses caption of the Consolidated Statements of Operations and Comprehensive Income (Loss) in the fourth quarter of 2016. Taking this charge into account, we have recognized all costs associated with the resolution of these matters with the DOJ and SEC.
Purported class action and derivative litigation
Litigation was initiated against us and certain of our current and former directors, executive officers and employees following the restating of our financial statements principally as a result of the matters described above under “Resolution of SEC and DOJ investigations” relating to our Brazilian business.
Two civil complaints were filed in the United States District Court for the Southern District of New York on October 21, 2013 and December 4, 2013 by named plaintiffs, on behalf of purported classes of persons who purchased or otherwise acquired our publicly traded securities, against us, Gregory Kenny, our former President and Chief Executive Officer, and Brian Robinson, our former Executive Vice President and Chief Financial Officer. On our motion, the complaints were transferred to the United States District Court for the Eastern District of Kentucky, the actions were consolidated, and a consolidated complaint was filed in that Court on May 20, 2014 by City of Livonia Employees Retirement System, as lead plaintiff on behalf of a purported class of all persons or entities who purchased our securities between November 3, 2010 and October 14, 2013 (the “City of Livonia Complaint”). The City of Livonia Complaint alleged claims under the antifraud and controlling person liability provisions of the Exchange Act, alleging generally, among other assertions, that we employed inadequate internal financial reporting controls that resulted in, among other things, improper revenue recognition, understated cost of sales, overstated operating income, net income and earnings per share, and the failure to detect inventory lost through theft; that we issued materially false financial results that had to be restated on two occasions; and that statements of Messrs. Kenny and Robinson that they had tested and found effective our internal controls over financial reporting and disclosure were false. The City of Livonia Complaint alleged that as a result of the foregoing, our stock price was artificially inflated and the plaintiffs suffered damages in connection with their purchase of our stock. The City of Livonia Complaint sought damages in an unspecified amount; reasonable costs and expenses, including counsel and experts fees; and such equitable injunctive or other relief as the Court deems just and proper. On January 27, 2015, the Court dismissed the City of Livonia Complaint, with prejudice, based on plaintiff’s failure to state a claim upon which relief could be granted. Plaintiff subsequently appealed the lower Court’s decisions to the Sixth Circuit Court of Appeals, which affirmed the lower Court’s decisions dismissing the case. The period of time available to plaintiff to further appeal the Sixth Circuit’s decision has now expired, and the case is closed.
99
In addition, a derivative complaint was filed on January 7, 2014 in the Campbell County, Kentucky Circuit Court against all but one member of our Board of Directors, including Mr. Kenny, two former directors, Mr. Robinson and two former officers, one of whom is a former executive officer. The derivative complaint alleges that the defendants breached their fiduciary duties by knowingly failing to ensure that we implemented and maintained adequate internal controls over our accounting and financial reporting functions and by knowingly disseminating to stockholders materially false and misleading statements concerning our financial results and internal controls. The derivative complaint seeks damages in an unspecified amount, appropriate equitable relief to remedy the alleged breaches of fiduciary duty, attorneys’ fees, experts’ fees and other costs. On March 5, 2014, the derivative case was placed on inactive status until a motion is filed by a party to reinstate the action to the Court’s active docket. On July 27, 2016, plaintiff filed a Notice of Dismissal with the Court, voluntarily terminating the derivative litigation.
FCPA-related litigation matters
A civil complaint was filed in the United States District Court for the Southern District of New York on January 5, 2017, by named plaintiffs, on behalf of purported classes of persons who purchased or otherwise acquired our publicly traded securities, against us, Gregory Kenny, our former President and Chief Executive Officer, and Brian Robinson, our former Executive Vice President and Chief Financial Officer (the “Doshi Complaint”). The parties have stipulated to the transfer of the matter to the Eastern District of Kentucky and await court approval of that agreement. The Doshi Complaint alleges claims under the antifraud and controlling person liability provisions of the Exchange Act, alleging generally, among other assertions, that the defendants made materially false and misleading statements in various quarterly and annual reports filed with the SEC between February 2012 and February 2016. Plaintiffs claim that the Corporation failed to disclose during that period that it had paid bribes in violation of the FCPA, failed to disclose that a portion of its profits were subject to disgorgement, and failed to disclose that when this conduct was discovered it would subject the Corporation to significant monetary penalties. The Doshi Complaint alleges that as a result of the foregoing, our stock price was artificially inflated and the plaintiffs suffered damages in connection with their purchase of our stock. The Doshi Complaint seeks damages in an unspecified amount; reasonable costs and expenses, including counsel and experts fees; and such equitable injunctive or other relief as the Court deems just and proper. We have not yet responded to the Complaint. At this early stage in the litigation, we cannot determine the likelihood of nor can we reasonably estimate the range of any possible loss.
Other
In addition, we are involved in various routine legal proceedings and administrative actions incidental to our business. In the opinion of our management, these routine proceedings and actions should not, individually or in the aggregate, have a material adverse effect on our consolidated results of operations, cash flows or financial position. However, in the event of unexpected future developments, it is possible that the ultimate resolution of these matters or other similar matters, if unfavorable, may have such adverse effects.
In accordance with GAAP, we record a liability when it is both probable that a liability has been incurred and the amount of the loss can be reasonably estimated. These provisions are reviewed at least quarterly and adjusted to reflect the impacts of negotiations, settlements, rulings, advice of legal counsel, and other information and events pertaining to a particular case. To the extent additional information arises or our strategies change, it is possible that our estimate of our probable liability in these matters may change.
The General Cable Executive Severance Benefit Plan (“Severance Plan”), effective January 1, 2008, applicable to our U.S. executives holding a position of Executive Vice President or above prior to August 1, 2014, and the 2014 Executive Officer Severance Plan ("2014 Severance Plan"), applicable to the Company’s executive officers holding a position of Executive Vice President or above or the position of Chief Financial Officer, General Counsel, Chief Compliance Officer or Chief Human Resources Officer and were hired or first promoted into such position after August 1, 2014, each include a change in control provision such that the executives may receive payments or benefits in accordance with the Severance Plan or 2014 Severance Plan, as applicable, to the extent that both a change of control and a triggering event, each as defined in the Severance Plan, occur. Unless there are circumstances of ineligibility, as defined, the Company must provide payments and benefits upon both a change in control and a triggering event.
The Company has entered into various operating lease agreements related principally to certain administrative, manufacturing and distribution facilities and transportation equipment. At December 31, 2016, future minimum rental payments required under non-cancelable lease agreements during the twelve month periods beginning December 31, 2016 through December 31, 2021 and thereafter are $15.0 million, $10.4 million, $8.7 million, $7.6 million and $5.0 million, respectively, and $11.5 million thereafter. Rental expense recorded in operating income (loss) was $23.9 million, $41.6 million and $45.3 million for the years ended December 31, 2016, 2015 and 2014, respectively.
As of December 31, 2016, the Company had $23.6 million in letters of credit, $268.1 million in various performance bonds and $72.5 million in other guarantees. Other guarantees include bank guarantees and advance payment bonds. These letters of credit, performance bonds and guarantees are periodically renewed and are generally related to risk associated with self-insurance claims, defined benefit plan obligations, contract performance, quality and other various bank and financing guarantees. Advance payment bonds are often required by customers when the Company obtains advance payments to secure the production of cable for long
100
term contracts. The advance payment bonds provide the customer protection on their deposit in the event that the Company does not perform under the contract.
20. Unconsolidated Affiliated Companies
Unconsolidated affiliated companies are those in which the Company generally owns less than 50 percent of the outstanding voting shares. The Company does not control these companies and accounts for its investments in them on the equity method basis. The unconsolidated affiliated companies primarily manufacture or market wire and cable products in our Latin America and Africa/Asia Pacific segments. As of December 31, 2016 and 2015, the Company has recorded on its Consolidated Balance Sheets an investment in unconsolidated affiliated companies of $9.0 million and $8.4 million, respectively. The Company’s share of the income of these companies is reported in the Consolidated Statements of Operations and Comprehensive Income (Loss) under “Equity in net earnings of affiliated companies.” In 2016, 2015 and 2014, equity in net earnings of affiliated companies was $0.9 million, $0.5 million, and $1.4 million, respectively. As of December 31, 2016, the Company’s ownership percentage was as follows: Colada Continua Chilena, S.A. 41%, Nostag GmBH & Co. KG 33% and Pakistan Cables Limited 24.6%. In the first quarter of 2017, the Company completed the sale of its interest in Pakistan Cables Limited for cash consideration of approximately $5.3 million.
21. Fair Value
The fair market values of the Company’s financial instruments are determined based on the fair value hierarchy as discussed in ASC 820.
The Company carries derivative assets and liabilities (Level 2) and marketable equity securities (Level 1) held in the rabbi trust as part of the Company’s Deferred Compensation Plan at fair value. The fair values of derivative assets and liabilities traded in the over-the-counter market are determined using quantitative models that require the use of multiple market inputs including interest rates, prices and indices to generate pricing and volatility factors, which are used to value the position. The predominance of market inputs are actively quoted and can be validated through external sources, including brokers, market transactions and third-party pricing services. Marketable equity securities are recorded at fair value, which are based on quoted market prices.
Financial assets and liabilities measured at fair value on a recurring basis are summarized below (in millions).
Fair Value Measurement | ||||||||||||||||||||||||||||||||
December 31, 2016 | December 31, 2015 | |||||||||||||||||||||||||||||||
(in millions) | Level 1 | Level 2 | Level 3 | Fair Value | Level 1 | Level 2 | Level 3 | Fair Value | ||||||||||||||||||||||||
Assets: | ||||||||||||||||||||||||||||||||
Derivative assets | $ | — | $ | 9.3 | $ | — | $ | 9.3 | $ | — | $ | 0.9 | $ | — | $ | 0.9 | ||||||||||||||||
Equity securities (1) | 9.8 | — | — | 9.8 | 18.0 | — | — | 18.0 | ||||||||||||||||||||||||
Total Assets | $ | 9.8 | $ | 9.3 | $ | — | $ | 19.1 | $ | 18.0 | $ | 0.9 | $ | — | $ | 18.9 | ||||||||||||||||
Liabilities: | ||||||||||||||||||||||||||||||||
Derivative liabilities | $ | — | $ | 2.9 | $ | — | $ | 2.9 | $ | — | $ | 12.3 | $ | — | $ | 12.3 | ||||||||||||||||
Total liabilities | $ | — | $ | 2.9 | $ | — | $ | 2.9 | $ | — | $ | 12.3 | $ | — | $ | 12.3 | ||||||||||||||||
(1) Balance represents the market value of the assets, exclusive of the market value of restricted stock and restricted stock units held ("Deferred Stock") and the General Cable Stock Fund by participants’ elections, held in the Rabbi Trust in connection with the Company's deferred compensation plan at December 31, 2016 and December 31, 2015 classified as “other non-current assets” in the Consolidated Balance Sheets. The market value of mutual fund investments and the General Cable Stock Fund in the Rabbi Trust was $17.2 million and $25.6 million as of December 31, 2016 and December 31, 2015, respectively. Amounts payable to the plan participants at December 31, 2016 and December 31, 2015, excluding the Deferred Stock, were $11.0 million and $19.0 million, respectively, and are classified as “Other liabilities” in the Consolidated Balance Sheets.
At December 31, 2016, there were no material financial assets or financial liabilities measured at fair value on a recurring basis using significant unobservable inputs (Level 3).
The following long-lived asset impairment charges were recorded in the years ended December 31, 2016, December 31, 2015 and December 31, 2014:
In the fourth quarter of 2016, the Company recorded an impairment charge of $11.0 million related to its China machinery and equipment and real property assets. The remaining property, plant and equipment, $18.6 million, was measured at fair value at December 31, 2016.
101
In 2016, the Company also recognized asset-related charges of $21.4 million related to the Company's restructuring programs (the remaining property, plant and equipment is immaterial) and $6.0 million related to the Company's Egypt operations (Egypt was sold in the second quarter of 2016).
In 2015, the Company recognized asset-related charges of $17.7 million related to the Company's restructuring programs, $30.7 million related to the Company's Algerian operations and $13.6 million related to the Company's India operations.
In 2014, the Company recognized asset related costs of $117.5 million related to the Company's July 2014 restructuring program, $13.1 million related to a Brazil rod mill plant, $29.3 million related to the Company's Venezuela operations, $16.5 million related to the Company's India operations and impairment charges equal to the total recorded PDIC reporting unit goodwill of $155.1 million and $93.4 million of impairment charges related to the PDIC trade name.
Refer to Note 3 - Restructuring and Note 7 - Property, Plant and Equipment for additional details regarding the impairment charges.
To determine the fair value for the above long-lived asset groups, the Company utilized standard valuation techniques, including both income and market-based approaches. The fair value of the asset groups were based on significant inputs that were not observable in the market and are considered to be Level 3 inputs as defined by ASC 820. Under the income approach, the Company used a discounted cash flow method to calculate fair value based on the present value of estimated future cash flows. Assumptions used in the discounted cash flow method, such as forecasted operating results, expected growth rates, working capital needs, tax rates, and the weighted average cost of capital ("WACC"), were based on the then current market conditions and were consistent with internal management projections. The WACC rates and the growth rates assumed were in the range of 10% to 12% and 0% to 6%, respectively. Under the market approach, the Company provided an estimate of value using multiples of earnings derived from the market values of similar type businesses and considered other binding and non-binding sales offers.
102
22. Quarterly Operating Results (Unaudited)
The interim financial information is unaudited. In the opinion of management, the interim financial information reflects all adjustments necessary for a fair presentation of quarterly financial information. Quarterly results have been influenced by seasonal factors inherent in General Cable’s businesses. The sum of the quarters’ earnings per share amounts may not add to full year earnings per share because each quarter is calculated independently, and the sum of the quarters’ other figures may not add to the full year because of rounding. The Company's fiscal quarters consist of 13-week periods ending on the Friday nearest to the end of the calendar months of March, June and September. Adjustments that are material to the quarterly operating results include the effect of the disposals of businesses, restructuring costs, long-lived asset impairment charges and SEC and DOJ related charges. Refer to Note 3 - Divestitures, Note 4 - Restructuring, Note 7 - Property, Plant and Equipment and Note 19 - Commitments and Contingencies for the effect and nature of these adjustments.
First Quarter | Second Quarter | Third Quarter | Fourth Quarter | ||||||||||||
2016 | |||||||||||||||
Net sales | $ | 1,002.7 | $ | 1,021.2 | $ | 924.5 | $ | 910.0 | |||||||
Gross profit | 110.9 | 119.2 | 102.9 | 74.1 | |||||||||||
Net income (loss) including noncontrolling interest | (4.4 | ) | 28.3 | (13.7 | ) | (103.7 | ) | ||||||||
Less: net income (loss) attributable to noncontrolling interest | 0.3 | (1.5 | ) | 0.6 | 0.9 | ||||||||||
Net income (loss) attributable to Company common shareholders | (4.7 | ) | 29.8 | (14.3 | ) | (104.6 | ) | ||||||||
Net income (loss) attributable to Company common shareholders — for diluted EPS computation | (4.7 | ) | 29.8 | (14.3 | ) | (104.6 | ) | ||||||||
Earnings (loss) per common share — basic | $ | (0.10 | ) | $ | 0.60 | $ | (0.29 | ) | $ | (2.10 | ) | ||||
Earnings (loss) per common share — assuming dilution | $ | (0.10 | ) | $ | 0.57 | $ | (0.29 | ) | $ | (2.10 | ) | ||||
First Quarter | Second Quarter | Third Quarter | Fourth Quarter | ||||||||||||
2015 | |||||||||||||||
Net sales | $ | 1,262.3 | $ | 1,202.9 | $ | 1,096.4 | $ | 952.9 | |||||||
Gross profit | 120.7 | 131.5 | 115.3 | 64.9 | |||||||||||
Net income (loss) including noncontrolling interest | (40.9 | ) | (8.4 | ) | (31.8 | ) | (54.7 | ) | |||||||
Less: net income (loss) attributable to noncontrolling interest | (2.8 | ) | (1.5 | ) | (2.8 | ) | (6.8 | ) | |||||||
Net income (loss) attributable to Company common shareholders | (38.1 | ) | (6.9 | ) | (29.0 | ) | (47.9 | ) | |||||||
Net income (loss) attributable to Company common shareholders — for diluted EPS computation | (38.1 | ) | (6.9 | ) | (29.0 | ) | (47.9 | ) | |||||||
Earnings (loss) per common share — basic | $ | (0.78 | ) | $ | (0.14 | ) | $ | (0.59 | ) | $ | (0.98 | ) | |||
Earnings (loss) per common share — assuming dilution | $ | (0.78 | ) | $ | (0.14 | ) | $ | (0.59 | ) | $ | (0.98 | ) | |||
103
23. Supplemental Guarantor Condensed Financial Information
General Cable Corporation (“Parent Company”) and its U.S. 100% wholly-owned subsidiaries (“Guarantor Subsidiaries”) fully and unconditionally guarantee the $600.0 million of 5.75% Senior Notes due in 2022 of the Parent Company on a joint and several basis. The following tables present financial information about the Parent Company, Guarantor Subsidiaries and Non-Guarantor Subsidiaries in millions. Intercompany transactions are eliminated in the "Eliminations" column of the Supplemental Guarantor Condensed Financial Information tables.
Condensed Statement of Operations and Comprehensive Income (Loss) Information
Year Ended December 31, 2016
Parent | Guarantor Subsidiaries | Non- Guarantor Subsidiaries | Eliminations | Total | |||||||||||||||
Net sales: | |||||||||||||||||||
Customers | $ | — | $ | 1,730.3 | $ | 2,128.1 | $ | — | $ | 3,858.4 | |||||||||
Intercompany | 63.2 | 206.4 | 155.3 | (424.9 | ) | — | |||||||||||||
63.2 | 1,936.7 | 2,283.4 | (424.9 | ) | 3,858.4 | ||||||||||||||
Cost of sales | — | 1,703.0 | 2,110.0 | (361.7 | ) | 3,451.3 | |||||||||||||
Gross profit | 63.2 | 233.7 | 173.4 | (63.2 | ) | 407.1 | |||||||||||||
Selling, general and administrative expenses | 111.8 | 127.9 | 232.4 | (63.2 | ) | 408.9 | |||||||||||||
Goodwill impairment charges | — | 7.4 | 1.6 | — | 9.0 | ||||||||||||||
Intangible asset impairment charges | — | 5.0 | 2.5 | — | 7.5 | ||||||||||||||
Operating income (loss) | (48.6 | ) | 93.4 | (63.1 | ) | — | (18.3 | ) | |||||||||||
Other income (expense) | — | 1.5 | 5.7 | — | 7.2 | ||||||||||||||
Interest income (expense): | |||||||||||||||||||
Interest expense | (57.6 | ) | (65.3 | ) | (27.3 | ) | 60.7 | (89.5 | ) | ||||||||||
Interest income | 55.6 | 5.1 | 2.5 | (60.7 | ) | 2.5 | |||||||||||||
(2.0 | ) | (60.2 | ) | (24.8 | ) | — | (87.0 | ) | |||||||||||
Income (loss) before income taxes | (50.6 | ) | 34.7 | (82.2 | ) | — | (98.1 | ) | |||||||||||
Income tax (provision) benefit | 9.7 | 18.4 | (24.4 | ) | — | 3.7 | |||||||||||||
Equity in net earnings of affiliated companies and subsidiaries | (52.9 | ) | (106.0 | ) | 0.2 | 159.6 | 0.9 | ||||||||||||
Net income (loss) including noncontrolling interest | (93.8 | ) | (52.9 | ) | (106.4 | ) | 159.6 | (93.5 | ) | ||||||||||
Less: net income (loss) attributable to noncontrolling interest | — | — | 0.3 | — | 0.3 | ||||||||||||||
Net income (loss) attributable to Company common shareholders | $ | (93.8 | ) | $ | (52.9 | ) | $ | (106.7 | ) | $ | 159.6 | $ | (93.8 | ) | |||||
Comprehensive income (loss): | |||||||||||||||||||
Net income (loss) | $ | (93.8 | ) | $ | (52.9 | ) | $ | (106.4 | ) | $ | 159.6 | $ | (93.5 | ) | |||||
Currency translation gain (loss) | 47.2 | 47.2 | 45.6 | (92.1 | ) | 47.9 | |||||||||||||
Defined benefit plan adjustments, net of tax | 6.6 | 6.6 | 0.6 | (7.2 | ) | 6.6 | |||||||||||||
Comprehensive income (loss), net of tax | (40.0 | ) | 0.9 | (60.2 | ) | 60.3 | (39.0 | ) | |||||||||||
Comprehensive income (loss) attributable to noncontrolling interest, net of tax | — | — | 1.0 | — | 1.0 | ||||||||||||||
Comprehensive income (loss) attributable to Company common shareholders, net of tax | $ | (40.0 | ) | $ | 0.9 | $ | (61.2 | ) | $ | 60.3 | $ | (40.0 | ) | ||||||
104
Condensed Statement of Operations and Comprehensive Income (Loss) Information
Year Ended December 31, 2015
Parent | Guarantor Subsidiaries | Non- Guarantor Subsidiaries | Eliminations | Total | |||||||||||||||
Net sales: | |||||||||||||||||||
Customers | $ | — | $ | 1,926.4 | $ | 2,588.1 | $ | — | $ | 4,514.5 | |||||||||
Intercompany | 75.6 | 219.2 | 151.1 | (445.9 | ) | — | |||||||||||||
75.6 | 2,145.6 | 2,739.2 | (445.9 | ) | 4,514.5 | ||||||||||||||
Cost of sales | — | 1,889.9 | 2,562.5 | (370.3 | ) | 4,082.1 | |||||||||||||
Gross profit | 75.6 | 255.7 | 176.7 | (75.6 | ) | 432.4 | |||||||||||||
Selling, general and administrative expenses | 75.6 | 185.1 | 227.2 | (75.6 | ) | 412.3 | |||||||||||||
Goodwill impairment charges | — | — | 3.9 | — | 3.9 | ||||||||||||||
Intangible asset impairment charges | — | — | 1.7 | — | 1.7 | ||||||||||||||
Operating income | — | 70.6 | (56.1 | ) | — | 14.5 | |||||||||||||
Other income (expense) | 0.7 | (8.1 | ) | (63.9 | ) | — | (71.3 | ) | |||||||||||
Interest income (expense): | |||||||||||||||||||
Interest expense | (58.2 | ) | (66.2 | ) | (36.4 | ) | 63.8 | (97.0 | ) | ||||||||||
Interest income | 56.2 | 7.5 | 2.8 | (63.8 | ) | 2.7 | |||||||||||||
(2.0 | ) | (58.7 | ) | (33.6 | ) | — | (94.3 | ) | |||||||||||
Income (loss) before income taxes | (1.3 | ) | 3.8 | (153.6 | ) | — | (151.1 | ) | |||||||||||
Income tax (provision) benefit | 0.3 | 21.2 | (6.7 | ) | — | 14.8 | |||||||||||||
Equity in net earnings of affiliated companies and subsidiaries | (120.9 | ) | (145.9 | ) | 0.2 | 267.1 | 0.5 | ||||||||||||
Net income (loss) including noncontrolling interest | (121.9 | ) | (120.9 | ) | (160.1 | ) | 267.1 | (135.8 | ) | ||||||||||
Less: net income (loss) attributable to noncontrolling interest | — | — | (13.9 | ) | — | (13.9 | ) | ||||||||||||
Net income (loss) attributable to Company common shareholders | $ | (121.9 | ) | $ | (120.9 | ) | $ | (146.2 | ) | $ | 267.1 | $ | (121.9 | ) | |||||
Comprehensive income (loss): | |||||||||||||||||||
Net income (loss) | $ | (121.9 | ) | $ | (120.9 | ) | $ | (160.1 | ) | $ | 267.1 | $ | (135.8 | ) | |||||
Currency translation gain (loss) | (100.2 | ) | (100.2 | ) | (71.4 | ) | 171.6 | (100.2 | ) | ||||||||||
Defined benefit plan adjustments, net of tax | 15.1 | 15.1 | 10.0 | (25.1 | ) | 15.1 | |||||||||||||
Comprehensive income (loss), net of tax | (207.0 | ) | (206.0 | ) | (221.5 | ) | 413.6 | (220.9 | ) | ||||||||||
Comprehensive income (loss) attributable to noncontrolling interest, net of tax | — | — | (22.2 | ) | — | (22.2 | ) | ||||||||||||
Comprehensive income (loss) attributable to Company common shareholders, net of tax | $ | (207.0 | ) | $ | (206.0 | ) | $ | (199.3 | ) | $ | 413.6 | $ | (198.7 | ) | |||||
105
Condensed Statement of Operations and Comprehensive Income (Loss) Information
Year Ended December 31, 2014
Parent | Guarantor Subsidiaries | Non- Guarantor Subsidiaries | Eliminations | Total | |||||||||||||||
Net sales: | |||||||||||||||||||
Customers | $ | — | $ | 2,064.9 | $ | 3,914.9 | $ | — | $ | 5,979.8 | |||||||||
Intercompany | 58.8 | 303.6 | 200.3 | (562.7 | ) | — | |||||||||||||
58.8 | 2,368.5 | 4,115.2 | (562.7 | ) | 5,979.8 | ||||||||||||||
Cost of sales | — | 2,103.8 | 3,986.7 | (503.9 | ) | 5,586.6 | |||||||||||||
Gross profit | 58.8 | 264.7 | 128.5 | (58.8 | ) | 393.2 | |||||||||||||
Selling, general and administrative expenses | 49.9 | 181.3 | 278.3 | (58.8 | ) | 450.7 | |||||||||||||
Goodwill impairment charges | — | — | 155.1 | — | 155.1 | ||||||||||||||
Intangible asset impairment charges | — | 2.1 | 96.7 | — | 98.8 | ||||||||||||||
Operating income | 8.9 | 81.3 | (401.6 | ) | — | (311.4 | ) | ||||||||||||
Other income (expense) | (1.5 | ) | 5.3 | (216.7 | ) | — | (212.9 | ) | |||||||||||
Interest income (expense): | |||||||||||||||||||
Interest expense | (63.0 | ) | (65.7 | ) | (57.0 | ) | 69.4 | (116.3 | ) | ||||||||||
Interest income | 55.2 | 13.9 | 4.8 | (69.4 | ) | 4.5 | |||||||||||||
(7.8 | ) | (51.8 | ) | (52.2 | ) | — | (111.8 | ) | |||||||||||
Income (loss) before income taxes | (0.4 | ) | 34.8 | (670.5 | ) | — | (636.1 | ) | |||||||||||
Income tax (provision) benefit | 0.1 | (11.4 | ) | 3.0 | — | (8.3 | ) | ||||||||||||
Equity in net earnings of affiliated companies and subsidiaries | (627.3 | ) | (650.7 | ) | 0.8 | 1,278.6 | 1.4 | ||||||||||||
Net income (loss) including noncontrolling interest | (627.6 | ) | (627.3 | ) | (666.7 | ) | 1,278.6 | (643.0 | ) | ||||||||||
Less: net income (loss) attributable to noncontrolling interest | — | — | (15.4 | ) | — | (15.4 | ) | ||||||||||||
Net income (loss) attributable to Company common shareholders | $ | (627.6 | ) | $ | (627.3 | ) | $ | (651.3 | ) | $ | 1,278.6 | $ | (627.6 | ) | |||||
Comprehensive income (loss): | |||||||||||||||||||
Net income (loss) | $ | (627.6 | ) | $ | (627.3 | ) | $ | (666.7 | ) | $ | 1,278.6 | $ | (643.0 | ) | |||||
Currency translation gain (loss) | (118.0 | ) | (118.0 | ) | (61.0 | ) | 199.7 | (97.3 | ) | ||||||||||
Defined benefit plan adjustments, net of tax | (25.7 | ) | (25.7 | ) | (12.4 | ) | 38.1 | (25.7 | ) | ||||||||||
Other, net of tax | (7.6 | ) | (7.6 | ) | — | 7.6 | (7.6 | ) | |||||||||||
Comprehensive income (loss), net of tax | (778.9 | ) | (778.6 | ) | (740.1 | ) | 1,524.0 | (773.6 | ) | ||||||||||
Comprehensive income (loss) attributable to noncontrolling interest, net of tax | — | — | 5.3 | — | 5.3 | ||||||||||||||
Comprehensive income (loss) attributable to Company common shareholders, net of tax | $ | (778.9 | ) | $ | (778.6 | ) | $ | (745.4 | ) | $ | 1,524.0 | $ | (778.9 | ) | |||||
106
Condensed Balance Sheet Information
December 31, 2016
Parent | Guarantor Subsidiaries | Non- Guarantor Subsidiaries | Eliminations | Total | |||||||||||||||
Assets | |||||||||||||||||||
Current assets: | |||||||||||||||||||
Cash and cash equivalents | $ | — | $ | 1.0 | $ | 100.1 | $ | — | $ | 101.1 | |||||||||
Receivables, net of allowances | — | 202.9 | 461.6 | — | 664.5 | ||||||||||||||
Inventories | — | 363.4 | 404.8 | 768.2 | |||||||||||||||
Prepaid expenses and other | — | 26.2 | 39.2 | — | 65.4 | ||||||||||||||
Total current assets | — | 593.5 | 1,005.7 | — | 1,599.2 | ||||||||||||||
Property, plant and equipment, net | 0.3 | 202.8 | 326.2 | — | 529.3 | ||||||||||||||
Deferred income taxes | — | 42.9 | 20.4 | (42.9 | ) | 20.4 | |||||||||||||
Intercompany accounts | 1,092.4 | 104.7 | 69.4 | (1,266.5 | ) | — | |||||||||||||
Investment in subsidiaries | 73.2 | 612.7 | — | (685.9 | ) | — | |||||||||||||
Goodwill | — | 5.6 | 6.4 | — | 12.0 | ||||||||||||||
Intangible assets, net | — | 6.0 | 22.3 | — | 28.3 | ||||||||||||||
Unconsolidated affiliated companies | — | 8.8 | 0.2 | — | 9.0 | ||||||||||||||
Other non-current assets | — | 15.5 | 27.9 | — | 43.4 | ||||||||||||||
Total assets | $ | 1,165.9 | $ | 1,592.5 | $ | 1,478.5 | $ | (1,995.3 | ) | $ | 2,241.6 | ||||||||
Liabilities and Total Equity | |||||||||||||||||||
Current liabilities: | |||||||||||||||||||
Accounts payable | $ | — | $ | 112.4 | $ | 301.6 | $ | — | $ | 414.0 | |||||||||
Accrued liabilities | 93.4 | 105.0 | 221.2 | — | 419.6 | ||||||||||||||
Current portion of long-term debt | — | — | 67.5 | — | 67.5 | ||||||||||||||
Total current liabilities | 93.4 | 217.4 | 590.3 | — | 901.1 | ||||||||||||||
Long-term debt | 772.3 | 75.9 | 22.9 | — | 871.1 | ||||||||||||||
Deferred income taxes | 147.1 | — | 22.5 | (42.9 | ) | 126.7 | |||||||||||||
Intercompany accounts | — | 1,161.1 | 105.4 | (1,266.5 | ) | — | |||||||||||||
Other liabilities | — | 64.9 | 108.9 | — | 173.8 | ||||||||||||||
Total liabilities | 1,012.8 | 1,519.3 | 850.0 | (1,309.4 | ) | 2,072.7 | |||||||||||||
Total Company shareholders’ equity | 153.1 | 73.2 | 612.7 | (685.9 | ) | 153.1 | |||||||||||||
Noncontrolling interest | — | — | 15.8 | — | 15.8 | ||||||||||||||
Total liabilities, redeemable noncontrolling interest and equity | $ | 1,165.9 | $ | 1,592.5 | $ | 1,478.5 | $ | (1,995.3 | ) | $ | 2,241.6 | ||||||||
107
Condensed Balance Sheet Information
December 31, 2015
Parent | Guarantor Subsidiaries | Non- Guarantor Subsidiaries | Eliminations | Total | |||||||||||||||
Assets | |||||||||||||||||||
Current assets: | |||||||||||||||||||
Cash and cash equivalents | $ | — | $ | 0.8 | $ | 111.6 | $ | — | $ | 112.4 | |||||||||
Receivables, net of allowances | — | 214.0 | 501.4 | — | 715.4 | ||||||||||||||
Inventories | — | 367.7 | 478.7 | — | 846.4 | ||||||||||||||
Prepaid expenses and other | — | 18.5 | 47.7 | — | 66.2 | ||||||||||||||
Total current assets | — | 601.0 | 1,139.4 | — | 1,740.4 | ||||||||||||||
Property, plant and equipment, net | 0.4 | 192.6 | 370.2 | — | 563.2 | ||||||||||||||
Deferred income taxes | — | 56.2 | 30.9 | (56.2 | ) | 30.9 | |||||||||||||
Intercompany accounts | 1,114.5 | 102.8 | 66.4 | (1,283.7 | ) | — | |||||||||||||
Investment in subsidiaries | 72.4 | 672.8 | — | (745.2 | ) | — | |||||||||||||
Goodwill | — | 13.8 | 8.4 | — | 22.2 | ||||||||||||||
Intangible assets, net | — | 9.5 | 27.1 | — | 36.6 | ||||||||||||||
Unconsolidated affiliated companies | — | 8.4 | — | — | 8.4 | ||||||||||||||
Other non-current assets | — | 27.1 | 25.8 | — | 52.9 | ||||||||||||||
Total assets | $ | 1,187.3 | $ | 1,684.2 | $ | 1,668.2 | $ | (2,085.1 | ) | $ | 2,454.6 | ||||||||
Liabilities and Total Equity | |||||||||||||||||||
Current liabilities: | |||||||||||||||||||
Accounts payable | $ | — | $ | 103.5 | $ | 325.2 | $ | — | $ | 428.7 | |||||||||
Accrued liabilities | 11.2 | 124.0 | 217.3 | — | 352.5 | ||||||||||||||
Current portion of long-term debt | — | — | 168.1 | — | 168.1 | ||||||||||||||
Total current liabilities | 11.2 | 227.5 | 710.6 | — | 949.3 | ||||||||||||||
Long-term debt | 768.6 | 127.5 | 15.5 | — | 911.6 | ||||||||||||||
Deferred income taxes | 179.5 | — | 22.2 | (56.2 | ) | 145.5 | |||||||||||||
Intercompany accounts | — | 1,180.1 | 103.6 | (1,283.7 | ) | — | |||||||||||||
Other liabilities | — | 76.7 | 110.4 | — | 187.1 | ||||||||||||||
Total liabilities | 959.3 | 1,611.8 | 962.3 | (1,339.9 | ) | 2,193.5 | |||||||||||||
Redeemable noncontrolling interest | — | — | 18.2 | — | 18.2 | ||||||||||||||
Total Company shareholders’ equity | 228.0 | 72.4 | 672.8 | (745.2 | ) | 228.0 | |||||||||||||
Noncontrolling interest | — | — | 14.9 | — | 14.9 | ||||||||||||||
Total liabilities, redeemable noncontrolling interest and equity | $ | 1,187.3 | $ | 1,684.2 | $ | 1,668.2 | $ | (2,085.1 | ) | $ | 2,454.6 | ||||||||
108
Condensed Statement of Cash Flows Information
Year Ended December 31, 2016
Parent | Guarantor Subsidiaries | Non- Guarantor Subsidiaries | Eliminations | Total | |||||||||||||||
Net cash flows of operating activities | $ | 6.3 | $ | 63.2 | $ | 85.1 | $ | — | $ | 154.6 | |||||||||
Cash flows of investing activities: | |||||||||||||||||||
Capital expenditures | — | (48.0 | ) | (36.1 | ) | — | (84.1 | ) | |||||||||||
Proceeds from properties sold | — | 0.7 | 0.8 | — | 1.5 | ||||||||||||||
Disposal of subsidiaries, net of cash disposed of | — | 76.8 | 5.0 | — | 81.8 | ||||||||||||||
Other | — | (1.0 | ) | 1.2 | — | 0.2 | |||||||||||||
Net cash flows of investing activities | — | 28.5 | (29.1 | ) | — | (0.6 | ) | ||||||||||||
Cash flows of financing activities: | |||||||||||||||||||
Dividends paid to shareholders | (35.6 | ) | — | — | — | (35.6 | ) | ||||||||||||
Intercompany accounts | 28.1 | (42.0 | ) | 13.9 | — | — | |||||||||||||
Proceeds from debt | — | 1,114.0 | 402.2 | — | 1,516.2 | ||||||||||||||
Repayments of debt | — | (1,165.7 | ) | (469.5 | ) | — | (1,635.2 | ) | |||||||||||
Purchase of noncontrolling interest | — | — | (18.0 | ) | — | (18.0 | ) | ||||||||||||
Dividends paid to noncontrolling interest | — | — | (0.1 | ) | — | (0.1 | ) | ||||||||||||
Proceeds from exercise of stock options | 1.2 | — | — | — | 1.2 | ||||||||||||||
Proceeds from sale leaseback transaction | — | — | 6.2 | — | 6.2 | ||||||||||||||
Net cash flows of financing activities | (6.3 | ) | (93.7 | ) | (65.3 | ) | — | (165.3 | ) | ||||||||||
Effect of exchange rate changes on cash and cash equivalents | — | 2.2 | (2.2 | ) | — | — | |||||||||||||
Increase (decrease) in cash and cash equivalents | — | 0.2 | (11.5 | ) | — | (11.3 | ) | ||||||||||||
Cash and cash equivalents — beginning of period | — | 0.8 | 111.6 | — | 112.4 | ||||||||||||||
Cash and cash equivalents — end of period | $ | — | $ | 1.0 | $ | 100.1 | $ | — | $ | 101.1 | |||||||||
109
Condensed Statement of Cash Flows Information
Year Ended December 31, 2015
Parent | Guarantor Subsidiaries | Non- Guarantor Subsidiaries | Eliminations | Total | |||||||||||||||
Net cash flows of operating activities | $ | 1.8 | $ | 179.2 | $ | 29.6 | $ | (11.7 | ) | $ | 198.9 | ||||||||
Cash flows of investing activities: | |||||||||||||||||||
Capital expenditures | — | (18.6 | ) | (42.9 | ) | — | (61.5 | ) | |||||||||||
Proceeds from properties sold | — | 0.1 | 1.7 | — | 1.8 | ||||||||||||||
Reduction of cash due to Venezuela deconsolidation | — | — | (8.2 | ) | — | (8.2 | ) | ||||||||||||
Disposal of subsidiaries, net of cash disposed of | — | 88.4 | (10.0 | ) | — | 78.4 | |||||||||||||
Other | — | (0.2 | ) | 0.2 | — | — | |||||||||||||
Net cash flows of investing activities | — | 69.7 | (59.2 | ) | — | 10.5 | |||||||||||||
Cash flows of financing activities: | |||||||||||||||||||
Dividends paid to shareholders | (35.3 | ) | — | — | — | (35.3 | ) | ||||||||||||
Intercompany accounts | 158.3 | (208.4 | ) | 38.4 | 11.7 | — | |||||||||||||
Proceeds from debt | — | 2,082.1 | 863.4 | — | 2,945.5 | ||||||||||||||
Repayments of debt | (125.0 | ) | (2,091.3 | ) | (950.9 | ) | — | (3,167.2 | ) | ||||||||||
Dividends paid to noncontrolling interest | — | — | (2.5 | ) | — | (2.5 | ) | ||||||||||||
Proceeds from exercise of stock options | 0.2 | — | — | — | 0.2 | ||||||||||||||
Net cash flows of financing activities | (1.8 | ) | (217.6 | ) | (51.6 | ) | 11.7 | (259.3 | ) | ||||||||||
Effect of exchange rate changes on cash and cash equivalents | — | (31.7 | ) | (11.8 | ) | — | (43.5 | ) | |||||||||||
Increase (decrease) in cash and cash equivalents | — | (0.4 | ) | (93.0 | ) | — | (93.4 | ) | |||||||||||
Cash and cash equivalents — beginning of period | — | 1.2 | 204.6 | — | 205.8 | ||||||||||||||
Cash and cash equivalents — end of period | $ | — | $ | 0.8 | $ | 111.6 | $ | — | $ | 112.4 | |||||||||
110
Condensed Statement of Cash Flows Information
Year Ended December 31, 2014
Parent | Guarantor Subsidiaries | Non- Guarantor Subsidiaries | Eliminations | Total | |||||||||||||||
Net cash flows of operating activities | $ | 0.6 | $ | 116.9 | $ | 30.8 | $ | (15.1 | ) | $ | 133.2 | ||||||||
Cash flows of investing activities: | |||||||||||||||||||
Capital expenditures | — | (34.3 | ) | (55.3 | ) | — | (89.6 | ) | |||||||||||
Proceeds from properties sold | — | 16.6 | 4.8 | — | 21.4 | ||||||||||||||
Disposal of subsidiaries, net of cash disposed of | — | — | 52.4 | — | 52.4 | ||||||||||||||
Intercompany accounts | — | (19.8 | ) | — | 19.8 | — | |||||||||||||
Other | — | (1.6 | ) | 1.4 | — | (0.2 | ) | ||||||||||||
Net cash flows of investing activities | — | (39.1 | ) | 3.3 | 19.8 | (16.0 | ) | ||||||||||||
Cash flows of financing activities: | |||||||||||||||||||
Dividends paid to shareholders | (35.4 | ) | — | — | — | (35.4 | ) | ||||||||||||
Intercompany accounts | 65.0 | 49.3 | (109.6 | ) | (4.7 | ) | — | ||||||||||||
Proceeds from debt | — | 1,406.6 | 1,283.3 | — | 2,689.9 | ||||||||||||||
Repayments of debt | — | (1,494.9 | ) | (1,245.4 | ) | — | (2,740.3 | ) | |||||||||||
Purchase of noncontrolling interest | — | (1.5 | ) | 0.8 | — | (0.7 | ) | ||||||||||||
Dividends paid to noncontrolling interest | — | — | (6.2 | ) | — | (6.2 | ) | ||||||||||||
Repurchase of common shares | (30.7 | ) | — | — | — | (30.7 | ) | ||||||||||||
Proceeds from exercise of stock options | 0.3 | — | — | — | 0.3 | ||||||||||||||
Net cash flows of financing activities | (0.8 | ) | (40.5 | ) | (77.1 | ) | (4.7 | ) | (123.1 | ) | |||||||||
Effect of exchange rate changes on cash and cash equivalents | — | (38.3 | ) | (167.5 | ) | — | (205.8 | ) | |||||||||||
Cash held for sale | — | — | (1.3 | ) | — | (1.3 | ) | ||||||||||||
Increase (decrease) in cash and cash equivalents | (0.2 | ) | (1.0 | ) | (211.8 | ) | — | (213.0 | ) | ||||||||||
Cash and cash equivalents — beginning of period | 0.2 | 2.2 | 416.4 | — | 418.8 | ||||||||||||||
Cash and cash equivalents — end of period | $ | — | $ | 1.2 | $ | 204.6 | $ | — | $ | 205.8 | |||||||||
Intercompany Activity
The Parent Company and its Guarantor Subsidiaries participate in a cash pooling program. As part of this program, cash balances are generally swept on a daily basis between the Guarantor Subsidiaries’ bank accounts and those of the Parent Company. There are a significant number of the Company’s subsidiaries that participate in this cash pooling arrangement and there are thousands of transactions per week that occur between the Parent Company and Guarantor Subsidiaries, all of which are accounted for through the intercompany accounts.
Parent Company transactions include interest, dividends, tax payments and intercompany sales transactions related to administrative costs incurred by the Parent Company, which are billed to Guarantor Subsidiaries on a cost-plus basis. These costs are reported in the Parent’s “Selling, general and administrative expenses” on the Consolidated Statement of Operations and Comprehensive Income (Loss) Information for the respective period(s). All intercompany transactions are presumed to be settled in cash when they occur and are included in operating activities on the Consolidated Statements of Cash Flows. Non-operating cash flow changes have been classified as financing activities beginning in 2009.
111
A summary of cash and non-cash transactions of the Parent Company’s intercompany account is provided below:
Year ended | ||||||||||||
(in millions) | Dec 31, 2016 | Dec 31, 2015 | Dec 31, 2014 | |||||||||
Beginning Balance | $ | 1,114.5 | $ | 1,280.8 | $ | 1,305.5 | ||||||
Non-cash transactions | ||||||||||||
Deferred tax | (27.6 | ) | (19.9 | ) | 21.4 | |||||||
Equity based awards | 5.2 | 11.7 | 13.8 | |||||||||
Foreign currency and other | 28.4 | 0.2 | 5.1 | |||||||||
Cash transactions | (28.1 | ) | (158.3 | ) | (65.0 | ) | ||||||
Ending Balance | $ | 1,092.4 | $ | 1,114.5 | $ | 1,280.8 | ||||||
Dividends
There were no dividend payments to the Parent Company from the Guarantor Subsidiaries in the twelve months ended December 31, 2016, 2015, and 2014.
Parent Company Long-Term Debt
At December 31, 2016 and 2015, the Parent Company was party to various long-term financing arrangements, as summarized below (in millions):
(in millions) | Dec 31, 2016 | Dec 31, 2015 | ||||||
5.75% Senior Notes due 2022 | $ | 600.0 | $ | 600.0 | ||||
Subordinated Convertible Notes due 2029 | 429.5 | 429.5 | ||||||
Debt discount | (255.6 | ) | (257.8 | ) | ||||
Debt issuance costs | (10.6 | ) | (12.1 | ) | ||||
Other | 9.0 | 9.0 | ||||||
Total Parent Company debt | 772.3 | 768.6 | ||||||
Less current maturities | — | — | ||||||
Parent Company Long-term debt | $ | 772.3 | $ | 768.6 | ||||
(in millions) | 2017 | 2018 | 2019 | 2020 | 2021 | |||||||||||||||
Debt maturities | $ | — | $ | — | $ | — | $ | — | $ | — | ||||||||||
Long-term debt related to the Parent Company is discussed in Note 10 - Long-Term Debt.
Commitments and Contingencies
For contingencies and guarantees related to the Parent Company, refer to Note 10 - Long-Term Debt and Note 19 - Commitments and Contingencies.
112
Schedule II
GENERAL CABLE CORPORATION AND SUBSIDIARIES
Valuation and Qualifying Accounts
(in millions)
For the Year Ended | |||||||||||
Dec 31, 2016 | Dec 31, 2015 | Dec 31, 2014 | |||||||||
Accounts Receivable Allowances: | |||||||||||
Beginning balance | $ | 23.0 | $ | 32.0 | $ | 39.2 | |||||
Impact of foreign currency exchange rate changes | (0.1 | ) | (4.2 | ) | (4.2 | ) | |||||
Provision | 5.1 | 8.1 | 11.4 | ||||||||
Write-offs | (4.4 | ) | (3.1 | ) | (12.9 | ) | |||||
Other | (3.4 | ) | (9.8 | ) | (1.5 | ) | |||||
Ending balance | $ | 20.2 | $ | 23.0 | $ | 32.0 | |||||
Deferred Tax Valuation Allowance: | |||||||||||
Beginning balance | $ | 172.1 | $ | 145.4 | $ | 93.8 | |||||
Additions charged to tax expense | 27.9 | 45.8 | 111.0 | ||||||||
Changes attributable to acquisitions and dispositions | (20.5 | ) | 6.3 | (1.2 | ) | ||||||
Changes impacting equity and other movements | 0.9 | (18.6 | ) | (45.4 | ) | ||||||
Reductions from utilization and reassessments | (3.3 | ) | (6.8 | ) | (12.8 | ) | |||||
Ending balance | $ | 177.1 | $ | 172.1 | $ | 145.4 | |||||
113