Attached files
| file | filename |
|---|---|
| EX-31.2 - EXHIBIT 31.2 - FIRST POTOMAC REALTY TRUST | fpo201610-kexx312.htm |
| EX-32.2 - EXHIBIT 32.2 - FIRST POTOMAC REALTY TRUST | fpo201610-kexx322.htm |
| EX-32.1 - EXHIBIT 32.1 - FIRST POTOMAC REALTY TRUST | fpo201610-kexx321.htm |
| EX-31.1 - EXHIBIT 31.1 - FIRST POTOMAC REALTY TRUST | fpo201610-kexx311.htm |
| EX-23 - EXHIBIT 23 - FIRST POTOMAC REALTY TRUST | fpo201610-kex23.htm |
| EX-21 - EXHIBIT 21 - FIRST POTOMAC REALTY TRUST | fpo201610-kex21.htm |
| EX-12 - EXHIBIT 12 - FIRST POTOMAC REALTY TRUST | fpo201610-kex12.htm |
UNITED STATES
SECURITIES AND EXCHANGE COMMISSION
Washington, DC 20549
FORM 10-K
x | ANNUAL REPORT PURSUANT TO SECTION 13 OR 15(d) OF THE SECURITIES EXCHANGE ACT OF 1934 |
For the fiscal year ended December 31, 2016 | |
OR | |
¨ | TRANSITION REPORT PURSUANT TO SECTION 13 OR 15(d) OF THE SECURITIES EXCHANGE ACT OF 1934 |
Commission File Number 1-31824 | |
FIRST POTOMAC REALTY TRUST
(Exact name of registrant as specified in its charter)
MARYLAND | 37-1470730 | |
(State of incorporation) | (I.R.S. Employer Identification No.) | |
7600 Wisconsin Avenue, 11th Floor, Bethesda, MD |
(Address of principal executive offices) |
20814 |
(Zip Code) |
(301) 986-9200 |
(Registrant’s telephone number, including area code) |
Securities registered pursuant to Section 12(b) of the Act: |
Title of Each Class | Name of Each Exchange upon Which Registered | |
Common Shares of beneficial interest, $0.001 par value per share | New York Stock Exchange | |
Securities registered pursuant to Section 12(g) of the Act: None
Indicate by check mark if the registrant is a well-known seasoned issuer, as defined in Rule 405 of Securities Act. YES ¨ NO x
Indicate by check mark if the registrant is not required to file reports pursuant to Section 13 or Section 15(d) of the Act. YES ¨ NO x
Indicate by check mark whether the registrant (1) has filed all reports required to be filed by Section 13 or 15(d) of the Securities Exchange Act of 1934 during the preceding 12 months (or for such shorter period that the registrant was required to file such reports), and (2) has been subject to such filing requirements for the past 90 days. YES x NO ¨
Indicated by check mark whether the registrant has submitted electronically and posted on its corporate Web site, if any, every Interactive Data File required to be submitted and posted pursuant to Rule 405 of Regulation S-T (§232.405 of this chapter) during the preceding 12 months (or for such shorter period that the registrant was required to submit and post such files). Yes x No ¨
Indicate by check mark if disclosure of delinquent filers pursuant to Item 405 of Regulations S-K is not contained herein, and will not be contained, to the best of registrant’s knowledge, in definitive proxy or information statements incorporated by reference in Part III of this Form 10-K or any amendment of this Form 10-K. x
Indicate by check mark whether the registrant is a large accelerated filer, an accelerated filer, a non-accelerated filer or a smaller reporting company (see the definitions of “large accelerated filer”, “accelerated filer” and “smaller reporting company” in Rule 12b-2 of the Exchange Act).
Large Accelerated Filer | x | Accelerated Filer | o | |
Non-Accelerated Filer | o | Smaller Reporting Company | o | |
(Do not check if a smaller reporting company) | ||||
Indicate by check mark whether the registrant is a shell company (as defined in Exchange Act Rule 12b-2 of the Act) YES ¨ NO x
The aggregate fair value of the registrant’s common shares of beneficial interest, $0.001 par value per share, at June 30, 2016, held by those persons deemed by the registrant to be non-affiliates was $526,679,042.
As of February 22, 2017, there were 58,698,267 common shares of beneficial interest, par value $0.001 per share, outstanding.
Documents Incorporated By Reference
Portions of the Company’s definitive proxy statement relating to the 2017 Annual Meeting of Shareholders, to be filed with the Securities and Exchange Commission, are incorporated by reference in Part III, Items 10-14 of this Annual Report on Form 10-K as indicated herein.
1
FIRST POTOMAC REALTY TRUST
FORM 10-K
INDEX
Part I | Page | |
Item 1. | ||
Item 1A. | ||
Item 1B. | ||
Item 2. | ||
Item 3. | ||
Item 4. | ||
Part II | ||
Item 5. | ||
Item 6. | ||
Item 7. | ||
Item 7A. | ||
Item 8. | ||
Item 9. | ||
Item 9A. | ||
Item 9B. | ||
Part III | ||
Item 10. | ||
Item 11. | ||
Item 12. | ||
Item 13. | ||
Item 14. | ||
Part IV | ||
Item 15. | ||
Item 16. | ||
2
SPECIAL NOTE ABOUT FORWARD-LOOKING STATEMENTS
This report contains forward-looking statements, including statements regarding the execution of our strategic plan, potential dispositions and the timing of such dispositions, and future acquisitions and growth opportunities, within the meaning of the federal securities laws. Forward-looking statements, which are based on certain assumptions and describe future plans, strategies and expectations of the Company, are generally identifiable by use of the words “believe,” “expect,” “intend,” “anticipate,” “estimate,” “project” or similar expressions. The Company’s ability to predict results or the actual effect of future plans or strategies is inherently uncertain.
Certain factors that could cause actual results, performance or achievements to differ materially from the Company’s expectations include, among others, the following:
• | changes in general or regional economic conditions; |
• | the Company’s ability to timely lease or re-lease space at current or anticipated rents; |
• | changes in interest rates; |
• | changes in operating costs; |
• | the Company’s ability to complete acquisitions and dispositions on acceptable terms, or at all; |
• | the Company’s ability to manage its current debt levels and repay or refinance its indebtedness upon maturity or other required payment dates; |
• | the Company’s ability to maintain financial covenant compliance under its debt agreements; |
• | the Company’s ability to maintain effective internal controls over financial reporting and disclosure controls and procedures; |
• | the Company’s ability to obtain debt and/or financing on attractive terms, or at all; and |
• | other risks detailed under “Risk Factors” in Part I, Item 1A of this Annual Report on Form 10-K and in the other documents the Company files with the Securities and Exchange Commission (“SEC”), which are accessible on the SEC’s website at www.sec.gov. |
The risks set forth above are not exhaustive. Other sections of this report may include additional factors that could adversely affect the Company’s business and financial performance. Moreover, the Company operates in a very competitive and rapidly changing environment. Many of these factors are beyond the Company’s ability to control or predict. Forward-looking statements are not guarantees of performance. For forward-looking statements herein, the Company claims the protection of the safe harbor for forward-looking statements contained in the Private Securities Litigation Reform Act of 1995. The Company assumes no obligation to update or supplement forward-looking statements that become untrue because of subsequent events. We do not intend to, and expressly disclaim any duty to, update or revise the forward-looking statements in this discussion to reflect changes in underlying assumptions or factors, new information, future events, or otherwise, after the date hereof, except as may be required by law. In light of these risks and uncertainties, you should not rely upon these forward-looking statements after the date of this report and should keep in mind that any forward-looking statement made in this discussion, or elsewhere, might not occur.
3
References in this Annual Report on Form 10-K to “we,” “us,” “our,” the “Company” or “First Potomac,” refer to First Potomac Realty Trust and its subsidiaries, on a consolidated basis, unless the context indicates otherwise.
PART I
ITEM 1. | BUSINESS |
Overview
We are a leader in the ownership, management, redevelopment and development of office and business park properties in the greater Washington, D.C. region. Our focus is owning and operating properties that we believe can benefit from our market knowledge and intensive operational skills, with a focus on increasing their profitability and value. Our portfolio primarily contains a mix of single-tenant and multi-tenant office properties and business parks. Office properties are single-story and multi-story buildings that are primarily for office use, and business parks contain buildings with office features combined with some industrial property space. We separate our properties into four distinct reporting segments, which we refer to as the Washington, D.C., Maryland, Northern Virginia and Southern Virginia reporting segments.
We conduct our business through First Potomac Realty Investment Limited Partnership, our operating partnership (the “Operating Partnership”). We are the sole general partner of, and, as of December 31, 2016, owned 95.8% of the common interest in the Operating Partnership. The remaining common interests in the Operating Partnership, which are presented as noncontrolling interests in the Operating Partnership in the accompanying consolidated financial statements, are limited partnership interests that are owned by unrelated parties.
At December 31, 2016, we wholly owned properties totaling 6.7 million square feet and had a noncontrolling ownership interest in properties totaling an additional 0.9 million square feet through five unconsolidated joint ventures. We also owned land that can support 0.6 million square feet of additional development. Our consolidated properties were 92.6% occupied by 384 tenants at December 31, 2016. We do not include square footage of properties in development or redevelopment in our occupancy calculation. At December 31, 2016, none of the 6.7 million square feet owned through our properties was in development or redevelopment. We derive substantially all of our revenue from leases of space within our properties. As of December 31, 2016, our largest tenant was the U.S. Government, which accounted for 16% of our total annualized cash basis rent, and the U.S. Government combined with government contractors accounted for 27% of our total annualized cash basis rent as of December 31, 2016. We operate so as to qualify as a real estate investment trust (“REIT”) for federal income tax purposes.
For the year ended December 31, 2016, we had consolidated total revenues of $160.3 million and consolidated total assets of $1.3 billion. Financial information related to our four reporting segments is set forth in note 17, Segment Information, to our consolidated financial statements.
Our corporate headquarters are located at 7600 Wisconsin Avenue, 11th Floor, Bethesda, Maryland 20814, and we believe our current space is sufficient to meet our current needs. We do not own the building in which we lease space for our corporate headquarters. As of December 31, 2016, we had four other offices for our property management operations, which occupy approximately 18,000 square feet within buildings we own.
Our History
The Operating Partnership was formed in 1997 to focus on the acquisition, development and redevelopment of industrial properties and business parks, primarily in the suburban markets of the greater Washington, D.C. region. The Company was formed as a Maryland trust in 2003, and we completed our initial public offering in October 2003. At December 31, 2003, we owned properties totaling 2.9 million square feet and had total assets of $244.1 million. By the beginning of 2010, we had grown our portfolio to over 12 million square feet and had total assets of $1.1 billion. In 2010, we entered the office market in Washington, D.C. with the acquisition of four office properties, including one property purchased through an unconsolidated joint venture, and thereafter continued our focus on acquiring office properties. We updated our strategic and capital plan in 2013, which, among other things, included a capital recycling strategy to divest of lower quality assets. During 2013, we sold the majority of our industrial portfolio and decided to strategically focus on office properties and business parks. In 2016, we completed an extensive underwriting of our business, our portfolio and our team, and based on this underwriting, we began implementing a new strategic plan, the focus of which is to de-risk the portfolio, de-lever the balance sheet and maximize asset values (the “Strategic Plan”). See “Item 7, Management’s Discussion and Analysis of Financial Condition and Results of Operations — Strategic Plan” for a
4
detailed discussion of the Strategic Plan’s key action items and the measures we have taken to complete these strategic objectives during 2016.
Description of Business
We have used our management team’s knowledge of and experience in the greater Washington, D.C. region to transform us into a leading owner and operator of office and business park properties in the region. We believe that we are well positioned for growth given our operational capabilities in the region and access to capital, together with the large number of properties that we believe meet our investment criteria.
Our investment strategy focuses on properties in our target markets that generally meet the following investment criteria:
• | high barrier-to-entry submarkets; |
• | amenity rich and transportation friendly; |
• | institutional quality, demonstrating liquidity in most points of the real estate cycle; |
• | known employment areas; and/or |
• | in-place cash flow. |
We use our depth of local market knowledge to identify and opportunistically acquire and redevelop office buildings and business park properties. We also believe that our operational capabilities for professional property management and our transparency as a public company allow us to attract high-quality tenants to the properties that we acquire, leading, in some cases, to increased profitability and value for our properties. We also target properties that we believe can be converted, in whole or in part, to a higher use.
Competitive Advantages
We believe that our business strategy and operating model distinguish us from other owners, operators and acquirers of rental property in a number of ways, which include:
• | Experienced Management Team. Our three executive officers have over 50 years of cumulative real estate experience in the greater Washington, D.C. region; |
• | Focused Strategy. We focus primarily on high-quality, multi-story office properties in the greater Washington, D.C. region. We believe that the greater Washington, D.C. region historically has been one of the largest, most stable markets in the U.S. for assets of this type; |
• | Value-Add Management Approach. Through our hands-on approach to management, leasing, renovation and repositioning, we endeavor to add significant value to the properties that we acquire by improving tenant quality and increasing occupancy rates and net rent per square foot; |
• | Local Market Knowledge. We have established relationships with local real estate owners, the brokerage community, prospective tenants and property managers in our markets. We believe that our market knowledge enhances our efforts to identify attractive acquisition opportunities and lease space in our properties; and |
• | Diverse Tenant Mix. We believe our tenant base is highly diverse. Approximately 55% of our annualized cash basis rent is generated from our 25 largest tenants, and our largest 100 tenants generate approximately 79% of our annualized cash basis rent. The balance of our tenants, which is comprised of over 250 different companies, generates the remaining 21% of our annualized cash basis rent. We believe that our diversified tenant base provides a desirable mix of stability, diversity and growth potential. |
5
Our Markets
We operate, acquire, develop and redevelop, office and business park properties in the greater Washington, D.C. region. Within this area, our primary market is the Washington, D.C. metropolitan statistical area (“MSA”), which includes Washington D.C., Northern Virginia and suburban Maryland. Additionally, we own and operate office and business park properties in the Virginia Beach-Norfolk-Newport News MSA, where our Southern Virginia properties are located, as well as in the Baltimore-Columbia-Towson MSA where the remainder of our Maryland properties are located (Annapolis and Columbia). We derive approximately 74.1% of our annualized cash basis rent from the Washington, D.C. MSA, 19.6% from Virginia Beach-Norfolk-Newport News MSA, and the remaining 6.3% of our annualized cash basis rent comes from properties within the Baltimore-Columbia-Towson MSA.
According to data from Transwestern, a commercial real estate services provider, the Washington, D.C. MSA contains approximately 423 million square feet of office property and is the second largest office market in the country behind New York. The Washington, D.C. MSA office market totaled 2.3 million square feet of positive net absorption during 2016. The region also contains approximately 402 million square feet of flex/business park/industrial property, which is the smallest amongst the nation’s largest metro areas.
In 2016, the Washington, D.C. MSA was the sixth largest job market in the United States behind Los Angeles, New York, Dallas, San Francisco and Atlanta. Through November 2016, the D.C. MSA added more than 65,500 jobs, primarily in professional & business services, education & health, state & local government, and leisure & hospitality, according to the Transwestern / Delta Associates’ publication “TrendLines 2017, Investing in the Future”. The publication also stated that the Washington, D.C. MSA is estimated to add an annual average of 43,600 jobs from 2017 to 2021, with private sector firms leading the way. As of November 2016, the Washington D.C. MSA had an unemployment rate of 3.7%, the fifth lowest among its peer metropolitan areas, trailing only Boston, Denver, Dallas and San Francisco according to the Transwestern / Delta Associates’ publication.
The Virginia Beach-Norfolk-Newport News MSA is our second largest market when measured by annualized cash basis rent and square footage. We own approximately 2 million square feet in the region and derive 19.6% of our annualized cash basis rent from the market. Norfolk is home to the largest military installation in the world, according to the United States Navy, and remains heavily invested in the defense and shipping industries, as it is the only NATO command on U.S. soil. In addition, the Norfolk port is the third largest port on the East Coast of the United States, has the deepest, obstruction-free channels available on the East Coast, and is the only East Coast port with Congressional authorization for 55-foot depth channels, according to the Virginia Port Authority.
The Baltimore-Columbia-Towson MSA is our smallest market when measured by annualized cash basis rent and square footage. We own approximately 470,000 square feet in the region and derive 6.3% of our annualized cash basis rent from the market. The properties that we own in the Baltimore-Columbia-Towson MSA are located in Columbia and Annapolis, Maryland. Columbia is a planned community that benefits from its strategic location between the cities of Washington, D.C. and Baltimore, Maryland. Columbia has consistently ranked in the top ten of CNN Money's “Best Places to Live in America”. Annapolis is the Maryland state capital and home to the U.S. Naval Academy.
Competition
We compete with other real estate investment trusts (“REITs”), public and private real estate companies, private real estate investors and lenders, both domestic and foreign, in acquiring and developing properties. Many of these entities have greater resources than we do or other competitive advantages. We also face competition in leasing or subleasing available properties to prospective tenants.
We believe that our management’s experience and relationships in, and local knowledge of, the markets in which we operate put us at a competitive advantage when seeking acquisitions. However, many of our competitors have greater resources than we do, or may have a more flexible capital structure when seeking to finance acquisitions. We also face competition in leasing or subleasing available properties to prospective tenants. Some real estate operators may be willing to enter into leases at lower contractual rental rates (particularly if tenants, due to the economy, seek lower rents). However, we believe that our intensive management services are attractive to tenants and serve as a competitive advantage.
6
Environmental Matters
Under various federal, state and local environmental laws and regulations, a current or previous owner, operator or tenant of rental property may be required to investigate and clean up hazardous or toxic substances or petroleum product releases or threats of releases at such property, and may be held liable to a government entity or to third parties for natural resource damages, personal injury, property damage and for investigation, clean up and monitoring costs incurred by such parties in connection with the actual or threatened contamination. Such laws typically impose clean up responsibility and liability without regard to fault, or whether or not the owner, operator or tenant knew of or caused the presence of the contamination. The liability under such laws may be joint and several for the full amount of the investigation, clean-up and monitoring costs incurred or to be incurred or actions to be undertaken. These costs may be substantial, and can exceed the fair value of the property. The presence of contamination or the failure to properly remediate contamination on such property may adversely affect the ability of the owner, operator or tenant to sell or rent such property or to borrow using such property as collateral, and may adversely impact our investment in a property.
Federal and state regulations require building owners and those exercising control over a building’s management to identify and warn, via signs and labels, of potential hazards posed by workplace exposure to installed asbestos-containing materials and potentially asbestos-containing materials in their building. The regulations also set forth employee training, record keeping and due diligence requirements pertaining to asbestos-containing materials and potentially asbestos-containing materials. Significant fines can be assessed for violation of these regulations. Building owners and those exercising control over a building’s management may be subject to an increased risk of personal injury lawsuits by workers and others exposed to asbestos-containing materials and potentially asbestos-containing materials. Federal, state and local environmental laws and regulations also govern the removal, encapsulation, disturbance, handling and/or disposal of asbestos-containing materials. Such laws may impose liability for improper handling, exposure to or a release to the environment of asbestos-containing materials.
We also may incur liability arising from mold growth in the buildings we own or operate. When excessive moisture accumulates in buildings or on building materials, mold growth may occur, particularly if the moisture problem remains undiscovered or is not addressed over a period of time. Some molds may produce airborne toxins or irritants. Indoor air quality issues can also stem from inadequate ventilation, chemical contamination from indoor or outdoor sources, and other biological contaminants such as pollen, viruses and bacteria. Indoor exposure to airborne toxins or irritants can be alleged to cause a variety of adverse health effects and symptoms, including allergic or other reactions. As a result, the presence of significant mold or other airborne contaminants at any of our properties could require us to undertake a costly remediation program to contain or remove the mold or other airborne contaminants or increase ventilation. In addition, the presence of significant mold or other airborne contaminants could expose us to liability from our tenants, employees of our tenants, and others if property damage or personal injury occurs.
Prior to closing any property acquisition, if appropriate, we obtain such environmental assessments as may be prudent in order to attempt to identify potential environmental concerns at such properties. These assessments are carried out in accordance with an appropriate level of due diligence and generally may include a physical site inspection, a review of relevant federal, state and local environmental and health agency database records, one or more interviews with appropriate site-related personnel, review of the property’s chain of title and review of historic aerial photographs. We may also conduct limited subsurface investigations and test for substances of concern where the results of the first phase of the environmental assessments or other information, indicates possible contamination or where our consultants recommend such procedures.
We believe that our properties are in compliance in all material respects with all federal, state and local environmental laws and regulations regarding hazardous or toxic substances and other environmental matters. We have not been notified by any governmental authority of any material non-compliance, liability or claim relating to hazardous or toxic substances or other environmental matter in connection with any of our properties. See Item 1a, Risk Factors, for more information regarding potential environmental liabilities.
Employees
We had 120 employees as of February 17, 2017. We believe that relations with our employees are good.
Availability of Reports Filed with the Securities and Exchange Commission
A copy of this Annual Report on Form 10-K, as well as our quarterly reports on Form 10-Q, current reports on Form 8-K and any amendments to such reports filed or furnished pursuant to Section 13(a) or 15(d) of the Securities Exchange Act of 1934, as amended (the “Exchange Act”), are available, free of charge, on our Internet Web site (www.first-potomac.com). All of these reports are made available on our Web site as soon as reasonably practicable after they are electronically filed with or furnished
7
to the Securities and Exchange Commission (the “SEC”). Our Governance Guidelines and Code of Business Conduct and Ethics and the charters of the Audit, Finance and Investment, Compensation, and Nominating and Governance Committees of our Board of Trustees are also available on our Web site at www.first-potomac.com under the section “Investors—Corporate Governance”, and are available in print to any shareholder upon written request to First Potomac Realty Trust, c/o Investor Relations, 7600 Wisconsin Avenue, 11th Floor, Bethesda, MD 20814. The information on or accessible through our Web site is not, and shall not be deemed to be, a part of this report or incorporated into any other filing we make with the SEC.
8
ITEM 1A. RISK FACTORS
An investment in our securities involves various risks, including the risk that an investor might lose its entire investment. The following discussion concerns the material risks associated with our business. These risks are interrelated and should be considered collectively. The risks described below are not the only risks that may affect us. Additional risks and uncertainties not presently known to us or not identified below, may also materially and adversely affect our business, financial condition, results of operations and ability to make distributions to our security holders. Some statements in this Annual Report on Form 10-K, including statements in the following risk factors, constitute forward-looking statements. Please refer to the section entitled “Special Note About Forward-Looking Statements” at the beginning of this Annual Report on Form 10-K.
Risks Related to Our Business and Properties
Real estate investments are inherently risky, which could materially adversely affect our results of operations and cash flow.
Real estate investments are subject to varying degrees of risk. If we acquire or develop properties and they do not generate sufficient operating cash flow to meet operating expenses, including debt service, capital expenditures and tenant improvements, our results of operations, cash flow and ability to make distributions to our security holders will be materially adversely affected. Income from properties may be adversely affected by, among other things:
• | downturns in the national, regional and local economic conditions (particularly in the greater Washington, D.C. region, where substantially all of our properties are located); |
• | declines in the financial condition of our tenants (including tenant bankruptcies) and our ability to collect rents from our tenants; |
• | local real estate market conditions, such as oversupply or reduction in demand for office space; |
• | decreases in rent and/or occupancy rates due to competition, oversupply, adverse changes to the areas surrounding our properties, or other factors; |
• | changes in market rental rates and related concessions granted to tenants including, but not limited to, free rent and tenant improvement allowances; |
• | competition from similar asset type properties; |
• | increased competition for public capital from new or expanding market participants; |
• | changes in space utilization by our tenants that may adversely affect future demand due to technology, telecommuting and overall shift in business culture; |
• | increases in operating costs such as real estate taxes, insurance premiums, site maintenance (including snow removal costs) and utilities; |
• | vacancies and the need to periodically repair, renovate and re-lease space, or other significant capital expenditures; |
• | reduced capital investment in or demand for real estate in the future; |
• | costs of remediation and liabilities associated with environmental conditions and laws; |
• | earthquakes and other natural disasters, civil disturbances, or terrorist acts or acts of war, which may result in uninsured or underinsured losses; |
• | decreases in the underlying value of our real estate; |
• | changes in interest rates and the availability of financing; |
• | inflation; and |
• | changes in laws and governmental regulations, including those governing real estate usage, zoning and taxes. |
Substantially all of our properties are located in the greater Washington, D.C. region, making us vulnerable to changes in economic, regulatory or other conditions in that region that could have a material adverse effect on our results of operations.
Substantially all of our properties are located in the greater Washington, D.C. region, exposing us to greater risks than if we owned properties in multiple geographic regions. Economic conditions in the greater Washington, D.C. region may significantly affect the occupancy and rental rates of our properties. A decline in occupancy and rental rates, in turn, may significantly adversely affect our profitability and our ability to satisfy our financial obligations. Further, the economic condition of the region may also depend on one or more industries and, therefore, an economic downturn in one of these industry sectors may adversely affect our results of operations. For example, the U.S. Government, which has a large presence in our markets, accounted for 16% of our total annualized cash basis rent as of December 31, 2016, and the U.S. Government combined with government contractors accounted for 27% of our total annualized cash basis rent as of December 31, 2016.
9
Therefore, we are directly affected by decreases in federal government spending (either directly through the potential loss of a U.S. Government tenant or indirectly if the businesses of tenants that contract with the U.S. Government are negatively impacted). In particular, the office market in the Washington, D.C. metropolitan area was negatively impacted by uncertainty regarding the potential for significant reductions in spending by the U.S. Government and may be impacted by the uncertainty regarding policy changes under the new administration. In addition to actual economic conditions, investor perception of risks associated with real estate in the Washington, D.C. metropolitan area as a result of its perceived dependence on the U.S. Government, and the impact of sequestration (defined below) or anticipated policy changes, may make potential investors less likely to invest in our shares, which could have a material adverse effect on the price of our shares.
We may also be subject to changes in the region’s regulatory environment (such as increases in real estate and other taxes, costs of complying with government regulations or increased regulation and other factors) or other adverse conditions or events (such as natural disasters). Certain policy changes under the new federal administration may increase costs to our tenants, or may cause certain government contractors to lose their contract with the U.S. Government or limit their ability to expand or renew space. Thus, adverse developments and/or conditions in the greater Washington, D.C. region could reduce demand for space, impact the credit-worthiness of our tenants or force our tenants to curtail operations, which could impair their ability to meet their rent obligations to us and, accordingly, could have a material adverse effect on our results of operations.
We may be unable to renew expiring leases or re-lease vacant space on a timely basis or on attractive terms, which could have a material adverse effect on our results of operations and cash flow.
At December 31, 2016, 19.0%, 8.6% and 9.3% of our annualized cash basis rent was scheduled to expire in 2017, 2018 and 2019, respectively. In particular, we own two single-tenant buildings that have leases expiring in 2017 (540 Gaither Road - Department of Health and Human Services, and 500 First Street, NW - Bureau of Prisons). Together, these two leases represent approximately $8 million of annual net operating income. Current tenants may not renew their leases upon the expiration of their terms and may attempt to terminate their leases prior to the expiration of their current terms. The amount of annualized cash basis rent scheduled to expire in 2017 includes 5.1% of our total annualized cash basis rent that is related to CACI International, which fully leased One Fair Oaks pursuant to a lease that expired on December 31, 2016. We subsequently sold One Fair Oaks on January 9, 2017 for net proceeds of $13.3 million. In addition, as discussed in the risk factor titled “A decrease in federal government spending, or the threat thereof, as a result of sequestration cuts or otherwise, could have a material adverse effect on our results of operations and cash flow, and could cause an impairment of the value of some of our properties”, our leases with the U.S. Government include favorable tenant termination provisions. For example, in October 2015, we received notice from the Department of Health and Human Services, which fully leases the building at 540 Gaither Road, that it will be exercising its early termination right, which will be effective in March 2017. In addition, the Bureau of Prisons, which fully leases 500 First Street, NW, has a lease that is scheduled to expire on July 31, 2017. Currently, we are evaluating various strategies with respect to these properties (and, in certain instances have engaged third parties to assist in evaluating such strategies), which includes repositioning 540 Gaither Road and 500 First Street, NW and gauging new tenant interest to lease these properties, all with the ultimate goal of maximizing value upon the expiration of these leases. However, we can provide no assurances regarding the outcome of these or any other alternative strategies for properties with expiring leases.
A decrease in federal government spending, or the threat thereof, as a result of sequestration cuts or otherwise, could have a material adverse effect on our results of operations and cash flow, and could cause an impairment of the value of some of our properties.
The U.S. Government accounted for 16% of our total annualized cash basis rent as of December 31, 2016, and the U.S. Government combined with government contractors accounted for 27% of our total annualized cash basis rent as of December 31, 2016. A significant reduction in federal government spending could affect the ability of these tenants to fulfill lease obligations or decrease the likelihood that they will renew their leases with us. Further, economic conditions in the greater Washington, D.C. region, particularly the Washington, D.C. and Norfolk, VA metropolitan areas, are significantly dependent upon the level of federal government spending in the region, and uncertainty regarding the potential for future reduction in government spending could also decrease or delay leasing activity from the U.S. Government and government contractors. Moreover, the Budget Control Act, which was passed in 2011 and imposed caps on the federal budget in order to achieve targeted spending levels over the 2013-2021 fiscal years (commonly referred to as “sequestration”), has fueled further uncertainty regarding future government spending reductions. The reductions in U.S. federal government spending imposed by the Budget Control Act went into effect on March 1, 2013, which lead to significant reductions in U.S. federal government spending in 2013 through 2015, with similar cuts scheduled through 2021. Overall, the sequester imposed by the Budget Control Act lowers spending by a total of approximately $1.1 trillion versus pre-sequester levels over the period from 2013 to 2021. As a result of the scheduled reductions in U.S. federal government spending, there could be negative economic
10
changes in our region, which could adversely impact the ability of our tenants to perform their financial obligations under our leases or decrease the likelihood of their lease renewal. In addition, some of our leases with the U.S. Government are for relatively short terms or provide for early termination rights, including termination for convenience or in the event of a budget shortfall. Further, on July 31, 2003, the United States Department of Defense issued the Unified Facilities Criteria (the “UFC”), which established minimum antiterrorism standards for the design and construction of new and existing buildings leased by the departments and agencies of the Department of Defense. The loss of the federal government as a tenant resulting from reductions in federal government spending, exercise of the government’s contractual termination rights, our inability to comply with the UFC standards or for any other reason would have a material adverse effect on our results of operations. A reduction or elimination of rent from the U.S. Government or other significant tenants would also materially reduce our cash flow and materially adversely affect our results of operations and ability to make distributions to our security holders.
In addition, a significant economic downturn due to a significant reduction in federal government spending over a period of time could result in an event or change in circumstances that results in an impairment in the value of one or more of our properties. An impairment loss is recognized if the carrying value of the asset (i) is not recoverable over its expected holding period and (ii) exceeds the estimated fair value of the asset. There can be no assurance that we will not take charges in the future related to the impairment of our assets or investments. Any future impairment could have a material adverse effect on our results of operations in the period in which the charge is taken.
Our properties face significant competition, which could adversely affect our results of operations or financial condition.
We face significant competition for tenants in our properties from developers, owners and operators of similar properties that may be more willing to make space available to prospective tenants at lower prices and with greater tenant improvements and other concessions than comparable spaces in our properties, especially in difficult economic times. Thus, competition could negatively affect our ability to attract and retain tenants and may reduce the rents we are able to charge and increase the tenant improvements and other concessions that we offer, which could materially and adversely affect our results of operations.
One aspect of our Strategic Plan, which is substantially complete, includes focusing on our portfolio of high-quality office properties in the Washington, D.C. metropolitan region, and disposing of properties that are no longer a strategic fit. The execution of this phase of the business plan has reduced the size of our overall portfolio and increased the concentration of our portfolio in office properties. If the proceeds of the remaining dispositions contemplated under our Strategic Plan are not what we expect, or if we cannot timely and effectively deploy the remaining proceeds, there could be a material adverse effect on our results of operations and financial condition.
One aspect of our Strategic Plan, which is substantially complete, includes focusing on our portfolio of high-quality office properties in the Washington, D.C. metropolitan region, and disposing of those properties that are no longer a strategic fit, properties in submarkets where we do not have asset concentration or operating efficiencies and/or properties where we believe we cannot further maximize value. As of the date of this filing, we have sold $294.6 million of non-core assets toward our previously stated goal of $350 million. We have used or intend to use the proceeds generated from the $350 million of property dispositions to, among other things, repay outstanding indebtedness, reposition or redevelop certain properties where we believe we can increase profitability, redeem all of our previously outstanding 7.750% Series A Cumulative Redeemable Perpetual Preferred Shares (the “Series A Preferred Shares”) and acquire additional high-quality office properties in the Washington, D.C. metropolitan region. We can provide no assurance that we will be able to dispose of any additional properties under our business plan for the amounts of proceeds we expect, or at all. In addition, if we are able to dispose of any additional properties, we can provide no assurance that we will be able to use the capital in a timely or more efficient manner. Furthermore, although we intend to acquire additional office properties, we face significant competition for acquisitions in the office market and we may not be able or have the opportunity to make suitable investments on favorable terms. As such, we may not be able to adequately time any decrease in revenues from the sale of properties with a corresponding increase in revenues associated with the redevelopment or acquisition of properties. The failure to dispose of properties under our business plan, or to timely and more efficiently apply the proceeds from any disposition of properties could have a material adverse effect on our financial condition and results of operations.
11
Our strategic shift and decision to focus on office properties in the Washington, D.C. metropolitan region exposes us to a number of risks, including risks related to the reduced size of our overall portfolio and the further concentration of our portfolio in office properties.
As part of our strategic and capital plan announced in January 2013, we disposed of our industrial portfolio in June 2013 and our current Strategic Plan contemplates disposing of properties that are no longer a strategic fit (including a significant portion of our business park properties), properties in submarkets where we do not have asset concentration or operating efficiencies and/or properties where we believe we cannot further maximize value. Pursuant to our Strategic Plan, we have disposed of an additional $294.6 million of non-core assets since December 2015 in order to focus on office properties in the Washington, D.C. metropolitan area. As such, the size of our overall portfolio has been and may continue to be significantly reduced, and therefore any adverse developments at any one of our remaining properties may have a greater negative impact on our results of operations. Although we intend to acquire additional office properties in the near future, we face significant competition for acquisitions in the office market and we may not be able or have the opportunity to make suitable investments on favorable terms. See “-Competition for acquisitions may impede our growth and may result in increased prices for property acquisitions.” As such, the resulting decrease in our net income attributable to the disposed properties likely will not be completely offset by income from the reinvestment of disposition proceeds. In addition, a further concentration of our portfolio in office properties exposes us to the risk of a downturn in the office market to a greater extent than if our portfolio remained more diversified in office, business park and industrial properties.
Redevelopment, development and construction risks could materially adversely affect our results of operations and growth prospects.
One aspect of our Strategic Plan includes repositioning or redeveloping certain properties where we believe we can increase profitability. Our renovation, redevelopment, development and related construction activities may subject us to the following risks:
• | we may be unable to obtain, or suffer delays in obtaining, necessary zoning, land-use, building, occupancy and other required governmental permits and authorizations, which could result in increased costs or our abandonment of these projects; |
• | we may incur construction costs for a property that exceed our original estimates due to increased costs for materials, labor, leasing or other costs that we did not anticipate, which could make completion of the project less profitable because market rents may not increase sufficiently to compensate for the increase in construction costs; |
• | we may not be able to obtain financing on favorable terms, if at all, especially with respect to large scale developments and redevelopments, which may render us unable to proceed with our development activities; |
• | we may abandon development opportunities after we begin to explore them and, as a result, we may lose deposits or fail to recover expenses already incurred; |
• | we may expend funds on and devote management’s time to projects which we do not complete; |
• | we may be unable to complete construction and lease-up of a property on schedule, which could result in increased debt service expense or construction costs; |
• | we may be unable to achieve expected occupancy rates and rental rents at the completed property, which could make the property less profitable than anticipated or not profitable at all; and |
• | we may suspend development projects after construction has begun due to changes in economic conditions or other factors, and this may result in the write-off of costs, payment of additional costs or increases in overall costs when the development project is restarted. |
Additionally, the time frame required for development, construction and lease-up of these properties means that we may have to wait years for a significant cash return. Any of these conditions could materially adversely affect our results of operations and growth prospects.
We intend to increase the size of our portfolio through acquisitions, redevelopments and developments, which initially may be dilutive and/or may not produce the returns that we expect, which could materially adversely affect our results of operations and growth prospects.
Our business strategy contemplates expansion through acquisitions, redevelopments and developments, which acquisitions initially may be dilutive to our net income. In deciding whether to acquire or develop a particular property, we make assumptions regarding the expected future performance of that property. In particular, we estimate the return on our investment based on expected occupancy and rental rates, as well as expected development costs and leasing costs. We have acquired, and in the future may acquire, properties not fully leased, and the cash flow from existing operations of such properties may be insufficient
12
to pay the operating expenses and debt service associated with such properties until they are more fully leased at favorable rental rates. Moreover, operating expenses related to acquired properties may be greater than anticipated, particularly if we provide tenant improvements or other concessions or additional services in order to maintain or attract new tenants. We also may experience unanticipated costs or difficulties integrating newly acquired properties into our existing portfolio or hiring and retaining sufficient operational staff to manage such properties. If our estimated return on investment for the property proves to be inaccurate and the property is unable to achieve the expected occupancy and rental rates, it may fail to perform as we projected (including, without limitation, as a result of tenant bankruptcies, increased tenant improvements and other concessions, increased capital expenditures, our inability to collect rents and higher than anticipated operating costs), thereby having a material adverse effect on our results of operations. This risk may be particularly pronounced for properties placed into development or acquired shortly before the recent economic downturn, where we estimated occupancy and rental rates without the benefit of knowing how those assumptions might be impacted by the changing economic conditions that followed.
In addition, when we acquire certain properties that are significantly under-leased, we often plan to reposition or redevelop them with the goal of increasing profitability. Our estimate of the costs of repositioning or redeveloping such properties may prove to be inaccurate, which may result in our failure to meet our profitability goals. Moreover, we may be unsuccessful in leasing up such properties after repositioning or redeveloping them and if one or more of these new properties do not perform as expected, our results of operations may be materially adversely affected.
Our acquisition activities and the success of such acquisitions are subject to the following additional risks:
• | we may have difficulty finding properties that are consistent with our strategies and that meet our standards; |
• | even if we enter into an acquisition agreement for a property, the acquisition agreement will likely contain conditions to closing, including completion of due diligence investigations to our satisfaction or other conditions that are not within our control, which may not be satisfied; |
• | we may be unable to complete the acquisition after making a non-refundable deposit and incurring certain other acquisition-related costs; |
• | we may be unable to obtain or assume financing for acquisitions on favorable terms or at all; |
• | acquired properties may fail to perform as expected; |
• | we may acquire real estate through the acquisition of the ownership entity subjecting us to the risks of that entity; |
• | the timing of property acquisitions may lag the timing of property dispositions, leading to periods of time where projects' proceeds are not invested as profitably as we desire; |
• | the actual returns realized on acquired properties may not exceed our cost of capital; and |
• | we could experience a decline in value of the acquired assets after acquisition. |
Competition for acquisitions may impede our growth and may result in increased prices for property acquisitions.
Our business strategy contemplates expansion primarily through acquisitions. The commercial real estate industry is highly competitive, and we compete with substantially larger companies, including substantially larger REITs and institutional investment funds (including foreign wealth funds), which may have better access to lower cost capital for the acquisition, development and leasing of properties. As a result, we may not be able or have the opportunity to make suitable investments on favorable terms in the future, which may impede our growth and have a material adverse effect on our results of operations. In addition, competition for acquisitions may significantly increase the purchase price and/or require us to, among other things, make concessions to sellers and/or agree to higher non-refundable deposits, which could require us to agree to acquisition terms less favorable to us.
Acquired properties may expose us to unknown liabilities.
We may acquire properties subject to liabilities and without any recourse, or with only limited recourse, against the prior owners or other third parties with respect to unknown liabilities. As a result, if a liability were asserted against us based upon ownership of those properties, we might have to pay substantial sums to settle or contest it, which could adversely affect our results of operations and cash flow. Unknown liabilities with respect to acquired properties might include:
• | liabilities for clean-up of environmental contamination; |
• | claims by tenants, vendors or other persons against the former owners of the properties; |
• | liabilities incurred in the ordinary course of business; and |
• | claims for indemnification by general partners, directors, officers and others indemnified by the former owners of the properties. |
13
We may not be able to access adequate cash to fund our business or growth strategy, which could have a material adverse effect on our results of operations, financial condition and cash flow.
Our business requires access to adequate cash to finance our operations, distributions, capital expenditures, debt service obligations, development and redevelopment costs and property acquisition costs, if any, and to refinance or repay maturing debt. We may not be able to generate sufficient cash to fund our business, particularly if we are unable to renew leases, lease vacant space or re-lease space as leases expire according to expectations. This risk may be even more pronounced given the ongoing challenges and uncertainties in the current economic environment.
Moreover, we rely on third-party sources to fund our capital needs. We may not be able to obtain the financing on favorable terms, in the time period we desire, or at all. Our access to third-party sources of capital depends, in part, on:
• | general market conditions; |
• | the market’s view of the quality of our assets; |
• | the market’s perception of our growth potential; |
• | our current debt levels; |
• | our current and expected future earnings; |
• | our cash flow and cash distributions; and |
• | the market price of our common shares. |
If we cannot obtain capital from third-party sources, we may not be able to acquire or develop properties when strategic opportunities exist, satisfy our principal and interest obligations or make distributions to our shareholders.
In addition, our access to funds under our revolving credit facility depends on the ability of the lenders that are parties to such facility to meet their funding commitment to us. If our lenders are not able to meet their funding commitment to us, our business, results of operations, cash flow and financial condition could be materially adversely affected.
Illiquidity of real estate investments could significantly impede our ability to complete our Strategic Plan or respond to adverse changes in the performance of our properties, which may have a material adverse effect on our results of operations, financial condition and cash flow.
Because real estate investments are relatively illiquid, our ability to promptly sell one or more properties in our portfolio in order to realize their value or in response to adverse changes in the performance of such properties may be limited. We cannot predict whether we will be able to sell any property for the price or on the terms set by us, or whether any price or other terms offered by a prospective purchaser would be acceptable to us. We may be required to expend funds to correct defects or to make improvements before a property can be sold and we cannot assure you that we will have funds available to correct those defects or to make those improvements. We also cannot predict the length of time needed to find a willing purchaser and to close the sale of a property. Failure to dispose of properties and to timely and more efficiently apply the proceeds from any disposition of properties could have a material adverse effect on our financial condition and results of operations.
Moreover, the REIT rules governing property sales and agreements that we may enter into with joint venture partners or contributors to our Operating Partnership not to sell certain properties for a period of time may interfere with our ability to dispose of properties on a timely basis without incurring significant additional costs. In addition, when acquiring a property, we may agree to lock-out provisions that materially restrict us from selling that property for a period of time or impose other restrictions, such as a limitation on the amount of debt that can be placed or repaid on that property. We may also acquire properties that are subject to mortgage loans that may limit our ability to sell those properties prior to the applicable loan’s maturity. These factors and any others that would impede our ability to execute our business plan or to respond to adverse changes in the performance of our properties could have a material adverse effect on our results of operations, financial condition, cash flow and our ability to make distributions with respect to, and the market price of, our securities.
We may experience a decline in the fair value of our assets, which may have a material impact on our financial condition, liquidity and results of operations and adversely impact the market value of our securities.
A decline in the fair market value of our assets may require us to recognize an other-than-temporary impairment against such assets under GAAP if we were to determine that we do not have the ability and intent to hold any assets in unrealized loss positions to maturity or for a period of time sufficient to allow for recovery to the amortized cost of such assets. In such event, we would recognize unrealized losses through earnings and write down the amortized cost of such assets to a new cost
14
basis, based on the fair value of such assets on the date they are considered to be other-than-temporarily impaired. Such impairment charges reflect non-cash losses at the time of recognition. Subsequent disposition or sale of such assets could further affect our future losses or gains, as they are based on the difference between the sale price received and adjusted amortized cost of such assets at the time of sale, which may adversely affect our financial condition, liquidity and results of operations. There can be no assurance that we will not take charges in the future related to the impairment of our assets or investments. Any future impairment could have a material adverse effect on our results of operations in the period in which the charge is taken.
We are subject to the credit risk of our tenants, which may declare bankruptcy or otherwise fail to make lease payments, which could have a material adverse effect on our results of operations and cash flow.
We are subject to the credit risk of our tenants. We cannot assure you that our tenants will not default on their leases and fail to make rental payments to us. In particular, disruptions in the financial and credit markets, local economic conditions and other factors affecting the industries in which our tenants operate may affect our tenants’ ability to obtain financing to operate their businesses or continue to profitability execute their business plans. This, in turn, may cause our tenants to be unable to meet their financial obligations, including making rental payments to us, which may result in their bankruptcy or insolvency. We cannot evict a tenant solely because of its bankruptcy. On the other hand, a tenant in bankruptcy may be able to restrict our ability to collect unpaid rent and interest during the bankruptcy proceeding and may reject the lease. In such case, our claim against the bankrupt tenant for unpaid and future rent would be subject to a statutory cap that might be substantially less than the remaining rent actually owed under the lease. As a result, our claim for unpaid rent likely would not be paid in full. This shortfall could adversely affect our cash flow and results of operations. Furthermore, in the event of the tenant’s breach of its obligations to us or its rejection of the lease in bankruptcy proceedings, we may be unable to locate a replacement tenant in a timely manner or on comparable or better terms. The loss of rental revenues from any of our larger tenants, a number of our smaller tenants or any combination thereof, combined with our inability to replace such tenants on a timely basis, may materially adversely affect our results of operations and cash flow.
A majority of our tenants hold leases covering less than 10,000 square feet. Many of these tenants are small companies with nominal net worth and, therefore, may be challenged in operating their businesses during economic downturns. In addition, certain of our properties are, and may be in the future be, substantially leased to a single tenant and, therefore, such property’s operating performance and our ability to service the property’s debt is particularly exposed to the economic condition of the tenant. The loss of rental revenues from any of our larger tenants or a number of our smaller tenants may materially adversely affect our results of operations and cash flow.
Our degree of leverage could limit our ability to obtain additional financing, and may have a negative impact on our results of operations, financial condition, cash flow and our ability to pursue growth through acquisitions and development projects.
As of December 31, 2016, our total consolidated debt was $743.4 million, consisting principally of our mortgage debt and amounts outstanding under our consolidated credit agreement (including our unsecured revolving credit facility and unsecured term loans included therein). In addition, we will incur additional indebtedness in the future in connection with, among other things, our acquisition, redevelopment, development and operating activities. Our current degree of leverage, or an increase in our leverage levels, may make it difficult to obtain additional financing for working capital, capital expenditures, acquisitions, development or other general corporate purposes, or to refinance existing debt on favorable terms or at all. Failure to obtain additional financing could impede our ability to grow and develop our business through, among other things, acquisitions, redevelopments and developments, and a failure to refinance our existing debt as it matures could have a material adverse effect on our financial condition, liquidity and ability to make distributions to our shareholders. Our leverage levels also could make us more vulnerable to a downturn in business or the economy generally and may adversely affect the market price of our securities if an investment in our common shares is perceived to be more risky than an investment in our peers.
We face risks associated with the use of debt, including refinancing risk.
We rely on debt financing to fund acquisitions, redevelopment and development activities, and for general corporate purposes. Our use of debt financing creates risks, including risks that:
• | our cash flow will be insufficient to make required payments of principal and interest, including “balloon” payments due at maturity; |
• | we will be unable to refinance some or all of our indebtedness or that any refinancing will not be on terms as favorable as those of the existing indebtedness; |
15
• | required debt payments will not be reduced if the economic performance of any property declines; |
• | debt service obligations will reduce funds available for distribution to our security holders and funds available for acquisitions, development and redevelopment; |
• | most of our secured debt obligations require the lender to be made whole to the extent we decide to pay off the debt prior to the maturity date; and |
• | any default on our indebtedness, including as a result of a failure to maintain certain financial and operating covenants in our consolidated credit agreement, could result in acceleration of those obligations and possible cross defaults under other indebtedness and/or loss of property to foreclosure. |
If the economic performance of any of our properties declines, our ability to make debt service payments would be adversely affected. If a property is mortgaged to secure payment of indebtedness and we are unable to meet mortgage payments, we may lose that property to lender foreclosure with a resulting loss of income and asset value.
Covenants in our debt agreements could adversely affect our liquidity and financial condition.
Our consolidated credit agreement (which contains our unsecured revolving credit facility and unsecured term loans) and our construction loans contain certain and varying restrictions on the amount of debt we are allowed to incur and other restrictions and requirements on our operations (including, among other things, requirements to maintain a minimum tangible net worth and specified coverage ratios (e.g., a maximum of total indebtedness to gross asset value, a maximum of secured indebtedness to gross asset value, a minimum fixed charge coverage ratio (defined as the ratio of adjusted EBITDA to fixed charges), a maximum unencumbered leverage ratio (defined as the ratio of unsecured debt to the value of certain unencumbered properties) and a minimum unencumbered interest coverage ratio (defined as the ratio of the adjusted net operating income of certain unencumbered properties to interest expense on unsecured debt)) and other financial covenants, and limitations on our ability to make distributions, enter into joint ventures, develop properties and engage in certain business combination transactions). See “Item 7, Management’s Discussion and Analysis of Financial Condition and Results of Operations —Liquidity and Capital Resources.” These restrictions, particularly if we are at or near the required ratios or thresholds, could prevent or inhibit our ability to make distributions to our shareholders and to pursue some business initiatives or effect certain transactions that may otherwise be beneficial to our company, which could adversely affect our financial condition and results of operations. Moreover, our continued ability to borrow under our revolving credit facility is subject to compliance with these financial and operating covenants and our failure to comply with such covenants could cause a default under the credit facility, and we may then be required to repay such debt with capital from other sources. Under those circumstances, other sources of capital may not be available to us, or be available only on unattractive terms. In addition, if we breach covenants in our debt agreements, the lenders can declare a default and, if the debt is secured, take possession of the property securing the defaulted loan. Although we were in compliance with all of the financial and operating covenants of our outstanding debt agreements as of December 31, 2016, we can provide no assurance that we will be able to continue to comply with these covenants in future periods.
Our debt agreements also contain cross-default provisions that would be triggered if we are in default under other loans in excess of certain amounts. Moreover, even if a secured debt instrument is below the cross default threshold for non-recourse secured debt under our unsecured debt agreements, a default under such secured debt instrument may still cause a cross default under our unsecured debt agreements because such secured debt instrument may not qualify as “non-recourse” under the definition in our unsecured debt agreements. In the event of a default or cross default, the lenders could accelerate the timing of payments under the debt obligations and we may be required to repay such debt with capital from other sources, which may not be available to us on attractive terms, or at all, which would have a material adverse effect on our liquidity, financial condition, results of operations and ability to make distributions with respect to, and the market price of, our securities.
Our variable rate debt subjects us to interest rate risk.
As of December 31, 2016, we had a consolidated credit agreement consisting of a $300.0 million unsecured revolving credit facility and a $300.0 million unsecured term loan facility, a $32.2 million construction loan (440 First Street, NW), a $34.6 million construction loan (Northern Virginia build-to-suit) and certain other debt, some of which is unhedged, that bear interest at variable rates. In addition, we may incur additional variable rate debt in the future. As of December 31, 2016, we had $510.8 million of variable rate debt, of which, $240.0 million was hedged through nine interest rate swap agreements. Our $510.8 million of variable rate debt includes $60.0 million of unhedged debt under the unsecured term loan facility (which bears an interest rate of one-month LIBOR plus 1.45%), our $32.2 million construction loan at 440 First Street, NW (which bears interest at a rate of one-month LIBOR plus 2.50%), our $34.6 million construction loan for the Northern Virginia development project (which bears interest at a rate of one-month LIBOR plus 1.85%) and the $144.0 million outstanding under our unsecured revolving credit facility (which bears interest at LIBOR plus 1.50%). One-month LIBOR was 0.77% at
16
December 31, 2016. Increases in interest rates on variable rate debt would increase our interest expense, if not hedged effectively or at all, which would adversely affect net earnings and cash available for payment of our debt obligations and distributions to our security holders. For example, if market rates of interest on our unhedged variable rate debt outstanding as of December 31, 2016 increased by 1%, or 100 basis points, the increase in interest expense on our existing unhedged variable rate debt would decrease future earnings and cash flow by approximately $2.7 million annually.
We have and may continue to engage in hedging transactions, which can limit our gains and increase exposure to losses.
We have and may continue to enter into hedging transactions to attempt to protect us from the effects of interest rate fluctuations on floating rate debt, or in some cases, prior to a proposed debt issuance. Our hedging transactions may include interest rate swap agreements or interest rate cap or floor agreements, or other interest rate exchange contracts. Hedging activities may not have the desired beneficial impact on our results of operations or financial condition. No hedging activity can completely insulate us from the risks associated with changes in interest rates. Moreover, interest rate hedging could fail to protect us and could adversely affect us because, among other things:
• | available interest rate hedging may not correspond directly with the interest rate risk for which we seek protection; |
• | the duration of the hedge may not match the duration of the related liability; |
• | the party owing money in the hedging transaction may default on its obligation to pay; |
• | the credit quality of the party owing money on the hedge may be downgraded to such an extent that it impairs our ability to sell or assign our side of the hedging transaction; and |
• | the value of derivatives used for hedging may be adjusted from time to time in accordance with accounting rules to reflect changes in fair value. Such downward adjustments, or “mark-to-market losses,” would reduce our equity. |
Hedging involves risk and typically involves costs, including transaction costs that may reduce our overall returns on our investments. These costs increase as the period covered by the hedging increases and during periods of rising and volatile interest rates. These costs will also limit the amount of cash available for distribution to shareholders. We generally intend to hedge as much of the interest rate risk as management determines is in our best interests given the cost of such hedging transactions. REIT qualification rules may limit our ability to enter into hedging transactions that might otherwise be advantageous by, among other things, requiring us to limit our income from hedges, or may cause us to implement those hedges through a taxable REIT subsidiary. This could increase the cost of our hedging activities because our taxable REIT subsidiary would be subject to tax on gains or expose us to greater risks associated with changes in interest rates than we would otherwise want to bear. In addition, losses in our taxable REIT subsidiary will generally not provide any current tax benefit, except to the extent that they may be carried back to prior years or forward to future years and offset against taxable income in the taxable REIT subsidiary. If we are unable to hedge effectively because of the REIT rules, we will face greater interest rate exposure.
Moreover, there can be no assurance that our hedging arrangements will qualify as highly effective cash flow hedges under Financial Accounting Standards Board ("FASB"), Accounting Standards Codification ("ASC") Topic 815, Derivatives and Hedging, or that our hedging activities will have the desired beneficial impact on our results of operations. Should we desire to terminate a hedging agreement, there could be significant costs and cash requirements involved to fulfill our obligation under the hedging agreement
17
We rely, in certain instances, on third-party vendors to manage and lease certain of our properties and could be materially and adversely affected if such third-party vendors do not manage and/or lease our properties in our best interests.
In certain instances, we retain third parties to manage and/or lease certain of our properties and, in connection with such arrangements, we would be dependent on them and their key personnel who provide services to us and we may not find a suitable replacement if the agreements are terminated, or if key personnel leave or otherwise become unavailable to us. In particular, we retained a third-party management company in 2014 to operate our Southern Virginia portfolio pursuant to individual property management agreements. While we believe this management structure provides operating efficiencies, we could be materially and adversely affected if our third-party manager fails to provide quality services and amenities, fails to maintain a quality brand name or otherwise fails to manage our properties in our best interest. In addition, from time to time, disputes may arise between us and our third-party manager regarding its performance or compliance with the terms of the property management agreements, which in turn could adversely affect our results of operations. We generally will attempt to resolve any such disputes through discussions and negotiations; however, if we are unable to reach satisfactory results through discussions and negotiations, we may choose to terminate our management agreement (which we are permitted to do upon 30-days’ notice), litigate the dispute or submit the matter to third-party dispute resolution, the outcome of which may be unfavorable to us. In the event that we terminate any of our management agreements, we can provide no assurances that we could find a replacement manager in a timely manner, or at all, or that any replacement manager will be successful in operating such properties.
In addition, we retain third-party vendors to lease certain of our properties pursuant to listing agreements and, as such, are dependent on such third parties and their key personnel. If these third-party leasing agents fail to provide quality services to us or otherwise fail to act in our best interest, it could have a material adverse effect on our business and results of operations.
Under some of our leases, tenants have the right to terminate prior to the scheduled expiration of the lease, which could have a material adverse effect on our results of operations and cash flow.
Some leases at our properties provide tenants with the right to terminate prior to the scheduled expiration of the lease. If a tenant terminates its lease with us prior to the expiration of the term, we may be unable to re-lease that space on favorable terms, or at all, which could materially adversely affect our results of operations, cash flow and our ability to make distributions to our security holders.
Property owned through joint ventures, or in limited liability companies and partnerships in which we are not the sole equity holder, may limit our ability to act exclusively in our interests.
We have, and may in the future, make investments through partnerships, limited liability companies or joint ventures, some of which may be significant in size. In particular, during 2010 and 2011, we entered a number of joint ventures in connection with our acquisition and development of various real estate assets. Partnership, limited liability company or joint venture investments may involve various risks, including the following:
• | our partners or co-members might become bankrupt (in which event we and any other remaining general partners or co-members would generally remain liable for the liabilities of the partnership or joint venture) or default on their obligations necessitating that we fulfill their obligation; |
• | our partners or co-members might at any time have economic or other business interests or goals that are inconsistent with our business interests or goals; |
• | our partners or co-members may have competing interests in our markets that could create conflicts of interest; |
• | our partners or co-members may be structured differently than us for tax purposes and this could create conflicts of interest; |
• | our partners or co-members may be in a position to take action contrary to our instructions, requests, policies, or objectives, including our current policy with respect to maintaining our qualification as a real estate investment trust; |
• | our partners or co-members may be in a position to withhold consent necessary for us take certain actions with respect to our jointly owned investments, including rights with respect to disposition or development; and |
• | agreements governing joint ventures, limited liability companies and partnerships often contain restrictions on the transfer of a member’s or partner’s interest or “buy-sell” or other provisions that may result in a purchase or sale of the interest at a disadvantageous time or on disadvantageous terms. |
The occurrence of one or more of the events described above could adversely affect our financial condition, results of operations, cash flow and ability to make distributions with respect to, and the market price of, our securities.
18
Failure to maintain effective internal control over financial reporting could have a material adverse effect on our business, liquidity and financial condition and the market price of our securities.
Our management is responsible for establishing and maintaining adequate internal control over financial reporting. Any material weakness in our internal control over financial reporting could prevent us from accurately reporting our results of operations, result in material misstatements in our financial statements or cause us to fail to meet our reporting obligations. This could prevent or inhibit our ability to access third party sources of capital, which could adversely affect our liquidity and financial condition, and could cause investors to lose confidence in our reported financial information, thereby adversely affecting the perception of our business and the market price of our securities.
Liabilities under environmental laws for contamination could have a material adverse effect on our results of operations, financial condition and cash flow.
Our operating expenses could be higher than anticipated due to liability created under existing or future federal, state or local environmental laws and regulations for contamination. An owner or operator of real property can face strict, joint and several liability for environmental contamination created by the presence or discharge of hazardous substances, including petroleum-based products at, on, under or from the property. Similarly, a former owner or operator of real property can face the same liability for the disposal of hazardous substances that occurred during the time of ownership or operation. We may face liability regardless of:
• | our lack of knowledge of the contamination; |
• | the extent of the contamination; |
• | the timing of the release of the contamination; or |
• | whether or not we caused the contamination. |
Environmental liability for contamination may include the following, without limitation: investigation and feasibility study costs, remediation costs, litigation costs, oversight costs, monitoring costs, institutional control costs, penalties from state and federal agencies, natural resource damages and third-party claims. Moreover, operations on-site may be required to be suspended until certain environmental contamination is remediated and/or permits are received and environmental laws can impose permanent restrictions on the manner in which a property may be used depending on the extent and nature of the contamination. This may result in a default of the terms of the lease entered into with our tenants. Environmental laws also may create liens on contaminated sites in favor of the government for damages and costs it incurs to address such contamination. In addition, the presence of hazardous substances at, on, under or from a property may adversely affect our ability to lease or sell the property, or borrow using the property as collateral, thus harming our financial condition. Environmental laws also may impose liability on persons who arrange for the disposal or treatment of hazardous substances, and such persons may incur the cost of removal or remediation of hazardous substances at disposal or treatment facilities, regardless of whether or not they owned or operated such facility.
There may be environmental liabilities associated with our properties of which we are unaware. For example, some of our properties contain, or may have contained in the past, underground tanks for the storage of hazardous substances, petroleum-based substances or wastes, and some of our properties have been used, or may have been used, historically to conduct industrial operations, and any of these circumstances could create a potential for release of hazardous substances. Such liabilities could have a material adverse effect on our results of operations, financial condition and cash flow.
Non-compliance with environmental laws at our properties could have a material adverse effect on our results of operations, financial condition and cash flow.
Our properties are subject to various federal, state and local environmental laws. Non-compliance with these environmental laws could subject us or our tenants to liability and changes in these laws could increase the potential costs of compliance or increase liability for noncompliance. Although our leases generally require our tenants to operate in compliance with all applicable laws and to indemnify us against any environmental liabilities arising from a tenant’s activities on the property, we could nonetheless be subject to liability by virtue of our ownership or operation interests for environmental liabilities created by our tenants, and we cannot be sure that our tenants would satisfy their indemnification obligations under the applicable lease. Moreover, these environmental liabilities could affect our tenants’ ability to make rental payments to us. Non-compliance with environmental laws at our properties could have a material adverse effect on our results of operations, financial condition, cash flow and our ability to make distributions to our security holders.
19
Liabilities arising from the presence of hazardous building materials at our properties could have a material adverse effect on our results of operations, financial condition and cash flow.
As the owner or operator of real property, we may also incur liability based on various building conditions. For example, buildings and other structures on properties that we formerly owned or operated, currently own or operate, or those we acquire or operate in the future contain, may contain, or may have contained, asbestos-containing material, or ACM. Environmental, health and safety laws require that ACM be properly managed and maintained and may impose fines or penalties on owners, operators or employers for non-compliance with those requirements. These requirements include warnings, removal, abatement or air monitoring, if ACM would be disturbed during maintenance, renovation or demolition of a building, potentially resulting in substantial costs. In addition, we may be subject to liability for personal injury or property damage sustained as a result of exposure to ACM or releases of ACM into the environment. As a result, such liabilities arising from the presence of ACM or other hazardous building materials at our properties could have a material adverse effect on our results of operations, financial condition and cash flow.
Our properties may contain or develop harmful mold or suffer from other indoor air quality issues, which could lead to liability for adverse health effects, property damage or remediation costs and have a material adverse effect on our results of operations, financial condition and cash flow.
When excessive moisture accumulates in buildings or on building materials, mold growth may occur, particularly if the moisture problem remains undiscovered or is not addressed over a period of time. Some molds may produce airborne toxins or irritants. Indoor air quality issues can also stem from inadequate ventilation, chemical contamination from indoor or outdoor sources, and other biological contaminants such as pollen, viruses and bacteria. Concern about indoor exposure to airborne toxins or irritants, including mold, has been increasing as exposure to these airborne contaminants have been alleged to cause a variety of adverse health effects and symptoms, including allergic or other reactions. As a result, the presence of significant mold or other airborne contaminants at any of our properties could require us to undertake a costly remediation program to contain or remove the mold or other airborne contaminants from the affected property or to increase ventilation. In addition, the presence of significant mold or other airborne contaminants could expose us to liability from our tenants, employees of our tenants, and others if property damage or health concerns arise. The occurrence of any of these risks could have a material adverse effect on our results of operations, financial condition and cash flow.
We may be subject to litigation, which could have a material adverse effect on our financial condition.
We may be subject to litigation, including claims relating to our assets and operations that are otherwise in the ordinary course of business. Some of these claims may result in significant defense costs and potentially significant judgments against us, some of which we may not be insured against. We may also incur significant costs to seek indemnification and contribution from third parties, which costs may not be reimbursed. We generally intend to vigorously defend ourselves against such claims. However, we cannot be certain of the ultimate outcomes of claims that may be asserted. Resolution of these types of matters against us may result in our management having to dedicate significant time to those matters and in the company having to pay significant fines, judgments, or settlements, which, if uninsured, or if the fines, judgments, and settlements exceed insured levels, would adversely impact our earnings and cash flows, thereby impacting our ability to service debt and make quarterly distributions to our shareholders. Certain litigation or the resolution of certain litigation may affect the availability or cost of some of our insurance coverage, which could adversely impact our financial condition and results of operations, expose us to increased risks that would be uninsured, and/or adversely impact our ability to attract officers and trustees.
Failure to succeed in new markets may limit our growth and/or have a material adverse effect on our results of operations.
We may make selected acquisitions outside our current geographic market from time to time as appropriate opportunities arise. Our historical experience is in the greater Washington, D.C. region, and we may not be able to operate successfully in other market areas where we have limited or no experience. We may be exposed to a variety of risks if we choose to enter new markets. These risks include, among others:
• | a lack of market knowledge and understanding of the local economies; |
• | an inability to identify promising acquisition or development opportunities; |
• | an inability to identify and cultivate relationships that, similar to our relationships in the greater Washington, D.C. region, are important to successfully effecting our business plan; |
• | an inability to employ construction trades people; and |
• | a lack of familiarity with local government and permitting procedures. |
20
Any of these factors could adversely affect the profitability of projects outside our current markets and limit the success of our acquisition and development strategy. If our acquisition and development strategy is negatively affected, our growth may be impeded and our results of operations materially adversely affected.
Mezzanine loan investments are subject to significant risks, and losses related to these investments could have a material adverse effect on our results of operations and ability to make distributions to our shareholders.
We previously have and may in the future again engage in lending activities, including mezzanine financing activities. Such mezzanine loans may be secured by a portion of the owners’ interest in a property and be effectively subordinate to a senior mortgage loan on the property. These types of loans involve a higher degree of risk than long-term senior mortgage lending secured by income-producing real property, because the loan may become unsecured as a result of foreclosure by the senior lender. In addition, mezzanine loans may have higher loan-to-value ratios than conventional mortgage loans, resulting in less equity in the property and increasing the risk of loss of principal. If a borrower defaults on our mezzanine loan or debt senior to our loan, or in the event of a borrower bankruptcy, our mezzanine loan would be satisfied only after the senior debt is paid in full. Where debt senior to our loan exists, the presence of intercreditor arrangements between the holder of the mortgage loan and us, as the mezzanine lender, may limit our ability to amend our loan documents, assign our loans, accept prepayments, exercise our remedies and control decisions made in bankruptcy proceedings relating to borrowers. As a result, we may not recover some or all of our investment, which could result in losses. In addition, even if we are able to foreclose on the underlying collateral following a default on a mezzanine loan, we would be substituted for the defaulting borrower and, to the extent income generated on the underlying property is insufficient to meet outstanding debt obligations on the property, may need to commit substantial additional capital to stabilize the property and prevent additional defaults to lenders with existing liens on the property. Significant losses related to mezzanine loans could have a material adverse effect on our results of operations and our ability to make distributions to our shareholders.
Effective for the District’s taxable year beginning October 1, 2014, Washington, D.C. implemented a new methodology for assessing office property values, and such methodology may increase the assessed values of office properties in Washington, D.C., thereby increasing office property owners’ tax liabilities and making Washington, D.C. a less attractive market for potential tenants, from whom property tax payments are often recoverable pursuant to market lease terms.
Effective for the District’s taxable year beginning October 1, 2014, Washington, D.C. implemented a new methodology for assessing office property values, which are used to determine the amount of property taxes for which office property owners are liable to the city. The new methodology will use market values to determine property values in lieu of the current system, which analyzes rent, occupancy and other operating data. As of December 31, 2016, we own interests in seven office properties (including one property owned through an unconsolidated joint venture) in Washington, D.C., which total approximately 1.0 million square feet. Pursuant to typical leases between office property owners and their tenants, property owners may recover property tax expenses from tenants. As a result, increases in property tax liabilities may increase the cost to our tenants of leasing office space in Washington, D.C. This could cause our current, as well as potential future tenants, to seek to lease office space in other markets, which could negatively impact our ability to lease and re-lease space in our Washington, D.C. office buildings at current rates or at all. In addition, if we are unable to recover all of the increased property tax expense from our tenants, the increase in property tax liabilities could have a material adverse effect on our results of operations, financial condition and cash flow.
We face risks associated with short-term liquid investments which could adversely affect our results of operations or financial condition.
We periodically have significant cash balances that we invest in a variety of short-term investments that are intended to preserve principal value and maintain a high degree of liquidity while providing current income. From time to time, these investments may include (either directly or indirectly):
• | direct obligations issued by the U.S. Treasury; |
• | obligations issued or guaranteed by the U.S. government or its agencies; |
• | taxable municipal securities; |
• | obligations (including certificates of deposit) of banks and thrifts; |
• | commercial paper and other instruments consisting of short-term U.S. dollar denominated obligations issued by corporations and banks; |
• | repurchase agreements collateralized by corporate and asset-backed obligations; |
21
• | registered and unregistered money market funds; and |
• | other highly-rated short-term securities. |
Investments in these securities and funds are not insured against loss of principal. Under certain circumstances, we may be required to redeem all or part of our investment, and our right to redeem some or all of our investment may be delayed or suspended. In addition, there is no guarantee that our investments in these securities or funds will be redeemable at par value. A decline in the value of our investment or a delay or suspension of our right to redeem may have a material adverse effect on our results of operations or financial condition.
Compliance with the Americans with Disabilities Act and fire, safety and other regulations may require us to make unanticipated expenditures that materially adversely impact our cash flow.
All of our properties are required to comply with Title III of the Americans with Disabilities Act, or the ADA. The ADA has separate compliance requirements for “public accommodations” and “commercial facilities” that are not public accommodations, but it generally requires that buildings be made accessible to people with disabilities. Compliance with the ADA requirements could require, for example, removal of access barriers and non-compliance could result in the imposition of fines by the U.S. Government or an award of damages to private litigants, or both. While the tenants to whom we lease properties are obligated by law to comply with the ADA provisions, and typically under our leases are obligated to cover costs associated with compliance, under the law we are also legally responsible for our properties’ ADA compliance. If required changes involve greater expenditures than anticipated, or if the changes must be made on a more accelerated basis than anticipated, the ability of our tenants to cover costs could be adversely affected and we could be required to expend our own funds to comply with the provisions of the ADA, which could adversely affect our results of operations and financial condition and our ability to make distributions to security holders. State and local laws may also require modifications to our properties related to access by disabled persons. In addition, we are required to operate our properties in compliance with fire and safety regulations, building codes and other land use regulations, as they may be adopted by governmental agencies and bodies and become applicable to our properties. We may be required to make substantial capital expenditures to comply with those requirements and these expenditures could have a material adverse effect on our cash flow and ability to make distributions to our security holders.
Failure to comply with Federal government contractor requirements could result in substantial costs and loss of substantial revenue.
We are subject to compliance with a wide variety of complex legal requirements because we are a Federal government contractor. These laws regulate how we conduct business, require us to administer various compliance programs and require us to impose compliance responsibilities on some of our contractors. Our failure to comply with these laws could subject us to fines, penalties and damages, cause us to be in default of our leases and other contracts with the Federal government and bar us from entering into future leases and other contracts with the Federal government. There can be no assurance that these potential costs and losses of revenue will not have a material adverse effect on our results of operations, financial condition and cash flow.
An uninsured loss or a loss that exceeds the policies on our properties could have a material adverse effect on our results of operations, financial condition and cash flow.
We carry insurance coverage on our properties of types and in amounts and with deductibles that we believe are in line with coverage customarily obtained by owners of similar properties. In particular, we have obtained comprehensive liability, casualty, earthquake, flood and rental loss insurance policies on our properties. All of these policies may, depending on the nature of the loss, involve substantial deductibles and certain exclusions. In addition, under the terms and conditions of most of the leases currently in force on our properties, our tenants generally are required to indemnify and hold us harmless from liabilities resulting from injury to persons, air, water, land or property, on or off the premises, due to activities conducted on the properties, except for claims arising from the negligence or intentional misconduct of us or our agents. Furthermore, tenants are generally required, at the tenant’s expense, to obtain and keep in full force during the term of the lease, liability and full replacement value property damage insurance policies. However, our largest tenant, the federal government, is not required to maintain property insurance at all. In addition, we cannot assure you that our tenants will properly maintain their insurance policies or have the ability to pay the deductibles.
Should a loss occur that is uninsured or in an amount exceeding the combined aggregate limits for the policies noted above, or in the event of a loss that is subject to a substantial deductible under an insurance policy, we could lose all or part of our capital invested in, and anticipated revenue from, one or more of the properties. Depending on the specific circumstances of
22
the affected property, it is possible that we could be liable for any mortgage indebtedness or other obligations related to the property. Any such loss could have a material adverse effect on our results of operations, financial condition, cash flow and our ability to make distributions to our security holders.
Terrorist attacks and other acts of violence or war may affect any market on which our securities trade, the markets in which we operate, our business and our results of operations.
Actual or threatened terrorist attacks may negatively affect our business and our results of operations. In particular, because of our concentration of properties in the Washington, D.C. metropolitan area, which has been and may in the future be the target of actual or threatened terrorist attacks, some tenants in our market may choose to relocate their businesses to other markets. This could result in an overall decrease in the demand for commercial space in this market generally, which could increase vacancies in our properties or necessitate that we lease our properties on less favorable terms, or both. In addition, future terrorist attacks or armed conflicts may directly impact the value of our properties through damage, destruction, loss or increased security costs, or cause losses that materially exceed our insurance coverage. As a result of the foregoing, our ability to generate revenues and the value of our properties could decline materially, which would negatively affect our business and our results of operations. See also “-An uninsured loss or a loss that exceeds the policies on our properties could have a material adverse effect on our results of operations, financial condition and cash flow.”
In response to the uncertainty in the insurance market following the terrorist attacks of September 11, 2001, the Federal Terrorism Risk Insurance Act (as amended, “TRIA”) was enacted in November 2002 to require regulated insurers to make available coverage for “certified” acts of terrorism (as defined by the statute). TRIA was renewed in January 2015 until 2020 by the Terrorism Risk Insurance Program Reauthorization Act of 2015; however, we can provide no assurance that TRIA will be extended beyond 2020. Currently, our property insurance coverage includes acts of terrorism certified under TRIA other than nuclear, biological, chemical or radiological terrorism. The terrorism insurance that we obtain may not be sufficient to cover loss for damages to our properties as a result of terrorist attacks. In addition, certain losses resulting from these types of events are uninsurable and others would not be covered by our current terrorism insurance. Additional terrorism insurance may not be available at a reasonable price or at all. If the properties in which we invest are unable to obtain sufficient and affordable insurance coverage, the value of those investments could decline, and in the event of an uninsured loss, we could lose all or a portion of an investment. Furthermore, the United States may enter into armed conflicts in the future. The consequences of any armed conflicts are unpredictable, and we may not be able to foresee events that could have an adverse effect on our business.
Any of these events could result in increased volatility in or damage to the United States and worldwide financial markets and economy. They also could result in a continuation of the current economic uncertainty in the United States or abroad. Adverse economic conditions could affect the ability of our tenants to pay rent, which could have a material adverse effect on our operating results and financial condition, as well as our ability to make distributions to our security holders, and may adversely affect and/or result in volatility in the market price for our securities.
We face risks associated with security breaches through cyber attacks, cyber intrusions or otherwise, as well as other significant disruptions of our information technology (IT) networks and related systems.
We face risks associated with security breaches, whether through cyber attacks or cyber intrusions over the Internet, malware, computer viruses, attachments to e-mails, persons inside our organization or persons with access to systems inside our organization, and other significant disruptions of our IT networks and related systems. The risk of a security breach or disruption, particularly through cyber attack or cyber intrusion, including by computer hackers, foreign governments and cyber terrorists, has generally increased as the number, intensity and sophistication of attempted attacks and intrusions from around the world have increased. Our IT networks and related systems are essential to the operation of our business and our ability to perform day-to-day operations (including managing our building systems) and, in some cases, may be critical to the operations of certain of our tenants. Although we make efforts to maintain the security and integrity of these types of IT networks and related systems, and we have implemented various measures to manage the risk of a security breach or disruption, there can be no assurance that our security efforts and measures will be effective or that attempted security breaches or disruptions would not be successful or damaging. Even the most well protected information, networks, systems and facilities remain potentially vulnerable because the techniques used in such attempted security breaches evolve and generally are not recognized until launched against a target, and in some cases are designed not be detected and, in fact, may not be detected. Accordingly, we may be unable to anticipate these techniques or to implement adequate security barriers or other preventative measures, and thus it is impossible for us to entirely mitigate this risk.
23
A security breach or other significant disruption involving our IT networks and related systems could:
• | disrupt the proper functioning of our networks and systems and therefore our operations and/or those of certain of our tenants; |
• | result in misstated financial reports, violations of loan covenants, and/or missed reporting deadlines; |
• | result in our inability to properly monitor our compliance with the rules and regulations regarding our qualification as a REIT; |
• | result in the unauthorized access to, and destruction, loss, theft, misappropriation or release of proprietary, confidential, sensitive or otherwise valuable information of ours or others, which others could use to compete against us or for disruptive, destructive or otherwise harmful purposes and outcomes; |
• | result in our inability to maintain the building systems relied upon by our tenants for the efficient use of their leased space; |
• | require significant management attention and resources to remedy any damages that result; |
• | subject us to claims for breach of contract, damages, credits, penalties or termination of leases or other agreements; or |
• | damage our reputation among our tenants and investors generally. |
Any or all of the foregoing could have a material adverse effect on our financial condition, results of operations, cash flow and ability to make distributions with respect to, and the market price of, our securities.
Our business and operations would suffer in the event of system failures.
Despite system redundancy and the implementation of a disaster recovery plan and security measures for our IT networks and related systems, our systems are vulnerable to damages from any number of sources, including computer viruses, energy blackouts, natural disasters, terrorism, war, and telecommunication failures. We rely on our IT networks and related systems, including the Internet, to process, transmit and store electronic information and to manage or support a variety of our business processes, including financial transactions and keeping of records, which may include personal identifying information of tenants and lease data. We rely on commercially available systems, software, tools and monitoring to provide security for processing, transmitting and storing confidential tenant information, such as individually identifiable information relating to financial accounts. Any failure to maintain proper function, security and availability of our IT networks and related systems could interrupt our operations, damage our reputation, subject us to liability claims or regulatory penalties and could have a material adverse effect on our operations. Further, we are dependent on our personnel and, although we recently implemented a formal disaster recovery plan to assist our employees, or to facilitate their maintaining continuity of operations after events such as energy blackouts, natural disasters, terrorism, war, and telecommunication failures, we can provide no assurances that any of the foregoing events would not have a material adverse effect on our results of operations.
We face risks associated with our tenants being designated “Prohibited Persons” by the Office of Foreign Assets Control.
Pursuant to Executive Order 13224 and other laws, the Office of Foreign Assets Control of the U.S. Department of the Treasury, or OFAC, maintains a list of persons designated as terrorists or who are otherwise blocked or banned, or Prohibited Persons. OFAC regulations and other laws prohibit conducting business or engaging in transactions with Prohibited Persons. Certain of our loan and other agreements require us to comply with these OFAC requirements. If a tenant or other party with whom we contract is placed on the OFAC list, we may be required by the OFAC requirements to terminate the lease or other agreement. Any such termination could result in a loss of revenue or a damage claim by the other party that the termination was wrongful.
Rising energy costs could have an adverse effect on our results of operations.
Electricity and natural gas, the most common sources of energy used by commercial buildings, are subject to significant price volatility. In recent years, energy costs, including energy generated by natural gas and electricity, have fluctuated significantly. Some of our properties may be subject to leases that require our tenants to pay all utility costs while other leases may provide that tenants will reimburse us for utility costs in excess of a base year amount. It is possible that some or all of our tenants will not fulfill their lease obligations and reimburse us for their share of any significant energy rate increases and that we will not be able to retain or replace our tenants if energy price fluctuations continue. Also, to the extent under a lease we agree to pay for such costs, rising energy prices could have an adverse effect on our results of operations.
We face possible risks associated with the physical effects of climate change.
24
We cannot assert with certainty whether climate change is occurring and, if so, at what rate. However, the physical effects of climate change could have a material adverse effect on our properties, operations and business. For example, all of our properties are located along the East coast. To the extent climate change causes changes in weather patterns, our markets could experience increases in storm intensity and rising sea-levels. Over time, these conditions could result in declining demand for office space in our buildings or our inability to operate the buildings at all. Climate change may also have indirect effects on our business by increasing the cost of (or making unavailable) property insurance on terms we find acceptable, increasing the cost of energy and increasing the cost of snow removal at our properties. There can be no assurance that climate change will not have a material adverse effect on our properties, operations or business.
Changes in accounting pronouncements could adversely affect our operating results, in addition to the reported financial performance of our tenants.
Accounting policies and methods are fundamental to how we record and report our financial condition and results of operations. Uncertainties posed by various initiatives of accounting standard-setting by the Financial Accounting Standards Board and the Securities and Exchange Commission, which create and interpret applicable accounting standards for U.S. companies, may change the financial accounting and reporting standards or their interpretation and application of these standards that govern the preparation of our financial statements. Changes include, but are not limited to, changes in lease accounting and the adoption of accounting standards likely to require the increased use of “fair-value” measures.
These changes could have a material impact on our reported financial condition and results of operations. In some cases, we could be required to apply a new or revised standard retroactively, resulting in potentially material restatements of prior period financial statements. Similarly, these changes could have a material impact on our tenants’ reported financial condition or results of operations or could affect our tenants’ preferences regarding leasing real estate.
Risks Related to Our Organization and Structure
Our executive officers have agreements that provide them with benefits if their employment is terminated without cause or if such agreements are not renewed by the Company (including within two years of a change in control of the Company), which could prevent or deter a change in control of the Company.
We have entered into employment agreements with our three executive officers, Robert Milkovich, Andrew P. Blocher and Samantha S. Gallagher, which provide them with severance benefits if terminated without cause, if the executive officer resigns for “good reason” as defined in the employment agreements or if their employment ends under certain circumstances following a change in control of the Company. These benefits could increase the cost to a potential acquirer of the Company and thereby prevent or deter a change in control of the Company that might involve a premium price for our securities or otherwise be in the interests of our security holders.
Conflicts of interest may arise between our executive officers relating to their duties to us and our duties to our Operating Partnership.
Our executive officers may have conflicting duties because, in their capacities as our executive officers, they have a duty to the Company and its shareholders, and in the Company’s capacity as general partner of our Operating Partnership, they have a fiduciary duty to the limited partners. Conflicts may arise when the interests of our shareholders and the limited partners of our Operating Partnership diverge, particularly in circumstances in which there may be an adverse tax consequence to the limited partners, such as upon the sale of assets or the repayment of indebtedness. These conflicts of interest could lead to decisions that are not in the best interests of the Company and its shareholders.
We depend on key personnel, particularly Robert Milkovich, with long-standing business relationships, the loss of whom could threaten our ability to operate our business successfully.
Our future success depends, to a significant extent, upon the continued services of our senior management team, including Robert Milkovich. In particular, the extent and nature of the relationships that Mr. Milkovich has developed in the real estate community in our markets is critically important to the success of our business. Although we have employment agreements with Mr. Milkovich and our other executive officers, there is no guarantee that Mr. Milkovich or our other executive officers will remain employed with us. We do not maintain key person life insurance on any of our officers. The loss of services of one or more members of our senior management team, particularly Mr. Milkovich, could harm our business and prospects.
25
Further, loss of a member of our senior management team could be negatively perceived in the capital markets, which could have an adverse effect on the market price of our securities.
Our rights and the rights of our security holders to take action against our trustees and officers are limited, which could limit your recourse in the event of actions not in your best interests.
Maryland law generally provides that a trustee has no liability for actions taken as a trustee, but may not be relieved of any liability to the company or its security holders for actions taken in bad faith, with willful misfeasance, gross negligence or reckless disregard for his or her duties. Our amended and restated declaration of trust authorizes us to indemnify, and to pay or reimburse reasonable expenses to, our trustees and officers for actions taken by them in those capacities to the maximum extent permitted by Maryland law. In addition, our declaration of trust limits the liability of our trustees and officers for money damages, except as otherwise prohibited by Maryland law or for liability resulting from:
• | actual receipt of an improper benefit or profit in money, property or services; or |
• | a final judgment or other final adjudication based upon a finding of active and deliberate dishonesty by the trustee or officer that was material to the cause of action adjudicated. |
As a result, we and our security holders may have more limited rights against our trustees than might otherwise exist. Our bylaws require us to indemnify each trustee or officer who has been successful, on the merits or otherwise, in the defense of any proceeding to which he or she is made a party by reason of his or her service to us. In addition, we may be obligated to fund the defense costs incurred by our trustees and officers.
We are a holding company with no direct operations and, as such, we rely on funds received from our Operating Partnership to pay liabilities, and the interests of our shareholders are structurally subordinated to all liabilities and obligations of our Operating Partnership and its subsidiaries.
We are a holding company and conduct substantially all of our operations through our Operating Partnership. We do not have, apart from an interest in our Operating Partnership, any independent operations. As a result, we rely on distributions from our Operating Partnership to pay any dividends we might declare on our common shares. We also rely on distributions from our Operating Partnership to meet our obligations, including any tax liability on taxable income allocated to us from our Operating Partnership. In addition, because we are a holding company, claims of our equity holders will be structurally subordinated to all existing and future liabilities and obligations (whether or not for borrowed money) of our Operating Partnership and its subsidiaries. Therefore, in the event of our bankruptcy, liquidation or reorganization, our assets and those of our Operating Partnership and its subsidiaries will be available to satisfy the claims of our shareholders only after all of our and our Operating Partnership’s and its subsidiaries’ liabilities and obligations have been paid in full.
Our ownership limitations may restrict business combination opportunities.
To maintain our qualification as a REIT under the Internal Revenue Code of 1986, as amended (the “Internal Revenue Code”), no more than 50% of the value of our outstanding shares of beneficial interest may be owned, directly or under applicable attribution rules, by five or fewer individuals (as defined to include certain entities) during the last half of each taxable year. To preserve our REIT qualification, our declaration of trust generally prohibits direct or indirect beneficial ownership (as defined under the Internal Revenue Code) by any person of (i) more than 8.75% of the number or value (whichever is more restrictive) of our outstanding common shares or (ii) more than 8.75% of the value of our outstanding shares of all classes. Generally, shares owned by affiliated owners will be aggregated for purposes of the ownership limitation. Our declaration of trust has created an ownership limitation for the group comprised of Louis T. Donatelli and Douglas J. Donatelli, former trustees and, in the case of Douglas J. Donatelli, a former executive officer of the Company, and certain related persons, which prohibits such group from acquiring direct or indirect ownership (as defined under the Internal Revenue Code) of (i) more than 14.9% of the number or value (whichever is more restrictive) of our outstanding common shares or (ii) more than 14.9% of the value of all of our outstanding shares of all classes. Unless the applicable ownership limitation is waived by our board of trustees prior to transfer, any transfer of our shares that would violate the ownership limitation will be null and void, and the intended transferee will acquire no rights in such shares. Shares that would otherwise be held in violation of the ownership limit will be designated as “shares-in-trust” and transferred automatically to a trust effective on the day before the purported transfer or other event giving rise to such excess ownership. The beneficiary of the trust will be one or more charitable organizations named by us. The ownership limitation provisions could have the effect of delaying, deterring or preventing a change in control or other transaction in which holders of shares might receive a premium for their shares over the then current market price or that such holders might believe to be otherwise in their best interests. The
26
ownership limitation provisions also may make our common shares an unsuitable investment vehicle for any person seeking to obtain, either alone or with others as a group, ownership of shares that would violate the ownership limitation provisions.
Our declaration of trust contains provisions that make removal of our trustees difficult, which could make it difficult for our shareholders to effect changes to our management.
Our declaration of trust provides that a trustee may be removed, with or without cause, only upon the affirmative vote of holders of a majority of our outstanding common shares. Vacancies may be filled by the board of trustees. This requirement makes it more difficult to change our management by removing and replacing trustees.
Our bylaws may only be amended by our board of trustees, which could limit your control of certain aspects of our corporate governance.
Our board of trustees has the sole authority to amend our bylaws. Thus, the board is able to amend the bylaws in a way that may be detrimental to your interests.
Maryland law may discourage a third party from acquiring us.
Maryland law provides broad discretion to our board of trustees with respect to their duties as trustees in considering a change in control of our Company, including that our board is subject to no greater level of scrutiny in considering a change in control transaction than with respect to any other act by our board.
The Maryland Business Combination Act restricts mergers and other business combinations between our Company and an interested shareholder for five years after the most recent date on which the shareholder becomes an interested shareholder, and thereafter imposes special shareholder voting requirements on these combinations. An “interested shareholder” is defined as any person who is the beneficial owner of 10% or more of the voting power of our common shares and also includes any of our affiliates or associates that, at any time within the two year period prior to the date of a proposed merger or other business combination, was the beneficial owner of 10% or more of our voting power. Additionally, the “control shares” provisions of the Maryland General Corporation Law, or MGCL, are applicable to us as if we were a corporation. These provisions eliminate the voting rights of issued and outstanding shares acquired in quantities so as to constitute “control shares,” as defined under the MGCL, unless our shareholders approve such voting rights by the affirmative vote of at least two-thirds of all votes entitled to be cast on the matter, excluding all interested shares and shares held by our trustees and officers. “Control shares” are generally defined as shares which, when aggregated with other shares controlled by the shareholder, entitle the shareholder to exercise one of three increasing ranges of voting power in electing trustees. Our amended and restated declaration of trust and bylaws provide that we are not bound by the Maryland Business Combination Act or the control share acquisition statute, respectively. However, in the case of the control share acquisition statute, our board of trustees may opt to make this statute applicable to us at any time by amending our bylaws, and may do so on a retroactive basis. We could also opt to make the Maryland Business Combination Act applicable to us by amending our declaration of trust by a vote of a majority of our outstanding common shares. Finally, the “unsolicited takeovers” provisions of the MGCL permit our board of trustees, without shareholder approval and regardless of what is currently provided in our declaration of trust or bylaws, to implement certain provisions that may have the effect of inhibiting a third party from making an acquisition proposal for our Company or of delaying, deferring or preventing a change in control of our Company under circumstances that otherwise could provide the holders of our common shares with the opportunity to realize a premium over the then current market price or that shareholders may otherwise believe is in their best interests.
Potential future issuances of preferred shares may have terms that may limit our ability to maximize value to common shareholders.
Our declaration of trust permits our board of trustees to issue up to 50 million preferred shares, issuable in one or more classes or series. Our board of trustees may increase the number of preferred shares authorized by our declaration of trust without shareholder approval. Our board of trustees may also classify or reclassify any unissued preferred shares and establish the preferences and rights (including the right to vote, to participate in earnings and to convert into securities) of any such preferred shares, which rights may be superior to those of our common shares. Thus, our board of trustees could authorize the issuance of preferred shares with terms and conditions that could have the effect of discouraging a takeover or other transaction in which holders of some or a majority of the common shares might receive a premium for their shares over the then current market price of our common shares.
27
Tax Risks of our Business and Structure
If we fail to remain qualified as a REIT for federal income tax purposes, we will not be able to deduct our distributions, and our income will be subject to taxation, which would reduce the cash available for distribution to our shareholders.
We elected to be taxed as a REIT under the Internal Revenue Code commencing with our short taxable year ended December 31, 2003. The requirements for qualification as a REIT are complex and interpretations of the federal income tax laws governing REITs are limited. The REIT qualification rules are even more complicated for a REIT that invests through an operating partnership, in various joint ventures, in other REITs and in both equity and debt investments. Our qualification as a REIT depends on our ability to meet various requirements concerning, among other things, the ownership of our outstanding shares of beneficial interest, the nature of our assets, the sources of our income and the amount of our distributions to our shareholders. If we fail to meet these requirements and do not qualify for certain statutory relief provisions, our distributions to our shareholders will not be deductible by us and we will be subject to a corporate level tax (including any applicable alternative minimum tax) on our taxable income at regular corporate rates, substantially reducing our cash available to make distributions to our shareholders. In addition, if we fail to maintain our qualification as a REIT, we would no longer be required to make distributions for federal income tax purposes. Incurring corporate income tax liability might cause us to borrow funds, liquidate some of our investments or take other steps that could negatively affect our operating results. Moreover, if our REIT status is terminated because of our failure to meet a REIT qualification requirement or if we voluntarily revoke our election, unless relief provisions applicable to certain REIT qualification failures apply, we would be disqualified from electing treatment as a REIT for the four taxable years following the year in which REIT status is lost. We may not qualify for relief provisions for REIT qualification failures and even if we can qualify for such relief, we may be required to make penalty payments, which could be significant in amount.
Certain subsidiaries might fail to qualify or fail to remain qualified as a REIT
We own substantially all of the outstanding stock of a subsidiary which we consolidate for financial reporting purposes but which is treated as a separate REIT for federal income tax purposes (the “Subsidiary REIT”). To qualify as a REIT, the Subsidiary REIT must independently satisfy all of the REIT qualification requirements under the Code, together with all other rules applicable to REITs. Provided that the Subsidiary REIT qualifies as a REIT, our interests in the Subsidiary REIT will be treated as qualifying real estate assets for purposes of the REIT asset tests. If the Subsidiary REIT fails to qualify as a REIT in any taxable year, the Subsidiary REIT will be subject to federal and state income taxes and may not be able to qualify as a REIT for the four subsequent taxable years. Any such failure could have an adverse effect on our ability to comply with the REIT income and asset tests, and thus our ability to qualify as a REIT, unless we are able to avail ourselves of certain relief provisions.
Even if we qualify as a REIT, we may face other tax liabilities that reduce the cash available for distribution to our shareholders.
Even if we maintain our qualification as a REIT, we are subject to any applicable federal, state and local taxes on our income, property or net worth, including taxes on any undistributed income, tax on income from some activities conducted as a result of a foreclosure, and state or local income, property and transfer taxes. Moreover, if we have net income from “prohibited transactions,” that income will be subject to a 100% tax. In general, prohibited transactions are sales or other dispositions of property held primarily for sale to customers in the ordinary course of business. The determination as to whether a particular sale is a prohibited transaction depends on the facts and circumstances related to that sale. While we will undertake sales of assets if those assets become inconsistent with our long-term strategic or return objectives, we do not believe that those sales should be considered prohibited transactions, but there can be no assurance that the Internal Revenue Service would not contend otherwise. The need to avoid prohibited transactions could cause us to forego or defer sales of properties that might otherwise be in our best interest to sell. In addition, we could, in certain circumstances, be required to pay an excise or penalty tax (which could be significant in amount) in order to utilize one or more relief provisions under the Internal Revenue Code to maintain our qualification as a REIT. Any of these taxes would decrease cash available for the payment of our debt obligations and distributions to shareholders. Our taxable REIT subsidiary generally will be subject to U.S. federal corporate income tax on its net taxable income.
Failure of our Operating Partnership to be treated as a partnership for federal income tax purposes would result in our failure to qualify as a REIT.
28
We believe that our Operating Partnership is organized and operated in a manner so as to be treated as a partnership and not an association or a publicly traded partnership taxable as a corporation, for federal income tax purposes. Failure of our Operating Partnership (or a subsidiary partnership) to be treated as a partnership for federal income tax purposes would have serious adverse consequences to our shareholders. If the Internal Revenue Service were to successfully challenge the federal income tax status of our Operating Partnership and treat our Operating Partnership as an association or publicly traded partnership taxable as a corporation for federal income tax purposes, we would fail to meet the gross income tests and certain of the asset tests applicable to REITs and, accordingly, would cease to qualify as a REIT. Also, the failure of the Operating Partnership to qualify as a partnership would cause it to become subject to federal corporate income tax, which would reduce significantly the amount of its cash available for distribution to its partners, including us.
Our disposal of properties may have negative implications, including unfavorable tax consequences.
One aspect of our Strategic Plan includes disposing of those properties that are no longer a strategic fit, properties in submarkets where we do not have asset concentration or operating efficiencies and/or properties where we believe we cannot further maximize value. If we dispose of a property directly or through an entity that is treated for federal income tax purposes as a partnership or a disregarded entity, and such sale is deemed to be a sale of dealer property or inventory, such sale may be deemed to be a “prohibited transaction” under the federal income tax laws applicable to REITs, in which case our gain, or our share of the gain, from the sale would be subject to a 100% penalty tax. If we believe that a sale of a property might be treated as a prohibited transaction, we may seek to conduct that sales activity through a taxable REIT subsidiary, in which case the gain from the sale would be subject to corporate income tax but not the 100% prohibited transaction tax. We cannot assure you, however, that the Internal Revenue Service will not assert successfully that sales of properties that we make directly or through an entity that is treated as a partnership or a disregarded entity, for federal income tax purposes are sales of dealer property or inventory, in which case the 100% penalty tax would apply.
Moreover, we have entered and may enter into agreements with joint venture partners or contributors to our Operating Partnership that require us to indemnify, in whole or in part, such joint venture partners or such contributors for their tax obligations resulting from the recognition of gain in the case of taxable sales of certain contributed properties or a failure to maintain certain property-level indebtedness on certain contributed properties for a period of years.
Distribution requirements relating to qualification as a REIT for federal income tax purposes limit our flexibility in executing our business plan.
Our long-term business plan contemplates growth through acquisitions. To maintain our qualification as a REIT for federal income tax purposes, we generally are required to distribute to our shareholders at least 90% of our “REIT taxable income” (determined without regard to the deduction for dividends paid and by excluding net capital gains) for each of our taxable years. To the extent that we satisfy the 90% distribution requirement, but distribute less than 100% of our taxable income, we will be subject to federal corporate income tax on our undistributed taxable income. In addition, we are required to pay a 4% nondeductible excise tax on the amount, if any, by which actual distributions we pay with respect to any calendar year are less than the sum of 85% of our ordinary income for that calendar year, 95% of our capital gain net income for the calendar year and any amount of our undistributed taxable income required to be distributed from prior years.
We have distributed, and intend to continue to distribute, to our shareholders all or substantially all of our REIT taxable income each year in order to comply with the distribution requirements of the Internal Revenue Code and to eliminate all federal income tax liability at the REIT level and liability for the 4% nondeductible excise tax. Our distribution requirements limit our ability to accumulate capital for other business purposes, including funding acquisitions, debt maturities and capital expenditures. Thus, our ability to grow through acquisitions will be limited if we are unable to obtain debt or equity financing. In addition, differences in timing between the receipt of income and the payment of expenses in arriving at REIT taxable income and the effect of required debt amortization payments could require us to borrow funds or make a taxable distribution of our shares or debt securities to meet the distribution requirements that are necessary to achieve the tax benefits associated with qualifying as a REIT.
We may be subject to adverse legislative or regulatory tax changes that could reduce the market price of our securities.
At any time, the federal income tax laws or regulations governing REITs or the administrative interpretations of those laws or regulations may be amended. Legislative and regulatory changes, including comprehensive tax reform, may be more likely in the 115th Congress, which convened in January 2017, because the Presidency and both Houses of Congress will be controlled by the same political party. We cannot predict when or if any new federal income tax law, regulation or administrative
29
interpretation, or any amendment to any existing federal income tax law, regulation or administrative interpretation, will be adopted, promulgated or become effective and any such law, regulation or interpretation may take effect retroactively. We and our shareholders, as well as the market price of our securities, could be adversely affected by any such change in, or any new, federal income tax law, regulation or administrative interpretation.
Dividends payable by REITs generally do not qualify for the reduced tax rates available for some dividends.
The maximum federal income tax rate currently applicable to income from “qualified dividends” payable by corporations to U.S. shareholders taxed at individual rates is 20% (excluding the 3.8% net investment income tax). Dividends payable by REITs, however, generally are not eligible for the reduced tax rates. Although such reduced tax rates do not adversely affect the taxation of REITs or dividends payable by REITs, the more favorable tax rates applicable to regular corporate qualified dividends could cause investors who are taxed at individual rates to perceive investments in REITs to be relatively less attractive than investments in shares of non-REIT corporations that pay dividends, which could adversely affect the market price of shares of REITs, including our shares.
Complying with REIT requirements may force us to forego and/or sell otherwise attractive investments.
To maintain our qualification as a REIT, we must satisfy certain requirements with respect to the character of our assets. If we fail to comply with these requirements at the end of any calendar quarter, we must correct such failure within 30 days after the end of the calendar quarter (by, possibly, selling assets notwithstanding their prospects as an investment) to avoid losing our REIT status. If we fail to comply with these requirements at the end of any calendar quarter, and the failure exceeds a de minimis threshold, we may be able to preserve our REIT status if (a) the failure was due to reasonable cause and not to willful neglect, (b) we dispose of the assets causing the failure within six months after the last day of the quarter in which we identified the failure, (c) we file a schedule with the Internal Revenue Service describing each asset that caused the failure, and (d) we pay an additional tax of the greater of $50,000 or the product of the highest applicable tax rate multiplied by the net income generated on those assets. As a result, we may be required to liquidate or forego otherwise attractive investments. These actions could have the effect of reducing our income and amounts available for distribution to our shareholders.
In addition to the asset test requirements mentioned above, to qualify as a REIT we must continually satisfy tests concerning, among other things, the sources of our income, the amounts we distribute to our shareholders and the ownership of our stock. We may be unable to pursue investments that would be otherwise advantageous to us in order to satisfy the source-of-income or asset-diversification requirements for qualifying as a REIT. Thus, compliance with the REIT requirements may hinder our ability to make certain attractive investments.
Risks Related to an Investment in Our Equity Securities
Our common shares trade in a limited market, which could hinder your ability to sell our common shares.
Our common shares experience relatively limited trading volume; many investors, particularly institutions, may not be interested (or be permitted) in owning our common shares because of the inability to acquire or sell a substantial block of our common shares at one time. This illiquidity could have an adverse effect on the market price of our common shares. In addition, a shareholder may not be able to borrow funds using our common shares as collateral because lenders may be unwilling to accept the pledge of common shares having a limited market, thereby making our common shares a less attractive investment for some investors.
The market price and trading volume of our common shares may be volatile.
The market price of our common shares has been and may continue to be more volatile than in prior years and subject to wide fluctuations. In addition, the trading volume in our common shares may fluctuate and cause significant price variations to occur. We cannot assure you that the market price of our common shares will not fluctuate or decline significantly in the future, including as a result of factors unrelated to our operating performance or prospects.
30
Some of the factors that could negatively affect our share price or result in fluctuations in the price or trading volume of our common shares include:
• | actual or anticipated declines in our quarterly operating results or distributions; |
• | reductions in our funds from operations; |
• | declining occupancy rates or increased tenant defaults; |
• | general market and economic conditions, including continued volatility in the financial and credit markets; |
• | increases in market interest rates that lead purchasers of our securities to demand a higher dividend yield; |
• | the general reputation of REITs and the attractiveness of our equity securities in comparison to other equity securities, including securities issued by other real estate-based companies; |
• | perceived attractiveness of the Washington, D.C. region; |
• | changes in market valuations of similar companies; |
• | adverse market reaction to any increased indebtedness we incur in the future; |
• | additions or departures of key management personnel; |
• | actions by institutional shareholders; |
• | our issuance of additional debt or preferred equity securities; |
• | speculation in the press or investment community; and |
• | unanticipated charges due to the vesting of equity based compensation awards upon achievement of certain performance measures that cause our operating results to decline or fail to meet market expectations. |
An increase in market interest rates may have an adverse effect on the market price of our common shares.
One of the factors that investors may consider in deciding whether to buy or sell our common shares is our distribution rate as a percentage of our share price, relative to market interest rates. If market interest rates increase, prospective investors may desire a higher distribution rate on our common shares or seek securities paying higher dividends or interest. The market price of our common shares likely will be based primarily on the earnings that we derive from rental income with respect to our properties and our related distributions to shareholders, and not from the underlying appraised value of the properties themselves. As a result, interest rate fluctuations and capital market conditions can affect the market price of our common shares. For instance, if interest rates rise without an increase in our distribution rate, the market price of our common shares could decrease because potential investors may require a higher yield on our common shares as market rates on interest-bearing securities, such as bonds, rise. In addition, rising interest rates would result in increased interest expense on our non-hedged variable rate debt, thereby adversely affecting cash flow and our ability to service our indebtedness and make distributions to our shareholders.
We have not established a minimum dividend payment level and we cannot assure you of our ability to pay dividends in the future or the amount of any dividends.
We have not established a minimum dividend payment level and our ability to make distributions may be adversely affected by the risk factors described in this Annual Report on Form 10-K and any risk factors in our subsequent filings with the SEC. For example, in 2016, we reduced our targeted annualized common share dividend to $0.40 per share, which represents a 33% reduction from the previous annualized dividend rate of $0.60 per share. All distributions are made at the discretion of our board of trustees and their payment and amount will depend on our earnings, our financial condition, maintenance of our REIT status, compliance with our debt covenants and other factors as our board of trustees may deem relevant from time to time. We cannot assure you of our ability to make distributions in the future or that the distributions will be made in amounts similar to our current distributions. In particular, our outstanding debt, and the limitations imposed on us by our debt agreements, could make it more difficult for us to satisfy our obligations with respect to our equity securities, including paying dividends. See “Risk Factors - Risks Related to Our Business and Properties - Covenants in our debt agreements could adversely affect our liquidity and financial condition.” Further, future offerings of preferred shares could have a preference on liquidating distributions or a preference on dividend payments or both that could limit our ability to make a dividend distribution to the holders of our common shares. In addition, some of our distributions may include a return of capital or may be taxable distributions of our shares or debt securities.
Future offerings of debt securities, which would rank senior to our common shares upon liquidation, and future offerings of equity securities, which would dilute our existing shareholders and may be senior to our common shares for the purposes of dividend and liquidating distributions, may adversely affect the market price of our equity securities.
In the future, particularly as we seek to acquire and develop additional real estate assets consistent with our growth strategy, we may attempt to increase our capital resources through debt offerings or additional equity offerings, including senior or
31
subordinated notes and series of preferred shares or common shares. Any preferred shares that we issue will rank junior to all of our existing and future debt and to other non-equity claims on us and our assets available to satisfy claims against us, including claims in bankruptcy, liquidation or similar proceedings. Further, upon liquidation, holders of our debt securities and preferred shares and lenders with respect to other borrowings will receive a distribution of our available assets prior to the holders of our common shares.
Additional equity offerings may dilute the holdings of our existing shareholders, reduce the market price of our equity securities, or have a dilutive effect on our earnings per share and funds from operations per share. Because our decision to issue securities in any future offering will depend on market conditions and other factors beyond our control, we cannot predict or estimate the amount, timing or nature of our future offerings or the actual amount of dilution, if any. Thus, holders of our equity securities bear the risk of our future offerings reducing the market price of our equity securities and diluting their share holdings in us.
Shares eligible for future sale may have adverse effects on our share price.
We cannot predict the effect, if any, of future sales of common shares, or the availability of shares for future sales, on the market price of our common shares. Sales of substantial amounts of common shares, including common shares issuable upon the redemption of units of our Operating Partnership and exercise of options, or the perception that these sales could occur, may adversely affect prevailing market prices for our common shares and impede our ability to raise capital. Any substantial sale of our common shares could have a material adverse effect on the market price of our common shares.
We also may issue from time to time additional common shares or preferred shares or units of our Operating Partnership in connection with the acquisition of properties, and we may grant demand or piggyback registration rights in connection with these issuances. For example, in 2011, we issued approximately 2.0 million units in our Operating Partnership in connection with the acquisition of an office property in Washington, D.C. (and subsequently granted an additional approximately 39,000 units pursuant to the contingent consideration obligation in connection with such acquisition) and granted the holders of those units registration rights. Sales of substantial amounts of securities or the perception that these sales could occur may adversely affect the prevailing market price for our securities. In addition, the sale of these shares could impair our ability to raise capital through a sale of additional equity securities.
ITEM 1B. | UNRESOLVED STAFF COMMENTS |
None.
32
ITEM 2. | PROPERTIES |
The following sets forth certain information about our properties by segment as of December 31, 2016 (including properties in development and redevelopment, dollars in thousands):
WASHINGTON, D.C. REGION
Property | Buildings | Sub-Market(1) | Square Feet | Annualized Cash Basis Rent(2) | Leased at December 31, 2016 | Occupied at December 31, 2016 | ||||||||||||
Office | ||||||||||||||||||
11 Dupont Circle, NW(3) | 1 | CBD | 151,144 | $ | 5,086 | 88.1 | % | 88.1 | % | |||||||||
440 First Street, NW(3) | 1 | Capitol Hill | 138,603 | 3,856 | 81.5 | % | 81.5 | % | ||||||||||
500 First Street, NW | 1 | Capitol Hill | 129,035 | 4,638 | 100.0 | % | 100.0 | % | ||||||||||
840 First Street, NE(3) | 1 | NoMA | 248,536 | 7,719 | 100.0 | % | 100.0 | % | ||||||||||
1211 Connecticut Avenue, NW(3) | 1 | CBD | 131,665 | 3,706 | 92.1 | % | 92.1 | % | ||||||||||
1401 K Street, NW(3) | 1 | East End | 119,283 | 3,155 | 79.3 | % | 74.5 | % | ||||||||||
Total/Weighted Average | 6 | 918,266 | 28,160 | 91.4 | % | 90.8 | % | |||||||||||
Unconsolidated Joint Venture | ||||||||||||||||||
1750 H Street, NW(3) | 1 | CBD | 113,131 | 4,123 | 94.6 | % | 91.1 | % | ||||||||||
Region Total/Weighted Average | 7 | 1,031,397 | $ | 32,283 | 91.8 | % | 90.8 | % | ||||||||||
(1) | CBD refers to Central Business District; NoMA refers to North of Massachusetts Avenue. |
(2) | Annualized cash basis rent at the end of the year, which is calculated as the contractual rent due under the terms of the lease, without taking into account rent abatements, is reflected on a triple-net equivalent basis, by deducting estimated operating expense reimbursements that are included, along with base rent, in the contractual payments of our full service leases. This amount does not include items such as rent abatement, unreimbursed expenses, non-recurring revenues and expenses, differences in leased vs. occupied space, and timing differences related to tenant activity. |
(3) | Properties are encumbered by mortgage debt or a construction loan as of December 31, 2016. See note 10, Debt, for more information on debt encumbering the Washington D.C. office properties and note 5, Investment in Affiliates, for more information on the debt encumbering 1750 H Street, NW in the notes to our accompanying financial statements. |
33
MARYLAND REGION
Property | Buildings | Location | Square Feet | Annualized Cash Basis Rent(1) | Leased at December 31, 2016 | Occupied at December 31, 2016 | ||||||||||||
Office | ||||||||||||||||||
Annapolis Business Center | 2 | Annapolis | 101,113 | $ | 1,758 | 100.0 | % | 100.0 | % | |||||||||
Cloverleaf Center | 4 | Germantown | 173,916 | 2,626 | 89.8 | % | 89.8 | % | ||||||||||
Hillside I and II | 2 | Columbia | 87,267 | 991 | 87.6 | % | 82.3 | % | ||||||||||
Metro Park North | 4 | Rockville | 191,211 | 2,942 | 87.3 | % | 87.3 | % | ||||||||||
Redland II and III(2)(3) | 2 | Rockville | 349,267 | 9,737 | 100.0 | % | 100.0 | % | ||||||||||
Redland I(2) | 1 | Rockville | 133,895 | 2,711 | 100.0 | % | 100.0 | % | ||||||||||
TenThreeTwenty | 1 | Columbia | 138,950 | 2,153 | 94.4 | % | 94.4 | % | ||||||||||
Total Office | 16 | 1,175,619 | 22,918 | 94.8 | % | 94.5 | % | |||||||||||
Business Park | ||||||||||||||||||
Ammendale Business Park(4) | 7 | Beltsville | 312,846 | 3,699 | 80.5 | % | 80.5 | % | ||||||||||
Gateway 270 West | 6 | Clarksburg | 252,295 | 3,242 | 92.9 | % | 89.2 | % | ||||||||||
Snowden Center | 5 | Columbia | 145,423 | 2,241 | 99.1 | % | 96.5 | % | ||||||||||
Total Business Park | 18 | 710,564 | 9,182 | 88.7 | % | 86.8 | % | |||||||||||
Total Consolidated | 34 | 1,886,183 | 32,100 | 92.5 | % | 91.6 | % | |||||||||||
Unconsolidated Joint Ventures | ||||||||||||||||||
Aviation Business Park (5) | 3 | Glen Burnie | 120,284 | 1,458 | 79.3 | % | 69.8 | % | ||||||||||
Rivers Park I and II (3)(5) | 6 | Columbia | 307,984 | 3,711 | 82.9 | % | 82.9 | % | ||||||||||
Total Joint Ventures | 9 | 428,268 | 5,169 | 81.9 | % | 79.2 | % | |||||||||||
Region Total/Weighted Average | 43 | 2,314,451 | $ | 37,269 | 90.6 | % | 89.3 | % | ||||||||||
(1) | Annualized cash basis rent at the end of the year, which is calculated as the contractual rent due under the terms of the lease, without taking into account rent abatements, is reflected on a triple-net equivalent basis, by deducting operating expense reimbursements that are included, along with base rent, in the contractual payments of our full service leases. This amount does not include items such as rent abatement, unreimbursed expenses, non-recurring revenues and expenses, differences in leased vs. occupied space, and timing differences related to tenant activity. |
(2) | Redland II and III (520 and 530 Gaither Road, respectively) and Redland I (540 Gaither Road) are collectively referred to as Redland. |
(3) | These properties were encumbered by mortgage debt as of December 31, 2016. See note 10, Debt, for more information on the debt encumbering Redland II and III and note 5, Investment in Affiliates, for more information on the debt encumbering Rivers Park I and II in the notes to our accompanying consolidated financial statements. |
(4) | Ammendale Business Park consists of the following properties: Ammendale Commerce Center and Indian Creek Court. |
(5) | In January 2017, the unconsolidated joint ventures that own these properties entered into a binding contract to sell Aviation Business Park and Rivers Park I and II, which are all located in Maryland. We anticipate completing the sale in March 2017; however, we can provide no assurances regarding the timing or pricing of such sale, or that such sale will ultimately occur. |
34
NORTHERN VIRGINIA REGION
Property | Buildings | Location | Square Feet | Annualized Cash Basis Rent(1) | Leased at December 31, 2016 | Occupied at December 31, 2016 | ||||||||||||
Office | ||||||||||||||||||
Atlantic Corporate Park | 2 | Sterling | 218,250 | $ | 3,964 | 96.2 | % | 96.2 | % | |||||||||
NOVA build-to-suit(2) | 1 | Not Disclosed | 167,440 | 4,050 | 100.0 | % | 100.0 | % | ||||||||||
One Fair Oaks (3) | 1 | Fairfax | 214,214 | 5,707 | 100.0 | % | 100.0 | % | ||||||||||
Three Flint Hill | 1 | Oakton | 180,699 | 3,714 | 97.9 | % | 97.9 | % | ||||||||||
1775 Wiehle Avenue | 1 | Reston | 129,982 | 2,973 | 95.5 | % | 95.5 | % | ||||||||||
Total Office | 6 | 910,585 | 20,409 | 98.0 | % | 98.0 | % | |||||||||||
Business Park | ||||||||||||||||||
Sterling Park Business Center(4) | 7 | Sterling | 472,543 | 4,390 | 92.1 | % | 85.4 | % | ||||||||||
Industrial | ||||||||||||||||||
Plaza 500 (5) | 2 | Alexandria | 502,830 | 5,089 | 90.5 | % | 90.5 | % | ||||||||||
Total Consolidated | 15 | 1,885,958 | 29,887 | 94.5 | % | 92.8 | % | |||||||||||
Unconsolidated Joint Venture | ||||||||||||||||||
Prosperity Metro Plaza(2) | 2 | Merrifield | 326,197 | 8,816 | 100.0 | % | 100.0 | % | ||||||||||
Region Total/Weighted Average | 17 | 2,212,155 | $ | 38,703 | 95.3 | % | 93.9 | % | ||||||||||
(1) | Annualized cash basis rent at the end of the year, which is calculated as the contractual rent due under the terms of the lease, without taking into account rent abatements, is reflected on a triple-net equivalent basis, by deducting operating expense reimbursements that are included, along with base rent, in the contractual payments of our full service leases. This amount does not include items such as rent abatement, unreimbursed expenses, non-recurring revenues and expenses, differences in leased vs. occupied space, and timing differences related to tenant activity. |
(2) | These properties were encumbered by mortgage debt or a construction loan as of December 31, 2016. See note 10, Debt, for more information on the debt encumbering the NOVA build-to-suit and note 5, Investment in Affiliates, for more information on the debt encumbering Prosperity Metro Plaza in the notes to our accompanying consolidated financial statements. |
(3) | On January 9, 2017, we sold One Fair Oaks for net proceeds of $13.3 million. |
(4) | Sterling Park Business Center consists of the following properties: 403/405 Glenn Drive, Davis Drive and Sterling Park Business Center. |
(5) | On February 17, 2017, we sold Plaza 500 for net proceeds of $72.5 million. |
35
SOUTHERN VIRGINIA REGION
Property | Buildings | Location | Square Feet | Annualized Cash Basis Rent(1) | Leased at December 31, 2016 | Occupied at December 31, 2016 | ||||||||||||
Office | ||||||||||||||||||
Greenbrier Towers | 2 | Chesapeake | 171,766 | $ | 1,949 | 90.6 | % | 88.7 | % | |||||||||
Business Park | ||||||||||||||||||
Battlefield Corporate Center(2) | 1 | Chesapeake | 96,720 | 861 | 100.0 | % | 100.0 | % | ||||||||||
Crossways Commerce Center(3) | 9 | Chesapeake | 1,082,461 | 11,825 | 96.1 | % | 94.9 | % | ||||||||||
Greenbrier Business Park(4) | 4 | Chesapeake | 411,237 | 4,569 | 94.0 | % | 92.0 | % | ||||||||||
Norfolk Commerce Park(5) | 3 | Norfolk | 261,674 | 2,716 | 96.1 | % | 96.1 | % | ||||||||||
Total Business Park | 17 | 1,852,092 | 19,971 | 95.8 | % | 94.7 | % | |||||||||||
Region Total/Weighted Average | 19 | 2,023,858 | $ | 21,920 | 95.4 | % | 94.2 | % | ||||||||||
(1) | Annualized cash basis rent at the end of the year, which is calculated as the contractual rent due under the terms of the lease, without taking into account rent abatements, is reflected on a triple-net equivalent basis, by deducting operating expense reimbursements that are included, along with base rent, in the contractual payments of our full service leases. This amount does not include items such as rent abatement, unreimbursed expenses, non-recurring revenues and expenses, differences in leased vs. occupied space, and timing differences related to tenant activity. |
(2) | This property was encumbered by mortgage debt as of December 31, 2016. See note 10, Debt, in the notes to our accompanying consolidated financial statements for more information. |
(3) | Crossways Commerce Center consists of the following properties: Coast Guard Building, Crossways Commerce Center I, Crossways Commerce Center II, Crossways Commerce Center IV and 1434 Crossways Boulevard. |
(4) | Greenbrier Business Park consists of the following properties: Greenbrier Technology Center I, Greenbrier Technology Center II and Greenbrier Circle Corporate Center. |
(5) | Norfolk Commerce Park consists of the following properties: Norfolk Business Center, Norfolk Commerce Park II and Gateway II. |
36
Lease Expirations
At December 31, 2016, 19.0% of our annualized cash basis rent was scheduled to expire in 2017, which includes 5.1% of our annualized cash basis rent that is related to CACI International (whose lease expired on December 31, 2016), the sole tenant at One Fair Oaks, which was sold on January 9, 2017. We expect replacement rents on leases expiring in 2017 to increase slightly on a cash basis relative to the current rental rates being paid by tenants. Current tenants are not obligated to renew their leases upon the expiration of their terms. If non-renewals or terminations occur, we may not be able to locate qualified replacement tenants and, as a result, could lose a significant source of revenue while remaining responsible for the payment of our financial obligations. For new tenants or upon lease expiration for existing tenants, we generally must make improvements and pay other leasing costs for which we may not receive increased rents. We may also make building-related capital improvements for which tenants may not reimburse us. Moreover, the terms of a renewal or new lease, including the amount of rent, may be less favorable to us than the current lease terms, or we may be forced to provide tenant improvements at our expense or provide other concessions or additional services to maintain or attract tenants. We continually strive to increase our portfolio occupancy, and the amount of vacant space in our portfolio at any given time may impact our willingness to reduce rental rates or provide greater concessions to retain existing tenants and attract new tenants. We continually monitor our portfolio on a regional and per property basis to assess market trends, including vacancy, comparable deals and transactions, and other business and economic factors that may influence our leasing decisions. Prior to signing a lease with a tenant, we generally assess the prospective tenant’s credit quality through review of its financial statements and tax returns, and the result of that review is a factor in establishing the rent to be charged and/or level of security deposit required. Over the course of our leases, we monitor our tenants to stay aware of any material changes in credit quality. The metrics we use to evaluate a significant tenant’s liquidity and creditworthiness depend on facts and circumstances specific to that tenant and to the industry in which it operates and include the tenant’s credit history and economic conditions related to the tenant, its operations and the markets in which it operates. These factors may change over time. In addition, our property management personnel have regular contact with tenants and tenant employees, and, where the terms of the lease permit and we deem it prudent, we may request tenant financial information for periodic review, review publicly-available financial statements in the case of public company tenants and monitor news and rating agency reports regarding our tenants (or their parent companies) and their underlying businesses. In addition, we regularly analyze account receivable balances as part of the ongoing monitoring of the timeliness of rent collections from tenants.
During 2016, we had a tenant retention rate of 74% and had positive net absorption of 135,000 square feet. After reflecting all of the renewal leases on a triple-net basis to allow for comparability, the weighted average rental rate of our renewed leases in 2016 increased 6.9% on a U.S. generally accepted accounting principles (“GAAP”) basis, compared with expiring leases. During 2016, we executed new leases for approximately 299,000 square feet, and the majority of the new leases (based on square footage) contained rent escalations. After reflecting all leases on a triple-net basis to allow for comparability, the weighted average rental rate of our new leases increased 3.4% on a GAAP basis, compared with expiring leases.
At December 31, 2016, we owned three single-tenant buildings that had leases expiring in 2017 (One Fair Oaks - CACI International, 540 Gaither Road - Department of Health and Human Services and 500 First Street, NW - Bureau of Prisons).
CACI International, which fully leased One Fair Oaks in our Northern Virginia reporting segment, had a lease that terminated on December 31, 2016. In connection with our fourth quarter reporting for 2015, we evaluated the potential loss of cash flow at One Fair Oaks and the anticipated challenges of re-leasing the property, and as a result, we recorded an impairment charge of $33.9 million to bring the property to its estimated fair value. On January 9, 2017, we sold One Fair Oaks for net proceeds of $13.3 million.
In October 2015, we received notice from the Department of Health and Human Services, which fully leases the building at 540 Gaither Road within our Redland property in our Maryland reporting segment, that it will be exercising its early termination right, which is in March 2017. We underwrote the Department of Health and Human Services exercising its termination right when we acquired the building in 2013. During the second quarter of 2016, we re-leased two floors at 540 Gaither Road, which totaled 45,000 square feet, or approximately 34% of the building’s total square footage. We anticipate that the new tenant at 540 Gaither Road will take occupancy in early 2018; however, we can provide no assurances regarding the timing of when the tenant will take occupancy. We have begun repositioning the property, gauging new tenant interest to lease the property and, upon the expiration of the current tenant’s lease in March 2017, will place 540 Gaither Road into redevelopment, all with the ultimate goal of maximizing value upon the expiration of the lease; however, we can provide no assurances regarding the outcome of these or any other alternative strategies for the property.
The Bureau of Prisons, which fully leases 500 First Street, NW in our Washington, D.C. reporting segment, was subject to a lease that was scheduled to expire in July 2016. During the second quarter of 2016, we entered into a one-year lease extension with the Bureau of Prisons, which is set to expire in July 2017, and we believe there is a likelihood that the tenant will elect to
37
further extend the expiration date of the lease; however, we can provide no assurances regarding the length of such extension or that such extension will occur at all. Currently, we are evaluating various strategies with respect to 500 First Street, NW, which include repositioning 500 First Street, NW and gauging new tenant interest to lease this property, all with the ultimate goal of maximizing value upon the expiration of the lease; however, we can provide no assurances regarding the outcome of these or any other alternative strategies for the property.
The following table sets forth tenant improvement and leasing commission costs on a rentable square foot basis for all new and renewal leases signed during the year ended December 31, 2016:
New | Renewal | ||
Tenant improvements (per rentable square foot) | $21.28 | $6.56 | |
Leasing commissions (per rentable square foot) | $10.43 | $2.19 | |
The following table sets forth a summary schedule of the lease expirations at our consolidated properties for leases in place as of December 31, 2016, assuming no tenant exercises renewal options or early termination rights (dollars in thousands, except per square foot data):
Year of Lease Expiration(1) | Number of Leases Expiring | Leased Square Feet | % of Leased Square Feet | Annualized Cash Basis Rent(2) | % of Annualized Cash Basis Rent | Average Base Rent per Square Foot(3) | ||||||||||||||
2017(4) | 61 | 964,882 | 15.3 | % | $ | 21,313 | 19.0 | % | $ | 22.09 | ||||||||||
2018 | 63 | 651,458 | 10.3 | % | 9,602 | 8.6 | % | 14.74 | ||||||||||||
2019 | 60 | 725,573 | 11.5 | % | 10,442 | 9.3 | % | 14.39 | ||||||||||||
2020 | 56 | 968,619 | 15.4 | % | 15,446 | 13.8 | % | 15.95 | ||||||||||||
2021 | 48 | 505,811 | 8.0 | % | 7,319 | 6.5 | % | 14.47 | ||||||||||||
2022 | 50 | 699,816 | 11.1 | % | 9,547 | 8.5 | % | 13.64 | ||||||||||||
2023 | 16 | 479,800 | 7.6 | % | 11,289 | 10.1 | % | 23.53 | ||||||||||||
2024 | 21 | 519,230 | 8.2 | % | 9,524 | 8.5 | % | 18.34 | ||||||||||||
2025 | 15 | 250,193 | 4.0 | % | 4,547 | 4.1 | % | 18.17 | ||||||||||||
2026 | 14 | 147,358 | 2.3 | % | 3,269 | 2.9 | % | 22.18 | ||||||||||||
Thereafter | 17 | 384,981 | 6.1 | % | 9,771 | 8.7 | % | 25.38 | ||||||||||||
Total / Weighted Average | 421 | 6,297,721 | 100.0 | % | $ | 112,067 | 100.0 | % | $ | 17.79 | ||||||||||
(1) | We classify leases that expired or were terminated on the last day of the quarter as leased square footage since the tenant is contractually entitled to the space. |
(2) | Annualized cash basis rent at the end of the year, which is calculated as the contractual rent due under the terms of the lease, without taking into account rent abatements, is reflected on a triple-net equivalent basis, by deducting estimated operating expense reimbursements that are included, along with base rent, in the contractual payments of our full-service leases. The operating expense reimbursements primarily relate to real estate taxes and insurance expenses. This amount does not include items such as rent abatement, unreimbursed expenses, non-recurring revenues and expenses, differences in leased and occupied space and timing differences related to tenant activity. |
(3) | Represents annualized cash basis rent at December 31, 2016, divided by the square footage of the expiring leases. |
(4) | Includes the contractual expiration of the CACI International lease at One Fair Oaks on December 31, 2016 (presented as a first quarter 2017 expiration), which was sold on January 9, 2017. Also includes the contractual expiration of the Department of Health and Human Services lease at Redland Corporate Center on March 22, 2017 and the Bureau of Prisons lease at 500 First Street, NW on July 31, 2017. |
38
Our average effective annual rental rate per square foot on a cash basis for each of the previous five years is as follows:
Weighted Average Base Rent per Square Foot(1) | |||
2012 | $ | 11.83 | |
2013 | 13.58 | ||
2014 | 15.22 | ||
2015 | 16.41 | ||
2016 | 17.38 | ||
(1) | Represents the weighted average of quarterly annualized cash basis rent during the respective year, divided by the total square footage under the terms of the respective leases from which the annualized cash basis rent is derived (including leased spaces that are not yet occupied). Annualized cash basis rent at the end of each quarter, which is calculated as the contractual rent due under the terms of the lease, without taking into account rent abatements, is reflected on a triple-net equivalent basis, by deducting estimated operating expense reimbursements that are included, along with base rent, in the contractual payments of our full-service leases. The operating expense reimbursements primarily relate to real estate taxes and insurance expenses. This amount does not include items such as rent abatement, unreimbursed expenses, non-recurring revenues and expenses, differences in leased and occupied space and timing differences related to tenant activity. |
Our weighted average occupancy rates for each of the previous five years are summarized as follows:
Weighted Average Occupancy Rates | ||
2012 | 83.3 | % |
2013 | 84.6 | % |
2014 | 86.5 | % |
2015 | 89.0 | % |
2016 | 91.4 | % |
ITEM 3. | LEGAL PROCEEDINGS |
We are subject to legal proceedings and claims arising in the ordinary course of our business. In the opinion of our management, as of December 31, 2016, we are not involved in any material litigation, nor, to management’s knowledge, is any material litigation threatened against us or the Operating Partnership.
ITEM 4. | MINE SAFETY DISCLOSURES |
Not applicable.
39
PART II
ITEM 5. | MARKET FOR REGISTRANT’S COMMON EQUITY, RELATED STOCKHOLDER MATTERS AND ISSUER PURCHASES OF EQUITY SECURITIES |
Market Information
Our common shares are listed on the New York Stock Exchange (“NYSE”) under the symbol “FPO.” Our common shares began trading on the NYSE upon the closing of our initial public offering in October 2003. At February 8, 2017, there were 47 common shareholders of record; however, because many of our common shares are held by brokers and other institutions on behalf of shareholders, we believe there are substantially more beneficial holders of our common shares than record holders.
The following table sets forth the high and low sales prices for our common shares and the dividends paid per common share for 2016 and 2015.
Price Range | Dividends Per Share | ||||||||||
2016 | High | Low | |||||||||
Fourth Quarter | $ | 10.97 | $ | 8.01 | $ | 0.10 | |||||
Third Quarter | 10.47 | 8.83 | 0.10 | ||||||||
Second Quarter | 9.77 | 8.26 | 0.10 | ||||||||
First Quarter | 11.46 | 7.90 | 0.15 | ||||||||
Price Range | Dividends Per Share | ||||||||||
2015 | High | Low | |||||||||
Fourth Quarter | $ | 12.11 | $ | 10.79 | $ | 0.15 | |||||
Third Quarter | 11.89 | 10.18 | 0.15 | ||||||||
Second Quarter | 12.06 | 9.88 | 0.15 | ||||||||
First Quarter | 13.29 | 11.16 | 0.15 | ||||||||
On January 24, 2017, we declared a dividend of $0.10 per common share, equating to an annualized dividend of $0.40 per common share. The dividend was paid on February 15, 2017 to common shareholders of record as of February 8, 2017. As part of our Strategic Plan, we reduced our targeted annualized common share dividend from $0.60 to $0.40 per common share in 2016, which we believe will enable us to improve our balance sheet and finance future growth, including through redevelopment.
On a quarterly basis, our management team recommends a distribution amount that must then be approved by our Board of Trustees in its sole discretion. Our ability to make future cash distributions will be dependent upon, among other things, (i) the taxable income and cash flow generated by our operating activities; (ii) cash generated by, or used in, our financing and investing activities; and (iii) the annual distribution requirements under the REIT provisions of the Internal Revenue Code described in “Item 7. Management’s Discussion and Analysis of Financial Condition and Results of Operations – Distributions” and such other factors as the Board of Trustees deems relevant. Our ability to make cash distributions will also be limited by the covenants contained in our Operating Partnership agreement and our financing arrangements as well as limitations imposed by state law and any agreements governing any future indebtedness. See “Item 1A – Risk Factors – Risks Related to Our Business and Properties – Covenants in our debt agreements could adversely affect our liquidity and financial condition” and “Item 7 – Management’s Discussion and Analysis of Financial Condition and Results of Operations – Liquidity and Capital Resources.” Historically, we have generated sufficient cash flows from operating activities to fund distributions. We may rely on borrowings under our unsecured revolving credit facility or may make taxable distributions of our shares or securities to make any distributions in excess of cash available from operating activities.
Sales of Unregistered Equity Securities and Issuer Repurchases
We did not sell any unregistered equity securities during the year ended December 31, 2016. During the year ended December 31, 2016, 73,467 common Operating Partnership units were redeemed with available cash. No common Operating Partnership units were redeemed for common shares during the year ended December 31, 2016.
40
Issuer Purchases of Equity Securities
During the three months ended December 31, 2016, we did not repurchase any equity securities registered pursuant to Section 12 of the Exchange Act.
41
Share Return Performance
The following graph compares the cumulative total return on our common shares with the cumulative total return of the S&P 500 Stock Index and The MSCI US REIT Index for the period from December 31, 2011 through December 31, 2016 assuming the investment of $100 in each of us and the two indices, on December 31, 2011, and the reinvestment of common dividends. The performance reflected in the graph is not necessarily indicative of future performance. We will not make or endorse any predictions as to our future share performance.
COMPARISON OF CUMULATIVE TOTAL RETURNS FOR THE PERIOD
DECEMBER 31, 2011 THROUGH DECEMBER 31, 2016
FIRST POTOMAC REALTY TRUST COMMON STOCK AND S&P 500 AND
THE MSCI US REIT INDEX (RMS)
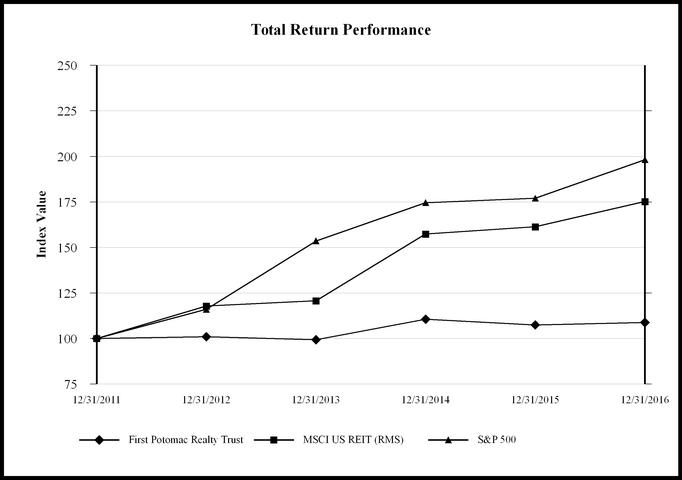
Total Return Index from 12/31/11 to the Period Ended | |||||||||||||||||
Index | 12/31/11 | 12/31/12 | 12/31/13 | 12/31/14 | 12/31/15 | 12/31/16 | |||||||||||
First Potomac Realty Trust | 100.00 | 100.97 | 99.30 | 110.59 | 107.45 | 108.73 | |||||||||||
MSCI US REIT (RMS) | 100.00 | 117.77 | 120.68 | 157.34 | 161.30 | 175.17 | |||||||||||
S&P 500 | 100.00 | 116.00 | 153.57 | 174.60 | 177.01 | 198.18 | |||||||||||
The foregoing graph and chart shall not be deemed incorporated by reference by any general statement incorporating by reference this Annual Report on Form 10-K into any filing under the Securities Act of 1933, as amended, or under the Securities Exchange Act of 1934, as amended, except to the extent we specifically incorporate this information by reference, and shall not be deemed filed under those acts.
42
ITEM 6. | SELECTED FINANCIAL DATA |
The following table presents selected financial information of our Company and our subsidiaries. The financial information has been derived from the consolidated balance sheets and consolidated statements of operations.
The following financial information should be read in conjunction with “Management’s Discussion and Analysis of Financial Condition and Results of Operations,” and the consolidated financial statements and related notes included elsewhere in this Annual Report on Form 10-K.
Year Ended December 31, | |||||||||||||||||||
(amounts in thousands, except per share amounts) | 2016 | 2015 | 2014 | 2013 | 2012 | ||||||||||||||
(unaudited) | |||||||||||||||||||
Operating Data: | |||||||||||||||||||
Total revenues | $ | 160,334 | $ | 172,846 | $ | 161,652 | $ | 148,815 | $ | 142,962 | |||||||||
(Loss) income from continuing operations | (1,569 | ) | (34,417 | ) | 15,559 | (10,761 | ) | (24,324 | ) | ||||||||||
(Loss) income from discontinued operations | — | (607 | ) | 1,484 | 21,742 | 15,943 | |||||||||||||
Net (loss) income | (1,569 | ) | (35,024 | ) | 17,043 | 10,981 | (8,381 | ) | |||||||||||
Less: Net loss (income) attributable to noncontrolling interests | 502 | 2,058 | (199 | ) | 93 | 986 | |||||||||||||
Net (loss) income attributable to First Potomac Realty Trust | (1,067 | ) | (32,966 | ) | 16,844 | 11,074 | (7,395 | ) | |||||||||||
Less: Dividends on preferred shares | (3,053 | ) | (12,400 | ) | (12,400 | ) | (12,400 | ) | (11,964 | ) | |||||||||
Less: Issuance costs on redeemed preferred shares | (5,515 | ) | — | — | — | — | |||||||||||||
Net (loss) income attributable to common shareholders | $ | (9,635 | ) | $ | (45,366 | ) | $ | 4,444 | $ | (1,326 | ) | $ | (19,359 | ) | |||||
Basic and diluted earnings per common share: | |||||||||||||||||||
(Loss) income from continuing operations | $ | (0.17 | ) | $ | (0.78 | ) | $ | 0.05 | $ | (0.41 | ) | $ | (0.70 | ) | |||||
(Loss) income from discontinued operations | — | (0.01 | ) | 0.02 | 0.38 | 0.30 | |||||||||||||
Net (loss) income | $ | (0.17 | ) | $ | (0.79 | ) | $ | 0.07 | $ | (0.03 | ) | $ | (0.40 | ) | |||||
Cash dividends declared and paid per common share | $ | 0.45 | $ | 0.60 | $ | 0.60 | $ | 0.60 | $ | 0.80 | |||||||||
At December 31, | |||||||||||||||||||
(amounts in thousands) | 2016 | 2015 | 2014 | 2013 | 2012 | ||||||||||||||
Balance Sheet Data: | |||||||||||||||||||
Total assets(1) | $ | 1,260,247 | $ | 1,442,406 | $ | 1,612,300 | $ | 1,494,883 | $ | 1,713,033 | |||||||||
Debt(1)(2) | 737,171 | 724,250 | 807,477 | 666,070 | 929,149 | ||||||||||||||
Series A Preferred Shares(3) | — | 160,000 | 160,000 | 160,000 | 160,000 | ||||||||||||||
(1) | Total assets and debt have been restated in accordance with Accounting Standards Update No. 2015-03, Simplifying the Presentation of Debt Issuance Costs (“ASU 2015-03”), which requires debt issuance costs to be presented in the balance sheet as a direct deduction from the carrying value of the respective debt liability and which is applied on a retrospective basis. |
(2) | Includes the mortgage debt balance of our rental properties that were classified as held-for-sale at December 31, 2016 and December 31, 2015 and are reflected in “Liabilities held-for-sale” on our consolidated balance sheets. For more information, see note 9, Dispositions, in the notes to our accompanying consolidated financial statements. |
(3) | Our 7.750% Series A Preferred Shares were redeemed and delisted from the New York Stock Exchange in 2016. |
43
ITEM 7. | MANAGEMENT’S DISCUSSION AND ANALYSIS OF FINANCIAL CONDITION AND RESULTS OF OPERATIONS |
The following discussion and analysis of our financial condition and results of operations should be read in conjunction with the consolidated financial statements and notes thereto appearing elsewhere in this Annual Report on Form 10-K. The discussion and analysis is derived from the consolidated operating results and activities of First Potomac Realty Trust. This discussion may contain forward-looking statements based upon current expectations that involve risks and uncertainties. Our actual results may differ materially from those anticipated in these forward-looking statements as a result of various factors, including those set forth under “Risk Factors” or elsewhere in this Annual Report on Form 10-K. See “Risk Factors” and “Special Note About Forward-Looking Statements.”
Overview
We are a leader in the ownership, management, redevelopment and development of office and business park properties in the greater Washington, D.C. region. Our focus is owning and operating properties that we believe can benefit from our market knowledge and intensive operational skills with a focus on increasing their profitability and value. Our portfolio primarily contains a mix of single-tenant and multi-tenant office properties and business parks. Office properties are single-story and multi-story buildings that are primarily for office use, and business parks contain buildings with office features combined with some industrial property space. We separate our properties into four distinct reporting segments, which we refer to as the Washington, D.C., Maryland, Northern Virginia and Southern Virginia reporting segments.
We conduct our business through First Potomac Realty Investment Limited Partnership, our operating partnership (the “Operating Partnership”). We are the sole general partner of, and, as of December 31, 2016, owned 95.8% of the common interest in the Operating Partnership. The remaining common interests in the Operating Partnership, which are presented as noncontrolling interests in the Operating Partnership in the accompanying consolidated financial statements, are limited partnership interests that are owned by unrelated parties.
At December 31, 2016, we wholly owned properties totaling 6.7 million square feet and had a noncontrolling ownership interest in properties totaling an additional 0.9 million square feet through five unconsolidated joint ventures. We also owned land that can support 0.6 million square feet of additional development. Our consolidated properties were 92.6% occupied by 384 tenants at December 31, 2016. We do not include square footage of properties in development or redevelopment in our occupancy calculation. At December 31, 2016, none of the 6.7 million square feet owned through our properties was in development or redevelopment. We derive substantially all of our revenue from leases of space within our properties.
The primary source of our revenue is rent received from tenants under long-term (generally three to ten years) operating leases at our properties, including reimbursements from tenants for certain operating costs. Additionally, we may generate earnings from the sale of assets to third parties or the contribution of assets to joint ventures.
Our long-term growth will principally be driven by our ability to:
• | maintain and increase occupancy rates and/or increase rental rates at our properties; |
• | sell assets to third parties, or contribute properties to joint ventures, at favorable prices; |
• | develop and redevelop existing assets; |
• | continue to grow our portfolio through acquisitions of new properties, potentially through joint ventures; and |
• | execute initiatives designed to increase balance sheet capacity and expand the potential sources of capital. |
Strategic Plan Update
As previously disclosed in our Form 10-K for the year ended December 31, 2015 and our Form 10-Q for the quarters ended March 31, 2016, June 30, 2016 and September 30, 2016, we completed an extensive underwriting of our business, our portfolio and our team in early 2016. Based on this underwriting, we began implementing our previously
44
announced Strategic Plan, the focus of which is to de-risk the portfolio, de-lever the balance sheet and maximize asset values. As we near completion of the Strategic Plan, the key action items of the Strategic Plan and our results on the action items are as follows:
Improve our portfolio composition by disposing of approximately $350 million of non-core assets.
From December 2015 through the date of this filing, we have sold $294.6 million of non-core assets identified as part of our Strategic Plan, which includes sales of the following properties (dollars in thousands):
Reporting Segment | Disposition Date | Contractual Sales Price(1) | ||||||
Plaza 500 | Northern Virginia | February 17, 2017 | $ | 75,000 | ||||
One Fair Oaks | Northern Virginia | January 9, 2017 | 13,700 | |||||
Storey Park | Washington, D.C. | July 25, 2016 | 54,500 | |||||
NOVA Non-Core Portfolio (2) | Northern Virginia | March 25, 2016 | 91,600 | |||||
Cedar Hill I and III | Northern Virginia | December 23, 2015 | 27,300 | |||||
Newington Business Park Center | Northern Virginia | December 17, 2015 | 32,500 | |||||
Total | $ | 294,600 | ||||||
(1) Represents the contractual sales price for the properties, not the net proceeds received. For more information, including net proceeds received on the assets sales, see note 9, Dispositions, in the notes to our accompanying consolidated financial statements.
(2) Consists of Van Buren Office Park, Herndon Corporate Center, Windsor at Battlefield, Reston Business Campus, Enterprise Center, Gateway Centre Manassas, Linden Business Center and Prosperity Business Center (collectively, the “NOVA Non-Core Portfolio”).
In addition, in January 2017, the unconsolidated joint ventures that own Aviation Business Park and Rivers Park I and II entered into a binding contract to sell such properties, which are all located in Maryland. We anticipate completing the sale in March 2017; however, we can provide no assurances regarding the timing or pricing of such sale, or that such sale will ultimately occur.
Address three large upcoming lease expirations at single-tenant buildings through the sale of One Fair Oaks and the repositioning of 500 First Street, NW and 540 Gaither Road at Redland.
On January 9, 2017, we sold One Fair Oaks, which was located in our Northern Virginia reporting segment, for net proceeds of $13.3 million. CACI International, which fully leased One Fair Oaks, had a lease that terminated on December 31, 2016.
We currently own two other single-tenant buildings that have leases expiring in 2017 (540 Gaither Road - Department of Health and Human Services and 500 First Street, NW - Bureau of Prisons).
In October 2015, we received notice from the Department of Health and Human Services, which fully leases the building at 540 Gaither Road within our Redland property in our Maryland reporting segment, that it will be exercising its early termination right, which is in March 2017. We underwrote the Department of Health and Human Services exercising its termination right when we acquired the building in 2013. During the second quarter of 2016, we re-leased two floors at 540 Gaither Road, which totaled 45,000 square feet, or approximately 34% of the building’s total square footage. We anticipate that the new tenant at 540 Gaither Road will take occupancy in early 2018; however, we can provide no assurances regarding the timing of when the tenant will take occupancy. We have begun repositioning the property, gauging new tenant interest to lease the property and, upon the expiration of the current tenant’s lease in March 2017, will place 540 Gaither Road into redevelopment, all with the ultimate goal of maximizing value upon the expiration of the lease; however, we can provide no assurances regarding the outcome of these or any other alternative strategies for the property.
The Bureau of Prisons, which fully leases 500 First Street, NW in our Washington, D.C. reporting segment, was subject to a lease that was scheduled to expire in July 2016. During the second quarter of 2016, we entered into a one-year lease extension with the Bureau of Prisons, which is set to expire in July 2017, and we believe there is a likelihood that the tenant will elect to further extend the expiration date of the lease; however, we can provide no assurances regarding the length of such extension or that such extension will occur at all. Currently, we are evaluating various strategies with respect to 500 First Street, NW, which include repositioning 500 First Street, NW and gauging new
45
tenant interest to lease this property, all with the ultimate goal of maximizing value upon the expiration of the lease; however, we can provide no assurances regarding the outcome of these or any other alternative strategies for the property.
Strengthen the balance sheet and improve liquidity by reducing leverage, limiting our floating rate debt exposure over time and extending our debt maturities to better match our capital structure with our assets.
We have been diligently working to improve our balance sheet leverage and increase our liquidity. At December 31, 2016, our debt plus preferred shares over the undepreciated book value of our real estate assets was 57.1% compared with 66.6% at December 31, 2015. During 2016, we redeemed all 6.4 million shares of our outstanding 7.750% Series A Preferred Shares with proceeds from property dispositions and from the prepayment of a note receivable. The 7.750% Series A Preferred Shares (NYSE: FPO-PA) were delisted from trading on the New York Stock Exchange upon redemption of the final outstanding shares on July 6, 2016. The dividend rate on the 7.750% Series A Preferred Shares was significantly higher than the weighted average interest rate of our total debt, which was 3.5% at December 31, 2016. As of the date of this filing, we have $150.9 million available under our unsecured revolving credit facility compared with $114.0 million available at the time of filing our Form 10-K for the year ended December 31, 2015.
Manage our cost structure by reducing corporate overhead and general and administrative expenses.
We have focused on reducing our corporate overhead costs. For the year ended December 31, 2016, our corporate overhead expense (which is allocated between property operating and general and administrative expenses) was $23.4 million compared with $33.5 million for the same period in 2015, which included $6.5 million of separation costs recorded during 2015 (primarily related to the departure of our former Chief Executive Officer and former Chief Investment Officer in November 2015). Excluding the separation costs recorded in 2015, corporate overhead expense decreased 14% for the year ended December 31, 2016 compared with the same period in 2015. The portion of our corporate overhead expense recorded as general and administrative expense was $17.0 million compared with $25.5 million for the same period in 2015. The aforementioned $6.5 million of separation costs were recorded as general and administrative expense in 2015 and, excluding these costs, our general and administrative expense decreased 11% in 2016 compared with the same period in 2015.
Reduce our targeted annualized common share dividend from $0.60 to $0.40.
As previously disclosed, on April 26, 2016, our Board of Trustees declared a reduction of our dividend rate by 33% from $0.15 per common share to $0.10 per common share, which equates to an annualized dividend of $0.40 per common share and was effective for the dividends paid on and after May 16, 2016. During 2016, we paid a combined $27.3 million in dividends on our common shares and distributions on our Operating Partnership units compared with a combined $36.7 million paid in 2015.
Significant 2016 Activity
• | Increased occupied percentage to 92.6% from 90.3% at December 31, 2015. |
• | Reached $294.6 million of asset sales that were identified as part of our Strategic Plan to dispose of at least $350 million of non-core assets, which includes the sale of One Fair Oaks in January 2017 and the sale of Plaza 500 in February 2017. |
• | Redeemed all 6.4 million outstanding 7.750% Series A Preferred Shares, consistent with our Strategic Plan. |
• | Completed construction of the 167,000 square foot build-to-suit office building in Northern Virginia (the “NOVA build-to-suit”) and commenced revenue recognition in the third quarter of 2016. |
Our total assets were $1.3 billion at December 31, 2016 compared with $1.4 billion at December 31, 2015.
Development and Redevelopment Activity
We will place completed development and redevelopment assets in-service upon the earlier of one year after major construction activity is deemed to be substantially complete or upon occupancy. We construct office buildings and/or business parks on a build-to-suit basis or with the intent to lease upon completion of construction. At
46
December 31, 2016, we owned developable land that can accommodate 0.6 million square feet of additional building space, of which 34 thousand is located in the Washington, D.C. reporting segment, 0.1 million in the Maryland reporting segment, 0.4 million in the Northern Virginia reporting segment and 0.1 million in the Southern Virginia reporting segment.
During the third quarter of 2014, we signed a lease for the NOVA build-to-suit in our Northern Virginia reporting segment on vacant land that we had in our portfolio. We substantially completed construction of the new building in the first quarter of 2016, and we substantially completed construction of the tenant improvements during the third quarter of 2016. We commenced revenue recognition in August 2016, at which time the building was placed in-service. As of December 31, 2016, our total investment in the newly constructed building was $54.1 million, which includes tenant improvements (net of reimbursements), costs to construct the building, the original cost basis of the applicable portion of the vacant land of $5.2 million and leasing commissions.
On August 4, 2011, we formed a joint venture, in which we had a 97% interest, with an affiliate of Perseus Realty, LLC to acquire Storey Park in our Washington, D.C. reporting segment. At the time, the site was leased to Greyhound Lines, Inc. (“Greyhound”), which subsequently relocated its operations. Greyhound’s lease expired on August 31, 2013, at which time the property was placed into development with the anticipation of developing a mixed-use project on the 1.6 acre site, which could accommodate up to 712,000 square feet. On July 25, 2016, our consolidated joint venture sold Storey Park for a contractual purchase price of $54.5 million, which generated net proceeds of $52.7 million. In June 2016, we recorded a $2.8 million impairment charge based on the sales price, less estimated selling costs. On January 1, 2016, we ceased capitalizing expenses associated with the development project as we began marketing the property for sale. See note 9, Dispositions, in the notes to our accompanying consolidated financial statements for more information.
During 2016, other than the NOVA build-to-suit, we did not place in-service any completed development or redevelopment space. At December 31, 2016, we did not have any completed development or redevelopment space that had yet to be placed in-service.
Critical Accounting Policies and Estimates
Our consolidated financial statements are prepared in accordance with GAAP that require us to make certain estimates and assumptions. Critical accounting policies and estimates are those that require subjective or complex judgments and are the policies and estimates that we deem most important to the portrayal of our financial condition, results of operations and cash flows. It is possible that the use of different reasonable estimates or assumptions in making these judgments could result in materially different amounts being reported in our consolidated financial statements. Our critical accounting policies and estimates relate to revenue recognition, including evaluation of the collectability of accounts receivable, impairment of long-lived assets, purchase accounting for acquisitions of rental property, derivative instruments and share-based compensation.
The following is a summary of certain aspects of these critical accounting policies and estimates.
Revenue Recognition
We generate substantially all of our revenue from leases on our properties. We recognize rental revenue on a straight-line basis over the terms of our leases, which includes fixed-rate renewal periods leased at below market rates at acquisition or inception. Accrued straight-line rents represent the difference between rental revenue recognized on a straight-line basis over the term of the respective lease agreements and the rental payments contractually due for leases that contain abatement or fixed periodic increases. We consider current information, credit quality, historical trends, economic conditions and other events regarding the tenants’ ability to pay their obligations in determining if amounts due from tenants, including accrued straight-line rents, are ultimately collectible. The uncollectible portion of the amounts due from tenants, including accrued straight-line rents, is charged to property operating expense in the period in which the determination is made.
Tenant leases generally contain provisions under which the tenants reimburse us for a portion of property operating expenses and real estate taxes incurred by us. Such reimbursements are recognized in the period in which the expenses are incurred. We record a provision for losses on estimated uncollectible accounts receivable based on our analysis of risk of loss on specific accounts. Lease termination fees are recognized on the date of termination when the related lease or portion thereof is canceled, the collectability of the fee is reasonably assured and we have possession of the terminated space.
47
In May 2014, FASB issued Accounting Standards Update No. 2014-09, Revenue from Contracts with Customers (“ASU 2014-09”), which requires an entity to recognize the amount of revenue to which it expects to be entitled for the transfer of promised goods or services to customers and will replace most existing revenue recognition guidance when it becomes effective. In July 2015, the FASB deferred by one year the mandatory effective date of ASU 2014-09 from January 1, 2017 to January 1, 2018. Early adoption is permitted, but not prior to the original effective date of January 1, 2017. ASU 2014-09 permits the use of either the retrospective or cumulative effect transition method. We have begun to evaluate each of the revenue streams under the new model and the pattern of recognition is not expected to change significantly. We have not yet selected a transition method and are evaluating the impact that ASU 2014-09 will have on our consolidated financial statements and related disclosures.
In February 2016, the FASB issued Accounting Standards Update No. 2016-02, Leases (“ASU 2016-02”), which requires a lessee to record on the balance sheet a right-of-use asset with a corresponding lease liability created by lease terms of more than 12 months. Additional qualitative and quantitative disclosures will also be required. The guidance will become effective for periods beginning after December 15, 2018 and will be applied using a modified retrospective transition method. We are currently evaluating the impact that ASU 2016-02 will have on our consolidated financial statements and related disclosures.
Accounts Receivable
We must make estimates of the collectability of our accounts receivable related to minimum rent, deferred rent, tenant reimbursements and lease termination fees. We specifically analyze accounts receivable and historical bad debt experience, tenant concentrations, tenant creditworthiness and current economic trends when evaluating the adequacy of our allowance for doubtful accounts receivable. These estimates have a direct impact on our net income as a higher required allowance for doubtful accounts receivable will result in lower net income. The uncollectible portion of the amounts due from tenants, including straight-line rents, is charged to property operating expense in the period in which the determination is made.
Investments in Rental Property and Rental Property Entities
Rental property is initially recorded at fair value, when acquired in a business combination, or initial cost when constructed or acquired in an asset purchase. Improvements and replacements are capitalized at cost when they extend the useful life, increase capacity or improve the efficiency of the asset. Repairs and maintenance are charged to expense when incurred. Depreciation and amortization are recorded on a straight-line basis over the estimated useful lives of the assets. The estimated useful lives of our assets, by class, are as follows:
Buildings | 39 years | |
Building improvements | 5 to 20 years | |
Furniture, fixtures and equipment | 5 to 15 years | |
Lease related intangible assets | The term of the related lease | |
Tenant improvements | Shorter of the useful life of the asset or the term of the related lease | |
We regularly review market conditions for possible impairment of a property’s carrying value. When circumstances such as adverse market conditions, changes in management’s intended holding period or potential sale to a third party indicate a possible impairment of the carrying value of a property, an impairment analysis is performed. We assess potential impairments based on an estimate of the future undiscounted cash flows (excluding interest charges) expected to result from the property’s use and eventual disposition. This estimate is based on projections of future revenues, expenses, capital improvement costs to maintain the operating capacity, expected holding periods and capitalization rates. These cash flows consider factors such as expected market trends and leasing prospects, as well as the effects of leasing demand, competition and other factors. If impairment exists due to the inability to recover the carrying value of a real estate investment based on forecasted undiscounted cash flows, an impairment loss is recorded to the extent that the carrying value exceeds the estimated fair value of the property. Further, we will record an impairment loss if we expect to dispose of a property, in the near term, at a price below carrying value. In such an event, we will record an impairment loss based on the difference between a property’s carrying value and its projected sales price less any estimated costs to sell.
48
We will classify a building as held-for-sale in accordance with GAAP in the period in which we have made the decision to dispose of the building, our Board of Trustees or a designated delegate has approved the sale, there is a binding contract pursuant to which the buyer has significant money at risk, or high likelihood a binding agreement to purchase the property will be signed under which the buyer will be required to commit a significant amount of nonrefundable cash, and no significant financing contingencies exist that could cause the transaction not to be completed in a timely manner. We will cease recording depreciation on a building once it has been classified as held-for-sale. In the second quarter of 2014, we prospectively adopted ASU 2014-08, which impacts the presentation of operations and gains or losses from disposed properties and properties classified as held-for-sale.
If the building does not qualify as a discontinued operation under ASU 2014-08, we will classify the building’s operating results, together with any impairment charges and any gains or losses on the sale of the building, in continuing operations for all periods presented in our consolidated statements of operations. We will classify the assets and liabilities related to the building as held-for-sale in our consolidated balance sheet for the period in which the held-for-sale criteria were met.
If the building does qualify as a discontinued operation under ASU 2014-08, we will classify the building’s operating results, together with any impairment charges and any gains or losses on the sale of the building, in discontinued operations in our consolidated statements of operations for all periods presented and classify the assets and liabilities related to the building as held-for-sale in our consolidated balance sheets for the periods presented. Interest expense is reclassified to discontinued operations only to the extent the disposed or held-for-sale property is secured by specific mortgage debt and the mortgage debt will not be assigned to another property owned by us after the disposition.
We recognize the fair value, if sufficient information exists to reasonably estimate the fair value, of any liability for conditional asset retirement obligations when assumed or incurred, which is generally upon acquisition, construction, development or redevelopment and/or through the normal operation of the asset.
We capitalize interest costs incurred on qualifying expenditures for real estate assets under development or redevelopment, which include our investments in assets owned through unconsolidated joint ventures that are under development or redevelopment, while being readied for their intended use in accordance with accounting requirements regarding capitalization of interest. We will capitalize interest when qualifying expenditures for the asset have been made, activities necessary to get the asset ready for its intended use are in progress and interest costs are being incurred. Capitalized interest also includes interest associated with expenditures incurred to acquire developable land while development activities are in progress. We also capitalize direct compensation costs of our construction personnel who manage the development and redevelopment projects, but only to the extent the employee’s time can be allocated to a project. Any portion of construction management costs not directly attributable to a specific project are recognized as general and administrative expense in the period incurred. We do not capitalize any other general and administrative costs such as office supplies, office rent expense or an overhead allocation to our development or redevelopment projects. Capitalized compensation costs were immaterial during 2016, 2015 and 2014. Capitalization of interest ends when the asset is substantially complete and ready for its intended use, but no later than one year from completion of major construction activity, if the property is not occupied. We place redevelopment and development assets into service at this time and commence depreciation upon the substantial completion of tenant improvements and the recognition of revenue. Capitalized interest is depreciated over the useful life of the underlying assets, commencing when those assets are placed into service.
Purchase Accounting
Acquisitions of rental property, including any associated intangible assets, are measured at fair value at the date of acquisition. Any liabilities assumed or incurred are recorded at their fair value at the time of acquisition. The fair value of the acquired property is allocated between land and building (on an as-if vacant basis) based on management’s estimate of the fair value of those components for each type of property and to tenant improvements based on the depreciated replacement cost of the tenant improvements, which approximates their fair value. The fair value of the in-place leases is recorded as follows:
• | the fair value of leases in-place on the date of acquisition is based on absorption costs for the estimated lease-up period in which vacancy and foregone revenue are avoided due to the presence of the acquired leases; |
• | the fair value of above and below-market in-place leases based on the present value (using a discount rate that reflects the risks associated with the acquired leases) of the difference between the contractual rent amounts to be paid under the assumed lease and the estimated market lease rates for the corresponding spaces |
49
over the remaining non-cancelable terms of the related leases, which range from one to fourteen years; and
• | the fair value of intangible tenant or customer relationships. |
Our determination of these fair values requires us to estimate market rents for each of the leases and make certain other assumptions. These estimates and assumptions affect the rental revenue, and depreciation and amortization expense recognized for these leases and associated intangible assets and liabilities.
Derivative Instruments
We are exposed to certain risks arising from business operations and economic factors. We use derivative financial instruments to manage exposures that arise from business activities in which our future exposure to interest rate fluctuations is unknown. The objective in the use of an interest rate derivative is to add stability to interest expenses and manage exposure to interest rate changes. We do not use derivatives for trading or speculative purposes and we intend to enter into derivative agreements only with counterparties that we believe have a strong credit rating to mitigate the risk of counterparty default or insolvency. No hedging activity can completely insulate us from the risks associated with changes in interest rates. Moreover, interest rate hedging could fail to protect us or adversely affect us because, among other things:
• | available interest rate hedging may not correspond directly with the interest rate risk for which we seek protection; |
• | the duration of the hedge may not match the duration of the related liability; |
• | the party owing money in the hedging transaction may default on its obligation to pay; and |
• | the credit quality of the party owing money on the hedge may be downgraded to such an extent that it impairs our ability to sell or assign its side of the hedging transaction. |
We may designate a derivative as either a hedge of the cash flows from a debt instrument or anticipated transaction (cash flow hedge) or a hedge of the fair value of a debt instrument (fair value hedge). All derivatives are recognized as assets or liabilities at fair value. For effective hedging relationships, the effective portion of the change in the fair value of the assets or liabilities is recorded within equity (cash flow hedge) or through earnings (fair value hedge). Ineffective portions of derivative transactions will result in changes in fair value recognized in earnings. For a cash flow hedge, we record our proportionate share of unrealized gains or losses on our derivative instruments associated with our unconsolidated joint ventures within equity and “Investment in affiliates.” We incorporate credit valuation adjustments to appropriately reflect both our own nonperformance risk and the respective counterparty’s nonperformance risk in the fair value measurements. In adjusting the fair value of our derivative contracts for the effect of nonperformance risk, we have considered the impact of netting any applicable credit enhancements, such as collateral postings, thresholds, mutual inputs and guarantees.
Share-Based Payments
We measure the cost of employee services received in exchange for an award of equity instruments based on the grant-date fair value of the award. For options awards, we use a Black-Scholes option-pricing model. Expected volatility is based on an assessment of our realized volatility over the preceding period that is equivalent to the award’s expected life. The expected term represents the period of time the options are anticipated to remain outstanding as well as our historical experience for groupings of employees that have similar behavior and are considered separately for valuation purposes. For non-vested share awards that vest over a predetermined time period, we use the outstanding share price at the date of issuance to fair value the awards. For non-vested shares awards that vest based on market conditions, we use a Monte Carlo simulation (risk-neutral approach) to determine the value and derived service period of each tranche. The expense associated with the share-based awards will be recognized over the period during which an employee is required to provide services in exchange for the award - the requisite service period (usually the vesting period). The fair value for all share-based payment transactions are recognized as a component of income or loss from continuing operations.
50
Results of Operations
Comparison of the Years Ended December 31, 2016, 2015 and 2014
The term “Comparable Portfolio” refers to all consolidated properties owned by us and in-service, with operating results reflected in our continuing operations, for the entirety of the periods presented. The Comparable Portfolio includes One Fair Oaks, which was classified as held-for-sale at December 31, 2016.
The term “Non-Comparable Properties” refers to properties that we have acquired, sold, placed in-service, or placed in development or redevelopment during the periods presented.
For purposes of comparing the years ended December 31, 2016 and 2015, the Non-Comparable Properties are comprised of the following properties:
• | Storey Park, a development site that was located in our Washington, D.C. reporting segment and was owned by our 97% consolidated joint venture, which was sold in July 2016 (we ceased capitalizing expenses related to Storey Park at the beginning of 2016 as we began marketing the property for sale); the NOVA Non-Core Portfolio, which was comprised of eight properties and was sold in March 2016; and Rumsey Center, Newington Business Park Center and Cedar Hill I and III, which were sold during 2015. For the Results of Operations discussion below with respect to the comparison of the years ended December 31, 2016 and 2015, these twelve properties are collectively referred to as the “Disposed Properties”. The operating results of these properties are reflected in continuing operations in our consolidated statements of operations for each of the periods presented; and |
• | The NOVA build-to-suit, which was fully placed in-service during the third quarter of 2016. |
For purposes of comparing the years ended December 31, 2015 and 2014, the Non-Comparable Properties are comprised of the following properties:
• | 11 Dupont Circle, NW (acquired September 24, 2014), 1775 Wiehle Avenue (acquired June 25, 2014) and 1401 K Street, NW (acquired April 8, 2014), which were acquired for an aggregate purchase price of $188.0 million. For the Results of Operations discussion below with respect to the comparison of the years ended December 31, 2015 and 2014, these three properties are collectively referred to as the “Acquired Properties”. We did not acquire any properties during 2015; |
• | Rumsey Center, Newington Business Park Center and Cedar Hill I and III, which were sold during 2015, and Corporate Campus at Ashburn Center and Owings Mills Business Park, which were sold during 2014. For the Results of Operations discussion below with respect to the comparison of the years ended December 31, 2015 and 2014, these five properties are collectively referred to as the “Disposed Properties”. The operating results of these properties are reflected in continuing operations in our consolidated statements of operations for each of the periods presented; |
• | 440 First Street, NW, which was fully placed in service in October 2014. The redevelopment of 440 First Street, NW was substantially completed in October 2013; and |
• | Storey Park, which was in development for the entirety of 2015 and 2014. |
The operating results for the Richmond, Virginia portfolio, which included Chesterfield Business Center, Hanover Business Center, Park Central, Virginia Technology Center and a three-acre parcel of undeveloped land (the “Richmond Portfolio”), and which was sold during the first quarter of 2015, as well as the properties disposed of in 2014 (excluding Corporate Campus at Ashburn Center and Owings Mills Business Park, which have operating results reflected within continuing operations), are reflected as discontinued operations in our consolidated statement of operations for 2015 and 2014, as applicable.
For discussion of the operating results of our reporting segments, the terms “Washington, D.C.”, “Maryland”, “Northern Virginia” and “Southern Virginia” will be used to describe the respective reporting segments.
Due to the timing of acquisitions and dispositions in 2017, which may or may not occur, we cannot determine if property operating revenues or expenses, or depreciation expense will increase or decrease during 2017 compared with 2016.
In the tables below, we do not present year-over-year percentage changes that we deem to be non-meaningful as such balances for the respective periods presented are considered to be non-comparable.
51
Total Revenues
Total revenues are summarized as follows:
Year Ended December 31, | Percent Change | Year Ended December 31, | Percent Change | ||||||||||||||||||||||||||
(dollars in thousands) | 2016 | 2015 | Change | 2015 | 2014 | Change | |||||||||||||||||||||||
Rental | $ | 129,225 | $ | 139,006 | $ | (9,781 | ) | (7 | )% | $ | 139,006 | $ | 128,226 | $ | 10,780 | 8 | % | ||||||||||||
Tenant reimbursements and other | $ | 31,109 | $ | 33,840 | $ | (2,731 | ) | (8 | )% | $ | 33,840 | $ | 33,426 | $ | 414 | 1 | % | ||||||||||||
Rental Revenue
Rental revenue is comprised of contractual rent, the impact of straight-line revenue, the amortization of deferred lease incentive costs and deferred tenant improvement reimbursement revenue, and the amortization of deferred market rent assets and liabilities representing above and below market rate leases at acquisition. Rental revenue decreased $9.8 million in 2016 compared with 2015. For the Comparable Portfolio, rental revenue increased $3.2 million in 2016 compared with 2015 due to an increase in occupancy in the Comparable Portfolio, partially offset by a $1.4 million write-off of unamortized lease incentives and rent abatement related to a defaulted tenant at 840 First Street, NE. The weighted average occupancy of the Comparable Portfolio was 92.3% for 2016 compared with 90.3% for 2015. Rental revenue for the Non-Comparable Properties decreased by $13.0 million in 2016 compared with 2015 due to the following:
•a $14.5 million decrease from the Disposed Properties; and
•a $1.5 million increase from the NOVA build-to-suit.
Rental revenue increased $10.8 million in 2015 compared with 2014. For the Comparable Portfolio, rental revenue increased $3.3 million in 2015 compared with 2014 due to an increase in occupancy in the Comparable Portfolio. The weighted average occupancy of the Comparable Portfolio was 89.6% for 2015 compared with 87.8% for 2014. Rental revenue for the Non-Comparable Properties increased by $7.5 million in 2015 compared with 2014 due to the following:
•an $8.1 million increase from the Acquired Properties;
•a $2.0 million increase from 440 First Street, NW; and
•a $2.6 million decrease from the Disposed Properties.
Rental revenue increased (decreased) for each reporting segment during the periods presented, due to the factors discussed above, as follows:
Reporting Segment | |||||||||||||||||||
(dollars in thousands) | Washington, D.C. | Maryland | Northern Virginia | Southern Virginia | Total | ||||||||||||||
Increase (decrease) in rental revenue: | |||||||||||||||||||
2016 compared with 2015 | $ | 226 | $ | 571 | $ | (11,834 | ) | $ | 1,256 | $ | (9,781 | ) | |||||||
2015 compared with 2014 | $ | 9,756 | $ | (453 | ) | $ | 733 | $ | 744 | $ | 10,780 | ||||||||
Significant increases or decreases within reporting segments primarily relate to acquisitions or dispositions, unless otherwise noted.
Tenant Reimbursements and Other Revenues
Tenant reimbursements and other revenues include operating and common area maintenance costs reimbursed by our tenants as well as other incidental revenues, such as lease termination payments, parking revenue and joint venture and construction related management fees. Tenant reimbursements and other revenues decreased $2.7 million
52
in 2016 compared with 2015. For the Comparable Portfolio, tenant reimbursements and other revenues increased by $0.4 million in 2016 compared with 2015, primarily due to an increase in operating expense recoveries related to increases in occupancy. Tenant reimbursements and other revenues for the Non-Comparable Properties decreased by $3.1 million in 2016 compared with 2015 due to the following:
•a $4.0 million decrease from the Disposed Properties; and
•a $0.9 million increase from the NOVA build-to-suit.
Tenant reimbursements and other revenues increased $0.4 million in 2015 compared with 2014. For the Comparable Portfolio, tenant reimbursements and other revenues decreased by $0.2 million, primarily due to a decrease in termination fee income. Tenant reimbursements and other revenues for the Non-Comparable Properties increased by $0.6 million in 2015 compared with 2014 due to the following:
•a $1.2 million increase from the Acquired Properties;
•a $0.1 million increase from 440 First Street, NW; and
•a $0.7 million decrease from the Disposed Properties.
Tenant reimbursements and other revenue increased (decreased) for each reporting segment during the periods presented, due to the factors discussed above, as follows:
Reporting Segment | |||||||||||||||||||
(dollars in thousands) | Washington, D.C. | Maryland | Northern Virginia | Southern Virginia | Total | ||||||||||||||
Increase (decrease) in tenant reimbursements and other revenues: | |||||||||||||||||||
2016 compared with 2015 | $ | 281 | $ | (87 | ) | $ | (2,740 | ) | $ | (185 | ) | $ | (2,731 | ) | |||||
2015 compared with 2014 | $ | 838 | $ | (1,088 | ) | $ | 853 | $ | (189 | ) | $ | 414 | |||||||
Total Expenses
Property Operating Expenses
Property operating expenses are summarized as follows:
Year Ended December 31, | Percent Change | Year Ended December 31, | Percent Change | ||||||||||||||||||||||||||
(dollars in thousands) | 2016 | 2015 | Change | 2015 | 2014 | Change | |||||||||||||||||||||||
Property operating | $ | 38,554 | $ | 44,093 | $ | (5,539 | ) | (13 | )% | $ | 44,093 | $ | 43,252 | $ | 841 | 2 | % | ||||||||||||
Real estate taxes and insurance | $ | 19,808 | $ | 19,745 | $ | 63 | 0 | % | $ | 19,745 | $ | 17,360 | $ | 2,385 | 14 | % | |||||||||||||
Property operating expenses decreased $5.5 million in 2016 compared with 2015. For the Comparable Portfolio, property operating expenses decreased $1.1 million in 2016 compared with 2015, primarily due to a reduction of repairs and maintenance and utilities expenses, as well as a reduction in allocated overhead costs. Property operating expenses for the Non-Comparable Properties decreased by $4.4 million in 2016 compared with 2015 due to the following:
•a $4.7 million decrease from the Disposed Properties; and
•a $0.3 million increase from the NOVA build-to-suit.
Property operating expenses increased $0.8 million in 2015 compared with 2014. For the Comparable Portfolio, property operating expenses decreased $0.7 million, primarily due to a reduction of bad debt and utilities expenses. Property operating expenses for the Non-Comparable Properties increased by $1.5 million in 2015 compared with 2014 due to the following:
•a $2.1 million increase from the Acquired Properties;
•a $0.3 million increase from 440 First Street, NW; and
53
•a $0.9 million decrease from the Disposed Properties.
Property operating expenses increased (decreased) for each reporting segment during the periods presented, due to the factors discussed above, as follows:
Reporting Segment | |||||||||||||||||||
(dollars in thousands) | Washington, D.C. | Maryland | Northern Virginia | Southern Virginia | Total | ||||||||||||||
Increase (decrease) in property operating expenses: | |||||||||||||||||||
2016 compared with 2015 | $ | 175 | $ | (1,663 | ) | $ | (3,824 | ) | $ | (227 | ) | $ | (5,539 | ) | |||||
2015 compared with 2014 | $ | 1,680 | $ | (25 | ) | $ | 188 | $ | (1,002 | ) | $ | 841 | |||||||
Real Estate Taxes and Insurance
Real estate taxes and insurance expense increased $0.1 million in 2016 compared with 2015. For the Comparable Portfolio, real estate taxes and insurance expense increased $1.3 million primarily due to higher real estate taxes resulting from an increase in real estate tax assessments for properties in Maryland and Washington D.C. Real estate taxes and insurance expense decreased $1.2 million for the Non-Comparable Properties in 2016 compared with 2015 due to the following:
•a $1.3 million decrease from the Disposed Properties; and
•a $0.1 million increase from the NOVA build-to-suit.
Real estate taxes and insurance expense increased $2.4 million in 2015 compared with 2014. For the Comparable Portfolio, real estate taxes and insurance expense increased $0.2 million primarily due to an increase in real estate tax assessments for properties in Washington D.C. and Southern Virginia. Real estate taxes and insurance expense increased $2.2 million for the Non-Comparable Properties in 2015 compared with 2014 due to the following:
•a $1.7 million increase from the Acquired Properties;
•a $1.0 million increase from 440 First Street, NW; and
•a $0.5 million decrease from the Disposed Properties.
Real estate taxes and insurance expense increased (decreased) for each reporting segment during the periods presented, due to the factors discussed above, as follows:
Reporting Segment | |||||||||||||||||||
(dollars in thousands) | Washington, D.C. | Maryland | Northern Virginia | Southern Virginia | Total | ||||||||||||||
Increase (decrease) in real estate taxes and insurance expense: | |||||||||||||||||||
2016 compared with 2015 | $ | 1,137 | $ | 341 | $ | (1,465 | ) | $ | 50 | $ | 63 | ||||||||
2015 compared with 2014 | $ | 2,655 | $ | (367 | ) | $ | (52 | ) | $ | 149 | $ | 2,385 | |||||||
Other Operating Expenses
General and administrative expenses are summarized as follows:
Year Ended December 31, | Percent Change | Year Ended December 31, | Percent Change | ||||||||||||||||||||||||||
(dollars in thousands) | 2016 | 2015 | Change | 2015 | 2014 | Change | |||||||||||||||||||||||
General and administrative | $ | 16,976 | $ | 25,450 | $ | (8,474 | ) | (33 | )% | $ | 25,450 | $ | 21,156 | $ | 4,294 | 20 | % | ||||||||||||
General and administrative expenses decreased $8.5 million in 2016 compared with 2015 due to $6.5 million of personnel separation costs incurred during 2015, which were primarily related to the departure of our former Chief
54
Executive Officer and our former Chief Investment Officer during the fourth quarter of 2015. In addition, general and administrative expenses decreased due to a decrease in employee compensation costs and other overhead costs.
General and administrative expenses increased $4.3 million in 2015 compared with 2014 due to the $6.5 million of personnel separation costs primarily related to the departure of our former Chief Executive Officer and our former Chief Investment Officer incurred during the fourth quarter of 2015. The increase in personnel separation costs was partially offset by a decrease in employee compensation costs and other overhead costs.
We currently anticipate that general and administrative expenses for 2017 will increase compared with 2016 due to increases in employee compensation costs.
Acquisition costs are summarized as follows:
Year Ended December 31, | Year Ended December 31, | ||||||||||||||||||||||
(dollars in thousands) | 2016 | 2015 | Change | 2015 | 2014 | Change | |||||||||||||||||
Acquisition costs | $ | — | $ | — | $ | — | $ | — | $ | 2,681 | $ | (2,681 | ) | ||||||||||
We did not acquire any properties in 2016 or 2015. During 2014, we acquired three office buildings (two in Washington, D.C. and one in Northern Virginia) for an aggregate purchase price of $188.0 million.
Depreciation and amortization expense is summarized as follows:
Year Ended December 31, | Percent Change | Year Ended December 31, | Percent Change | ||||||||||||||||||||||||||
(dollars in thousands) | 2016 | 2015 | Change | 2015 | 2014 | Change | |||||||||||||||||||||||
Depreciation and amortization | $ | 60,862 | $ | 66,624 | $ | (5,762 | ) | (9 | )% | $ | 66,624 | $ | 61,796 | $ | 4,828 | 8 | % | ||||||||||||
Depreciation and amortization expense includes depreciation of rental property and the amortization of intangible assets and leasing commissions. Depreciation and amortization expense decreased $5.8 million in 2016 compared with 2015. For the Comparable Portfolio, depreciation and amortization expense increased $0.2 million primarily due to a $2.0 million write-off of lease-level assets associated with a defaulted tenant at 840 First Street, NE, which is located in Washington, D.C., and due to additional leasing and tenant improvement costs related to the increase in occupancy in our Comparable Portfolio. The increase in depreciation and amortization expense for the Comparable Portfolio was mostly offset by a decrease in depreciation and amortization related to the impairment of assets at One Fair Oaks at the end of 2015 and the full amortization of lease-related assets across the Comparable Portfolio during 2016. Depreciation and amortization expense for the Non-Comparable Properties decreased $6.0 million in 2016 compared with 2015 due to the following:
•a $6.9 million decrease from the Disposed Properties; and
•a $0.9 million increase from the NOVA build-to-suit.
Depreciation and amortization expense increased $4.8 million in 2015 compared with 2014. For the Comparable Portfolio, depreciation and amortization expense increased $0.5 million due to additional leasing and tenant improvement costs related to the increase in occupancy in our portfolio, partially offset by the full amortization of lease-related assets. Depreciation and amortization expense for the Non-Comparable Properties increased $4.3 million in 2015 compared with 2014 due to the following:
•a $3.8 million increase from the Acquired Properties;
•a $2.4 million increase from 440 First Street, NW; and
•a $1.9 million decrease from the Disposed Properties.
55
Impairment of rental property is summarized as follows:
Year Ended December 31, | Year Ended December 31, | ||||||||||||||||||||||
(dollars in thousands) | 2016 | 2015 | Change | 2015 | 2014 | Change | |||||||||||||||||
Impairment of rental property | $ | 2,772 | $ | 60,826 | $ | (58,054 | ) | $ | 60,826 | $ | 3,956 | $ | 56,870 | ||||||||||
On July 25, 2016, our 97% owned consolidated joint venture sold Storey Park for a contractual purchase price of $54.5 million, which generated net proceeds of $52.7 million. During the second quarter of 2016, we recorded a $2.8 million impairment charge related to Storey Park based on the sales price, less estimated selling costs.
In late January 2016, we entered into a binding contract to sell the NOVA Non-Core Portfolio, which included eight properties in our Northern Virginia reporting segment and was sold in March 2016. We recorded an impairment charge of $26.9 million on the NOVA Non-Core Portfolio for the fourth quarter of 2015 based on the anticipated sales price of the portfolio, less estimated selling costs. In addition, due to the anticipated move out of the sole tenant at our One Fair Oaks property, we recorded an impairment charge of $33.9 million on One Fair Oaks for the fourth quarter of 2015 to bring the property to its estimated fair value as a result of the loss of cash flow and the anticipated challenges of re-leasing the property.
In October 2014, we sold Owings Mills Business Park, a four-building business park located in our Maryland reporting segment. We recorded an impairment charge of $4.0 million on the four buildings at Owings Mills Business Park in the second quarter of 2014 based on the fair value of the property, less selling costs.
We did not record any other impairment charges within continuing operations during 2016, 2015 or 2014.
Other Expenses (Income)
Interest expense is summarized as follows:
Year Ended December 31, | Percent Change | Year Ended December 31, | Percent Change | ||||||||||||||||||||||||||
(dollars in thousands) | 2016 | 2015 | Change | 2015 | 2014 | Change | |||||||||||||||||||||||
Interest expense | $ | 26,370 | $ | 26,797 | $ | (427 | ) | (2 | )% | $ | 26,797 | $ | 24,696 | $ | 2,101 | 9 | % | ||||||||||||
Interest expense decreased $0.4 million in 2016 compared with 2015 due to a lower average outstanding debt balance and the maturity of two swaps that together fixed LIBOR at a weighted average interest rate of 1.8% on $60.0 million of our variable-rate debt in July 2016. In 2016, our aggregate weighted average borrowings under the unsecured revolving credit facility and unsecured term loan totaled $454.9 million with a weighted average interest rate of 2.0%, compared with aggregate weighted average borrowings of $465.5 million with a weighted average interest rate of 2.0% in 2015. In December 2015, we amended, restated and consolidated our unsecured revolving credit facility and unsecured term loan, which lowered the applicable interest spreads for the unsecured revolving credit facility and unsecured term loan. Also, based on our leverage ratios, the interest rate spreads on our unsecured revolving credit facility and unsecured term loan further decreased from March 30, 2016 to August 14, 2016. The decreases in interest rate spreads were mostly offset by increases in LIBOR in 2016 compared with 2015. The decreases in interest expense for 2016 compared with 2015 were partially offset by a $1.2 million decrease in capitalized interest related to Storey Park, which was taken out of development in January 2016 as the property was being marketed for sale, and the NOVA build-to-suit, which was placed in-service during the third quarter of 2016.
Interest expense increased $2.1 million in 2015 compared with 2014 due to a higher average outstanding debt balance and higher weighted average interest rates on our unsecured revolving credit facility and our unsecured term loan. In 2015, our aggregate weighted average borrowings under the unsecured revolving credit facility and unsecured term loan totaled $465.5 million with a weighted average interest rate of 2.0%, compared with aggregate weighted average borrowings of $436.1 million with a weighted average interest rate of 1.8% in 2014. In addition, the increase in interest expense in 2015 compared with 2014 relates to a $1.4 million decrease in capitalized interest, as we placed 440 First Street, NW into service during the fourth quarter of 2014.
56
We anticipate interest expense will slightly decrease in 2017 compared with 2016, primarily due to repayments of outstanding debt and the July 2017 maturity of $147.5 million of interest rate swaps that fix LIBOR at a weighted average interest rate of 1.5%, which are anticipated to be partially offset by a higher LIBOR.
Interest and other income are summarized as follows:
Year Ended December 31, | Percent Change | Year Ended December 31, | Percent Change | ||||||||||||||||||||||||||
(dollars in thousands) | 2016 | 2015 | Change | 2015 | 2014 | Change | |||||||||||||||||||||||
Interest and other income | $ | 2,348 | $ | 6,794 | $ | (4,446 | ) | (65 | )% | $ | 6,794 | $ | 6,799 | $ | (5 | ) | 0 | % | |||||||||||
Interest and other income decreased $4.4 million in 2016 compared with 2015 and remained relatively flat in 2015 compared with 2014.
On June 2, 2016, the owners of 950 F Street, NW, a ten-story, 287,000 square-foot office/retail building located in Washington, D.C., prepaid a mezzanine loan that had an outstanding balance of $34.0 million. The loan required monthly interest-only payments and had a fixed interest rate of 9.75%. The mezzanine loan was scheduled to mature on April 1, 2017 and had been prepayable since December 21, 2015. In addition to the prepayment of the loan's entire principal balance, we received interest through June 24, 2016 and an exit fee upon the loan's prepayment. We recognized $0.2 million of accelerated income in the second quarter of 2016 related to the early payment of the exit fee.
On February 24, 2015, the owners of America’s Square, a 461,000 square foot office complex located in Washington, D.C., prepaid the $29.7 million outstanding balance of the mezzanine loan. We received a yield maintenance payment of $2.4 million with the prepayment of the mezzanine loan, which is reflected within “Interest and other income” on our consolidated statements of operations.
We anticipate that interest and other income will decrease in 2017 compared with 2016 due to the reduction in interest income associated with the prepayment of the $34.0 million 950 F Street, NW mezzanine loan in 2016.
Equity in earnings of affiliates is summarized as follows:
Year Ended December 31, | Percent Change | Year Ended December 31, | Percent Change | ||||||||||||||||||||||||||
(dollars in thousands) | 2016 | 2015 | Change | 2015 | 2014 | Change | |||||||||||||||||||||||
Equity in earnings of affiliates | $ | 2,294 | $ | 1,825 | $ | 469 | 26 | % | $ | 1,825 | $ | 775 | $ | 1,050 | 135 | % | |||||||||||||
Equity in earnings of affiliates reflects our aggregate ownership interest in the operating results of the properties in which we do not have a controlling interest.
The increase in income from our unconsolidated joint ventures in 2016 compared with 2015 relates to an increase in income from Prosperity Metro Plaza, due to an increase in occupancy, and Aviation Business Park, due to a decrease in operating expenses.
The increase in income from our unconsolidated joint ventures in 2015 compared with 2014 relates to an increase in income from Prosperity Metro Plaza, 1750 H Street, NW and Aviation Business Park primarily due to an increase in occupancy at the properties during 2015.
We expect equity in earnings of affiliates to decrease in 2017 compared with 2016 due to the anticipated sale of Aviation Business Park and Rivers Park I and II in March 2017. See note 9, Dispositions, in the notes to our accompanying consolidated financial statements for additional information.
Loss (gain) on sale of rental property is summarized as follows:
Year Ended December 31, | Year Ended December 31, | ||||||||||||||||||||||
(dollars in thousands) | 2016 | 2015 | Change | 2015 | 2014 | Change | |||||||||||||||||
Loss (gain) on sale of rental property | $ | 1,155 | $ | (29,477 | ) | $ | 30,632 | $ | (29,477 | ) | $ | (21,230 | ) | $ | (8,247 | ) | |||||||
57
On March 25, 2016, we sold the NOVA Non-Core Portfolio for net proceeds of $90.5 million. For the fourth quarter of 2015, we recorded an impairment charge of $26.9 million related to the sale based on the anticipated net proceeds, and we recorded an additional $1.2 million loss on the sale in the first quarter of 2016. We used the net proceeds from the sale of the NOVA Non-Core Portfolio to redeem 3.6 million 7.750% Series A Preferred Shares on April 27, 2016. We did not record any gain or loss on the sale of Storey Park, which was sold on July 25, 2016.
On December 17, 2015 we sold Newington Business Park Center, a seven-building industrial property located in Northern Virginia, totaling 255,600 square feet, for net proceeds of $31.4 million and reported a gain on sale of $19.5 million. On December 23, 2015, we sold Cedar Hill I and III, two three-story office buildings located in Northern Virginia, totaling 102,632 square feet, for net proceeds of $25.9 million and reported a gain on sale of $6.6 million. In January 2016, we used the combined net proceeds from the sale of these two properties to redeem 2.2 million shares of our Series A Preferred Shares. On July 28, 2015, we sold Rumsey Center, a four-building, single-story business park, located in our Maryland reporting segment, totaling 135,015 square feet, for net proceeds of $15.0 million and reported a gain on sale of $3.4 million. We used a portion of the net proceeds from the sale of Rumsey Center to fund repurchases of our common shares and the remainder to repay a portion of the outstanding balance of our unsecured revolving credit facility.
On June 26, 2014, we sold Corporate Campus at Ashburn Center, a three-building, 194,184 square foot single-story business park, which is located in Ashburn, Virginia, for net proceeds of $39.9 million and reported a gain on the sale of the property of $21.2 million. We used the net proceeds from the sale, together with available cash, to acquire 1775 Wiehle Avenue.
Loss on debt extinguishment / modification is summarized as follows:
Year Ended December 31, | Year Ended December 31, | ||||||||||||||||||||||
(dollars in thousands) | 2016 | 2015 | Change | 2015 | 2014 | Change | |||||||||||||||||
Loss on debt extinguishment / modification | $ | 48 | $ | 1,824 | $ | (1,776 | ) | $ | 1,824 | $ | — | $ | 1,824 | ||||||||||
The loss on debt extinguishment / modification for 2016 relates to charges associated with the defeasance of the outstanding balance of the mortgage loan encumbering Gateway Centre Manassas, which was included in the NOVA Non-Core Portfolio and sold on March 25, 2016.
On December 4, 2015, we amended, restated and consolidated our unsecured revolving credit facility and unsecured term loan. As part of the amendments, we, among other things, reduced the interest rate spreads on our unsecured revolving credit facility and our unsecured term loan to market rates, reduced the capitalization rates used to calculate gross asset value in the financial covenants, and amended the covenant package to more closely align with our Strategic Plan. During the fourth quarter of 2015, the Company incurred $1.8 million of debt modification charges related to amending and restating the unsecured revolving credit facility and unsecured term loan.
58
(Loss) income from discontinued operations
(Loss) income from discontinued operations is summarized as follows:
Year Ended December 31, | Year Ended December 31, | ||||||||||||||||||||||
(dollars in thousands) | 2016 | 2015 | Change | 2015 | 2014 | Change | |||||||||||||||||
(Loss) income from discontinued operations | $ | — | $ | (607 | ) | $ | 607 | $ | (607 | ) | $ | 1,484 | $ | (2,091 | ) | ||||||||
Discontinued operations for the periods presented reflect the operating results of the Richmond Portfolio, which was sold during 2015 and was classified within discontinued operations due to our strategic shift away from the Richmond market, as well as disposed properties that were classified as discontinued operations in previously filed consolidated financial statements prior to our adoption of ASU 2014-08. We recorded gains on the sale of rental property of $0.9 million and $1.3 million in 2015 and 2014, respectively. We have had, and will have, no continuing involvement with these properties subsequent to their disposal. For more information about our discontinued operations, see note 9, Dispositions, in the notes to our accompanying consolidated financial statements.
Net loss (income) attributable to noncontrolling interests
Net loss (income) attributable to noncontrolling interests is summarized as follows:
Year Ended December 31, | Year Ended December 31, | ||||||||||||||||||||||
(dollars in thousands) | 2016 | 2015 | Change | 2015 | 2014 | Change | |||||||||||||||||
Net loss (income) attributable to noncontrolling interests | $ | 502 | $ | 2,058 | $ | (1,556 | ) | $ | 2,058 | $ | (199 | ) | $ | 2,257 | |||||||||
Net loss (income) attributable to noncontrolling interests reflects the ownership interests in our net income or loss, less amounts owed to our preferred shareholders, attributable to parties other than us. During 2016 and 2015, we had a net loss, less preferred dividends, of $10.1 million and $47.4 million, respectively, and during 2014 we had net income, less preferred dividends, of $4.6 million. The weighted average percentage of the common Operating Partnership units held by third parties was 4.2% in 2016 and 4.3% in 2015 and 2014.
Prior to the sale of Storey Park on July 25, 2016, we consolidated the operating results of one joint venture that owned Storey Park, and we recognized our joint venture partner’s percentage of gains or losses within net loss (income) attributable to noncontrolling interests. The joint venture partner’s aggregate share of earnings in the operating results of our consolidated joint venture was immaterial during 2016, 2015 and 2014.
59
Same Property Net Operating Income
Same Property Net Operating Income (“Same Property NOI”), defined as property revenues (rental and tenant reimbursements and other revenues) less property operating expenses (real estate taxes, property operating and insurance expenses) from the consolidated properties owned by us and in-service for the entirety of the periods presented, is a primary performance measure we use to assess the results of operations at our properties. Same Property NOI is a non-GAAP measure. As an indication of our operating performance, Same Property NOI should not be considered an alternative to net income calculated in accordance with GAAP. A reconciliation of our Same Property NOI to net (loss) income from our consolidated statements of operations is presented below. The Same Property NOI results exclude the collection of termination fees, as these items vary significantly period-over-period, thus impacting trends and comparability. Also, Same Property NOI includes a normalized management fee percentage in lieu of an administrative overhead allocation for comparative purposes. We eliminate depreciation and amortization expense, which are property level expenses, in computing Same Property NOI as these are non-cash expenses that are based on historical cost accounting assumptions and management believes these expenses do not offer the investor significant insight into the operations of the property. This presentation allows management and investors to determine whether growth or declines in net operating income are a result of increases or decreases in property operations or the acquisition or disposition of additional properties. While this presentation provides useful information to management and investors, the results below should be read in conjunction with the results from the consolidated statements of operations to provide a complete depiction of our total performance.
60
Comparison of the Year Ended December 31, 2016 with the Year Ended December 31, 2015
Reconciliation of Same Property NOI for Our Reporting Segments
The following table provides a reconciliation of our Same Property NOI for our reporting segments to our consolidated net loss for 2016 and 2015 and provides the basis for our discussion of total Same Property NOI in 2016 compared with 2015. A detailed discussion of each reporting segment’s Same Property NOI results for 2016 and 2015 follows this table.
CONSOLIDATED
2016 | 2015 | Same Property(1) | ||||||||||||||||||||||||||||
Revenues: | Same Property(1) | Non-Same Property(2) | All Properties | Same Property(1) | Non-Same Property(2) | All Properties | $ Change | % Change | ||||||||||||||||||||||
Rental | $ | 124,997 | $ | 4,228 | $ | 129,225 | $ | 121,843 | $ | 17,163 | $ | 139,006 | $ | 3,154 | 2.6 | |||||||||||||||
Tenant reimbursements and other(3) | 28,682 | 2,427 | 31,109 | 28,303 | 5,537 | 33,840 | 379 | 1.3 | ||||||||||||||||||||||
Total revenues | 153,679 | 6,655 | 160,334 | 150,146 | 22,700 | 172,846 | 3,533 | 2.4 | ||||||||||||||||||||||
Operating expenses: | ||||||||||||||||||||||||||||||
Property(4) | 36,630 | 1,924 | 38,554 | 36,691 | 7,402 | 44,093 | (61 | ) | (0.2 | ) | ||||||||||||||||||||
Real estate taxes and insurance | 18,965 | 843 | 19,808 | 17,707 | 2,038 | 19,745 | 1,258 | 7.1 | ||||||||||||||||||||||
Total operating expenses | 55,595 | 2,767 | 58,362 | 54,398 | 9,440 | 63,838 | 1,197 | 2.2 | ||||||||||||||||||||||
Net operating income | $ | 98,084 | $ | 3,888 | 101,972 | $ | 95,748 | $ | 13,260 | 109,008 | $ | 2,336 | 2.4 | |||||||||||||||||
General and administrative expenses | (16,976 | ) | (25,450 | ) | ||||||||||||||||||||||||||
Depreciation and amortization | (60,862 | ) | (66,624 | ) | ||||||||||||||||||||||||||
Impairment of rental property | (2,772 | ) | (60,826 | ) | ||||||||||||||||||||||||||
Total other expenses (income) | (22,931 | ) | 9,475 | |||||||||||||||||||||||||||
(Loss) from discontinued operations | — | (607 | ) | |||||||||||||||||||||||||||
Net loss | $ | (1,569 | ) | $ | (35,024 | ) | ||||||||||||||||||||||||
2016 | 2015 | Same Property(1) | ||||||||||||||||||||||||||||
Net Operating Income by Segment: | Same Property(1) | Non-Same Property(2) | All Properties | Same Property(1) | Non-Same Property(2) | All Properties | $ Change | % Change | ||||||||||||||||||||||
Washington, D.C. | $ | 24,491 | $ | (342 | ) | $ | 24,149 | $ | 25,202 | $ | (249 | ) | $ | 24,952 | $ | (711 | ) | (2.8 | ) | |||||||||||
Maryland | 30,508 | 527 | 31,035 | 28,479 | 750 | 29,229 | 2,029 | 7.1 | ||||||||||||||||||||||
Northern Virginia | 22,753 | 4,114 | 26,867 | 23,067 | 13,084 | 36,150 | (314 | ) | (1.4 | ) | ||||||||||||||||||||
Southern Virginia | 20,332 | (411 | ) | 19,921 | 19,000 | (325 | ) | 18,677 | 1,332 | 7.0 | ||||||||||||||||||||
Total | $ | 98,084 | $ | 3,888 | $ | 101,972 | $ | 95,748 | $ | 13,260 | $ | 109,008 | $ | 2,336 | 2.4 | |||||||||||||||
Full Year Weighted Average Occupancy | ||||||||||||||||||||||||||||||
2016 | 2015 | |||||||||||||||||||||||||||||
Same Properties | 92.3 | % | 90.3 | % | ||||||||||||||||||||||||||
Total | 91.4 | % | 89.0 | % | ||||||||||||||||||||||||||
(1) | Same property comparisons are based upon those consolidated properties owned and in-service for the entirety of the periods presented. Same property results for the year ended December 31, 2016 and 2015 exclude the operating results of all disposed properties and the results of the following non-same property that was owned as of December 31, 2016: the NOVA build-to-suit. |
(2) | Includes property results for the NOVA build-to-suit and all properties that were disposed of prior to December 31, 2016 and whose operations for the periods we owned the property are classified within continuing operations. Also includes an administrative overhead allocation, which was replaced by a normalized management fee for comparative purposes, and termination fee income. |
(3) | Excludes termination fee income for comparative purposes. |
(4) | Same property operating expenses have been adjusted to reflect a normalized management fee in lieu of an administrative overhead allocation for comparative purposes. |
Same Property NOI increased $2.3 million for the year ended December 31, 2016 compared with the same period in 2015. Total same property revenues increased $3.5 million for the year ended December 31, 2016 compared with the same period in 2015 primarily due to an increase in occupancy, partially offset by a $1.4 million write-off of unamortized lease incentives and rent abatement, which was recorded as a deduction from same property rental revenues, associated with a defaulted tenant at 840 First Street, NE in our Washington, D.C. reporting segment. Total same property operating expenses increased $1.2 million for the year ended December 31, 2016 compared with the same period in 2015 due to an increase in real estate tax expense, due to higher real estate tax assessments, partially offset by a decrease in utilities and repairs and maintenance expenses.
61
Washington, D.C. | |||||||||||||||
For the Year Ended December 31, | |||||||||||||||
(dollars in thousands) | 2016 | 2015 | $ Change | % Change | |||||||||||
Number of buildings(1) | 6 | 6 | — | — | |||||||||||
Same property revenues | |||||||||||||||
Rental | $ | 34,862 | $ | 34,636 | $ | 226 | 0.7 | ||||||||
Tenant reimbursements and other(2) | 10,031 | 9,727 | 304 | 3.1 | |||||||||||
Total same property revenues | 44,893 | 44,363 | 530 | 1.2 | |||||||||||
Same property operating expenses | |||||||||||||||
Property(3) | 11,524 | 10,923 | 601 | 5.5 | |||||||||||
Real estate taxes and insurance | 8,878 | 8,238 | 640 | 7.8 | |||||||||||
Total same property operating expenses | 20,402 | 19,161 | 1,241 | 6.5 | |||||||||||
Same Property NOI | $ | 24,491 | $ | 25,202 | $ | (711 | ) | (2.8 | ) | ||||||
Full Year Weighted Average Occupancy | |||||||||||||||
2016 | 2015 | ||||||||||||||
Same Properties | 89.2 | % | 85.4 | % | |||||||||||
Total | 89.2 | % | 85.4 | % | |||||||||||
(1) | Same property comparisons are based upon those consolidated properties owned and in-service for the entirety of the periods presented. |
(2) | Excludes termination fee income for comparative purposes. |
(3) | Same property operating expenses have been adjusted to reflect a normalized management fee in lieu of an administrative overhead allocation for comparative purposes. |
Same Property NOI for the Washington, D.C. properties decreased $0.7 million for the year ended December 31, 2016 compared with the same period in 2015 due to a $1.4 million write-off of unamortized lease incentives and straight-line rent abatement that is deducted from same property rental revenues and is associated with a defaulted tenant at 840 First Street, NE. For the year ended December 31, 2016, total same property revenues increased $0.5 million compared with 2015 due to an increase in occupancy at certain Washington D.C. properties, partially offset by the aforementioned write-off of lease incentives and straight-line rent abatement. Total same property operating expenses increased by $1.2 million in 2016 compared with 2015 as there was an increase in real estate tax expenses, due to higher real estate tax assessments, and an increase in anticipated bad debt reserves.
62
Maryland | |||||||||||||||
For the Year Ended December 31, | |||||||||||||||
(dollars in thousands) | 2016 | 2015 | $ Change | % Change | |||||||||||
Number of buildings(1) | 34 | 34 | — | — | |||||||||||
Same property revenues | |||||||||||||||
Rental | $ | 37,096 | $ | 35,724 | $ | 1,372 | 3.8 | ||||||||
Tenant reimbursements and other(2) | 6,983 | 6,808 | 175 | 2.6 | |||||||||||
Total same property revenues | 44,079 | 42,532 | 1,547 | 3.6 | |||||||||||
Same property operating expenses | |||||||||||||||
Property(3) | 9,690 | 10,602 | (912 | ) | (8.6 | ) | |||||||||
Real estate taxes and insurance | 3,881 | 3,451 | 430 | 12.5 | |||||||||||
Total same property operating expenses | 13,571 | 14,053 | (482 | ) | (3.4 | ) | |||||||||
Same Property NOI | $ | 30,508 | $ | 28,479 | $ | 2,029 | 7.1 | ||||||||
Full Year Weighted Average Occupancy | |||||||||||||||
2016 | 2015 | ||||||||||||||
Same Properties | 91.8 | % | 91.1 | % | |||||||||||
Total | 91.8 | % | 91.2 | % | |||||||||||
(1) | Same property comparisons are based upon those consolidated properties owned and in-service for the entirety of the periods presented. |
(2) | Excludes termination fee income for comparative purposes. |
(3) | Same property operating expenses have been adjusted to reflect a normalized management fee in lieu of an administrative overhead allocation for comparative purposes. |
Same Property NOI for the Maryland properties increased $2.0 million for the year ended December 31, 2016 compared with the same period in 2015. Total same property revenues increased $1.5 million during 2016 compared with 2015 due to an increase in occupancy and rental rates at certain Maryland properties. Total same property operating expenses decreased $0.5 million during 2016 compared with 2015 due to decreases in repairs and maintenance costs, anticipated bad debt reserves and utilities expense, which were partially offset by an increase in real estate tax expenses due to higher real estate tax assessments.
63
Northern Virginia | |||||||||||||||
For the Year Ended December 31, | |||||||||||||||
(dollars in thousands) | 2016 | 2015 | $ Change | % Change | |||||||||||
Number of buildings(1) | 14 | 14 | — | — | |||||||||||
Same property revenues | |||||||||||||||
Rental | $ | 27,719 | $ | 27,417 | $ | 302 | 1.1 | ||||||||
Tenant reimbursements and other(2) | 7,127 | 7,099 | 28 | 0.4 | |||||||||||
Total same property revenues | 34,846 | 34,516 | 330 | 1.0 | |||||||||||
Same property operating expenses | |||||||||||||||
Property(3) | 8,349 | 7,842 | 507 | 6.5 | |||||||||||
Real estate taxes and insurance | 3,744 | 3,607 | 137 | 3.8 | |||||||||||
Total same property operating expenses | 12,093 | 11,449 | 644 | 5.6 | |||||||||||
Same Property NOI | $ | 22,753 | $ | 23,067 | $ | (314 | ) | (1.4 | ) | ||||||
Full Year Weighted Average Occupancy | |||||||||||||||
2016 | 2015 | ||||||||||||||
Same Properties | 92.2 | % | 91.3 | % | |||||||||||
Total | 89.4 | % | 87.1 | % | |||||||||||
(1) | Same property comparisons are based upon those consolidated properties owned and in-service for the entirety of the periods presented. Same property results exclude the results of the following non-same property that was owned as of December 31, 2016: NOVA build-to-suit. |
(2) | Excludes termination fee income for comparative purposes. |
(3) | Same property operating expenses have been adjusted to reflect a normalized management fee in lieu of an administrative overhead allocation for comparative purposes. |
Same Property NOI for the Northern Virginia properties decreased $0.3 million for the year ended December 31, 2016 compared with the same period in 2015. Total same property revenues increased $0.3 million during 2016 compared with 2015 due to an increase in occupancy at certain Northern Virginia properties. Total same property operating expenses increased $0.6 million during 2016 compared with 2015 due to an increase in service contract expenses, as well as an increase in real estate tax expenses due to higher real estate tax assessments. These increases in operating expenses were partially offset by decreases in utilities and repairs and maintenance costs.
64
Southern Virginia | |||||||||||||||
For the Year Ended December 31, | |||||||||||||||
(dollars in thousands) | 2016 | 2015 | $ Change | % Change | |||||||||||
Number of buildings(1) | 19 | 19 | — | — | |||||||||||
Same property revenues | |||||||||||||||
Rental | $ | 25,320 | $ | 24,066 | $ | 1,254 | 5.2 | ||||||||
Tenant reimbursements and other(2) | 4,541 | 4,669 | (128 | ) | (2.7 | ) | |||||||||
Total same property revenues | 29,861 | 28,735 | 1,126 | 3.9 | |||||||||||
Same property operating expenses | |||||||||||||||
Property(3) | 7,067 | 7,324 | (257 | ) | (3.5 | ) | |||||||||
Real estate taxes and insurance | 2,462 | 2,411 | 51 | 2.1 | |||||||||||
Total same property operating expenses | 9,529 | 9,735 | (206 | ) | (2.1 | ) | |||||||||
Same Property NOI | $ | 20,332 | $ | 19,000 | $ | 1,332 | 7.0 | ||||||||
Full Year Weighted Average Occupancy | |||||||||||||||
2016 | 2015 | ||||||||||||||
Same Properties | 94.3 | % | 90.8 | % | |||||||||||
Total | 94.3 | % | 90.8 | % | |||||||||||
(1) | Same property comparisons are based upon those consolidated properties owned and in-service for the entirety of the periods presented. |
(2) | Excludes termination fee income for comparative purposes. |
(3) | Same property operating expenses have been adjusted to reflect a normalized management fee in lieu of an administrative overhead allocation for comparative purposes. |
Same Property NOI for the Southern Virginia properties increased $1.3 million for the year ended December 31, 2016 compared with the same period in 2015. Total same property revenues increased $1.1 million during 2016 compared with 2015 due to an increase in occupancy at certain Southern Virginia properties. Total same property operating expenses decreased $0.2 million during 2016 compared with 2015 due to a reduction in utilities, repairs and maintenance and snow and ice removal costs.
65
Comparison of the Year Ended December 31, 2015 with the Year Ended December 31, 2014
Reconciliation of Same Property NOI for Our Reporting Segments
The following table provides a reconciliation of our Same Property NOI for our reporting segments to our consolidated net (loss) income for 2015 and 2014 and provides the basis for our discussion of total Same Property NOI in 2015 compared with 2014. A detailed discussion of each reporting segment’s Same Property NOI results for 2015 and 2014 follows this table.
CONSOLIDATED
2015 | 2014 | Same Property(1) | ||||||||||||||||||||||||||||
Same property revenues | Same Property(1) | Non-Same Property(2) | All Properties | Same Property(1) | Non-Same Property(2) | All Properties | $ Change | % Change | ||||||||||||||||||||||
Rental | $ | 113,977 | $ | 25,029 | $ | 139,006 | $ | 110,648 | $ | 17,578 | $ | 128,226 | $ | 3,329 | 3.0 | |||||||||||||||
Tenant reimbursements and other(3) | 28,790 | 5,050 | 33,840 | 27,705 | 5,721 | 33,426 | 1,085 | 3.9 | ||||||||||||||||||||||
Total same property revenues | 142,767 | 30,079 | 172,846 | 138,353 | 23,299 | 161,652 | 4,414 | 3.2 | ||||||||||||||||||||||
Same property operating expenses | ||||||||||||||||||||||||||||||
Property(4) | 34,919 | 9,174 | 44,093 | 34,899 | 8,353 | 43,252 | 20 | 0.1 | ||||||||||||||||||||||
Real estate taxes and insurance | 14,739 | 5,006 | 19,745 | 14,573 | 2,787 | 17,360 | 166 | 1.1 | ||||||||||||||||||||||
Total same property operating expenses | 49,658 | 14,180 | 63,838 | 49,472 | 11,140 | 60,612 | 186 | 0.4 | ||||||||||||||||||||||
Same property net operating income | $ | 93,109 | $ | 15,899 | 109,008 | $ | 88,881 | $ | 12,159 | 101,040 | $ | 4,228 | 4.8 | |||||||||||||||||
General and administrative expenses | (25,450 | ) | (21,156 | ) | ||||||||||||||||||||||||||
Acquisition costs | — | (2,681 | ) | |||||||||||||||||||||||||||
Depreciation and amortization | (66,624 | ) | (61,796 | ) | ||||||||||||||||||||||||||
Impairment of rental property | (60,826 | ) | (3,956 | ) | ||||||||||||||||||||||||||
Total other expenses (income) | 9,475 | 4,108 | ||||||||||||||||||||||||||||
(Loss) income from discontinued operations | (607 | ) | 1,484 | |||||||||||||||||||||||||||
Net (loss) income | $ | (35,024 | ) | $ | 17,043 | |||||||||||||||||||||||||
2015 | 2014 | Same Property(1) | ||||||||||||||||||||||||||||
Net operating income by Segment: | Same Property(1) | Non-Same Property(2) | All Properties | Same Property(1) | Non-Same Property(2) | All Properties | $ Change | % Change | ||||||||||||||||||||||
Washington, D.C. | $ | 16,603 | $ | 8,349 | $ | 24,952 | $ | 15,277 | $ | 3,416 | $ | 18,693 | $ | 1,326 | 8.7 | |||||||||||||||
Maryland | 28,478 | 751 | 29,229 | 27,851 | 2,527 | 30,378 | 627 | 2.3 | ||||||||||||||||||||||
Northern Virginia | 29,028 | 7,122 | 36,150 | 28,025 | 6,676 | 34,701 | 1,003 | 3.6 | ||||||||||||||||||||||
Southern Virginia | 19,000 | (323 | ) | 18,677 | 17,728 | (460 | ) | 17,268 | 1,272 | 7.2 | ||||||||||||||||||||
Total | $ | 93,109 | $ | 15,899 | $ | 109,008 | $ | 88,881 | $ | 12,159 | $ | 101,040 | $ | 4,228 | 4.8 | |||||||||||||||
Full Year Weighted Average Occupancy | ||||||||||||||||||||||||||||||
2015 | 2014 | |||||||||||||||||||||||||||||
Same Properties | 89.6 | % | 87.8 | % | ||||||||||||||||||||||||||
Total | 89.0 | % | 86.5 | % | ||||||||||||||||||||||||||
(1) | Same property comparisons are based upon those consolidated properties owned and in-service for the entirety of the periods presented. Same property results for the year ended December 31, 2015 and 2014 exclude the operating results of all disposed properties and the results of the following non-same properties that were owned as of December 31, 2015: 440 First Street, NW, Storey Park, 1401 K Street, NW, 1775 Wiehle Avenue, and 11 Dupont Circle, NW (collectively, the “2015 Non-Same Properties”.) |
(2) | Includes property results for the 2015 Non-Same Properties and the results of all properties that were disposed of prior to December 31, 2015 and whose operations for the periods we owned the property are classified within continuing operations. See note 9, Dispositions, in the notes to our accompanying consolidated financial statements. Also includes an administrative overhead allocation, which was replaced by a normalized management fee for comparative purposes, and termination fee income. |
(3) | Excludes termination fee income for comparative purposes. |
(4) | Same property operating expenses have been adjusted to reflect a normalized management fee in lieu of an administrative overhead allocation for comparative purposes. |
Same Property NOI increased $4.2 million for the year ended December 31, 2015 compared with the same period in 2014. Total same property revenues increased $4.4 million in 2015 compared with 2014 primarily due to an increase in occupancy. In addition, total same property revenues increased due to an increase in construction management fees. Total same property operating expenses increased $0.2 million in 2015 compared with 2014, due to higher real estate tax assessments and management fees, partially offset by an overall decrease in anticipated bad debt reserves and utilities.
66
Washington, D.C. | |||||||||||||||
For the Year Ended December 31, | |||||||||||||||
(dollars in thousands) | 2015 | 2014 | $ Change | % Change | |||||||||||
Number of buildings(1) | 3 | 3 | — | — | |||||||||||
Same property revenues | |||||||||||||||
Rental | $ | 19,339 | $ | 17,550 | $ | 1,789 | 10.2 | ||||||||
Tenant reimbursements and other(2) | 7,960 | 7,893 | 67 | 0.8 | |||||||||||
Total same property revenues | 27,299 | 25,443 | 1,856 | 7.3 | |||||||||||
Same property operating expenses | |||||||||||||||
Property(3) | 6,263 | 5,981 | 282 | 4.7 | |||||||||||
Real estate taxes and insurance | 4,433 | 4,185 | 248 | 5.9 | |||||||||||
Total same property operating expenses | 10,696 | 10,166 | 530 | 5.2 | |||||||||||
Same Property NOI | $ | 16,603 | $ | 15,277 | $ | 1,326 | 8.7 | ||||||||
Full Year Weighted Average Occupancy | |||||||||||||||
2015 | 2014 | ||||||||||||||
Same Properties | 96.6 | % | 90.8 | % | |||||||||||
Total | 86.9 | % | 89.3 | % | |||||||||||
(1) | Same property comparisons are based upon those consolidated properties owned and in-service for the entirety of the periods presented. Same-property results exclude the following non-same properties that were owned as of December 31, 2015: 440 First Street, NW, Storey Park, 1401 K Street, NW and 11 Dupont Circle, NW. |
(2) | Excludes termination fee income for comparative purposes. |
(3) | Same property operating expenses have been adjusted to reflect a normalized management fee in lieu of an administrative overhead allocation for comparative purposes. |
Same Property NOI for the Washington, D.C. properties increased $1.3 million for the year ended December 31, 2015 compared with the same period in 2014. Total same property revenues increased $1.9 million during 2015 compared with 2014 due to an increase in occupancy at certain Washington D.C. properties. Total same property operating expenses increased $0.5 million during 2015 compared with 2014 primarily due to higher real estate taxes, due to an increase in real estate tax assessments, and due to an increase in labor and service contract costs.
67
Maryland | |||||||||||||||
For the Year Ended December 31, | |||||||||||||||
(dollars in thousands) | 2015 | 2014 | $ Change | % Change | |||||||||||
Number of buildings(1) | 34 | 34 | — | — | |||||||||||
Same property revenues | |||||||||||||||
Rental | $ | 35,724 | $ | 34,961 | $ | 763 | 2.2 | ||||||||
Tenant reimbursements and other(2) | 6,809 | 6,505 | 304 | 4.7 | |||||||||||
Total same property revenues | 42,533 | 41,466 | 1,067 | 2.6 | |||||||||||
Same property operating expenses | |||||||||||||||
Property(3) | 10,603 | 10,065 | 538 | 5.3 | |||||||||||
Real estate taxes and insurance | 3,452 | 3,550 | (98 | ) | (2.8 | ) | |||||||||
Total same property operating expenses | 14,055 | 13,615 | 440 | 3.2 | |||||||||||
Same Property NOI | $ | 28,478 | $ | 27,851 | $ | 627 | 2.3 | ||||||||
Full Year Weighted Average Occupancy | |||||||||||||||
2015 | 2014 | ||||||||||||||
Same Properties | 91.2 | % | 88.5 | % | |||||||||||
Total | 91.2 | % | 86.1 | % | |||||||||||
(1) | Same property comparisons are based upon those consolidated properties owned and in-service for the entirety of the periods presented. |
(2) | Excludes termination fee income for comparative purposes. |
(3) | Same property operating expenses have been adjusted to reflect a normalized management fee in lieu of an administrative overhead allocation for comparative purposes. |
Same Property NOI for the Maryland properties increased $0.6 million for the year ended December 31, 2015 compared with the same period in 2014. Total same property revenues increased $1.1 million during 2015 compared with 2014 due to an increase in occupancy at certain Maryland properties. Total same property operating expenses increased $0.4 million in 2015 compared with 2014 due to an increase in anticipated bad debt reserves and an increase in snow and ice removal costs incurred in the first quarter of 2015.
68
Northern Virginia | |||||||||||||||
For the Year Ended December 31, | |||||||||||||||
(dollars in thousands) | 2015 | 2014 | $ Change | % Change | |||||||||||
Number of buildings(1) | 39 | 39 | — | — | |||||||||||
Same property revenues | |||||||||||||||
Rental | $ | 34,848 | $ | 34,815 | $ | 33 | 0.1 | ||||||||
Tenant reimbursements and other(2) | 9,353 | 8,458 | 895 | 10.6 | |||||||||||
Total same property revenues | 44,201 | 43,273 | 928 | 2.1 | |||||||||||
Same property operating expenses | |||||||||||||||
Property(3) | 10,730 | 10,673 | 57 | 0.5 | |||||||||||
Real estate taxes and insurance | 4,443 | 4,575 | (132 | ) | (2.9 | ) | |||||||||
Total same property operating expenses | 15,173 | 15,248 | (75 | ) | (0.5 | ) | |||||||||
Same Property NOI | $ | 29,028 | $ | 28,025 | $ | 1,003 | 3.6 | ||||||||
Full Year Weighted Average Occupancy | |||||||||||||||
2015 | 2014 | ||||||||||||||
Same Properties | 86.3 | % | 85.7 | % | |||||||||||
Total | 86.9 | % | 86.4 | % | |||||||||||
(1) | Same property comparisons are based upon those consolidated properties owned and in-service for the entirety of the periods presented. Same-property results exclude the following non-same property that was owned as of December 31, 2015: 1775 Wiehle Avenue. |
(2) | Excludes termination fee income for comparative purposes. |
(3) | Same property operating expenses have been adjusted to reflect a normalized management fee in lieu of an administrative overhead allocation for comparative purposes. |
Same Property NOI for the Northern Virginia properties increased $1.0 million for the year ended December 31, 2015 compared with the same period in 2014. Total same property revenues increased $0.9 million during 2015 compared with 2014 primarily due to an increase in occupancy at certain Northern Virginia properties. Total same property operating expenses decreased $0.1 million during 2015 compared with 2014 due to lower real estate taxes and insurance expense.
69
Southern Virginia | |||||||||||||||
For the Year Ended December 31, | |||||||||||||||
(dollars in thousands) | 2015 | 2014 | $ Change | % Change | |||||||||||
Number of buildings(1) | 19 | 19 | — | — | |||||||||||
Same property revenues | |||||||||||||||
Rental | $ | 24,066 | $ | 23,322 | $ | 744 | 3.2 | ||||||||
Tenant reimbursements and other(2) | 4,668 | 4,849 | (181 | ) | (3.7 | ) | |||||||||
Total same property revenues | 28,734 | 28,171 | 563 | 2.0 | |||||||||||
Same property operating expenses | |||||||||||||||
Property(3) | 7,323 | 8,179 | (856 | ) | (10.5 | ) | |||||||||
Real estate taxes and insurance | 2,411 | 2,264 | 147 | 6.5 | |||||||||||
Total same property operating expenses | 9,734 | 10,443 | (709 | ) | (6.8 | ) | |||||||||
Same Property NOI | $ | 19,000 | $ | 17,728 | $ | 1,272 | 7.2 | ||||||||
Full Year Weighted Average Occupancy | |||||||||||||||
2015 | 2014 | ||||||||||||||
Same Properties | 90.8 | % | 89.3 | % | |||||||||||
Total | 90.8 | % | 86.3 | % | |||||||||||
(1) | Same property comparisons are based upon those consolidated properties owned and in-service for the entirety of the periods presented. |
(2) | Excludes termination fee income for comparative purposes. |
(3) | Same property operating expenses have been adjusted to reflect a normalized management fee in lieu of an administrative overhead allocation for comparative purposes. |
Same Property NOI for the Southern Virginia properties increased $1.3 million for the year ended December 31, 2015 compared with 2014. Total same property revenues increased $0.6 million during 2015 compared with 2014 due to an increase in occupancy at certain Southern Virginia properties. Total same property operating expenses decreased $0.7 million during 2015 compared with 2014 primarily due to a decrease in anticipated bad debt reserves.
Liquidity and Capital Resources
Overview
We seek to maintain a flexible balance sheet, with an appropriate balance of cash, debt, equity and available funds under our unsecured revolving credit facility, to readily provide access to capital given the volatility of the market and to position us to take advantage of potential growth opportunities (including both internal growth through development and redevelopment, as well as external growth through acquisitions). As previously disclosed in our Form 10-K for the year ended December 31, 2015 and our Form 10-Q for the quarters ended March 31, 2016, June 30, 2016 and September 30, 2016, we completed an extensive underwriting of our business, our portfolio and our team. Based on this underwriting, we have been implementing our Strategic Plan, the focus of which is to de-risk the portfolio, de-lever the balance sheet and maximize asset values.
The key action items of the Strategic Plan, which is substantially complete, are as follows:
• | Improve our portfolio composition by disposing of approximately $350 million of non-core assets. |
• | Address three large upcoming lease expirations at single-tenant buildings through the sale of One Fair Oaks and the repositioning of 500 First Street, NW and 540 Gaither Road at Redland. |
• | Strengthen the balance sheet and improve liquidity by reducing leverage, limiting our floating rate debt exposure over time, and extending our debt maturities to better match our capital structure with our assets. |
• | Manage our cost structure by reducing corporate overhead and general and administrative expenses. |
• | Reduce our targeted annualized common share dividend from $0.60 to $0.40. |
70
We have executed on several key components of our previously disclosed Strategic Plan. As of the date of this filing, we have sold $294.6 million of non-core assets, beginning with the December 2015 sales of Newington Business Park Center and Cedar Hill I and III. On January 19, 2016, we used the combined proceeds from the sale of Newington Business Park Center and Cedar Hill I and III to redeem 2.2 million 7.750% Series A Preferred Shares. On April 27, 2016, we used the proceeds from the sale of the NOVA Non-Core Portfolio to redeem an additional 3.6 million 7.750% Series A Preferred Shares. On July 6, 2016, we used proceeds from the prepayment of a note receivable to redeem the remaining 0.6 million 7.750% Series A Preferred Shares and to pay down a portion of the outstanding balance under our unsecured revolving credit facility. The 7.750% Series A Preferred Shares (NYSE: FPO-PA) were delisted from trading on the New York Stock Exchange upon redemption of the final outstanding shares on July 6, 2016. On July 25, 2016, our consolidated joint venture utilized proceeds from the sale of Storey Park to repay the $22.0 million land loan at the property, and we used our portion of the remaining proceeds to repay $27.0 million of the outstanding balance under the unsecured revolving credit facility and for other general corporate purposes. In addition, in January 2017, we sold One Fair Oaks and used the proceeds from the sale to repay $13.3 million of the outstanding balance under the unsecured revolving credit facility. Finally, in February 2017, we sold Plaza 500 and used a portion of the proceeds to repay $70.0 million of the outstanding balance under the unsecured revolving credit facility.
We made progress addressing our large upcoming lease expirations at One Fair Oaks, 540 Gaither Road at Redland and 500 First Street, NW.
On January 9, 2017, we sold One Fair Oaks, which was located in our Northern Virginia reporting segment, for net proceeds of $13.3 million. CACI International, which fully leased One Fair Oaks, had a lease that terminated on December 31, 2016.
In October 2015, we received notice from the Department of Health and Human Services, which fully leases the building at 540 Gaither Road within our Redland property in our Maryland reporting segment, that it will be exercising its early termination right, which is in March 2017. We underwrote the Department of Health and Human Services exercising its termination right when we acquired the building in 2013. During the second quarter of 2016, we re-leased two floors at 540 Gaither Road, which totaled 45,000 square feet, or approximately 34% of the building’s total square footage. We anticipate that the new tenant at 540 Gaither Road will take occupancy in early 2018; however, we can provide no assurances regarding the timing of when the tenant will take occupancy. We have begun repositioning the property, gauging new tenant interest to lease the property and, upon the expiration of the current tenant’s lease in March 2017, will place 540 Gaither Road into redevelopment, all with the ultimate goal of maximizing value upon the expiration of the lease; however, we can provide no assurances regarding the outcome of these or any other alternative strategies for the property.
The Bureau of Prisons, which fully leases 500 First Street, NW in our Washington, D.C. reporting segment, was subject to a lease that was scheduled to expire in July 2016. During the second quarter of 2016, we entered into a one-year lease extension with the Bureau of Prisons, which is set to expire in July 2017, and we believe there is a likelihood that the tenant will elect to further extend the expiration date of the lease; however, we can provide no assurances regarding the length of such extension or that such extension will occur at all. Currently, we are evaluating various strategies with respect to 500 First Street, NW, which include repositioning 500 First Street, NW and gauging new tenant interest to lease this property, all with the ultimate goal of maximizing value upon the expiration of the lease; however, we can provide no assurances regarding the outcome of these or any other alternative strategies for the property.
As previously disclosed, we have been diligently working to improve our balance sheet leverage and increase our liquidity. At December 31, 2016, our debt plus preferred shares over the undepreciated book value of our real estate assets was 57.1% compared with 66.6% at December 31, 2015. In addition, we have focused on reducing our corporate overhead costs. For the year ended December 31, 2016, our corporate overhead expense (which includes total general and administrative expense and overhead allocated to property operating expense) was $23.4 million compared with $33.5 million for the same period in 2015, which included $6.5 million of separation costs recorded in 2015 (primarily related to the departure of our former Chief Executive Officer and former Chief Investment Officer in November 2015). Excluding the separation costs recorded in 2015, corporate overhead expense decreased 14% for the year ended December 31, 2016 compared with the same period in 2015. Finally, as previously disclosed in connection with our Strategic Plan, on April 26, 2016, the Board of Trustees declared a reduction of our dividend rate by 33% from $0.15 per common share to $0.10 per common share, which equates to an annualized dividend of $0.40 per share, and was effective for the dividends paid on and after May 16, 2016.
We expect to meet short-term liquidity requirements generally through working capital, net cash provided by operations, and, if necessary, borrowings on our unsecured revolving credit facility. Our short-term obligations consist primarily of the lease for our corporate headquarters, normal recurring operating expenses, regular debt payments, recurring expenditures for corporate and administrative needs, non-recurring expenditures, such as capital improvements, tenant improvements and redevelopments, leasing commissions and dividends to common shareholders.
71
In January and February of 2017, we used the proceeds from the dispositions of One Fair Oaks and Plaza 500, as well as available cash, to repay a total of $80.0 million of the outstanding balance under the unsecured revolving credit facility. As of the date of this filing, we had $64.0 million outstanding and $150.9 million available under the unsecured revolving credit facility. In the next 12 months, we have a $32.2 million construction loan and a $63.2 million fixed rate loan maturing, both of which we anticipate will be refinanced or repaid during 2017. For a list of principal debt balances and their maturity dates, as well as a reconciliation of our borrowings to the net debt balances presented in our consolidated balance sheets, see note 8, Debt, in the notes to our accompanying consolidated financial statements.
Over the next twelve months, we believe that we will generate sufficient cash flow from operations and have access to the capital resources, through debt and equity markets, necessary to expand and develop our business, to fund our operating and administrative expenses, to continue to meet our debt service obligations and to pay distributions in accordance with REIT requirements. However, our cash flow from operations and ability to access the debt and equity markets could be adversely affected due to uncertain economic factors and volatility in the financial and credit markets. In particular, we cannot assure that our tenants will not default on their leases or fail to make full rental payments if their businesses are challenged due to, among other things, the economic conditions (particularly if the tenants are unable to secure financing to operate their businesses). This may be particularly true for our tenants that are smaller companies. Further, 19.0% of our annualized cash basis rent (which includes 5.1% of our annualized cash basis rent that is related to CACI International at One Fair Oaks, which was sold in January 2017) is scheduled to expire during the next twelve months and, if we are unable to renew these leases or re-lease the space, our cash flow could be negatively impacted.
We also believe, based on our historical experience and forecasted operations, that we will have sufficient cash flow or access to capital to meet our obligations over the next five years. We intend to meet our long-term funding requirements for property acquisitions, development, redevelopment and other non-recurring capital improvements through net cash provided from operations, long-term secured and unsecured indebtedness, including borrowings under our unsecured revolving credit facility and unsecured term loan, proceeds from disposal of strategically identified assets (outright or through joint ventures) and/or the issuance of equity and/or debt securities. In the process of exploring different financing options, we actively monitor the impact that each potential financing decision will have on our financial covenants in order to avoid any issues of non-compliance with the terms of our existing financial covenants.
Our ability to raise funds through sales of debt and equity securities and access to other third party sources of capital in the future will be dependent on, among other things, general economic conditions, general market conditions for REITs, rental rates, occupancy levels, market perceptions and the trading price of our shares. We will continue to analyze which sources of capital are most advantageous to us at any particular point in time, but the capital markets may not be consistently available on terms we deem attractive, or at all.
Financing Activity
Land Loan
On July 25, 2016, our 97% owned consolidated joint venture sold Storey Park for net proceeds of $52.7 million. We used a portion of the proceeds to repay a $22.0 million land loan secured by the Storey Park land, which had a variable interest rate of LIBOR plus a spread of 2.50% and was scheduled to mature on October 16, 2016.
Construction Loans
On June 5, 2013, we entered into a construction loan that is collateralized by our 440 First Street, NW property (the “440 First Street, NW Construction Loan”), which underwent a major redevelopment that was substantially completed in October 2013. The 440 First Street, NW Construction Loan has a borrowing capacity of up to $43.5 million, of which we borrowed $32.2 million as of December 31, 2016. During the second quarter of 2016, we extended the maturity date of the loan by one year to May 30, 2017, and we anticipate refinancing the loan in 2017. The 440 First Street, NW Construction Loan has a variable interest rate of LIBOR plus a spread of 2.50%, and we can repay all or a portion of the 440 First Street, NW Construction Loan, without penalty, at any time during the term of the loan. At December 31, 2016, per the terms of the loan agreement, 50% of the outstanding principal balance and all of the outstanding accrued interest were recourse to us. The percentage of outstanding principal balance that is recourse to us can be reduced upon the property achieving certain operating thresholds. As of December 31, 2016, we were in compliance with all the financial covenants of the 440 First Street, NW Construction Loan.
On September 1, 2015, we entered into a construction loan that is collateralized by the NOVA build-to-suit (the “Northern Virginia Construction Loan”), which was placed in-service in August 2016. The Northern Virginia Construction Loan has a
72
borrowing capacity of up to $43.7 million, of which we borrowed $34.6 million as of December 31, 2016. The loan has a variable interest rate of LIBOR plus a spread of 1.85% and matures on September 1, 2019. We can repay all or a portion of the Northern Virginia Construction Loan, without penalty, at any time during the term of the loan. As of December 31, 2016, we were in compliance with all of the financial covenants of the Northern Virginia Construction Loan.
Mortgage Debt
We have originated or assumed the following mortgage loans since January 1, 2015 (dollars in thousands):
Month | Year | Property | Effective Interest Rate | Principal Balance at December 31, 2016 | ||||||||
September | 2015 | Northern Virginia Construction Loan | LIBOR + 1.85% | (1) | $ | 34,584 | (2) | |||||
August | 2015 | 11 Dupont Circle, NW | 4.22% | 66,780 | ||||||||
(1) | At December 31, 2016, LIBOR was 0.77%. |
(2) | The loan has a borrowing capacity of up to $43.7 million, of which we borrowed $25.4 million and $9.2 million during 2016 and 2015, respectively. |
We have repaid the following mortgage and land loans since January 1, 2015 (dollars in thousands):
Month | Year | Property | Effective Interest Rate | Principal Balance Repaid | |||||||
October | 2016 | Hillside I and II | 4.62 | % | $ | 12,199 | |||||
August | 2016 | Storey Park Land Loan | LIBOR + 2.50% | 22,000 | |||||||
February | 2016 | Gateway Centre Manassas | 5.88 | % | 174 | ||||||
July | 2015 | Jackson National Life Loan | 5.19 | % | 64,230 | ||||||
March | 2015 | Hanover Business Center Building D | 6.63 | % | 65 | ||||||
March | 2015 | Chesterfield Business Center Buildings C,D,G and H | 6.63 | % | 202 | ||||||
March | 2015 | Hanover Business Center Building C | 6.63 | % | 460 | ||||||
March | 2015 | Chesterfield Business Center Buildings A,B,E and F | 6.63 | % | 1,584 | ||||||
March | 2015 | Airpark Business Center | 6.63 | % | 864 | ||||||
Distributions
We are required to distribute at least 90% of our REIT taxable income to our shareholders in order to maintain qualification as a REIT, including some types of taxable income we recognize for tax purposes but with regard to which we do not receive corresponding cash. In addition, we must distribute 100% of our taxable income to our shareholders to eliminate our U.S. federal income tax liability. The funds we use to pay dividends on our common and preferred shares are provided through distributions from the Operating Partnership. For each of our common and preferred shares, the Operating Partnership has issued a corresponding common and preferred unit to us. We are the sole general partner of and, as of December 31, 2016, owned 95.8% of the common interest in the Operating Partnership. The remaining common interests in the Operating Partnership are limited partnership interests that are owned by unrelated parties. The Operating Partnership is required to make cash distributions to us in an amount sufficient to meet our distribution requirements. The cash distributions by the Operating Partnership reduce the amount of cash that is available for general corporate purposes, which includes repayment of debt, funding acquisitions or construction activities, and for other corporate operating activities.
On a quarterly basis, our management team recommends a distribution amount that must then be approved by our Board of Trustees in its sole discretion. The amount of future distributions will be at the discretion of our Board of Trustees and will be based on, among other things: (i) the taxable income and cash flow generated by our operating activities; (ii) cash generated by, or used in, our financing and investing activities; (iii) the annual distribution requirements under the REIT provisions of the Internal Revenue Code; and (iv) such other factors as the Board of Trustees deems relevant. Our ability to make cash distributions will also be limited by the covenants contained in our Operating Partnership agreement and our financing arrangements as well as limitations imposed by state law and the agreements governing any future indebtedness. See “Item 1A – Risk Factors – Risks
73
Related to Our Business and Properties – Covenants in our debt agreements could adversely affect our liquidity and financial condition,” “Item 1A – Risk Factors – Risks Related to an Investment in Our Equity Securities – We have not established a minimum dividend payment level and we cannot assure you of our ability to pay dividends in the future or the amount of any dividends” and “—Financial Covenants” below for additional information regarding the financial covenants.
Cash Flows
Due to the nature of our business, we rely on working capital and net cash provided by operations and, if necessary, borrowings under our unsecured revolving credit facility to fund our short-term liquidity needs. Net cash provided by operations is substantially dependent on the continued receipt of rental payments and other expenses reimbursed by our tenants. The ability of tenants to meet their obligations, including the payment of rent contractually owed to us, and our ability to lease space to new or replacement tenants on favorable terms, could affect our cash available for short-term liquidity needs. We intend to meet short and long term funding requirements for debt maturities, interest payments, dividend distributions and capital expenditures through cash flow provided by operations, long-term secured and unsecured indebtedness, including borrowings under our unsecured revolving credit facility, proceeds from asset disposals and the issuance of equity and debt securities. However, we may not be able to obtain capital from such sources on favorable terms, in the time period we desire, or at all. In addition, our continued ability to borrow under our existing debt instruments is subject to compliance with our financial and operating covenants and a failure to comply with such covenants could cause a default under the applicable debt agreement. In the event of a default, we may be required to repay such debt with capital from other sources, which may not be available on attractive terms, or at all.
We may also fund building acquisitions, development, redevelopment and other non-recurring capital improvements through additional borrowings, issuance of common Operating Partnership units or sales of assets, outright or through joint ventures.
Consolidated cash flow information is summarized as follows:
Year Ended December 31, | Change | ||||||||||||||||||
(dollars in thousands) | 2016 | 2015 | 2014 | 2016 vs. 2015 | 2015 vs. 2014 | ||||||||||||||
Cash provided by operating activities | $ | 62,599 | $ | 60,382 | $ | 62,953 | $ | 2,217 | $ | (2,571 | ) | ||||||||
Net cash provided by (used in) investing activities | 120,240 | 84,888 | (111,556 | ) | 35,352 | 196,444 | |||||||||||||
Net cash (used in) provided by financing activities | (182,222 | ) | (145,066 | ) | 53,186 | (37,156 | ) | (198,252 | ) | ||||||||||
Comparison of the Years Ended December 31, 2016 and 2015
Net cash provided by operating activities increased $2.2 million for the year ended December 31, 2016 compared with same period in 2015, primarily due to the timing of cash payments and receipts, as we had a decrease in accounts receivable and a lower increase in accounts payable. In addition, net cash provided by operating activities increased due to a reduction of general and administrative expenses for the year ended December 31, 2016 compared with the same period in 2015. The increase in net cash provided by operating activities for the year ended December 31, 2016 compared with the same period in 2015 was partially offset by a reduction of net operating income related to dispositions.
Net cash provided by investing activities increased $35.4 million for the year ended December 31, 2016 compared with the same period in 2015. During 2016, we received aggregate net proceeds of $143.2 million from the sales of Storey Park and the NOVA Non-Core Portfolio, and the owners of 950 F Street, NW prepaid a mezzanine loan that had an outstanding principal balance of $34.0 million. During 2015, we received aggregate net proceeds of $129.2 million from the sales of Cedar Hill I and III, Newington Business Park Center, Rumsey Center and the Richmond Portfolio, which does not include cash used to prepay the $3.2 million of mortgage debt secured by the Richmond Portfolio. In addition, during 2015 the owners of America’s Square prepaid a mezzanine loan that had an outstanding balance of $29.7 million. Cash provided by investing activities for the year ended 2016 compared with the same period in 2015 also increased due to a $16.9 million combined decrease in cash used for construction activities and additions to rental property and furniture, fixtures and equipment, which was primarily driven by a decrease in costs incurred for the construction of the NOVA build-to-suit, as the building was substantially completed in the first quarter of 2016, and the property was placed in-service in August 2016 after substantial completion of the tenant improvements.
Net cash used in financing activities increased $37.2 million for the year ended December 31, 2016 compared with the same period in 2015. During 2016, we issued $238.4 million of debt and repaid $227.0 million of outstanding debt, and during 2015
74
we issued $196.0 million of debt and repaid $277.1 million of outstanding debt. In addition, we used proceeds from dispositions and cash from the prepayment of the 950 F Street, NW mezzanine loan to redeem all of our outstanding 6.4 million 7.750% Series A Preferred Shares with a face value of $160.0 million during 2016. The redemption of the 7.750% Series A Preferred Shares during 2016 resulted in a $7.8 million decrease in dividends to preferred shareholders for 2016 compared with 2015. In addition, dividends to common shareholders decreased $8.9 million for 2016 compared to the same period in 2015 due to a reduction of our quarterly dividend rate from $0.15 per common share to $0.10 per common share during 2016. In addition, in 2015, we used $10.2 million to repurchase 0.9 million common shares.
Comparison of the Years Ended December 31, 2015 and 2014
Net cash provided by operating activities decreased $2.6 million for the year ended December 31, 2015 compared with same period in 2014, primarily related to the timing of cash payments and receipts, as we had a decrease in rents received in advance. In addition, net cash provided by operating activities decreased due to the release of funds in 2014 that had previously been escrowed. The decrease in net cash provided by operating activities for the year ended December 31, 2015 was partially offset by an increase in net operating income, due to a higher occupancy in our portfolio, and an increase in accounts payable and accrued expenses.
Net cash provided by investing activities was $84.9 million for the year ended December 31, 2015 compared with net cash used in investing activities of $111.6 million for the same period in 2014. During 2015, we received aggregate net proceeds of $129.2 million from the sale of Cedar Hill I and III, Newington Business Park Center, Rumsey Center and the Richmond Portfolio, which does not include cash used to prepay the $3.2 million of mortgage debt secured by the Richmond Portfolio. During 2014, we acquired three properties for an aggregate net cash purchase price of $150.7 million, which excludes the assumption of a $37.3 million mortgage loan in connection with our acquisition of 1401 K Street, NW, and we sold six properties for aggregate net proceeds of $97.7 million. During 2015, the owners of America’s Square prepaid a mezzanine loan that had an outstanding balance of $29.7 million. The proceeds from the loan repayment were used to pay down a portion of the outstanding balance of our unsecured revolving credit facility. During the year ended December 31, 2014, we increased our loan to the owners of 950 F Street, NW by $9.0 million, which was funded through a draw under our unsecured revolving credit facility. The increase in cash provided by investing activities was partially offset by a $23.1 million combined increase in cash used for construction activities and additions to rental property and furniture, fixtures and equipment, which was primarily driven by tenant improvement costs at Atlantic Corporate Park in our Northern Virginia reporting segment, as well as costs incurred for the NOVA build-to-suit.
Net cash used in financing activities was $145.1 million for the year ended December 31, 2015 compared with net cash provided by financing activities of $53.2 million for the same period in 2014. During 2015, we issued $196.0 million of debt and repaid $277.1 million of debt, and during 2014, we issued $250.5 million of debt and repaid of $147.6 million of debt. The increase in net cash used in financing activities for the year ended December 31, 2015 also includes $10.2 million of cash used to repurchase 0.9 million common shares.
75
Property Acquisitions and Dispositions
We did not acquire any properties in 2016 or 2015. Below is a summary of our dispositions during 2016 and 2015 (dollars in thousands):
Dispositions | Reporting Segment | Disposition Date | Property Type | Square Feet | Net Sale Proceeds | (Loss) Gain on Sale | Capitalization Rate(1) | |||||||||||||
Storey Park(2) | Washington, D.C. | 7/25/2016 | Land | — | $ | 52,659 | $ | — | — | % | ||||||||||
NOVA Non-Core Portfolio | Northern Virginia | 3/25/2016 | Various | 945,745 | 90,501 | (1,155 | ) | 8.7 | % | |||||||||||
Cedar Hill I and III | Northern Virginia | 12/23/2015 | Office | 102,632 | 25,939 | 6,598 | 8.6 | % | ||||||||||||
Newington Business Park Center | Northern Virginia | 12/17/2015 | Business Park | 255,600 | 31,409 | 19,495 | 6.0 | % | ||||||||||||
Rumsey Center | Maryland | 7/28/2015 | Business Park | 135,015 | 14,956 | 3,384 | 8.3 | % | ||||||||||||
Richmond Portfolio(3) | Southern Virginia | 3/19/2015 | Business Park | 827,900 | 53,768 | 857 | 9.0 | % | ||||||||||||
(1) | Capitalization rates for dispositions are calculated based on the annualized net operating income, which is based on the annualized year-to-date net operating income through the month prior to the sale, divided by the selling price. |
(2) | As this property was a development site and did not generate any revenues, a capitalization rate for the property is not applicable. |
(3) | The operating results of these properties, including any gains on sale or impairments, are reflected in “(Loss) income from discontinued operations” in our statement of operations. See further discussion at note 9, Dispositions, in the notes to our accompanying consolidated financial statements. |
76
Outstanding Debt
The following table sets forth certain information with respect to our outstanding indebtedness at December 31, 2016 (dollars in thousands):
Effective Interest Rate | Balance at December 31, 2016 | Annualized Debt Service | Maturity Date | Balance at Maturity | ||||||||||||
Fixed-Rate Debt | ||||||||||||||||
Encumbered Properties | ||||||||||||||||
Redland II and III | 4.64 | % | $ | 63,214 | $ | 4,014 | 11/1/2017 | $ | 62,064 | |||||||
840 First Street, NE | 6.01 | % | 35,201 | 2,722 | 7/1/2020 | 32,000 | ||||||||||
Battlefield Corporate Center | 4.40 | % | 3,353 | 320 | 11/1/2020 | 2,618 | ||||||||||
1211 Connecticut Avenue, NW | 4.47 | % | 28,503 | 1,823 | 7/1/2022 | 24,668 | ||||||||||
1401 K Street, NW | 4.93 | % | 35,556 | 2,392 | 6/1/2023 | 30,414 | ||||||||||
11 Dupont Circle, NW(1) | 4.22 | % | 66,780 | 2,705 | 9/1/2030 | 60,449 | ||||||||||
Total Fixed-Rate Debt | 4.75 | % | (2) | $ | 232,607 | $ | 13,976 | $ | 212,213 | |||||||
Variable-Rate Debt(3) | ||||||||||||||||
440 First Street, NW Construction Loan(4) | LIBOR + 2.50% | $ | 32,216 | $ | 1,053 | 5/30/2017 | $ | 32,216 | ||||||||
Northern Virginia Construction Loan(5) | LIBOR + 1.85% | 34,584 | 906 | 9/1/2019 | 34,584 | |||||||||||
Unsecured Revolving Credit Facility(6) | LIBOR + 1.50% | 144,000 | 3,269 | 12/4/2019 | 144,000 | |||||||||||
Unsecured Term Loan(6) | ||||||||||||||||
Tranche A | LIBOR + 1.45% | 100,000 | 2,220 | 12/4/2020 | 100,000 | |||||||||||
Tranche B | LIBOR + 1.45% | 100,000 | 2,220 | 6/4/2021 | 100,000 | |||||||||||
Tranche C | LIBOR + 1.80% | 100,000 | 2,570 | 12/4/2022 | 100,000 | |||||||||||
Total Unsecured Term Loan | 2.38 | % | (2) | 300,000 | 7,010 | 300,000 | ||||||||||
Total Variable-Rate Debt | 2.93 | % | (2)(7) | 510,800 | 12,238 | 510,800 | ||||||||||
Total Debt at December 31, 2016(8) | 3.50 | % | (2)(7) | $ | 743,407 | $ | 26,214 | (9) | $ | 723,013 | ||||||
(1) | The loan is interest only until September 1, 2025. |
(2) | Represents the weighted average interest rate. |
(3) | All of our variable rate debt is based on one-month LIBOR. For the purposes of calculating the annualized debt service and the effective interest rate, we used the one-month LIBOR rate at December 31, 2016, which was 0.77%. |
(4) | In the second quarter of 2016, we extended the loan’s maturity date one year to May 30, 2017. We can repay all or a portion of the 440 First Street, NW Construction Loan, without penalty, at any time during the term of the loan. |
(5) | The loan has a borrowing capacity of up to $43.7 million and is collateralized by the NOVA build-to-suit, which was placed in-service in August 2016. We can repay all or a portion of the Northern Virginia Construction Loan, without penalty, at any time during the term of the loan. |
(6) | Based on our leverage ratio at December 31, 2016, the applicable interest rate spreads associated with the unsecured revolving credit facility and unsecured term loan will remain unchanged. |
(7) | The effective interest rate reflects the impact of our interest rate swap agreements. As of December 31, 2016, we had fixed LIBOR at a weighted average interest rate of 1.4% on $240.0 million of our variable rate debt through nine interest rate swap agreements. |
(8) | The total debt balance at December 31, 2016 excludes $6.2 million of unamortized deferred financing costs. See note 10, Debt, in the notes to our consolidated financial statements for more information. |
(9) | During 2016, we paid approximately $3.7 million in principal payments on our consolidated mortgage debt. |
All of our outstanding debt contains customary, affirmative covenants including financial reporting, standard lease requirements and certain negative covenants. We are also subject to cash management agreements with most of our mortgage lenders. These agreements require that revenue generated by the subject property be deposited into a clearing account and then swept into a cash collateral account for the benefit of the lender from which cash is distributed only after funding of improvement, leasing and maintenance reserves and payment of debt service, insurance, taxes, capital expenditures and leasing costs.
77
Financial Covenants
Our outstanding corporate debt agreements contain specific financial covenants that may impact future financing decisions made by us or may be impacted by a decline in operations. As of December 31, 2016, we were in compliance with the covenants of our amended, restated and consolidated unsecured revolving credit facility and unsecured term loan, 440 First Street, NW Construction Loan and Northern Virginia Construction Loan. On July 25, 2016, in connection with our 97% owned consolidated joint venture’s sale of Storey Park, we repaid the entire balance of the Storey Park Land Loan.
Our continued ability to borrow under the amended, restated and consolidated unsecured revolving credit facility is subject to compliance with financial and operating covenants, and a failure to comply with any of these covenants could result in a default under the facility. These debt agreements also contain cross-default provisions that would be triggered if we are in default under other loans, including mortgage loans, in excess of certain amounts. In the event of a default, the lenders could accelerate the timing of payments under the debt obligations and we may be required to repay such debt with capital from other sources, which may not be available on attractive terms, or at all, which would have a material adverse effect on our liquidity, financial condition, results of operations and ability to make distributions to our shareholders.
Below is a summary of certain financial covenants associated with these debt agreements at December 31, 2016 (dollars in thousands):
Unsecured Revolving Credit Facility, Unsecured Term Loan and Construction Loans
Covenants | Quarter Ended December 31, 2016 | Covenant | |
Consolidated Total Leverage Ratio(1) | 47.0% | ≤ 60% | |
Tangible Net Worth(1) | $895,915 | ≥ $601,202 | |
Fixed Charge Coverage Ratio(1) | 2.82x | ≥ 1.50x | |
Maximum Dividend Payout Ratio | 47.7% | ≤ 95% | |
Restricted Indebtedness: | |||
Maximum Secured Debt | 20.6% | ≤ 40% | |
Unencumbered Pool Leverage(1) | 44.3% | ≤ 60% | |
Unencumbered Pool Interest Coverage Ratio(1) | 5.91x | ≥ 1.75x | |
(1) | These are the only covenants that apply to our 440 First Street, NW Construction Loan and Northern Virginia Construction Loan, which are calculated in accordance with the amended, restated and consolidated unsecured revolving credit facility and unsecured term loan. |
Derivative Financial Instruments
We are exposed to certain risks arising from business operations and economic factors. We use derivative financial instruments to manage exposures that arise from business activities in which our future exposure to interest rate fluctuations is unknown. The objective in the use of an interest rate derivative is to add stability to interest expenses and manage exposure to interest rate changes. We do not use derivatives for trading or speculative purposes and intend to enter into derivative agreements only with counterparties that we believe have a strong credit rating to mitigate the risk of counterparty default or insolvency. No hedging activity can completely insulate us from the risks associated with changes in interest rates. Moreover, interest rate hedging could fail to protect us or adversely affect us because, among other things:
• | available interest rate hedging may not correspond directly with the interest rate risk for which we seek protection; |
• | the duration of the hedge may not match the duration of the related liability; |
• | the party owing money in the hedging transaction may default on its obligation to pay; and |
• | the credit quality of the party owing money on the hedge may be downgraded to such an extent that it impairs our ability to sell or assign our side of the hedging transaction. |
We enter into interest rate swap agreements to hedge our exposure on our variable rate debt against fluctuations in prevailing interest rates. The interest rate swap agreements fix LIBOR to a specified interest rate; however, the swap agreements do not affect the contractual spreads associated with each variable debt instrument’s applicable interest rate.
78
At December 31, 2016, we had fixed LIBOR at a weighted average interest rate of 1.4% on 240.0 million of our variable rate debt through nine interest rate swap agreements that are summarized below (dollars in thousands):
Maturity Date | Notional Amount | Interest Rate Contractual Component | Fixed LIBOR Interest Rate | ||||||
July 2017 | $ | 30,000 | LIBOR | 2.093 | % | ||||
July 2017 | 30,000 | LIBOR | 2.093 | % | |||||
July 2017 | 25,000 | LIBOR | 1.129 | % | |||||
July 2017 | 12,500 | LIBOR | 1.129 | % | |||||
July 2017 | 50,000 | LIBOR | 0.955 | % | |||||
July 2018 | 12,500 | LIBOR | 1.383 | % | |||||
July 2018 | 30,000 | LIBOR | 1.660 | % | |||||
July 2018 | 25,000 | LIBOR | 1.394 | % | |||||
July 2018 | 25,000 | LIBOR | 1.135 | % | |||||
Total/Weighted Average | $ | 240,000 | 1.442 | % | |||||
In July 2016, two swap agreements that together fixed LIBOR at a weighted average interest rate of 1.8% on $60.0 million of variable rate debt expired.
Off-Balance Sheet Arrangements
We are secondarily liable for $2.8 million of mortgage debt, which represents our proportionate share of the mortgage debt that is secured by two properties that we own through two unconsolidated joint ventures. Management believes the fair value of the potential liability to us is inconsequential as the likelihood of our need to perform under the debt agreement is remote. See note 5, Investment in Affiliates, in the notes to our accompanying consolidated financial statements for more information.
Disclosure of Contractual Obligations
The following table summarizes known material contractual obligations as of December 31, 2016 (dollars in thousands):
Payments due by period | |||||||||||||||||||
Contractual Obligations | Total | Less than 1 Year | 1-3 Years | 3 -5 Years | More than 5 Years | ||||||||||||||
Mortgage and construction loans(1) | $ | 299,407 | $ | 97,672 | $ | 39,410 | $ | 38,801 | $ | 123,524 | |||||||||
Unsecured term loan(1) | 300,000 | — | — | 200,000 | 100,000 | ||||||||||||||
Unsecured revolving credit facility(1) | 144,000 | — | 144,000 | — | — | ||||||||||||||
Interest expense(2) | 112,088 | 23,283 | 37,965 | 22,427 | 28,413 | ||||||||||||||
Operating leases(3) | 7,594 | 1,469 | 3,901 | 2,224 | — | ||||||||||||||
Construction in progress | 3,056 | 3,056 | — | — | — | ||||||||||||||
Capital expenditures | 2,730 | 2,730 | — | — | — | ||||||||||||||
Tenant improvements(4) | 2,742 | 2,742 | — | — | — | ||||||||||||||
Total | $ | 871,617 | $ | 130,952 | $ | 225,276 | $ | 263,452 | $ | 251,937 | |||||||||
(1) | Balances do not include unamortized deferred financing costs totaling $6.2 million at December 31, 2016. See note 10, Debt, in the notes to our accompanying consolidated financial statements for more information. |
(2) | Interest expense for our fixed rate obligations represents the amount of interest that is contractually due under the terms of the respective loans. Interest expense for our variable rate obligations and our interest rate swap obligations are calculated using the outstanding balance and applicable interest rate at December 31, 2016 over the life of the obligation. |
(3) | Reflects the lease obligation on our corporate headquarters, net of sublease income. |
(4) | Includes leasehold improvement and space refurbishment costs. |
79
As of December 31, 2016, we had contractual construction in progress obligations, which included amounts accrued at December 31, 2016, of $3.1 million. The amount of contractual construction in progress obligations are primarily related to development activities at 540 Gaither Road at Redland in our Maryland reporting segment. As of December 31, 2016, we had contractual rental property and furniture, fixtures and equipment obligations of $5.5 million outstanding, which included amounts accrued at December 31, 2016. The amount of contractual rental property and furniture, fixtures and equipment obligations at December 31, 2016 are related to tenant improvement and capital improvement costs for various properties across our reporting segments, including significant tenant improvements at Atlantic Corporate Park and capital improvements at 11 Dupont Circle, NW. We anticipate meeting our contractual obligations related to our construction activities with cash from our operating activities. In the event cash from our operating activities is not sufficient to meet our contractual obligations, we can access additional capital through our unsecured revolving credit facility.
We remain liable, solely to the extent of our proportionate ownership percentage, to fund any capital shortfalls or commitments from properties owned through unconsolidated joint ventures.
We have various obligations to certain local municipalities associated with our development projects that will require completion of specified site improvements, such as sewer and road maintenance, grading and other general landscaping work. As of December 31, 2016, we remained liable to those local municipalities for $2.3 million in the event that we do not complete the specified work. We intend to complete the site improvements in satisfaction of these obligations.
We had no other material contractual obligations as of December 31, 2016.
Funds From Operations
Funds from operations (“FFO”), which is a non-GAAP measure used by many investors and analysts that follow the public real estate industry, represents net income (computed in accordance with GAAP), excluding gains (losses) on sales of rental property and impairments of rental property, plus real estate-related depreciation and amortization and after adjustments for unconsolidated partnerships and joint ventures. We also exclude from our FFO calculation, the impact related to third parties from our consolidated joint venture. FFO available to common shareholders and unitholders is calculated as FFO less accumulated dividends on our preferred shares for the applicable periods presented. We compute FFO in accordance with standards established by the National Association of Real Estate Investment Trusts (“NAREIT”), which may differ from the methodology for calculating FFO, or similarly titled measures, utilized by other equity REITs and, accordingly, may not be comparable to such other REITs.
We consider FFO and FFO available to common shareholders and unitholders useful measures of performance for an equity REIT as they facilitate an understanding of the operating performance of our properties without giving effect to real estate depreciation and amortization, which assume that the value of rental property diminishes predictably over time. Since real estate values have historically risen or fallen with market conditions, we believe that FFO provides a meaningful indication of our performance. We also consider FFO an appropriate supplemental performance measure given its wide use by investors and analysts. However, FFO does not represent amounts available for our discretionary use because of needed capital replacement or expansion, debt service obligations or other commitments and uncertainties, nor is it indicative of funds available to fund our cash needs, including our ability to make distributions. Our methodology for computing FFO adds back noncontrolling interests in the income from our Operating Partnership in determining FFO. We believe this is appropriate as common Operating Partnership units are presented on an as-converted, one-for-one basis for shares of stock in determining FFO per diluted share.
Our presentation of FFO in accordance with NAREIT’s definition should not be considered as an alternative to net (loss) income attributable to common shareholders (computed in accordance with GAAP) as an indicator of our financial performance.
80
The following table presents a reconciliation of net (loss) income attributable to common shareholders to FFO available to common shareholders and unitholders (dollars in thousands):
Year Ended December 31, | |||||||||||
2016 | 2015 | 2014 | |||||||||
Net (loss) income attributable to common shareholders | $ | (9,635 | ) | $ | (45,366 | ) | $ | 4,444 | |||
Add: Depreciation and amortization: | |||||||||||
Rental property | 60,862 | 66,624 | 61,796 | ||||||||
Discontinued operations | — | 1,222 | 3,662 | ||||||||
Unconsolidated joint ventures | 3,610 | 3,916 | 4,466 | ||||||||
Impairment of rental property(1) | 2,772 | 60,826 | 3,957 | ||||||||
Loss (gain) on sale of rental property(2) | 1,155 | (30,334 | ) | (22,568 | ) | ||||||
Net (loss) income attributable to noncontrolling interests in the Operating Partnership | (428 | ) | (2,056 | ) | 199 | ||||||
FFO available to common shareholders and unitholders | 58,336 | 54,832 | 55,956 | ||||||||
Dividends on preferred shares | 3,053 | 12,400 | 12,400 | ||||||||
Issuance costs of redeemed preferred shares | 5,515 | — | — | ||||||||
FFO | $ | 66,904 | $ | 67,232 | $ | 68,356 | |||||
Weighted average common shares and Operating Partnership units outstanding – diluted | 60,325 | 60,704 | 60,851 | ||||||||
(1) | Impairment charges are reflected in continuing operations in our consolidated statements of operations for all periods shown. See note 12, Fair Value Measurements, in the notes to our accompanying consolidated financial statements for more information. |
(2) | Includes gains and losses on the sale of properties that are classified within continuing operations and gains and losses on the sale of properties that are classified within discontinued operations in our consolidated statement of operations. See note 9, Dispositions, in the notes to our accompanying consolidated financial statements for more information. |
ITEM 7A. | QUANTITATIVE AND QUALITATIVE DISCLOSURES ABOUT MARKET RISK |
Our future income, cash flows and fair values relevant to financial instruments are dependent upon prevailing market interest rates. In the normal course of business, we are exposed to the effect of interest rate changes. We have historically entered into derivative agreements to mitigate exposure to unexpected changes in interest. Market risk refers to the risk of loss from adverse changes in market interest rates. We periodically use derivative financial instruments to seek to manage, or hedge, interest rate risks related to our borrowings. We do not use derivatives for trading or speculative purposes and only enter into contracts with major financial institutions based on their credit rating and other factors. We intend to enter into derivative agreements only with counterparties that we believe have a strong credit rating to mitigate the risk of counterparty default or insolvency.
We had $743.4 million of debt outstanding at December 31, 2016, of which $232.6 million was fixed rate debt and $240.0 million was hedged variable rate debt. The remainder of our debt, $270.8 million, was unhedged variable rate debt that consisted of $60.0 million under the unsecured term loan, $144.0 million under the unsecured revolving credit facility, a $32.2 million outstanding balance under the 440 First Street, NW Construction Loan and a $34.6 million outstanding balance under the Northern Virginia Construction Loan. At December 31, 2016, the 440 First Street, NW Construction Loan had a contractual interest rate of LIBOR plus 2.50%, and the Northern Virginia Construction Loan had a contractual interest rate of LIBOR plus 1.85%. At December 31, 2016, LIBOR was 0.77%. A change in interest rates of 1% would result in an increase or decrease of $2.7 million in interest expense on our unhedged variable rate debt on an annualized basis.
In the first quarter of 2016, we adopted ASU 2015-03, which requires debt issuance costs to be presented in the balance sheet as a direct deduction from the carrying value of the respective debt liability and which is applied on a retrospective basis. Our gross debt balances exclude a total of $6.2 million unamortized deferred financing costs at December 31, 2016.
81
The table below summarizes our interest rate swap agreements as of December 31, 2016 (dollars in thousands):
Maturity Date | Notional Amount | Interest Rate Contractual Component | Fixed LIBOR Interest Rate | ||||||
July 2017 | $ | 30,000 | LIBOR | 2.093 | % | ||||
July 2017 | 30,000 | LIBOR | 2.093 | % | |||||
July 2017 | 50,000 | LIBOR | 0.955 | % | |||||
July 2017 | 25,000 | LIBOR | 1.129 | % | |||||
July 2017 | 12,500 | LIBOR | 1.129 | % | |||||
July 2018 | 30,000 | LIBOR | 1.660 | % | |||||
July 2018 | 25,000 | LIBOR | 1.394 | % | |||||
July 2018 | 12,500 | LIBOR | 1.383 | % | |||||
July 2018 | 25,000 | LIBOR | 1.135 | % | |||||
Total/Weighted Average | $ | 240,000 | 1.442 | % | |||||
In July 2016, two swap agreements that together fixed LIBOR at a weighted average interest rate of 1.8% on $60.0 million of variable rate debt expired.
For fixed rate debt, changes in interest rates generally affect the fair value of our debt but not our earnings or cash flow. See note 12, Fair Value Measurements, in the notes to our accompanying consolidated financial statements for more information on the fair value of our debt.
Our projected long-term debt obligations, principal cash flows by anticipated maturity and weighted average interest rates at December 31, 2016, for each of the succeeding five years are as follows (dollars in thousands):
2017 | 2018 | 2019 | 2020 | 2021 | Thereafter | Total | Fair Value | ||||||||||||||||||||||||
Fixed Rate Debt(1) | |||||||||||||||||||||||||||||||
Mortgage debt(2) | $ | 65,456 | $ | 2,354 | $ | 2,472 | $ | 37,203 | $ | 1,598 | $123,524 | $ | 232,607 | $ | 234,127 | ||||||||||||||||
Weighted average interest rate | 4.75 | % | 4.78 | % | 4.77 | % | 4.63 | % | 4.45 | % | 4.27 | % | |||||||||||||||||||
Variable Rate Debt(1) | |||||||||||||||||||||||||||||||
440 First Street, NW Construction Loan | $ | 32,216 | $ | — | $ | — | $ | — | $ | — | $ | — | $ | 32,216 | $ | 32,216 | |||||||||||||||
Northern Virginia Construction Loan | — | — | 34,584 | — | — | — | 34,584 | 34,584 | |||||||||||||||||||||||
Unsecured term loan | — | — | — | 100,000 | 100,000 | 100,000 | 300,000 | 300,000 | |||||||||||||||||||||||
Credit facility | — | — | 144,000 | — | — | — | 144,000 | 144,000 | |||||||||||||||||||||||
Weighted average interest rate(3) | 2.36 | % | 2.34 | % | 2.33 | % | 2.34 | % | 2.47 | % | 2.57 | % | $ | 510,800 | $ | 510,800 | |||||||||||||||
Interest Rate Swaps | |||||||||||||||||||||||||||||||
Variable to fixed(4) | $ | 147,500 | $ | 92,500 | $ | — | $ | — | $ | — | $ | — | $ | 240,000 | $ | (906 | ) | ||||||||||||||
Average pay rate | 3.03 | % | 3.21 | % | — | — | — | — | |||||||||||||||||||||||
Weighted average receive rate(3) | 2.35 | % | 2.57 | % | — | — | — | — | |||||||||||||||||||||||
(1) | Balances do not include unamortized deferred financing costs totaling $6.2 million as of December 31, 2016. See note 10, Debt, in the notes to our accompanying consolidated financial statements for more information. |
(2) | Excludes the $32.2 million outstanding balance under the 440 First Street, NW Construction Loan and the $34.6 million outstanding balance under the Northern Virginia Construction Loan. |
(3) | Based on the one-month LIBOR rate of 0.77% at December 31, 2016. |
(4) | Represents the notional amounts of the hedged debt. At December 31, 2016, we had fixed LIBOR on $240.0 million of our variable rate debt though nine interest rate swap agreements. |
82
ITEM 8. | FINANCIAL STATEMENTS AND SUPPLEMENTARY DATA |
The financial statements and supplementary data required by this Item 8 are filed with this Annual Report on Form 10-K immediately following the signature page of this Annual Report on Form 10-K and are incorporated herein by reference.
ITEM 9. | CHANGES IN AND DISAGREEMENTS WITH ACCOUNTANTS ON ACCOUNTING AND FINANCIAL DISCLOSURE |
None.
83
ITEM 9A. | CONTROLS AND PROCEDURES |
Disclosure Controls and Procedures
We maintain disclosure controls and procedures (as defined in Rules 13a-15(e) and 15d-15(e) of the Securities Exchange Act of 1934, as amended (the “Exchange Act”)) that are designed to ensure that information required to be disclosed in our periodic reports pursuant to the Exchange Act, is recorded, processed, summarized and reported within the time periods specified in the SEC’s rules and forms, and that such information is accumulated and communicated to our management, including our principal executive officer and principal financial officer, as appropriate, to allow timely decisions regarding required financial disclosure.
We carried out an evaluation, under the supervision and with the participation of our management, including the principal executive officer and principal financial officer, of the effectiveness of the design and operation of our disclosure controls and procedures pursuant to Exchange Act Rule 13a-15(e) as of the end of the period covered by this report. Based upon this evaluation, our principal executive officer and principal financial officer concluded that our disclosure controls and procedures were effective as of the end of the period covered by this report.
Management’s Report on Internal Control Over Financial Reporting
Our management is responsible for establishing and maintaining adequate internal control over financial reporting. Our internal control over financial reporting is a process designed under the supervision of our principal executive officer and principal financial officer to provide reasonable assurance regarding the reliability of financial reporting and the preparation of our consolidated financial statements for external reporting purposes in accordance with GAAP.
Our internal control over financial reporting includes policies and procedures that pertain to the maintenance of records that, in reasonable detail, accurately and fairly reflect transactions and dispositions of assets; provide reasonable assurances that transactions are recorded as necessary to permit preparation of financial statements in accordance with GAAP, and that receipts and expenditures are being made only in accordance with authorizations of our management and trustees; and provide reasonable assurance regarding prevention or timely detection of unauthorized acquisition, use or disposition of our assets that could have a material effect on our consolidated financial statements.
Management conducted an assessment of the effectiveness of our internal control over financial reporting as of December 31, 2016 based on the framework established in the updated Internal Control – Integrated Framework (2013) issued by the Committee of Sponsoring Organizations of the Treadway Commission (COSO). Based on this assessment, management has determined that our internal control over financial reporting was effective as of December 31, 2016.
The effectiveness of our internal control over financial reporting as of December 31, 2016 has been audited by KPMG LLP, an independent registered public accounting firm, as stated in their attestation report appearing on page 85 of this Annual Report on Form 10-K. KPMG’s report expresses an unqualified opinion on the effectiveness of our internal control over financial reporting as of December 31, 2016.
Changes in Internal Control Over Financial Reporting
There were no changes in our internal control over financial reporting during the quarter ended December 31, 2016 that have materially affected, or are reasonably likely to materially affect, our internal control over financial reporting.
ITEM 9B. | OTHER INFORMATION |
None.
84
Report of Independent Registered Public Accounting Firm
The Board of Trustees and Shareholders
First Potomac Realty Trust:
We have audited First Potomac Realty Trust’s internal control over financial reporting as of December 31, 2016, based on criteria established in Internal Control - Integrated Framework (2013) issued by the Committee of Sponsoring Organizations of the Treadway Commission (COSO). First Potomac Realty Trust’s management is responsible for maintaining effective internal control over financial reporting and for its assessment of the effectiveness of internal control over financial reporting, included in the accompanying Management’s Report on Internal Control Over Financial Reporting. Our responsibility is to express an opinion on the Company’s internal control over financial reporting based on our audit.
We conducted our audit in accordance with the standards of the Public Company Accounting Oversight Board (United States). Those standards require that we plan and perform the audit to obtain reasonable assurance about whether effective internal control over financial reporting was maintained in all material respects. Our audit included obtaining an understanding of internal control over financial reporting, assessing the risk that a material weakness exists, and testing and evaluating the design and operating effectiveness of internal control based on the assessed risk. Our audit also included performing such other procedures as we considered necessary in the circumstances. We believe that our audit provides a reasonable basis for our opinion.
A company’s internal control over financial reporting is a process designed to provide reasonable assurance regarding the reliability of financial reporting and the preparation of financial statements for external purposes in accordance with generally accepted accounting principles. A company’s internal control over financial reporting includes those policies and procedures that (1) pertain to the maintenance of records that, in reasonable detail, accurately and fairly reflect the transactions and dispositions of the assets of the company; (2) provide reasonable assurance that transactions are recorded as necessary to permit preparation of financial statements in accordance with generally accepted accounting principles, and that receipts and expenditures of the company are being made only in accordance with authorizations of management and directors of the company; and (3) provide reasonable assurance regarding prevention or timely detection of unauthorized acquisition, use, or disposition of the company’s assets that could have a material effect on the financial statements.
Because of its inherent limitations, internal control over financial reporting may not prevent or detect misstatements. Also, projections of any evaluation of effectiveness to future periods are subject to the risk that controls may become inadequate because of changes in conditions, or that the degree of compliance with the policies or procedures may deteriorate.
In our opinion, First Potomac Realty Trust maintained, in all material respects, effective internal control over financial reporting as of December 31, 2016, based on criteria established in Internal Control - Integrated Framework (2013) issued by the Committee of Sponsoring Organizations of the Treadway Commission (COSO).
We also have audited, in accordance with the standards of the Public Company Accounting Oversight Board (United States), the consolidated balance sheets of First Potomac Realty Trust and subsidiaries as of December 31, 2016 and 2015, and the related consolidated statements of operations, comprehensive income (loss), equity, and cash flows for each of the years in the three-year period ended December 31, 2016, and our report dated February 23, 2017 expressed an unqualified opinion on those consolidated financial statements.
/s/ KPMG LLP
McLean, Virginia
February 23, 2017
85
PART III
ITEM 10. | DIRECTORS, EXECUTIVE OFFICERS AND CORPORATE GOVERNANCE |
Executive Officers of the Company
The following table sets forth information with respect to our executive officers:
Name | Age | Position and Background |
Robert Milkovich | 57 | President, Chief Executive Officer and Chief Operating Officer Robert Milkovich has served as President and Chief Executive Officer of the Company since November 2015 and has served as Chief Operating Officer since joining the Company in June 2014. Mr. Milkovich has over 25 years of leadership in the greater Washington, D.C. commercial real estate industry, as well as elsewhere in the country. Prior to joining the Company, he served, since 2012, as President and Head of the Investment Committee of Spaulding & Slye Investments, a comprehensive real estate services and investment company that is a wholly owned subsidiary of JLL. He also served as Regional Director of Archon Group, L.P., an investment arm of the Merchant Banking Division of Goldman Sachs, which he joined in 2004, where he spearheaded the asset management of $2 billion for their Merchant Bank, Special Situations Group, and other parts of the firm, in addition to generating investment opportunities. Mr. Milkovich also previously served as Market Managing Director for CarrAmerica Realty Corporation, a then publicly traded office REIT headquartered in Washington, D.C., with primary responsibilities including overseeing asset management, development activities, portfolio investments and acquisition efforts. He currently serves as a Director and Investment Committee member for the University System of Maryland Foundation. Mr. Milkovich is on the Board and Membership Committee of the Economic Club of Washington, D.C. and is a member of the Urban Land Institute’s Office Development Counsel, and was a past president of The Real Estate Group in Washington, D.C. Mr. Milkovich graduated with a Bachelor of Science degree in Business Administration from the University of Maryland. |
Andrew P. Blocher | 52 | Executive Vice President, Chief Financial Officer and Treasurer Andrew P. Blocher joined the Company in October 2012 as Executive Vice President, Chief Financial Officer and Treasurer. Mr. Blocher has over 20 years of finance and capital markets experience, including 15 years in the public REIT sector. Prior to joining the Company, Mr. Blocher was the Chief Financial Officer at Federal Realty Investment Trust (“NYSE: FRT”), a publicly traded retail REIT, where he had oversight of the finance, accounting, human resources, investor relations and information technology departments. Mr. Blocher joined Federal Realty Investment Trust in 2000 as Vice President, Investor Relations and was promoted to Senior Vice President in 2007 and to Chief Financial Officer in 2008. Mr. Blocher had served as Director, Structured Finance Marketing and Modeling, at Freddie Mac, as well as Vice President of Capital Markets for CRIIMI MAE Inc., a mortgage REIT. Mr. Blocher is a member of the National Association of Real Estate Investment Trusts (“NAREIT”). In addition, he currently serves as a member of the Board of Directors of Make-A-Wish® Mid-Atlantic, Inc. and serves as a member of its Executive Committee, as well as Chairman of its Audit and Finance Committee. Mr. Blocher received his Bachelor of Science degree in Finance from Indiana University in Bloomington and his Masters of Business Administration in Finance from The George Washington University. |
Samantha Sacks Gallagher | 40 | Executive Vice President, General Counsel and Secretary Samantha Sacks Gallagher joined the Company in October 2014 as Executive Vice President, General Counsel and Secretary. Ms. Gallagher serves as the Company’s chief legal officer and leads the Company’s corporate legal function. In her role, she has leadership responsibility for corporate governance matters, SEC and NYSE compliance, structuring of corporate-level transactions, overseeing litigation, as well as managing outside counsel. Ms. Gallagher has over 15 years of experience representing REITs and other real estate companies and financial institutions. Prior to joining the Company, Ms. Gallagher served as a Partner at Arnold & Porter LLP in the firm’s Corporate and Securities Practice. She also previously served as a Partner at Hogan Lovells US LLP in the firm’s Corporate, Capital Markets and REIT practice groups (having joined Hogan as a corporate attorney in 2001). While in private practice, Ms. Gallagher focused on capital markets transactions (including public and private equity and debt offerings), joint ventures, mergers and acquisitions and strategic investments, as well as advising companies in a variety of corporate and securities law matters. She currently serves on the Board of Directors for Make-A-Wish® Mid-Atlantic, Inc. where she is Chair of its Governance Committee and is a member of its Executive Committee. Ms. Gallagher received her Juris Doctor degree from Georgetown University Law Center, cum laude, and her Bachelor of Arts degree from Princeton University, summa cum laude. |
The information appearing in our definitive proxy statement to be filed in connection with our Annual Meeting of Shareholders to be held on May 23, 2017 (the “Proxy Statement”) under the headings “Proposal 1: Election of Trustees,” “Corporate Governance and Board Matters,” “Executive Officers” and “Other Matters—Section 16(a) Beneficial Ownership Reporting Compliance” is incorporated by reference herein.
86
ITEM 11. | EXECUTIVE COMPENSATION |
The information in the Proxy Statement under the headings “Compensation of Trustees,” “Compensation Discussion and Analysis,” “Compensation of Executive Officers,” “Compensation Committee Interlocks and Insider Participation” and “Compensation Committee Report” is incorporated by reference herein.
ITEM 12. | SECURITY OWNERSHIP OF CERTAIN BENEFICIAL OWNERS AND MANAGEMENT AND RELATED STOCKHOLDER MATTERS |
The information in the Proxy Statement under the headings “Share Ownership of Trustees and Executive Officers,” “Share Ownership by Certain Beneficial Owners” and “Equity Compensation Plan Information” is incorporated by reference herein.
ITEM 13. | CERTAIN RELATIONSHIPS AND RELATED TRANSACTIONS, AND DIRECTOR INDEPENDENCE |
The information in the Proxy Statement under the headings “Certain Relationships and Related Transactions” and “Corporate Governance and Board Matters” is incorporated by reference herein.
ITEM 14. | PRINCIPAL ACCOUNTING FEES AND SERVICES |
The information in the Proxy Statement under the heading “Principal Accountant Fees and Services” is incorporated by reference herein.
87
PART IV
ITEM 15. | EXHIBITS AND FINANCIAL STATEMENT SCHEDULES |
Financial Statements and Schedules
Reference is made to the Index to Financial Statements and Schedules on page 90 for a list of the financial statements and schedules included in this report. |
Exhibits
The exhibits required by Item 601 of Regulation S-K are listed in the Exhibit Index beginning on page 137 of this report, which is incorporated by reference herein. |
ITEM 16. | FORM 10-K SUMMARY |
None.
88
SIGNATURES
Pursuant to the requirements of Section 13 and 15(d) of the Securities Exchange Act of 1934, the registrant has duly caused this report to be signed on its behalf by the undersigned thereunto duly authorized, in the state of Maryland on February 23, 2017.
FIRST POTOMAC REALTY TRUST | ||
/s/ Robert Milkovich | ||
Robert Milkovich | ||
President, Chief Executive Officer and Chief Operating Officer | ||
Pursuant to the requirements of the Securities Exchange Act of 1934, this report has been signed by the following persons on behalf of the registrant and in the capacities indicated on February 23, 2017.
Signature | Title | |
/s/ Robert Milkovich | ||
Robert Milkovich | President, Chief Executive Officer and Chief Operating Officer (principal executive officer) | |
/s/ Andrew P. Blocher | ||
Andrew P. Blocher | Executive Vice President, Chief Financial Officer and Treasurer (principal financial officer) | |
/s/ Michael H. Comer | ||
Michael H. Comer | Senior Vice President and Chief Accounting Officer (principal accounting officer) | |
/s/ Terry L. Stevens | ||
Terry L. Stevens | Chairman of the Board of Trustees | |
/s/ Robert H. Arnold | ||
Robert H. Arnold | Trustee | |
/s/ Richard B. Chess | ||
Richard B. Chess | Trustee | |
/s/ James P. Hoffmann | ||
James P. Hoffmann | Trustee | |
/s/ Alan G. Merten | ||
Alan G. Merten | Trustee | |
/s/ Kati M. Penney | ||
Kati M. Penney | Trustee | |
/s/ Thomas E. Robinson | ||
Thomas E. Robinson | Trustee | |
89
FIRST POTOMAC REALTY TRUST
INDEX TO FINANCIAL STATEMENTS AND SCHEDULES
The following consolidated financial statements and schedule of First Potomac Realty Trust and Subsidiaries and report of our independent registered public accounting firm thereon are attached hereto:
FIRST POTOMAC REALTY TRUST AND SUBSIDIARIES | |
Page | |
FINANCIAL STATEMENT SCHEDULE | |
All other schedules are omitted because they are not applicable, or because the required information is included in the consolidated financial statements or notes thereto.
90
Report of Independent Registered Public Accounting Firm
The Board of Trustees and Shareholders
First Potomac Realty Trust:
We have audited the accompanying consolidated balance sheets of First Potomac Realty Trust and subsidiaries (the Company) as of December 31, 2016 and 2015, and the related consolidated statements of operations, comprehensive income (loss), equity, and cash flows for each of the years in the three‑year period ended December 31, 2016. In connection with our audits of the consolidated financial statements, we also have audited financial statement schedule of real estate and accumulated depreciation. These consolidated financial statements and financial statement schedule are the responsibility of the Company’s management. Our responsibility is to express an opinion on these consolidated financial statements and financial statement schedules based on our audits.
We conducted our audits in accordance with the standards of the Public Company Accounting Oversight Board (United States). Those standards require that we plan and perform the audit to obtain reasonable assurance about whether the financial statements are free of material misstatement. An audit includes examining, on a test basis, evidence supporting the amounts and disclosures in the financial statements. An audit also includes assessing the accounting principles used and significant estimates made by management, as well as evaluating the overall financial statement presentation. We believe that our audits provide a reasonable basis for our opinion.
In our opinion, the consolidated financial statements referred to above present fairly, in all material respects, the financial position of First Potomac Realty Trust and subsidiaries as of December 31, 2016 and 2015, and the results of their operations and their cash flows for each of the years in the three‑year period ended December 31, 2016, in conformity with U.S. generally accepted accounting principles. Also in our opinion, the related financial statement schedules, when considered in relation to the consolidated financial statements taken as a whole, present fairly, in all material respects, the information set forth therein.
We also have audited, in accordance with the standards of the Public Company Accounting Oversight Board (United States), First Potomac Realty Trust’s internal control over financial reporting as of December 31, 2016, based on criteria established in Internal Control - Integrated Framework (2013) issued by the Committee of Sponsoring Organizations of the Treadway Commission, and our report dated February 23, 2017 expressed an unqualified opinion on the effectiveness of the Company’s internal control over financial reporting.
/s/ KPMG LLP
McLean, Virginia
February 23, 2017
91
FIRST POTOMAC REALTY TRUST AND SUBSIDIARIES
Consolidated Balance Sheets
December 31, 2016 and 2015
(Amounts in thousands, except per share amounts)
2016 | 2015 | ||||||
Assets: | |||||||
Rental property, net | $ | 1,059,272 | $ | 1,130,266 | |||
Assets held-for-sale | 13,176 | 90,674 | |||||
Cash and cash equivalents | 14,144 | 13,527 | |||||
Escrows and reserves | 1,419 | 2,514 | |||||
Accounts and other receivables, net of allowance for doubtful accounts of $655 and $876, respectively | 6,892 | 9,868 | |||||
Accrued straight-line rents, net of allowance for doubtful accounts of $414 and $105, respectively | 42,745 | 36,888 | |||||
Notes receivable | — | 34,000 | |||||
Investment in affiliates | 49,392 | 48,223 | |||||
Deferred costs, net | 42,712 | 36,537 | |||||
Prepaid expenses and other assets | 5,389 | 6,950 | |||||
Intangible assets, net | 25,106 | 32,959 | |||||
Total assets | $ | 1,260,247 | $ | 1,442,406 | |||
Liabilities: | |||||||
Mortgage loans, net | $ | 296,212 | $ | 307,769 | |||
Unsecured term loan, net | 299,404 | 299,404 | |||||
Unsecured revolving credit facility, net | 141,555 | 116,865 | |||||
Liabilities held-for-sale | — | 1,513 | |||||
Accounts payable and other liabilities | 43,904 | 47,972 | |||||
Accrued interest | 1,537 | 1,603 | |||||
Rents received in advance | 6,234 | 6,003 | |||||
Tenant security deposits | 4,982 | 4,982 | |||||
Deferred market rent, net | 1,792 | 2,154 | |||||
Total liabilities | 795,620 | 788,265 | |||||
Noncontrolling interests in the Operating Partnership | 28,244 | 28,813 | |||||
Equity: | |||||||
Preferred Shares, $0.001 par value per share, 50,000 shares authorized; | |||||||
7.750% Series A Preferred Shares, $25 per share liquidation preference, 0 and 6,400 shares issued and outstanding, respectively | — | 160,000 | |||||
Common shares, $0.001 par value per share, 150,000 shares authorized; 58,319 and 57,718 shares issued and outstanding, respectively | 58 | 58 | |||||
Additional paid-in capital | 913,367 | 907,220 | |||||
Noncontrolling interests in a consolidated partnership | — | 800 | |||||
Accumulated other comprehensive loss | (844 | ) | (2,360 | ) | |||
Dividends in excess of accumulated earnings | (476,198 | ) | (440,390 | ) | |||
Total equity | 436,383 | 625,328 | |||||
Total liabilities, noncontrolling interests and equity | $ | 1,260,247 | $ | 1,442,406 | |||
See accompanying notes to consolidated financial statements.
92
FIRST POTOMAC REALTY TRUST AND SUBSIDIARIES
Consolidated Statements of Operations
Years ended December 31, 2016, 2015 and 2014
(Amounts in thousands, except per share amounts)
2016 | 2015 | 2014 | |||||||||
Revenues: | |||||||||||
Rental | $ | 129,225 | $ | 139,006 | $ | 128,226 | |||||
Tenant reimbursements and other | 31,109 | 33,840 | 33,426 | ||||||||
Total revenues | 160,334 | 172,846 | 161,652 | ||||||||
Operating expenses: | |||||||||||
Property operating | 38,554 | 44,093 | 43,252 | ||||||||
Real estate taxes and insurance | 19,808 | 19,745 | 17,360 | ||||||||
General and administrative | 16,976 | 25,450 | 21,156 | ||||||||
Acquisition costs | — | — | 2,681 | ||||||||
Depreciation and amortization | 60,862 | 66,624 | 61,796 | ||||||||
Impairment of rental property | 2,772 | 60,826 | 3,956 | ||||||||
Total operating expenses | 138,972 | 216,738 | 150,201 | ||||||||
Operating income (loss) | 21,362 | (43,892 | ) | 11,451 | |||||||
Other expenses (income): | |||||||||||
Interest expense | 26,370 | 26,797 | 24,696 | ||||||||
Interest and other income | (2,348 | ) | (6,794 | ) | (6,799 | ) | |||||
Equity in earnings of affiliates | (2,294 | ) | (1,825 | ) | (775 | ) | |||||
Loss (gain) on sale of rental property | 1,155 | (29,477 | ) | (21,230 | ) | ||||||
Loss on debt extinguishment / modification | 48 | 1,824 | — | ||||||||
Total other expenses (income) | 22,931 | (9,475 | ) | (4,108 | ) | ||||||
(Loss) income from continuing operations | (1,569 | ) | (34,417 | ) | 15,559 | ||||||
Discontinued operations: | |||||||||||
(Loss) income from operations | — | (975 | ) | 146 | |||||||
Loss on debt extinguishment | — | (489 | ) | — | |||||||
Gain on sale of rental property | — | 857 | 1,338 | ||||||||
(Loss) income from discontinued operations | — | (607 | ) | 1,484 | |||||||
Net (loss) income | (1,569 | ) | (35,024 | ) | 17,043 | ||||||
Less: Net loss (income) attributable to noncontrolling interests | 502 | 2,058 | (199 | ) | |||||||
Net (loss) income attributable to First Potomac Realty Trust | (1,067 | ) | (32,966 | ) | 16,844 | ||||||
Less: Dividends on preferred shares | (3,053 | ) | (12,400 | ) | (12,400 | ) | |||||
Less: Issuance costs on redeemed preferred shares | (5,515 | ) | — | — | |||||||
Net (loss) income attributable to common shareholders | $ | (9,635 | ) | $ | (45,366 | ) | $ | 4,444 | |||
Basic and diluted earnings per common share: | |||||||||||
(Loss) income from continuing operations | $ | (0.17 | ) | $ | (0.78 | ) | $ | 0.05 | |||
(Loss) income from discontinued operations | — | (0.01 | ) | 0.02 | |||||||
Net (loss) income | $ | (0.17 | ) | $ | (0.79 | ) | $ | 0.07 | |||
Weighted average common shares outstanding – basic | 57,581 | 57,982 | 58,150 | ||||||||
Weighted average common shares outstanding – diluted | 57,581 | 57,982 | 58,220 | ||||||||
See accompanying notes to consolidated financial statements.
93
FIRST POTOMAC REALTY TRUST AND SUBSIDIARIES
Consolidated Statements of Comprehensive Income (Loss)
Years ended December 31, 2016, 2015 and 2014
(Amounts in thousands)
2016 | 2015 | 2014 | |||||||||
Net (loss) income | $ | (1,569 | ) | $ | (35,024 | ) | $ | 17,043 | |||
Unrealized gain on derivative instruments | 1,584 | 1,317 | 1,289 | ||||||||
Unrealized loss on derivative instruments | — | (367 | ) | (696 | ) | ||||||
Total comprehensive income (loss) | 15 | (34,074 | ) | 17,636 | |||||||
Net loss (income) attributable to noncontrolling interests | 502 | 2,058 | (199 | ) | |||||||
Net gain from derivative instruments attributable to noncontrolling interests | (68 | ) | (42 | ) | (25 | ) | |||||
Comprehensive income (loss) attributable to First Potomac Realty Trust | $ | 449 | $ | (32,058 | ) | $ | 17,412 | ||||
See accompanying notes to consolidated financial statements.
94
FIRST POTOMAC REALTY TRUST AND SUBSIDIARIES
Consolidated Statements of Equity
Years ended December 31, 2016, 2015 and 2014
(Amounts in thousands)
Series A Preferred Shares | Common Shares | Additional Paid-in Capital | Noncontrolling Interests in Consolidated Partnerships | Accumulated Other Comprehensive Loss | Dividends in Excess of Accumulated Earnings | Total Equity | |||||||||||||||||||||
Balance at December 31, 2013 | $ | 160,000 | $ | 59 | $ | 911,533 | $ | 781 | $ | (3,836 | ) | $ | (329,246 | ) | $ | 739,291 | |||||||||||
Net income | — | — | — | — | — | 17,043 | 17,043 | ||||||||||||||||||||
Net unrealized gain on derivative instruments | — | — | — | — | 593 | — | 593 | ||||||||||||||||||||
Net income attributable to noncontrolling interests | — | — | — | — | (25 | ) | (199 | ) | (224 | ) | |||||||||||||||||
Dividends paid to common shareholders | — | — | — | — | — | (35,198 | ) | (35,198 | ) | ||||||||||||||||||
Dividends on preferred shares | — | — | — | — | — | (12,400 | ) | (12,400 | ) | ||||||||||||||||||
Accrued common dividends | — | — | — | — | — | (66 | ) | (66 | ) | ||||||||||||||||||
Restricted stock expense | — | — | 2,860 | — | — | — | 2,860 | ||||||||||||||||||||
Exercise of stock options | — | — | 174 | — | — | — | 174 | ||||||||||||||||||||
Stock option and employee stock purchase plan expense | — | — | 536 | — | — | — | 536 | ||||||||||||||||||||
Issuance of common stock, net of net settlements | — | — | (397 | ) | — | — | — | (397 | ) | ||||||||||||||||||
Adjustment of common Operating Partnership units to fair value | — | — | (1,424 | ) | — | — | — | (1,424 | ) | ||||||||||||||||||
Net contributions to noncontrolling interest in consolidated joint ventures | — | — | — | 117 | — | — | 117 | ||||||||||||||||||||
Balance at December 31, 2014 | 160,000 | 59 | 913,282 | 898 | (3,268 | ) | (360,066 | ) | 710,905 | ||||||||||||||||||
Net loss | — | — | — | (2 | ) | — | (35,024 | ) | (35,026 | ) | |||||||||||||||||
Net unrealized gain on derivative instruments | — | — | — | — | 950 | — | 950 | ||||||||||||||||||||
Net (income) loss attributable to noncontrolling interests | — | — | — | — | (42 | ) | 2,058 | 2,016 | |||||||||||||||||||
Dividends paid to common shareholders | — | — | — | — | — | (35,080 | ) | (35,080 | ) | ||||||||||||||||||
Dividends on preferred shares | — | — | — | — | — | (12,400 | ) | (12,400 | ) | ||||||||||||||||||
Accrued common dividends | — | — | — | — | — | 117 | 117 | ||||||||||||||||||||
Restricted stock expense | — | — | 3,442 | — | — | 5 | 3,447 | ||||||||||||||||||||
Exercise of stock options | — | — | 26 | — | — | — | 26 | ||||||||||||||||||||
Share repurchases | — | (1 | ) | (10,179 | ) | — | — | — | (10,180 | ) | |||||||||||||||||
Stock option and employee stock purchase plan expense | — | — | 1,245 | — | — | — | 1,245 | ||||||||||||||||||||
Issuance of common stock, net of net settlements | — | — | (1,393 | ) | — | — | — | (1,393 | ) | ||||||||||||||||||
Adjustment of common Operating Partnership units to fair value | — | — | 797 | — | — | — | 797 | ||||||||||||||||||||
Net distributions from noncontrolling interest in consolidated joint ventures | — | — | — | (96 | ) | — | — | (96 | ) | ||||||||||||||||||
Balance at December 31, 2015 | 160,000 | 58 | 907,220 | 800 | (2,360 | ) | (440,390 | ) | 625,328 | ||||||||||||||||||
Net loss | — | — | — | (74 | ) | — | (1,569 | ) | (1,643 | ) | |||||||||||||||||
Net unrealized gain on derivative instruments | — | — | — | — | 1,584 | — | 1,584 | ||||||||||||||||||||
Net (income) loss attributable to noncontrolling interests | — | — | — | — | (68 | ) | 502 | 434 | |||||||||||||||||||
Dividends paid to common shareholders | — | — | — | — | — | (26,137 | ) | (26,137 | ) | ||||||||||||||||||
Accrued common dividends | — | — | — | — | — | (36 | ) | (36 | ) | ||||||||||||||||||
Dividends on preferred shares | — | — | — | — | — | (3,053 | ) | (3,053 | ) | ||||||||||||||||||
Redemption of preferred shares | (160,000 | ) | — | 5,485 | — | — | (5,515 | ) | (160,030 | ) | |||||||||||||||||
Restricted stock expense | — | — | 1,964 | — | — | — | 1,964 | ||||||||||||||||||||
Stock option and employee stock purchase plan expense | — | — | 193 | — | — | — | 193 | ||||||||||||||||||||
Issuance of common stock, net of net settlements | — | — | 97 | — | — | — | 97 | ||||||||||||||||||||
Adjustment of common Operating Partnership units to fair value | — | — | (1,592 | ) | — | — | — | (1,592 | ) | ||||||||||||||||||
Net distributions from noncontrolling interest in consolidated joint venture | — | — | — | (726 | ) | — | — | (726 | ) | ||||||||||||||||||
Balance at December 31, 2016 | $ | — | $ | 58 | $ | 913,367 | $ | — | $ | (844 | ) | $ | (476,198 | ) | $ | 436,383 | |||||||||||
See accompanying notes to consolidated financial statements.
95
FIRST POTOMAC REALTY TRUST AND SUBSIDIARIES
Consolidated Statements of Cash Flows
Years ended December 31, 2016, 2015 and 2014
(Amounts in thousands)
2016 | 2015 | 2014 | |||||||||
Cash flow from operating activities: | |||||||||||
Net (loss) income | $ | (1,569 | ) | $ | (35,024 | ) | $ | 17,043 | |||
Adjustments to reconcile net (loss) income to net cash provided by operating activities: | |||||||||||
Discontinued operations: | |||||||||||
Gain on sale of rental property | — | (857 | ) | (1,338 | ) | ||||||
Depreciation and amortization | — | 1,222 | 3,665 | ||||||||
Depreciation and amortization | 61,896 | 67,729 | 62,843 | ||||||||
Stock based compensation | 2,314 | 4,865 | 3,731 | ||||||||
Bad debt expense | 830 | 580 | 1,110 | ||||||||
Amortization of deferred market rent | 301 | 138 | (14 | ) | |||||||
Amortization of financing costs and discounts | 1,588 | 1,482 | 1,445 | ||||||||
Equity in earnings of affiliates | (2,294 | ) | (1,825 | ) | (775 | ) | |||||
Distributions from investments in affiliates | 1,424 | 1,490 | 1,356 | ||||||||
Impairment of rental property | 2,772 | 60,826 | 3,956 | ||||||||
Loss (gain) on sale of rental property | 1,155 | (29,477 | ) | (21,230 | ) | ||||||
Loss on debt extinguishment / modification | — | 664 | — | ||||||||
Changes in assets and liabilities: | |||||||||||
Escrows and reserves | 784 | 296 | 4,693 | ||||||||
Accounts and other receivables | 2,453 | (7 | ) | 1,475 | |||||||
Accrued straight-line rents | (6,476 | ) | (8,722 | ) | (7,968 | ) | |||||
Prepaid expenses and other assets | 913 | 285 | 326 | ||||||||
Tenant security deposits | (748 | ) | (849 | ) | 677 | ||||||
Accounts payable and accrued expenses | 9,524 | 7,921 | 1,227 | ||||||||
Accrued interest | (68 | ) | (115 | ) | 56 | ||||||
Rents received in advance | (307 | ) | (1,767 | ) | 1,984 | ||||||
Deferred costs | (11,893 | ) | (8,473 | ) | (11,309 | ) | |||||
Total adjustments | 64,168 | 95,406 | 45,910 | ||||||||
Net cash provided by operating activities | 62,599 | 60,382 | 62,953 | ||||||||
Cash flows from investing activities: | |||||||||||
Investment in note receivable | — | — | (9,000 | ) | |||||||
Principal payments from note receivable | 34,000 | 29,720 | 176 | ||||||||
Proceeds from sale of rental property | 143,159 | 129,247 | 97,701 | ||||||||
Change in escrow and reserve accounts | 312 | 176 | — | ||||||||
Additions to rental property and furniture, fixtures and equipment | (45,068 | ) | (52,955 | ) | (39,338 | ) | |||||
Additions to construction in progress | (11,863 | ) | (20,895 | ) | (11,451 | ) | |||||
Acquisition of rental property and associated intangible assets | — | — | (150,731 | ) | |||||||
Investment in affiliates | (300 | ) | (405 | ) | (1,988 | ) | |||||
Distributions from investments in affiliates | — | — | 3,075 | ||||||||
Net cash provided by (used in) investing activities | 120,240 | 84,888 | (111,556 | ) | |||||||
Cash flows from financing activities: | |||||||||||
Financing costs | (319 | ) | (4,476 | ) | (870 | ) | |||||
Issuance of debt | 238,408 | 195,956 | 250,518 | ||||||||
Repayments of debt | (227,044 | ) | (277,108 | ) | (147,577 | ) | |||||
Contributions from consolidated joint venture partners | — | — | 213 | ||||||||
Distributions to consolidated joint venture partners | (726 | ) | (96 | ) | (96 | ) | |||||
Dividends to common shareholders | (26,137 | ) | (35,080 | ) | (35,198 | ) | |||||
Dividends to preferred shareholders | (4,603 | ) | (12,400 | ) | (12,400 | ) | |||||
Distributions to noncontrolling interests | (1,166 | ) | (1,574 | ) | (1,578 | ) | |||||
Repurchases of common shares | — | (10,180 | ) | — | |||||||
Redemption of preferred shares | (160,000 | ) | — | — | |||||||
Redemption of operating partnership units | (635 | ) | (134 | ) | — | ||||||
Proceeds from stock option exercises | — | 26 | 174 | ||||||||
Net cash (used in) provided by financing activities | (182,222 | ) | (145,066 | ) | 53,186 | ||||||
Net increase (decrease) in cash and cash equivalents | 617 | 204 | 4,583 | ||||||||
Cash and cash equivalents, beginning of year | 13,527 | 13,323 | 8,740 | ||||||||
Cash and cash equivalents, end of year | $ | 14,144 | $ | 13,527 | $ | 13,323 | |||||
See accompanying notes to consolidated financial statements.
96
FIRST POTOMAC REALTY TRUST AND SUBSIDIARIES
Consolidated Statements of Cash Flows - Continued
Years ended December 31, 2016, 2015 and 2014
Supplemental disclosure of cash flow information is as follows (amounts in thousands):
2016 | 2015 | 2014 | |||||||||
Cash paid for interest, net | $ | 24,550 | $ | 25,129 | $ | 23,083 | |||||
Non-cash investing and financing activities: | |||||||||||
Debt assumed in connection with the acquisition of rental property | — | — | 37,269 | ||||||||
Value of common shares retired to settle employee income tax obligation | 137 | 1,781 | 487 | ||||||||
Change in fair value of the outstanding common Operating Partnership units | 1,592 | (797 | ) | 1,424 | |||||||
Issuance of common Operating Partnership units in connection with the acquisition of rental property | — | — | 40 | ||||||||
Change in accruals: | |||||||||||
Additions to rental property and furniture, fixtures and equipment | (3,561 | ) | 795 | 653 | |||||||
Additions to development and redevelopment | (5,576 | ) | 4,408 | (275 | ) | ||||||
Cash paid for interest on indebtedness is net of capitalized interest of $0.7 million, $1.9 million and $3.2 million in 2016, 2015 and 2014, respectively.
During 2016, 2015 and 2014, certain of our employees surrendered common shares owned by them valued at $0.1 million, $1.8 million and $0.5 million, respectively, to satisfy their statutory minimum federal income tax obligations associated with the vesting of restricted common shares of beneficial interest.
Noncontrolling interests in First Potomac Realty Investment Limited Partnership, our operating partnership (the “Operating Partnership”) are presented at the greater of their fair value or their cost basis, which is comprised of their fair value at issuance, subsequently adjusted for the noncontrolling interests’ share of net income or losses available to common shareholders, other comprehensive income or losses, distributions received or additional contributions. We account for issuances of common Operating Partnership units individually, which could result in some portion of our noncontrolling interests being carried at fair value with the remainder being carried at historical cost. At December 31, 2016 and 2015, we recorded adjustments of $6.1 million and $4.0 million, respectively, to present certain common Operating Partnership units at the greater of their carrying value or redemption value.
No common Operating Partnership units were issued during 2016 or 2015. During 2014, we issued 3,125 common Operating Partnership units at a fair value of $40 thousand to the seller of 840 First Street, NE to satisfy our contingent consideration obligation related to the acquisition of the property.
At December 31, 2016, 2015 and 2014, we accrued $6.1 million, $9.9 million and $9.3 million, respectively, of capital expenditures related to rental property and furniture, fixtures and equipment in accounts payable. At December 31, 2016, 2015 and 2014, we accrued $0.1 million, $5.7 million and $1.3 million, respectively, of capital expenditures related to development and redevelopment in accounts payable.
97
FIRST POTOMAC REALTY TRUST AND SUBSIDIARIES
NOTES TO CONSOLIDATED FINANCIAL STATEMENTS
(1) Description of Business
First Potomac Realty Trust (the “Company”) is a leader in the ownership, management, redevelopment and development of office and business park properties in the greater Washington, D.C. region. The Company’s focus is owning and operating properties that it believes can benefit from its market knowledge and intensive operational skills with a focus on increasing their profitability and value. The Company’s portfolio primarily contains a mix of single-tenant and multi-tenant office properties and business parks. Office properties are single-story and multi-story buildings that are primarily for office use, and business parks contain buildings with office features combined with some industrial property space. The Company separates its properties into four distinct reporting segments, which it refers to as the Washington, D.C., Maryland, Northern Virginia and Southern Virginia reporting segments.
References in these consolidated financial statements to “we,” “our,” “us,” “the Company” or “First Potomac,” refer to the Company and its subsidiaries, on a consolidated basis, unless the context indicates otherwise.
We conduct our business through our Operating Partnership. We are the sole general partner of, and, as of December 31, 2016, owned 95.8% of the common interest in the Operating Partnership. The remaining common interests in the Operating Partnership, which are presented as noncontrolling interests in the Operating Partnership in the accompanying consolidated financial statements, are limited partnership interests that are owned by unrelated parties.
At December 31, 2016, we wholly owned properties totaling 6.7 million square feet and had a noncontrolling ownership interest in properties totaling an additional 0.9 million square feet through five unconsolidated joint ventures. We also owned land that can support 0.6 million square feet of additional development. Our consolidated properties were 92.6% occupied by 384 tenants at December 31, 2016. We do not include square footage of properties in development or redevelopment in our occupancy calculation. At December 31, 2016, none of our 6.7 million square feet owned through our properties was in development or redevelopment. We derive substantially all of our revenue from leases of space within our properties. As of December 31, 2016, our largest tenant was the U.S. Government, which accounted for 16% of our total annualized cash basis rent, and the U.S. Government combined with government contractors accounted for 27% of our total annualized cash basis rent as of December 31, 2016. We operate so as to qualify as a real estate investment trust (“REIT”) for federal income tax purposes.
For the year ended December 31, 2016, we had consolidated total revenues of $160.3 million and consolidated total assets of $1.3 billion. Financial information related to our four reporting segments is set forth in note 17, Segment Information, to our consolidated financial statements.
(2) Summary of Significant Accounting Policies
(a) Principles of Consolidation
Our consolidated financial statements include our accounts and the accounts of our Operating Partnership, which we consider to be a variable interest entity (“VIE”), and the subsidiaries in which we or our Operating Partnership has a controlling interest, which includes First Potomac Management, LLC, a wholly-owned subsidiary that manages the majority of our properties. All intercompany balances and transactions have been eliminated in consolidation.
(b) Use of Estimates
The preparation of consolidated financial statements in conformity with U.S. generally accepted accounting principles (“GAAP”) requires our management team to make a number of estimates and assumptions relating to the reported amounts of assets and liabilities and the disclosure of contingent assets and liabilities at the date of the consolidated financial statements and the reported amounts of revenues and expenses during the period. Estimates include the amount of accounts receivable that may be uncollectible, future cash flows, discount and capitalization rate assumptions used to fair value acquired properties and to test impairment of certain long-lived assets and goodwill, derivative valuations, market lease rates, lease-up periods, leasing and tenant improvement costs used to fair value intangible assets acquired and probability weighted cash flow analysis used to fair value contingent liabilities. Actual results could differ from those estimates.
98
(c) Revenue Recognition and Accounts Receivable
We generate substantially all of our revenue from leases on our properties. We recognize rental revenue on a straight-line basis over the term of our leases, which includes fixed-rate renewal periods leased at below market rates at acquisition or inception. Accrued straight-line rents represent the difference between rental revenue recognized on a straight-line basis over the term of the respective lease agreements and the rental payments contractually due for leases that contain abatement or fixed periodic increases. We consider current information, credit quality, historical trends, economic conditions and other events regarding the tenants’ ability to pay their obligations in determining if amounts due from tenants, including accrued straight-line rents, are ultimately collectible. The uncollectible portion of the amounts due from tenants, including accrued straight-line rents, is charged to “Property operating expense” in our consolidated statements of operations in the period in which the determination is made and to allowance for doubtful accounts in “Accounts and other receivables” and/or “Accrued straight-line rents” on our consolidated balance sheets. During 2016, 2015 and 2014, we incurred charges of $0.8 million, $0.6 million and $1.1 million, respectively, related to anticipated uncollectible amounts from tenants, including accrued straight-line rents. We consider similar criteria in assessing impairment associated with outstanding loans or notes receivable and whether any allowance for anticipated credit loss is appropriate.
Tenant leases generally contain provisions under which the tenants reimburse us for a portion of property operating expenses and real estate taxes incurred by us. Such reimbursements are recognized in the period in which the expenses are incurred. We record a provision for losses on estimated uncollectible accounts receivable based on our analysis of risk of loss on specific accounts. Lease termination fees are recognized on the date of termination when the related lease or portion thereof is cancelled, the collectability of the fee is reasonably assured and we have possession of the terminated space. We recognized lease termination fees included in “Tenant reimbursements and other revenues” in our consolidated statements of operations of $0.1 million, $0.1 million and $1.1 million for the years ended December 31, 2016, 2015 and 2014, respectively.
(d) Cash and Cash Equivalents
We consider all highly liquid investments with a maturity of 90 days or less at the date of purchase to be cash equivalents.
(e) Escrows and Reserves
Escrows and reserves represent cash restricted for debt service, real estate taxes, insurance, leasing commissions and tenant improvements. We reflect cash inflows and outflows from our escrows and reserves accounts related to debt service, real estate taxes, insurance and leasing commissions within net cash provided by operating activities and our cash inflows and outflows related to tenant improvements within net cash used by investing activities on our consolidated statements of cash flows.
(f) Deferred Costs
Leasing costs related to the execution of tenant leases and lease incentives are deferred and amortized ratably over the term of the related leases. Accumulated amortization of these combined costs was $26.3 million and $22.0 million at December 31, 2016 and 2015, respectively.
99
The following table sets forth scheduled future amortization for deferred leasing costs at December 31, 2016 (amounts in thousands):
Deferred Leasing(1) | Deferred Lease Incentive(2) | ||||||
2017 | $ | 5,464 | $ | 1,500 | |||
2018 | 4,915 | 1,473 | |||||
2019 | 4,118 | 1,399 | |||||
2020 | 3,363 | 1,327 | |||||
2021 | 2,649 | 1,265 | |||||
Thereafter | 6,689 | 6,006 | |||||
$ | 27,198 | $ | 12,970 | ||||
(1) | Excludes the amortization of $1.8 million of leasing costs that have yet to be placed in-service as the associated tenants have not moved into their related spaces and, therefore, the period over which the leasing costs will be amortized has yet to be determined. |
(2) | Excludes the amortization of $0.7 million of lease incentive costs that have yet to be placed in-service as the associated tenants have not moved into their related spaces and, therefore, the period over which the lease incentive costs will be amortized has yet to be determined. |
(g) Rental Property
Rental property is initially recorded at fair value, when acquired in a business combination, or initial cost when constructed or acquired in an asset purchase. Improvements and replacements are capitalized at cost when they extend the useful life, increase capacity or improve the efficiency of the asset. Repairs and maintenance are charged to expense when incurred. Depreciation and amortization are recorded on a straight-line basis over the estimated useful lives of the assets. The estimated useful lives of our assets, by class, are as follows:
Buildings | 39 years | ||
Building improvements | 5 to 20 years | ||
Furniture, fixtures and equipment | 5 to 15 years | ||
Tenant improvements | Shorter of the useful life of the asset or the term of the related lease | ||
We regularly review market conditions for possible impairment of a property’s carrying value. When circumstances such as adverse market conditions, changes in management’s intended holding period or potential sale to a third party indicate a possible impairment of the carrying value of a property, an impairment analysis is performed. We assess potential impairments based on an estimate of the future undiscounted cash flows (excluding interest charges) expected to result from the property’s use and eventual disposition. This estimate is based on projections of future revenues, expenses, capital improvement costs to maintain the operating capacity, expected holding periods and capitalization rates. These cash flows consider factors such as expected market trends and leasing prospects, as well as the effects of leasing demand, competition and other factors. If impairment exists due to the inability to recover the carrying value of a real estate investment based on forecasted undiscounted cash flows, an impairment loss is recorded to the extent that the carrying value exceeds the estimated fair value of the property. Further, we will record an impairment loss if we expect to dispose of a property in the near term, at a price below carrying value. In such an event, we will record an impairment loss based on the difference between a property’s carrying value and its projected sales price less any estimated costs to sell.
We will classify a building as held-for-sale in accordance with GAAP in the period in which we have made the decision to dispose of the building, our Board of Trustees or a designated delegate has approved the sale, there is a binding contract pursuant to which the buyer has significant money at risk, or high likelihood a binding agreement to purchase the property will be signed under which the buyer will be required to commit a significant amount of nonrefundable cash, and no significant financing contingencies exist that could cause the transaction not to be completed in a timely manner. We will cease recording depreciation on a building once it has been classified as held-for-sale. In the second quarter of 2014, we prospectively adopted Accounting Standards Update No. 2014-08, Reporting Discontinued Operations and Disclosures of Disposals of Components of an Entity
100
(“ASU 2014-08”), which impacts the presentation of operations and gains or losses from disposed properties and properties classified as held-for-sale. ASU 2014-08 states that a disposal of a component of an entity or a group of components of an entity is required to be reported in discontinued operations only if the disposal represents a strategic shift that has, or will have, a major effect on an entity’s operations or financial results. The operations of the following properties are reflected within discontinued operations in our consolidated statements of operations for all periods presented: (i) all properties that were sold prior to the adoption of ASU 2014-08; (ii) two properties (West Park and Patrick Center) that were classified as held-for-sale in previously issued financial statements prior to our adoption of ASU 2014-08 and were subsequently sold; and (iii) our Richmond, Virginia portfolio, which included Chesterfield Business Center, Hanover Business Center, Park Central, Virginia Technology Center and a three-acre parcel of undeveloped land (the “Richmond Portfolio”).
If the building does not qualify as a discontinued operation under ASU 2014-08, we will classify the building’s operating results, together with any impairment charges and any gains or losses on the sale of the building, in continuing operations for all periods presented in our consolidated statements of operations. We will classify the assets and liabilities related to the building as held-for-sale in our consolidated balance sheet for the period the held-for-sale criteria were met.
If the building does qualify as a discontinued operation under ASU 2014-08, we will classify the building’s operating results, together with any impairment charges and any gains or losses on the sale of the building, in discontinued operations in our consolidated statements of operations for all periods presented and classify the assets and liabilities related to the building as held-for-sale in our consolidated balance sheets for the periods presented. Interest expense is reclassified to discontinued operations only to the extent the disposed or held-for-sale property is secured by specific mortgage debt and the mortgage debt will not be assigned to another property owned by us after the disposition.
We recognize the fair value, if sufficient information exists to reasonably estimate the fair value, of any liability for conditional asset retirement obligations when assumed or incurred, which is generally upon acquisition, construction, development or redevelopment and/or through the normal operation of the asset.
We capitalize interest costs incurred on qualifying expenditures for real estate assets under development or redevelopment, which include our investments in assets owned through unconsolidated joint ventures that are under development or redevelopment, while being readied for their intended use in accordance with accounting requirements regarding capitalization of interest. We will capitalize interest when qualifying expenditures for the asset have been made, activities necessary to get the asset ready for its intended use are in progress and interest costs are being incurred. Capitalized interest also includes interest associated with expenditures incurred to acquire developable land while development activities are in progress. We also capitalize direct compensation costs of our construction personnel who manage the development and redevelopment projects, but only to the extent the employee’s time can be allocated to a project. Any portion of construction management costs not directly attributable to a specific project are recognized as general and administrative expense in the period incurred. We do not capitalize any other general and administrative costs such as office supplies, office rent expense or an overhead allocation to our development or redevelopment projects. Capitalized compensation costs were immaterial during 2016, 2015 and 2014. Capitalization of interest ends when the asset is substantially complete and ready for its intended use, but no later than one year from completion of major construction activity, if the property is not occupied. We place redevelopment and development assets into service at this time and commence depreciation upon the substantial completion of tenant improvements and the recognition of revenue. Capitalized interest is depreciated over the useful life of the underlying assets, commencing when those assets are placed into service.
(h) Purchase Accounting
Acquisitions of rental property, including any associated intangible assets, are measured at fair value at the date of acquisition. Any liabilities assumed or incurred are recorded at their fair value at the time of acquisition. The fair value of the acquired property is allocated between land and building (on an as-if vacant basis) based on management’s estimate of the fair value of those components for each type of property and to tenant improvements based on the depreciated replacement cost of the tenant improvements, which approximates their fair value. The fair value of the in-place leases is recorded as follows:
• | the fair value of leases in-place on the date of acquisition is based on absorption costs for the estimated lease-up period in which vacancy and foregone revenue are avoided due to the presence of the acquired leases; |
• | the fair value of above and below-market in-place leases based on the present value (using a discount rate that reflects the risks associated with the acquired leases) of the difference between the contractual rent amounts to be paid under the assumed lease and the estimated market lease rates for the corresponding spaces over the remaining non-cancelable terms of the related leases, which range from one to fourteen years; and |
• | the fair value of intangible tenant or customer relationships. |
101
Our determination of these fair values requires us to estimate market rents for each of the leases and make certain other assumptions. These estimates and assumptions affect the rental revenue, and depreciation and amortization expense recognized for these leases and associated intangible assets and liabilities.
(i) Investment in Affiliates
We may continue to grow our portfolio by entering into ownership arrangements with third parties for which we do not have a controlling interest. The structure of the arrangement may affect our accounting treatment as the entities may qualify as VIE based on disproportionate voting to equity interests, or other factors. In determining whether to consolidate an entity, we assess the structure and intent of the entity relationship as well its power to direct major decisions regarding the entity’s operations. When our investment in an entity meets the requirements for the equity method of accounting, we will record our initial investment in our consolidated balance sheets as “Investment in affiliates.” The initial investment in the entity is adjusted to recognize our share of earnings, losses, distributions received from the entity or additional contributions. Basis differences, if any, are recognized over the depreciable life of the venture’s assets as an adjustment to “Equity in (earnings) losses of affiliates” in our consolidated statements of operations. Our respective share of all earnings or losses from the entity will be recorded in our consolidated statements of operations as “Equity in (earnings) losses of affiliates.”
When we are deemed to have a controlling interest in a partially-owned entity, we will consolidate all of the entity’s assets, liabilities, operating results and cash flows within our consolidated financial statements. The cash contributed to the consolidated entity by the third party, if any, will be reflected in the permanent equity section of our consolidated balance sheets to the extent the associated ownership interests are not mandatorily redeemable. The amount will be recorded based on the third party’s initial investment in the consolidated entity and will be adjusted to reflect the third party’s share of earnings or losses in the consolidated entity and for any distributions received or additional contributions made by the third party. The earnings or losses from the entity attributable to the third party will be recorded in our consolidated statements of operations as a component of “Net loss (income) attributable to noncontrolling interests.”
(j) Sales of Rental Property
We account for sales of rental property in accordance with the requirements for full profit recognition, which occurs when the sale is consummated, the buyer has made adequate initial and continuing investments in the property, our receivable is not subject to future subordination, and we do not have substantial continuing involvement with the property. Once the requirements for full profit recognition are achieved, the related assets and liabilities are removed from the balance sheet and the resultant gain or loss is recorded in the period the sale is consummated. For sales transactions that do not meet the criteria for full profit recognition, we account for the transactions as partial sales or financing arrangements required by GAAP. For sales transactions with continuing involvement after the sale, if the continuing involvement with the property is limited by the terms of the sales contract, profit is recognized at the time of sale and is reduced by the maximum exposure to loss related to the nature of the continuing involvement. Sales to entities in which we have or receive an interest are accounted for as partial sales.
For sales transactions that do not meet sale criteria, we evaluate the nature of the continuing involvement, including put and call provisions, if present, and account for the transaction as a financing arrangement, profit-sharing arrangement, leasing arrangement or other alternate method of accounting rather than as a sale, based on the nature and extent of the continuing involvement. Some transactions may have numerous forms of continuing involvement. In those cases, we determine which method is most appropriate based on the substance of the transaction.
(k) Intangible Assets
Intangible assets include the fair value of acquired tenant or customer relationships and the fair value of in-place leases at acquisition. Customer relationship fair values are determined based on our evaluation of the specific characteristics of each tenant’s lease and our overall relationship with the tenant. Characteristics we consider include the nature and extent of our existing business relationships with the tenant, growth prospects for developing new business with the tenant, the tenant’s credit quality and expectations of lease renewals. The fair value of customer relationship intangible assets is amortized to expense over the lesser of the initial lease term and any expected renewal periods or the remaining useful life of the building. We determine the fair value of the in-place leases at acquisition by estimating the leasing commissions avoided by having in-place tenants and the operating income that would have not been recognized during the estimated time required to lease the space occupied by existing tenants at the acquisition date. The fair value attributable to existing tenants is amortized to expense over the initial term of the respective leases. Should a tenant terminate its lease, the unamortized portion of the in-place lease fair value is charged to expense by the date of termination.
102
Deferred market rent liability consists of the acquired leases with below-market rents at the date of acquisition. The fair value attributed to deferred market rent assets, which consist of above-market rents at the date of acquisition, is recorded as a component of deferred costs. Above and below-market lease fair values are determined on a lease-by-lease basis based on the present value (using a discounted rate that reflects the risks associated with the acquired leases) of the difference between the contractual rent amounts to be paid under the lease and the estimated market lease rates for the corresponding spaces over the remaining non-cancelable terms of the related leases including any below-market fixed rate renewal periods. The capitalized below-market lease fair values are amortized as an increase to rental revenue over the initial term and any below-market fixed-rate renewal periods of the related leases. Capitalized above-market lease fair values are amortized as a decrease to rental revenue over the initial term of the related leases.
In conjunction with our initial public offering and related formation transactions, First Potomac Management, Inc. contributed all of the capital interests in First Potomac Management LLC. The $2.1 million fair value of the in-place workforce acquired has been classified as goodwill and is included as a component of “Intangible assets, net” on the consolidated balance sheets. In 2011, we recognized additional goodwill of $4.8 million representing the residual difference between the consideration transferred for the purchase of 840 First Street, NE, which was acquired in March 2011, and the acquisition date fair value of the identifiable assets acquired and liabilities assumed and deferred taxes representing the difference between the fair value of acquired assets at acquisition and the carryover basis used for income tax purposes. In accordance with accounting requirements regarding goodwill and other intangibles, all acquired goodwill that relates to the operations of a reporting unit and is used in determining the fair value of a reporting unit is allocated to our appropriate reporting unit in a reasonable and consistent manner.
We assess goodwill for impairment annually at the end of our fiscal year and in interim periods if certain events occur indicating the carrying value may be impaired. We perform our analysis for potential impairment of goodwill in accordance with GAAP and are permitted to make a qualitative assessment of whether it is more likely than not that a reporting unit’s fair value is less than its carrying amount before applying the two-step goodwill impairment test for that reporting unit. We assess the impairment of our goodwill based on such qualitative factors as general economic conditions, industry and market conditions, market competiveness, overall financial performance (such as negative cash flows) and other entity specific events. As of December 31, 2016, we concluded that it was more likely than not that the fair value of our reporting units exceeded its carrying value, and as a result, we determined that it was unnecessary to perform any additional testing for goodwill impairment. No goodwill impairment losses were recognized during 2016, 2015 and 2014.
(l) Derivative Instruments
We are exposed to certain risks arising from business operations and economic factors. We use derivative financial instruments to manage exposures that arise from business activities in which our future exposure to interest rate fluctuations is unknown. The objective in the use of an interest rate derivative is to add stability to interest expenses and manage exposure to interest rate changes. We do not use derivatives for trading or speculative purposes and we intend to enter into derivative agreements only with counterparties that we believe have a strong credit rating to mitigate the risk of counterparty default or insolvency. No hedging activity can completely insulate us from the risks associated with changes in interest rates. Moreover, interest rate hedging could fail to protect us or adversely affect us because, among other things:
• | available interest rate hedging may not correspond directly with the interest rate risk for which we seek protection; |
• | the duration of the hedge may not match the duration of the related liability; |
• | the party owing money in the hedging transaction may default on its obligation to pay; and |
• | the credit quality of the party owing money on the hedge may be downgraded to such an extent that it impairs our ability to sell or assign its side of the hedging transaction. |
We may designate a derivative as either a hedge of the cash flows from a debt instrument or anticipated transaction (cash flow hedge) or a hedge of the fair value of a debt instrument (fair value hedge). All derivatives are recognized as assets or liabilities at fair value. For effective hedging relationships, the effective portion of the change in the fair value of the assets or liabilities is recorded within equity (cash flow hedge) or through earnings (fair value hedge). Ineffective portions of derivative transactions will result in changes in fair value recognized in earnings. For a cash flow hedge, we record our proportionate share of unrealized gains or losses on our derivative instruments associated with our unconsolidated joint ventures within equity and “Investment in affiliates” on our consolidated balance sheets. We incorporate credit valuation adjustments to appropriately reflect both our own nonperformance risk and the respective counterparty’s nonperformance risk in the fair value measurements. In adjusting the fair
103
value of our derivative contracts for the effect of nonperformance risk, we have considered the impact of netting any applicable credit enhancements, such as collateral postings, thresholds, mutual inputs and guarantees.
(m) Income Taxes
We have elected to be taxed as a REIT. To maintain our status as a REIT, we are required to distribute at least 90% of our ordinary taxable income annually to our shareholders and meet other organizational and operational requirements. As a REIT, we will not be subject to federal income tax and any non-deductible excise tax if we distribute at least 100% of our REIT taxable income to our shareholders. If we fail to qualify as a REIT in any taxable year, we will be subject to federal income tax on our taxable income at regular corporate tax rates. We have certain subsidiaries, including a taxable REIT subsidiary (“TRS”) and an entity that has elected to be taxed as a REIT (which indirectly owns 500 First Street, NW) that may be subject to federal, state or local taxes, as applicable. Our subsidiary REIT will not be subject to federal income tax so long as it meets the REIT qualification requirements and distributes 100% of its REIT taxable income to its shareholders. Our TRS was inactive in 2016, 2015 and 2014. See note 8, Income Taxes, for further information.
We account for deferred income taxes using the asset and liability method. Under this method, deferred income taxes are recognized for temporary differences between the financial reporting basis of assets and liabilities and their respective tax bases and for operating losses, capital losses and tax credit carryovers based on tax rates to be effective when amounts are realized or settled. We will recognize deferred tax assets only to the extent that it is more likely than not that they will be realized based on available evidence, including future reversals of existing temporary differences, future projected taxable income and tax planning strategies. We may recognize a tax benefit from an uncertain tax position when it is more-likely-than-not (defined as a likelihood of more than 50%) that the position will be sustained upon examination, including resolutions of any related appeals or litigation processes, based on the technical merits. If a tax position does not meet the more-likely-than-not recognition threshold, despite our belief that our filing position is supportable, the benefit of that tax position is not recognized in the statements of operations. We recognize interest and penalties, as applicable, related to unrecognized tax benefits as a component of income tax expense. We recognize unrecognized tax benefits in the period that the uncertainty is eliminated by either affirmative agreement of the uncertain tax position by the applicable taxing authority, or by expiration of the applicable statute of limitation. For the years ended December 31, 2016, 2015 and 2014, we did not have any uncertain tax positions.
(n) Share-Based Payments
We measure the cost of employee services received in exchange for an award of equity instruments based on the grant-date fair value of the award. For options awards, we use a Black-Scholes option-pricing model. Expected volatility is based on an assessment of our realized volatility over the preceding period that is equivalent to the award’s expected life. The expected term represents the period of time the options are anticipated to remain outstanding as well as our historical experience for groupings of employees that have similar behavior and considered separately for valuation purposes. For non-vested share awards that vest over a predetermined time period, we use the outstanding share price at the date of issuance to fair value the awards. For non-vested shares awards that vest based on market conditions, we use a Monte Carlo simulation (risk-neutral approach) to determine the value and derived service period of each tranche. The expense associated with the share-based awards will be recognized over the period during which an employee is required to provide services in exchange for the award – the requisite service period (usually the vesting period). The fair value for all share-based payment transactions are recognized as a component of income or loss from continuing operations.
(o) Notes Receivable
We record loans to owners of real estate properties, which can be collateralized by interest in the real estate property, as “Notes receivable” in our consolidated balance sheets. These loans are recorded net of any discount or issuance costs, which are amortized over the life of the respective note receivable using the effective interest method. We record interest earned from notes receivable and amortization of any discount costs or issuance costs within “Interest and other income” in our consolidated statements of operations.
We will establish a provision for anticipated credit losses associated with our notes receivable when we anticipate that we may be unable to collect any contractually due amounts. This determination is based upon such factors as delinquencies, loss experience, collateral quality and current economic or borrower conditions. Any estimated losses are recorded as a charge to earnings to establish an allowance for credit losses that we estimate to be adequate based on these factors. During the second quarter of 2016, we received the full repayment of a mezzanine loan with an outstanding principal balance of $34.0 million. We
104
did not have any notes receivable outstanding at December 31, 2016. Based on the review of the above criteria, we did not record an allowance for credit losses for our notes receivable during 2016, 2015 and 2014.
(p) Application of New Accounting Standards
In January 2016, we adopted Accounting Standards Update No. 2015-01, Simplifying Income Statement Presentation by Eliminating the Concept of Extraordinary Items (“ASU 2015-01”), which eliminates the concept of extraordinary items from GAAP and the requirement that an entity separately report extraordinary items in the income statement. ASU 2015-01 also requires that entities continue to evaluate whether items are unusual in nature or infrequent in occurrence for presentation and disclosure purposes. The adoption of ASU 2015-01 did not have a material impact on our consolidated financial statements and related disclosures.
In January 2016, we adopted ASU No. 2015-02, Amendments to the Consolidation Analysis (“ASU 2015-02”). This standard amends certain guidance applicable to the consolidation of various legal entities, including VIEs. In determining the method of accounting for partially owned joint ventures, we evaluate the characteristics of associated entities and determine whether an entity is a VIE and, if so, determine which party is the primary beneficiary by analyzing whether we have both the power to direct the entity's significant economic activities and the obligation to absorb potentially significant losses or receive potentially significant benefits. Significant judgments and assumptions inherent in this analysis include the nature of the entity's operations, the entity's financing and capital structure, and contractual relationship and terms, including consideration of governance and decision making rights. We consolidate a VIE when we have determined that we are the primary beneficiary.
We evaluated the application of ASU 2015-02 and concluded that no change was required to our accounting for any of our interests in less-than-wholly owned joint ventures. We continued to consolidate our joint venture in Storey Park, which was sold on July 25, 2016, as described in note 15(b), Noncontrolling Interests in a Consolidated Partnership, as it continued to meet the definition and certain criteria as a VIE in which we were considered to be the primary beneficiary.
Under ASU 2015-02, our Operating Partnership now meets the definition of a VIE, we are the primary beneficiary, and, accordingly, we continue to consolidate the Operating Partnership. Our sole significant asset is our investment in the Operating Partnership and, consequently, substantially all of our assets and liabilities represent assets and liabilities of the Operating Partnership. All of our debt is an obligation of the Operating Partnership and may only be settled with the assets of the Operating Partnership.
In January 2016, we adopted Accounting Standards Update No. 2015-03, Simplifying the Presentation of Debt Issuance Costs (“ASU 2015-03”), which requires debt issuance costs to be presented in the balance sheet as a direct deduction from the carrying value of the debt liability. ASU 2015-03 is applied on a retrospective basis, which resulted in the reclassification of our debt issuance costs from previously presented balances. The guidance did not have a material impact on our consolidated financial statements and related disclosures.
In January 2016, we adopted Accounting Standards Update No. 2015-16, Simplifying the Accounting for Measurement-Period Adjustments (“ASU 2015-16”), which eliminates the requirement for an acquirer to retrospectively adjust the financial statements for measurement-period adjustments that occur in periods after the acquisition of a business combination. The acquirer would instead recognize measurement-period adjustments in the reporting period in which the adjustment is identified. The adoption of ASU 2015-16 did not have a material impact on our consolidated financial statements and related disclosures.
In May 2014, the Financial Accounting Standards Board (“FASB”) issued Accounting Standards Update No. 2014-09, Revenue from Contracts with Customers (“ASU 2014-09”), which requires an entity to recognize the amount of revenue to which it expects to be entitled for the transfer of promised goods or services to customers and will replace most existing revenue recognition guidance when it becomes effective. In July 2015, the FASB deferred by one year the mandatory effective date of ASU 2014-09 from January 1, 2017 to January 1, 2018. Early adoption is permitted, but not prior to the original effective date of January 1, 2017. ASU 2014-09 permits the use of either the retrospective or cumulative effect transition method. We have begun to evaluate each of the revenue streams under the new model and the pattern of recognition is not expected to change significantly. We have not yet selected a transition method and are evaluating the impact that ASU 2014-09 will have on our consolidated financial statements and related disclosures.
In August 2014, the FASB issued Accounting Standards Update No. 2014-15, Disclosure of Uncertainties about an Entity’s Ability to Continue as a Going Concern (“ASU 2014-15”), which requires an entity to evaluate whether conditions or events, in the aggregate, raise substantial doubt about the entity’s ability to continue as a going concern for one year from the date the financial
105
statements are issued or are available to be issued. The guidance became effective for annual periods ending after December 15, 2016. The adoption of ASU 2014-15 is not expected to have an impact on our consolidated financial statements and related disclosures.
In January 2016, the FASB issued Accounting Standards Update No. 2016-01, Recognition and Measurement of Financial Assets and Financial Liabilities (“ASU 2016-01”), which requires, among other things, entities to use the exit price notion when measuring the fair value of financial instruments for disclosure purposes and eliminates the requirement for public business entities to disclose the method(s) and significant assumptions used to estimate the fair value disclosed for financial instruments measured at amortized cost on the balance sheet. ASU 2016-01 is effective for periods beginning after December 15, 2017; early adoption is not permitted. The guidance is not expected to have a material impact on our consolidated financial statements and related disclosures.
In February 2016, the FASB issued Accounting Standards Update No. 2016-02, Leases (“ASU 2016-02”), which requires a lessee to record on the balance sheet a right-of-use asset with a corresponding lease liability created by lease terms of more than 12 months. Additional qualitative and quantitative disclosures will also be required. The guidance will become effective for periods beginning after December 15, 2018 and will be applied using a modified retrospective transition method. We are currently evaluating the impact that ASU 2016-02 will have on our consolidated financial statements and related disclosures.
In March 2016, the FASB issued Accounting Standards Update No. 2016-09, Improvements to Employee Share-Based Payment Accounting (“ASU 2016-09”), which is intended to simplify several aspects of the accounting for employee share-based payment transactions, including income tax consequences, classification of awards as either equity or liabilities and classification on the statement of cash flows. The guidance became effective for periods beginning after December 15, 2016 and early adoption is permitted. ASU 2016-09 permits the use of the cumulative-effect and prospective methods. The guidance is not expected to have a material impact on our consolidated financial statements and related disclosures.
In August 2016, the FASB issued Accounting Standards Update No. 2016-15, Classification of Certain Cash Receipts and Cash Payments (“ASU 2016-15”). The guidance addresses eight classification issues related to the statement of cash flows, including debt prepayment or debt extinguishment costs and distributions received from equity-method investees. The guidance will become effective for periods beginning after December 15, 2017 and early adoption is permitted. ASU 2016-15 requires the use of a retrospective transition method to each period presented. If such retrospective transition is impracticable for certain issues, the adoption of ASU 2016-15 for the applicable issues may be applied prospectively as of the earliest date practicable. The guidance is not expected to have a material impact on our consolidated financial statements or related disclosures.
In October 2016, the FASB issued Accounting Standards Update No. 2016-17, Consolidation (Topic 810): Interests Held through Related Parties That Are under Common Control (“ASU 2016-17”), which requires a single decision maker or service provider, in evaluating whether it is the primary beneficiary, to consider on a proportionate basis indirect interests held through related parties under common control. ASU 2016-17 was effective for periods beginning after December 15, 2016. ASU 2016-17 requires the use of a retrospective transition method beginning with the earliest annual period in which ASU 2015-02 was adopted. The adoption of ASU 2016-17 will not have a material impact on our consolidated financial statements or related disclosures.
In November 2016, the FASB issued Accounting Standards Update No. 2016-18, Statement of Cash Flows (Topic 230): Restricted Cash (“ASU 2016-18”), which requires companies to include cash and cash equivalents that have restrictions on withdrawal or use in total cash and cash equivalents on the statement of cash flows. ASU 2016-18 is effective for periods beginning after December 15, 2017 and early adoption is permitted. The guidance is not expected to have a material impact on our consolidated financial statements and related disclosures.
(q) Reclassifications
Certain prior year asset and debt balances have been reclassified to conform to the current year presentation as a result of adopting ASU 2015-03 in January 2016, which requires debt issuance costs to be presented in the balance sheet as a direct deduction from the carrying value of the debt liability and which is applied on a retrospective basis. See note 2(p), Summary of Significant Accounting Policies - Application of New Accounting Standards for more information.
106
(3) Earnings Per Common Share
Basic earnings or loss per common share (“EPS”) is calculated by dividing net income or loss attributable to common shareholders by the weighted average common shares outstanding for the periods presented. Diluted EPS is computed after adjusting the basic EPS computation for the effect of dilutive common equivalent shares outstanding during the periods presented, which include stock options and non-vested shares. We apply the two-class method for determining EPS as our outstanding unvested shares with non-forfeitable dividend rights are considered participating securities. Our excess of distributions over earnings related to participating securities is shown as a reduction in total earnings attributable to common shareholders in our computation of EPS.
The following table sets forth the computation of our basic and diluted earnings per common share (amounts in thousands, except per share amounts):
2016 | 2015 | 2014 | |||||||||
Numerator for basic and diluted earnings per common share: | |||||||||||
(Loss) income from continuing operations | $ | (1,569 | ) | $ | (34,417 | ) | $ | 15,559 | |||
(Loss) income from discontinued operations | — | (607 | ) | 1,484 | |||||||
Net (loss) income | (1,569 | ) | (35,024 | ) | 17,043 | ||||||
Less: Net loss (income) from continuing operations attributable to noncontrolling interests | 502 | 2,032 | (135 | ) | |||||||
Less: Net loss (income) from discontinued operations attributable to noncontrolling interests | — | 26 | (64 | ) | |||||||
Net (loss) income attributable to First Potomac Realty Trust | (1,067 | ) | (32,966 | ) | 16,844 | ||||||
Less: Dividends on preferred shares | (3,053 | ) | (12,400 | ) | (12,400 | ) | |||||
Less: Issuance costs of redeemed preferred shares(1) | (5,515 | ) | — | — | |||||||
Net (loss) income attributable to common shareholders | (9,635 | ) | (45,366 | ) | 4,444 | ||||||
Less: Allocation to participating securities | (232 | ) | (241 | ) | (314 | ) | |||||
Net (loss) income attributable to common shareholders | $ | (9,867 | ) | $ | (45,607 | ) | $ | 4,130 | |||
Denominator for basic and diluted earnings per common share: | |||||||||||
Weighted average common shares outstanding – basic | 57,581 | 57,982 | 58,150 | ||||||||
Weighted average common shares outstanding – diluted | 57,581 | 57,982 | 58,220 | ||||||||
Basic and diluted earnings per common share: | |||||||||||
(Loss) income from continuing operations attributable to common shareholders | $ | (0.17 | ) | $ | (0.78 | ) | $ | 0.05 | |||
(Loss) income from discontinued operations attributable to common shareholders | — | (0.01 | ) | 0.02 | |||||||
Net (loss) income | $ | (0.17 | ) | $ | (0.79 | ) | $ | 0.07 | |||
(1) | Represents the original issuance costs associated with the redemption of 6.4 million 7.750% Series A Cumulative Redeemable Perpetual Preferred Shares (the “7.750% Series A Preferred Shares”) during the year ended December 31, 2016. |
In accordance with GAAP regarding earnings per common share, we did not include the following potential weighted average common shares in our calculation of diluted earnings per common share as they are anti-dilutive for the periods presented (amounts in thousands):
2016 | 2015 | 2014 | ||||||
Stock option awards | 960 | 1,020 | 1,122 | |||||
Non-vested share awards | 669 | 310 | 398 | |||||
1,629 | 1,330 | 1,520 | ||||||
107
(4) Rental Property
Rental property represents buildings and related improvements, net of accumulated depreciation, and developable land that are wholly owned or owned by an entity in which we have a controlling interest. All of our rental properties are located within the greater Washington, D.C. region. Rental property consists of the following at December 31 (dollars in thousands):
2016(1) | 2015(2) | ||||||
Land and land improvements | $ | 282,923 | $ | 280,149 | |||
Buildings and improvements | 824,867 | 793,184 | |||||
Construction in progress | 4,605 | 97,361 | |||||
Tenant improvements | 189,031 | 168,946 | |||||
Furniture, fixtures and equipment | 408 | 410 | |||||
1,301,834 | 1,340,050 | ||||||
Less: accumulated depreciation | (242,562 | ) | (209,784 | ) | |||
$ | 1,059,272 | $ | 1,130,266 | ||||
(1) | Excludes rental property totaling $13.2 million at December 31, 2016 related to One Fair Oaks, which was classified as held-for-sale at December 31, 2016 and was sold on January 9, 2017. |
(2) | Excludes rental property totaling $90.6 million at December 31, 2015 related to the NOVA Non-Core Portfolio (defined in note 9(a), Dispositions), which was classified as held-for-sale at December 31, 2015 and was sold on March 25, 2016. |
Depreciation of rental property is computed on a straight-line basis over the estimated useful lives of the assets. The estimated lives of our assets range from 5 to 39 years or, in the case of tenant improvements, the shorter of the useful life of the asset or the term of the underlying lease.
Development and Redevelopment Activity
We will place completed development and redevelopment assets in service upon the earlier of one year after major construction activity is deemed to be substantially complete or upon occupancy. We construct office buildings and/or business parks on a build-to-suit basis or with the intent to lease upon completion of construction. At December 31, 2016, we owned developable land that can accommodate 0.6 million square feet of additional building space, of which 34 thousand is located in the Washington, D.C. reporting segment, 0.1 million in the Maryland reporting segment, 0.4 million in the Northern Virginia reporting segment and 0.1 million in the Southern Virginia reporting segment.
During the third quarter of 2014, we signed a lease for 167,000 square feet at a to-be-constructed building (the “NOVA build-to-suit”) in our Northern Virginia reporting segment, which was on vacant land that we had in our portfolio. We substantially completed construction of the new building in the first quarter of 2016, and we substantially completed construction of the tenant improvements during the third quarter of 2016. We commenced revenue recognition in August 2016, at which time the building was placed in-service. At December 31, 2016, our total investment in the newly constructed building, excluding tenant improvements and leasing commission costs, was $35.0 million, which related to the costs of construction of the building and included the original cost basis of the applicable portion of the vacant land of $5.2 million.
On August 4, 2011, we formed a joint venture, in which we had a 97% interest, with an affiliate of Perseus Realty, LLC to acquire Storey Park in our Washington, D.C. reporting segment. At the time, the site was leased to Greyhound Lines, Inc. (“Greyhound”), which subsequently relocated its operations. Greyhound’s lease expired on August 31, 2013, at which time the property was placed into development with the anticipation of developing a mixed-use project on the 1.6 acre site, which could accommodate up to 712,000 square feet. On July 25, 2016, our consolidated joint venture sold Storey Park for a contractual purchase price of $54.5 million, which generated net proceeds of $52.7 million. In June 2016, we recorded a $2.8 million impairment charge based on the sales price, less estimated selling costs. On January 1, 2016, we ceased capitalizing expenses associated with the development project as we began marketing the property for sale. See note 9, Dispositions, for more information.
During 2016, other than the NOVA build-to-suit, we did not place in-service any completed development or redevelopment space. At December 31, 2016, we did not have any completed development or redevelopment space that had yet to be placed in-service.
108
(5) Investment in Affiliates
We own an interest in several joint ventures that own properties. We do not control the activities that are most significant to the joint ventures. As a result, the assets, the liabilities and the operating results of these noncontrolled joint ventures are not consolidated within our consolidated financial statements. Our investments in these joint ventures are recorded as “Investment in affiliates” on our consolidated balance sheets. Our investment in affiliates consisted of the following (dollars in thousands):
Reporting Segment | Ownership Interest | Investment at December 31, 2016 | Investment at December 31, 2015 | |||||||||
Prosperity Metro Plaza | Northern Virginia | 51 | % | $ | 26,414 | $ | 24,909 | |||||
1750 H Street, NW | Washington, D.C. | 50 | % | 14,625 | 15,168 | |||||||
Aviation Business Park(1) | Maryland | 50 | % | 5,941 | 5,899 | |||||||
Rivers Park I and II(1)(2) | Maryland | 25 | % | 2,413 | 2,247 | |||||||
$ | 49,392 | $ | 48,223 | |||||||||
(1) | In January 2017, the unconsolidated joint ventures that own these properties entered into a binding contract to sell Aviation Business Park and Rivers Park I and II, which are all located in our Maryland reporting segment. We anticipate completing the sale in March 2017; however, we can provide no assurances regarding the timing or pricing of such sale, or that such sale will ultimately occur. |
(2) | Rivers Park I and Rivers Park II are owned through two separate unconsolidated joint ventures. |
The following table provides a summary of the mortgage debt held by our unconsolidated joint ventures (dollars in thousands):
FPO Ownership | Effective Interest Rate | Maturity Date | Principal Balance at December 31, 2016(1) | Principal Balance at December 31, 2015(1) | ||||||||||
Rivers Park I and II(2) | 25% | LIBOR + 1.90%(3) | September 2017 | $ | 28,000 | $ | 28,000 | |||||||
1750 H Street, NW(4) | 50% | 3.92% | August 2024 | 32,000 | 32,000 | |||||||||
Prosperity Metro Plaza(5) | 51% | 3.91% | December 2029 | 50,000 | 50,000 | |||||||||
Weighted Average/Total | 3.60% | $ | 110,000 | $ | 110,000 | |||||||||
(1) | Reflects the entire balance of the debt secured by the properties, not our portion of the debt. |
(2) | The loan is repayable in full, without penalty, at any time during the term of the loan. Of the outstanding principal balance, $2.8 million is recourse to us. We believe the fair value of the potential liability to us related to the recourse debt is inconsequential as the likelihood of our need to perform under the debt agreement is remote. |
(3) | At December 31, 2016, LIBOR was 0.77%. All references to LIBOR in the financial statements refer to one-month LIBOR. |
(4) | The loan requires interest-only payments with a constant interest rate over the life of the loan. The loan is repayable in full, without penalty, on or after August 1, 2021. |
(5) | The loan requires interest-only payments through December 2024, at which time the loan requires principal and interest payments through its maturity date. The loan in repayable in full without penalty on or after June 1, 2029. |
109
The net assets of our unconsolidated joint ventures consisted of the following at December 31 (dollars in thousands):
2016 | 2015 | ||||||
Assets: | |||||||
Rental property, net | $ | 189,245 | $ | 193,243 | |||
Cash and cash equivalents | 9,887 | 5,992 | |||||
Other assets | 20,726 | 16,490 | |||||
Total assets | 219,858 | 215,725 | |||||
Liabilities: | |||||||
Mortgage loans, net (1)(2) | 109,372 | 109,273 | |||||
Other liabilities | 8,674 | 7,214 | |||||
Total liabilities | 118,046 | 116,487 | |||||
Net assets | $ | 101,812 | $ | 99,238 | |||
(1) | Of the total mortgage debt that encumbers our unconsolidated properties, $2.8 million is recourse to us. We believe the fair value of the potential liability to us under this guaranty is inconsequential as the likelihood of our need to perform under the debt agreement is remote. |
(2) | In the first quarter of 2016, our unconsolidated joint ventures adopted ASU 2015-03, which requires debt issuance costs to be presented on the balance sheet as a direct deduction from the carrying value of the respective debt liability and which is applied on a retrospective basis. Mortgage loans, net at December 31, 2016 and 2015 included $0.6 million and $0.7 million, respectively, of unamortized deferred financing costs. |
Our share of earnings or losses related to our unconsolidated joint ventures is recorded in our consolidated statements of operations as “Equity in earnings of affiliates.”
The following table summarizes the results of operations of our unconsolidated joint ventures at December 31, which, due to our varying ownership interests in the joint ventures and the varying operations of the joint ventures, may not be reflective of the amounts recorded in our consolidated statements of operations (dollars in thousands):
2016 | 2015 | 2014 | |||||||||
Total revenues | $ | 24,704 | $ | 24,255 | $ | 23,285 | |||||
Total operating expenses | (7,770 | ) | (7,660 | ) | (7,408 | ) | |||||
Net operating income | 16,934 | 16,595 | 15,877 | ||||||||
Depreciation and amortization | (8,044 | ) | (8,718 | ) | (9,893 | ) | |||||
Interest expense, net | (3,995 | ) | (3,909 | ) | (3,890 | ) | |||||
Provision for income taxes | — | — | (63 | ) | |||||||
Contingent consideration charge | — | — | 126 | ||||||||
Net income | $ | 4,895 | $ | 3,968 | $ | 2,157 | |||||
We earn various fees from several of our joint ventures, which include management fees, leasing commissions and construction management fees. We recognize fees only to the extent of the third party ownership interest in our unconsolidated joint ventures. We recognized fees from our unconsolidated joint ventures of $0.6 million, $0.7 million, and $0.7 million in 2016, 2015 and 2014, respectively, which are reflected within “Tenant reimbursements and other revenues” in our consolidated statements of operations.
(6) Notes Receivable
On June 2, 2016, the owners of 950 F Street, NW, a ten-story, 287,000 square-foot office/retail building located in Washington, D.C., prepaid a mezzanine loan that was secured by a portion of the owners’ interest in the property and had an outstanding balance of $34.0 million. The mezzanine loan, which had a fixed interest rate of 9.75% was scheduled to mature on April 1, 2017 and had been prepayable since December 21, 2015. In addition to the prepayment of the loan's entire principal balance, we received interest through June 24, 2016 and an exit fee upon the loan's prepayment. We recognized $0.2 million of accelerated income in the second quarter of 2016 related to the payment of the exit fee, which is reflected in “Interest and other income” in our consolidated statement of operations for the year ended December 31, 2016. We used the proceeds from the prepayment of the note receivable to redeem the remaining 0.6 million 7.750% Series A Preferred Shares outstanding and to pay down a portion of our unsecured revolving credit facility.
On February 24, 2015, the owners of America’s Square, a 461,000 square foot office complex located in Washington, D.C., prepaid a mezzanine loan that had an outstanding balance of $29.7 million. The loan had a fixed-interest rate of 9.0% and was scheduled to mature on May 1, 2016. With the prepayment of the loan, we received a yield maintenance payment of $2.4 million, which is reflected within “Interest and other income” on our consolidated statement of operations for the year ended December 31, 2015.
We recorded interest income related to our notes receivable of $1.6 million, $3.7 million and $6.1 million during 2016, 2015, and 2014, respectively, which is included within “Interest and other income” in our consolidated statements of operations.
110
(7) Intangible Assets and Deferred Market Rent Liabilities
Intangible assets and deferred market rent liabilities consisted of the following at December 31 (amounts in thousands):
2016 | 2015 | ||||||||||||||||||||||
Gross Intangibles | Accumulated Amortization | Net Intangibles | Gross Intangibles | Accumulated Amortization | Net Intangibles | ||||||||||||||||||
In-place leases | $ | 38,804 | $ | (25,423 | ) | $ | 13,381 | $ | 45,901 | $ | (26,961 | ) | $ | 18,940 | |||||||||
Customer relationships | 663 | (663 | ) | — | 663 | (601 | ) | 62 | |||||||||||||||
Leasing commissions | 9,499 | (5,882 | ) | 3,617 | 10,612 | (5,485 | ) | 5,127 | |||||||||||||||
Legal leasing fees | 299 | (193 | ) | 106 | 344 | (177 | ) | 167 | |||||||||||||||
Deferred market rent assets | 2,880 | (1,808 | ) | 1,072 | 3,558 | (1,825 | ) | 1,733 | |||||||||||||||
Goodwill | 6,930 | — | 6,930 | 6,930 | — | 6,930 | |||||||||||||||||
$ | 59,075 | $ | (33,969 | ) | $ | 25,106 | $ | 68,008 | $ | (35,049 | ) | $ | 32,959 | ||||||||||
Deferred market rent liability | $ | 4,173 | $ | (2,381 | ) | $ | 1,792 | $ | 4,869 | $ | (2,715 | ) | $ | 2,154 | |||||||||
We recognized $7.0 million, $10.6 million, and $10.3 million of amortization expense on intangible assets for the years ended December 31, 2016, 2015 and 2014, respectively. Through the net amortization of deferred market rent assets and deferred market rent liabilities, we recognized a $0.3 million reduction of rental revenue in 2016, a $0.1 million reduction of rental revenue in 2015 and an additional $14 thousand of revenue in 2014. Losses due to the termination of tenant leases and defaults, which resulted in the write-offs of all related lease-level and intangible assets, were $3.0 million, $0.5 million and $1.1 million during 2016, 2015 and 2014, respectively.
The projected net amortization of intangible assets and deferred market liabilities as of December 31, 2016 are as follows (amounts in thousands):
2017 | $ | 4,114 | |
2018 | 2,646 | ||
2019 | 2,361 | ||
2020 | 2,147 | ||
2021 | 1,463 | ||
Thereafter | 3,653 | ||
$ | 16,384 | ||
(8) Income Taxes
We own properties in Washington, D.C. that are subject to income-based franchise taxes at an effective rate of 9.975% as a result of conducting business in Washington, D.C. Our deferred tax assets and liabilities associated with our properties were primarily associated with differences in the GAAP and tax basis of rental property, particularly acquisition costs, but also included intangible assets and deferred market rent assets and liabilities that were associated with properties located in Washington, D.C. We will recognize deferred tax assets only to the extent that it is more likely than not that deferred tax assets will be realized based on consideration of available evidence, including future reversals of existing taxable temporary differences, future projected taxable income and tax planning strategies.
During the third quarter of 2012, there was a change in tax regulations in Washington, D.C. that required us to file a unitary tax return, which allowed for a deduction for dividends paid to shareholders. The change in tax regulations resulted in us prospectively measuring all of our deferred tax assets and deferred tax liabilities using the effective tax rate (0%) expected to be in effect as these timing differences reverse; therefore, we did not record a benefit from income taxes during 2016, 2015 or 2014. At both December 31, 2016 and 2015, we had recorded an estimated receivable of $1.2 million within “Accounts and other receivables” in our consolidated balance sheets for an expected tax refund associated with our 2011 tax payments and the estimated payments made in 2012 arising from the change in regulations in 2012. At December 31, 2016 and 2015, we did not have any recorded deferred tax assets or deferred tax liabilities. We also have interests in an unconsolidated joint venture that owns rental
111
property in Washington, D.C. that is subject to the franchise tax. The impact for income taxes related to this unconsolidated joint venture is reflected within “Equity in earnings of affiliates” in our consolidated statements of operations.
We did not record a valuation allowance against our deferred tax assets for any period presented. We did not recognize any deferred tax assets or liabilities as a result of uncertain tax positions and had no material net operating loss, capital loss or alternative minimum tax carryovers for any of the periods presented. There was no benefit or provision for income taxes associated with our discontinued operations for any of the periods presented.
As we believe we both qualify as a REIT and will not be subject to federal income tax, a reconciliation between the income tax provision calculated at the statutory federal income tax rate and the actual income tax provision has not been provided.
(9) Dispositions
During the second quarter of 2014, we prospectively adopted ASU 2014-08, which states that a component of an entity or a group of components of an entity is required to be reported in discontinued operations only if the disposal represents a strategic shift that has, or will have, a major effect on an entity’s operations and financial results. All other disposed properties will have their operating results reflected within continuing operations on our consolidated statements of operations for all periods presented.
We have had, and will have, no continuing involvement with any of our disposed properties subsequent to their disposal. The operations of the disposed properties were not subject to any income based taxes. Other than the properties discussed below in this note 9, Dispositions, we did not dispose of or enter into any agreements to sell any other properties during 2016, 2015 and 2014.
(a) Disposed or Held-for-Sale Properties within Continuing Operations
The following table is a summary of property dispositions or held-for-sale properties whose operating results are included in continuing operations in our consolidated statements of operations for the periods presented (dollars in thousands):
Reporting Segment | Disposition Date | Property Type | Square Feet | Net Sale Proceeds | ||||||||
One Fair Oaks(1) | Northern Virginia | 1/9/2017 | Office | 214,214 | $ | 13,255 | ||||||
Storey Park (2) | Washington, D.C. | 7/25/2016 | Land | — | 52,659 | |||||||
NOVA Non-Core Portfolio (3) | Northern Virginia | 3/25/2016 | Various | 945,745 | 90,501 | |||||||
Cedar Hill I and III | Northern Virginia | 12/23/2015 | Office | 102,632 | 25,939 | |||||||
Newington Business Park Center | Northern Virginia | 12/17/2015 | Industrial | 255,600 | 31,409 | |||||||
Rumsey Center | Maryland | 7/28/2015 | Business Park | 135,015 | 14,956 | |||||||
Owings Mills Business Park | Maryland | 10/16/2014 | Business Park | 180,475 | 12,417 | |||||||
Corporate Campus at Ashburn Center | Northern Virginia | 6/26/2014 | Business Park | 194,184 | 39,910 | |||||||
(1) | One Fair Oaks was classified as held-for-sale at December 31, 2016. |
(2) | This development site could have supported up to 712,000 rentable square feet. |
(3) | Consists of Van Buren Office Park, Herndon Corporate Center, Windsor at Battlefield, Reston Business Campus, Enterprise Center, Gateway Centre Manassas, Linden Business Center and Prosperity Business Center (collectively, the “NOVA Non-Core Portfolio”). |
At December 31, 2016, One Fair Oaks met our held-for-sale criteria and, therefore, the assets of the building were classified within “Assets held-for-sale” on our consolidated balance sheet. The assets classified within held-for-sale as of December 31, 2016 primarily consisted of $17.6 million in building and building improvements, $1.6 million of land and $6.0 million of accumulated depreciation. No material liabilities were classified as held-for-sale at December 31, 2016.
On July 25, 2016, we sold Storey Park, a development site located in our Washington, D.C reporting segment that was 97% owned by us through a consolidated joint venture, for net proceeds of $52.7 million. We used the proceeds from the sale to prepay, without penalty, the $22.0 million loan encumbering the Storey Park land (the “Storey Park Land Loan”), to make a distribution to our 3% joint venture partner for their allocable share of the joint venture’s net assets and to pay down a portion of the outstanding balance of our unsecured revolving credit facility.
112
At December 31, 2015, the NOVA Non-Core Portfolio met our held-for-sale criteria and, therefore, the assets of the buildings were classified within “Assets held-for-sale” and the liabilities of the buildings, which included one mortgage that was defeased in March 2016, were classified within “Liabilities held-for-sale” on our consolidated balance sheet. The majority of the assets classified within assets held-for-sale as of December 31, 2015 consisted of $25.2 million in land and land improvements, $88.0 million in buildings and building improvements, $14.4 million in tenant improvements and $37.0 million of accumulated depreciation. Assets held-for-sale also consisted of immaterial amounts of accrued straight-line rents, net of allowance for doubtful accounts, deferred costs, net of accumulated amortization, and prepaid expenses and other assets.
On February 17, 2017, we sold Plaza 500, a 503,000 square-foot office building located in Northern Virginia, for net proceeds of $72.5 million. The sale of Plaza 500 represented the divestiture of our last industrial property. We used the proceeds from the sale to pay down a portion of the outstanding balance under our unsecured revolving credit facility. Plaza 500 did not meet the criteria to be classified as held-for-sale at December 31, 2016.
In addition, in January 2017, the unconsolidated joint ventures that own Aviation Business Park and Rivers Park I and II entered into a binding contract to sell Aviation Business Park and Rivers Park I and II, which are all located in Maryland. We anticipate completing the sale in March 2017; however, we can provide no assurances regarding the timing or pricing of such sale, or that such sale will ultimately occur.
The following table summarizes the aggregate results of operations for the disposed or held-for-sale properties that are included in continuing operations for the periods presented (dollars in thousands):
2016 | 2015 | 2014 | |||||||||
Revenues | $ | 11,156 | $ | 29,773 | $ | 31,027 | |||||
Property operating expenses | (4,307 | ) | (10,353 | ) | (11,055 | ) | |||||
Depreciation and amortization | (1,070 | ) | (10,310 | ) | (11,289 | ) | |||||
Interest expense, net of interest income | (436 | ) | (465 | ) | (843 | ) | |||||
Loss on debt extinguishment | (48 | ) | — | — | |||||||
Impairment of rental property | (2,772 | ) | (60,826 | ) | — | ||||||
Income (loss) from operations of disposed property | 2,523 | (52,181 | ) | 7,840 | |||||||
(Loss) gain on sale of rental property | (1,155 | ) | 29,477 | 21,230 | |||||||
Net income (loss) from continuing operations | $ | 1,368 | $ | (22,704 | ) | $ | 29,070 | ||||
(b) Discontinued Operations
The following table is a summary of property dispositions whose operating results are reflected as discontinued operations in our consolidated statements of operations for the periods presented (dollars in thousands):
Reporting Segment | Disposition Date | Property Type | Square Feet | Net Sale Proceeds | ||||||||
Richmond Portfolio(1) | Southern Virginia | 3/19/2015 | Business Park | 827,900 | $ | 53,768 | ||||||
Patrick Center | Maryland | 4/16/2014 | Office | 66,269 | 10,888 | |||||||
West Park | Maryland | 4/2/2014 | Office | 28,333 | 2,871 | |||||||
Girard Business Center and Gateway Center | Maryland | 1/29/2014 | Business Park and Office | 341,973 | 31,616 | |||||||
(1) | Consists of Chesterfield Business Center, Hanover Business Center, Park Central, Virginia Technology Center and a three-acre parcel of undeveloped land. |
In March 2015, we sold our Richmond, Virginia portfolio, which was located in our Southern Virginia reporting segment. The Richmond Portfolio consisted of Chesterfield Business Center, Hanover Business Center, Park Central, Virginia Technology Center and a three-acre parcel of undeveloped land, and in the aggregate was comprised of 19 buildings totaling 827,900 square feet. With the sale of our Richmond Portfolio, we no longer owned any properties in the Richmond, Virginia area and had strategically exited the Richmond market. As such, in accordance with ASU 2014-08, our Richmond Portfolio was classified as held-for-sale at December 31, 2014 and the operating results of the Richmond Portfolio are reflected within discontinued operations for each of the periods presented.
113
The following table summarizes the results of operations of properties included in discontinued operations for the years ended December 31 (dollars in thousands):
2016 | 2015 | 2014 | |||||||||
Revenues | $ | — | $ | 877 | $ | 7,688 | |||||
Property operating expenses | — | (638 | ) | (3,612 | ) | ||||||
Depreciation and amortization | — | (1,222 | ) | (3,662 | ) | ||||||
Net interest income (expense) | — | 8 | (268 | ) | |||||||
(Loss) income from operations of disposed property | — | (975 | ) | 146 | |||||||
Loss on debt extinguishment | — | (489 | ) | — | |||||||
Gain on sale of rental property | — | 857 | 1,338 | ||||||||
Net (loss) income from discontinued operations | $ | — | $ | (607 | ) | $ | 1,484 | ||||
(10) Debt
Our borrowings consisted of the following at December 31 (dollars in thousands):
2016(1) | 2015(1)(2) | ||||||
Mortgage loans, net effective interest rates ranging from 4.22% to 6.01%, maturing at various dates through September 2030(3)(4) | $ | 296,212 | $ | 307,769 | |||
Unsecured term loan, net effective interest rates ranging from LIBOR plus 1.45% to LIBOR plus 1.80%, with staggered maturity dates ranging from December 2020 to December 2022(3) | 299,404 | 299,404 | |||||
Unsecured revolving credit facility, net effective interest rate of LIBOR plus 1.50%, maturing December 2019(3) | 141,555 | 116,865 | |||||
$ | 737,171 | $ | 724,038 | ||||
(1) | In the first quarter of 2016, we adopted ASU 2015-03, which requires debt issuance costs to be presented on the balance sheet as a direct deduction from the carrying value of the respective debt liability and is applied on a retrospective basis. The balances include a total of $6.2 million and $8.0 million of unamortized deferred financing costs at December 31, 2016 and 2015, respectively. |
(2) | Excludes $0.2 million of mortgage debt that was classified within “Liabilities held-for-sale” on our consolidated balance sheet at December 31, 2015. See note 9, Dispositions, for further discussion. |
(3) | At December 31, 2016, LIBOR was 0.77%. All references to LIBOR in the consolidated financial statements refer to one-month LIBOR. |
(4) | At December 31, 2016 and 2015, the mortgage loans balance includes two construction loans. At December 31, 2015, the mortgage loans balance includes two construction loans and the Storey Park Land Loan, which was repaid in July 2016. |
114
(a) Mortgage Loans
The following table provides a summary of our mortgage debt, which includes two construction loans and, for the year ended December 31, 2015, the Storey Park Land Loan (dollars in thousands):
Encumbered Property | Contractual Interest Rate | Effective Interest Rate | Maturity Date | December 31, 2016 | December 31, 2015 | |||||||||||
Storey Park Land Loan (1)(2) | LIBOR + 2.50% | LIBOR + 2.50% | October 2016 | $ | — | $ | 22,000 | |||||||||
Hillside I and II (3) | 5.75 | % | 4.62 | % | December 2016 | — | 12,368 | |||||||||
440 First Street, NW Construction Loan(1)(4) | LIBOR + 2.50% | LIBOR + 2.50% | May 2017 | 32,216 | 32,216 | |||||||||||
Redland II & III | 4.20 | % | 4.64 | % | November 2017 | 63,214 | 64,543 | |||||||||
Northern Virginia Construction Loan(1)(5) | LIBOR + 1.85% | LIBOR + 1.85% | September 2019 | 34,584 | 9,176 | |||||||||||
840 First Street, NE | 5.72 | % | 6.01 | % | July 2020 | 35,201 | 35,888 | |||||||||
Battlefield Corporate Center | 4.26 | % | 4.40 | % | November 2020 | 3,353 | 3,526 | |||||||||
1211 Connecticut Avenue, NW | 4.22 | % | 4.47 | % | July 2022 | 28,503 | 29,110 | |||||||||
1401 K Street, NW | 4.80 | % | 4.93 | % | June 2023 | 35,556 | 36,224 | |||||||||
11 Dupont Circle, NW | 4.05 | % | 4.22 | % | September 2030 | 66,780 | 66,780 | |||||||||
Principal balance | 4.41 | % | (6) | 299,407 | 311,831 | |||||||||||
Unamortized fair value adjustments | — | 172 | ||||||||||||||
Unamortized deferred financing costs(7) | (3,195 | ) | (4,234 | ) | ||||||||||||
Total balance, net | $ | 296,212 | $ | 307,769 | ||||||||||||
Debt Classified within Liabilities Held-for-Sale | ||||||||||||||||
Gateway Centre Manassas Building I(8) | 7.35 | % | 5.88 | % | November 2016 | $ | — | $ | 212 | |||||||
Unamortized fair value adjustments | — | 1 | ||||||||||||||
Total balance, net | $ | — | $ | 213 | ||||||||||||
(1) | At December 31, 2016, LIBOR was 0.77%. |
(2) | The Storey Park Land Loan encumbered the Storey Park land and was entered into by our 97% owned consolidated joint venture that owned Storey Park. On July 25, 2016, our consolidated joint venture sold Storey Park and the Storey Park Land Loan was concurrently repaid with proceeds from the sale. |
(3) | On October 6, 2016, we used available cash to prepay, without penalty, the Hillside I and II loan. |
(4) | This construction loan (the “440 First Street, NW Construction Loan”) is collateralized by 440 First Street, NW. In May 2016, we extended the maturity date by one year to May 30, 2017. We can repay all or a portion of the construction loan, without penalty, at any time during the term of the loan. At December 31, 2016, per the terms of the loan agreement, 50% of the outstanding principal balance and all of the outstanding accrued interest were recourse to us. |
(5) | This construction loan has a borrowing capacity of up to $43.7 million and is collateralized by the NOVA build-to-suit (the “Northern Virginia Construction Loan”), which was placed in-service in August 2016. We can repay all or a portion of the Northern Virginia Construction loan, without penalty, at any time during the term of the loan. |
(6) | Represents the weighted average interest rate on total mortgage debt. |
(7) | In the first quarter of 2016, we adopted ASU 2015-03, which requires debt issuance costs to be presented on the balance sheet as a direct deduction from the carrying value of the respective debt liability and is applied on a retrospective basis. |
(8) | The mortgage loan that encumbered Gateway Centre Manassas, which was included in the NOVA Non-Core Portfolio and sold on March 25, 2016, was classified within “Liabilities held-for-sale” on our December 31, 2015 consolidated balance sheet. In February 2016, we used $0.2 million in available cash to defease the outstanding balance of the mortgage loan. |
Northern Virginia Construction Loan
On September 1, 2015, we entered into the Northern Virginia Construction Loan, which is collateralized by the NOVA build-to-suit (which was placed in-service in August 2016). The loan has a borrowing capacity of up to $43.7 million, of which we borrowed $34.6 million and $9.2 million at December 31, 2016 and 2015, respectively. The loan has a variable interest rate of LIBOR plus a spread of 1.85% and matures on September 1, 2019. We can repay all or a portion of the Northern Virginia Construction Loan, without penalty, at any time during the term of the loan.
115
With the exception of the 440 First Street, NW Construction Loan, our mortgage debt is recourse solely to specific assets. We had 8 and 11 consolidated properties that secured mortgage debt at December 31, 2016 and 2015, respectively.
We have originated the following mortgage and construction loans since January 1, 2015 (dollars in thousands):
Month | Year | Property | Effective Interest Rate | Principal Balance at December 31, 2016 | |||||||
September | 2015 | Northern Virginia Construction Loan | LIBOR + 1.85% | (1) | $ | 34,584 | (2) | ||||
August | 2015 | 11 Dupont Circle, NW | 4.22% | 66,780 | |||||||
(1) | At December 31, 2016, LIBOR was 0.77% . |
(2) | The loan has a borrowing capacity of up to $43.7 million, of which we borrowed $25.4 million and $9.2 million during 2016 and 2015, respectively. |
We have repaid the following mortgage and land loans since January 1, 2015 (dollars in thousands):
Month | Year | Property | Effective Interest Rate | Principal Balance Repaid | |||||||
October | 2016 | Hillside I and II | 4.62 | % | $ | 12,199 | |||||
August | 2016 | Storey Park Land Loan | LIBOR + 2.50% | (1) | 22,000 | ||||||
February | 2016 | Gateway Centre Manassas | 5.88 | % | 174 | ||||||
July | 2015 | Jackson National Life Loan | 5.19 | % | 64,230 | ||||||
March | 2015 | Hanover Business Center Building D | 6.63 | % | 65 | ||||||
March | 2015 | Chesterfield Business Center Buildings C,D,G and H | 6.63 | % | 202 | ||||||
March | 2015 | Hanover Business Center Building C | 6.63 | % | 460 | ||||||
March | 2015 | Chesterfield Business Center Buildings A,B,E and F | 6.63 | % | 1,584 | ||||||
March | 2015 | Airpark Business Center | 6.63 | % | 864 | ||||||
(1) | At December 31, 2016, LIBOR was 0.77% . |
(b) Unsecured Term Loan and Unsecured Revolving Credit Facility
On December 4, 2015, we amended, restated and consolidated our unsecured revolving credit facility and our unsecured term loan. The amendments extended the maturity date of the unsecured term loan’s three $100 million tranches to December 2020, June 2021 and December 2022 from October 2018, October 2019 and October 2020, respectively and the maturity date of the unsecured revolving credit facility to December 2019 from October 2017, with two, six-month extensions at our option. As part of the amendments, we reduced the interest rate spreads on our unsecured term loan and our unsecured revolving credit facility, reduced the capitalization rates used to calculate gross asset value in the financial covenants and amended the covenant package to more closely align with our corporate goals. During the fourth quarter of 2015, the Company incurred $1.8 million of debt modification charges related to amending and restating the unsecured revolving credit facility and unsecured term loan.
116
The table below shows the outstanding balances and the interest rates of the three tranches of the $300.0 million unsecured term loan at December 31, 2016 and 2015 (dollars in thousands):
Maturity Date | Interest Rate(1) | December 31, 2016 | December 31, 2015 | ||||||||
Tranche A | December 2020 | LIBOR + 1.45% | $ | 100,000 | $ | 100,000 | |||||
Tranche B | June 2021 | LIBOR + 1.45% | 100,000 | 100,000 | |||||||
Tranche C | December 2022 | LIBOR + 1.80% | 100,000 | 100,000 | |||||||
Total | 300,000 | 300,000 | |||||||||
Unamortized deferred financing costs (2) | (596 | ) | (596 | ) | |||||||
Total, net | $ | 299,404 | $ | 299,404 | |||||||
(1) | At December 31, 2016, LIBOR was 0.77%. The interest rate spread is subject to change based on our maximum total indebtedness ratio. For more information, see note 10(e), Debt – Financial Covenants. |
(2) | In the first quarter of 2016, we adopted ASU-2015-03, which requires debt issuance costs to be presented on the balance sheet as a direct deduction from the carrying value of the respective debt liability and is applied on a retrospective basis. |
The weighted average borrowings outstanding under the unsecured revolving credit facility were $154.9 million with a weighted average interest rate of 1.9% during 2016 compared with $165.5 million and 1.9%, respectively, during 2015. Our maximum outstanding borrowings were $204.0 million and $218.0 million during 2016 and 2015, respectively. At December 31, 2016, outstanding borrowings under the unsecured revolving credit facility were $144.0 million with a weighted average interest rate of 2.2%. Our outstanding borrowings under the unsecured revolving credit facility do not include $2.4 million of unamortized deferred financing costs that are deducted from the facility’s balance in the December 31, 2016 consolidated balance sheet in accordance with ASU 2015-03, which we adopted in the first quarter of 2016. At December 31, 2016, LIBOR was 0.77% and the applicable spread on our unsecured revolving credit facility was 150 basis points. The available capacity under the unsecured revolving credit facility was $150.9 million as of the date of this filing. We are required to pay a commitment fee at an annual rate of 0.15% of the unused capacity if our usage exceeds 50% of our total capacity under the revolving credit facility, or 0.25% if our usage does not exceed 50%. For more information, see note 10(e) Debt – Financial Covenants. As of December 31, 2016, we were in compliance with all the financial covenants of the unsecured revolving credit facility.
(d) Interest Rate Swap Agreements
At December 31, 2016, we fixed LIBOR, at a weighted average interest rate of 1.4%, on $240.0 million of our variable rate debt through nine interest rate swap agreements. In July 2016, two swaps that together fixed LIBOR at a weighted average interest rate of 1.8% on $60.0 million of variable rate debt expired. See note 11, Derivative Instruments, for more information about our interest rate swap agreements.
(e) Financial Covenants
The credit agreement governing our unsecured revolving credit facility and unsecured term loan contains various restrictive covenants, including with respect to liens, indebtedness, investments, distributions, mergers and asset sales. The agreement also includes customary events of default, the occurrence of which, following any applicable cure period, would permit the lenders to, among other things, declare the principal, accrued interest and other obligations under the agreement to be immediately due and payable
Our outstanding corporate debt agreements contain specific financial covenants that may impact future financing decisions made by us or may be impacted by a decline in operations. These covenants relate to our allowable leverage, minimum tangible net worth, fixed charge coverage and other financial metrics. As of December 31, 2016, we were in compliance with the covenants of our amended, restated and consolidated unsecured revolving credit facility and unsecured term loan, the 440 First Street, NW Construction Loan and the Northern Virginia Construction Loan.
Our continued ability to borrow under the unsecured revolving credit facility is subject to compliance with financial and operating covenants, and a failure to comply with any of these covenants could result in a default under the credit facility. These debt agreements also contain cross-default provisions that would be triggered if we were in default under other loans, including mortgage loans, in excess of certain amounts. In the event of a default, the lenders could accelerate the timing of payments under the debt obligations and we may be required to repay such debt with capital from other sources, which may not be available on attractive terms, or at all, which would have a material adverse effect on our liquidity, financial condition, results of operations and ability to make distributions to our shareholders.
117
Our unsecured revolving credit facility and unsecured term loan are subject to interest rate spreads that float based on the quarterly measurement of our maximum consolidated total indebtedness to gross asset value ratio. Based on our leverage ratio at December 31, 2016, the applicable interest rate spreads on the unsecured revolving credit facility and the unsecured term loan will remain unchanged.
(f) Aggregate Debt Maturities
Our aggregate debt maturities as of December 31, 2016, are as follows (dollars in thousands):
Debt Maturities | |||
2017 | $ | 97,672 | |
2018 | 2,354 | ||
2019 | 181,055 | ||
2020 | 137,203 | ||
2021 | 101,598 | ||
Thereafter | 223,525 | ||
Total contractual principal balance | $ | 743,407 | |
Financing costs related to long-term debt are deferred and amortized over the remaining life of the debt using the effective interest method. These costs are presented as a direct deduction from the carrying value of the respective debt liability (dollars in thousands).
Deferred Financing Costs | |||
2017 | $ | 1,540 | |
2018 | 1,399 | ||
2019 | 1,365 | ||
2020 | 400 | ||
2021 | 400 | ||
Thereafter | 1,132 | ||
Total deferred financing costs | $ | 6,236 | |
(11) Derivative Instruments
Our interest rate swap agreements are designated as cash flow hedges and we record the effective portion of any unrealized gains associated with the change in fair value of the swap agreements within “Accumulated other comprehensive loss” and “Prepaid expenses and other assets” and the effective portion of any unrealized losses within “Accumulated other comprehensive loss” and “Accounts payable and other liabilities” on our consolidated balance sheets. We record our proportionate share of any unrealized gains or losses on our cash flow hedges associated with our unconsolidated joint ventures within “Accumulated other comprehensive loss” and “Investment in affiliates” on our consolidated balance sheets. We record any gains or losses incurred as a result of each interest rate swap agreement’s fixed rate deviating from our respective loan’s contractual rate within “Interest expense” in our consolidated statements of operations. We did not have any material ineffectiveness associated with our cash flow hedges in 2016, 2015 and 2014.
118
We enter into interest rate swap agreements to hedge our exposure on our variable rate debt against fluctuations in prevailing interest rates. The interest rate swap agreements fix LIBOR to a specified interest rate; however, the swap agreements do not affect the contractual spreads associated with each variable debt instrument’s applicable interest rate. At December 31, 2016, we fixed LIBOR at a weighted average interest rate of 1.4% on $240.0 million of our variable rate debt through nine interest rate swap agreements that are summarized below (dollars in thousands):
Maturity Date | Notional Amount | Interest Rate Contractual Component | Fixed LIBOR Interest Rate | ||||||
July 2017 | $ | 30,000 | LIBOR | 2.093 | % | ||||
July 2017 | 30,000 | LIBOR | 2.093 | % | |||||
July 2017 | 25,000 | LIBOR | 1.129 | % | |||||
July 2017 | 12,500 | LIBOR | 1.129 | % | |||||
July 2017 | 50,000 | LIBOR | 0.955 | % | |||||
July 2018 | 12,500 | LIBOR | 1.383 | % | |||||
July 2018 | 30,000 | LIBOR | 1.660 | % | |||||
July 2018 | 25,000 | LIBOR | 1.394 | % | |||||
July 2018 | 25,000 | LIBOR | 1.135 | % | |||||
Total/Weighted Average | $ | 240,000 | 1.442 | % | |||||
In July 2016, two swap agreements that together fixed LIBOR at a weighted average interest rate of 1.8% on $60.0 million of variable rate debt expired.
Amounts reported in “Accumulated other comprehensive loss” on our consolidated balance sheet at December 31, 2016 related to derivatives will be reclassified to “Interest expense” on our consolidated statements of operations as interest payments are made on our variable-rate debt. We reclassified accumulated other comprehensive losses as an increase to interest expense of $2.8 million, $4.0 million and $4.1 million in 2016, 2015 and 2014, respectively. At December 31, 2016, we estimated that $0.9 million of our accumulated other comprehensive loss will be reclassified as an increase to interest expense over the following twelve months.
(12) Fair Value Measurements
Our application of GAAP outlines a valuation framework and creates a fair value hierarchy, which distinguishes between assumptions based on market data (observable inputs) and a reporting entity’s own assumptions about market data (unobservable inputs). The required disclosures increase the consistency and comparability of fair value measurements and the related disclosures. Fair value is identified, under the standard, as the price that would be received to sell an asset or paid to transfer a liability between willing third parties at the measurement date (an exit price). In accordance with GAAP, certain assets and liabilities must be measured at fair value, and we provide the necessary disclosures that are required for items measured at fair value as outlined in the accounting requirements regarding fair value.
Financial assets and liabilities, as well as those non-financial assets and liabilities requiring fair value measurement, are measured using inputs from three levels of the fair value hierarchy.
The three levels are as follows:
Level 1 - Inputs are quoted prices (unadjusted) in active markets for identical assets or liabilities that we have the ability to access at the measurement date. An active market is defined as a market in which transactions for the assets or liabilities occur with sufficient frequency and volume to provide pricing information on an ongoing basis.
Level 2 - Inputs include quoted prices for similar assets and liabilities in active markets, quoted prices for identical or similar assets or liabilities in markets that are not active (markets with few transactions), inputs other than quoted prices that are observable for the asset or liability (i.e., interest rates, yield curves, etc.), and inputs derived principally from or corroborated by observable market data correlation or other means (market corroborated inputs).
119
Level 3 - Unobservable inputs, only used to the extent that observable inputs are not available, reflect our assumptions about the pricing of an asset or liability.
In accordance with accounting provisions and the fair value hierarchy described above, the following table shows the fair value of our consolidated assets and liabilities that are measured on a non-recurring and recurring basis as of December 31, 2016 and 2015 (dollars in thousands):
Balance at December 31, 2016 | Level 1 | Level 2 | Level 3 | ||||||||||||
Recurring Measurements: | |||||||||||||||
Derivative instrument-swap liabilities | $ | 906 | $ | — | $ | 906 | $ | — | |||||||
Balance at December 31, 2015 | Level 1 | Level 2 | Level 3 | ||||||||||||
Non-recurring Measurements: | |||||||||||||||
Impaired real estate assets | $ | 104,625 | $ | — | $ | 90,625 | $ | 14,000 | |||||||
Recurring Measurements: | |||||||||||||||
Derivative instrument-swap liabilities | 2,491 | — | 2,491 | — | |||||||||||
We did not re-measure or complete any transactions involving non-financial assets or non-financial liabilities that are measured at fair value on a recurring basis during the years ended December 31, 2016 and 2015. Also, no transfers into or out of fair value measurement levels for assets or liabilities that are measured on a recurring basis occurred during the years ended December 31, 2016 and 2015.
Impairment of Rental Property
We regularly review market conditions for possible impairment of a property’s carrying value. When circumstances such as adverse market conditions, changes in management’s intended holding period or potential sale to a third party indicate a possible impairment of a property, an impairment analysis is performed.
In March 2016, we sold our NOVA Non-Core Portfolio, which is located in our Northern Virginia reporting segment. Based on the anticipated sales price, less estimated selling costs, we recorded an impairment charge of $26.9 million for the fourth quarter of 2015, and we recorded an additional loss on the sale of $1.2 million in the first quarter of 2016. See note 9, Dispositions for more information.
CACI International, which fully leased One Fair Oaks in our Northern Virginia reporting segment, had a lease that terminated on December 31, 2016. In connection with our fourth quarter reporting for 2015, we evaluated the potential loss of cash flow at One Fair Oaks and the anticipated challenges of re-leasing the property, and as a result, we recorded an impairment charge of $33.9 million to bring the property to its estimated fair value. We estimated the fair value of the property using a discounted cash flow analysis and comparable sales information. In our analysis, we estimated the future net cash flows from the property using an income-based valuation of the building as vacant. The expected useful life and holding period was based on the age of the property and our current plan for the property as well as experience with similar properties. The capitalization rate was estimated using rates from external market research and comparable market transactions, and the discount rate was estimated using a risk adjusted rate of return. On January 9, 2017, we sold One Fair Oaks for net proceeds of $13.3 million. See note 9, Dispositions for more information.
We incurred impairment charges of $2.8 million, $60.8 million and $4.0 million during 2016, 2015 and 2014, respectively. The total impairment charges incurred during 2016 related to our sale of Storey Park in July 2016 and during 2015 related to the aforementioned NOVA Non-Core Portfolio and One Fair Oaks, which are all reflected within continuing operations in our consolidated statements of operations. The $4.0 million of impairment charges incurred during 2014 related to disposed properties that are reflected within continuing operations on our consolidated statements of operations. See note 9, Dispositions, for more information.
120
Interest Rate Derivatives
At December 31, 2016, we had hedged $240.0 million of our variable rate debt through nine interest rate swap agreements. See note 11, Derivative Instruments, for more information about our interest rate swap agreements.
The interest rate derivatives are fair valued based on prevailing market yield curves on the measurement date and also incorporate credit valuation adjustments to appropriately reflect both our own nonperformance risk and the respective counterparty’s nonperformance risk in the fair value measurements. In adjusting the fair value of our derivative contracts for the effect of nonperformance risk, we have considered the impact of netting any applicable credit enhancements, such as collateral postings, thresholds, mutual inputs and guarantees. We use a third party to assist in valuing our interest rate swap agreements. A daily “snapshot” of the market is taken to obtain close of business rates. The snapshot includes over 7,500 rates including LIBOR fixings, Eurodollar futures, swap rates, exchange rates, treasuries, etc. This market data is obtained via direct feeds from Bloomberg and Reuters and from Inter-Dealer Brokers. The selected rates are compared to their historical values. Any rate that has changed by more than normal mean and related standard deviation would be considered an outlier and flagged for further investigation. The rates are then compiled through a valuation process that generates daily valuations, which are used to value our interest rate swap agreements. Our interest rate swap derivatives are effective cash flow hedges and the effective portion of the change in fair value is recorded in the equity section of our consolidated balance sheets as “Accumulated other comprehensive loss.”
Financial Instruments
The carrying amounts of cash equivalents, accounts and other receivables, accounts payable and other liabilities, with the exception of any items listed above, approximate their fair values due to their short-term maturities. We determine the fair value of our notes receivable and debt instruments by discounting future contractual principal and interest payments using prevailing market rates for securities with similar terms and characteristics at the balance sheet date. We deem the fair value measurement of our debt instruments as a Level 2 measurement as we use quoted interest rates for similar debt instruments to value our debt instruments. We also use quoted market interest rates for similar notes to value our notes receivable, which we consider a Level 2 measurement as we do not believe notes receivable trade in an active market.
The carrying amount and estimated fair value of our notes receivable and debt instruments at December 31 are as follows (amounts in thousands):
2016 | 2015 | ||||||||||||||
Carrying Value(1) | Fair Value | Carrying Value(1) | Fair Value | ||||||||||||
Financial Assets: | |||||||||||||||
Notes receivable(2) | $ | — | $ | — | $ | 34,000 | $ | 34,000 | |||||||
Financial Liabilities: | |||||||||||||||
Mortgage debt(3) | $ | 299,407 | $ | 300,927 | $ | 312,216 | $ | 298,541 | |||||||
Unsecured term loan | 300,000 | 300,000 | 300,000 | 300,000 | |||||||||||
Unsecured revolving credit facility | 144,000 | 144,000 | 120,000 | 120,000 | |||||||||||
Total | $ | 743,407 | $ | 744,927 | $ | 732,216 | $ | 718,541 | |||||||
(1) | In the first quarter of 2016, we adopted ASU 2015-03, which requires debt issuance costs to be presented in the balance sheet as a direct deduction from the carrying value of the respective debt liability and which is applied on a retrospective basis. The debt balances exclude a combined total of $6.2 million and $8.0 million of unamortized deferred financing costs at December 31, 2016 and 2015, respectively. |
(2) | The note receivable was prepaid on June 2, 2016. See note 5, Notes Receivable, for more information regarding the prepayment of the note receivable. |
(3) | Includes $0.2 million of mortgage debt that was classified within “Liabilities held-for-sale” on our consolidated balance sheet at December 31, 2015. See note 9, Dispositions for more information. |
121
(13) Commitments and Contingencies
(a) Operating Leases
Our rental properties are subject to non-cancelable operating leases generating future minimum contractual rent payments due from tenants, which as of December 31, 2016 are as follows (dollars in thousands):
Future minimum contractual rent payments | |||
2017 | $ | 114,009 | |
2018 | 106,865 | ||
2019 | 96,101 | ||
2020 | 82,139 | ||
2021 | 66,787 | ||
Thereafter | 195,825 | ||
$ | 661,726 | ||
Our consolidated properties were 92.6% occupied by 384 tenants at December 31, 2016. We do not include square footage of properties in development or redevelopment in our occupancy calculation. At December 31, 2016, none of our 6.7 million square feet owned through our properties was in development or redevelopment.
We rent office space for our corporate headquarters under a non-cancelable operating lease, which we entered into in 2005. The lease agreement for our corporate headquarters will expire on January 31, 2021.
During the fourth quarter of 2012, we subleased 5,000 square feet of our corporate office space to one tenant, which commenced in January 2013. Subsequent to commencement of the sublease, we entered into two amendments to the sublease, which expanded the subleased premise by 4,000 square feet with the last sublease amendment commencing in December 2015. The subtenant’s lease will expire in January 2018.
Rent expense incurred under the terms of the corporate office leases, net of subleased revenue, was $1.5 million, $1.6 million and $1.8 million for the years ended December 31, 2016, 2015 and 2014.
Future minimum rental payments under our corporate office leases as of December 31, 2016 are summarized as follows, net of sublease revenue (dollars in thousands):
Future minimum rent payments | |||
2017 | $ | 1,469 | |
2018 | 1,906 | ||
2019 | 1,995 | ||
2020 | 2,049 | ||
2021 | 175 | ||
$ | 7,594 | ||
(b) Legal Proceedings
We are subject to legal proceedings and claims arising in the ordinary course of our business, for which, we carry various forms of insurance to protect the Company. In the opinion of our management and legal counsel, the amount of ultimate liability with respect to these claims will not have a material impact on our financial position, results of operations or cash flows.
122
(c) Capital Commitments
As of December 31, 2016, we had contractual construction in progress obligations, which included amounts accrued at December 31, 2016, of $3.1 million. The amount of contractual construction in progress obligations are primarily related to development activities at 540 Gaither Road at Redland in our Maryland reporting segment. As of December 31, 2016, we had contractual rental property and furniture, fixtures and equipment obligations of $5.5 million outstanding, which included amounts accrued at December 31, 2016. The amount of contractual rental property and furniture, fixtures and equipment obligations at December 31, 2016 are related to tenant improvement and capital improvement costs for various properties across our reporting segments, including significant tenant improvements at Atlantic Corporate Park and capital improvements at 11 Dupont Circle, NW. We anticipate meeting our contractual obligations related to our construction activities with cash from our operating activities. In the event cash from our operating activities is not sufficient to meet our contractual obligations, we can access additional capital through our unsecured revolving credit facility.
We remain liable, solely to the extent of our proportionate ownership percentage, to fund any capital shortfalls or commitments from properties owned through unconsolidated joint ventures.
We have various obligations to certain local municipalities associated with our development projects that will require completion of specified site improvements, such as sewer and road maintenance, grading and other general landscaping work. As of December 31, 2016, we remained liable to those local municipalities for $2.3 million in the event that we do not complete the specified work. We intend to complete the site improvements in satisfaction of these obligations.
(d) Insurance
We carry insurance coverage on our properties with policy specifications and insured limits that we believe are adequate given the relative risk of loss, cost of the coverage and standard industry practice. However, certain types of losses (such as from terrorism, earthquakes and floods) may be either uninsurable or not economically insurable. Further, certain of the properties are located in areas that are subject to earthquake activity and floods. Should a property sustain damage as a result of a terrorist act, earthquake or flood, we may incur losses due to insurance deductibles, co-payments on insured losses or uninsured losses. Should an uninsured loss occur, we could lose some or all of our capital investment, cash flow and anticipated profits related to one or more properties.
123
(14) Equity
In December 2015, our Board of Trustees authorized the redemption of some or all of our 6.4 million outstanding 7.750% Series A Preferred Shares. On January 19, 2016 and April 27, 2016, we used proceeds from dispositions to redeem 2.2 million shares and 3.6 million shares, respectively, of our 7.750% Series A Preferred Shares at a redemption price of $25.00 per share, plus accrued dividends up to the applicable dates of redemption. On July 6, 2016, we used proceeds from the repayment of the 950 F Street, NW mezzanine loan to redeem the remaining 0.6 million outstanding shares of our 7.750% Series A Preferred Shares at a redemption price of $25.00 per share, plus accrued dividends up to the date of redemption. The 7.750% Series A Preferred Shares (NYSE: FPO-PA) were delisted from trading on the New York Stock Exchange (the “NYSE”) upon redemption of the remaining 0.6 million outstanding shares on July 6, 2016.
In July 2015, our Board of Trustees authorized a share repurchase program that allowed us to acquire up to five million of our common shares of beneficial interest from time to time through July 2016 in open market transactions at prevailing prices or in negotiated private transactions. We were not obligated to acquire any particular amount of common shares and the share repurchase program was subject to suspension by the Board of Trustees at any time. During 2015, we repurchased 924,198 shares at a weighted average share price of $10.99 for a total purchase price of $10.2 million, utilizing proceeds from dispositions. During the year ended December 31, 2016, we did not repurchase any common shares under the share repurchase program. We are no longer authorized to repurchase common shares under the previously authorized share repurchase program, which expired at the end of July 2016.
We declared and paid total dividends of $0.45 per common share to common shareholders during 2016 and $0.60 per common share to common shareholders during both 2015 and 2014. During 2016, we declared and paid accrued dividends at a rate of 7.750% on the $25 face value per share of our 7.750% Series A Preferred Shares. The 7.750% Series A Preferred Shares were redeemed during 2016 with the last redemption occurring on July 6, 2016, at which time our 7.750% Series A Preferred Shares were delisted from the NYSE. All 7.750% Series A Preferred Shares redeemed during 2016 received a payment of dividends accrued up to, but not including, their applicable date of redemption. We declared and paid dividends of $1.9375 per share on our Series A Preferred Shares during both 2015 and 2014. On January 24, 2017, we declared a dividend of $0.10 per common share, equating to an annualized dividend of $0.40 per common share. The dividend was paid on February 15, 2017 to common shareholders of record as of February 8, 2017. Dividends on all non-vested share awards are recorded as a reduction of shareholders’ equity. For each dividend paid by us on our common shares and, when applicable, preferred shares, the Operating Partnership distributes an equivalent distribution on our common and preferred Operating Partnership units, respectively.
Our unsecured revolving credit facility and unsecured term loan, the 440 First Street, NW Construction Loan and the Northern Virginia Construction Loan contain certain restrictions that include, among other things, requirements to maintain specified coverage ratios and other financial covenants, which may limit our ability to make distributions to our common and preferred shareholders, except for distributions required to maintain our qualification as a REIT.
For federal income tax purposes, dividends paid to shareholders may be characterized as ordinary income, return of capital or capital gains. The characterization of the dividends declared on our common and preferred shares for 2016, 2015 and 2014 are as follows:
Common Shares | Preferred Shares | ||||||||||||||||
2016 | 2015 | 2014 | 2016 | 2015 | 2014 | ||||||||||||
Ordinary income(1) | — | % | 52.01 | % | 72.42 | % | — | % | 72.89 | % | 100.00 | % | |||||
Return of capital | 100.00 | % | 28.64 | % | 27.58 | % | 100.00 | % | — | % | — | % | |||||
Capital gains | — | % | 19.35 | % | — | % | — | % | 27.11 | % | — | % | |||||
(1) | The dividends classified above as ordinary income do not represent “qualified dividend income” and, therefore, are not eligible for reduced rates. |
(15) Noncontrolling Interests
(a) Noncontrolling Interests in the Operating Partnership
Noncontrolling interests relate to the common interests in the Operating Partnership not owned by us. Interests in the Operating Partnership are owned by limited partners who contributed buildings and other assets to the Operating Partnership in exchange for common Operating Partnership units. Limited partners have the right to tender their units for redemption in exchange for, at
124
our option, our common shares on a one-for-one basis or cash based on the fair value of our common shares at the date of redemption. Unitholders receive a distribution per unit equivalent to the dividend per common share. Differences between amounts paid to redeem noncontrolling interests and their carrying values are charged or credited to equity. As a result of the redemption feature of the Operating Partnership units, the noncontrolling interests are recorded outside of permanent equity.
Noncontrolling interests are presented at the greater of their fair value or their cost basis, which is comprised of their fair value at issuance, subsequently adjusted for the noncontrolling interests’ share of net income or losses available to common shareholders, other comprehensive income or losses, distributions received or additional contributions. We account for issuances of common Operating Partnership units individually, which could result in some portion of our noncontrolling interests being carried at fair value with the remainder being carried at historical cost. Based on the closing price of our common shares at December 31, 2016, the cost to acquire, through cash purchase or issuance of our common shares, all of the outstanding common Operating Partnership units not owned by us would be $27.9 million. At December 31, 2016 and 2015, we recorded adjustments of $6.1 million and $4.0 million, respectively, to present certain common Operating Partnership units at the greater of their carrying value or redemption value.
We owned 95.8% of the outstanding common Operating Partnership units at December 31, 2016 and 95.7% of the outstanding common Operating Partnership units at December 31, 2015 and 2014.
At December 31, 2016, 2,545,602 of the total common Operating Partnership units, or 4.2%, were not owned by us. During 2016 and 2015, 73,467 and 11,508 common Operating Partnership units, respectively were redeemed with available cash. There were no common Operating Partnership units redeemed for cash in 2014. No common Operating Partnership units were redeemed for common shares in 2016, 2015 or 2014. During the first quarter of 2014, we issued 3,125 common Operating Partnership units to the seller of 840 First Street, NE to satisfy a contingent consideration obligation related to the acquisition of the property.
The redeemable noncontrolling interests in the Operating Partnership for the three years ended December 31 are as follows (dollars in thousands):
Redeemable noncontrolling interests | |||
Balance at December 31, 2014 | $ | 33,332 | |
Net loss | (2,056 | ) | |
Changes in ownership, net | (931 | ) | |
Distributions to owners | (1,574 | ) | |
Other comprehensive income | 42 | ||
Balance at December 31, 2015 | 28,813 | ||
Net loss | (428 | ) | |
Changes in ownership, net | 957 | ||
Distributions to owners | (1,166 | ) | |
Other comprehensive income | 68 | ||
Balance at December 31, 2016 | $ | 28,244 | |
(b) Noncontrolling Interests in a Consolidated Partnership
When we are deemed to have a controlling interest in a partially-owned entity, we will consolidate all of the entity’s assets, liabilities and operating results within our consolidated financial statements. The net assets contributed to the consolidated entity by the third party, if any, will be reflected within permanent equity in our consolidated balance sheets to the extent they are not mandatorily redeemable. The amount will be recorded based on the third party’s initial investment in the consolidated entity and will be adjusted to reflect the third party’s share of earnings or losses in the consolidated entity and any distributions received or additional contributions made by the third party. The earnings or losses from the entity attributable to the third party are recorded as a component of “Net loss (income) attributable to noncontrolling interests” on our consolidated statements of operations.
On August 4, 2011, we formed a joint venture, in which we had a 97% interest, with an affiliate of Perseus Realty, LLC to acquire Storey Park in our Washington, D.C. reporting segment, which was placed into development in August 2013. Storey Park was sold July 25, 2016, at which time all assets and liabilities owned by the joint venture were either sold or settled at the time of
125
disposition and the remaining proceeds from the sale were distributed to the joint venture partners in accordance with the terms of the joint venture agreement. See note 9, Dispositions, for more information.
(16) Benefit Plans
(a) Share-Based Payments
We have issued share-based payments in the form of stock options and non-vested shares as permitted in our 2003 Equity Compensation Plan (the “2003 Plan”), which was amended in 2005, 2007 and July 2013, and expired in September 2013. We have also issued share-based compensation in the form of stock options and non-vested shares as permitted in our 2009 Equity Compensation Plan (the “2009 Plan”), which was amended in 2010, 2011, 2013 and 2016. In 2016 and 2011, we received shareholder approval to authorize an additional 4.1 million and 4.5 million shares, respectively, for issuance under the 2009 Plan. The compensation plans provide for the issuance of options to purchase common shares, share awards, share appreciation rights, performance units and other equity-based awards. Stock options granted under the plans are non-qualified, and all employees and non-employee trustees are eligible to receive grants. Under the terms of the amendment to the 2009 Plan, every stock option granted by us reduces the awards available for issuance on a one-for-one basis. However, for every restricted award issued, the awards available for issuance are reduced by 3.44 awards. At December 31, 2016, we had 11.5 million share equity awards authorized under the 2009 Plan and, of those awards, 4.8 million common share equity awards remained available for issuance by us.
We record costs related to our share-based compensation based on the grant-date fair value calculated in accordance with GAAP. We recognize share-based compensation costs on a straight-line basis over the requisite service period for each award and these costs are recorded within “General and administrative expense” or “Property operating expense” in our consolidated statements of operations based on the employee’s job function.
Stock Options Summary
As of December 31, 2016, 2.4 million stock options have been awarded of which 0.9 million stock options remained outstanding. During the first quarter of 2016, we issued 95,000 stock options to our non-officer employees. The stock options have a ten-year contractual life and vest 25% on the first anniversary of the date of grant and 6.25% in each subsequent calendar quarter. We recognized compensation expense associated with stock option awards in the amount of $0.2 million, $1.2 million and $0.5 million for the years ended December 31, 2016, 2015 and 2014, respectively. Compensation expense associated with our stock option awards for the year ended December 31, 2015 includes a $0.8 million charge related to the accelerated vesting of 0.3 million options in accordance with the separation agreement for our former Chief Executive Officer.
126
A summary of our stock option activity for the three years ended December 31 is presented below:
Options | Weighted Average Exercise Price | Weighted Average Remaining Contractual Term | Aggregate Intrinsic Value | |||||||||
Outstanding at December 31, 2013 | 1,089,292 | $ | 15.83 | 6.6 years | $ | 109,151 | ||||||
Granted | 135,250 | 11.61 | ||||||||||
Exercised | (17,171 | ) | 10.10 | |||||||||
Expired | (57,500 | ) | 19.08 | |||||||||
Forfeited | (98,512 | ) | 14.49 | |||||||||
Outstanding at December 31, 2014 | 1,051,359 | 15.33 | 6.3 years | $ | 181,352 | |||||||
Granted | 119,500 | 12.48 | ||||||||||
Exercised | (2,750 | ) | 9.30 | |||||||||
Expired | (59,000 | ) | 22.44 | |||||||||
Forfeited | (145,971 | ) | 15.06 | |||||||||
Outstanding at December 31, 2015 | 963,138 | 14.59 | 6.1 years | $ | 59,002 | |||||||
Granted | 95,000 | 11.03 | ||||||||||
Expired | (11,850 | ) | 26.60 | |||||||||
Forfeited | (140,851 | ) | 12.87 | |||||||||
Outstanding at December 31, 2016 | 905,437 | $ | 14.34 | 4.7 years | $ | 35,700 | ||||||
Exercisable at December 31: | ||||||||||||
2016 | 773,067 | $ | 14.81 | 4.1 years | $ | 35,700 | ||||||
2015 | 805,259 | 15.06 | 5.6 years | 59,002 | ||||||||
2014 | 552,620 | 16.49 | 5.1 years | 102,039 | ||||||||
Options expected to vest, subsequent to December 31, 2016 | 110,528 | $ | 11.64 | 8.3 years | $ | — | ||||||
The following table summarizes information about our stock options at December 31, 2016:
Options Outstanding | Options Exercisable | |||||||||||||||||
Year Issued | Range of Exercise Prices | Options | Weighted Average Remaining Contractual Life | Weighted Average Exercise Price | Options | Weighted Average Exercise Price | ||||||||||||
2007 | $ 29.11 - 29.24 | 21,500 | 0.0 years | $ | 29.14 | 21,500 | $ | 29.14 | ||||||||||
2008 | 17.29 | 22,250 | 1.0 year | 17.29 | 22,250 | 17.29 | ||||||||||||
2009 | 9.30 | 21,377 | 2.0 years | 9.30 | 21,377 | 9.30 | ||||||||||||
2010 | 12.57 | 25,892 | 3.0 years | 12.57 | 25,892 | 12.57 | ||||||||||||
2011 | 17.12 | 27,500 | 4.0 years | 17.12 | 27,500 | 17.12 | ||||||||||||
2012 | 13.54 - 15.00 | 537,750 | 3.9 years | 14.90 | 537,750 | 14.87 | ||||||||||||
2013 | 12.73 | 43,686 | 6.0 years | 12.73 | 40,975 | 12.73 | ||||||||||||
2014 | 11.61 | 61,936 | 7.0 years | 11.61 | 42,743 | 11.61 | ||||||||||||
2015 | 12.48 | 75,046 | 8.0 years | 12.48 | 33,080 | 12.48 | ||||||||||||
2016 | 11.03 | 68,500 | 9.0 years | 11.03 | — | 11.03 | ||||||||||||
905,437 | 4.7 years | 14.34 | 773,067 | 14.81 | ||||||||||||||
As of December 31, 2016, we had $0.2 million of unrecognized compensation cost, net of estimated forfeitures, related to stock option awards. We anticipate this cost will be recognized over a weighted average period of approximately 2.2 years. We calculate the grant date fair value of option awards using a Black-Scholes option-pricing model. Expected volatility is based on an assessment of our realized volatility over the preceding period that is equivalent to the award’s expected life, which in our opinion, gives an accurate indication of future volatility. The expected term represents the period of time the options are anticipated to remain outstanding as well as our historical experience for groupings of employees that have similar behavior and are considered separately for valuation purposes. The risk-free rate is based on the U.S. Treasury rate at the time of grant for instruments of similar term.
127
The weighted average assumptions used in the fair value determination of stock options granted to employees for the years ended December 31 are summarized as follows:
2016 | 2015 | 2014 | ||||||
Risk-free interest rate | 1.73 | % | 1.61 | % | 1.72 | % | ||
Expected volatility | 27.0 | % | 29.2 | % | 39.0 | % | ||
Expected dividend yield | 3.63 | % | 4.79 | % | 4.66 | % | ||
Weighted average expected life of options | 5.0 years | 5.0 years | 5.0 years | |||||
The weighted average grant date fair value of the stock options issued in 2016, 2015 and 2014 was $1.87, $1.96 and $2.67, respectively.
Option Exercises
No options were exercised during 2016. We received $26 thousand and $174 thousand from the exercise of stock options during 2015 and 2014, respectively. Shares issued as a result of stock option exercises are provided by the issuance of new shares. The total intrinsic value of options exercised was $7 thousand and $43 thousand during 2015 and 2014, respectively.
Non-Vested Share Awards
We issue non-vested common share awards that either vest over a specific time period that is identified at the time of issuance or vest upon the achievement of specific performance goals that are identified at the time of issuance. We issue new common shares, subject to restrictions, upon each grant of non-vested common share awards. In January 2016, we granted a total of 290,000 non-vested common shares to our executive officers. The awards have a five-year term and vest in one-quarter increments on the second through fifth anniversaries of the grant date. In February 2016, we granted a total of 103,429 non-vested common shares to our officers, which will vest ratably on an annual basis over a three-year period from the grant date. In July 2016, we granted a total of 181,357 non-vested performance-based common shares to our officers. The number of shares that will be earned will be determined at the end of 2018, based upon the achievement of specified market performance goals measured over the performance period from February 22, 2016 (the date we announced our 2016 Strategic Plan) through December 31, 2018. Of the shares earned, 50% will vest on February 1, 2019 and the remaining earned shares will vest on February 1, 2020. Any shares that are not earned will be forfeited.
In November 2015, we entered into separation agreements with our former Chief Executive Officer and Chief Investment Officer. Pursuant to the terms of their respective separation agreements, all of the former officers’ non-vested restricted share awards, which totaled an aggregate 229,171 restricted shares, vested on November 8, 2015, their date of separation. We incurred $1.2 million of compensation expense related to the accelerated vesting of the former officers’ non-vested restricted share awards.
Independent members of our Board of Trustees received annual grants of restricted common shares as a component of compensation for serving on our Board of Trustees. In May 2016, we granted 36,828 non-vested common shares to our non-employee trustees, all of which will vest on the earlier of the first anniversary of the grant date or the date of our 2017 annual meetings of our shareholders, subject to continued service by the trustee until that date. In October 2016, our Board of Trustees appointed a new non-employee trustee. We granted 3,508 non-vested common shares to the new trustee, which will vest on the earlier of May 24, 2017 or the date of our 2017 annual meetings of our shareholders, subject to continued service by the trustee until that date. We recognized $0.3 million of compensation expense associated with trustee restricted share awards for the year ended December 31, 2016, and $0.4 million for both years ended December 31, 2015 and 2014.
We recognized a total $2.1 million, $3.6 million and $3.2 million of compensation expense associated with all of our non-vested common share awards in 2016, 2015 and 2014, respectively. Compensation expense associated with our non-vested common shares for 2015 included $1.2 million of expense related to the accelerated vesting of the restricted shares associated with the departure of two former officers in 2015. Dividends on all non-vested common share awards are recorded as a reduction of equity. We apply the two-class method for determining EPS as our outstanding non-vested common shares with non-forfeitable dividend rights are considered participating securities. Our excess of dividends over earnings related to participating securities are shown as a reduction in net income or loss attributable to common shareholders in our computation of EPS.
128
A summary of our non-vested common share awards at December 31, 2016 is as follows:
Non-vested Shares | Weighted Average Grant Date Fair Value | |||||
Non-vested at December 31, 2013 | 637,662 | $ | 13.33 | |||
Granted | 164,675 | 12.84 | ||||
Vested | (137,924 | ) | 14.21 | |||
Expired | (29,514 | ) | 10.21 | |||
Forfeited | (11,478 | ) | 13.04 | |||
Non-vested at December 31, 2014 | 623,421 | 13.16 | ||||
Granted | 152,598 | 11.79 | ||||
Vested | (401,888 | ) | 13.16 | |||
Expired | (133,371 | ) | 12.61 | |||
Forfeited | (48,378 | ) | 13.30 | |||
Non-vested at December 31, 2015 | 192,382 | 12.42 | ||||
Granted | 615,122 | 9.40 | ||||
Vested | (91,007 | ) | 12.14 | |||
Expired | (1,630 | ) | 12.21 | |||
Forfeited | (3,493 | ) | 9.54 | |||
Non-vested at December 31, 2016 | 711,374 | $ | 9.85 | |||
As of December 31, 2016, we had $4.9 million of unrecognized compensation cost related to non-vested common shares. We anticipate this cost will be recognized over a weighted average period of 3.2 years.
We value our non-vested time-based awards issued in 2016, 2015 and 2014 at the grant date fair value, which is the market price of our common shares. For the non-vested performance-based common share awards granted in July 2016, we used a Monte Carlo Simulation (risk-neutral approach) to determine the number of shares that may be issued pursuant to the award as these awards were deemed to have a market condition. The risk-free interest rate assumptions used in the Monte Carlo Simulation were determined based on the zero coupon risk-free rate for the time frame of 0.25 years to 3 years, which ranged from 0.48% to 0.96%, respectively. The volatility used for our common share price in the Monte Carlo Simulation varied between 24.10% and 26.20%. We did not issue any non-vested performance-based awards in 2015 or 2014.
The weighted average grant date fair value of the shares issued in 2016, 2015 and 2014 were $9.40, $11.79 and $12.84, respectively. The total fair value of shares vested were $1.1 million, $5.3 million and $2.0 million during 2016, 2015 and 2014, respectively. We issue new shares, subject to restrictions, upon each grant of non-vested common share awards.
(b) 401(k) Plan
We have a 401(k) defined contribution plan covering all employees in accordance with the Internal Revenue Code. The maximum employer or employee contribution cannot exceed the IRS limits for the plan year. In 2014, we amended the eligibility requirements of the plan, allowing employees to contribute after 60 days of consecutive service. Employee contributions vest immediately. Employer contributions begin one year after the employee’s start of service and vest ratably over four years. For the three years ended December 31, 2016, 2015 and 2014, we matched up to 6% of each employee’s contributions. We pay for administrative expenses and matching contributions with available cash. Our plan does not allow for us to make additional discretionary contributions. Our contributions were $0.5 million for the year ended December 31, 2016 and $0.6 million for both of the years ended December 31, 2015 and 2014. The employer match payable to the 401(k) plan was fully funded as of December 31, 2016.
129
(c) Employee Share Purchase Plan
In 2009, our common shareholders approved the First Potomac Realty Trust 2009 Employee Share Purchase Plan (“the Plan”). The Plan allows participating employees to acquire our common shares, at a discounted price, through payroll deductions or cash contributions. Under the Plan, a total of 200,000 common shares may be issued and the offering periods of the Plan cannot exceed five years. Currently, each offering period commences on the first day of each calendar quarter (offering date) and ends on the last business day of the calendar quarter (purchase date) in which the offering period commenced. The purchase price at which common shares will be sold in any offering period will be the lower of: a) 85 percent of the fair value of common shares on the offering date or b) 85 percent of the fair value of the common shares on the purchase date. The first offering period began during the fourth quarter of 2009. We issued common shares of 7,585, 5,843 and 8,950 under the Plan during the years ended December 31, 2016, 2015 and 2014, respectively, which resulted in compensation expense totaling $10 thousand, $11 thousand and $20 thousand, respectively.
(17) Segment Information
Our reportable segments consist of four distinct reporting and operational segments within the greater Washington, D.C. region in which we operate: Washington, D.C., Maryland, Northern Virginia and Southern Virginia. We evaluate the performance of our segments based on the operating results of the properties located within each segment, which excludes large non-recurring gains and losses, gains or losses from sale of rental property, interest expense, general and administrative costs, acquisition costs or any other indirect corporate expense to the segments. In addition, the segments do not have significant non-cash items reporting in their operating results other than the impact of straight-line revenue and the amortization deferred market rents, deferred lease incentives and deferred tenant improvement reimbursements. There are no inter-segment sales or transfers recorded between segments.
130
The results of continuing operations for our four reporting segments for the three years ended December 31 are as follows (dollars in thousands):
2016 | |||||||||||||||||||
Washington, D.C. | Maryland | Northern Virginia | Southern Virginia | Consolidated | |||||||||||||||
Number of buildings | 6 | 34 | 15 | 19 | 74 | ||||||||||||||
Square feet | 918,266 | 1,886,183 | 1,885,958 | 2,023,858 | 6,714,265 | ||||||||||||||
Total revenues | $ | 45,062 | $ | 44,710 | $ | 40,658 | $ | 29,904 | $ | 160,334 | |||||||||
Property operating expense | (11,538 | ) | (9,794 | ) | (9,716 | ) | (7,506 | ) | (38,554 | ) | |||||||||
Real estate taxes and insurance | (9,375 | ) | (3,881 | ) | (4,075 | ) | (2,477 | ) | (19,808 | ) | |||||||||
Total property operating income | $ | 24,149 | $ | 31,035 | $ | 26,867 | $ | 19,921 | 101,972 | ||||||||||
Depreciation and amortization expense | (60,862 | ) | |||||||||||||||||
General and administrative | (16,976 | ) | |||||||||||||||||
Impairment of rental property | (2,772 | ) | |||||||||||||||||
Other expense | (22,931 | ) | |||||||||||||||||
Net loss | $ | (1,569 | ) | ||||||||||||||||
Total assets(1) | $ | 445,528 | $ | 332,655 | $ | 302,769 | $ | 161,563 | $ | 1,260,247 | |||||||||
Capital expenditures(2) | $ | 13,971 | $ | 5,308 | $ | 33,847 | $ | 3,269 | $ | 56,931 | |||||||||
2015 | |||||||||||||||||||
Washington, D.C. | Maryland | Northern Virginia | Southern Virginia | Consolidated | |||||||||||||||
Number of buildings (3) | 6 | 34 | 40 | 19 | 99 | ||||||||||||||
Square feet (3) | 918,375 | 1,885,630 | 2,661,448 | 2,023,639 | 7,489,092 | ||||||||||||||
Total revenues | $ | 44,553 | $ | 44,226 | $ | 55,230 | $ | 28,837 | $ | 172,846 | |||||||||
Property operating expense | (11,363 | ) | (11,457 | ) | (13,540 | ) | (7,733 | ) | (44,093 | ) | |||||||||
Real estate taxes and insurance | (8,238 | ) | (3,540 | ) | (5,540 | ) | (2,427 | ) | (19,745 | ) | |||||||||
Total property operating income | $ | 24,952 | $ | 29,229 | $ | 36,150 | $ | 18,677 | 109,008 | ||||||||||
Depreciation and amortization expense | (66,624 | ) | |||||||||||||||||
General and administrative | (25,450 | ) | |||||||||||||||||
Impairment of rental property | (60,826 | ) | |||||||||||||||||
Other income | 9,475 | ||||||||||||||||||
Loss from discontinued operations | (607 | ) | |||||||||||||||||
Net loss | $ | (35,024 | ) | ||||||||||||||||
Total assets(1)(4) | $ | 517,928 | $ | 341,375 | $ | 374,299 | $ | 167,447 | $ | 1,442,406 | |||||||||
Capital expenditures(2) | $ | 12,930 | $ | 9,003 | $ | 43,125 | $ | 7,961 | $ | 73,850 | |||||||||
131
2014 | |||||||||||||||||||
Washington, D.C. | Maryland | Northern Virginia | Southern Virginia | Consolidated | |||||||||||||||
Number of buildings (3) | 6 | 38 | 49 | 38 | 131 | ||||||||||||||
Square feet (3) | 917,008 | 1,999,332 | 3,021,509 | 2,852,298 | 8,790,147 | ||||||||||||||
Total revenues | $ | 33,959 | $ | 45,767 | $ | 53,645 | $ | 28,281 | $ | 161,652 | |||||||||
Property operating expense | (9,683 | ) | (11,482 | ) | (13,352 | ) | (8,735 | ) | (43,252 | ) | |||||||||
Real estate taxes and insurance | (5,583 | ) | (3,907 | ) | (5,592 | ) | (2,278 | ) | (17,360 | ) | |||||||||
Total property operating income | $ | 18,693 | $ | 30,378 | $ | 34,701 | $ | 17,268 | 101,040 | ||||||||||
Depreciation and amortization expense | (61,796 | ) | |||||||||||||||||
General and administrative | (21,156 | ) | |||||||||||||||||
Acquisition costs | (2,681 | ) | |||||||||||||||||
Impairment of rental property | (3,956 | ) | |||||||||||||||||
Other income | 4,108 | ||||||||||||||||||
Income from discontinued operations | 1,484 | ||||||||||||||||||
Net income | $ | 17,043 | |||||||||||||||||
Total assets(1)(4) | $ | 503,530 | $ | 359,603 | $ | 439,803 | $ | 228,234 | $ | 1,612,300 | |||||||||
Capital expenditures(2) | $ | 23,422 | $ | 10,185 | $ | 7,816 | $ | 8,436 | $ | 50,789 | |||||||||
(1) | Total assets include our investment in properties that are owned through joint ventures that are not consolidated within our consolidated financial statements. For more information on our unconsolidated investments, including locations within our reportable segments, see note 5, Investment in Affiliates. Corporate assets not allocated to any of our reportable segments totaled $17,732, $41,357 and $81,130 at December 31, 2016, 2015 and 2014, respectively. |
(2) | Capital expenditures for corporate assets not allocated to any of our reportable segments totaled $536, $831 and $930 at December 31, 2016, 2015 and 2014, respectively. |
(3) | Excludes Storey Park, our 97% owned consolidated joint venture within our Washington, DC reporting segment, which was in development during 2014 and 2015 and was sold in July 2016. |
(4) | Total assets at December 31, 2015 and 2014 have been restated to exclude a total of $7.9 million and $6.2 million, respectively of unamortized deferred financing costs that are now deducted from the respective debt liability in accordance with ASU 2015-03, which we adopted in the first quarter of 2016. |
132
(18) Quarterly Financial Information (unaudited)
2016(1) | |||||||||||||||
First | Second | Third | Fourth | ||||||||||||
(amounts in thousands, except per share amounts) | Quarter | Quarter | Quarter | Quarter | |||||||||||
Revenues | $ | 42,697 | $ | 38,493 | $ | 40,172 | $ | 38,972 | |||||||
Operating expenses | 36,337 | 35,681 | 32,295 | 34,658 | |||||||||||
Operating income | 6,360 | 2,812 | 7,877 | 4,314 | |||||||||||
(Loss) income from continuing operations | (101 | ) | (1,992 | ) | 2,242 | (1,717 | ) | ||||||||
Less: Net loss (income) attributable to noncontrolling interests | 147 | 390 | (107 | ) | 71 | ||||||||||
Net income (loss) attributable to First Potomac Realty Trust | 46 | (1,602 | ) | 2,135 | (1,646 | ) | |||||||||
Less: Dividends on preferred shares | (2,248 | ) | (794 | ) | (11 | ) | — | ||||||||
Less: Issuance costs on redeemed preferred shares | (1,904 | ) | (3,095 | ) | (517 | ) | — | ||||||||
Net (loss) income attributable to common shareholders | $ | (4,106 | ) | $ | (5,491 | ) | $ | 1,607 | $ | (1,646 | ) | ||||
Basic and diluted earnings per common share: | |||||||||||||||
Net (loss) income | $ | (0.07 | ) | $ | (0.10 | ) | $ | 0.03 | $ | (0.03 | ) | ||||
2015(1) | |||||||||||||||
First | Second | Third | Fourth | ||||||||||||
(amounts in thousands, except per share amounts) | Quarter | Quarter | Quarter | Quarter | |||||||||||
Revenues | $ | 43,849 | $ | 43,039 | $ | 42,854 | $ | 43,104 | |||||||
Operating expenses | 40,016 | 37,268 | 37,079 | 102,375 | |||||||||||
Operating income (loss) | 3,833 | 5,771 | 5,775 | (59,271 | ) | ||||||||||
Income (loss) from continuing operations | 1,099 | 476 | 3,997 | (39,990 | ) | ||||||||||
Loss from discontinued operations | (607 | ) | — | — | — | ||||||||||
Less: Net loss (income) attributable to noncontrolling interests | 112 | 114 | (38 | ) | 1,870 | ||||||||||
Net income (loss) attributable to First Potomac Realty Trust | 604 | 590 | 3,959 | (38,120 | ) | ||||||||||
Less: Dividends on preferred shares | (3,100 | ) | (3,100 | ) | (3,100 | ) | (3,100 | ) | |||||||
Net (loss) income attributable to common shareholders | $ | (2,496 | ) | $ | (2,510 | ) | $ | 859 | $ | (41,220 | ) | ||||
Basic and diluted earnings per common share: | |||||||||||||||
(Loss) income from continuing operations | $ | (0.03 | ) | $ | (0.04 | ) | $ | 0.01 | $ | (0.72 | ) | ||||
Loss from discontinued operations | (0.01 | ) | — | — | — | ||||||||||
Net (loss) income | $ | (0.04 | ) | $ | (0.04 | ) | $ | 0.01 | $ | (0.72 | ) | ||||
(1) | These figures are rounded to the nearest thousand, which may impact cross-footing in reconciling to full year totals. |
We did not sell any common shares in 2016 or 2015. The sum of the basic and diluted earnings per common share for the four quarters in the periods presented differs from the annual earnings per common share calculation due to the required method of computing the weighted average number of common shares in the respective periods.
133
SCHEDULE III
FIRST POTOMAC REALTY TRUST
REAL ESTATE AND ACCUMULATED DEPRECIATION
December 31, 2016
(Amounts in thousands)
Property | Location(1) | Date Acquired | Property Type(2) | Encumbrances at December 31, 2016(3) | |||||
Maryland | |||||||||
Snowden Center | Columbia | Oct 2002 | BP | $ | — | ||||
Metro Park North | Rockville | Dec 2004 | Office | — | |||||
Gateway 270 West | Clarksburg | Jul 2006 | BP | — | |||||
Indian Creek Court | Beltsville | Aug 2006 | BP | — | |||||
Ammendale Commerce Center | Beltsville | Mar 2007 | BP | — | |||||
Annapolis Business Center | Annapolis | Jun 2007 | Office | — | |||||
Cloverleaf Center | Germantown | Oct 2009 | Office | — | |||||
Redland II & III | Rockville | Nov 2010 | Office | 63,214 | |||||
TenThreeTwenty | Columbia | Feb 2011 | Office | — | |||||
Hillside I and II | Columbia | Nov 2011 | Office | — | |||||
540 Gaither Road (Redland I) | Rockville | Oct 2013 | Office | — | |||||
Total Maryland | 63,214 | ||||||||
Washington, D.C. | |||||||||
500 First Street, NW | Capitol Hill | Jun 2010 | Office | — | |||||
440 First Street, NW | Capitol Hill | Dec 2010 | Office | 32,216 | |||||
1211 Connecticut Ave, NW | CBD | Dec 2010 | Office | 28,503 | |||||
840 First Street, NE | NoMA | Mar 2011 | Office | 35,201 | |||||
1401 K Street, NW | East End | Apr 2014 | Office | 35,556 | |||||
11 Dupont Circle, NW | CBD | Sep 2014 | Office | 66,780 | |||||
Total Washington, D.C. | 198,256 | ||||||||
Northern Virginia | |||||||||
Plaza 500 | Alexandria | Dec 1997 | I | — | |||||
403/405 Glenn Drive | Sterling | Oct 2005 | BP | — | |||||
Sterling Park Business Center | Sterling | Feb 2006 | BP | — | |||||
Davis Drive | Sterling | Aug 2006 | BP | — | |||||
Three Flint Hill | Oakton | Apr 2010 | Office | — | |||||
Atlantic Corporate Park | Sterling | Nov 2010 | Office | — | |||||
1775 Wiehle Avenue | Reston | Jun 2014 | Office | — | |||||
Northern Virginia build-to-suit | Northern Virginia | 34,584 | |||||||
Total Northern Virginia | 34,584 | ||||||||
Southern Virginia | |||||||||
Crossways Commerce Center | Chesapeake | Dec 1999 | BP | — | |||||
Greenbrier Technology Center II | Chesapeake | Oct 2002 | BP | — | |||||
Norfolk Business Center | Norfolk | Oct 2002 | BP | — | |||||
Crossways II | Chesapeake | Oct 2004 | BP | — | |||||
Norfolk Commerce Park II | Norfolk | Oct 2004 | BP | — | |||||
1434 Crossways Boulevard | Chesapeake | Aug 2005 | BP | — | |||||
Crossways I | Chesapeake | Feb 2006 | BP | — | |||||
Crossways Commerce Center IV | Chesapeake | May 2006 | BP | — | |||||
Gateway II | Norfolk | Nov 2006 | BP | — | |||||
Greenbrier Circle Corporate Center | Chesapeake | Jan 2007 | BP | — | |||||
Greenbrier Technology Center I | Chesapeake | Jan 2007 | BP | — | |||||
Battlefield Corporate Center | Chesapeake | Oct 2010 | BP | 3,353 | |||||
Greenbrier Towers | Chesapeake | Jul 2011 | Office | — | |||||
Total Southern Virginia | 3,353 | ||||||||
Land held for future development | — | ||||||||
Other | — | ||||||||
Total Consolidated Portfolio | $ | 299,407 | |||||||
Initial Costs | Gross Amount at End of Year | |||||||||||||||||||||||||
Land | Building and Improvements | Since Acquisition | Land | Building and Improvements | Total | Accumulated Depreciation | ||||||||||||||||||||
$ | 3,404 | $ | 12,824 | $ | 5,159 | $ | 3,404 | $ | 17,983 | $ | 21,387 | $ | 7,878 | |||||||||||||
9,220 | 32,056 | 3,138 | 9,220 | 35,194 | 44,414 | 11,175 | ||||||||||||||||||||
18,302 | 20,562 | 9,049 | 18,302 | 29,611 | 47,913 | 8,741 | ||||||||||||||||||||
5,673 | 17,168 | 12,946 | 5,672 | 30,115 | 35,787 | 10,750 | ||||||||||||||||||||
2,398 | 7,659 | 6,763 | 2,398 | 14,422 | 16,820 | 6,275 | ||||||||||||||||||||
6,101 | 12,602 | 681 | 6,102 | 13,282 | 19,384 | 3,267 | ||||||||||||||||||||
7,097 | 14,211 | 3,144 | 7,097 | 17,355 | 24,452 | 3,539 | ||||||||||||||||||||
17,272 | 63,480 | 15,134 | 17,271 | 78,615 | 95,886 | 19,109 | ||||||||||||||||||||
2,041 | 5,327 | 14,403 | 2,041 | 19,730 | 21,771 | 4,626 | ||||||||||||||||||||
3,302 | 10,926 | 3,618 | 3,301 | 14,545 | 17,846 | 1,759 | ||||||||||||||||||||
6,458 | 19,831 | 616 | 6,753 | 20,152 | 26,905 | 3,346 | ||||||||||||||||||||
81,268 | 216,646 | 74,651 | 81,561 | 291,004 | 372,565 | 80,465 | ||||||||||||||||||||
25,806 | 33,883 | 628 | 25,995 | 34,322 | 60,317 | 7,048 | ||||||||||||||||||||
— | 15,300 | 51,633 | 9,122 | 57,811 | 66,933 | 7,279 | ||||||||||||||||||||
27,077 | 17,520 | 11,937 | 27,077 | 29,457 | 56,534 | 4,790 | ||||||||||||||||||||
16,846 | 60,905 | 9,879 | 16,846 | 70,784 | 87,630 | 12,618 | ||||||||||||||||||||
29,506 | 23,269 | 12,809 | 29,506 | 36,078 | 65,584 | 2,875 | ||||||||||||||||||||
15,744 | 64,832 | 5,788 | 15,744 | 70,620 | 86,364 | 5,147 | ||||||||||||||||||||
114,979 | 215,709 | 92,674 | 124,290 | 299,072 | 423,362 | 39,757 | ||||||||||||||||||||
6,265 | 35,433 | 7,548 | 6,265 | 42,981 | 49,246 | 20,515 | ||||||||||||||||||||
3,940 | 12,547 | 4,417 | 3,940 | 16,964 | 20,904 | 6,037 | ||||||||||||||||||||
14,656 | 10,750 | 23,482 | 20,010 | 28,878 | 48,888 | 10,410 | ||||||||||||||||||||
1,614 | 3,611 | 2,871 | 1,646 | 6,450 | 8,096 | 2,133 | ||||||||||||||||||||
— | 13,653 | 24,608 | 4,181 | 34,080 | 38,261 | 9,639 | ||||||||||||||||||||
5,895 | 11,655 | 22,080 | 5,895 | 33,735 | 39,630 | 7,057 | ||||||||||||||||||||
3,542 | 30,575 | 211 | 3,541 | 30,786 | 34,328 | 3,370 | ||||||||||||||||||||
5,241 | — | 49,343 | — | 54,584 | 54,584 | — | ||||||||||||||||||||
41,153 | 118,224 | 134,560 | 45,478 | 248,458 | 293,937 | 59,161 | ||||||||||||||||||||
5,160 | 23,660 | 14,124 | 5,160 | 37,784 | 42,944 | 17,333 | ||||||||||||||||||||
1,365 | 5,119 | 1,347 | 1,365 | 6,466 | 7,831 | 2,921 | ||||||||||||||||||||
1,323 | 4,967 | 1,411 | 1,324 | 6,377 | 7,701 | 2,936 | ||||||||||||||||||||
1,036 | 6,254 | 1,503 | 1,036 | 7,757 | 8,793 | 2,606 | ||||||||||||||||||||
1,221 | 8,693 | 4,387 | 1,221 | 13,080 | 14,301 | 5,459 | ||||||||||||||||||||
4,447 | 24,739 | 4,582 | 4,815 | 28,953 | 33,768 | 8,871 | ||||||||||||||||||||
2,657 | 11,597 | 2,875 | 2,646 | 14,483 | 17,129 | 4,990 | ||||||||||||||||||||
1,292 | 3,899 | 756 | 1,292 | 4,655 | 5,947 | 1,703 | ||||||||||||||||||||
1,320 | 2,293 | 610 | 1,320 | 2,904 | 4,223 | 1,060 | ||||||||||||||||||||
4,164 | 18,984 | 6,113 | 4,164 | 25,097 | 29,261 | 7,338 | ||||||||||||||||||||
2,024 | 7,960 | 2,381 | 2,024 | 10,341 | 12,365 | 3,465 | ||||||||||||||||||||
1,860 | 6,071 | 804 | 1,881 | 6,854 | 8,735 | 1,414 | ||||||||||||||||||||
2,997 | 9,173 | 6,406 | 2,997 | 15,579 | 18,576 | 3,024 | ||||||||||||||||||||
30,866 | 133,409 | 47,299 | 31,245 | 180,330 | 211,574 | 63,120 | ||||||||||||||||||||
343 | — | 6 | 349 | — | 349 | — | ||||||||||||||||||||
— | — | 47 | — | 47 | 47 | 59 | ||||||||||||||||||||
$ | 268,609 | $ | 683,988 | $ | 349,237 | $ | 282,923 | $ | 1,018,911 | $ | 1,301,834 | $ | 242,562 | |||||||||||||
(1) | CBD=Central Business District; NoMA=North of Massachusetts Avenue |
(2) | I=Industrial; BP=Business Park |
(3) | Includes the unamortized fair value adjustments recorded at acquisition upon the assumption of mortgage loans. |
Depreciation of rental property is computed on a straight-line basis over the estimated useful lives of the assets. The estimated lives of our assets range from 5 to 39 years or to the term of the underlying lease. The tax basis of our rental property assets was $1,435 million and $1,547 million at December 31, 2016 and 2015, respectively.
(a) Reconciliation of Rental Property(1)
The following table reconciles the rental property investments for the years ended December 31 (amounts in thousands):
2016 | 2015 | 2014 | |||||||||
Beginning balance | $ | 1,340,050 | $ | 1,504,372 | $ | 1,330,180 | |||||
Acquisitions of rental property(2) | — | — | 170,823 | ||||||||
Capital expenditures(3) | 56,030 | 73,125 | 49,860 | ||||||||
Impairments | — | (51,521 | ) | (3,956 | ) | ||||||
Dispositions of rental property | (55,625 | ) | (59,652 | ) | (30,916 | ) | |||||
Assets held-for-sale | (19,407 | ) | (127,907 | ) | (643 | ) | |||||
Other(4) | (19,214 | ) | 1,633 | (10,976 | ) | ||||||
Ending balance | $ | 1,301,834 | $ | 1,340,050 | $ | 1,504,372 | |||||
(b) Reconciliation of Accumulated Depreciation(1)
The following table reconciles the accumulated depreciation on the rental property investments for the years ended December 31 (amounts in thousands):
2016 | 2015 | 2014 | |||||||||
Beginning balance | $ | 209,784 | $ | 215,499 | $ | 185,725 | |||||
Depreciation of rental property | 44,952 | 49,772 | 47,625 | ||||||||
Assets held-for-sale | 31,034 | (16,400 | ) | (1,631 | ) | ||||||
Dispositions of rental property | (37,001 | ) | (35,964 | ) | (5,712 | ) | |||||
Other(4) | (6,207 | ) | (3,123 | ) | (10,508 | ) | |||||
Ending balance | $ | 242,562 | $ | 209,784 | $ | 215,499 | |||||
(1) | Excludes rental property and applicable accumulated depreciation at December 31, 2016 related to the One Fair Oaks, which was classified as held-for-sale at December 31, 2016 and was sold on January 9, 2017. Also excludes the rental property and applicable accumulated depreciation at December 31, 2015 related to the NOVA Non-Core Portfolio, which was classified as held-for-sale at December 31, 2015 and was sold on March 24, 2016. |
(2) | For more information on our acquisitions, including the assumption of liabilities and other non-cash items, see the supplemental disclosure of cash flow information accompanying our consolidated statements of cash flows. |
(3) | Represents cash paid for capital expenditures. |
(4) | Includes accrued increases to rental property investments, fully depreciated assets that were written-off during the year and other immaterial transactions. |
134
Exhibit Index
Exhibit | Description of Document | ||
3.1 | First Amended and Restated Declaration of Trust of the Company (Incorporated by reference to Exhibit 3.1 to the Company’s Registration Statement on Form S-11 (Registration No. 333-107172) filed on October 1, 2003). | ||
3.2 | Articles Supplementary designating the Company’s 7.750% Series A Cumulative Redeemable Perpetual Preferred Shares, liquidation preference $25.00 per share, par value $0.001 per share (Incorporated by reference to Exhibit 3.2 to the Company’s Registration Statement on Form 8-A filed on January 18, 2011 (File No. 001-31824)). | ||
3.3 | Articles Supplementary establishing additional shares of the Company’s 7.750% Series A Cumulative Redeemable Perpetual Preferred Shares, liquidation preference $25.00 per share, par value $0.001 per share (Incorporated by reference to Exhibit 3.1 to the Company’s Current Report on Form 8-K filed on March 14, 2012 (File No. 001-31824)). | ||
3.4 | Second Amended and Restated Bylaws of the Company (Incorporated by reference to Exhibit 3.1 to the Company’s Current Report on Form 8-K (Registration No. 333-107172) filed on October 29, 2015). | ||
4.1 | Form of share certificate evidencing the Company’s Common Shares (Incorporated by reference to Exhibit 4.1 to the Company’s Registration Statement on Form S-3 (Registration No. 333-120821) filed on November 30, 2004). | ||
10.1 | Amended and Restated Limited Partnership Agreement of First Potomac Realty Investment Limited Partnership dated September 15, 2003 (Incorporated by reference to Exhibit 3.3 to the Company’s Registration Statement on Form S-11 (Registration No. 333-107172) filed on October 1, 2003). | ||
10.2 | Amendment No. 13 to Amended and Restated Limited Partnership Agreement of First Potomac Realty Investment Limited Partnership dated January 18, 2011 (Incorporated by reference to Exhibit 10.1 to the Company’s Current Report on Form 8-K filed on January 19, 2011(File No. 001-31824)). | ||
10.3 | Amendment No. 14 to Amended and Restated Limited Partnership Agreement of First Potomac Realty Investment Limited Partnership dated March 24, 2011 (Incorporated by reference to Exhibit 4.3 to the Company’s Quarterly Report on Form 10-Q for the quarter ended March 31, 2011 (File No. 001-31824)). | ||
10.4 | Amendment No. 15 to Amended and Restated Limited Partnership Agreement of First Potomac Realty Investment Limited Partnership dated March 25, 2011 (Incorporated by reference to Exhibit 4.1 to the Company’s Quarterly Report on Form 10-Q for the quarter ended March 31, 2012 (File No. 001-31824)). | ||
10.5 | Amendment No. 16 to Amended and Restated Limited Partnership Agreement of First Potomac Realty Investment Limited Partnership dated March 25, 2011 (Incorporated by reference to Exhibit 4.2 to the Company’s Quarterly Report on Form 10-Q for the quarter ended March 31, 2012 (File No. 001-31824)). | ||
10.6 | Amendment No. 17 to Amended and Restated Limited Partnership Agreement of First Potomac Realty Investment Limited Partnership dated January 6, 2012 (Incorporated by reference to Exhibit 4.3 to the Company’s Quarterly Report on Form 10-Q for the quarter ended March 31, 2012 (File No. 001-31824)). | ||
10.7 | Amendment No. 18 to Amended and Restated Limited Partnership Agreement of First Potomac Realty Investment Limited Partnership dated March 14, 2012 (Incorporated by reference to Exhibit 10.1 to the Company’s Current Report on Form 8-K filed on March 14, 2012 (File No. 001-31824)). | ||
10.8† | Separation of Employment Agreement and General Release, dated November 8, 2015, by and between First Potomac Realty Investment Limited Partnership and Douglas J. Donatelli (Incorporated by reference to Exhibit 10.1 to the Company’s Current Report on Form 8-K filed on November 9, 2015 (File No. 001-31824)). | ||
10.9† | Separation of Employment Agreement and General Release, dated November 8, 2015, by and between First Potomac Realty Investment Limited Partnership and Nicholas R. Smith (Incorporated by reference to Exhibit 10.2 to the Company’s Current Report on Form 8-K filed on November 9, 2015 (File No. 001-31824)). | ||
10.10† | Employment Agreement, dated January 13, 2016, by and between First Potomac Realty Investment Limited Partnership, the Company and Robert Milkovich (Incorporated by reference to Exhibit 10.1 to the Company’s Current Report on Form 8-K/A filed on January 19, 2016 (File No. 001-31824)). | ||
10.11† | Employment Agreement, dated January 13, 2016, by and between First Potomac Realty Investment Limited Partnership, the Company and Samantha Sacks Gallagher (Incorporated by reference to Exhibit 10.2 to the Company’s Current Report on Form 8-K filed on January 19, 2016 (File No. 001-31824)). | ||
10.12† | Employment Agreement, January 13, 2016, by and between First Potomac Realty Investment Limited Partnership, the Company and Andrew Blocher (Incorporated by reference to Exhibit 10.1 to the Company’s Current Report on Form 8-K filed on January 19, 2016 (File No. 001-31824)). | ||
135
10.13† | 2003 Equity Compensation Plan (Incorporated by reference to Exhibit 10.24 to the Company’s Registration Statement on Form S-11 (Registration No. 333-107172) filed on October 14, 2003). | ||
10.14† | 2009 Equity Compensation Plan (Incorporated by reference to Exhibit A to the Company’s definitive proxy statement on Schedule 14A filed on April 8, 2009 (File No. 001-31824)). | ||
10.15† | 2009 Employee Share Purchase Plan (Incorporated by reference to Exhibit B to the Company’s definitive proxy statement on Schedule 14A filed on April 8, 2009 (File No. 001-31824)). | ||
10.16† | Amendment No. 1 to the Company’s 2003 Equity Compensation Plan (Incorporated by reference to Exhibit 10.1 to the Company’s Current Report on Form 8-K filed on October 20, 2005 (File No. 001-31824)). | ||
10.17† | Amendment No. 2 to the Company’s 2003 Equity Compensation Plan (Incorporated by reference to Exhibit A to the Company’s definitive proxy statement on Schedule 14A filed on April 11, 2007 (File No. 001-31824)). | ||
10.18† | Amendment No. 1 to the Company’s 2009 Equity Compensation Plan (Incorporated by reference to Exhibit 10.1 to the Company’s Current Report on Form 8-K filed on May 21, 2010 (File No. 001-31824)). | ||
10.19† | Amendment No. 2 to the Company’s 2009 Equity Compensation Plan (Incorporated by reference to Exhibit 10.1 to the Company’s Current Report on Form 8-K filed on May 23, 2011 (File No. 001-31824)). | ||
10.20† | Amendment No. 3 to the Company’s 2009 Equity Compensation Plan (Incorporated by reference to Exhibit 10.4 to the Company’s Quarterly Report on Form 10-Q for the quarter ended June 30, 2013 (File No. 001-31824)). | ||
10.21† | Amendment No. 4 to the Company’s 2009 Equity Compensation Plan (Incorporated by reference to Exhibit 10.1 to the Company’s Current Report on Form 8-K filed on May 25, 2016 (File No. 001-31824)). | ||
10.22† | Form of 2009 Restricted Stock Agreement for Officers (Performance-Vesting) (Incorporated by reference to Exhibit 10.2 to the Company’s Current Report on Form 8-K filed on May 27, 2009 (File No. 001-31824)). | ||
10.23† | Form of 2010 Restricted Stock Agreement for Officers (Performance-Vesting) (Incorporated by reference to Exhibit 10.2 to the Company’s Current Report on Form 8-K filed on March 1, 2010 (File No. 001-31824)). | ||
10.24† | Form of 2003 Plan Restricted Share Agreement for Officers (Incorporated by reference to Exhibit 10.37 to the Company’s Annual Report on Form 10-K for the year ended December 31, 2012 (File No. 001-31824)). | ||
10.25† | Form of 2003 Plan Nonqualified Share Option Agreement (Incorporated by reference to Exhibit 10.39 to the Company’s Annual Report on Form 10-K for the year ended December 31, 2012 (File No. 001-31824)). | ||
10.26† | Form of 2009 Plan Restricted Share Agreement for Officers (Incorporated by reference to Exhibit 10.40 to the Company’s Annual Report on Form 10-K for the year ended December 31, 2012 (File No. 001-31824)). | ||
10.27† | Form of 2009 Plan Restricted Share Agreement for Trustees (Incorporated by reference to Exhibit 10.41 to the Company’s Annual Report on Form 10-K for the year ended December 31, 2012 (File No. 001-31824)). | ||
10.28† | Form of 2009 Plan Nonqualified Share Option Agreement (Incorporated by reference to Exhibit 10.42 to the Company’s Annual Report on Form 10-K for the year ended December 31, 2012 (File No. 001-31824)). | ||
10.29† | Form of Performance-Based Restricted Share Agreement (Incorporated by reference to Exhibit 10.1 to the Company’s Current Report on Form 8-K filed on July 28, 2016 (File No. 001-31824)). | ||
10.30† | Description of Long-Term Incentive Award Program (“2013 LTI Program”) (Incorporated by reference to Item 5.02 of the Company’s Current Report on Form 8-K filed on April 3, 2013 (File No. 001-31824)). | ||
10.31 | Amended, Restated and Consolidated Credit Agreement, dated as of December 4, 2015, by and among First Potomac Realty Investment Limited Partnership, the Company, KeyBank National Association, as a lender and administrative agent, and the other lenders and agents party thereto (Incorporated by reference to Exhibit 10.1 to the Company’s Current Report on Form 8-K filed on December 8, 2015 (File No. 001-31824)). | ||
10.32 | Subsidiary Guaranty, dated as of December 4, 2015, by certain subsidiaries of the Operating Partnership in favor of KeyBank National Association, in its capacity as administrative agent for the lenders under the Amended, Restated and Consolidated Credit Agreement, dated as of December 4, 2105. (Incorporated by reference to Exhibit 10.2 to the Company’s Current Report on Form 8-K filed on December 8, 2015 (File No. 001-31824)). | ||
136
10.33 | Parent Guaranty (Springing), dated as of December 4, 2015, by the Company in favor of KeyBank National Association, in its capacity as administrative agent for the lenders under the Amended, Restated and Consolidated Credit Agreement, dated as of December 4, 2015 (Incorporated by reference to Exhibit 10.3 to the Company’s Current Report on Form 8-K filed on December 8, 2015 (File No. 001-31824)). | ||
12* | Statement Regarding Computation of Ratios. | ||
21* | Subsidiaries of the Company. | ||
23* | Consent of KPMG LLP (independent registered public accounting firm). | ||
31.1* | Section 302 Certification of Chief Executive Officer. | ||
31.2* | Section 302 Certification of Chief Financial Officer. | ||
32.1** | Section 906 Certification of Chief Executive Officer. | ||
32.2** | Section 906 Certification of Chief Financial Officer. | ||
101* | XBRL (Extensible Business Reporting Language). The following materials from First Potomac Realty Trust’s Annual Report on Form 10-K for the year ended December 31, 2016, formatted in XBRL: (i) Consolidated balance sheets as of December 31, 2016 and 2015; (ii) Consolidated statements of operations for the years ended December 31, 2016, 2015 and 2014; (iii) Consolidated statements of comprehensive income (loss) and equity for the years ended December 31, 2016, 2015 and 2014; (iv) Consolidated statements of cash flows for the years ended December 31, 2016, 2015 and 2014; and (iv) Notes to condensed consolidated financial statements. | ||
† | Indicates management contract or compensatory plan or arrangement. |
* | Filed herewith |
** | Furnished herewith |
137