Attached files
| file | filename |
|---|---|
| EX-10.15 - FORM OF TIME-BASED STOCK OPTION AWARD AGREEMENT UNDER THE 2014 INCENTIVE PLAN - FARO TECHNOLOGIES INC | faro201610kex1015.htm |
| EX-99.1 - PROPERTIES - FARO TECHNOLOGIES INC | faro201610kex991.htm |
| EX-32.B - CERTIFICATION - FARO TECHNOLOGIES INC | faro201610kex32-b.htm |
| EX-32.A - CERTIFICATION - FARO TECHNOLOGIES INC | faro201610kex32-a.htm |
| EX-31.B - CERTIFICATION - FARO TECHNOLOGIES INC | faro201610kex31-b.htm |
| EX-31.A - CERTIFICATION - FARO TECHNOLOGIES INC | faro201610kex31-a.htm |
| EX-23.1 - CONSENT - FARO TECHNOLOGIES INC | faro201610kex231.htm |
| EX-21.1 - LIST OF SUBSIDIARIES - FARO TECHNOLOGIES INC | faro201610kex211.htm |
UNITED STATES
SECURITIES AND EXCHANGE COMMISSION
WASHINGTON, D.C. 20549
FORM 10-K |
ý | ANNUAL REPORT PURSUANT TO SECTION 13 OR 15(d) OF THE SECURITIES EXCHANGE ACT OF 1934 |
For the fiscal year ended December 31, 2016
or
¨ | TRANSITION REPORT PURSUANT TO SECTION 13 OR 15(d) OF THE SECURITIES EXCHANGE ACT OF 1934 |
For the transition period from to
Commission File Number 0-23081
FARO TECHNOLOGIES, INC.
(Exact name of Registrant as Specified in Its Charter)
Florida | 59-3157093 | |
(State or Other Jurisdiction of Incorporation or Organization) | (I.R.S. Employer Identification Number) | |
250 Technology Park, Lake Mary, FL | 32746 | |
(Address of Principal Executive Offices) | (Zip Code) | |
Registrant’s telephone number, including area code: (407) 333-9911
Securities registered pursuant to Section 12(b) of the Act:
Title of each class | Name of each exchange on which registered | |
Common Stock, par value $.001 | NASDAQ Global Select Market | |
Securities registered pursuant to Section 12(g) of the Act: None
Indicate by check mark if the registrant is a well-known seasoned issuer, as defined in Rule 405 of the Securities Act. Yes ¨ No ý
Indicate by check mark if the registrant is not required to file reports pursuant to Section 13 or Section 15(d) of the Act. Yes ¨ No ý
Indicate by check mark whether the registrant: (1) has filed all reports required to be filed by Section 13 or 15(d) of the Securities Exchange Act of 1934 during the preceding 12 months (or for such shorter period that the registrant was required to file such reports), and (2) has been subject to such filing requirements for the past 90 days. Yes ý No ¨
Indicate by check mark whether the registrant has submitted electronically and posted on its corporate Web site, if any, every Interactive Data File required to be submitted and posted pursuant to Rule 405 of Regulation S-T (§ 232.405 of this chapter) during the preceding 12 months (or for such shorter period that the registrant was required to submit and post such files). Yes ý No ¨
Indicate by check mark if disclosure of delinquent filers pursuant to Item 405 of Regulation S-K (§229.405) is not contained herein, and will not be contained, to the best of registrant’s knowledge, in definite proxy or information statements incorporated by reference in Part III of this Form 10-K or any amendment to this Form 10-K.ý
Indicate by check mark whether the registrant is a large accelerated filer, an accelerated filer, a non-accelerated filer or a smaller reporting company. See definitions of “large accelerated filer,” “accelerated filer” and “smaller reporting company” in Rule 12b-2 of the Exchange Act.
Large accelerated filer | ý | Accelerated filer | ¨ | |
Non-accelerated filer | ¨ | (Do not check if a smaller reporting company) | Smaller reporting company | ¨ |
Indicate by check mark whether the Registrant is a shell company (as defined in Rule 12b-2 of the Act). Yes ¨ No ý
The aggregate market value of the Registrant’s common stock held by non-affiliates of the Registrant on June 30, 2016 (the last business day of the Registrant’s most recently completed second fiscal quarter) was $554,424,308 based on the closing price of the Registrant’s common stock on such date on the NASDAQ Global Select Market, and assuming solely for the purposes of this calculation that all directors and executive officers of the Registrant are “affiliates.”
As of February 20, 2017, there were outstanding 16,680,791 shares of the Registrant’s common stock.
DOCUMENTS INCORPORATED BY REFERENCE
Portions of the Registrant’s proxy statement for the 2017 Annual Meeting of Shareholders are incorporated by reference in Part III of this Annual Report on Form 10-K.
TABLE OF CONTENTS
Page | ||
Item 1. | ||
Item 1A. | ||
Item 1B. | ||
Item 2. | ||
Item 3. | ||
Item 4. | ||
Item 5. | ||
Item 6. | ||
Item 7. | ||
Item 7A. | ||
Item 8. | ||
Item 9. | ||
Item 9A. | ||
Item 9B. | ||
Item 10. | ||
Item 11. | ||
Item 12. | ||
Item 13. | ||
Item 14. | ||
Item 15. | ||
Item 16. | ||
i
PART I
CAUTIONARY STATEMENTS FOR FORWARD-LOOKING INFORMATION
FARO Technologies, Inc. (“FARO,” the “Company,” “us,” “we” or “our”) has made “forward-looking statements” in this Annual Report on Form 10-K within the meaning of Section 27A of the Securities Act of 1933, as amended, or the Securities Act, and Section 21E of the Securities Exchange Act of 1934, as amended, or the Exchange Act. Statements that are not historical facts or that describe our plans, beliefs, goals, intentions, objectives, projections, expectations, assumptions, strategies, or future events are forward-looking statements. In addition, words such as “may,” “might,” “would,” “will,” “will be,” “future,” “strategy,” “believe,” “plan,” “should,” “could,” “seek,” “expect,” “anticipate,” “intend,” “estimate,” “goal,” “objective,” “project,” “forecast,” “target” and similar words identify forward-looking statements.
Forward-looking statements are not guarantees of future performance and are subject to a number of known and unknown risks, uncertainties, and other factors that could cause actual results to differ materially from those expressed or implied by such forward-looking statements. Consequently, undue reliance should not be placed on these forward-looking statements. We do not intend to update any forward-looking statements, whether as a result of new information, future events, or otherwise, unless otherwise required by law. Important factors that could cause actual results to differ materially from those contemplated in such forward-looking statements include, among others, the following:
• | economic downturn in the manufacturing industry or the domestic and international economies in the regions of the world where we operate; |
• | our inability to further penetrate our customer base and target markets; |
• | our ability to fully implement the initiatives we have been undertaking to reorganize our business around certain vertical markets, modernize our sales processes to improve the efficiency of our sales organization, accelerate and maintain a consistent schedule of new product introductions, and harmonize our global functions to improve operational effectiveness; |
• | development by others of new or improved products, processes or technologies that make our products less competitive or obsolete; |
• | our inability to maintain our technological advantage by developing new products and releasing them as planned, as well as enhancing our existing products; |
• | risks associated with expanding international operations, such as fluctuations in currency exchange rates, difficulties in staffing and managing foreign operations, political and economic instability, compliance with import and export regulations, and the burdens and potential exposure of complying with a wide variety of U.S. and foreign laws and labor practices; |
• | our inability to successfully identify and acquire target companies and achieve expected benefits from, and effectively integrate, acquisitions that are consummated; |
• | the cyclical nature of the industries of our customers and material adverse changes in our customers’ access to liquidity and capital; |
• | change in the potential for the computer-aided measurement (“CAM2”) market and the potential adoption rate for our products, which are difficult to quantify and predict; |
• | our inability to protect our patents and other proprietary rights in the United States and foreign countries; |
• | our inability to adequately establish and maintain effective internal controls over financial reporting resulting in material weaknesses or significant deficiencies, and our inability to remediate any such issues completely or promptly; |
• | fluctuations in our annual and quarterly operating results and the inability to achieve our financial operating targets as a result of a number of factors including, without limitation, (i) litigation and regulatory action brought against us, (ii) quality issues with our products, (iii) excess or obsolete inventory, shrinkage or other inventory losses due to product obsolescence, change in demand for our products, scrap or material price changes, (iv) raw material price fluctuations and other inflationary pressures, (v) expansion of our manufacturing capability, (vi) the size and timing of customer orders, (vii) the amount of time that it takes to fulfill orders and ship our products, (viii) the length of our sales cycle to new customers and the time and expense incurred in further penetrating our existing customer base, (ix) increases in operating expenses required for product development and new product marketing, (x) costs associated with new product introductions, such as product development, marketing, assembly line start-up costs and low introductory period production volumes, (xi) the timing and market acceptance of new products and product enhancements, (xii) |
1
customer order deferrals in anticipation of new products and product enhancements, (xiii) the inability of our sales and marketing programs to achieve their sales targets, (xiv) start-up costs associated with opening new sales offices outside of the United States, (xv) fluctuations in revenue without proportionate adjustments in fixed costs, (xvi) inefficiencies in the management of our inventories and fixed assets, (xvii) compliance with government regulations including health, safety, and environmental matters, and (xviii) costs associated with our continued initiatives to reorganize our business around certain vertical markets, modernize our sales process to improve the efficiency of our sales organization, accelerate and maintain a consistent schedule of new product introductions, and harmonize our global functions to improve effectiveness;
• | changes in gross margin due to changing mix of products sold and the different gross margins on different products and sales channels; |
• | our inability to successfully maintain the requirements of Restriction of use of Hazardous Substances (“RoHS2”) and Waste Electrical and Electronic Equipment (“WEEE”) compliance in our products; |
• | the inability of our products to displace traditional measurement devices and attain broad market acceptance; |
• | the impact of competitive products and pricing on our current offerings; |
• | the loss of our Chief Executive Officer or other key personnel; |
• | difficulties in recruiting research and development engineers and application engineers; |
• | the failure to effectively manage the effects of our growth; |
• | the impact of reductions or projected reductions in government spending, particularly in the defense sector; |
• | variations in our effective income tax rate and the difficulty in predicting the tax rate on a quarterly and annual basis; |
• | the loss of key suppliers and the inability to find sufficient alternative suppliers in a reasonable period of time or on commercially reasonable terms; |
• | our ability to maintain profitability; |
• | the effect of estimates and assumptions with respect to critical accounting policies and the impact of the adoption of recently issued accounting pronouncements; |
• | the magnitude of increased warranty costs from new product introductions and enhancements to existing products; |
• | the sufficiency of our plants to meet manufacturing requirements; |
• | the continuation of our share repurchase program; |
• | the sufficiency of our working capital and cash flow from operations to fund our long-term liquidity requirements; |
• | the impact of geographic changes in the manufacturing or sales of our products on our tax rate; and |
• | our ability to comply with the requirements for favorable tax rates in foreign jurisdictions. |
as well as other risks and uncertainties discussed in Part I, Item 1A of this Annual Report on Form 10-K. Moreover, new risks and uncertainties emerge from time to time, and we undertake no obligation to update publicly or review the risks and uncertainties included in this Annual Report on Form 10-K, unless otherwise required by law.
2
ITEM 1. BUSINESS
FARO was founded in 1982, and re-incorporated in Florida in 1992. Our worldwide headquarters are located at 250 Technology Park, Lake Mary, Florida 32746 and our telephone number is (407) 333-9911.
We design, develop, manufacture, market and support software driven, three-dimensional (3D) measurement, imaging and realization systems. This technology permits high-precision 3D measurement, imaging and comparison of parts and complex structures within production and quality assurance processes. Our devices are used for inspection of components and assemblies, rapid prototyping, reverse engineering, documenting large volume or structures in 3D, surveying and construction as well as for investigation and reconstruction of accident sites or crime scenes. We sell the majority of our products through a direct sales force across a broad number of customers in a range of manufacturing, industrial, architecture, surveying, building information modeling, construction, public safety forensics, cultural heritage and other applications. Our FaroArm®, FARO Laser ScanArm®, FARO Gage®, FARO Laser TrackerTM, FARO Laser Projector, FARO Cobalt Array Imager, and their companion CAM2®and BuildIT software solutions, provide for Computer-Aided Design, or CAD, based inspection, factory-level statistical process control, high-density surveying and laser-guided assembly and production. Together, these products integrate the measurement, quality inspection, and reverse engineering functions with CAD and 3D software to improve productivity, enhance product quality, and decrease rework and scrap in the manufacturing process, mainly supporting applications in our Factory Metrology vertical. Our FARO Focus and FARO Scanner Freestyle3DX laser scanners, and their companion SCENE, FARO PointSense, and FARO public safety forensics software offerings, are utilized for a wide variety of 3D modeling, documentation and high-density surveying applications in our Construction Building Information Modeling - Construction Information Management (“Construction BIM-CIM”) and Public Safety Forensics verticals. Our FARO Laser ScanArm®, FARO Cobalt Array Imager, FARO Scanner Freestyle3DX laser scanners and their companion SCENE software also enable a fully digital workflow used to capture real world geometry for the purpose of empowering design, enabling innovation, and speeding up the design cycle, supporting our Product Design vertical. FARO Visual InspectTM enables large, complex 3D CAD data to be transferred to a tablet device and then used for mobile visualization and comparison to real world conditions, facilitating in-process inspection, assembly, guidance and positioning for applications in our Factory Metrology and Construction BIM-CIM verticals.
Industry Background
We believe four principal forces drive the need for our products and services: 1) the widespread use by manufacturers of CAD in product development, which shortens product cycles; 2) the adoption by manufacturers of quality standards such as Six Sigma and ISO-9001 (and its offshoot QS-9000), which stress the measurement of every step in a manufacturing process to reduce or eliminate defects; 3) the inability of traditional measurement devices to address many manufacturing problems such as throughput, efficiency, and accuracy, especially with respect to large components for products such as automobiles, aircraft, heavy duty construction equipment and factory retrofits; and 4) the growing demand to capture and synthesize large volumes of three-dimensional data for modeling and analysis.
CAD improves the manufacturing process. The creation of physical products involves the processes of design, engineering, production, and measurement and quality inspection. These basic processes have been profoundly affected by the computer hardware and software revolution that began in the 1980s. CAD software was developed to automate the design process, providing manufacturers with computerized 3D design capability and shortening the time between design changes. Today, most manufacturers use some form of CAD software to create designs and engineering specifications for new products and to quantify and modify designs and specifications for existing products. While manufacturers previously designed their products to remain in production for longer periods of time, current manufacturing practices must accommodate more frequent product introductions and modifications, while satisfying more stringent quality and safety standards. Assembly fixtures and measurement tools must be linked to the CAD design to enable production to keep up with the rate of design change.
Quality standards dictate measurement to reduce defects. QS-9000 is the name given to the Quality System requirements of the automotive industry developed by Chrysler, Ford, General Motors and major truck manufacturers. Companies registered under QS-9000 are considered to have higher standards and better quality products. Six Sigma is a set of quality standards that embodies the principles of total quality management, focused on measuring results and reducing product or service failure rates to 3.4 per million. All aspects of a Six Sigma company’s infrastructure must be analyzed and, if necessary, restructured to increase revenues and raise customer satisfaction levels. The all-encompassing nature of these and other quality standards has resulted in manufacturers measuring every aspect of their processes, including stages of product assembly that may never have been measured before, in part, because of the lack of suitable measurement equipment.
Traditional products do not measure up. A significant aspect of the manufacturing process entails measurement and quality inspection. Historically, manufacturers have measured and inspected products using hand-measurement tools such as
3
scales, calipers, micrometers and plumb lines for simple measuring tasks, test (or check) fixtures for certain large manufactured products, and traditional (or fixed) coordinate measurement machines, or CMM, for objects that require higher precision measurement. However, the broader utility of each of these measurement methods is limited.
Although hand-measurement tools are often appropriate for simple geometric measurements, including hole diameters or length and width of a rectangular component, their use for complex part measurements, such as the fender of a car, is limited. Also, these devices do not allow for the measurements to be directly compared electronically to the CAD model of the part. Test fixtures (customized fixed tools used to make comparative measurements of complex production parts to “master parts”) are relatively expensive and must be reworked or discarded each time a dimensional change is made in the part being measured. In addition, these manual measuring devices do not permit the manufacturer to electronically compare the dimensions of an object with its CAD model.
Conventional CMMs are generally large, fixed-base machines that provide very high levels of precision and provide a link to the CAD model of the object being measured. However, fixed-base CMMs require that the object being measured be brought to the CMM and fit within the CMM’s measurement grid. As manufactured subassemblies increase in size and become integrated into even larger assemblies, they become less transportable, thus diminishing the utility of a conventional CMM. Consequently, manufacturers must continue to use hand-measurement tools, or expensive customized test fixtures, to measure large or unconventionally shaped objects. In addition, some parts or assemblies are not easily accessible and cannot be measured using traditional devices.
The market demands three-dimensional data. Various factors contribute to market demand for FARO products and services. Conventional surveying equipment is limited to single-point measurements and does not have the capacity to capture and analyze large volumes of three-dimensional data. As data requirements for construction, civil engineering and public safety applications become more complex, single-point measurement devices will become increasingly more difficult to utilize in those applications.
Escalating global competition has created a demand for higher quality products with shorter life cycles. Customers require more rapid design, greater control of the manufacturing process, tools to compare components to their CAD specifications, the ability to precisely measure components that cannot be measured or inspected by conventional devices, and the ability to capture and analyze large volumes of three-dimensional data. Moreover, they increasingly require measurement capabilities to be integrated into manufacturing processes and to be available on the factory floor. These changing demands have contributed to the demand for FARO’s products and services.
Business Segments and Markets
In 2016, we reorganized our business to align our sales, marketing, and product management to five specific vertical markets and better redefine our end market applications. In accordance with U.S. generally accepted accounting principles, vertical markets that do not meet the criteria to be a reportable segment are aggregated into one “Other” segment; therefore, we are now organized into three reporting segments encompassing our various applications and product lines: Factory Metrology, Construction BIM-CIM and Other. Our segments are distinguished by the applications they serve. Each segment is responsible for its own product management, sales, strategy and financial performance. Information regarding our net sales and segment profit by segment, as well as a reconciliation of total segment profit to income from operations, is set forth in Note 17 to the “Notes to Consolidated Financial Statements” included in Part II, Item 8 of this Annual Report on Form 10-K.
Factory Metrology. The Factory Metrology segment provides solutions for manual and automated measurement and inspection in an industrial or manufacturing environment. Applications include alignment, part inspection, dimensional analysis, first article inspection, incoming and in-process inspection, machine calibration, non-contact inspection, robot calibration, tool building and set-up, and assembly guidance.
Construction BIM-CIM. The Construction BIM-CIM segment provides solutions for as-built data capturing and 3D visualization in building information modeling and construction information management applications, allowing our customers in the architecture, engineering and construction markets to quickly and accurately extract 2D and 3D measurement points. Applications include as-built documentation, construction monitoring, surveying, asset and facility management, and heritage preservation.
4
Other. The Other segment includes our Product Design, Public Safety Forensics and 3D Solutions operating segments which have been combined based on the aggregation criteria and quantitative thresholds in accordance with the provisions of Financial Accounting Standards Board Accounting Standards Codification Topic 280, “Segment Reporting.”
• | Product Design – provides advanced 3D solutions to assist in the engineering or design of a movable object, enabling a fully digital workflow. Applications include reverse engineering and virtual simulation. |
• | Public Safety Forensics – provides solutions to public safety officials and professionals to capture environmental or situational scenes in 2D and 3D for crime, crash and fire scene investigations and environmental safety evaluations. |
• | 3D Solutions – provides solutions to customers who require customized 3D measurement and realization solutions not otherwise addressed by our off-the-shelf product offerings. |
Information regarding net sales by segment and segment profit for the years ended December 31, 2016, 2015 and 2014 is set forth in Note 17 to the “Notes to Consolidated Financial Statements” included in Part II, Item 8 of this Annual Report on Form 10-K. Total assets are not allocated to a particular segment or segments.
Recent Acquisitions
BuildIT Software & Solutions Ltd. In July 2016, we acquired BuildIT Software & Solutions Ltd. (“BuildIT”), located in Montreal, Canada. BuildIT specializes in process-configurable 3D metrology software solutions with hardware agnostic interfaces. The acquisition enhances our Factory Metrology portfolio, providing customers greater software options to use in a variety of applications to reduce inspection and assembly times and increase productivity.
Laser Projection Technologies, Inc. In August 2016, we acquired Laser Projection Technologies, Inc. (“LPT”), located in Londonderry, New Hampshire. LPT specializes in laser projection and measurement systems used throughout manufacturing environments around the globe to maximize productivity and efficiency. The acquisition enhances our portfolio of 3D measurement solutions and supports our long-term strategy to expand our presence in key markets.
MWF-Technology GmbH. In December 2016, we acquired MWF-Technology GmbH (“MWF”), located near Frankfurt, Germany. MWF is an innovator in mobile augmented reality solutions, with breakthrough technology that enables large, complex 3D CAD data to be transferred to a tablet device and then used for mobile visualization and comparison to real world conditions. This enables real time, actionable manufacturing insight for in-process inspection, assembly, guidance and positioning.
FARO Products
FaroArm. The FaroArm is a combination of a portable, six or seven-axis, articulated measurement arm, a computer, and CAM2 software programs, which are described below under “FARO Software”.
• | Articulated Arm – The articulated arm is comprised of three major joints, each of which may consist of one, two or three axes of motion. The articulated arm is available in a variety of sizes, configurations and precision levels suitable for a broad range of applications. To take a measurement, the operator simply touches the object to be measured with a probe at the end of the arm and presses a button. Data can be captured at either individual points or a series of points. Optical encoders located at each of the joints of the arm measure the angles at those joints, and this rotational measurement data is transmitted to an on-board controller that converts the arm angles to precise locations in 3D space using “xyz” position coordinates and “ijk” orientation coordinates. |
• | Computer – We pre-install our CAM2 software primarily on either a notebook or desktop style computer, depending on the customer’s need, and the measurement arm, computer and installed software are sold as a system. We purchase the computers sold with our products from various suppliers. |
FARO Laser ScanArm. The FARO Laser ScanArm is a FaroArm equipped with a combination of a hard probe (like that in the FaroArm) and a non-contact laser line probe. This product provides our customers the ability to measure products without touching them and offers a seven-axis contact/non-contact measurement device with a fully integrated laser scanner. The ScanArm is used for contact and non-contact measurement applications, including inspection, cloud-to-CAD comparison, rapid prototyping, reverse engineering and 3D modeling.
FARO Gage. The FARO Gage is a smaller, higher-accuracy version of the FaroArm that is sold as a combination of an articulated arm device with a computer and software. The FARO Gage is also distinguished from the FaroArm by the special
5
mounting features and software unique to the FARO Gage. The FARO Gage is targeted at machine tools and bench tops around machine tools, where basic measurements of smaller machined parts must be taken. The CAM2 FARO Gage software developed for this device, described below, features basic 2D and 3D measurements common to these applications.
FARO Laser Tracker. The FARO Laser Tracker combines a portable, large-volume laser measurement tool, a computer, and CAM2 software programs.
• | Laser Tracker Vantage – The FARO Laser Tracker Vantage utilizes an ultra-precise laser beam to measure objects of up to 79 meters. It enables manufacturing, engineering, and quality control professionals to measure and inspect large parts, machine tools and other large objects on-site and in-process. |
In January 2017, we released the FARO VantageS and VantageE Laser Trackers. The VantageS is intended for short-to-long range measurement applications of up to 80 meters, while the VantageE supports short-to-medium range applications of up to 25 meters.
• | Laser Tracker ION – The FARO Laser Tracker ION is an interferometer (IFM)-based measurement system that provides the high accuracy and range to complete measurement tasks, such as in-line measurements, high-speed dynamic measurements, or high-accuracy machine calibration. |
• | Computer – The FARO Laser Tracker includes a notebook or desktop style computer, depending on the customer’s requirements, that includes the pre-installed CAM2 Software. |
FARO Cobalt Array Imager. The FARO Cobalt Array Imager is a metrology-grade structured light imager that utilizes blue light technology to capture millions of high resolution 3D coordinate measurements in seconds. FARO Cobalt’s versatility supports a variety of deployment options including rotary table, robot, industrial inspection cells and multiple imager arrays. This technology is used in quality control to improve product quality and reduce scrap, as well as for reverse engineering and rapid manufacturing.
FARO Laser Projector. The FARO TracerM accurately projects a laser line onto a surface or object, providing a virtual template that operators and assemblers can use to quickly and accurately position components with confidence. The laser template is created using a 3D CAD model that enables the system to visually project a laser outline of parts, reference points, or areas of interest. The result is a virtual and collaborative 3D template to streamline a wide range of assembly and production applications.
FARO Focus. The FARO Focus laser scanner utilizes laser technology to measure and collect a cloud of data points, allowing for the detailed and precise three-dimensional rendering of an object or an area as large as an industrial facility. This technology is currently used for factory planning, facility life-cycle management, quality control, forensic analysis and capturing large volumes of three-dimensional data. The FARO Focus simplifies modeling, reduces project time and maintains or increases the detail, identifies the colors and measures the dimensions of surrounding structures. The resulting data is used with major CAD systems or FARO’s own proprietary SCENE, PointSense, and FARO public safety forensics software offerings.
FARO Scanner Freestyle3DX. The FARO Scanner Freestyle3DX is a handheld scanner that quickly documents rooms, structures and objects in 3D and creates high-definition point clouds. The applications of the FARO Scanner Freestyle3DX include architecture, construction, industrial production and forensics. The FARO Scanner Freestyle3DX’s durable carbon fiber design equips the user with a versatile and ergonomic tool for performing accurate scanning in confined spaces. The FARO Scanner Freestyle3DX can be used independently or as a complement to the FARO Focus. The FARO Scanner Freestyle3DX comes with two software applications in addition to FARO’s proprietary SCENE software: SCENE Capture, which is installed on a tablet computer to record and visualize the capturing of 3D data, and SCENE Process, which processes the captured 3D data.
FARO Software. We provide a family of proprietary CAD-based measurement and laser scanner software used with our measurement and scanning devices.
• | CAM2 Measure 10 allows customers to complete measurement jobs quickly and gives customers the freedom to measure as required by the application. State-of-the-art functionalities improve every process where measuring is needed. |
• | CAM2 SmartInspect is our CAM2 solution for measuring geometry and building dimensions. The software allows customers to quickly measure geometric features and report dimensions for control. |
6
• | BuildIT is a CAD-to-part inspection software that enables quick and easy dimensional verification of manufactured parts and assemblies for tool building, assembly, alignment, process automation, reverse engineering and quality control. BuildIT’s advanced analysis and reporting capabilities combine measurement data from multiple sources to produce detailed graphical and textual reports that are used to quickly identify manufacturing and production trends. With both numerical and graphical feedback of real-time deviations, BuildIT allows users to position parts with micrometer accuracy for high-precision assembly and alignment applications. |
• | FARO SCENE software combines ease-of-use, networking, and an enhanced 3D experience to deliver a complete scan processing solution. With SCENE, customers can display, analyze, administer and edit 3D measurements in point clouds. |
• | FARO Public Safety Forensics software makes diagramming and pre-planning easier for law enforcement officers, firefighters and loss control engineers by allowing the users who need to draw site plans or crash or crime scene diagrams to be able to do so in a fast and efficient manner. FARO’s Public Safety Forensics software includes the following offerings: |
◦ | FARO Reality provides 3D diagramming and advanced animation of crash and crime scene investigations. Reality has an intuitive user-friendly interface, realistic environmental details, and animated vehicle crash effects that make it fast and easy to create professional animations for courtroom presentations. |
◦ | The FARO CAD Zone suite of software products are designed for public safety professionals to create clear and accurate diagrams and animations. The FARO CAD Zone suite of software products includes Crash Zone, Crime Zone, Fire Zone 3D and Insurance Zone. |
• | PointSense software products enable and simplify the use of real world objects in CAD applications. Primarily serving the surveying and architecture, engineering and construction spaces, the offering allows the user to integrate 3D laser scan data with CAD environments. The PointSense offerings includes PointSense for Revit® (a registered trademark of Autodesk), PointSense Building, PointSense Heritage, and PointSense Plant. |
Warranties and Services. To support our product lines, we also offer extended warranties and comprehensive support, training and technology consulting services to our customers.
Customers
Our sales are diversified across a broad number of over 15,000 customers worldwide in our Factory Metrology, Construction BIM-CIM, Product Design, Public Safety Forensics, and 3D Solutions vertical markets. Our ten largest customers by revenue represented an aggregate of approximately 4.7% of our total sales in 2016. No customer represented more than 1.0% of our sales in 2016.
Sales and Marketing
We conduct our sales and marketing efforts on a decentralized basis in three main regions around the world: Americas, Europe/Middle East/Africa (“EMEA”) and Asia-Pacific. The regional headquarters for the Americas, which is also our global headquarters, is located in Lake Mary, Florida; the EMEA regional headquarters is located in Stuttgart, Germany; and the regional headquarters for the Asia-Pacific region is located in Singapore. Each of these regional sales and marketing organizations support each of our reporting segments. As of December 31, 2016, we employed 602 sales and marketing specialists globally.
We sell most of our products through direct sales representation in Australia, Brazil, Canada, China, France, Germany, India, Italy, Japan, Malaysia, Mexico, the Netherlands, Poland, Singapore, South Korea, Spain, Sweden, Switzerland, Thailand, Turkey, the United Kingdom, the United States, and Vietnam. Our sales and marketing efforts use a process of integrated lead qualification and sales demonstration. Once a customer opportunity is identified, we employ a team-based sales approach involving inside and outside sales personnel who are supported by application engineers. Each team has the ability to sell multiple product lines. We employ a variety of marketing techniques to promote brand awareness and customer identification.
Information regarding our net sales and long-lived assets by geographic region is set forth in Note 17 to the “Notes to Consolidated Financial Statements” included in Part II, Item 8 of this Annual Report on Form 10-K.
Research and Development
We believe that our future success depends, in part, on our ability to maintain technological leadership, which will require ongoing enhancements of our products and the development of new applications and products that provide 3D measurement
7
solutions. The field of 3D measurement continues to expand, and new technologies and applications will be essential to competing in this market. Accordingly, we intend to continue to make substantial investments in the development of new technologies, the commercialization of new products that build on our existing technological base, and the enhancement and development of additional applications for our products.
Our research and development efforts are directed primarily at enhancing the functional adaptability of our current products and developing new and innovative products that respond to specific requirements of the emerging market for 3D measurement and documentation systems. Our engineering development efforts will continue to focus on enhancing the mechanical hardware, electronics, and software in our existing products and developing new products for the CAM2 market. Research and development activities, especially with respect to new products and technologies, are subject to significant risks, and there can be no assurance that any of our research and development activities will be completed successfully or on schedule, or, if completed, will be commercially accepted.
At December 31, 2016, we employed 215 scientists and technicians in our research and development efforts. Research and development expenses were approximately $30.1 million in 2016, compared to $26.7 million in 2015 and $27.6 million in 2014.
Intellectual Property
We own approximately 920 patents and pending patent applications worldwide, which generally expire on a rolling basis between 2017 and 2040. We also own approximately 70 trademark registrations worldwide.
Our success and ability to maintain a competitive position depends, in large part, on our ability to protect our intellectual property. We rely on a combination of contractual provisions and trade secret laws to protect our proprietary information. However, there can be no assurance that the steps taken by us to protect our trade secrets and proprietary information will be sufficient to prevent misappropriation of our proprietary information or preclude third-party development of similar intellectual property.
Despite our efforts to protect our proprietary rights, unauthorized parties may attempt to copy aspects of our products or to obtain and use information that we regard as proprietary. We intend to vigorously defend our proprietary rights against infringement by third parties. However, policing unauthorized use of our products is difficult, particularly in foreign countries, and we may be unable to determine the extent, if any, to which unauthorized uses of our products exist. In addition, the laws of some foreign countries do not protect our proprietary rights to the same extent as the laws of the United States.
We do not believe that any of our products infringe on the valid, proprietary rights of third parties. There can be no assurance, however, that third parties will not claim infringement by us with respect to current or future products. Any such claims, with or without merit, could be time consuming, result in costly litigation, cause product shipment delays or require us to enter into royalty or licensing agreements, which could have a material adverse effect upon our business, operating results and financial condition. In addition, such royalty or licensing agreements, if required, may not be available on terms acceptable to us, if at all.
Manufacturing and Assembly
We manufacture our FaroArm, FARO Gage, FARO Laser ScanArm, FARO Cobalt Array Imager, FARO Laser Tracker and FARO Laser Projector products in our manufacturing facilities located in Florida and Pennsylvania for customer orders from the Americas, in our manufacturing facility located in Schaffhausen, Switzerland for customer orders from the EMEA region, and in our manufacturing facility located in Singapore for customer orders from the Asia-Pacific region. We manufacture our FARO Focus and FARO Scanner Freestyle3DX products in our facilities located in Stuttgart, Germany and Schaffhausen, Switzerland.
We expect all of our existing plants to have the production capacity necessary to support our volume requirements through 2017.
Manufacturing consists primarily of assembling and integrating components and subassemblies purchased from suppliers into finished products. The primary components, which include machined parts and electronic circuit boards, are produced by subcontractors according to our specifications. Products are assembled, calibrated and tested for accuracy and functionality before shipment. We perform limited in-house circuit board assembly and component part machining. Typically, we enter into purchase commitments for manufacturing components to cover production requirements for 60 to 120 days. We have entered,
8
and may continue to enter, into longer agreements to purchase sufficient inventory to satisfy warranty commitments or to ensure adequate component availability.
Our manufacturing, engineering, and design headquarters have been registered to the ISO-9001 standard since July 1998. Semi-annual surveillance audits have documented continuous improvement to this multinational standard. Currently, our manufacturing sites in Lake Mary, Florida; Exton, Pennsylvania; Stuttgart, Germany; Schaffhausen, Switzerland; and Singapore are jointly registered to ISO-9001. Our FARO Laser Tracker, FaroArm, FARO Gage, and FARO Cobalt Array Imager products are all registered to ISO-17025:2005. We continue to examine our scope of registration as our business evolves and we have chosen English as the standard business language for our operations.
Our efforts to register our manufacturing, engineering and design headquarters to the ISO-9001 standard in concert with the ISO9001:2008 Quality Management System Certification verifies our commitment to quality through an internationally recognized standard. Additionally, we take a global approach to ISO-17025:2005 regarding the recognition of the Competence of Calibration and Testing Laboratories, seeking to have all locations registered with similar scopes of accreditation and capabilities for the products generated and serviced.
Competition
Our measurement systems compete in the broad and highly competitive market for measurement devices for manufacturing and industrial applications, which, in addition to portable articulated arms, laser tracker, 3D imaging and laser scanner products, consist of fixed-base CMMs, templates and go/no-go gages, check fixtures, handheld measurement tools, and various categories of surveying equipment. In the FARO Gage product line, we compete with a number of manufacturers of handheld measurement tools and fixed-base CMMs, including some large, well-established companies. In the FaroArm, FARO Laser ScanArm, FARO Laser Tracker, and FARO Focus product lines, we compete primarily with Hexagon Manufacturing Intelligence, a division of Hexagon AB, Automated Precision Inc, Artec Europe, S.a.r.l, Leica Geosystems, a division of Hexagon AB, and Trimble Inc. In the FARO Cobalt Array Imager product lines, we compete primarily with Steinbichler Optotechnik GmbH, GOM GmbH, Hexagon Manufacturing Intelligence, and Nikon Metrology, a division of Nikon Inc. In the FARO Laser Projector product line, we compete primarily with ViRTEK, a division of Gerber Technology LLC. We also compete in these product lines with a number of other smaller companies. We compete on the basis of technical innovation, product performance, quality and price with respect to all of our products.
We will be required to make continued investments in technology and product development to maintain and extend the technological advantage that we believe we currently have over our competition. However, we cannot be certain that our technology or our product development efforts will allow us to successfully compete as the industry evolves. As the market for our measurement systems expands, additional competition may emerge and our existing and future competitors may commit more resources to the markets in which we participate.
Government Regulation
Our operations are subject to numerous governmental laws and regulations, including those governing antitrust and competition, the environment, import and export of products, currency conversions and repatriation, taxation of foreign earnings and earnings of expatriate personnel, and use of local employees and suppliers. Our foreign operations are subject to the U.S. Foreign Corrupt Practices Act, or FCPA, and similar foreign anti-corruption laws, which makes illegal any payments to government officials or government employees that are intended to induce their influence to assist us or to gain any improper advantage for us. We operate in certain regions in the Middle East, Africa, Latin America, and Asia-Pacific that are more prone to risk under these anti-corruption laws.
Manufacturers of electrical goods are subject to the European Union’s RoHS2 and WEEE directives, which took effect during 2006. RoHS2 prohibits the use of lead, mercury and certain other specified substances in electronics products, and WEEE makes producers of electrical goods financially responsible for specified collection, recycling, treatment, and disposal of covered electronic products and components. Parallel initiatives are being proposed in other jurisdictions, including several states in the United States and China.
We currently hold WEEE registration and are in compliance with the directives of the European Union. Under the classification of “Industrial Monitoring and Control Instruments,” our products have until July 22, 2017 to become compliant with the RoHS2 directive. Currently, only the FARO Laser Tracker ION does not meet the RoHS2 directive. If we are unable to bring the FARO Laser Tracker ION into compliance with the RoHS2 directive by July 22, 2017, we would be unable to sell the FARO Laser Tracker ION in the European Union countries and China, and potentially in several states in the United States, which could have a material adverse effect on our sales and results of operations.
9
Backlog and Seasonality
At December 31, 2016, we had orders representing approximately $13.4 million in sales outstanding, of which $4.5 million related to services that we expect to deliver within one year. The product-related outstanding orders as of December 31, 2016 were $8.9 million, of which $5.8 million were shipped by February 20, 2017. As of February 20, 2017, we had orders representing approximately $16.5 million in sales outstanding, inclusive of 2016 open and undelivered orders, of which $5.7 million related to service orders and $10.8 million were product-related orders. We believe that substantially all of the outstanding sales orders as of February 20, 2017 will be shipped during 2017. At December 31, 2015 and 2014, we had orders representing approximately $9.1 million and $14.1 million in sales outstanding, respectively.
We typically experience greater order volume during the fourth quarter as customers spend the remaining balances of their capital expenditure budgets.
Employees
At December 31, 2016, we had 1,485 full-time employees, consisting of 602 sales and marketing professionals, 215 production staff, 215 research and development staff, 184 administrative staff, and 269 customer service/training/application engineering specialists. We are not a party to any collective bargaining agreements and believe our employee relations are satisfactory. Management believes that our future growth and success will depend in part on our ability to retain and continue to attract highly skilled personnel. We anticipate that we will be able to obtain the additional personnel required to satisfy our staffing requirements over the foreseeable future.
Available Information
We make available, free of charge on our Internet website at http://www.faro.com, our Annual Report on Form 10-K, Quarterly Reports on Form 10-Q, Current Reports on Form 8-K, and any amendments to those reports filed or furnished pursuant to Section 13(a) or 15(d) of the Exchange Act as soon as reasonably practicable after they are electronically filed with, or furnished to, the Securities and Exchange Commission, or the SEC. You can find these reports on our website at www.faro.com by first clicking “Investor Relations” and then “SEC Filings”. The information on, or accessible through, our website is not a part of this Annual Report on Form 10-K.
These reports may also be obtained at the SEC’s Public Reference Room at 100 F Street NE, Washington, DC 20549. Information on the operation of the Public Reference Room is available by calling the SEC at (800) SEC-0330. You may also access this information at the SEC’s website at http://www.sec.gov. This site contains reports, proxy and information statements and other information regarding issuers that file electronically with the SEC.
10
ITEM 1A. RISK FACTORS.
The statements under this heading describe the most significant risks to our business identified by management and should be considered carefully in conjunction with the discussion in Management’s Discussion and Analysis of Financial Condition and Results of Operations included in Part II, Item 7 of this Annual Report on Form 10-K and in our Consolidated Financial Statements and notes thereto included in Part II, Item 8 of this Annual Report on Form 10-K before deciding to invest in, or retain, shares of our common stock.
Any of the following risks and uncertainties could materially and adversely affect our business, results of operations, liquidity, and financial condition. These are not the only risks we face. Our operations could also be affected by additional factors that are not presently known by us or by factors that we currently do not consider material to our business.
Competitors may develop products that make our products obsolete or less competitive.
The CAM2 market is characterized by rapid technological change. Competitors may develop new or improved products, processes or technologies that may make our products obsolete or less competitive.
As a result, our success depends, in part, on our ability to maintain our technological advantage by developing new products and applications and enhancing our existing products, which can be complex and time-consuming and require substantial investment. Significant delays in new product releases or difficulties in developing new products could adversely affect our business and results of operations. We can provide no assurance that we will be able to adapt to evolving markets and technologies or maintain our technological advantage.
Our financial performance is dependent on the conditions of various industries, including the automotive, aerospace, and heavy equipment industries, which have from time to time experienced, and may again experience, significant disruptions in the economic environment.
A significant portion of our sales are to manufacturers in the automotive, aerospace, and heavy equipment industries. We are dependent upon the continued viability and financial stability of our customers in these industries, which are highly cyclical and dependent upon the general health of the economy and consumer spending.
Because a significant portion of our revenues and expenses are denominated in foreign currencies, we face significant exposure to foreign exchange rate risk.
Our results of operations are affected by fluctuations in exchange rates, which has caused, and may continue to cause, significant fluctuations in our quarterly and annual results of operations. Fluctuations in exchange rates may have a material adverse effect on our results of operations and financial condition, and could result in potentially significant foreign exchange gains and losses. To the extent that the percentage of our non-U.S. dollar revenues derived from international sales increases in the future, our exposure to risks associated with fluctuations in foreign exchange rates will increase.
We may be unable to recognize the anticipated benefits of our reorganization initiatives.
On February 24, 2016, we announced our intention to pursue various reorganization initiatives targeting certain vertical markets, modernizing our sales process, harmonizing our global functions and accelerating our product development efforts. Management expects to derive certain benefits from these reorganization initiatives, including accelerating sales growth, improving the leverage of our sales organization, and optimizing management and operations. Actual results and experience, including the costs of the reorganization initiatives, may differ materially from management's expectations, resulting in our inability to realize the expected benefits of the reorganization initiatives and negatively impacting our ability to execute our future plans and strategies.
Product failures or product availability and performance issues could result in increased warranty costs and delays in new product introductions and enhancements, and could adversely affect our business and financial condition.
We regularly introduce new products and enhance existing products. Failures in our new or existing products could result in increased warranty costs, delays in new product introductions or existing product enhancements, and a loss of sales and customers, and could have an adverse effect on our business and financial condition.
11
Our growth depends on the ability of our products to attain broad market acceptance.
The market for traditional fixed-base CMMs, check fixtures, handheld measurement tools, and surveying equipment is mature. Part of our strategy is to continue to displace these traditional measurement devices. Displacing traditional measurement devices and achieving broad market acceptance for our products requires significant effort to convince customers to reevaluate their historical measurement procedures and methodologies.
The potential size and growth rate of the CAM2 market is uncertain and difficult to quantify. If the CAM2 market does not continue to expand or does not expand as quickly as we anticipate, we may not be able to grow our sales, which could materially adversely affect our results of operations and financial condition.
We market eight closely interdependent products (FaroArm, FARO Laser ScanArm, FARO Gage, FARO Laser Tracker, FARO Cobalt Array Imager, FARO Focus, FARO Scanner Freestyle3DX and FARO Laser Projector) and related software for use in measurement, inspection, and high density surveying applications. Substantially all of our revenues are currently derived from sales of these products and software, and we plan to continue our business strategy of focusing on the software-driven, 3D measurement and inspection market. Consequently, our financial performance will depend, in large part, on computer-based measurement, inspection and high density surveying products achieving broad market acceptance. If our products cannot attain broad market acceptance, we will not grow as anticipated and may be required to make increased expenditures on research and development for new applications or new products.
We may not be able to identify or consummate acquisitions or achieve expected benefits from or effectively integrate acquisitions, which could harm our growth.
Our growth strategy partly depends on our ability to obtain additional technologies, complementary product lines and sales channels through selective acquisitions and strategic investments. We may not be able to identify and successfully negotiate suitable acquisitions, obtain financing for future acquisitions, if necessary, on satisfactory terms or otherwise complete acquisitions in the future. In the past, we have used our stock as consideration for acquisitions. Our common stock may not remain at a price at which it can be used as consideration for acquisitions without diluting our existing shareholders, and potential acquisition candidates may not view our stock attractively.
In addition, realization of the benefits of acquisitions often requires integration of some or all of the sales and marketing, distribution, manufacturing, engineering, software development, customer service, finance and administrative organizations of the acquired companies. The integration of acquisitions demands substantial attention from senior management and the management of the acquired companies. Our recent acquisitions and any future acquisitions may be subject to a variety of risks and uncertainties including:
• | the inability to assimilate effectively the operations, products, technologies and personnel of the acquired companies (some of which may be located in diverse geographic regions); |
• | the inability to maintain uniform standards, controls, procedures and policies; |
• | the need or obligation to divest portions of the acquired companies; and |
• | the potential impairment of relationships with customers. |
We cannot offer any assurance that we will be able to identify, complete or successfully integrate any suitable acquisitions, that any acquired companies will operate profitably, or that we will realize the expected synergies and other benefits from any acquisition.
The buying process for most of our customers for our measurement products is highly decentralized and typically requires significant time and expense for us to further penetrate the potential market of a specific customer, which may delay our ability to generate additional revenue.
Our success depends, in part, on our ability to further penetrate our customer base. During 2016, approximately 82% of our revenue was attributable to sales to our existing customers. If we are not able to continue to further penetrate our existing customer base, our sales growth may further decline. However, most of our customers have a decentralized buying process for measurement devices, and we must spend significant time and resources to increase revenues from a specific customer. For example, we may provide products to only one of our customer’s manufacturing facilities or for a specific product line within a manufacturing facility. We cannot offer any assurance that we will be able to maintain or increase the amount of sales to our existing customers, which could adversely affect our financial results.
12
Our failure to attract and retain qualified personnel could lead to a loss of sales or decreased profitability.
During 2015, we announced the departure of our Chief Executive Officer, Jay Freeland and our Chief Financial Officer, Peter Abram. Subsequently, on March 11, 2016, we announced the departure of our Chief Financial Officer, Laura A. Murphy-Wolf. While we appointed our Chairman, Dr. Simon Raab, as President and Chief Executive Officer and we recently promoted Robert Seidel to the position of Chief Financial Officer, these senior leadership changes could impact our ability to attract and retain sufficient qualified personnel to support our growth and could have a material adverse effect on our business reputation and results of operations.
In addition, the loss of any of our current executive officers, or other key personnel, could adversely affect our sales, profitability or growth. Moreover, we continue to rely, in part, on equity awards to attract and retain qualified personnel, which may result in an increase in compensation expense.
Our ability to protect our patents and proprietary rights in the United States and foreign countries could adversely affect our revenues.
Our success depends, in large part, on our ability to obtain and maintain patents and other proprietary rights protection for our processes and products in the United States and other countries. We also rely upon trade secrets, technical know-how and continuing inventions to maintain our competitive position. We seek to protect our technology and trade secrets, in part, by confidentiality agreements with our employees and contractors. However, our employees may breach these agreements; or our trade secrets may otherwise become known or be independently discovered by inventors. If we are unable to obtain or maintain protection of our patents, trade secrets and other proprietary rights, we may not be able to prevent third parties from using our proprietary rights, which could have a material adverse effect on our results of operations.
Our patent protection involves complex legal and technical questions. Our patents may be challenged, narrowed, invalidated or circumvented. Further, we may be able to protect our proprietary rights from infringement by third parties only to the extent that our proprietary processes and products are covered by valid and enforceable patents or are effectively maintained as trade secrets. Furthermore, others may independently develop similar or alternative technologies or design around our patented technologies. Litigation or other proceedings to defend or enforce our intellectual property rights could require us to spend significant time and money, which could have an adverse impact on our financial condition.
Claims from others that we infringed on their intellectual property rights may adversely affect our business and financial condition.
From time to time, we receive notices from others claiming that we infringed on their intellectual property rights. Resolving these claims may require us to enter into royalty or licensing agreements on unfavorable terms, require us to stop selling or to redesign affected products, or require us to pay damages. In addition, from time to time, we are involved in intellectual property lawsuits. We could, in the future, incur judgments or enter into settlements of lawsuits and claims that could have a material adverse effect on our financial condition. Any litigation or interference proceedings, regardless of their outcome, may be costly and may require significant time and attention of our management and technical personnel.
We may not be able to achieve financial results within our target goals, and our operating results may fluctuate due to a number of factors, many of which are beyond our control.
Our ability to achieve financial results that are within our goals is subject to a number of factors beyond our control. Moreover, our annual and quarterly operating results have varied significantly in the past and likely will vary significantly in the future. Factors that cause our financial results to fluctuate include, but are not limited to, the following:
• | adverse changes in the manufacturing industry and general economic conditions; |
• | the effectiveness of sales promotions; |
• | geographic expansion in our regions; |
• | training and ramp-up time for new sales people; |
• | investments in strategic sales, product or other initiatives; |
• | investments in technologies and new products and product enhancements, including costs associated with new development and product introductions, and the timing and market acceptance of new products and product enhancements; |
13
• | excess or obsolete inventory, shrinkage or other inventory losses due to product obsolescence, change in demand for our products, scrap or material price changes; |
• | expansion of our manufacturing capability; |
• | the size and timing of customer orders, many of which are received towards the end of a quarter; |
• | the amount of time that it takes to fulfill orders and ship our products; |
• | the length of our sales cycle to new customers; |
• | customer order deferrals in anticipation of new products and product enhancements; |
• | start-up costs and ramp-up time associated with opening new sales offices outside of the United States; |
• | variations in the effective income tax rate and difficulty in predicting the tax rate on a quarterly and annual basis; and |
• | litigation and regulatory action brought against us. |
Any one or a combination of these factors could adversely affect our annual and quarterly operating results in the future and could cause us to fail to achieve our target financial results.
We compete with manufacturers of measurement systems and traditional measurement devices, many of which have more resources than us and may develop new products and technologies.
Our measurement systems compete in the broad and highly competitive market for measurement devices for manufacturing and industrial applications, which, in addition to portable articulated arms, laser tracker, 3D imaging and laser scanner products, consist of fixed-base CMMs, templates and go/no-go gages, check fixtures, handheld measurement tools, and various categories of surveying equipment. In the FARO Gage product line, we compete with a number of manufacturers of handheld measurement tools and fixed-base CMMs, including some large, well-established companies. In the FaroArm, FARO Laser ScanArm, FARO Laser Tracker, and FARO Focus product lines, we compete primarily with Hexagon Manufacturing Intelligence, a division of Hexagon AB, Automated Precision Inc, Artec Europe, S.a.r.l, Leica Geosystems, a division of Hexagon AB, and Trimble Inc. In the FARO Cobalt Array Imager product lines, we compete primarily with Steinbichler Optotechnik GmbH, GOM GmbH, Hexagon Manufacturing Intelligence, and Nikon Metrology, a division of Nikon Inc. In the FARO Laser Projector product line, we compete primarily with ViRTEK, a division of Gerber Technology LLC. We also compete in these product lines with a number of other smaller companies. We compete on the basis of technical innovation, product performance, quality and price with respect to all of our products.
We will be required to make continued investments in technology and product development to maintain the technological advantage that we believe we currently have over our competition. Some of our competitors possess substantially greater financial, technical, and marketing resources than we possess. Moreover, we cannot be certain that our technology or our product development efforts will allow us to successfully compete as the industry evolves. As the market for our measurement systems expands, additional competition may emerge and our existing and future competitors may commit more resources to the markets in which we participate. Our results of operations could be adversely affected by pricing strategies pursued by competitors or technological or product developments by competitors.
If we fail to establish and maintain effective internal controls over financial reporting, our financial statements could contain a material misstatement, which could adversely affect our business and financial condition.
Under Section 404 of the Sarbanes-Oxley Act of 2002 and the rules promulgated by the SEC, companies are required to conduct a comprehensive evaluation of their internal controls over financial reporting. As part of this process, we are required to document and test our internal controls over financial reporting; management is required to assess and issue a report concerning our internal controls over financial reporting; and our independent registered public accounting firm is required to attest to the effectiveness of our internal controls over financial reporting. Our internal controls over financial reporting may not prevent or detect misstatements because of their inherent limitations, including the possibility of human error, the circumvention or overriding of controls, or fraud. Over time, controls may become inadequate because of changes in conditions or deterioration in the degree of compliance with policies or procedures. Because of the inherent limitations in a cost-effective control system, misstatements due to error or fraud may occur and may not be prevented or detected on a timely basis. Even effective internal controls over financial reporting can provide only reasonable assurance with respect to the preparation and fair presentation of financial statements.
During 2015, we identified and disclosed a material weakness in our internal controls over financial reporting related to the review of certain deferred income tax accounts. To remediate this material weakness, we have instituted additional training
14
and review procedures and have engaged supplemental resources. During the fourth quarter of fiscal 2016, we successfully completed the testing necessary to conclude that the material weakness has been remediated.
If we fail to adequately establish and maintain effective internal controls over financial reporting, additional material weaknesses or significant deficiencies in our internal control over financial reporting may occur in the future, our financial statements may contain material misstatements, and we could be required to restate our financial results. This could cause us to fail to meet our reporting obligations, lead to a loss of investor confidence and adversely affect our business, our financial condition, and the trading price of our common stock.
We derive a substantial part of our revenues from our international operations, which are subject to greater volatility and often require more management time and expense to achieve profitability than our domestic operations.
We derive more than half of our revenues from international operations. Our international operations are subject to various risks, including:
• | difficulties in staffing and managing foreign operations; |
• | political and economic instability; |
• | unexpected changes in regulatory requirements and laws; |
• | longer customer payment cycles and difficulty collecting accounts receivable; |
• | compliance with export and import regulations and trade restrictions; |
• | governmental restrictions on the transfer of funds to us from our operations outside the United States; and |
• | burdens of complying with a wide variety of foreign laws and labor practices. |
Several of the countries where we operate have emerging or developing economies, which may be subject to greater currency volatility, negative growth, high inflation, limited availability of foreign exchange and other risks. These factors may harm our results of operations and any measures that we may implement to reduce the effect of volatile currencies and other risks of our international operations may not be effective.
Our financial results may be adversely affected by exposure to additional tax liabilities.
As a multinational corporation, we are subject to income tax in the United States and numerous foreign jurisdictions. Our effective tax rate is directly impacted by the application of complex tax laws and regulations and is highly dependent upon the geographic mix of our worldwide earnings or losses, the tax regulations in each country or geographic region in which we operate, and the availability of tax credits and loss carry-forwards. Application of tax laws and regulations is also subject to legal and factual interpretation, judgment, and uncertainty. Further, tax laws are subject to change as a result of changes in fiscal policy and legislation and the evolution of regulations and court rulings. In recent months, the Organization for Economic Cooperation and Development (“OECD”), a group tasked by the G20 to address tax reform, has released guidance referred to as the Base Erosion and Profit Shifting (“BEPS”) initiative. As BEPS guidance is further released, legislative changes may result that could potentially impact the recorded amounts of our deferred tax assets and liabilities and our effective tax rate. As a result of the BEPS initiative, as a multinational corporation, we may face uncertainty in the application of conflicting tax laws, increased scrutiny and increased audit activity and costs. Consequently, taxing authorities may impose tax assessments or judgments against us and/or tax laws could change that could materially impact our tax liability and/or our effective income tax rate. To the extent that there is tax reform in the United States, it may impact our tax expense and the carrying value of our deferred tax assets and liabilities.
The United Kingdom's vote to exit from the European Union could adversely impact our business.
On June 23, 2016, the United Kingdom (the “U.K.”) held a referendum in which voters approved an exit from the European Union (“E.U.”), commonly referred to as “Brexit.” The referendum is non-binding; however, it is expected to be passed into law, after which negotiations will commence to determine the future terms of the U.K.’s relationship with the E.U. The impact on our business as a result of Brexit will depend, in part, on the outcome of tariff, trade, regulatory and other negotiations.
As a result of the referendum, the global markets and currencies have been and may continue to be adversely impacted. Brexit could also lead to legal uncertainty and potentially divergent national laws and regulations as the U.K. determines which E.U. laws to replace or replicate, and those laws and regulations may be cumbersome, difficult or costly in terms of
15
compliance. Any of these effects of Brexit, among others, could adversely affect our business, financial condition, operating results and cash flows.
Reductions in defense spending could adversely affect our business.
Certain of our customers operate in the defense sector and depend significantly on U.S. government spending. In August 2011, Congress enacted the Budget Control Act of 2011, which imposed spending caps and certain reductions in defense spending through 2021. Automatic spending reductions, referred to as sequestration, were implemented in March 2013. Ongoing budgetary discussions in the federal government may result in other cuts to defense spending. Reductions in defense spending that impact the aerospace and defense industries could have an adverse effect on our results of operations.
We are subject to the impact of governmental and other similar certification processes and regulations, which could adversely affect our business and results of operations.
Our operations are subject to numerous governmental laws and regulations, including those governing antitrust and competition, the environment, import and export of products, currency conversions and repatriation, taxation of foreign earnings and earnings of expatriate personnel, and use of local employees and suppliers. An inability to comply with these regulations or obtain any necessary certifications in a timely manner could have an adverse effect on our business and results of operations.
Manufacturers of electrical goods are subject to the European Union’s RoHS2 and WEEE directives, which took effect during 2006. RoHS2 prohibits the use of lead, mercury and certain other specified substances in electronics products, and WEEE makes producers of electrical goods financially responsible for specified collection, recycling, treatment, and disposal of covered electronic products and components. Parallel initiatives are being proposed in other jurisdictions, including several states in the United States and China.
We currently hold WEEE registration and are in compliance with the directives of the European Union. Under the classification of “Industrial Monitoring and Control Instruments,” our products have until July 22, 2017 to become compliant with the RoHS2 directive. Currently, only the FARO Laser Tracker ION does not meet the RoHS2 directive. If we are unable to bring the FARO Laser Tracker ION into compliance with the RoHS2 directive by July 22, 2017, we would be unable to sell the FARO Laser Tracker ION in the European Union countries and China, and potentially in several states in the United States, which could have a material adverse effect on our sales and results of operations.
Any failure to comply with the Foreign Corrupt Practices Act or similar anti-corruption laws could subject us to fines and penalties.
In 2012, our monitorship expired pursuant to our settlement with the SEC and the United States Department of Justice, or DOJ, concerning certain payments made by our subsidiary in China that may have violated the Foreign Corrupt Practices Act, or the FCPA, and other applicable laws. We are, of course, still subject to such laws and have adopted and maintain a compliance program designed to ensure compliance with these laws; however, in light of our prior conduct, any future failure to comply with any such continuing obligations could result in the SEC and the DOJ aggressively seeking to impose penalties against us. In addition, many countries in which we operate have increased regulation regarding anti-corruption practices generally. Compliance with such regulations could be costly and could adversely impact our results of operations or delay entry into new markets.
We may face difficulties managing the effects of our growth.
If our business grows rapidly in the future, we expect it to result in:
• | increased complexity; |
• | increased responsibility for existing and new management personnel; and |
• | incremental strain on our operations and financial and management systems. |
If we are not able to manage the effects of our future growth, our business, financial condition and operating results may be harmed.
16
Our dependence on suppliers for materials could impair our ability to manufacture our products.
Outside vendors provide key components used in the manufacture of our products. Any supply interruption in a limited source component would hinder our ability to manufacture our products until a new source of supply is identified. In addition, an uncorrected defect or supplier’s variation in a component, either known or unknown, or incompatibility with our manufacturing processes could hinder our ability to manufacture our products. We may not be able to find a sufficient alternative supplier in a reasonable period of time, or on commercially reasonable terms, if at all. If we fail to obtain a supplier for the manufacture of components of our potential products, we may experience delays or interruptions in our operations, which would adversely affect our business, results of operations and financial condition.
The disclosure requirements under the “conflict minerals” provisions of the Dodd-Frank Act could increase our costs and limit the supply of certain metals used in our products and affect our reputation with customers and shareholders.
Under the Dodd-Frank Wall Street Reform and Consumer Protection Act of 2010, as amended, or the Dodd-Frank Act, the SEC adopted disclosure requirements, which became effective in 2014, for public companies using certain minerals and metals in their products. These minerals and metals are generally referred to as “conflict minerals” regardless of their country of origin. Under these rules, we are required to perform due diligence and disclose our efforts to prevent the sourcing of such conflict minerals from the Democratic Republic of Congo or adjoining countries. Conflict minerals are commonly used in the manufacture of electronics and may be incorporated in our products. As a result of these regulations, we have incurred, and expect to continue to incur, additional costs to comply with the disclosure requirements, including costs related to determining the source of any of the conflict minerals used in our products. These requirements could also adversely affect the sourcing, availability and pricing of such minerals, and the pool of suppliers who provide “conflict free” metals may be limited. As a result, we or our suppliers may not be able to obtain materials necessary for production of our products in sufficient quantities or at competitive prices. In addition, since our supply chain is complex, we may not be able to sufficiently verify the origins of all metals used in our products and confirm that they are “conflict free,” which may adversely affect our reputation. Implementation of certain provisions of the rule has been delayed as a result of pending litigation challenging certain aspects of the rule. The SEC is currently reconsidering whether its previously issued guidance on the conflict minerals rule is still appropriate and whether any additional relief is appropriate. We continue to monitor these developments and their implications on us.
Risks generally associated with our information systems could adversely affect our business reputation and results of operations.
We rely on our information systems to obtain, rapidly process, analyze and manage data to, among other things:
• | facilitate the purchase and distribution of thousands of inventory items; |
• | receive, process and ship orders on a timely basis; |
• | accurately bill and collect from customers; |
• | process payments to suppliers and employees; and |
• | summarize results and manage our business. |
Our primary and back-up computer systems are subject to damage or interruption from power outages, computer and telecommunication failures, computer viruses, security breaches, natural disasters and errors by employees. Though losses arising from some of these issues would be covered by insurance, interruptions of our critical business computer systems or failure of our back-up systems could lead to a loss of sales or decreased profitability.
A cyberattack or security breach of our systems may compromise the confidentiality, integrity, or availability of our internal data and the availability of our products and websites designed to support our customers or their data. Computer hackers, foreign governments or cyber terrorists may attempt to penetrate our network security and our website. Unauthorized access to our proprietary business information or customer data may be obtained through break-ins, sabotage, breach of our secure network by an unauthorized party, computer viruses, computer denial-of-service attacks, employee theft or misuse or other misconduct. Because the techniques used by computer programmers who may attempt to penetrate and sabotage our network security or our website change frequently and may not be recognized until launched against a target, we may be unable to anticipate these techniques. It is also possible that unauthorized access to customer data may be obtained through inadequate use of security controls by customers, suppliers or other vendors. Any security breach, cyberattack or cyber security breach, and any incident involving the misappropriation, loss or other unauthorized disclosure of, or access to, sensitive or confidential customer information, whether by us or by one of our vendors, could require us to expend significant resources to remediate any damage, could interrupt our operations and damage our reputation, and could also result in regulatory enforcement actions,
17
material fines and penalties, litigation or other actions which could have a material adverse effect on our business, reputation and results of operations.
We are subject to risks of natural disasters.
The occurrence of one or more natural disasters, such as tornadoes, hurricanes, earthquakes, floods and other forms of severe weather where we have a manufacturing facility could result in physical damage to, and complete or partial closure of, our manufacturing facilities, which could adversely affect our business, operations and financial performance. Interruptions in our manufacturing operations or damage to our manufacturing facilities could reduce our revenues and increase our costs, and the extent of losses from natural disasters and severe weather will be a function of both the severity of the event and the total amount of insured exposure. Although we maintain insurance coverage, we can offer no assurance that our insurance coverage will be adequate to cover any losses or that we will be able to maintain insurance at a reasonable cost in the future. If losses from business interruption or property damage exceed the amounts for which we are insured, our business, results of operations and financial condition could be adversely affected.
We may experience volatility in our stock price.
The price of our common stock has been, and may continue to be, highly volatile in response to various factors, many of which are beyond our control, including:
• | fluctuations in demand for, and sales of, our products or prolonged downturns in the industries that we serve; |
• | actual or anticipated variations in quarterly or annual operating results; |
• | general economic uncertainties; |
• | speculation in the press or investment community; and |
• | announcements of technological innovations or new products by us or our competitors. |
The market price of our common stock may also be affected by our inability to meet analyst and investor expectations and failure to achieve projected financial results. Any failure to meet such expectations or projected financial results, even if minor, could cause the market price of our common stock to decline significantly. Volatility in our stock price may result in the inability of our shareholders to sell their shares at or above the price at which they purchased them.
Our relatively small public float and daily trading volume have in the past caused, and may in the future result in, significant volatility in our stock price. At December 31, 2016, we had approximately 16.4 million shares outstanding held by non-affiliates. Our daily trading volume for the year ended December 31, 2016 averaged approximately 122,623 shares.
In addition, stock markets have generally experienced a high level of price and volume volatility, and the market prices of equity securities of many companies have experienced wide price fluctuations not necessarily related to the operating performance of such companies. These broad market fluctuations may adversely affect the market price of our common stock. In the past, securities class action lawsuits frequently have been instituted against such companies following periods of volatility in the market price of such companies’ securities. If any such litigation is instigated against us, it could result in substantial costs and a diversion of management’s attention and resources, which could have a material adverse effect on our results of operations and financial condition.
Anti-takeover provisions in our articles of incorporation, bylaws and provisions of Florida law could delay or prevent a change of control that you may favor.
Our articles of incorporation, bylaws and provisions of Florida law could make it more difficult for a third party to acquire us. Although we believe such provisions are appropriate to protect long-term value for our shareholders, these provisions could discourage potential takeover attempts and could adversely affect the market price of our shares. Because of these provisions, you might not be able to receive a premium on your investment. These provisions include:
• | a limitation on shareholders’ ability to call a special meeting of our shareholders; |
• | advance notice requirements to nominate directors for election to our board of directors or to propose matters that can be acted on by shareholders at shareholder meetings; |
• | our classified board of directors, which means that approximately one-third of our directors are elected each year; and |
18
• | the authority of the board of directors to issue, without shareholder approval, preferred stock with such terms as the board of directors may determine. |
The provisions described above could delay or make more difficult transactions involving a change in control of the Company or our management.
ITEM 1B. UNRESOLVED STAFF COMMENTS.
None.
19
ITEM 2. PROPERTIES
The Americas
Our headquarters is located in a leased building in Lake Mary, Florida containing approximately 46,500 square feet. This facility houses our sales, marketing, customer service/application operations and administrative staff. Our U.S. production, research and development, service operations and manufacturing are located in another leased building in Lake Mary, Florida, which consists of approximately 35,000 square feet, a leased facility consisting of approximately 90,400 square feet located in Exton, Pennsylvania containing research and development, manufacturing and service operations of our FARO Laser Tracker™ and FARO Cobalt Array Imager product lines, and a leased facility consisting of approximately 15,000 square feet located in Londonderry, New Hampshire containing research and development and the service operations of our FARO Laser Projector product line. We also lease a facility in Nuevo Leon, Mexico containing service and sales operations, which consists of approximately 36,000 square feet. The facilities in the Americas region serve all of our reporting segments.
Europe/Middle East/Africa
Our Europe/Middle East/Africa (“EMEA”) headquarters is located in a leased building in Stuttgart, Germany containing approximately 105,300 square feet. This facility houses the manufacturing, administration, sales, marketing and service management personnel for our EMEA operations. Additionally, we have a leased facility consisting of approximately 15,900 square feet located in Schaffhausen, Switzerland containing manufacturing operations for our products shipped to customers in EMEA. The facilities in the EMEA region serve all of our reporting segments.
Asia-Pacific
Our Asia-Pacific headquarters is located in a leased building in Singapore containing approximately 22,000 square feet. This facility houses the administration, sales, marketing, service management personnel and manufacturing for our Asia-Pacific operations. Our Japan operations are located in a leased building in Nagoya, Japan containing approximately 15,900 square feet. This facility houses our Japanese sales, marketing and service operations. Our China operations are located in a leased building in Shanghai, China containing approximately 24,700 square feet for sales, marketing and service operations. The facilities in the Asia-Pacific region serve all of our reporting segments.
We believe our current facilities will be adequate for our foreseeable needs and that we will be able to locate suitable space for additional regional offices or enhanced production needs as necessary.
The information required by the remainder of this Item is incorporated herein by reference to Exhibit 99.1 to this Annual Report on Form 10-K.
ITEM 3. LEGAL PROCEEDINGS
We are not involved in any legal proceedings other than routine litigation arising in the normal course of business, none of which we believe will have a material adverse effect on our business, financial condition or results of operations.
ITEM 4. MINE SAFETY DISCLOSURES
Not applicable.
20
PART II
ITEM 5. MARKET FOR REGISTRANT'S COMMON EQUITY, RELATED STOCKHOLDER MATTERS AND ISSUER PURCHASES OF EQUITY SECURITIES.
Market Information and Holders
Our common stock is listed and traded on the NASDAQ Global Select Market under the symbol “FARO”.
The following table sets forth, for the periods indicated, the high and low sales prices of our common stock as reported by the NASDAQ Stock Market:
2016 | 2015 | |||||||||||||||
High | Low | High | Low | |||||||||||||
First Quarter | $ | 35.70 | $ | 20.72 | $ | 63.21 | $ | 51.79 | ||||||||
Second Quarter | 38.01 | 27.87 | 64.00 | 38.75 | ||||||||||||
Third Quarter | 36.87 | 30.20 | 47.22 | 32.95 | ||||||||||||
Fourth Quarter | 40.15 | 29.00 | 40.51 | 24.25 | ||||||||||||
As of February 17, 2017, we had 47 holders of record of common stock.
Dividends
To date, we have not paid any cash dividends on our common stock. We expect to retain future earnings for use in operating and expanding our business and we do not anticipate paying any cash dividends in the reasonably foreseeable future.
Recent Sales of Unregistered Securities
During the year ended December 31, 2016, we did not sell any equity securities that were not registered under the Securities Act.
Purchases of Equity Securities
On November 24, 2008, our Board of Directors approved a $30 million share repurchase program. Acquisitions for the share repurchase program may be made from time to time at prevailing prices, as permitted by securities laws and other legal requirements and subject to market conditions and other factors. The share repurchase program may be discontinued at any time. There is no expiration date or other restriction governing the period over which we can repurchase shares under the program. In October 2015, our Board of Directors authorized an increase to the existing share repurchase program from $30 million to $50 million. We made no stock repurchases during the year ended December 31, 2016 under this program. As of December 31, 2016, we had authorization to repurchase $18.3 million remaining under the repurchase program.
Performance Graph
The following performance graph and related information shall not be deemed “soliciting material” or to be “filed” with the SEC, nor shall such information be incorporated by reference into any future filing under the Securities Act or the Exchange Act, except to the extent that we specifically incorporate it by reference into such filing.
The following line graph compares the cumulative five-year returns of our common stock with (1) the cumulative returns of the NASDAQ Composite-Total Returns and (2) the Morningstar Scientific & Technical Instruments Index.
For purposes of preparing the graph, we assumed that an investment of $100 was made at market close on December 31, 2011, the last trading day before the beginning of our fifth preceding fiscal year, with reinvestment of any dividends at the time they were paid. We did not pay any dividends during the period indicated.
21
The comparison in the graph below is based on historical data. The stock price performance shown on the graph is not necessarily indicative of future price performance. Information used in the graph and table was obtained from Zacks Investment Research, a source believed to be reliable, but we are not responsible for any errors or omissions in such information.
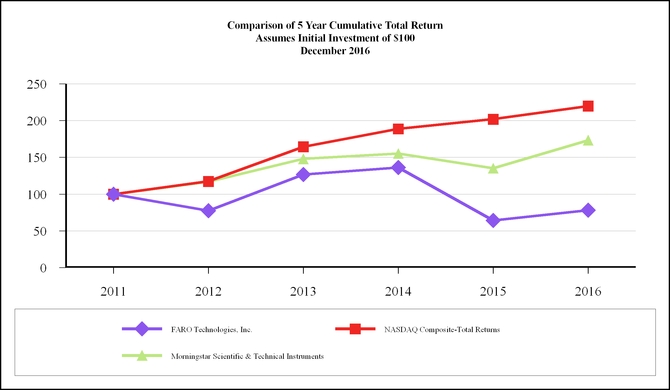
Company/Market/Peer Group | 2011 | 2012 | 2013 | 2014 | 2015 | 2016 | ||||||||||||||||||
FARO Technologies, Inc. | $ | 100.00 | $ | 77.57 | $ | 126.74 | $ | 136.26 | $ | 64.17 | $ | 78.26 | ||||||||||||
NASDAQ Composite-Total Returns | $ | 100.00 | $ | 117.45 | $ | 164.57 | $ | 188.84 | $ | 201.98 | $ | 219.89 | ||||||||||||
Morningstar Scientific & Technical Instruments | $ | 100.00 | $ | 116.93 | $ | 147.99 | $ | 155.24 | $ | 135.23 | $ | 173.35 | ||||||||||||
22
ITEM 6. SELECTED FINANCIAL DATA.
Year ended December 31, | ||||||||||||||||||||
in thousands, except share and per-share data | 2016 | 2015 | 2014 | 2013 | 2012 | |||||||||||||||
Consolidated Statement of Operations Data: | ||||||||||||||||||||
Sales | $ | 325,584 | $ | 317,548 | $ | 341,826 | $ | 291,784 | $ | 273,395 | ||||||||||
Gross profit (1) | 177,960 | 167,236 | 188,510 | 161,651 | 149,445 | |||||||||||||||
Income from operations | 13,284 | 13,122 | 37,340 | 30,154 | 31,554 | |||||||||||||||
Income before income tax expense(benefit) | 12,626 | 12,806 | 37,522 | 28,862 | 30,942 | |||||||||||||||
Net income | 11,107 | 12,813 | 33,649 | 21,509 | 22,998 | |||||||||||||||
Net income per common share: | ||||||||||||||||||||
Basic | $ | 0.67 | $ | 0.74 | $ | 1.95 | $ | 1.26 | $ | 1.36 | ||||||||||
Diluted | $ | 0.67 | $ | 0.74 | $ | 1.93 | $ | 1.25 | $ | 1.34 | ||||||||||
Weighted average shares outstanding: | ||||||||||||||||||||
Basic | 16,654,786 | 17,288,665 | 17,247,727 | 17,087,104 | 16,910,830 | |||||||||||||||
Diluted | 16,681,710 | 17,389,473 | 17,416,453 | 17,241,115 | 17,129,128 | |||||||||||||||
As at December 31, | ||||||||||||||||||||
2016 | 2015 | 2014 | 2013 | 2012 | ||||||||||||||||
Consolidated Balance Sheet Data: | ||||||||||||||||||||
Working capital (2) | $ | 219,620 | $ | 229,127 | $ | 256,170 | $ | 263,166 | $ | 232,396 | ||||||||||
Total assets | 423,714 | 409,186 | 425,463 | 391,496 | 350,807 | |||||||||||||||
Total debt-capital leases | 21 | 28 | 8 | 16 | 64 | |||||||||||||||
Total shareholders’ equity | 339,657 | 327,644 | 343,854 | 315,950 | 282,736 | |||||||||||||||
(1) | In 2016, certain prior year stock compensation expenses were reclassified between cost of sales, general and administrative, selling and marketing, and research and development expenses to reflect the appropriate departmental costs. As a result of this reclassification, gross profit for the years ended December 31, 2015, 2014, 2013 and 2012 was reduced by $0.4 million, $0.4 million, $0.2 million and $0.2 million, respectively. |
(2) | In 2015 management reassessed certain inventory policies based on the then-current sales and customer trends. As a result, we now expect our sales demonstration inventory to be held by our sales representatives for more than one year. To reflect this change in policy, we reclassified $18.5 million as of December 31, 2015 and December 31, 2014 from current assets to long-term assets, impacting the working capital calculation. Working capital as of December 31, 2013 and December 31, 2012 has not been adjusted to reflect this change in policy as it is not practical to do so. |
23
ITEM 7. MANAGEMENT'S DISCUSSION AND ANALYSIS OF FINANCIAL CONDITION AND RESULTS OF OPERATIONS.
The following information should be read in conjunction with our Consolidated Financial Statements, including the notes thereto, included in Part II, Item 8 of this Annual Report on Form 10-K.
Overview
We design, develop, manufacture, market and support software driven, three-dimensional (3D) measurement, imaging and realization systems. This technology permits high-precision 3D measurement, imaging and comparison of parts and complex structures within production and quality assurance processes. Our devices are used for inspection of components and assemblies, rapid prototyping, reverse engineering, documenting large volume or structures in 3D, surveying and construction as well as for investigation and reconstruction of accident sites or crime scenes. We sell the majority of our products through a direct sales force across a broad number of customers in a range of manufacturing, industrial, architecture, surveying, building information modeling, construction, public safety forensics, cultural heritage and other applications. Our FaroArm®, FARO Laser ScanArm®, FARO Gage®, FARO Laser TrackerTM, FARO Laser Projector, FARO Cobalt Array Imager, and their companion CAM2® and BuildIT software solutions, provide for Computer-Aided Design, or CAD, based inspection, factory-level statistical process control, high-density surveying and laser-guided assembly and production. Together, these products integrate the measurement, quality inspection, and reverse engineering functions with CAD and 3D software to improve productivity, enhance product quality, and decrease rework and scrap in the manufacturing process, mainly supporting applications in our Factory Metrology vertical. Our FARO Focus and FARO Scanner Freestyle3DX laser scanners, and their companion SCENE, FARO PointSense, and FARO public safety forensics software offerings, are utilized for a wide variety of 3D modeling, documentation and high-density surveying applications in our Construction Building Information Modeling - Construction Information Management (“Construction BIM-CIM”) and Public Safety Forensics verticals. Our FARO Laser ScanArm®, FARO Cobalt Array Imager, FARO Scanner Freestyle3DX laser scanners and their companion SCENE software also enable a fully digital workflow used to capture real world geometry for the purpose of empowering design, enabling innovation, and speeding up the design cycle, supporting our Product Design vertical. FARO Visual InspectTM enables large, complex 3D CAD data to be transferred to a tablet device and then used for mobile visualization and comparison to real world conditions, facilitating in-process inspection, assembly, guidance and positioning for applications in our Factory Metrology and Construction BIM-CIM verticals.
We derive our revenues primarily from the sale of our measurement equipment and their related multi-faceted software programs. Revenue related to these products is generally recognized upon shipment. In addition, we sell extended warranties and training and technology consulting services relating to our products. We recognize the revenue from extended warranties on a straight-line basis over the term of the warranty, and revenue from training and technology consulting services when the services are provided.
We operate in international markets throughout the world and maintain sales offices in Australia, Brazil, Canada, China, France, Germany, India, Italy, Japan, Malaysia, Mexico, the Netherlands, Poland, Portugal, Singapore, South Korea, Spain, Switzerland, Thailand, Turkey, the United Kingdom, the United States, and Vietnam.
We manufacture our FaroArm®, FARO Laser ScanArm®, FARO Gage®, and FARO Laser TrackerTM products in our manufacturing facility located in Switzerland for customer orders from the EMEA region, in our manufacturing facility located in Singapore for customer orders from the Asia-Pacific region, and in our manufacturing facilities located in Florida and Pennsylvania for customer orders from the Americas. We manufacture our FARO Focus and FARO Scanner Freestyle3DX products in our facilities located in Germany and Switzerland. We manufacture our FARO Laser Projection products in our facility located in Pennsylvania. We expect all of our existing plants to have the production capacity necessary to support our volume requirements through 2017.
We account for wholly owned foreign subsidiaries in the currency of the respective foreign jurisdiction; therefore, fluctuations in exchange rates may have an impact on the value of the intercompany account balances denominated in different currencies and reflected in our condensed consolidated financial statements. We are aware of the availability of off-balance sheet financial instruments to hedge exposure to foreign currency exchange rates, including cross-currency swaps, forward contracts and foreign currency options. However, we have not used such instruments in the past, and none were utilized in 2016, 2015 or 2014.
24
Executive Summary
Our total sales in 2016 increased $8.1 million, or 2.5%, to $325.6 million for the year ended December 31, 2016 from $317.5 million for the year ended December 31, 2015. This increase reflected improved service revenue compared with the prior year, offset by a decrease in product sales. In 2016, we initiated a broad-reaching renewal of FARO to drive sales growth and increase operating efficiencies through several key initiatives. These initiatives include:
Global reorganization – In 2016, we reorganized our business to align our sales, marketing, product management and R&D to specific vertical markets and better define our end market applications. We believe this realignment will enable us to focus our product offerings and selling approach to meet the specific needs of our customers. As a result of the reorganization, we realigned our business into the following three reporting segments, which incorporate our specific vertical markets:
◦ | Factory Metrology – provides solutions for manual and automated measurement and inspection in an industrial or manufacturing environment. Applications include alignment, part inspection, dimensional analysis, first article inspection, incoming and in-process inspection, machine calibration, non-contact inspection, robot calibration, tool building and set up, and assembly guidance. |
◦ | Construction BIM-CIM – provides solutions for as-built data capturing and 3D visualization in building information modeling or construction information management applications, allowing our customers in the architecture, engineering and construction markets to quickly and accurately extract desired 2D and 3D measurement points. Applications include as-build documentation, construction monitoring, surveying, asset and facility management, and heritage preservation. |
◦ | Other – The Other segment includes our Product Design, Public Safety Forensics and 3D Solutions vertical organizations. |
▪ | Product Design – provides advanced 3D solutions to assist in the engineering or design of a movable object, enabling a fully digital workflow. Applications include reverse engineering and virtual simulation. |
▪ | Public Safety Forensics – provides solutions to public safety officials and professionals to capture environmental or situational scenes in 2D and 3D for crime, crash and fire scene investigations and environmental safety evaluations. |
▪ | 3D Solutions – provides solutions to customers who require customized 3D measurement and realization solutions not otherwise addressed by our off-the-shelf product offerings. |
The prior period presentations throughout this Annual Report on Form 10-K have been restated to reflect the change in reporting segments.
Product innovation – In 2016, we launched several new products including:
◦ | FARO FocusS Laser Scanner – This new laser scanner includes an increased measurement range and an accessory bay for customer add-on devices, and features safeguards against intrusions such as dirt, dust and other outdoor elements. |
◦ | FARO Cobalt Array Imager – The FARO Cobalt Array Imager is our next generation FARO Imager product offering, replacing the FARO 3D Imager AMP. The FARO Cobalt Array Imager is a metrology-grade non-contact scanner that utilizes blue light technology to capture millions of high resolution 3D coordinate measurements in seconds. FARO Cobalt’s versatility supports a variety of deployment options including rotary table, robot, industrial inspection cells and multiple imager arrays. This technology is used in quality control to improve product quality and reduce scrap, as well as for reverse engineering and rapid manufacturing. |
◦ | FARO VantageE – This addition to the Vantage Laser Tracker product line includes well-proven features and capabilities such as high-speed dynamic measurement, with an affordable price for customers who demand high performance while working with short-to-medium range applications. |
Acquisitions – During 2016, we acquired:
◦ | BuildIT Software & Solutions Ltd. (“BuildIT”) – Located in Montreal, Canada, BuildIT specializes in process-configurable 3D metrology software solutions with hardware agnostic interfaces. The acquisition |
25
enhances our Factory Metrology portfolio, providing customers greater software options to use in a variety of applications to reduce inspection and assembly times and increase productivity.
◦ | Laser Projection Technologies, Inc. (“LPT”) – Located in Londonderry, New Hampshire, LPT specializes in laser projection and measurement systems used throughout manufacturing environments around the globe to maximize productivity and efficiency. The acquisition enhances our portfolio of 3D measurement solutions and supports our long-term strategy to expand our presence in key markets. |
◦ | MWF-Technology GmbH (“MWF”) – Located near Frankfurt, Germany, MWF is an innovator in mobile augmented reality solutions, with breakthrough technology that enables large, complex 3D CAD data to be transferred to a tablet device and then used for mobile visualization and comparison to real world conditions. This enables real time, actionable manufacturing insight for in-process inspection, assembly, guidance and positioning. |
Sales modernization – To support our future growth, we modernized our sales process by leveraging our current direct sales approach of on-site demonstrations with multimedia, web-based demonstrations and cloud-based customer relations development.
Global harmonization – We reorganized all functions, processes and people to a harmonized global mindset from our historically regional business structure. The reorganization is expected to increase operating efficiency by harmonizing our global manufacturing and business support functions, including among other items, the implementation of uniform sales terms and conditions, global demonstration and service loaner inventory management, and a global human resources information system (HRIS).
We will continue to drive these initiatives though the 2017 fiscal year to achieve long-term growth and profitability. Our ability to fully implement these initiatives to reorganize our business around certain vertical markets, modernize our sales processes to improve the efficiency of our sales organization, accelerate and maintain a consistent schedule of new product introductions, and harmonize our global functions to improve operational effectiveness is dependent upon a number of factors, including the continued improvements to our new ERP system, continued development of our products to maintain our technological advantage, and retention of key employees.
26
Results of Operations
2016 Compared to 2015
Years ended December 31, | ||||||||||||||||
2016 | 2015 | Change | ||||||||||||||
(dollars in millions) | % of Sales | % of Sales | 2016 vs 2015 | |||||||||||||
Sales | $ | 325.6 | 100.0 | % | $ | 317.5 | 100.0 | % | $ | 8.1 | ||||||
Cost of sales | 147.6 | 45.3 | % | 150.3 | 47.3 | % | (2.7 | ) | ||||||||
Gross profit | 178.0 | 54.7 | % | 167.2 | 52.7 | % | 10.8 | |||||||||
Operating expenses | ||||||||||||||||
Selling and marketing | 79.9 | 24.5 | % | 79.8 | 25.1 | % | 0.1 | |||||||||
General and administrative | 40.8 | 12.5 | % | 36.4 | 11.5 | % | 4.4 | |||||||||
Depreciation and amortization | 13.9 | 4.3 | % | 11.2 | 3.5 | % | 2.7 | |||||||||
Research and development | 30.1 | 9.2 | % | 26.7 | 8.4 | % | 3.4 | |||||||||
Total operating expenses | 164.7 | 50.6 | % | 154.1 | 48.5 | % | 10.6 | |||||||||
Other expense (income) | 0.7 | 0.2 | % | 0.3 | 0.1 | % | 0.4 | |||||||||
Income tax expense (benefit) | 1.5 | 0.5 | % | — | — | % | 1.5 | |||||||||
Net income | $ | 11.1 | 3.4 | % | $ | 12.8 | 4.0 | % | $ | (1.7 | ) | |||||
Consolidated Results
Sales. Total sales increased $8.1 million, or 2.5%, to $325.6 million for the year ended December 31, 2016 from $317.5 million for the year ended December 31, 2015. Our sales increase was primarily driven by higher service revenue and a modest increase in average selling prices, partially offset by a decrease in product sales. Total product sales decreased by $3.8 million, or 1.5%, to $256.0 million for the year ended December 31, 2016 from $259.8 million for the year ended December 31, 2015. Our product sales decrease reflected a decline in unit sales partially offset by an increase in average selling prices in our products. Service revenue increased by $11.9 million, or 20.6%, to $69.6 million for the year ended December 31, 2016 from $57.7 million for the year ended December 31, 2015, primarily due to an increase in warranty and customer service revenue driven by the growth of our installed, serviceable base and focused sales initiatives. Foreign exchange rates had a slightly negative impact on sales of $1.8 million, decreasing our overall sales growth by 0.6 percentage points, primarily due to the decline of the British pound sterling and the Chinese yuan renminbi relative to the U.S. dollar.
Gross profit. Gross profit increased by $10.8 million, or 6.4%, to $178.0 million for the year ended December 31, 2016 from $167.2 million for the year ended December 31, 2015. Gross margin increased to 54.7% for the year ended December 31, 2016 from 52.7% in the prior year period. Gross margin from product revenue increased by 1.8 percentage points to 57.8% for the year ended December 31, 2016 from 56.0% in the prior year period. This increase was primarily due to higher average selling prices in our products and a lower write-down of inventory, partially offset by increased sales of service and demonstration inventory which results in lower gross margins. Gross margin from service revenue increased by 5.5 percentage points to 43.0% for the year ended December 31, 2016 from 37.5% for the prior year period, primarily due to higher warranty and customer service revenue.
Selling and Marketing Expenses. Selling and marketing expenses were virtually flat year-over-year as a result of increased compensation expenses reflecting higher headcount, higher incentive compensation, and higher base salaries from a change in our commission structure as well as higher recruiting-related expense, almost entirely offset by lower costs resulting from not holding our annual sales meeting in 2016 and a decrease in commissions due to lower product sales and the change in
27
our commission structure. Selling and marketing expenses as a percentage of sales were 24.5% for the year ended December 31, 2016 compared with 25.1% for the year ended December 31, 2015.
Selling headcount is a key driver of our sales growth. We look at selling headcount from two perspectives: actual period-ending headcount and a time-weighted average experienced headcount, which we refer to as Full Time Experienced (“FTE”) headcount, over the trailing four quarters. To determine selling FTE headcount, we discount the first year of a new employee by an experience factor to better correlate sales effectiveness with headcount, and we weight the number of months employed on a full-time or part-time basis. Our worldwide selling actual period-ending headcount increased by 85, or 18.8%, to 536 at December 31, 2016 from 451 at December 31, 2015. Selling FTE headcount increased by 29, or 6.3%, to 486 at December 31, 2016 from 457 at December 31, 2015.
General and administrative expenses. General and administrative expenses increased by $4.4 million, or 12.2%, to $40.8 million, for the year ended December 31, 2016 from $36.4 million for the year ended December 31, 2015. The increase in general and administrative expenses was primarily driven by higher compensation expense due to higher headcount, higher incentive compensation, increased recruiting costs and higher costs related to businesses acquired, partially offset by lower year-over-year consulting fees. General and administrative expenses were 12.5% of sales for the year ended December 31, 2016 compared to 11.5% of sales in the prior year.
Depreciation and amortization expenses. Depreciation and amortization expenses increased by $2.7 million, or 23.6%, to $13.9 million for the year ended December 31, 2016 from $11.2 million for the year ended December 31, 2015, primarily due to increased depreciation for our new ERP system and service inventory that was transferred to fixed assets, as well as increased amortization of intangibles related to our prior and current year acquisitions.
Research and development expenses. Research and development expenses increased $3.4 million, or 12.9%, to $30.1 million for the year ended December 31, 2016 from $26.7 million for the year ended December 31, 2015. This increase was mainly due to higher project material costs and higher compensation expense resulting from increased engineering headcount in connection with our initiative to accelerate new product development and introductions, and an overall increase in incentive compensation. Research and development expenses as a percentage of sales increased to 9.2% for the year ended December 31, 2016 from 8.4% for the year ended December 31, 2015.
Other expense (income). Other expense increased by $0.4 million to $0.7 million for the year ended December 31, 2016 compared with $0.3 million for the year ended December 31, 2015. The increase was primarily driven by foreign exchange transaction losses resulting from the negative impact of changes in foreign exchange rates on the value of the current intercompany account balances of our subsidiaries denominated in other currencies.
Income tax (benefit) expense. Income tax expense for the year ended December 31, 2016 was $1.5 million compared with income tax benefit of $7,000 for the year ended December 31, 2015. This change was primarily the result of a shift in the distribution of profits and losses among our tax jurisdictions. Our effective tax rate was 12.0% for the year ended December 31, 2016 compared with (0.1%) in the prior year. Our effective tax rate continues to be lower than the statutory tax rate in the United States reflecting primarily our global footprint in foreign jurisdictions with lower tax rates. Our effective tax rate could be impacted positively or negatively by geographic changes in the manufacturing or sales of our products and a change in statutory tax rates in a jurisdiction, as well as the resulting effect on taxable income in each jurisdiction.
Net income. Net income was $11.1 million for the year ended December 31, 2016 compared with $12.8 million for the year ended December 31, 2015 reflecting the impact of the factors described above.
Segment Results
We use segment profit to evaluate the performance of our reportable segments, which are Factory Metrology, Construction BIM-CIM and Other. Segment profit is calculated as gross profit, net of selling and marketing expenses, for the reporting segment. The discussion of segment results for the years ended December 31, 2016 and 2015 presented below is based on segment profit, as described above, and segment profit as a percent of sales, which is calculated as segment profit divided by net sales for such reporting segment. Our definition of segment profit may not be comparable to similarly titled measures reported by other companies. For additional information, including a reconciliation of total segment profit to income from operations, see Note 17 to the “Notes to Consolidated Financial Statements” included in Part II, Item 8 of this Annual Report on Form 10-K.
28
Factory Metrology | |||||||
(dollars in millions) | December 31, 2016 | December 31, 2015 | |||||
Net sales | $ | 236.3 | $ | 222.7 | |||
Segment profit | $ | 69.8 | $ | 63.5 | |||
Segment profit as a % of Sales | 29.5 | % | 28.5 | % | |||
Sales. Sales in our Factory Metrology segment increased $13.6 million, or 6.1%, to $236.3 million for the year ended December 31, 2016 from $222.7 million in the prior year primarily reflecting higher average selling prices and higher service revenue across all of our regions, partially offset by a decline in units sold mainly in the EMEA region. Foreign exchange rates had a negative impact on sales of $1.5 million, decreasing sales growth by 0.7 percentage points.
Segment profit. Segment profit in our Factory Metrology segment increased $6.3 million, or 9.9%, to $69.8 million for the year ended December 31, 2016 from $63.5 million in the prior year. This increase was primarily due to the increase in segment sales in addition to a higher write-down of inventory recorded in 2015 compared to 2016, partially offset by an increase in selling and marketing expenses reflecting higher headcount allocated to this segment partially offset by cost savings due to not holding the annual sales meeting in 2016.
Construction BIM-CIM | |||||||
(dollars in millions) | December 31, 2016 | December 31, 2015 | |||||
Net sales | $ | 65.1 | $ | 70.8 | |||
Segment profit | $ | 18.3 | $ | 16.3 | |||
Segment profit as a % of Sales | 28.1 | % | 23.0 | % | |||
Sales. Sales in our Construction BIM-CIM segment decreased $5.7 million, or 8.1%, to $65.1 million for the year ended December 31, 2016 from $70.8 million in the prior year primarily reflecting a decline in units sold mostly in the Americas and the EMEA regions, partially offset by an increase in average selling prices and higher service revenue across all of our regions. Foreign exchange rates had a slightly negative impact on sales of $0.1 million, decreasing sales growth by 0.2 percentage points.
Segment profit. Segment profit in our Construction BIM-CIM segment increased $2.0 million, or 12.3%, to $18.3 million for the year ended December 31, 2016 from $16.3 million in the prior year. This increase was primarily due to the increase in service revenue, a slight decline in selling and marketing expenses reflecting cost savings due to not holding the annual sales meeting in 2016, and a higher write-down of inventory recorded in 2015 compared to 2016, partially offset by a decrease in product sales.
Other | |||||||
(dollars in millions) | December 31, 2016 | December 31, 2015 | |||||
Net sales | $ | 24.2 | $ | 24.0 | |||
Segment profit | $ | 10.0 | $ | 7.6 | |||
Segment profit as a % of Sales | 41.3 | % | 31.7 | % | |||
Sales. Sales in our Other segment increased $0.2 million, or 0.8%, to $24.2 million for the year ended December 31, 2016 from $24.0 million in the prior year primarily reflecting higher average selling prices mostly in the Americas region, and higher service revenue across all of our regions, partially offset by a decline in unit sales particularly in the EMEA region. Foreign exchange rates had a slightly negative impact on sales of $0.2 million, decreasing sales growth by 0.6 percentage points.
Segment profit. Segment profit in our Other segment increased $2.4 million, or 31.6%, to $10.0 million for the year ended December 31, 2016 from $7.6 million in the prior year. This increase was primarily due to a shift in our product and
29
service sales mix resulting in higher gross margins, partially offset by an increase in selling and marketing expenses reflecting higher headcount and cost savings due to not holding the annual sales meeting in 2016.
2015 Compared to 2014
Years ended December 31, | ||||||||||||||||
2015 | 2014 | Change | ||||||||||||||
(dollars in millions) | % of Sales | % of Sales | 2015 vs 2014 | |||||||||||||
Sales | $ | 317.5 | 100.0 | % | $ | 341.8 | 100.0 | % | $ | (24.3 | ) | |||||
Cost of sales | 150.3 | 47.3 | % | 153.3 | 44.9 | % | (3.0 | ) | ||||||||
Gross profit | 167.2 | 52.7 | % | 188.5 | 55.1 | % | (21.3 | ) | ||||||||
Operating expenses | ||||||||||||||||
Selling and marketing | 79.8 | 25.1 | % | 80.8 | 23.6 | % | (1.0 | ) | ||||||||
General and administrative | 36.4 | 11.5 | % | 35.4 | 10.4 | % | 1.0 | |||||||||
Depreciation and amortization | 11.2 | 3.5 | % | 7.4 | 2.2 | % | 3.8 | |||||||||
Research and development | 26.7 | 8.4 | % | 27.6 | 8.1 | % | (0.9 | ) | ||||||||
Total operating expenses | 154.1 | 48.5 | % | 151.2 | 44.2 | % | 2.9 | |||||||||
Other expense (income) | 0.3 | 0.1 | % | (0.2 | ) | (0.1 | )% | 0.5 | ||||||||
Income tax expense (benefit) | — | — | % | 3.9 | 1.1 | % | (3.9 | ) | ||||||||
Net income | $ | 12.8 | 4.0 | % | $ | 33.6 | 9.8 | % | $ | (20.8 | ) | |||||
Consolidated Results
Sales. Total sales decreased $24.3 million, or 7.1%, to $317.5 million for the year ended December 31, 2015 from $341.8 million for the year ended December 31, 2014. The lower sales reflected a $24.3 million unfavorable impact of foreign exchange rates primarily due to a weakening of the Euro, Japanese yen and Brazilian real relative to the U.S. dollar. Excluding the foreign exchange rate impact, sales for the year ended December 31, 2015 would have been about even compared with the year ended December 31, 2014. Our sales results were primarily driven by a decline in product sales, offset by increased service revenue. Total product sales decreased by $24.3 million, or 8.6%, to $259.8 million for the year ended December 31, 2015 from $284.1 million for the year ended December 31, 2014. Our product sales decrease was primarily driven by a decline in unit sales, partially offset by an increase in average selling prices as well as the favorable sales impact resulting from new product launches in 2015. Service revenue totaled $57.7 million for both the years ended December 31, 2015 and 2014, reflecting an increase in warranty revenue offset by the unfavorable impact from foreign exchange rates.
Gross profit. Gross profit was $167.2 million for the year ended December 31, 2015 compared with $188.5 million for the year ended December 31, 2014. The decrease of $21.3 million, or 11.3%, reflected primarily unfavorable foreign exchange rates, lower product sales and an increase in our inventory reserve recorded in the third quarter of 2015. Gross margin was 52.7% for the year ended December 31, 2015 compared with 55.1% in the prior year. Gross margin from product sales was 56.0% for the year ended December 31, 2015 compared with 59.4% in the prior year. This decrease was primarily the result of an increase in the inventory reserve and higher manufacturing costs as a percent of sales consistent with lower sales volume, partially offset by higher average selling prices. Gross margin from service revenue increased by 3.5 percentage points to 37.5% for the year ended December 31, 2015 from 34.0% for the year ended December 31, 2014, primarily reflecting higher warranty revenue and lower service costs.
Selling and Marketing Expenses. Selling and marketing expenses were $79.8 million for the year ended December 31, 2015 compared with $80.8 million for the year ended December 31, 2014. The lower selling and marketing
30
expenses of $1.0 million, or 1.2%, primarily reflected lower sales commissions, partially offset by an increase in headcount driven by our two acquisitions completed in 2015. Selling and marketing expenses as a percentage of sales increased to 25.1% for the year ended December 31, 2015 compared with 23.6% for the year ended December 31, 2014 primarily due to lower net sales.
Our worldwide selling actual period-ending headcount increased by 17, or 3.9%, to 451 at December 31, 2015 from 434 at December 31, 2014. Selling FTE headcount increased by 44, or 10.6%, to 457 at December 31, 2015 from 413 at December 31, 2014.
General and administrative expenses. General and administrative expenses were $36.4 million for the year ended December 31, 2015 compared with $35.4 million for the year ended December 31, 2014. The increase in general and administrative expenses reflected primarily severance costs relating to cost reduction initiatives, as well as higher advisory and consulting fees to support our ERP implementation, acquisition expenses and other professional fees. General and administrative expenses as a percentage of sales increased to 11.5% for the year ended December 31, 2015 from 10.4% for the year ended December 31, 2014.
Depreciation and amortization expenses. Depreciation and amortization expenses were $11.2 million for the year ended December 31, 2015 compared with $7.4 million for the year ended December 31, 2014. This increase of $3.8 million reflected primarily our Exton facility, implementation of our ERP system, and amortization expense related to our recent acquisitions.
Research and development expenses. Research and development expenses were $26.7 million for the year ended December 31, 2015 compared with $27.6 million for the year ended December 31, 2014. The lower expenses primarily reflected a reduction in high-cost contractor expenses, timing of product development activities, and the impact of favorable foreign exchange rates, partially offset by an impairment charge related to the discontinuation of a licensing agreement. Research and development expenses as a percentage of sales increased to 8.4% for the year ended December 31, 2015 from 8.1% for the year ended December 31, 2014.
Other expense (income). Other expense (income) changed by $0.5 million to $0.3 million of expense for the year ended December 31, 2015 compared with $0.2 million of income for the year ended December 31, 2014. The change was primarily driven by foreign exchange transaction losses resulting from changes in foreign exchange rates on the value of the current intercompany account balances of our subsidiaries denominated in other currencies.
Income tax expense (benefit). Income tax benefit for the year ended December 31, 2015 was $7,000 compared with income tax expense of $3.9 million for the year ended December 31, 2014. This change was primarily due to lower pre-tax income offset partially by a discrete tax benefit of $4.5 million related to the reversal of a valuation allowance in 2014. Our effective tax rate was (0.1%) for the year ended December 31, 2015 compared with 10.3% in the prior year. Our effective tax rate continues to be lower than the statutory tax rate in the United States primarily due to our global footprint in foreign jurisdictions with lower tax rates. In particular, the low tax rate recognized in 2015 primarily reflected higher operating income in jurisdictions like Switzerland and operating losses in our jurisdictions that have a higher statutory tax rate, such as the United States and Germany. Our effective tax rate could be impacted positively or negatively by geographic changes in the manufacturing or sales of our products and a change in statutory tax rates in a jurisdiction, as well as the resulting effect on taxable income in each jurisdiction.
Net income. Net income was $12.8 million for the year ended December 31, 2015 compared with $33.6 million for the year ended December 31, 2014 reflecting the impact of the factors described above.
Segment Results
Factory Metrology | |||||||
(dollars in millions) | December 31, 2015 | December 31, 2014 | |||||
Net sales | $ | 222.7 | $ | 246.2 | |||
Segment profit | $ | 63.5 | $ | 76.1 | |||
Segment profit as a % of Sales | 28.5 | % | 30.9 | % | |||
31
Sales. Sales in our Factory Metrology segment decreased $23.5 million, or 9.5%, to $222.7 million for the year ended December 31, 2015 from $246.2 million in the prior year. Foreign exchange rates had a negative impact on sales of $17.4 million, decreasing sales growth by 7.1 percentage points. The decrease in Factory Metrology sales primarily reflected a decline in unit sales across all of our regions and lower average selling prices in the EMEA and Asia-Pacific regions.
Segment profit. Segment profit in our Factory Metrology segment decreased $12.6 million, or 16.6%, to $63.5 million for the year ended December 31, 2015 from $76.1 million in the prior year. This decrease was primarily due to unfavorable foreign exchange rates, lower product sales and an increase in our inventory reserve recorded in the third quarter of 2015, partially offset by a slight decrease in selling and marketing expenses due to lower sales commissions.
Construction BIM-CIM | |||||||
(dollars in millions) | December 31, 2015 | December 31, 2014 | |||||
Net sales | $ | 70.8 | $ | 75.4 | |||
Segment profit | $ | 16.3 | $ | 24.5 | |||
Segment profit as a % of Sales | 23.0 | % | 32.5 | % | |||
Sales. Sales in our Construction BIM-CIM segment decreased $4.6 million, or 6.1%, to $70.8 million for the year ended December 31, 2015 from $75.4 million in the prior year period. Foreign exchange rates had a negative impact on sales of $5.9 million, decreasing sales growth by 7.8 percentage points. The decrease in Construction BIM-CIM sales primarily reflected a decline in units sold, mostly in the Americas and EMEA regions, partially offset by increased average selling prices in the Americas region as well as the favorable sales impact resulting from new product launches during the first quarter of 2015.
Segment profit. Segment profit in our Construction BIM-CIM segment decreased $8.2 million, or 33.5%, to $16.3 million for the year ended December 31, 2015 from $24.5 million in the prior year. This decrease was primarily due to unfavorable foreign exchange rates, lower product sales, an increase in our inventory reserve recorded in the third quarter of 2015, and a slight increase in selling and marketing expenses driven by increased headcount and partially offset by lower sales commissions.
Other | |||||||
(dollars in millions) | December 31, 2015 | December 31, 2014 | |||||
Net sales | $ | 24.0 | $ | 20.2 | |||
Segment profit | $ | 7.6 | $ | 7.1 | |||
Segment profit as a % of Sales | 31.7 | % | 35.1 | % | |||
Sales. Sales in our Other segment increased $3.8 million, or 18.8%, to $24.0 million for the year ended December 31, 2015 from $20.2 million in the prior year. Foreign exchange rates had a negative impact on sales of $1.0 million, decreasing sales growth by 5.1 percentage points. The increase in sales for the Other segment primarily reflected increased unit sales and strong service revenue, particularly in the Americas region.
Segment profit. Segment profit in our Other segment increased $0.5 million, or 7.0%, to $7.6 million for the year ended December 31, 2015 from $7.1 million in the prior year. This increase was primarily due to the increase in sales, partially offset by unfavorable foreign exchange rates and a slight increase in selling and marketing expenses driven by increased headcount and higher sales commissions.
Liquidity and Capital Resources
Cash and cash equivalents decreased by $1.2 million to $106.2 million at December 31, 2016 from $107.4 million at December 31, 2015. The decrease was primarily driven by cash paid for acquisitions during the year ended December 31, 2016, mostly offset by improved cash flow from operations.
Cash flows from operating activities provide our primary source of liquidity. We generated positive cash flows from operations of $37.6 million during the year ended December 31, 2016 compared to cash provided by operations of $28.0
32
million during the year ended December 31, 2015. The increase was mainly due to lower inventory levels as well as the impact of prepaid expenses and other assets and accounts payable and accrued liabilities during the year ended December 31, 2016 compared with the year ended December 31, 2015.
Cash flows used in investing activities during the year ended December 31, 2016 and December 31, 2015 were $37.1 million and $6.4 million, respectively. The increase in cash used in investing activities was primarily due to the change in proceeds from the sale of investments and the increase in cash paid as consideration for the three acquisitions completed during the year ended December 31, 2016 compared to the two acquisitions completed during the year ended December 31, 2015.
Cash flows provided by financing activities during the year ended December 31, 2016 were $0.2 million compared with cash flows used in financing activities of $20.2 million during the year ended December 31, 2015. The change was primarily due to the repurchase of common stock during the year ended December 31, 2015.
Of our cash and cash equivalents, $87.3 million was held by foreign subsidiaries as of December 31, 2016. Our current intent is to indefinitely reinvest these funds in our foreign operations, as the cash is needed to fund on-going operations. In the event circumstances change, leading to the conclusion that these funds will not be indefinitely reinvested, we would need to accrue at the time of such determination for the income taxes that would be triggered upon their repatriation.
On November 24, 2008, our Board of Directors approved a $30 million share repurchase program. Acquisitions for the share repurchase program may be made from time to time at prevailing prices as permitted by securities laws and other legal requirements, and subject to market conditions and other factors. The share repurchase program may be discontinued at any time. There is no expiration date or other restriction governing the period over which we can repurchase shares under the program. In October 2015, our Board of Directors authorized an increase to the existing share repurchase program from $30 million to $50 million. We made no stock repurchases during the year ended December 31, 2016 and $22.8 million during the year ended December 31, 2015 under this program. As of December 31, 2016, we had authorization to repurchase $18.3 million remaining under the repurchase program.
We believe that our working capital and anticipated cash flow from operations will be sufficient to fund our long-term liquidity operating requirements for the foreseeable future.
We have no off balance sheet arrangements.
Contractual Obligations and Commercial Commitments
We are party to capital leases on equipment with an initial term of 36 to 60 months and other non-cancelable operating leases. These obligations are presented below as of December 31, 2016 (dollars in thousands):
Payments Due by Period | ||||||||||||||||||||
Contractual Obligations | Total | < 1 Year | 1-3 Years | 3-5 Years | > 5 Years | |||||||||||||||
Operating lease obligations | $ | 23,363 | $ | 6,620 | $ | 8,573 | $ | 3,653 | $ | 4,517 | ||||||||||
Capital lease obligations | 21 | 8 | 13 | |||||||||||||||||
Purchase obligations | 59,692 | 29,380 | 30,312 | |||||||||||||||||
Other obligations | 2,100 | 2,100 | ||||||||||||||||||
Total | $ | 85,176 | $ | 36,008 | $ | 40,998 | $ | 3,653 | $ | 4,517 | ||||||||||
We enter into purchase commitments for products and services in the ordinary course of business. These purchases generally cover production requirements for 60 to 120 days as well as materials necessary to service customer units through the product lifecycle and for warranty commitments. As of December 31, 2016 we had approximately $29.4 million in purchase commitments that are expected to be delivered within the next 12 months. To ensure adequate component availability in preparation for new product introductions, we also had $30.3 million in long-term commitments for purchases to be delivered after 12 months. Other obligations included in the table primarily represent estimated payments due for acquisition related earn-outs. We had a $0.3 million liability for unrecognized tax benefits that is excluded from the contractual obligations table due to the uncertainty of the period of settlement, if any, with the respective taxing authorities.
Inflation
Inflation did not have a material impact on our results of operations in recent years, and we do not expect inflation to have a material impact on our operations in 2017.
33
Critical Accounting Policies
The preparation of our consolidated financial statements requires our management to make estimates and assumptions that affect the reported amounts of assets, liabilities, revenues, and expenses, as well as disclosure of contingent assets and liabilities. We base our estimates on historical experience, along with various other factors believed to be reasonable under the circumstances, the results of which form the basis for making judgments about the carrying value of assets and liabilities that are not readily apparent from other sources. Some of these judgments can be subjective and complex and, consequently, actual results may differ from these estimates under different assumptions or conditions. While for any given estimate or assumption made by our management there may be other estimates or assumptions that are reasonable, we believe that, given the current facts and circumstances, it is unlikely that applying any such other reasonable estimate or assumption would materially impact the financial statements.
In response to the SEC’s financial reporting release, FR-60, “Cautionary Advice Regarding Disclosure About Critical Accounting Policies,” we have selected our critical accounting policies for purposes of explaining the methodology used in our calculation, in addition to any inherent uncertainties pertaining to the possible effects on our financial condition. The critical policies discussed below are our processes of recognizing revenue, the reserve for excess and obsolete inventory, income taxes, the reserve for warranties, goodwill impairment, business combinations and stock-based compensation. These policies affect current assets, current liabilities and operating results and are therefore critical in assessing our financial and operating status. These policies involve certain assumptions that, if incorrect, could have an adverse impact on our operations and financial position.
Revenue Recognition
Revenue is recognized when the price is fixed, collectability is reasonably assured, the title and risks and rewards of ownership have passed to the customer, and the earnings process is complete. Revenue related to our measurement, imaging, and realization equipment and related software is generally recognized upon shipment, as we consider the earnings process complete as of the shipping date. Fees billed to customers associated with the distribution of products are classified as revenue. We warrant our products against defects in design, materials and workmanship for one year. A provision for estimated future costs relating to warranty expense is recorded when products are shipped. We separately sell extended warranties. Extended warranty revenues are recognized on a straight-line basis over the term of the warranty. Costs relating to extended warranties are recognized as incurred. Revenue from sales of software only is recognized when no further significant production, modification or customization of the software is required and when the following criteria are met: persuasive evidence of a sales agreement exists, delivery has occurred, and the sales price is fixed or determinable and deemed collectible. These software arrangements generally include short-term maintenance that is considered post-contract support (“PCS”). We generally establish vendor-specific objective evidence (“VSOE”) of fair value for this PCS component based on our maintenance renewal rate. Maintenance renewals, when sold, are recognized on a straight-line basis over the term of the maintenance agreement. Revenues resulting from sales of comprehensive support, training and technology consulting services are recognized as such services are performed and are deferred when billed in advance of the performance of services. Revenues are presented net of sales-related taxes.
Reserve for Excess and Obsolete Inventory
Because the value of inventory that will ultimately be realized cannot be known with exact certainty, we rely upon both past sales history and future sales forecasts to provide a basis for the determination of the reserve. Inventory is considered potentially obsolete if we have withdrawn those products from the market or had no sales of the product for the past 12 months and have no sales forecasted for the next 12 months. Inventory is considered potentially excess if the quantity on hand exceeds 12 months of expected remaining usage. The resulting obsolete and excess parts are then reviewed to determine if a substitute usage or a future need exists. Items without an identified current or future usage are reserved in an amount equal to 100% of the first-in first-out (“FIFO”) cost of such inventory. Our products are subject to changes in technologies that may make certain of our products or their components obsolete or less competitive, which may increase our historical provisions to the reserve.
Income Taxes
We review our deferred tax assets on a regular basis to evaluate their recoverability based upon expected future reversals of deferred tax liabilities, projections of future taxable income over a two-year period, and tax planning strategies that we might employ to utilize such assets, including net operating loss carryforwards. Based on the positive and negative evidence of recoverability, we establish a valuation allowance against the net deferred assets of a taxing jurisdiction in which we operate, unless it is “more likely than not” that we will recover such assets through the above means. In the future, our evaluation of the
34
need for the valuation allowance will be significantly influenced by our ability to achieve profitability and our ability to predict and achieve future projections of taxable income over at least a two-year period.
Significant judgment is required in determining our worldwide provision for income taxes. In the ordinary course of operating a global business, there are many transactions for which the ultimate tax outcome is uncertain. We establish provisions for income taxes when, despite the belief that tax positions are fully supportable, there remain certain positions that do not meet the minimum probability threshold as described by Financial Accounting Standards Board (“FASB”) Accounting Standards Codification (“ASC”) Topic 740, Income Taxes, which is a tax position that is more likely than not to be sustained upon examination by the applicable taxing authority. In the ordinary course of business, we are examined by various federal, state, and foreign tax authorities. We regularly assess the potential outcome of these examinations and any future examinations for the current or prior years in determining the adequacy of our provision for income taxes. We assess the likelihood and amount of potential adjustments and adjust the income tax provision, the current tax liability and deferred taxes in the period in which the facts that gave rise to a revision become known.
Reserve for Warranties
We establish at the time of sale a liability for the one year warranty included with the initial purchase price of equipment, based upon an estimate of the repair expenses likely to be incurred for the warranty period. The warranty period is measured in installation-months for each major product group. The warranty reserve is included in accrued liabilities in the accompanying consolidated balance sheets. The warranty expense is estimated by applying the actual total repair expenses for each product group in the prior period and determining a rate of repair expense per installation-month. This repair rate is multiplied by the number of installation-months of warranty for each product group to determine the provision for warranty expenses for the period. We evaluate our exposure to warranty costs at the end of each period using the estimated expense per installation-month for each major product group, the number of units remaining under warranty, and the remaining number of months each unit will be under warranty. We have a history of new product introductions and enhancements to existing products, which may result in unforeseen issues that increase our warranty costs. While such expenses have historically been within expectations, we cannot guarantee this will continue in the future.
Goodwill Impairment
Goodwill represents the excess cost of a business acquisition over the fair value of the net assets acquired. We do not amortize goodwill; however, we perform an annual review in the fourth quarter of each year, or more frequently if indicators of potential impairment exist, to determine if the carrying value of the recorded goodwill or indefinite lived intangible assets is impaired. If an asset is impaired, the difference between the value of the asset reflected in the financial statements and its current fair value is recognized as an expense in the period in which the impairment occurs.
Each period, and for any of our reporting units, we can elect to perform a qualitative assessment to determine whether it is necessary to perform the two-step quantitative goodwill impairment test. If we believe, as a result of our qualitative assessment, that it is not more likely than not that the fair value of a reporting unit containing goodwill is less than its carrying amount, then the first and second steps of the quantitative goodwill impairment test are unnecessary. If we elect to bypass the qualitative assessment option, or if the qualitative assessment was performed and resulted in the Company being unable to conclude that it is not more likely than not that the fair value of a reporting unit containing goodwill is greater than its carrying amount, we will perform the two-step quantitative goodwill impairment test. We perform the first step of the two-step quantitative goodwill impairment test by calculating the fair value of the reporting unit using a discounted cash flow method and market approach method, and then comparing the respective fair value with the carrying amount of the reporting unit. If the carrying amount of the reporting unit exceeds its fair value, we perform the second step of the quantitative goodwill impairment test to measure the amount of the impairment loss, if any. Management has concluded there was no goodwill impairment for the years ended December 31, 2016, 2015 and 2014.
Business Combinations
We allocate the fair value of purchase consideration to the assets acquired and liabilities assumed based on their fair values at the acquisition date. The excess of the fair value of purchase consideration over the fair value of the assets acquired and liabilities assumed is recorded as goodwill. When determining the fair values of assets acquired and liabilities assumed, management makes significant estimates and assumptions, especially with respect to intangible assets. Critical estimates in valuing intangible assets include, but are not limited to, expected future cash flows, which include consideration of future growth rates and margins, customer attrition rates, future changes in technology and brand awareness, loyalty and position, and discount rates. Fair value estimates are based on the assumptions management believes a market participant would use in
35
pricing the asset or liability. Amounts recorded in a business combination may change during the measurement period, which is a period not to exceed one year from the date of acquisition, as additional information about conditions existing at the acquisition date becomes available.
Stock-Based Compensation
We measure and record compensation expense using the applicable accounting guidance for share-based payments related to stock options, restricted stock, and performance-based awards granted to our directors and employees. The fair value of stock options, including performance awards, without a market condition is determined by using the Black-Scholes option valuation model. The fair value of restricted stock awards and stock options with a market condition is estimated, at the date of grant, using the Monte Carlo Simulation valuation model. The Black-Scholes and Monte Carlo Simulation valuation models incorporate assumptions as to stock price volatility, the expected life of options or awards, a risk-free interest rate and dividend yield. In valuing our stock options, significant judgment is required in determining the expected volatility of our common stock and the expected life that individuals will hold their stock options prior to exercising. Expected volatility for stock options is based on the historical and implied volatility of our own common stock while the volatility for our restricted stock units with a market condition is based on the historical volatility of our own stock and the stock of companies within our defined peer group. The expected life of stock options is derived from the historical actual term of option grants and an estimate of future exercises during the remaining contractual period of the option. While volatility and estimated life are assumptions that do not bear the risk of change subsequent to the grant date of stock options, these assumptions may be difficult to measure as they represent future expectations based on historical experience. Further, our expected volatility and expected life may change in the future, which could substantially change the grant-date fair value of future awards of stock options and, ultimately, the expense we record. The fair value of restricted stock, including performance awards, without a market condition is estimated using the current market price of our common stock on the date of grant. Additionally, in calculating compensation expense for these awards, we are also required to estimate the extent to which awards will be forfeited prior to vesting. Many factors are considered when estimating expected forfeitures, including types of awards, employee class and historical experience. To the extent actual results or updated estimates of forfeiture differ from current estimates, such amounts are recorded as a cumulative adjustment to the previously recorded amounts.
We expense stock-based compensation for stock options, restricted stock awards, and performance awards over the requisite service period. For awards with only a service condition, we expense stock-based compensation, adjusted for estimated forfeitures, using the straight-line method over the requisite service period for the entire award. For awards with both performance and service conditions, we expense the stock-based compensation, adjusted for estimated forfeitures, on a straight-line basis over the requisite service period for each separately vesting portion of the award, taking into account the probability that we will satisfy the performance condition. Furthermore, we expense awards with a market condition over the three-year vesting period regardless of the value that the award recipients ultimately receive. Excess tax benefits are credited to additional paid-in capital when the deduction reduces cash taxes payable. When we have tax deductions in excess of the compensation cost, they are classified as financing cash inflows in the Condensed Consolidated Statements of Cash Flows.
Impact of Recently Issued Accounting Standards
In October 2016, the FASB issued Accounting Standards Update (“ASU”) No. 2016-16, Income Taxes (Topic 740): Intra-Entity Transfers of Assets Other than Inventory (“ASU 2016-16”), which removes the prohibition in ASC 740 against the immediate recognition of the current and deferred income tax effects of intra-entity transfers of assets other than inventory. This ASU requires the tax effects of intercompany transactions, other than sales of inventory, to be recognized when the transfer occurs, instead of deferred until the transferred asset is sold to a third party or otherwise recovered through use of the asset. The new guidance must be applied on a modified retrospective basis through a cumulative-effect adjustment directly to retained earnings as of the beginning of the period of adoption and is effective for annual periods beginning after December 15, 2017, and interim period therein, with early adoption permitted. We do not expect the adoption of this guidance will have a material impact on our consolidated financial statements.
In August 2016, the FASB issued ASU No. 2016-15, Statement of Cash Flows (Topic 230): Classification of Certain Cash Receipts and Cash Payments (“ASU 2016-15”), which clarifies how companies present and classify certain cash receipts and cash payments in the statement of cash flows. ASU 2016-15 is effective for annual periods beginning after December 15, 2017, and interim periods therein. Early adoption is permitted. We do not expect the adoption of this guidance will have a material impact on our consolidated financial statements.
In May 2014, the FASB issued ASU No. 2014-09, Revenue from Contracts with Customers: (Topic 606) (“ASU 2014-09”), amending its accounting guidance related to revenue recognition. Under this ASU and subsequently issued amendments, revenue is recognized to depict the transfer of goods or services to customers in an amount that reflects the
36
consideration to which the entity expects to be entitled in exchange for those goods or services. Additional disclosures are required to provide the nature, amount, timing and uncertainty of revenue and cash flows arising from customer contracts, including significant judgments and changes in judgments and assets recognized from costs incurred to obtain or fulfill a contract. The ASU and subsequently issued amendments to the revenue recognition accounting guidance are effective for us on January 1, 2018 and permit the use of either the retrospective or cumulative effective transition method. We have not yet selected a transition method nor have we determined the effect of the revenue recognition accounting guidance on our ongoing financial reporting.
In March 2016, the FASB issued ASU 2016-09, Compensation – Stock Compensation (Topic 718): Improvements to Employee Share-Based Payment Accounting (“ASU 2016-09”), which is intended to simplify several aspects of the accounting for share-based payment transactions, including the income tax consequences, classification of awards as either equity or liabilities, and classification on the statement of cash flows. ASU 2016-09 became effective for annual periods beginning after December 15, 2016, and interim periods therein (our fiscal year 2017). We adopted ASU 2016-09 effective January 1, 2017. Under the new guidance, excess tax benefits that were not previously recognized because the related tax deduction had not reduced current taxes payable are to be recorded on a modified retrospective basis. This is achieved through a cumulative-effect adjustment to retained earnings as of the beginning of the period in which the new guidance is adopted. Historically, we recognized all excess tax benefits when an option was exercised or a share vested since we did not have a U.S. net operating loss carryforward. Therefore, the tax benefit will be allowed under the current guidance and no adjustment to retained earnings is required.
Under the new guidance, all tax-related cash flows resulting from share-based payments are reported as operating activities in the statement of cash flows. Effective January 1, 2017, we adopted this portion of the guidance on a prospective basis. This approach incorporates the net of the inflow and outflow from all tax-related cash flows resulting from share-based payments in the deferred income tax (benefit) expense line item and presents it along with other income tax cash flows as operating activities in the statement of cash flows.
We also elected to account for forfeitures related to the service condition-based awards as they occur effective January 1, 2017, which is a change from our treatment of estimating forfeitures in previous years. However, we continue to assess performance condition-based awards quarterly as required. In adopting the new policy using a modified retrospective approach, we assessed the cumulative effect adjustment and recorded to retaining earnings the difference between the amount of compensation cost previously recorded and the amount that would have been recorded without assuming forfeitures. The cumulative effect adjustment recorded to retained earnings was not material. We will continue to assess the impact of the adopted guidance on a quarterly basis and do not expect the adoption of this guidance will have a material impact on our consolidated financial statements.
In February 2016, the FASB issued ASU 2016-02, Leases (Topic 842) (“ASU 2016-02”), which is intended to increase transparency and comparability among organizations by recognizing lease assets and lease liabilities on the balance sheet and disclosing key information about leasing arrangements to enable users of financial statements to assess the amount, timing, and uncertainty of cash flows arising from leases. ASU 2016-02 must be applied on a modified retrospective basis and is effective for fiscal years beginning after December 15, 2018, and interim periods within those years, with early adoption permitted. We are evaluating the impact of adopting this standard on our consolidated financial statements and related disclosures.
In July 2015, the FASB issued ASU 2015-11, Inventory (Topic 330): Simplifying the Measurement of Inventory (“ASU 2015-11”), which changes the measurement principle for inventory from the lower of cost or market to the lower of cost and net realizable value. ASU 2015-11 defines net realizable value as estimated selling prices in the ordinary course of business, less reasonably predictable costs of completion, disposal, and transportation. The new guidance must be applied on a prospective basis and became effective for fiscal years beginning after December 15, 2016 (our fiscal year 2017), and interim periods within those years, with early adoption permitted. We adopted ASU 2015-11 effective January 1, 2017. The adoption of this standard did not have a material impact on our consolidated financial statements.
37
ITEM 7A. QUANTITATIVE AND QUALITATIVE DISCLOSURES ABOUT MARKET RISK
Foreign Exchange Exposure
We conduct a significant portion of our business outside the United States. In 2016, 59% of our revenue was invoiced, and a significant portion of our operating expenses were paid in foreign currencies. At December 31, 2016, 56% of our assets were denominated in foreign currencies. Fluctuations in exchange rates between the U.S. dollar and such foreign currencies may have a material adverse effect on our results of operations and financial condition and could specifically result in foreign exchange gains and losses. The impact of future exchange rate fluctuations on the results of our operations cannot be accurately predicted due to the constantly changing exposure to various currencies, the fact that all foreign currencies do not react in the same manner in relation to the U.S. dollar and the number of currencies involved, although our most significant exposures are to the Euro, Swiss franc, Japanese yen, and Brazilian real. To the extent that the percentage of our non-U.S. dollar revenues derived from international sales increases in the future, our exposure to risks associated with fluctuations in foreign exchange rates may increase. We are aware of the availability of off-balance sheet financial instruments to hedge exposure to foreign currency exchange rates, including cross-currency swaps, forward contracts and foreign currency options. However, we have not used such instruments in the past, and none were utilized in 2016, 2015 or 2014.
38
ITEM 8. FINANCIAL STATEMENTS AND SUPPLEMENTARY DATA.
REPORT OF INDEPENDENT REGISTERED PUBLIC ACCOUNTING FIRM
Board of Directors and Shareholders
FARO Technologies, Inc. and Subsidiaries
We have audited the accompanying consolidated balance sheets of FARO Technologies Inc. (a Florida corporation) and subsidiaries (the “Company”) as of December 31, 2016 and 2015, and the related consolidated statements of operations, comprehensive income (loss), shareholders’ equity, and cash flows for each of the three years in the period ended December 31, 2016. These financial statements are the responsibility of the Company’s management. Our responsibility is to express an opinion on these financial statements based on our audits.
We conducted our audits in accordance with the standards of the Public Company Accounting Oversight Board (United States). Those standards require that we plan and perform the audit to obtain reasonable assurance about whether the financial statements are free of material misstatement. An audit includes examining, on a test basis, evidence supporting the amounts and disclosures in the financial statements. An audit also includes assessing the accounting principles used and significant estimates made by management, as well as evaluating the overall financial statement presentation. We believe that our audits provide a reasonable basis for our opinion.
In our opinion, the consolidated financial statements referred to above present fairly, in all material respects, the financial position of FARO Technologies, Inc. and subsidiaries as of December 31, 2016 and 2015, and the results of their operations and their cash flows for each of the three years in the period ended December 31, 2016 in conformity with accounting principles generally accepted in the United States of America.
We also have audited, in accordance with the standards of the Public Company Accounting Oversight Board (United States), the Company’s internal control over financial reporting as of December 31, 2016, based on criteria established in the 2013 Internal Control-Integrated Framework issued by the Committee of Sponsoring Organizations of the Treadway Commission (COSO), and our report dated February 24, 2017 expressed an unqualified opinion.
/s/ GRANT THORNTON LLP
Orlando, Florida
February 24, 2017
39
FARO TECHNOLOGIES, INC. AND SUBSIDIARIES
CONSOLIDATED BALANCE SHEETS
(in thousands, except share data) | December 31, 2016 | December 31, 2015 | ||||||
ASSETS | ||||||||
Current assets: | ||||||||
Cash and cash equivalents | $ | 106,169 | $ | 107,356 | ||||
Short-term investments | 42,942 | 42,994 | ||||||
Accounts receivable, net | 61,364 | 69,918 | ||||||
Inventories, net | 51,886 | 45,571 | ||||||
Deferred income tax assets, net | 7,565 | 7,792 | ||||||
Prepaid expenses and other current assets | 16,304 | 18,527 | ||||||
Total current assets | 286,230 | 292,158 | ||||||
Property and equipment: | ||||||||
Machinery and equipment | 57,063 | 54,124 | ||||||
Furniture and fixtures | 6,099 | 5,945 | ||||||
Leasehold improvements | 18,778 | 18,471 | ||||||
Property and equipment at cost | 81,940 | 78,540 | ||||||
Less: accumulated depreciation and amortization | (50,262 | ) | (42,594 | ) | ||||
Property and equipment, net | 31,678 | 35,946 | ||||||
Goodwill | 46,744 | 26,371 | ||||||
Intangible assets, net | 22,279 | 15,985 | ||||||
Service and sales demonstration inventory, net | 29,136 | 33,709 | ||||||
Deferred income tax assets, net | 6,742 | 4,050 | ||||||
Other long-term assets | 905 | 967 | ||||||
Total assets | $ | 423,714 | $ | 409,186 | ||||
LIABILITIES AND SHAREHOLDERS’ EQUITY | ||||||||
Current liabilities: | ||||||||
Accounts payable | $ | 11,126 | $ | 11,345 | ||||
Accrued liabilities | 24,572 | 22,574 | ||||||
Income taxes payable | 618 | — | ||||||
Current portion of unearned service revenues | 27,422 | 26,114 | ||||||
Customer deposits | 2,872 | 2,998 | ||||||
Total current liabilities | 66,610 | 63,031 | ||||||
Unearned service revenues - less current portion | 13,813 | 15,025 | ||||||
Deferred income tax liabilities | 1,409 | 686 | ||||||
Other long-term liabilities | 2,225 | 2,800 | ||||||
Total liabilities | 84,057 | 81,542 | ||||||
Commitments and contingencies - See Note 13 | ||||||||
Shareholders’ equity: | ||||||||
Preferred stock - par value $0.01, 10,000,000 shares authorized; none issued | — | — | ||||||
Common stock - par value $.001, 50,000,000 shares authorized; 18,170,267 and 18,077,594 issued; 16,680,791 and 16,588,118 outstanding, respectively | 18 | 18 | ||||||
Additional paid-in capital | 212,602 | 206,996 | ||||||
Retained earnings | 183,436 | 172,329 | ||||||
Accumulated other comprehensive loss | (24,561 | ) | (19,861 | ) | ||||
Common stock in treasury, at cost - 1,489,476 shares | (31,838 | ) | (31,838 | ) | ||||
Total shareholders’ equity | 339,657 | 327,644 | ||||||
Total liabilities and shareholders’ equity | $ | 423,714 | $ | 409,186 | ||||
The accompanying notes are an integral part of these consolidated financial statements.
40
FARO TECHNOLOGIES, INC. AND SUBSIDIARIES
CONSOLIDATED STATEMENTS OF OPERATIONS
Years ended December 31, | |||||||||||||
(in thousands, except share and per share data) | 2016 | 2015 | 2014 | ||||||||||
SALES | |||||||||||||
Product | $ | 256,010 | $ | 259,842 | $ | 284,147 | |||||||
Service | 69,574 | 57,706 | 57,679 | ||||||||||
Total sales | 325,584 | 317,548 | 341,826 | ||||||||||
COST OF SALES | |||||||||||||
Product | 107,965 | 114,257 | 115,266 | ||||||||||
Service | 39,659 | 36,055 | 38,050 | ||||||||||
Total cost of sales (exclusive of depreciation and amortization, shown separately below) | 147,624 | 150,312 | 153,316 | ||||||||||
GROSS PROFIT | 177,960 | 167,236 | 188,510 | ||||||||||
OPERATING EXPENSES | |||||||||||||
Selling and marketing | 79,870 | 79,837 | 80,804 | ||||||||||
General and administrative | 40,813 | 36,370 | 35,331 | ||||||||||
Depreciation and amortization | 13,868 | 11,217 | 7,428 | ||||||||||
Research and development | 30,125 | 26,690 | 27,607 | ||||||||||
Total operating expenses | 164,676 | 154,114 | 1 | 151,170 | |||||||||
INCOME FROM OPERATIONS | 13,284 | 13,122 | 37,340 | ||||||||||
OTHER EXPENSE (INCOME) | |||||||||||||
Interest income | (212 | ) | (111 | ) | (96 | ) | |||||||
Other expense (income), net | 822 | 371 | (94 | ) | |||||||||
Interest expense | 48 | 56 | 8 | ||||||||||
INCOME BEFORE INCOME TAX EXPENSE (BENEFIT) | 12,626 | 12,806 | 37,522 | ||||||||||
INCOME TAX EXPENSE (BENEFIT) | 1,519 | (7 | ) | 3,873 | |||||||||
NET INCOME | $ | 11,107 | $ | 12,813 | $ | 33,649 | |||||||
NET INCOME PER SHARE - BASIC | $ | 0.67 | $ | 0.74 | $ | 1.95 | |||||||
NET INCOME PER SHARE - DILUTED | $ | 0.67 | $ | 0.74 | $ | 1.93 | |||||||
Weighted average shares - Basic | 16,654,786 | 17,288,665 | 17,247,727 | ||||||||||
Weighted average shares - Diluted | 16,681,710 | 17,389,473 | 17,416,453 | ||||||||||
The accompanying notes are an integral part of these consolidated financial statements.
41
FARO TECHNOLOGIES, INC. AND SUBSIDIARIES
CONSOLIDATED STATEMENTS OF COMPREHENSIVE INCOME (LOSS)
Years ended December 31, | ||||||||||||
(in thousands) | 2016 | 2015 | 2014 | |||||||||
Net income | $ | 11,107 | $ | 12,813 | $ | 33,649 | ||||||
Currency translation adjustments, net of tax | (4,700 | ) | (13,166 | ) | (13,961 | ) | ||||||
Comprehensive income (loss) | $ | 6,407 | $ | (353 | ) | $ | 19,688 | |||||
The accompanying notes are an integral part of these consolidated financial statements.
42
FARO TECHNOLOGIES, INC. AND SUBSIDIARIES
CONSOLIDATED STATEMENTS OF SHAREHOLDERS’ EQUITY
FOR THE YEARS ENDED DECEMBER 31, 2016, 2015, AND 2014
Accumulated Other Comprehensive Income (Loss) | Common Stock in Treasury | Total | |||||||||||||||||||||||||
Additional Paid-in Capital | Retained Earnings | ||||||||||||||||||||||||||
Common Stock | |||||||||||||||||||||||||||
(in thousands except share data) | Shares | Amounts | |||||||||||||||||||||||||
BALANCE JANUARY 1, 2014 | 17,188,137 | $ | 18 | $ | 191,874 | $ | 125,867 | $ | 7,266 | $ | (9,075 | ) | $ | 315,950 | |||||||||||||
Net income | 33,649 | 33,649 | |||||||||||||||||||||||||
Currency translation adjustment, net of tax | (13,961 | ) | (13,961 | ) | |||||||||||||||||||||||
Restricted stock issued and stock based compensation under incentive plans | 24,588 | 4,678 | 4,678 | ||||||||||||||||||||||||
Stock options exercised | 104,705 | 3,369 | 3,369 | ||||||||||||||||||||||||
Tax impact from restricted stock and stock options | 169 | 169 | |||||||||||||||||||||||||
BALANCE DECEMBER 31, 2014 | 17,317,430 | $ | 18 | $ | 200,090 | $ | 159,516 | $ | (6,695 | ) | $ | (9,075 | ) | $ | 343,854 | ||||||||||||
Net income | 12,813 | 12,813 | |||||||||||||||||||||||||
Currency translation adjustment, net of tax | (13,166 | ) | (13,166 | ) | |||||||||||||||||||||||
Restricted stock issued and stock based compensation under incentive plans | 13,143 | 4,306 | 4,306 | ||||||||||||||||||||||||
Stock options exercised | 66,786 | 2,287 | 2,287 | ||||||||||||||||||||||||
Tax impact from restricted stock and stock options | 313 | 313 | |||||||||||||||||||||||||
Repurchase of common stock | (809,241 | ) | (22,763 | ) | (22,763 | ) | |||||||||||||||||||||
BALANCE DECEMBER 31, 2015 | 16,588,118 | $ | 18 | $ | 206,996 | $ | 172,329 | $ | (19,861 | ) | $ | (31,838 | ) | $ | 327,644 | ||||||||||||
Net income | 11,107 | 11,107 | |||||||||||||||||||||||||
Currency translation adjustment, net of tax | (4,700 | ) | (4,700 | ) | |||||||||||||||||||||||
Restricted stock issued and stock based compensation under incentive plans | 20,925 | 5,374 | 5,374 | ||||||||||||||||||||||||
Stock options exercised | 71,748 | 674 | 674 | ||||||||||||||||||||||||
Tax impact from restricted stock and stock options | (442 | ) | (442 | ) | |||||||||||||||||||||||
BALANCE DECEMBER 31, 2016 | 16,680,791 | $ | 18 | $ | 212,602 | $ | 183,436 | $ | (24,561 | ) | $ | (31,838 | ) | $ | 339,657 | ||||||||||||
The accompanying notes are an integral part of these consolidated financial statements.
43
FARO TECHNOLOGIES, INC. AND SUBSIDIARIES
CONSOLIDATED STATEMENTS OF CASH FLOWS
Years Ended December 31, | ||||||||||||
(in thousands) | 2016 | 2015 | 2014 | |||||||||
CASH FLOWS FROM: | ||||||||||||
OPERATING ACTIVITIES: | ||||||||||||
Net income | $ | 11,107 | $ | 12,813 | $ | 33,649 | ||||||
Adjustments to reconcile net income to net cash provided by operating activities: | ||||||||||||
Depreciation and amortization | 13,868 | 11,217 | 7,428 | |||||||||
Compensation for stock options and restricted stock units | 5,374 | 4,306 | 4,678 | |||||||||
Provision for bad debts (net recovery of) | 898 | 346 | (306 | ) | ||||||||
Loss on disposal of assets | 860 | 947 | — | |||||||||
Write-down of inventories | 4,134 | 10,878 | 3,272 | |||||||||
Deferred income tax benefit | (2,002 | ) | (655 | ) | (4,707 | ) | ||||||
Income tax benefit from exercise of stock options | (357 | ) | (313 | ) | (169 | ) | ||||||
Change in operating assets and liabilities: | ||||||||||||
Decrease (increase) in: | ||||||||||||
Accounts receivable, net | 6,727 | 9,584 | (24,587 | ) | ||||||||
Inventories, net | (6,729 | ) | (18,021 | ) | (21,995 | ) | ||||||
Prepaid expenses and other assets | 3,588 | (2,834 | ) | (3,501 | ) | |||||||
(Decrease) increase in: | ||||||||||||
Accounts payable and accrued liabilities | 534 | (6,401 | ) | 8,867 | ||||||||
Income taxes payable | 618 | — | (1,560 | ) | ||||||||
Customer deposits | (1,310 | ) | 1,114 | (724 | ) | |||||||
Unearned service revenues | 273 | 5,051 | 5,313 | |||||||||
Net cash provided by operating activities | 37,583 | 28,032 | 5,658 | |||||||||
INVESTING ACTIVITIES: | ||||||||||||
Proceeds from sale of investments | — | 22,001 | — | |||||||||
Purchases of property and equipment | (7,720 | ) | (14,169 | ) | (18,722 | ) | ||||||
Payments for intangible assets | (1,657 | ) | (2,140 | ) | (1,221 | ) | ||||||
Acquisition of business, net of cash received | (27,708 | ) | (12,066 | ) | (1,150 | ) | ||||||
Net cash used in investing activities | (37,085 | ) | (6,374 | ) | (21,093 | ) | ||||||
FINANCING ACTIVITIES: | ||||||||||||
Payments on capital leases | (8 | ) | (8 | ) | (8 | ) | ||||||
Payments of contingent consideration for acquisitions | (774 | ) | — | — | ||||||||
Repurchase of common stock | — | (22,763 | ) | — | ||||||||
Income tax benefit from exercise of stock options | 357 | 313 | 169 | |||||||||
Proceeds from issuance of stock, net | 674 | 2,287 | 3,369 | |||||||||
Net cash provided by (used in) financing activities | 249 | (20,171 | ) | 3,530 | ||||||||
EFFECT OF EXCHANGE RATE CHANGES ON CASH AND CASH EQUIVALENTS | (1,934 | ) | (3,420 | ) | (3,436 | ) | ||||||
DECREASE IN CASH AND CASH EQUIVALENTS | (1,187 | ) | (1,933 | ) | (15,341 | ) | ||||||
CASH AND CASH EQUIVALENTS, BEGINNING OF YEAR | 107,356 | 109,289 | 124,630 | |||||||||
CASH AND CASH EQUIVALENTS, END OF YEAR | $ | 106,169 | $ | 107,356 | $ | 109,289 | ||||||
The accompanying notes are an integral part of these consolidated financial statements.
44
FARO TECHNOLOGIES, INC. AND SUBSIDIARIES
NOTES TO CONSOLIDATED FINANCIAL STATEMENTS
YEARS ENDED DECEMBER 31, 2016, 2015 and 2014
(in thousands, except share and per share data or as otherwise noted)
1. SUMMARY OF SIGNIFICANT ACCOUNTING POLICIES
Description of Business—FARO Technologies, Inc. and its subsidiaries (collectively “FARO,” the “Company,” “us,” “we” or “our”) design, develop, manufacture, market and support software driven, three-dimensional (3D) measurement, imaging and realization systems. This technology permits high-precision 3D measurement, imaging and comparison of parts and complex structures within production and quality assurance processes. Our devices are used for inspection of components and assemblies, rapid prototyping, reverse engineering, documenting large volume or structures in 3D, surveying and construction as well as for investigation and reconstruction of accident sites or crime scenes. We sell the majority of our products through a direct sales force across a broad number of customers in a range of manufacturing, industrial, architecture, surveying, building information modeling, construction, public safety forensics, cultural heritage and other applications. Our FaroArm®, FARO Laser ScanArm®, FARO Gage®, FARO Laser TrackerTM, FARO Laser Projector, FARO Cobalt Array Imager, and their companion CAM2® and BuildIT software solutions, provide for Computer-Aided Design, or CAD, based inspection, factory-level statistical process control, high-density surveying and laser-guided assembly and production. Together, these products integrate the measurement, quality inspection, and reverse engineering functions with CAD and 3D software to improve productivity, enhance product quality, and decrease rework and scrap in the manufacturing process, mainly supporting applications in our Factory Metrology vertical. Our FARO Focus and FARO Scanner Freestyle3DX laser scanners, and their companion SCENE, FARO PointSense, and FARO public safety forensics software offerings, are utilized for a wide variety of 3D modeling, documentation and high-density surveying applications in our Construction Building Information Modeling-Construction Information Management (“Construction BIM-CIM”) and Public Safety Forensics verticals. Our FARO Laser ScanArm®, FARO Cobalt Array Imager, FARO Scanner Freestyle3DX laser scanners and their companion SCENE software also enable a fully digital workflow used to capture real world geometry for the purpose of empowering design, enabling innovation, and speeding up the design cycle, supporting our Product Design vertical. FARO Visual InspectTM enables large, complex 3D CAD data to be transferred to a tablet device and then used for mobile visualization and comparison to real world conditions, facilitating in-process inspection, assembly, guidance and positioning for applications in our Factory Metrology and Construction BIM-CIM verticals.
Reportable Segments—During fiscal 2016, we evaluated our reportable segment structure based on our new management organization and the changes implemented in connection with our initiatives to reorganize our business around certain vertical markets. As a result of this assessment, we now report our activities in the following three reportable segments:
• | The Factory Metrology segment provides solutions for manual and automated measurement and inspection in an industrial or manufacturing environment. Applications include alignment, part inspection, dimensional analysis, first article inspection, incoming and in-process inspection, machine calibration, non-contact inspection, robot calibration, tool building and set-up, and assembly guidance. |
• | The Construction BIM-CIM segment provides solutions for as-built data capturing and 3D visualization in building information modeling and construction information management applications, allowing our customers in our architecture, engineering and construction markets to quickly and accurately extract 2D and 3D measurement points. Applications include as-built documentation, construction monitoring, surveying, asset and facility management, and heritage preservation. |
• | The Other segment includes our Product Design, Public Safety Forensics and 3D Solutions operating segments. Our Product Design organization provides advanced 3D solutions to assist in the engineering or design of a movable object, enabling a full digital workflow for applications that include reverse engineering and virtual simulation. Our Public Safety Forensics organization provides solutions to public safety officials and professionals to capture environmental or situational scenes in 2D and 3D for crime, crash and fire scene investigations and environmental safety evaluations. Our 3D Solutions organization provides customized 3D solutions to customers who require customized 3D measurement and realization solutions not otherwise addressed by our off-the-shelf product offerings. |
45
All other operating segments that do not meet the criteria to be reportable segments are aggregated in the Other category and have been combined based on the aggregation criteria and quantitative thresholds in accordance with the provisions of Financial Accounting Standards Board (“FASB”) Accounting Standards Codification (“ASC”) Topic 280, “Segment Reporting” (“FASB ASC Topic 280”). Our new reportable segments have been determined in accordance with our internal management structure, which is based on operating activities. We evaluate business performance based upon several metrics, using profitable revenue growth and segment profit as the primary financial measure. There has been no change in our total consolidated financial condition or results of operations previously reported as a result of the change in our reportable segments.
We report our segment information in accordance with the provisions of FASB ASC Topic 280. See Note 17, “Segment Reporting” for further information.
Principles of Consolidation—Our consolidated financial statements include the accounts of FARO Technologies, Inc. and its subsidiaries, all of which are wholly owned. All intercompany transactions and balances have been eliminated. The financial statements of our foreign subsidiaries are translated into U.S. dollars using exchange rates in effect at period-end for assets and liabilities and average exchange rates during each reporting period for results of operations. Adjustments resulting from financial statement translations are reflected as a separate component of accumulated other comprehensive income. Foreign currency transaction gains and losses are included in income.
Revenue Recognition, Product Warranty and Extended Warranty Contracts—Revenue is recognized when the price is fixed, collectability is reasonably assured, the title and risks and rewards of ownership have passed to the customer, and the earnings process is complete. Revenue related to our measurement, imaging, and realization equipment and related software is generally recognized upon shipment, as we consider the earnings process complete as of the shipping date. The related software sold with our equipment function together and deliver the tangible product’s essential functionality. Fees billed to customers associated with the distribution of products are classified as revenue. We warrant our products against defects in design, materials and workmanship for one year. A provision for estimated future costs relating to warranty expense is recorded when products are shipped. We separately sell extended warranties. Extended warranty revenues are recognized on a straight-line basis over the term of the warranty. Costs relating to extended warranties are recognized as incurred. Revenue from sales of software only is recognized when no further significant production, modification or customization of the software is required and when the following criteria are met: persuasive evidence of a sales agreement exists, delivery has occurred, and the sales price is fixed or determinable and deemed collectible. These software arrangements generally include short-term maintenance that is considered post-contract support (PCS). We generally establish vendor-specific objective evidence (VSOE) of fair value for this PCS component based on our maintenance renewal rate. Maintenance renewals, when sold, are recognized on a straight-line basis over the term of the maintenance agreement. Revenues resulting from sales of comprehensive support, training and technology consulting services are recognized as such services are performed and are deferred when billed in advance of the performance of services. Revenues are presented net of sales-related taxes.
Cash and Cash Equivalents—We consider cash on hand and amounts on deposit with financial institutions with maturities of three months or less when purchased to be cash and cash equivalents. We have deposits with foreign banks totaling $87.3 million and $71.2 million as of December 31, 2016 and 2015, respectively. We do not intend to repatriate those funds (See Note 12, “Income Taxes”).
Accounts Receivable and Related Allowance for Doubtful Accounts—Credit is extended to customers based on an evaluation of a customer’s financial condition and, generally, collateral is not required. Accounts receivable are generally due within 30 to 90 days and are stated at amounts due from customers, net of an allowance for doubtful accounts. Accounts outstanding longer than the contractual payment terms are considered past due. We make judgments as to the collectability of accounts receivable based on historical trends and future expectations. Management estimates an allowance for doubtful accounts, which adjusts gross trade accounts receivable to its net realizable value. The allowance for doubtful accounts is based on an analysis of all receivables for possible impairment issues and historical write-off percentages. We write off accounts receivable when they become uncollectible, and payments subsequently received on such receivables are credited to the allowance for doubtful accounts. We do not generally charge interest on past due receivables.
Inventories—Inventories are stated at the lower of cost or net realizable value using the first-in first-out (“FIFO”) method. Shipping and handling costs are classified as a component of cost of sales in the consolidated statements of operations. Sales demonstration inventory is comprised of measuring, imaging and realization devices utilized by sales representatives to present our products to customers. In the third quarter of 2015, management reassessed certain inventory policies based on the then-current sales and customer trends and in light of new product introductions, impacting our entire product portfolio. As a result of these policy amendments, management expects sales demonstration inventory to be held by our sales representatives for up to three years, at which time it would be refurbished and transferred to finished goods as used equipment, stated at the lo
46
wer of cost or net realizable value. Management expects these refurbished units to remain in finished goods inventory and be sold within 12 months at prices that produce reduced gross margins. Sales demonstration inventory remains classified as inventory, as it is available for sale and any required refurbishment prior to sale is minimal.
Service inventory is typically used to provide a temporary replacement product to a customer covered by a premium warranty when the customer’s unit requires service or repair and as training equipment. Service inventory is available for sale; however, management does not expect service inventory to be sold within 12 months and, as such, classifies this inventory as a long-term asset. Service inventory that we utilize for training or repairs which we deem as no longer available for sale is transferred to fixed assets at the lower of cost or net realizable value and depreciated over its remaining useful life, typically three years.
Reserve for Excess and Obsolete Inventory—Since the value of inventory that will ultimately be realized cannot be known with exact certainty, we rely upon both past sales history and future sales forecasts to provide a basis for the determination of the reserve. Inventory is considered potentially obsolete if we have withdrawn those products from the market or had no sales of the product for the past 12 months and have no sales forecasted for the next 12 months. Inventory is considered potentially excess if the quantity on hand exceeds 12 months of expected remaining usage. The resulting obsolete and excess parts are then reviewed to determine if a substitute usage or a future need exists. Items without an identified current or future usage are reserved in an amount equal to 100% of the FIFO cost of such inventory. Our products are subject to changes in technologies that may make certain of our products or their components obsolete or less competitive, which may increase our historical provisions to the reserve.
Property and Equipment—Property and equipment purchases exceeding a thousand dollars are capitalized and recorded at cost. Depreciation is computed beginning on the date that the asset is placed into service using the straight-line method over the estimated useful lives of the various classes of assets as follows:
Machinery, equipment and software | 2 to 5 years |
Furniture and fixtures | 3 to 10 years |
Leasehold improvements are amortized on a straight-line basis over the lesser of the life of the asset or the remaining term of the lease.
Depreciation expense was $10,933, $9,238 and $6,171 in 2016, 2015 and 2014, respectively. Accelerated methods of depreciation are used for income tax purposes in contrast to book purposes, and as a result, appropriate provisions are made for the related deferred income taxes.
Business Combinations—We allocate the fair value of purchase consideration to the assets acquired and liabilities assumed based on their fair values at the acquisition date. The excess of the fair value of purchase consideration over the fair value of these assets acquired and liabilities assumed is recorded as goodwill. When determining the fair values of assets acquired and liabilities assumed, management makes significant estimates and assumptions, especially with respect to intangible assets. Critical estimates in valuing intangible assets include, but are not limited to, expected future cash flows, which includes consideration of future growth rates and margins, customer attrition rates, future changes in technology and brand awareness, loyalty and position, and discount rates. Fair value estimates are based on the assumptions management believes a market participant would use in pricing the asset or liability. Amounts recorded in a business combination may change during the measurement period, which is a period not to exceed one year from the date of acquisition, as additional information about conditions existing at the acquisition date becomes available.
Goodwill and Intangibles—Goodwill represents the excess cost of a business acquisition over the fair value of the net assets acquired. We do not amortize goodwill; however, we perform an annual review in the fourth quarter of each year, or more frequently if indicators of potential impairment exist, to determine if the carrying value of the recorded goodwill or indefinite lived intangible assets is impaired. If an asset is impaired, the difference between the value of the asset reflected in the financial statements and its current fair value is recognized as an expense in the period in which the impairment occurs.
Each period, and for any of our reporting units, we can elect to perform a qualitative assessment to determine whether it is necessary to perform the two-step quantitative goodwill impairment test. If we believe, as a result of our qualitative assessment, that it is not more likely than not that the fair value of a reporting unit containing goodwill is less than its carrying amount, then the first and second steps of the quantitative goodwill impairment test are unnecessary. If we elect to bypass the qualitative assessment option, or if the qualitative assessment was performed and resulted in the Company being unable to
47
conclude that it is not more likely than not that the fair value of a reporting unit containing goodwill is greater than its carrying amount, we will perform the two-step quantitative goodwill impairment test. We perform the first step of the two-step quantitative goodwill impairment test by calculating the fair value of the reporting unit using a discounted cash flow method and market approach method, and then comparing the respective fair value with the carrying amount of the reporting unit. If the carrying amount of the reporting unit exceeds its fair value, we perform the second step of the quantitative goodwill impairment test to measure the amount of the impairment loss, if any. Management has concluded there was no goodwill impairment for the years ended December 31, 2016, 2015 and 2014.
Other intangible assets principally include patents, existing product technology and customer relationships that arose in connection with our acquisitions. Other intangible assets are recorded at fair value at the date of acquisition and are amortized over their estimated useful lives of 3 to 20 years. As of December 31, 2016 and 2015, there were no indefinite-lived intangible assets.
Product technology and patents are recorded at cost. Amortization is computed using the straight-line method over the lives of the product technology and patents of 7 to 20 years.
The remaining weighted-average amortization period for all our intangible assets is nine years.
Long-Lived Assets—Long-lived assets, other than goodwill, are evaluated for impairment when events or changes in business circumstances indicate that the carrying amount of the assets may not be fully recoverable. Management has concluded that there were no indications of impairment of these assets during the years ended December 31, 2016, 2015 and 2014.
Research and Development—Research and development costs incurred in the discovery of new knowledge and the resulting translation of this new knowledge into plans and designs for new products, prior to the attainment of the related products’ technological feasibility, are recorded as expenses in the period incurred.
Reserve for Warranties—We establish at the time of sale a liability for the one year warranty included with the initial purchase price of our products, based upon an estimate of the repair expenses likely to be incurred for the warranty period. The warranty period is measured in installation-months for each major product group. The warranty reserve is included in accrued liabilities in the accompanying consolidated balance sheets. The warranty expense is estimated by applying the actual total repair expenses for each product group in the prior period and determining a rate of repair expense per installation-month. This repair rate is multiplied by the number of installation-months of warranty for each product group to determine the provision for warranty expenses for the period. We evaluate our exposure to warranty costs at the end of each period using the estimated expense per installation-month for each major product group, the number of units remaining under warranty, and the remaining number of months each unit will be under warranty. We have a history of new product introductions and enhancements to existing products, which may result in unforeseen issues that increase our warranty costs. While such expenses have historically been within expectations, we cannot guarantee this will continue in the future.
Income Taxes—We review our deferred tax assets on a regular basis to evaluate their recoverability based upon expected future reversals of deferred tax assets and liabilities, projections of future taxable income, and tax planning strategies that we might employ to utilize such assets, including net operating loss carryforwards. Based on the positive and negative evidence for recoverability, we establish a valuation allowance against the net deferred tax assets of a taxing jurisdiction in which we operate unless it is “more likely than not” that we will recover such assets through the above means. In the future, our evaluation of the need for the valuation allowance will be significantly influenced by our ability to maintain profitability and our ability to predict and achieve future projections of taxable income over at least a two-year period.
We recognize tax benefits related to uncertain tax positions only if it is more likely than not that the tax position will be sustained upon examination by taxing authorities. For those positions where it is not more likely than not that a tax benefit will be sustained, no tax benefit has been recognized in the financial statements. In the ordinary course of business, we are examined by various federal, state, and foreign tax authorities. We regularly assess the potential outcomes of these examinations and any future examinations for the current or prior years in determining the adequacy of our provision for income taxes.
Earnings Per Share (EPS)—Basic earnings per share is computed by dividing net income by the weighted average number of shares outstanding. Diluted earnings per share is computed by also considering the impact of potential common stock on both net income and the weighted average number of shares outstanding. Our potential common stock consists of employee and director stock options, restricted stock, restricted stock units and performance-based awards. Our potential common stock is excluded from the basic earnings per share calculation and is included in the diluted earnings per share
48
calculation when doing so would not be anti-dilutive. Performance-based awards are included in the computation of diluted earnings per share only to the extent that the underlying performance conditions (and any applicable market condition) (i) are satisfied as of the end of the reporting period or (ii) would be considered satisfied if the end of the reporting period were the end of the related contingency period and the result would be dilutive under the treasury stock method. A reconciliation of the number of common shares used in the calculation of basic and diluted EPS is presented in Note 15, “Earnings Per Share.”
Accounting for Stock-Based Compensation—We have several stock-based employee and director compensation plans, which are described more fully in Note 14, “Stock Compensation Plans”.
We measure and record compensation expense using the applicable accounting guidance for share-based payments related to stock options, restricted stock, and performance-based awards granted to our directors and employees. The fair value of stock options, including performance awards, without a market condition is estimated, at the date of grant, using the Black-Scholes option-pricing model. The fair value of restricted stock awards and stock options with a market condition is estimated, at the date of grant, using the Monte Carlo Simulation model. The Black-Scholes and Monte Carlo Simulation valuation models incorporate assumptions as to stock price volatility, the expected life of options or awards, a risk-free interest rate and dividend yield. In valuing our stock options, significant judgment is required in determining the expected volatility of our common stock and the expected life that individuals will hold their stock options prior to exercising. Expected volatility for stock options is based on the historical and implied volatility of our own common stock while the volatility for our restricted stock units with a market condition is based on the historical volatility of our own stock and the stock of companies within our defined peer group. The expected life of stock options is derived from the historical actual term of option grants and an estimate of future exercises during the remaining contractual period of the option. While volatility and estimated life are assumptions that do not bear the risk of change subsequent to the grant date of stock options, these assumptions may be difficult to measure as they represent future expectations based on historical experience. Further, our expected volatility and expected life may change in the future, which could substantially change the grant-date fair value of future awards of stock options and, ultimately, the expense we record. The fair value of restricted stock, including performance awards, without a market condition is estimated using the current market price of our common stock on the date of grant. Additionally, in calculating compensation expense for these awards, we are also required to estimate the extent to which awards will be forfeited prior to vesting. Many factors are considered when estimating expected forfeitures, including types of awards, employee class and historical experience. To the extent actual results or updated estimates of forfeiture differ from current estimates, such amounts are recorded as a cumulative adjustment to the previously recorded amounts.
We expense stock-based compensation for stock options, restricted stock awards, and performance awards over the requisite service period. For awards with only a service condition, we expense stock-based compensation, adjusted for estimated forfeitures, using the straight-line method over the requisite service period for the entire award. For awards with both performance and service conditions, we expense the stock-based compensation, adjusted for estimated forfeitures, on a straight-line basis over the requisite service period for each separately vesting portion of the award, taking into account the probability that we will satisfy the performance conditions. Furthermore, we expense awards with a market condition over the three-year vesting period regardless of the value that the award recipients ultimately receive. Excess tax benefits are credited to additional paid-in capital when the deduction reduces cash taxes payable. When we have tax deductions in excess of the compensation cost, they are classified as financing cash inflows in the Consolidated Statements of Cash Flows.
Concentration of Credit Risk—Financial instruments that expose us to concentrations of credit risk consist principally of short-term investments and operating demand deposit accounts. Our policy is to place our operating demand deposit accounts with high credit quality financial institutions, the balances of which at times may exceed federally insured limits. We continually monitor our banking relationships and believe we are not exposed to any significant credit risk on our operating demand deposit accounts.
Estimates—The preparation of financial statements in conformity with accounting principles generally accepted in the United States of America (“U.S. GAAP”) requires management to make estimates and assumptions that affect the reported amounts of assets and liabilities and disclosure of contingent assets and liabilities at the date of the financial statements and the reported amounts of revenues and expenses during the reporting period. Actual results could differ from those estimates.
Impact of Recently Issued Accounting Standards — In October 2016, the FASB issued Accounting Standards Update (“ASU”) No. 2016-16, Income Taxes (Topic 740): Intra-Entity Transfers of Assets Other than Inventory (“ASU 2016-16”), which removes the prohibition in ASC 740 against the immediate recognition of the current and deferred income tax effects of intra-entity transfers of assets other than inventory. This ASU requires the tax effects of intercompany transactions, other than sales of inventory, to be recognized when the transfer occurs, instead of deferred until the transferred asset is sold to a third party or otherwise recovered through use of the asset. The new guidance must be applied on a modified retrospective basis through a cumulative-effect adjustment directly to retained earnings as of the beginning of the period of adoption and is
49
effective for annual periods beginning after December 15, 2017, and interim period therein, with early adoption permitted. We do not expect the adoption of this guidance will have a material impact on our consolidated financial statements.
In August 2016, the FASB issued ASU No. 2016-15, Statement of Cash Flows (Topic 230): Classification of Certain Cash Receipts and Cash Payments (“ASU 2016-15”), which clarifies how companies present and classify certain cash receipts and cash payments in the statement of cash flows. ASU 2016-15 is effective for annual periods beginning after December 15, 2017, and interim periods therein. Early adoption is permitted. We do not expect the adoption of this guidance will have a material impact on our consolidated financial statements.
In May 2014, the FASB issued ASU No. 2014-09, Revenue from Contracts with Customers: (Topic 606) (“ASU 2014-09”), amending its accounting guidance related to revenue recognition. Under this ASU and subsequently issued amendments, revenue is recognized to depict the transfer of goods or services to customers in an amount that reflects the consideration to which the entity expects to be entitled in exchange for those goods or services. Additional disclosures are required to provide the nature, amount, timing and uncertainty of revenue and cash flows arising from customer contracts, including significant judgments and changes in judgments and assets recognized from costs incurred to obtain or fulfill a contract. The ASU and subsequently issued amendments to the revenue recognition accounting guidance are effective for us on January 1, 2018 and permit the use of either the retrospective or cumulative effective transition method. We have not yet selected a transition method nor have we determined the effect of the revenue recognition accounting guidance on our ongoing financial reporting.
In March 2016, the FASB issued ASU 2016-09, Compensation – Stock Compensation (Topic 718): Improvements to Employee Share-Based Payment Accounting (“ASU 2016-09”), which is intended to simplify several aspects of the accounting for share-based payment transactions, including the income tax consequences, classification of awards as either equity or liabilities, and classification on the statement of cash flows. ASU 2016-09 became effective for annual periods beginning after December 15, 2016, and interim periods therein (our fiscal year 2017). We adopted ASU 2016-09 effective January 1, 2017. Under the new guidance, excess tax benefits that were not previously recognized because the related tax deduction had not reduced current taxes payable are to be recorded on a modified retrospective basis. This is achieved through a cumulative-effect adjustment to retained earnings as of the beginning of the period in which the new guidance is adopted. Historically, we recognized all excess tax benefits when an option was exercised or a share vested since we did not have a U.S. net operating loss carryforward. Therefore, the tax benefit will be allowed under the current guidance and no adjustment to retained earnings is required.
Under the new guidance, all tax-related cash flows resulting from share-based payments are reported as operating activities in the statement of cash flows. Effective January 1, 2017, we adopted this portion of the guidance on a prospective basis. This approach incorporates the net of the inflow and outflow from all tax-related cash flows resulting from share-based payments in the deferred income tax (benefit) expense line item and presents it along with other income tax cash flows as operating activities in the statement of cash flows.
We also elected to account for forfeitures related to the service condition-based awards as they occur effective January 1, 2017, which is a change from our treatment of estimating forfeitures in previous years. However, we continue to assess performance condition-based awards quarterly as required. In adopting the new policy using a modified retrospective approach, we assessed the cumulative effect adjustment and recorded to retaining earnings the difference between the amount of compensation cost previously recorded and the amount that would have been recorded without assuming forfeitures. The cumulative effect adjustment recorded to retained earnings was not material. We will continue to assess the impact of the adopted guidance on a quarterly basis and do not expect the adoption of this guidance will have a material impact on our consolidated financial statements.
In February 2016, the FASB issued ASU 2016-02, Leases (Topic 842) (“ASU 2016-02”), which is intended to increase transparency and comparability among organizations by recognizing lease assets and lease liabilities on the balance sheet and disclosing key information about leasing arrangements to enable users of financial statements to assess the amount, timing, and uncertainty of cash flows arising from leases. ASU 2016-02 must be applied on a modified retrospective basis and is effective for fiscal years beginning after December 15, 2018, and interim periods within those years, with early adoption permitted. We are evaluating the impact of adopting this standard on our consolidated financial statements and related disclosures.
In July 2015, the FASB issued ASU 2015-11, Inventory (Topic 330): Simplifying the Measurement of Inventory (“ASU 2015-11”), which changes the measurement principle for inventory from the lower of cost or market to the lower of cost and net realizable value. ASU 2015-11 defines net realizable value as estimated selling prices in the ordinary course of business, less reasonably predictable costs of completion, disposal, and transportation. The new guidance must be applied on a prospective basis and became effective for fiscal years beginning after December 15, 2016 (our fiscal year 2017), and interim periods
50
within those years, with early adoption permitted. We adopted ASU 2015-11 effective January 1, 2017. The adoption of this standard did not have a material impact on our consolidated financial statements.
Reclassifications—Certain prior year amounts have been reclassified in the accompanying consolidated financial statements to conform to the current period presentation. For example:
• | Certain prior year stock compensation expenses were reclassified between cost of sales, general and administrative, selling and marketing, and research and development expenses in the accompanying consolidated financial statements to reflect the appropriate departmental costs. |
• | Goodwill balances and activity presented in Note 6 “Goodwill” as of and for the year ended December 31, 2015 were reclassified to conform to the current period presentation as a result of the realignment of our reporting units. |
• | During the third quarter of 2016, we reclassified certain service costs that were previously classified as product costs. This reclassification did not have a material impact on either the current or prior years. As such, the prior year amounts have not been reclassified in our consolidated financial statements. |
2. SUPPLEMENTAL CASH FLOW INFORMATION
Selected cash payments and non-cash activities were as follows:
Years ended December 31, | ||||||||||||
2016 | 2015 | 2014 | ||||||||||
Supplemental cash flow information: | ||||||||||||
Cash paid for interest | $ | 28 | $ | 55 | $ | 7 | ||||||
Cash paid for income taxes | $ | 2,576 | $ | 4,682 | $ | 10,844 | ||||||
Supplemental noncash investing and financing activities: | ||||||||||||
Transfer of service and sales demonstration inventory to fixed assets | $ | 511 | $ | 2,979 | $ | 41 | ||||||
3. ALLOWANCE FOR DOUBTFUL ACCOUNTS
Activity in the allowance for doubtful accounts was as follows:
Years ended December 31, | ||||||||||||
2016 | 2015 | 2014 | ||||||||||
Balance, beginning of year | $ | 1,417 | $ | 1,844 | $ | 3,686 | ||||||
Provision (net of recovery) | 898 | 346 | (306 | ) | ||||||||
Amounts written off, net of recoveries | (486 | ) | (773 | ) | (1,536 | ) | ||||||
Balance, end of year | $ | 1,829 | $ | 1,417 | $ | 1,844 | ||||||
4. SHORT-TERM INVESTMENTS
Short-term investments at December 31, 2016 consisted of U.S Treasury Bills totaling $42.9 million that mature through June 15, 2017. Short-term investments at December 31, 2015 consisted of U.S. Treasury Bills totaling $43.0 million that matured through April 14, 2016. The interest rate on the U.S. Treasury Bills is less than one percent. The investments are classified as held-to-maturity and recorded at cost plus accrued interest, which approximates fair value. The fair value of the U.S. Treasury Bills at December 31, 2016 and December 31, 2015 were classed as Level 1 as they are traded with sufficient frequency and volume to enable us to obtain pricing information on an ongoing basis. For further discussion of fair value, refer to Note 10, “Fair Value Measurements.”
51
5. INVENTORIES
Inventories consist of the following:
December 31, 2016 | December 31, 2015 | |||||||
Raw materials | $ | 36,760 | $ | 28,190 | ||||
Finished goods | 15,126 | 17,381 | ||||||
Inventories, net | $ | 51,886 | $ | 45,571 | ||||
Service and sales demonstration inventory, net | $ | 29,136 | $ | 33,709 | ||||
6. GOODWILL
Our goodwill at December 31, 2016 and 2015 is related to our previous acquisitions. We evaluate each reporting unit’s fair value as compared to its carrying value on December 31 of each year or more frequently if events or changes in circumstances indicate that the carrying value may exceed the fair value. We first perform a qualitative assessment to determine whether the existence of events or circumstances leads to a determination that it is more likely than not that the fair value of a reporting unit is less than its carrying amount and if it is necessary to perform the two-step goodwill impairment test. If Step 1 of the quantitative goodwill impairment test is performed, the fair value of the reporting units is measured using a discounted cash flow model incorporating discount rates commensurate with the risks involved for each reporting unit and a market approach. The key assumptions used in the discounted cash flow model include discount rates, growth rates, cash flow projections and terminal value rates. These rates are susceptible to change and require significant management judgment. The market approach relies on an analysis of publicly-traded companies similar to us and derives a range of revenue and profit multiples. The publicly-traded companies used in the market approach are selected based on our defined peer group. The resulting multiples are then applied to each reporting unit to determine fair value. Impairments to goodwill are charged against earnings in the period the impairment is identified.
During 2016, we realigned our organizational structure to focus on five operating segments: Factory Metrology, Construction BIM-CIM, Product Design, Public Safety Forensics, and 3D Solutions. As a result of the change to our new operating segments in 2016, we have realigned our reporting units for which goodwill was tested as of December 31, 2016: Factory Metrology, Construction BIM-CIM and Public Safety Forensics as shown in the table below. Goodwill amounts as of and for the year ended December 31, 2015 were reclassified to conform to the current period presentation.
As of December 31, 2016 and 2015, we did not have any goodwill that was identified as impaired. The increase in goodwill during 2016 and 2015 reflected the acquisitions completed in those periods, partially offset by changes in foreign exchange rates.
December 31, 2016 | Beginning Balance | Additions | Foreign Currency Translation | Ending Balance | ||||||||||||
Factory Metrology | $ | 21,360 | $ | 16,709 | $ | (208 | ) | $ | 37,861 | |||||||
Construction BIM-CIM | 3,429 | 2,682 | (33 | ) | 6,078 | |||||||||||
Public Safety Forensics | $ | 1,582 | $ | 1,238 | $ | (15 | ) | $ | 2,805 | |||||||
Total | $ | 26,371 | $ | 20,629 | $ | (256 | ) | $ | 46,744 | |||||||
December 31, 2015 | Beginning Balance | Additions | Foreign Currency Translation | Ending Balance | ||||||||||||
Factory Metrology | $ | 15,556 | $ | 7,103 | $ | (1,299 | ) | $ | 21,360 | |||||||
Construction BIM-CIM | 2,497 | 1,140 | (208 | ) | 3,429 | |||||||||||
Public Safety Forensics | $ | 1,152 | $ | 526 | $ | (96 | ) | $ | 1,582 | |||||||
Total | $ | 19,205 | $ | 8,769 | $ | (1,603 | ) | $ | 26,371 | |||||||
7. INTANGIBLE ASSETS
Intangible assets consist of the following:
52
As of December 31, 2016 | ||||||||||||
Carrying Value | Accumulated Amortization | Net Intangible | ||||||||||
Amortizable intangible assets: | ||||||||||||
Product technology | $ | 15,700 | $ | 7,614 | $ | 8,086 | ||||||
Patents and trademarks | 13,328 | 4,927 | 8,401 | |||||||||
Customer relationships | 5,466 | 837 | 4,629 | |||||||||
Other | 8,013 | 6,850 | 1,163 | |||||||||
Total | $ | 42,507 | $ | 20,228 | $ | 22,279 | ||||||
As of December 31, 2015 | ||||||||||||
Carrying Value | Accumulated Amortization | Net Intangible | ||||||||||
Amortizable intangible assets: | ||||||||||||
Product technology | $ | 10,494 | $ | 7,204 | $ | 3,290 | ||||||
Patents and trademarks | 13,048 | 4,130 | 8,918 | |||||||||
Customer relationships | 3,087 | 287 | 2,800 | |||||||||
Other | 7,670 | 6,693 | 977 | |||||||||
Total | $ | 34,299 | $ | 18,314 | $ | 15,985 | ||||||
Amortization expense was $2,935, $1,979 and $1,257 in 2016, 2015 and 2014, respectively. The estimated amortization expense for each of the years 2017 through 2021 and thereafter is as follows:
Years ending December 31, | Amount | ||
2017 | $ | 3,895 | |
2018 | 3,733 | ||
2019 | 3,297 | ||
2020 | 3,175 | ||
2021 | 2,954 | ||
Thereafter | 5,225 | ||
$ | 22,279 | ||
8. ACCRUED LIABILITIES
Accrued liabilities consist of the following:
As of December 31, | ||||||||
2016 | 2015 | |||||||
Accrued compensation and benefits | $ | 13,649 | $ | 12,798 | ||||
Accrued warranties | 2,594 | 2,309 | ||||||
Professional and legal fees | 1,775 | 2,014 | ||||||
Taxes other than income | 4,026 | 2,605 | ||||||
Other accrued liabilities | 2,528 | 2,848 | ||||||
$ | 24,572 | $ | 22,574 | |||||
Activity related to accrued warranties was as follows:
Years ended December 31, | ||||||||||||
2016 | 2015 | 2014 | ||||||||||
Balance, beginning of year | $ | 2,309 | $ | 2,719 | $ | 2,364 | ||||||
Provision for warranty expense | 3,544 | 3,597 | 3,848 | |||||||||
Fulfillment of warranty obligations | (3,259 | ) | (4,007 | ) | (3,493 | ) | ||||||
Balance, end of year | $ | 2,594 | $ | 2,309 | $ | 2,719 | ||||||
53
9. LINE OF CREDIT
On July 11, 2006, we entered into a loan agreement providing for an available line of credit of $30 million, which was most recently amended on March 15, 2012. Loans under the Amended and Restated Loan Agreement, as amended, bear interest at the rate of LIBOR plus a fixed percentage between 1.50% and 2.00%. The Amended and Restated Loan Agreement required us to maintain a minimum cash balance of $25 million and tangible net worth measured at the end of each of our fiscal quarters. The term of the Amended and Restated Loan Agreement, as amended, expired on March 31, 2015. We did not extend the loan agreement and we did not draw on this line of credit in 2015 or 2014.
10. FAIR VALUE MEASUREMENTS
The guidance on fair value measurements and disclosures defines fair value, establishes a framework for measuring fair value, and requires enhanced disclosures about assets and liabilities measured at fair value. Fair value is defined as the price at which an asset could be exchanged in a current transaction between knowledgeable, willing parties. A liability’s fair value is defined as the amount that would be paid to transfer the liability to a new obligor, not the amount that would be paid to settle the liability with the creditor. Where available, fair value is based on observable market prices or parameters or derived from such prices or parameters. Where observable prices or inputs are not available, valuation models are used to determine fair value. These models employ valuation techniques that involve some level of management estimation and judgment, the degree of which is dependent on the price transparency for the instruments or market and the instruments’ complexity.
Assets and liabilities recorded at fair value on a recurring basis in our consolidated balance sheets are categorized based upon the level of judgment associated with the inputs used to measure their fair value. Hierarchical levels, defined by the guidance on fair value measurements, are directly related to the amount of subjectivity associated with the inputs to fair valuation of these assets and liabilities and are as follows:
Level 1 - Valuation is based upon quoted market price for identical instruments traded in active markets.
Level 2 - Valuation is based on quoted market prices for similar instruments in active markets, quoted prices for identical or similar instruments in markets that are not active, and model-based valuation techniques for which all significant assumptions are observable in the market.
Level 3 - Valuation is generated from model-based techniques that use significant assumptions not observable in the market. Valuation techniques include use of discounted cash flow models and similar techniques.
Fair Value on a Recurring Basis
Assets and liabilities measured at fair value on a recurring basis are categorized in the tables below based upon the lowest level of significant input to the valuations:
December 31, 2016 | ||||||||||||
Level 1 | Level 2 | Level 3 | ||||||||||
Assets: | ||||||||||||
Short-term investments (1) | $ | 42,942 | $ | — | $ | — | ||||||
Total | $ | 42,942 | $ | — | $ | — | ||||||
Liabilities: | ||||||||||||
Contingent consideration (2) | $ | — | $ | — | $ | 2,100 | ||||||
Total | $ | — | $ | — | $ | 2,100 | ||||||
December 31, 2015 | ||||||||||||
Level 1 | Level 2 | Level 3 | ||||||||||
Assets: | ||||||||||||
Short-term investments (1) | $ | 42,994 | $ | — | $ | — | ||||||
Total | $ | 42,994 | $ | — | $ | — | ||||||
Liabilities: | ||||||||||||
Contingent consideration (2) | $ | — | $ | — | $ | 2,695 | ||||||
Total | $ | — | $ | — | $ | 2,695 | ||||||
(1) | Short-term investments in the accompanying consolidated balance sheets are six-month U.S. Treasury Bills. The fair values of these assets are based on Level 1 inputs in the fair value hierarchy. |
54
(2) | Contingent consideration liability represents arrangements to pay the former owners of certain companies we acquired. The undiscounted maximum payment under the arrangements was $7.9 million, based on future revenues, gross profits and certain milestones. We estimated the fair value of the contingent consideration using a Monte Carlo Simulation, which is based on significant inputs, primarily forecasted future results of the acquired businesses not observable in the market, and thus represents a Level 3 measure. For the year ended December 31, 2016, we paid $0.8 million as part of these arrangements. No payments under such arrangements were due during the year ended December 31, 2015. The remaining change in the fair value of the contingent consideration from December 31, 2015 to December 31, 2016 was related to changes in foreign currency exchange rates. |
11. OTHER EXPENSE (INCOME), NET
Other expense (income), net consists of the following:
Years ended December 31, | ||||||||||||
2016 | 2015 | 2014 | ||||||||||
Foreign exchange transaction (gains) losses | $ | 1,356 | $ | 377 | $ | (103 | ) | |||||
Other | (534 | ) | (6 | ) | 9 | |||||||
Total other expense (income), net | $ | 822 | $ | 371 | $ | (94 | ) | |||||
12. INCOME TAXES
Income (loss) before income tax expense (benefit) consists of the following:
Years ended December 31, | ||||||||||||
2016 | 2015 | 2014 | ||||||||||
Domestic | $ | (1,527 | ) | $ | (144 | ) | $ | 12,877 | ||||
Foreign | 14,153 | 12,950 | 24,645 | |||||||||
Income before income taxes | $ | 12,626 | $ | 12,806 | $ | 37,522 | ||||||
The components of the income tax expense (benefit) for income taxes are as follows:
Years ended December 31, | ||||||||||||
2016 | 2015 | 2014 | ||||||||||
Current: | ||||||||||||
Federal | $ | 409 | $ | 199 | $ | 3,780 | ||||||
State | 40 | 78 | 367 | |||||||||
Foreign | 3,482 | 562 | 4,433 | |||||||||
Current income tax expense | 3,931 | 839 | 8,580 | |||||||||
Deferred: | ||||||||||||
Federal | (2,357 | ) | 88 | 306 | ||||||||
State | (229 | ) | 9 | 30 | ||||||||
Foreign | 174 | (943 | ) | (5,043 | ) | |||||||
Deferred income tax benefit | (2,412 | ) | (846 | ) | (4,707 | ) | ||||||
Income tax expense (benefit) | $ | 1,519 | $ | (7 | ) | $ | 3,873 | |||||
Reconciliations of the income tax expense at the U.S. federal statutory income tax rate compared to our actual income tax expense (benefit) are summarized below:
55
Years ended December 31, | ||||||||||||
2016 | 2015 | 2014 | ||||||||||
Tax expense at statutory rate of 34% | $ | 4,427 | $ | 4,354 | $ | 12,757 | ||||||
State income taxes, net of federal benefit | (50 | ) | 54 | 425 | ||||||||
Foreign tax rate difference | (1,939 | ) | (3,708 | ) | (2,917 | ) | ||||||
Research and development credit | (917 | ) | (853 | ) | (583 | ) | ||||||
Change in valuation allowance | 162 | (28 | ) | (5,392 | ) | |||||||
Equity based compensation | (255 | ) | 54 | 880 | ||||||||
Manufacturing credit | (61 | ) | 11 | (721 | ) | |||||||
Other | 152 | 109 | (576 | ) | ||||||||
Income tax expense (benefit) | $ | 1,519 | $ | (7 | ) | $ | 3,873 | |||||
The components of our net deferred income tax asset and liabilities are as follows:
As of December 31, | ||||||||
2016 | 2015 | |||||||
Net deferred income tax asset - Current | ||||||||
Warranty cost | $ | 1,121 | $ | 657 | ||||
Bad debt reserve | (159 | ) | 21 | |||||
Inventory reserve | 456 | 774 | ||||||
Unearned service revenue | 4,934 | 4,319 | ||||||
Other, net | 1,213 | 2,021 | ||||||
Net deferred income tax asset - Current | $ | 7,565 | $ | 7,792 | ||||
Net deferred income tax asset - Non-current | ||||||||
Depreciation | $ | (6,799 | ) | $ | (5,658 | ) | ||
Goodwill amortization | (2,279 | ) | (2,076 | ) | ||||
Employee stock options | 4,501 | 3,664 | ||||||
Unearned service revenue | 2,155 | 2,337 | ||||||
Tax Credits | 2,035 | — | ||||||
Loss carryforwards | 8,005 | 6,568 | ||||||
Deferred income tax asset - Non-current | 7,618 | 4,835 | ||||||
Valuation Allowance | (876 | ) | (785 | ) | ||||
Net deferred income tax asset - Non-current | $ | 6,742 | $ | 4,050 | ||||
Net deferred income tax liability - Non-current | ||||||||
Intangible assets | $ | (1,409 | ) | $ | (686 | ) | ||
The effective income tax rate for 2016, 2015, and 2014 includes a reduction in the statutory corporate tax rates for our operations in Switzerland. The aggregate dollar effect of this favorable tax rate was approximately $1.0 million, or $0.06 per share, in the year ended December 31, 2016, $2.7 million, or $0.16 per share, in the year ended December 31, 2015, and $1.9 million, or $0.11 per share, in the year ended December 31, 2014.
Our domestic entities had deferred income tax assets in the amount of $7.8 million and $5.2 million as of December 31, 2016 and December 31, 2015, respectively. At December 31, 2016 and 2015, our foreign subsidiaries had deferred tax assets primarily relating to net operating losses of $6.4 million and $6.6 million, respectively, some of which expire in the next 1 to 9 years and others which can be carried forward indefinitely. The valuation allowance for deferred tax assets as of December 31, 2016 and 2015 was $0.9 million and $0.8 million, respectively. The net change in the total valuation allowance for each of the years ended December 31, 2016, 2015 and 2014, was a $0.1 million increase, and a $1.0 million and $5.0 million decrease, respectively. During the year ended December 31, 2014, we identified certain immaterial errors related to deferred tax assets and the related valuation allowance. As a result, we decreased deferred tax assets and the related valuation allowance by $4.7 million each to correct the gross-up error as of December 31, 2014. We believe this error was not material to the consolidated
56
financial statements of any prior interim or annual periods and that the correction of the error was not material to the 2014 consolidated financial statements.
The valuation allowance as of December 31, 2016 and 2015 was primarily related to foreign net operating loss carryforwards that, in the judgment of management, were not more likely than not to be realized. In assessing the realizability of deferred tax assets, management considers whether it is more likely than not that some or all of the deferred tax assets will not be realized. The ultimate realization of deferred tax assets depends on the generation of future taxable income during the periods in which those temporary differences are deductible. Management considers the scheduled reversal of deferred tax liabilities (including the impact of available carryback and carryforward periods), projected taxable income, and tax-planning strategies in making this assessment. The primary change impacting the valuation allowance for the year ended December 31, 2016 related to changes in foreign statutory tax rates.
We have not recognized any U.S. tax expense on undistributed international earnings, as we intend to reinvest the earnings outside the U.S. for the foreseeable future. Our net undistributed international earnings were approximately $131.4 million and $119.5 million at December 31, 2016 and 2015, respectively.
Significant judgment is required in determining our worldwide provision for income taxes. In the ordinary course of a global business, there are many transactions for which the ultimate tax outcome is uncertain. We review our tax contingencies on a regular basis and make appropriate accruals as necessary.
As of December 31, 2016 and 2015, our unrecognized tax benefits totaled $0.3 million, which includes approximately $0.03 million of interest and penalties. We estimate that the unrecognized tax benefits will not change significantly within the next year.
A reconciliation of the beginning and ending amount of unrecognized tax benefits is as follows:
Years ended December 31, | ||||||||||||
2016 | 2015 | 2014 | ||||||||||
Balance at January 1, | $ | 265 | $ | 265 | $ | 265 | ||||||
Additions based on tax positions related to the current year | — | — | — | |||||||||
Additions for tax positions of prior years | 59 | — | — | |||||||||
Reductions for tax positions of prior years | — | — | — | |||||||||
Settlements | — | — | — | |||||||||
Balance at December 31, | $ | 324 | $ | 265 | $ | 265 | ||||||
We file income tax returns in the U.S. federal jurisdiction and various state and foreign jurisdictions. The table below summarizes the open tax years and ongoing tax examinations in major jurisdictions as of December 31, 2016:
Jurisdiction | Open Years | Examination in Process | ||
United States - Federal Income Tax | 2013-2016 | 2014 | ||
United States - various states | 2012-2016 | N/A | ||
Germany | 2010-2016 | 2010-2012 | ||
Switzerland | 2016 | N/A | ||
Singapore | 2012-2016 | N/A | ||
We recognize accrued interest and penalties related to unrecognized tax benefits in income tax expense. The total amount of unrecognized tax benefits that, if recognized, would affect the effective tax rate is $0.3 million. We do not currently anticipate that the total amount of unrecognized tax benefits will result in material changes to our financial position. We are subject to income taxes at the federal, state and foreign country level. Our tax returns are subject to examination at the U.S. federal level from 2013 forward and at the state level are subject to a three to four year statute of limitations depending on the state. In the fourth quarter of 2016, the Internal Revenue Service notified the Company of an examination of its 2014 U.S. Federal Income Tax return. To date, no examination procedures have been performed or issues identified.
57
13. COMMITMENTS AND CONTINGENCIES
Leases – We lease buildings and equipment under non-cancellable operating leases through 2026. Some of these leases include cost-escalation clauses. Such cost-escalation clauses are recognized on a straight-line basis over the lease term. The following is a schedule of future minimum lease payments required under non-cancelable operating leases with initial terms in excess of one year, in effect at December 31, 2016:
Years ending December 31, | Amount | ||
2017 | $ | 6,620 | |
2018 | 4,969 | ||
2019 | 3,604 | ||
2020 | 2,416 | ||
2021 | 1,237 | ||
Thereafter | 4,517 | ||
Total future minimum lease payments | $ | 23,363 | |
Rent expense for 2016, 2015, and 2014 was $7,720, $6,874 and $6,119, respectively.
Purchase Commitments — We enter into purchase commitments for products and services in the ordinary course of business. These purchases generally cover production requirements for 60 to 120 days as well as materials necessary to service customer units through the product lifecycle and for warranty commitments. As of December 31, 2016 we had approximately $29.4 million in purchase commitments that are expected to be delivered within the next 12 months. To ensure adequate component availability in preparation for new product introductions, as of December 31, 2016, we also had $30.3 million in long-term commitments for purchases to be delivered after 12 months.
Legal Proceedings — We are not involved in any legal proceedings other than routine litigation arising in the normal course of business, none of which we believe will have a material adverse effect on our business, financial condition or results of operations.
14. STOCK COMPENSATION PLANS
We have three compensation plans that provide for the granting of stock options and other share-based awards to key employees and non-employee members of the Board of Directors. The 2004 Equity Incentive Plan (“2004 Plan”), the 2009 Equity Incentive Plan (“2009 Plan”), and the 2014 Equity Incentive Plan (“2014 Plan”) provide for granting options, restricted stock, restricted stock units or stock appreciation rights to employees and non-employee directors.
We were authorized to grant awards for up to 1,750,000 shares of common stock under the 2004 Plan, of which 3,500 options were outstanding at December 31, 2016 at an exercise price of $24.36. We were also authorized to grant awards for up to 1,781,546 shares of common stock under the 2009 Plan, as well as any shares underlying awards outstanding under the 2004 Plan as of the effective date of the 2009 Plan that thereafter terminated or expired unexercised or were canceled, forfeited or lapsed for any reason. There were 504,658 options outstanding at December 31, 2016 under the 2009 Plan at exercise prices between $24.30 and $57.54. The options outstanding under the 2004 Plan and the 2009 Plan have a 10-year term (7 years on grants beginning in 2010) and vest over a 3-year period.
In May 2014, our shareholders approved the 2014 Plan authorizing us to grant awards for up to 1,974,543 shares of common stock, as well as any shares underlying awards outstanding under the 2004 Plan and 2009 Plan as of the effective date of the 2014 Plan that thereafter terminate or expire unexercised or are canceled, forfeited or lapse for any reason. There were 517,171 options outstanding at December 31, 2016 under the 2014 Plan at exercise prices between $29.98 and $62.63. The options outstanding under the 2014 Plan have a 7-year term and generally vest over a 3-year period. We will not make any further grants under the 2004 Plan or the 2009 Plan.
Upon election to the Board, each non-employee director receives an initial equity grant of shares of restricted common stock with a value equal to $100,000, calculated using the closing share price on the date of the non-employee director’s election to the Board. The initial restricted stock grant vests on the third anniversary of the grant date, subject to the non-employee director’s continued membership on the Board. Annually, the non-employee directors are granted restricted shares equal to 50% of their compensation on the first business day following the annual meeting of shareholders, calculated using the closing price of our common stock on that day. The shares of restricted stock vest on the day prior to the following year’s
58
annual meeting date, subject to a non-employee director’s continued membership on the Board. We record compensation cost associated with our restricted stock grants on a straight-line basis over the vesting term.
Annually, upon approval by our Compensation Committee, we grant stock options and restricted stock units to certain employees. We also grant stock options and restricted stock units to certain new employees throughout the year. Prior to 2016, these awards vested in three equal annual installments beginning one year after the grant date. The fair value of these stock-based awards is determined by using (a) the current market price of our common stock on the grant date in the case of restricted stock units or (b) the Black-Scholes option valuation model in the case of stock options.
In 2015, we granted performance-based stock options and restricted stock units to certain executives. These awards vest in three annual installments beginning one year after the grant date if the applicable performance measures or strategic objectives are achieved. The related stock-based compensation expense is recognized over the requisite service period, taking into account the probability that we will satisfy the performance measures or strategic objectives. In addition to certain strategic objectives, the performance-based stock options and restricted stock units granted in 2015 are earned and vest based on (1) our achievement of specified revenue and EPS targets, and (2) our total shareholder return (TSR) relative to the TSR attained by companies within our defined peer group.
Due to the TSR presence in certain performance-based grants, the fair value of these awards is determined using the Monte Carlo Simulation valuation model. We expense these market condition awards over the three-year vesting period regardless of the value that the award recipients ultimately receive. In February 2016, our Compensation Committee determined the number of performance-based stock options and restricted stock units that were earned for the 2015 performance period. Based on the performance and strategic objectives achieved in 2015, 7,225 stock options and 226 restricted stock units were earned and vested and 23,328 stock options and 677 restricted stock units were determined to be unearned, as the required metrics were not achieved.
We did not grant performance-based stock options and restricted stock units to our employees during 2016. Instead, our annual grant in March 2016 consisted of stock options and restricted stock units that are subject to only time-based vesting. The number of stock options and/or restricted stock units granted was based on the employee’s individual objectives, performance against operational metrics assigned to the employee, and overall contribution over the last year. The restricted stock unit awards vest in full on the three-year anniversary of the grant date. The stock options vest in three equal annual installments beginning one year after the grant date. The fair value of these stock-based awards is determined by using (a) the current market price of our common stock on the grant date in the case of restricted stock units or (b) the Black-Scholes option valuation model in the case of stock options.
In May 2016, we granted an aggregate of 18,615 restricted stock units to certain non-executive key employees as a retention incentive in recognition of the significant efforts required from such employees to assist us in executing our initiatives in 2016 to reorganize our business around certain vertical markets, modernize our sales process to improve the efficiency of our sales organization, accelerate and maintain a consistent schedule of new product introductions, and harmonize our global functions to improve effectiveness. These restricted stock unit awards vest in full on the three-year anniversary of the grant date. The fair value of these restricted stock units is determined by using the current market price of our common stock on the grant date.
The Black-Scholes option valuation model incorporates assumptions as to stock price volatility, the expected life of options or awards, a risk-free interest rate and dividend yield. The weighted-average grant-date fair value of the stock options that were granted during the years ended December 31, 2016, 2015, and 2014 and valued using the Black-Scholes option valuation model was $12.90, $15.08 and $19.38 per option, respectively. For stock options granted during the years ended December 31, 2016, 2015, and 2014 valued using the Black-Scholes option valuation model, we used the following assumptions:
Years ended December 31, | |||||||||
2016 | 2015 | 2014 | |||||||
Risk-free interest rate | 1.06% - 1.57% | 0.80% - 1.21% | 0.95% - 1.32% | ||||||
Expected dividend yield | — | % | — | % | — | % | |||
Expected option life | 4 years | 3 years | 3-4 years | ||||||
Expected volatility | 45.0% - 47.0% | 42.3% - 48.5% | 42.5% - 45.4% | ||||||
Weighted-average expected volatility | 46.1 | % | 43.5 | % | 42.6 | % | |||
59
Historical information was the primary basis for the selection of the expected dividend yield, expected volatility and the expected lives of the options. The risk-free interest rate was based on the yields of U.S. zero coupon issues and U.S. Treasury issues, with a term equal to the expected life of the option being valued.
There were no market condition awards granted during the year ended December 31, 2016 and, as such, the Monte Carlo Simulation valuation model was not used to determine the fair value of the stock options and restricted stock units granted during 2016. In 2015, we granted performance-based stock options and restricted stock units which included the presence of a market condition and were valued using the Monte Carlo Simulation model. This valuation model incorporates assumptions as to stock price volatility, the expected life of options or awards, a risk-free interest rate and dividend yield. The assumptions used to estimate the fair value of the performance-based stock options and restricted stock units granted during 2015 and valued under the Monte Carlo Simulation model were as follows:
Years Ended December 31, | |||||||||
2016 | 2015 | 2014 | |||||||
Risk-free interest rate | — | % | 0.95% - 1.48% | — | % | ||||
Expected dividend yield | — | % | — | % | — | % | |||
Expected option life | — | 4 years | — | ||||||
Expected volatility | — | % | 44.5 | % | — | % | |||
Weighted-average expected volatility | — | % | 44.5 | % | — | % | |||
A summary of stock option activity and weighted average exercise prices follows:
Options | Weighted- Average Exercise Price | Weighted-Average Remaining Contractual Term (Years) | Aggregate Intrinsic Value as of December 31, 2016 | ||||||||||
Outstanding at January 1, 2016 | 1,178,585 | $ | 48.14 | ||||||||||
Granted | 264,215 | 34.71 | |||||||||||
Forfeited | (217,688 | ) | 46.57 | ||||||||||
Exercised | (111,624 | ) | 18.10 | ||||||||||
Unearned performance-based options | (23,328 | ) | 59.97 | ||||||||||
Outstanding at December 31, 2016 | 1,090,160 | $ | 48.02 | 4.4 | $ | 1,010 | |||||||
Options exercisable at December 31, 2016 | 823,512 | $ | 40.75 | 2.3 | $ | 367 | |||||||
The aggregate intrinsic value of stock options exercised during the years ended December 31, 2016, 2015, and 2014 was $1.7 million, $1.7 million and $2.2 million, respectively. The total fair value of stock options vested during the years ended December 31, 2016, 2015 and 2014 was $3.8 million, $3.9 million and $3.7 million, respectively.
The following table summarizes the restricted stock and restricted stock unit activity and weighted average grant-date fair values for the year ended December 31, 2016:
Shares | Weighted-Average Grant Date Fair Value | ||||||
Non-vested at January 1, 2016 | 15,916 | $ | 43.47 | ||||
Granted | 159,625 | 33.20 | |||||
Forfeited | (10,935 | ) | 33.05 | ||||
Vested | (13,247 | ) | 42.79 | ||||
Unearned performance-based awards | (677 | ) | 53.03 | ||||
Non-vested at December 31, 2016 | 150,682 | $ | 33.39 | ||||
We recorded total stock-based compensation expense associated with our stock incentive plans of $5,374, $4,306 and $4,678 in 2016, 2015 and 2014, respectively.
60
As of December 31, 2016, there was $8.3 million in total unrecognized stock-based compensation expense related to non-vested stock-based compensation arrangements. The expense is expected to be recognized over a weighted average period of 1.8 years.
15. EARNINGS PER SHARE
Basic earnings per share is computed by dividing net income by the weighted average number of shares outstanding. Diluted earnings per share is computed by also considering the impact of potential common stock on both net income and the weighted average number of shares outstanding. Our potential common stock consists of employee and director stock options, restricted stock, restricted stock units and performance-based awards. Our potential common stock is excluded from the basic earnings per share calculation and is included in the diluted earnings per share calculation when doing so would not be anti-dilutive. Performance-based awards are included in the computation of diluted earnings per share only to the extent that the underlying performance conditions (and any applicable market condition) (i) are satisfied as of the end of the reporting period or (ii) would be considered satisfied if the end of the reporting period were the end of the related contingency period and the result would be dilutive under the treasury stock method. A reconciliation of the number of common shares used in the calculation of basic and diluted earnings per share (EPS) is presented below:
Years Ended December 31, | ||||||||||||||||||||||
2016 | 2015 | 2014 | ||||||||||||||||||||
Shares | Per-Share Amount | Shares | Per-Share Amount | Shares | Per-Share Amount | |||||||||||||||||
Basic EPS | 16,654,786 | $ | 0.67 | 17,288,665 | $ | 0.74 | 17,247,727 | $ | 1.95 | |||||||||||||
Effect of dilutive securities | 26,924 | — | 100,808 | — | 168,726 | (0.02 | ) | |||||||||||||||
Diluted EPS | 16,681,710 | — | $ | 0.67 | 17,389,473 | $ | 0.74 | 17,416,453 | $ | 1.93 | ||||||||||||
Securities excluded from the determination of weighted average shares for the calculation of diluted EPS, as they were potentially antidilutive | 1,046,947 | 870,421 | 520,739 | |||||||||||||||||||
16. EMPLOYEE RETIREMENT BENEFIT PLAN
We maintain a 401(k) defined contribution retirement plan for our eligible U.S. employees. Costs charged to operations in connection with the 401(k) plan during 2016, 2015, and 2014 aggregated $1,390, $1,334, and $1,127, respectively.
17. SEGMENT REPORTING
We have three reportable segments; Factory Metrology, Construction BIM-CIM, and Other. These segments are based upon the vertical markets that we currently serve. Business activities that do not meet the criteria to be reportable segments are aggregated in the Other category.
We develop, manufacture, market, support and sell CAD-based quality assurance products integrated with CAD-based inspection and statistical process control software, and three-dimensional documentation systems in each of these reportable segments. These activities represent more than 99% of consolidated sales.
Our Chief Operating Decision Maker (CODM), our Chief Executive Officer, evaluates segment performance and allocates resources based upon profitable growth. We use segment profit to evaluate the performance of our reportable segments. Segment profit is calculated as gross profit, net of selling and marketing expenses, for the reporting segment. Our definition of segment profit may not be comparable to similarly titled measures reported by other companies.
Our segment structure presented below represents a change from geographic segments due to the reorganization efforts taken place during the year ended December 31, 2016. The prior period amounts have been restated to reflect the change in reporting segments. Each of our segments employ consistent accounting policies.
61
The following tables present information about our reportable segments for the years ended December 31, 2016, 2015, and 2014:
Factory Metrology | Construction BIM-CIM | Other | Total | |||||||||||||
2016 | ||||||||||||||||
Net sales to external customers | $ | 236,313 | $ | 65,056 | $ | 24,215 | $ | 325,584 | ||||||||
Segment profit | $ | 69,845 | $ | 18,250 | $ | 9,995 | $ | 98,090 | ||||||||
General and administrative | 40,813 | |||||||||||||||
Depreciation and amortization | 13,868 | |||||||||||||||
Research and development | 30,125 | |||||||||||||||
Income from operations | $ | 13,284 | ||||||||||||||
Factory Metrology | Construction BIM-CIM | Other | Total | |||||||||||||
2015 | ||||||||||||||||
Net sales to external customers | $ | 222,745 | $ | 70,849 | $ | 23,954 | $ | 317,548 | ||||||||
Segment profit | $ | 63,463 | $ | 16,299 | $ | 7,637 | $ | 87,399 | ||||||||
General and administrative | 36,370 | |||||||||||||||
Depreciation and amortization | 11,217 | |||||||||||||||
Research and development | 26,690 | |||||||||||||||
Income from operations | $ | 13,122 | ||||||||||||||
Factory Metrology | Construction BIM-CIM | Other | Total | |||||||||||||
2014 | ||||||||||||||||
Net sales to external customers | $ | 246,216 | $ | 75,383 | $ | 20,227 | $ | 341,826 | ||||||||
Segment profit | $ | 76,111 | $ | 24,497 | $ | 7,098 | $ | 107,706 | ||||||||
General and administrative | 35,331 | |||||||||||||||
Depreciation and amortization | 7,428 | |||||||||||||||
Research and development | 27,607 | |||||||||||||||
Income from operations | $ | 37,340 | ||||||||||||||
62
Net sales to external customers is based upon the geographic location of the customer.
For the Years Ended December 31, | ||||||||||||
2016 | 2015 | 2014 | ||||||||||
Net sales to external customers | ||||||||||||
United States | $ | 133,924 | $ | 131,670 | $ | 124,851 | ||||||
Americas-Other | 11,815 | 11,718 | 14,117 | |||||||||
Germany | 44,041 | 41,151 | 50,437 | |||||||||
Europe-Other | 57,710 | 62,032 | 69,742 | |||||||||
Japan | 32,530 | 24,018 | 32,531 | |||||||||
Asia-Other | 45,564 | 46,959 | 50,148 | |||||||||
$ | 325,584 | $ | 317,548 | $ | 341,826 | |||||||
Long-lived assets consist primarily of property, plant, and equipment, goodwill, and intangible assets, and are attributed to the geographic area in which they are located or originated.
As of December 31, | ||||||||||||
2016 | 2015 | 2014 | ||||||||||
Long-Lived Assets | ||||||||||||
United States | $ | 54,157 | $ | 39,973 | $ | 35,900 | ||||||
Americas-Other | 13,486 | 9,447 | 1,113 | |||||||||
Germany | 23,734 | 24,637 | 17,351 | |||||||||
Europe-Other | 6,949 | 1,146 | 248 | |||||||||
Japan | 460 | 517 | 599 | |||||||||
Asia-Other | 1,915 | 2,582 | 2,448 | |||||||||
$ | 100,701 | $ | 78,302 | $ | 57,659 | |||||||
18. BUSINESS COMBINATIONS
In February 2015, we completed the acquisition of ARAS 360 Technologies Inc. (“ARAS”) for a purchase price, net of cash acquired, of $7.6 million, paid with cash on hand, subject to certain additional post-closing adjustments, and up to an additional $4.0 million in contingent consideration that may be earned over a two-year period, of which none has been earned as of December 31, 2016. ARAS, a privately-held business headquartered in Canada, produces a full suite of accident and crime reconstruction software tools that offer advanced graphics, analytical tools, and the ability to work with large point cloud data. The acquisition complements our portfolio within the Public Safety Forensics vertical.
In March 2015, we completed the acquisition of kubit GmbH for a purchase price, net of cash acquired, of $4.4 million, paid with cash on hand, subject to certain additional post-closing adjustments, and up to an additional $3.3 million in contingent consideration that may be earned over a three-year period, of which $0.4 million has been earned as of December 31, 2016. The acquisition also included substantially all of the assets of kubit GmbH’s U.S. distributor kubit USA, Inc. (collectively “kubit”). Kubit, a privately-held business with operating facilities in Germany and the United States, develops software for surveying and as-built documentation. The acquisition complements our portfolio of software products, specifically in the Construction BIM-CIM vertical.
In July 2016, we acquired BuildIT Software & Solutions Ltd. (“BuildIT”) for a purchase price, net of cash acquired, of $3.9 million, paid with cash on hand, subject to certain additional post-closing adjustments. BuildIT, a software solutions business located in Montreal, Canada, specializes in process-configurable 3D metrology software solutions with hardware agnostic interfaces. The addition of BuildIT enhances our metrology portfolio, providing customers greater software options to use in a variety of applications to reduce inspection and assembly times and increase productivity.
In August 2016, we acquired Laser Projection Technologies, Inc. (“LPT”) for a purchase price, net of cash acquired, of $17.2 million, paid with cash on hand, subject to certain additional post-closing adjustments. LPT, located in Londonderry, New Hampshire, specializes in laser projection and measurement systems used throughout manufacturing environments around the globe to maximize productivity and efficiency. The acquisition enhances our portfolio of 3D measurement solutions and supports our long-term strategy to expand our presence in key markets.
63
In December 2016, we acquired MWF-technology, GmbH (“MWF”) for a purchase price, net of cash acquired, of $6.6 million, paid with cash on hand, subject to certain post-closing adjustments. MWF, an innovator in mobile augmented reality solutions located near Frankfurt, Germany, provides technology that enables large, complex 3D CAD data to be transferred to a tablet device for use in mobile visualization and comparison to real world conditions. This enables real time, actionable manufacturing insight for in-process inspection, assembly, guidance and positioning.
The acquisitions of ARAS, Kubit, BuildIT, LPT and MWF constitute business combinations as defined by FASB ASC Topic 805, Business Combinations. Accordingly, the assets acquired and liabilities assumed were recorded at their fair values on the date of acquisition. The purchase price allocations marked as “Preliminary” below are based on the information that was available to make estimates of the fair value and may change as further information becomes available and additional analyses are completed. While we believe such information provided a reasonable basis for estimating the fair values, we may obtain more information and evidence during the measurement period that may result in changes to the estimated fair value amounts. The measurement period ends on the earlier of one year after the acquisition date or the date we received the information about the facts and circumstances that existed at the acquisition date. Subsequent adjustments, if necessary, will be recognized during the period in which the amounts are determined. These refinements include: (1) changes in the estimated fair value of certain intangible assets acquired; and (2) changes in deferred tax assets and liabilities related to the fair value estimates. The purchase price allocations marked as “Final” below represent our final determination of the fair value of the assets acquired and liabilities assumed for such acquisitions.
Following is a summary of our allocations of the purchase price to the fair values of the assets acquired and liabilities assumed as of the date of each acquisition:
ARAS (Final) | kubit (Final) | BuildIT (Final) | LPT (Preliminary) | MWF (Preliminary) | ||||||||||||||||
Accounts receivable | $ | 294 | $ | 136 | $ | 237 | $ | 54 | $ | 150 | ||||||||||
Inventory | — | — | — | 322 | — | |||||||||||||||
Other assets | — | 246 | 36 | 160 | 666 | |||||||||||||||
Deferred income tax assets | — | — | — | 1,112 | — | |||||||||||||||
Intangible assets | 5,351 | 2,571 | 1,015 | 5,474 | 1,816 | |||||||||||||||
Goodwill (1) | 4,964 | 3,805 | 3,393 | 11,872 | 5,364 | |||||||||||||||
Accounts payable and accrued liabilities | (27 | ) | (182 | ) | (95 | ) | (697 | ) | (700 | ) | ||||||||||
Other liabilities | (219 | ) | (489 | ) | (471 | ) | (1,086 | ) | (345 | ) | ||||||||||
Deferred income tax liabilities | (1,385 | ) | (674 | ) | (205 | ) | — | (364 | ) | |||||||||||
Contingent consideration | (1,338 | ) | (987 | ) | — | — | — | |||||||||||||
Total purchase price, net of cash acquired | $ | 7,640 | $ | 4,426 | $ | 3,910 | $ | 17,211 | $ | 6,587 | ||||||||||
(1) | The goodwill arising from the acquisitions consists largely of the expected synergies from combining operations as well as the value of the workforce. The goodwill value is not expected to be tax deductible. |
Following are the details of the purchase price allocated to the intangible assets acquired for the acquisitions noted above:
ARAS (Final) | kubit (Final) | BuildIT (Final) | LPT (Preliminary) | MWF (Preliminary) | |||||||||||||||||||||
Amount | Weighted Average Life | Amount | Weighted Average Life | Amount | Weighted Average Life | Amount | Weighted Average Life | Amount | Weighted Average Life | ||||||||||||||||
Trade name | $ | 509 | 5 | $ | 658 | 6 | $ | 346 | 7 | $ | 64 | 1 | $ | 36 | 1 | ||||||||||
Non-competition agreement | 540 | 4 | 272 | 3 | 31 | 5 | — | 0 | 3 | 2 | |||||||||||||||
Technology | 2,052 | 5 | 945 | 5 | 361 | 7 | 4,260 | 7 | 951 | 5 | |||||||||||||||
Customer relationships | 2,250 | 7 | 696 | 6 | 277 | 7 | 1,150 | 7 | 826 | 5 | |||||||||||||||
Fair value of intangible assets acquired | $ | 5,351 | 5 | $ | 2,571 | 5 | $ | 1,015 | 7 | $ | 5,474 | 7 | $ | 1,816 | 5 | ||||||||||
64
Acquisition and integration costs are not included as components of consideration transferred, but are recorded as expense in the period in which such costs are incurred. To date, we have incurred approximately $1.0 million in acquisition and integration costs for the ARAS, kubit, BuildIT, LPT and MWF acquisitions.
Pro forma results of operations for ARAS, kubit, BuildIT, LPT and MWF have not been presented because the effects of these acquisitions, individually and in aggregate, were not material to our consolidated results of operations.
19. QUARTERLY RESULT OF OPERATIONS (UNAUDITED)
Quarter ended | March 31, 2016 | June 30, 2016 | September 30, 2016 | December 31, 2016 | ||||||||||||
Sales | $ | 75,748 | $ | 78,538 | $ | 79,600 | $ | 91,698 | ||||||||
Gross profit | 42,671 | 43,934 | 42,678 | 48,677 | ||||||||||||
Net income | 3,080 | 3,392 | 1,090 | 3,545 | ||||||||||||
Net income per share: | ||||||||||||||||
Basic | $ | 0.19 | $ | 0.20 | $ | 0.07 | $ | 0.21 | ||||||||
Diluted | $ | 0.19 | $ | 0.20 | $ | 0.07 | $ | 0.21 | ||||||||
Quarter ended | March 28, 2015 | June 27, 2015 | September 26, 2015 | December 31, 2015 | ||||||||||||
Sales | $ | 69,939 | $ | 83,775 | $ | 72,507 | $ | 91,327 | ||||||||
Gross profit | 39,506 | 44,441 | 34,766 | 48,523 | ||||||||||||
Net income (loss) | 664 | 4,148 | (884 | ) | 8,885 | |||||||||||
Net income (loss) per share: | ||||||||||||||||
Basic | $ | 0.04 | $ | 0.24 | $ | (0.05 | ) | $ | 0.52 | |||||||
Diluted | $ | 0.04 | $ | 0.24 | $ | (0.05 | ) | $ | 0.52 | |||||||
ITEM 9. CHANGES IN AND DISAGREEMENTS WITH ACCOUNTANTS ON ACCOUNTING AND FINANCIAL DISCLOSURE.
None.
65
ITEM 9A. CONTROLS AND PROCEDURES.
Evaluation of Disclosure Controls and Procedures
We conducted an evaluation, under the supervision and with the participation of our management, including our Chief Executive Officer and Chief Financial Officer, of the effectiveness of the design and operation of our disclosure controls and procedures as of December 31, 2016. Disclosure controls and procedures (as defined in Rules 13a-15(e) and 15d-15(e) under the Exchange Act) are designed to provide reasonable assurance that information required to be disclosed in our reports filed under the Exchange Act, such as this Annual Report on Form 10-K, is recorded, processed, summarized and reported within the time periods specified in the SEC’s rules and forms. Disclosure controls and procedures also include, without limitation, controls and procedures that are designed to provide reasonable assurance that such information is accumulated and communicated to our management, including our Chief Executive Officer and Chief Financial Officer, as appropriate, to allow timely decisions regarding required disclosure.
The evaluation of our disclosure controls and procedures included a review of the control objectives and design, our implementation of the controls and the effect of the controls on the information generated for use in this Annual Report on Form 10-K. In conducting this evaluation, our Chief Executive Officer and Chief Financial Officer concluded that our disclosure controls and procedures, as defined by Rule 13a-15(e) under the Exchange Act, were effective as of December 31, 2016 to provide reasonable assurance that information required to be disclosed in this Annual Report on Form 10-K was recorded, processed, summarized and reported within the time periods specified in the SEC’s rules and forms and was accumulated and communicated to our management, including our Chief Executive Officer and Chief Financial Officer, as appropriate, to allow timely decisions regarding required disclosure.
Changes in Internal Control over Financial Reporting
During the fourth quarter of 2015, we identified and disclosed a material weakness in our internal control over financial reporting related to the review of certain deferred income tax accounts. Specifically, inaccurate unearned service revenue balances were used to calculate the deferred tax amounts in China and our internal controls over the review of the related deferred income tax accounts in foreign jurisdictions were not sufficiently designed to identify reasonably possible errors, including the lack of certain specific, documented instructions to the reviewers of the foreign income tax provisions. To remediate the material weakness described above, we instituted additional training and review procedures and engaged supplemental resources. During the fourth quarter of 2016, we successfully completed the testing necessary to conclude that the material weakness has been remediated.
Except for the implementation of the remediation measures noted above, there were no other changes in our internal control over financial reporting during the fourth quarter ended December 31, 2016 that have materially affected, or are reasonably likely to materially affect, our internal control over financial reporting.
Management’s Report on Internal Control over Financial Reporting
Management is responsible for establishing and maintaining adequate internal control over financial reporting (as defined in Rule 13a-15(f) of the Exchange Act). Internal control over financial reporting is the process designed under the Chief Executive Officer’s and the Chief Financial Officer’s supervision, and effected by our Board of Directors, management and other personnel, to provide reasonable assurance regarding the reliability of financial reporting and the preparation of financial statements for external purposes in accordance with generally accepted accounting principles in the United States.
There are inherent limitations in the effectiveness of internal control over financial reporting, including the possibility that misstatements may not be prevented or detected. Accordingly, an effective control system, no matter how well designed and operated, can provide only reasonable assurance of achieving the designed control objectives, and management is required to apply its judgment in evaluating the cost-benefit relationship of possible controls and procedures. Because of the inherent limitations in all control systems, no evaluation of controls can provide absolute assurance that all control issues and instances of fraud, if any, within the Company have been detected. The design of any system of controls is also based in part upon certain assumptions about the likelihood of future events, and there can be no assurance that any design will succeed in achieving its stated goals under all potential future conditions.
Under the supervision and with the participation of our management, including our Chief Executive Officer and Chief Financial Officer, we conducted an evaluation of the effectiveness of our internal control over financial reporting as of December 31, 2016, as required by Exchange Act Rule 13a-15(c). In making this assessment, we used the criteria set forth by
66
the Committee of Sponsoring Organizations of the Treadway Commission (“COSO”) in the 2013 Internal Control - Integrated Framework. Based on our assessment under the framework in Internal Control - Integrated Framework (2013 framework), management concluded that our internal control over financial reporting was effective as of December 31, 2016.
Grant Thornton LLP, the independent registered public accounting firm that audited our consolidated financial statements and internal control over financial reporting, has issued an attestation report on our internal control over financial reporting as of December 31, 2016, which appears below.
FARO Technologies, Inc.
Lake Mary, Florida
February 24, 2017
67
REPORT OF INDEPENDENT REGISTERED PUBLIC ACCOUNTING FIRM
Board of Directors and Shareholders
FARO Technologies, Inc. and Subsidiaries
We have audited the internal control over financial reporting of FARO Technologies, Inc. (a Florida corporation) and subsidiaries (the “Company”) as of December 31, 2016, based on criteria established in the 2013 Internal Control-Integrated Framework issued by the Committee of Sponsoring Organizations of the Treadway Commission (COSO). The Company’s management is responsible for maintaining effective internal control over financial reporting and for its assessment of the effectiveness of internal control over financial reporting, included in the accompanying Management’s Report on Internal Control over Financial Reporting. Our responsibility is to express an opinion on the Company’s internal control over financial reporting based on our audit.
We conducted our audit in accordance with the standards of the Public Company Accounting Oversight Board (United States). Those standards require that we plan and perform the audit to obtain reasonable assurance about whether effective internal control over financial reporting was maintained in all material respects. Our audit included obtaining an understanding of internal control over financial reporting, assessing the risk that a material weakness exists, testing and evaluating the design and operating effectiveness of internal control based on the assessed risk, and performing such other procedures as we considered necessary in the circumstances. We believe that our audit provides a reasonable basis for our opinion.
A company’s internal control over financial reporting is a process designed to provide reasonable assurance regarding the reliability of financial reporting and the preparation of financial statements for external purposes in accordance with generally accepted accounting principles. A company’s internal control over financial reporting includes those policies and procedures that (1) pertain to the maintenance of records that, in reasonable detail, accurately and fairly reflect the transactions and dispositions of the assets of the company; (2) provide reasonable assurance that transactions are recorded as necessary to permit preparation of financial statements in accordance with generally accepted accounting principles, and that receipts and expenditures of the company are being made only in accordance with authorizations of management and directors of the company; and (3) provide reasonable assurance regarding prevention or timely detection of unauthorized acquisition, use, or disposition of the company’s assets that could have a material effect on the financial statements.
Because of its inherent limitations, internal control over financial reporting may not prevent or detect misstatements. Also, projections of any evaluation of effectiveness to future periods are subject to the risk that controls may become inadequate because of changes in conditions, or that the degree of compliance with the policies or procedures may deteriorate.
In our opinion, the Company maintained, in all material respects, effective internal control over financial reporting as of December 31, 2016, based on criteria established in the 2013 Internal Control-Integrated Framework issued by COSO.
We also have audited, in accordance with the standards of the Public Company Accounting Oversight Board (United States), the consolidated financial statements of the Company as of and for the year ended December 31, 2016, and our report dated February 24, 2017 expressed an unqualified opinion on those financial statements.
/s/ GRANT THORNTON LLP
Orlando, Florida
February 24, 2017
68
ITEM 9B. OTHER INFORMATION
None.
PART III
ITEM 10. DIRECTORS, EXECUTIVE OFFICERS AND CORPORATE GOVERNANCE.
The information required by this Item with respect to directors and executive officers is incorporated herein by reference to the information under the headings “Election of Directors” and “Executive Officers” contained in our definitive proxy statement for our 2017 Annual Meeting of Shareholders, which we refer to as the Proxy Statement.
The information required by this Item regarding compliance with Section 16(a) of the Exchange Act appears under the heading “Section 16(a) Beneficial Ownership Reporting Compliance” in the Proxy Statement and is incorporated herein by reference.
The information required by this Item with respect to corporate governance and our Code of Ethics is incorporated herein by reference to the information contained in the Proxy Statement under the heading “Corporate Governance and Board Matters”.
ITEM 11. EXECUTIVE COMPENSATION.
The information required by this Item regarding executive compensation is incorporated herein by reference to the information contained in the Proxy Statement under the headings “Executive Compensation” and “2016 Director Compensation”.
The information required by this Item regarding Compensation Committee interlocks and insider participation is incorporated herein by reference to from the information contained in the Proxy Statement under the heading “Corporate Governance and Board Matters”.
ITEM 12. SECURITY OWNERSHIP OF CERTAIN BENEFICIAL OWNERS AND MANAGEMENT AND RELATED STOCKHOLDER MATTERS.
The information required by this Item regarding security ownership of certain beneficial owners and management and related stockholder matters is incorporated herein by reference to the information contained in the Proxy Statement under the headings “Security Ownership of Certain Beneficial Owners and Management” and “Equity Compensation Plan Information”.
ITEM 13. CERTAIN RELATIONSHIPS AND RELATED TRANSACTIONS, AND DIRECTOR INDEPENDENCE.
The information required by this Item about certain relationships and related transactions appears under the heading “Certain Relationships and Related Transactions” in the Proxy Statement and is incorporated herein by reference.
The information required by this Item regarding director independence is incorporated herein by reference to the information contained in the Proxy Statement under the heading “Corporate Governance and Board Matters”.
ITEM 14. PRINCIPAL ACCOUNTING FEES AND SERVICES.
The information required by this Item about principal accounting fees and services as well as related pre-approval policies appears under the heading “Independent Public Accountants” in the Proxy Statement and is incorporated herein by reference.
69
PART IV
ITEM 15. EXHIBITS, FINANCIAL STATEMENT SCHEDULES.
(a) (1) Financial Statements.
The following consolidated financial statements required by this item are included in Part II, Item 8 of this Annual Report on Form 10-K under the caption “Financial Statement and Supplementary Data”:
Consolidated Balance Sheets
Consolidated Statements of Operations
Consolidated Statements of Comprehensive Income (Loss)
Consolidated Statements of Shareholders’ Equity
Consolidated Statements of Cash Flows
Notes to Consolidated Financial Statements
Reports of Independent Registered Public Accounting Firm
(2) Financial Statement Schedules.
All financial statement schedules have been omitted as they are either not required or not applicable, or the required information is otherwise included in our consolidated financial statements or the notes thereto.
(b) Exhibits. The exhibits listed in the accompanying Exhibit Index are filed or incorporated by reference as part of this Annual Report on Form 10-K.
70
ITEM 16. FORM 10-K SUMMARY.
None.
SIGNATURES
Pursuant to the requirements of Section 13 or 15(d) of the Securities Exchange Act of 1934, the registrant has duly caused this report to be signed on its behalf by the undersigned, thereunto duly authorized.
FARO TECHNOLOGIES, INC. | ||||
Date: | February 24, 2017 | By: | /s/ Robert Seidel | |
Robert Seidel, Chief Financial Officer | ||||
(Duly Authorized Officer and Principal Financial Officer) | ||||
Pursuant to the requirements of the Securities Exchange Act of 1934, this report has been signed below by the following persons on behalf of the registrant and in the capacities and on the dates indicated. Each person whose signature appears below constitutes and appoints each of SIMON RAAB, ROBERT SEIDEL AND JODY GALE his or her true and lawful attorney-in-fact and agent, with full power of substitution and revocation, for him or her and in his or her name, place and stead, in any and all capacities, to sign any and all amendments to this report and to file the same, with all exhibits thereto, and other documents in connection therewith, with the Securities and Exchange Commission, granting unto said attorneys-in-fact and agents, and each of them, full power and authority to do and perform each and every act and thing requisite and necessary to be done in connection therewith, as fully to all intents and purposes as he or she might or could do in person, hereby ratifying and confirming all that said attorneys-in-fact and agents, or any of them, may lawfully do or cause to be done by virtue hereof.
71
Signature | Title | Date | ||
/s/ Simon Raab | Chairman of the Board, Director, President and Chief Executive Officer (Principal Executive Officer) | February 24, 2017 | ||
Simon Raab | ||||
/s/ Robert Seidel | Chief Financial Officer (Principal Financial Officer) | February 24, 2017 | ||
Robert Seidel | ||||
/s/ Janet D'Anjou | Vice President and Corporate Controller (Principal Accounting Officer) | February 24, 2017 | ||
Janet D'Anjou | ||||
/s/ John Caldwell | Director | February 24, 2017 | ||
John Caldwell | ||||
/s/ Lynn Brubaker | Director | February 24, 2017 | ||
Lynn Brubaker | ||||
/s/ Stephen R. Cole | Director | February 24, 2017 | ||
Stephen R. Cole | ||||
/s/ Marvin Sambur | Director | February 24, 2017 | ||
Marvin Sambur | ||||
/s/ John Donofrio | Director | February 24, 2017 | ||
John Donofrio | ||||
72
EXHIBIT INDEX
Exhibit No. | Description | |
2.1 | Stock Purchase Agreement, dated as of August 26, 2016, by and among FARO Technologies, Inc., Laser Projection Technologies, Inc., each of the shareholders of Laser Projection Technologies, Inc. and Steven P. Kaufman in the capacity of the Seller Representative (Filed as Exhibit 2.1 to Registrant's Current Report on Form 8-K filed August 30, 2016, and incorporated herein by reference)** | |
3.1 | Amended and Restated Articles of Incorporation, as amended (Filed as Exhibit 3.1 to Registrant’s Registration Statement on Form S-1/A filed September 10, 1997, No. 333-32983, and incorporated herein by reference) | |
3.2 | Amended and Restated Bylaws (Filed as Exhibit 3.1 to Registrant’s Current Report on Form 8-K, filed February 3, 2010, and incorporated herein by reference, SEC File No. 000-23081) | |
4.1 | Specimen Stock Certificate (Filed as Exhibit 4.1 to Registrant’s Registration Statement on Form S-1/A , filed September 10, 1997, No. 333-32983, and incorporated herein by reference) | |
10.1 | Amended and Restated 2004 Equity Incentive Plan (Filed as Exhibit 10.1 to Registrant’s Form 8-K filed November 24, 2008, and incorporated herein by reference, SEC File No. 000-23081)* | |
10.2 | Amendment to Amended and Restated 2004 Equity Incentive Plan (Filed as Exhibit 10.3 to Registrant’s Form 8-K, filed April 8, 2009, and incorporated herein by reference, SEC File No. 000-23081)* | |
10.3 | 1997 Non-Employee Director Stock Option Plan (Filed as Exhibit 10.3 to Registrant’s Registration Statement on Form S-1 filed August 6, 1997, No. 333-32983, and incorporated herein by reference)* | |
10.4 | 2009 Equity Incentive Plan (Filed as Appendix A to Registrant’s Definitive Proxy Statement on Schedule 14A filed April 15, 2009, and incorporated herein by reference, SEC File No. 000-23081)* | |
10.5 | First Amendment to the 2009 Equity Incentive Plan (Filed as Exhibit 10.1 to Registrant’s Current Report on Form 8-K, filed April 15, 2011, and incorporated herein by reference, SEC File No. 000-23081)* | |
10.6 | 2014 Incentive Plan (Filed as Exhibit 10.1 to Registrant’s Current Report on Form 8-K, filed June 3, 2014, and incorporated herein by reference)* | |
10.7 | Summary of Director Compensation Program (Filed as Exhibit 10.7 to Registrant's Annual Report on Form 10-K for the year ended December 31, 2015, and incorporated herein by reference)* | |
10.8 | Form of Intellectual Property and Confidentiality Agreement between FARO Technologies, Inc. and new employees (Filed as Exhibit 10.8 to Registrant's Annual Report on Form 10-K for the year ended December 31, 2015, and incorporated herein by reference) | |
10.9 | Form of Stock Option Award Agreement under the 2004 Equity Incentive Plan (Filed as Exhibit 10.1 to Registrant’s Quarterly Report on Form 10-Q for the quarter ended March 29, 2008, and incorporated herein by reference, SEC file No. 000-23801)* | |
10.10 | Form of Stock Option Award Agreement under the 2009 Equity Incentive Plan (Filed as Exhibit 10.10 to Registrant’s Annual Report on Form 10-K for the year ended December 31, 2015, and incorporated herein by reference)* | |
10.11 | Form of Restricted Stock Unit Award Agreement under the 2009 Equity Incentive Plan (Filed as Exhibit 10.11 to Registrant’s Annual Report on Form 10-K for the year ended December 31, 2015, and incorporated herein by reference)* | |
10.12 | Form of performance-based Stock Option Award Agreement under the 2014 Incentive Plan (Filed as Exhibit 10.12 to Registrant’s Annual Report on Form 10-K for the year ended December 31, 2015, and incorporated herein by reference)* | |
73
10.13 | Form of performance-based Restricted Stock Unit Award Agreement under the 2014 Incentive Plan (Filed as Exhibit 10.13 to Registrant’s Annual Report on Form 10-K for the year ended December 31, 2015, and incorporated herein by reference)* | |
10.14 | Form of Restricted Stock Unit Award Agreement under the 2014 Incentive Plan (Filed as Exhibit 10.4 to Registrant's Quarterly Report on Form 10-Q for the quarter ended June 30, 2016, and incorporated herein by reference)* | |
10.15 | Form of time-based Stock Option Award Agreement under the 2014 Incentive Plan* | |
10.16 | Amended and Restated Employment Agreement, dated November 7, 2008, by and between FARO Technologies, Inc. and Jay Freeland (Filed as Exhibit 10.1 to Registrant’s Current Report on Form 8-K filed November 14, 2008, and incorporated herein by reference, SEC File No. 000-23801)* | |
10.17 | Amendment to Amended and Restated Employment Agreement, dated April 2, 2009, by and between FARO Technologies, Inc. and Jay Freeland (Filed as Exhibit 10.1 to Registrant’s Current Report on Form 8-K, filed April 8, 2009, and incorporated herein by reference, SEC File No. 000-23801)* | |
10.18 | Amendment No. 2 to Amended and Restated Employment Agreement, dated December 14, 2010, by and between FARO Technologies, Inc. and Jay Freeland (Filed as Exhibit 10.17 to the Registrant’s Annual Report on Form 10-K for the year ended December 31, 2010 and incorporated herein by reference, SEC File No. 000-23801)* | |
10.19 | Transition and Separation Agreement dated December 4, 2015 between FARO Technologies, Inc. and Jay Freeland (Filed as Exhibit 10.1 to Registrant’s Current Report on Form 8-K, filed December 7, 2015, and incorporated herein by reference)* | |
10.20 | Employment Agreement between FARO Technologies, Inc. and Peter G. Abram, dated March 7, 2014 (Filed as Exhibit 10.1 to Registrant’s Current Report on Form 8-K filed March 10, 2014 and incorporated herein by reference)* | |
10.21 | Separation and release letter agreement, dated as of March 20, 2015, between FARO Technologies, Inc. and Peter G. Abram (Filed as Exhibit 10.1 to Registrant’s Current Report on Form 8-K filed March 25, 2015 and incorporated herein by reference)* | |
10.22 | Employment Agreement between FARO Technologies, Inc. and Joseph Arezone, dated as of April 27, 2016 (Filed as Exhibit 10.2 to Registrant’s Current Report on Form 8-K, filed April 29, 2016, and incorporated herein by reference)* | |
10.23 | Amended and Restated Employment Agreement between FARO Technologies, Inc. and Kathleen J. Hall, dated as of April 27, 2016 (Filed as Exhibit 10.1 to Registrant’s Current Report on Form 8-K filed April 29, 2016, and incorporated herein by reference)* | |
10.24 | Amended and Restated Employment Agreement between FARO Technologies, Inc. and Jody S. Gale, dated as of April 27, 2016 (Filed as Exhibit 10.3 to Registrant’s Current Report on Form 8-K filed April 29, 2016, and incorporated herein by reference)* | |
10.25 | Employment Agreement between FARO Technologies, Inc. and Laura Murphy, dated as of July 29, 2015 (Filed as Exhibit 10.1 to Registrant’s Current Report on Form 8-K, filed July 31, 2015 and incorporated herein by reference)* | |
10.26 | Transition and Separation Agreement between FARO Technologies, Inc. and Laura A. Murphy-Wolf, dated as of March 10, 2016 (Filed as Exhibit 10.1 to Registrant's Current Report on Form 8-K filed March 11, 2016, and incorporated by reference)* | |
10.27 | Employment Agreement between FARO Technologies, Inc. and Robert E. Seidel, dated December 21, 2016 (Filed as Exhibit 10.1 to Registrant's Current Report on Form 8-K filed December 21, 2016, and incorporated herein by reference)* | |
10.28 | FARO Technologies, Inc. Amended and Restated Change in Control Severance Policy, dated as of April 9, 2015 (Filed as Exhibit 10.1 to Registrant’s Current Report on Form 8-K, filed April 10, 2015 and incorporated herein by reference)* | |
10.29 | Office Flex Lease, dated September 26, 2007, by and between FARO Technologies, Inc. and Sun Life Assurance Company of Canada (Filed as Exhibit 10.15 to Registrant’s Annual Report on Form 10-K for the year ended December 31, 2007, and incorporated herein by reference, SEC File No. 000-23801) | |
74
10.30 | First Amendment to Lease Agreement, dated October 1, 2009, by and between FARO Technologies, Inc. and Sun Life Assurance Company of Canada (Filed as Exhibit 10.27 to Registrant’s Annual Report on Form 10-K for the year ended December 31, 2009 and incorporated herein by reference, SEC File No. 000-23801) | |
10.31 | Amended and Restated Lease Agreement, dated October 1, 2009, by and between FARO Technologies, Inc. and Emma Investments, LLC (Filed as Exhibit 10.26 to Registrant’s Annual Report on Form 10-K for the year ended December 31, 2009 and incorporated herein by reference, SEC File No. 000-23801) | |
10.32 | First Amendment to Amended and Restated Lease Agreement between Emma Investments, LLC and FARO Technologies, Inc., dated as of May 14, 2014 (Filed as Exhibit 10.1 to Registrant’s Current Report on Form 8-K filed May 16, 2014 and incorporated herein by reference) | |
10.33 | Agreement of Lease (Amendment and Restatement) between 290 National Road Limited Partnership and FARO Technologies, Inc., dated as of September 9, 2014 (Filed as Exhibit 10.1 to Registrant’s Current Report on Form 8-K filed September 12, 2014 and incorporated herein by reference) | |
21.1 | List of Subsidiaries | |
23.1 | Consent of Grant Thornton LLP | |
24.1 | Power of Attorney relating to subsequent amendments (included on the signature page(s) of this report). | |
31-A | Certification of the Chief Executive Officer Pursuant to Section 302 of the Sarbanes-Oxley Act of 2002 | |
31-B | Certification of the Chief Financial Officer Pursuant to Section 302 of the Sarbanes-Oxley Act of 2002 | |
32-A | Certification of the Chief Executive Officer Pursuant to Section 906 of the Sarbanes-Oxley Act of 2002 | |
32-B | Certification of the Chief Financial Officer Pursuant to Section 906 of the Sarbanes-Oxley Act of 2002 | |
99.1 | Properties | |
101.INS | XBRL Instance Document | |
101.SCH | XBRL Taxonomy Extension Schema Document | |
101.CAL | XBRL Taxonomy Calculation Linkbase | |
101.DEF | XBRL Taxonomy Extension Definition Linkbase Document | |
101.LAB | XBRL Taxonomy Labels Linkbase Document | |
101.PRE | XBRL Taxonomy Presentation Linkbase Document | |
* | Indicates management contracts or compensatory plans or arrangements |
** | Schedules and exhibits are omitted pursuant to Item 601(b)(2) of Regulation S-K. Registrant agrees to furnish supplementally a copy of any omitted schedules or exhibits to the Securities and Exchange Commission upon request. |
75