Attached files
| file | filename |
|---|---|
| EX-23.2 - CONSENT OF INDEPENDENT PETROLEUM ENGINEERS - California Resources Corp | a2016yeexhibit232ryderscot.htm |
| EX-99.1 - REPORT OF INDEPENDENT PETROLEUM ENGINEERS - California Resources Corp | a2016yeexhibit991ryderscott.htm |
| EX-32.1 - CERTIFICATIONS OF CEO AND CFO - California Resources Corp | a2016yeexhibit321.htm |
| EX-31.2 - CERTIFICATION OF CFO - California Resources Corp | a2016yeexhibit312.htm |
| EX-31.1 - CERTIFICATION OF CEO - California Resources Corp | a2016yeexhibit311.htm |
| EX-23.1 - CONSENT OF INDEPENDENT REGISTERED PUBLIC ACCOUNTING FIRM - California Resources Corp | a2016yeexhibit231kpmgconse.htm |
| EX-21 - LIST OF SUBSIDIARIES - California Resources Corp | a2016yeexhibit21listofsubs.htm |
| EX-12 - RATIO OF EARNINGS TO FIXED CHARGES - California Resources Corp | a2016yeexhibit12.htm |
UNITED STATES SECURITIES AND EXCHANGE COMMISSION
Washington, D.C. 20549
Form 10-K
þ | ANNUAL REPORT PURSUANT TO SECTION 13 OR 15(d) OF THE SECURITIES EXCHANGE ACT OF 1934 |
For the fiscal year ended December 31, 2016
¨ | TRANSITION REPORT PURSUANT TO SECTION 13 OR 15(d) OF THE SECURITIES EXCHANGE ACT OF 1934 |
For the transition period from to
Commission File Number 001-36478
California Resources Corporation
(Exact name of registrant as specified in its charter)
Delaware (State or other jurisdiction of incorporation or organization) | 46-5670947 (I.R.S. Employer Identification No.) | |
9200 Oakdale Ave. Los Angeles, California (Address of principal executive offices) | 91311 (Zip Code) | |
(888) 848-4754
(Registrant’s telephone number, including area code)
Securities registered pursuant to Section 12(b) of the Act:
Title of Each Class | Name of Each Exchange on Which Registered | |
Common Stock | New York Stock Exchange | |
5% Senior Notes due 2020 | ||
5½% Senior Notes due 2021 | ||
6% Senior Notes due 2024 | ||
Securities registered pursuant to Section 12(g) of the Act: None
Indicate by check mark if the registrant is a well-known seasoned issuer, as defined in Rule 405 of the Securities Act. Yes þ No ¨
Indicate by check mark if the registrant is not required to file reports pursuant to Section 13 or Section 15(d) of the Act: | Yes ¨ No þ |
Indicate by check mark whether the registrant (1) has filed all reports required to be filed by Section 13 or 15(d) of the Securities Exchange Act of 1934 during the preceding 12 months (or for such shorter period that the registrant was required to file such reports), and (2) has been subject to such filing requirements for the past 90 days. Yes þ No ¨
Indicate by check mark whether the registrant has submitted electronically and posted on its corporate Web site, if any, every Interactive Date File required to be submitted and posted pursuant to Rule 405 of Regulation S-T during the preceding 12 months (or such shorter period as the registrant was required to submit and post files). Yes þ No ¨
Indicate by check mark if disclosure of delinquent filers pursuant to Item 405 of Regulation S-K is not contained herein, and will not be contained, to the best of registrant's knowledge, in definitive proxy or information statements incorporated by reference in Part III of this Form 10-K or any amendment to this Form 10-K. ¨
Indicate by check mark whether the registrant is a large accelerated filer, an accelerated filer, a non-accelerated filer, or a smaller reporting company. See the definitions of "large accelerated filer," "accelerated filer" and "smaller reporting company" in Rule 12b-2 of the Exchange Act.
Large Accelerated Filer | ¨ | Accelerated Filer | þ | |
Non-Accelerated Filer | ¨ | Smaller Reporting Company | ¨ | |
Indicate by check mark whether the registrant is a shell company (as defined in Rule 12b-2 of the Act) Yes ¨ No þ
The aggregate market value of the voting common stock held by nonaffiliates of the registrant was approximately $496 million, computed by reference to the closing price on the New York Stock Exchange composite tape of $12.20 per share of Common Stock on June 30, 2016. Shares of Common Stock held by each executive officer and director have been excluded from this computation in that such persons may be deemed to be affiliates. This determination of potential affiliate status is not a conclusive determination for other purposes.
At January 31, 2017, there were 42,542,637 shares of Common Stock outstanding.
DOCUMENTS INCORPORATED BY REFERENCE
Portions of the registrant’s definitive proxy statement to be filed with the Securities and Exchange Commission in connection with the registrant's 2017 Annual Meeting of Stockholders, are incorporated by reference into Part III of this Form 10-K.
1
LIST OF OPERATING SUBSIDIARIES
The following is a list of our subsidiaries at December 31, 2016 other than certain subsidiaries that did not in the aggregate constitute a significant subsidiary.
Name | Jurisdiction of Formation | |
California Heavy Oil, Inc. | Delaware | |
California Resources Coles Levee, LLC | Delaware | |
California Resources Coles Levee, L.P. | Delaware | |
California Resources Elk Hills, LLC | Delaware | |
California Resources Long Beach, Inc. | Delaware | |
California Resources Petroleum Corporation | Delaware | |
California Resources Production Corporation | Delaware | |
California Resources Tidelands, Inc. | Delaware | |
California Resources Wilmington, LLC | Delaware | |
CRC Construction Services, LLC | Delaware | |
CRC Marketing, Inc. | Delaware | |
CRC Services, LLC | Delaware | |
Elk Hills Power, LLC | Delaware | |
Socal Holding, LLC | Delaware | |
Southern San Joaquin Production, Inc. | Delaware | |
Thums Long Beach Company | Delaware | |
Tidelands Oil Production Company | Texas | |
2
TABLE OF CONTENTS
Page | ||
Part I | ||
Items 1 | BUSINESS | |
General | ||
Business Operations | ||
Our Business Strategy | ||
Key Characteristics of our Operations | ||
Portfolio Management and 2017 Capital Budget | ||
Reserves and Production Information | ||
Marketing Arrangements | ||
Regulation of the Oil and Natural Gas Industry | ||
Employees | ||
Available Information | ||
Item 1A | RISK FACTORS | |
Item 1B | UNRESOLVED STAFF COMMENTS | |
Item 2 | PROPERTIES | |
Our Operations | ||
Our Reserves and Production Information | ||
Determination of Identified Drilling Locations | ||
Production, Price and Cost History | ||
Productive Wells | ||
Acreage | ||
Participation in Exploratory and Development Wells Being Drilled | ||
Delivery Commitments | ||
Our Infrastructure | ||
Item 3 | LEGAL PROCEEDINGS | |
Item 4 | MINE SAFETY DISCLOSURES | |
EXECUTIVE OFFICERS | ||
Part II | ||
Item 5 | MARKET FOR REGISTRANT'S COMMON EQUITY, RELATED STOCKHOLDER MATTERS AND ISSUER PURCHASES OF EQUITY SECURITIES | |
Item 6 | SELECTED FINANCIAL DATA | |
Item 7 | MANAGEMENT'S DISCUSSION AND ANALYSIS OF FINANCIAL CONDITION AND RESULTS OF OPERATIONS | |
The Separation and Spin-off | ||
Basis of Presentation and Certain Factors Affecting Comparability | ||
Business Environment and Industry Outlook | ||
Seasonality | ||
Income Taxes | ||
Operations | ||
Financial and Operating Results | ||
Balance Sheet Analysis | ||
Statement of Operations Analysis | ||
Liquidity and Capital Resources | ||
Cash Flow Analysis | ||
Acquisitions and Divestitures | ||
2016 Capital Program and 2017 Capital Budget | ||
Off-Balance-Sheet Arrangements | ||
Lawsuits, Claims, Contingencies and Commitments | ||
Critical Accounting Policies and Estimates | ||
Significant Accounting and Disclosure Changes | ||
Item 7A | QUANTITATIVE AND QUALITATIVE DISCLOSURES ABOUT MARKET RISK | |
FORWARD-LOOKING STATEMENTS | ||
Item 8 | FINANCIAL STATEMENTS AND SUPPLEMENTARY DATA | |
Report of Independent Registered Public Accounting Firm on Consolidated and Combined Financial Statements | ||
Report of Independent Registered Public Accounting Firm on Internal Control Over Financial Reporting | ||
Consolidated Balance Sheets | ||
Consolidated and Combined Statements of Operations | ||
Consolidated and Combined Statements of Comprehensive Income | ||
Consolidated and Combined Statements of Equity | ||
3
Consolidated and Combined Statements of Cash Flows | ||
Notes to Consolidated and Combined Financial Statements | ||
Quarterly Financial Data (Unaudited) | ||
Supplemental Oil and Gas Information (Unaudited) | ||
SCHEDULE II - VALUATION AND QUALIFYING ACCOUNTS | ||
Item 9 | CHANGES IN AND DISAGREEMENTS WITH ACCOUNTANTS ON ACCOUNTING AND FINANCIAL DISCLOSURE | |
Item 9A | CONTROLS AND PROCEDURES | |
Item 9B | OTHER INFORMATION | |
Part III | ||
Item 10 | DIRECTORS, EXECUTIVE OFFICERS AND CORPORATE GOVERNANCE | |
Item 11 | EXECUTIVE COMPENSATION | |
Item 12 | SECURITY OWNERSHIP OF CERTAIN BENEFICIAL OWNERS AND MANAGEMENT AND RELATED STOCKHOLDER MATTERS | |
Item 13 | CERTAIN RELATIONSHIPS AND RELATED TRANSACTIONS AND DIRECTOR INDEPENDENCE | |
Item 14 | PRINCIPAL ACCOUNTANT FEES AND SERVICES | |
Part IV | ||
Item 15 | EXHIBITS | |
4
PART I
Item 1 | BUSINESS |
In this report, except when the context otherwise requires or where otherwise indicated, (1) all references to ‘‘CRC,’’ the ‘‘Company,’’ ‘‘we,’’ ‘‘us’’ and ‘‘our’’ refer to California Resources Corporation and its subsidiaries or the California business, (2) all references to the ‘‘California business’’ refer to Occidental’s California oil and gas exploration and production operations and related assets, liabilities and obligations, which we assumed in connection with the spin-off from Occidental on November 30, 2014 (the Spin-off), and (3) all references to ‘‘Occidental’’ refer to Occidental Petroleum Corporation, our former parent, and its subsidiaries.
General
We are an independent oil and natural gas exploration and production company operating properties within the state of California. We were incorporated in Delaware as a wholly owned subsidiary of Occidental on April 23, 2014, and remained a wholly owned subsidiary of Occidental until November 30, 2014. As of November 30, 2014, all material existing assets, operations and liabilities of Occidental's California business were consolidated under us. On November 30, 2014, Occidental distributed shares of our common stock on a pro rata basis to Occidental stockholders and we became an independent, publicly traded company (the Spin-off). Occidental initially retained approximately 18.5% of our outstanding shares of common stock, which it distributed to Occidental stockholders on March 24, 2016. On May 31, 2016 we completed a reverse stock split using a ratio of one share of common stock for every ten shares then outstanding. Share and per share amounts included in this report have been restated to reflect this reverse stock split.
Business Operations
Our Business
Our business is focused on conventional and unconventional assets in California. We are the largest oil and gas producer in California on a gross operated basis and we believe we have the largest privately held mineral acreage position in the state, consisting of approximately 2.3 million net acres spanning the state’s four major oil and gas basins. We produced approximately 140 thousand barrels of oil equivalent per day (MBoe/d) for the year ended December 31, 2016. As of December 31, 2016, we had net proved reserves of 568 million barrels of oil equivalent (MMBoe), of which approximately 71% was categorized as proved developed reserves. Oil represented 72% of our proved reserves.
Our large acreage position and extensive drilling inventory provide us a diversified portfolio of oil and natural gas locations that are economically viable in a variety of operating and commodity price conditions, including many which are high return projects throughout the price cycle. Our acreage position contains numerous development and growth opportunities due to its varied geologic characteristics and multiple stacked pay reservoirs which, in many cases, are thousands of feet thick. We have a large portfolio of low-risk and low-decline conventional opportunities in each of our major oil and gas basins with approximately 70% of our proved reserves associated with conventional opportunities. Conventional reservoirs are capable of natural flow using primary, steamflood and waterflood recovery methods. We also have a significant portfolio of unconventional growth opportunities in lower permeability reservoirs that typically utilize established well stimulation techniques. We have approximately 3,400 net identified drilling locations targeting unconventional reservoirs primarily in the San Joaquin basin. Prior to the severe price declines, we were focused on higher-value unconventional production from seven discrete stacked pay horizons within the Monterey formation, primarily within the upper Monterey. Over the longer term, as project economics improve, we will seek to duplicate our successful upper Monterey results to develop opportunities in the unconventional reservoirs of the lower Monterey, Kreyenhagen and Moreno formations, which have similar geological attributes.
5
The following table summarizes certain information concerning our acreage, wells and drilling activities (as of December 31, 2016, acres and dollars in millions, unless otherwise stated):
Acreage | Average Net Acreage Held in Fee (%) | Producing Wells, gross | Net Revenue Interest (%) | Identified Drilling Locations(1) | ||||||||||||||||
Gross | Net | Gross | Net | |||||||||||||||||
San Joaquin Basin | 1.8 | 1.5 | 64 | % | 6,246 | 79 | % | 23,900 | 16,650 | |||||||||||
Los Angeles Basin(2) | <0.1 | <0.1 | 52 | % | 1,315 | 78 | % | 2,150 | 2,050 | |||||||||||
Ventura Basin | 0.3 | 0.3 | 72 | % | 567 | 84 | % | 2,950 | 2,750 | |||||||||||
Sacramento Basin | 0.6 | 0.5 | 37 | % | 709 | 76 | % | 1,900 | 1,400 | |||||||||||
Total | 2.8 | 2.3 | 58 | % | 8,837 | 79 | % | 30,900 | 22,850 | |||||||||||
(1) | Our total identified drilling locations exclude approximately 6,400 gross (5,300 net) prospective resource drilling locations. Our total identified drilling locations include approximately 2,350 gross (2,150 net) locations associated with proved undeveloped reserves as of December 31, 2016. Our total identified drilling locations also include approximately 2,300 gross (2,100 net) injection well locations. Please see "Item 2 – Properties – Our Reserves and Production Information" for more information regarding the processes and criteria through which we identified our drilling locations. |
(2) | We currently hold approximately 42,600 gross (34,400 net) acres in the Los Angeles basin. Our Los Angeles basin operations are concentrated with pad drilling. |
We develop our capital investment programs by prioritizing life of project returns to grow our net asset value over the long term, while balancing the short- and long-term growth potential of each of our assets. We use a Value Creation Index (VCI) metric for project selection and capital allocation across our portfolio of opportunities. We calculate the VCI for each of our projects by dividing the net present value of the project's expected pre-tax cash flow over its life by the present value of the investments, each using a 10% discount rate. Projects are expected to meet a VCI of 1.3, meaning that 30% of expected value is created above our cost of capital for every dollar invested. Our technical teams are consistently working to enhance value by improving the economics of our inventory through detailed geologic studies as well as application of more effective and efficient drilling and completion techniques. As a result, we expect many projects that do not currently meet our investment hurdle today will do so by the time of development. We regularly monitor internal performance and external factors and adjust our capital investment program with the objective of creating the most value from our portfolio of drilling opportunities.
Over the past decade, we have also built a 3D seismic library that covers approximately 4,800 square miles, representing over 90% of the 3D seismic data available in California. We have developed unique, proprietary stratigraphic and structural models of the subsurface geology and hydrocarbon potential in each of the four basins in which we operate. In recent years we have tested and successfully implemented various exploration, drilling, completion and enhanced recovery technologies to increase recoveries, growth and value from our portfolio. We continue working to build depth in our exploration inventory and identify new prospects based on the competitive advantage provided by this proprietary data set and our experience.
Business Environment
Much of the global exploration and production industry has been challenged at recent price levels, putting pressure on the industry's ability to generate positive cash flow and access capital. The decline in average oil prices that began in the last half of 2014 continued into the first quarter of 2016. While global oil prices improved modestly through the end of 2016 and began to trade in a narrower range, daily average prices were still lower for the full year of 2016 compared to 2015.
Consistent with our strategy to invest within our cash flow, we initially budgeted $50 million for our 2016 capital program, primarily to maintain the mechanical integrity of our facilities and systems and operate them safely. In the first half of the year, we further reduced the pace of our capital program to below our initial budget. In response to commodity price improvements in the second half of the year, we gradually increased our capital investment to $75 million for the full year. Our slowdown of drilling activity from late 2015 through the first half of 2016, coupled with the selective deferral of expense and capital workover activity, led to a decline in our production in 2016. However, we accomplished our operational tenet of minimizing our base decline with nominal capital investment.
6
At the time of our Spin-off, we had over 2,000 employees. In the third quarter of 2015 and early 2016, we implemented a voluntary retirement program and other employee actions to align our workforce with our view of the commodity price environment. We ended 2016 with approximately 1,450 employees, representing a nearly 30% reduction mainly through attrition and the 2015 and 2016 employee actions. We have also taken a number of other steps which better align our cost structure with the current environment. As a result of these steps, our 2016 production costs and general and administrative expenses were below 2015 levels. These measures helped offset some of the cash flow effects of the low commodity prices. We also pursued a number of alternatives to strengthen our balance sheet and better align our capital structure with the recent market conditions as described in more detail in “Item 7 – Management’s Discussion and Analysis of Financial Condition and Results of Operation – Liquidity and Capital Resources.”
With significant operating control of our properties, we have the ability to adjust our drilling and workover rig count based on commodity prices and monitor market conditions to increase or decrease our program accordingly. We reactivated our drilling program in the third quarter of 2016 with one drilling rig located in the San Joaquin basin primarily targeting steamflood activities. By the end of the year, we operated two drilling rigs, one each in the San Joaquin and Los Angeles basins. We drilled 42 development wells with 37 wells in the San Joaquin basin and 5 in the Los Angeles basin. These included 34 steamflood and 8 waterflood wells. In 2016, we also increased our workover rig count from 26 at the beginning of the year to 41 at the end of the year to focus on projects that meet our investment criteria. In total, we performed 133 capital workover projects during 2016.
Compared to 2015, our 2016 production declined 12.5%, with only $31 million of drilling and workover capital employed for the year. Excluding the effect of our production-sharing contracts (PSCs) in Long Beach, our decline rate would have been under 12%. This performance reflects the resilience of our asset base and the better than expected flattening of our base production decline. We expect to direct virtually all of our capital investments toward oil-weighted opportunities in 2017 to the extent the oil-to-gas price relationship remains favorable, which should improve our overall margins. For example, our steamflood projects provide some of the highest returns in our portfolio when the oil-to-gas price ratio exceeds five to one. As of December 31, 2016, the ratio was approximately 19 to one.
The flattening of our production decline rate that started in the second half of 2016 as a result of higher activity levels has continued into the first quarter of 2017. We believe that the actions we have taken since the Spin-off to streamline our business and reduce costs, together with recent price increases, have brought us to an inflection point where we can increase our activity level. We intend to fund our capital investment program by reinvesting substantially all of our operating cash flow, while considering additional potential deleveraging opportunities. We expect to drive organic deleveraging by drilling our extensive inventory of oil-heavy, low-decline assets. Our high level of operational control provides flexibility to adjust the level of our capital investments as circumstances warrant. As a result, we have created dynamic budgets that can be adjusted to align investments with projected cash flows. In the event of improved and more consistent prices and cash flow, we may choose to deploy additional capital based on our VCI investment metric, while abiding by our financial covenants.
Prior to the Spin-off, while we were a subsidiary of Occidental, we did not have a hedging program. Given the volatile oil price environment, we instituted a program immediately after the Spin-off to protect our cash flows, margins and capital investment programs and to improve our ability to comply with our credit facility covenants in case of price deterioration.
7
Our Business Strategy
Near-Term Strategy
In mid-2016, global oil prices began to recover from the apparent low point of this commodity cycle. The recovery further strengthened following the production cuts announced at the November 2016 meeting of the Organization of the Petroleum Exporting Countries (OPEC). In light of these developments, we began to increase our activity level in the second half of 2016 and have continued to do so in early 2017. While we began 2017 with two rigs running, by the end of the first quarter of 2017, we anticipate having four rigs running (three in the San Joaquin basin and one in the Los Angeles basin). We also plan to add an additional rig in the Ventura basin by the third quarter of 2017. Our 2017 development program will focus primarily on our core fields: Elk Hills; Wilmington; Kern Front; Buena Vista; and the delineation of Kettleman North Dome. Based on then-current market conditions, we increased our 2017 planned capital program to $300 million from the $75 million invested in 2016. We have developed a dynamic plan which can be scaled up or down depending on the price environment. For 2017, we have action plans that can reduce our capital investment plan to under $100 million or increase it to as high as $500 million based on conditions during the year. For highlights of our 2017 program, see "Portfolio Management and 2017 Capital Budget" section below.
Our approach to our 2017 drilling program is consistent with our stated strategy to remain financially disciplined and fund projects through internally generated cash flow. This approach is intended to maintain our liquidity and further strengthen our balance sheet. We are prepared to significantly increase our drilling activity if prices continue to improve during 2017. We will also evaluate the use of excess cash for other opportunities to further strengthen our capital structure. Our plan is to deploy capital to projects that help stabilize our production and return to a growth profile in the second half of the year. Our current drilling inventory comprises a diversified portfolio of oil and natural gas locations that are economically viable in a variety of operating and commodity price conditions.
Long-Term Strategy
We plan to drive long-term stockholder value by applying modern technology to develop our resource base and increase production. We have significant conventional opportunities to pursue, which we develop through their life-cycles to increase recovery factors by transitioning them from primary production to steamfloods, waterfloods and other enhanced recovery mechanisms. In the recent price and constrained capital environment, we have remained financially disciplined and prudent with our capital investments to maintain liquidity. We are cautiously optimistic that the prices at the end of 2016 are at a turning point and moving towards a more stabilized and relatively higher commodity price environment. In a sustained higher price environment, we intend to direct any additional available capital to oil projects that provide long-term value, high returns, growing cash flows and low production declines. Higher activity should ultimately lead to more production which further increases our cash flows, allowing us to strengthen our balance sheet through growth. The principal elements of our long-term business strategy include the following:
• | Focus on high-margin crude oil projects to generate sufficient cash flows to internally fund our growth capital needs. We expect the percentage of our oil production to continue to increase over time and favorably impact our overall margins as we anticipate directing virtually all of our capital investments towards oil-weighted opportunities to the extent the oil-to-gas price relationship remains favorable and capital is available. Approximately 95% of our identified drilling inventory is associated with oil-rich projects. Currently, 65% of our production is oil while 72% of our reserves are oil. Over time, we expect our share of oil production to approach the share of oil reserves. |
• | Maintain an appropriate share of conventional projects in our production mix to manage production declines and lower base maintenance capital requirements. Our portfolio of assets includes a large number of steamflood and waterflood projects that have much lower decline rates than many unconventional projects. At current price levels, we intend to focus a greater portion of our capital investments on such projects, which we expect will lower our production decline rates. Over time, we expect that this strategy will reduce the capital required to maintain flat crude oil production. We have significant additional lower-risk conventional opportunities with approximately 27,150 gross (19,450 net) identified drilling locations, 54% of which are associated with Improved Oil Recovery (IOR) and Enhanced Oil Recovery (EOR) projects. The remaining 46% are associated with primary recovery methods, many of which we expect will develop into IOR and EOR projects in the future. |
8
• | Proactive and collaborative approach to safety, environmental protection, and community relations. We are committed to managing our assets in a manner that safeguards people and protects the environment, and we seek to proactively engage with regulatory agencies, communities and other stakeholders to pursue mutually beneficial outcomes. As a California company, helping our state meet its water needs is a key strategic focus. Through our investments in water conservation and in recycling of produced water from oil and gas reservoirs, we are a net water supplier to agriculture. In 2016, our operations supplied more than 3.9 billion gallons of reclaimed water to agricultural water districts, a 49% increase from 2015. This water supply to agriculture set a company record and again exceeded the volume of fresh water we purchased for our operations statewide. We continue to evaluate measures to further decrease our fresh water use and to expand the beneficial use of our produced water over the coming years. |
• | Continue to pursue joint venture development opportunities. We continuously evaluate opportunities to accelerate future development through joint ventures. We would pursue these projects to the extent we believe they would increase stockholder value. We are actively discussing both development and exploration project opportunities. In addition to pursuing growth through joint ventures, we expect substantially all our cash flow to be directed to our capital program while considering other deleveraging opportunities as appropriate. |
• | Continue to identify high-growth unconventional drilling opportunities. Over the longer term and in a higher oil-price environment, we believe we can generate significant production growth from unconventional reservoirs such as tight sandstones and shales. In such an environment, we would expect to generate sufficient cash flow from our conventional projects to fund numerous unconventional opportunities in our portfolio. We hold mineral interests in approximately 1.3 million net acres with unconventional potential and have identified approximately 3,750 gross (3,400 net) drilling locations on this acreage. A meaningful portion of our production already comes from unconventional assets. While we have not yet developed sufficient information to reliably predict success rates across our entire portfolio, our continued technical reviews of these unconventional projects are allowing us to better understand performance of these reservoirs in addition to improving our overall cycle time from project identification to development. As a result of our increased understanding of these reservoirs, we believe we will be able to direct future available capital more precisely to higher value projects, allowing us to strategically increase our investment levels in unconventional drilling over time. |
• | Apply proven modern technologies to enhance production growth and cost efficiency. Over the last several decades, the oil and gas industry has focused significantly less effort on utilizing modern development and exploration processes and technologies in California relative to other prolific U.S. basins. We believe this is largely due to other oil companies’ limited capital investments in California, concentration on shallow zone thermal projects, or investments in other assets within their global portfolios. As an independent company focused on California, we intend to use proven modern technologies in drilling and completing wells, as well as production methods, which we expect will substantially increase both our production and cost efficiency over time. We have developed an extensive 3D seismic library covering almost 4,800 square miles in all four of our basins, representing over 90% of the 3D seismic data available for California, and have tested and successfully implemented various exploration, drilling, completion, IOR and EOR technologies in the state. |
• | Continued focus on our successful exploration program. As prices improve and sufficient additional capital becomes available, we intend to significantly increase our investment in exploration, focusing on both unconventional and conventional opportunities, primarily in areas that we believe can be quickly developed, such as those adjacent to our existing properties. In addition, we plan to explore and test new unconventional resource areas, which, if successful, could result in significant longer-term production growth. In addition, we are also actively pursuing joint venture partnership opportunities, which may give us the opportunity to implement some of our exploration projects even in the current environment. |
9
Key Characteristics of our Operations
The following are among the key characteristics of our operations:
• | Operational control of our diverse asset base provides flexibility over various commodity price ranges and preserves future value and growth potential in a higher price environment. Our near 100% operational control of 135 fields in California provides us flexibility to adapt our investments to various market environments through our ability to select drilling locations, the timing of our development and the drilling and completion techniques we use. Our large and diverse mineral acreage position, of which approximately 60% is held in fee, 15% is held by production and 25% are term leases, allows us to choose among multiple recovery mechanisms, including primary conventional, steamflood, waterflood and unconventional, and to develop various products, including oil, natural gas and natural gas liquids (NGLs). A majority of our interests are in producing properties located in reservoirs characterized by what we believe have long-lived production profiles with repeatable development opportunities. Approximately 95% of our identified drilling inventory is associated with oil-rich projects, primarily located in the San Joaquin, Los Angeles and Ventura basins, and the remaining inventory is associated with natural gas properties in the Sacramento, San Joaquin and Ventura basins. The variety of recovery mechanisms and product types available to us, together with our operating control, allows us to allocate capital in a manner designed to optimize cash flow over a wide range of commodity prices. The low base decline of our conventional assets allows us to limit production declines with minimal investment. We believe our low base decline positions us well to achieve oil production growth in the current price environment while living within our means. |
• | Relatively favorable margins driven by California's deficit energy market. We currently sell all of our crude oil into the California refining markets, which we believe have offered favorable pricing for comparable grades relative to other U.S. regions. California is heavily reliant on imported sources of energy, with approximately 65% of oil and 90% of natural gas consumed in recent years imported from outside the state. A vast majority of the imported oil arrives via supertanker, mostly from foreign locations. As a result, California refiners have typically purchased crude oil at international waterborne-based prices. We believe that the limited crude transportation infrastructure from other parts of the country to California will continue contributing to higher realizations than most other United States oil markets for comparable grades. In addition, we own fee mineral interests on approximately 60% of our net acreage position. The returns on fee mineral acreage are enhanced because we do not pay royalties and other lease payments. To further improve our margins, we are opportunistically pursuing newly opened export markets for our crude oil production. |
• | Largest acreage position in a world-class oil and natural gas province. We believe we are the largest private oil and natural gas mineral acreage holder in California, with interests in approximately 2.3 million net acres. California is one of the most prolific oil and natural gas producing regions in the world and is the third largest oil producing state in the nation. It has four of the 12 largest fields in the lower 48 states based on proved reserves as of 2013, and our portfolio includes interests in each of these four fields. California is also the nation’s largest state economy, and the world's sixth largest, with significant energy demands that exceed local supply. Our large acreage position with a diverse development portfolio enables us to pursue the appropriate production strategy for the relevant commodity price environment without the need to acquire new acreage. For example, in a high natural gas price environment we can rapidly increase our investments in the Sacramento basin to generate significant production growth. Our large acreage position also allows us to quickly deploy the knowledge we gain in our existing operations, together with our seismic data, in other areas within our portfolio. |
10
• | Opportunity rich drilling and workover portfolio. Our drilling inventory at December 31, 2016 consisted of approximately 30,900 gross identified well locations, including approximately 27,150 gross (19,450 net) conventional drilling locations and approximately 3,750 gross (3,400 net) unconventional drilling locations. Our drilling inventory count increased by about 30% from the prior year as a result of our technical teams' continued efforts. We also have approximately 1,000 workover projects that can deliver high returns. At about $55 Brent, we estimate that we have been able to increase investment opportunities that meet our 1.3 VCI hurdle sufficiently to double the drilling and workover capital we could deploy. In the process, our inventory of lower-risk conventional development opportunities with attractive returns has increased, even more than our unconventional opportunities. In a more favorable, sustained price environment, we believe we can also achieve further long-term production growth through the development of unconventional reservoirs. In addition, our rich conventional and unconventional portfolio can provide attractive joint venture partnership opportunities. |
• | Proven operational management and technical teams with extensive experience operating in California. The members of our operational management and technical teams have an average of over 25 years’ experience in the oil and natural gas industry, with an average of over 15 years focused on our California oil and gas operations through multiple pricing cycles. Our operational management team and technical staff have a proven track record of applying modern technologies and operating methods to develop our assets and improve their operating efficiencies. For example, our teams have successfully reduced field operating costs on a per unit basis by approximately 22% since the Spin-off. |
Portfolio Management and 2017 Capital Budget
We develop our capital investment programs by prioritizing life of project returns to grow our net asset value over the long term, while balancing the short- and long-term growth potential of each of our assets. We use the VCI metric for project selection and capital allocation across our portfolio of opportunities.
In 2016, we invested approximately $13 million for drilling wells, $18 million for capital workovers, $23 million for facilities and compression expansion (including $19 million for a major turnaround of our power plant), $15 million for maintenance and occupational health, safety and environmental projects and the rest for other items. Virtually all of our 2016 development capital was directed towards oil-weighted production consistent with 2015 and 2014.
In mid-2016, global oil prices began to recover from the apparent low point of this commodity cycle. The recovery further strengthened following the production cuts announced at the November 2016 meeting of the OPEC. In light of these developments, we began to increase our activity level in the second half of 2016 and have continued to do so in early 2017. While we began 2017 with two rigs running, by the end of the first quarter 2017, we anticipate having four rigs running (three in the San Joaquin and one in the Los Angeles basin). We also plan to add an additional rig in the Ventura basin by the third quarter of 2017. Our 2017 development program will focus primarily on our core fields: Elk Hills; Wilmington; Kern Front; Buena Vista; and the delineation of Kettleman North Dome. Based on the current market conditions, we increased our 2017 planned capital program to $300 million from the $75 million invested in 2016. We have developed a dynamic plan which can be scaled up or down depending on the price environment. For 2017, we have action plans that can reduce the capital program to below $100 million or increase it as high as $500 million based on conditions during the year while remaining within our operating cash flows.
Based on our current 2017 plan, we expect to use approximately half of our capital to drill over 100 wells. Our drilling program utilizes all four of our recovery mechanisms: primary conventional, steamflood, waterflood and unconventional. The depth of our primary conventional wells is expected to range from 2,000-14,000 feet.
With the significant reduction in our drilling costs since the Spin-off, many of our deep conventional and unconventional programs have become more competitive. We intend to drill approximately 20 unconventional wells in the Elk Hills, Buena Vista and Kettleman areas. We expect to focus our conventional program of approximately 90 wells primarily on Mount Poso, Elk Hills, Pleito Ranch, Kern Front and Wilmington, which will largely consist of steam and waterfloods. We recently entered into a joint venture that will invest up to $250 million in the development of certain of our properties. The joint venture will allow us to change the mix and nature of our drilling program as the year progresses.
11
We also plan to use over 15% of our capital for capital workovers on existing well bores. Capital workovers are some of the highest VCI projects in our portfolio and generally include well deepenings, recompletions, changes of lift methods and other activities designed to add incremental productive intervals and reserves.
Further, over 15% of our 2017 program is intended for development facilities at our newer projects, including pipeline and gathering line interconnections, gas compression and water management systems, and about 10% each is intended to be used for exploration and to maintain the mechanical integrity, safety and environmental performance of our operations.
As a result of higher activity levels, our production decline rate began to flatten in the second half of 2016 and continues to improve in 2017. We believe that the actions we have taken since the Spin-off to streamline our business and reduce costs, together with recent price increases, have brought us to an inflection point where we can increase our activity level.
In addition, we will continue to build our inventory of available projects, which will position us to take advantage of future higher prices.
Reserves and Production Information
The table below summarizes our proved reserves and average net daily production as of and for the year ended December 31, 2016 in each of California's four major oil and gas basins:
Proved Reserves as of December 31, 2016 | Average Net Daily Production for the Year Ended December 31, 2016 | ||||||||||||||||||||||||
Oil (MMBbl) | NGLs (MMBbl) | Natural Gas (Bcf) | Total (MMBoe) | Oil (%) | Proved Developed (%) | (MBoe/d) | Oil (%) | R/P Ratio (Years)(1) | |||||||||||||||||
San Joaquin Basin | 287 | 53 | 536 | 429 | 67 | % | 67 | % | 97 | 59 | % | 12.1 | |||||||||||||
Los Angeles Basin | 98 | — | 7 | 99 | 99 | % | 84 | % | 30 | 97 | % | 9.0 | |||||||||||||
Ventura Basin | 24 | 2 | 15 | 29 | 83 | % | 86 | % | 7 | 71 | % | 11.3 | |||||||||||||
Sacramento Basin | — | — | 68 | 11 | — | 100 | % | 6 | — | % | 5.0 | ||||||||||||||
Total operations | 409 | 55 | 626 | 568 | 72 | % | 71 | % | 140 | 65 | % | 11.1 | |||||||||||||
Note: MMBbl refers to millions of barrels; Bcf refers to billion cubic feet of natural gas; MMBoe refers to million barrels of oil equivalent; and MBoe/d refers to thousands of barrels of oil equivalent per day. Natural gas volumes have been converted to Boe based on the equivalence of energy content between six Mcf of natural gas and one Bbl of oil.
(1) | Calculated as total proved reserves as of December 31, 2016 divided by annualized Average Net Daily Production for the year ended December 31, 2016. |
Marketing Arrangements
We market our crude oil, natural gas, NGLs and electricity in accordance with standard energy industry practices.
Crude Oil. Substantially all of our crude oil production is connected to California markets via our crude oil gathering pipelines, which are used almost entirely for our production. We generally do not transport, refine or process the crude oil we produce and do not have any significant long-term crude oil transportation arrangements in place. California is heavily reliant on imported sources of energy, with approximately 65% of the oil consumed in recent years imported from outside the state. A vast majority of the imported oil arrives via supertanker, mostly from foreign locations. We currently sell all of our crude oil into the California refining markets, which we believe have offered relatively favorable pricing compared to other U.S. regions for similar grades. A vast majority of the imported oil arrives via supertanker, with a minor amount arriving by rail. As a result, California refiners have typically purchased crude oil at international waterborne-based prices. Currently, none of our index-based crude oil sales contracts have terms extending past one year and a substantial majority have 60- or 90-day terms. Beginning in late 2015, the U.S. federal government allowed the export of crude oil.
Prior to the Spin-off, while we were a subsidiary of Occidental, we did not have a hedging program. Given the volatile oil price environment, as well as our leverage, we began a hedging program immediately after the Spin-off to protect our cash flows, margins and capital investment program and improve our ability to comply with the covenants under our credit facilities in case of further price deterioration. We will continue to be strategic and opportunistic in implementing our hedging program.
12
Unless otherwise indicated, we use the term "hedge" to describe derivative instruments that are designed to achieve our hedging program goals, even though they are not necessarily accounted for as cash flow or fair value hedges. As part of our hedging program, we currently have the following Brent-based crude oil contracts as of December 31, 2016:
Q1 2017 | Q2 2017 | Q3 2017 | Q4 2017 | Q1 2018 | Q2-Q4 2018 | ||||||||||||||||||
Crude Oil | |||||||||||||||||||||||
Calls: | |||||||||||||||||||||||
Barrels per day | 12,100 | 5,000 | 10,000 | 15,000 | 15,600 | 15,000 | |||||||||||||||||
Weighted-average price per barrel | $ | 56.37 | $ | 55.05 | $ | 56.15 | $ | 56.12 | $ | 58.77 | $ | 58.83 | |||||||||||
Puts: | |||||||||||||||||||||||
Barrels per day | 22,100 | 20,000 | 17,000 | 10,000 | — | — | |||||||||||||||||
Weighted-average price per barrel | $ | 49.10 | $ | 50.25 | $ | 50.88 | $ | 48.00 | $ | — | $ | — | |||||||||||
Swaps: | |||||||||||||||||||||||
Barrels per day | 20,000 | 20,000 | 20,000 | 20,000 | — | — | |||||||||||||||||
Weighted-average price per barrel | $ | 53.98 | $ | 53.98 | $ | 53.98 | $ | 53.98 | $ | — | $ | — | |||||||||||
The second through fourth quarter 2017 crude oil swaps grant our counterparty a quarterly option to increase volumes by up to 10,000 barrels per day for that quarter at a weighted-average Brent price of $55.46. Our counterparty also has an option to increase volumes by up to 5,000 barrels per day for the second half of the year at a weighted-average Brent price of $61.43.
Natural Gas. California imports approximately 90% of the natural gas consumed in the state. We have firm transportation capacity contracts to access markets where necessary. These contracts are required to facilitate deliveries. We sell virtually all of our natural gas production under individually negotiated contracts using market-based pricing on a monthly or shorter basis.
NGLs. We process substantially all of our NGLs through our processing plants, which facilitates access to third-party delivery points near the Elk Hills field. We currently have pipeline capacity contracts to transport 20,000 barrels per day of NGLs to market. We sell virtually all of our NGLs using index-based pricing. Our NGLs are generally sold pursuant to one-year contracts that are renewed annually.
Electricity. We provide part of the electrical output of our Elk Hills power plant to reduce Elk Hills field operating costs and increase reliability. We sell the excess to the grid and to others under contract.
Our Principal Customers
We sell our crude oil, natural gas and NGLs production to marketers, California refineries and other purchasers that have access to transportation and storage facilities. Our marketing of crude oil, natural gas and NGLs can be affected by factors that are beyond our control, and which cannot be accurately predicted.
For the year ended December 31, 2016, Phillips 66 Company, Tesoro Refining & Marketing Company LLC, Valero Marketing & Supply Company and Shell Trading (US) Company each accounted for at least 10%, and, collectively, 67% of our revenue. For the year ended December 31, 2015, Phillips 66 Company, Tesoro Refining & Marketing Company LLC and Valero Marketing & Supply Company each accounted for more than 10%, and collectively, 64% of our revenue. For the year ended December 31, 2014, ConocoPhillips/Phillips 66 Company and Tesoro Refining & Marketing Company LLC each accounted for at least 10%, and, collectively, 45% of our revenue.
13
Title to Properties
As is customary in the oil and natural gas industry, we initially conduct a high-level review of the title to our properties at the time of acquisition. Individual properties may be subject to ordinary course burdens that we believe do not materially interfere with the use or affect the value of our properties. Such burdens on properties may include customary royalty interests, liens incident to operating agreements and for current taxes, obligations or duties under applicable laws, development obligations, or net profits interests, among others. Prior to the commencement of drilling operations on those properties, we conduct a more thorough title examination and perform curative work with respect to significant defects. We generally will not commence drilling operations on a property until we have cured known title defects that are material to the project. In addition, our properties have been pledged as collateral to secure a portion of our debt.
Competition
We have many competitors (including international competitors exporting to California), some of which are larger and better funded, may be willing to accept greater risks or have special competencies. We compete for services to profitably develop our assets, to find or acquire additional reserves, to sell our production and to find and retain qualified personnel. Historically higher commodity prices intensify competition for drilling and workover rigs, pipe, other oil field equipment and personnel. Over the longer term, competition for reserves can increase costs for, or delay, reserves replacement. We compete on the basis of costs, our inventory of drilling opportunities, access to capital, efficiency of capital allocation and other factors.
Regulation of the Oil and Natural Gas Industry
Our operations are subject to complex and stringent federal, state, local and other laws and regulations relating to the exploration and development of our properties, the production, transportation, marketing and sale of our products, and the services we provide.
Regulation of Exploration and Production
Federal, state and local laws and regulations govern most aspects of exploration and production in California, including:
• | oil and natural gas production including well spacing or density on private and state lands; |
• | methods of constructing, drilling, completing, stimulating, operating, maintaining and abandoning wells; |
• | design, construction, operation, maintenance and decommissioning of facilities, such as natural gas processing plants, power plants, compressors and liquid and natural gas pipelines or gathering lines; |
• | improved or enhanced recovery techniques such as fluid injection for pressure management, waterflooding or steamflooding; |
• | sourcing and disposal of water used in the drilling, completion, stimulation, maintenance and enhanced recovery processes; |
• | imposition of taxes and fees with respect to our properties and operations; |
• | the conservation of oil and natural gas, including provisions for the unitization or pooling of oil and natural gas properties; |
• | posting of bonds or other financial assurance to drill, operate and abandon or decommission wells and facilities; and |
• | occupational health, safety and environmental matters and the transportation, marketing and sale of our products as described below. |
The Division of Oil, Gas, and Geothermal Resources (DOGGR) of the Department of Conservation is the state’s primary regulator of the oil and natural gas industry on private and state lands, with additional oversight from the State Lands Commission’s administration of state surface and mineral interests. The Bureau of Land Management (BLM) of the U.S. Department of the Interior exercises similar jurisdiction on federal lands in California. In addition, specific aspects of our operations, such as occupational health, safety, air and water quality, labor, marketing and taxation, are regulated by other federal, state or local agencies. Collectively, the effect of these regulations is to potentially limit the number and location of our wells and the amount of oil and natural gas that we can produce from our wells compared to what we otherwise would be able to do.
14
In 2013 California adopted Senate Bill 4 (SB 4), which increased regulation of certain well stimulation techniques, including, as defined, acid matrix stimulation and hydraulic fracturing, which involves the injection of fluid under pressure into underground rock formations to create or enlarge fractures to allow oil and gas to flow more freely. Among other things, SB 4 requires operators to obtain specific well stimulation permits, make disclosures and implement groundwater monitoring and water management plans. The U.S. Environmental Protection Agency (EPA) and the BLM also regulate certain well stimulation activities, though their regulations are currently being challenged in court. The implementation of federal and state well stimulation regulations has delayed, and increased the cost of, certain operations.
In addition, certain local governments have proposed or adopted ordinances that would regulate certain drilling activities in general and well stimulation or completion activities in particular, or ban such activities outright. The most onerous of these local measures was adopted by Monterey County in November 2016, where we own mineral interests but do not have production. The measure, which is currently stayed during a legal challenge, would prohibit drilling of new oil and gas wells, hydraulic fracturing and other well stimulation and phase out water injection.
Regulation of Health, Safety and Environmental Matters
Numerous federal, state, local, and other laws and regulations that govern health and safety, the release or discharge of materials, land use or environmental protection may restrict the use of our properties and operations, increase our costs or lower demand for or restrict the use of our products and services. Applicable federal health, safety and environmental laws include, but are not limited to, the Occupational Safety and Health Act, Clean Air Act, Clean Water Act, Safe Drinking Water Act, Oil Pollution Act, Natural Gas Pipeline Safety Act, Pipeline Safety Improvement Act, Pipeline Safety, Regulatory Certainty, and Job Creation Act, Endangered Species Act, Migratory Bird Treaty Act, Comprehensive Environmental Response, Compensation, and Liability Act, Resource Conservation and Recovery Act and National Environmental Policy Act. California imposes additional laws that are analogous to, and often more stringent than, such federal laws. The foregoing laws and regulations:
• | establish air, soil and water quality standards for a given region, such as the San Joaquin Valley, and attainment plans to meet those regional standards, which may include significant restrictions on development, economic activity and transportation in such region; |
• | require various permits and approvals before drilling, workover, production, underground fluid injection or waste disposal commences, or before facilities are constructed or put into operation; |
• | require the installation of sophisticated safety and pollution control equipment, such as leak detection, monitoring and shutdown systems, to prevent or reduce releases or discharges of regulated materials to air, land, surface water or ground water; |
• | restrict the use, types or sources of water, energy, land surface, habitat or other natural resources, require conservation and reclamation measures, and impose energy efficiency or renewable energy standards; |
• | restrict the types, quantities and concentrations of regulated materials, including oil, natural gas, produced water or wastes, that can be released or discharged into the environment, or any other uses of those materials resulting from drilling, production, processing, power generation or transportation activities; |
• | limit or prohibit operations on lands lying within coastal, wilderness, wetlands, groundwater recharge, endangered species habitat and other protected areas, and require the dedication of surface acreage for habitat conservation; |
• | establish standards for the closure, abandonment, cleanup or restoration of former operations, such as plugging and abandonment of wells and decommissioning of facilities; |
• | impose substantial liabilities for unauthorized releases or discharges of regulated materials into the environment with respect to our current or former properties and operations and other locations where such materials generated by us or our predecessors were released or discharged; |
• | require comprehensive environmental analyses, recordkeeping and reports with respect to operations affecting federal, state and private lands or leases; |
• | impose taxes or fees with respect to the foregoing matters; |
• | may expose us to litigation with government authorities, counterparties, special interest groups or others; and |
• | may restrict our rate of oil, NGLs, natural gas and electricity production. |
15
Due to the severe drought in California over the last several years, water districts and the state government are implementing regulations and policies that may restrict groundwater extraction and water usage and increase the cost of water. Water management is an essential component of our operations. We treat and re–use water that is co-produced with oil and natural gas for a substantial portion of our needs in activities such as pressure management, waterflooding, steamflooding and well drilling, completion and stimulation, and we provide reclaimed produced water to certain agricultural water districts. We also use supplied water from various local and regional sources, particularly for power plants and to support operations like steam injection in certain fields.
In 2014, at the request of the EPA, DOGGR commenced a detailed review of the multi-decade practice of permitting underground injection wells and associated aquifer exemptions under the Safe Drinking Water Act (SDWA). In 2015, the state set deadlines to obtain the EPA’s confirmation of aquifer exemptions under the SDWA in certain formations in certain fields, and those deadlines are currently being challenged in court. Since the state and the EPA did not complete their review before the state's deadlines, the state has announced that it will not rescind permits or enforce the deadlines with respect to many of the formations pending completion of the review, but plans to apply the deadlines to others. During the review, the state has restricted injection in certain formations or wells in several fields, including some operated by us. To date, such restrictions have not affected our oil and natural gas production in any material way. Separately, the state began a review in 2015 of permitted surface discharge of produced water and the use of reclaimed water for agricultural irrigation. Government authorities may ultimately restrict injection of produced water or other fluids in additional formations or certain wells, restrict the surface discharge or use of produced water or take other administrative actions. The foregoing reviews could also give rise to litigation with government authorities and third parties.
Federal, state and local agencies may assert overlapping authority to regulate in these areas. In addition, certain of these laws and regulations may apply retroactively and may impose strict or joint and several liability on us for events or conditions over which we and our predecessors had no control, without regard to fault, legality of the original activities, or ownership or control by third parties.
Regulation of Climate Change and Greenhouse Gas (GHG) Emissions
A number of international, federal, state and regional efforts seek to prevent or mitigate the effects of climate change or to track or reduce GHG emissions associated with energy use and industrial activity, including operations of the oil and natural gas production sector and those who use our products as a source of energy. The EPA has adopted federal regulations to:
• | require reporting of annual GHG emissions from power plants and gas processing plants; gathering and boosting compression and pipeline facilities; and certain completions and workovers; |
• | incorporate measures to reduce GHG emissions in permits for certain facilities; and |
• | restrict GHG emissions from certain mobile sources. |
California has adopted the most stringent such laws and regulations. These state laws and regulations:
• | established a “cap-and-trade” program for GHG emissions that sets a statewide maximum limit on total GHG emissions, and this cap declines annually to reach 1990 levels by 2020, the year that the cap-and-trade program currently expires; |
• | require allowances or qualifying offsets for GHGs emitted from California operations and for the volume of propane and liquid transportation fuels sold for use in California, for which allowances we incurred costs of approximately $33 million in 2016; |
• | require refiners to reduce the carbon content of transportation fuels they market in California by 10% by 2020; |
• | impose a more stringent state goal of reducing GHG emissions to 40% below 1990 levels by 2030 by reducing industrial source emissions, even if the cap-and-trade program is not extended; |
• | impose state goals to derive 50% of California’s electricity from renewable sources and to double the energy efficiency of buildings in the state by 2030; and |
• | impose state goals of reducing emissions of methane and fluorocarbon gases by 40% and black carbon by 50% below 2013 levels by 2030. |
16
The EPA and the California Air Resources Board (CARB) have also expanded direct regulation of methane emissions. In 2016, the EPA adopted regulations to require additional emission controls for methane, volatile organic compounds and certain other substances for new or modified oil and natural gas facilities and announced its intent to propose controls on methane emissions from existing sources. CARB has also proposed regulations to require monitoring, leak detection, repair and reporting of methane emissions from oil and gas production operations beginning in 2018 and additional controls such as vapor recovery to capture methane emissions in subsequent years.
Regulation of Transportation, Marketing and Sale of Our Products
Our sales prices of oil, NGLs and natural gas in the U.S. are set by the market and are not presently regulated. In late 2015, the U.S. federal government lifted restrictions on the export of domestically produced oil that allows for the sale of U.S. oil production, including ours, in additional markets, which may affect the prices we realize.
Federal and state laws regulate transportation rates for, and marketing and sale of, petroleum products and electricity with respect to certain of our operations and those of certain of our customers, suppliers and counterparties. Such regulations also govern:
• | interstate and intrastate pipeline transportation rates for oil, natural gas and NGLs in regulated pipeline systems; |
• | prevention of market manipulation in the oil, natural gas, NGL and power markets; |
• | market transparency rules with respect to natural gas and power markets; |
• | the physical and futures energy commodities market, including financial derivative and hedging activity; and |
• | prevention of discrimination in natural gas gathering operations in favor of producers or sources of supply. |
The federal and state agencies overseeing these regulations have substantial rate-setting and enforcement authority, and violation of the foregoing regulations could expose us to litigation with other government authorities, counterparties, special interest groups and others.
Employees
Our future success will depend partially on our ability to attract, retain and motivate qualified employees. We also utilize the services of independent contractors to perform drilling, well work, operations, construction and other services, including construction contractors whose workforce is often represented by labor unions. Approximately 75 of our employees are represented by labor unions. We have not experienced any strikes or work stoppages by our employees in the past 36 years or longer.
At the time of our Spin-off, we had over 2,000 employees. In the third quarter of 2015 and early 2016, we implemented a voluntary retirement program and other employee actions to align our workforce with our view of the commodity price environment. We ended 2016 with approximately 1,450 employees, representing a nearly 30% reduction mainly through attrition and the 2015 and 2016 employee actions.
Effective January 1, 2015, we adopted the California Resources Corporation 2014 Employee Stock Purchase Plan (ESPP). The ESPP provides our employees the ability to purchase shares of our common stock at a price equal to 85% of the closing price of a share of our common stock as of the first or last day of each fiscal quarter, whichever amount is less. At January 1, 2017, over one quarter of our employees had elected to participate in the plan.
17
Available Information
We make the following information available free of charge on our website at www.crc.com:
• | Forms 10-K, 10-Q, 8-K and amendments to these forms as soon as reasonably practicable after they are electronically filed with, or furnished to, the Securities and Exchange Commission (SEC); |
• | Other SEC filings including Forms 3, 4 and 5; and |
• | Corporate governance information, including our corporate governance guidelines, board-committee charters and code of business conduct (see Part III, Item 10, of this report for further information). |
Information contained on our website is not part of this report.
ITEM 1A | RISK FACTORS |
RISK FACTORS
We are subject to certain risks and hazards due to the nature of our business activities. The risks discussed below, any of which could materially and adversely affect our business, financial condition, cash flows and results of operations, are not the only risks we face. We may experience additional risks and uncertainties not currently known to us or, as a result of developments occurring in the future, conditions that we currently deem to be immaterial may ultimately materially and adversely affect our business, financial condition, cash flows and results of operations.
Risks Related to Our Business and Industry
Commodity pricing can fluctuate widely and strongly affects our results of operations, financial condition, cash flow and ability to grow.
Our financial results, financial condition, cash flow and ability to grow correlate closely to the prices we obtain for our products. Compared to the 2014 average, global energy commodity prices have declined significantly. For example, Brent crude prices declined from over $110 per barrel in June 2014 to below $30 per barrel in January 2016. While prices remain lower than the 2014 and 2015 averages, they have improved modestly since early 2016. However, such improvements may not continue or may be reversed. Continued low prices for our products or further price decreases could have several adverse effects including:
• | reduced cash flow and decreased funds available for capital investments, interest payments and operational expenses; |
• | reduced proved oil and gas reserves over time and related cash flows; |
• | impairments of our oil and gas properties such as we experienced in 2014 and 2015; |
• | reduced borrowing base capacity under our first-out revolving credit facility as proved oil and gas reserves values fall; |
• | the potential for a reduction of our liquidity, mandatory loan repayments and default and foreclosure by our banks and bondholders against our secured assets; |
• | inability to attract counterparties to our transactions, including hedging transactions; and |
• | inability to access funds through the capital markets and the price we could obtain for, or our ability to conduct, asset sales or other monetization transactions. |
Commodity pricing can fluctuate widely and is affected by a variety of factors, including changes in consumption patterns; inventory levels; global and local economic conditions; the actions of OPEC and other significant producers and governments; actual or threatened production, refining and processing disruptions; worldwide drilling and exploration activities; the effects of conservation; weather, geophysical and technical limitations; currency exchange rates; technological advances and regional market conditions; transportation capacity, bottlenecks and costs in producing areas; alternative energy sources; other matters affecting the supply and demand dynamics for our products; and the effect of changes in these variables on market perceptions. These and other factors make it impossible to predict realized prices reliably. While our hedging activities provide some protection for a significant portion of our 2017 production, they may not adequately protect us from commodity price reductions and we may be unable to enter into acceptable additional hedges.
18
Our lenders require us to comply with covenants and can limit our borrowing capabilities, which may materially limit our ability to use or access capital and our business activities.
Our ability to borrow funds under our reserves-based first-lien first-out credit facilities is limited by the size of our lenders' commitments, our ability to comply with their covenants, our borrowing base and a minimum monthly liquidity requirement. At January 31, 2017, the lenders' commitments under our first-out facilities were $2.05 billion, and we had approximately $486 million in availability, subject to the minimum liquidity requirement. We may need to depend on our revolving credit facility for a portion of our future capital or operating needs.
The financial covenants that we must satisfy under our first-out facilities include quarterly first-out leverage and interest expense coverage ratios, as well as a semi-annual first-lien asset coverage ratio. The first-out facilities also restrict our ability to monetize assets and issue or purchase debt as a means of complying with our financial covenants. Our borrowing base under our first-out facilities, which currently exceeds lender commitments, is redetermined each May 1 and November 1. The borrowing base is determined with reference to a number of factors, including commodity prices and reserves. Restrictions under our first-out credit facilities are further described in "Management's Discussion and Analysis of Financial Condition and Results of Operations – Liquidity and Capital Resources – Credit Facilities."
If we were to breach any of the covenants under our first-out facilities, our lenders would be permitted to accelerate the principal amount due under the first-out facilities and foreclose against the assets securing them. If payment were accelerated, or we failed to make certain payments, under our first-out facilities, it would result in a default under our second-out credit facility and outstanding notes and permit acceleration and foreclosure against the assets securing the second-out credit facility and the secured notes.
Low commodity prices, coupled with substantial interest payments, could constrain our liquidity. A significant reduction in our liquidity may force us to take actions which could have significant adverse effects.
The primary source of liquidity and resources to fund our capital program and other obligations is cash flow from operations and borrowings under our revolving credit facility. As noted above, our borrowing capacity is limited.
Further price declines would reduce our cash flows from operations and may limit our access to borrowing capacity or cause default under our credit facilities or notes. Under these conditions, if we were unable to achieve improved liquidity through additional financing, asset monetizations, restructuring of our debt obligations, equity issuances or otherwise, cash flow from operations and expected available credit capacity could be insufficient to meet our commitments. Successfully completing these actions could have significant adverse effects such as higher operating and financing costs, loss of certain tax attributes or dilution of equity. For example, our repurchases of unsecured notes in 2016 resulted in the elimination of federal net operating losses. In 2016, we incurred debt under a second-out credit facility that, together with our 2015 exchange, increased our annual interest expense.
We have significant indebtedness and may incur more debt. Higher levels of indebtedness could make us more vulnerable to economic downturns and adverse developments in our business or otherwise limit our operational flexibility.
As of December 31, 2016, we had $5.3 billion of consolidated indebtedness comprised of senior unsecured notes, second lien secured notes and first-out and second-out secured credit facility borrowings.
Our credit facilities and the indentures governing our outstanding notes permit us to incur significant additional indebtedness as well as certain defined obligations unrestricted by debt incurrence or lien covenants, or that do not constitute indebtedness. To the extent we need to incur indebtedness above amounts permitted by our credit facilities, we may seek amendments or waivers.
Indebtedness outstanding under our first-out and second-out facilities bears interest at variable rates, therefore a rise in interest rates will generate greater interest expense to the extent we do not purchase interest rate hedges.
19
Our level of indebtedness may have several important consequences, including, without limitation:
• | jeopardizing our ability to execute our business plans; |
• | increasing our vulnerability to adverse changes in our business and in economic and industry conditions generally, and putting us at a disadvantage against competitors that have lower fixed obligations and more cash flow to devote to their businesses; |
• | limiting our ability to obtain additional financing for working capital, capital investments and general corporate and other purposes or increasing the cost of that capital; and |
• | limiting our flexibility to operate our business, compete for capital, react to competitive pressures, address adverse regulatory changes and engage in certain transactions that might otherwise be beneficial to us. |
The terms of the credit facilities and note indentures may limit, among other things:
• | incurrence of additional indebtedness; |
• | investments; |
• | amounts and types of joint ventures; |
• | restricted payments; |
• | creation of liens on our assets; |
• | sales of assets that constitute collateral; |
• | application of the full proceeds of asset sales other than to pay down debt; |
• | mergers or acquisitions; and |
• | release of collateral. |
These limitations are further described in "Management's Discussion and Analysis of Financial Condition and Results of Operations – Liquidity and Capital Resources – Credit Facilities; Senior Notes" and the documents governing our indebtedness that are filed with the Securities and Exchange Commission (SEC).
Our ability to meet our debt obligations and other financial needs will depend on our future performance or our ability to further reduce our debt, which will be affected by market, financial, business, economic, regulatory and other factors. If our cash flow is not sufficient to service our debt, we may be required to refinance debt, sell assets or sell additional equity on terms that may be unattractive, if it can be done at all. Further, our failure to comply with the financial and other restrictive covenants relating to our indebtedness could result in a default. Any of these factors could result in a material adverse effect on our business, financial condition, cash flows or results of operations and a default on our indebtedness could result in acceleration of all of our debt and foreclosure against assets constituting collateral for our secured credit facilities and secured notes.
Our business requires substantial capital investments, which may include acquisitions. We may be unable to fund these investments through operating cash flow or obtain any needed additional capital on satisfactory terms or at all, which could lead to a decline in our oil and gas reserves or production. Our capital investment program is also susceptible to risks that could materially affect its implementation.
The oil and gas industry is capital intensive. We make and expect to continue to make substantial capital investments for the development and exploration of oil and gas reserves. Our ability to deploy capital as planned depends on a number of variables, including: (i) commodity prices and market access; (ii) regulatory and third-party approvals; (iii) our ability to timely drill, complete and stimulate wells due to technical factors and contract terms; (iv) the availability of, and our ability to compete for, capital, equipment, services and personnel; (v) drilling and completion costs and results and (vi) our ability to compete for acquisitions or otherwise match the prices offered by our competitors. Capital availability may be reduced (i) by our lenders, (ii) due to joint venture partners’ perceptions of the quality of our assets or credit risk or (iii) as a result of capital market constraints or poor stock price performance. Because of these and other potential variables, we may be unable to deploy capital in the manner planned, which may constrain our development or acquisition activities.
Estimates of proved reserves and related future net cash flows are not precise. The actual quantities of our proved reserves and future net cash flows may prove to be lower than estimated.
Many uncertainties exist in estimating quantities of proved reserves and related future net cash flows. Our estimates are based on various assumptions, which may ultimately prove to be inaccurate.
20
The Brent oil price used for reserve calculations decreased from $55.57 per barrel for 2015 to $42.90 per barrel for 2016. As a result, we experienced negative price-related revisions to our proved reserves at December 31, 2016 of 60 MMBoe. Generally, lower prices adversely affect the quantity of our reserves as those reserves expected to be produced in later years, which tend to be costlier on a per unit basis, become uneconomic. In addition, a portion of our proved undeveloped reserves may no longer meet the economic producibility criteria under the applicable rules or may be removed due to a lower amount of capital available to develop these projects within the SEC-mandated five-year limit.
In addition, our reserves information represents estimates prepared by internal engineers. Although over 80% of our 2016 proved reserve estimates were audited by our independent petroleum engineers, Ryder Scott Company, L.P., we cannot guarantee that the estimates are accurate. Reserves estimation is a partially subjective process of estimating accumulations of oil and natural gas. Estimates of economically recoverable oil and natural gas reserves and of future net cash flows from those reserves depend upon a number of variables and assumptions, including:
• | historical production from the area compared with production from similar areas; |
• | the quality, quantity and interpretation of available relevant data; |
• | commodity prices; |
• | production and operating costs; |
• | ad valorem, excise and income taxes; |
• | development costs; |
• | the effects of government regulations; and |
• | future workover and asset retirement costs. |
Misunderstanding of these variables, inaccurate assumptions, changed circumstances or new information could require us to make significant negative reserves revisions.
We currently expect improved recovery, extensions and discoveries to be our main sources for reserves additions. However, factors such as the availability of capital, geology, government regulations and permits, the effectiveness of development plans and other factors could affect the source or quantity of future reserves additions. Any material inaccuracies in our reserves estimates could materially affect the net present value of our reserves, which could adversely affect our borrowing base and liquidity under our reserves-based first-out credit facilities, as well as our results of operations.
Risks related to our disposition and acquisition activities could adversely impact our financial condition and results of operations.
Our disposition activities, including joint ventures, carry risks that we may (i) not be able to realize reasonable prices or rates of return for assets we sell or contribute to joint ventures; (ii) be required to retain liabilities that are greater than desired or anticipated; (iii) lose synergies among elements of our business and (iv) the revenue lost or costs to replace the services from assets sold could reduce our borrowing base and cash flows. Our acquisition activities carry risks that we may: (i) not fully realize anticipated benefits due to less-than-expected reserves or production or changed circumstances; (ii) bear unexpected integration costs or experience other integration difficulties; (iii) experience share price declines based on the market’s evaluation of the activity; and (iv) assume liabilities that are greater than anticipated.
In connection with our acquisitions, we are often only able to perform limited due diligence. Successful acquisitions of oil and gas properties require an assessment of a number of factors, including estimates of recoverable reserves, the timing for recovering the reserves, exploration potential, future commodity prices, operating costs and potential environmental, regulatory and other liabilities. Such assessments are inexact and incomplete, and we may be unable to make these assessments with a high degree of accuracy.
21
Unless we replace crude oil and natural gas reserves, our future reserves and production will decline.
Unless we conduct successful development and exploration activities or acquire properties containing proved reserves, our proved reserves will decline as those reserves are produced. Reduced capital investment may result in a decline in our reserves. Our ability to make the necessary long-term capital investments or acquisitions needed to maintain or expand our reserves may be impaired to the extent cash flow from operations or external sources of capital are insufficient. We may not be successful in developing, exploring for or acquiring additional reserves. Over the long term, a continuing decline in our production and reserves would reduce our liquidity and ability to satisfy our debt obligations by reducing our cash flow from operations and the value of our assets.
Our business is highly regulated and governmental authorities can delay or deny permits and approvals or change legal requirements governing our operations, including hydraulic fracturing and other well stimulation, enhanced production techniques and fluid injection or disposal, that could increase costs, restrict operations and delay our implementation of, or cause us to change, our business strategy.
Our operations are subject to complex and stringent federal, state, local and other laws and regulations relating to the exploration and development of our properties, as well as the production, transportation, marketing and sale of our products. Federal, state and local agencies may assert overlapping authority to regulate in these areas. In addition, certain of these laws and regulations may apply retroactively and may impose strict or joint and several liability on us for events or conditions over which we and our predecessors had no control, without regard to fault, legality of the original activities, or ownership or control by third parties.
See “Item 1 – Business – Regulation of the Oil and Natural Gas Industry” for a description of laws and regulations that affect our business. To operate in compliance with these laws and regulations, we must obtain and maintain permits, approvals and certificates from federal, state and local government authorities for a variety of activities including siting, drilling, completion, stimulation, operation, maintenance, transportation, marketing, site remediation, decommissioning, abandonment, fluid injection and disposal and water recycling and reuse. Failure to comply may result in the assessment of administrative, civil and/or criminal fines and penalties and liability for noncompliance, costs of corrective action, cleanup or restoration, compensation for personal injury, property damage or other losses, and the imposition of injunctive or declaratory relief restricting or limiting our operations. Under certain environmental laws and regulations, we could be subject to strict or joint and several liability for the removal or remediation of contamination, including on properties over which we and our predecessors had no control, without regard to fault, legality of the original activities, or ownership or control by third parties.
Our customers, including refineries and utilities, and the businesses that transport our products to customers are also highly regulated. For example, federal and state pipeline safety agencies have adopted or proposed regulations to expand their jurisdiction to include more gas and liquid gathering lines and pipelines and to impose additional mechanical integrity requirements. The state has adopted additional regulations on the storage of natural gas that could affect the demand or availability of such storage, increase seasonal volatility, or otherwise affect the prices we receive from customers.
Costs of compliance may increase and operational delays or restrictions may occur as existing laws and regulations are revised or reinterpreted, or as new laws and regulations become applicable to our operations, each of which has occurred in the past.
Government authorities and other organizations continue to study health, safety and environmental aspects of oil and gas operations, including those related to air, soil and water quality, ground movement or seismicity and natural resources. Government authorities have also adopted or proposed new or more stringent requirements for permitting, well construction and public disclosure or environmental review of, or restrictions on, oil and gas operations. Such requirements or associated litigation could result in potentially significant added costs to comply, delay or curtail our exploration, development, fluid injection and disposal or production activities, and preclude us from drilling, completing or stimulating wells, which could have an adverse effect on our expected production, other operations and financial condition.
For recent examples relating to well stimulation, water management and fluid injection see “Item 1 – Business – Regulation of the Oil and Natural Gas Industry.”
22
Drilling for and producing oil and natural gas carry significant operational and financial risk and uncertainty. We may not drill our identified sites at the times we scheduled or at all, and sites we decide to drill may not yield crude oil or natural gas in economically producible quantities.
Our decisions to explore, develop, purchase or otherwise exploit prospects or properties will depend in part on the evaluation of geophysical, geologic, engineering, production and other technical data and processes; the analysis of which is often inconclusive or subject to varying interpretations. Our decisions and ultimate profitability are also affected by crude oil and natural gas prices, the availability of capital, regulatory approvals, available transportation capacity, political resistance and other factors. Our cost of drilling, completing, stimulating, equipping, operating, maintaining and abandoning wells is also often uncertain. Our production cost per barrel are higher than that of many of our peers due to the extraction methods we use, the large number of wells we operate and the effects of our PSC contracts. Overruns in budgeted investments are a common risk that can make a particular project uneconomic or less economic than forecast. We bear the risks of equipment failures, accidents, environmental hazards, adverse weather conditions, permitting or construction delays, title disputes, surface access disputes, disappointing drilling results or reservoir performance, including production response to improved recovery or enhanced recovery efforts, and other associated risks.
We have specifically identified locations for drilling over the next several years, which represent a significant part of our long-term growth strategy. Our actual drilling activities may materially differ from those presently identified. If future drilling results in these projects do not establish sufficient reserves to achieve an economic return, we may curtail drilling or development of these projects. We make assumptions about the consistency and accuracy of data when we identify these locations that may prove inaccurate. We cannot guarantee that these prospective drilling locations or any other drilling locations we have identified will ever be drilled or if we will be able to produce crude oil or natural gas from these drilling locations. In addition, some of our leases could expire if we do not establish production in the leased acreage. The combined net acreage covered by leases expiring in the next three years represented approximately 20% of our total net undeveloped acreage at December 31, 2016.
Part of our strategy involves exploratory drilling, including drilling in new or emerging plays. Our drilling results are uncertain, and the value of our undeveloped acreage may decline if drilling is unsuccessful.
The risk profile for our exploration and prospective drilling locations is higher than for other locations because we have less geologic and production data and drilling history, in particular for our prospective resource locations, which are in unproven geologic plays. We may not find commercial amounts of oil or natural gas, in which case the value of our undeveloped acreage may decline and could be impaired. We may increase the proportion of our drilling in new or emerging plays over time.
One of our important assets is our acreage in the Monterey shale play in the San Joaquin, Los Angeles and Ventura basins. The geology of the Monterey shale is highly complex and not uniform due to localized and varied faulting and changes in structure and rock characteristics. As a result, it differs from other shale plays that can be developed in part on the basis of their uniformity. Instead, individual Monterey shale drilling sites may need to be more fully understood and may require a more precise development approach, which could affect our ability, the timing or the cost to develop this asset.
Our commodity-price risk-management activities may prevent us from fully benefiting from price increases and may expose us to other risks.
Our current commodity-price risk-management activities may prevent us from realizing the full benefits of price increases above the levels determined under the derivative instruments we use to manage price risk. In addition, our commodity-price risk-management activities may expose us to the risk of financial loss in certain circumstances, including instances in which the following occur:
• | a change in price basis differentials; |
• | the counterparties to our hedging or other price-risk management contracts fail to perform under those arrangements; and |
• | an event materially impacts oil and natural gas prices in the opposite direction of our derivative positions. |
23
Tax law changes may adversely affect our operations.
In California, there have been proposals for new taxes on oil and gas production. Although the proposals have not become law, campaigns by various interest groups could lead to future additional oil and gas severance or other taxes. The imposition of such taxes could significantly reduce our profit margins and cash flow and could ultimately result in lower oil and natural gas production, which may reduce our capital investments and growth plans.
Our producing properties are located in California, making us vulnerable to risks associated with having operations concentrated in this geographic area.
Our operations are concentrated in California. Because of this geographic concentration, the success and profitability of our operations may be disproportionately exposed to the effect of regional conditions. These include local price fluctuations, changes in state or regional laws and regulations affecting our operations, and other regional supply and demand factors, including gathering, pipeline and transportation capacity constraints, limited potential customers, infrastructure capacity and availability of rigs, equipment, oil field services, supplies and labor. The concentration of our operations in California and limited local storage options also increase our exposure to events such as natural disasters, mechanical failures, industrial accidents or labor difficulties. Any one of these events has the potential to cause producing wells to be shut-in, delay operations and growth plans, decrease cash flows, increase operating and capital costs, prevent development of lease inventory before expiration and limit access to markets for our products.
The enactment of derivatives legislation, and the promulgation of regulations pursuant thereto, could have an adverse effect on our ability to use derivative instruments to reduce the effect of risks associated with our business.
The Dodd-Frank Wall Street Reform and Consumer Protection Act (the Dodd-Frank Act), enacted in 2010, establishes federal oversight and regulation of the over-the-counter (OTC) derivatives market and entities, like us, that participate in that market. Among other things, the Dodd-Frank Act required the CFTC to promulgate a range of rules and regulations applicable to OTC derivatives transactions, and these rules may affect both the size of positions that we may enter and the ability or willingness of counterparties to trade opposite us, potentially increasing costs for transactions. Moreover, such changes could materially reduce our hedging opportunities which could adversely affect our revenues and cash flow during periods of low commodity prices. While many Dodd-Frank Act regulations are already in effect, the rulemaking and implementation process is ongoing, and the ultimate effect of the adopted rules and regulations and any future rules and regulations on our business remains uncertain.
In addition, the European Union and other non-U.S. jurisdictions are implementing regulations with respect to the derivatives market. To the extent we transact with counterparties in foreign jurisdictions or counterparties with other businesses that subject them to regulation in foreign jurisdictions, we may become subject to or otherwise impacted by such regulations. At this time, the impact of such regulations is not clear.
Concerns about climate change and other air quality issues may affect our operations or results.
Concerns about climate change and regulation of GHGs and other air quality issues may materially affect our business in many ways, including increasing the costs to provide our products and services, and reducing demand for, and consumption of, our products and services, and we may be unable to recover or pass through a significant portion of our costs. In addition, legislative and regulatory responses to such issues may increase our operating costs and render certain wells or projects uneconomic. As these requirements become more stringent, we may be unable to implement them in a cost-effective manner. To the extent financial markets view climate change and GHG emissions as a financial risk, this could adversely impact our cost of, and access to, capital. Both California and the EPA have adopted laws, and policies that seek to reduce GHG emissions as discussed in "Business – Regulation of the Oil and Natural Gas Industry." In 2016, we incurred costs of approximately $33 million for mandatory GHG emissions allowances in California, and costs of such allowances per metric ton of GHG emissions are expected to increase in the future as CARB tightens program requirements.
In addition, other current and proposed international agreements and federal and state laws, regulations and policies seek to restrict or reduce the use of petroleum products in transportation fuels and electricity generation, impose additional taxes and costs on producers and consumers of petroleum products and require or subsidize the use of renewable energy.
24
Governmental authorities can impose administrative, civil and/or criminal penalties for non-compliance with air permits or other requirements of the federal Clean Air Act and associated state laws and regulations. In addition, California air quality laws and regulations, particularly in southern and central California where most of our operations are located, are in most instances more stringent than analogous federal laws and regulations. For example, despite achieving significant emissions reductions, the San Joaquin Valley will be required to adopt more rigorous attainment plans under the Clean Air Act to comply with federal ozone and particulate matter standards, and these efforts could affect our activities in the region.
We may incur substantial losses and be subject to substantial liability claims as a result of catastrophic events. We may not be insured for, or our insurance may be inadequate to protect us against, these risks.
We are not fully insured against all risks. Our oil and gas exploration and production activities, including well drilling, completion, stimulation, maintenance and abandonment activities, are subject to oil and gas operational risks such as fires, explosions, releases, discharges, equipment failures and industrial accidents. Other catastrophic events such as earthquakes, floods, mudslides, fires, droughts, terrorist attacks and other events that cause operations to cease or be curtailed may adversely affect our business and the communities in which we operate. We may be unable to obtain, or may elect not to obtain, insurance for certain risks if we believe that the cost of available insurance is excessive relative to the risks presented.
Information technology failures and cyber attacks could affect us significantly.
We rely on electronic systems and networks to communicate, control and manage our operations and prepare our financial management and reporting information. If we record inaccurate data or experience infrastructure outages, our ability to communicate and control and manage our business could be adversely affected. Cyber attacks on businesses have escalated in recent years. If we were to experience an attack and our security measures failed, the potential consequences to our business and the communities in which we operate could be significant.
Risks Related to the Spin-off
In connection with our separation from Occidental, we agreed to indemnify Occidental for certain liabilities, including those related to the operation of our business while it was still owned by Occidental, and Occidental agreed to indemnify us for certain liabilities, which indemnities may not be adequate.
Pursuant to agreements with Occidental, Occidental agreed to indemnify us for certain liabilities, and we agreed to indemnify Occidental for certain liabilities, in each case for uncapped amounts. Indemnity payments that we may be required to provide Occidental may be significant and could adversely impact our business, particularly indemnity payments relating to our actions that could impact the tax-free nature of the Spin-off. Third parties could also seek to hold us responsible for liabilities that Occidental has agreed to retain. Further, there can be no assurance that the indemnity from Occidental will be sufficient or timely to protect us against the full effect of such liabilities.
Our Tax Sharing Agreement with Occidental may limit our ability to take certain actions, including strategic transactions, and may require us to indemnify Occidental for significant tax liabilities.
Under a tax sharing agreement with Occidental we agreed to take, or refrain from, certain actions to ensure that the Spin-off and certain related transactions qualify for tax-free treatment. The agreement restricts our ability to sell assets outside the ordinary course of business, to issue or sell additional common stock or other securities, or to enter into certain other corporate transactions. For example, for a period of two years after March 24, 2016, the date of Occidental's final disposition of our common stock that it had retained, we may not enter into any transaction that would be reasonably likely to cause us to undergo either a 30% or greater change in the ownership of our voting stock or a 30% or greater change in the ownership (measured by vote or value) of all classes of our stock absent approval of Occidental.
25
We could have significant tax liabilities for periods during which Occidental operated our business.
We or one or more of our subsidiaries were included in the combined, consolidated or unitary tax returns of Occidental or one or more of its subsidiaries for periods prior to the Spin-off. We will be responsible for any increase in Occidental’s federal or state tax liability for any period in which we or any of our subsidiaries were combined or consolidated with Occidental if such increase results from audit adjustments attributable to our business. Further, if the Spin-off were determined to be taxable for U.S. federal income tax purposes, we could incur significant tax liabilities under the Tax Sharing Agreement between Occidental and us.
The agreements between us and Occidental were not made on an arm’s-length basis.
The agreements we entered into with Occidental in connection with the Spin-off, were negotiated while we were still a wholly owned subsidiary of Occidental and did not have an independent board of directors or a management team independent of Occidental. The terms of those agreements may be unfavorable and may not reflect terms that would have resulted from arm’s-length negotiations between unaffiliated third parties. The terms relate to, among other things, the allocation of assets, liabilities, rights and other obligations between Occidental and us.
ITEM 1B | UNRESOLVED STAFF COMMENTS |
We have no unresolved SEC staff comments at December 31, 2016.
26
ITEM 2 | PROPERTIES |
Our Operations
Our Areas of Operation
California is one of the most prolific oil and natural gas producing regions in the world and is the third largest oil producing state in the nation. According to DOGGR, cumulative California production from all four basins in which we operate is 36 billion barrels of oil equivalent (BBoe), including approximately 20 BBoe in the San Joaquin basin, 11 BBoe in the Los Angeles basin, 3 BBoe in the Ventura basin and 10 trillion cubic feet (Tcf) of natural gas in the Sacramento basin. Additionally, Kern County has been one of the top two largest oil producing counties in the lower 48 states for a number of years. California is heavily reliant on imported sources of energy, with approximately 65% of oil and 90% of natural gas consumed in recent years imported from outside the state. A vast majority of the imported oil arrives via supertanker, mostly from foreign locations. As a result, California refiners have typically purchased crude oil at international waterborne-based prices. Because of limited crude transportation infrastructure from other parts of the country to California, the California market is generally isolated from the rest of the nation, which we believe has offered relatively favorable pricing compared to other U.S. regions for similar grades. The favorable pricing, coupled with the high percentage of oil in our total production, provides us with attractive cash operating margins. Our operations include 135 fields with 8,837 gross active wellbores as of December 31, 2016. We believe we are the largest private oil and natural gas mineral acreage holder in California, with interests in approximately 2.3 million net acres. Approximately 60% of our total net mineral interest position is held in fee. A majority of our interests are in producing properties located in reservoirs characterized by what we believe to be long-lived production profiles with repeatable development opportunities.
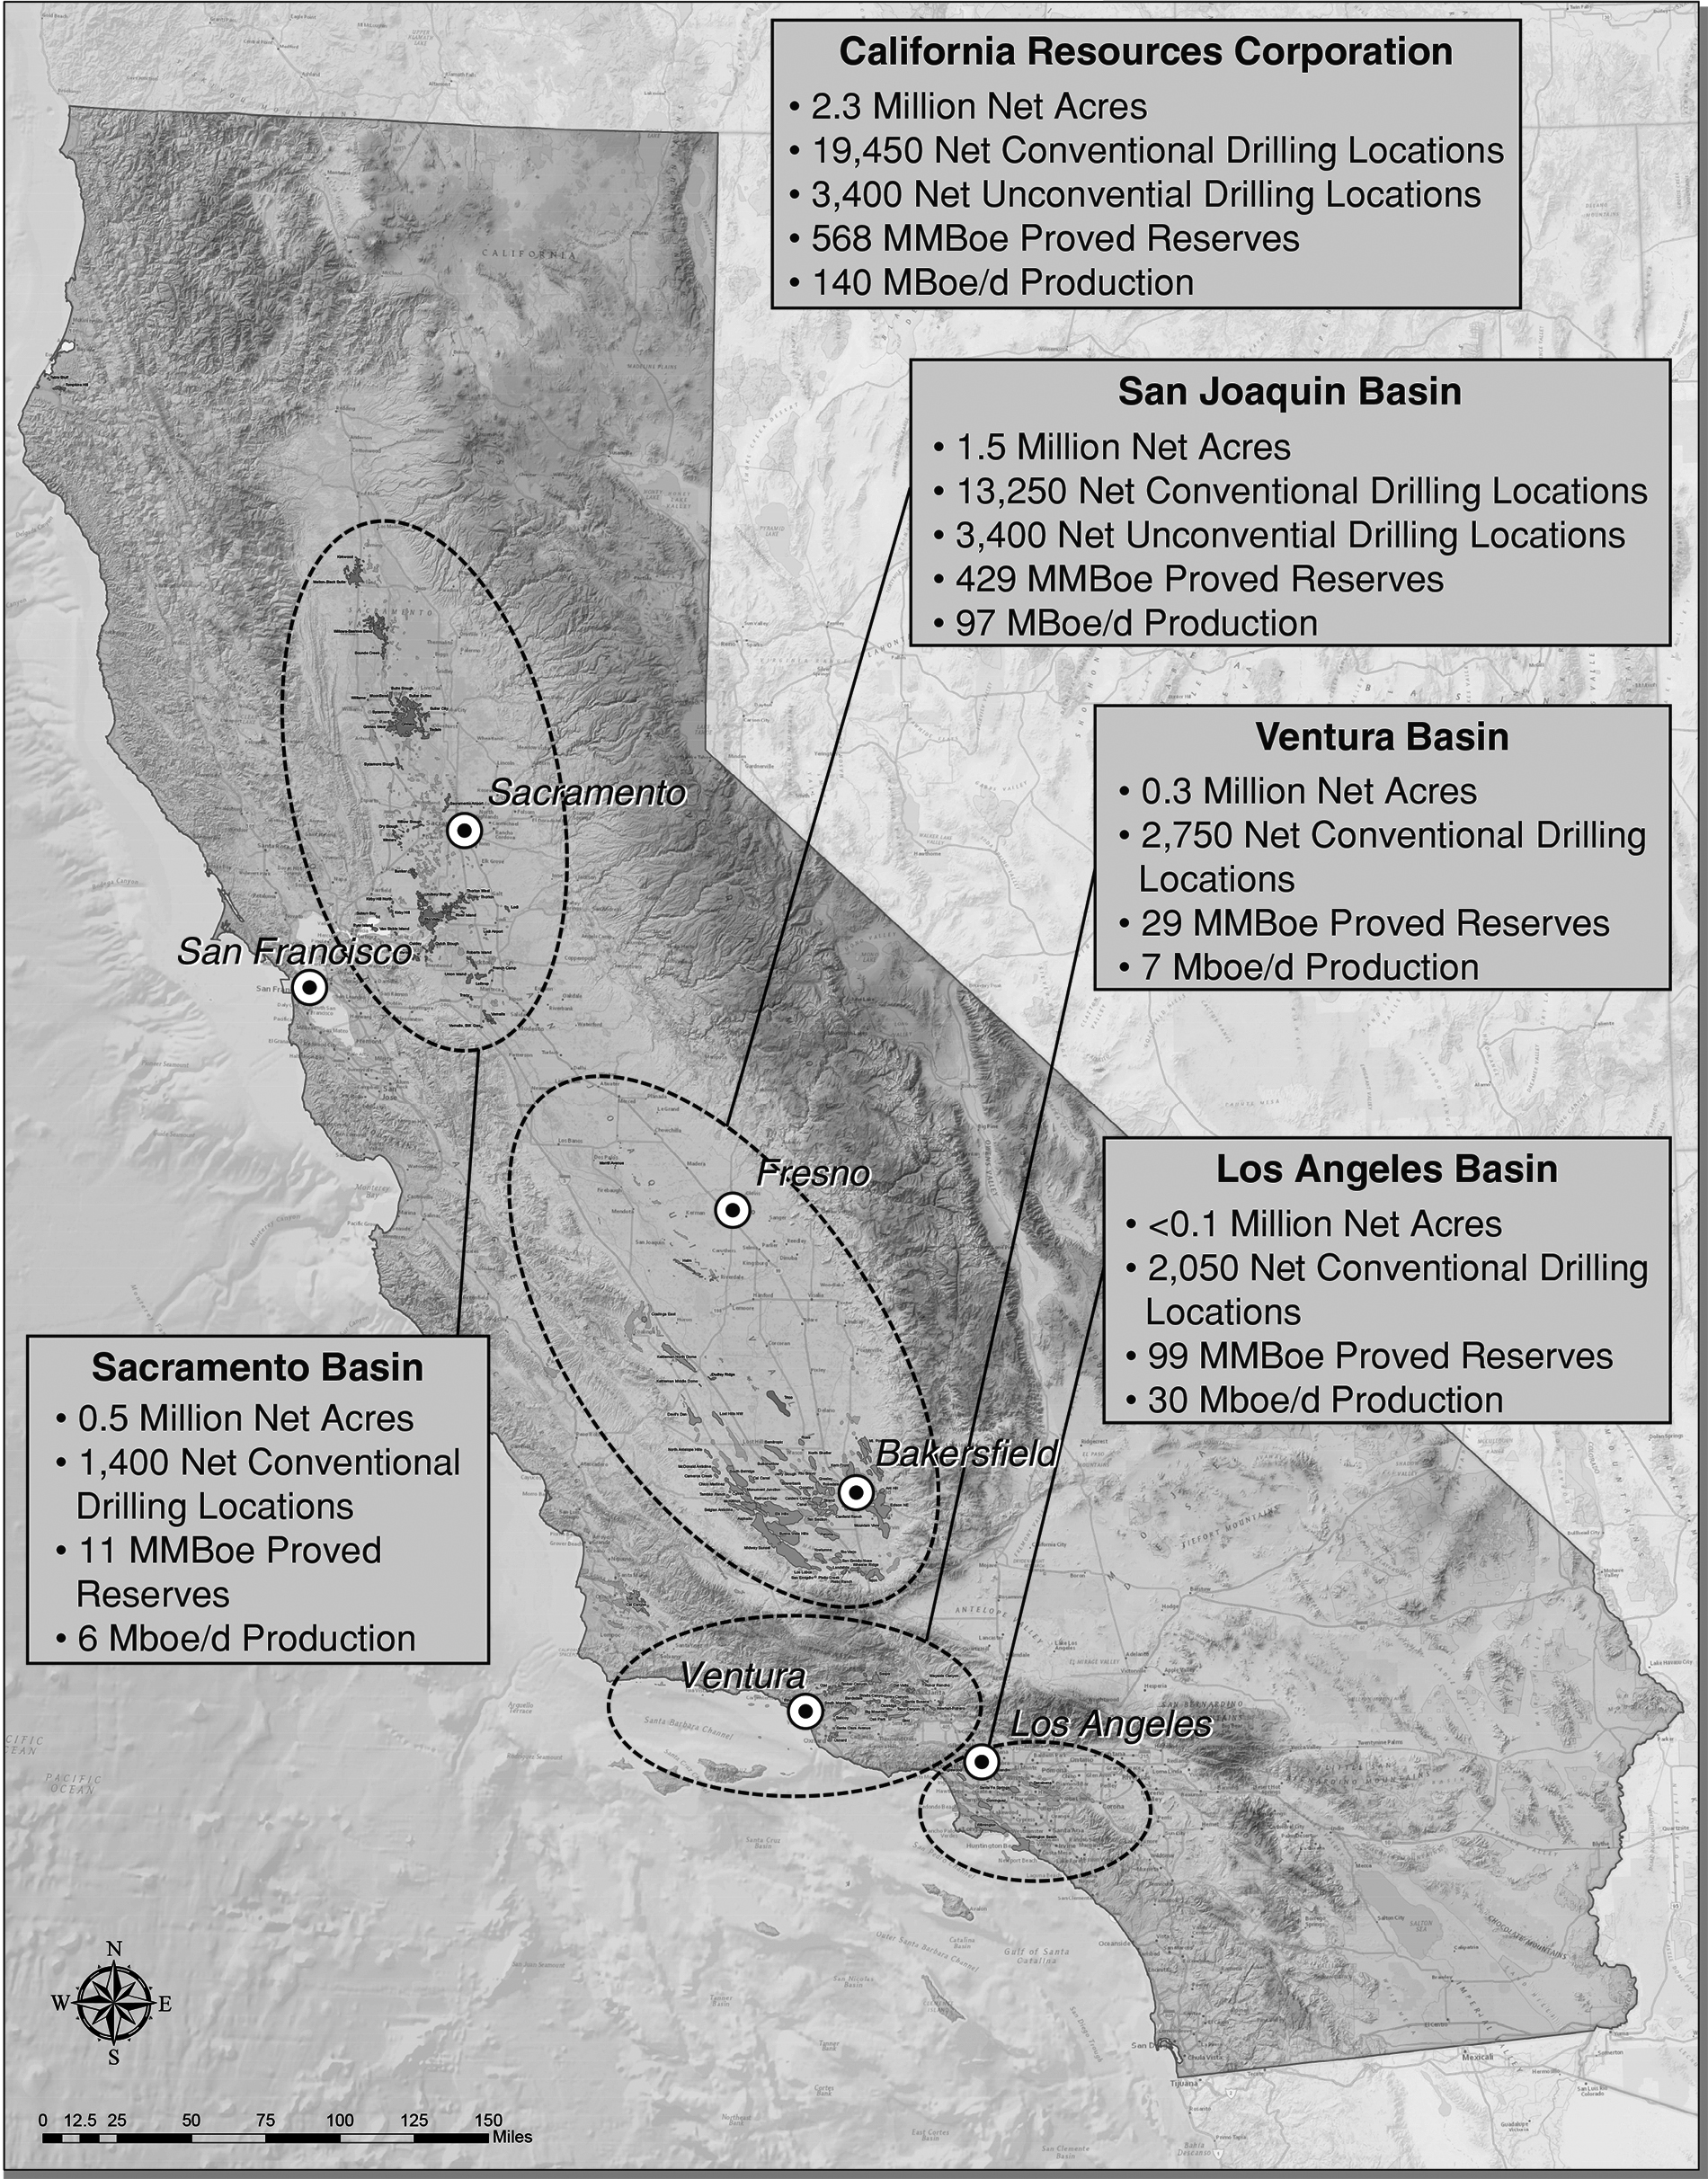
27
In 2016 we produced 51 million barrels of oil equivalent (MMBoe). Our capital program, along with positive performance-related revisions of 13 MMBoe, added 36 MMBoe of proved reserves in 2016 representing a 71% organic reserves replacement ratio. This was accomplished with $31 million of drilling and workover capital. For further information on our reserves replacement ratio, see "Our Reserves and Production Information – PV-10, Standardized Measure and Reserves Replacement Ratio" section below.
San Joaquin Basin
We actively operate and are developing 45 fields in this inland basin in the southern part of California's central valley, which consists of conventional primary, IOR, EOR and unconventional project types with approximately 1.5 million net acres, approximately 64% of which we hold in fee. Approximately 76% of our estimated proved reserves as of December 31, 2016 were located in, and 69% of our average daily net production for the year ended December 31, 2016 came from, the San Joaquin basin.
According to DOGGR, approximately 75% of California’s daily oil production for 2015 was produced in the San Joaquin basin. Commercial petroleum development began in the basin in the 1800s. Rapid discovery of many of the largest oil accumulations followed during the next several decades, including the Elk Hills field. We have been redeveloping this field and building our expertise to use in other fields across the state. According to the U.S. Geological Survey as of 2012, the San Joaquin basin contained three of the 10 largest oil fields in the United States based on cumulative production and proved reserves. We have been successfully developing steamfloods in our Kern Front operations, which are located next to the giant Kern River field, and in the northwest portion of the Lost Hills field. Beginning in the 1980s, reserves additions occurred in the Monterey formation on the west side of the basin and in our new conventional field discoveries. The basin contains multiple stacked formations throughout its areal extent, and we believe that the San Joaquin basin provides an appealing inventory of existing field re-development opportunities, as well as new play discovery and unconventional play potential. The complex stratigraphy and structure in the San Joaquin basin has allowed continuing discoveries of stratigraphic and structural traps. We believe our extensive 3D seismic library, which covers nearly 3,000 square miles in the San Joaquin basin, including 50% of our acreage, will give us a competitive advantage in further exploring this basin.
We have established a large ownership interest in several of the largest existing oil fields in the San Joaquin basin, including Elk Hills, our largest producing field, as well as the Buena Vista and Kettleman North Dome fields.
Elk Hills
Elk Hills is one of the largest fields in the continental United States based on proved reserves and has produced over 2.0 BBoe to date. During the year ended December 31, 2016, we produced 52 MBoe/d on average from our Elk Hills properties, or approximately 37% of our total average daily production. Of our total Elk Hills production, 65% is liquids. We also operate efficient natural gas processing facilities, including a state-of-the-art cryogenic gas plant, with a combined capacity of over 590 MMcf/d. Additionally, we generate sufficient electricity to operate the field and sell excess power to the grid and to others through contractual agreements. A portion of our excess power is subject to a five-year contract with a local utility, which includes a minimum capacity payment, thereby providing us with rates that are generally better than we could receive from sales to the grid. Our operations at Elk Hills include a state-of-the-art central control facility and remote automation control on over 95% of our wells.
Los Angeles Basin
We actively operate and are developing 8 fields in this urban, coastal basin which consists of conventional primary, IOR, EOR and unconventional project types, approximately half of which we hold in fee. Approximately 17% of our estimated proved reserves as of December 31, 2016 were located in, and 21% of our average daily net production for the year ended December 31, 2016 came from, the Los Angeles basin.
The basin is a northwest-trending plain about 50 miles long and 20 miles wide. Most of the significant discoveries in the Los Angeles basin date back to the 1920s. The Los Angeles basin has one of the highest concentrations per acre of crude oil in the world with 68 fields in an area of about 0.3 million acres. The basin contains multiple stacked formations throughout its depths, and we believe that the Los Angeles basin provides a considerable inventory of existing field re-development opportunities as well as new play discovery potential. Large active oil fields include the Wilmington and Huntington Beach fields, where we have significant operations.
28
Wilmington Oil Field
The Wilmington field located in Long Beach is the fourth largest field in the United States and has produced over 3.0 BBoe to date. During the year ended December 31, 2016, we produced approximately 33 MBoe/d gross on average, or 98% of the Wilmington field's daily production from all producers for the year. We operate in this field on behalf of the state of California and the city of Long Beach. Our net production in 2016 of approximately 25 MBoe/d equated to approximately 18% of our total average daily production. Most of our Wilmington production is covered under a set of contracts similar to production-sharing contracts under which we recover the capital and operating costs we incur on behalf of the state and the city of Long Beach and receive our share of profits. The field is developed by applying waterflood methods of oil recovery. Our waterflood operations have attractive margins and returns in the current price environment and extend the productive life of our reservoirs beyond the economic life expected for primary development.
Ventura Basin
We actively operate and are developing 29 fields in this central California coastal basin which consists of primary conventional, IOR, EOR and unconventional project types. We currently hold approximately 0.3 million net acres in the Ventura basin, approximately 72% of which we hold in fee. Approximately 5% of our estimated proved reserves as of December 31, 2016 were located in, and approximately 5% of our average daily net production for the year ended December 31, 2016 came from, the Ventura basin.
The Ventura basin is the onshore part of a structural feature and its offshore extension is the modern Santa Barbara basin. All of the sedimentary section is productive at various locations, and most reservoirs are sandstones with favorable porosity and permeability. The basin contains multiple stacked formations throughout its depths, and we believe that the Ventura basin provides an appealing inventory of existing field re-development opportunities, as well as new play exploration potential.
Sacramento Basin
We actively operate and are developing 53 fields in this inland basin in the northern part of California's central valley, primarily consisting of dry gas production. We currently hold approximately 0.5 million net acres in the Sacramento basin, approximately 37% of which we hold in fee. We believe our significant acreage position in the Sacramento basin gives us the option for future development and rapid production growth in an attractive natural gas price environment. Approximately 2% of our estimated proved reserves as of December 31, 2016 were located in, and approximately 4% of our average daily net production for the year ended December 31, 2016 came from, the Sacramento basin.
The Sacramento basin is a deep, thick sequence of sedimentary deposits within an elongated northwest-trending structural feature covering about 7.7 million acres. Exploration and development in the basin began in 1918.
Conventional Reservoir Recovery Methods
We determine which development method to use based on reservoir characteristics, reserves potential and expected returns. We seek to optimize the potential of our conventional assets by progressively using primary recovery methods, which may include some well stimulation techniques, IOR methods like waterflooding and EOR methods such as steamflooding, using both vertical and horizontal drilling. All of these techniques are proven technologies we have used extensively in California.
Primary Recovery
Primary recovery is a reservoir drive mechanism that utilizes the natural energy of the reservoir and is the first technique we use to develop a reservoir. Primary recovery is achieved by drilling and producing wells without supplementing the natural energy of the reservoir. Our successful exploration program continues to provide us with primary recovery opportunities in new reservoirs or through extensions of existing fields. Our conventional development programs create future opportunities to convert these reservoirs to waterfloods or steamfloods after their primary production phase.
29
Waterfloods
Some of our fields have been partially produced and no longer have sufficient energy to drive oil to our producing wellbores. Waterflooding is a well understood process that has been used in California for over 50 years to re-introduce energy to the reservoir through water injection and to sweep oil to producing wellbores. This process has been known to increase recovery factors from approximately 10% under primary recovery methods to up to approximately 20%. Our waterflood operations have attractive margins and returns in the current price environment. These operations typically have low and predictable production declines and allow us to extend the productive life of a reservoir and significantly increase our incremental recovery after primary recovery. As a result, investments in waterfloods can yield attractive returns even in a low price environment. We use waterfloods extensively in the San Joaquin, Los Angeles and Ventura basins where they have allowed us to reduce production declines or modestly grow our production from mature fields such as Elk Hills and Wilmington.
Steamfloods
Some of our fields contain heavy, thick oil. Steamfloods work by injecting steam into the reservoir to heat the oil, decreasing its viscosity, or thinning the oil, allowing it to flow more easily to the producing wellbores. Steamflooding is a well understood process that has been used in California since the early 1960s. This process has been known to increase recovery factors from approximately 10% under primary recovery methods to up to approximately 75%. Thermal operations are most effective in shallow reservoirs containing heavy, viscous oil. The steamflood process is generally characterized by low capital investment with attractive margins and returns even in a low oil price environment as long as the oil-to-gas price ratio is in excess of five. The economics of steamflooding are largely a function of the ratio between oil and natural gas prices. After drilling, these operations typically ramp up production over one to two years as the steam continues to influence the oil production, and then exhibit a plateau for several months, with a subsequent low, predictable production decline rate of 5 to 10% per year. This gradual decline allows us to extend the productive life of a reservoir and significantly increase our incremental recovery after primary depletion. We use steamfloods extensively in the San Joaquin basin, where they have allowed us to grow our production from mature fields such as Kern Front and Lost Hills, among others.
Unconventional Reservoir Potential
We believe our undeveloped unconventional acreage has the potential to provide significant long-term production growth. In total, we hold mineral interests in approximately 1.3 million net acres with unconventional potential and have identified over 3,750 gross (3,400 net) unconventional drilling locations on this acreage. As a result of focusing more on these reservoirs over the past few years, approximately 32% of our 2016 production was from unconventional reservoirs, an increase of approximately 95% since the acquisition of our Elk Hills field properties in 1998. As of December 31, 2016, we had proved reserves of approximately 170 MMBoe associated with our unconventional properties, approximately 26% of which were proved undeveloped reserves.
We hold significant interests in the Monterey formation, which is divided into upper and lower intervals. We have successfully produced from seven discrete stacked pay horizons within the upper Monterey. During the year ended December 31, 2016, we produced approximately 48 MBoe/d on average from upper Monterey. The lower Monterey is recognized as a world-class source rock generating the majority of the hydrocarbons produced from fields across California.
In a higher price environment, we plan to apply the knowledge acquired from our successes in the upper Monterey to other unconventional reservoirs in the San Joaquin basin such as the Kreyenhagen and Moreno formations. The Kreyenhagen and Moreno formations are hydrocarbon source rocks that have generated oil and gas, and we believe they offer similar development opportunities to the upper Monterey and other resource play onshore U.S. reservoirs. The lower Monterey has an extremely limited production history compared to the upper Monterey, and therefore very limited knowledge exists regarding its potential. For example, only about 25 wells have tested the lower Monterey to date. However, we believe we will be able to apply knowledge we gain from the upper Monterey in the lower Monterey as well.
30
Exploration Program
California is one of the most prolific hydrocarbon producing regions as a result of its world-class source rocks and stacked conventional and unconventional reservoirs. California basins have generated billions of barrels of oil and have established production from over 270 identified reservoir intervals in both structural and stratigraphic trap configurations. Historic industry activity has focused on the primary and secondary development of known hydrocarbon accumulations, many of which were discovered over one century ago. The hydrocarbon basins where we have significant land positions remain underexplored.
We have a successful exploration program in both conventional and unconventional plays under which discoveries have been quickly developed into producing fields as demonstrated by our past success rates, which have been approximately double the worldwide industry average over the last decade. We believe our experienced technical staff, proprietary geological models, leading acreage position and extensive 3D seismic library give us a strong competitive advantage.
The underexplored nature of the California basins and the unique competitive advantage provided by our extensive technical knowledge, land position and proprietary data have resulted in a large inventory of low-risk conventional exploration projects in proven play trends. We took advantage of our recent lower activity levels to create a ranked near-field portfolio of over 150 exploration prospects across the San Joaquin, Sacramento and Ventura basins. As of December 31, 2016, our project inventory increased to approximately 12,100 gross (5,650 net) conventional exploration drilling locations in proven reservoirs. The majority of these locations are located near and are analogous to existing producing fields or our recent exploration discoveries.
We continue to develop our understanding and knowledge of the significant prospective resources in the exploration shale reservoirs. In 2016, we completed the data processing of approximately 200 square miles of proprietary 3D seismic data around the Kettleman North Dome field that aids reservoir characterization and fracture analysis. In addition, we undertook reservoir analysis incorporating proprietary log and core data to further advance our understanding of exploration shale reservoirs. We have identified approximately 6,400 gross (5,300 net) prospective resource drilling locations in the lower Moneterey, Kreyenhagen and Moreno unconventional reservoirs.
Our Reserves and Production Information
Reserves Data
The information with respect to our estimated reserves presented below has been prepared in accordance with the rules and regulations of the SEC.
Reserves Presentation
Proved oil, NGLs and natural gas reserves were estimated using the unweighted arithmetic average of the first-day-of-the-month price for each month within the year (SEC prices), unless prices were defined by contractual arrangements. Oil, NGLs and natural gas prices used for this purpose were based on posted benchmark prices and adjusted for price differentials to account for gravity, quality and transportation costs. For the 2016 disclosures, the calculated average Brent oil price was $42.90 per barrel and the average NYMEX gas price was $2.48 per Million British Thermal Units (MMBtu). The average realized prices used for the 2016 disclosures were $39.83 per barrel for oil, $21.54 per barrel for NGLs and $2.28 per Mcf for natural gas.
31
The following tables summarize our estimated proved reserves at December 31, 2016. Reserves are stated net of applicable royalties. Estimated reserves include our economic interests under arrangements similar to production-sharing contracts relating to the Wilmington field in Long Beach.
As of December 31, 2016 | ||||||||||||||
San Joaquin Basin | Los Angeles Basin | Ventura Basin | Sacramento Basin | Total | ||||||||||
Proved developed reserves: | ||||||||||||||
Oil (MMBbl) | 177 | 82 | 20 | — | 279 | |||||||||
NGLs (MMBbl) | 42 | — | 2 | — | 44 | |||||||||
Natural Gas (Bcf) | 410 | 7 | 15 | 68 | 500 | |||||||||
Total (MMBoe)(a)(b) | 287 | 83 | 25 | 11 | 406 | |||||||||
Proved undeveloped reserves: | ||||||||||||||
Oil (MMBbl) | 110 | 16 | 4 | — | 130 | |||||||||
NGLs (MMBbl) | 11 | — | — | — | 11 | |||||||||
Natural Gas (Bcf) | 126 | — | — | — | 126 | |||||||||
Total (MMBoe)(b) | 142 | 16 | 4 | — | 162 | |||||||||
Total proved reserves: | ||||||||||||||
Oil (MMBbl) | 287 | 98 | 24 | — | 409 | |||||||||
NGLs (MMBbl) | 53 | — | 2 | — | 55 | |||||||||
Natural Gas (Bcf) | 536 | 7 | 15 | 68 | 626 | |||||||||
Total (MMBoe)(b) | 429 | 99 | 29 | 11 | 568 | |||||||||
(a) | As of December 31, 2016, approximately 20% of proved developed oil reserves, 11% of proved developed NGLs reserves, 14% of proved developed natural gas reserves and, overall, 17% of total proved developed reserves are non-producing. A majority of our non-producing reserves relate to steamfloods and waterfloods where full peak production response has not yet occurred due to the nature of such projects. |
(b) | Natural gas volumes have been converted to Boe based on the equivalence of energy content between six Mcf of gas and one Bbl of oil. Barrels of oil equivalence does not necessarily result in price equivalence. The price of natural gas on a barrel of oil equivalent basis is currently substantially lower than the corresponding price for oil and has been similarly lower for a number of years. For example, in 2016, the average prices of Brent oil and NYMEX natural gas were $45.04 per Bbl and $2.42 per MMBtu, respectively, resulting in an oil-to-gas price ratio of approximately 19 to 1. |
32
Proved Reserves Additions
In 2016, we added 23 MMBoe of proved reserves resulting from our capital program and 13 MMBoe due to positive performance revisions. These additions were offset by negative price-related revisions of 60 MMBoe. The price revisions incorporated the positive effect of lower operating costs also caused by the lower commodity price environment. In a higher price environment, many of the volumes that became uneconomic this year could again become economic and be added back to the reserves base though possible operating cost increases may dampen the volume increase. The components of the changes to our proved reserves during the year ended December 31, 2016 were as follows:
San Joaquin Basin | Los Angeles Basin | Ventura Basin | Sacramento Basin | Total | ||||||||||
Improved recovery: | ||||||||||||||
Oil (MMBbl) | 3 | — | — | — | 3 | |||||||||
NGLs (MMBbl) | — | — | — | — | — | |||||||||
Natural Gas (Bcf) | — | — | — | — | — | |||||||||
Total (MMBoe) | 3 | — | — | — | 3 | |||||||||
Extensions and discoveries: | ||||||||||||||
Oil (MMBbl) | 11 | 1 | 2 | — | 14 | |||||||||
NGLs (MMBbl) | 2 | — | — | — | 2 | |||||||||
Natural Gas (Bcf) | 20 | — | 3 | 2 | 25 | |||||||||
Total (MMBoe) | 16 | 1 | 3 | — | 20 | |||||||||
Total reserves additions from capital program | 19 | 1 | 3 | — | 23 | |||||||||
Revisions related to performance (MMBoe): | 12 | — | 2 | (1 | ) | 13 | ||||||||
Revisions related to price changes (MMBoe): | (17 | ) | (23 | ) | (20 | ) | — | (60 | ) | |||||
Divestitures (MMBoe): | — | (1 | ) | — | — | (1 | ) | |||||||
Our ability to add reserves, other than through acquisitions, depends on the success of improved recovery, extension and discovery projects, each of which depends on reservoir characteristics, technology improvements and oil and natural gas prices, as well as capital and operating costs. Many of these factors are outside management's control, and will affect whether the historical sources of proved reserves additions continue to provide reserves at similar levels.
Improved Recovery
In 2016, we added proved reserves of 3 MMBoe from improved recovery through proven IOR and EOR methods. The improved recovery additions in 2016 were associated with the continued development of steamflood and waterflood properties in the San Joaquin basin. The types of conventional IOR and EOR development methods we use can be applied through existing wells, though additional drilling is frequently required to fully optimize the development configuration.
Extensions and Discoveries
In 2016, we added 20 MMBoe of proved reserves from extensions and discoveries, which generally result from exploration, exploitation and development programs. The extensions and discovery additions were associated with the continued successful but limited drilling primarily in the San Joaquin, Los Angeles, and Ventura basins.
33
Revisions of Previous Estimates
Revisions related to performance - Performance related revisions can include upward or downward changes to previous proved reserves estimates due to the evaluation or interpretation of geologic, production decline or operating performance data. In 2016, our positive performance related revisions of 13 MMBoe resulted primarily from better than expected reservoir performance and comprehensive field development planning. These positive revisions primarily came from the San Joaquin and Ventura basins.
Revisions related to price changes - Product price changes affect proved reserves we record. For example, higher prices generally increase the economically recoverable reserves in all of our operations, because the extra margin extends their expected lives and renders more projects economic. Partially offsetting this effect, higher prices decrease our share of proved cost recovery reserves under arrangements similar to production-sharing contracts at our Long Beach operations because less oil is required to recover costs. Conversely, when prices drop, we experience the opposite effects. Total net negative price revisions in 2016 were 60 MMBoe. The price revisions incorporated the positive effect of lower operating costs also caused by the lower commodity price environment.
During the course of 2016 we experienced further price declines compared to 2015, resulting in the average SEC price for Brent oil decreasing from $55.57 per barrel for 2015 to $42.90 for 2016. As a result, we experienced negative price related revisions to our proved reserves at December 31, 2016 of 60 MMBoe. Generally, lower prices adversely impact the quantity of our reserves as those reserves may no longer meet the economic producibility criteria under the rules or may be removed due to a lower amount of capital available to develop these projects within the SEC-mandated five-year limit. However, our production-sharing contracts in Long Beach tend to partially offset these effects because our share of production and reserves from these contracts increases as prices decline. Further, during the course of the year we implemented significant cost reduction and efficiency steps, which reduced our production costs by approximately 16% and drilling costs by approximately 23%. These cost reductions, as well as other efficiency efforts, offset a portion of the price-related loss of reserves quantities as some of the barrels that would have become uneconomic in later years remain economic, a portion of the proved undeveloped reserves that would otherwise be removed from the reserves quantities become economic and we expect to drill more wells with the same amount of capital.
34
Proved Undeveloped Reserves
In 2016, we had proved undeveloped reserves additions of 12 MMBoe from extensions and discoveries primarily in the San Joaquin and Los Angeles basins and 20 MMBoe from performance-related revisions, offset by 29 MMBoe of negative revisions due to lower prices. We transferred 4 MMBoe of proved undeveloped reserves to the proved developed category as a result of the 2016 development program, all of which was in the San Joaquin and Los Angeles basins. As a result, we converted approximately 2% of our beginning-of-year proved undeveloped reserves to proved developed reserves during the year, investing approximately $13 million of capital. The total changes to our proved undeveloped reserves during the year ended December 31, 2016 were as follows:
San Joaquin Basin | Los Angeles Basin | Ventura Basin | Sacramento Basin | Total | ||||||||||
Improved recovery (MMBoe): | — | — | — | — | — | |||||||||
Extensions and discoveries: | ||||||||||||||
Oil (MMBbl) | 8 | 1 | — | — | 9 | |||||||||
NGLs (MMBbl) | 1 | — | — | — | 1 | |||||||||
Natural Gas (Bcf) | 12 | — | — | 2 | 14 | |||||||||
Total (MMBoe) | 11 | 1 | — | — | 12 | |||||||||
Revisions related to performance (MMBoe): | 17 | 2 | 1 | — | 20 | |||||||||
Revisions related to price changes (MMBoe): | (8 | ) | (13 | ) | (8 | ) | — | (29 | ) | |||||
Transfers to proved developed reserves: | ||||||||||||||
Oil (MMBbl) | (3 | ) | (1 | ) | — | — | (4 | ) | ||||||
NGLs (MMBbl) | — | — | — | — | — | |||||||||
Natural Gas (Bcf) | (1 | ) | — | — | — | (1 | ) | |||||||
Total (MMBoe) | (3 | ) | (1 | ) | — | — | (4 | ) | ||||||
Our year-end development plans and associated proved undeveloped reserves are consistent with SEC guidelines for development within five years. Our conclusion is based on $65 average Brent price over the next five years. Prices that are significantly below this level for a prolonged period could require us to reduce expected capital investment over the next five years, potentially impacting either the quantity or the development timing of proved undeveloped reserves. For example, if the five-year average price remained at current levels, we would need to remove approximately 45 MMBoe from our proved undeveloped reserves.
35
PV-10, Standardized Measure and Reserves Replacement Ratio
As of December 31, 2016, our standardized measure of discounted future net cash flows (Standardized Measure) was $2.7 billion and PV-10 was over $2.8 billion. In addition, we organically replaced 71% of our proved reserves in 2016.
PV-10 is a non-GAAP financial measure and represents the year-end present value of estimated future cash inflows from proved oil and natural gas reserves, less future development and production costs, discounted at 10% per annum to reflect the timing of future cash flows and using SEC prescribed pricing assumptions for the period. PV-10 differs from Standardized Measure because Standardized Measure includes the effects of future income taxes on future net cash flows. Neither PV-10 nor Standardized Measure should be construed as the fair value of our oil and natural gas reserves. PV-10 and Standardized Measure are used by the industry and by our management as an asset value measure to compare against our past reserves bases and the reserves bases of other business entities because the pricing, cost environment and discount assumptions are prescribed by the SEC and are comparable. PV-10 further facilitates the comparisons to other companies as it is not dependent on the tax-paying status of the entity.
As of December 31, 2016 | |||
($ in millions) | |||
PV-10 of proved reserves | $ | 2,848 | |
Present value of future income taxes discounted at 10% | (181 | ) | |
Standardized measure of discounted future net cash flows | $ | 2,667 | |
Organic reserves replacement ratio(1) | 71 | % | |
(1) | The organic reserves replacement ratio is calculated for a specified period using the proved oil-equivalent additions from extensions and discoveries, improved recovery and performance-related revisions, divided by oil-equivalent production. There is no guarantee that historical sources of reserves additions will continue as many factors fully or partially outside management's control, including commodity prices, availability of capital and the underlying geology affect reserves additions. Management uses this measure to gauge the results of its capital allocation. Other oil and gas producers may use different methods to calculate replacement ratios, which may affect comparability. |
Reserves Evaluation and Review Process
Our estimates of proved reserves and associated future net cash flows as of December 31, 2016 were made by our technical personnel, such as reservoir engineers and geoscientists, with the assistance of operational and financial personnel and are the responsibility of management. The estimation of proved reserves is based on the requirement of reasonable certainty of economic producibility and management's funding commitments to develop the reserves. Reserves volumes are estimated by forecasts of production rates, operating costs and capital investments. Price differentials between specified benchmark prices and realized prices and specifics of each operating agreement are then applied against the SEC Price to estimate the net reserves. Production rate forecasts are derived using a number of methods, including estimates from decline-curve analysis, type-curve analysis, material balance calculations, which take into account the volumes of substances replacing the volumes produced and associated reservoir pressure changes, seismic analysis and computer simulations of reservoir performance. These field-tested technologies have demonstrated reasonably certain results with consistency and repeatability in the formations being evaluated or in analogous formations. Operating and capital costs are forecast using the current cost environment (without accounting for possible cost changes) applied to expectations of future operating and development activities related to the proved reserves.
Net proved developed reserves are those volumes that are expected to be recovered through existing wells with existing equipment and operating methods, for which the incremental cost of any additional required investment is relatively minor. Net proved undeveloped reserves are those volumes that are expected to be recovered from new wells on undrilled acreage, or from existing wells where a relatively major expenditure is required.
36
Our Vice President, Reserves and Corporate Development has primary responsibility for overseeing the preparation of our reserves estimates. She has over 15 years of experience as an energy sector engineer including as a Senior Reservoir Engineer with Ryder Scott Company, L.P. (Ryder Scott). She is a member of the Society of Petroleum Engineers (SPE) for which she served as past chair of the U.S. Registration Committee. She holds a Master of Business Administration from the Massachusetts Institute of Technology, a Master of Engineering in Petroleum Engineering from the University of Houston and a Bachelor of Science from the University of Florida. She is also a registered engineer in the state of Texas.
We have an Oil and Gas Reserves Review Committee (Reserves Committee), consisting of senior corporate officers, which reviewed and approved our oil and natural gas reserves for 2016. The Reserves Committee reports to the Audit Committee during the year.
Audits of Reserves Estimates
Ryder Scott was engaged to provide an independent audit of our 2016 and 2015 reserves estimates for fields that in each year comprised at least 80% of our total proved reserves. Until year end 2014, Ryder Scott conducted process reviews of our properties on behalf of our former parent. The primary technical engineer responsible for our audit has 38 years of petroleum engineering experience, the majority of which has been in the estimation and evaluation of reserves. He serves on the Ryder Scott Board of Directors and is a registered Professional Engineer in the state of Texas.
The 2016 reserves audit included a detailed review of 83% of our total proved reserves. For 2016 and 2015 combined, Ryder Scott audited 94% of our total proved reserves. Ryder Scott examined the assumptions underlying our reserves estimates, adequacy and quality of our work product, and estimates of future production rates, net revenues, and the present value of such net revenues. Ryder Scott also examined the appropriateness of the methodologies employed to estimate our reserves as well as their categorization, using the definitions set forth by the SEC and found them to be appropriate. As part of their process, Ryder Scott developed their own independent estimates of reserves for those fields that they audited. When compared on a field-by-field basis, some of our estimates were greater and some were less than the estimates of Ryder Scott. Given the inherent uncertainties and judgments in estimating proved reserves, differences between our and Ryder Scott's estimates are to be expected. The aggregate difference between our estimates and Ryder Scott's was less than 10%, which was within SPE's acceptable tolerance.
In the conduct of the reserves audit, Ryder Scott did not independently verify the accuracy and completeness of information and data furnished by us with respect to ownership interests, crude oil and natural gas production, well test data, historical costs of operation and development, product prices, or any agreements relating to current and future operations of the fields and sales of production. However, if anything came to Ryder Scott's attention which brought into question the validity or sufficiency of any such information or data, Ryder Scott would not rely on such information or data until it had resolved its questions relating thereto or had independently verified such information or data.
Ryder Scott determined that our estimates of reserves have been prepared in accordance with the definitions and regulations of the SEC as well as the Standards Pertaining to the Estimating and Auditing of Oil and Gas Reserves Information promulgated by the SPE, including the criteria of “reasonable certainty,” as it pertains to expectations about the recoverability of reserves in future years, under existing economic and operating conditions. Ryder Scott issued an unqualified audit opinion on our proved reserves at December 31, 2016. Ryder Scott's report is attached as an exhibit to this Form 10-K.
Determination of Identified Drilling Locations
Proven Drilling Locations
Based on our reserves report as of December 31, 2016, we have approximately 2,350 gross (2,150 net) drilling locations attributable to our proved undeveloped reserves. We use production data and experience gained from our development programs to identify and prioritize this proven drilling inventory. These drilling locations are included in our inventory only after we have adopted a development plan to drill them within a five-year time frame. As a result of rigorous technical evaluation of geologic and engineering data, we can estimate with reasonable certainty that reserves from these locations will be commercially recoverable in accordance with SEC guidelines.
37
Management considers the availability of local infrastructure, drilling support assets, state and local regulations and other factors it deems relevant in determining such locations.
Unproven Drilling Locations
We have also identified a multi-year inventory of 16,450 gross (15,050 net) drilling locations that are not associated with proved undeveloped reserves but are specifically identified on a field-by-field basis considering the applicable geologic, engineering and production data. We analyze past field development practices and identify analogous drilling opportunities taking into consideration historical production performance, estimated drilling and completion costs, spacing and other performance factors. These drilling locations primarily include (i) infill drilling locations, (ii) additional locations due to field extensions or (iii) potential IOR and EOR project expansions, some of which are currently in the pilot phase across our properties, but have yet to be moved to the proven category. We believe the assumptions and data used to estimate these drilling locations are consistent with established industry practices with well spacing selected based on the type of recovery process we are using.
Exploration Drilling Locations
Our portfolio of prospective drilling locations contains approximately 12,100 gross (5,650 net) unrisked exploration drilling locations in proven reservoirs, the majority of which are located near existing producing fields. We use internally generated information and proprietary geologic models consisting of data from analog plays, 3D seismic data, open hole and mud log data, cores, and reservoir engineering data to help define the extent of the targeted intervals and the potential ability of such intervals to produce commercial quantities of hydrocarbons. Information used to identify exploration locations includes both our own proprietary data, as well as industry data available in the public domain. After defining the potential areal extent of an exploration prospect, we identify our exploration drilling locations within the prospect by applying the well spacing historically utilized for the applicable type of recovery process used in analogous fields.
Prospective Resource Drilling Locations
In addition, we have approximately 6,400 gross (5,300 net) unrisked prospective resource drilling locations identified in the lower Monterey, Kreyenhagen and Moreno unconventional reservoirs based on screening criteria that include geologic and economic considerations and limited production information. Prospective play areas are defined by geologic data consisting of well cuttings, hydrocarbon shows, open-hole well logs, geochemical data, available 3D or 2D seismic data and formation pressure data, where available. Information used to identify our prospective locations includes both our own proprietary data, as well as industry data available in the public domain. We identify our prospective resource drilling locations based on an assumption of 80-acre spacing per well throughout the prospective area for each resource play.
Well Spacing Determination
Our well spacing determinations in the above categories of identified well locations are based on actual operational spacing within our existing producing fields, which we believe are reasonable for the particular recovery process employed (i.e., primary, waterflood or EOR). Due to the significant vertical thickness and multiple stacked reservoirs usually encountered by our drilling wells, typical well spacing is generally less than 20 acres and often 10 acres or less in the majority of our fields unless specified differently above. These parameters also meet the general well spacing restrictions imposed on certain oil and gas fields in California.
Drilling Schedule
Our identified drilling locations have been scheduled as part of our current multi-year drilling schedule or are expected to be scheduled in the future. However, we may not drill our identified sites at the times scheduled or at all. We view the risk profile for our exploration drilling locations and our prospective resource drilling locations as being higher than for our other drilling locations due to relatively less available geologic and production data and drilling history, in particular with respect to our prospective resource locations, which are in unproven geologic plays. We make assumptions about the consistency and accuracy of data when we identify these locations that may prove inaccurate.
38
Our ability to profitably drill and develop our identified drilling locations depends on a number of variables, including crude oil and natural gas prices, capital availability, costs, drilling results, regulatory approvals, available transportation capacity and other factors. If future drilling results in these projects do not establish sufficient reserves to achieve an economic return, we may curtail drilling or development of these projects. A small portion of the unproven drilling locations may be uneconomic at current prices. For a discussion of the risks associated with our drilling program, see "Risk Factors—Risks Related to Our Business and Industry."
The table below sets forth our total gross identified drilling locations as of December 31, 2016, excluding our prospective drilling locations from new resource plays.
Proven Drilling Locations | Total Identified Drilling Locations | ||||||||||
Oil and Natural Gas Wells | Injection Wells | Oil and Natural Gas Wells | Injection Wells | ||||||||
San Joaquin Basin | |||||||||||
Primary Conventional | 200 | — | 9,000 | — | |||||||
Steamflood | 1,050 | 250 | 7,550 | 450 | |||||||
Waterflood | 100 | 50 | 2,100 | 1,050 | |||||||
Unconventional | 250 | — | 3,750 | — | |||||||
San Joaquin Basin subtotal | 1,600 | 300 | 22,400 | 1,500 | |||||||
Los Angeles Basin | |||||||||||
Primary Conventional | — | — | — | — | |||||||
Steamflood | — | — | — | — | |||||||
Waterflood | 250 | 100 | 1,600 | 550 | |||||||
Unconventional | — | — | — | — | |||||||
Los Angeles Basin subtotal | 250 | 100 | 1,600 | 550 | |||||||
Ventura Basin | |||||||||||
Primary Conventional | — | — | 1,600 | — | |||||||
Steamflood | — | — | 350 | — | |||||||
Waterflood | 50 | 50 | 750 | 250 | |||||||
Unconventional | — | — | — | — | |||||||
Ventura Basin subtotal | 50 | 50 | 2,700 | 250 | |||||||
Sacramento Basin | |||||||||||
Primary Conventional | — | — | 1,900 | — | |||||||
Sacramento Basin subtotal | — | — | 1,900 | — | |||||||
Total Identified Drilling Locations | 1,900 | 450 | 28,600 | 2,300 | |||||||
39
Production, Price and Cost History
Oil, NGLs and natural gas are commodities; therefore, the price that we receive for our production is largely a function of market supply and demand. Product prices are affected by a variety of factors, including changes in consumption patterns, inventory levels, global and local economic conditions, the actions of OPEC and other significant producers and governments, actual or threatened production and refining disruptions, currency exchange rates, worldwide drilling and exploration activities, the effects of conservation, weather, geophysical and technical limitations, refining and processing disruptions, transportation bottlenecks and other matters affecting the supply and demand dynamics for our products, technological advances and regional market conditions; transportation capacity and costs in producing areas; and the effect of changes in these variables on market perceptions. Given the volatile oil price environment, as well as our leverage, we have a hedging program to protect our cash flow and capital investment program and improve our ability to comply with the covenants under our credit facilities in case of price deterioration.
Fixed and Variable Costs
Our total production costs consist of variable costs that tend to vary depending on production levels, and fixed costs that typically do not vary with changes in production levels or well counts, especially in the short term. The substantial majority of our near-term fixed costs become variable over the longer term because we manage them based on the field’s stage of life and operating characteristics. For example, portions of labor and material costs, energy, workovers and maintenance expenditures correlate to well count, production and activity levels. Portions of these same costs can be relatively fixed over the near term; however, they are managed down as fields mature in a manner that correlates to production and commodity price levels. While a certain amount of costs for facilities, surface support, surveillance and related maintenance can be regarded as fixed in the early phases of a program, as the production from a certain area matures, well count increases and daily per well production drops, such support costs can be reduced and consolidated over a larger number of wells, reducing costs per operating well. Further, many of our other costs, such as property taxes and oilfield services, are variable and will respond to activity levels and tend to correlate with commodity prices. Overall, we believe approximately one-third of our operating costs are fixed over the life cycle of our fields. We actively manage our fields to optimize production and costs. When we see growth in a field we increase capacities, and similarly when a field nears the end of its economic life we manage the costs while it remains economically viable to produce.
40
The following table sets forth information regarding production, realized and benchmark prices, and costs for oil and gas producing activities for the years ended December 31, 2016, 2015 and 2014. For additional information on price calculations, see information set forth in "Management's Discussion and Analysis of Financial Condition and Results of Operations."
Year Ended December 31, | |||||||||||
2016 | 2015 | 2014 | |||||||||
Production Data: | |||||||||||
Oil (MBbl/d) | 91 | 104 | 99 | ||||||||
NGLs (MBbl/d) | 16 | 18 | 19 | ||||||||
Natural gas (MMcf/d) | 197 | 229 | 246 | ||||||||
Average daily combined production (MBoe/d)(a) | 140 | 160 | 159 | ||||||||
Total combined production (MMBoe) | 51 | 58 | 58 | ||||||||
Average realized prices: | |||||||||||
Oil prices with hedge ($/Bbl) | $ | 42.01 | $ | 49.19 | $ | 92.30 | |||||
Oil prices without hedge ($/Bbl) | $ | 39.72 | $ | 47.15 | $ | 92.30 | |||||
NGLs prices ($/Bbl) | $ | 22.39 | $ | 19.62 | $ | 47.84 | |||||
Natural gas prices ($/Mcf) | $ | 2.28 | $ | 2.66 | $ | 4.39 | |||||
Average Benchmark prices: | |||||||||||
Brent oil ($/Bbl) | $ | 45.04 | $ | 53.64 | $ | 99.51 | |||||
WTI oil ($/Bbl) | $ | 43.32 | $ | 48.80 | $ | 93.00 | |||||
NYMEX gas ($/MMBtu) | $ | 2.42 | $ | 2.75 | $ | 4.34 | |||||
Average costs per Boe:(b) | |||||||||||
Production costs | $ | 15.61 | $ | 16.30 | $ | 18.23 | |||||
General and administrative expense, as adjusted(c) | $ | 0.72 | $ | 1.00 | $ | 1.47 | |||||
Other operating expenses, as adjusted(d) | $ | 0.67 | $ | 0.36 | $ | 0.55 | |||||
Depreciation, depletion and amortization | $ | 10.28 | $ | 16.72 | $ | 20.40 | |||||
Taxes other than on income | $ | 2.36 | $ | 2.67 | $ | 3.50 | |||||
(a) | Natural gas volumes have been converted to Boe based on the equivalence of energy content between six Mcf of natural gas to one Bbl of oil. |
(b) | For 2015 and 2014, the amount excludes asset impairment charges of $4.9 billion and $3.4 billion, respectively. |
(c) | For 2016, the amount excludes unusual and infrequent charges related to severance and early retirement costs associated with field personnel totaling $0.12 per Boe. For 2015, the amount excludes charges of $0.31 per Boe related to early retirement and severance costs. For 2014, the amount excludes charges of $0.10 per Boe related to Spin-off and transition-related costs. |
(d) | For 2016, the amount excludes net unusual and infrequent gains of $0.35 per Boe that include refunds partially offset by plant turnaround charges and other items. For 2015, the amount excludes charges related to the write-down of certain assets and rig termination charges of $1.42 per Boe. For 2014, the amount excludes charges related to rig termination charges and Spin-off and transition-related charges of $0.97 per Boe. |
41
The following table sets forth information regarding production, realized prices and production costs for our largest two fields, Elk Hills and Wilmington, for the years ended December 31, 2016, 2015 and 2014:
Elk Hills | Wilmington | ||||||||||||||||||||||
2016 | 2015 | 2014 | 2016 | 2015 | 2014 | ||||||||||||||||||
Production data: | |||||||||||||||||||||||
Oil (MBbl/d) | 21 | 24 | 25 | 25 | 28 | 25 | |||||||||||||||||
NGLs (MBbl/d) | 13 | 15 | 16 | — | — | — | |||||||||||||||||
Natural gas (MMcf/d)(a) | 106 | 123 | 136 | — | 1 | — | |||||||||||||||||
Average realized prices:(b) | |||||||||||||||||||||||
Oil (MBbl/d) | $ | 44.50 | $ | 52.78 | $ | 97.27 | $ | 37.98 | $ | 45.50 | $ | 90.37 | |||||||||||
NGLs (MBbl/d) | $ | 23.03 | $ | 20.12 | $ | 48.68 | $ | — | $ | — | $ | — | |||||||||||
Natural gas (MMcf/d)(a) | $ | 2.27 | $ | 2.67 | $ | 4.47 | $ | 1.83 | $ | 2.05 | $ | — | |||||||||||
Production costs per Boe(c) | $ | 10.48 | $ | 11.11 | $ | 14.31 | $ | 22.27 | $ | 21.87 | $ | 28.98 | |||||||||||
(a) | Natural gas volumes have been converted to Boe based on the equivalence of energy content between six Mcf of natural gas to one Bbl of oil. |
(b) | Excludes the effect of hedges. |
(c) | Production costs per Boe for Wilmington are higher than the actual cost to run the field due to the effect of PSCs. The reported production cost per Boe is calculated as total production cost for the entire field over our share of production. Using the total field production, the production costs per Boe would be $17.21, $17.74 and $19.94 for 2016, 2015 and 2014 respectively, which more accurately represent the actual cost of operating this field. |
42
The following table sets forth our reserves and production by basin and recovery mechanism:
Total Proved Reserves | Average Net Daily Production(MBoe/d) | |||||||
% of Total Basin | Oil (%) | Year ended December 31, 2016 | ||||||
San Joaquin Basin | ||||||||
Primary Conventional | 14 | % | 68 | % | 15 | |||
Waterfloods | 12 | % | 79 | % | 8 | |||
Steamfloods(a) | 34 | % | 100 | % | 29 | |||
Unconventional | 40 | % | 34 | % | 45 | |||
San Joaquin Basin subtotal(b) | 429 | 67 | % | 97 | ||||
Los Angeles Basin | ||||||||
Primary Conventional | — | 100 | % | — | ||||
Waterfloods | 100 | % | 99 | % | 30 | |||
Steamfloods | — | — | — | |||||
Unconventional | — | — | — | |||||
Los Angeles Basin subtotal(b) | 99 | 99 | % | 30 | ||||
Ventura Basin | ||||||||
Primary Conventional | 28 | % | 76 | % | 3 | |||
Waterfloods | 72 | % | 86 | % | 4 | |||
Steamfloods | — | — | — | |||||
Unconventional | — | — | — | |||||
Ventura Basin subtotal(b) | 29 | 83 | % | 7 | ||||
Sacramento Basin | ||||||||
Primary Conventional | 100 | % | — | 6 | ||||
Sacramento Basin subtotal(b) | 11 | — | 6 | |||||
Total | 568 | 72 | % | 140 | ||||
(a) | Includes reserves and production from gas injection of 14% and 8%, respectively. |
(b) | Subtotal basin reserves in MMBoe. |
43
Productive Wells
Productive wells are those that produce, or are capable of producing, commercial quantities of hydrocarbons, regardless of whether they produce a reasonable rate of return. Net wells represent the sum of fractional interests in wells in which we own an interest. As of December 31, 2016, we had a total of 8,837 gross (7,737 net) producing wells, approximately 90% of which were oil wells. Our average working interest in our producing wells is approximately 88%. Wells are categorized based on the primary product they produce.
The following table sets forth our productive oil and natural gas wells (both producing and capable of production) as of December 31, 2016, excluding wells that have been idle for more than five years:
As of December 31, 2016 | |||||||||||
Productive Oil Wells | Productive Gas Wells | ||||||||||
Gross(a) | Net(b) | Gross(a) | Net(b) | ||||||||
San Joaquin Basin | 8,035 | 6,848 | 184 | 153 | |||||||
Los Angeles Basin | 1,699 | 1,641 | — | — | |||||||
Ventura Basin | 1,204 | 1,197 | — | — | |||||||
Sacramento Basin | — | — | 909 | 832 | |||||||
Total(c) | 10,938 | 9,686 | 1,093 | 985 | |||||||
Multiple completion wells included above | 82 | 71 | 66 | 63 | |||||||
(a) | The total number of wells in which interests are owned. |
(b) | Sum of fractional interests. |
(c) | This total represents both producing and capable of producing wells. As of December 31, 2016, we had 2,957 gross (2,726 net) oil wells and 237 gross (208 net) gas wells that are capable of production but currently not producing. |
Acreage
The following table sets forth certain information regarding the total developed and undeveloped acreage in which we owned an interest as of December 31, 2016, of which approximately 60% is held in fee, 15% is held by production and 25% are term leases.
San Joaquin Basin | Los Angeles Basin | Ventura Basin | Sacramento Basin | Total | ||||||||||
(in thousands) | ||||||||||||||
Developed(a) | ||||||||||||||
Gross(b) | 418 | 25 | 71 | 268 | 782 | |||||||||
Net(c) | 380 | 20 | 69 | 248 | 717 | |||||||||
Undeveloped(d) | ||||||||||||||
Gross(b) | 1,382 | 17 | 229 | 357 | 1,985 | |||||||||
Net(c) | 1,133 | 14 | 192 | 275 | 1,614 | |||||||||
(a) | Acres spaced or assigned to productive wells. |
(b) | Total acres in which we hold an interest. |
(c) | Sum of fractional interests owned based on working interests or interests under arrangements similar to production-sharing contracts. |
(d) | Acres on which wells have not been drilled or completed to a point that would permit the production of commercial quantities of oil and natural gas, regardless of whether the acreage contains proved reserves. |
Work programs are designed to ensure that the exploration potential of any leased property is fully evaluated before expiration. In some instances, we may relinquish leased acreage in advance of the contractual expiration date if the evaluation process is complete and there is no longer a business basis for leasing that acreage. In cases where we determine we want to take the additional time required to fully evaluate acreage, we have generally been successful in obtaining extensions. The combined net acreage covered by leases expiring in the next three years represents approximately 20% of our total net undeveloped acreage at December 31, 2016 and these expirations would not have a material adverse impact on us. Historically, we have not dedicated any significant portion of our capital program to prevent lease expirations and do not expect we will need to do so in the future.
44
Participation in Exploratory and Development Wells Being Drilled
The following table sets forth our participation in exploratory and development wells being drilled as of December 31, 2016.
San Joaquin Basin | Los Angeles Basin | Ventura Basin | Sacramento Basin | Total | ||||||||||
Exploratory and development wells | ||||||||||||||
Gross | 4 | 1 | — | — | 5 | |||||||||
Net | 4 | 1 | — | — | 5 | |||||||||
At December 31, 2016, we were developing two steamfloods and three waterfloods. The steamflood projects were located in the San Joaquin basin. Two waterflood projects were located in the San Joaquin basin and one in the Los Angeles basin.
45
Drilling Activity
The following table describes our drilling activity of net wells for the periods indicated, which represents the sum of fractional interests in wells in which we own an interest. The information should not be considered indicative of future performance, nor should it be assumed that there is necessarily any correlation among the number of productive wells drilled, quantities of reserves found or economic value.
San Joaquin Basin | Los Angeles Basin | Ventura Basin | Sacramento Basin | Total | ||||||||||
2016 | ||||||||||||||
Oil | ||||||||||||||
Exploratory | — | — | — | — | — | |||||||||
Development | 37.0 | 5.4 | — | — | 42.4 | |||||||||
Natural Gas | ||||||||||||||
Exploratory | — | — | — | — | — | |||||||||
Development | — | — | — | — | — | |||||||||
Dry | ||||||||||||||
Exploratory | — | — | — | — | — | |||||||||
Development | — | — | — | — | — | |||||||||
2015 | ||||||||||||||
Oil | ||||||||||||||
Exploratory | 3.0 | — | — | — | 3.0 | |||||||||
Development | 254.0 | 29.1 | — | — | 283.1 | |||||||||
Natural Gas | ||||||||||||||
Exploratory | — | — | — | — | — | |||||||||
Development | — | — | — | — | — | |||||||||
Dry | ||||||||||||||
Exploratory | — | — | — | — | — | |||||||||
Development | — | — | — | — | — | |||||||||
2014 | ||||||||||||||
Oil | ||||||||||||||
Exploratory | 2.0 | — | 1.7 | — | 3.7 | |||||||||
Development | 775.2 | 170.2 | 20.3 | — | 965.7 | |||||||||
Natural Gas | ||||||||||||||
Exploratory | — | — | — | — | — | |||||||||
Development | — | — | — | 3.0 | 3.0 | |||||||||
Dry | ||||||||||||||
Exploratory | 8.0 | — | 2.0 | 1.0 | 11.0 | |||||||||
Development | 2.3 | 0.9 | — | — | 3.2 | |||||||||
Delivery Commitments
We have made short-term commitments to certain refineries and other buyers to deliver oil, natural gas and NGLs. As of December 31, 2016, we had 30- to 90-day oil delivery commitments ranging from 21 MBbls/d to 48 MBbls/d, gas contracts for 2 Bcf of natural gas under 30-day contracts and NGL commitments for 2 MMBbls of NGLs through March 2017. These are index-based contracts with prices set at the time of delivery. We have significantly more production capacity than the amounts committed for oil and natural gas. We have agreements to purchase third-party NGLs for the shortfall between the committed quantities and our production. Further, we have the ability to secure additional volumes for all products if necessary. None of the commitments are expected to have a material impact on our financial statements.
46
Our Infrastructure
We own a network of infrastructure that is integral to and significantly complements our operations. Our significant footprint in California and a wide network of fully owned infrastructure helps connect to third party transportation pipelines, provide competitive advantage and reduce our operating costs. Following is a description of our infrastructure:
Description | Quantity | Unit | Capacity | |||||||
San Joaquin Basin | Other Basins | Total | ||||||||
Gas Plants | 9 | MMcf/d | 590 | 50 | 640 | |||||
Power Plants/Co-generation | 3 | MW | 600 | 50 | 650 | |||||
Steam Generators/Plants | >50 | Mb/d | 220 | — | 220 | |||||
Compressors | 400 | MHP | 300 | 20 | 320 | |||||
Water Disposal Systems | Mbw/d | 2,400 | 2,100 | 4,500 | ||||||
Water Softeners | 30 | Mbw/d | 265 | — | 265 | |||||
Oil and NGL Storage | Mbbls | 580 | 660 | 1,240 | ||||||
Gathering Systems | Miles | >20,000 | ||||||||
Gas Processing
We believe we own the largest gas processing system in the state of California. In the San Joaquin basin, our Elk Hills cryogenic gas plant has a capacity of 200 MMcf/d of wellhead gas bringing our total processing capacity in the basin to over 590 MMcf/d. We also own and operate a system of natural gas processing facilities in the Ventura basin that are capable of processing equity wellhead gas from the surrounding areas. Our natural gas processing facilities are interconnected via pipelines to nearby third-party rail and trucking facilities, with access to certain North American NGL markets. In addition, we have truck rack facilities coupled with a battery of pressurized storage tanks at our Elk Hills natural gas processing facility for NGL sales to third parties.
Electricity
We generate all of our electricity needs for our Elk Hills and contiguous operations in the San Joaquin basin, which utilize approximately a third of the capacity of our wholly owned 550 megawatt combined-cycle power plant located adjacent to our Elk Hills processing facilities, and sell the excess. Our Elk Hills power plant also provides primary steam supply to our cryogenic gas plant. We also operate a 45 megawatt cogeneration facility at Elk Hills that provides additional flexibility and reliability to support field operations. Within our Long Beach operations in the Los Angeles basin, we operate a 48 megawatt power generating facility that provides over 40% of the Long Beach operation’s electricity requirements. All of these facilities are integrated with our operations to improve their reliability and performance while reducing operating costs.
Steam Infrastructure
We own, control and operate all of our steam generation infrastructure in the San Joaquin basin, including steam generators, steam plants, steam distribution systems, steam injection lines and headers, water softeners and water disposal systems. We soften and self-supply water to generate steam, reducing our operating costs. This infrastructure is integral to our operations in San Joaquin basin and supports our high margin and shallow to medium depth oil fields such as Kern Front and Lost Hills.
47
Gathering Systems
We own an extensive network of over 20,000 miles of oil and gas gathering lines. These gathering lines are dedicated almost entirely to collecting our oil and gas production and are in close proximity to field specific facilities such as tank settings or central processing sites. These lines connect our producing wells and facilities to gathering networks, natural gas collection and compression systems, and water and steam processing, injection and distribution systems. Our oil gathering lines connect to multiple third-party transportation pipelines, which increases our flexibility to ship to various parties. In addition, virtually all of our natural gas facilities connect with major third-party natural gas pipeline systems. As a result of these connections, we typically have the ability to access multiple delivery points to improve the prices we obtain for our oil and natural gas production.
Oil and NGL Storage
Our tank storage capacity throughout California gives us the flexibility to store crude oil and NGLs in the event of third-party pipeline maintenance or disruptions. Our network of tank batteries allows us to continue production and avoid or delay any field shutdowns.
ITEM 3 | LEGAL PROCEEDINGS |
For information regarding legal proceedings, see the information under the caption, "Lawsuits, Claims, Commitments and Contingencies" in the MD&A section of this report and in Note 7 of our Financial Statements.
ITEM 4 | MINE SAFETY DISCLOSURES |
Not applicable.
48
EXECUTIVE OFFICERS
Executive officers are appointed annually by the Board of Directors. The following table sets forth our current executive officers:
Name | Positions Held with CRC and Predecessor and Employment History | Age at February 24, 2017 | ||
Todd A. Stevens | President, Chief Executive Officer and Director since 2014; Occidental Vice President - Corporate Development 2012 to 2014; Oxy Oil & Gas Vice President - California Operations 2008 to 2012; Occidental Vice President - Acquisitions and Corporate Finance 2004 to 2012. | 50 | ||
Marshall D. Smith | Senior Executive Vice President and Chief Financial Officer since 2014; Ultra Petroleum Corp. Chief Financial Officer 2005 to 2014; Ultra Petroleum Corp. Senior Vice President 2011 to 2014. | 57 | ||
Robert A. Barnes | Executive Vice President - Operations since 2016; Executive Vice President - Northern Operations 2014 to 2016; Occidental of Elk Hills President and General Manager 2012 to 2014; Oxy Permian CO2 Operations Manager 2011 to 2012, Occidental Argentina Deputy General Manager and Senior Vice President, Operations 2010 to 2011; Occidental Argentina Vice President, Operations 2007 to 2010. | 60 | ||
Shawn M. Kerns | Executive Vice President - Corporate Development since 2014; Vintage Production California President and General Manager 2012 to 2014; Occidental of Elk Hills General Manager 2010 to 2012; Occidental of Elk Hills Asset Development Manager 2008 to 2010. | 46 | ||
Roy Pineci | Executive Vice President - Finance since 2014; Occidental Vice President and Controller 2008 to 2014; Occidental Oil and Gas Senior Vice President 2007 to 2008. | 54 | ||
Michael L. Preston | Executive Vice President, General Counsel and Corporate Secretary since 2014; Occidental Oil and Gas Vice President and General Counsel 2001 to 2014. | 52 | ||
Charles F. Weiss | Executive Vice President - Public Affairs since 2014; Occidental Vice President, Health, Environment and Safety 2007 to 2014. | 53 | ||
Darren Williams | Executive Vice President - Exploration since 2014; Marathon Upstream Gabon Limited President and Africa Exploration Manager 2013 to 2014; Marathon Oil Oklahoma Subsurface Manager 2010 to 2013; Marathon Oil Gulf of Mexico Exploration and Appraisal Manager 2008 to 2010. | 45 | ||
49
PART II
ITEM 5 | MARKET FOR REGISTRANT'S COMMON EQUITY, RELATED STOCKHOLDER MATTERS AND ISSUER PURCHASES OF EQUITY SECURITIES |
Market Information for Common Stock
Our common stock began trading "regular way" on the New York Stock Exchange (NYSE) under the symbol "CRC" on December 1, 2014. Prior to that date there was no public trading market for our common stock. On May 31, 2016, we completed a reverse stock split using a ratio of one share of common stock for every ten shares then outstanding. All share-related information is presented on a split-adjusted basis.
The following schedule sets forth the high and low sales price per share of our common stock as reported on the NYSE for the periods indicated:
Stock Price | |||||||||||||||
2016 | 2015 | ||||||||||||||
High | Low | High | Low | ||||||||||||
First Quarter | $ | 23.30 | $ | 2.81 | $ | 78.68 | $ | 37.50 | |||||||
Second Quarter | $ | 25.50 | $ | 9.20 | $ | 98.65 | $ | 55.90 | |||||||
Third Quarter | $ | 15.18 | $ | 8.79 | $ | 60.50 | $ | 22.60 | |||||||
Fourth Quarter | $ | 21.97 | $ | 9.84 | $ | 51.50 | $ | 17.60 | |||||||
Holders of Record
Our common stock was held by over 22,100 stockholders of record at December 31, 2016.
Dividend Policy
In 2016, no dividends were paid. In 2015, we paid quarterly dividends of $0.10 per share for the first three quarters of the year.
In November 2015, our Board of Directors suspended the payment of any dividends. This decision remains consistent with the Company's broader initiatives to contain costs and strengthen the balance sheet. The payment of future dividends, if any, will be at the discretion of our Board of Directors and will depend upon, among other things, our financial condition, results of operations, capital requirements and development expenditures, future business prospects and any restrictions imposed by future debt instruments. See the "Item 7 – Management's Discussion and Analysis of Financial Condition and Results of Operations – Liquidity and Capital Resources – Credit Facilities" section below for a description of limitations on paying dividends in our credit facilities.
Securities Authorized for Issuance Under Equity Compensation Plans
Our stock-based compensation plans were approved by our sole stockholder prior to the Spin-off. A description of the plans can be found in Note 10 of our Financial Statements. The aggregate number of shares of our common stock authorized for issuance under stock-based compensation plans for our employees and non-employee directors is 5.7 million, of which approximately 3.4 million had been issued through December 31, 2016.
The following is a summary of the securities available for issuance under such plans:
a) | Number of securities to be issued upon exercise of outstanding options, warrants and rights | b) | Weighted-average exercise price of outstanding options, warrants and rights | c) | Number of securities remaining available for future issuance under equity compensation plans (excluding securities in column (a)) | ||
2,240,479 | $69.89 | 2,288,027 (2) | |||||
(1) | Exercise price applies only to approximately 1.1 million options included in column (a) and not to any other awards. |
(2) | Includes 503,348 shares available under our 2014 Employee Stock Purchase Plan (ESPP) at 85% of the lower of the market price at (i) the beginning of a quarter and (ii) the end of a quarter. |
50
Performance Graph
The following graph compares the cumulative total return to stockholders on our common stock relative to the cumulative total returns of the S&P 500 and Dow Jones U.S. Exploration and Production indexes and our peer group (with reinvestment of all dividends). The graph assumes $100 was invested on December 1, 2014, the date our common stock began trading on the NYSE, in our common stock, in each index and in each of the peer group companies' common stock weighted by their relative market values within the peer group, and that all dividends were reinvested. The returns shown are based on historical results and are not intended to suggest future performance.
Our peer group consists of Cabot Oil and Gas Corporation, Cimarex Energy Co., Concho Resources Inc., Denbury Resources Inc, Energen Corporation, EP Energy Corporation, Murphy Oil Corporation, Newfield Exploration Company, Noble Energy, Inc., Oasis Petroleum Corporation, Parsley Energy, Inc., Pioneer Natural Resources Company, QEP Resources, Inc., Range Resources Corporation, SM Energy Company, Whiting Petroleum Corporation and WPX Energy, Inc.
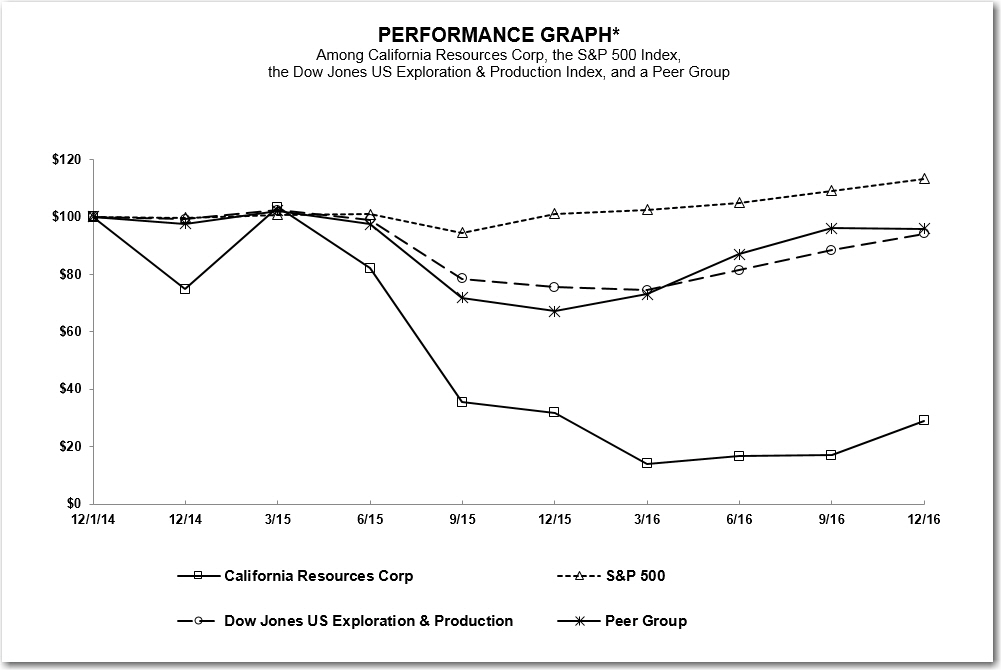
12/1/14 | 12/31/14 | 3/31/15 | 6/30/15 | 9/30/15 | 12/31/15 | 3/31/16 | 6/30/16 | 9/30/16 | 12/31/16 | |||||||||||||||||||||||||||||||
California Resources Corp | $ | 100 | $ | 75 | $ | 103 | $ | 82 | $ | 35 | $ | 32 | $ | 14 | $ | 17 | $ | 17 | $ | 29 | ||||||||||||||||||||
S&P 500 | 100 | 100 | 101 | 101 | 94 | 101 | 102 | 105 | 109 | 113 | ||||||||||||||||||||||||||||||
Dow Jones US Exploration & Production | 100 | 99 | 102 | 99 | 79 | 76 | 74 | 81 | 88 | 94 | ||||||||||||||||||||||||||||||
Peer Group | 100 | 98 | 102 | 97 | 72 | 67 | 73 | 87 | 96 | 96 | ||||||||||||||||||||||||||||||
* This performance graph shall not be deemed “soliciting material” or to be “filed” with the SEC for purposes of Section 18 of the Securities Exchange Act of 1934, as amended (Exchange Act), or otherwise subject to the liabilities under that Section, and shall not be deemed to be incorporated by reference into any filing of CRC under the Securities Act of 1933, as amended, or the Exchange Act except to the extent that we specifically request it be treated as soliciting material or specifically incorporate it by reference.
51
ITEM 6 | SELECTED FINANCIAL DATA |
Prior to the Spin-off on November 30, 2014, financial data was derived from the California business of Occidental. All financial information presented after the Spin-off represents our stand-alone consolidated results of operations, financial position and cash flows. Accordingly:
• | The selected statement of operations and cash flows data for the years ended December 31, 2016 and 2015 consist of our stand-alone consolidated results post Spin-off. For the year ended December 31, 2014 the statement of operations and cash flows data includes the consolidated results for the month ended December 31, 2014 and the combined results of the California business prior to the Spin-off. The selected statement of operations data for the years ended December 31, 2013 and 2012 consists entirely of the combined results of the California business. |
• | The selected balance sheet data at December 31, 2016, 2015 and 2014 consists of our stand-alone consolidated balances, while the selected balance sheet data at December 31, 2013 and 2012 consists of the combined balances of the California business. |
All share-related information is presented on a split-adjusted basis.
Year Ended December 31, | |||||||||||||||||||
2016 | 2015 | 2014 | 2013 | 2012 | |||||||||||||||
(in millions, except for per share data) | |||||||||||||||||||
Statement of Operations Data | |||||||||||||||||||
Revenues | $ | 1,547 | $ | 2,403 | $ | 4,173 | $ | 4,284 | $ | 4,073 | |||||||||
Income (loss) before income taxes | $ | 201 | $ | (5,476 | ) | $ | (2,421 | ) | $ | 1,447 | $ | 1,181 | |||||||
Net income (loss) | $ | 279 | $ | (3,554 | ) | $ | (1,434 | ) | $ | 869 | $ | 699 | |||||||
Per common share | |||||||||||||||||||
Basic | $ | 6.76 | $ | (92.79 | ) | $ | (37.54 | ) | $ | 22.38 | $ | 18.01 | |||||||
Diluted | $ | 6.76 | $ | (92.79 | ) | $ | (37.54 | ) | $ | 22.38 | $ | 18.01 | |||||||
Statement of Cash Flows Data | |||||||||||||||||||
Net cash provided by operating activities | $ | 130 | $ | 403 | $ | 2,371 | $ | 2,476 | $ | 2,223 | |||||||||
Capital investments | $ | (75 | ) | $ | (401 | ) | $ | (2,089 | ) | $ | (1,669 | ) | $ | (2,331 | ) | ||||
Acquisitions | $ | — | $ | (141 | ) | $ | (288 | ) | $ | (48 | ) | $ | (427 | ) | |||||
Net (repayments) borrowings and related costs | $ | (73 | ) | $ | 356 | $ | 6,290 | $ | — | $ | — | ||||||||
Spin-off related dividends to Occidental | $ | — | $ | — | $ | (6,000 | ) | $ | — | $ | — | ||||||||
(Distributions to) contributions from Occidental, net | $ | — | $ | — | $ | (335 | ) | $ | (763 | ) | $ | 532 | |||||||
Dividends per Common Share | $ | — | $ | 0.30 | $ | — | $ | — | $ | — | |||||||||
As of December 31, | |||||||||||||||||||
2016 | 2015 | 2014 | 2013 | 2012 | |||||||||||||||
(in millions) | |||||||||||||||||||
Balance Sheet Data | |||||||||||||||||||
Total current assets | $ | 425 | $ | 438 | $ | 701 | $ | 254 | $ | 245 | |||||||||
Property, plant and equipment, net | $ | 5,885 | $ | 6,312 | $ | 11,685 | $ | 14,008 | $ | 13,499 | |||||||||
Total assets | $ | 6,354 | $ | 7,053 | $ | 12,429 | $ | 14,297 | $ | 13,764 | |||||||||
Current maturities of long-term debt | $ | 100 | $ | 100 | $ | — | $ | — | $ | — | |||||||||
Total current liabilities | $ | 726 | $ | 605 | $ | 922 | $ | 689 | $ | 551 | |||||||||
Long-term debt - principal amount | $ | 5,168 | $ | 6,043 | $ | 6,360 | $ | — | $ | — | |||||||||
Deferred gain and issuance costs, net | $ | 397 | $ | 491 | $ | (68 | ) | $ | — | $ | — | ||||||||
Other long-term liabilities | $ | 620 | $ | 830 | $ | 549 | $ | 497 | $ | 511 | |||||||||
Equity | $ | (557 | ) | $ | (916 | ) | $ | 2,611 | $ | 9,989 | $ | 9,860 | |||||||
The selected financial data presented above should be read in conjunction with "Item 7 – Management's Discussion and Analysis of Financial Condition and Results of Operations" and the consolidated and combined financial statements and accompanying notes included elsewhere in this Form 10-K.
52
ITEM 7 | MANAGEMENT'S DISCUSSION AND ANALYSIS OF FINANCIAL CONDITION AND RESULTS OF OPERATIONS |
Except when the context otherwise requires or where otherwise indicated, (1) all references to ‘‘CRC,’’ the ‘‘Company,’’ ‘‘we,’’ ‘‘us’’ and ‘‘our’’ refer to California Resources Corporation and its subsidiaries or the California business, (2) all references to the ‘‘California business’’ refer to Occidental’s California oil and gas exploration and production operations and related assets, liabilities and obligations, which we have assumed in connection with the Spin-off, and (3) all references to ‘‘Occidental’’ refer to Occidental Petroleum Corporation, our former parent, and its subsidiaries.
The Separation and Spin-off
We are an independent oil and natural gas exploration and production company operating properties within the state of California. We were incorporated in Delaware as a wholly owned subsidiary of Occidental Petroleum Corporation (Occidental) on April 23, 2014, and remained a wholly owned subsidiary of Occidental until November 30, 2014. Prior to November 30, 2014, all material existing assets, operations and liabilities of Occidental's California business were consolidated under us. On November 30, 2014, Occidental distributed shares of our common stock on a pro-rata basis to Occidental stockholders and we became an independent, publicly traded company (the Spin-off). Occidental initially retained approximately 18.5% of our outstanding shares of common stock, which it distributed to Occidental stockholders on March 24, 2016.
Basis of Presentation and Certain Factors Affecting Comparability
Until the Spin-off, the accompanying financial statements were derived from the consolidated financial statements and accounting records of Occidental and were presented on a combined basis for the pre-Spin-off periods. These financial statements reflect the historical results of operations, financial position and cash flows of the California business. All financial information presented after the Spin-off consists of our stand-alone consolidated results of operations, financial position and cash flows. We account for our share of oil and gas exploration and production ventures, in which we have a direct working interest, by reporting our proportionate share of assets, liabilities, revenues, costs and cash flows within the relevant lines on the balance sheets and statements of operations and cash flows.
The statements of operations for periods prior to the Spin-off include expense allocations for certain corporate functions and centrally-located activities historically performed by Occidental. These functions include executive oversight, accounting, treasury, tax, financial reporting, finance, internal audit, legal, risk management, information technology, government relations, public relations, investor relations, human resources, procurement, engineering, drilling, exploration, marketing, ethics and compliance, and certain other shared services. These allocations were based primarily on specific identification of time or activities associated with us, employee headcount or our relative size compared to Occidental. Our management believes the assumptions underlying the financial statements, including the assumptions regarding allocating expenses from Occidental, are reasonable. However, the financial statements for the pre-Spin-off periods may not include all of the actual expenses that would have been incurred, may include duplicative costs and may not reflect our results of operations, financial position and cash flows had we operated as a stand-alone public company during the periods presented. Actual costs that would have been incurred if we had been a stand-alone company prior to the Spin-off would depend on multiple factors, including organizational structure and strategic and operating decisions.
Prior to the Spin-off, we participated in Occidental’s centralized treasury management program and did not incur any debt. Excess cash generated by our business was distributed to Occidental, and likewise our cash needs were provided by Occidental in the form of contributions.
Had we been a stand-alone company for the full year 2014, and had the same level of debt throughout the year as we did on December 31, 2014, of approximately $6.4 billion, we would have incurred $314 million of interest expense, on a pro-forma basis, for the year ended December 31, 2014, compared to the $72 million pre-tax interest expense reported in our statement of operations for the year then ended.
On May 31, 2016 we completed a reverse stock split using a ratio of one share of common stock for every ten shares then outstanding. Share and per share amounts included in this report have been restated for all periods presented to reflect this stock split.
53
Business Environment and Industry Outlook
Our operating results and those of the oil and gas industry as a whole are heavily influenced by commodity prices. Oil and gas prices and differentials may fluctuate significantly, generally as a result of changes in supply and demand and other market-related variables. These and other factors make it impossible to predict realized prices reliably. Much of the global exploration and production industry has been challenged at recent price levels, putting pressure on the industry's ability to generate positive cash flow and access capital. Average oil prices continued the decline that began in the last half of 2014 into the first quarter of 2016. In mid-2016, global oil prices began to recover from the apparent low point of this commodity cycle. The recovery further strengthened following the production cuts announced at the November 2016 meeting of the Organization of the Petroleum Exporting Countries (OPEC). While global oil prices improved modestly through the end of 2016 and began to trade in a narrower range, daily average prices were still lower for the full year of 2016 compared to 2015.
Natural gas liquids (NGLs) prices improved relative to crude oil prices throughout 2016 due to tighter supplies, the strength of industry exports and higher contract prices on natural gasoline.
Full year average natural gas prices were lower in 2016 than in 2015. However, prices rebounded modestly in the second half of the year due to lower production, higher demand and warmer weather. California natural gas differentials for the second half of the year also improved due to reduced storage in the state following a third-party facility incident that occurred in late 2015.
The following table presents the average daily Brent oil, WTI oil and NYMEX gas prices for each of the years ended December 31, 2016, 2015 and 2014:
2016 | 2015 | 2014 | |||||||||
Brent oil ($/Bbl) | $ | 45.04 | $ | 53.64 | $ | 99.51 | |||||
WTI oil ($/Bbl) | $ | 43.32 | $ | 48.80 | $ | 93.00 | |||||
NYMEX gas ($/MMBtu) | $ | 2.42 | $ | 2.75 | $ | 4.34 | |||||
Oil prices and differentials will continue to be affected by a variety of factors, including consumption patterns, inventory levels, global and local economic conditions, the actions of OPEC and other significant producers and governments, actual or threatened production and refining disruptions, currency exchange rates, worldwide drilling and exploration activities, the effects of conservation, weather, geophysical and technical limitations, refining and processing disruptions, transportation bottlenecks and other matters affecting the supply and demand dynamics for oil, technological advances, regional market conditions, transportation capacity and costs in producing areas and the effect of changes in these variables on market perceptions.
We currently sell all of our crude oil into the California refining markets, which we believe have offered relatively favorable pricing compared to other U.S. regions for similar grades. California is heavily reliant on imported sources of energy, with approximately 65% of the oil consumed in recent years imported from outside the state. A vast majority of the imported oil arrives via supertanker, mostly from foreign locations. As a result, California refiners have typically purchased crude oil at international waterborne-based prices. We believe that the limited crude transportation infrastructure from other parts of the country to California will continue to contribute to higher realizations than most other U.S. oil markets for comparable grades. We also opportunistically consider foreign markets to improve our margins.
Prices and differentials for NGLs are related to the supply and demand for the products making up these liquids. Some of them more typically correlate to the price of oil while others are affected by natural gas prices as well as the demand for certain chemical products for which they are used as feedstock. In addition, infrastructure constraints magnify pricing volatility.
Natural gas prices and differentials are strongly affected by local market fundamentals, as well as availability of transportation capacity from producing areas. Capacity influences prices because California imports about 90% of its natural gas from other parts of the U.S. As a result, we typically enjoy favorable pricing since we can deliver our gas for much lower transportation costs. Due to much lower levels of natural gas production compared to our oil production, the changes in natural gas prices have a smaller impact on our operating results.
54
Higher natural gas prices have a net positive effect on our operating results. In addition to selling natural gas, we also use gas for our steamfloods and power generation. As a result, the positive impact of higher prices is partially offset by higher operating costs. Conversely, lower natural gas prices generally have a net negative effect on our operations, but lower the cost of our steamflood projects and power generation.
Our earnings are also affected by the performance of our processing and power generation assets. We process our wet gas to extract NGLs and other natural gas byproducts. We then deliver dry gas to pipelines and separately sell the NGLs. The efficiency with which we extract liquids from the wet gas stream affects our operating results. Additionally, we provide part of the electricity from our Elk Hills power plant to reduce operating costs to Elk Hills and nearby fields and increase reliability. The remaining electricity is sold to the grid and a utility under a contract that includes a capacity charge. The price we obtain for our excess power impacts our earnings but generally by an insignificant amount.
We opportunistically seek strategic hedging transactions to protect our cash flows, margins and capital investment programs from the cyclical nature of commodity prices and to improve our ability to comply with the covenants under our credit facilities. We can give no assurances that our hedges will be adequate to accomplish our objectives. Unless otherwise indicated, we use the term "hedge" to describe derivative instruments that are designed to achieve our hedging program goals, even though they are not necessarily accounted for as cash-flow or fair-value hedges.
We respond to economic conditions by adjusting the size and allocation of our capital program, aligning the size of our workforce with our level of activity, continuing to improve efficiencies and finding cost savings. The reductions in our capital program over the past two years negatively impacted our production levels. Sustained low-prices may materially affect the quantities of oil and gas reserves we can economically produce over the longer term.
Seasonality
While certain aspects of our operations are affected by seasonal factors, such as electricity costs, overall, seasonality is not a material driver of changes in our quarterly earnings during the year.
Income Taxes
The following table sets forth our before- and after-tax income (loss) and income tax amounts:
For the years ended December 31, | |||||||||||
2016 | 2015 | 2014 | |||||||||
(in millions) | |||||||||||
Pre-tax income (loss) | $ | 201 | $ | (5,476 | ) | $ | (2,421 | ) | |||
Income tax benefit | 78 | 1,922 | 987 | ||||||||
Net income (loss) | $ | 279 | $ | (3,554 | ) | $ | (1,434 | ) | |||
We did not make United States federal and state income tax payments in 2016 and 2015 due to the taxable losses we incurred. Until the Spin-off, our share of Occidental's tax payments or refunds were paid or received, as applicable, by Occidental. During the year ended December 31, 2014, Occidental paid approximately $165 million on our behalf.
55
The following reconciliation of the United States federal statutory income tax rate to our effective tax rate is stated as a percentage of pre-tax income or loss:
For the years ended December 31, | ||||||||
2016 | 2015 | 2014 | ||||||
United States federal statutory tax rate | 35 | % | 35 | % | 35 | % | ||
State income taxes, net of federal | 6 | 5 | 6 | |||||
Valuation allowance | 199 | (7 | ) | — | ||||
Cancellation of debt income | (288 | ) | — | — | ||||
Stock-based compensation | 3 | — | — | |||||
Federal effect of state taxes on above items | 5 | 2 | — | |||||
Other | 1 | — | — | |||||
Effective tax rate | (39 | )% | 35 | % | 41 | % | ||
Federal and state valuation allowance
In the first quarter of 2016, we reduced our valuation allowance against net deferred tax assets by $82 million. During the course of the year, we also increased the valuation allowance by $480 million. The resulting $398 million increase in the valuation allowance had the effect of increasing our effective tax rate by 199%.
The first quarter 2016 reduction in the valuation allowance resulted from our evaluation in early 2016 of our assets and liabilities at the time of our fourth quarter 2015 debt exchange, which generated $1.4 billion of cancellation of debt income (CODI) for tax purposes. At that date, our evaluation indicated that our liabilities exceeded the value of our assets, both calculated in accordance with tax rules, enabling us to move the liability related to CODI to deferred tax liabilities. The resulting increase of our deferred tax liabilities that could be offset against assets caused an $82 million reduction in the valuation allowance.
During the course of the year, based on prevailing product prices, we concluded that we could not realize, on a more-likely-than-not basis, any of the deferred tax assets being generated through operating losses. Accordingly, we provided full allowances against such assets generated during the year by the amount of $480 million.
We evaluate our deferred tax assets to determine if a valuation allowance is required to reduce our gross deferred tax assets to an amount expected to be realized. We expect to realize $375 million of our gross deferred tax assets through reversals of taxable temporary differences. We have maintained a full valuation allowance on our deferred tax assets above this amount as there is not sufficient evidence to support the reversal of any portion of this allowance. Given our recent and anticipated future earnings trends, we do not believe any of the valuation allowance will be released within the next 12 months. The amount of the deferred tax assets considered realizable could however be adjusted if estimates or amounts of deferred tax liabilities change.
Federal and state cancellation of debt income
As a result of our 2015 and 2016 debt transactions and modifications, we generated CODI of $1.4 billion and $1.3 billion, respectively ($2.7 billion in the aggregate), for both U.S. federal and California state tax purposes. These respective amounts were excluded from taxable income in those years because we determined that our liabilities exceeded the value of our assets for tax purposes immediately prior to each of the transactions. In exchange for this exclusion, tax rules require us to reduce the tax basis of our assets. Accordingly, we reduced our net operating losses and the basis of property, plant and equipment by $1.2 billion for U.S. federal and $1.9 billion for California. We were not required to make any further reductions in those assets because, beyond this point, our liabilities would have exceeded the tax basis of our assets. Accordingly, any tax liability attributable to the remaining approximately $1.5 billion of federal and $800 million of California CODI was relieved without any future tax liability. As a result, we recorded a benefit of $577 million for this permanent reduction of tax liability, which reduced our effective tax rate by 288%.
56
Operations
We conduct our operations, in large part, through fee interests, land leases and other contractual arrangements. We believe we are the largest private oil and natural gas mineral acreage holder in California, with interests in approximately 2.3 million net acres, approximately 60% of which we hold in fee. Our oil and gas leases have a primary term ranging from one to ten years, which is extended through the end of production once it commences. We also own a network of strategically placed infrastructure that is integrated with, and complementary to, our operations, including gas plants, oil and gas gathering systems, a power plant and other related assets, to maximize the value generated from our production.
Our share of production and reserves from operations in the Wilmington field is subject to contractual arrangements similar to production-sharing contracts (PSCs) that are in effect through the economic life of the assets. Under such contracts we are obligated to fund all capital and production costs. We record a share of production and reserves to recover a portion of such capital and production costs and an additional share for profit. Our portion of the production represents volumes: (1) to recover our partners’ share of capital and production costs that we incur on their behalf, (2) for our share of contractually defined base production and (3) for our share of production in excess of contractually defined base production for each period. We realize our share of capital and production costs, and generate returns, through our defined share of production from (2) and (3) above. These contracts do not transfer any right of ownership to us and reserves reported from these arrangements are based on our economic interest as defined in the contracts. Our share of production and reserves from these contracts decreases when product prices rise and increases when prices decline assuming comparable capital investment and production costs; however, our net economic benefit is greater when product prices are higher. The contracts represented slightly less than 20% of our production for the year ended December 31, 2016. In September 2016, the PSC representing the majority of the field production adjusted to eliminate the base production sharing split. Our share of the base production was smaller than our share of excess production. Accordingly, we now receive a modestly larger share of total field production after cost recovery.
Financial and Operating Results
2016 compared to 2015
• | Realized crude oil prices, including the effect of cash received from settled hedges, decreased 15% from $49.19 to $42.01 per barrel. |
• | Reduced capital investment by 81% from $401 million in 2015 to $75 million in 2016. |
• | Average daily oil and gas production volumes decreased 12.5% from 160,000 to 140,000 Boe. |
• | Production costs decreased 16% from $951 million to $800 million. |
• | General and administrative expenses decreased 30% from $354 million to $248 million, and adjusted general and administrative expenses decreased 20%. |
• | In 2016, net income of $279 million included a net gain of $805 million on early extinguishment of debt and $283 million of non-cash derivative losses. |
• | Adjusted net loss increased 2% from $311 million to $317 million. |
2015 compared to 2014
• | Realized crude oil prices, including the effect of cash received from settled hedges, decreased 47% from $92.30 to $49.19 per barrel. |
• | Reduced capital investment by 81% from $2,089 million in 2014 to $401 million in 2015. |
• | Average daily oil and gas production volumes increased 1% from 159,000 to 160,000 Boe. |
• | Production costs decreased 10% from $1,057 million to $951 million. |
• | General and administrative expenses increased 17% from $302 million to $354 million, and adjusted general and administrative expenses decreased 2%. |
• | In 2015, net loss of $3.6 billion included after-tax asset impairments of $2.9 billion. |
• | Adjusted net income decreased from income of $650 million to a loss of $311 million. |
57
The table below reconciles net income (loss) to adjusted net income (loss) and presents net and adjusted net income (loss) per diluted share:
2016 | 2015 | 2014 | |||||||||
(in millions, except share data) | |||||||||||
Net income (loss) | $ | 279 | $ | (3,554 | ) | $ | (1,434 | ) | |||
Unusual and infrequent items: | |||||||||||
Non-cash derivative losses (gains) | 283 | (52 | ) | — | |||||||
Severance, early retirement and other costs | 20 | 67 | — | ||||||||
Net gains on early extinguishment of debt | (805 | ) | (20 | ) | — | ||||||
Gain from asset divestitures | (30 | ) | — | — | |||||||
Refunds, plant turnaround charges and other | (13 | ) | 11 | 52 | |||||||
Debt issuance costs | — | 28 | — | ||||||||
Asset impairments | — | 4,852 | 3,402 | ||||||||
Write-down of certain assets | — | 71 | — | ||||||||
Spin-off and transition-related costs | — | — | 55 | ||||||||
Adjusted income (loss) items before interest and taxes | (545 | ) | 4,957 | 3,509 | |||||||
Deferred debt issuance costs write-off | 12 | — | — | ||||||||
Reversal of valuation allowance for deferred tax assets(a) | (63 | ) | 294 | — | |||||||
Tax effects of these items | — | (2,008 | ) | (1,425 | ) | ||||||
Total | (596 | ) | 3,243 | 2,084 | |||||||
Adjusted net (loss) income | $ | (317 | ) | $ | (311 | ) | $ | 650 | |||
Net income (loss) per diluted share | $ | 6.76 | $ | (92.79 | ) | $ | (37.54 | ) | |||
Adjusted net (loss) income per diluted share | $ | (7.85 | ) | $ | (8.12 | ) | $ | 16.73 | |||
(a) Amount represents the out-of-period portion of the valuation allowance reversal.
The following table presents the components of our net derivative losses (gains):
2016 | 2015 | 2014 | |||||||||
(in millions) | |||||||||||
Non-cash derivative losses (gains) | $ | 283 | $ | (52 | ) | $ | 3 | ||||
Net (proceeds) payments from settled derivatives | (77 | ) | (81 | ) | 2 | ||||||
Net derivative losses (gains) | $ | 206 | $ | (133 | ) | $ | 5 | ||||
The following table presents the reconciliation of our company-wide general and administrative expenses to adjusted general and administrative expenses:
2016 | 2015 | 2014 | |||||||||
(in millions) | |||||||||||
General and administrative expenses | $ | 248 | $ | 354 | $ | 302 | |||||
Severance, early retirement and other costs | (20 | ) | (67 | ) | (10 | ) | |||||
Adjusted general and administrative expenses | $ | 228 | $ | 287 | $ | 292 | |||||
Our results of operations can include the effects of unusual and infrequent transactions and events affecting earnings that vary widely and unpredictably in nature, timing, amount and frequency. Therefore, management uses measures called adjusted net income (loss) and adjusted general and administrative expenses, both of which exclude those items. These measures are not meant to disassociate items from management's performance, but rather are meant to provide useful information to investors interested in comparing our performance between periods. Reported earnings are considered representative of management's performance over the long term. Adjusted net income (loss) and adjusted general and administrative expenses are not considered to be alternatives to net income (loss) or general and administrative expenses, respectively, reported in accordance with U.S. generally accepted accounting principles (GAAP).
58
The following table sets forth the average realized prices for our products:
2016 | 2015 | 2014 | |||||||||
Oil prices with hedge ($ per Bbl) | $ | 42.01 | $ | 49.19 | $ | 92.30 | |||||
Oil prices without hedge ($ per Bbl) | $ | 39.72 | $ | 47.15 | $ | 92.30 | |||||
NGLs prices ($ per Bbl) | $ | 22.39 | $ | 19.62 | $ | 47.84 | |||||
Gas prices with hedge ($ per Mcf) | $ | 2.28 | $ | 2.66 | $ | 4.39 | |||||
The following table presents our average realized prices as a percentage of Brent, WTI and NYMEX for each of the three years in the period ended December 31, 2016:
2016 | 2015 | 2014 | ||||||
Oil with hedge as a percentage of Brent | 93 | % | 92 | % | 93 | % | ||
Oil without hedge as a percentage of Brent | 88 | % | 88 | % | 93 | % | ||
Oil without hedge as a percentage of WTI | 92 | % | 97 | % | 99 | % | ||
Gas with hedge as a percentage of NYMEX | 94 | % | 97 | % | 101 | % | ||
59
The following table sets forth our average production volumes of oil, NGLs and natural gas per day for each of the three years in the period ended December 31, 2016:
2016 | 2015 | 2014 | ||||||
Oil (MBbl/d) | ||||||||
San Joaquin Basin | 57 | 64 | 64 | |||||
Los Angeles Basin | 29 | 34 | 29 | |||||
Ventura Basin | 5 | 6 | 6 | |||||
Sacramento Basin | — | — | — | |||||
Total | 91 | 104 | 99 | |||||
NGLs (MBbl/d) | ||||||||
San Joaquin Basin | 15 | 17 | 18 | |||||
Los Angeles Basin | — | — | — | |||||
Ventura Basin | 1 | 1 | 1 | |||||
Sacramento Basin | — | — | — | |||||
Total | 16 | 18 | 19 | |||||
Natural gas (MMcf/d) | ||||||||
San Joaquin Basin | 150 | 172 | 180 | |||||
Los Angeles Basin | 3 | 2 | 1 | |||||
Ventura Basin | 8 | 11 | 11 | |||||
Sacramento Basin | 36 | 44 | 54 | |||||
Total | 197 | 229 | 246 | |||||
Total Production (MBoe/d)(a) | 140 | 160 | 159 | |||||
Note: MBbl/d refers to thousands of barrels per day; MMcf/d refers to millions of cubic feet per day; MBoe/d refers to thousands of barrels of oil equivalent per day.
(a) | Natural gas volumes have been converted to Boe based on the equivalence of energy content between six Mcf of natural gas and one barrel of oil. Barrels of oil equivalence does not necessarily result in price equivalence. The price of natural gas on a barrel of oil equivalent basis is currently substantially lower than the corresponding price for oil and has been similarly lower for a number of years. For example, for the year ended December 31, 2016, the average prices of Brent oil and NYMEX natural gas were $45.04 per barrel and $2.42 per MMBtu, respectively, resulting in an oil-to-gas price ratio of approximately 19 to 1. |
60
Balance Sheet Analysis
The changes in our balance sheet as of December 31, 2016 and 2015, are discussed below:
2016 | 2015 | ||||||
(in millions) | |||||||
Cash and cash equivalents | $ | 12 | $ | 12 | |||
Trade receivables, net | $ | 232 | $ | 200 | |||
Inventories | $ | 58 | $ | 58 | |||
Other current assets | $ | 123 | $ | 168 | |||
Property, plant and equipment, net | $ | 5,885 | $ | 6,312 | |||
Other assets | $ | 44 | $ | 303 | |||
Current maturities of long-term debt | $ | 100 | $ | 100 | |||
Accounts payable | $ | 219 | $ | 257 | |||
Accrued liabilities | $ | 407 | $ | 222 | |||
Current income taxes | $ | — | $ | 26 | |||
Long-term debt - principal amount | $ | 5,168 | $ | 6,043 | |||
Deferred gain and financing costs, net | $ | 397 | $ | 491 | |||
Other long-term liabilities | $ | 620 | $ | 830 | |||
Equity | $ | (557 | ) | $ | (916 | ) | |
See "Liquidity and Capital Resources" for discussion of changes in our cash and cash equivalents.
The increase in trade receivables was largely the result of higher year-end prices partially offset by lower production volumes in 2016 compared to 2015. The decrease in other current assets was mainly due to a reduction in the net value of our derivative assets. The decrease in property, plant and equipment reflected depreciation, depletion and amortization (DD&A) for the period and a small non-core asset sale, partially offset by capital investments. The decrease in other assets was primarily due to the changes in deferred taxes in the first quarter of 2016 as previously discussed in the "Income Taxes" section above.
The decrease in accounts payable reflected lower capital investments towards the end of 2016 compared to 2015. The increase in accrued liabilities was primarily due to higher greenhouse gas liabilities as well as the higher fair value of outstanding derivatives. Current income taxes and other long-term liabilities as of December 31, 2015 included $336 million in tax liabilities that have subsequently been reclassified to deferred taxes. The other long-term liabilities also reflected higher derivative liabilities, primarily due to non-cash mark-to-market effects and higher asset retirement obligations. The decrease in long-term debt reflected the notes tender offer, repurchases and exchanges of a portion of our unsecured notes and prepayment of part of our first-lien, first-out term loan, partially offset by the issuance of a first-lien, second-out term loan credit facility. The decrease in deferred gain and issuance costs, net, reflected the amortization of deferred gains and additional deferred debt issuance costs on the new term loan, partially offset by the amortization and write-off of existing deferred issuance costs. The increase in equity primarily reflected the net income for the period, as well as the issuances of equity in exchange for debt and the amortization of employee stock awards.
61
Statement of Operations Analysis
The following table presents the results of our operations, including the unusual and infrequent items discussed in the "Financial and Operating Results" section above:
2016 | 2015 | 2014 | |||||||||
(in millions) | |||||||||||
Oil and gas net sales(a) | $ | 1,621 | $ | 2,134 | $ | 4,064 | |||||
Net derivative (losses) gains(b) | (206 | ) | 133 | (5 | ) | ||||||
Other revenue | 132 | 136 | 114 | ||||||||
Production costs | (800 | ) | (951 | ) | (1,057 | ) | |||||
General and administrative expenses | (248 | ) | (354 | ) | (302 | ) | |||||
Depreciation, depletion and amortization | (559 | ) | (1,004 | ) | (1,198 | ) | |||||
Asset impairments | — | (4,852 | ) | (3,402 | ) | ||||||
Taxes other than on income | (144 | ) | (180 | ) | (217 | ) | |||||
Exploration expense | (23 | ) | (36 | ) | (139 | ) | |||||
Other expenses, net | (79 | ) | (168 | ) | (207 | ) | |||||
Interest and debt expense, net | (328 | ) | (326 | ) | (72 | ) | |||||
Net gains on early extinguishment of debt | 805 | 20 | — | ||||||||
Other non-operating income (expense) | 30 | (28 | ) | — | |||||||
Income tax benefit | 78 | 1,922 | 987 | ||||||||
Net income (loss) | $ | 279 | $ | (3,554 | ) | $ | (1,434 | ) | |||
Adjusted net (loss) income(c) | $ | (317 | ) | $ | (311 | ) | $ | 650 | |||
Adjusted EBITDAX(d) | $ | 616 | $ | 906 | $ | 2,548 | |||||
Effective tax rate | (39 | )% | 35 | % | 41 | % | |||||
(a) | Includes related-party sales for 2014. |
(b) | Amounts are net of (proceeds) payments from settled derivatives of $(77) million, $(81) million and $2 million, in 2016, 2015 and 2014, respectively. |
(c) | See "Financial and Operating Results" above for our Non-GAAP reconciliation. |
(d) | We define adjusted EBITDAX as earnings before interest expense; income taxes; depreciation, depletion and amortization; exploration expense; and other unusual and infrequent items. Our management believes adjusted EBITDAX provides useful information in assessing our financial condition, results of operations and cash flows and is widely used by the industry, the investment community and our lenders. While adjusted EBITDAX is a non-GAAP measure, the amounts included in the calculation of adjusted EBITDAX were computed in accordance with GAAP. This measure is a material component of certain of our financial covenants under our first-lien, first-out credit facilities and is provided in addition to, and not as an alternative for, income and liquidity measures calculated in accordance with GAAP. Certain items excluded from adjusted EBITDAX are significant components in understanding and assessing our financial performance, such as our cost of capital and tax structure, as well as the historic cost of depreciable and depletable assets. Adjusted EBITDAX should be read in conjunction with the information contained in our financial statements prepared in accordance with GAAP. |
62
The following table presents a reconciliation of the GAAP financial measure of net income (loss) to the non-GAAP financial measure of adjusted EBITDAX:
2016 | 2015 | 2014 | |||||||||
(in millions) | |||||||||||
Net income (loss) | $ | 279 | $ | (3,554 | ) | $ | (1,434 | ) | |||
Interest and debt expense | 328 | 326 | 72 | ||||||||
Income tax benefit | (78 | ) | (1,922 | ) | (987 | ) | |||||
Depreciation, depletion and amortization | 559 | 1,004 | 1,198 | ||||||||
Exploration expense | 23 | 36 | 139 | ||||||||
Adjusted income items before interest and taxes(a) | (545 | ) | 4,957 | 3,509 | |||||||
Other non-cash items | 50 | 59 | 51 | ||||||||
Adjusted EBITDAX | $ | 616 | $ | 906 | $ | 2,548 | |||||
(a) | See "Financial and Operating Results" for a table which includes items reconciling net income (loss) to adjusted net income (loss). |
The following represents key metrics of our oil and gas operations, excluding certain corporate items and asset impairments, on a per Boe basis for the years ended December 31, 2016, 2015 and 2014:
2016 | 2015 | 2014 | |||||||||
Production costs | $ | 15.61 | $ | 16.30 | $ | 18.23 | |||||
General and administrative expense, as adjusted(a) | $ | 0.72 | $ | 1.00 | $ | 1.47 | |||||
Other operating expenses, as adjusted(b) | $ | 0.67 | $ | 0.36 | $ | 0.55 | |||||
Depreciation, depletion and amortization | $ | 10.28 | $ | 16.72 | $ | 20.40 | |||||
Taxes other than on income | $ | 2.36 | $ | 2.67 | $ | 3.50 | |||||
(a) | For 2016, the amount excludes unusual and infrequent charges related to severance and early retirement costs associated with field personnel totaling $0.12 per Boe. For 2015, the amount excludes charges of $0.31 per Boe related to early retirement and severance costs. For 2014, the amount excludes charges of $0.10 per Boe related to Spin-off and transition-related costs. |
(b) | For 2016, the amount excludes net unusual and infrequent gains of $0.35 that include refunds partially offset by plant turnaround charges and other items. For 2015, the amount excludes charges related to the write-down of certain assets and rig termination charges of $1.42 per Boe. For 2014, the amount excludes charges related to rig termination charges and Spin-off and transition-related charges of $0.97 per Boe. |
Year Ended December 31, 2016 vs. 2015
Oil and gas net sales decreased 24%, or $513 million, in 2016 compared to 2015, due to reductions of approximately $282 million and $181 million from lower oil prices and volumes, respectively; $28 million and $26 million from lower natural gas prices and volumes, respectively; $14 million from lower NGL volumes; and an increase of $18 million from higher NGL prices. The lower realized oil prices reflected a 16% decrease in global oil prices. Our realized oil prices in 2016 and 2015 also included $77 million and $78 million of cash generated from our hedging program, respectively. Daily oil and gas production volumes averaged 140,000 Boe in 2016, compared with 160,000 Boe in 2015, representing a 12.5% year-over-year decline rate, consistent with our estimated overall annual base decline rate. The 2016 production was negatively impacted by 1,000 Boe per day due to the PSCs in our Long Beach operations. Excluding this PSC effect, our year-over-year production decline would have been under 12%. Average oil production decreased by 13%, or 13,000 barrels per day, to 91,000 barrels per day in 2016 compared to 2015. NGL production decreased by 11% to 16,000 barrels per day. Natural gas production decreased by 14% to 197,000 MMcf per day, consistent with our focus on oil-based projects. The overall production decline continued to reflect our decision to withhold development capital and selectively defer workover and downhole maintenance activity in the early part of the year.
Derivative losses were $206 million in 2016, compared to gains of $133 million in 2015. Of the change, $335 million was due to the valuation of outstanding derivative contracts at the end of 2016 and $4 million was the result of lower gains from cash settlements. Overall, the 2016 derivative losses are primarily a function of the higher commodity price curve at the end of 2016 compared to the curve when the derivatives were implemented.
63
Production costs were $800 million or $15.61 per Boe in 2016, compared to $951 million or $16.30 per Boe in 2015, resulting in a 16% reduction on an absolute dollar basis. Of the absolute dollar reduction, approximately 25% related to lower energy costs, largely resulting from lower natural gas prices. The balance, or 75% of the reduction, came from ongoing cost-reduction initiatives which reduced costs across our operations in all categories including surface operations, downhole maintenance and labor costs.
Our general and administrative expenses were lower in 2016 compared to 2015 on a total dollar and per Boe basis, reflecting continued employee and contractor cost-reduction initiatives. Severance and early retirement costs of $20 million and $67 million were included in general and administrative expenses in 2016 and 2015, respectively. The non-cash portion of general and administrative expenses, comprising equity compensation and a portion of pension costs, was approximately $25 million and $30 million in 2016 and 2015, respectively.
DD&A expense decreased 44%, or $445 million, in 2016 compared to 2015, primarily due to a $376 million decrease in the DD&A rate that resulted from asset impairments in the fourth quarter of 2015, and an approximately $73 million decrease attributable to lower volumes.
At year-end 2015, we performed impairment tests with respect to our proved and unproved properties triggered by the sharp drop in oil prices in the fourth quarter of 2015, resulting in pre-tax asset impairment charges of $4.9 billion.
Taxes other than on income, which include ad valorem taxes, greenhouse gas emissions costs and production taxes, decreased 20%, or $36 million, in 2016 compared to 2015, reflecting lower property taxes assessed in the lower price environment.
Exploration expense decreased 36%, or $13 million, in 2016 compared to 2015, due to reduced lease rentals that we negotiated during the year and lower exploration activity.
Interest and debt expense, net, of $328 million in 2016, compared to $326 million in 2015, reflected higher interest rates on our new debt, increased amortization of deferred financing costs including a $12 million write-off of the deferred financing costs associated with the tender for our notes during 2016. Offsetting these effects were $71 million of amortization of the deferred gains from our December 2015 debt exchange and lower overall debt principal amounts.
The decrease in other expenses from $168 million in 2015 to $79 million in 2016 was largely the result of net gains in 2016 principally from energy and property tax refunds as well as certain 2015 asset write-downs.
Net gains on early extinguishment of debt of $805 million in 2016 resulted from the August tender as well as other note repurchases and exchanges, net of related expenses. Net gains on early extinguishment of debt of $20 million in 2015 resulted from note repurchases, net of related expenses.
Other non-operating income (expense) consisted of approximately $30 million of gains from non-core asset divestitures in 2016 and $28 million of debt-related transaction costs in 2015.
In 2016, we had pre-tax income of $201 million and an income tax benefit of $78 million reflecting the release of a portion of the beginning of the year valuation allowance. Further, in 2016, we excluded CODI from taxable income which resulted in a tax loss. We did not recognize a resulting tax benefit due to the uncertainty of realizing such benefit. For 2015, we had a pre-tax loss of $5.5 billion and a $1.9 billion benefit which was net of a $294 million change related to a valuation allowance.
Year Ended December 31, 2015 vs. 2014
Oil and natural gas net sales decreased 47%, or $1.9 billion, in 2015 compared to 2014, primarily due to an approximately $1.6 billion negative impact from lower oil prices, $190 million from lower NGL prices and volumes and $180 million from lower natural gas prices and volumes. The lower oil prices resulted from a significant decrease in benchmark prices generally, as well as higher differentials to those benchmark prices in 2015, mainly caused by local refinery and pipeline events. The decrease was partially offset by an approximately $70 million positive effect of higher oil volumes. Average oil production increased by 5% or 5,000 barrels per day to 104,000 barrels per day in the year ended December 31, 2015 compared to the prior year. NGL production decreased by 5% to 18,000 barrels per day and natural gas production decreased by 7% to 229 MMcf per day.
64
Derivative gains were $133 million in 2015, compared to losses of $5 million in 2014. The change was largely due to volume and non-cash valuation changes in our outstanding derivative positions of $138 million.
Other revenue in 2015 increased 19%, or $22 million, due to increased marketing revenue partially offset by lower prices for power sold by our Elk Hills power plant.
Production costs decreased 10%, or $106 million, to $16.30 per Boe in 2015, compared to $18.23 per Boe in 2014, an 11% reduction on a Boe basis. The decrease was driven by cost reductions across the board, particularly in well maintenance and workovers, well servicing efficiency, surface operations, reduced energy use through efficiencies and employee reductions, including early retirements, and was aided by lower natural gas and electricity prices.
Adjusted general and administrative expenses, which excludes voluntary retirement and employee reduction costs, decreased 2%, or $5 million, in 2015 compared to 2014, largely due to our cost reduction efforts and lower stock-based compensation costs resulting from a lower year-end stock price. The non-cash portion of adjusted G&A, comprising equity compensation and pension costs, was approximately $30 million for each of 2015 and 2014.
DD&A expense decreased 16%, or $194 million, in 2015 compared to 2014, almost all of which was due to a lower DD&A rate resulting from the 2014 impairment charges, partially offset by higher 2015 production.
At year-end 2015, we performed impairment tests with respect to our proved and unproved properties triggered by the sharp drop in oil prices in the fourth quarter of 2015. As a result, in the fourth quarter of 2015, we recorded pre-tax asset impairment charges of $4.9 billion on proved and unproved properties throughout our asset base. The impairment charge was related to certain properties in the San Joaquin, Los Angeles and Ventura basins, as well as our gas properties in the Sacramento basin. Approximately $100 million of the charge was related to unproved acreage. We evaluate our properties, in part, based on year-end forward price curves, as well as assessing projects we determined we would not pursue in the foreseeable future given the current environment. To the extent prices recover to levels above the year-end forward price curves, we would expect a substantial portion of these assets would ultimately become economic in an improved price environment.
Taxes other than on income decreased 17%, or $37 million, in 2015 compared to 2014, reflecting lower property taxes assessed in the lower price environment prevailing during the period and a decrease in greenhouse gas emissions costs.
Exploration expense decreased 74%, or $103 million, in 2015 compared to 2014, consistent with our reduced exploration activity.
Other expenses, net decreased 19%, or $39 million, in 2015 compared to 2014, reflecting lower natural gas costs for our Elk Hills power plant and lower rig termination costs.
The increase in interest and debt expense, net, of $254 million in 2015 compared to 2014, resulted from the debt incurred in connection with the Spin-off in the fourth quarter of 2014.
Net gains on early extinguishment of debt of $20 million in 2015 resulted from note repurchases, net of related expenses.
Provision for income taxes showed a benefit of $1.9 billion in 2015, which reflected a pre-tax loss of approximately $5.5 billion, compared to a benefit of $987 million in 2014, which reflected a pre-tax loss of approximately $2.4 billion. The 2015 benefit was net of a $294 million charge related to a valuation allowance, which resulted in a lower effective tax rate in 2015.
65
Liquidity and Capital Resources
The primary source of liquidity and capital resources to fund our capital program and other obligations for 2016 was cash flow from operations. Operating cash flows are largely dependent on oil and natural gas prices, sales volumes and costs. Average oil prices continued the decline that began in the last half of 2014 into the first quarter of 2016. While global oil prices improved modestly through the end of 2016 and began to trade in a narrower range, daily average prices were still lower for the full year of 2016 compared to 2015. These lower commodity prices have negatively impacted our revenues, earnings and cash flows. If oil and natural gas prices were to drop again meaningfully from current levels, this could have a material and adverse effect on our liquidity position.
Much of the global exploration and production industry has been challenged at recent price levels, which put pressure on the industry's ability to generate positive cash flow and access capital. If commodity prices were to prevail through 2017 at about current levels, we would expect to be able to fund our operations and capital budget with our operating cash flows and would not anticipate a net draw down on our credit facilities. Our ability to borrow funds under our reserves-based first-lien first-out credit facilities is limited by the size of our lenders' commitments, our ability to comply with their covenants, our borrowing base and a minimum monthly liquidity requirement. Effective November 1, 2016, the borrowing base under our existing first-lien first-out credit facilities was reaffirmed at $2.3 billion. However, the lenders' commitments under our first-lien first-out credit facilities are limited to $2.05 billion. As of January 31, 2017, we had approximately $486 million of available borrowing capacity under our revolving credit facility, subject to the minimum liquidity requirement.
If product prices currently projected in the forward price curves materialize, we expect to be in compliance with our covenants under our first-lien first-out credit facilities for the next twelve months and possibly beyond. If we were to breach any of the covenants under our first-out facilities, our lenders would be permitted to accelerate the principal amount due under the first-out facilities and foreclose against the assets securing them. If payment were accelerated, or we failed to make certain payments, under our first-out facilities, it would result in a default under our second-out credit facility and outstanding notes and permit acceleration and foreclosure against the assets securing the second-out credit facility and the secured notes.
Our 2017 base capital budget is approximately $300 million. We have developed a dynamic plan that can be adjusted down to below $100 million or up to $500 million based on commodity prices during the year in order to remain within our cash flows. Our liquidity position, along with internally generated cash flows from operations and settlements from our derivative contracts in a lower price environment, is expected to provide continued financial flexibility as we actively manage the pace of our development activities.
At the beginning of the year, in response to commodity price declines, we budgeted $50 million for our 2016 capital program, compared to our 2015 capital investments of $401 million. In the first half of 2016, we further reduced the pace of our capital program to below our initial budget. Since then and in response to recent commodity price improvements, we modestly increased our 2016 capital investments in the second half of the year, ending the year with $75 million. Our slowdown of drilling activity from late 2015 through the first half of 2016, coupled with the selective deferral of expense and capital workover activity, led to a decline in production in 2016. However, we began increasing activity levels gradually towards the end of the second quarter, which continued into the third and fourth quarters of 2016. We reactivated our drilling program in August, and we saw production benefits that reduced the base production decline rate. We began experiencing the positive impact of the increased activity towards the end of the third quarter, and expect to see further production benefits that should reduce the base production decline rate further. We believe our overall annual base decline rate ranges from 10% to 15%. With minimal capital in 2016, our production declined 12.5% compared to 2015. We cannot guarantee our planned increase in investments will result in a rapid reversal of, or a significant increase in, production trends. Over the long term, if commodity prices fall again or remain at depressed levels, we may experience continued declines in our production and reserves, which could reduce our liquidity and ability to satisfy our debt obligations by negatively impacting our cash flow from operations, the value of our assets and our borrowing base.
We focus on creating value and are committed to internally fund our capital budget with operating cash flows. Our low decline assets plus our high level of operational control give us the flexibility to adjust the level of our capital investments as circumstances warrant. We create dynamic budgets that can be adjusted to align investments with projected cash flows. We are also focusing our capital on oil projects, which provide higher margins and low decline rates that we believe will generate growing cash flow year after year and fund increasing capital budgets to grow production assuming stable or increasing product pricing and modest service cost inflation. In this scenario we expect to be able to strengthen our balance sheet organically.
66
We have taken a number of other steps to reduce our cost structure with the current price environment, including a reduction of our workforce to below 1,500 employees as of December 31, 2016. As a result of these steps, in 2016 we have seen a reduction in our production costs and general and administrative expenses below 2015 levels. These measures have helped offset some of the cash flow effects of prolonged low commodity prices.
We reduced outstanding debt by approximately $900 million in 2016. In January and February 2016, we repurchased over $100 million in aggregate principal amount of our senior unsecured notes for under $13 million in cash. In May 2016, we entered into privately negotiated exchange agreements with a holder of our 6% Senior Notes due 2024 (the 2024 notes) and our 5½% Senior Notes due 2021 (the 2021 notes) to exchange a total of approximately 2.1 million shares of our common stock on a post-split basis for notes in the aggregate principal amount of $80 million. In August 2016, we issued a new $1 billion first-lien, second-out term loan credit facility (2016 Second-Out Credit Agreement) to prepay a portion of our existing term loans and reduce outstanding revolving loans under our first-lien, first-out credit facilities (2014 First-Out Credit Facilities). Further, we used the availability from 2014 First–Out Credit Facilities to repurchase approximately $1.4 billion of our unsecured senior notes. In October 2016, we entered into privately negotiated exchange agreements with certain holders of our 2024 notes and 2021 notes to exchange a total of 1.3 million shares of our common stock for notes in the aggregate principal amount of $22 million. In the fourth quarter of 2016, we repurchased $11 million in aggregate principal amount of our 2024 and 2021 notes for $6 million in cash.
Our 2014 First-Out Credit Facilities mature at the earlier of November 2019 and the 182nd day prior to the maturity of our 5% Senior Notes due 2020 (the 2020 notes) to the extent that more than $100 million of such notes remain outstanding at such date and 2016 Second-Out Credit Agreement matures at the earlier of December 2021 and the 91st day prior to maturity of the 2020 notes and 2021 notes if the outstanding principal amount of such notes exceeds $100 million prior to their respective maturity dates.
We will continue to evaluate opportunities to strengthen our balance sheet to competitively position the company for the longer term. We expect our main source of deleveraging, as measured by a lower leverage ratio, will come from our future production growth through reinvesting substantially all of our operating cash flow into our business. However, we may also from time to time seek to further reduce our outstanding debt using cash from asset sales, other monetizations or other sources. Such activities, if any, will depend on available funds, prevailing market conditions, our liquidity requirements, contractual restrictions in our credit facilities, perceived credit risk by counterparties and other factors. The amounts involved may be material. However, we can give no assurances that any of these efforts will be successful.
Our strategy for protecting our cash flows and liquidity also includes our hedging program. We currently have the following Brent-based crude oil contracts:
Q1 2017 | Q2 2017 | Q3 2017 | Q4 2017 | Q1 2018 | Q2-Q4 2018 | ||||||||||||||||||
Crude Oil | |||||||||||||||||||||||
Calls: | |||||||||||||||||||||||
Barrels per day | 12,100 | 5,000 | 10,000 | 15,000 | 15,600 | 15,000 | |||||||||||||||||
Weighted-average price per barrel | $ | 56.37 | $ | 55.05 | $ | 56.15 | $ | 56.12 | $ | 58.77 | $ | 58.83 | |||||||||||
Puts: | |||||||||||||||||||||||
Barrels per day | 22,100 | 20,000 | 17,000 | 10,000 | — | — | |||||||||||||||||
Weighted-average price per barrel | $ | 49.10 | $ | 50.25 | $ | 50.88 | $ | 48.00 | $ | — | $ | — | |||||||||||
Swaps: | |||||||||||||||||||||||
Barrels per day | 20,000 | 20,000 | 20,000 | 20,000 | — | — | |||||||||||||||||
Weighted-average price per barrel | $ | 53.98 | $ | 53.98 | $ | 53.98 | $ | 53.98 | $ | — | $ | — | |||||||||||
67
Some of our second through fourth quarter 2017 crude oil swaps grant our counterparty a quarterly option to increase volumes by up to 10,000 barrels per day for that quarter at a weighted-average Brent price of $55.46. Our counterparty also has an option to increase volumes by up to 5,000 barrels per day for the second half of 2016 at a weighted-average Brent price of $61.43. During 2016, we purchased derivative assets that partially reduced our 2017 and 2018 call exposure for which we paid $86 million and deferred payment of $15 million.
Credit Facilities
2014 First-Out Credit Facilities
The 2014 First-Out Credit Facilities comprise (i) a $650 million senior term loan facility (the Term Loan Facility) and (ii) a $1.4 billion senior revolving loan facility (the Revolving Credit Facility). We are permitted to increase the size of the Revolving Credit Facility by up to $250 million if we obtain additional commitments from new or existing lenders. The Revolving Credit Facility includes a sub-limit of $400 million for the issuance of letters of credit. Our credit limit under our 2014 First-Out Credit Facilities is $2.05 billion. Borrowings under these facilities are also subject to a borrowing base, which was reaffirmed at $2.3 billion as of November 1, 2016.
As of December 31, 2016 and 2015, we had outstanding borrowings of $847 million and $739 million under our Revolving Credit Facility and $650 million and $1 billion under the Term Loan Facility, respectively. At December 31, 2016, we had $1 billion outstanding under the 2016 Second-Out Credit Agreement. We made payments on the Term Loan Facility during each of the four quarters in 2016 totaling $100 million and a $250 million prepayment from proceeds of the 2016 Second-Out Credit Agreement.
As of February 2016, we amended the 2014 First-Out Credit Facilities to change certain of our financial and other covenants. We again amended this agreement in April 2016 to facilitate certain types of deleveraging transactions, in August 2016 to further change certain of our covenants, grant additional collateral to our lenders and permit the incurrence of debt under the 2016 Second-Out Credit Agreement and in February 2017 to facilitate additional joint venture transactions and note repurchases, eliminate our capital expenditure restriction and adopt a minimum liquidity covenant.
We have granted the lenders under the 2014 First-Out Credit Facilities a first-priority lien in a substantial majority of our assets, including our Elk Hills power plant and midstream assets. We also granted a lien in the same assets to the lenders under our 2016 Second-Out Credit Agreement and the holders of our 8% senior secured second-lien notes due in 2022 (2022 notes).
Borrowings under the 2014 First-Out Credit Facilities bear interest, at our election, at either a LIBOR rate or an alternate base rate (ABR) (equal to the greatest of (i) the administrative agent’s prime rate, (ii) the one-month LIBOR rate plus 1.00% and (iii) the federal funds effective rate plus 0.50%), in each case plus an applicable margin. This applicable margin is based, while our total leverage ratio exceeds 3.00:1.00, on our borrowing base utilization and will vary from (a) in the case of LIBOR loans, 2.50% to 3.50% and (b) in the case of ABR loans, 1.50% to 2.50%. The unused portion of the Revolving Credit Facility commitments is subject to a commitment fee equal to 0.50% per annum. We also pay customary fees and expenses under the 2014 First-Out Credit Facilities. Interest on ABR loans is payable quarterly in arrears. Interest on LIBOR loans is payable at the end of each LIBOR period, but not less than quarterly.
Our financial performance covenants under the 2014 First-Out Credit Facilities require that (i) the ratio of our first-lien, first-out secured debt to trailing four quarter EBITDAX (the First-Lien First-Out Leverage Ratio) not exceed 3.50 to 1.00 at any quarter end through the quarter ending June 30, 2017 and 3.25 to 1.00 for the quarters ending September 30 and December 31, 2017 and (ii) the total interest expense coverage ratio at each quarter end not be less than 1.20 to 1.00 at any quarter end through the quarter ending December 31, 2017. Beginning with the end of the first quarter of 2018, the First-Lien First-Out Leverage Ratio may not exceed 2.25 to 1.00 and the total interest expense coverage ratio may not be less than 2.00 to 1.00. The covenants also include a requirement that the first-lien asset coverage ratio must be at least 1.20 to 1.00 as of any June 30 and December 31 beginning December 31, 2016 and a requirement that minimum monthly liquidity be not less than $250 million. As of January 31, 2017, we had approximately $486 million of liquidity, subject to the minimum liquidity requirement.
68
We must apply 100% of the proceeds from asset sales to repay loans outstanding under the 2014 First-Out Credit Facilities, except that we are permitted to (i) use up to 50% (or, if our leverage ratio is less than 4:00 to 1:00, 60%) of proceeds from non-borrowing base asset sales or monetizations to repurchase our notes to the extent available at a significant minimum discount to par, as specified in the facilities and (ii) purchase up to $140 million of certain of our unsecured notes at a discount. The 2014 First-Out Credit Facilities also permit us to incur up to an additional $50 million of non-facility indebtedness, which may be secured by non-borrowing base assets, subject to compliance with our financial covenants and indentures, the proceeds of which must be applied to repay the Term Loan Facility. We must apply cash on hand in excess of $150 million daily to repay amounts outstanding under our Revolving Credit Facility. Further, we are restricted from paying dividends or making other distributions to common stockholders.
Our borrowing base under the 2014 First-Out Credit Facilities is redetermined each May 1 and November 1. The borrowing base will be based upon a number of factors, including commodity prices and reserves. Increases in our borrowing base require approval of at least 80% of our revolving lenders, as measured by exposure, while decreases or affirmations require a two-thirds approval. We and the lenders (requiring a request from the lenders holding two-thirds of the revolving commitments and outstanding loans) each may request a special redetermination once in any period between three consecutive scheduled redeterminations. We will be permitted to have collateral released when both (i) our credit ratings are at least Baa3 from Moody's and BBB
from S&P, in each case with a stable or better outlook, and (ii) certain permitted liens securing other debt are released.
2016 Second-Out Credit Agreement
The net borrowings under the 2016 Second-Out Credit Agreement were used to (i) prepay $250 million of the Term Loan Facility and (ii) reduce our Revolving Credit Facility by $740 million. The proceeds received were net of a $10 million original issue discount. The loan under the 2016 Second-Out Credit Agreement bears interest at a floating rate per annum equal to 10.375% plus LIBOR, subject to a 1.00% LIBOR floor, determined for the applicable interest period (or ABR rates in certain circumstances). Interest on ABR loans is payable quarterly in arrears. Interest on LIBOR loans is payable at the end of each LIBOR period, but not less than quarterly.
The 2016 Second-Out Credit Agreement is secured by a security interest in the same collateral used to secure the 2014 First-Out Credit Facilities, but, under intercreditor arrangements with our 2014 First-Out Credit Facilities lenders, are second in collateral recovery behind such lenders. Prepayment of the 2016 Second-Out Credit Agreement is subject to a make-whole premium prior to the third anniversary of closing and a premium to par equal to 50% of coupon between the third anniversary and the fourth anniversary. Following the fourth anniversary, we may redeem at par. The 2016 Second-Out Credit Agreement matures on December 31, 2021, but if the aggregate principal amount outstanding of either our 2020 Notes or our 2021 Notes exceeds $100 million 91 days prior to their respective maturity dates, the maturity date of the term loans will accelerate to such prior 91st day. As of December 31, 2016, we had $193 million and $135 million in aggregate principal amount of outstanding 2020 notes and 2021 notes, respectively.
The 2016 Second-Out Credit Agreement provides for customary covenants and events of default consistent with, or generally less restrictive than, the covenants in our 2014 First-Out Credit Facilities, including limitations on additional indebtedness, liens, asset dispositions, investments, restricted payments and other negative covenants, in each case subject to certain limitations and exceptions. Additionally, the 2016 Second-Out Credit Agreement requires us to maintain a first-lien asset coverage ratio of 1.20 to 1.00 as of any June 30 and December 31 beginning December 31, 2016, consistent with the 2014 First-Out Credit Facilities.
Senior Notes
In October 2014, we issued $5.00 billion in aggregate principal amount of our senior unsecured notes, including $1.00 billion of 2020 notes, $1.75 billion of 2021 notes and $2.25 billion of 2024 notes (collectively, the unsecured notes). We used the net proceeds from the issuance of the unsecured notes to make a $4.95 billion cash distribution to Occidental in October 2014.
69
In December 2015, we exchanged $534 million, $921 million and $1,358 million in aggregate principal amount of the 2020 notes, the 2021 notes, and the 2024 notes, respectively, for $2.25 billion in aggregate principal amount of the newly issued 2022 notes. We recorded a deferred gain of approximately $560 million on the debt exchange, which will be amortized using the effective interest rate method over the term of the 2022 notes. Our 2022 notes are secured on a second-priority basis, subject to the terms of an intercreditor agreement and collateral trust agreement, by a lien on the same collateral used to secure our obligations under our 2014 First-Out Credit Facilities and 2016 Second-Out Credit Agreement (the Credit Facilities).
In January and February 2016, we repurchased over $100 million in aggregate principal amount of our unsecured notes for under $13 million in cash, for a pre-tax gain of $87 million, net of related expenses. In May 2016, we entered into privately negotiated exchange agreements with a holder of our 2024 notes and our 2021 notes to exchange a total of approximately 2.1 million shares of our common stock on a post-split basis for notes in the aggregate principal amount of $80 million, resulting in a $44 million pre-tax gain, net of related expenses.
In August 2016, we repurchased $197 million, $605 million and $613 million in aggregate principal amount of our 2020 notes, 2021 notes and 2024 notes, respectively, for $750 million using our Revolving Credit Facility, resulting in a $660 million pre-tax gain, net of related expenses.
In October 2016, we entered into privately negotiated exchange agreements with certain holders of our 2024 notes and 2021 notes to exchange a total of 1.3 million shares of our common stock for notes in the aggregate principal amount of $22 million, resulting in a $8 million pre-tax gain, net of related expenses.
In the fourth quarter of 2016, we repurchased $11 million in aggregate principal amount of our 2024 and 2021 notes for $6 million, resulting in a $4 million pre-tax gain, net of related expenses.
We will pay interest semiannually in cash in arrears on January 15 and July 15 for the 2020 notes, on March 15 and September 15 for the 2021 notes, on June 15 and December 15 for the 2022 notes and on May 15 and November 15 for the 2024 notes.
The indentures governing the unsecured notes and the 2022 notes each include covenants that, among other things, limit our and our subsidiaries’ ability to incur debt secured by liens. The indentures also restrict our ability to merge or consolidate with, or transfer all or substantially all of our assets to, another entity. These covenants are subject to a number of important qualifications and limitations that are set forth in the indenture. The covenants are not, however, directly linked to measures of our financial performance. In addition, if we experience a “change of control triggering event” (as defined in the indentures) with respect to a series of notes, we will be required, unless we have exercised our right to redeem the notes of such series, to offer to purchase the notes of such series at a purchase price equal to 101% of their principal amount, plus accrued and unpaid interest. The indenture governing our second lien secured notes also restricts our ability to sell certain assets and to release collateral from liens securing the second lien secured notes, unless the collateral is released in compliance with our Credit Facilities.
Other
All obligations under the Credit Facilities and the notes are guaranteed jointly and severally by all of our material wholly owned subsidiaries. The assets and liabilities of subsidiaries not guaranteeing the debt are de minimis.
At December 31, 2016, we were in compliance with all the financial and other covenants under our Credit Facilities.
A one-eighth percent change in the variable interest rates on the borrowings under our Credit Facilities on December 31, 2016, would result in a $3 million change in annual interest expense.
As of December 31, 2016, we had letters of credit of approximately $130 million under the Revolving Credit Facility. As of December 31, 2015, we had letters of credit in the aggregate amount of $70 million (including $49 million under the Revolving Credit Facility). These letters of credit were issued to support ordinary course marketing, insurance, regulatory and other matters.
70
Spin-off Related Distributions to Occidental
We used the net proceeds from the private placement of our unsecured notes in 2014 to make a $4.95 billion cash distribution to Occidental in October 2014. See “—Senior Notes” for more details regarding the terms of our senior notes. On November 25, 2014, we borrowed $1.0 billion under our Term Loan Facility and $50 million under a Revolving Credit Facility to make a $1.05 billion cash distribution to Occidental on November 26, 2014.
Cash Flow Analysis
2016 | 2015 | 2014 | |||||||||
(in millions) | |||||||||||
Net cash flows provided by operating activities | $ | 130 | $ | 403 | $ | 2,371 | |||||
Net cash flows used in investing activities | $ | (61 | ) | $ | (757 | ) | $ | (2,312 | ) | ||
Net cash flows provided by (used in) financing activities | $ | (69 | ) | $ | 352 | $ | (45 | ) | |||
Adjusted EBITDAX (a) | $ | 616 | $ | 906 | $ | 2,548 | |||||
(a) We define adjusted EBITDAX as earnings before interest expense; income taxes; depreciation, depletion and amortization; exploration expense; and other unusual and infrequent items. Our management believes adjusted EBITDAX provides useful information in assessing our financial condition, results of operations and cash flows and is widely used by the industry, the investment community and our lenders. While adjusted EBITDAX is a non-GAAP measure, the amounts included in the calculation of adjusted EBITDAX were computed in accordance with GAAP. This measure is a material component of certain of our financial covenants under our first-lien, first-out credit facilities and is provided in addition to, and not as an alternative for, income and liquidity measures calculated in accordance with GAAP. Certain items excluded from adjusted EBITDAX are significant components in understanding and assessing our financial performance, such as our cost of capital and tax structure, as well as the historic cost of depreciable and depletable assets. Adjusted EBITDAX should be read in conjunction with the information contained in our financial statements prepared in accordance with GAAP.
The following table sets forth a reconciliation of the GAAP measure of net cash provided by operating activities to the non-GAAP financial measure of adjusted EBITDAX:
2016 | 2015 | 2014 | |||||||||
(in millions) | |||||||||||
Net cash provided by operating activities | $ | 130 | $ | 403 | $ | 2,371 | |||||
Cash interest | 384 | 359 | 3 | ||||||||
Cash income taxes | — | — | 165 | ||||||||
Exploration expenditures | 20 | 27 | 38 | ||||||||
Other changes in operating assets and liabilities | 95 | 106 | (81 | ) | |||||||
Other | (13 | ) | 11 | 52 | |||||||
Adjusted EBITDAX | $ | 616 | $ | 906 | $ | 2,548 | |||||
Year Ended December 31, 2016 vs. 2015
Our net cash provided by operating activities in 2016 decreased by $273 million from $403 million in 2015 to $130 million in 2016. The decrease reflected lower revenues of approximately $521 million, primarily due to lower commodity prices and volumes, net of cash generated from our hedging program, $25 million of higher interest payments and the negative effect of working capital changes of $16 million, partially offset by lower costs including lower production costs of $151 million, cash general and administrative expenses of $47 million, taxes other than on income of $36 million and exploration expense of $13 million.
Our net cash flows used by investing activities decreased by approximately $696 million from $757 million in 2015 to $61 million in 2016. The decrease reflected significantly reduced capital investments, lower payments related to capital activity from prior periods and no acquisitions in 2016.
71
Our net cash flow used by financing activities of $69 million in 2016 included approximately $990 million of proceeds from the issuance of the 2016 Second-Out Credit Agreement, $108 million of net proceeds from the Revolving Credit Facility, $350 million of scheduled and early payments on the Term Loan Facility and $821 million of debt repurchases and related costs. Our net cash flow provided by financing activities of $352 million in 2015 primarily included approximately $379 million of net proceeds on the Revolving Credit Facility, partially offset by 2015 debt repurchase and amendment costs of $23 million and $12 million in cash dividends paid.
Year Ended December 31, 2015 vs. 2014
Our net cash provided by operating activities in 2015 decreased by $2.0 billion from $2.4 billion in 2014 to $403 million in 2015. The decrease reflected approximately $1.8 billion in lower sales primarily due to lower oil prices and lower NGL and natural gas prices and volumes and $360 million of higher interest payments, partially offset by lower operating costs. Additionally, changes in working capital resulted in an approximate $290 million reduction in operating cash due to lower operating costs resulting in lower year-end 2015 payables and lower accruals for payroll and bonuses in line with our reduced workforce, partially offset by lower receivables from customers due to lower year-end 2015 product prices. Further, the 2014 positive working capital reflected the effect of higher operating, general and administrative and other costs and related higher accruals from the previous year-end, in line with a higher level of activity.
Our net cash flows used by investing activities decreased by approximately $1.6 billion from $2.3 billion in 2014 to $757 million in 2015. The decrease reflected reduced capital investments of $1.7 billion and lower acquisition costs of approximately $140 million, partially offset by approximately $200 million in 2014 capital investments paid in 2015.
Our net cash flow used by financing activities changed from $45 million used in 2014 to $352 million provided in 2015. The change is primarily due to 2015 net proceeds from the revolving credit facility of $379 million, largely to fund the working capital uses to pay for the fourth quarter 2014 capital investments and $8 million from the issuance of common stock, partially offset by 2015 debt repurchase and amendment costs of $23 million and $12 million in cash dividends paid.
Acquisitions and Divestitures
In February 2017, we divested non-core assets resulting in $32 million of proceeds. Additionally, we entered into a joint venture with a third party that is committed to invest $50 million initially and up to an additional $200 million subject to agreement of the parties. The funds will be used to develop certain of our oil and gas properties in exchange for a contribution of a net profits interest in such properties. After the investor achieves its targeted rate of return, the interests revert back to us.
During the year ended December 31, 2016, we divested non-core assets resulting in $20 million of proceeds.
During the year ended December 31, 2015, we paid approximately $140 million to acquire certain producing and non-producing oil and gas properties, primarily in the San Joaquin basin.
During the year ended December 31, 2014, we paid approximately $290 million to acquire certain producing and non-producing oil and gas properties, including oil and gas properties in the Ventura Basin purchased for approximately $200 million in the fourth quarter of 2014.
2016 Capital Program and 2017 Capital Budget
In 2016, we invested approximately $75 million of capital, predominantly targeting projects in the San Joaquin and Los Angeles basins, as compared to approximately $401 million in 2015. Virtually all of our oil and gas 2016 capital was directed towards oil-weighted production consistent with 2015 and 2014. Of the total 2016 capital program, approximately $13 million was allocated to drilling wells, $18 million to capital workovers, $23 million to facilities and compression expansion (including $19 million for a major turnaround of our power plant), $15 million to maintenance and occupational health, safety and environmental projects and the rest to other items.
72
The table below sets forth our 2016 capital investments for the year ended December 31, 2016 (in millions):
Conventional | Unconventional | Other | Total Capital Investments | ||||||||||||||||||||||||
Primary | Waterflood | Steamflood | Total | Primary | |||||||||||||||||||||||
Basin: | |||||||||||||||||||||||||||
San Joaquin | $ | 6 | $ | 5 | $ | 4 | $ | 15 | $ | 12 | $ | — | $ | 27 | |||||||||||||
Los Angeles | — | 8 | 7 | 15 | — | — | 15 | ||||||||||||||||||||
Ventura | 7 | 1 | — | 8 | — | — | 8 | ||||||||||||||||||||
Sacramento | 3 | — | — | 3 | — | — | 3 | ||||||||||||||||||||
Basin Total | 16 | 14 | 11 | 41 | 12 | — | 53 | ||||||||||||||||||||
Other(a) | — | — | — | — | — | 22 | 22 | ||||||||||||||||||||
Total | $ | 16 | $ | 14 | $ | 11 | $ | 41 | $ | 12 | $ | 22 | $ | 75 | |||||||||||||
(a) | Includes $19 million for a major turnaround of our power plant. |
We focused a substantial majority of our 2016 capital on our mature steamfloods, waterfloods and capital workovers, all of which offer among the highest VCIs in our portfolio. We focus on creating value and are committed to internally fund our capital budget with operating cash flows. Our low decline assets plus our high level of operational control gives us the flexibility to adjust the level of such capital investments as circumstances warrant. In mid-2016, global oil prices began to recover from the apparent low point of this commodity cycle. The recovery further strengthened following the production cuts announced at the November 2016 meeting of the OPEC. In light of these continuing results, we began to increase our activity level beginning toward the end of the second half of 2016 and have continued to do so in early 2017. We began 2017 with two rigs running (one each in the San Joaquin and the Los Angeles basins). By the end of the first quarter of 2017, we anticipate having four rigs running (three in the San Joaquin and one in the Los Angeles basin). We also plan to add an additional rig in the Ventura basin by the third quarter of 2017. Our 2017 development program will focus primarily on our core fields: Elk Hills; Wilmington; Kern Front; Buena Vista; and the delineation of Kettleman North Dome. Based on the current market conditions, we increased our 2017 planned capital program to $300 million from the $75 million invested in 2016. We have developed a dynamic plan which can be scaled up or down depending on the price environment. For 2017, we have action plans that can reduce our capital program to below $100 million or increase it as high as $500 million based on conditions during the year.
Off-Balance-Sheet Arrangements
We have no material off-balance-sheet arrangements other than those noted below.
Leases
We, or certain of our subsidiaries, have entered into various operating lease agreements, mainly for field equipment, office space and office equipment. We lease assets when leasing offers greater operating flexibility. Lease payments are generally expensed as part of production costs or selling, general and administrative expenses. For more information, see "Contractual Obligations."
73
Contractual Obligations
The table below summarizes and cross-references our contractual obligations as of December 31, 2016. This summary indicates on- and off-balance-sheet obligations as of December 31, 2016.
Payments Due by Year | |||||||||||||||||||
Total | 2017 | 2018 and 2019 | 2020 and 2021 | 2022 and thereafter | |||||||||||||||
(in millions) | |||||||||||||||||||
On-Balance Sheet | |||||||||||||||||||
Long-term debt - principal amount (Note 5)(a) | $ | 5,268 | $ | 100 | $ | 1,397 | $ | 1,754 | $ | 2,017 | |||||||||
Other long-term liabilities(b) | 159 | 12 | 19 | 15 | 113 | ||||||||||||||
Off-Balance Sheet | |||||||||||||||||||
Operating leases | 112 | 16 | 30 | 16 | 50 | ||||||||||||||
Purchase obligations(c)(d) | 340 | 74 | 219 | 16 | 31 | ||||||||||||||
Total | $ | 5,879 | $ | 202 | $ | 1,665 | $ | 1,801 | $ | 2,211 | |||||||||
(a) | Excludes interest on the debt. As of December 31, 2016, interest on long-term debt totaling $2.0 billion is payable in the following years: 2017 - $380 million, 2018 and 2019 - $743 million, 2020 and 2021 - $627 million, 2022 and thereafter - $206 million. The calculation of interest payable on the variable interest debt assumes the interest rate at December 31, 2016 to be the applicable interest rate for the entire term. In performing the calculation, the Revolving Credit Facility borrowings outstanding at December 31, 2016 of $847 million were assumed to be outstanding for the entire term of the agreement. |
(b) | Includes obligations under postretirement benefit and deferred compensation plans. |
(c) | Amounts include payments that will become due under long-term agreements to purchase goods and services used in the normal course of business to secure pipeline capacity, drilling rigs and services. |
(d) | Included in these obligations is a commitment to invest approximately $170 million in evaluation and development activities for one of our oil and gas properties prior to the end of 2018. Any deficiency in meeting this capital investment obligation would need to be paid in cash. Our 2017 capital program includes development plans for these properties, and we expect to fulfill the minimum investment requirement. |
Lawsuits, Claims, Contingencies and Commitments
We, or certain of our subsidiaries, are involved, in the normal course of business, in lawsuits, environmental and other claims and other contingencies that seek, among other things, compensation for alleged personal injury, breach of contract, property damage or other losses, punitive damages, civil penalties, or injunctive or declaratory relief.
On April 21, 2016, a purported class action was filed against us in the United States District Court for the Southern District of New York on behalf of all beneficial owners of our unsecured notes from November 12, 2015 to the present. The complaint alleges that our December 2015 debt exchange excluded non-qualified institutional holders in violation of the Trust Indenture Act of 1939 and related law and, thereby, impaired their rights to receive principal and interest payments. The purported class action seeks declaratory relief that the debt exchange and the liens securing the new notes are null and void and that the debt exchange resulted in a default. The plaintiff also seeks monetary damages and attorneys’ fees. We plan to vigorously defend against the claims made by the plaintiff.
We accrue reserves for currently outstanding lawsuits, claims and proceedings when it is probable that a liability has been incurred and the liability can be reasonably estimated. Reserve balances at December 31, 2016 and 2015 were not material to our balance sheets as of such dates. We also evaluate the amount of reasonably possible losses that we could incur as a result of these matters. We believe that reasonably possible losses that we could incur in excess of reserves accrued on our balance sheet would not be material to our consolidated financial position or results of operations.
We, our subsidiaries, or both, have indemnified various parties against specific liabilities those parties might incur in the future in connection with the Spin-off, purchases and other transactions that they have entered into with us. These indemnities include indemnities made to Occidental against certain tax-related liabilities that may be incurred by Occidental relating to the Spin-off and liabilities related to operation of our business while it was still owned by Occidental. As of December 31, 2016, we are not aware of material indemnity claims pending or threatened against the Company.
74
Critical Accounting Policies and Estimates
The process of preparing financial statements in accordance with generally accepted accounting principles requires management to select appropriate accounting policies and to make informed estimates and judgments regarding certain items and transactions. Changes in facts and circumstances or discovery of new information may result in revised estimates and judgments, and actual results may differ from these estimates upon settlement. We consider the following to be our most critical accounting policies and estimates that involve management’s judgment and that could result in a material impact on the financial statements due to the levels of subjectivity and judgment.
Oil and Gas Properties
The carrying value of our property, plant and equipment (PP&E) represents the cost incurred to acquire or develop the asset, including any asset retirement obligations and capitalized interest, net of accumulated DD&A and any impairment charges. For assets acquired, initial PP&E cost is based on fair values at the acquisition date.
We use the successful efforts method to account for our oil and gas properties. Under this method, we capitalize costs of acquiring properties, costs of drilling successful exploration wells and development costs. The costs of exploratory wells are initially capitalized pending a determination of whether we find proved reserves. If we find proved reserves, the costs of exploratory wells remain capitalized. Otherwise, we charge the costs of the related wells to expense. In some cases, we cannot determine whether we have found proved reserves at the completion of exploration drilling, and must conduct additional testing and evaluation of the wells. We generally expense the costs of such exploratory wells if we do not determine we have found proved reserves within a 12-month period after drilling is complete.
We determine depreciation and depletion of oil and gas producing properties by the unit-of-production method. We amortize acquisition costs over total proved reserves and capitalized development and successful exploration costs over proved developed reserves.
Proved oil and gas reserves and production volumes are used as the basis for recording depreciation and depletion of oil and gas producing properties. Proved reserves are those quantities of oil and gas which, by analysis of geoscience and engineering data, can be estimated with reasonable certainty to be economically producible—from a given date forward, from known reservoirs, and under existing economic conditions, operating methods, and government regulations—regardless of whether deterministic or probabilistic methods are used for the estimation. We have no proved oil and gas reserves for which the determination of economic producibility is subject to the completion of major additional capital investments.
Several factors could change our proved oil and gas reserves. For example, we receive a share of production from certain arrangements in the Wilmington field similar to production-sharing contracts to recover costs and generally an additional share for profit. Our share of production and reserves from these contracts decreases when product prices rise and increases when prices decline. Overall, our net economic benefit from these contracts is greater at higher product prices. In other cases, particularly with long-lived properties, lower product prices may lead to a situation where production of a portion of proved reserves becomes uneconomic. For such properties, higher product prices typically result in additional reserves becoming economic. Estimation of future production and development costs is also subject to change partially due to factors beyond our control, such as energy costs and inflation or deflation of oil field service costs. These factors, in turn, could lead to changes in the quantity of proved reserves. Additional factors that could result in a change of proved reserves include production decline rates and operating performance differing from those estimated when the proved reserves were initially recorded.
Additionally, we perform impairment tests with respect to our proved properties when product prices decline other than temporarily, reserves estimates change significantly, other significant events occur or management’s plans change with respect to these properties in a manner that may impact our ability to realize the recorded asset amounts. Impairment tests incorporate a number of assumptions involving expectations of undiscounted future cash flows, which can change significantly over time. These assumptions include estimates of future product prices, which we base on forward price curves and, when applicable, contractual prices, estimates of oil and gas reserves and estimates of future expected operating and development costs. Apart from the effect of product prices, we believe our approach to interpreting technical data regarding proved oil and gas reserves makes it more likely that future proved reserves revisions will be positive rather than negative.
75
The most significant ongoing financial statement effect from a change in our oil and gas reserves or impairment of the carrying value of our proved properties would be to the DD&A rate. For example, a 5% increase or decrease in the amount of oil and gas reserves would change the DD&A rate by approximately $1.00 per barrel, which would increase or decrease pre-tax income (loss) by approximately $35 million annually based on production rates for the year ended December 31, 2016.
A portion of the carrying value of our oil and gas properties is attributable to unproved properties. At December 31, 2016, the net capitalized costs attributable to unproved properties were approximately $300 million. The unproved amounts are not subject to DD&A until they are classified as proved properties. However, if the exploration and development work were to be unsuccessful, or management decided not to pursue development of these properties as a result of lower commodity prices, higher development and operating costs, contractual conditions or other factors, the capitalized costs of the related properties would be expensed. The timing of any write-downs of unproved properties, if warranted, depends upon management’s plans, the nature, timing and extent of future exploration and development activities and their results. We believe our current plans and exploration and development efforts will allow us to realize the carrying value of our unproved property balance at December 31, 2016.
At year-end 2015, we performed impairment tests with respect to our proved and unproved properties triggered by the sharp drop in oil prices in the fourth quarter of 2015. As a result, in the fourth quarter of 2015, we recorded pre-tax asset impairment charges of $4.9 billion on certain proved and unproved properties throughout our asset base. Approximately $100 million of the charge was related to unproved properties.
At year-end 2014, we performed impairment tests with respect to our proved and unproved properties as a result of significant declines in oil prices largely during the last half of 2014. Consequently, in the fourth quarter of 2014, we recorded pre-tax asset impairment charges of $3.4 billion on certain proved and unproved properties throughout our asset base. Approximately $650 million of the charge was related to unproved properties.
In 2015 and 2014, we recorded impairment charges on our properties, in part, based on year-end forward price curves, as well as assessing projects we determined we would not pursue in the foreseeable future given the then current environment. To the extent prices recover to levels above those year-end forward price curves, we would expect a substantial portion of these assets would ultimately become economic.
Fair Value Measurements
We have categorized our assets and liabilities that are measured at fair value in a three-level fair value hierarchy, based on the inputs to the valuation techniques: Level 1—using quoted prices in active markets for the assets or liabilities; Level 2—using observable inputs other than quoted prices for the assets or liabilities; and Level 3—using unobservable inputs. Transfers between levels, if any, are recognized at the end of each reporting period. We primarily apply the market approach for recurring fair value measurement, maximize our use of observable inputs and minimize use of unobservable inputs. We generally use an income approach to measure fair value when observable inputs are unavailable. This approach utilizes management’s judgments regarding expectations of projected cash flows and discounts those cash flows using a risk-adjusted discount rate.
The most significant items on our balance sheet that would be affected by recurring fair value measurements are derivatives. Commodity derivatives are carried at fair value. We utilize the mid-point between bid and ask prices for valuing these instruments. In addition to using market data in determining these fair values, we make assumptions about the risks inherent in the inputs to the valuation technique. Our commodity derivatives comprise OTC bilateral financial commodity contracts, which are generally valued using industry-standard models that consider various inputs, including quoted forward prices for commodities, time value, volatility factors, credit risk and current market and contracted prices for the underlying instruments, as well as other relevant economic measures. Substantially all of these inputs are observable data or are supported by observable prices at which transactions are executed in the marketplace. We classify these measurements as Level 2. Based on the $97 million net derivative liability as of December 31, 2016, a 10% increase or decrease in their fair value would affect pre-tax earnings by approximately $10 million.
76
Our property, plant and equipment is written down to fair value if we determine that there has been an impairment in its value. The fair value is determined as of the date of the assessment using discounted cash flow models based on management’s expectations for the future. Inputs include estimates of future production, prices based on commodity forward price curves as of the date of the estimate, estimated future operating and development costs and a risk-adjusted discount rate.
Other Loss Contingencies
In the normal course of business, we are involved in lawsuits, claims and other environmental and legal proceedings and audits. We accrue reserves for these matters when it is probable that a liability has been incurred and the liability can be reasonably estimated. In addition, we disclose, if material, in aggregate, our exposure to loss in excess of the amount recorded on the balance sheet for these matters if it is reasonably possible that an additional material loss may be incurred. We review our loss contingencies on an ongoing basis.
Loss contingencies are based on judgments made by management with respect to the likely outcome of these matters and are adjusted as appropriate. Management’s judgments could change based on new information, changes in, or interpretations of, laws or regulations, changes in management’s plans or intentions, opinions regarding the outcome of legal proceedings, or other factors. See ‘‘Item 7 — Lawsuits, Claims, Contingencies and Commitments’’ for additional information.
Significant Accounting and Disclosure Changes
During 2016, the Financial Accounting Standards Board (FASB) issued rules clarifying the new revenue recognition standard issued in 2014. Under the new standard, an entity will recognize revenue when it transfers promised goods or services to customers in an amount that reflects the consideration to which the entity expects to be entitled in exchange for those goods or services. The new standard also requires more detailed disclosures related to the nature, timing, amount and uncertainty of revenue and cash flows arising from contracts with its customers. We will adopt these rules when they become effective for interim and annual reporting periods beginning with our first quarter of 2018. We believe the implementation of these rules will not have a material impact on the timing or net amounts of our commodity sales. However, we will enhance our disclosures to meet the new requirements.
In August 2016, the FASB issued rules that modify how certain cash receipts and cash payments are presented and classified in the statement of cash flows. These rules are effective for fiscal years beginning after December 15, 2017 and interim periods within those fiscal years, with earlier adoption permitted. We are currently evaluating the impact of these rules on our financial statements.
In June 2016, the FASB issued rules that change how entities will measure credit losses for certain financial assets and other instruments that are not measured at fair value. These rules are effective for fiscal years beginning after December 15, 2019, including interim periods within those fiscal years, with early adoption permitted. We are currently evaluating the impact of these rules on our financial statements.
In February 2016, the FASB issued rules requiring lessees to recognize assets and liabilities on the balance sheet for the rights and obligations created by all leases with terms of more than 12 months and to include qualitative and quantitative disclosures with respect to the amount, timing, and uncertainty of cash flows arising from leases. These rules will be effective for fiscal years beginning after December 15, 2018, including interim periods within those fiscal years, with earlier application permitted. We are currently evaluating the impact of these rules on our financial statements.
In January 2016, the FASB issued rules that modify how entities measure equity investments and present changes in the fair value of financial liabilities. Unless the investments qualify for a practicality exception, the new rules require all equity investments to be measured at fair value with changes in the fair value recognized through net income (other than those accounted for under the equity method of accounting or those that result in consolidation of the investee). Entities will have to record changes in instrument-specific credit risk for financial liabilities measured under the fair value option in other comprehensive income. These new rules become effective for fiscal years beginning after December 15, 2017 with no early adoption permitted. We do not expect the adoption of these rules to have a significant impact on our financial statements.
77
ITEM 7A | QUANTITATIVE AND QUALITATIVE DISCLOSURES ABOUT MARKET RISK |
Commodity Price Risk
General
Our results are sensitive to fluctuations in oil, NGL and gas prices. We expect that in 2017 price changes at current levels of production and prices, including the impact of existing hedges, will affect our pre-tax annual income and cash flows consistent with the following table:
Pre-tax 2017 Price Sensitivities | On Income | On Cash | |
$1 change in Brent index - Oil(a) | $18.0 million | $18.0 million | |
$1 change in Brent index - NGLs | $2.8 million | $2.8 million | |
$0.50 change in NYMEX - Gas | $11.8 million | $11.8 million | |
(a) Amounts reflect the sensitivity with respect to unhedged barrels at a Brent index price exceeding $56.00 a barrel and include the effect of production sharing type contracts in our Wilmington field operations. At a Brent index price between $50.00 and $56.00 the sensitivity is $21 million and below $50.00 the sensitivity is $16 million.
These price-change sensitivities include the impact on income of volume changes under arrangements similar to production-sharing contracts. If production and price levels change in the future, the sensitivity of our results to prices also will change.
Derivatives
As of December 31, 2016, we had a net derivative liability of $97 million carried at fair value, using industry-standard models with various inputs, including quoted forward prices. See additional hedging information in ‘Item 7 — Management's Discussion and Analysis of Financial Condition and Results of Operations – Liquidity and Capital Resources."
Counterparty Credit Risk
Our credit risk relates primarily to trade receivables and derivative financial instruments. Credit exposure for each customer is monitored for outstanding balances and current activity. For derivative swaps and options entered into as part of our hedging program, we are subject to counterparty credit risk to the extent the counterparty is unable to meet its settlement commitments. We actively manage this credit risk by selecting counterparties that we believe to be financially strong and continuing to monitor their financial health. Concentration of credit risk is regularly reviewed to ensure that counterparty credit risk is adequately diversified.
As of December 31, 2016, the substantial majority of the credit exposures related to our business was with investment grade counterparties. We believe exposure to credit-related losses related to our business at December 31, 2016 was not material and losses associated with credit risk have been insignificant for all years presented.
Concentration of Credit Risk
Through July 2014, substantially all of our products were sold through Occidental’s marketing subsidiaries at market prices and were settled at the time of sale to those entities. Beginning August 2014, we began marketing our own products directly to third parties. For the year ended December 31, 2014, sales through Occidental subsidiaries accounted for approximately 65% of our net sales, respectively. For the year ended December 31, 2016, Phillips 66 Company, Tesoro Refining & Marketing Company LLC, Valero Marketing & Supply Company and Shell Trading (US) Company each accounted for at least 10%, and, collectively, 67% of our revenue. For the year ended December 31, 2015, Phillips 66 Company, Tesoro Refining & Marketing Company LLC and Valero Marketing & Supply Company each accounted for at least 10%, and collectively, 64% of our revenue. For the year ended December 31, 2014, ConocoPhillips/Phillips 66 Company and Tesoro Refining & Marketing Company LLC each accounted for at least 10%, and, collectively, 45% of our revenue.
78
Interest Rate Risk
As of December 31, 2016, we had borrowings of $1.5 billion outstanding under our 2014 First-Out Credit Facilities and approximately $1 billion outstanding under our 2016 Second-Out Credit Agreement, both of which carry variable interest rates. A one-eighth percent change in the interest rates on these outstanding borrowings under these facilities would result in an approximately $3 million change in annual interest expense.
The following table shows our fixed- and variable-rate debt as of December 31, 2016 (in millions):
Year of Maturity | U.S. Dollar Fixed-Rate Debt | U.S. Dollar Variable-Rate Debt | Total | |||||||||
2017 | $ | — | $ | 100 | $ | 100 | ||||||
2018 | — | 100 | 100 | |||||||||
2019 | — | 1,297 | 1,297 | |||||||||
2020 | 193 | — | 193 | |||||||||
2021 | 561 | 1,000 | 1,561 | |||||||||
Thereafter | 2,017 | — | 2,017 | |||||||||
Total | $ | 2,771 | $ | 2,497 | $ | 5,268 | ||||||
Weighted-average interest rate | 7.53 | % | 6.91 | % | 7.24 | % | ||||||
Fair Value | $ | 2,390 | $ | 2,497 | $ | 4,887 | ||||||
FORWARD-LOOKING STATEMENTS
This presentation contains forward-looking statements that involve risks and uncertainties that could materially affect our expected results of operations, liquidity, cash flows and business prospects. Such statements include those regarding our expectations as to our future:
• | financial position, liquidity, cash flows, and results of operations |
• | business prospects |
• | transactions and projects |
• | operating costs |
• | operations and operational results including production, hedging, capital investment and expected VCI |
• | budgets and maintenance capital requirements |
• | reserves |
79
Actual results may differ from anticipated results, sometimes materially, and reported results should not be considered an indication of future performance. While we believe assumptions or bases underlying our expectations are reasonable and make them in good faith, they almost always vary from actual results, sometimes materially. We also believe third party statements we cite are accurate but have not independently verified them and do not warrant their accuracy or completeness. Factors (but not necessarily all the factors) that could cause results to differ include:
• | commodity price changes |
• | debt limitations on our financial flexibility |
• | insufficient cash flow to fund planned investment |
• | inability to enter desirable transactions including asset sales and joint ventures |
• | legislative or regulatory changes, including those related to drilling, completion, well stimulation, operation, maintenance or abandonment of wells or facilities, managing energy, water, land, greenhouse gases or other emissions, protection of health, safety and the environment, or transportation, marketing and sale of our products |
• | unexpected geologic conditions |
• | changes in business strategy |
• | inability to replace reserves |
• | insufficient capital, including as a result of lender restrictions, unavailability of capital markets or inability to attract potential investors |
• | inability to enter efficient hedges |
• | equipment, service or labor price inflation or unavailability |
• | availability or timing of, or conditions imposed on, permits and approvals |
• | lower-than-expected production, reserves or resources from development projects or acquisitions or higher-than-expected decline rates |
• | disruptions due to accidents, mechanical failures, transportation constraints, natural disasters, labor difficulties, cyber attacks or other catastrophic events |
• | factors discussed in “Item 1A – Risk Factors”. |
Words such as "anticipate," "believe," "continue," "could," "estimate," "expect," "goal," "intend," "likely," "may," "might," "plan," "potential," "project," "seek," "should," "target, "will" or "would" and similar words that reflect the prospective nature of events or outcomes typically identify forward-looking statements. Any forward-looking statement speaks only as of the date on which such statement is made and should not be relied on unduly. We undertake no obligation to correct or update any forward-looking statement, whether as a result of new information, future events or otherwise, except as required by applicable law.
80
ITEM 8 | FINANCIAL STATEMENTS AND SUPPLEMENTARY DATA |
Report of Independent Registered Public Accounting Firm on Consolidated and Combined Financial Statements
To the Board of Directors and Stockholders
California Resources Corporation:
We have audited the accompanying consolidated balance sheets of California Resources Corporation and subsidiaries (the Company) as of December 31, 2016 and 2015, and the related consolidated and combined statements of operations, comprehensive income, equity and cash flows for each of the years in the three‑year period ended December 31, 2016. These consolidated and combined financial statements are the responsibility of the Company’s management. Our responsibility is to express an opinion on these consolidated and combined financial statements based on our audits.
We conducted our audits in accordance with the standards of the Public Company Accounting Oversight Board (United States). Those standards require that we plan and perform the audit to obtain reasonable assurance about whether the financial statements are free of material misstatement. An audit includes examining, on a test basis, evidence supporting the amounts and disclosures in the financial statements. An audit also includes assessing the accounting principles used and significant estimates made by management, as well as evaluating the overall financial statement presentation. We believe that our audits provide a reasonable basis for our opinion.
In our opinion, the consolidated and combined financial statements referred to above present fairly, in all material respects, the financial position of California Resources Corporation and subsidiaries as of December 31, 2016 and 2015, and the results of their operations and their cash flows for each of the years in the three‑year period ended December 31, 2016, in conformity with U.S. generally accepted accounting principles.
We also have audited, in accordance with the standards of the Public Company Accounting Oversight Board (United States), California Resources Corporation’s internal control over financial reporting as of December 31, 2016, based on criteria established in Internal Control - Integrated Framework issued in 2013 by the Committee of Sponsoring Organizations of the Treadway Commission (COSO), and our report dated February 24, 2017 expressed an unqualified opinion on the effectiveness of the Company’s internal control over financial reporting.
/s/ KPMG LLP | ||
Los Angeles, California
February 24, 2017
81
Report of Independent Registered Public Accounting Firm on Internal Control Over Financial Reporting
To the Board of Directors and Stockholders
California Resources Corporation:
We have audited California Resources Corporation’s (the Company) internal control over financial reporting as of December 31, 2016, based on criteria established in Internal Control - Integrated Framework issued in 2013 by the Committee of Sponsoring Organizations of the Treadway Commission (COSO). California Resources Corporation’s management is responsible for maintaining effective internal control over financial reporting and for its assessment of the effectiveness of internal control over financial reporting, included in the accompanying Management’s Annual Assessment of and Report on Internal Control Over Financial Reporting. Our responsibility is to express an opinion on the Company’s internal control over financial reporting based on our audit.
We conducted our audit in accordance with the standards of the Public Company Accounting Oversight Board (United States). Those standards require that we plan and perform the audit to obtain reasonable assurance about whether effective internal control over financial reporting was maintained in all material respects. Our audit included obtaining an understanding of internal control over financial reporting, assessing the risk that a material weakness exists, and testing and evaluating the design and operating effectiveness of internal control based on the assessed risk. Our audit also included performing such other procedures as we considered necessary in the circumstances. We believe that our audit provides a reasonable basis for our opinion.
A company’s internal control over financial reporting is a process designed to provide reasonable assurance regarding the reliability of financial reporting and the preparation of financial statements for external purposes in accordance with generally accepted accounting principles. A company’s internal control over financial reporting includes those policies and procedures that (1) pertain to the maintenance of records that, in reasonable detail, accurately and fairly reflect the transactions and dispositions of the assets of the company; (2) provide reasonable assurance that transactions are recorded as necessary to permit preparation of financial statements in accordance with generally accepted accounting principles, and that receipts and expenditures of the company are being made only in accordance with authorizations of management and directors of the company; and (3) provide reasonable assurance regarding prevention or timely detection of unauthorized acquisition, use, or disposition of the company’s assets that could have a material effect on the financial statements.
Because of its inherent limitations, internal control over financial reporting may not prevent or detect misstatements. Also, projections of any evaluation of effectiveness to future periods are subject to the risk that controls may become inadequate because of changes in conditions, or that the degree of compliance with the policies or procedures may deteriorate.
In our opinion, California Resources Corporation maintained, in all material respects, effective internal control over financial reporting as of December 31, 2016, based on criteria established in Internal Control - Integrated Framework issued in 2013 by the Committee of Sponsoring Organizations of the Treadway Commission (COSO).
We also have audited, in accordance with the standards of the Public Company Accounting Oversight Board (United States), the consolidated balance sheets of California Resources Corporation and subsidiaries as of December 31, 2016 and 2015, and the related consolidated and combined statements of operations, comprehensive income, equity and cash flows for each of the years in the three-year period ended December 31, 2016, and our report dated February 24, 2017 expressed an unqualified opinion on those consolidated and combined financial statements.
/s/ KPMG LLP | ||
Los Angeles, California
February 24, 2017
82
CALIFORNIA RESOURCES CORPORATION AND SUBSIDIARIES
Consolidated Balance Sheets
As of December 31, 2016 and 2015
(in millions, except share data)
2016 | 2015 | ||||||
CURRENT ASSETS | |||||||
Cash and cash equivalents | $ | 12 | $ | 12 | |||
Trade receivables, net | 232 | 200 | |||||
Inventories | 58 | 58 | |||||
Other current assets | 123 | 168 | |||||
Total current assets | 425 | 438 | |||||
PROPERTY, PLANT AND EQUIPMENT | 20,915 | 20,996 | |||||
Accumulated depreciation, depletion and amortization | (15,030 | ) | (14,684 | ) | |||
Total property, plant, equipment | 5,885 | 6,312 | |||||
OTHER ASSETS | 44 | 303 | |||||
TOTAL ASSETS | $ | 6,354 | $ | 7,053 | |||
CURRENT LIABILITIES | |||||||
Current maturities of long-term debt | $ | 100 | $ | 100 | |||
Accounts payable | 219 | 257 | |||||
Accrued liabilities | 407 | 222 | |||||
Current income taxes | — | 26 | |||||
Total current liabilities | 726 | 605 | |||||
LONG-TERM DEBT - PRINCIPAL AMOUNT | 5,168 | 6,043 | |||||
DEFERRED GAIN AND ISSUANCE COSTS, NET | 397 | 491 | |||||
OTHER LONG-TERM LIABILITIES | 620 | 830 | |||||
EQUITY | |||||||
Preferred stock (20 million shares authorized at $0.01 par value) no shares outstanding at December 31, 2016 or 2015 | — | — | |||||
Common stock (200 million shares authorized at $0.01 par value) outstanding shares (2016 — 42,542,637 shares and 2015 — 38,818,048 shares) | — | — | |||||
Additional paid-in capital | 4,861 | 4,782 | |||||
Accumulated deficit | (5,404 | ) | (5,683 | ) | |||
Accumulated other comprehensive loss | (14 | ) | (15 | ) | |||
Total equity | (557 | ) | (916 | ) | |||
TOTAL LIABILITIES AND EQUITY | $ | 6,354 | $ | 7,053 | |||
The accompanying notes are an integral part of these consolidated and combined financial statements.
83
CALIFORNIA RESOURCES CORPORATION AND SUBSIDIARIES
Consolidated and Combined Statements of Operations
For the years ended December 31, 2016, 2015 and 2014
(in millions, except share data)
2016 | 2015 | 2014 | |||||||||
REVENUES AND OTHER | |||||||||||
Oil and gas net sales | $ | 1,621 | $ | 2,134 | $ | 1,447 | |||||
Oil and gas sales to related parties | — | — | 2,617 | ||||||||
Net derivative (losses) gains | (206 | ) | 133 | (5 | ) | ||||||
Other revenue | 132 | 136 | 114 | ||||||||
Total revenues and other | 1,547 | 2,403 | 4,173 | ||||||||
COSTS AND OTHER | |||||||||||
Production costs | 800 | 951 | 1,057 | ||||||||
General and administrative expenses | 248 | 354 | 302 | ||||||||
Depreciation, depletion and amortization | 559 | 1,004 | 1,198 | ||||||||
Asset impairments | — | 4,852 | 3,402 | ||||||||
Taxes other than on income | 144 | 180 | 217 | ||||||||
Exploration expense | 23 | 36 | 139 | ||||||||
Other expenses, net | 79 | 168 | 207 | ||||||||
Total costs and other | 1,853 | 7,545 | 6,522 | ||||||||
OPERATING LOSS | (306 | ) | (5,142 | ) | (2,349 | ) | |||||
NON-OPERATING INCOME (LOSS) | |||||||||||
Interest and debt expense, net | (328 | ) | (326 | ) | (72 | ) | |||||
Net gains on early extinguishment of debt | 805 | 20 | — | ||||||||
Other non-operating income (expense) | 30 | (28 | ) | — | |||||||
INCOME (LOSS) BEFORE INCOME TAXES | 201 | (5,476 | ) | (2,421 | ) | ||||||
Income tax benefit | 78 | 1,922 | 987 | ||||||||
NET INCOME (LOSS) | $ | 279 | $ | (3,554 | ) | $ | (1,434 | ) | |||
Net income (loss) per share of common stock | |||||||||||
Basic | $ | 6.76 | $ | (92.79 | ) | $ | (37.54 | ) | |||
Diluted | $ | 6.76 | $ | (92.79 | ) | $ | (37.54 | ) | |||
Dividends per common share | $ | — | $ | 0.30 | $ | — | |||||
The accompanying notes are an integral part of these consolidated and combined financial statements.
84
CALIFORNIA RESOURCES CORPORATION AND SUBSIDIARIES
Consolidated and Combined Statements of Comprehensive Income
For the years ended December 31, 2016, 2015 and 2014
(in millions)
2016 | 2015 | 2014 | |||||||||
Net income (loss) | $ | 279 | $ | (3,554 | ) | $ | (1,434 | ) | |||
Other comprehensive income (loss) items: | |||||||||||
Unrealized (losses) gains on derivatives (a) | — | — | (2 | ) | |||||||
Pension and postretirement (losses) gains(b) | (9 | ) | (2 | ) | (1 | ) | |||||
Reclassification to income of realized losses (gains) on derivatives (c) | — | — | 3 | ||||||||
Reclassification to income of realized losses (gains) on pensions (d) | 10 | 11 | — | ||||||||
Other comprehensive income, net of tax | 1 | 9 | — | ||||||||
Comprehensive income (loss) | $ | 280 | $ | (3,545 | ) | $ | (1,434 | ) | |||
(a) | Net of tax of zero for 2016 and 2015, respectively, and $1 million for 2014. |
(b) | Net of tax of zero, $1 million and $1 million for 2016, 2015 and 2014, respectively. See Note 13, Retirement and Postretirement Benefit Plans, for additional information. |
(c) | Net of tax of zero for 2016 and 2015, respectively, and $(2) million in 2014. |
(d) | Net of tax of zero, $(7) million and zero for 2016, 2015 and 2014, respectively. See Note 13, Retirement and Postretirement Benefit Plans, for additional information. |
The accompanying notes are an integral part of these consolidated and combined financial statements.
85
CALIFORNIA RESOURCES CORPORATION AND SUBSIDIARIES
Consolidated and Combined Statements of Equity
For the years ended December 31, 2016, 2015 and 2014
(in millions)
Common Stock | Additional Paid-in Capital | Accumulated Deficit | Accumulated Other Comprehensive Income (Loss) | Net Parent Company Investment | Total Equity/Net Investment | ||||||||||||||||||
Balance, December 31, 2013 | $ | — | $ | — | $ | — | $ | (24 | ) | $ | 10,013 | $ | 9,989 | ||||||||||
Net income (loss)(a) | — | — | (2,117 | ) | — | 683 | (1,434 | ) | |||||||||||||||
Net contributions from Occidental(b) | — | — | — | — | 56 | 56 | |||||||||||||||||
Dividend to Occidental | — | — | — | — | (6,000 | ) | (6,000 | ) | |||||||||||||||
Issuance of common stock at Spin-off | — | — | — | — | — | — | |||||||||||||||||
Reclassification of net parent company investment to additional paid-in capital | — | 4,752 | — | — | (4,752 | ) | — | ||||||||||||||||
Balance, December 31, 2014 | $ | — | $ | 4,752 | $ | (2,117 | ) | $ | (24 | ) | $ | — | $ | 2,611 | |||||||||
Net income (loss) | — | — | (3,554 | ) | — | — | (3,554 | ) | |||||||||||||||
Other comprehensive income, net of tax | — | — | — | 9 | — | 9 | |||||||||||||||||
Dividends on common stock | — | — | (12 | ) | — | — | (12 | ) | |||||||||||||||
Issuance of common stock and other, net | — | 30 | — | — | — | 30 | |||||||||||||||||
Balance, December 31, 2015 | $ | — | $ | 4,782 | $ | (5,683 | ) | $ | (15 | ) | $ | — | $ | (916 | ) | ||||||||
Net income (loss) | — | — | 279 | — | — | 279 | |||||||||||||||||
Other comprehensive income, net of tax | — | — | — | 1 | — | 1 | |||||||||||||||||
Dividends on common stock | — | — | — | — | — | — | |||||||||||||||||
Issuance of common stock and other, net | — | 79 | — | — | — | 79 | |||||||||||||||||
Balance, December 31, 2016 | $ | — | $ | 4,861 | $ | (5,404 | ) | $ | (14 | ) | $ | — | $ | (557 | ) | ||||||||
(a) | Net income of $683 million related to operations from January 1, 2014 through the spin-off date of November 30, 2014 was included in Net Parent Company Investment. The net loss of $2,117 million for the month ended December 31, 2014 reflected our accumulated deficit as of that date as a stand-alone company. |
(b) | Net contributions from Occidental include non-cash contributions of approximately $400 million, predominantly trade receivables, partially offset by $335 million in cash distributions to Occidental. |
The accompanying notes are an integral part of these consolidated and combined financial statements.
86
CALIFORNIA RESOURCES CORPORATION AND SUBSIDIARIES
Consolidated and Combined Statements of Cash Flows
For the years ended December 31, 2016, 2015 and 2014
(in millions)
2016 | 2015 | 2014 | |||||||||
CASH FLOW FROM OPERATING ACTIVITIES | |||||||||||
Net income (loss) | $ | 279 | $ | (3,554 | ) | $ | (1,434 | ) | |||
Adjustments to reconcile net income (loss) to net cash provided by operating activities: | |||||||||||
Depreciation, depletion and amortization | 559 | 1,004 | 1,198 | ||||||||
Asset impairments | — | 4,852 | 3,402 | ||||||||
Deferred income tax benefit | (78 | ) | (2,258 | ) | (1,152 | ) | |||||
Net derivative losses (gains) | 206 | (133 | ) | 5 | |||||||
Net proceeds (payments) on settled derivatives | 77 | 81 | (2 | ) | |||||||
Net gains on early extinguishment of debt | (805 | ) | (20 | ) | — | ||||||
Deferred gain and issuance costs amortization | (41 | ) | 7 | — | |||||||
Other non-cash tax provision | — | 310 | — | ||||||||
Other non-cash losses in income, net | 41 | 200 | 113 | ||||||||
Dry hole expenses | 3 | 9 | 101 | ||||||||
Changes in operating assets and liabilities, net: | |||||||||||
(Increase) decrease in receivables, net | (33 | ) | 99 | 146 | |||||||
(Increase) decrease in inventories | — | — | 2 | ||||||||
(Increase) decrease in other current assets | 25 | 18 | (133 | ) | |||||||
Increase (decrease) in accounts payable and accrued liabilities | (103 | ) | (212 | ) | 125 | ||||||
Net cash provided by operating activities | 130 | 403 | 2,371 | ||||||||
CASH FLOW FROM INVESTING ACTIVITIES | |||||||||||
Capital investments | (75 | ) | (401 | ) | (2,089 | ) | |||||
Changes in capital investment accruals | (6 | ) | (205 | ) | 69 | ||||||
Asset divestitures | 20 | — | — | ||||||||
Acquisitions and other | — | (151 | ) | (292 | ) | ||||||
Net cash used by investing activities | (61 | ) | (757 | ) | (2,312 | ) | |||||
CASH FLOW FROM FINANCING ACTIVITIES | |||||||||||
Proceeds from revolving credit facility | 2,218 | 2,035 | 515 | ||||||||
Repayments of revolving credit facility | (2,110 | ) | (1,656 | ) | (155 | ) | |||||
Issuance of senior notes | — | — | 5,000 | ||||||||
Issuance of term loans | 990 | — | 1,000 | ||||||||
Debt repurchases | (770 | ) | (12 | ) | — | ||||||
Payments on first-lien first-out term loan | (350 | ) | — | — | |||||||
Debt transaction costs | (51 | ) | (11 | ) | (70 | ) | |||||
Issuance of common stock | 4 | 8 | — | ||||||||
Cash dividends paid | — | (12 | ) | — | |||||||
Distributions to Occidental, net | — | — | (335 | ) | |||||||
Dividends to Occidental | — | — | (6,000 | ) | |||||||
Net cash provided (used) by financing activities | (69 | ) | 352 | (45 | ) | ||||||
(Decrease) increase in cash and cash equivalents | — | (2 | ) | 14 | |||||||
Cash and cash equivalents—beginning of year | 12 | 14 | — | ||||||||
Cash and cash equivalents—end of year | $ | 12 | $ | 12 | $ | 14 | |||||
The accompanying notes are an integral part of these consolidated and combined financial statements.
87
CALIFORNIA RESOURCES CORPORATION AND SUBSIDIARIES
Notes to Consolidated and Combined Financial Statements
NOTE 1 THE SPIN-OFF, SUMMARY OF SIGNIFICANT ACCOUNTING POLICIES AND OTHER
The Separation and Spin-off
We are an independent oil and natural gas exploration and production company operating properties within the state of California. We were incorporated in Delaware as a wholly owned subsidiary of Occidental Petroleum Corporation (Occidental) on April 23, 2014, and remained a wholly owned subsidiary of Occidental until November 30, 2014. Prior to November 30, 2014, all material existing assets, operations and liabilities of Occidental's California business were consolidated under us. On November 30, 2014, Occidental distributed shares of our common stock on a pro-rata basis to Occidental stockholders and we became an independent, publicly traded company (the Spin-off). Occidental initially retained approximately 18.5% of our outstanding shares of common stock, which it distributed to Occidental stockholders on March 24, 2016.
Except when the context otherwise requires or where otherwise indicated, (1) all references to ‘‘CRC,’’ the ‘‘Company,’’ ‘‘we,’’ ‘‘us’’ and ‘‘our’’ refer to California Resources Corporation and its subsidiaries or the California business, (2) all references to the ‘‘California business’’ refer to Occidental’s California oil and gas exploration and production operations and related assets, liabilities and obligations, which we have assumed in connection with the Spin-off, and (3) all references to ‘‘Occidental’’ refer to Occidental Petroleum Corporation, our former parent, and its subsidiaries.
Basis of Presentation
Until the Spin-off, the accompanying financial statements were derived from the consolidated financial statements and accounting records of Occidental and were presented on a combined basis for the pre-Spin-off periods. These financial statements reflect the historical results of operations, financial position and cash flows of the California business. All financial information presented after the Spin-off consists of our stand-alone consolidated results of operations, financial position and cash flows. We account for our share of oil and gas exploration and production ventures, in which we have a direct working interest, by reporting our proportionate share of assets, liabilities, revenues, costs and cash flows within the relevant lines on the balance sheets and statements of operations and cash flows.
The statements of operations for periods prior to the Spin-off include expense allocations for certain corporate functions and centrally-located activities historically performed by Occidental. These functions include executive oversight, accounting, treasury, tax, financial reporting, finance, internal audit, legal, risk management, information technology, government relations, public relations, investor relations, human resources, procurement, engineering, drilling, exploration, marketing, ethics and compliance, and certain other shared services. These allocations were based primarily on specific identification of time or activities associated with us, employee headcount or our relative size compared to Occidental. Our management believes the assumptions underlying the financial statements, including the assumptions regarding allocating expenses from Occidental, are reasonable. However, the financial statements for the pre-Spin-off periods may not include all of the actual expenses that would have been incurred, may include duplicative costs and may not reflect our results of operations, financial position and cash flows had we operated as a stand-alone public company during the periods presented. Actual costs that would have been incurred if we had been a stand-alone company prior to the Spin-off would depend on multiple factors, including organizational structure and strategic and operating decisions.
The assets and liabilities in the consolidated and combined financial statements are presented on a historical cost basis. We have eliminated all of our significant intercompany transactions and accounts. Prior to the Spin-off, we participated in Occidental’s centralized treasury management program and had not incurred any debt. Additionally, excess cash generated by our business was distributed to Occidental, and likewise our cash needs were provided by Occidental in the form of contributions.
88
All financial information represents our post Spin-off stand-alone consolidated financial position, results of operations and cash flows, except as follows:
• | Our consolidated and combined statements of operations, comprehensive income and cash flows for the year ended December 31, 2014 consist of the consolidated results for the month ended December 31, 2014 and the combined results of the California business prior to the Spin-off. |
• | Our consolidated and combined statement of changes in equity for the year ended December 31, 2014 consists of both the California business prior to the Spin-off and our consolidated activity subsequent to the Spin-off. |
Had we been a stand-alone company for the full year 2014, and had the same level of debt throughout the year as we did on December 31, 2014, of approximately $6.4 billion, we would have incurred $314 million of interest expense, on a pro-forma basis, for the year ended December 31, 2014, compared to the $72 million pre-tax interest expense reported in our statement of operations for the year then ended.
Certain prior year amounts have been reclassified to conform to the 2016 presentation. In 2016, we reclassified net derivative gains (losses) out of other revenue to its own line item. Prior period gains (losses) on debt transactions were reclassified from other expenses, net, to gains on early extinguishment of debt. We also reclassified transaction costs related to our 2015 debt exchange from other expenses, net, to other non-operating income (expense). The current portion of deferred taxes of $59 million as of December 31, 2015 was also reclassified from other current assets to other assets in accordance with the retrospective application of recently adopted accounting rules.
Risks and Uncertainties
The process of preparing financial statements in conformity with United States generally accepted accounting principles requires management to make informed estimates and judgments regarding certain types of financial statement balances and disclosures. Such estimates primarily relate to unsettled transactions and events as of the date of the financial statements and judgments on expected outcomes as well as the materiality of transactions and balances. Changes in facts and circumstances or discovery of new information relating to such transactions and events may result in revised estimates and judgments and actual results may differ from estimates upon settlement. Management believes that these estimates and judgments provide a reasonable basis for the fair presentation of our financial statements.
Revenue Recognition
We recognize revenue from oil and natural gas production when title has passed from us to the transportation company or the customer, as applicable. We recognize our share of revenues net of any royalties and other third-party share.
Net Parent Company Investment
Prior to the Spin-off, our balance sheets included net parent company investment, which represented Occidental's historical investment in us, our accumulated net income and the net effect of transactions with, and allocations from, Occidental.
Inventories
Materials and supplies are valued at weighted-average cost and are reviewed periodically for obsolescence. Finished goods include oil and natural gas products, which are valued at the lower of cost or market.
Property, Plant and Equipment
The carrying value of our property, plant and equipment (PP&E) represents the cost incurred to acquire or develop the asset, including any asset retirement obligations and capitalized interest, net of accumulated depreciation, depletion and amortization (DD&A) and any impairment charges. For assets acquired, initial PP&E cost is based on fair values at the acquisition date. Asset retirement obligations are capitalized and amortized over the lives of the related assets.
89
We use the successful efforts method to account for our oil and gas properties. Under this method, we capitalize costs of acquiring properties, costs of drilling successful exploration wells and development costs. The costs of exploratory wells, including permitting, land preparation and drilling costs, are initially capitalized pending a determination of whether we find proved reserves. If we find proved reserves, the costs of exploratory wells remain capitalized. Otherwise, we charge the costs of the related wells to expense. In some cases, we cannot determine whether we have found proved reserves at the completion of exploration drilling, and must conduct additional testing and evaluation of the wells. We generally expense the costs of such exploratory wells if we do not determine we have found proved reserves within a 12-month period after drilling is complete.
The following table summarizes the activity of capitalized exploratory well costs for the years ended December 31:
2016 | 2015 | 2014 | |||||||||
(in millions) | |||||||||||
Balance - beginning of year | $ | 6 | $ | 4 | $ | 18 | |||||
Additions to capitalized exploratory well costs pending the determination of proved reserves | 1 | 16 | 3 | ||||||||
Reclassification to property, plant and equipment based on the determination of proved reserves | — | (5 | ) | (8 | ) | ||||||
Capitalized exploratory well costs charged to expense | (3 | ) | (9 | ) | (9 | ) | |||||
Balance - end of year | $ | 4 | $ | 6 | $ | 4 | |||||
We expense annual lease rentals; the costs of injection used in production and exploration; and geological, geophysical and seismic costs as incurred. Costs of maintenance and repairs are expensed as incurred, except that the costs of replacements that expand capacity or add proven oil and gas reserves are capitalized.
We determine depreciation and depletion of oil and gas producing properties by the unit-of-production method. We amortize acquisition costs over total proved reserves, and capitalized development and successful exploration costs over proved developed reserves. Substantially all of our total depreciation, depletion and amortization expense relates to production costs.
Proved oil and gas reserves and production volumes are used as the basis for recording depreciation and depletion of oil and gas properties. Proved reserves are those quantities of oil and natural gas which, by analysis of geoscience and engineering data, can be estimated with reasonable certainty to be economically producible—from a given date forward, from known reservoirs, and under existing economic conditions, operating methods, and government regulations—prior to the time at which contracts providing the right to operate expire, unless evidence indicates that renewal is reasonably certain, regardless of whether deterministic or probabilistic methods are used for the estimation. We have no proved oil and gas reserves for which the determination of economic producibility is subject to the completion of major additional capital investments.
Our gas plant and power plant assets are depreciated over the estimated useful lives of the assets, using the straight-line method, with expected initial useful lives of the assets ranging from two to 30 years. Other non-producing property and equipment is depreciated using the straight-line method based on expected initial lives of the individual assets or group of assets ranging from two to 20 years.
We perform impairment tests with respect to proved properties when product prices decline other than temporarily, reserves estimates change significantly, other significant events occur or management's plans change with respect to these properties in a manner that may impact our ability to realize the recorded asset amounts. Impairment tests incorporate a number of assumptions involving expectations of undiscounted future cash flows, which can change significantly over time. These assumptions include estimates of future product prices, which we base on forward price curves and, when applicable, contractual prices, estimates of oil and gas reserves and estimates of future expected operating and development costs. Any impairment loss would be calculated as the excess of the asset's net book value over its estimated fair value. We recognize any impairment loss on proved properties by adjusting the carrying amount of the asset.
90
A portion of the carrying value of our oil and gas properties is attributable to unproved properties. We evaluate these properties, in part, based on year-end forward price curves as well as assessing projects we determined we would not pursue in the foreseeable future. At December 31, 2016, the net capitalized costs attributable to unproved properties were approximately $300 million. The unproved amounts are not subject to DD&A until they are classified as proved properties. As exploration and development work progresses, if reserves on these properties are proved, capitalized costs attributable to the properties become subject to DD&A. If the exploration and development work were to be unsuccessful, or management decided not to pursue development of these properties as a result of lower commodity prices, higher development and operating costs, contractual conditions or other factors, the capitalized costs of the related properties would be expensed. The timing of any write-downs of these unproved properties, if warranted, depends upon management's plans, the nature, timing and extent of future exploration and development activities and their results. We recognize any impairment loss on unproved properties by providing a valuation allowance.
At year-end 2015, we performed impairment tests with respect to our proved and unproved properties triggered by the sharp drop in oil prices in the fourth quarter of 2015. As a result, in the fourth quarter of 2015, we recorded pre-tax asset impairment charges of $4.9 billion on certain proved and unproved properties throughout our asset base. Approximately $100 million of the charge was related to unproved properties.
At year-end 2014, we performed impairment tests with respect to our proved and unproved properties as a result of significant declines in oil prices largely during the last half of 2014. As a result, in the fourth quarter of 2014, we recorded pre-tax asset impairment charges of $3.4 billion on certain proved and unproved properties throughout our asset base. Approximately $650 million of the charge was related to unproved properties.
Asset Retirement Obligations
We recognize the fair value of asset retirement obligations in the period in which a determination is made that a legal obligation exists to dismantle an asset and reclaim or remediate the property at the end of its useful life and the cost of the obligation can be reasonably estimated. The liability amounts are based on future retirement cost estimates and incorporate many assumptions such as time to abandonment, technological changes, future inflation rates and the risk-adjusted discount rate. When the liability is initially recorded, we capitalize the cost by increasing the related PP&E balances. If the estimated future cost of the asset retirement obligation changes, we record an adjustment to both the asset retirement obligation and PP&E. Over time, the liability is increased and expense is recognized for accretion, and the capitalized cost is depreciated over the useful life of the asset.
At certain of our facilities, we have identified asset retirement obligations that are related mainly to plant and field decommissioning, including plugging and abandonment of wells. In certain cases, we do not know or cannot estimate when we may settle these obligations and, therefore, we cannot reasonably estimate the fair value of these liabilities. We will recognize these asset retirement obligations in the periods in which sufficient information becomes available to reasonably estimate their fair values. Additionally, for certain plants, we do not have a legal obligation to decommission them and accordingly we have not recorded a liability.
The following table summarizes the activity of our asset retirement obligation, of which $397 million and $343 million is included in other long-term liabilities, with the remaining current portion in accrued liabilities at December 31, 2016 and 2015, respectively.
For the years ended December 31, | |||||||
2016 | 2015 | ||||||
(in millions) | |||||||
Beginning balance | $ | 357 | $ | 415 | |||
Liabilities incurred - capitalized to PP&E | 2 | 7 | |||||
Liabilities settled and paid | (10 | ) | (18 | ) | |||
Accretion expense | 22 | 20 | |||||
Disposition and other - changes in PP&E | (17 | ) | — | ||||
Revisions to estimated cash flows - changes in PP&E | 57 | (67 | ) | ||||
Ending balance | $ | 411 | $ | 357 | |||
91
Derivative Instruments
Our derivatives are carried at fair value and on a net basis when a legal right of offset exists with the same counterparty. Fair value gains and losses from derivative instruments are recognized in earnings in the current period and are reported on a net basis in the statements of operations.
Unless otherwise indicated, we use the term "hedge" to describe derivative instruments that are designed to achieve our hedging program goals, even though they are not necessarily accounted for as cash-flow or fair-value hedges.
Stock-Based Incentive Plans
We have stockholder approved stock-based incentive plans for certain employees and directors that are more fully described in Note 10. A summary of our accounting policy for awards issued under our plans is as follows.
The fair value of stock options is measured on the grant date using the Black-Scholes option valuation model and expensed on a straight-line basis over the vesting period. The model uses various assumptions, based on management's estimates at the time of grant, which impact the calculation of fair value and ultimately the amount of expense recognized over the vesting period of the stock option award. The expected life of stock options is calculated based on the simplified method and represents the period of time that options granted are expected to be held prior to exercise. In the absence of adequate stock price history of our common stock, the volatility factor was based on the average volatilities of the stocks of a select group of peer companies. The risk-free interest rate is the implied yield available on zero-coupon United States (U.S.) Treasury notes at the grant date with a remaining term approximating the expected life. The dividend yield is the expected annual dividend yield over the expected life, expressed as a percentage of the stock price on the grant date. Of the required assumptions, the expected life of the stock option award and the expected volatility have the most significant impact on the fair value calculation. Estimates of fair value are not intended to, and may not, accurately predict the value ultimately realized by employees who receive the awards, and the ultimate value may not be indicative of the reasonableness of the original estimates of fair value made by us.
The performance targets under the 2015 Performance Stock Unit (PSU) awards are based 50% on achievement of specified Value Creation Index (VCI) results and 50% on total stockholder return (TSR) relative to a selected peer group of companies over specified multi-year performance periods, with payouts ranging from 0% to 200% of the target award. The awards were originally cash-settled awards accounted for as liability awards until they were modified in 2016 and became stock-settled awards accounted for as equity awards. Dividend equivalents, if any, declared during the vesting period are accumulated and paid upon certification, for the number of vested shares.
Prior to the modification, the fair value of the VCI-based portions of the PSU were initially determined on the grant date based on an estimated performance achievement at the target level. Additionally, the fair value of the TSR-based portions of the PSU were initially determined on the grant date using a Monte Carlo simulation model based on applicable assumptions. The volatility is derived from corresponding peer group companies, which we used in the absence of adequate stock price history for our common stock. The expected life is based on the vesting period of the award. The risk-free rate is the implied yield available on zero-coupon U.S. Treasury notes at the time of grant and subsequent measurement periods with a remaining term equal to the remaining term of the awards. The dividend yield is the expected annual dividend yield over the term, expressed as a percentage of the stock price on the valuation date. Estimates of fair value are not intended to, and may not, accurately predict the value ultimately realized by the employees who receive the awards, and the ultimate value may not be indicative of the reasonableness of the original estimates of fair value made by us. The fair values were then recognized on a straight-line basis over the requisite service period, adjusted for actual forfeitures. Compensation expense was adjusted quarterly, on a cumulative basis, for any changes in the number of share equivalents expected to be paid based on the relevant performance criteria. All such performance or stock-price-related changes were recognized in compensation expense.
On the modification date, the fair value of the PSUs was redetermined based on target-level VCI and TSR Monte Carlo results as of that date. The resulting fair value is being recognized as compensation expense on a straight-line basis over the remaining requisite service period, adjusted for actual forfeitures.
For cash-settled restricted stock units (RSU), compensation value is initially measured on the grant date using the quoted market price of our common stock, which is then recognized on a straight-line basis over the requisite service periods, adjusted for actual forfeitures. Compensation expense is adjusted on a quarterly basis for the cumulative changes in the value of the underlying stock.
92
For stock-settled RSU and restricted stock awards, compensation value is initially measured on the grant date using the quoted market price of our common stock, which is then recognized on a straight-line basis over the requisite service periods, adjusted for actual forfeitures.
For performance-based restricted stock awards, compensation value is initially measured on the grant date using the quoted market price of our common stock and estimated performance achievement based on a cumulative EBITDA target, which is then recognized on a straight-line basis over the requisite service period, adjusted for actual forfeitures.
For all of our awards with nonforfeitable dividend rights (except for PSU awards noted above), dividends or dividend equivalents declared during the vesting period are paid as declared.
Earnings Per Share
We compute basic earnings per share (EPS) by dividing net income available to common stockholders by the weighted-average common shares outstanding during the period and compute diluted EPS by dividing earnings available to common stockholders by the weighted-average shares outstanding during the period and the impact of securities that, if exercised, would have a dilutive effect on EPS.
We compute basic EPS under the two-class method, which is a method of computing EPS when an entity has both common stock and participating securities. We consider unvested restricted stock as a participating security if it contains rights to receive non-forfeitable dividends at the same rate as common stock. Under the two-class method, we exclude any income and distributions attributable to participating securities from the calculation of basic and diluted EPS and exclude the participating securities from the weighted-average shares outstanding.
Retirement and Postretirement Benefit Plans
Prior to the Spin-off, a majority of our employees participated in postretirement benefit plans sponsored by Occidental, which included participants from other Occidental subsidiaries. These plans had an insignificant amount of assets and were substantially funded as benefits were paid. We recognized a liability in the accompanying balance sheets for the employees of the California business. The related postretirement expenses were allocated to us from Occidental based on the employees of the California business. Following the Spin-off, all of our employees participate in postretirement benefit plans sponsored by us. These plans are funded as benefits are paid.
For defined benefit pension and postretirement plans that are sponsored by us, we recognize the net overfunded or underfunded amounts in the financial statements using a December 31 measurement date.
We determine our defined benefit pension and postretirement benefit plan obligations based on various assumptions and discount rates. The discount rate assumptions used are meant to reflect the interest rate at which the obligations could effectively be settled on the measurement date. We estimate the rate of return on assets with regard to current market factors but within the context of historical returns.
Pension plan assets are measured at fair value. Publicly registered mutual funds are valued using quoted market prices in active markets. Commingled funds are valued at the fund units’ net asset value (NAV) provided by the issuer, which represents the quoted price in a non-active market. Guaranteed deposit accounts are valued at the book value provided by the issuer.
Actuarial gains and losses that have not yet been recognized through income are recorded in accumulated other comprehensive income within equity, net of taxes, until they are amortized as a component of net periodic benefit cost.
Fair Value Measurements
We have categorized our assets and liabilities that are measured at fair value in a three-level fair value hierarchy, based on the inputs to the valuation techniques: Level 1—using quoted prices in active markets for the assets or liabilities; Level 2—using observable inputs other than quoted prices for the assets or liabilities; and Level 3—using unobservable inputs. Transfers between levels, if any, are recognized at the end of each reporting period. We apply the market approach for certain recurring fair value measurements, maximize our use of observable inputs and minimize use of unobservable inputs. We generally use an income approach to measure fair value when observable inputs are unavailable. This approach utilizes management's judgments regarding expectations of projected cash flows and discounts those cash flows using a risk-adjusted discount rate.
93
Commodity derivatives are carried at fair value. We utilize the mid-point between bid and ask prices for valuing these instruments. In addition to using market data in determining these fair values, we make assumptions about the risks inherent in the inputs to the valuation technique. Our commodity derivatives comprise over-the-counter (OTC) bilateral financial commodity contracts, which are generally valued using industry-standard models that consider various inputs, including quoted forward prices for commodities, time value, volatility factors, credit risk and current market and contracted prices for the underlying instruments, as well as other relevant economic measures. Substantially all of these inputs are observable data or are supported by observable prices at which transactions are executed in the marketplace. We classify these measurements as Level 2.
Our property, plant and equipment is written down to fair value if we determine that there has been an impairment in its value. The fair value is determined as of the date of the assessment using discounted cash flow models based on management’s expectations for the future. Inputs include estimates of future production, prices based on commodity forward price curves as of the date of the estimate, estimated future operating and development costs and a risk-adjusted discount rate.
The carrying amounts of cash and other on-balance sheet financial instruments, other than fixed-rate debt, approximate fair value.
Income Taxes
Until the Spin-off, our taxable income was historically included in the consolidated U.S. federal income tax returns of Occidental and in a number of their consolidated state income tax returns. In the accompanying financial statements, our provision for income taxes through the Spin-off is computed as if we were a stand-alone tax-paying entity.
Deferred tax assets and liabilities are recognized for the estimated future tax consequences attributable to differences between the financial statement carrying amounts of assets and liabilities and their tax bases. Deferred tax assets are recorded when it is more likely than not that they will be realized. We periodically assess our deferred tax assets and reduce such assets by a valuation allowance if we deem it is more likely than not that some portion or all of the deferred tax assets will not be realized.
We recognize interest and penalties, if any, related to uncertain tax positions as a component of the income tax provision. No interest or penalties related to uncertain tax positions were recognized in the financial statements for the periods presented.
Other Current Assets
Other current assets at December 31, 2016 and 2015 included net amounts due from joint interest partners of $44 million and $42 million, derivative assets from commodities contracts of $39 million and $87 million and prepaid expenses of $14 million and $26 million, respectively.
Accrued Liabilities
Accrued liabilities reflected derivative liabilities from commodities contracts of $103 million and $1 million at December 31, 2016 and 2015, respectively; greenhouse gas obligations of $89 million and $6 million at December 31, 2016 and 2015, respectively; accrued employee-related costs of $91 million and $105 million at December 31, 2016 and 2015, respectively, and accrued interest of $25 million and $39 million at December 31, 2016 and 2015, respectively.
Supplemental Cash Flow Information
We have not made United States federal and state income tax payments in 2016 and 2015 due to the taxable loss we incurred. Until the Spin-off, our share of Occidental's tax payments or refunds were paid or received, as applicable, by Occidental. During the year ended December 31, 2014, Occidental paid approximately $165 million on our behalf. We also paid taxes other than on income, consisting mostly of property taxes, of approximately $115 million, $154 million and $183 million during the years ended December 31, 2016, 2015 and 2014, respectively. Interest paid totaled approximately $384 million, $359 million and $3 million, respectively, for the years ended December 31, 2016, 2015 and 2014.
In 2014, Occidental transferred to us certain assets, liabilities and accruals, of which the most significant consisted of outstanding trade receivables of approximately $400 million. These non-cash transfers and the corresponding net contribution to us from Occidental were excluded from net cash provided by operating activities and cash flow from financing activities.
94
Major Customers
For the year ended December 31, 2016, Phillips 66 Company, Tesoro Refining & Marketing Company LLC, Valero Marketing & Supply Company and Shell Trading (US) Company each accounted for at least 10%, and, collectively, 67% of our revenue. For the year ended December 31, 2015, Phillips 66 Company, Tesoro Refining & Marketing Company LLC and Valero Marketing & Supply Company each accounted for at least 10%, and collectively, 64% of our revenue. For the year ended December 31, 2014, ConocoPhillips/Phillips 66 Company and Tesoro Refining & Marketing Company LLC each accounted for at least 10%, and, collectively, 45% of our revenue.
Reverse Stock Split
We completed a reverse stock split on May 31, 2016 using a ratio of one share of common stock for every ten shares then outstanding. Share and per share amounts included in this report have been restated to reflect this reverse stock split.
The split proportionally decreased the number of authorized shares of common stock from 2.0 billion shares to 200 million shares and preferred stock from 200 million to 20 million shares. The compensation committee of our board approved proportionate adjustments to the number of shares outstanding and available for issuance under our stock-based compensation plans and to the exercise price, grant price or purchase price relating to any award under the plans, using the same reverse-split ratio, pursuant to existing authority granted to the committee under the plans.
NOTE 2 ACCOUNTING AND DISCLOSURE CHANGES
Recently Issued Accounting and Disclosure Changes
During 2016, the Financial Accounting Standards Board (FASB) issued rules clarifying the new revenue recognition standard issued in 2014. Under the new standard, an entity will recognize revenue when it transfers promised goods or services to customers in an amount that reflects the consideration to which the entity expects to be entitled in exchange for those goods or services. The new standard also requires more detailed disclosures related to the nature, timing, amount and uncertainty of revenue and cash flows arising from contracts with its customers. We will adopt these rules when they become effective for interim and annual reporting periods beginning with our first quarter of 2018. We believe the implementation of these rules will not have a material impact on the timing or net amounts of our recurring commodity sales. However, we will enhance our disclosures to meet the new requirements.
In August 2016, the FASB issued rules that modify how certain cash receipts and cash payments are presented and classified in the statement of cash flows. These rules are effective for fiscal years beginning after December 15, 2017 and interim periods within those fiscal years, with earlier adoption permitted. We are currently evaluating the impact of these rules on our financial statements.
In June 2016, the FASB issued rules that change how entities will measure credit losses for certain financial assets and other instruments that are not measured at fair value. These rules are effective for fiscal years beginning after December 15, 2019, including interim periods within those fiscal years, with early adoption permitted. We are currently evaluating the impact of these rules on our financial statements.
In February 2016, the FASB issued rules requiring lessees to recognize assets and liabilities on the balance sheet for the rights and obligations created by all leases with terms of more than 12 months and to include qualitative and quantitative disclosures with respect to the amount, timing, and uncertainty of cash flows arising from leases. These rules will be effective for fiscal years beginning after December 15, 2018, including interim periods within those fiscal years, with earlier application permitted. We are currently evaluating the impact of these rules on our financial statements.
In January 2016, the FASB issued rules that modify how entities measure equity investments and present changes in the fair value of financial liabilities. Unless the investments qualify for a practicality exception, the new rules require all equity investments to be measured at fair value with changes in the fair value recognized through net income (other than those accounted for under the equity method of accounting or those that result in consolidation of the investee). Entities will have to record changes in instrument-specific credit risk for financial liabilities measured under the fair value option in other comprehensive income. These new rules become effective for fiscal years beginning after December 15, 2017 with no early adoption permitted. We do not expect the adoption of these rules to have a significant impact on our financial statements.
95
Recently Adopted Accounting and Disclosure Changes
In March 2016, the FASB simplified several aspects of the accounting for employee share-based payment transactions, including the accounting for income taxes, forfeitures, and statutory tax withholding requirements, as well as classification in the statement of cash flows. We adopted these rules in 2016 with no material changes reflected in our financial statements.
In November 2015, the FASB issued rules requiring that deferred income tax liabilities and assets be classified as noncurrent in a classified balance sheet. We adopted the new rule in 2016 and reclassified the current portion of deferred tax assets of $59 million as of December 31, 2015 from other current assets to other assets.
In August 2014, the FASB issued rules relating to management's responsibility to evaluate and make disclosures, if applicable, regarding the entity's ability to continue as a going concern within one year after the date that the financial statements are issued. We adopted these rules in 2016 with no material changes reflected in our financial statements.
In June 2014, the FASB issued rules for employee share-based payment awards in which the terms of the awards provide that a performance target can be achieved after the requisite service period. A performance target that affects vesting and that could be achieved after the requisite service period will be treated as a performance condition. We adopted these rules in 2016 with no material changes reflected in our financial statements.
NOTE 3 ACQUISITIONS AND DIVESTITURES
In February 2017, we divested non-core assets resulting in $32 million of proceeds. Additionally, we entered into a joint venture with a third party that is committed to invest $50 million initially and up to an additional $200 million subject to agreement of the parties. The funds will be used to develop certain of our oil and gas properties in exchange for a contribution of a net profits interest in such properties. After the investor achieves its targeted rate of return, the interests revert back to us.
2016
During the year ended December 31, 2016, there were no acquisitions. However, we divested non-core assets resulting in $20 million of proceeds and a $30 million gain included in other non-operating income (expense).
2015
During the year ended December 31, 2015, we paid approximately $140 million to acquire certain producing and non-producing oil and gas properties, primarily in the San Joaquin basin.
2014
During the year ended December 31, 2014, we paid approximately $290 million to acquire certain producing and non-producing oil and gas properties, including oil and gas properties in the Ventura basin purchased for approximately $200 million in the fourth quarter of 2014.
NOTE 4 INVENTORIES
Inventories consisted of the following:
Balance at December 31, | |||||||
2016 | 2015 | ||||||
(in millions) | |||||||
Materials and supplies | $ | 55 | $ | 55 | |||
Finished goods | 3 | 3 | |||||
Total | $ | 58 | $ | 58 | |||
96
NOTE 5 DEBT
Debt consisted of the following:
December 31, | |||||||
2016 | 2015 | ||||||
(in millions) | |||||||
2014 First-Out Credit Facilities (Secured First Lien) | |||||||
Revolving Credit Facility | $ | 847 | $ | 739 | |||
Term Loan Facility | 650 | 1,000 | |||||
2016 Second-Out Credit Agreement (Secured First Lien) | 1,000 | — | |||||
Senior Notes (Secured Second Lien) | |||||||
8% Notes Due 2022 | 2,250 | 2,250 | |||||
Senior Unsecured Notes | |||||||
5% Notes Due 2020 | 193 | 433 | |||||
5½% Notes Due 2021 | 135 | 829 | |||||
6% Notes Due 2024 | 193 | 892 | |||||
Total Debt - Principal Amount | 5,268 | 6,143 | |||||
Less Current Maturities of Long-Term Debt | (100 | ) | (100 | ) | |||
Long-Term Debt - Principal Amount | $ | 5,168 | $ | 6,043 | |||
At December 31, 2016, deferred gain and issuance costs were $397 million net, consisting of $489 million of deferred gains offset by $92 million of deferred issuance costs and original issue discounts. The December 31, 2015 deferred gain and issuance costs were $491 million net, consisting of $560 million of deferred gains offset by $69 million of deferred issuance costs.
Credit Facilities
2014 First-Out Credit Facilities
Our first-lien, first-out credit facilities (2014 First-Out Credit Facilities) comprise (i) a $650 million senior term loan facility (the Term Loan Facility) and (ii) a $1.4 billion senior revolving loan facility (the Revolving Credit Facility). We are permitted to increase the size of the Revolving Credit Facility by up to $250 million if we obtain additional commitments from new or existing lenders. The facilities mature at the earlier of November 2019 and the 182nd day prior to the maturity of our 5% senior unsecured notes due January 15, 2020 (2020 notes), to the extent more than $100 million of such notes remain outstanding at such date. The Revolving Credit Facility includes a sub-limit of $400 million for the issuance of letters of credit. Our credit limit under our 2014 First-Out Credit Facilities is $2.05 billion. Borrowings under these facilities are also subject to a borrowing base, which was reaffirmed at $2.3 billion as of November 1, 2016.
As of December 31, 2016 and 2015, we had outstanding borrowings of $847 million and $739 million under our Revolving Credit Facility, and $650 million and $1 billion under the Term Loan Facility, respectively. At December 31, 2016, we had $1 billion outstanding under a new first-lien, second-out term loan credit facility (2016 Second-Out Credit Agreement). We made payments on the Term Loan Facility during each of the four quarters in 2016 totaling $100 million and a $250 million prepayment from proceeds of the 2016 Second-Out Credit Agreement.
As of February 2016, we amended the 2014 First-Out Credit Facilities to change certain of our financial and other covenants. We again amended this agreement in April 2016 to facilitate certain types of deleveraging transactions, in August 2016 to further change certain of the covenants, grant additional collateral to our lenders and permit the incurrence of debt under the 2016 Second-Out Credit Agreement and in February 2017 to facilitate additional joint venture transactions and note repurchases, eliminate our capital expenditure restriction and adopt a minimum liquidity covenant.
97
We have granted the lenders under the 2014 First-Out Credit Facilities a first-priority lien in a substantial majority of our assets, including our Elk Hills power plant and midstream assets. We also granted a lien in the same assets to the lenders under our 2016 Second-Out Credit Agreement and the holders of our 8% senior secured second lien notes due in 2022 (2022 notes).
Borrowings under the 2014 First-Out Credit Facilities bear interest, at our election, at either a LIBOR rate or an alternate base rate (ABR) (equal to the greatest of (i) the administrative agent’s prime rate, (ii) the one-month LIBOR rate plus 1.00% and (iii) the federal funds effective rate plus 0.50%), in each case plus an applicable margin. This applicable margin is based, while our total leverage ratio exceeds 3.00:1.00, on our borrowing base utilization and will vary from (a) in the case of LIBOR loans, 2.50% to 3.50% and (b) in the case of ABR loans, 1.50% to 2.50%. The unused portion of the Revolving Credit Facility commitments is subject to a commitment fee equal to 0.50% per annum. We also pay customary fees and expenses under the 2014 First-Out Credit Facilities. Interest on ABR loans is payable quarterly in arrears. Interest on LIBOR loans is payable at the end of each LIBOR period, but not less than quarterly.
Our financial performance covenants under the 2014 First-Out Credit Facilities require that (i) the ratio of our first-lien, first-out secured debt to trailing four quarter EBITDAX (the First-Lien First-Out Leverage Ratio) not exceed 3.50 to 1.00 at any quarter end through the quarter ending June 30, 2017 and 3.25 to 1.00 for the quarters ending September 30 and December 31, 2017 and (ii) the total interest expense coverage ratio at each quarter end not be less than 1.20 to 1.00 at any quarter end through the quarter ending December 31, 2017. Beginning with the end of the first quarter of 2018, the First-Lien First-Out Leverage Ratio may not exceed 2.25 to 1.00 and the total interest expense coverage ratio may not be less than 2.00 to 1.00. The covenants also include a requirement that the first-lien asset coverage ratio of 1.20 to 1.00 as of any June 30 and December 31 beginning December 31, 2016 and a requirement that minimum monthly liquidity be not less than $250 million. As of January 31, 2017, we had approximately $486 million of liquidity, subject to the minimum liquidity requirement.
We must apply 100% of the proceeds from asset sales to repay loans outstanding under the 2014 First-Out Credit Facilities; except that we are permitted to (i) use up to 50% (or, if our leverage ratio is less than 4:00 to 1:00, 60%) of proceeds from non-borrowing base asset sales or monetizations to repurchase our notes to the extent available at a significant minimum discount to par, as specified in the facilities and (ii) purchase up to $140 million of certain of our unsecured notes at a discount. The 2014 First-Out Credit Facilities also permit us to incur up to an additional $50 million of non-facility indebtedness, which may be secured by non-borrowing base assets, subject to compliance with our financial covenants and indentures, the proceeds of which must be applied to repay the Term Loan Facility. We must apply cash on hand in excess of $150 million daily to repay amounts outstanding under our Revolving Credit Facility. Further, we are restricted from paying dividends or making other distributions to common stockholders.
Our borrowing base under the 2014 First-Out Credit Facilities is redetermined each May 1 and November 1. The borrowing base will be based upon a number of factors, including commodity prices and reserves. Increases in our borrowing base require approval of at least 80% of our revolving lenders, as measured by exposure, while decreases or affirmations require a two-thirds approval. We and the lenders (requiring a request from the lenders holding two-thirds of the revolving commitments and outstanding loans) each may request a special redetermination once in any period between three consecutive scheduled redeterminations. We will be permitted to have collateral released when both (i) our credit ratings are at least Baa3 from Moody's and BBB- from S&P, in each case with a stable or better outlook, and (ii) certain permitted liens securing other debt are released.
2016 Second-Out Credit Agreement
The net borrowings under the 2016 Second-Out Credit Agreement were used to (i) prepay $250 million of the Term Loan Facility and (ii) reduce our Revolving Credit Facility by $740 million. The proceeds received were net of a $10 million original issue discount. The loan under the 2016 Second-Out Credit Agreement bears interest at a floating rate per annum equal to 10.375% plus LIBOR, subject to a 1.00% LIBOR floor, determined for the applicable interest period (or ABR rates in certain circumstances). Interest on ABR loans is payable quarterly in arrears. Interest on LIBOR loans is payable at the end of each LIBOR period, but not less than quarterly.
The 2016 Second-Out Credit Agreement is secured by a security interest in the same collateral used to secure the 2014 First-Out Credit Facilities, but, under intercreditor arrangements with our 2014 First-Out Credit Facilities lenders, are second in collateral recovery behind such lenders. Prepayment of the 2016 Second-Out Credit Agreement is subject to a make-whole premium prior to the third anniversary of closing and a premium to par equal
98
to 50% of coupon between the third anniversary and the fourth anniversary. Following the fourth anniversary, we may redeem at par. The 2016 Second-Out Credit Agreement matures on December 31, 2021, but if the aggregate principal amount outstanding of either our 2020 Notes or our 5½% senior unsecured notes due September 15, 2021 (2021 Notes) exceeds $100 million 91 days prior to their respective maturity dates, the maturity date of the term loans will accelerate to such prior 91st day. As of December 31, 2016, we had $193 million and $135 million in aggregate principal amount of outstanding 2020 notes and 2021 notes, respectively.
The 2016 Second-Out Credit Agreement provides for customary covenants and events of default consistent with, or generally less restrictive than, the covenants in our 2014 First-Out Credit Facilities, including limitations on additional indebtedness, liens, asset dispositions, investments, restricted payments and other negative covenants, in each case subject to certain limitations and exceptions. Additionally, the 2016 Second-Out Credit Agreement requires us to maintain a first-lien asset coverage ratio of 1.20 to 1.00 as of any June 30 and December 31 beginning December 31, 2016, consistent with the 2014 First-Out Credit Facilities.
Senior Notes
In October 2014, we issued $5.00 billion in aggregate principal amount of our senior unsecured notes, including $1.00 billion of 2020 notes, $1.75 billion of 2021 notes and $2.25 billion of 6% senior unsecured notes due November 15, 2024 (the 2024 notes, and together with the 2020 notes and the 2021 notes, the unsecured notes). We used the net proceeds from the issuance of the unsecured notes to make a $4.95 billion cash distribution to Occidental in October 2014.
In December 2015, we exchanged $534 million, $921 million and $1,358 million in aggregate principal amount of the 2020 notes, the 2021 notes, and the 2024 notes, respectively, for $2.25 billion in aggregate principal amount of the newly issued 2022 notes. We recorded a deferred gain of approximately $560 million on the debt exchange, which will be amortized using the effective interest rate method over the term of the 2022 notes. Our 2022 notes are secured on a second-priority basis, subject to the terms of an intercreditor agreement and collateral trust agreement, by a lien on the same collateral used to secure our obligations under our 2014 First-Out Credit Facilities and 2016 Second-Out Credit Agreement (the Credit Facilities).
In January and February 2016, we repurchased over $100 million in aggregate principal amount of our unsecured notes for under $13 million in cash, for a gain of $87 million, net of related expenses. In May 2016, we entered into privately negotiated exchange agreements with a holder of our 2024 notes and our 2021 notes to exchange a total of approximately 2.1 million shares of our common stock on a post-split basis for notes in the aggregate principal amount of $80 million, resulting in a $44 million pre-tax gain, net of related expenses.
In August 2016, we repurchased $197 million, $605 million and $613 million in aggregate principal amount of our 2020 notes, 2021 notes and 2024 notes, respectively, for $750 million using our Revolving Credit Facility, resulting in a $660 million pre-tax gain, net of related expenses.
In October 2016, we entered into privately negotiated exchange agreements with certain holders of our 2024 notes and 2021 notes to exchange a total of 1.3 million shares of our common stock for notes in the aggregate principal amount of $22 million, resulting in a $8 million pre-tax gain, net of related expenses.
In the fourth quarter of 2016, we repurchased $11 million in aggregate principal amount of our 2024 and 2021 notes for $6 million, resulting in a $4 million pre-tax gain, net of related expenses.
We will pay interest semiannually in cash in arrears on January 15 and July 15 for the 2020 notes, on March 15 and September 15 for the 2021 notes, on June 15 and December 15 for the 2022 notes and on May 15 and November 15 for the 2024 notes.
The indentures governing the unsecured notes and the 2022 notes each include covenants that, among other things, limit our and our subsidiaries’ ability to incur debt secured by liens. The indentures also restrict our ability to merge or consolidate with, or transfer all or substantially all of our assets to, another entity. These covenants are subject to a number of important qualifications and limitations that are set forth in the indenture. The covenants are not, however, directly linked to measures of our financial performance. In addition, if we experience a “change of control triggering event” (as defined in the indentures) with respect to a series of notes, we will be required, unless we have exercised our right to redeem the notes of such series, to offer to purchase the notes of such series at a purchase price equal to 101% of their principal amount, plus accrued and unpaid interest. The indenture governing
99
our second lien secured notes also restricts our ability to sell certain assets and to release collateral from liens securing the second lien secured notes, unless the collateral is released in compliance with our Credit Facilities.
All obligations under the Credit Facilities and the notes are guaranteed jointly and severally by all of our material wholly owned subsidiaries. The assets and liabilities of subsidiaries not guaranteeing the debt are de minimis.
At December 31, 2016, we were in compliance with all the financial and other covenants under our Credit Facilities.
Principal maturities of long-term debt outstanding at December 31, 2016 are as follows (in millions):
2017 | $ | 100 | |
2018 | 100 | ||
2019 | 1,297 | ||
2020 | 193 | ||
2021 | 1,561 | ||
Thereafter | 2,017 | ||
Total(a) | $ | 5,268 | |
(a) | For information on potential springing maturities, see the "Credit Facilities" and "Senior Notes" sections above. |
We estimate the fair value of fixed-rate debt, which is classified as Level 1, based on prices from known market transactions for our instruments. The estimated fair value of our debt at December 31, 2016 and December 31, 2015, including the fair value of the variable rate portion, was approximately $4.9 billion and $3.6 billion, respectively, compared to a carrying value of approximately $5.3 billion and $6.1 billion. A one-eighth percent change in the variable interest rates on the borrowings under our Credit Facilities on December 31, 2016, would result in a $3 million change in annual interest expense.
As of December 31, 2016, we had letters of credit of approximately $130 million under the Revolving Credit Facility. As of December 31, 2015, we had letters of credit in the aggregate amount of $70 million (including $49 million under the Revolving Credit Facility). These letters of credit were issued to support ordinary course marketing, insurance, regulatory and other matters.
NOTE 6 LEASE COMMITMENTS
We have entered into various operating lease agreements, mainly for office space, office equipment and field equipment. We lease assets when leasing offers greater operating flexibility. Lease payments are generally expensed as part of production costs or general and administrative expenses. At December 31, 2016, future net minimum lease payments for noncancelable operating leases (excluding oil and natural gas and other mineral leases, utilities, taxes, insurance and maintenance expense) totaled:
Amount | |||
(in millions) | |||
2017 | $ | 16 | |
2018 | 16 | ||
2019 | 14 | ||
2020 | 8 | ||
2021 | 8 | ||
Thereafter | 50 | ||
Total minimum lease payments | $ | 112 | |
Rental expense for operating leases was $13 million in 2016, $11 million in 2015 and $10 million in 2014. Minimum future lease payments and rental income from subleases was immaterial in 2016, 2015 and 2014.
NOTE 7 LAWSUITS, CLAIMS, COMMITMENTS AND CONTINGENCIES
100
We, or certain of our subsidiaries, are involved, in the normal course of business, in lawsuits, environmental and other claims and other contingencies that seek, among other things, compensation for alleged personal injury, breach of contract, property damage or other losses, punitive damages, civil penalties, or injunctive or declaratory relief.
On April 21, 2016, a purported class action was filed against us in the United States District Court for the Southern District of New York on behalf of all beneficial owners of our unsecured notes from November 12, 2015 to the present. The complaint alleges that our December 2015 debt exchange excluded non-qualified institutional holders in violation of the Trust Indenture Act of 1939 and related law and, thereby, impaired their rights to receive principal and interest payments. The purported class action seeks declaratory relief that the debt exchange and the liens securing the new notes are null and void and that the debt exchange resulted in a default. The plaintiff also seeks monetary damages and attorneys’ fees. We plan to vigorously defend against the claims made by the plaintiff.
We accrue reserves for currently outstanding lawsuits, claims and proceedings when it is probable that a liability has been incurred and the liability can be reasonably estimated. Reserve balances at December 31, 2016 and 2015 were not material to our balance sheets as of such dates. We also evaluate the amount of reasonably possible losses that we could incur as a result of these matters. We believe that reasonably possible losses that we could incur in excess of reserves accrued on our balance sheet would not be material to our consolidated financial position or results of operations.
We have certain commitments under contracts, including purchase commitments for goods and services. At December 31, 2016, total purchase obligations on a discounted basis were approximately $340 million, which included approximately $74 million, $189 million, $30 million, $12 million and $4 million that will be paid in 2017, 2018, 2019, 2020 and 2021, respectively. Included in these obligations is a commitment to invest approximately $170 million in evaluation and development activities for one of our oil and gas properties prior to the end of 2018. Any deficiency in meeting this capital investment obligation would need to be paid in cash. Our 2017 capital program includes development plans for these properties, and we expect to fulfill the minimum investment requirement.
We, our subsidiaries, or both, have indemnified various parties against specific liabilities those parties might incur in the future in connection with the Spin-off, purchases and other transactions that they have entered into with us. These indemnities include indemnities made to Occidental against certain tax-related liabilities that may be incurred by Occidental relating to the Spin-off and liabilities related to operation of our business while it was still owned by Occidental. As of December 31, 2016, we are not aware of material indemnity claims pending or threatened against the Company.
NOTE 8 DERIVATIVES
We use a variety of derivative instruments to protect our cash flows, margins and capital investment program from the cyclical nature of commodity prices and to improve our ability to comply with the covenants of our credit facilities in case of further price deterioration. We will continue to be strategic and opportunistic in implementing our hedging program as market conditions permit.
Derivatives are carried at fair value and on a net basis when a legal right of offset exists with the same counterparty. We apply hedge accounting when transactions meet specified criteria for cash-flow hedge treatment and management elects and documents such treatment. Otherwise, we recognize any fair value gains or losses, over the remaining term of the hedge instrument, in earnings in the current period.
As of December 31, 2016, we did not have any derivatives designated as hedges. Unless otherwise indicated, we use the term "hedge" to describe derivative instruments that are designed to achieve our hedging program goals, even though they are not necessarily accounted for as cash-flow or fair-value hedges. As part of our hedging program, we entered into a number of derivative transactions that resulted in the following Brent-based crude oil contracts as of December 31, 2016:
101
Q1 2017 | Q2 2017 | Q3 2017 | Q4 2017 | Q1 2018 | Q2-Q4 2018 | ||||||||||||||||||
Crude Oil | |||||||||||||||||||||||
Calls: | |||||||||||||||||||||||
Barrels per day | 12,100 | 5,000 | 10,000 | 15,000 | 15,600 | 15,000 | |||||||||||||||||
Weighted-average price per barrel | $ | 56.37 | $ | 55.05 | $ | 56.15 | $ | 56.12 | $ | 58.77 | $ | 58.83 | |||||||||||
Puts: | |||||||||||||||||||||||
Barrels per day | 22,100 | 20,000 | 17,000 | 10,000 | — | — | |||||||||||||||||
Weighted-average price per barrel | $ | 49.10 | $ | 50.25 | $ | 50.88 | $ | 48.00 | $ | — | $ | — | |||||||||||
Swaps: | |||||||||||||||||||||||
Barrels per day | 20,000 | 20,000 | 20,000 | 20,000 | — | — | |||||||||||||||||
Weighted-average price per barrel | $ | 53.98 | $ | 53.98 | $ | 53.98 | $ | 53.98 | $ | — | $ | — | |||||||||||
The second through fourth quarter 2017 crude oil swaps grant our counterparty a quarterly option to increase volumes by up to 10,000 barrels per day for that quarter at a weighted-average Brent price of $55.46. Our counterparty also has an option to increase volumes by up to 5,000 barrels per day for the second half of 2016 at a weighted-average Brent price of $61.43. During 2016, we purchased derivative assets that partially reduced our 2017 and 2018 call exposure for which we paid $86 million and deferred payment of $15 million.
The after-tax gains and losses recognized in, and reclassified to income from accumulated other comprehensive income (AOCI), for derivative instruments classified as cash-flow hedges for the years ended December 31, 2015 and 2014, and the ending AOCI balances for each period were not material. We did not have any cash-flow hedges in 2016. The amount of the ineffective portion of cash-flow hedges was immaterial for the years ended December 31, 2015 and 2014. For the years ended December 31, 2016 and 2015, we recognized non-cash derivative (losses) gains of approximately $(283) million and $52 million, respectively, from marking these contracts to market, which were included in revenues.
We had no fair-value hedges as of and during the years ended December 31, 2016, 2015 and 2014.
102
Fair Value of Derivatives
Our commodity derivatives are measured at fair value using industry-standard models with various inputs, including quoted forward prices, and are all classified as Level 2 in the required fair value hierarchy for the periods presented. The following table presents the fair values (at gross and net) of our outstanding derivatives as of December 31, 2016 and 2015 (in millions):
December 31, 2016 | |||||||||||||
Balance Sheet Classification | Gross Amounts Recognized at Fair Value | Gross Amounts Offset in the Balance Sheet | Net Fair Value Presented in the Balance Sheet | ||||||||||
Assets | |||||||||||||
Commodity Contracts | Other current assets | $ | 88 | $ | (49 | ) | $ | 39 | |||||
Commodity Contracts | Other assets | 25 | (6 | ) | 19 | ||||||||
Liabilities | |||||||||||||
Commodity Contracts | Accrued liabilities | (152 | ) | 49 | (103 | ) | |||||||
Commodity Contracts | Other long-term liabilities | (58 | ) | 6 | (52 | ) | |||||||
Total derivatives | $ | (97 | ) | $ | — | $ | (97 | ) | |||||
December 31, 2015 | |||||||||||||
Balance Sheet Classification | Gross Amounts Recognized at Fair Value | Gross Amounts Offset in the Balance Sheet | Net Fair Value Presented in the Balance Sheet | ||||||||||
Assets | |||||||||||||
Commodity Contracts | Other current assets | $ | 87 | $ | — | $ | 87 | ||||||
Liabilities | |||||||||||||
Commodity Contracts | Accrued liabilities | (1 | ) | — | (1 | ) | |||||||
Total derivatives | $ | 86 | $ | — | $ | 86 | |||||||
103
NOTE 9 INCOME TAXES
Income (loss) before income taxes was $201 million, $(5,476) million and $(2,421) million for the years ended December 31, 2016, 2015 and 2014, respectively. The provision (benefit) for federal, state and local income taxes consisted of the following:
For the years ended December 31, | United States Federal | State and Local | Total | ||||||||
(in millions) | |||||||||||
2016 | |||||||||||
Current | $ | — | $ | — | $ | — | |||||
Deferred | (66 | ) | (12 | ) | (78 | ) | |||||
$ | (66 | ) | $ | (12 | ) | $ | (78 | ) | |||
2015 | |||||||||||
Current | $ | 255 | $ | 81 | $ | 336 | |||||
Deferred | (1,961 | ) | (297 | ) | (2,258 | ) | |||||
$ | (1,706 | ) | $ | (216 | ) | $ | (1,922 | ) | |||
2014 | |||||||||||
Current | $ | 66 | $ | 99 | $ | 165 | |||||
Deferred | (840 | ) | (312 | ) | (1,152 | ) | |||||
$ | (774 | ) | $ | (213 | ) | $ | (987 | ) | |||
The following reconciliation of the United States federal statutory income tax rate to our effective tax rate is stated as a percentage of pre-tax income or loss:
For the years ended December 31, | ||||||||
2016 | 2015 | 2014 | ||||||
United States federal statutory tax rate | 35 | % | 35 | % | 35 | % | ||
State income taxes, net of federal | 6 | 5 | 6 | |||||
Valuation allowance | 199 | (7 | ) | — | ||||
Cancellation of debt income | (288 | ) | — | — | ||||
Stock-based compensation | 3 | — | — | |||||
Federal effect of state taxes on the above items | 5 | 2 | — | |||||
Other | 1 | — | — | |||||
Effective tax rate | (39 | )% | 35 | % | 41 | % | ||
Federal and state valuation allowance
In the first quarter of 2016, we reduced our valuation allowance against net deferred tax assets by $82 million. During the course of the year, we also increased the valuation allowance by $480 million. The resulting $398 million increase in the valuation allowance had the effect of increasing our effective tax rate by 199%.
The first quarter 2016 reduction in the valuation allowance resulted from our evaluation in early 2016 of our assets and liabilities at the time of our fourth quarter 2015 debt exchange, which generated $1.4 billion of cancellation of debt income (CODI) for tax purposes. At that date, our evaluation indicated that our liabilities exceeded the value of our assets, both calculated in accordance with the tax rules, enabling us to move the liability related to CODI to deferred tax liabilities. The resulting increase of our deferred tax liabilities that could be offset against assets caused an $82 million reduction in the valuation allowance.
During the course of the year, based on prevailing product prices, we concluded that we could not realize, on a more-likely-than-not basis, any of the deferred tax assets being generated through operating losses. Accordingly, we provided full allowances against such assets generated during the year by the amount of $480 million.
104
We evaluate our deferred tax assets to determine if a valuation allowance is required to reduce our gross deferred tax assets to an amount expected to be realized. We expect to realize $375 million of our gross deferred tax assets through reversals of taxable temporary differences. We have maintained a full valuation allowance on our deferred tax assets above this amount as there is not sufficient evidence to support the reversal of any portion of this allowance. Given our recent and anticipated future earnings trends, we do not believe any of the valuation allowance will be released within the next 12 months. The amount of the deferred tax assets considered realizable could however be adjusted if estimates or amounts of deferred tax liabilities change.
Federal and state cancellation of debt income
As a result of our 2015 and 2016 debt transactions and modifications, we generated CODI of $1.4 billion and $1.3 billion, respectively ($2.7 billion in the aggregate), for both U.S. federal and California state tax purposes. These respective amounts were excluded from taxable income in those years because we determined that our liabilities exceeded the value of our assets for tax purposes immediately prior to each of the transactions. In exchange for this exclusion, tax rules require us to reduce the tax basis of our assets. Accordingly, we reduced our net operating losses and the basis of property, plant and equipment by $1.2 billion for U.S. federal and $1.9 billion for California. We were not required to make any further reductions in those assets because, beyond this point, our liabilities would have exceeded the tax basis of our assets. Accordingly, any tax liability attributable to the remaining approximately $1.5 billion of federal and $800 million of California CODI was relieved without any future tax liability. As a result, we recorded a benefit of $577 million for this permanent reduction of tax liability, which reduced our effective tax rate by 288%.
The tax effects of temporary differences resulting in deferred income taxes at December 31, 2016 and 2015 were as follows:
2016 | 2015 | ||||||||||||||
Deferred Tax Assets | Deferred Tax Liabilities | Deferred Tax Assets | Deferred Tax Liabilities | ||||||||||||
(in millions) | |||||||||||||||
Debt | $ | 693 | $ | — | $ | 608 | $ | — | |||||||
Property, plant and equipment differences | 60 | (335 | ) | 132 | (427 | ) | |||||||||
Postretirement benefit accruals | 45 | — | 41 | — | |||||||||||
Deferred compensation and benefits | 74 | — | 75 | — | |||||||||||
Asset retirement obligations | 183 | — | 156 | — | |||||||||||
Federal effect of state income taxes | — | — | 28 | (24 | ) | ||||||||||
Net operating loss carryforward | 61 | — | 7 | — | |||||||||||
All other | 39 | (40 | ) | 47 | (3 | ) | |||||||||
Subtotal | 1,155 | (375 | ) | 1,094 | (454 | ) | |||||||||
Valuation allowance | (780 | ) | — | (382 | ) | — | |||||||||
Total net deferred taxes | $ | 375 | $ | (375 | ) | $ | 712 | $ | (454 | ) | |||||
Our tax returns for the post-Spin off period in 2014 and calendar year 2015 are under examination by the Internal Revenue Service. No significant issues have been raised to date. The returns filed for these same periods remain subject to examination by the California tax authority. Prior to the Spin-off date, we were included in the Occidental income tax returns for all applicable years. Under the tax sharing agreement, Occidental controls tax examinations for the periods in which we were included in a consolidated or combined income tax return filed by Occidental. There were no amounts due to Occidental as of December 31, 2016 and 2015 under the tax sharing agreement. The income tax provision was calculated as if we filed separate tax returns for all periods presented prior to the Spin-off.
105
Tax benefits are recognized only for tax positions that are more likely than not to be sustained upon examination by tax authorities. The amount recognized is measured as the largest amount of benefit that is greater than 50 percent likely to be realized upon settlement. A liability for unrecognized tax benefits is recorded for any tax benefits claimed in the Company’s tax returns that do not meet these recognition and measurement standards. As of December 31, 2016, we recorded a $25 million liability for tax positions taken in prior periods which has been classified as a deferred tax liability. This amount of unrecognized tax benefits, if recognized, would affect the effective tax rate. We believe there will not be significant increases or decreases to our unrecognized tax benefits within the next 12 months.
As of December 31, 2016, we had a $777 million net operating loss carryforward in California. The California net operating loss carryforward begins expiring in 2026. A portion of the California net operating loss carryforward resulted from acquisitions in prior years and is subject to an annual limitation as a result of these acquisitions. Accordingly, no financial statement benefit has been recognized for $88 million of the California net operating loss carryforward.
NOTE 10 STOCK COMPENSATION
General
Prior to the Spin-off, our employees participated in Occidental's stock-based incentive plans under which, if they were eligible, they received Occidental stock awards. Effective on the Spin-off date of November 30, 2014, our employees and non-employee directors began participating in our long-term incentive plan. In connection with the Spin-off, unvested share-based compensation awards granted to our employees under Occidental's stock-based incentive plans and held by grantees as of November 30, 2014 were replaced with substitute awards based on CRC common shares. These substitute awards were intended to generally preserve the value of the original Occidental award determined as of November 30, 2014. Original and remaining vesting periods of Occidental awards were unaffected by the substitution. There were approximately 650 employees affected by the substitution of awards. The substitution of awards did not cause us to recognize incremental compensation expense. These substitute awards reduced the maximum number of shares of our common stock available for grant under our incentive plan.
In May 2016, our PSU and certain RSU awards that were originally granted as cash-settled awards were converted to stock-settled awards when our stockholders approved additional shares for grant under our long-term incentive plan at the 2016 annual stockholder meeting. Less than 50 people were impacted by this modification, which resulted in no incremental compensation cost.
Compensation expense for stock-based awards for the year ended December 31, 2016, 2015 and 2014 was approximately $33 million, $34 million and $27 million, respectively. Prior to the Spin-off, Occidental allocated certain costs to us that included compensation costs for stock-based awards of Occidental stock. Using the same allocation method for all allocated costs used by Occidental, we estimated the stock compensation expense allocated to us was approximately $26 million for January 1, 2014 through November 30, 2014.
For the years ended December 31, 2016 and December 31, 2015, we recognized income tax expense of $0 and approximately $2 million and made cash payments of $5 million and $10 million for the cash-settled portion of our awards, respectively. As the stock compensation expenses prior to the Spin-off costs were allocated to us, it was not practical to calculate the tax expense/benefit or cash payments for those years.
As of December 31, 2016, unrecognized compensation expense for all our unvested stock-based incentive awards, based on the year-end value of our common stock, was $51 million. This expense is expected to be recognized over a weighted-average period of two years.
The maximum number of authorized shares of our common stock that may be issued pursuant to our long-term incentive plan is 4.7 million shares.
Restricted Stock
Certain employees are granted RSUs or restricted stock awards which are in the form of, or equivalent in value to, actual shares of our common stock. Depending on their terms, RSUs are service- or performance-based and are settled in cash or stock at the time of vesting. The service-based awards vest ratably over three years, or at the end of two or three years, following the date of grant. The performance-based awards vest after two or three years from the grant date if the performance targets are met.
106
During 2016 and 2015, non-employee directors were granted RSUs representing approximately 76,788 shares and 15,375 shares, respectively, which fully vest and convert into shares one year from the date of grant.
The following summarizes our RSU activity for the year ended December 31, 2016:
Stock-Settled | Cash-Settled | ||||||||
Number of Shares (in thousands) | Weighted-Average Grant-Date Fair Value | Number of Shares (in thousands) | |||||||
Unvested at January 1 | 132 | $ | 79.39 | 904 | |||||
Granted | 453 | $ | 15.40 | 1,273 | |||||
Vested | (121 | ) | $ | 62.04 | (344 | ) | |||
Forfeited | (24 | ) | $ | 52.66 | (88 | ) | |||
Converted to stock-settled awards | 165 | $ | 18.50 | (165 | ) | ||||
Unvested at December 31 | 605 | $ | 22.08 | 1,580 | |||||
Performance Stock Unit Awards
Certain executives were awarded PSU awards that vest at the end of a three-year period following the grant date if performance targets are met. A summary of our unvested PSU awards as of December 31, 2016, and changes during the year ended December 31, 2016, is presented below:
Stock-Settled | Cash-Settled | ||||||||
Number of Shares (in thousands) | Weighted-Average Grant-Date Fair Value | Number of Shares (in thousands) | |||||||
Unvested at January 1 | 322 | $ | 77.80 | 279 | |||||
Granted | — | $ | — | — | |||||
Vested | (118 | ) | $ | 77.26 | — | ||||
Forfeited | (21 | ) | $ | 51.40 | (3 | ) | |||
Converted to stock-settled awards | 276 | $ | 18.50 | (276 | ) | ||||
Unvested at December 31 | 459 | $ | 44.34 | — | |||||
The modification and grant date assumptions used in the Monte Carlo valuation for the TSR-based portion of the outstanding PSU awards are as follows:
Modification Date | Grant Date | |||||||
Risk-free interest rate | 0.77 | % | 1.06 | % | ||||
Dividend yield | — | % | 0.95 | % | ||||
Volatility factor | 69.69 | % | 43.63 | % | ||||
Expected life (years) | 2.16 | 2.9 | ||||||
Fair value of underlying common stock | $ | 18.50 | $ | 42.00 | ||||
Stock Options
We granted stock options to certain executives under our long-term incentive plan. The options permit purchase of our common stock at exercise prices no less than the fair market value of the stock on the date the options were granted. The options have terms of seven years and vest ratably over three years, with one third of the granted shares becoming exercisable on each anniversary date following the date of grant.
107
The following table summarizes our option activity during the year ended December 31, 2016:
Options (000's) | Weighted-Average Exercise Price | Weighted-Average Grant-Date Fair Value | Aggregate Intrinsic Value | |||||||||||
Beginning balance, January 1 | 1,152 | $ | 70.21 | $ | 18.46 | $ | — | |||||||
Granted | — | $ | — | $ | — | $ | — | |||||||
Exercised | — | $ | — | $ | — | $ | — | |||||||
Forfeited | (43 | ) | $ | 78.37 | $ | 19.46 | $ | — | ||||||
Expired or Canceled | — | $ | — | $ | — | $ | — | |||||||
Ending balance, December 31 | 1,109 | $ | 69.89 | $ | 18.42 | $ | — | |||||||
Exercisable at December 31 | 669 | $ | 73.61 | $ | 18.88 | $ | — | |||||||
The grant date assumptions used in the Black-Scholes valuation for options granted during 2015 and 2014 were as follows:
2015 | 2014 | |||||||
Exercise price per share | $ | 42.00 | $ | 81.10 | ||||
Expected life (in years) | 4.5 | 4.5 | ||||||
Expected volatility | 44.7 | % | 35.4 | % | ||||
Risk-free interest rate | 1.56 | % | 1.40 | % | ||||
Dividend yield | 0.95 | % | 0.50 | % | ||||
Grant date fair value of stock option awards granted | $ | 15.00 | $ | 19.80 | ||||
Employee Stock Purchase Plan
Effective January 1, 2015, we adopted the California Resources Corporation 2014 Employee Stock Purchase Plan (ESPP). The ESPP provides our employees the ability to purchase shares of our common stock at a price equal to 85% of the closing price of a share of our common stock as of the first or last day of each offering period (a fiscal quarter), whichever amount is less.
The maximum number of shares of our common stock that may be issued pursuant to the ESPP is subject to certain annual limits and has a cumulative limit of one million shares, subject to adjustment pursuant to the terms of the ESPP. For the year ended December 31, 2016, we issued approximately 0.3 million shares of common stock in connection with the ESPP. As of January 1, 2017, over one quarter of our employees had elected to participate in the plan.
NOTE 11 EQUITY
The following is a summary of common stock issuances on a post-split basis:
Common Stock | ||
(in thousands) | ||
Balance, December 31, 2014 | 38,564 | |
Issued | 254 | |
Balance, December 31, 2015 | 38,818 | |
Issued | 3,725 | |
Balance, December 31, 2016 | 42,543 | |
At December 31, 2016 and 2015, we had 200 million authorized common stock shares and 20 million authorized preferred stock shares, both with a $0.01 par value per share, and no outstanding preferred stock shares in either period.
108
ACCUMULATED OTHER COMPREHENSIVE INCOME (LOSS)
Accumulated other comprehensive income (loss) consisted of pension and post-retirement losses of $14 million and $15 million, at December 31, 2016 and 2015, respectively.
NOTE 12 EARNINGS PER SHARE
On November 30, 2014, the Spin-off date, 38.1 million shares (on a split-adjusted basis) of our common stock were issued, of which approximately 18.5% was retained by Occidental and was divested on March 24, 2016. For comparative purposes, and to provide a more meaningful calculation of weighted-average shares outstanding, we have assumed this amount to be outstanding as of the beginning of each period prior to the Spin-off. In addition, we have assumed the stock awards granted in connection with the Spin-off were also outstanding for each of the periods presented prior to the Spin-off, resulting in a weighted-average basic share count of 38.2 million shares for those periods. Stock options, restricted stock awards and restricted stock units were not included in the computation of diluted EPS because to do so would have been anti-dilutive for the periods presented.
The following table presents the calculation of basic and diluted EPS for the years ended December 31:
2016 | 2015 | 2014 | |||||||||
(in millions, except per-share amounts) | |||||||||||
Basic EPS calculation | |||||||||||
Net income (loss) | $ | 279 | $ | (3,554 | ) | $ | (1,434 | ) | |||
Net loss allocated to participating securities | (6 | ) | — | — | |||||||
Net income (loss) available to common stockholders | $ | 273 | $ | (3,554 | ) | $ | (1,434 | ) | |||
Weighted-average common shares outstanding - basic | 40.4 | 38.3 | 38.2 | ||||||||
Basic EPS | $ | 6.76 | $ | (92.79 | ) | $ | (37.54 | ) | |||
Diluted EPS calculation | |||||||||||
Net income (loss) | $ | 279 | $ | (3,554 | ) | $ | (1,434 | ) | |||
Net loss allocated to participating securities | (6 | ) | — | — | |||||||
Net income (loss) available to common stockholders | $ | 273 | $ | (3,554 | ) | $ | (1,434 | ) | |||
Weighted-average common shares outstanding - basic | 40.4 | 38.3 | 38.2 | ||||||||
Dilutive effect of potentially dilutive securities | — | — | — | ||||||||
Weighted-average common shares outstanding - diluted | 40.4 | 38.3 | 38.2 | ||||||||
Diluted EPS | $ | 6.76 | $ | (92.79 | ) | $ | (37.54 | ) | |||
NOTE 13 RETIREMENT AND POSTRETIREMENT BENEFIT PLANS
We have various benefit plans for our salaried and union and nonunion hourly employees.
Defined Contribution Plans
All of our employees are eligible to participate in one or more of the defined contribution retirement or savings plans that provide for periodic contributions by us or our subsidiaries based on plan-specific criteria, such as base pay, age, level and employee contributions. Certain salaried employees participate in supplemental plans that restore benefits lost due to governmental limitations on qualified plans. As of December 31, 2016 and 2015, we recognized $31 million and $32 million in other long-term liabilities for these supplemental plans. We expensed $32 million in 2016, $39 million in 2015 and $29 million in 2014 under the provisions of these defined contribution and savings plans.
Defined Benefit Plans
Participation in defined benefit pension plans sponsored by us is limited. During 2016, approximately 200 employees accrued benefits under these plans, including union and certain nonunion employees who joined us from acquired operations with grandfathered benefits. Effective December 31, 2015, the plans were amended such that participants other than union employees no longer earn benefits for service after December 31, 2015.
109
Pension costs for the defined benefit pension plans, determined by independent actuarial valuations, are generally funded by payments to trust funds, which are administered by independent trustees.
Postretirement and Other Benefit Plans
We provide postretirement medical and dental benefits for our former employees and their eligible dependents. The benefits are funded as they are paid during the year.
Obligations and Funded Status
The following tables show the amounts recognized in our balance sheets related to pension and postretirement benefit plans, as well as plans that we or our subsidiaries sponsor, and their funding status, obligations and plan asset fair values (in millions):
Pension Benefits | Postretirement Benefits | ||||||||||||||
As of December 31, | |||||||||||||||
2016 | 2015 | 2016 | 2015 | ||||||||||||
Amounts recognized in the balance sheet: | |||||||||||||||
Accrued liabilities | $ | — | $ | — | $ | (2 | ) | $ | (1 | ) | |||||
Other long-term liabilities | (26 | ) | (27 | ) | (75 | ) | (70 | ) | |||||||
$ | (26 | ) | $ | (27 | ) | $ | (77 | ) | $ | (71 | ) | ||||
Amounts recognized in accumulated other comprehensive income (loss): | |||||||||||||||
$ | (18 | ) | $ | (19 | ) | $ | 4 | $ | 4 | ||||||
Pension Benefits | Postretirement Benefits | ||||||||||||||
2016 | 2015 | 2016 | 2015 | ||||||||||||
Changes in the benefit obligation: | |||||||||||||||
Benefit obligation—beginning of year | $ | 83 | $ | 108 | $ | 71 | $ | 68 | |||||||
Service cost—benefits earned during the period | 1 | 4 | 3 | 5 | |||||||||||
Interest cost on projected benefit obligation | 3 | 4 | 3 | 3 | |||||||||||
Curtailment (gain) loss | — | (12 | ) | — | 5 | ||||||||||
Actuarial loss (gain) | 7 | 24 | 1 | (10 | ) | ||||||||||
Benefits paid | (24 | ) | (45 | ) | (1 | ) | — | ||||||||
Benefit obligation—end of year | $ | 70 | $ | 83 | $ | 77 | $ | 71 | |||||||
Changes in plan assets: | |||||||||||||||
Fair value of plan assets—beginning of year | $ | 56 | $ | 87 | $ | — | $ | — | |||||||
Actual return on plan assets | 2 | 1 | — | — | |||||||||||
Employer contributions | 10 | 13 | 1 | — | |||||||||||
Benefits paid | (24 | ) | (45 | ) | (1 | ) | — | ||||||||
Fair value of plan assets—end of year | $ | 44 | $ | 56 | $ | — | $ | — | |||||||
Unfunded status | $ | (26 | ) | $ | (27 | ) | $ | (77 | ) | $ | (71 | ) | |||
The following table sets forth our defined-benefit pension plans with accumulated benefit obligations in excess of plan assets for the years ended December 31:
2016 | 2015 | ||||||
(in millions) | |||||||
Projected Benefit Obligation | $ | 70 | $ | 83 | |||
Accumulated Benefit Obligation | $ | 67 | $ | 81 | |||
Fair Value of Plan Assets | $ | 44 | $ | 56 | |||
110
None of our defined-benefit pension plans had plan assets in excess of accumulated benefit obligations. We do not expect any plan assets to be returned during 2017.
COMPONENTS OF NET PERIODIC BENEFIT COST
The following tables set forth our pension and postretirement benefit costs and amounts recognized in other comprehensive income (before tax) for the years ended December 31:
Pension Benefits | Postretirement Benefits | ||||||||||||||||||||||
2016 | 2015 | 2014 | 2016 | 2015 | 2014 | ||||||||||||||||||
(in millions) | |||||||||||||||||||||||
Net periodic benefit costs: | |||||||||||||||||||||||
Service cost—benefits earned during the period | $ | 1 | $ | 4 | $ | 4 | $ | 3 | $ | 5 | $ | 4 | |||||||||||
Interest cost on projected benefit obligation | 3 | 4 | 4 | 3 | 3 | 2 | |||||||||||||||||
Expected return on plan assets | (3 | ) | (5 | ) | (6 | ) | — | — | — | ||||||||||||||
Amortization of net actuarial loss (gain) | 2 | 3 | 2 | — | — | 1 | |||||||||||||||||
Settlement cost | 8 | 18 | 2 | — | — | — | |||||||||||||||||
Curtailment loss | — | — | — | — | 5 | — | |||||||||||||||||
Net periodic benefit cost | $ | 11 | $ | 24 | $ | 6 | $ | 6 | $ | 13 | $ | 7 | |||||||||||
Pension Benefits | Postretirement Benefits | ||||||||||||||||||||||
2016 | 2015 | 2014 | 2016 | 2015 | 2014 | ||||||||||||||||||
(in millions) | |||||||||||||||||||||||
Amounts recognized in other comprehensive income (loss): | |||||||||||||||||||||||
Net actuarial (loss) gain | $ | (9 | ) | $ | (28 | ) | $ | (6 | ) | $ | — | $ | 9 | $ | 1 | ||||||||
Net prior service (cost) credit | — | 12 | — | — | — | — | |||||||||||||||||
Settlement cost | 8 | 18 | 2 | — | — | — | |||||||||||||||||
Transfer adjustment | — | — | — | — | — | 2 | |||||||||||||||||
Amortization of net actuarial gain/loss | 2 | 3 | 2 | — | — | 1 | |||||||||||||||||
Total recognized in other comprehensive income (loss) | $ | 1 | $ | 5 | $ | (2 | ) | $ | — | $ | 9 | $ | 4 | ||||||||||
The estimated net loss and prior service credit for the defined benefit pension plans that will be amortized from AOCI into net periodic benefit cost over the next fiscal year are $2 million and $0, respectively. We do not expect to have any estimated net loss or prior service cost for the defined benefit postretirement plans that will be amortized from AOCI into net periodic benefit cost over the next fiscal year.
The following table sets forth the weighted-average assumptions used to determine our benefit obligations and net periodic benefit cost:
Pension Benefits | Postretirement Benefits | ||||||||||
For the years ended December 31, | |||||||||||
2016 | 2015 | 2016 | 2015 | ||||||||
Benefit Obligation Assumptions: | |||||||||||
Discount rate | 3.88 | % | 3.99 | % | 4.58 | % | 4.81 | % | |||
Rate of compensation increase | 4.00 | % | 4.00 | % | — | — | |||||
Net Periodic Benefit Cost Assumptions: | |||||||||||
Discount rate | 3.99 | % | 3.82 | % | 4.81 | % | 4.44 | % | |||
Assumed long-term rate of return on assets | 6.50 | % | 6.50 | % | — | — | |||||
Rate of compensation increase | 4.00 | % | 4.00 | % | — | — | |||||
111
For pension plans and postretirement benefit plans that we or our subsidiaries sponsor, we based the discount rate on the Aon/Hewitt AA Above Median yield curve in both 2016 and 2015. The weighted-average rate of increase in future compensation levels is consistent with our past and anticipated future compensation increases for employees participating in retirement plans that determine benefits using compensation. The assumed long-term rate of return on assets is estimated with regard to current market factors but within the context of historical returns for the asset mix that exists at year end.
Effective in 2016, we adopted the Society of Actuaries MP-2016 Mortality Improvement Scale, which updated the Society of Actuaries Adjusted RP-2014 mortality assumptions that private defined benefit pension plans in the United States use in the actuarial valuations that determine a plan sponsor’s pension and postretirement obligations. In 2015, we utilized the Society of Actuaries Adjusted RP-2014 Mortality Table reflecting the MP-2015 Mortality Improvement Scale. At December 31, 2016, the changes in the mortality assumptions resulted in no significant change to the pension benefit obligations and a decrease of $1 million in the postretirement benefit obligations.
The postretirement benefit obligation was determined by application of the terms of medical and dental benefits, including the effect of established maximums on covered costs, together with relevant actuarial assumptions and healthcare cost trend rates projected at an assumed U.S. Consumer Price Index (CPI) increase of 1.97% and 1.60% as of December 31, 2016 and 2015, respectively. Under the terms of our postretirement plans, participants other than certain union employees pay for all medical cost increases in excess of increases in the CPI. For those union employees, we projected that as of December 31, 2016, healthcare cost trend rates would decrease 0.25 percent per year from 6.25% in 2017 until they reach 4.5% in 2024, and remain at 4.5% thereafter. A 1-percent increase or a 1-percent decrease in these assumed healthcare cost trend rates would result in an increase of $4 million or a reduction of $3 million, respectively, in the postretirement benefit obligation as of December 31, 2016. The annual service and interest costs would not be materially affected by these changes.
The actuarial assumptions used could change in the near term as a result of changes in expected future trends and other factors that, depending on the nature of the changes, could cause increases or decreases in the plan assets and liabilities.
Fair Value of Pension Plan Assets
We employ a total return investment approach that uses a diversified blend of equity and fixed-income investments to optimize the long-term return of plan assets at a prudent level of risk. The investments were monitored by our Investment Committee. Equity investments were diversified across U.S. and non-U.S. stocks, as well as differing styles and market capitalizations. Other asset classes, such as private equity and real estate, may have been used with the goals of enhancing long-term returns and improving portfolio diversification. In 2016 and 2015, the target allocation of plan assets was 65% equity securities and 35% debt securities. Investment performance was measured and monitored on an ongoing basis through quarterly investment portfolio and manager guideline compliance reviews, annual liability measurements and periodic studies.
112
The fair values of our pension plan assets by asset category are as follows (in millions):
Fair Value Measurements at December 31, 2016 Using | |||||||||||||||
Level 1 | Level 2 | Level 3 | Total | ||||||||||||
Asset Class: | |||||||||||||||
Cash equivalents | $ | 3 | $ | — | $ | — | $ | 3 | |||||||
Commingled funds: | |||||||||||||||
Fixed income | — | 9 | — | 9 | |||||||||||
U.S. equity | — | 10 | — | 10 | |||||||||||
International equity | — | 6 | — | 6 | |||||||||||
Mutual funds: | |||||||||||||||
Bond funds | 4 | — | — | 4 | |||||||||||
Blend funds | 2 | — | — | 2 | |||||||||||
Value funds | 2 | — | — | 2 | |||||||||||
Growth funds | 2 | — | — | 2 | |||||||||||
Guaranteed deposit account | — | — | 6 | 6 | |||||||||||
Total pension plan assets | $ | 13 | $ | 25 | $ | 6 | $ | 44 | |||||||
Fair Value Measurements at December 31, 2015 Using | |||||||||||||||
Level 1 | Level 2 | Level 3 | Total | ||||||||||||
Asset Class: | |||||||||||||||
Commingled funds: | |||||||||||||||
Fixed income | $ | — | $ | 15 | $ | — | $ | 15 | |||||||
U.S. equity | — | 16 | — | 16 | |||||||||||
International equity | — | 10 | — | 10 | |||||||||||
Mutual funds: | |||||||||||||||
Bond funds | 4 | — | — | 4 | |||||||||||
Blend funds | 2 | — | — | 2 | |||||||||||
Value funds | 1 | — | — | 1 | |||||||||||
Growth funds | 2 | — | — | 2 | |||||||||||
Guaranteed deposit account | — | — | 6 | 6 | |||||||||||
Total pension plan assets | $ | 9 | $ | 41 | $ | 6 | $ | 56 | |||||||
The activity during the years ended December 31, 2016 and 2015, for the assets using Level 3 fair value measurements was insignificant. We expect to contribute $9 million to our defined benefit pension plans during 2017.
Estimated future benefit payments, which reflect expected future service, as appropriate, are as follows:
For the years ended December 31, | Pension Benefits | Postretirement Benefits | |||||
(in millions) | |||||||
2017 | $ | 18 | $ | 3 | |||
2018 | $ | 9 | $ | 3 | |||
2019 | $ | 5 | $ | 3 | |||
2020 | $ | 5 | $ | 3 | |||
2021 | $ | 5 | $ | 4 | |||
2022 - 2026 | $ | 20 | $ | 21 | |||
113
NOTE 14 RELATED-PARTY TRANSACTIONS
During 2014, we entered into the following related-party transactions:
2014 | |||
(in millions) | |||
Sales(a) | $ | 2,706 | |
Allocated costs for services provided by affiliates | $ | 126 | |
Purchases | $ | 175 | |
(a) | Amounts include related-party sales from our Elk Hills power plant of $89 million during 2014. These sales are included in other revenue in the statements of operations. |
Through July 2014, substantially all of our products were sold through Occidental's marketing subsidiaries at market prices and were settled at the time of sale to those entities. Beginning August 2014, we began marketing our own products directly to third parties. For the year ended December 31, 2014, sales to Occidental subsidiaries accounted for approximately 65% of our net sales.
The statements of operations for the year ended December 31, 2014 includes expense allocations for certain corporate functions and centrally-located activities performed by Occidental prior to the Spin-off. These functions include executive oversight, accounting, treasury, tax, financial reporting, internal audit, legal, risk management, information technology, government relations, public relations, investor relations, human resources, procurement, engineering, drilling, exploration, finance, marketing, ethics and compliance, and certain other shared services. Charges from Occidental for these services were generally reflected in general and administrative expenses and also include employee-related costs such as salaries, bonuses and stock compensation costs.
Purchases from related parties reflected products purchased at market prices from Occidental's subsidiaries and used in our operations. These purchases are included in production costs. There are no remaining related-party receivable or payable balances related to these transactions at December 31, 2014.
114
Quarterly Financial Data (Unaudited)
2016 | 2015 | |||||||||||||||||||||||||||||||
Quarter | First | Second | Third | Fourth | First | Second | Third | Fourth | ||||||||||||||||||||||||
(in millions, except per share amounts) | ||||||||||||||||||||||||||||||||
Revenues(a) | $ | 322 | $ | 317 | $ | 456 | $ | 452 | $ | 577 | $ | 634 | $ | 626 | $ | 566 | ||||||||||||||||
Operating loss | $ | (143 | ) | $ | (141 | ) | $ | (19 | ) | $ | (3 | ) | $ | (90 | ) | $ | (31 | ) | $ | (72 | ) | $ | (4,949 | ) | ||||||||
Net income (loss)(b)(c) | $ | (50 | ) | $ | (140 | ) | $ | 546 | $ | (77 | ) | $ | (100 | ) | $ | (68 | ) | $ | (104 | ) | $ | (3,282 | ) | |||||||||
Net income (loss) per share: | ||||||||||||||||||||||||||||||||
Basic(d) | $ | (1.30 | ) | $ | (3.51 | ) | $ | 13.04 | $ | (1.83 | ) | $ | (2.62 | ) | $ | (1.78 | ) | $ | (2.72 | ) | $ | (85.47 | ) | |||||||||
Diluted(d) | $ | (1.30 | ) | $ | (3.51 | ) | $ | 13.04 | $ | (1.83 | ) | $ | (2.62 | ) | $ | (1.78 | ) | $ | (2.72 | ) | $ | (85.47 | ) | |||||||||
(a) | Revenues include net derivative gains (losses). |
(b) | For the first quarter of 2016, amount included unusual and infrequent items consisting of $81 million of non-cash derivative losses on outstanding hedges, $89 million of net gains on early extinguishment of debt and $21 million of other non-recurring charges. The first quarter of 2016 also included a $63 million deferred tax valuation allowance. For the second quarter of 2016, amount included $137 million of non-cash derivative losses on outstanding hedges, $44 million of net gains on early extinguishment of debt, $31 million of gains from asset divestitures and $6 million of other non-recurring charges. For the third quarter of 2016, amount included $660 million of net gains on early extinguishment of debt, $25 million of non-cash derivative losses on outstanding hedges, a $12 million interest charge for the write-off of deferred debt issuance costs and $6 million of other non-recurring charges. For the fourth quarter of 2016, amount included $40 million of non-cash derivative losses on outstanding hedges, $12 million of net gains on early extinguishment of debt and $26 million of other non-recurring charges, net. There were no associated taxes for 2016. |
(c) | For the first quarter of 2015, amount included after-tax unusual and infrequent items consisting of $2 million of non-cash derivative losses on outstanding hedges. For the second quarter of 2015, amount included after-tax items consisting of $10 million of derivative losses on outstanding hedges and $6 million in early retirement and severance costs. For the third quarter of 2015, amount included after-tax items consisting of $36 million of non-cash derivative gains on outstanding hedges, offset by $42 million in early retirement and severance costs. For the fourth quarter of 2015, amount included after-tax items consisting of $2.9 billion of asset impairments for proved and unproved properties, $42 million in write-down of certain other assets, $5 million in debt transaction costs and $3 million in rig termination and other costs, partially offset by $14 million in non-cash hedge-related gains and other. The fourth quarter of 2015 also included a $294 million deferred tax valuation allowance. |
(d) | We changed our previously reported third quarter 2016 basic and diluted earnings per share from $13.45 to $13.04 and $13.06 to $13.04, respectively. These changes occurred because of the application of the two-class method of earnings allocation in a period with net income. Unlike other periods in the year, the third quarter of 2016 resulted in net income because of the non-recurring gain generated from the extinguishment of debt. This represents a 3% change from the previously reported basic earnings per share amount, which we believe is immaterial based on the absolute amount as well as the non-recurring nature of the third quarter gain, which did not affect any trends embedded in operating results. |
115
Supplemental Oil and Gas Information (Unaudited)
The following tables set forth our net interests in quantities of proved developed and undeveloped reserves of oil (including condensate), natural gas liquids (NGLs) and natural gas and changes in such quantities. Reserves are stated net of applicable royalties. Estimated reserves include our economic interests under arrangements similar to production-sharing contracts (PSCs) relating to the Wilmington field in Long Beach. All of our proved reserves are located within the state of California.
TOTAL RESERVES
San Joaquin Basin | Los Angeles Basin(b) | Ventura Basin | Sacramento Basin | Total | ||||||||||
(in MMBoe(a)) | ||||||||||||||
PROVED DEVELOPED AND UNDEVELOPED RESERVES | ||||||||||||||
Balance at December 31, 2013 | 511 | 158 | 55 | 20 | 744 | |||||||||
Revisions of previous estimates | (48 | ) | 8 | (3 | ) | 1 | (42 | ) | ||||||
Improved recovery | 101 | 11 | 4 | 1 | 117 | |||||||||
Extensions and discoveries | 1 | — | — | — | 1 | |||||||||
Acquisitions | 1 | — | 5 | — | 6 | |||||||||
Sales of proved reserves | — | — | — | — | — | |||||||||
Production | (41 | ) | (11 | ) | (3 | ) | (3 | ) | (58 | ) | ||||
Balance at December 31, 2014 | 525 | 166 | 58 | 19 | 768 | |||||||||
Revisions of previous estimates | (58 | ) | (34 | ) | (13 | ) | (3 | ) | (108 | ) | ||||
Improved recovery | 3 | — | — | — | 3 | |||||||||
Extensions and discoveries | 15 | 12 | 5 | 1 | 33 | |||||||||
Acquisitions | 6 | — | — | — | 6 | |||||||||
Sales of proved reserves | — | — | — | — | — | |||||||||
Production | (40 | ) | (12 | ) | (3 | ) | (3 | ) | (58 | ) | ||||
Balance at December 31, 2015 | 451 | 132 | 47 | 14 | 644 | |||||||||
Revisions of previous estimates | (5 | ) | (23 | ) | (18 | ) | (1 | ) | (47 | ) | ||||
Improved recovery | 3 | — | — | — | 3 | |||||||||
Extensions and discoveries | 16 | 1 | 3 | — | 20 | |||||||||
Acquisitions | — | — | — | — | — | |||||||||
Sales of proved reserves | — | (1 | ) | — | — | (1 | ) | |||||||
Production | (36 | ) | (10 | ) | (3 | ) | (2 | ) | (51 | ) | ||||
Balance at December 31, 2016 | 429 | 99 | 29 | 11 | 568 | |||||||||
PROVED DEVELOPED RESERVES | ||||||||||||||
December 31, 2013 | 349 | 110 | 35 | 20 | 514 | |||||||||
December 31, 2014 | 367 | 126 | 41 | 18 | 552 | |||||||||
December 31, 2015 | 326 | 105 | 36 | 14 | 481 | |||||||||
December 31, 2016(c) | 287 | 83 | 25 | 11 | 406 | |||||||||
PROVED UNDEVELOPED RESERVES | ||||||||||||||
December 31, 2013 | 162 | 48 | 20 | — | 230 | |||||||||
December 31, 2014 | 158 | 40 | 17 | 1 | 216 | |||||||||
December 31, 2015 | 125 | 27 | 11 | — | 163 | |||||||||
December 31, 2016 | 142 | 16 | 4 | — | 162 | |||||||||
(a) | Natural gas volumes have been converted to Boe based on the equivalence of energy content between six Mcf of natural gas and one Bbl of oil. Barrels of oil equivalence does not necessarily result in price equivalence. The price of natural gas on a barrel of oil equivalent basis is currently substantially lower than the corresponding price for oil and has been similarly lower for a number of years. For example, in 2016, the average prices of Brent oil and NYMEX natural gas were $45.04 per Bbl and $2.42 per Mcf, respectively, resulting in an oil-to-gas price ratio of approximately 19 to 1. |
(b) | Includes proved reserves related to economic arrangements similar to PSCs of 85 MMBbl, 103 MMBbl, 116 MMBbl and 102 MMBbl at December 31, 2016, 2015, 2014 and 2013, respectively. |
(c) | Approximately 17% of the proved developed reserves at December 31, 2016 are non-producing. A majority of our non-producing reserves relate to steamfloods and waterfloods where full peak production response has not yet occurred due to the nature of such projects. |
116
OIL RESERVES
San Joaquin Basin | Los Angeles Basin(a) | Ventura Basin | Sacramento Basin | Total | ||||||||||
(in millions of barrels (MMBbl)) | ||||||||||||||
PROVED DEVELOPED AND UNDEVELOPED RESERVES | ||||||||||||||
Balance at December 31, 2013 | 332 | 155 | 45 | — | 532 | |||||||||
Revisions of previous estimates | (41 | ) | 8 | (4 | ) | — | (37 | ) | ||||||
Improved recovery | 70 | 11 | 4 | — | 85 | |||||||||
Extensions and discoveries | 1 | — | — | — | 1 | |||||||||
Acquisitions | 1 | — | 5 | — | 6 | |||||||||
Sales of proved reserves | — | — | — | — | — | |||||||||
Production | (23 | ) | (11 | ) | (2 | ) | — | (36 | ) | |||||
Balance at December 31, 2014 | 340 | 163 | 48 | — | 551 | |||||||||
Revisions of previous estimates | (35 | ) | (33 | ) | (12 | ) | — | (80 | ) | |||||
Improved recovery | 3 | — | — | — | 3 | |||||||||
Extensions and discoveries | 8 | 12 | 5 | — | 25 | |||||||||
Acquisitions | 4 | — | — | — | 4 | |||||||||
Sales of proved reserves | — | — | — | — | — | |||||||||
Production | (23 | ) | (12 | ) | (2 | ) | — | (37 | ) | |||||
Balance at December 31, 2015 | 297 | 130 | 39 | — | 466 | |||||||||
Revisions of previous estimates | (3 | ) | (22 | ) | (15 | ) | — | (40 | ) | |||||
Improved recovery | 3 | — | — | — | 3 | |||||||||
Extensions and discoveries | 11 | 1 | 2 | — | 14 | |||||||||
Acquisitions | — | — | — | — | — | |||||||||
Sales of proved reserves | — | (1 | ) | — | — | (1 | ) | |||||||
Production | (21 | ) | (10 | ) | (2 | ) | — | (33 | ) | |||||
Balance at December 31, 2016 | 287 | 98 | 24 | — | 409 | |||||||||
| | | | | | | ||||||||
PROVED DEVELOPED RESERVES | ||||||||||||||
December 31, 2013 | 226 | 109 | 28 | — | 363 | |||||||||
December 31, 2014 | 229 | 124 | 34 | — | 387 | |||||||||
December 31, 2015 | 205 | 103 | 30 | — | 338 | |||||||||
December 31, 2016(b) | 177 | 82 | 20 | — | 279 | |||||||||
| | | | | | | ||||||||
PROVED UNDEVELOPED RESERVES | ||||||||||||||
December 31, 2013 | 106 | 46 | 17 | — | 169 | |||||||||
December 31, 2014 | 111 | 39 | 14 | — | 164 | |||||||||
December 31, 2015 | 92 | 27 | 9 | — | 128 | |||||||||
December 31, 2016 | 110 | 16 | 4 | — | 130 | |||||||||
(a) | Includes proved reserves related to economic arrangements similar to PSCs of 85 MMBbl, 103 MMBbl, 116 MMBbl and 102 MMBbl at December 31, 2016, 2015, 2014 and 2013, respectively. |
(b) | Approximately 20% of the proved developed reserves at December 31, 2016 are non-producing. A majority of our non-producing reserves relate to steamfloods and waterfloods where full peak production response has not yet occurred due to the nature of such projects. |
117
NGL RESERVES
San Joaquin Basin | Los Angeles Basin | Ventura Basin | Sacramento Basin | Total | ||||||||||
(in MMBbl) | ||||||||||||||
PROVED DEVELOPED AND UNDEVELOPED RESERVES | ||||||||||||||
Balance at December 31, 2013 | 68 | — | 3 | — | 71 | |||||||||
Revisions of previous estimates | 8 | — | — | — | 8 | |||||||||
Improved recovery | 13 | — | — | — | 13 | |||||||||
Extensions and discoveries | — | — | — | — | — | |||||||||
Acquisitions | — | — | — | — | — | |||||||||
Sales of proved reserves | — | — | — | — | — | |||||||||
Production | (7 | ) | — | — | — | (7 | ) | |||||||
Balance at December 31, 2014 | 82 | — | 3 | — | 85 | |||||||||
Revisions of previous estimates | (23 | ) | — | — | — | (23 | ) | |||||||
Improved recovery | — | — | — | — | — | |||||||||
Extensions and discoveries | 2 | — | — | — | 2 | |||||||||
Acquisitions | 1 | — | — | — | 1 | |||||||||
Sales of proved reserves | — | — | — | — | — | |||||||||
Production | (6 | ) | — | — | — | (6 | ) | |||||||
Balance at December 31, 2015 | 56 | — | 3 | — | 59 | |||||||||
Revisions of previous estimates | 1 | — | (1 | ) | — | — | ||||||||
Improved recovery | — | — | — | — | — | |||||||||
Extensions and discoveries | 2 | — | — | — | 2 | |||||||||
Acquisitions | — | — | — | — | — | |||||||||
Sales of proved reserves | — | — | — | — | — | |||||||||
Production | (6 | ) | — | — | — | (6 | ) | |||||||
Balance at December 31, 2016 | 53 | — | 2 | — | 55 | |||||||||
| | | | | | |||||||||
PROVED DEVELOPED RESERVES | ||||||||||||||
December 31, 2013 | 47 | — | 1 | — | 48 | |||||||||
December 31, 2014 | 62 | — | 2 | — | 64 | |||||||||
December 31, 2015 | 45 | — | 2 | — | 47 | |||||||||
December 31, 2016(a) | 42 | — | 2 | — | 44 | |||||||||
PROVED UNDEVELOPED RESERVES | ||||||||||||||
December 31, 2013 | 21 | — | 2 | — | 23 | |||||||||
December 31, 2014 | 20 | — | 1 | — | 21 | |||||||||
December 31, 2015 | 11 | — | 1 | — | 12 | |||||||||
December 31, 2016 | 11 | — | — | — | 11 | |||||||||
(a) | Approximately 11% of the proved developed reserves at December 31, 2016 are non-producing. |
118
NATURAL GAS RESERVES
San Joaquin Basin | Los Angeles Basin | Ventura Basin | Sacramento Basin | Total | ||||||||||
(in billions of cubic feet (Bcf)) | ||||||||||||||
PROVED DEVELOPED AND UNDEVELOPED RESERVES | ||||||||||||||
Balance at December 31, 2013 | 671 | 16 | 33 | 124 | 844 | |||||||||
Revisions of previous estimates | (91 | ) | — | 4 | 7 | (80 | ) | |||||||
Improved recovery | 107 | — | 2 | 5 | 114 | |||||||||
Extensions and discoveries | — | — | — | — | — | |||||||||
Acquisitions | — | — | 2 | — | 2 | |||||||||
Sales of proved reserves | — | — | — | — | — | |||||||||
Production | (66 | ) | — | (4 | ) | (20 | ) | (90 | ) | |||||
Balance at December 31, 2014 | 621 | 16 | 37 | 116 | 790 | |||||||||
Revisions of previous estimates | (2 | ) | (5 | ) | (6 | ) | (20 | ) | (33 | ) | ||||
Improved recovery | — | — | — | — | — | |||||||||
Extensions and discoveries | 27 | 1 | — | 6 | 34 | |||||||||
Acquisitions | 8 | — | — | — | 8 | |||||||||
Sales of proved reserves | — | — | — | — | — | |||||||||
Production | (63 | ) | (1 | ) | (4 | ) | (16 | ) | (84 | ) | ||||
Balance at December 31, 2015 | 591 | 11 | 27 | 86 | 715 | |||||||||
Revisions of previous estimates | (20 | ) | (3 | ) | (12 | ) | (7 | ) | (42 | ) | ||||
Improved recovery | — | — | — | — | — | |||||||||
Extensions and discoveries | 20 | — | 3 | 2 | 25 | |||||||||
Acquisitions | — | — | — | — | — | |||||||||
Sales of proved reserves | — | — | — | — | — | |||||||||
Production | (55 | ) | (1 | ) | (3 | ) | (13 | ) | (72 | ) | ||||
Balance at December 31, 2016 | 536 | 7 | 15 | 68 | 626 | |||||||||
| | | | | | |||||||||
PROVED DEVELOPED RESERVES | ||||||||||||||
December 31, 2013 | 455 | 9 | 22 | 117 | 603 | |||||||||
December 31, 2014 | 458 | 11 | 28 | 110 | 607 | |||||||||
December 31, 2015 | 456 | 9 | 24 | 86 | 575 | |||||||||
December 31, 2016(a) | 410 | 7 | 15 | 68 | 500 | |||||||||
PROVED UNDEVELOPED RESERVES | ||||||||||||||
December 31, 2013 | 216 | 7 | 11 | 7 | 241 | |||||||||
December 31, 2014 | 163 | 5 | 9 | 6 | 183 | |||||||||
December 31, 2015 | 135 | 2 | 3 | — | 140 | |||||||||
December 31, 2016 | 126 | — | — | — | 126 | |||||||||
(a) | Approximately 14% of the proved developed reserves at December 31, 2016 are non-producing. |
119
CAPITALIZED COSTS
Capitalized costs relating to oil and gas producing activities and related accumulated depreciation, depletion and amortization (DD&A) were as follows:
San Joaquin Basin | Los Angeles Basin | Ventura Basin | Sacramento Basin | Total | |||||||||||||||
(in millions) | |||||||||||||||||||
December 31, 2016 | |||||||||||||||||||
Proved properties | $ | 15,673 | $ | 2,055 | $ | 1,299 | $ | 298 | $ | 19,325 | |||||||||
Unproved properties | 544 | 106 | 172 | 289 | 1,111 | ||||||||||||||
Total capitalized costs(a) | 16,217 | 2,161 | 1,471 | 587 | 20,436 | ||||||||||||||
Accumulated depreciation, depletion and amortization(b) | (11,671 | ) | (1,495 | ) | (1,168 | ) | (557 | ) | (14,891 | ) | |||||||||
Net capitalized costs | $ | 4,546 | $ | 666 | $ | 303 | $ | 30 | $ | 5,545 | |||||||||
December 31, 2015 | |||||||||||||||||||
Proved properties | $ | 15,549 | $ | 2,071 | $ | 1,352 | $ | 374 | $ | 19,346 | |||||||||
Unproved properties | 544 | 106 | 172 | 289 | 1,111 | ||||||||||||||
Total capitalized costs(a) | 16,093 | 2,177 | 1,524 | 663 | 20,457 | ||||||||||||||
Accumulated depreciation, depletion and amortization(b) | (11,166 | ) | (1,491 | ) | (1,208 | ) | (603 | ) | (14,468 | ) | |||||||||
Net capitalized costs | $ | 4,927 | $ | 686 | $ | 316 | $ | 60 | $ | 5,989 | |||||||||
December 31, 2014 | |||||||||||||||||||
Proved properties | $ | 15,362 | $ | 1,982 | $ | 1,353 | $ | 326 | $ | 19,023 | |||||||||
Unproved properties | 469 | 106 | 113 | 323 | 1,011 | ||||||||||||||
Total capitalized costs(a) | 15,831 | 2,088 | 1,466 | 649 | 20,034 | ||||||||||||||
Accumulated depreciation, depletion and amortization(b) | (6,846 | ) | (826 | ) | (495 | ) | (497 | ) | (8,664 | ) | |||||||||
Net capitalized costs | $ | 8,985 | $ | 1,262 | $ | 971 | $ | 152 | $ | 11,370 | |||||||||
(a) | Includes acquisition costs, development costs and asset retirement obligations. |
(b) | Includes accumulated valuation allowance for total unproved properties of $819 million, $819 million, and $715 million at December 31, 2016, 2015 and 2014, respectively. |
120
COSTS INCURRED
Costs incurred relating to oil and gas activities that included capital investments, exploration (whether expensed or capitalized), acquisitions, asset retirement obligations and excluded corporate items were as follows:
San Joaquin Basin | Los Angeles Basin | Ventura Basin | Sacramento Basin | Total | |||||||||||||||
(in millions) | |||||||||||||||||||
FOR THE YEAR ENDED DECEMBER 31, 2016 | |||||||||||||||||||
Property acquisition costs | |||||||||||||||||||
Proved properties | $ | — | $ | — | $ | — | $ | — | $ | — | |||||||||
Unproved properties | — | — | — | — | — | ||||||||||||||
Exploration costs | 17 | — | 2 | 2 | 21 | ||||||||||||||
Development costs(a) | 49 | 23 | 26 | 4 | 102 | ||||||||||||||
Costs incurred | $ | 66 | $ | 23 | $ | 28 | $ | 6 | $ | 123 | |||||||||
FOR THE YEAR ENDED DECEMBER 31, 2015 | |||||||||||||||||||
Property acquisition costs | |||||||||||||||||||
Proved properties | $ | 73 | $ | 2 | $ | 2 | $ | — | $ | 77 | |||||||||
Unproved properties | 65 | — | — | — | 65 | ||||||||||||||
Exploration costs | 36 | — | 4 | 3 | 43 | ||||||||||||||
Development costs(a) | 191 | 89 | 10 | — | 290 | ||||||||||||||
Costs incurred | $ | 365 | $ | 91 | $ | 16 | $ | 3 | $ | 475 | |||||||||
FOR THE YEAR ENDED DECEMBER 31, 2014 | |||||||||||||||||||
Property acquisition costs | |||||||||||||||||||
Proved properties | $ | 79 | $ | 3 | $ | 128 | $ | — | $ | 210 | |||||||||
Unproved properties | 21 | — | 81 | — | 102 | ||||||||||||||
Exploration costs | 105 | — | 14 | 5 | 124 | ||||||||||||||
Development costs | 1,356 | 495 | 99 | 12 | 1,962 | ||||||||||||||
Costs incurred | $ | 1,561 | $ | 498 | $ | 322 | $ | 17 | $ | 2,398 | |||||||||
(a) | Total development costs include a $49 million increase, a $62 million decrease and a $13 million decrease in asset retirement obligations in 2016, 2015 and 2014, respectively. |
121
RESULTS OF OPERATIONS
Our oil and gas producing activities, which exclude items such as asset dispositions and corporate overhead, were as follows:
San Joaquin Basin | Los Angeles Basin | Ventura Basin | Sacramento Basin | Total | |||||||||||||||
(in millions) | |||||||||||||||||||
FOR THE YEAR ENDED DECEMBER 31, 2016 | |||||||||||||||||||
Revenues(a) | $ | 1,151 | $ | 425 | $ | 89 | $ | 35 | $ | 1,700 | |||||||||
Production costs(b) | 469 | 241 | 70 | 20 | 800 | ||||||||||||||
General and administrative expenses(c) | 14 | 18 | 4 | 1 | 37 | ||||||||||||||
Other operating expenses(d) | 18 | 13 | 3 | — | 34 | ||||||||||||||
Depreciation, depletion and amortization | 462 | 48 | 16 | 1 | 527 | ||||||||||||||
Taxes other than on income | 69 | 38 | 8 | 6 | 121 | ||||||||||||||
Exploration expenses | 19 | — | 2 | 2 | 23 | ||||||||||||||
Pretax income (loss) | 100 | 67 | (14 | ) | 5 | 158 | |||||||||||||
Income tax (expense) benefit(g) | (41 | ) | (27 | ) | 6 | (2 | ) | (64 | ) | ||||||||||
Results of operations | $ | 59 | $ | 40 | $ | (8 | ) | $ | 3 | $ | 94 | ||||||||
FOR THE YEAR ENDED DECEMBER 31, 2015 | |||||||||||||||||||
Revenues(a) | $ | 1,484 | $ | 569 | $ | 123 | $ | 46 | $ | 2,222 | |||||||||
Production costs(b) | 564 | 278 | 85 | 24 | 951 | ||||||||||||||
General and administrative expenses(c) | 28 | 21 | 7 | 2 | 58 | ||||||||||||||
Other operating expenses(d) | 15 | 2 | 2 | 2 | 21 | ||||||||||||||
Depreciation, depletion and amortization | 808 | 100 | 48 | 20 | 976 | ||||||||||||||
Taxes other than on income | 97 | 45 | 13 | 1 | 156 | ||||||||||||||
Asset impairments(e) | 3,554 | 571 | 613 | 114 | 4,852 | ||||||||||||||
Exploration expenses | 30 | — | 3 | 3 | 36 | ||||||||||||||
Pretax loss | (3,612 | ) | (448 | ) | (648 | ) | (120 | ) | (4,828 | ) | |||||||||
Income tax benefit(g) | 1,472 | 183 | 264 | 49 | 1,968 | ||||||||||||||
Results of operations | $ | (2,140 | ) | $ | (265 | ) | $ | (384 | ) | $ | (71 | ) | $ | (2,860 | ) | ||||
FOR THE YEAR ENDED DECEMBER 31, 2014 | |||||||||||||||||||
Revenues(a) | $ | 2,735 | $ | 956 | $ | 244 | $ | 88 | $ | 4,023 | |||||||||
Production costs(b) | 596 | 342 | 92 | 27 | 1,057 | ||||||||||||||
General and administrative expenses(c) | 37 | 31 | 9 | 8 | 85 | ||||||||||||||
Other operating expenses(d) | 21 | 2 | 3 | 4 | 30 | ||||||||||||||
Depreciation, depletion and amortization | 875 | 148 | 79 | 81 | 1,183 | ||||||||||||||
Taxes other than on income | 140 | 49 | 8 | 6 | 203 | ||||||||||||||
Asset impairments(e) | 1,266 | 1,110 | 437 | 589 | 3,402 | ||||||||||||||
Exploration expenses(f) | 104 | — | 9 | 5 | 118 | ||||||||||||||
Pretax loss | (304 | ) | (726 | ) | (393 | ) | (632 | ) | (2,055 | ) | |||||||||
Income tax benefit(g) | 124 | 296 | 161 | 258 | 839 | ||||||||||||||
Results of operations | $ | (180 | ) | $ | (430 | ) | $ | (232 | ) | $ | (374 | ) | $ | (1,216 | ) | ||||
(a) | Revenues are net of royalty payments. |
(b) | Production costs are the costs incurred in lifting the oil and natural gas to the surface and include gathering, processing, field storage and insurance on proved properties, but do not include DD&A, royalties, income taxes and general and administrative expenses. |
(c) | For 2016, the amount excludes unusual and infrequent charges related to severance and early retirement costs associated with field personnel totaling $6 million. For 2015, the amount excludes charges of $18 million related to early retirement and severance costs. For 2014, the amount excludes charges of $6 million related to Spin-off and transition-related costs. |
(d) | For 2016, the amount excludes net unusual and infrequent gains of $18 million that include refunds, partially offset by plant turnaround charges and other items. For 2015, the amount excludes charges related to the write-down of certain assets and rig termination charges of $82 million. For 2014, the amount excludes charges related to rig termination charges and Spin-off and transition-related costs of $55 million. |
(e) | At year end 2015 and 2014, we recorded pre-tax asset impairment charges of $4.9 billion and $3.4 billion, respectively, on certain proved and unproved properties in the San Joaquin, Los Angeles, Ventura and Sacramento basins. |
(f) | Excludes $21 million of unusual and infrequent costs related to dry holes and seismic charges. |
(g) | Income taxes are calculated on the basis of a stand-alone tax filing entity. |
122
RESULTS PER UNIT OF PRODUCTION
San Joaquin Basin | Los Angeles Basin | Ventura Basin | Sacramento Basin | Total | |||||||||||||||
(in millions) | |||||||||||||||||||
FOR THE YEAR ENDED DECEMBER 31, 2016 | |||||||||||||||||||
Revenue from each barrel of oil equivalent ($/Boe)(a)(b) | $ | 32.43 | $ | 39.24 | $ | 32.58 | $ | 16.00 | $ | 33.17 | |||||||||
Production costs | 13.21 | 22.25 | 25.62 | 9.14 | 15.61 | ||||||||||||||
General and administrative expenses(c) | 0.39 | 1.66 | 1.46 | 0.46 | 0.72 | ||||||||||||||
Other operating expenses(d) | 0.51 | 1.20 | 1.10 | — | 0.67 | ||||||||||||||
Depreciation, depletion and amortization | 13.02 | 4.43 | 5.86 | 0.46 | 10.28 | ||||||||||||||
Taxes other than on income | 1.94 | 3.51 | 2.93 | 2.74 | 2.36 | ||||||||||||||
Exploration expenses | 0.54 | — | 0.73 | 0.91 | 0.45 | ||||||||||||||
Pretax income (loss) | 2.82 | 6.19 | (5.12 | ) | 2.29 | 3.08 | |||||||||||||
Income tax (expense) benefit(f) | (1.16 | ) | (2.49 | ) | 2.20 | (0.91 | ) | (1.25 | ) | ||||||||||
Results of operations | $ | 1.66 | $ | 3.70 | $ | (2.92 | ) | $ | 1.38 | $ | 1.83 | ||||||||
FOR THE YEAR ENDED DECEMBER 31, 2015 | |||||||||||||||||||
Revenue from each barrel of oil equivalent ($/Boe)(a)(b) | $ | 37.04 | $ | 46.69 | $ | 36.10 | $ | 17.07 | $ | 38.07 | |||||||||
Production costs | 14.08 | 22.81 | 24.95 | 8.91 | 16.30 | ||||||||||||||
General and administrative expenses(c) | 0.70 | 1.72 | 2.05 | 0.74 | 1.00 | ||||||||||||||
Other operating expenses(d) | 0.37 | 0.16 | 0.59 | 0.74 | 0.36 | ||||||||||||||
Depreciation, depletion and amortization | 20.16 | 8.21 | 14.09 | 7.42 | 16.72 | ||||||||||||||
Taxes other than on income | 2.42 | 3.69 | 3.82 | 0.37 | 2.67 | ||||||||||||||
Asset impairments(e) | 88.69 | 46.85 | 179.92 | 42.30 | 83.14 | ||||||||||||||
Exploration expenses | 0.75 | — | 0.88 | 1.11 | 0.62 | ||||||||||||||
Pretax loss | (90.13 | ) | (36.75 | ) | (190.20 | ) | (44.52 | ) | (82.74 | ) | |||||||||
Income tax benefit(f) | 36.74 | 15.02 | 77.49 | 18.18 | 33.72 | ||||||||||||||
Results of operations | $ | (53.39 | ) | $ | (21.73 | ) | $ | (112.71 | ) | $ | (26.34 | ) | $ | (49.02 | ) | ||||
FOR THE YEAR ENDED DECEMBER 31, 2014 | |||||||||||||||||||
Revenue from each barrel of oil equivalent ($/Boe)(a)(b) | $ | 67.32 | $ | 88.96 | $ | 75.73 | $ | 26.11 | $ | 69.40 | |||||||||
Production costs | 14.66 | 31.82 | 28.68 | 7.92 | 18.23 | ||||||||||||||
General and administrative expenses(c) | 0.91 | 2.88 | 2.79 | 2.37 | 1.47 | ||||||||||||||
Other operating expenses(d) | 0.52 | 0.19 | 0.93 | 1.19 | 0.55 | ||||||||||||||
Depreciation, depletion and amortization | 21.52 | 13.77 | 24.52 | 24.04 | 20.40 | ||||||||||||||
Taxes other than on income | 3.44 | 4.56 | 2.48 | 1.78 | 3.50 | ||||||||||||||
Asset impairments(e) | 31.14 | 103.29 | 135.63 | 174.78 | 58.66 | ||||||||||||||
Exploration expenses | 2.56 | — | 2.79 | 1.48 | 2.03 | ||||||||||||||
Pretax loss | (7.43 | ) | (67.55 | ) | (122.09 | ) | (187.45 | ) | (35.44 | ) | |||||||||
Income tax benefit(f) | 3.05 | 27.55 | 49.97 | 76.85 | 14.47 | ||||||||||||||
Results of operations | $ | (4.38 | ) | $ | (40.00 | ) | $ | (72.12 | ) | $ | (110.60 | ) | $ | (20.97 | ) | ||||
(a) | Natural gas volumes have been converted to Boe based on the equivalence of energy content between six Mcf of natural gas and one Bbl of oil. |
(b) | Revenues are net of royalty payments. |
(c) | For 2016, the amount excludes unusual and infrequent charges related to severance and early retirement costs associated with field personnel totaling $0.12 per Boe. For 2015, the amount excludes charges of $0.31 per Boe related to early retirement and severance costs. For 2014, the amount excludes charges of $0.10 per Boe related to Spin-off and transition-related costs. |
(d) | For 2016, the amount excludes net unusual and infrequent gains of $0.35 per Boe that include refunds partially offset by plant turnaround charges and other items. For 2015, the amount excludes charges related to the write-down of certain assets and rig termination charges of totaling $1.42 per Boe. For 2014, the amount excludes charges related to rig termination charges and Spin-off and transition-related costs totaling $0.97 per Boe. |
(e) | At year end 2015 and 2014, we recorded pre-tax asset impairment charges of $4.9 billion and $3.4 billion, respectively, on certain proved and unproved properties in the San Joaquin, Los Angeles, Ventura and Sacramento basins. |
(f) | Income taxes are calculated on the basis of a stand-alone tax filing entity. |
123
STANDARDIZED MEASURE, INCLUDING YEAR-TO-YEAR CHANGES THEREIN, OF DISCOUNTED FUTURE NET CASH FLOWS
For purposes of the following disclosures, future cash flows were computed by applying to our proved oil and gas reserves the unweighted arithmetic average of the first-day-of-the-month price for each month within the years ended December 31, 2016, 2015 and 2014, respectively. The realized prices used to calculate future cash flows vary by producing area and market conditions. Future operating and capital costs were forecast using the current cost environment applied to expectations of future operating and development activities. Future income tax expenses were computed by applying, generally, year-end statutory tax rates (adjusted for permanent differences, tax credits and allowances) to the estimated net future pre-tax cash flows, after allowing for the tax basis of the assets. The discount was computed by application of a 10-percent discount factor. The calculations assumed the continuation of existing economic, operating and contractual conditions at December 31, 2016, 2015 and 2014. Such assumptions, which are prescribed by regulation, have not always proven accurate in the past. Other valid assumptions would give rise to substantially different results.
Standardized Measure of Discounted Future Net Cash Flows
Total | |||
(in millions) | |||
AT DECEMBER 31, 2016 | |||
Future cash inflows | $ | 18,831 | |
Future costs | |||
Production costs(a) | (10,092 | ) | |
Development costs(b) | (3,376 | ) | |
Future income tax expense | (340 | ) | |
Future net cash flows | 5,023 | ||
Ten percent discount factor | (2,356 | ) | |
Standardized measure of discounted future net cash flows | $ | 2,667 | |
AT DECEMBER 31, 2015 | |||
Future cash inflows | $ | 26,477 | |
Future costs | |||
Production costs(a) | (13,458 | ) | |
Development costs(b) | (3,502 | ) | |
Future income tax expense | (1,858 | ) | |
Future net cash flows | 7,659 | ||
Ten percent discount factor | (3,635 | ) | |
Standardized measure of discounted future net cash flows | $ | 4,024 | |
AT DECEMBER 31, 2014 | |||
Future cash inflows | $ | 59,709 | |
Future costs | |||
Production costs(a) | (22,906 | ) | |
Development costs(b) | (4,858 | ) | |
Future income tax expense | (10,322 | ) | |
Future net cash flows | 21,623 | ||
Ten percent discount factor | (10,795 | ) | |
Standardized measure of discounted future net cash flows | $ | 10,828 | |
(a) | Includes general and administrative expenses and taxes other than on income. |
(b) | Includes asset retirement costs. |
124
Changes in the Standardized Measure of Discounted Future Net Cash Flows From Proved Reserves Quantities
For the years ended December 31, | |||||||||||
2016 | 2015 | 2014 | |||||||||
(in millions) | |||||||||||
Beginning of year | $ | 4,024 | $ | 10,828 | $ | 9,223 | |||||
Sales and transfers of oil and natural gas produced, net of production costs and other operating expenses | (742 | ) | (1,038 | ) | (2,658 | ) | |||||
Net change in prices received per Bbl, production costs and other operating expenses | (2,297 | ) | (12,362 | ) | 567 | ||||||
Extensions, discoveries and improved recovery, net of future production and development costs | 117 | 292 | 2,593 | ||||||||
Change in estimated future development costs | 89 | 792 | 75 | ||||||||
Revisions of quantity estimates(a) | (247 | ) | (872 | ) | (925 | ) | |||||
Previously estimated development costs incurred during the period | 62 | 394 | 1,440 | ||||||||
Accretion of discount | 458 | 1,474 | 1,324 | ||||||||
Net change in income taxes | 854 | 4,228 | (468 | ) | |||||||
Purchases and sales of reserves in place, net | (4 | ) | 45 | 125 | |||||||
Changes in production rates and other | 353 | 243 | (468 | ) | |||||||
Net change | (1,357 | ) | (6,804 | ) | 1,605 | ||||||
End of year | $ | 2,667 | $ | 4,024 | $ | 10,828 | |||||
(a) | Includes revisions related to performance and price changes. |
125
OIL, NGL and NATURAL GAS PRODUCTION PER DAY
The following table sets forth the production volumes of oil, NGLs and natural gas per day for each of the three years in the period ended December 31, 2016:
2016 | 2015 | 2014 | ||||||
Oil (MBbl/d) | ||||||||
San Joaquin Basin(b) | 57 | 64 | 64 | |||||
Los Angeles Basin(c) | 29 | 34 | 29 | |||||
Ventura Basin | 5 | 6 | 6 | |||||
Sacramento Basin | — | — | — | |||||
Total | 91 | 104 | 99 | |||||
| ||||||||
NGLs (MBbl/d) | ||||||||
San Joaquin Basin(b) | 15 | 17 | 18 | |||||
Los Angeles Basin | — | — | — | |||||
Ventura Basin | 1 | 1 | 1 | |||||
Sacramento Basin | — | — | — | |||||
Total | 16 | 18 | 19 | |||||
| | | ||||||
Natural gas (MMcf/d) | ||||||||
San Joaquin Basin(b) | 150 | 172 | 180 | |||||
Los Angeles Basin(c) | 3 | 2 | 1 | |||||
Ventura Basin | 8 | 11 | 11 | |||||
Sacramento Basin | 36 | 44 | 54 | |||||
Total | 197 | 229 | 246 | |||||
Total Production (MBoe/d)(a) | 140 | 160 | 159 | |||||
(a) | Natural gas volumes have been converted to Boe based on the equivalence of energy content between six Mcf of natural gas and one Bbl of oil. |
(b) | Includes daily production from Elk Hills field of 21 MBbl oil, 13 MBbl NGLs and 106 MMcf natural gas in 2016; 24 MBbl oil, 15 MBbl NGLs and 123 MMcf natural gas in 2015; and 25 MBbl oil, 16 MBbl NGLs and 136 MMcf natural gas in 2014. |
(c) | Includes daily production from Wilmington field of 25 MBbl oil in 2016; 28 MBbl oil and 1 MMcf natural gas in 2015; and 25 MBbl oil in 2014. |
126
SCHEDULE II - VALUATION AND QUALIFYING ACCOUNTS
(in millions)
Balance at Beginning of Period | Charged (Credited) to Costs and Expenses | Charged to Other Accounts | Deductions(a) | Balance at End of Period | |||||||||||||||
2016 | |||||||||||||||||||
Deferred tax valuation allowance | $ | 382 | $ | 398 | $ | — | $ | — | $ | 780 | |||||||||
Other asset valuation allowance | $ | 68 | $ | (12 | ) | $ | — | $ | — | $ | 56 | ||||||||
Environmental reserves | $ | 7 | $ | — | $ | — | $ | (1 | ) | $ | 6 | ||||||||
2015 | |||||||||||||||||||
Deferred tax valuation allowance(b) | $ | — | $ | 294 | $ | 88 | $ | — | $ | 382 | |||||||||
Other asset valuation allowance | $ | 10 | $ | 58 | $ | — | $ | — | $ | 68 | |||||||||
Environmental reserves | $ | 8 | $ | — | $ | — | $ | (1 | ) | $ | 7 | ||||||||
2014 | |||||||||||||||||||
Other asset valuation allowance | $ | — | $ | 10 | $ | — | $ | — | $ | 10 | |||||||||
Environmental reserves | $ | 8 | $ | 1 | $ | — | $ | (1 | ) | $ | 8 | ||||||||
(a) | Consists of payments. |
(b) | Our 2015 deferred tax liabilities were net of $88 million, which represented the federal benefit for the state-related portion of the deferred tax valuation allowance. |
127
ITEM 9 | CHANGES IN AND DISAGREEMENTS WITH ACCOUNTANTS ON ACCOUNTING AND FINANCIAL DISCLOSURE |
None.
ITEM 9A | CONTROLS AND PROCEDURES |
Management's Annual Assessment of and Report on Internal Control Over Financial Reporting
The management of California Resources Corporation and its subsidiaries (CRC) is responsible for establishing and maintaining adequate internal control over financial reporting. CRC’s system of internal control over financial reporting is designed to provide reasonable assurance regarding the reliability of financial reporting and the preparation of consolidated financial statements for external purposes in accordance with generally accepted accounting principles. CRC’s internal control over financial reporting includes those policies and procedures that: (i) pertain to the maintenance of records that, in reasonable detail, accurately and fairly reflect the transactions and dispositions of CRC’s assets; (ii) provide reasonable assurance that transactions are recorded as necessary to permit preparation of financial statements in accordance with generally accepted accounting principles, and that CRC’s receipts and expenditures are being made only in accordance with authorizations of CRC’s management and directors; and (iii) provide reasonable assurance regarding prevention or timely detection of unauthorized acquisition, use or disposition of CRC’s assets that could have a material effect on the financial statements.
Because of its inherent limitations, internal control over financial reporting may not prevent or detect misstatements. Also, projections of any evaluation of effectiveness to future periods are subject to the risk that controls may become inadequate because of changes in conditions, or that the degree of compliance with the policies or procedures may deteriorate.
Management has assessed the effectiveness of CRC’s internal control system as of December 31, 2016, based on the criteria for effective internal control over financial reporting described in Internal Control - Integrated Framework issued in 2013 by the Committee of Sponsoring Organizations of the Treadway Commission (COSO). Based on this assessment, management believes that, as of December 31, 2016, CRC’s system of internal control over financial reporting is effective.
CRC’s independent auditors, KPMG LLP, have issued an audit report on CRC’s internal control over financial reporting, which is set forth in Item 8.
Evaluation of Disclosure Controls and Procedures
Our management, with the participation of our chief executive officer (CEO) and chief financial officer (CFO), has evaluated the effectiveness of our disclosure controls and procedures (as defined in Rules 13a-15(e) and 15d- 15(e) under the Securities Exchange Act of 1934, as amended (Exchange Act)), as of the end of the period covered by this Annual Report on Form 10-K. Based on that evaluation, our CEO and CFO have concluded that, as of December 31, 2016, our disclosure controls and procedures are effective and are designed to provide reasonable assurance that information we are required to disclose in reports that we file or submit under the Exchange Act is recorded, processed, summarized, and reported within the time periods specified in the rules and forms of the Securities and Exchange Commission (SEC), and that such information is accumulated and communicated to our management, including our CEO and CFO, as appropriate, to allow timely decisions regarding required disclosure.
Changes in Internal Control
There were no changes in our internal control over financial reporting (as defined in Rules 13a-15(f) and 15d-15(f) of the Exchange Act) identified in management's evaluation pursuant to Rules 13a-15(d) or 15d-15(d) of the Exchange Act during our fourth fiscal quarter that materially affected, or are reasonably likely to materially affect, our internal control over financial reporting.
Limitations on Effectiveness of Controls and Procedures
In designing and evaluating the disclosure controls and procedures, management recognizes that any controls and procedures, no matter how well designed and operated, can provide only reasonable assurance of achieving the desired control objectives.
128
ITEM 9B | OTHER INFORMATION |
None.
PART III
ITEM 10 | DIRECTORS, EXECUTIVE OFFICERS AND CORPORATE GOVERNANCE |
The information required by this item is incorporated by reference to our Proxy Statement for the 2017 Annual Meeting of Stockholders to be filed with the Securities and Exchange Commission (SEC) within 120 days of the fiscal year ended December 31, 2016 (Proxy Statement) where it appears under the caption "Corporate Governance - General Overview," " - Our Board of Directors," "- Committees of the Board - Audit Committee," "Stock Ownership Information - Section 16(a) Beneficial Ownership Reporting Compliance" and "Stockholder Proposals and Other Company Information - Stockholder Proposals and Director Nominations." The list of our executive officers and related information under "Executive Officers" set forth in Part I of this Annual Report on Form 10-K is incorporated by reference herein.
Our board of directors has adopted a code of business conduct applicable to all officers, directors and employees, which is available on our website (www.crc.com). We intend to satisfy the disclosure requirement under Item 5.05 of Form 8-K regarding amendment to, or waiver from, a provision of our code of business conduct by posting such information on our website at the address specified above.
ITEM 11 | EXECUTIVE COMPENSATION |
The information required by this item is incorporated by reference to our Proxy Statement where it appears under the caption "Compensation Discussion and Analysis" and "Compensation Committee Interlocks and Insider Participation." Pursuant to the rules and regulations under the Exchange Act, the information under the caption "Compensation Discussion and Analysis - Compensation Committee Report" shall not be deemed to be "soliciting material," or to be "filed" with the SEC, or subject to Regulation 14A or 14C under the Exchange Act or to the liabilities under Section 18 of the Exchange Act, nor shall it be deemed incorporated by reference into any filing under the Securities Act of 1933.
ITEM 12 | SECURITY OWNERSHIP OF CERTAIN BENEFICIAL OWNERS AND MANAGEMENT AND RELATED STOCKHOLDER MATTERS |
The information required by this item is incorporated by reference to our Proxy Statement where it appears under the caption "Stock Ownership Information - Security Ownership of Directors, Management and Certain Beneficial Holders." See also the information under "Securities Authorized for Issuance Under Equity Compensation Plans" in Part II, Item 5 of this report.
129
ITEM 13 | CERTAIN RELATIONSHIPS AND RELATED TRANSACTIONS AND DIRECTOR INDEPENDENCE |
The information required by this item is incorporated by reference to our Proxy Statement where it appears under the caption "Certain Relationships and Related Transactions" (except under the subheading "- Policies and Procedures") and "Director Independence Determinations."
ITEM 14 | PRINCIPAL ACCOUNTANT FEES AND SERVICES |
The information required by this item is incorporated by reference to our Proxy Statement where it appears under the caption "Proposals Requiring Your Vote - Proposal 2: Ratification of the Appointment of the Independent Registered Public Accounting Firm."
130
PART IV
ITEM 15 | EXHIBITS |
The agreements included as exhibits to this report are included to provide information about their terms and not to provide any other factual or disclosure information about us or the other parties to the agreements. The agreements contain representations and warranties by each of the parties to the applicable agreement that were made solely for the benefit of the other agreement parties and:
• | should not be treated as categorical statements of fact, but rather as a way of allocating the risk among the parties if those statements prove to be inaccurate; |
• | have been qualified by disclosures that were made to the other party in connection with the negotiation of the applicable agreement, which disclosures are not necessarily reflected in the agreement; |
• | may apply standards of materiality in a way that is different from the way investors may view materiality; and |
• | were made only as of the date of the applicable agreement or such other date or dates as may be specified in the agreement and are subject to more recent developments. |
(a) (1) and (2). Financial Statements
Reference is made to Item 8 of the Table of Contents of this report where these documents are listed.
(a) (3). Exhibits
Exhibit Number | Exhibit Description | |
2.1 | Separation and Distribution Agreement between Occidental Petroleum Corporation and California Resources Corporation (filed as Exhibit 2.1 to Registrant’s Current Report on Form 8-K filed December 1, 2014 and incorporated herein by reference). | |
3.1 | Amended and Restated Certificate of Incorporation of California Resources Corporation (filed as Exhibit 3.1 to Registrant’s Current Report on Form 8-K filed June 3, 2016 and incorporated herein by reference). | |
3.2 | Amended and Restated Bylaws of California Resources Corporation (filed as Exhibit 3.2 to the Registrant’s Current Report on Form 8-K filed November 10, 2015 and incorporated herein by reference). | |
4.1 | Indenture, dated October 1, 2014, by and among California Resources Corporation, the Guarantors and Wells Fargo Bank, National Association (filed as Exhibit 4.2 to Amendment No. 4 to the Registrant’s Information Statement on Form 10 filed October 8, 2014 and incorporated herein by reference). | |
4.2 | Indenture, dated December 15, 2015, by and among California Resources Corporation, the Guarantors and the Bank of New York Mellon Trust Company, N.A. (filed as Exhibit 4.1 to Registrant’s Current Report on Form 8-K filed December 18, 2015 and incorporated herein by reference). | |
4.3 | Guarantor Supplemental Indenture dated as of March 5, 2015, among California Resources Corporation, CRC Construction Services, LLC, certain other guarantors and Wells Fargo Bank, National Association (filed as Exhibit 4.2 to Registrant’s Registration Statement on Form S-4 filed March 12, 2015 and incorporated herein by reference). | |
4.4 | Guarantor Supplemental Indenture dated as of March 4, 2016, among California Resources Corporation, California Resources Coles Levee, LLC, certain other guarantors and The Bank of New York Mellon Trust Company, N.A., as trustee (filed as Exhibit 4.1 to Registrant’s Quarterly Report on Form 10-Q filed August 4, 2016 and incorporated herein by reference). | |
4.5 | Guarantor Supplement Indenture dated as of March 4, 2016, among California Resources Corporation, California Resources Coles Levee, L.P., certain other guarantors and The Bank of New York Mellon Trust Company, N.A., as trustee (filed as Exhibit 4.2 to Registrant’s Quarterly Report on Form 10-Q filed August 4, 2016 and incorporated herein by reference). | |
131
4.6 | Guarantor Supplemental Indenture No. 2, dated as of April 29, 2016, among California Resources Corporation, California Resources Coles Levee, L.P. and California Resources Coles Levee, LLC, certain other guarantors and Wilmington Trust, National Association, as trustee (filed as Exhibit 10.4 to Registrant’s Quarterly Report on Form 10-Q filed August 4, 2016 and incorporated herein by reference). | |
4.7 | Assumption Agreement dated as of March 6, 2015, among CRC Construction Services, LLC and JP Morgan Chase Bank, N.A., as Administrative Agent for lenders (filed as Exhibit 10.31 to Registrant’s Registration Statement on Form S-4 filed March 12, 2015 and incorporated herein by reference). | |
4.8 | Registration Rights Agreement, dated October 1, 2014, by and among California Resources Corporation, the Guarantors and the Initial Purchasers (filed as Exhibit 4.3 to Amendment No. 4 to the Registrant’s Information Statement on Form 10 filed October 8, 2014 and incorporated herein by reference). | |
4.9 | Form of 5% Senior Note due 2020 (included in Exhibit 4.2). | |
4.10 | Form of 5½% Senior Note due 2021 (included in Exhibit 4.2). | |
4.11 | Form of 6% Senior Note due 2024 (included in Exhibit 4.2). | |
4.12 | Form of 8% Senior Secured Second Lien Note due 2022 (included in Exhibit 4.1). | |
10.1 | Credit Agreement, dated as of September 24, 2014, among California Resources Corporation, the Lenders and JPMorgan Chase Bank, N.A. as Administrative Agent, a Swingline Lender and a Letter of Credit Issuer and Bank of America, N.A. as Syndication Agent, a Swingline Lender and a Letter of Credit Issuer (filed as Exhibit 10.25 to Amendment No. 5 to the Company's Registration Statement on Form 10 filed October 14, 2014, and incorporated herein by reference). | |
10.2 | First Amendment to Credit Agreement, dated as of February 25, 2015, among California Resources Corporation, the Lenders and JPMorgan Chase Bank, N.A. as Administrative Agent, a Swingline Lender and a Letter of Credit Issuer and Bank of America, N.A. as Syndication Agent, a Swingline Lender and a Letter of Credit Issuer (filed as Exhibit 10.35 to the Registrant’s Annual Report on Form 10-K filed February 27, 2015, and incorporated herein by reference). | |
10.3 | Second Amendment to Credit Agreement, dated November 2, 2015, among California Resources Corporation, the Lenders and JPMorgan Chase Bank, N.A. as Administrative Agent, a Swingline Lender and a Letter of Credit Issuer and Bank of America, N.A. as Syndication Agent, a Swingline Lender and a Letter of Credit Issuer (filed as Exhibit 10.1 to the Registrant’s Quarterly Report on Form 10-Q filed November 6, 2015, and incorporated herein by reference). | |
10.4 | Third Amendment to Credit Agreement, dated February 23, 2016, among California Resources Corporation and JP Morgan Chase Bank, N.A., as Administrative Agent, a Swingline Lender and a Letter of Credit Issuer and Bank of America, N.A. as Syndication Agent, a Swingline Lender and a Letter of Credit Issuer (filed as Exhibit 99.1to the Registrant's Current Report on Form 8-K filed February 23, 2016, and incorporated herein by reference). | |
10.5 | Fourth Amendment to Credit Agreement dated as of April 22, 2016, among California Resources Corporation, as the Borrower and JP Morgan Chase Bank, N.A., as Administrative Agent, a Swingline Lender and a Letter of Credit Issuer and Bank of America, N.A., as Syndication Agent, Swingline Lender and a Letter of Credit Issuer (filed as Exhibit 99.1 to the Registrant’s Current Report on Form 8-K filed April 22, 2016, and incorporated herein by reference). | |
10.6 | Fifth Amendment to Credit Agreement, dated August 12, 2016, among California Resources Corporation, as the Borrower and JP Morgan Chase Bank, N.A., as Administrative Agent, a Swingline Lender and a Letter of Credit Issuer and Bank of America, N.A., as Syndication Agent, a Swingline Lender and a Letter of Credit Issuer (filed as Exhibit 10.2 to the Registration’s Current Report on Form 8-K filed August 17, 2016 and incorporated herein by reference). | |
10.7 | Credit Agreement, dated August 12, 2016, among California Resources Corporation, as the Borrower, the several Lenders from time to time parties thereto, Goldman Sachs Bank USA, as Lead Arranger and Bookrunner, and The Bank of New York Mellon Trust Company, N.A., as Administrative Agent and Collateral Agent (filed as Exhibit 10.1 to the Registration’s Current Report on Form 8-K filed August 17, 2016 and incorporated herein by reference). | |
10.8 | Omnibus Amendment, dated September 12 2016, among California Resources Corporation, the Guarantors party thereto, the Collateral Trustee and the other party lien representatives party thereto (filed as Exhibit 10.3 to the Registration’s Quarterly Report on Form 10-Q filed November 3, 2016 and incorporated herein by reference). | |
132
10.9 | Intercreditor Agreement, dated December 15, 2015 between JP Morgan Chase Bank, N.A., as Priority Lien Agent and The Bank of New York Mellon Trust Company, N.A., as Second Lien Collateral Agent for the Second Lien Secured Parties (filed as Exhibit 10.4 to the Registrant’s Quarterly Report on Form 10-Q filed November 3, 2016 and incorporated herein by reference). | |
10.10 | Transition Services Agreement between Occidental Petroleum Corporation and California Resources Corporation (filed as Exhibit 10.4 to Registrant’s Current Report on Form 8-K filed December 1, 2014 and incorporated herein by reference). | |
10.11 | Tax Sharing Agreement between Occidental Petroleum Corporation and California Resources Corporation (filed as Exhibit 10.2 to Registrant’s Current Report on Form 8-K filed December 1, 2014 and incorporated herein by reference). | |
10.12 | Employee Matters Agreement between Occidental Petroleum Corporation and California Resources Corporation (filed as Exhibit 10.3 to Registrant’s Current Report on Form 8-K filed December 1, 2014 and incorporated herein by reference). | |
10.13 | Intellectual Property License Agreement between Occidental Petroleum Corporation and California Resources Corporation (filed as Exhibit 10.7 to Registrant’s Current Report on Form 8-K filed December 1, 2014 and incorporated herein by reference). | |
10.14 | Area of Mutual Interest Agreement between Occidental Petroleum Corporation and California Resources Corporation (filed as Exhibit 10.5 to Registrant’s Current Report on Form 8-K filed December 1, 2014 and incorporated herein by reference). | |
10.15 | Agreement for Implementation of an Optimized Waterflood Program for the Long Beach Unit, dated November 5, 1991, by and among the State of California, by and through the State Lands Commission, the City of Long Beach, Atlantic Richfield Company and ARCO Long Beach, Inc. (filed as Exhibit 10.10 to Amendment No. 2 to the Company's Registration Statement on Form 10 filed August 20, 2014, and incorporated herein by reference). | |
10.16 | Amendment to the Agreement for Implementation of an Optimized Waterflood Program for the Long Beach Unit, dated January 16, 2009, by and among the State of California, by and through the State Lands Commission, the City of Long Beach, and Oxy Long Beach, Inc. (filed as Exhibit 10.11 to Amendment No. 2 to the Company's Registration Statement on Form 10 filed August 20, 2014, and incorporated herein by reference). | |
10.17 | Contractors' Agreement, by and between the City of Long Beach, Humble Oil & Refining Company, Shell Oil Company, Socony Mobil Oil Company, Inc., Texaco, Inc., Union Oil Company of California, Pauley Petroleum, Inc., Allied Chemical Corporation, Richfield Oil Corporation and Standard Oil Company of California (filed as Exhibit 10.12 to Amendment No. 2 to the Company's Registration Statement on Form 10 filed August 20, 2014, and incorporated herein by reference). | |
10.18 | Confidentiality and Trade Secret Protection Agreement by and between Occidental Petroleum Corporation and California Resources Corporation, dated November 24, 2014 (filed as Exhibit 10.6 to the Company's Current Report on Form 8-K filed on December 1, 2014, and incorporated herein by reference). | |
The following are management contracts and compensatory plans required to be identified specifically as responsive to Item 601(b)(10)(iii)(A) of Regulation S-K pursuant to Item 15(b) of Form 10-K. | ||
10.19 | California Resources Corporation Long-Term Incentive Plan Restricted Stock Unit Award Terms and Conditions (filed as Exhibit 10.3 to the Registrant’s Quarterly Report Form 10-Q filed November 6, 2015, and incorporated herein by reference). | |
10.20 | California Resources Corporation Long-Term Incentive Plan, 2016 Annual Incentive Award Summary (filed as Exhibit 10.5 on Registrant’s Quarterly Report on Form 10-Q filed August 4, 2016 and incorporated herein by reference). | |
10.21 | California Resources Corporation Long-Term Incentive Plan Performance Stock Unit Award Terms and Conditions (filed as Exhibit 10.2 to the Registrant’s Quarterly Report on Form 10-Q filed November 6, 2015, and incorporated herein by reference). | |
10.22 | California Resources Corporation Long-Term Incentive Plan Nonstatutory Stock Option Award Terms and Conditions (filed as Exhibit 10.4 to the Registrant’s Quarterly Report Form 10-Q filed November 6, 2015, and incorporated herein by reference). | |
10.23 | California Resources Corporation Supplemental Savings Plan (filed as Exhibit 10.1 to the Registrant’s Current Report on Form 8-K filed on December 2, 2014, and incorporated herein by reference). | |
133
10.24 | First Amendment to California Resources Corporation Supplemental Savings Plan (filed as Exhibit 10.18 to the Registrant's Annual Report on Form 10–K filed February 29, 2016, and incorporated herein by reference). | |
10.25 | California Resources Corporation Supplemental Retirement Plan II (filed as Exhibit 10.3 to the Registrant’s Current Report on Form 8-K filed on December 2, 2014, and incorporated herein by reference). | |
10.26 | California Resources Corporation Deferred Compensation Plan (filed as Exhibit 10.2 to the Registrant’s Current Report on Form 8-K filed on December 2, 2014, and incorporated herein by reference). | |
10.27 | California Resources Corporation Long-Term Incentive Plan (filed as Exhibit 4.3 to the Registrant’s related Registration Statement on Form S-8 filed November 26, 2014 and incorporated herein by reference). | |
10.28 | Acknowledgment of Amendment to Long-Term Incentive Award Terms and Conditions with William E. Albrecht (filed as Exhibit 10.22 to the Registrant's Annual Report on Form 10–K filed February 29, 2016, and incorporated herein by reference). | |
10.29 | Form of Nonstatutory Stock Option Award Terms and Conditions (filed as Exhibit 10.6 to Amendment No. 3 to the Registrant’s Information Statement on Form 10 filed September 22, 2014 and incorporated herein by reference). | |
10.30 | Form of California Resources Corporation Long-Term Incentive Plan Restricted Stock Unit Award Terms and Conditions (filed as Exhibit 10.6 to the Registrant’s Quarterly Report on Form 10-Q filed August 4, 2016 and incorporated herein by reference). | |
10.31 | Form of 2016 Nonstatutory Stock Option Award Terms and Conditions (filed as Exhibit 10.5 to the Registrant’s Quarterly Report on Form 10-Q filed November 3, 2016, and incorporated herein by reference). | |
10.32 | Form of Performance Incentive Award Terms and Conditions (filed as Exhibit 10.6 to the Registrant’s Quarterly Report on Form 10-Q filed November 3, 2016, and incorporated herein by reference). | |
10.33 | Form of Restricted Stock Incentive Award Terms and Conditions (Not Performance-Based) (filed as Exhibit 10.8 to Amendment No. 3 to the Registrant’s Information Statement on Form 10 filed September 22, 2014 and incorporated herein by reference). | |
10.34 | Form of Restricted Stock Incentive Award Terms and Conditions (Performance-Based) (filed as Exhibit 10.1 to the Registrant's Current Report on Form 8-K filed February 10, 2015, and incorporated herein by reference). | |
10.35 | Form of Restricted Stock Unit Award for Non-Employee Directors Grant Agreement (filed as Exhibit 10.9 to Amendment No. 3 to the Registrant’s Information Statement on Form 10 filed September 22, 2014 and incorporated herein by reference). | |
10.36 | Form of Long-Term Incentive Award Terms and Conditions (Cash-based, Equity, and Cash-settled Award) (filed as Exhibit 10.10 to Amendment No. 3 to the Registrant’s Information Statement on Form 10 filed September 22, 2014 and incorporated herein by reference). | |
10.37 | Form of Restricted Stock Incentive Award Terms and Conditions (Replacement Award-Performance-Based) (filed as Exhibit 10.11 to Amendment No. 3 to the Registrant’s Information Statement on Form 10 filed September 22, 2014 and incorporated herein by reference). | |
10.38 | Form of Restricted Stock Incentive Award Terms and Conditions (Replacement Award-Not Performance-Based) (filed as Exhibit 10.12 to Amendment No. 3 to the Registrant’s Information Statement on Form 10 filed September 22, 2014 and incorporated herein by reference). | |
10.39 | Form of Phantom Share Unit Award Terms and Conditions (Replacement Award) (filed as Exhibit 10.13 to Amendment No. 3 to the Registrant’s Information Statement on Form 10 filed September 22, 2014 and incorporated herein by reference). | |
10.40 | California Resources Corporation 2014 Employee Stock Purchase Plan (filed as Exhibit 4.3 to the Registrant’s related Registration Statement on Form S-8 filed November 26, 2014 and incorporated herein by reference). | |
10.41 | Form of Indemnification Agreements (filed as Exhibit 10.14 to Amendment No. 3 Registrant’s Information Statement on Form 10 filed September 22, 2014 and incorporated herein by reference). | |
134
10.42 | First Amendment to the California Resources Corporation 2014 Employee Stock Purchase Plan effective May 4, 2016 (filed as Annex C-1 to the Registrant’s Definitive Proxy Statement on Schedule 14A filed March 23, 2016 and incorporated herein by reference). | |
10.43 | Form of Retention Letter Assignment and Assumption Agreement (filed as Exhibit 10.20 to Amendment No. 3 to the Company's Registration Statement on Form 10 filed September 22, 2014, and incorporated herein by reference). | |
10.44 | Bonus Acknowledgement Agreement between Occidental Petroleum Corporation and William E. Albrecht (filed as Exhibit 10.21 to Amendment No. 3 to the Company's Registration Statement on Form 10 filed September 22, 2014, and incorporated herein by reference). | |
10.45 | Retention and Separation Arrangement with Todd A. Stevens (filed as Exhibit 10.22 to Amendment No. 3 to the Company's Registration Statement on Form 10 filed September 22, 2014, and incorporated herein by reference). | |
10.46 | Retention and Separation Arrangement with William E. Albrecht (filed as Exhibit 10.23 to Amendment No. 3 to the Company's Registration Statement on Form 10 filed September 22, 2014, and incorporated herein by reference). | |
10.47 | Retention and Separation Arrangement with Robert A. Barnes (filed as Exhibit 10.24 to Amendment No. 3 to the Company's Registration Statement on Form 10 filed September 22, 2014, and incorporated herein by reference). | |
12* | Computation of Ratio of Earnings to Fixed Charges. | |
21* | List of Subsidiaries of California Resources Corporation. | |
23.1* | Consent of Independent Registered Public Accounting Firm. | |
23.2* | Consent of Independent Petroleum Engineers. | |
31.1* | Certification of Chief Executive Officer pursuant to Section 302 of the Sarbanes-Oxley Act of 2002. | |
31.2* | Certification of Chief Financial Officer pursuant to Section 302 of the Sarbanes-Oxley Act of 2002. | |
32.1* | Certifications of Chief Executive Officer and Chief Financial Officer pursuant to Section 906 of the Sarbanes-Oxley Act of 2002. | |
99.1* | Ryder Scott Company Estimated Future Reserves Attributable to Certain Leasehold and Royalty Interests as of December 31, 2016. | |
101.INS* | XBRL Instance Document. | |
101.SCH* | XBRL Taxonomy Extension Schema Document. | |
101.CAL* | XBRL Taxonomy Extension Calculation Linkbase Document. | |
101.LAB* | XBRL Taxonomy Extension Labels Linkbase Document. | |
101.PRE* | XBRL Taxonomy Extension Presentation Linkbase Document. | |
101.DEF* | XBRL Taxonomy Extension Definition Linkbase Document. | |
* - Filed herewith.
135
SIGNATURES
Pursuant to the requirements of Section 13 or 15(d) of the Securities Exchange Act of 1934, the registrant has duly caused this report to be signed on its behalf by the undersigned, thereunto duly authorized.
CALIFORNIA RESOURCES CORPORATION | ||
February 24, 2017 | By: | /s/ Todd A. Stevens |
Todd A. Stevens | ||
President | ||
and Chief Executive Officer | ||
Pursuant to the requirements of the Securities Exchange Act of 1934, this report has been signed below by the following persons on behalf of the registrant and in the capacities and on the dates indicated.
Title | Date | |||
/s/ Todd A. Stevens | President, | February 24, 2017 | ||
Todd A. Stevens | Chief Executive Officer and Director | |||
/s/ Marshall D. Smith | Senior Executive Vice President and | February 24, 2017 | ||
Marshall D. Smith | Chief Financial Officer | |||
/s/ Roy Pineci | Executive Vice President - Finance and | February 24, 2017 | ||
Roy Pineci | Principal Accounting Officer | |||
/s/ William E. Albrecht | Chairman of the Board | February 24, 2017 | ||
William E. Albrecht | ||||
/s/ Justin A. Gannon | Director | February 24, 2017 | ||
Justin A. Gannon | ||||
/s/ Ronald L. Havner | Director | February 24, 2017 | ||
Ronald L. Havner | ||||
/s/ Catherine Kehr | Director | February 24, 2017 | ||
Catherine Kehr | ||||
/s/ Harold M. Korell | Director | February 24, 2017 | ||
Harold M. Korell | ||||
/s/ Richard W. Moncrief | Director | February 24, 2017 | ||
Richard W. Moncrief | ||||
/s/ Avedick B. Poladian | Director | February 24, 2017 | ||
Avedick B. Poladian | ||||
/s/ Robert V. Sinnott | Director | February 24, 2017 | ||
Robert V. Sinnott | ||||
/s/ Timothy J. Sloan | Director | February 24, 2017 | ||
Timothy J. Sloan | ||||
136
EXHIBIT INDEX
EXHIBITS
12 | Computation of Ratio of Earnings to Fixed Charges. | |
21 | List of Subsidiaries of California Resources Corporation. | |
23.1 | Consent of Independent Registered Public Accounting Firm. | |
23.2 | Consent of Independent Petroleum Engineers. | |
31.1 | Certification of Chief Executive Officer pursuant to Section 302 of the Sarbanes-Oxley Act of 2002. | |
31.2 | Certification of Chief Financial Officer pursuant to Section 302 of the Sarbanes-Oxley Act of 2002. | |
32.1 | Certifications of Chief Executive Officer and Chief Financial Officer pursuant to Section 906 of the Sarbanes-Oxley Act of 2002. | |
99.1 | Ryder Scott Company Estimated Future Reserves Attributable to Certain Leasehold and Royalty Interests as of December 31, 2016. | |
101.INS | XBRL Instance Document. | |
101.SCH | XBRL Taxonomy Extension Schema Document. | |
101.CAL | XBRL Taxonomy Extension Calculation Linkbase Document. | |
101.LAB | XBRL Taxonomy Extension Labels Linkbase Document. | |
101.PRE | XBRL Taxonomy Extension Presentation Linkbase Document. | |
101.DEF | XBRL Taxonomy Extension Definition Linkbase Document. | |
137