Attached files
| file | filename |
|---|---|
| EX-32.B - EXHIBIT 32.B - CTS CORP | ex-32b1.htm |
| EX-32.A - EXHIBIT 32.A - CTS CORP | ex-32a1.htm |
| EX-31.B - EXHIBIT 31.B - CTS CORP | ex-31b1.htm |
| EX-31.A - EXHIBIT 31.A - CTS CORP | ex-31a1.htm |
| EX-23 - EXHIBIT 23 - CTS CORP | ex-231.htm |
| EX-21 - EXHIBIT 21 - CTS CORP | ex-211.htm |
UNITED STATES
SECURITIES AND EXCHANGE COMMISSION
WASHINGTON, D.C. 20549
FORM 10-K
(Mark One)
x | ANNUAL REPORT PURSUANT TO SECTION 13 OR 15(d) OF THE SECURITIES EXCHANGE ACT OF 1934 For The Fiscal Year Ended December 31, 2016 |
OR | |
o | TRANSITION REPORT PURSUANT TO SECTION 13 OR 15(d) OF THE SECURITIES EXCHANGE ACT OF 1934 |
Commission File Number: 1-4639
CTS CORPORATION
(Exact name of registrant as specified in its charter)
Indiana | 35-0225010 | |||||
(State or other jurisdiction of incorporation or organization) | (IRS Employer Identification Number) | |||||
2375 Cabot Drive, Lisle, IL (Address of principal executive offices) | 60532 (Zip Code) | |||||
Registrant's telephone number, including area code: 630-577-8800
Securities registered pursuant to Section 12(b) of the Act:
Title of Each Class | Name of Each Exchange on Which Registered | |
Common stock, without par value | New York Stock Exchange | |
Securities registered pursuant to Section 12(g) of the Act: None
Indicate by check mark if the registrant is a well-known seasoned issuer, as defined in Rule 405 of the Securities Act. Yes ¨ No x
Indicate by check mark if the registrant is not required to file reports pursuant to Section 13 or 15(d) of the Exchange Act. Yes ¨ No x
Indicate by check mark whether the registrant (1) has filed all reports required to be filed by Section 13 or 15(d) of the Securities Exchange Act of 1934 during the preceding 12 months (or for such shorter period that the registrant was required to file such reports), and (2) has been subject to such filing requirements for the past 90 days. Yes x No ¨
Indicate by check mark whether the registrant has submitted electronically and posted on its corporate Web site, if any, every Interactive Data File required to be submitted and posted pursuant to Rule 405 of Regulation S-T (§ 232.405 of this chapter) during the preceding 12 months (or for such shorter period that the registrant was required to submit and post such files). x Yes ¨ No
Indicate by check mark if disclosure of delinquent filers pursuant to Item 405 of Regulation S-K is not contained herein, and will not be contained, to the best of registrant's knowledge, in definitive proxy or information statements incorporated by reference in Part III of this Form 10-K or any amendment to this Form 10-K. ¨
Indicate by check mark whether the registrant is a large accelerated filer, an accelerated filer, a non-accelerated filer, or a smaller reporting company. See the definitions of "large accelerated filer", "accelerated filer" and "smaller reporting company" in Rule 12b-2 of the Exchange Act.
Large accelerated filer o | Accelerated filer x | Non-accelerated filer o | Smaller reporting company o | |||
(Do not check if smaller reporting company) | ||||||
Indicate by check mark whether the registrant is a shell company (as defined in Rule 12b-2 of the Exchange Act). Yes o No x
The aggregate market value of the voting and non-voting stock held by non-affiliates of CTS Corporation, based upon the closing sales price of CTS common stock on June 30, 2016, was approximately $584,000,000. There were 32,762,494 shares of common stock, without par value, outstanding on February 21, 2017.
DOCUMENTS INCORPORATED BY REFERENCE
(1) | Portions of the Proxy Statement to be filed for the annual meeting of shareholders to be held on or about May 18, 2017 are incorporated by reference in Part III. |
TABLE OF CONTENTS
ITEM | PAGE | ||||
CTS CORPORATION 1
Safe Harbor
Forward-Looking Statements
This document contains statements that are, or may be deemed to be, forward-looking statements within the meaning of the Private Securities Litigation Reform Act of 1995. These forward-looking statements include, but are not limited to, any financial or other guidance, statements that reflect our current expectations concerning future results and events, and any other statements that are not based solely on historical fact. Forward-looking statements are based on management's expectations, certain assumptions and currently available information. Readers are cautioned not to place undue reliance on these forward-looking statements, which speak only as of the date hereof and are based on various assumptions as to future events, the occurrence of which necessarily are subject to uncertainties. These forward-looking statements are made subject to certain risks, uncertainties and other factors, which could cause our actual results, performance or achievements to differ materially from those presented in the forward-looking statements. Examples of factors that may affect future operating results and financial condition include, but are not limited to: changes in the economy generally and in respect to the business in which CTS operates; unanticipated issues in integrating acquisitions; the results of actions to reposition our business; rapid technological change; general market conditions in the automotive, communications, and computer industries, as well as conditions in the industrial, defense and aerospace, and medical markets; reliance on key customers; unanticipated natural disasters or other events; environmental compliance and remediation expenses; the ability to protect our intellectual property; pricing pressures and demand for our products; and risks associated with our international operations, including trade and tariff barriers, exchange rates and political and geopolitical risks. Many of these, and other risks and uncertainties, are discussed in further detail in Item 1A. of this Annual Report on Form 10-K. We undertake no obligation to publicly update our forward-looking statements to reflect new information or events or circumstances that arise after the date hereof, including market or industry changes.
PART I
Item 1. Business
CTS Corporation ("CTS", "we", "our", "us" or the "Company") is a global manufacturer of sensors, electronic components, and actuators. CTS was established in 1896 as a provider of high-quality telephone products and was incorporated as an Indiana corporation in February 1929. Our principal executive offices are located in Lisle, Illinois.
We design, manufacture, and sell a broad line of sensors, electronic components, and actuators primarily to original equipment manufacturers ("OEMs") for the transportation, industrial, medical, information technology, defense and aerospace, and communications markets. Our vision is to be a leading provider of sensing and motion devices as well as connectivity components, enabling an intelligent and seamless world. These devices are categorized by their ability to Sense, Connect or Move. Sense products provide vital inputs to electronic systems. Connect products allow systems to function in synchronization with other systems. Move products ensure required movements are effectively and accurately executed. We are committed to achieving our vision by continuing to invest in the development of products and technologies within these categories.
We operate manufacturing facilities in North America, Asia, and Europe. Sales and marketing are accomplished through our sales engineers, independent manufacturers' representatives, and distributors.
See the Consolidated Financial Statements and Notes included in Part II, Item 8 in this Annual Report on Form 10-K for financial information regarding the Company.
PRODUCTS BY MAJOR MARKETS
Our products perform specific electronic functions for a given product family and are intended for use in customer assemblies. Our major products consist principally of sensors and actuators used in passenger or commercial vehicles, electronic components used in communications infrastructure, information technology and other high-speed applications, switches, and potentiometers supplied to multiple markets, and fabricated piezoelectric materials and substrates used primarily in medical, industrial, defense and aerospace, and information technology markets.
2 CTS CORPORATION
The following table provides a breakdown of net sales by industry as a percent of consolidated net sales:
2016 | 2015 | 2014 | |
Industry | |||
Transportation | 66% | 67% | 67% |
Industrial | 17% | 17% | 17% |
Medical | 7% | 3% | 2% |
Information Technology | 4% | 5% | 6% |
Defense and Aerospace | 4% | 5% | 4% |
Communications | 2% | 3% | 4% |
% of consolidated net sales | 100% | 100% | 100% |
The following table identifies major products by industry. Products are sold to several industry OEMs and through distributors.
Product Description | Transportation | Communications | IT | Medical | Industrial | Defense and Aerospace |
SENSE | l | l | l | l | ||
(Controls, Pedals, Piezo Sensing Products, Sensors, Switches, Transducers) | ||||||
CONNECT | l | l | l | l | l | |
(EMI/RFI Filters, Capacitors, Frequency Control, Resistors, RF filters) | ||||||
MOVE | l | l | l | |||
(Piezo Microactuators, Rotary Actuators, Thermal) | ||||||
MARKETING AND DISTRIBUTION
Sales and marketing to OEMs is accomplished through our sales engineers, independent manufacturers' representatives, and distributors. We maintain sales offices in China, Germany, Japan, Scotland, Singapore, India, Taiwan, and the United States. Approximately 90% of 2016 net sales were attributable to our sales engineers.
Our sales engineers generally service the largest customers with application-specific products. The sales engineers work closely with major customers in designing and developing products to meet specific customer requirements.
We utilize the services of independent manufacturers' representatives for customers not serviced directly by our sales engineers. Independent manufacturers' representatives receive commissions from us. During 2016, approximately 5% of net sales were attributable to independent manufacturers' representatives. We also use independent distributors. Independent distributors purchase products from us for resale to customers. In 2016, independent distributors accounted for approximately 5% of net sales.
RAW MATERIALS
We utilize a wide variety of raw materials and purchased parts in our manufacturing processes. The following are the most significant raw materials and purchased components:
Conductive inks and contactors, passive electronic components, integrated circuits and semiconductors, certain rare earth elements ("REEs"), ceramic powders, plastic components, molding compounds, printed circuit boards and assemblies, quartz blanks and crystals, wire harness assemblies, copper, brass, silver, gold, aluminum, and steel-based raw materials and components.
These raw materials and parts are purchased from several vendors, and, except for certain semiconductors, REEs, and conductive inks, we do not believe we are dependent upon one or a limited number of vendors. Although we purchase all of our semiconductors, REEs, and conductive inks from a limited number of vendors, alternative sources are available.
CTS CORPORATION 3
We do not currently anticipate any significant raw material shortages that would limit production. However, the lead times between the placement of orders for certain raw materials and purchased parts and actual delivery to us may vary. Occasionally, we may need to order raw materials in greater quantities and at higher-than-optimal prices to compensate for the variability of lead times for delivery.
PATENTS, TRADEMARKS, AND LICENSES
We maintain a program of obtaining and protecting U.S. and non-U.S. patents relating to products that we have designed and manufactured, as well as processes and equipment used in our manufacturing technology. We were issued 17 new U.S. patents and 7 non-U.S. patents in 2016 and currently hold 167 U.S. patents and 118 non-U.S. patents. We have 10 registered U.S. trademarks, 20 registered foreign trademarks and 4 international trademark registrations. We have licensed the right to use several of our patents. In 2016, license and royalty income was less than 1% of net sales.
MAJOR CUSTOMERS
Sales to our 15 largest customers as a percentage of total net sales were as follows:
Years Ended December 31, | |||
2016 | 2015 | 2014 | |
Total of 15 largest customers / net sales | 63.1% | 61.4% | 60.9% |
Our net sales to significant customers as a percentage of total net sales were as follows:
Years Ended December 31, | |||
2016 | 2015 | 2014 | |
Honda Motor Co. | 10.7% | 10.7% | 10.8% |
Toyota Motor Corporation | 10.4% | 10.1% | 8.4% |
We sells automotive parts to both Honda and Toyota for certain vehicle platforms under purchase agreements that have no volume commitments and are subject to purchase orders issued from time to time.
No other customer accounted for 10% or more of total net sales during these periods.
We continue to broaden our customer base. Changes in the level of our customers' orders have, in the past, had a significant impact on our operating results. If a major customer reduces the amount of business it does with us, or substantially changes the terms of that business, there could be an adverse impact on our operating results.
We expect to continue to depend on sales to our major customers. Because our customers are under no obligation to continue to do business with us on a long-term basis, it is possible that one or more customers may choose to work with a competitor and reduce its business with us. Customers may also reduce or delay their business with us because of economic or other conditions or decisions that reduce their need for our products or services. Since it is difficult to replace lost business on a timely basis, it is likely that our operating results would be adversely affected if one or more of our major customers were to cancel, delay, or reduce a large amount of business with us in the future. If one or more of our customers were to become insolvent or otherwise unable to pay for our products and/or services, our operating results, financial condition, and cash flows could be adversely affected.
ORDER BACKLOG
Order backlog, as previously disclosed, is comprised of firm open purchase orders we have received from our customers and generally represents 1 to 2 months of sales. Our business is a mix of purchase order based business, shorter-term contracts, and multi-year awards, such as with customers who serve the automotive end-market. As such, order backlog does not provide a meaningful indication of future sales.
4 CTS CORPORATION
COMPETITION
We compete with many domestic and foreign manufacturers principally on the basis of product features, price, technology, quality, reliability, delivery, and service. Most of our product lines encounter significant global competition. The number of competitors varies from product line to product line. No one competitor competes with us in every product line, but many competitors are larger and more diversified than we are.
Some customers have reduced or plan to reduce their number of suppliers, while increasing their volume of purchases. Customers demand lower cost and higher quality, reliability, and delivery standards from us as well as from our competitors. These trends create opportunities for us, but also increase the risk of loss of business to competitors. We are subject to competitive risks that are typical within the electronics industry, including in some cases short product life cycles and technical obsolescence.
We believe we compete most successfully in custom engineered products manufactured to meet specific applications of major OEMs.
NON-U.S. REVENUES AND ASSETS
Our net sales to external customers originating from non-U.S. operations as a percentage of total net sales were as follows:
Years Ended December 31, | |||
2016 | 2015 | 2014 | |
Net sales from non-U.S. operations to external customers | 30% | 38% | 42% |
Our percentages of total assets at non-U.S. locations were as follows:
Years Ended December 31, | |||
2016 | 2015 | 2014 | |
Total assets at non-U.S. operations | 48% | 46% | 43% |
A substantial portion of these assets, other than cash and cash equivalents, cannot readily be liquidated. We believe the business risks to our non-U.S. operations, though substantial, are normal risks for global businesses. These risks include currency controls and changes in currency exchange rates, longer collection cycles, political and transportation risks, economic downturns and inflation, government regulations, and expropriation. Our non-U.S. manufacturing facilities are located in China, Czech Republic, India, Mexico, and Taiwan.
See Note 19 "Geographic Data" in the Notes to Consolidated Financial Statements for further geographic information.
RESEARCH AND DEVELOPMENT ACTIVITIES
A summary of amounts spent for research and development activities is as follows:
Years Ended December 31, | |||||||||
(in thousands) | 2016 | 2015 | 2014 | ||||||
Research and development | $ | 24,040 | $ | 22,461 | $ | 22,563 | |||
Ongoing research and development activity is primarily focused on expanded applications, new product development, and current product and process enhancements.
We believe a strong commitment to research and development is required for growth. Most of our research and development activities relate to developing new, innovative products and technologies to meet the current and future needs of our customers. We provide our customers with engineering support to ensure quality and reliability through all phases of design, launch, and manufacturing to meet or exceed customer requirements. Many such research and development activities benefit one or a limited number of customers or potential customers. All research and development costs are expensed as incurred.
CTS CORPORATION 5
EMPLOYEES
We employed 2,796 people at December 31, 2016, with 74.2% of these employees located outside the U.S. We employed 2,883 people at December 31, 2015. Approximately 150 employees at one location in the United States were covered by two collective bargaining agreements as of December 31, 2016. Both agreements are scheduled to expire upon completion of our 2016 Restructuring Plan activities.
ADDITIONAL INFORMATION
We are incorporated in the State of Indiana. Our principal corporate office is located at 2375 Cabot Drive, Lisle, IL 60532.
Our internet address is www.ctscorp.com. We make available free of charge through our website our annual reports on Form 10-K, quarterly reports on Form 10-Q, current reports on Form 8-K and amendments to those reports filed or furnished pursuant to Section 13(a) of the Securities Exchange Act of 1934 as soon as reasonably practicable after we electronically file such material with, or furnish it to, the Securities and Exchange Commission ("SEC"). The information contained on or accessible through our website is not part of this or any other report we file or furnish to the SEC, other than the documents that we file with the SEC that are incorporated by reference herein.
Further, a copy of this annual report on Form 10-K is located at the SEC's Public Reference Room at 100 F Street, NE, Washington, D.C. 20549. Information on the operation of the Public Reference Room can be obtained by calling the SEC at 1-800-SEC-0330. The SEC maintains an internet site that contains reports, proxy and information statements and other information regarding our filings at www.sec.gov.
EXECUTIVE OFFICERS OF THE COMPANY
Executive Officers. The following serve as executive officers of CTS as of February 24, 2017. The executive officers are expected to serve until the next annual meeting of the Board of Directors, scheduled to be held on or about May 18, 2017, at which time the election of officers will be considered again by the Board of Directors.
Name | Age | Positions and Offices | ||
Kieran O'Sullivan | 54 | President, Chief Executive Officer and Chairman of the Board | ||
Ashish Agrawal | 46 | Vice President and Chief Financial Officer | ||
Luis Francisco Machado | 54 | Vice President, General Counsel and Secretary | ||
Kieran O'Sullivan - 54 - President, Chief Executive Officer and Chairman of the Board. Mr. O'Sullivan joined CTS on January 7, 2013. Before joining CTS, Mr. O'Sullivan served as Executive Vice President of Continental AG's Global Infotainment and Connectivity Business and led the NAFTA Interior Division, having joined Continental AG, a global automotive supplier, in 2006. Mr. O'Sullivan is a member of the board of directors and the compensation, audit and risk committees of LCI Industries, a supplier of components for manufacturers of recreational vehicles, manufactured homes and for the related aftermarkets of those industries.
Ashish Agrawal - 46 - Vice President and Chief Financial Officer. On November 11, 2013, Mr. Agrawal was elected Vice President and Chief Financial Officer for CTS. Mr. Agrawal joined CTS in June 2011 as Vice President, Treasury and Corporate Development, and was elected as Treasurer on September 1, 2011. Before joining CTS, Mr. Agrawal was with Dometic Corporation, a manufacturer of refrigerators, awnings and air conditioners, as Senior Vice President and Chief Financial Officer since 2007. Prior to that, Mr. Agrawal was with General Electric Co. in various positions since December 1994.
Luis Francisco Machado - 54 - Vice President, General Counsel and Secretary. Mr. Machado joined CTS in August 2015. Before joining CTS, Mr. Machado was Senior Vice President, Legal and Assistant Secretary at L Brands, Inc. since August 2010 and Associate General Counsel, Corporate and Assistant Secretary of Wm. Wrigley Jr. Company since February 2006.
Information with respect to Directors and Corporate Governance may be found in our definitive proxy statement to be delivered to shareholders in connection with our 2017 Annual Meeting of Shareholders. Such information is incorporated herein by reference.
6 CTS CORPORATION
Item 1A. Risk Factors
The following are certain risk factors that could affect our business, financial condition and operating results. These risk factors should be considered in connection with evaluating forward-looking statements contained in this Annual Report on Form 10-K or in any other reports filed or furnished by us, because these factors could cause our actual results and financial condition to differ materially from those projected in any such forward-looking statements. Before you invest in us, you should know that making such an investment involves risks, including the risks described below. The risks that are highlighted below are not the only ones that we face. If any of the following risks occur, our business, financial condition or operating results could be negatively affected.
Because we currently derive a significant portion of our revenues from a small number of customers, any decrease in orders from these customers could have an adverse effect on our business, financial condition and operating results.
We depend on a small number of customers for a large portion of our business, and changes in the level of our customers' orders have, in the past, had a significant impact on our results of operations. If a major customer significantly delays, reduces, or cancels the level of business it does with us, there could be an adverse effect on our business, financial condition and operating results, this effect would likely be material. Significant pricing and margin pressures exerted by a major customer could also materially adversely affect our operating results. In addition, we generate significant accounts receivable from sales to our major customers. If one or more of our major customers were to become insolvent or otherwise unable to pay or were to delay payment for services, our business, financial condition and operating results could be materially adversely affected.
Negative or unexpected tax consequences could adversely affect our results of operations.
We operate globally and changes in tax laws could adversely affect our results. The international tax environment continues to change as a result of both coordinated actions by governments and unilateral measures enacted by individual countries. Additionally, comprehensive tax reform may occur in the U.S. Both could significantly impact our effective tax rate, tax liabilities and our ability to utilize deferred tax assets.
Adverse changes in the underlying profitability and financial outlook of our operations in several jurisdictions could lead to changes in our valuation allowances against deferred tax assets and other tax accruals that could materially and adversely affect our results of operations. In addition, acquisitions or divestitures may cause our effective tax rate to increase.
We base our tax accounting positions upon the anticipated nature and conduct of our business and upon our understanding of the tax laws of the various countries in which we have assets or conduct activities. However, our tax accounting positions are subject to review and possible challenge by taxing authorities and to possible changes in law, which may have a retroactive effect.
We may be unable to compete effectively against competitors.
Our industry is highly competitive and characterized by price erosion and rapid technological change. We compete against many domestic and foreign companies, some of which have substantially greater manufacturing, financial, research and development and marketing resources than we do. If any customer becomes dissatisfied with our prices, quality or timeliness of delivery, among other things, it could award business to our competitors. Moreover, some of our customers could choose to manufacture and develop particular products themselves rather than purchase them from us. Increased competition could result in price reductions, reduced profit margins and loss of market share, each of which could materially adversely affect our business, financial condition and operating results. These developments also may materially adversely affect our ability to compete successfully going forward. We cannot assure you that our products will continue to compete successfully with our competitors' products, including OEMs.
We may be unable to keep pace with rapid technological changes that could make some of our products or processes obsolete before we realize a return on our investment.
The technologies relating to some of our products have undergone, and are continuing to undergo, rapid and significant changes. End markets for our products are characterized by technological change, frequent new product introductions and enhancements, changes in customer requirements, and emerging industry standards. The introduction of products embodying new technologies and the emergence of new industry standards could render our existing products obsolete and unmarketable before we can recover any or all of our research, development and commercialization expenses, or our capital investments. Furthermore, the life cycles of our products and the products we manufacture for others vary, may change, and are difficult to estimate.
We may experience difficulties that could delay or prevent the successful development, introduction and marketing of new products or product enhancements and our new products or product enhancements may not adequately meet the requirements of the marketplace or achieve market acceptance. If we are unable, for technological or other reasons, to develop and market new products
CTS CORPORATION 7
or product enhancements in a timely and cost-effective manner, our business, financial condition and operating results could be materially adversely affected.
Our customers may cancel their orders, change production quantities or locations or delay production.
We generally do not obtain firm, long-term purchase commitments from our customers, and regularly experience reduced or extended lead times in customer orders. Customers cancel orders, change production quantities and delay production for a number of reasons. Uncertain economic and geopolitical conditions may result in some of our customers delaying the delivery of some of the products we manufacture for them and placing purchase orders for lower volumes of products than previously anticipated. Cancellations, reductions or delays by a significant customer or by a number of customers may harm our results of operations by reducing the volumes of products we manufacture, as well as by causing a delay in the recovery of our expenditures for inventory in preparation for customer orders, or by reducing our asset utilization, resulting in lower profitability.
In addition, customers may require that manufacturing of their products be transitioned from one of our facilities to another to achieve cost reductions and other objectives. Such transfers may result in inefficiencies and costs due to resulting excess capacity and overhead at one facility and capacity constraints and the inability to fulfill all orders at another. In addition, we make significant decisions, including determining the levels of orders that we will seek and accept, production schedules, component procurement commitments, personnel needs and other resource requirements, based on our estimates of customer requirements. The short-term nature of our customers' commitments and the changes in demand for their products may reduce our ability to estimate future customer requirements accurately. This may make it difficult to schedule production and maximize utilization of our manufacturing capacity. Anticipated orders may not materialize and delivery schedules may be deferred as a result of changes in demand for our products or our customers' products. We often increase staffing and capacity, and incur other expenses to meet the anticipated demand of our customers, which causes reductions in our gross margins if customer orders are delayed or canceled. On occasion, customers require rapid increases in production, which may stress our resources and reduce margins. We may not have sufficient capacity at any given time to meet our customers' demands. In addition, because many of our costs and operating expenses are relatively fixed over the short-term, a reduction in customer demand could harm our gross margin and operating income until such time as adjustments can be made to activity and operating levels or to structural costs.
We sell products to customers in cyclical industries that are subject to significant downturns that could materially adversely affect our business, financial condition and operating results.
We sell products to customers in cyclical industries that have experienced economic and industry downturns. The markets for our products have softened in the past and may again soften in the future. We may face reduced end-customer demand, underutilization of our manufacturing capacity, changes in our revenue mix and other factors that could adversely affect our results of operations in the near-term. We cannot predict whether we will achieve profitability in future periods.
We derive a substantial portion of our revenues from customers in the automotive, computer and communications industries and are susceptible to trends and factors affecting those industries.
Sales to the automotive, computer and communications industries represent a substantial portion of our revenues. Factors negatively affecting these industries and the demand for their products also negatively affect our business, financial condition and operating results. Any adverse occurrence, including among others, industry slowdown, recession, political instability, costly or constraining regulations, reduced government budgets and spending, armed hostilities, terrorism, excessive inflation, prolonged disruptions in one or more of our customers' production schedules or labor disturbances, that results in a decline in the volume of sales in these industries, or in an overall downturn in the business and operations of our customers in these industries, could materially adversely affect our business, financial condition and operating results. These industries are generally unionized and some of our customers have experienced labor disruptions in the past. Furthermore, these industries are highly cyclical in nature and sensitive to changes in general economic conditions, consumer preferences and interest rates. The failure of manufacturers that we serve may result in the failure to receive payment in full for products sold in the past and an abrupt cancellation in demand for certain products. Weakness in demand, the insolvency of manufacturers that we serve or their suppliers, and constriction of credit markets may negatively and materially affect our facility utilization, cost structure, financial condition, and operating results.
Products we manufacture may contain design or manufacturing defects that could result in reduced demand for our products or services and liability claims against us.
Despite our quality control and quality assurance efforts, defects may occur in the products we manufacture due to design or manufacturing errors or component failure. Product defects could result in delayed shipments and reduced demand for our products. We may be subject to increased costs due to warranty claims on defective products. Product defects could result in product liability
8 CTS CORPORATION
claims against us where defects cause, or are alleged to cause, property damage, bodily injury or death. As we grow our business in the automotive and medical device manufacturing markets, the risk of exposure to product liability litigation increases. We may be required to participate in a recall involving products which are, or are alleged to be, defective. We carry insurance for certain legal matters involving product liability; however, we do not have coverage for all costs related to product defects and the costs of such claims, including costs of defense and settlement, may exceed our available coverage. Accordingly, our results of operations, cash flow and financial position could be adversely affected.
We are exposed to fluctuations in foreign currency exchange rates that may adversely affect our business, financial condition and operating results.
We transact business in various foreign countries. We present our consolidated financial statements in U.S. dollars, but a portion of our revenues and expenditures are transacted in other currencies. As a result, we are exposed to fluctuations in foreign currencies. Additionally, we have currency exposure arising from funds held in local currencies in foreign countries. Volatility in the exchange rates between the foreign currencies and the U.S. dollar could harm our business, financial condition and operating results. Furthermore, to the extent we sell our products in foreign markets, currency fluctuations may result in our products becoming too expensive for foreign customers.
Our operating results vary significantly from period to period.
We experience fluctuations in our operating results. Some of the principal factors that contribute to these fluctuations are: changes in demand for our products; our effectiveness in managing manufacturing processes, costs and timing of our component purchases so that components are available when needed for production, while mitigating the risks of purchasing inventory in excess of immediate production needs; the degree to which we are able to utilize our available manufacturing capacity; changes in the cost and availability of components, which often occur in the electronics manufacturing industry and which affect our margins and our ability to meet delivery schedules; general economic and served industry conditions; and local conditions and events that may affect our production volumes, such as labor conditions or political instability.
We face risks relating to our international operations.
Because we have significant international operations, our operating results and financial condition could be materially adversely affected by economic, political, health, regulatory and other factors existing in foreign countries in which we operate. Our international operations are subject to inherent risks, which may materially adversely affect us, including: political and economic instability in countries in which our products are manufactured; expropriation or the imposition of government controls; changes in government regulations; export license requirements; trade restrictions; earnings repatriation and expatriation restrictions; exposure to different legal standards, including related to intellectual property; health conditions and standards; currency controls; fluctuations in exchange rates; increases in the duties and taxes we pay; inflation or deflation; greater difficulty in collecting accounts receivable and longer payment cycles; changes in labor conditions and difficulties in staffing and managing our international operations; limitations on insurance coverage against geopolitical risks, natural disasters and business operations; and communication among and management of international operations. In addition, these same factors may also place us at a competitive disadvantage compared to some of our foreign competitors.
We may face risks associated with violations of the Foreign Corrupt Practices Act ("FCPA") and similar anti-bribery laws. The FCPA and similar anti-bribery laws in other jurisdictions generally prohibit companies and their intermediaries from making improper payments to government officials for the purpose of obtaining or retaining business. Our Code of Ethics mandates compliance with these anti-bribery laws. We operate in many parts of the world where strict compliance with anti-bribery laws may conflict with local customs and practices. We cannot assure you that our internal controls and procedures always will protect us from the detrimental actions by our employees or agents. If we are found to be liable for FCPA violations (either due to our own acts or our inadvertence or due to the acts or inadvertence of others), we could suffer from criminal or civil penalties or other sanctions, which could have a material adverse effect on our business.
Public health or safety concerns, conditions, or restrictions that impact the availability of labor or the movement of goods in some of the countries in which we operate could have a material adverse effect on our business, financial condition and operating results.
We may restructure our operations, which may materially adversely affect our business, financial condition and operating results.
We have announced and initiated restructuring plans designed to revise and consolidate certain operations for the purpose of improving our cost structure at various times in the recent past. We may incur restructuring and impairment charges in the future
CTS CORPORATION 9
if circumstances warrant. Additionally, if we are unsuccessful in implementing restructuring plans, we may experience disruptions in our operations and higher ongoing costs, which may materially adversely affect our business, financial condition and operating results.
Losses in the stock market could negatively impact pension asset returns and ultimately cash flow due to possible required contributions in the future.
We make a number of assumptions relating to our pension plans in order to measure the financial position of the plans and the net periodic benefit cost. The most significant assumptions relate to the discount rate and the expected long-term return on plan assets. If these assumptions prove to be significantly different from actual rates, then we may need to record additional expense relating to the pension plans, which could require cash contributions to fund future pension obligation payments and could have a material adverse effect on our financial condition and results of operations.
We may explore acquisitions that complement or expand our business as well as divestitures of various business operations. We may not be able to complete these transactions, and these transactions, if executed, may pose significant risks and may materially adversely affect our business, financial condition and operating results.
We intend to explore opportunities to buy other businesses or technologies that could complement, enhance or expand our current business or product lines or that might otherwise offer us growth opportunities. We may have difficulty finding these opportunities or, if we do identify these opportunities, we may not be able to complete the transactions for any number of reasons including a failure to secure financing. In addition, we may not be able to successfully or profitably integrate, operate, maintain and manage our newly acquired operations or employees. Any transactions that we are able to identify and complete may involve a number of risks, including: the diversion of management's attention from our existing business to integrate the operations and personnel of the acquired or combined business; possible adverse effects on our operating results during the integration process; difficulties managing and integrating operations in geographically dispersed locations; increases in our expenses and working capital requirements, which reduce our return on invested capital; exposure to unanticipated liabilities of acquired companies; and our possible inability to achieve the intended objectives of the transaction. Even if we are initially successful in integrating a new operation, we may not be able to maintain uniform standards, controls, procedures and policies, and this may lead to operational inefficiencies. In addition, future acquisitions may result in dilutive issuances of equity securities or the incurrence of additional debt. These and other factors could harm our ability to achieve anticipated levels of profitability from acquired operations or realize other anticipated benefits of an acquisition, and could adversely affect our business and operating results.
We have in the past, and may in the future, consider divesting certain business operations. Divestitures may involve a number of risks, including the diversion of management's attention, significant costs and expenses, the loss of customer relationships and cash flow, and the disruption of operations in the affected business. Failure to timely complete or consummate a divestiture may negatively affect valuation of the affected business or result in restructuring charges.
If we are unable to protect our intellectual property or we infringe, or are alleged to infringe, on another person's intellectual property, our business, financial condition and operating results could be materially adversely affected.
The success of our business depends, in part, upon our ability to protect trade secrets, copyrights and patents, obtain or license patents and operate without infringing on the intellectual property rights of others. We rely on a combination of trade secrets, copyrights, patents, nondisclosure agreements and technical measures to protect our proprietary rights in our products and technology. The steps we have taken to prevent misappropriation of our technology may be inadequate. In addition, the laws of some foreign countries in which we operate do not protect our proprietary rights to the same extent as do the laws of the United States. Although we continue to evaluate and implement protective measures, there can be no assurance that these efforts will be successful. Our inability to protect our intellectual property rights could diminish or eliminate the competitive advantages that we derive from our technology, cause us to lose sales or otherwise harm our business.
We believe that patents will continue to play an important role in our business. However, there can be no assurance that we will be successful in securing patents for claims in any pending patent application or that any issued patent will provide us with any competitive advantage. We also cannot provide assurance that the patents will not be challenged by third parties or that the patents of others will not materially adversely affect our ability to do business.
We may become involved in litigation in the future to protect our intellectual property or because others may allege that we infringed on their intellectual property. These claims and any resulting lawsuit could subject us to liability for damages and invalidate our intellectual property rights. If an infringement claim is successfully asserted by a holder of intellectual property rights, we may be required to cease marketing or selling certain products, pay penalties and spend significant time and money to develop a non-
10 CTS CORPORATION
infringing product or process or to obtain licenses for the technology, process or information from the holder. We may not be successful in the development of a non-infringing alternative, or licenses may not be available on commercially acceptable terms, if at all, in which case we may lose sales and profits. In addition, any litigation could be lengthy and costly and could materially adversely affect us even if we are successful in the litigation.
We may experience shortages and increased costs of raw material and required electronic components.
Unanticipated raw material or electronic component shortages may prevent us from making scheduled shipments to customers. Our inability to make scheduled shipments could cause us to experience a shortfall in revenue, increase our costs and adversely affect our relationship with affected customers and our reputation as a reliable supplier. We may be required to pay higher prices for raw materials or electronic components in short supply and order these raw materials or electronic components in greater quantities to compensate for variable delivery times. We may also be required to pay higher prices for raw materials or electronic components due to inflationary trends regardless of supply. We are also dependent on our suppliers' ability to supply and deliver raw materials on a timely basis at negotiated prices. Any delay or inability to deliver raw materials by our suppliers may require that we attempt to mitigate such failure or fail to make deliveries to our customers on a timely basis. As a result, raw material or electronic component shortages, price increases, or failure to perform by our suppliers could adversely affect our operating results for a particular period due to the resulting revenue shortfall and/or increased costs.
Loss of our key management and other personnel, or an inability to attract key management and other personnel, could materially affect our business.
We depend on our senior executive officers and other key personnel to run our business. We do not have long-term employment contracts with our key personnel. The loss of any of these officers or other key personnel could adversely affect our operations. Competition for qualified employees among companies that rely heavily on engineering and technology is at times intense, and the loss of qualified employees or an inability to attract, retain and motivate additional highly skilled employees required for the operation and expansion of our business could hinder our ability to conduct research activities and develop marketable products successfully.
We are subject to a variety of environmental, health, and safety laws and regulations that expose us to potential financial liability.
Our operations are regulated by a number of federal, state, local and foreign environmental, health, and safety (“EHS”) laws and regulations that govern, among other things, air and water emissions, worker protection, and the handling, storage and disposal of hazardous materials. Compliance with EHS laws and regulations is a major consideration for us because we use hazardous materials in our manufacturing processes. If we violate EHS laws and regulations, we could be liable for substantial fines, penalties, and costs of mandated remedial actions. Our environmental permits could also be revoked or modified, which could require us to cease or limit production at one or more of our facilities, thereby materially adversely affecting our business, financial condition and operating results. EHS laws and regulations have generally become more stringent over time and could continue to do so, imposing greater compliance costs and increasing risks and penalties associated with any violation, which also could materially affect our business, financial condition and operating results.
We have been notified by the U.S. Environmental Protection Agency, state environmental agencies and, in some cases, groups of potentially responsible parties, that we are potentially liable for environmental contamination at several sites currently and formerly owned or operated by us, including sites designated as National Priorities List sites under the U.S. Environmental Protection Agency’s Superfund program. Superfund liability is joint and several and we may be held responsible for more than our share of contamination at a site. Although we estimate our potential environmental liability and reserve for such matters, we cannot assure you that our reserves will be sufficient to cover the actual costs that we incur as a result of these matters.
Future events, such as the notification of potential liability at new sites, the discovery of additional contamination or changes to an approved remedy at existing sites, changes to existing EHS environmental laws and regulations or their interpretation, and more rigorous regulatory action by government authorities, may require additional expenditures by us, which could have a negative impact on our operations.
In addition, we could be affected by future laws or regulations imposed in response to climate change concerns. Such laws or regulations could have a material adverse effect on our business, financial condition, and results of operations.
CTS CORPORATION 11
Our indebtedness may adversely affect our financial health.
Our debt consists of borrowings under our revolving credit facility. Our indebtedness could, among other things: increase our vulnerability to general economic and industry conditions, including recessions; require us to use cash flow from operations to service our indebtedness, thereby reducing our ability to fund working capital, capital expenditures, research and development efforts and other expenses; limit our flexibility in planning for, or reacting to, changes in our business and the industries in which we operate; place us at a competitive disadvantage compared to competitors that have less indebtedness; or limit our ability to borrow additional funds that may be needed to operate and expand our business. Moreover, an increase in interest rates could increase our interest expense.
Our credit facility contains provisions that could materially restrict our business.
Our revolving credit facility requires us to deliver quarterly financial statements, annual financial statements, auditors certifications and compliance certificates. Additionally, the revolving credit facility contains restrictions limiting our ability to: dispose of assets; incur certain additional debt; repay other debt or amend subordinated debt instruments; create liens on assets; make investments, loans or advances; make acquisitions or engage in mergers or consolidations; engage in certain transactions with our subsidiaries and affiliates; and repurchases stock or make dividend payments above a certain amount.
The restrictions contained in our credit facility could limit our ability to plan for or react to market conditions or meet capital needs or could otherwise restrict our activities or business plans. These restrictions could adversely affect our ability to finance our operations, make strategic acquisitions, fund investments or other capital needs or engage in other business activities that could be in our interest.
Further, our ability to comply with our loan covenants may be affected by events beyond our control that could result in an event of default under our credit facility, or documents governing any other existing or future indebtedness. A default, if not cured or waived, may permit acceleration of our indebtedness. In addition, our lenders could terminate their commitments to make further extensions of credit under our credit facility. If our indebtedness is accelerated, we cannot be certain that we will have sufficient funds to pay the accelerated indebtedness or that we will have the ability to refinance accelerated indebtedness on terms favorable to us or at all.
Regulations related to conflict minerals could adversely impact our business.
The Dodd-Frank Wall Street Reform and Consumer Protection Act contains provisions to improve transparency and accountability concerning the supply of certain minerals, known as conflict minerals, originating from the Democratic Republic of Congo ("DRC") and adjoining countries. As a result, the SEC adopted annual disclosure and reporting requirements for those companies who may use conflict minerals mined from the DRC and adjoining countries in their products. There have been and will continue to be costs associated with complying with these disclosure requirements, including diligence costs to determine the sources of minerals used in our products and other potential changes to products, processes or sources of supply to the extent necessary as a consequence of such verification activities. These rules could adversely affect the sourcing, supply and pricing of materials used in our products. As there may be only a limited number of suppliers offering conflict-free minerals, we cannot be sure that we will be able to obtain necessary conflict-free minerals from such suppliers in sufficient quantities or at competitive prices. Also, we may face reputational challenges if we determine that certain of our products contain conflict minerals or if we are unable to sufficiently verify the origins for all minerals used in our products through the procedures we may implement.
Ineffective internal control over our financial reporting may harm our business.
We are subject to the ongoing internal control provisions of Section 404 of the Sarbanes-Oxley Act of 2002 ("Sarbanes-Oxley"). Our controls necessary for continued compliance with Sarbanes-Oxley may not operate effectively or at all times and may result in a material weakness. The identification of material weaknesses in internal control over financial reporting could indicate a lack of proper controls to generate accurate financial statements. Further, the effectiveness of our internal controls may be impacted if we are unable to retain sufficient skilled finance and accounting personnel, especially in light of the increased demand for such personnel among publicly traded companies.
12 CTS CORPORATION
Natural disasters may adversely impact our capability to supply product to our customers.
Natural disasters occurring at any of our locations may lead to disruption in our capability to supply product to our customers. In some cases, it may not be possible for us to find an alternate manufacturing location for certain product lines, further impacting our capability to recover from such a disruption.
We could face risks to our systems, networks and production including increased IT security threats and more sophisticated and targeted computer crime.
Increased global information technology security threats and more sophisticated and targeted computer crime pose a risk to the security of our systems and networks and the confidentiality, availability and integrity of our data and communications. While we attempt to mitigate these risks by employing a number of measures - including employee training, comprehensive monitoring of our networks and systems, and maintenan]ce of backup and protective systems - our systems, networks and products remain potentially vulnerable to advanced persistent threats. Depending on their nature and scope, such threats could potentially lead to the compromising of confidential information and communications, improper use of our systems and networks, manipulation and destruction of data, defective products, production downtimes and operational disruptions, which in turn could adversely affect our reputation, competitiveness and results of operations. Additionally, any updates to or implementation of systems may cause delays or disruptions in our processes or production which could adversely affect our results.
CTS CORPORATION 13
Item 1B. Unresolved Staff Comments
Not applicable.
Item 2. Properties
As of February 24, 2017, we had manufacturing facilities, administrative, research and development and sales offices in the following locations:
Manufacturing Facilities | Square Footage | Owned/Leased | ||
Albuquerque, New Mexico | 102,800 | Leased | ||
Bolingbrook, Illinois | 30,600 | Leased | ||
Elkhart, Indiana | 319,000 | Owned | ||
Haryana, India | 19,400 | Leased | ||
Hopkinton, Massachusetts | 32,000 | Owned | ||
Juarez, Mexico | 114,200 | Leased | ||
Kaohsiung, Taiwan | 75,900 | Owned | (1) | |
Matamoros, Mexico | 51,000 | Owned | ||
Nogales, Mexico | 64,000 | Leased | ||
Ostrava, Czech Republic | 67,600 | Leased | ||
Tianjin, China | 225,000 | Owned | (2) | |
Zhongshan, China | 112,600 | Leased | ||
Total manufacturing | 1,214,100 | |||
(1) Ground lease through 2017; restrictions on use and transfer apply.
(2) Land Use Rights Agreement through 2050 includes transfer, lease and mortgage rights.
Non-Manufacturing Facilities | Square Footage | Owned/Leased | Description | |
Brownsville, Texas | N/A | Owned | Land | |
Brownsville, Texas | 10,000 | Leased | Warehouse | |
El Paso, Texas | 22,400 | Leased | Office and warehouse | |
Elkhart, Indiana | 93,000 | Owned | Idle facility | |
Farmington Hills, Michigan | 1,800 | Leased | Sales office | |
Glasgow, Scotland | 18,600 | Leased | Administrative offices and research | |
Lisle, Illinois | 37,300 | Leased | Administrative offices and research | |
Lisle, Illinois | 105,925 | Leased | Administrative offices and research (possession in late 2017) | |
Malden, Massachusetts | 3,600 | Leased | Administrative offices and research | |
Nagoya, Japan | 800 | Leased | Sales office | |
Sandwich, Illinois | N/A | Owned | Land | |
Singapore | 5,600 | Leased | Sales office | |
Yokohama, Japan | 1,400 | Leased | Sales office | |
Total non-manufacturing | 300,425 | |||
We regularly assess the adequacy of our manufacturing facilities for manufacturing capacity, available labor, and proximity to our markets and major customers. Management believes our manufacturing facilities are suitable and adequate, and have sufficient capacity to meet our current needs. The extent of utilization varies from plant to plant and with general economic conditions. We also review the operating costs of our facilities and may from time-to-time relocate a portion of our manufacturing activities in order to reduce operating costs and improve asset utilization and cash flow.
14 CTS CORPORATION
Item 3. Legal Proceedings
From time to time we are involved in litigation with respect to matters arising from the ordinary conduct of our business, and currently certain claims are pending against us. In the opinion of management, based upon presently available information, either adequate provision for anticipated costs have been accrued or the ultimate anticipated costs will not materially affect our consolidated financial position, results of operations, or cash flows.
See NOTE 9 "Contingencies" in the Notes to the Consolidated Financial Statements in this Annual Report on Form 10-K.
Item 4. Mine Safety Disclosures
Not applicable.
CTS CORPORATION 15
PART II
Item 5. Market for Registrant's Common Equity, Related Shareholder Matters and Issuer Purchases of Equity Securities
Our common stock is listed on the New York Stock Exchange under the symbol "CTS." On February 21, 2017, there were approximately 1,099 shareholders of record.
Our quarterly dividend was $0.04 per share, or an annual rate of $0.16 per share, for the years ended December 31, 2016, and 2015. The declaration of a dividend and the amount of any such dividend is subject to earnings, anticipated working capital, capital expenditures, other investment requirements, our financial condition, and any other factors considered relevant by the Board of Directors.
Per Share Data (Unaudited)
Dividends | Net Earnings | ||||||||||||||
High(1) | Low(1) | Declared | Basic | Diluted | |||||||||||
2016 | |||||||||||||||
4th quarter | $ | 24.80 | $ | 16.35 | $ | 0.04 | $ | 0.25 | $ | 0.25 | |||||
3rd quarter | 19.79 | 17.10 | 0.04 | 0.11 | 0.11 | ||||||||||
2nd quarter | 19.09 | 15.06 | 0.04 | 0.44 | 0.44 | ||||||||||
1st quarter | 17.39 | 12.87 | 0.04 | 0.24 | 0.24 | ||||||||||
2015 | |||||||||||||||
4th quarter | $ | 20.25 | $ | 16.86 | $ | 0.04 | $ | (0.42 | ) | $ | (0.42 | ) | |||
3rd quarter | 19.49 | 17.85 | 0.04 | (0.15 | ) | (0.15 | ) | ||||||||
2nd quarter | 19.45 | 17.15 | 0.04 | 0.58 | 0.57 | ||||||||||
1st quarter | 18.22 | 15.30 | 0.04 | 0.19 | 0.19 | ||||||||||
(1) The market prices of CTS common stock presented reflect the highest and lowest sales prices on The New York Stock Exchange for each quarter of the last two years.
As shown in the following table, we did not repurchase stock during the twelve months ended December 31, 2016:
(in thousands, except share data) | (a) Total Number of Shares Purchased | (b) Average Price Paid per Share | (c) Total Value of Shares Purchased as Part of Plans or Program | (d) Maximum Value of Shares That May Yet Be Purchased Under the Plans or Programs(1) | |||||||
Balance at December 31, 2015 | $ | 17,554 | |||||||||
January 1, 2016 – December 31, 2016 | — | $ | — | $ | — | $ | 17,554 | ||||
(1) In April 2015, the Board of Directors authorized a program to repurchase up to $25 million of our common stock in the open market. The authorization has no expiration.
16 CTS CORPORATION
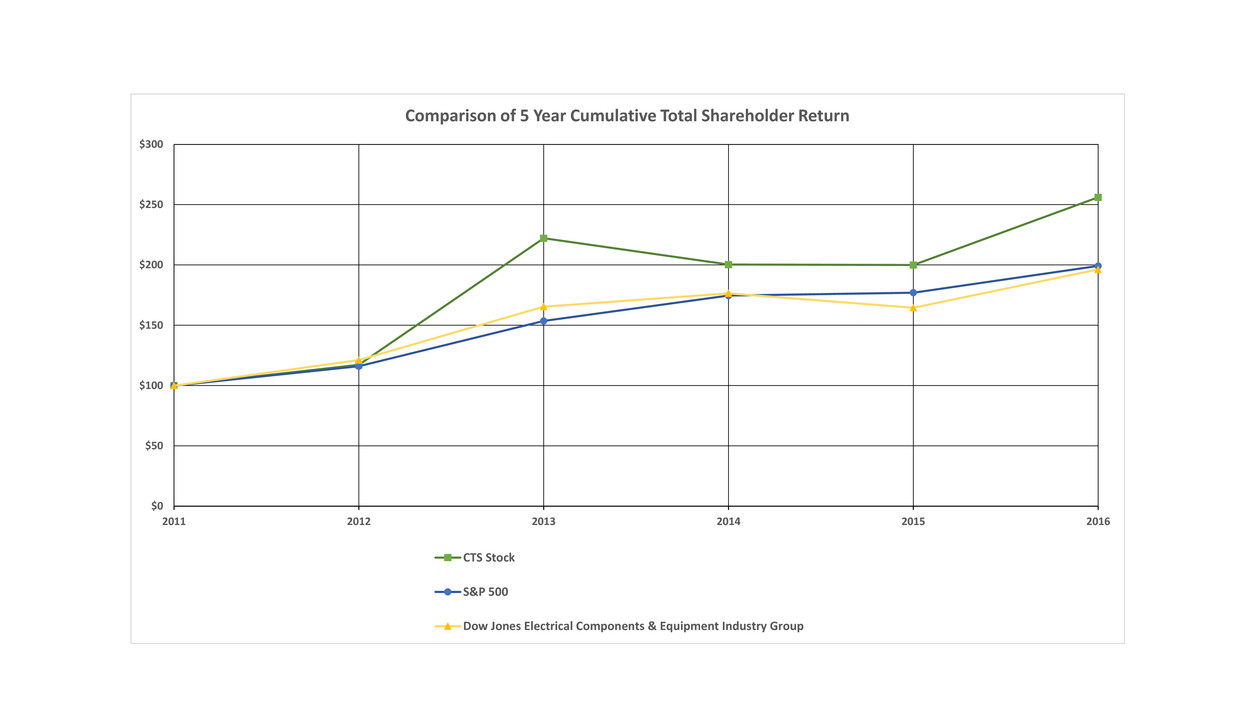
Shareholder Performance Graph
The following graph shows a five-year comparison of the cumulative total shareholder return on CTS common stock with the cumulative total returns of a general market index and a peer group index (S&P 500 and Dow Jones Electrical Components & Equipment Industry Group). The graph tracks the performance of a $100 investment in the Company's common stock and in each of the indexes (with the reinvestment of all dividends) on December 31, 2011.
CTS CORPORATION 17
Item 6. Selected Financial Data
Five-Year Summary
(Amounts in thousands, except percentages and per share amounts)
2016 | % of Sales | 2015 | % of Sales | 2014 | % of Sales | 2013 | % of Sales | 2012 | % of Sales | ||||||||||||||||
Summary of Operations | |||||||||||||||||||||||||
Net sales from continuing operations | $ | 396,679 | 100.0 | $ | 382,310 | 100.0 | $ | 404,021 | 100.0 | $ | 409,461 | 100.0 | $ | 304,481 | 100.0 | ||||||||||
Cost of goods sold | 256,251 | 64.6 | 255,201 | 66.8 | 274,058 | 67.8 | 288,108 | 70.4 | 212,965 | 70.0 | |||||||||||||||
Gross Margin | 140,428 | 35.4 | 127,109 | 33.2 | 129,963 | 32.2 | 121,353 | 29.6 | 91,516 | 30.0 | |||||||||||||||
Insurance recovery from business interruption | — | — | — | — | — | — | — | — | (637 | ) | (0.2 | ) | |||||||||||||
Selling, general and administrative expenses | 61,624 | 15.5 | 59,586 | 15.6 | 61,051 | 15.1 | 71,646 | 17.5 | 63,071 | 20.7 | |||||||||||||||
Research and development expenses | 24,040 | 6.1 | 22,461 | 5.9 | 22,563 | 5.6 | 23,222 | 5.7 | 20,918 | 6.9 | |||||||||||||||
Non-recurring environmental expense | — | — | 14,541 | 3.8 | — | — | — | — | — | — | |||||||||||||||
Restructuring and impairment charges | 3,048 | 0.8 | 14,564 | 3.8 | 5,941 | 1.5 | 10,455 | 2.5 | 3,437 | 1.1 | |||||||||||||||
Gain on sale of assets | (11,450 | ) | (2.9 | ) | (2,156 | ) | (0.6 | ) | (1,915 | ) | (0.5 | ) | (1,657 | ) | (0.4 | ) | (10,334 | ) | (3.4 | ) | |||||
Operating earnings from continuing operations | 63,166 | 15.9 | 18,113 | 4.7 | 42,323 | 10.5 | 17,687 | 4.3 | 15,061 | 4.9 | |||||||||||||||
Other (expense) income | (5,921 | ) | (1.5 | ) | (5,852 | ) | (1.5 | ) | (2,975 | ) | (0.7 | ) | 376 | 0.1 | (617 | ) | (0.2 | ) | |||||||
Earnings before income taxes from continuing operations | 57,245 | 14.4 | 12,261 | 3.2 | 39,348 | 9.8 | 18,063 | 4.4 | 14,444 | 4.7 | |||||||||||||||
Income tax expense from continuing operations | 22,865 | 5.8 | 5,307 | 1.4 | 12,826 | 3.2 | 16,066 | 3.9 | 952 | 0.3 | |||||||||||||||
Earnings from continuing operations | 34,380 | 8.7 | 6,954 | 1.8 | 26,522 | 6.6 | 1,997 | 0.5 | 13,492 | 4.4 | |||||||||||||||
(Loss)/earnings from discontinued operations, net of tax | — | — | — | (5,926 | ) | 6,841 | |||||||||||||||||||
Net earnings (loss) | $ | 34,380 | $ | 6,954 | $ | 26,522 | $ | (3,929 | ) | $ | 20,333 | ||||||||||||||
Retained earnings - beginning of year | $ | 381,840 | 380,145 | 358,997 | 367,800 | 352,205 | |||||||||||||||||||
Dividends declared | (5,241 | ) | (5,259 | ) | (5,374 | ) | (4,874 | ) | (4,738 | ) | |||||||||||||||
Retained earnings - end of year | $ | 410,979 | $ | 381,840 | $ | 380,145 | $ | 358,997 | $ | 367,800 | |||||||||||||||
Net earnings (loss) per share: | |||||||||||||||||||||||||
Basic: | |||||||||||||||||||||||||
Continuing operations | $ | 1.05 | $ | 0.21 | $ | 0.79 | $ | 0.06 | $ | 0.40 | |||||||||||||||
Discontinued operations | — | — | — | (0.18 | ) | 0.20 | |||||||||||||||||||
Total | $ | 1.05 | $ | 0.21 | $ | 0.79 | $ | (0.12 | ) | $ | 0.60 | ||||||||||||||
Diluted: | |||||||||||||||||||||||||
Continuing operations | $ | 1.03 | $ | 0.21 | $ | 0.78 | $ | 0.06 | $ | 0.39 | |||||||||||||||
Discontinued operations | — | — | — | (0.18 | ) | 0.20 | |||||||||||||||||||
Total | $ | 1.03 | $ | 0.21 | $ | 0.78 | $ | (0.12 | ) | $ | 0.59 | ||||||||||||||
Average basic shares outstanding (000s) | 32,728 | 32,959 | 33,618 | 33,601 | 33,922 | ||||||||||||||||||||
Average diluted shares outstanding (000s) | 33,251 | 33,484 | 34,130 | 34,249 | 34,523 | ||||||||||||||||||||
Cash dividends per share (annualized) | $ | 0.160 | $ | 0.160 | $ | 0.160 | $ | 0.145 | $ | 0.140 | |||||||||||||||
Capital expenditures | $ | 20,500 | $ | 9,723 | $ | 12,949 | $ | 13,982 | $ | 16,323 | |||||||||||||||
Depreciation and amortization | $ | 18,992 | $ | 16,254 | $ | 16,971 | $ | 21,169 | $ | 19,615 | |||||||||||||||
Financial Position at Year End | |||||||||||||||||||||||||
Current assets | $ | 215,707 | $ | 245,954 | $ | 240,401 | $ | 236,269 | $ | 309,558 | |||||||||||||||
Current liabilities | 98,129 | 94,620 | 79,982 | 95,120 | 115,040 | ||||||||||||||||||||
Current ratio | 2.2 to 1 | 2.5 to 1 | 3.0 to 1 | 2.5 to 1 | 2.7 to 1 | ||||||||||||||||||||
Working capital | 117,578 | 151,334 | 160,419 | 141,149 | 194,518 | ||||||||||||||||||||
Inventories | 28,652 | 24,600 | 27,887 | 32,226 | 81,752 | ||||||||||||||||||||
Net property, plant and equipment | 82,111 | 69,872 | 71,414 | 74,869 | 93,725 | ||||||||||||||||||||
Total assets | 517,697 | 483,373 | 456,926 | 480,265 | 561,190 | ||||||||||||||||||||
Long-term debt | 89,100 | 90,700 | 75,000 | 75,000 | 153,500 | ||||||||||||||||||||
Long-term obligations, including long-term debt | 101,686 | 107,099 | 87,155 | 88,416 | 178,392 | ||||||||||||||||||||
Shareholders' equity | 317,882 | 281,654 | 289,789 | 296,729 | 267,758 | ||||||||||||||||||||
Common shares outstanding (000s) | 32,762 | 32,548 | 33,392 | 33,559 | 33,433 | ||||||||||||||||||||
Equity (book value) per share | $ | 9.70 | $ | 8.65 | $ | 8.68 | $ | 8.84 | $ | 8.01 | |||||||||||||||
Stock price range | 12.87-24.80 | 15.30-20.25 | 15.58-21.65 | 9.33-20.10 | 7.06-11.22 | ||||||||||||||||||||
______________________________
Certain acquisitions, divestitures, closures of operations or product lines, and certain accounting reclassifications affect the comparability of information contained in the "Five-Year Summary."
18 CTS CORPORATION
Item 7. Management's Discussion and Analysis of Financial Condition and Results of Operations
Overview
CTS Corporation ("CTS", "we", "our" or "us") is a leading designer and manufacturer of products that Sense, Connect and Move. Our vision is to be a leading provider of sensing and motion devices as well as connectivity components, enabling an intelligent and seamless world. These devices are categorized by their ability to Sense, Connect or Move. Sense products provide vital inputs to electronic systems. Connect products allow systems to function in synchronization with other systems. Move products ensure required movements are effectively and accurately executed. We are committed to achieving our vision by continuing to invest in the development of products and technologies within these categories.
We manufacture sensors, electronic components, and actuators in North America, Europe, and Asia, and supply them to OEMs and distributors serving the transportation, industrial, medical, information technology, defense and aerospace, and communications markets.
There is an increasing proliferation of sensing and motion applications within various markets we serve. In addition, the increasing connectivity of various devices to the internet results in greater demand for communication bandwidth and data storage, increasing the need for our connectivity products. Our success is dependent on the ability to execute our strategy to support these trends. We are subject to challenges including periodic market softness, competition from other suppliers, changes in technology, and the ability to add new customers, launch new products or penetrate new markets.
Results of Operations: Fourth Quarter 2016 versus Fourth Quarter 2015
(Amounts in thousands, except percentages and per share amounts):
The following table highlights changes in significant components of the Consolidated Statements of Earnings (Loss) for the quarters ended December 31, 2016, and December 31, 2015:
Three Months Ended December 31, | Percent of Net Sales | |||||||||||
2016 | 2015 | Percent Change | 2016 | 2015 | ||||||||
Net sales | $ | 101,584 | $ | 93,282 | 8.9 | 100.0 | 100.0 | |||||
Cost of goods sold (1) | 65,723 | 63,128 | 4.1 | 64.7 | 67.7 | |||||||
Gross margin | 35,861 | 30,154 | 18.9 | 35.3 | 32.3 | |||||||
Selling, general and administrative expenses | 15,165 | 15,917 | (4.7 | ) | 14.9 | 17.1 | ||||||
Research and development expenses | 5,626 | 6,083 | (7.5 | ) | 5.5 | 6.5 | ||||||
Restructuring and impairment charges | 873 | 9,335 | (90.6 | ) | 0.9 | 10.0 | ||||||
Loss (gain) on sale of assets | 51 | (2,112 | ) | (102.4 | ) | 0.1 | (2.3 | ) | ||||
Total operating expenses | 21,715 | 29,223 | (25.7 | ) | 21.4 | 31.3 | ||||||
Operating earnings | 14,146 | 931 | 1,419.4 | 13.9 | 1.0 | |||||||
Other expense, net | (2,775 | ) | (1,610 | ) | 72.4 | (2.7 | ) | (1.7 | ) | |||
Earnings (loss) before income tax | 11,371 | (679 | ) | (1,774.7 | ) | 11.2 | (0.7 | ) | ||||
Income tax expense | 3,061 | 12,974 | (76.4 | ) | 3.0 | 13.9 | ||||||
Net earnings (loss) | $ | 8,310 | $ | (13,653 | ) | (160.9 | ) | 8.2 | (14.6 | ) | ||
Diluted earnings per share: | ||||||||||||
Diluted net earnings (loss) per share | $ | 0.25 | $ | (0.42 | ) | |||||||
(1) | Cost of goods sold includes restructuring-related charges of $0 in 2016 and $187 in 2015. |
Sales of $101,584 in the fourth quarter of 2016 increased $8,302 or 8.9% from the fourth quarter of 2015. Sales to automotive end-markets increased $3,487. Higher sensor and actuator volumes were partially offset by an unfavorable foreign exchange impact. Sales to other end-markets increased $4,815 including sales from the single crystal acquisition. Changes in foreign exchange rates reduced sales by $1,049 year-over-year due to the U.S. Dollar appreciating compared to the Chinese Renminbi and Euro.
Gross margin as a percent of sales was 35.3% in the fourth quarter of 2016 compared to 32.3% in the fourth quarter of 2015. The increase in gross margin resulted from cost savings from continued efficiency gains, material and labor productivity projects, savings from restructuring projects, favorable mix, and the addition of sales from the single crystal acquisition. In addition, foreign exchange rates had a favorable impact on manufacturing costs due to the strengthening of the U.S. Dollar compared to the Mexican Peso.
CTS CORPORATION 19
Selling, general and administrative expenses were $15,165 or 14.9% of sales in the fourth quarter of 2016 versus $15,917 or 17.1% of sales in the comparable quarter of 2015. The decrease is primarily attributable to timing of certain expenses. The fourth quarter of 2016 includes added costs as a result of the single crystal acquisition, including amortization of intangibles.
Research and development expenses were $5,626 or 5.5% of sales in the fourth quarter of 2016 compared to $6,083 or 6.5% of sales in the comparable quarter of 2015. The decrease is related to timing of certain expenses. Research and development expenses are focused on expanded applications of existing products, new product development, and enhancements for current products and processes.
Restructuring and impairment charges in the fourth quarter of 2016 totaled $873 for severance and other costs in connection with our 2016 restructuring plan. These costs in the fourth quarter 2015 totaled $9,335 and consisted of a non-cash charge for unamortized losses related to the windup of our U.K. pension plan in the amount of $8,280 and other costs incurred in connection with our previously announced 2013 and 2014 restructuring plans.
Operating earnings were $14,146 or 13.9% of sales in the fourth quarter of 2016 compared to $931 or 1.0% of sales in the comparable quarter of 2015 as a result of the items discussed above.
Other income and expense items are summarized in the following table:
Three Months Ended December 31, | ||||||
2016 | 2015 | |||||
Interest expense | $ | (956 | ) | $ | (673 | ) |
Interest income | 223 | 719 | ||||
Other expense | (2,042 | ) | (1,656 | ) | ||
Total other expense, net | $ | (2,775 | ) | $ | (1,610 | ) |
Interest expense increased in the fourth quarter of 2016 versus 2015 due to higher interest rates, higher commitment fees as a result of increasing the revolving credit facility from $200,000 to $300,000, and amortization of a contingent earnout liability associated with our Filter Sensing Technologies acquisition. Interest income declined due to lower cash balances in China. Other expense in the fourth quarter of 2016 and 2015 was driven by foreign currency translation losses, mainly due to the appreciation of the U.S. Dollar compared to the Chinese Renminbi.
Three Months Ended December 31, | ||||
2016 | 2015 | |||
Effective tax rate | 26.9 | % | (1,910.8 | )% |
The effective income tax rate for the fourth quarter of 2016 was 26.9%, which includes the impact of restructuring charges, one-time items, the tax impact of non-recurring stock compensation changes, and adjustments to valuation allowances. The effective income tax rate for the fourth quarter of 2015 was (1,910.8%), which included the impact of restructuring charges and one-time items. In the fourth quarter of 2015, we determined that as a result of changes in the business, the foreign earnings of our Canadian and U.K. subsidiaries were no longer permanently reinvested and a provision for the expected taxes on repatriation of those earnings was recorded. In addition, although we plan to permanently reinvest the earnings of our Chinese operations outside the U.S., we determined that we will not maintain those earnings in China in order to mitigate future currency risk. As a result of these changes, we recorded a tax expense of $7,461. We recorded additional discrete tax items related to valuation allowances, foreign earnings, and other discrete items in the fourth quarter of 2015, which increased income tax expense by $4,912. Since the shutdown of manufacturing facilities in the U.K. and Canada, we do not anticipate generating future profits in these countries. Therefore, the change in permanent reinvestment assertion for these two countries is not expected to have an ongoing impact on the Company's effective tax rate. We continue to record tax expense for withholding taxes (currently 10%) on earnings in China that are not anticipated to be maintained in China.
Net earnings were $8,310, or $0.25 per diluted share, in the fourth quarter of 2016 compared to a net loss of $(13,653), or $(0.42) per diluted share, in the comparable quarter of 2015.
20 CTS CORPORATION
Results of Operations: Years Ended December 31, 2016, versus Year Ended December 31, 2015
(Amounts in thousands, except percentages and per share amounts):
The following table highlights changes in significant components of the Consolidated Statements of Earnings for the years ended December 31, 2016, and December 31, 2015:
Years Ended December 31, | Percent of Net Sales | |||||||||||
2016 | 2015 | Percent Change | 2016 | 2015 | ||||||||
Net sales | $ | 396,679 | $ | 382,310 | 3.8 | 100.0 | 100.0 | |||||
Cost of goods sold (1) | 256,251 | 255,201 | 0.4 | 64.6 | 66.8 | |||||||
Gross margin | 140,428 | 127,109 | 10.5 | 35.4 | 33.2 | |||||||
Selling, general and administrative expenses | 61,624 | 59,586 | 3.4 | 15.5 | 15.6 | |||||||
Research and development expenses | 24,040 | 22,461 | 7.0 | 6.1 | 5.9 | |||||||
Non-recurring environmental expense | — | 14,541 | N/M | — | — | |||||||
Restructuring and impairment charges | 3,048 | 14,564 | (79.1 | ) | 0.8 | 3.8 | ||||||
Gain on sale of assets | (11,450 | ) | (2,156 | ) | 431.1 | (2.9 | ) | (0.6 | ) | |||
Total operating expenses | 77,262 | 108,996 | (29.1 | ) | 19.5 | 28.5 | ||||||
Operating earnings | 63,166 | 18,113 | 248.7 | 15.9 | 4.7 | |||||||
Other expense, net | (5,921 | ) | (5,852 | ) | 1.2 | (1.5 | ) | (1.5 | ) | |||
Earnings before income tax | 57,245 | 12,261 | 366.9 | 14.4 | 3.2 | |||||||
Income tax expense | 22,865 | 5,307 | 330.8 | 5.7 | 1.4 | |||||||
Net earnings | 34,380 | 6,954 | 394.4 | 8.7 | 1.8 | |||||||
Diluted earnings per share: | ||||||||||||
Diluted net earnings per share | $ | 1.03 | $ | 0.21 | ||||||||
(1) | Cost of goods sold includes restructuring related charges of $0 in 2016 and $631 in 2015. |
N/M = not meaningful
Sales of $396,679 for the year ended December 31, 2016, increased $14,369, or 3.8% from 2015. Sales to automotive end-markets increased $5,198. Higher sensor volumes were partially offset by an unfavorable foreign exchange impact. Sales to other end-markets increased $9,171 including the addition of sales from our single crystal acquisition. Sales of components for high-density disk drives ("HDD") declined 30% year-over-year. Changes in foreign exchange rates reduced sales by $2,746 year-over-year as the U.S. Dollar appreciated compared to the Chinese Renminbi and other currencies.
Gross margin as a percent of sales was 35.4% in 2016 versus 33.2% in 2015. The increase in gross margin resulted from cost savings from continued efficiency gains, material and labor productivity projects, savings from restructuring projects, favorable mix, and the addition of sales from our single crystal acquisition. In addition, foreign exchange rates had a favorable impact on manufacturing costs primarily due to the strengthening of the U.S. Dollar against the Mexican Peso.
Selling, general and administrative expenses were $61,624, or 15.5% of sales for the year ended December 31, 2016, versus $59,586 or 15.6% of sales in the comparable period of 2015. Expenses in 2016 include added costs as a result of our single crystal acquisition, including amortization of intangibles. In addition, we paid an early termination fee related to a leased facility in Lisle, Illinois in anticipation of a move in the 2017/2018 time frame to another leased facility in the same area, which will consolidate the Bolingbrook and Lisle, Illinois sites into one facility and reduce ongoing expenses.
Research and development expenses were $24,040 or 6.1% of sales in 2016 compared to $22,461 or 5.9% of sales in 2015. The increase was related to continued investment in new products to drive organic growth and expenses from our single crystal acquisition. Research and development expenses are focused on expanded applications of existing products, new product development, and enhancements for current products and processes.
A non-recurring environmental charge of $14,541 was recorded in the third quarter of 2015 related to a site in Asheville, North Carolina. The charge recorded included both the interim remediation costs we proposed, which was accepted by the Environmental Protection Agency (“EPA”), and anticipated future remediation and monitoring costs.
Restructuring and impairment charges for the year ended December 31, 2016, totaled $3,048 and consisted largely of severance, production line move and legal costs in connection with the 2016 restructuring plan. Restructuring and impairment charges for the year ended December 31, 2015, totaled $14,564 and consisted largely of a non-cash charge for unamortized losses related to
CTS CORPORATION 21
the windup of our U.K. pension plan in the amount of $8,280 as well as severance and other costs incurred in connection with the 2013 and 2014 restructuring plans.
The 2016 gain on sale of assets of $11,450 is driven principally by a gain on the sale of our former manufacturing facility in Canada in June 2016.
Operating earnings were $63,166, or 15.9% of sales in 2016, compared to $18,113, or 4.7% of sales in 2015 as a result of the items discussed above.
Other income and expense items are summarized in the following table:
Years Ended December 31, | ||||||
2016 | 2015 | |||||
Interest expense | $ | (3,702 | ) | $ | (2,628 | ) |
Interest income | 1,305 | 3,073 | ||||
Other expense | (3,524 | ) | (6,297 | ) | ||
Total other expense, net | $ | (5,921 | ) | $ | (5,852 | ) |
Interest expense increased in the year ended December 31, 2016, versus the comparable period in 2015 as a result of higher average debt balances related to our single crystal acquisition, higher interest rates, higher commitment fees as a result of increasing the revolving credit facility from $200,000 to $300,000, and amortization of a contingent earnout liability associated with our Filter Sensing Technologies acquisition. Interest income decreased due to lower cash balances in China. Other expense, net in the year ended December 31, 2016, was driven by foreign currency translation losses, mainly due to the appreciation of the U.S. Dollar compared to the Chinese Renminbi. Other expense, net in the year ended December 31, 2015, was also driven by foreign currency translation losses, mainly due to the appreciation of the U.S. Dollar compared to the Renminbi and the Euro.
Years Ended December 31, | ||||
2016 | 2015 | |||
Effective tax rate | 39.9 | % | 43.3 | % |
The effective income tax rate in 2016 was 39.9%, which includes the impact of restructuring charges and one-time items. The tax rate in 2016 reflects an increase in valuation allowances recorded against certain state net operating losses and tax credits and the revaluation of U.S. deferred taxes as a result of the June 2016 restructuring activities discussed in Note 7, "Costs Associated with Exit and Restructuring Activities", in this Annual Report on Form 10-K. The rate also reflects an increase in the valuation allowance on certain non-U.S. losses as a result of changes in the expectation of our ability to utilize those losses, changes in the mix of earnings by jurisdiction, our decision to no longer permanently reinvest the earnings of our Canadian and U.K. subsidiaries, tax expense for withholding taxes on earnings in China that are not anticipated to be maintained in China, and various other discrete items. The effective income tax rate in 2015 was 43.3%, which included the impact of restructuring charges and one-time items. In 2015, we determined that as a result of changes in the business, the foreign earnings of our Canadian and U.K. subsidiaries were no longer permanently reinvested. Therefore, a provision for the expected taxes on repatriation of those earnings was recorded. In addition, although we plan to permanently reinvest the earnings of our Chinese operations outside the U.S., we have determined that we will not maintain those earnings in China in order to mitigate future currency risk. As a result of these changes, we recorded a tax expense of $7,461. We recorded a benefit of $16,305 related to a change in the treatment of foreign taxes for U.S. federal income tax purposes. We also recorded additional discrete tax items in 2015 which increased income tax expense by $10,157 related to uncertain tax positions on certain foreign taxes, valuation allowances, foreign earnings, and other discrete items.
Net earnings were $34,380 or $1.03 per diluted share for the year ended December 31, 2016, compared to earnings of $6,954 or $0.21 per diluted share in the comparable period of 2015.
22 CTS CORPORATION
Results of Operations: Years Ended December 31, 2015, versus Year Ended December 31, 2014
(Amounts in thousands, except percentages and per share amounts):
The following table highlights changes in significant components of the Consolidated Statements of Earnings for the years ended December 31, 2015, and December 31, 2014:
Years Ended December 31, | Percent of Net Sales | |||||||||||
2015 | 2014 | Percent Change | 2015 | 2014 | ||||||||
Net sales | $ | 382,310 | $ | 404,021 | (5.4 | ) | 100.0 | 100.0 | ||||
Cost of goods sold (1) | 255,201 | 274,058 | (6.9 | ) | 66.8 | 67.8 | ||||||
Gross margin | 127,109 | 129,963 | (2.2 | ) | 33.2 | 32.2 | ||||||
Selling, general and administrative expenses | 59,586 | 61,051 | (2.4 | ) | 15.6 | 15.1 | ||||||
Research and development expenses | 22,461 | 22,563 | (0.5 | ) | 5.9 | 5.6 | ||||||
Non-recurring environmental expense | 14,541 | — | N/M | 3.8 | — | |||||||
Restructuring and impairment charges | 14,564 | 5,941 | 145.1 | 3.8 | 1.5 | |||||||
Gain on sale of assets | (2,156 | ) | (1,915 | ) | 12.6 | (0.6 | ) | (0.5 | ) | |||
Total operating expenses | 108,996 | 87,640 | 24.4 | 28.5 | 21.7 | |||||||
Operating earnings | 18,113 | 42,323 | (57.2 | ) | 4.7 | 10.5 | ||||||
Other expense, net | (5,852 | ) | (2,975 | ) | 96.7 | (1.5 | ) | (0.7 | ) | |||
Earnings before income tax | 12,261 | 39,348 | (68.8 | ) | 3.2 | 9.8 | ||||||
Income tax expense | 5,307 | 12,826 | (58.6 | ) | 1.4 | 3.2 | ||||||
Net earnings | 6,954 | 26,522 | (73.8 | ) | 1.8 | 6.6 | ||||||
Diluted earnings per share: | ||||||||||||
Diluted net earnings per share | $ | 0.21 | $ | 0.78 | ||||||||
(1) | Cost of goods sold includes restructuring related charges of $631 in 2015 and $1,935 in 2014. |
N/M = not meaningful
Sales of $382,310 for the year ended December 31, 2015, decreased $21,711 or 5.4% from 2014. Sales to automotive markets declined $14,941 partly due to lower volumes of older automotive products and partly due to an unfavorable currency impact of approximately $7,800. Other sales were down $6,770 driven by weak demand in communications and HDD markets.
Gross margin as a percent of sales was 33.2% in 2015 versus 32.2% in 2014. The increase in gross margin resulted from cost savings from continued efficiency gains, material and labor productivity projects, and savings from restructuring projects. We realized a substantial portion of anticipated savings from the shift of production from Canada to lower cost locations. In addition, foreign exchange rates had a favorable impact on manufacturing costs as the U.S. Dollar appreciated against various local currencies in countries in which we have manufacturing operations.
Selling, general and administrative expenses were $59,586 or 15.6% of sales for the year ended December 31, 2015, versus $61,051 or 15.1% of sales in the comparable period of 2014. The decrease was attributable to restructuring actions, cost containment efforts, and the timing of certain expenses.
Research and development expenses were $22,461 or 5.9% of sales in 2015 compared to $22,563 or 5.6% of sales in 2014. The decrease was driven by a re-prioritization of spending on specific projects and timing of projects. Research and development expenses are primarily focused on expanded applications of existing products and new product development as well as current product and process enhancements.
A non-recurring environmental charge of $14,541 was recorded in the third quarter of 2015 related to a site in Asheville, North Carolina. The charge recorded included both the interim remediation costs we proposed, which were accepted by the EPA, and anticipated future remediation and monitoring costs.
Restructuring and impairment charges for the year ended December 31, 2015, totaled $14,564 and consisted largely of a non-cash charge for unamortized losses related to the windup of our U.K. pension plan in the amount of $8,280 as well as severance and other costs incurred in connection with the 2013 and 2014 restructuring plans. Restructuring charges for the year ended December 31, 2014, totaled $5,941 and consisted primarily of severance costs related to the consolidation of our Canadian operation into other facilities, lease impairment costs in the U.K., asset impairment costs related to the sale of our Carol Stream facility, and costs in other locations related to the 2013 and 2014 restructuring plans.
CTS CORPORATION 23
Operating earnings were $18,113, or 4.7% of sales in 2015, compared to $42,323, or 10.5% of sales in 2014 as a result of the items discussed above.
Other income and expense items are summarized in the following table:
Years Ended December 31, | ||||||
2015 | 2014 | |||||
Interest expense | $ | (2,628 | ) | $ | (2,326 | ) |
Interest income | 3,073 | 2,786 | ||||
Other expense | (6,297 | ) | (3,435 | ) | ||
Total other expense, net | $ | (5,852 | ) | $ | (2,975 | ) |
Interest expense increased in the year ended December 31, 2015, versus the comparable period in 2014 as a result of higher borrowings in 2015. The higher borrowings were primarily to fund share buybacks in 2015. Interest income increased primarily due to higher cash balances. Other expense in the years ended December 31, 2015, and December 31, 2014, was primarily due to the unfavorable foreign exchange impact related to the appreciation of the U.S. Dollar compared to the Chinese Renminbi and the Euro.
Years Ended December 31, | ||||
2015 | 2014 | |||
Effective tax rate | 43.3 | % | 32.6 | % |
The effective income tax rate in 2015 was 43.3%, which included the impact of restructuring charges and one-time items. In 2015, we determined that as a result of changes in the business, the foreign earnings of our Canadian and U.K. subsidiaries were no longer permanently reinvested. Therefore, a provision for the expected taxes on repatriation of those earnings was recorded. In addition, although we plan to permanently reinvest the earnings of our Chinese operations outside the U.S., we have determined that we will not maintain those earnings in China in order to mitigate future currency risk. As a result of these changes, we recorded a tax expense of $7,461. We recorded a benefit of $16,305 related to a change in the treatment of foreign taxes for U.S. federal income tax purposes. We recorded additional discrete tax items in 2015, which increased income tax expense by $10,157 related to uncertain tax positions on certain foreign taxes, valuation allowances, foreign earnings, and other discrete items. The effective tax rate in 2014 was 32.6%, which included the impact of restructuring charges and one-time items. Tax adjustments related to restructuring increased the rate by 2.9% in 2014. Discrete tax items reduced the rate by 1.6%. The 2014 effective rate reflected higher profits, primarily from a change in the mix of earnings by jurisdiction.
Net earnings were $6,954 or $0.21 per diluted share for the year ended December 31, 2015, compared to earnings of $26,522 or $0.78 per diluted share in the comparable period of 2014.
Liquidity and Capital Resources
(Amounts in thousands, except percentages and per share amounts):
Cash and cash equivalents were $113,805 at December 31, 2016, and $156,928 at December 31, 2015, of which $112,736 and $156,310, respectively, were held outside the United States. The decrease in cash and cash equivalents of $43,123 was driven by a payment for a business acquisition in the amount of $73,063, capital expenditures of $20,500, dividends paid of $5,234, and other net cash outflows of $3,824, which were partially offset by cash generated from operations of $47,202 and proceeds from the sale of assets of $12,296. Total debt as of December 31, 2016, and December 31, 2015, was $89,100 and $90,700, respectively. Total debt as a percentage of total capitalization, defined as the sum of notes payable and long-term debt as a percentage of total debt and shareholders’ equity, was 22.1% at December 31, 2016, compared to 24.4% at December 31, 2015.
Working capital decreased by $33,756 from December 31, 2015, to December 31, 2016, primarily due to the aforementioned $43,123 decrease in cash and cash equivalents, partially offset by a $8,049 increase in accounts receivable, net.
Cash Flows from Operating Activities
Net cash provided by operating activities was $47,202 during the year ended December 31, 2016. Components of net cash provided by operating activities included net earnings of $34,380, depreciation and amortization expense of $18,992, and other net non-cash items totaling $2,998 (gains on sales of assets and foreign currency hedges, deferred income taxes, restructuring charges, stock-based compensation, and pension and other post-retirement plan adjustments), which were offset by net changes in assets and liabilities of $9,168.
24 CTS CORPORATION
Cash Flows from Investing Activities
Net cash used in investing activities for the year ended December 31, 2016, was $81,267, which includes $20,500 of capital expenditures, $12,296 in proceeds from the sale of fixed assets, and $73,063 paid for a business acquisition.
Cash Flows from Financing Activities
Net cash used in financing activities for the year ended December 31, 2016, was $8,643, which includes $5,234 of dividend payments, $1,600 of net payments on long-term debt, and $1,809 of taxes paid on behalf of equity award participants.
Capital Resources
We have an unsecured revolving credit facility; which has a term through January 10, 2020.
Long-term debt was comprised of the following:
As of December 31, | ||||||
2016 | 2015 | |||||
Revolving credit facility due in 2020 | $ | 89,100 | $ | 90,700 | ||
Weighted-average interest rate | 1.9 | % | 1.5 | % | ||
Amount available | $ | 208,735 | $ | 106,985 | ||
Total credit facility | $ | 300,000 | $ | 200,000 | ||
Standby letters of credit | $ | 2,165 | $ | 2,315 | ||
Commitment fee percentage per annum | 0.25 | % | 0.25 | % | ||
On August 10, 2015, we entered into a new five-year credit agreement (“Revolving Credit Facility”) with a group of banks in order to support our financing needs. The Revolving Credit Facility originally provided for a credit line of $200,000. On May 23, 2016, we requested and received a $100,000 increase in the aggregate revolving credit commitments under our existing credit agreement, which increased the credit line from $200,000 to $300,000.
The Revolving Credit Facility requires, among other things, that we comply with a maximum total leverage ratio and a minimum fixed charge coverage ratio. Failure to comply with these covenants could reduce the borrowing availability under the Revolving Credit Facility. We were in compliance with all debt covenants at December 31, 2016.
We use interest rate swaps to convert the Revolving Credit Facility’s variable rate of interest into a fixed rate on a portion of our debt balance. In the second quarter of 2012, we entered into four separate interest rate swap agreements to fix interest rates on $50,000 of long-term debt for the periods January 2013 to January 2017. In the third quarter of 2012, we entered into four additional interest rate swap agreements to fix interest rates on $25,000 of long-term debt for the periods January 2013 to January 2017. In the third quarter of 2016, we entered into three additional forward-starting interest rate swap agreements to fix interest rates on $50,000 of long-term debt for the periods August 2017 to August 2020. The difference to be paid or received under the terms of the swap agreements will be recognized as an adjustment to interest expense when settled.
Generally, our practice and intention is to reinvest the earnings of our non-U.S. subsidiaries outside the U.S. However, we determined during 2015 that as a result of changes in the business, the foreign earnings of our subsidiaries in Canada and the U.K. were no longer permanently reinvested. Therefore, a provision for the expected taxes on repatriation of those earnings was recorded at that time. Any repatriation may not result in significant cash income tax payments as the taxable event would likely be offset by the utilization of the then available tax credits, resulting in no significant net cash taxes being incurred. We do not provide for U.S. income taxes on undistributed earnings of our foreign subsidiaries that are intended to be permanently reinvested.
We have historically funded our capital and operating needs primarily through cash flows from operating activities, supported by available credit under our Revolving Credit Facility. We believe that cash flows from operating activities and available borrowings under our Revolving Credit Facility will be adequate to fund our working capital, capital expenditures and debt service requirements for at least the next twelve months. However, we may choose to pursue additional equity and debt financing to provide additional liquidity or to fund acquisitions.
CTS CORPORATION 25
Critical Accounting Policies and Estimates
Management prepared the consolidated financial statements under accounting principles generally accepted in the United States of America. These principles require the use of estimates, judgments, and assumptions. We believe that the estimates, judgments, and assumptions we used are reasonable, based upon the information available.
Our estimates and assumptions affect the reported amounts in our financial statements. The following accounting policies comprise those that we believe are the most critical in understanding and evaluating our reported financial results.
Revenue Recognition
Product revenue is recognized once four criteria are met: (1) we have persuasive evidence that an arrangement exists; (2) delivery has occurred and title has passed to the customer, which generally happens at the point of shipment, provided that no significant obligations remain; (3) the price is fixed and determinable; and (4) collectability is reasonably assured.
Product Warranties
Provisions for estimated warranty expenses related to our automotive products are made at the time products are sold. These estimates are established using a quoted industry rate. We adjust our warranty reserve for any known or anticipated warranty claims as new information becomes available. We evaluate our warranty obligations at least quarterly and adjust our accruals if it is probable that future costs will be different than our current reserve. Over the last three years, product warranty reserves have ranged from 0.5% to 0.7% of total sales. We believe our reserve level is appropriate considering the quality of our products.
Accounts Receivable
We have standardized credit granting and review policies and procedures for all customer accounts, including:
• | Credit reviews of all new significant customer accounts, |
• | Ongoing credit evaluations of current customers, |
• | Credit limits and payment terms based on available credit information, |
• | Adjustments to credit limits based upon payment history and the customer's current creditworthiness, |
• | An active collection effort by regional credit functions, reporting directly to the corporate financial officers, and |
• | Limited credit insurance on the majority of our international receivables. |
We reserve for estimated credit losses based upon historical experience and specific customer collection issues. Over the last three years, accounts receivable reserves have ranged from 0.2% to 0.3% of total accounts receivable. We believe our reserve level is appropriate considering the quality of the portfolio. While credit losses have historically been within expectations and the reserves established, we cannot guarantee that our credit loss experience will continue to be consistent with historical experience.
Inventories
We value our inventories at the lower of the actual cost to purchase or manufacture using the first-in, first-out ("FIFO") method, or net realizable value. We review inventory quantities on hand and record a provision for excess and obsolete inventory based on forecasts of product demand and production requirements.
Over the last three years, our reserves for excess and obsolete inventories have ranged from 17.6% to 20.1% of gross inventory. We believe our reserve level is appropriate considering the quantities and quality of the inventories.
Retirement Plans
Actuarial assumptions are used in determining pension income and expense and our pension benefit obligation. We utilize actuaries from consulting companies in each applicable country to develop our discount rates, matching high-quality bonds currently available and expected to be available during the period to maturity of the pension benefit in order to provide the necessary future cash flows to pay the accumulated benefits when due. After considering the recommendations of our actuaries, we have assumed a discount rate, expected rate of return on plan assets, and a rate of compensation increase in determining our annual pension income and expense and the projected benefit obligation. During the fourth quarter of each year, we review our actuarial assumptions in light of current economic factors to determine if the assumptions need to be adjusted. Changes in the actuarial assumptions could have a material effect on our results of operations.
26 CTS CORPORATION
Valuation of Goodwill
Goodwill of a reporting unit is tested for impairment annually, or more frequently, if an event occurs or circumstances change that would more-likely-than-not reduce the fair value of a reporting unit below its carrying amount. Examples of such events or circumstances include, but are not limited to, the following:
• | Significant decline in market capitalization relative to net book value, |
• | Significant adverse change in legal factors or in the business climate, |
• | Adverse action or assessment by a regulator, |
• | Unanticipated competition, |
• | More-likely-than-not expectation that a reporting unit or a significant portion of a reporting unit will be sold or otherwise disposed of, |
• | Testing for recoverability of a significant asset group within a reporting unit, and |
• | Allocation of a portion of goodwill to a business to be disposed. |
If we believe that one or more of the above indicators of impairment have occurred, we perform an impairment test. The test involves a two-step process. The first step of the impairment test involves comparing the fair values of the applicable reporting units with their aggregate carrying values, including goodwill. We generally determine the fair value of our reporting units using two valuation methods: "Income Approach — Discounted Cash Flow Method" and "Market Approach — Guideline Public Company Method". The approach defined below is based upon our last impairment test conducted as of October 1, 2016.
Under the "Income Approach — Discounted Cash Flow Method", the key assumptions include sales, cost of sales, and operating expense projections through the year 2021. These assumptions were determined by management utilizing our internal operating plan and assuming growth rates for revenues, operating expenses, and gross margin assumptions. The fourth key assumption under this approach is the discount rate, which is determined by looking at current risk-free rates, current market interest rates and the evaluation of risk premium relevant to the business segment. If any of our assumptions were to change or were incorrect, our fair value calculation may change, which could result in impairment.
Under the "Market Approach — Guideline Public Company Method", we identified eight publicly traded companies which we believe have significant relevant similarities to CTS. For these eight companies, we calculated a range of EBITDA multiples derived from the ratio of enterprise value to EBITDA and compared these multiples to the corresponding multiples for each of our reporting units. Similar to the income approach discussed above, sales, cost of sales, operating expenses and growth rates were key assumptions utilized in developing projected EBITDA levels for each of our reporting units. The market prices of CTS and the other guideline company's shares are also key assumptions as they are used to calculate enterprise value.
The results of these two methods are weighted based upon management's determination. The Market approach is based upon historical and current economic conditions, which might not reflect the long-term prospects or opportunities for our reporting units being evaluated.
If the carrying amount of a reporting unit exceeds the reporting unit's fair value, we perform the second step of the goodwill impairment test to determine the amount of impairment loss, if any. This involves comparing the implied fair value of the affected reporting unit's goodwill with the carrying value of that goodwill.
There have not been any significant changes to our impairment testing methodology other than updates to the assumptions to reflect the current market environment. Based upon our latest assessment, we determined that our goodwill was not impaired as of October 1, 2016. We will monitor future results and will perform a test if indicators trigger an impairment review.
CTS CORPORATION 27
Valuation of Other Intangible and Long-Lived Assets
We evaluate the impairment of identifiable intangibles and other long-lived assets whenever events or changes in circumstances indicate that the carrying value may not be recoverable. Factors considered that may trigger an impairment review consist of, but are not limited to, the following:
• | Significant decline in market capitalization relative to net book value, |
• | Significant underperformance relative to expected historical or projected future operating results, |
• | Significant changes in the manner of use of the acquired assets or the strategy for the overall business, |
• | Significant negative industry or economic trends. |
If we believe that one or more indicators of impairment have occurred, we perform a recoverability test by comparing the carrying amount of an asset or asset group to the sum of the undiscounted cash flows expected to result from the use and the eventual disposition of the asset or asset group. If such assets are considered to be impaired, the impairment to be recognized is measured by the amount by which the carrying amount of the assets exceeds the fair value. No indicators of impairment were identified as of December 31, 2016.
Environmental and Legal Contingencies
U.S. GAAP requires a liability to be recorded for contingencies when it is probable that a liability has been incurred and the amount of the liability can be reasonably estimated. Significant judgment is required to determine the existence of a liability as well as the amount to be recorded. We regularly consult with attorneys and consultants to determine the relevant facts and circumstances before we record a liability. Changes in laws, regulatory orders, cost estimates, participation of other parties, timing of payments, input of attorneys and consultants, or other circumstances may have a material impact on the recorded liability.
Income Taxes
Our income tax expense, deferred tax assets and liabilities, and liabilities for unrecognized tax benefits reflect management’s best estimate of current and future taxes to be paid. We are subject to income taxes in the United States and numerous foreign jurisdictions. Significant judgments and estimates are required in the determination of the consolidated income tax expense.
Deferred income taxes arise from temporary differences between the tax basis of assets and liabilities and their reported amounts in the financial statements, which will result in taxable or deductible amounts in the future. In evaluating our ability to recover our deferred tax assets in the jurisdiction from which they arise, we consider all available positive and negative evidence, including scheduled reversals of deferred tax liabilities, projected future taxable income, tax-planning strategies, and results of recent operations. The assumptions about future taxable income require the use of significant judgment and are consistent with the plans and estimates we are using to manage the underlying businesses.
The calculation of our tax liabilities involves dealing with uncertainties in the application of complex tax laws and regulations in a multitude of jurisdictions across our global operations. ASC 740 states that a tax benefit from an uncertain tax position may be recognized when it is more-likely-than-not that the position will be sustained upon examination, including resolutions of any related appeals or litigation processes, on the basis of its technical merits. We record unrecognized tax benefits as liabilities in accordance with ASC 740 and adjust these liabilities when our judgment changes as a result of the evaluation of new information not previously available. Because of the complexity of some of these uncertainties, the ultimate resolution may result in a payment that is materially different from our current estimate of the unrecognized tax benefit liabilities. These differences will be reflected as increases or decreases to income tax expense in the period in which new information is available.
Our practice is to recognize interest and penalties related to income tax matters as part of income tax expense.
We earn a significant amount of our operating income outside of the U.S., which is generally deemed to be permanently reinvested in foreign jurisdictions. However, we determined during 2015 that as a result of changes in the business, the foreign earnings of our subsidiaries in Canada and the U.K. were no longer permanently reinvested. Therefore, a provision for the expected taxes on repatriation of those earnings was recorded. We do not intend to repatriate funds beyond the amount from our Canadian and U.K. subsidiaries; however, should we require more capital in the U.S. than is generated by our domestic operations, we could elect to repatriate funds held in foreign jurisdictions or raise capital in the U.S. through debt or equity issuances. Repatriation would result in a higher effective tax rate. Borrowing in the U.S. would result in increased interest expense.
28 CTS CORPORATION
Contractual Obligations
Our contractual obligations as of December 31, 2016, were:
Payments due by period | |||||||||||||||
Total | 2017 | 2018-2019 | 2020-2021 | 2022-beyond | |||||||||||
Long-term debt, including interest | $ | 94,433 | $ | 1,748 | $ | 2,810 | $ | 89,875 | $ | — | |||||
Operating lease payments | 14,001 | 4,635 | 5,053 | 1,787 | 2,526 | ||||||||||
Retirement obligations | 6,955 | 1,009 | 1,501 | 1,385 | 3,060 | ||||||||||
Total | $ | 115,389 | $ | 7,392 | $ | 9,364 | $ | 93,047 | $ | 5,586 | |||||
We have no off-balance sheet arrangements, except for operating leases, that have a material current effect or are reasonably likely to have a material future effect on our financial condition or changes in our financial condition.
Management believes that existing capital resources and funds generated from operations are sufficient to finance anticipated capital requirements.
CTS CORPORATION 29
Item 7A. Quantitative and Qualitative Disclosures About Market Risk
(in thousands)
Our cash flows and earnings are subject to fluctuations resulting from changes in foreign currency exchange rates and interest rates. We manage our exposure to these market risks through internally established policies and procedures and, when deemed appropriate, through the use of derivative financial instruments. Our policies do not allow speculation in derivative instruments for profit or execution of derivative instrument contracts for which there are no underlying exposures. We do not use financial instruments for trading purposes and we are not a party to any leveraged derivatives. We monitor our underlying market risk exposures on an ongoing basis and believe that we can modify or adapt our hedging strategies as needed.
Interest Rate Risk
We are exposed to risk of changes in interest rates on our revolving credit facility. There was $89,100 and $90,700 outstanding under our revolving credit facility at December 31, 2016, and 2015, respectively. As of December 31, 2016, we had $50,000 in a forward starting interest rate swap that fixes interest costs on that portion of our debt starting August 1, 2017. The $50,000 is exposed to interest rate risk for the first seven months of the year and the remaining portion of $39,100 is exposed to interest rate risk for the entire year. Therefore, at December 31, 2016, a one percentage point increase in interest rates would increase interest expense by approximately $700.
Foreign Currency Risk
We are exposed to foreign currency exchange rate risks. Our significant foreign subsidiaries are located in China, Czech Republic, Mexico, Scotland, Singapore and Taiwan. As of December 31, 2016, we had $11.6 million outstanding foreign currency forward exchange contracts to hedge our exposure against the Mexican Peso.
In the normal course of business, our financial position is routinely subjected to a variety of risks, including market risks associated with interest rate movements, currency rate movements on non-U.S. dollar denominated assets and liabilities.
Commodity Price Risk
Many of our products require the use of raw materials that are produced in only a limited number of regions around the world or are available from only a limited number of suppliers. Our results of operations may be materially and adversely affected if we have difficulty obtaining these raw materials, the quality of available raw materials deteriorates, or there are significant price increases for these raw materials. For periods in which the prices of these raw materials are rising, we may be unable to pass on the increased cost to our customers, which would result in decreased margins for the products in which they are used. For periods in which the prices are declining, we may be required to write down our inventory carrying cost of these raw materials, since we record our inventory at the lower of cost or net realizable value.
30 CTS CORPORATION
Item 8. Financial Statements and Supplementary Data
REPORT OF INDEPENDENT REGISTERED PUBLIC ACCOUNTING FIRM
Board of Directors and Shareholders
CTS Corporation
We have audited the internal control over financial reporting of CTS Corporation (an Indiana corporation) and subsidiaries (the Company) as of December 31, 2016, based on criteria established in the 2013 Internal Control-Integrated Framework issued by the Committee of Sponsoring Organizations of the Treadway Commission (COSO). The Company’s management is responsible for maintaining effective internal control over financial reporting and for its assessment of the effectiveness of internal control over financial reporting, included in the accompanying Management’s Report on Internal Control over Financial Reporting. Our responsibility is to express an opinion on the Company’s internal control over financial reporting based on our audit.
We conducted our audit in accordance with the standards of the Public Company Accounting Oversight Board (United States). Those standards require that we plan and perform the audit to obtain reasonable assurance about whether effective internal control over financial reporting was maintained in all material respects. Our audit included obtaining an understanding of internal control over financial reporting, assessing the risk that a material weakness exists, testing and evaluating the design and operating effectiveness of internal control based on the assessed risk, and performing such other procedures as we considered necessary in the circumstances. We believe that our audit provides a reasonable basis for our opinion.
A company’s internal control over financial reporting is a process designed to provide reasonable assurance regarding the reliability of financial reporting and the preparation of financial statements for external purposes in accordance with generally accepted accounting principles. A company’s internal control over financial reporting includes those policies and procedures that (1) pertain to the maintenance of records that, in reasonable detail, accurately and fairly reflect the transactions and dispositions of the assets of the company; (2) provide reasonable assurance that transactions are recorded as necessary to permit preparation of financial statements in accordance with generally accepted accounting principles, and that receipts and expenditures of the company are being made only in accordance with authorizations of management and directors of the company; and (3) provide reasonable assurance regarding prevention or timely detection of unauthorized acquisition, use, or disposition of the company’s assets that could have a material effect on the financial statements.
Because of its inherent limitations, internal control over financial reporting may not prevent or detect misstatements. Also, projections of any evaluation of effectiveness to future periods are subject to the risk that controls may become inadequate because of changes in conditions, or that the degree of compliance with the policies or procedures may deteriorate.
In our opinion, the Company maintained, in all material respects, effective internal control over financial reporting as of December 31, 2016, based on criteria established in the 2013 Internal Control-Integrated Framework issued by COSO.
We also have audited, in accordance with the standards of the Public Company Accounting Oversight Board (United States), the consolidated financial statements of the Company as of and for the year ended December 31, 2016, and our report dated February 24, 2017, expressed an unqualified opinion on those financial statements.
/s/ GRANT THORNTON LLP
Chicago, Illinois
February 24, 2017
CTS CORPORATION 31
REPORT OF INDEPENDENT REGISTERED PUBLIC ACCOUNTING FIRM
Board of Directors and Shareholders
CTS Corporation
We have audited the accompanying consolidated balance sheets of CTS Corporation (an Indiana corporation) and subsidiaries (the Company) as of December 31, 2016 and 2015, and the related consolidated statements of earnings, comprehensive earnings, shareholders’ equity, and cash flows for each of the three years in the period ended December 31, 2016. Our audits of the basic consolidated financial statements included the financial statement schedules listed in the index appearing under Item 15(a)(2). These financial statements and financial statement schedules are the responsibility of the Company’s management. Our responsibility is to express an opinion on these financial statements and financial statement schedules based on our audits.
We conducted our audits in accordance with the standards of the Public Company Accounting Oversight Board (United States). Those standards require that we plan and perform the audit to obtain reasonable assurance about whether the financial statements are free of material misstatement. An audit includes examining, on a test basis, evidence supporting the amounts and disclosures in the financial statements. An audit also includes assessing the accounting principles used and significant estimates made by management, as well as evaluating the overall financial statement presentation. We believe that our audits provide a reasonable basis for our opinion.
In our opinion, the consolidated financial statements referred to above present fairly, in all material respects, the financial position of CTS Corporation and subsidiaries as of December 31, 2016 and 2015, and the results of their operations and their cash flows for each of the three years in the period ended December 31, 2016, in conformity with accounting principles generally accepted in the United States of America. Also in our opinion, the related financial statement schedules, when considered in relation to the basic consolidated financial statements taken as a whole, present fairly, in all material respects, the information set forth therein.
As described in note 1 of the consolidated financial statements, the Company has adopted new accounting guidance in 2016 and 2015, related to the presentation of deferred income taxes and accounting for stock-based compensation.
We also have audited, in accordance with the standards of the Public Company Accounting Oversight Board (United States), the Company’s internal control over financial reporting as of December 31, 2016, based on criteria established in the 2013 Internal Control-Integrated Framework issued by the Committee of Sponsoring Organizations of the Treadway Commission (COSO), and our report dated February 24, 2017, expressed an unqualified opinion.
/s/ GRANT THORNTON LLP
Chicago, Illinois
February 24, 2017
32 CTS CORPORATION
CTS CORPORATION AND SUBSIDIARIES
Consolidated Statements of Earnings
(in thousands)
Years Ended December 31, | |||||||||
2016 | 2015 | 2014 | |||||||
Net sales | $ | 396,679 | $ | 382,310 | $ | 404,021 | |||
Cost of goods sold | 256,251 | 255,201 | 274,058 | ||||||
Gross Margin | 140,428 | 127,109 | 129,963 | ||||||
Selling, general and administrative expenses | 61,624 | 59,586 | 61,051 | ||||||
Research and development expenses | 24,040 | 22,461 | 22,563 | ||||||
Non-recurring environmental expense | — | 14,541 | — | ||||||
Restructuring and impairment charges | 3,048 | 14,564 | 5,941 | ||||||
Gain on sale of assets | (11,450 | ) | (2,156 | ) | (1,915 | ) | |||
Operating earnings | 63,166 | 18,113 | 42,323 | ||||||
Other (expense) income: | |||||||||
Interest expense | (3,702 | ) | (2,628 | ) | (2,326 | ) | |||
Interest income | 1,305 | 3,073 | 2,786 | ||||||
Other expense | (3,524 | ) | (6,297 | ) | (3,435 | ) | |||
Total other expense, net | (5,921 | ) | (5,852 | ) | (2,975 | ) | |||
Earnings before taxes | 57,245 | 12,261 | 39,348 | ||||||
Income tax expense | 22,865 | 5,307 | 12,826 | ||||||
Net earnings | $ | 34,380 | $ | 6,954 | $ | 26,522 | |||
Net earnings per share: | |||||||||
Basic | 1.05 | 0.21 | 0.79 | ||||||
Diluted | 1.03 | 0.21 | 0.78 | ||||||
Basic weighted-average common shares outstanding | 32,728 | 32,959 | 33,618 | ||||||
Effect of dilutive securities | 523 | 525 | 512 | ||||||
Diluted weighted-average common shares outstanding | 33,251 | 33,484 | 34,130 | ||||||
Cash dividends declared per share | $ | 0.16 | $ | 0.16 | $ | 0.16 | |||
The accompanying notes are an integral part of the consolidated financial statements.
CTS CORPORATION 33
CTS CORPORATION AND SUBSIDIARIES
Consolidated Statements of Comprehensive Earnings
(in thousands)
Years Ended December 31, | |||||||||
2016 | 2015 | 2014 | |||||||
Net earnings | $ | 34,380 | $ | 6,954 | $ | 26,522 | |||
Other comprehensive earnings (loss): | |||||||||
Changes in fair market value of hedges, net of tax | 553 | 157 | (40 | ) | |||||
Changes in unrealized pension cost, net of tax | 6,412 | 6,809 | (21,062 | ) | |||||
Cumulative translation adjustment, net of tax | (1,154 | ) | (1,738 | ) | (1,234 | ) | |||
Other comprehensive earnings (loss) | $ | 5,811 | $ | 5,228 | $ | (22,336 | ) | ||
Comprehensive earnings | $ | 40,191 | $ | 12,182 | $ | 4,186 | |||
The accompanying notes are an integral part of the consolidated financial statements.
34 CTS CORPORATION
CTS CORPORATION AND SUBSIDIARIES
Consolidated Balance Sheets
(in thousands)
December 31, | ||||||
2016 | 2015 | |||||
ASSETS | ||||||
Current Assets | ||||||
Cash and cash equivalents | $ | 113,805 | $ | 156,928 | ||
Accounts receivable, net | 62,612 | 54,563 | ||||
Inventories, net | 28,652 | 24,600 | ||||
Other current assets | 10,638 | 9,863 | ||||
Total current assets | 215,707 | 245,954 | ||||
Property, plant and equipment, net | 82,111 | 69,872 | ||||
Other Assets | ||||||
Prepaid pension asset | 46,183 | 33,779 | ||||
Goodwill | 61,744 | 33,865 | ||||
Other intangible assets, net | 64,370 | 34,758 | ||||
Deferred income taxes | 45,839 | 63,809 | ||||
Other assets | 1,743 | 1,336 | ||||
Total other assets | 219,879 | 167,547 | ||||
Total Assets | $ | 517,697 | $ | 483,373 | ||
LIABILITIES AND SHAREHOLDERS' EQUITY | ||||||
Current Liabilities | ||||||
Short-term notes payable | $ | 1,006 | $ | — | ||
Accounts payable | 40,046 | 40,299 | ||||
Accrued payroll and benefits | 11,369 | 7,147 | ||||
Accrued expenses and other liabilities | 45,708 | 47,174 | ||||
Total current liabilities | 98,129 | 94,620 | ||||
Long-term debt | 89,100 | 90,700 | ||||
Long-term pension obligations | 7,006 | 7,230 | ||||
Other long-term obligations | 5,580 | 9,169 | ||||
Total Liabilities | 199,815 | 201,719 | ||||
Commitments and Contingencies (Note 9) | ||||||
Shareholders' Equity | ||||||
Common stock | 302,832 | 300,909 | ||||
Additional contributed capital | 40,521 | 41,166 | ||||
Retained earnings | 410,979 | 381,840 | ||||
Accumulated other comprehensive loss | (93,194 | ) | (99,005 | ) | ||
Total shareholders' equity before treasury stock | 661,138 | 624,910 | ||||
Treasury stock | (343,256 | ) | (343,256 | ) | ||
Total shareholders' equity | 317,882 | 281,654 | ||||
Total Liabilities and Shareholders' Equity | $ | 517,697 | $ | 483,373 | ||
The accompanying notes are an integral part of the consolidated financial statements.
CTS CORPORATION 35
CTS CORPORATION AND SUBSIDIARIES
Consolidated Statements of Cash Flows
(in thousands)
Years Ended December 31, | |||||||||
2016 | 2015 | 2014 | |||||||
Cash flows from operating activities: | |||||||||
Net earnings | $ | 34,380 | $ | 6,954 | $ | 26,522 | |||
Adjustments to reconcile net earnings to net cash provided by operating activities: | |||||||||
Depreciation and amortization | 18,992 | 16,254 | 16,971 | ||||||
Stock-based compensation | 2,738 | 3,195 | 2,660 | ||||||
Restructuring, impairment, and restructuring-related charges | 3,048 | 6,915 | 5,941 | ||||||
Restructuring loss on pension settlement | — | 8,280 | — | ||||||
Pension and other post-retirement plan income | (1,599 | ) | (2,451 | ) | (2,290 | ) | |||
Non-recurring environmental expense | — | 14,541 | — | ||||||
Deferred income taxes | 10,297 | (8,920 | ) | 4,900 | |||||
Gain on sale of assets | (11,450 | ) | (2,156 | ) | (1,915 | ) | |||
Gain on foreign currency hedges, net of cash received | (36 | ) | — | — | |||||
Changes in assets and liabilities, net of acquisitions and divestitures: | |||||||||
Accounts receivable | (7,120 | ) | 1,036 | 4,356 | |||||
Inventories | (2,290 | ) | 2,225 | 3,437 | |||||
Other assets | (289 | ) | 4,090 | (5,672 | ) | ||||
Accounts payable | 537 | (5,126 | ) | (2,692 | ) | ||||
Accrued payroll and benefits | 1,876 | (3,012 | ) | (8,124 | ) | ||||
Accrued expenses | (2,597 | ) | (5,731 | ) | (9,872 | ) | |||
Income taxes payable | 966 | 5,264 | 262 | ||||||
Other liabilities | 52 | (2,502 | ) | (721 | ) | ||||
Pension and other post-retirement plans | (303 | ) | 295 | (414 | ) | ||||
Total adjustments | 12,822 | 32,197 | 6,827 | ||||||
Net cash provided by operating activities | 47,202 | 39,151 | 33,349 | ||||||
Cash flows from investing activities: | |||||||||
Capital expenditures | (20,500 | ) | (9,723 | ) | (12,949 | ) | |||
Proceeds from sale of assets | 12,296 | 1,878 | 4,951 | ||||||
Payment for acquisitions, net of cash acquired | (73,063 | ) | (1,285 | ) | — | ||||
Net cash used in investing activities | (81,267 | ) | (9,130 | ) | (7,998 | ) | |||
Cash flows from financing activities: | |||||||||
Payments of long-term debt | (2,458,400 | ) | (1,343,500 | ) | (1,030,200 | ) | |||
Proceeds from borrowings of long-term debt | 2,456,800 | 1,359,200 | 1,030,200 | ||||||
Payments of short-term notes payable | — | (164 | ) | (810 | ) | ||||
Proceeds from borrowings of short-term notes payable | — | 164 | 810 | ||||||
Purchase of treasury stock | — | (18,088 | ) | (8,002 | ) | ||||
Dividends paid | (5,234 | ) | (5,291 | ) | (5,374 | ) | |||
Exercise of stock options | — | 64 | 1,204 | ||||||
Excess tax benefit on equity-based compensation | — | 313 | 297 | ||||||
Taxes paid on behalf of equity award participants | (1,809 | ) | (527 | ) | (926 | ) | |||
Other | — | — | (3,132 | ) | |||||
Net cash used in financing activities | (8,643 | ) | (7,829 | ) | (15,933 | ) | |||
Effect of exchange rate on cash and cash equivalents | (415 | ) | 228 | 722 | |||||
Net (decrease) increase in cash and cash equivalents | (43,123 | ) | 22,420 | 10,140 | |||||
Cash and cash equivalents at beginning of year | 156,928 | 134,508 | 124,368 | ||||||
Cash and cash equivalents at end of year | $ | 113,805 | $ | 156,928 | $ | 134,508 | |||
Supplemental cash flow information: | |||||||||
Cash paid for interest | $ | 2,939 | $ | 2,415 | $ | 2,113 | |||
Cash paid for income taxes, net | $ | 10,471 | $ | 6,779 | $ | 7,994 | |||
Non-Cash Investing and Financing Activities | |||||||||
Purchase of assets with short-term notes payable | $ | 1,006 | $ | — | $ | — | |||
The accompanying notes are an integral part of the consolidated financial statements.
36 CTS CORPORATION
CTS CORPORATION AND SUBSIDIARIES
Consolidated Statements of Shareholders' Equity
(in thousands)
Common Stock | Additional Contributed Capital | Retained Earnings | Accumulated Other Comprehensive Earnings/(Loss) | Treasury Stock | Total | |||||||||||||
Balances at January 1, 2014 | $ | 297,164 | $ | 39,631 | $ | 358,997 | $ | (81,897 | ) | $ | (317,166 | ) | $ | 296,729 | ||||
Net earnings | — | — | 26,522 | — | — | 26,522 | ||||||||||||
Changes in fair market value of hedges, net of tax | — | — | — | (40 | ) | — | (40 | ) | ||||||||||
Changes in unrealized pension cost, net of tax | — | — | — | (21,062 | ) | — | (21,062 | ) | ||||||||||
Cumulative translation adjustment, net of tax | — | — | — | (1,234 | ) | — | (1,234 | ) | ||||||||||
Cash dividends of $0.16 per share | — | — | (5,374 | ) | — | — | (5,374 | ) | ||||||||||
Acquired 460,496 shares for treasury stock | — | — | — | — | (8,002 | ) | (8,002 | ) | ||||||||||
Issued shares on exercise of options — net | 1,328 | (124 | ) | — | — | — | 1,204 | |||||||||||
Issued shares on vesting of restricted stock units | 1,400 | (3,311 | ) | — | — | — | (1,911 | ) | ||||||||||
Tax benefit on vesting of restricted stock units | — | 297 | — | — | — | 297 | ||||||||||||
Stock compensation | — | 2,660 | — | — | — | 2,660 | ||||||||||||
Balances at December 31, 2014 | $ | 299,892 | $ | 39,153 | $ | 380,145 | $ | (104,233 | ) | $ | (325,168 | ) | $ | 289,789 | ||||
Net earnings | — | — | 6,954 | — | — | 6,954 | ||||||||||||
Changes in fair market value of hedges, net of tax | — | — | — | 157 | — | 157 | ||||||||||||
Changes in unrealized pension cost, net of tax | — | — | — | 6,809 | — | 6,809 | ||||||||||||
Cumulative translation adjustment, net of tax | — | — | — | (1,738 | ) | — | (1,738 | ) | ||||||||||
Cash dividends of $0.16 per share | — | — | (5,259 | ) | — | — | (5,259 | ) | ||||||||||
Acquired 984,342 shares for treasury stock | — | — | — | — | (18,088 | ) | (18,088 | ) | ||||||||||
Issued shares on exercise of options — net | 64 | — | — | — | — | 64 | ||||||||||||
Issued shares on vesting of restricted stock units | 953 | (1,495 | ) | — | — | — | (542 | ) | ||||||||||
Tax benefit on vesting of restricted stock units | — | 313 | — | — | — | 313 | ||||||||||||
Stock compensation | — | 3,195 | — | — | — | 3,195 | ||||||||||||
Balances at December 31, 2015 | $ | 300,909 | $ | 41,166 | $ | 381,840 | $ | (99,005 | ) | $ | (343,256 | ) | $ | 281,654 | ||||
Net earnings | — | — | 34,380 | — | — | 34,380 | ||||||||||||
Changes in fair market value of hedges, net of tax | — | — | — | 553 | — | 553 | ||||||||||||
Changes in unrealized pension cost, net of tax | — | — | — | 6,412 | — | 6,412 | ||||||||||||
Cumulative translation adjustment, net of tax | — | — | — | (1,154 | ) | — | (1,154 | ) | ||||||||||
Cash dividends of $0.16 per share | — | — | (5,241 | ) | — | — | (5,241 | ) | ||||||||||
Issued shares on vesting of restricted stock units | 1,923 | (3,307 | ) | — | — | — | (1,384 | ) | ||||||||||
Stock compensation | — | 2,662 | — | — | — | 2,662 | ||||||||||||
Balances at December 31, 2016 | $ | 302,832 | $ | 40,521 | $ | 410,979 | $ | (93,194 | ) | $ | (343,256 | ) | $ | 317,882 | ||||
The accompanying notes are an integral part of the consolidated financial statements.
CTS CORPORATION 37
NOTES TO CONSOLIDATED FINANCIAL STATEMENTS
(in thousands, except for share and per share data)
NOTE 1 — Summary of Significant Accounting Policies
Description of Business: CTS Corporation ("CTS", "we", "our", "us" or the "Company") is a global manufacturer of sensors, electronic components, and actuators. We operate manufacturing facilities located throughout North America, Asia and Europe and services major markets globally.
CTS consists of one reportable business segment.
Principles of Consolidation: The consolidated financial statements include the accounts of CTS and its wholly-owned subsidiaries. All significant intercompany accounts and transactions have been eliminated.
Fiscal Calendar: Beginning in 2016, we began using a calendar period end. Prior to 2016, we operated on a 4 week/ 4 week/ 5 week fiscal quarter, and each fiscal quarter ended on a Sunday. The fiscal year always began on January 1 and ended on December 31. Our fiscal calendar resulted in some fiscal quarters being either greater than or less than 13 weeks, depending on the days of the week on which those dates fell.
Use of Estimates: The preparation of financial statements in conformity with the accounting principles generally accepted in the United States of America ("U.S. GAAP") requires management to make estimates and assumptions that affect the reported amounts of assets and liabilities, the disclosure of contingent assets and liabilities at the date of the financial statements and the reported amounts of revenues and expenses during the reporting period. Actual results could differ materially from those estimates.
Cash and Cash Equivalents: All highly liquid investments with maturities of three months or less at the date of purchase are considered to be cash equivalents.
Accounts Receivable and Allowance for Doubtful Accounts: Accounts receivable consists primarily of amounts due from normal business activities. We maintain an allowance for doubtful accounts for estimated uncollectible accounts receivable. Our reserves for estimated credit losses based upon historical experience and specific customer collection issues. Accounts are written off against the allowance account when they are determined to no longer be collectible.
Concentration of Credit Risk: Financial instruments that potentially subject us to concentrations of credit risk consist of cash and cash equivalents. Our cash and cash equivalents, at times, may exceed federally insured limits. Cash and cash equivalents are deposited primarily in banking institutions with global operations. We have not experienced any losses in such accounts. We believe we are not exposed to any significant credit risk on cash and cash equivalents.
Trade receivables subject us to the potential for credit risk with major customers. We sell our products to customers principally in the transportation, industrial, medical, information technology, defense and aerospace, and communications markets, primarily in North America, Europe, and Asia. We perform ongoing credit evaluations of our customers to minimize credit risk. We do not require collateral. The allowance for doubtful accounts is based on management's estimates of the collectability of its accounts receivable after analyzing historical bad debts, customer concentrations, customer creditworthiness, and current economic trends. Uncollectible trade receivables are charged against the allowance for doubtful accounts when all reasonable efforts to collect the amounts due have been exhausted.
Our net sales to significant customers as a percentage of total net sales were as follows:
Years Ended December 31, | |||
2016 | 2015 | 2014 | |
Honda Motor Co. | 10.7% | 10.7% | 10.8% |
Toyota Motor Corporation | 10.4% | 10.1% | 8.4% |
We sell pedal and sensor automotive parts to Honda Motor Co. and Toyota Motor Corporation under purchase agreements that have no volume commitments and are subject to purchase orders issued from time to time.
No other customer accounted for 10% or more of total net sales during these periods.
Inventories: We value our inventories at the lower of the actual cost to purchase or manufacture or the net realizable value using the first-in, first-out ("FIFO") method. We review inventory quantities on hand and record a provision for excess and obsolete inventory based on forecasts of product demand and production requirements.
Retirement Plans: We have various defined benefit and defined contribution retirement plans. Our policy is to annually fund the defined benefit pension plans at or above the minimum required by law. We: 1) recognize the funded status of a benefit plan
38 CTS CORPORATION
(measured as the difference between plan assets at fair value and the benefit obligation) in our Consolidated Balance Sheets; 2) recognize the gains or losses and prior service costs or credits that arise during the period but are not recognized as components of net periodic benefit/cost as a component of Other comprehensive earnings; and 3) measure defined benefit plan assets and obligations as of the date of our fiscal year-end. See NOTE 5, "Retirement Plans" for further information.
Property, Plant and Equipment: Property, plant and equipment is stated at cost. Depreciation and amortization is computed primarily over the estimated useful lives of the various classes of assets using the straight-line method. Useful lives for buildings and improvements range from 10 to 45 years. Machinery and equipment useful lives range from 3 to 8 years. Depreciation on leasehold improvements is computed over the lease term or estimated useful lives of the assets. Amounts expended for maintenance and repairs are charged to expense as incurred. Upon disposition, any related gains or losses are included in operating earnings.
Income Taxes: We account for income taxes under the asset and liability method, which requires the recognition of deferred tax assets and liabilities for the expected future tax consequences of events that have been included in the financial statements. Under this method, we determine deferred tax assets and liabilities on the basis of the differences between the financial statement and tax bases of assets and liabilities by using enacted tax rates in effect for the year in which the differences are expected to reverse. The effect of a change in tax rates on deferred tax assets and liabilities is recognized in income in the period that includes the enactment date.
We recognize deferred tax assets to the extent that we believe that these assets are more-likely-than-not to be realized. In making such a determination, we consider all available positive and negative evidence, including future reversals of existing taxable temporary differences, projected future taxable income, tax-planning strategies, and results of recent operations. If we determine that we would be able to realize our deferred tax assets in the future in excess of their net recorded amount, we would make an adjustment to the deferred tax asset valuation allowance, which would reduce the provision for income taxes. In 2016, we elected to early adopt ASU 2015-17 "Income Taxes (Topic 740): Balance Sheet Classification of Deferred Taxes", on a retrospective basis allowing for all deferred tax items to be classified as non-current. The non-current deferred tax assets and non-current deferred tax liabilities were not netted since these items relate to different tax jurisdictions.
We record uncertain tax positions in accordance with ASC 740 on the basis of a two-step process in which (1) we determine whether it is more-likely-than-not that the tax positions will be sustained on the basis of the technical merits of the position and (2) for those tax positions that meet the more-likely-than-not recognition threshold, we recognize the largest amount of tax benefit that is more than 50 percent likely to be realized upon ultimate settlement with the related tax authority.
We recognize interest and penalties related to unrecognized tax benefits on the income tax expense line in the accompanying Consolidated Statements of Operations. Accrued interest and penalties are included on the related tax liability line in the Consolidated Balance Sheets.
See NOTE 17, "Income Taxes" for further information.
Goodwill and Indefinite-lived Intangible Assets: Goodwill represents the excess of the purchase price over the fair values of the net assets acquired in a business combination. We test the impairment of goodwill at least annually, or more frequently if events or changes in circumstances indicate that the carrying value may not be recoverable. The impairment evaluation utilizes a two-step test. The first step compares the fair value of each reporting unit to its carrying value, including goodwill. If the fair value of the reporting unit is equal to or greater than its carrying value, goodwill is not impaired and no further testing is required. If the carrying value exceeds fair value, then the second step of the impairment test is performed in order to determine if the implied fair value of the goodwill of the reporting unit exceeds the carrying value of that goodwill. Goodwill is impaired when the carrying value of the goodwill exceeds its implied fair value. Impaired goodwill is written down to its implied fair value through a non-cash expense recorded in results of operations in the period the impairment is identified.
In 2015, we changed the date of our annual impairment test from the last day of our fiscal year to the first day of our fourth quarter. This change did not have a material effect on the results of our impairment test. We completed our annual impairment test during 2016 and determined that our goodwill was not impaired as of the measurement date.
No goodwill impairment was recorded for the years ended December 31, 2016, 2015 and 2014.
We also have acquired in-process research and development ("IPR&D") intangible assets that are treated as indefinite-lived intangible assets and therefore not subject to amortization until the completion or abandonment of the associated research and development efforts. If these efforts are abandoned in the future, the carrying value of the IPR&D asset will be expensed. If the research and development efforts are successfully completed, the IPR&D will be reclassified as a finite-lived asset and amortized over its useful life.
No impairment was recorded for the years ended December 31, 2016, 2015 and 2014.
CTS CORPORATION 39
Other Intangible Assets and Long-lived Assets: We account for long-lived assets (excluding indefinite-lived intangible assets) in accordance with the provisions of ASC 360. This statement requires that long-lived assets, which includes fixed assets and finite-lived intangible assets, be reviewed for impairment whenever events or changes in circumstances indicate that the carrying amount of an asset may not be recoverable. If an impairment test is warranted, recoverability of assets to be held and used is measured by a comparison of the carrying amount of an asset to the sum of the undiscounted cash flows expected to result from the use and the eventual disposition of the asset. If such assets are considered to be impaired, the impairment to be recognized is measured by the amount in which the carrying amount of the assets exceeds the fair value of the assets. Assets to be disposed of are reported at the lower of the carrying amount or fair value less costs to sell.
Intangible assets (excluding indefinite-lived intangible assets) consist primarily of customer lists and relationships, patents, technology, and other intangibles. These assets are recorded at cost and usually amortized on a straight-line basis over their estimated lives. We assess useful lives based on the period over which the asset is expected to contribute to cash flows.
Revenue Recognition: Product revenue is recognized once four criteria are met: 1) We have persuasive evidence that an arrangement exists; 2) delivery has occurred and title has passed to the customer, which generally happens at the point of shipment provided that no significant obligations remain; 3) the price is fixed and determinable; and 4) collectability is reasonably assured.
Research and Development: Research and development ("R&D") costs include expenditures for planned search and investigation aimed at discovery of new knowledge to be used to develop new products or processes or to significantly enhance existing products or production processes. R&D costs also include the implementation of new knowledge through design, testing of product alternatives, or construction of prototypes. We expense all R&D costs as incurred, net of customer reimbursements for sales of prototypes and non-recurring engineering charges.
We create prototypes and tools related to R&D projects. A prototype is defined as a constructed product not intended for production resulting in a commercial sale. We also incur engineering costs related to R&D activities. Such costs are incurred to support such activities to improve the reliability, performance and cost-effectiveness of our existing products and to design and develop innovative products that meet customer requirements for new applications. Furthermore, we may engage in activities that develop tooling machinery and equipment for our customers.
Costs of molds, dies and other tools used to make products sold for which we have a contractual guarantee for lump sum reimbursement from the customer are included in Other current assets on the Consolidated Balance Sheets until reimbursement is received from the customer. A summary of amounts to be received from customers is as follows:
December 31, | ||||||
2016 | 2015 | |||||
Cost of molds, dies and other tools included in Other current assets | $ | 2,837 | $ | 3,969 | ||
Reimbursements received from customers are netted against such costs. A summary of amounts received from customers is as follows:
Years Ended December 31, | |||||||||
2016 | 2015 | 2014 | |||||||
Reimbursements received from customers | $ | 2,036 | $ | 1,861 | $ | 1,400 | |||
Financial Instruments: We use forward contracts to mitigate currency risk related to forecasted foreign currency revenue and costs. These forward contracts are designed as cash flow hedges. At least quarterly, we assess the effectiveness of these hedging relationships based on the total change in their fair value using regression analysis. In addition, we use interest rate swaps to convert a portion of our revolving credit facility's variable rate of interest into a fixed rate. As a result of the use of these derivative instruments, the Company is exposed to the risk that counterparties to derivative contracts will fail to meet their contractual obligations. To mitigate the counterparty credit risk, the Company has a policy of only entering into contracts with carefully selected major financial institutions based upon their credit ratings and other factors and by using netting agreements. Our established policies and procedures for mitigating credit risk on principal transactions include reviewing and establishing limits for credit exposure and continually assessing the creditworthiness of counterparties.
40 CTS CORPORATION
We estimate the fair value of our financial instruments as follows:
Instrument | Method for determining fair value | |
Cash, cash equivalents, accounts receivable and accounts payable | Cost, approximates fair value due to the short-term nature of these instruments. | |
Revolving credit facility | The fair value of long-term debt approximates carrying value and was determined by valuing a similar hypothetical coupon bond and attributing that value to our credit facility. | |
Interest rate swaps and forward contracts | The fair value of our interest rate swaps and forward contracts are measured using a market approach which uses current industry information. | |
Debt Issuance Costs: We have debt issuance costs related to our long-term debt that is being amortized using the straight-line method over the life of the debt.
Stock-Based Compensation: We recognize expense related to the fair value of stock-based compensation awards, consisting of restricted stock units ("RSUs"), cash-settled restricted stock units, and stock options, in the Consolidated Statements of Earnings.
We estimate the fair value of stock option awards on the date of grant using the Black-Scholes option pricing model. A number of assumptions are used by the Black-Scholes option pricing model to compute the grant date fair value of an award, including expected price volatility, option term, risk-free interest rate, and dividend yield. These assumptions are established at each grant date based upon current information at that time. Expected volatilities are based on historical volatilities of CTS' common stock. The expected option term is derived from historical data of exercise behavior. Actual option terms can differ from the expected option terms as a result of different groups of employees exhibiting different exercise behavior. The dividend yield is based on historical dividend payments. The risk-free rate for periods within the contractual life of the option is based on the U.S. Treasury yield curve at the time of grant. The fair value of awards that are ultimately expected to vest is recognized as expense over the requisite service periods of the awards in the Consolidated Statements of Earnings.
The grant date fair values of our service-based and performance-based RSUs are the closing price of our common stock on the date of grant. The grant date fair value of our market-based RSUs is determined by using a simulation, or Monte Carlo, approach. Under this approach, stock returns from a comparative group of companies are simulated over the performance period, considering both stock price volatility and the correlation of returns. The simulated results are then used to estimate the future payout based on the performance and payout relationship established by the conditions of the award. The future payout is discounted to the measurement date using the risk-free interest rate.
Both our stock options and RSUs primarily have a graded vesting schedule. We recognize expense on a straight-line basis over the requisite service period for each separately vesting portion of the award as if the award was, in substance, multiple awards. See NOTE 15, "Stock-Based Compensation" for further information.
In 2016, we elected to early adopt the provisions of ASU 2016-09. Pursuant to this adoption, we recorded excess tax benefits within income tax expense for the year ended December 31, 2016, where previously these were recorded as increases or decreases to additional contributed capital. In addition, we have elected to account for forfeitures of awards as they occur. Both of these changes have been applied prospectively, and therefore no adjustments were made to prior periods. In accordance with the guidance, we retrospectively reported cash paid on behalf of employees for withholding shares for tax-withholding purposes as a financing activity in the Consolidated Statements of Cash Flows. Additionally, excess tax benefits were classified as an operating activity, applied prospectively. Adoption of this ASU did not result in a material change in our earnings, cash flows, or financial position.
Earnings Per Share: Basic earnings per share excludes any dilution and is computed by dividing net earnings available to common shareholders by the weighted-average number of common shares outstanding for the period.
Diluted earnings per share reflects the potential dilution that could occur if dilutive securities, such as stock options and unvested restricted stock units, were exercised or resulted in the issuance of common stock. Diluted earnings per share is calculated by adding all potentially dilutive shares to the weighted average number of common shares outstanding for the numerator. If the common stock equivalents have an anti-dilutive effect, they are excluded from the computation of diluted earnings per share.
Our antidilutive stock options and RSUs consist of the following:
Years Ended December 31, | ||||||
(units) | 2016 | 2015 | 2014 | |||
Antidilutive stock options and RSUs | 35,189 | 13,979 | — | |||
Foreign Currencies: The financial statements of our non-U.S. subsidiaries, except the United Kingdom ("U.K.") subsidiary, are remeasured into U.S. dollars using the U.S. dollar as the functional currency with all remeasurement adjustments included in the determination of net earnings.
CTS CORPORATION 41
Foreign currency loss recorded in the Consolidated Statement of Earnings includes the following:
Years Ended December 31, | |||||||||
2016 | 2015 | 2014 | |||||||
Foreign currency losses | $ | (3,714 | ) | $ | (6,299 | ) | $ | (4,130 | ) |
The assets and liabilities of our U.K. subsidiary are translated into U.S. dollars at the current exchange rate at period end, with the resulting translation adjustments made directly to the "Accumulated other comprehensive loss" component of shareholders' equity. Consolidated Statement of Earnings accounts are translated at the average rates during the period.
Shipping and Handling: All fees billed to the customer for shipping and handling is classified as a component of net sales. All costs associated with shipping and handling is classified as a component of cost of goods sold.
Sales Taxes: We classify sales taxes on a net basis in our consolidated financial statements.
Reclassifications: Certain prior period reclassifications have been made in the Consolidated Balance Sheet as a result of including our other post-retirement benefit plan liabilities in Post-retirement obligations as well as the retrospective application of a new accounting pronouncement upon the adoption of ASU 2015-17 related to the presentation of deferred tax assets and liabilities. The chart below quantifies the effects of these reclassification adjustments on our December 31, 2015, financial statements:
At December 31, 2015 | ||||||||||||
Consolidated Balance Sheet Line Item | As previously reported | Reclassification adjustment | As currently reported | |||||||||
Other current assets | $ | 15,888 | $ | (6,025 | ) | $ | 9,863 | |||||
Deferred income taxes | $ | 58,544 | $ | 5,265 | $ | 63,809 | ||||||
Accrued expenses and other liabilities | $ | (53,905 | ) | $ | 6,731 | $ | (47,174 | ) | ||||
Long-term pension obligations | $ | (2,703 | ) | $ | (4,527 | ) | $ | (7,230 | ) | |||
Other long-term obligations | $ | (7,725 | ) | $ | (1,444 | ) | $ | (9,169 | ) | |||
Recently Issued Accounting Pronouncements
ASU 2016-16 "Income Taxes (Topic 740) Intra-Entity Transfers of Assets Other Than Inventory"
In October 2016, the Financial Accounting Standards Board ("FASB") issued Accounting Standards Update ("ASU") No. 2016-16, "Intra-Entity Transfers of Assets Other Than Inventory". This ASU is meant to improve the accounting for the income tax effect of intra-entity transfers of assets other than inventory. Currently, US GAAP prohibits the recognition of current and deferred income taxes for intra-entity asset transfers until the asset is sold to a third party. This ASU will now require companies to recognize the income tax effect of an intra-entity asset transfer (other than inventory) when the transaction occurs. This ASU is effective, for public companies, for fiscal years beginning after December 15, 2019 and interim periods within those annual reporting periods. Early adoption is permitted and is to be applied on a modified retrospective bases through a cumulative-effect adjustment to retained earnings as of the beginning of the period of adoption. This guidance is not expected to have a material impact on our consolidated financial statements.
ASU 2016-15 "Statement of Cash Flows (Topic 230) Classification of Certain Cash Receipts and Cash Payments"
In August 2016, the FASB issued ASU No. 2016-15, "Classification of Certain Cash Receipts and Cash Payments". This ASU reduces the diversity in reporting of eight specific cash flow issues due to accounting guidance that is unclear or does not exist. The eight issues relate to certain debt activities, business combination activities, insurance settlements and other various activities. This guidance is effective for fiscal years beginning after December 15, 2017 and interim periods within those fiscal years. Early adoption is permitted and is to be applied retrospectively using a transition method for each period presented. An entity that elects early adoption of the amendment under this ASU must adopt all aspects of the amendment in the same period. This guidance is not expected to have a material impact on our consolidated financial statements.
ASU 2016-09 "Compensation-Stock Compensation (Topic 718): Improvement to Employee Share Based Payment Accounting"
In March 2016, the FASB issued ASU No. 2016-09, “Improvements to Employee Share-Based Payment Accounting.” This ASU simplifies several aspects of the accounting for share-based payment transactions, including the income tax consequences of excess
42 CTS CORPORATION
tax benefits, forfeitures, classification of awards as either equity or liabilities, and classification on the statement of cash flows. The guidance is effective for annual reporting periods beginning after December 15, 2016, including interim periods. Early adoption is permitted. An entity that elects early adoption of the amendment under this ASU must adopt all aspects of the amendment in the same period. In 2016, we elected to early adopt the provisions of ASU 2016-09 as described in more detail in the Stock-Based Compensation section of Note 1 above. Adoption of ASU 2016-09 did not have a material effect on our earnings, cash flows, or financial position.
ASU 2016-05 "Derivatives and Hedging (Topic 815): Effect of Derivative Contract Novations on Existing Hedge Accounting Relationships"
In March 2016, the FASB issued ASU No. 2016-05 "Derivatives and Hedging (Topic 815): Effect of Derivative Contract Novations on Existing Hedge Accounting Relationships". This amendment clarifies that a change in the counterparty to a derivative instrument does not on its own require dedesignation of the hedging instrument under Topic 815, provided that all other hedge accounting criteria (including those in paragraphs 815-20-35-14 through 35-18) continue to be met. This update can be applied prospectively or retrospectively and is effective for fiscal years beginning after December 15, 2016, and interim periods within those years. This guidance is not expected to have a material impact on our consolidated financial statements.
ASU 2016-02 "Leases (Topic 842)"
In February 2016, the FASB issued ASU 2016-02, "Leases (Topic 842)". This amendment created a new Topic under the accounting standards codification to account for the provisions of the ASU. This amendment is meant to provide transparency and to improve comparability between entities. The ASU requires companies to record an asset and liability on the balance sheet for leases that were formerly designated as operating leases as well as leases designated as financing leases. The provisions of the ASU predominately change the recognition of leases for lessees, the provisions do not substantially change the accounting for lessors. This ASU will supersede the provisions of Topic 840 Leases.
The liability recorded for a lease is meant to recognize the lease payments and the asset as a right to use the underlying asset for the lease, including optional periods if it is reasonably certain the option will be exercised. Recording of the liability should be based on the present value of the lease payments. If a lease term is less than twelve months, a company is allowed to elect not to record the asset and liability. Expense related to these leases are to be amortized straight-line over the term of the lease.
Additionally, the provisions of this ASU provide additional guidance on separating lease terms from maintenance and other type of provisions that provide a good or service, accounting for sale-leaseback provisions, and leveraged leases.
Reporting in the cash flow statement remains virtually unchanged. Additional qualitative and quantitative disclosures are required.
These updates are required to be applied under a modified retrospective approach from the beginning of the earlier period presented. The modified approach provides optional practical expedients that may be elected, which will allow companies to continue to account for leases under the previous guidance for leases that commenced prior to the effective date.
The provisions of this ASU are effective for fiscal years beginning after December 15, 2018, and interim periods within those periods. Early adoption is allowed. The provisions of this guidance are still being evaluated and the impact on our financial statements has not yet been determined.
ASU 2015-17, “Income Taxes (Topic 740): Balance Sheet Classification of Deferred Taxes”
In November 2015, the FASB issued ASU 2015-17, "Income Taxes Topic 740: Balance Sheet Classification of Deferred Taxes". The amendment requires companies to begin classifying all deferred income taxes as non-current. The provisions are expected to simplify the presentation of deferred income taxes and align the presentation of deferred income taxes with International Financial Reporting Standards ("IFRS"). The amendments in this update are effective for annual periods beginning after December 16, 2016 and interim periods within those annual periods. The update can be applied prospectively or retrospectively. In 2016, we elected to early adopt ASU 2015-17, applying this standard retrospectively. Reclassifications to the Consolidated Balance Sheet at December 31, 2015 are shown in the Reclassifications section of Note 1 above.
ASU 2015-11. “Inventory (Topic 330): Simplifying the Measurement of Inventory”
In July 2015, the FASB issued ASU 2015-11, "Inventory (Topic 330) Simplifying the Measurement of Inventory". The amendments clarify that an entity should measure inventory within the scope of this update at the lower of cost and net realizable value. Net realizable value is the estimated selling price in the ordinary course of business, less reasonably predictable costs of completion, disposal, and transportation. Substantial and unusual losses that result from subsequent measurement of inventory should be disclosed in the financial statements. This ASU is effective for fiscal years beginning after December 15, 2016, including interim periods within those annual periods. The amendments are to be applied prospectively with earlier application permitted as of the beginning of an interim or annual reporting period. This guidance is not expected to have a material impact on our consolidated financial statements.
CTS CORPORATION 43
ASU 2015-04, “Compensation - Retirement Benefits (Topic 715): Practical Expedient for the Measurement Date of an Employer’s Benefit Obligation and Plan Assets”
In April 2015, FASB issued ASU 2015-04, “Compensation-Retirement Benefits (Topic 715): Practical Expedient for the Measurement Date of an Employer’s Defined Benefit Obligation and Plan Assets”. The amended guidance permits companies to use a practical expedient, which allows an employer to measure defined benefit plan assets and obligations as of the month-end date that is closest to the employer’s fiscal year-end (alternative measurement date). An employer using this policy election must apply it consistently to all of its defined benefit plans.
In accordance with this ASU, an employer using the practical expedient is required to adjust the funded status for contributions and other significant events (as defined in paragraph 715-30-35-66) occurring between the alternative measurement date and its fiscal year-end. Paragraph 715-30-35-66 defines a significant event as: a plan amendment, settlement, or curtailment that calls for remeasurement. This ASU also allows employers the use of the practical expedient in interim remeasurements of significant events.
The employer would be required to disclose the election to use the practical expedient and the measurement date of the plan assets and obligations. Early application of this ASU is permitted. Entities must apply the guidance prospectively.
In 2016, we adopted the provisions of this ASU and it did not have an impact on our financial statements.
ASU 2014-09, "Revenue from Contracts with Customers (Topic 606)"
In May 2014, the FASB issued ASU 2014-09, "Revenue from Contracts with Customers (Topic 606)". The guidance in this ASU affects any entity that either enters into contracts with customers to transfer goods or services or enters into contracts for the transfer of nonfinancial assets unless those contracts are within the scope of other standards (for example, insurance contracts or lease contracts). The new revenue recognition guidance more closely aligns U.S. GAAP with International Financial Reporting Standards ("IFRS"). The core principle of the guidance is that an entity should recognize revenue to depict the transfer of promised goods or services to customers in an amount that reflects the consideration to which the entity expects to be entitled in exchange for those goods or services.
To achieve that core principle, an entity should apply the following steps:
Step 1: | Identify the contract(s) with a customer. |
Step 2: | Identify the performance obligations in the contract. |
Step 3: | Determine the transaction price. |
Step 4: | Allocate the transaction price to the performance obligations in the contract. |
Step 5: | Recognize revenue when (or as) the entity satisfies a performance obligation. |
In August 2015, the FASB issued ASU 2015-14: Accounting for Revenue from Contracts with Customers (Topic 606)" The amended guidance deferred the effective date of ASU 2014-9 to annual periods beginning after December 15, 2017 and interim periods within those fiscal years. Early adoption is permitted for annual periods beginning after December 15, 2016 and interim periods within those fiscal years. In addition, four other ASUs have been issued amending and clarifying ASU 2014-09 and must be adopted concurrently.
• | ASU 2016-08 "Revenue from Contracts with Customers (Topic 606): Principal versus Agent Considerations (Reporting Revenue Gross versus Net) |
• | ASU 2016-10 "Revenue from Contracts with Customers (Topic 606): Identifying Performance Obligations and Licensing" |
• | ASU 2016-12 "Revenue from Contracts with Customers (Topic 606): Narrow-Scope Improvements and Practical Expedients" |
• | ASU 2016-20 "Revenue from Contracts with Customers (Topic 606): Technical Corrections and Improvements" |
This update can either be applied under a cumulative effect or retrospective method. The Company is continuing to assess the potential effects of the standard and the impact of ASU 2014-09 on our financial statements the impact has not yet been determined. The Company has not yet selected a transition method and plans to adopt ASU 2014-09 effective January 1, 2018.
Subsequent Events: We have evaluated subsequent events and transactions for potential recognition or disclosure in the financial statements through the date the financial statements are issued.
44 CTS CORPORATION
NOTE 2 — Accounts Receivable
The components of accounts receivable are as follows:
As of December 31, | ||||||
2016 | 2015 | |||||
Accounts receivable, gross | $ | 62,782 | $ | 54,696 | ||
Less: Allowance for doubtful accounts | (170 | ) | (133 | ) | ||
Accounts receivable, net | $ | 62,612 | $ | 54,563 | ||
NOTE 3 — Inventories
Inventories consist of the following:
As of December 31, | ||||||
2016 | 2015 | |||||
Finished goods | $ | 7,513 | $ | 6,972 | ||
Work-in-process | 9,596 | 6,828 | ||||
Raw materials | 17,680 | 16,991 | ||||
Less: Inventory reserves | (6,137 | ) | (6,191 | ) | ||
Inventories, net | $ | 28,652 | $ | 24,600 | ||
NOTE 4 — Property, Plant and Equipment
Property, plant and equipment is comprised of the following:
As of December 31, | ||||||
2016 | 2015 | |||||
Land | $ | 2,330 | $ | 2,401 | ||
Buildings and improvements | 63,621 | 65,731 | ||||
Machinery and equipment | 213,198 | 191,212 | ||||
Less: Accumulated depreciation | (197,038 | ) | (189,472 | ) | ||
Property, plant and equipment, net | $ | 82,111 | $ | 69,872 | ||
Depreciation expense recorded in the Consolidated Statements of Earnings includes the following:
For the Years Ended | |||||||||
2016 | 2015 | 2014 | |||||||
Depreciation expense | $ | 13,177 | $ | 12,219 | $ | 12,781 | |||
NOTE 5 — Retirement Plans
We have a number of noncontributory defined benefit pension plans ("pension plans") covering approximately 6% of our active employees. Pension plans covering salaried employees provide pension benefits that are based on the employees´ years of service and compensation prior to retirement. Pension plans covering hourly employees generally provide benefits of stated amounts for each year of service.
We also provide post-retirement life insurance benefits for certain retired employees. Domestic employees who were hired prior to 1982 and certain domestic union employees are eligible for life insurance benefits upon retirement. We fund life insurance benefits through term life insurance policies and intend to continue funding all of the premiums on a pay-as-you-go basis.
We recognize the funded status of a benefit plan in our statement of financial position. The funded status is measured as the difference between plan assets at fair value and the projected benefit obligation. We also recognize, as a component of other comprehensive income, net of tax, the gains or losses and prior service costs or credits that arise during the period but are not recognized as components of net periodic benefit/cost.
The measurement dates for the pension plans for our U.S. and non-U.S. locations were December 31, 2016, and 2015.
CTS CORPORATION 45
During 2014, we approved a plan to terminate the U.K. Limited Retirement Benefits Scheme ("the U.K. Plan"). The pension liability was settled in a purchased annuity. We completed the termination of the pension plan by the end of 2015, and a loss on settlement of this pension in the amount of $8,280 was recorded in restructuring and impairment charges in 2015.
The following table provides a reconciliation of benefit obligation, plan assets, and the funded status of the pension plans for U.S. and non-U.S. locations at the measurement dates.
U.S. Pension Plans | Non-U.S. Pension Plans | ||||||||||||
2016 | 2015 | 2016 | 2015 | ||||||||||
Accumulated benefit obligation | $ | 247,276 | $ | 256,924 | $ | 2,295 | $ | 2,247 | |||||
Change in projected benefit obligation: | |||||||||||||
Projected benefit obligation at January 1 | $ | 256,924 | $ | 284,365 | $ | 2,796 | $ | 16,168 | |||||
Service cost | 87 | 171 | 51 | 63 | |||||||||
Interest cost | 11,024 | 11,258 | 46 | 465 | |||||||||
Benefits paid | (20,537 | ) | (21,526 | ) | (289 | ) | (691 | ) | |||||
Actuarial (gain) loss | (222 | ) | (17,344 | ) | 229 | (131 | ) | ||||||
Plan settlement | — | — | — | (12,786 | ) | ||||||||
Foreign exchange impact | — | — | 33 | (292 | ) | ||||||||
Projected benefit obligation at December 31 | $ | 247,276 | $ | 256,924 | $ | 2,866 | $ | 2,796 | |||||
Change in plan assets: | |||||||||||||
Assets at fair value at January 1 | $ | 289,315 | $ | 314,453 | $ | 1,480 | $ | 15,128 | |||||
Actual return on assets | 23,163 | (3,723 | ) | 11 | (538 | ) | |||||||
Company contributions | 103 | 111 | 303 | 1,275 | |||||||||
Benefits paid | (20,537 | ) | (21,526 | ) | (289 | ) | (691 | ) | |||||
Plan settlement | — | — | — | (13,437 | ) | ||||||||
Foreign exchange impact | — | — | 18 | (257 | ) | ||||||||
Assets at fair value at December 31 | $ | 292,044 | $ | 289,315 | $ | 1,523 | $ | 1,480 | |||||
Funded status (plan assets less projected benefit obligations) | $ | 44,768 | $ | 32,391 | $ | (1,343 | ) | $ | (1,316 | ) | |||
The measurement dates for the post-retirement life insurance plan were December 31, 2016, and 2015. The following table provides a reconciliation of benefit obligation, plan assets, and the funded status of the post-retirement life insurance plan at that measurement dates.
Post-Retirement Life Insurance Plan | ||||||
2016 | 2015 | |||||
Accumulated benefit obligation | $ | 4,952 | $ | 4,885 | ||
Change in projected benefit obligation: | ||||||
Projected benefit obligation at January 1 | $ | 4,886 | $ | 5,194 | ||
Service cost | 3 | 5 | ||||
Interest cost | 207 | 204 | ||||
Benefits paid | (165 | ) | (172 | ) | ||
Actuarial loss (gain) | 21 | (345 | ) | |||
Projected benefit obligation at December 31 | $ | 4,952 | $ | 4,886 | ||
Change in plan assets: | ||||||
Assets at fair value at January 1 | $ | — | $ | — | ||
Actual return on assets | — | — | ||||
Company contributions | 165 | 172 | ||||
Benefits paid | (165 | ) | (172 | ) | ||
Other | — | — | ||||
Assets at fair value at December 31 | $ | — | $ | — | ||
Funded status (plan assets less projected benefit obligations) | $ | (4,952 | ) | $ | (4,886 | ) |
46 CTS CORPORATION
The components of the prepaid (accrued) cost of the domestic and foreign pension plans, net are classified in the following lines in the Consolidated Balance Sheets at December 31:
U.S.Pension Plans | Non-U.S. Pension Plans | ||||||||||||
2016 | 2015 | 2016 | 2015 | ||||||||||
Prepaid pension asset | $ | 46,183 | $ | 33,779 | $ | — | $ | — | |||||
Accrued expenses and other liabilities | (317 | ) | — | — | — | ||||||||
Long-term pension obligations | (1,098 | ) | (1,388 | ) | (1,343 | ) | (1,316 | ) | |||||
Net prepaid (accrued) cost | $ | 44,768 | $ | 32,391 | $ | (1,343 | ) | $ | (1,316 | ) | |||
The components of the accrued cost of the post-retirement life insurance plan, net are classified in the following lines in the Consolidated Balance Sheets at December 31:
Post-Retirement Life Insurance Plan | ||||||
2016 | 2015 | |||||
Accrued expenses and other liabilities | $ | (387 | ) | $ | (360 | ) |
Long-term pension obligations | (4,565 | ) | (4,526 | ) | ||
Total accrued cost | $ | (4,952 | ) | $ | (4,886 | ) |
We have also recorded the following amounts to accumulated other comprehensive loss for the U.S. and non-U.S. pension plans, net of tax:
U.S.Pension Plans | Non-U.S. Pension Plans | ||||||||||||
Unrecognized Loss | Prior Service Cost | Total | Unrecognized Loss | ||||||||||
Balance at January 1, 2015 | $ | 96,194 | $ | — | $ | 96,194 | $ | 8,490 | |||||
Amortization of retirement benefits, net of tax | (3,956 | ) | — | (3,956 | ) | (1,507 | ) | ||||||
Settlements and curtailments | — | — | — | (5,355 | ) | ||||||||
Net actuarial gain | 4,150 | — | 4,150 | 640 | |||||||||
Foreign exchange impact | — | — | — | (629 | ) | ||||||||
Balance at January 1, 2016 | $ | 96,388 | $ | — | $ | 96,388 | $ | 1,639 | |||||
Amortization of retirement benefits, net of tax | (3,817 | ) | — | (3,817 | ) | 85 | |||||||
Settlements and curtailments | — | — | — | ||||||||||
Net actuarial (loss) gain | (2,808 | ) | — | (2,808 | ) | 12 | |||||||
Foreign exchange impact | — | — | — | 7 | |||||||||
Balance at December 31, 2016 | $ | 89,763 | $ | — | $ | 89,763 | $ | 1,743 | |||||
We have recorded the following amounts to accumulated other comprehensive loss for post-retirement life insurance plan, net of tax:
Unrecognized (Gain) loss | |||
Balance at January 1, 2015 | $ | (517 | ) |
Amortization of retirement benefits, net of tax | 63 | ||
Net actuarial loss | (215 | ) | |
Balance at January 1, 2016 | $ | (669 | ) |
Amortization of retirement benefits, net of tax | 95 | ||
Net actuarial gain | 14 | ||
Balance at December 31, 2016 | $ | (560 | ) |
The accumulated actuarial gains and losses and prior service costs and credits included in other comprehensive income are amortized in the following manner:
The component of unamortized net gains or losses related to our qualified pension plans is amortized based on the expected future life expectancy of the plan participants (estimated to be approximately 20 years at December 31, 2016), because substantially all of the participants in those plans are inactive. The component of unamortized net gains or losses related to our post-retirement
CTS CORPORATION 47
life insurance plan is amortized based on the estimated remaining future service period of the plan participants (estimated to be approximately 4 years at December 31, 2016). The Company uses a market-related value of plan assets approach reflecting changes in the fair value of plan assets over a five-year period. The variance resulting from the difference between the expected and actual return on plan assets is included in the amortization calculation upon reflection in the market-related value of plan assets.
We expect to recognize, on a pre-tax basis, approximately $5,931 of losses included in accumulated other comprehensive loss in 2017 related to our Pension Plans. We do not expect to recognize any significant such amounts related to the post-retirement life insurance plan in 2017.
The projected benefit obligation, accumulated benefit obligation and fair value of plan assets for those Pension Plans with accumulated benefit obligation in excess of fair value of plan assets is shown below:
As of December 31, | ||||||
2016 | 2015 | |||||
Projected benefit obligation | $ | 4,281 | $ | 4,184 | ||
Accumulated benefit obligation | 3,710 | 3,635 | ||||
Fair value of plan assets | 1,523 | 1,480 | ||||
Net pension (income) expense includes the following components:
Years Ended December 31, | Years Ended December 31, | ||||||||||||||||||
U.S. Pension Plans | Non-U.S. Pension Plans | ||||||||||||||||||
2016 | 2015 | 2014 | 2016 | 2015 | 2014 | ||||||||||||||
Service cost | $ | 87 | $ | 171 | $ | 192 | $ | 51 | $ | 63 | $ | 83 | |||||||
Interest cost | 11,024 | 11,258 | 12,214 | 46 | 465 | 608 | |||||||||||||
Expected return on plan assets(1) | (18,976 | ) | (20,272 | ) | (20,833 | ) | (26 | ) | (446 | ) | (677 | ) | |||||||
Amortization of unrecognized loss | 5,994 | 6,339 | 5,644 | 140 | 7,492 | 231 | |||||||||||||
Additional cost due to early retirement | — | — | 172 | — | 651 | — | |||||||||||||
Curtailment loss | — | — | — | — | — | — | |||||||||||||
Net (income)/expense | $ | (1,871 | ) | $ | (2,504 | ) | $ | (2,611 | ) | $ | 211 | $ | 8,225 | $ | 245 | ||||
Weighted-average actuarial assumptions(2) | |||||||||||||||||||
Benefit obligation assumptions: | |||||||||||||||||||
Discount rate | 4.16 | % | 4.43 | % | 4.07 | % | 1.13 | % | 1.63 | % | 3.13 | % | |||||||
Rate of compensation increase | 0.00 | % | 0.00 | % | 0.00 | % | 2.00 | % | 2.00 | % | 0.48 | % | |||||||
Pension income/expense assumptions: | |||||||||||||||||||
Discount rate | 4.43 | % | 4.07 | % | 4.84 | % | 1.63 | % | 3.13 | % | 3.85 | % | |||||||
Expected return on plan assets(1) | 6.63 | % | 7.00 | % | 7.50 | % | 1.63 | % | 2.00 | % | 4.06 | % | |||||||
Rate of compensation increase | 0.00 | % | 0.00 | % | 0.00 | % | 2.00 | % | 0.48 | % | 0.57 | % | |||||||
(1) | Expected return on plan assets is net of expected investment expenses and certain administrative expenses. |
(2) | During the fourth quarter of each year, we review our actuarial assumptions in light of current economic factors to determine if the assumptions need to be adjusted. |
48 CTS CORPORATION
Net post-retirement expense includes the following components:
Post-Retirement Life Insurance Plan | |||||||||
Years Ended December 31, | |||||||||
2016 | 2015 | 2014 | |||||||
Service cost | $ | 3 | $ | 5 | $ | 4 | |||
Interest cost | 207 | 204 | 230 | ||||||
Amortization of unrecognized gain | (149 | ) | (101 | ) | (158 | ) | |||
Net expense | $ | 61 | $ | 108 | $ | 76 | |||
Weighted-average actuarial assumptions (1) | |||||||||
Benefit obligation assumptions: | |||||||||
Discount rate | 4.10 | % | 4.43 | % | 4.07 | % | |||
Rate of compensation increase | 0 | % | 0 | % | 0 | % | |||
Pension income/post-retirement expense assumptions: | |||||||||
Discount rate | 4.43 | % | 4.07 | % | 4.84 | % | |||
Rate of compensation increase | 0 | % | 0 | % | 0 | % | |||
(1) | During the fourth quarter of each year, we review our actuarial assumptions in light of current economic factors to determine if the assumptions need to be adjusted. |
The discount rate utilized to estimate our pension and post-retirement obligations is based on market conditions at December 31, 2016, and is determined using a model consisting of high quality bond portfolios that match cash flows of the plans' projected benefit payments based on the plan participants' service to date and their expected future compensation. Use of the rate produced by this model generates a projected benefit obligation that equals the current market value of a portfolio of high quality bonds whose maturity dates match the timing and amount of expected future benefit payments.
The discount rate used to determine 2016 pension income and post-retirement expense for our pension and post-retirement plans is based on market conditions at December 31, 2015, and is the interest rate used to estimate interest incurred on the outstanding projected benefit obligations during the period.
We utilize a building block approach in determining the long-term rate of return for plan assets. Historical markets are reviewed and long-term relationships between equities and fixed-income are preserved consistent with the generally accepted capital market principle that assets with higher volatility generate a greater return over the long term. Current market factors such as inflation and interest rates are evaluated before long-term capital market assumptions are determined. The long-term portfolio return is established via a building block approach with proper consideration of diversification and rebalancing. Peer data and historical returns are reviewed to ensure for reasonableness and appropriateness.
Our pension plan asset allocation at December 31, 2016, and 2015, and target allocation for 2017 by asset category are as follows:
Target Allocations | Percentage of Plan Assets at December 31, | |||
Asset Category | 2017 | 2016 | 2015 | |
Equity securities (1) | 28% | 25% | 39% | |
Debt securities | 60% | 59% | 41% | |
Other | 12% | 16% | 20% | |
Total | 100% | 100% | 100% | |
(1) | Equity securities include CTS common stock in the amounts of approximately $17,700 (6% of total plan assets) at December 31, 2016, and approximately $25,000 (9% of total plan assets) at December 31, 2015. |
We employ a liability-driven investment strategy whereby a mix of equity and fixed-income investments are used to pursue a de-risking strategy which over time seeks to reduce interest rate mismatch risk and other risks while achieving a return that matches or exceeds the growth in projected pension plan liabilities. Risk tolerance is established through careful consideration of plan liabilities and funded status. The investment portfolio primarily contains a diversified mix of equity and fixed-income investments. Other assets such as private equity are used modestly to enhance long-term returns while improving portfolio diversification. Investment risk is measured and monitored on an ongoing basis through quarterly investment portfolio reviews, annual liability measurements, and asset/liability studies at regular intervals.
CTS CORPORATION 49
The following table summarizes the fair values of our pension plan assets:
As of December 31, | ||||||
2016 | 2015 | |||||
Equity securities - U.S. holdings(1) | $ | 43,708 | $ | 56,696 | ||
Equity securities - non-U.S. holdings(1) | 819 | 11,028 | ||||
Equity funds - U.S. holdings(1) | 28,052 | 17,522 | ||||
Equity funds - non-U.S. holdings(1) | — | 26,903 | ||||
Bond funds - government(6) | 22,237 | 47,800 | ||||
Bond funds - other(7) | 150,712 | 69,617 | ||||
Real estate(8) | 3,812 | 10,006 | ||||
Cash and cash equivalents(2) | 7,823 | 7,417 | ||||
Partnerships(5) | 12,862 | 13,360 | ||||
Long/short equity-focused hedge funds(4) | — | 5,255 | ||||
International hedge funds(3) | 23,542 | 25,191 | ||||
Total fair value of plan assets | $ | 293,567 | $ | 290,795 | ||
The fair values at December 31, 2016, are classified within the following categories in the fair value hierarchy:
Quoted Prices in Active Markets (Level 1) | Significant Other Observable Inputs (Level 2) | Significant Unobservable Inputs (Level 3) | Not Leveled | Total | |||||||||||
Equity securities - U.S. holdings(1) | $ | 43,708 | $ | — | $ | — | $ | — | $ | 43,708 | |||||
Equity securities - non-U.S. holdings(1) | 819 | — | — | — | 819 | ||||||||||
Equity funds - U.S. holdings(1) | — | 28,052 | — | — | 28,052 | ||||||||||
Equity funds - non-U.S. holdings(1) | — | — | — | — | — | ||||||||||
Bond funds - government(6) | — | 22,237 | — | — | 22,237 | ||||||||||
Bond funds - other(7) | — | 150,712 | — | — | 150,712 | ||||||||||
Real estate(8) (9) | — | — | — | 3,812 | 3,812 | ||||||||||
Cash and cash equivalents(2) | 7,823 | — | — | — | 7,823 | ||||||||||
Partnerships(5) | — | — | 12,862 | — | 12,862 | ||||||||||
International hedge funds(3) (9) | — | — | — | 23,542 | 23,542 | ||||||||||
Total | $ | 52,350 | $ | 201,001 | $ | 12,862 | $ | 27,354 | $ | 293,567 | |||||
The fair values at December 31, 2015, are classified within the following categories in the fair value hierarchy:
Quoted Prices in Active Markets (Level 1) | Significant Other Observable Inputs (Level 2) | Significant Unobservable Inputs (Level 3) | Not Leveled | Total | |||||||||||
Equity securities - U.S. holdings(1) | $ | 56,696 | $ | — | $ | — | $ | — | $ | 56,696 | |||||
Equity securities - non-U.S. holdings(1) | 11,028 | — | — | — | 11,028 | ||||||||||
Equity funds - U.S.holdings(1) | — | 17,522 | — | — | 17,522 | ||||||||||
Equity funds - non-U.S. holdings(1) | — | 26,903 | — | — | 26,903 | ||||||||||
Bond funds - government(6) | — | 47,800 | — | — | 47,800 | ||||||||||
Bond funds - other(7) | — | 69,617 | — | — | 69,617 | ||||||||||
Real Estate(8) (9) | — | — | — | 10,006 | 10,006 | ||||||||||
Cash and cash equivalents(2) | 7,417 | — | — | — | 7,417 | ||||||||||
Partnerships(5) | — | — | 13,360 | — | 13,360 | ||||||||||
Long/short equity-focused hedge funds(4) (9) | — | — | — | 5,255 | 5,255 | ||||||||||
International hedge funds(3) (9) | — | — | — | 25,191 | 25,191 | ||||||||||
Total | $ | 75,141 | $ | 161,842 | $ | 13,360 | $ | 40,452 | $ | 290,795 | |||||
(1) | Comprised of common stocks of companies in various industries. The Pension Plan fund manager may shift investments from value to growth strategies or vice-versa, from small cap to large cap stocks or vice-versa, in order to meet the Pension Plan's investment objectives, which are to provide for a reasonable amount of long-term growth of capital without undue exposure to volatility, and protect the assets from erosion of purchasing power. |
(2) | Comprised of investment grade short-term investment and money-market funds. |
50 CTS CORPORATION
(3) | This fund allocates its capital across several direct hedge-fund organizations. This fund invests with hedge funds that employ "non-directional" strategies. These strategies do not require the direction of the markets to generate returns. The majority of these hedge funds generate returns by the occurrence of key events such as bankruptcies, mergers, spin-offs, etc. Investments can be redeemed at the Share Net Asset Value ("NAV") as of the last business day of each calendar quarter with at least a sixty-five day prior written notice to the administrator. |
(4) | The hedge fund manager utilizes fundamental research and invests in equities both long (seeking price appreciation) and short (expectation that the stock will fall) instruments. Investments can be redeemed at the Share NAV as of the last business day of each calendar quarter with at least a sixty-five day prior written notice to the administrator. |
(5) | Comprised of partnerships that invest in various U.S. and international industries. |
(6) | Comprised of zero-coupon U.S. Treasury securities (“Treasury STRIPS”) with maturities greater than 20 years. |
(7) | Comprised predominately of investment grade U.S. corporate bonds with maturities greater than 10 years and U.S. high-yield corporate bonds; emerging market debt (local currency sovereign bonds, U.S. dollar-denominated sovereign bonds and U.S. dollar-denominated corporate bonds); and U.S. bank loans. |
(8) | Comprised of investments in securities of U.S. and non-U.S. real estate investment trusts (REITs), real estate operating companies and other companies that are principally engaged in the real estate industry and of investments in global private direct commercial real estate. Investments can be redeemed immediately following the valuation date with a notice of at least fifteen business days before valuation. |
(9) | Comprised of investments that are measured at fair value using the NAV per share practical expedient. In accordance with the provisions of ASC 820-10, these investments have not been classified in the fair value hierarchy. The fair value amount not leveled is presented to allow reconciliation of the fair value hierarchy to total fund pension plan assets. |
The pension plan assets recorded at fair value are measured and classified in a hierarchy for disclosure purposes consisting of three levels based on the observability of inputs available in the marketplace used to measure fair value as discussed below:
• | Level 1: Fair value measurements that are quoted prices (unadjusted) in active markets that the pension plan trustees have the ability to access for identical assets or liabilities. Market price data generally is obtained from exchange or dealer markets. |
• | Level 2: Fair value measurements based on inputs other than quoted prices included in Level 1 that are observable for the asset, either directly or indirectly. Level 2 inputs include quoted prices for similar assets in active or inactive markets, and inputs other than quoted prices that are observable for the asset, such as interest rates and yield curves that are observable at commonly quoted intervals. |
• | Level 3: Fair value measurements based on valuation techniques that use significant inputs that are unobservable. |
The table below reconciles the Level 3 partnership assets within the fair value hierarchy:
Amount | |||
Fair value of Level 3 partnership assets at January 1, 2015 | $ | 11,239 | |
Capital contributions | 2,808 | ||
Net ordinary gain attributable to partnership assets | — | ||
Realized and unrealized gain | 754 | ||
Capital distributions | (1,441 | ) | |
Fair value of Level 3 partnership assets at December 31, 2015 | 13,360 | ||
Capital contributions | 1,419 | ||
Net ordinary gain attributable to partnership assets | — | ||
Realized and unrealized gain | 584 | ||
Capital distributions | (2,501 | ) | |
Fair value of Level 3 partnership assets at December 31, 2016 | $ | 12,862 | |
The partnership fund manager uses a market approach in estimating the fair value of the plan's Level 3 asset. The market approach estimates fair value by first determining the entity's earnings before interest, taxes, depreciation and amortization and then multiplying that value by an estimated multiple. When establishing an appropriate multiple, the fund manager considers recent comparable private company transactions and multiples paid. The entity's net debt is then subtracted from the calculated amount to arrive at an estimated fair value for the entity. The fund manager's goal is to provide a conservative estimate of the fair value of such assets and to utilize conservative estimates of multiples used in establishing such fair values.
Our former U.K. pension plan assets included fixed annuity contracts at market value. These annuities had no tradeable value. Fair value was assessed at the present value of the stream of expected payments using certain actuarial assumptions. Accordingly, these fixed annuities are classified as Level 3 under the fair value hierarchy.
CTS CORPORATION 51
The table below reconciles the Level 3 fixed annuity contracts within the fair value hierarchy:
Amount | |||
Fair value of Level 3 fixed annuity contracts at January 1, 2015 | $ | 12,475 | |
Purchases | — | ||
Benefits paid | (12,475 | ) | |
Net loss | — | ||
Fair value of Level 3 fixed annuity contracts at December 31, 2015 | — | ||
Purchases | — | ||
Assets transferred due to termination of plan | — | ||
Net loss | — | ||
Fair value of Level 3 fixed annuity contracts at December 31, 2016 | $ | — | |
We expect to make $317 of contributions to the U.S. plans and $307 of contributions to the non-U.S. plans during 2017.
The following benefit payments, which reflect expected future service, as appropriate, are expected to be paid:
U.S. Pension Plans | Non-U.S. Pension Plans | Post-Retirement Life Insurance Plan | |||||||
2017 | $ | 16,411 | $ | 80 | $ | 387 | |||
2018 | 16,280 | 88 | 378 | ||||||
2019 | 16,390 | 92 | 369 | ||||||
2020 | 16,488 | 239 | 360 | ||||||
2021 | 16,504 | 91 | 350 | ||||||
2022-2025 | 80,563 | 711 | 1,596 | ||||||
Total | $ | 162,636 | $ | 1,301 | $ | 3,440 | |||
Defined Contribution Plans
We sponsor a 401(k) plan that covers substantially all of our U.S. employees. Contributions and costs are generally determined as a percentage of the covered employee's annual salary.
Expenses related to defined contribution plans include the following:
Years Ended December 31, | |||||||||
2016 | 2015 | 2014 | |||||||
401(k) and other plan expense | $ | 2,841 | $ | 3,352 | $ | 3,719 | |||
NOTE 6 — Goodwill and Other Intangible Assets
We evaluate finite-lived intangible assets for impairment if indicators of impairment exist. No indicators were identified for the years ended December 31, 2016, or December 31, 2015.
Other intangible assets consist of the following:
As of December 31, 2016 | ||||||||||||
Gross Carrying Amount | Accumulated Amortization | Net Amount | Weighted Average Remaining Amortization Period (in years) | |||||||||
Other intangible assets: | ||||||||||||
Customer lists / relationships | $ | 63,386 | $ | (30,318 | ) | $ | 33,068 | 11.6 | ||||
Patents | 10,319 | (10,319 | ) | — | — | |||||||
Technology and other intangibles | 36,715 | (7,613 | ) | 29,102 | 11.0 | |||||||
In process research and development | 2,200 | — | 2,200 | — | ||||||||
Other intangible assets, net | $ | 112,620 | $ | (48,250 | ) | $ | 64,370 | 11.4 | ||||
Amortization expense for the year ended December 31, 2016 | $ | 5,815 | ||||||||||
52 CTS CORPORATION
Amortization expense remaining for other intangible assets is as follows:
Amortization expense | |||
2017 | $ | 6,064 | |
2018 | 5,956 | ||
2019 | 5,947 | ||
2020 | 5,947 | ||
2021 | 5,868 | ||
Thereafter | 34,588 | ||
Total future amortization expense | $ | 64,370 | |
As of December 31, 2015 | |||||||||
Gross Carrying Amount | Accumulated Amortization | Net Amount | |||||||
Other intangible assets: | |||||||||
Customer lists / relationships | $ | 51,804 | $ | (27,101 | ) | $ | 24,703 | ||
Patents | 10,319 | (10,319 | ) | — | |||||
Technology and other intangibles | 12,871 | (5,016 | ) | 7,855 | |||||
In process research and development | 2,200 | — | 2,200 | ||||||
Other intangible assets, net | $ | 77,194 | $ | (42,436 | ) | $ | 34,758 | ||
Amortization expense for the year ended December 31, 2015 | $ | 4,035 | |||||||
Amortization expense for the year ended December 31, 2014 | $ | 4,190 | |||||||
In 2016, a Step 1 goodwill test was performed by management with the assistance of a third-party valuation firm. As of December 31, 2016, it was concluded that the estimated implied fair value of goodwill exceeded the carrying value and accordingly, no goodwill impairment was required.
Changes in the net carrying value amount of goodwill were as follows:
Total | |||
Goodwill as of December 31, 2014 | $ | 32,047 | |
Increase from acquisitions | 1,818 | ||
Goodwill as of December 31, 2015 | 33,865 | ||
Increase from acquisition | 27,879 | ||
Goodwill as of December 31, 2016 | $ | 61,744 | |
CTS CORPORATION 53
NOTE 7 — Costs Associated with Exit and Restructuring Activities
Restructuring and impairment charges are reported as a separate line within operating earnings in the Consolidated Statements of Earnings. Restructuring-related charges are recorded as a component of cost of goods sold. Total restructuring, impairment and restructuring-related charges were:
Years Ended December 31, | |||||||||
2016 | 2015 | 2014 | |||||||
Restructuring-related charges | $ | — | $ | 631 | $ | 1,935 | |||
Restructuring and impairment charges | 3,048 | 14,564 | 5,941 | ||||||
Total restructuring, impairment, and restructuring-related charges | $ | 3,048 | $ | 15,195 | $ | 7,876 | |||
In June 2016, we announced plans to restructure operations by phasing out production at the Elkhart facility by mid-2018 and transitioning it into a research and development center supporting our global operations ("June 2016 Plan"). Additional organizational changes will also occur in various other locations. The cost of the plan is expected to be approximately $16,000 including severance and other one-time benefit arrangements. We have recorded $3,048 of termination and other one-time benefit charges impacting approximately 230 employees as of December 31, 2016. Additional costs related to line movements, asset impairment and equipment charges, and other costs will be expensed as incurred. The total restructuring liability related to the June 2016 Plan was $1,739 at December 31, 2016.
The following table displays the planned restructuring and impairment charges associated with the June 2016 Plan as well as a summary of the actual costs incurred through December 31, 2016:
June 2016 Plan | Planned Costs | Actual costs incurred through December 31, 2016 | |||||
Workforce reduction | $ | 3,075 | $ | 2,504 | |||
Equipment relocation | 7,925 | 341 | |||||
Asset impairment charge | 3,700 | — | |||||
Other charges | 1,300 | 203 | |||||
Restructuring and impairment charges | $ | 16,000 | $ | 3,048 | |||
Total restructuring and impairment charges for the June 2016 Plan were as follows:
Years Ended December 31, | |||||||
2016 | 2015 | ||||||
Restructuring and impairment charges | $ | 3,048 | $ | — | |||
Not included in restructuring and impairment charges, but directly attributable to the June 2016 Plan, is an increase in tax expense of $2,316 relating to increases in valuation allowances on deferred tax assets for state net operating losses and tax credits and the revaluation of U.S. deferred taxes as a result of a change in our expected future tax rate as discussed in Note 17 "Income Taxes".
During April 2014, we announced plans to restructure our operations and consolidate our Canadian operations into other existing facilities as part of our overall plan to simplify our business model and rationalize our global footprint ("April 2014 Plan").
During the second quarter of 2015, management revised the April 2014 Plan. The amendment added $4,250 in planned costs for additional charges due to the extension of the timing of the plant shutdown, equipment impairment and relocation costs, administrative and legal costs, and training, travel and shipping costs to facilitate an effective transition.
These restructuring actions, which were substantially completed during 2015, resulted in the elimination of approximately 120 positions.
54 CTS CORPORATION
The following table displays the planned restructuring and restructuring-related charges associated with the April 2014 Plan, as well as a summary of the actual costs incurred through December 31, 2016:
April 2014 Plan | Planned Costs | Actual costs incurred through December 31, 2016 | ||||
Inventory write-down | $ | 850 | $ | — | ||
Equipment relocation | 1,800 | 444 | ||||
Other charges | 1,400 | 113 | ||||
Restructuring-related charges, included in cost of goods sold | $ | 4,050 | $ | 557 | ||
Workforce reduction | $ | 4,200 | $ | 4,423 | ||
Other charges, including pension termination costs | 1,700 | 3,413 | ||||
Restructuring and impairment charges | $ | 5,900 | $ | 7,836 | ||
Total restructuring, impairment and restructuring-related charges | $ | 9,950 | $ | 8,393 | ||
Under the April 2014 Plan, there were no restructuring, impairment, and restructuring-related charges for the year ended December 31, 2016. Restructuring, impairment, and restructuring-related charges were $4,923 for the year ended December 31, 2015 and $3,470 for the year ended December 31, 2014. The total restructuring liability related to the April 2014 Plan was $423 at December 31, 2016
During June 2013, we announced a restructuring plan to simplify our global footprint by consolidating manufacturing facilities into existing locations. This Plan included (1) the consolidation of operations from the U.K. manufacturing facility into the Czech Republic facility, (2) the consolidation of operations from the Carol Stream, Illinois manufacturing facility into the Juarez, Mexico facility, and (3) the discontinuation of manufacturing at the Singapore facility. Certain Corporate functions were consolidated or eliminated as a result of the June 2013 Plan and also as a result of the sale of our EMS business. These restructuring actions called for the elimination of approximately 350 positions.
During the fourth quarter of 2014, management revised the June 2013 Plan. The amendment added $4,000 in planned costs. Settlement of the U.K. pension plan was estimated to account for $2,000 of the added cost. The remaining $2,000 in restructuring and impairment charges were for severance costs that were estimated to result in the elimination of approximately 130 additional positions. The positions eliminated were spread globally throughout our businesses.
The following table displays the planned restructuring and restructuring-related charges associated with the June 2013 Plan, as well as a summary of the actual costs incurred through completion of the plan as of December 31, 2015:
June 2013 Plan | Planned Costs | Actual costs incurred through December 31, 2015 | ||||
Inventory write-down | $ | 800 | $ | 1,143 | ||
Equipment relocation | 900 | 1,792 | ||||
Other charges | 100 | 702 | ||||
Restructuring-related charges, included in cost of goods sold | $ | 1,800 | $ | 3,637 | ||
Workforce reduction | $ | 10,150 | $ | 9,615 | ||
Asset impairment charge | 3,000 | 4,139 | ||||
Other charges, including pension termination costs | 7,650 | 10,205 | ||||
Restructuring and impairment charges | $ | 20,800 | $ | 23,959 | ||
Total restructuring and restructuring-related charges | $ | 22,600 | $ | 27,596 | ||
Under the June 2013 Plan, restructuring, impairment and restructuring-related chargers were $10,272 for the year ended December 31, 2015 and $4,406 for the year ended December 31, 2014.
Actions under this plan were complete by the end of 2015 and no liability remains related to the June 2013 Plan as of December 31, 2016.
CTS CORPORATION 55
The following table displays the restructuring liability activity for the year ended December 31, 2016:
June 2013 Plan and April 2014 Plan and June 2016 Plan | Restructuring Liability | ||
Restructuring liability at January 1, 2016 | $ | 826 | |
Restructuring charges | 3,048 | ||
Cost paid | (1,729 | ) | |
Other activities (1) | 17 | ||
Restructuring liability at December 31, 2016 | $ | 2,162 | |
(1) Other activities includes currency translation adjustments not recorded through restructuring expense.
Total restructuring liability included in Other long-term obligations is $1,121 at December 31, 2016. The remaining liability of $1,041 is included in Accrued expenses and other liabilities at December 31, 2016.
NOTE 8 — Accrued Expenses and Other Liabilities
The components of accrued expenses and other liabilities are as follows:
As of December 31, | ||||||
2016 | 2015 | |||||
Accrued product related costs | $ | 5,556 | $ | 5,245 | ||
Accrued income taxes | 9,826 | 8,845 | ||||
Accrued property and other taxes | 1,917 | 1,838 | ||||
Dividends payable | 1,309 | 1,302 | ||||
Remediation reserves | 18,176 | 20,603 | ||||
Other accrued liabilities | 8,924 | 9,341 | ||||
Total accrued expenses and other liabilities | $ | 45,708 | $ | 47,174 | ||
NOTE 9 — Contingencies
Certain processes in the manufacture of our current and past products create by-products classified as hazardous waste. We have been notified by the U.S. Environmental Protection Agency, state environmental agencies, and in some cases, groups of potentially responsible parties, that we are potentially liable for environmental contamination at several sites currently and formerly owned or operated by CTS. Some sites, such as Asheville, North Carolina and Mountain View, California, are designated National Priorities List Superfund sites under the U.S. Environmental Protection Agency’s Superfund program. We reserve for probable remediation activities at these sites and for claims and proceedings against CTS with respect to other environmental matters. We record reserves on an undiscounted basis. In the opinion of management, based upon presently available information relating to such matters, adequate provision for probable and estimable costs have been recorded. We do not have any known environmental obligations where a loss is probable or reasonably possible of occurring for which we do not have a reserve, nor do we have any amounts for which we have not reserved because the amount of the loss cannot be reasonably estimated. Due to the inherent nature of environmental obligations, we cannot provide assurance that our ultimate environmental liability will not materially exceed the amount of our current reserve. Our reserve and disclosures will be adjusted accordingly if additional information becomes available in the future.
A roll forward of remediation reserves on the balance sheet is comprised of the following:
Years Ended December 31, | |||||||||
2016 | 2015 | 2014 | |||||||
Balance at beginning of period | $ | 20,603 | $ | 3,918 | $ | 5,116 | |||
Remediation expense | 556 | 18,591 | 1,521 | ||||||
Remediation payments | (2,983 | ) | (1,906 | ) | (2,719 | ) | |||
Balance at end of the period | $ | 18,176 | $ | 20,603 | $ | 3,918 | |||
Unrelated to the environmental claims described above, certain other legal claims are pending against us with respect to matters arising out of the ordinary conduct of our business. Although the ultimate outcome of any potential litigation resulting from these claims cannot be predicted with certainty, and some may be disposed of unfavorably to CTS, management believes that adequate provision for anticipated costs have been established based upon all presently available information. Except as noted herein, we
56 CTS CORPORATION
do not believe we have any pending loss contingencies that are probable or reasonably possible of having a material impact on our consolidated financial position, results of operations or cash flows.
NOTE 10 — Leases
Minimum future obligations under all non-cancelable operating leases as of December 31, 2016, are as follows:
Operating Leases | |||
2017 | $ | 4,635 | |
2018 | 3,224 | ||
2019 | 1,829 | ||
2020 | 1,204 | ||
2021 | 583 | ||
Thereafter | 2,526 | ||
Total minimum lease obligations | $ | 14,001 | |
Rent expense for operating leases charged to operations was as follows :
Years Ended December 31, | |||||||||
2016 | 2015 | 2014 | |||||||
Rent expense | $ | 5,694 | $ | 3,550 | $ | 4,300 | |||
Operating leases include a variety of properties around the world. These properties are used as manufacturing facilities, distribution centers and sales offices. Lease expirations range from 2017 to 2026 with breaking periods specified in the lease agreements. Sublease income was $457 in 2016. Future sublease income is $500 in 2017, $487 in 2018, and $1,872 thereafter. Some of our operating leases include renewal options and escalation clauses.
In the fourth quarter of 2012, one of our foreign locations entered into a sale-leaseback transaction. As a result of this transaction, a deferred gain of approximately $4,500 was being amortized over the 6 year expected lease term. During 2015, we terminated the lease and recognized the remaining unamortized deferred gain into income. A gain of $2,108 was included in the Consolidated Statements of Earnings for the year ended December 31, 2015.
NOTE 11 — Debt
Long-term debt was comprised of the following:
As of December 31 | ||||||
2016 | 2015 | |||||
Revolving credit facility due in 2020 | $ | 89,100 | $ | 90,700 | ||
Weighted-average interest rate | 1.9 | % | 1.5 | % | ||
Amount available | $ | 208,735 | $ | 106,985 | ||
Total credit facility | $ | 300,000 | $ | 200,000 | ||
Standby letters of credit | $ | 2,165 | $ | 2,315 | ||
Commitment fee percentage per annum | 0.25 | % | 0.25 | % | ||
The revolving credit facility requires, among other things, that we comply with a maximum total leverage ratio and a minimum fixed charge coverage ratio. Failure to comply with these covenants could reduce the borrowing availability under the revolving credit facility. We were in compliance with all debt covenants as of December 31, 2016. The revolving credit facility requires us to deliver quarterly financial statements, annual financial statements, auditors certifications and compliance certificates within a specified number of days after the end of a quarter and year. Additionally, the revolving credit facility contains restrictions limiting our ability to dispose of assets; incur certain additional debt; repay other debt or amend subordinated debt instruments; create liens on assets; make investments, loans or advances; make acquisitions or engage in mergers or consolidations; engage in certain transactions with our subsidiaries and affiliates; and make stock repurchases and dividend payments. Interest rates on the revolving credit facility fluctuate based upon the London Interbank Offered Rate and the Company's quarterly total leverage ratio. We pay a commitment fee on the undrawn portion of the revolving credit facility. The commitment fee varies based on the quarterly leverage ratio.
CTS CORPORATION 57
We have debt issuance costs related to our long-term debt that are being amortized using the straight-line method over the life of the debt. Amortization expense was approximately $163 in 2016, $175 in 2015, and $200 in 2014, and was recognized as interest expense.
We use interest rate swaps to convert the revolving credit facility's variable rate of interest into a fixed rate on a portion of the debt. In the second quarter of 2012, We entered into four separate interest rate swap agreements to fix interest rates on $50,000 of long-term debt for the periods January 2013 to January 2017. In the third quarter of 2012, we entered into four separate interest rate swap agreements to fix interest rates on $25,000 of long-term debt for the periods January 2013 to January 2017. In the third quarter of 2016, we entered into three additional forward-starting interest rate swap agreements to fix interest rates on $50,000 of long-term debt for the periods August 2017 to August 2020. The difference to be paid or received under the terms of the swap agreements is recognized as an adjustment to interest expense for the related revolving credit facility when settled.
These swaps are treated as cash flow hedges and consequently, the changes in fair value were recorded in Other comprehensive earnings. Interest rate swaps activity recorded in other comprehensive earnings before tax included the following:
Years Ended December 31, | |||||||||
2016 | 2015 | 2014 | |||||||
Unrealized gain (loss) | $ | 593 | $ | (516 | ) | $ | (510 | ) | |
Realized gain reclassified to interest expense | $ | 928 | $ | 768 | $ | 488 | |||
Interest rate swaps included on the balance sheets are comprised of the following:
As of December 31, | ||||||
2016 | 2015 | |||||
Other current assets | $ | 2 | $ | — | ||
Other assets | $ | 751 | $ | — | ||
Accrued expenses and other liabilities | $ | — | $ | 791 | ||
Other long-term obligations | $ | — | $ | (23 | ) | |
NOTE 12 — Derivatives
Our earnings and cash flows are subject to fluctuations due to changes in foreign currency exchange rates and interest rates. We selectively use derivative financial instruments including foreign currency forward contracts and interest rate swaps to manage our exposure to these risks.
The use of derivative financial instruments exposes the Company to credit risk, which relates to the risk of nonperformance by a counterparty to the derivative contracts. We manage our credit risk by entering into derivative contracts with only highly rated financial institutions and by using netting agreements.
Foreign Currency Hedges
In January of 2016, we began using forward contracts to mitigate currency risk related to a portion of our forecasted foreign Euro denominated revenues and Mexican Peso denominated expenses. The currency forward contracts are designed as cash flow hedges and are recorded in the Consolidated Balance Sheets at fair value. At least quarterly, we assess the effectiveness of these hedging relationships based on the total change in their fair value using regression analysis. The effective portion of derivative gains and losses are recorded in Accumulated other comprehensive loss until the hedged transaction affects earnings upon settlement, at which time they are reclassified to net sales and cost of goods sold. Ineffectiveness is recorded in Other expense in our Consolidated Statements of Earnings. If it becomes probable that an anticipated transaction that is hedged will not occur by the end of the originally specified time period, we reclassify the gains or losses related to that hedge from Accumulated other comprehensive loss to other expense.
As of December 31, 2016, we were hedging a portion of our forecasted Peso expenses for the following twelve months and did not have any Euro cash flow hedges in place. We continue to monitor the Company’s overall currency exposure and may elect to add cash flow hedges in the future. At December 31, 2016, we had a net unrealized loss of $637 in Accumulated other comprehensive loss, of which $637 is expected to be reclassified to income within the next 12 months. The notional amount of foreign currency forward contracts outstanding was $11.6 million at December 31, 2016.
58 CTS CORPORATION
Interest Rate Swaps
We use interest rate swaps to convert the revolving credit facility’s variable rate of interest into a fixed rate on a portion of the debt balance. In the second quarter of 2012, we entered into four separate interest rate swap agreements to fix interest rates on $50,000 of long-term debt for the periods January 2013 to January 2017. In the third quarter of 2012, we entered into four additional interest rate swap agreements to fix interest rates on $25,000 of long-term debt for the periods January 2013 to January 2017. In the third quarter of 2016, we entered into three additional forward-starting interest rate swap agreements to fix interest rates on $50,000 of long-term debt for the periods August 2017 to August 2020. The difference to be paid or received under the terms of the swap agreements will be recognized as an adjustment to interest expense when settled.
These swaps are treated as cash flow hedges and consequently, the changes in fair value were recorded in other comprehensive income (loss). The estimated net amount of the existing gains or losses that are reported in accumulated other comprehensive income (loss) that is expected to be reclassified into earnings within the next twelve months is approximately $2.
The location and fair values of derivative instruments designated as hedging instruments in the Consolidated Balance Sheets as of December 31, 2016, are shown in the following table:
As of December 31, | |||||||
2016 | 2015 | ||||||
Foreign currency hedges reported in Accrued expenses and other liabilities | $ | 601 | $ | — | |||
Interest rate swaps reported in Accrued expenses and other liabilities | $ | — | $ | 791 | |||
Interest rate swaps reported in Other long-term obligations | $ | — | $ | (23 | ) | ||
Interest rate swaps reported in Other current assets | $ | 2 | $ | — | |||
Interest rate swaps reported in Other assets | $ | 751 | $ | — | |||
The Company has elected to net its foreign currency derivative assets and liabilities in the balance sheet in accordance with ASC 210-20 (Balance Sheet, Offsetting). On a gross basis, there were no foreign currency derivative assets and foreign currency derivative liabilities were $601.
The effect of derivative instruments on the Consolidated Statements of Earnings is as follows:
Years Ended December 31, | |||||||
2016 | 2015 | ||||||
Foreign Exchange Contracts: | |||||||
Amounts reclassified from AOCI to earnings | |||||||
Net sales | $ | (124 | ) | $ | — | ||
Cost of goods sold | 111 | — | |||||
Selling, general and administrative | 1 | — | |||||
Total amounts reclassified from AOCI to earnings | (12 | ) | — | ||||
Loss recognized in other expense for hedge ineffectiveness | (1 | ) | — | ||||
Loss recognized in other expense for derivatives not designated as cash flow hedges | (5 | ) | — | ||||
Total derivative loss on foreign exchange contracts recognized in earnings | (18 | ) | — | ||||
Interest Rate Swaps: | |||||||
Interest Expense | $ | (928 | ) | $ | (768 | ) | |
Total loss on derivatives recognized in earnings | $ | (946 | ) | $ | (768 | ) | |
59 CTS CORPORATION
NOTE 13 — Accumulated Other Comprehensive Loss
Shareholders' equity includes certain items classified as accumulated other comprehensive loss ("AOCI") in the Consolidated Balance Sheets, including:
• | Unrealized gains (losses) on hedges relate to interest rate swaps to convert the revolving credit facility's variable rate of interest into a fixed rate and foreign currency forward contracts used to hedge our exposure to changes in exchange rates affecting certain revenues and costs denominated in foreign currencies. These hedges are designated as cash flow hedges, and we have deferred income statement recognition of gains and losses until the hedged transaction is settled. Amounts reclassified to income from AOCI for hedges are included in interest expense. Further information related to our interest rate swaps is included in NOTE 12, "Derivatives". |
• | Unrealized gains (losses) on pension obligations are deferred from income statement recognition until the gains or losses are realized. Amounts reclassified to income from AOCI are included in net periodic pension expense. Further information related to our pension obligations is included in NOTE 5, "Retirement Plans". |
• | Cumulative translation adjustment relates to our non-U.S. subsidiaries that have designated a functional currency other than the U.S. dollar. We are required to translate the subsidiary functional currency financial statements to dollars using a combination of historical, period-end, and average foreign exchange rates. This combination of rates creates the foreign currency translation adjustment component of other comprehensive income. Transfer of foreign currency translation gains and (losses) from AOCI to income are included in Other (expense) income. |
The components of AOCI for 2016 are as follows:
As of December 31, 2015 | Gain (Loss) Recognized in OCI | Gain (Loss) reclassified from AOCI to income | As of December 31, 2016 | |||||||||
Changes in fair market value of hedges: | ||||||||||||
Gross | $ | (768 | ) | $ | (56 | ) | $ | 940 | $ | 116 | ||
Income tax expense (benefit) | 289 | 20 | (351 | ) | (42 | ) | ||||||
Net | (479 | ) | (36 | ) | 589 | 74 | ||||||
Changes in unrealized pension cost: | ||||||||||||
Gross | (161,719 | ) | — | 10,101 | (151,618 | ) | ||||||
Income tax expense (benefit) | 64,361 | — | (3,689 | ) | 60,672 | |||||||
Net | (97,358 | ) | — | 6,412 | (90,946 | ) | ||||||
Cumulative translation adjustment: | ||||||||||||
Gross | (1,279 | ) | (1,135 | ) | — | (2,414 | ) | |||||
Income tax expense (benefit) | 111 | (19 | ) | — | 92 | |||||||
Net | (1,168 | ) | (1,154 | ) | — | (2,322 | ) | |||||
Total accumulated other comprehensive (loss) income | $ | (99,005 | ) | $ | (1,190 | ) | $ | 7,001 | $ | (93,194 | ) | |
The components of AOCI for 2015 are as follows:
As of December 31, 2014 | (Loss) Gain recognized in OCI | Gain (Loss) reclassified from AOCI to income | As of December 31, 2015 | |||||||||
Changes in fair market value of hedges: | ||||||||||||
Gross | $ | (1,020 | ) | $ | (516 | ) | $ | 768 | $ | (768 | ) | |
Income tax expense (benefit) | 384 | 194 | (289 | ) | 289 | |||||||
Net | (636 | ) | (322 | ) | 479 | (479 | ) | |||||
Changes in unrealized pension cost: | ||||||||||||
Gross | (169,291 | ) | — | 7,572 | (161,719 | ) | ||||||
Income tax expense (benefit) | 65,124 | — | (763 | ) | 64,361 | |||||||
Net | (104,167 | ) | — | 6,809 | (97,358 | ) | ||||||
Cumulative translation adjustment: | ||||||||||||
Gross | 245 | (1,524 | ) | — | (1,279 | ) | ||||||
Income tax expense (benefit) | 325 | (214 | ) | — | 111 | |||||||
Net | 570 | (1,738 | ) | — | (1,168 | ) | ||||||
Total accumulated other comprehensive (loss) income | $ | (104,233 | ) | $ | (2,060 | ) | $ | 7,288 | $ | (99,005 | ) | |
60 CTS CORPORATION
NOTE 14 — Shareholders' Equity
Share count and par value data related to shareholders' equity are as follows:
As of December 31, | ||
2016 | 2015 | |
Preferred Stock | ||
Par value per share | No par value | No par value |
Shares authorized | 25,000,000 | 25,000,000 |
Shares outstanding | — | — |
Common Stock | ||
Par value per share | No par value | No par value |
Shares authorized | 75,000,000 | 75,000,000 |
Shares issued | 56,456,516 | 56,242,499 |
Shares outstanding | 32,762,494 | 32,548,477 |
Treasury stock | ||
Shares held | 23,694,022 | 23,694,022 |
We use the cost method to account for our common stock purchases. During the year ended December 31, 2016, we did not purchase any shares of common stock under our board-authorized share repurchase program. For the year ended December 31, 2015, we purchased 984,382 shares of common stock for $18,088. Approximately $17,554 is available for future purchases.
A roll forward of common shares outstanding is as follows:
As of December 31, | ||||
2016 | 2015 | |||
Balance at beginning of the year | 32,548,477 | 33,392,060 | ||
Repurchases | — | (984,382 | ) | |
Stock option issuances | — | 5,200 | ||
Restricted stock unit issuances | 214,017 | 135,599 | ||
Balance at end of period | 32,762,494 | 32,548,477 | ||
CTS CORPORATION 61
NOTE 15 — Stock-Based Compensation
At December 31, 2016, we had four stock-based compensation plans: the Non-Employee Directors' Stock Retirement Plan ("Directors' Plan"), the 2004 Omnibus Long-Term Incentive Plan ("2004 Plan"), the 2009 Omnibus Equity and Performance Incentive Plan ("2009 Plan"), and the 2014 Performance & Incentive Plan ("2014 Plan"). Future grants can only be made under the 2014 Plan.
The 2009 Plan, and previously the 2004 Plan, provided for grants of incentive stock options or nonqualified stock options to officers, key employees, and non-employee members of the Board of Directors. In addition, the 2014 Plan, the 2009 Plan and the 2004 Plan allow for grants of stock appreciation rights, restricted stock, restricted stock units ("RSUs"), performance shares, performance-based restricted stock units, and other stock awards.
The following table summarizes the compensation expense included in selling, general and administrative expenses in the Consolidated Statements of Earnings related to stock-based compensation plans:
Years Ended December 31, | |||||||||
2016 | 2015 | 2014 | |||||||
Service-Based RSUs | $ | 1,997 | $ | 1,944 | $ | 1,771 | |||
Performance-Based RSUs | 665 | 1,235 | 872 | ||||||
Cash-settled awards | $ | 76 | $ | 16 | $ | 17 | |||
Total | $ | 2,738 | $ | 3,195 | $ | 2,660 | |||
Income tax benefit | $ | 1,029 | $ | 1,201 | $ | 1,000 | |||
We recorded a tax deduction related to RSUs that vested during the year ended December 31, 2016 in the amount of $1,829.
The following table summarizes the unrecognized compensation expense related to non-vested RSUs by type and the weighted-average period in which the expense is to be recognized:
Unrecognized compensation expense at December 31, 2016 | Weighted- average period | |||
Service-Based RSUs | $ | 1,625 | 1.12 years | |
Performance-Based RSUs | 1,231 | 1.73 years | ||
Total | $ | 2,856 | 1.38 years | |
We recognize expense on a straight-line basis over the requisite service period for each separately vesting portion of the award as if the award was, in substance, multiple awards.
The following table summarizes the status of these plans as of December 31, 2016:
2014 Plan | 2009 Plan | 2004 Plan | Directors' Plan | |||||
Awards originally available to be granted | 1,500,000 | 3,400,000 | 6,500,000 | N/A | ||||
Performance stock options outstanding | 320,000 | — | — | — | ||||
Maximum potential RSU and cash settled awards outstanding | 609,511 | 212,849 | 78,947 | 25,985 | ||||
Maximum potential awards outstanding | 929,511 | 212,849 | 78,947 | 25,985 | ||||
RSUs and cash settled awards vested and released | 54,544 | — | — | — | ||||
Awards available to be granted | 515,945 | — | — | — | ||||
Stock Options
Stock options are exercisable in cumulative annual installments over a maximum 10-year period, commencing at least one year from the date of grant. Stock options are generally granted with an exercise price equal to the market price of our stock on the date of grant. The stock options generally vest over four years and have a 10-year contractual life. The awards generally contain provisions to either accelerate vesting or allow vesting to continue on schedule upon retirement if certain service and age requirements are met. The awards also provide for accelerated vesting if there is a change in control event.
We estimate the fair value of the stock option on the grant date using the Black-Scholes option-pricing model and assumptions for expected price volatility, option term, risk-free interest rate, and dividend yield. Expected price volatilities are based on historical volatilities of our common stock. The expected option term was derived from historical data of exercise behavior. The dividend
62 CTS CORPORATION
yield was based on historical dividend payments. The risk-free rate for periods within the contractual life of the option was based on the U.S. Treasury yield curve in effect at the time of grant.
There were no outstanding stock options at December 31, 2016 or 2015 other than the performance-based stock options described below.
Performance-Based Stock Options
During 2015 and 2016, the Compensation committee of the Board of Directors (the "Committee") granted a total of 320,000 performance-based stock options (including forfeitures). The Performance-Based Option Awards have an exercise price of $18.37, a term of five years and generally will become exercisable (provided the optionee remains employed by the Company or an affiliate) upon our attainment of at least $600,000 in revenues during any of our four-fiscal-quarter trailing periods (as determined by the Committee) during the term. We have not recognized any expense on these Performance-Based Option Awards for the years ended December 31, 2016 and 2015, since the revenue target is not deemed likely to be attained based on our current forecast.
Service-Based Restricted Stock Units
Service-based RSUs entitle the holder to receive one share of common stock for each unit when the unit vests. RSUs are issued to officers, key employees and non-employee directors as compensation. Generally, the RSUs vest over a three-year period. RSUs granted to non-employee directors have historically vested one month after granted, except beginning in 2016 they vest one year after granted. Upon vesting, the non-employee directors elect to either receive the stock associated with the RSU immediately, or defer receipt of the stock to a future date. The fair value of the RSUs is equivalent to the trading value of our common stock on the grant date.
A summary of RSUs for all Plans is presented below:
Units | Weighted Average Grant Date Fair Value | Weighted Average Remaining Contractual Term | Aggregate Intrinsic Value | ||||||
Outstanding at January 1, 2016 | 505,170 | $ | 13.13 | ||||||
Granted | 195,266 | 15.07 | |||||||
Released | (102,967 | ) | 14.27 | ||||||
Forfeited | (42,991 | ) | 16.75 | ||||||
Outstanding at December 31, 2016 | 554,478 | $ | 13.37 | 21.8 | $ | 12,420 | |||
Releasable at December 31, 2016 | 303,233 | $ | 11.34 | 33.7 | $ | 6,792 | |||
Years Ended December 31, | |||||||||
2016 | 2015 | 2014 | |||||||
Weighted-average grant date fair value | $ | 15.07 | $ | 17.31 | $ | 9.00 | |||
Intrinsic value of RSUs released | $ | 1,520 | $ | 2,933 | $ | 5,670 | |||
A summary of nonvested RSUs is presented below:
RSUs | Weighted Average Grant Date Fair Value | ||||
Nonvested at January 1, 2016 | 218,849 | $ | 16.29 | ||
Granted | 195,266 | 15.07 | |||
Vested | (126,944 | ) | 15.19 | ||
Forfeited | (35,926 | ) | 16.75 | ||
Nonvested at December 31, 2016 | 251,245 | 15.81 | |||
Years Ended December 31, | |||||||||
2016 | 2015 | 2014 | |||||||
Fair value of RSUs vested | $ | 1,928 | $ | 1,908 | $ | 2,055 | |||
CTS CORPORATION 63
Performance-Based Restricted Stock Units
We grant performance-based restricted stock unit awards ("PSUs") to certain executives and key employees. Units are usually awarded in the range from zero percent to 200% of a targeted number of shares. The award rate for the 2014-2016, 2015-2017, and 2016-2018 PSUs is dependent upon our achievement of sales growth targets, cash flow targets, and relative total shareholder return ("RTSR") using a matrix based on the percentile ranking of our stock price performance compared to a peer group over a three-year period. These awards are weighted 35% for achievement of the sales growth metric, 30% for achievement of the cash flow metric, and 35% for achievement of the RTSR metric. Other PSUs are granted from time to time based on other performance criteria.
A summary of PSUs for all Plans is presented below:
Units | Weighted Average Grant Date Fair Value | Weighted Average Remaining Contractual Term | Aggregate Intrinsic Value | ||||||
Outstanding at January 1, 2016 | 249,560 | $ | 15.14 | ||||||
Granted | 108,650 | 13.56 | |||||||
Released | (234,517 | ) | 11.82 | ||||||
Forfeited | (18,810 | ) | 15.86 | ||||||
Added by performance factor | 97,017 | $ | 11.81 | ||||||
Outstanding at December 31, 2016 | 201,900 | $ | 16.48 | 44.2 | $ | 4,523 | |||
Releasable at December 31, 2016 | — | $ | — | — | $ | — | |||
The following table summarizes each grant of performance awards outstanding at December 31, 2016:
Description | Grant Date | Vesting Year | Vesting Dependency | Target Units Outstanding | Maximum Number of Units to be Granted | ||
2014-2016 Performance RSUs | February 14, 2014 | 2017 | 35% RTSR, 35% sales growth, 30% cash flow | 43,060 | 86,120 | ||
2015-2017 Performance RSUs | February 5, 2015 | 2018 | 35% RTSR, 35% sales growth, 30% cash flow | 62,000 | 124,000 | ||
2016-2018 Performance RSUs | February 16, 2016 | 2019 | 35% RTSR, 35% sales growth, 30% cash flow | 92,840 | 185,680 | ||
Single Crystal Performance RSUs | March 31, 2016 | 2019 | various | 4,000 | 8,000 | ||
201,900 | 403,800 | ||||||
Cash-Settled Restricted Stock Units
Cash-Settled RSUs entitle the holder to receive the cash equivalent of one share of common stock for each unit when the unit vests. These RSUs are issued to key employees residing in foreign locations as direct compensation. Generally, these RSUs vest over a three-year period. Cash-settled RSUs are classified as liabilities and are remeasured at each reporting date until settled. At December 31, 2016, and 2015, we had 12,074 and 7,958 cash-settled RSUs outstanding, respectively. At December 31, 2016, and 2015, liabilities of $170 and $94, respectively were included in Accrued expenses and other liabilities on our Consolidated Balance Sheets.
NOTE 16 — Fair Value Measurements
The table below summarizes the financial assets and liabilities that were measured at fair value on a recurring basis as of December 31, 2016 and the loss recorded during the year ended December 31, 2016:
Asset (Liability) Carrying Value at December 31, 2016 | Quoted Prices in Active Markets for Identical (Level 1) | Significant Other Observable Inputs (Level 2) | Significant Unobservable Inputs (Level 3) | (Gain) loss for Year Ended December 31, 2016 | |||||||||||
Interest rate swap — cash flow hedge | $ | 753 | $ | — | $ | 753 | $ | — | $ | (928 | ) | ||||
Foreign currency hedges | $ | (601 | ) | $ | — | $ | (601 | ) | $ | — | $ | 18 | |||
64 CTS CORPORATION
The table below summarizes the financial liability that was measured at fair value on a recurring basis as of December 31, 2015 and the loss recorded during the year ended December 31, 2015:
Asset (Liability) Carrying Value at December 31, 2015 | Quoted Prices in Active Markets for Identical (Level 1) | Significant Other Observable Inputs (Level 2) | Significant Unobservable Inputs (Level 3) | Loss for Year Ended December 31, 2015 | |||||||||||
Interest rate swap — cash flow hedge | $ | (768 | ) | $ | — | $ | (768 | ) | $ | — | $ | 768 | |||
The fair value of our interest rate swaps and foreign currency hedges were measured using standard valuation models using market-based observable inputs over the contractual terms, including forward yield curves, among others. There is a readily determinable market for these derivative instruments, but the market is not active and therefore they are classified within level 2 of the fair value hierarchy.
The table below provides a reconciliation of the recurring financial assets and liabilities related to interest rate swaps and foreign currency hedges:
Interest Rate Swaps | Foreign Currency Hedges | |||||
Balance at January 1, 2015 | $ | (1,020 | ) | $ | — | |
Total gains (losses) for the period: | ||||||
Included in earnings | 768 | — | ||||
Included in other comprehensive earnings | (516 | ) | — | |||
Balance at January 1, 2016 | $ | (768 | ) | $ | — | |
Settled in cash | — | 54 | ||||
Total gains (losses) for the period: | ||||||
Included in earnings | 928 | (18 | ) | |||
Included in other comprehensive earnings | 593 | (637 | ) | |||
Balance at December 31, 2016 | $ | 753 | $ | (601 | ) | |
Our long-term debt consists of a revolving debt facility which is recorded at its carrying value. There is a readily determinable market for our revolving credit debt and it is classified within Level 2 of the fair value hierarchy as the market is not deemed to be active. The fair value of long-term debt approximates carrying value and was determined by valuing a similar hypothetical coupon bond and attributing that value to our credit facility.
NOTE 17 — Income Taxes
Earnings before income taxes consist of the following:
Years Ended December 31, | |||||||||
2016 | 2015 | 2014 | |||||||
U.S. | $ | 25,746 | $ | (141 | ) | $ | 19,205 | ||
Non-U.S. | 31,499 | 12,402 | 20,143 | ||||||
Total | $ | 57,245 | $ | 12,261 | $ | 39,348 | |||
Significant components of income tax provision/(benefit) are as follows:
Years Ended December 31, | |||||||||
2016 | 2015 | 2014 | |||||||
Current: | |||||||||
U.S. | $ | (1,312 | ) | $ | 329 | $ | 945 | ||
Non-U.S. | 13,729 | 12,482 | 6,981 | ||||||
Total Current | 12,417 | 12,811 | 7,926 | ||||||
Deferred: | |||||||||
U.S. | 13,245 | (15,795 | ) | 3,590 | |||||
Non-U.S. | (2,797 | ) | 8,291 | 1,310 | |||||
Total Deferred | 10,448 | (7,504 | ) | 4,900 | |||||
Total provision for income taxes | $ | 22,865 | $ | 5,307 | $ | 12,826 | |||
CTS CORPORATION 65
Significant components of our deferred tax assets and liabilities are as follows:
As of December 31, | ||||||
2016 | 2015 | |||||
Post-retirement benefits | $ | 1,798 | $ | 1,837 | ||
Inventory reserves | 1,834 | 1,797 | ||||
Loss carry-forwards | 7,279 | 9,387 | ||||
Credit carry-forwards | 22,743 | 35,082 | ||||
Nondeductible accruals | 11,629 | 12,406 | ||||
Research expenditures | 31,380 | 30,465 | ||||
Stock compensation | 2,681 | 2,070 | ||||
Foreign exchange loss | 1,780 | 2,522 | ||||
Other | 648 | 1,231 | ||||
Gross deferred tax assets | 81,772 | 96,797 | ||||
Depreciation and amortization | 9,960 | 9,814 | ||||
Pensions | 16,024 | 11,868 | ||||
Subsidiaries' unremitted earnings | 1,292 | 7,461 | ||||
Gross deferred tax liabilities | 27,276 | 29,143 | ||||
Net deferred tax assets | 54,496 | 67,654 | ||||
Deferred tax asset valuation allowance | (11,024 | ) | (10,266 | ) | ||
Total net deferred tax assets | $ | 43,472 | $ | 57,388 | ||
The long-term deferred tax assets and long-term deferred tax liabilities are as follows below:
As of December 31, | ||||
2016 | 2015 | |||
Non-current deferred tax assets | 45,839 | 63,809 | ||
Non-current deferred tax liabilities | (2,367 | ) | (6,421 | ) |
Total net deferred tax assets | 43,472 | 57,388 | ||
In 2016, we elected to early adopt ASU 2015-17 "Income Taxes (Topic 740): Balance Sheet Classification of Deferred Taxes", on a retrospective basis allowing for all deferred tax items to be classified as non-current. The non-current deferred tax assets and non-current deferred tax liabilities were not netted since these items relate to different tax jurisdictions. Non-current deferred tax liabilities are included as a component of Other long-term obligations, on our Consolidated Balance Sheets at December 31, 2016 and 2015.
At each reporting date, we weigh all available positive and negative evidence to assess whether it is more-likely-than-not that the Company's deferred tax assets, including deferred tax assets associated with accumulated loss carryforwards and tax credits in the various jurisdictions in which it operates, will be realized. As of December 31, 2016 and 2015, we recorded deferred tax assets related to certain U.S. state and non-U.S. income tax loss carryforwards of $7,279 and $9,387, respectively, and U.S. and non-U.S. tax credits of $22,743 and $35,082, respectively. The deferred tax assets expire in various years primarily between 2017 and 2035.
Generally, we assess if it is more-likely-than-not that our net deferred tax assets will be realized during the available carry-forward periods. However, we have determined that valuation allowances of $11,024 and $10,266 should be provided for certain deferred tax assets at December 31, 2016 and 2015, respectively. As of December 31, 2016, the valuation allowances relate to certain U.S. state and non-U.S. loss carry-forwards and certain U.S. state tax credits that management does not anticipate will be utilized. The increase in the valuation allowance from December 31, 2015, to December 31, 2016, is primarily due to the June 2016 restructuring activities and changes in management's judgment regarding realizability of the related assets.
No valuation allowance was recorded in 2016 against the U.S. federal foreign tax credit carryforwards of $19,375, which expire in varying amounts between 2019 and 2025, research and development tax credits of $4,311. which expire in varying amounts between 2024 and 2035, and the alternative minimum tax credit carryforwards of $882, which have no expiration. We assessed the anticipated realization of those tax credits utilizing future taxable income projections. Based on those projections, management believes it is more-likely-than-not that we will realize the benefits of these carryforwards.
66 CTS CORPORATION
The following table reconciles taxes at the U.S. federal statutory rate to the effective income tax rate:
Years Ended December 31, | ||||||
2016 | 2015 | 2014 | ||||
Taxes at the U.S. statutory rate | 35.0 | % | 35.0 | % | 35.0 | % |
State income taxes, net of federal income tax benefit | 1.4 | % | (0.1 | )% | 0.7 | % |
Non-U.S. income taxed at rates different than the U.S. statutory rate | (7.5 | )% | (16.7 | )% | (7.6 | )% |
Foreign source income, net of associated foreign tax credits | 5.3 | % | 6.9 | % | 3.5 | % |
Benefit of tax credits | (1.0 | )% | (4.6 | )% | (1.3 | )% |
Non-deductible expenses | 0.7 | % | 1.3 | % | 2.8 | % |
Adjustment to valuation allowances | 3.8 | % | 37.8 | % | (0.4 | )% |
Benefit from prior period foreign tax credits | — | % | (133.0 | )% | — | % |
Change in unrecognized tax benefits | 3.3 | % | 59.5 | % | — | % |
Impacts of unremitted foreign earnings | 0.6 | % | 60.8 | % | — | % |
Other | (1.7 | )% | (3.6 | )% | (0.1 | )% |
Effective income tax rate | 39.9 | % | 43.3 | % | 32.6 | % |
During 2015, we changed our position regarding the U.S. federal tax treatment of foreign taxes paid. We claimed a foreign tax credit on our 2014 and 2015 U.S. federal income tax returns and filed amended tax returns for 2006 through 2013 in order to claim non-U.S. taxes paid as a credit against income tax, rather than as a deduction. The filing of the amended returns reduced the deferred tax asset for federal loss carryforwards by $8,214, and increased our available foreign tax credit carryforward by $24,519, resulting in a net tax benefit of $16,305, recorded in 2015.
In general, it is our practice and intention to reinvest the earnings of our non-U.S. subsidiaries in those operations. However, during 2015, we determined that as a result of changes in the business, the foreign earnings of our subsidiaries in Canada and the U.K. were no longer permanently reinvested. Therefore, a provision for the expected taxes on repatriation of those earnings was recorded. In addition, although we plan to permanently reinvest the earnings of our Chinese facilities outside the U.S., we have determined that we will not maintain those earnings in China in order to mitigate future currency risk. As a result of these changes, we recorded a tax expense of $7,461 in 2015. Management intends to continue to permanently reinvest all other remaining current and prior earnings in jurisdictions located outside of the U.S. As of December 31, 2016, no provision has been made for U.S. income taxes on approximately $133,074 of foreign earnings, which are permanently reinvested outside of the U.S. Upon distribution of those earnings in the form of dividends or otherwise, we would be subject to U.S. income taxes net of related foreign tax credits, state income taxes, and withholding taxes payable to the various foreign countries. Determination of the amount of unrecognized deferred U.S. tax liability is not practical because of complexities such as potential foreign tax credits, local restrictions on distributions, and treaty implications associated with the related calculation.
We recognize the financial statement benefit of a tax position when it is more-likely-than-not, based on its technical merits, that the position will be sustained upon examination. A tax position that meets the more-likely-than-not threshold is then measured to determine the amount of benefit recognized in the financial statements. As of December 31, 2016, we have approximately $12,347 of unrecognized tax benefits, which if recognized, would impact the effective tax rate. We do not anticipate any significant changes in our unrecognized tax benefits within the next 12 months.
A reconciliation of the beginning and ending unrecognized tax benefits is provided below:
2016 | 2015 | |||||
Balance at January 1 | $ | 11,008 | $ | 3,890 | ||
Increase related to current year tax positions | 1,088 | 1,406 | ||||
Increase related to prior year tax positions | 251 | 5,728 | ||||
Decrease as a result of lapse of statute of limitations | — | (16 | ) | |||
Balance at December 31 | $ | 12,347 | $ | 11,008 | ||
Our continuing practice is to recognize interest and/or penalties related to unrecognized tax benefits as income tax expense. As of December 31, 2016, and 2015, $1,772 and $1,206, respectively, of interest and penalties were accrued.
We are subject to taxation in the U.S., various states, and in non-U.S. jurisdictions. Our U.S. income tax returns are primarily subject to examination from 2012 through 2015; however, U.S. tax authorities also have the ability to review prior tax years to the extent loss carryforwards and tax credit carryforwards are utilized. The open years for the non-U.S. tax returns range from 2008 through 2015 based on local statutes.
CTS CORPORATION 67
NOTE 18 - Business Acquisitions
On March 11, 2016, we acquired all of the outstanding membership interests in CTG Advanced Materials, LLC (“CTG-AM”), a privately-held company, for $73 million in cash plus a working capital adjustment. CTG-AM, formerly operated as H.C. Materials, is the market leading designer and manufacturer of single crystal piezoelectric materials, serving major original equipment manufacturers throughout the medical marketplace. These materials enable high definition ultrasound imaging (3D and 4D), as well as intravascular ultrasound applications. Other applications for these materials include wireless pacemakers, implantable hearing aids, and defense technologies.
With the CTG-AM acquisition, we gained technology and proprietary manufacturing methods that expand our offering of piezoelectric materials. This allows us to become the leading large-scale commercial producer of both single crystal materials and traditional piezoelectric ceramics.
The purchase price of $73,063, net of cash acquired of $4, has been allocated to the fair values of assets and liabilities acquired as of March 11, 2016.
The following table summarizes the fair values of the assets acquired and the liabilities assumed at the date of acquisition:
Fair Values at March 11, 2016 | ||||
Current assets | $ | 4,215 | ||
Property, plant and equipment | 6,173 | |||
Other assets | 37 | |||
Goodwill | 27,879 | |||
Intangible assets | 35,427 | |||
Fair value of assets acquired | 73,731 | |||
Less fair value of liabilities acquired | (668 | ) | ||
Net cash paid | 73,063 | |||
Goodwill recorded in connection with this acquisition represents the value we expect to be created by combining the operations of the acquired business with our existing operations, including the expansion into markets within our existing business, access to new customers, and potential cost savings and synergies. Goodwill related to this acquisition is expected to be deductible for tax purposes.
The following table summarizes the carrying amounts and weighted average lives of the acquired intangible assets:
Carrying Value | Weighted Average Amortization Period (in years) | |||
Developed technology | 23,730 | 15.0 | ||
Customer relationships and contracts | 11,502 | 14.6 | ||
Other | 195 | 0.8 | ||
Total | 35,427 | 14.8 | ||
We incurred $804 in transaction related costs during the year ended December 31, 2016. These costs are included in selling, general, and administrative costs in our Consolidated Statements of Earnings.
Results of operations for CTG-AM are included in our consolidated financial statements beginning on March 11, 2016. The amount of net sales and net loss from CTG-AM since the acquisition date that have been included in the Consolidated Statements of Earnings are as follows:
For the period March 11, 2016 through December 31, 2016 | |||
Net sales | $ | 12,299 | |
Net earnings | $ | 1,357 | |
68 CTS CORPORATION
The unaudited pro forma amounts below include CTG-AM's revenues and earnings that would have been included in our Consolidated Statement of Earnings had the acquisition date been January 1, 2015.
December 31, 2016 (Unaudited Proforma) | December 31, 2015 (Unaudited Proforma) | |||||
Net sales | $ | 398,990 | $ | 395,495 | ||
Net earnings | $ | 34,321 | $ | 8,800 | ||
Earnings per share: | ||||||
Basic | $ | 1.05 | $ | 0.27 | ||
Diluted | $ | 1.03 | $ | 0.26 | ||
The pro forma results have been prepared for informational purposes only and include adjustments to amortize acquired intangible assets with finite life, reflect additional interest expense on debt used to fund the acquisition, and to record the tax consequences of the pro forma adjustments. Included in the pro forma results are nonrecurring expenses for transaction costs of $804 and additional costs of goods sold of $1,151 for the year ended December 31, 2016.
On October 28 2015, we acquired Filter Sensing Technologies Inc. (“FST”), a privately-held company, for $1.9 million in cash, plus contingent consideration of $1.6 million. FST is a developer and designer of sensing technology for radio frequency measurement and control systems. This acquisition added a leading-edge sensing technology to our transportation portfolio and allows the Company to participate in a market that is expected to be $150-$300 million in size by 2025 as new filtering solutions gain traction.
The following table summarizes the fair values of the assets acquired and the liabilities assumed at the date of acquisition:
Fair Values at October 28, 2015 | ||||
Current assets | $ | 555 | ||
Property, plant and equipment | 29 | |||
Goodwill | 1,818 | |||
In-process research and development intangible asset | 2,200 | |||
Other assets | 8 | |||
Fair value of assets acquired | 4,610 | |||
Less fair value of liabilities acquired | (1,205 | ) | ||
Less fair value of contingent consideration | (1,550 | ) | ||
Net cash paid | $ | 1,855 | ||
Goodwill recorded in connection with the above acquisition is primarily attributable to know-how of the acquired workforce in relation to the technology being developed. Goodwill related to this acquisition is not expected to be deductible for tax purposes.
The FST acquisition was accounted for using the acquisition method of accounting whereby the total purchase price is allocated to tangible and intangible assets and liabilities based on the fair market values on the date of acquisition. We determined the purchase price allocations based on estimates of the fair values of the assets acquired and liabilities assumed. The allocations for goodwill and other intangible assets were based on historical experience and third party evaluation.
69 CTS CORPORATION
NOTE 19 — Geographic Data
Financial information relating to our operations by geographic area were as follows:
Net Sales | Years Ended December 31, | ||||||||
2016 | 2015 | 2014 | |||||||
United States | $ | 276,033 | $ | 238,796 | $ | 234,323 | |||
Singapore | 6,668 | 8,379 | 11,510 | ||||||
China | 59,506 | 55,825 | 61,683 | ||||||
Canada | — | 24,519 | 35,145 | ||||||
Czech Republic | 34,767 | 36,348 | 44,424 | ||||||
Other non-U.S. | 19,705 | 18,443 | 16,936 | ||||||
Consolidated net sales | $ | 396,679 | $ | 382,310 | $ | 404,021 | |||
Sales are attributed to countries based upon the origin of the sale.
Long-Lived Assets | Years Ended December 31, | |||||
2016 | 2015 | |||||
United States | $ | 42,488 | $ | 32,239 | ||
China | 33,013 | 30,937 | ||||
United Kingdom | 569 | 1,042 | ||||
Taiwan | 2,755 | 2,694 | ||||
Czech Republic | 2,634 | 2,029 | ||||
Other non-U.S | 652 | 931 | ||||
Consolidated long-lived assets | $ | 82,111 | $ | 69,872 | ||
NOTE 20 — Quarterly Financial Data
Quarterly Results of Operations
(Unaudited)
First | Second | Third | Fourth | |||||||||
2016 | ||||||||||||
Net sales | $ | 96,705 | $ | 98,693 | $ | 99,697 | $ | 101,584 | ||||
Gross margin | $ | 33,468 | $ | 34,457 | $ | 36,641 | $ | 35,861 | ||||
Operating earnings | $ | 12,433 | $ | 24,097 | $ | 12,490 | $ | 14,146 | ||||
Net earnings | $ | 7,863 | $ | 14,487 | $ | 3,720 | $ | 8,310 | ||||
Basic earnings per share | $ | 0.24 | $ | 0.44 | $ | 0.11 | $ | 0.25 | ||||
Diluted earnings per share | $ | 0.24 | $ | 0.44 | $ | 0.11 | $ | 0.25 | ||||
2015 | ||||||||||||
Net sales | $ | 98,311 | $ | 100,071 | $ | 90,646 | $ | 93,282 | ||||
Gross margin | $ | 32,136 | $ | 33,373 | $ | 31,446 | $ | 30,154 | ||||
Operating earnings | $ | 10,488 | $ | 10,544 | $ | (3,850 | ) | $ | 931 | |||
Net earnings | $ | 6,287 | $ | 19,080 | $ | (4,760 | ) | $ | (13,653 | ) | ||
Basic earnings per share | $ | 0.19 | $ | 0.58 | $ | (0.15 | ) | $ | (0.42 | ) | ||
Diluted earnings per share | $ | 0.19 | $ | 0.57 | $ | (0.15 | ) | $ | (0.42 | ) | ||
70 CTS CORPORATION
CTS CORPORATION
SCHEDULE II — VALUATION AND QUALIFYING ACCOUNTS
Additions | |||||||||||||||
(in thousands) | Balance at Beginning of Period | Charged/ (Credit) to Expense | Charged to Other Accounts | Deductions | Balance at End of Period | ||||||||||
Year ended December 31, 2016 Allowance for doubtful accounts | $ | 133 | $ | 44 | $ | — | $ | (7 | ) | $ | 170 | ||||
Year ended December 31, 2015 Allowance for doubtful accounts | $ | 100 | $ | 33 | $ | — | $ | — | $ | 133 | |||||
Year ended December 31, 2014 Allowance for doubtful accounts | $ | 130 | $ | (38 | ) | $ | — | $ | 8 | $ | 100 | ||||
CTS CORPORATION 71
Item 9. Changes in and Disagreements with Accountants on Accounting and Financial Disclosure
Not applicable.
Item 9A. Controls and Procedures
Pursuant to Rule 13a-15(e) of the Securities Exchange Act of 1934, management, under the direction of our Chief Executive Officer and Chief Financial Officer, evaluated our disclosure controls and procedures as of the end of the period covered by this annual report. Based on such evaluation, our Chief Executive Officer and Chief Financial Officer concluded that our disclosure controls and procedures were effective as of December 31, 2016.
The report from Grant Thornton LLP on its audit of the effectiveness of our internal control over financial reporting as of December 31, 2016, is included in Part II, Item 8 of this Annual Report on Form 10-K under the heading "Report of Independent Registered Public Accounting Firm" and is incorporated herein by reference. The Report of Management on Internal Control over Financial Reporting, which can be found following the signature page of this Annual Report on Form 10-K, is incorporated herein by reference.
Changes in Internal Control over Financial Reporting
There were no changes in our internal control over financial reporting for the quarter ended December 31, 2016 that have materially affected, or are reasonably likely to materially affect, our internal control over financial reporting.
Item 9B. Other Information
Not applicable.
72 CTS CORPORATION
PART III
Item 10. Directors, Executive Officers and Corporate Governance
Please see Part I, Item 1 of this Annual Report on Form 10-K for information about our executive officers, which is incorporated by reference herein. Information with respect to Directors and Corporate Governance may be found in our definitive proxy statement to be delivered to shareholders in connection with our 2017 Annual Meeting of Shareholders. Such information is incorporated herein by reference.
Item 11. Executive Compensation
Information with respect to this item may be found in our definitive proxy statement to be delivered to shareholders in connection with our 2017 Annual Meeting of Shareholders. Such information is incorporated herein by reference.
EQUITY COMPENSATION PLAN INFORMATION
The following table provides information about shares of CTS common stock that could be issued under all of our equity compensation plans as of December 31, 2016:
Plan Category | (a) Number of Securities to be Issued Upon Exercise of Outstanding Options, RSUs, Warrants and Rights | (b) Weighted-Average Exercise Price of Outstanding Options, RSUs, Warrants and Rights | (c) Number of Securities Remaining Available for Future Issuance Under Equity Compensation Plans (Excluding Securities Reflected in Column(a)) | ||||
Equity compensation plans approved by security holders | 1,221,307 | $ | 13.37 | 515,945 | |||
Equity compensation plans not approved by security holders(1) | 25,985 | — | — | ||||
Total | 1,247,292 | $ | 13.37 | 515,945 | |||
(1) In 1990, we adopted the Stock Retirement Plan for Non-Employee Directors. Prior to December 1, 2004, we annually credited an account for each non-employee director with 800 CTS common stock units. We also annually credited each deferred stock account with an additional number of CTS common stock units representing the amount of dividends which would have been paid on an equivalent number of shares of CTS common stock for each quarter during the preceding calendar year. As of December 1, 2004, this plan was amended to preclude crediting any additional CTS common stock units under the plan. Upon retirement, a participating non-employee director is entitled to receive one share of CTS common stock for each CTS common stock unit in his deferred stock account. On December 31, 2016, the deferred stock accounts contained a total of 25,985 CTS common stock units.
Item 12. Security Ownership of Certain Beneficial Owners and Management and Related Shareholder Matters
Information with respect to this item may be found in our definitive proxy statement to be delivered to shareholders in connection with our 2017 Annual Meeting of Shareholders. Such information is incorporated herein by reference.
Item 13. Certain Relationships and Related Transactions, and Director Independence
Information with respect to this item may be found in our definitive proxy statement to be delivered to shareholders in connection with our 2017 Annual Meeting of Shareholders. Such information is incorporated herein by reference.
Item 14. Principal Accountant Fees and Services
Information with respect to this item may be found in our definitive proxy statement to be delivered to shareholders in connection with our 2017 Annual Meeting of Shareholders. Such information is incorporated herein by reference.
CTS CORPORATION 73
PART IV
Item 15. Exhibits and Financial Statements Schedules
(a) (1) Financial Statements
The following Consolidated Financial Statements of CTS Corporation and Subsidiaries are included herein:
Report of Independent Registered Public Accounting Firm
Report of Independent Registered Public Accounting Firm on Internal Control over Financial Reporting
Consolidated Statements of Earnings: Years ended December 31, 2016, December 31, 2015, and December 31, 2014
Consolidated Statements of Comprehensive Earnings: Years ended December 31, 2016, December 31, 2015, and December 31, 2014
Consolidated Balance Sheets: December 31, 2016, and December 31, 2015
Consolidated Statements of Cash Flows: Years ended December 31, 2016, December 31, 2015, and December 31, 2014
Consolidated Statements of Shareholders' Equity: Years Ended December 31, 2016, December 31, 2015, and December 31, 2014
Notes to Consolidated Financial Statements
(a) (2) Financial Statement Schedule:
Schedule II: Valuation and Qualifying Accounts and Reserves
Other schedules have been omitted because they are not applicable or the required information is shown in the Consolidated Financial Statements or Notes thereto.
(a) (3) Exhibits
All references to documents filed pursuant to the Securities Exchange Act of 1934, including Forms 10-K, 10-Q and 8-K, were filed by CTS, File No. 1-4639.
(3)(i) | Amended and Restated Articles of Incorporation (incorporated by reference to Exhibit 5 to the Current Report on Form 8-K, filed with the SEC on September 1, 1998). | ||
(3)(ii) | Amended and Restated Bylaws (incorporated herein by reference to Exhibit 3 to the Form 8-K, filed with the SEC on February 8, 2010). | ||
(10)(a) | CTS Corporation Stock Retirement Plan for Non-Employee Directors, effective April 30, 1990, as amended (incorporated by reference to Exhibit (10)(a) to the Quarterly Report on Form 10-Q for the quarter ended March 30, 2003, filed with the SEC on April 23, 2003).* | ||
(10)(b) | Amendment to the CTS Corporation Stock Retirement Plan for Non-Employee Directors, dated as of December 1, 2004 (incorporated by reference to Exhibit (10)(j) to the Annual Report on Form 10-K for the year ended December 31, 2004, filed with the SEC on March 4, 2005). | ||
(10)(c) | CTS Corporation Pension Plan (formerly known as the CTS Corporation Salaried Employees' Pension Plan) (incorporated by reference to Exhibit (10)(t) to the Annual Report on Form 10-K for the year ended December 31, 2002, filed with the SEC on February 14, 2003).* | ||
(10)(d) | Amendments to the CTS Corporation Pension Plan (formerly known as the CTS Corporation Salaried Employees' Pension Plan) (incorporated by reference to Exhibit 10(b) to the Quarterly Report on Form 10-Q for the quarter ended June 29, 2003, filed with the SEC on July 25, 2003).* | ||
(10)(e) | CTS Corporation 2004 Omnibus Long-term Incentive Plan and Incentive Stock Option Agreement (incorporated by reference to the Exhibit 10(a) to the Quarterly Report on Form 10-Q for the quarter ended September 26, 2004, filed with the SEC on October 19, 2004).* | ||
(10)(f) | Amendments to the CTS Corporation Pension Plan (incorporated by reference to Exhibit 10(p) to the Annual Report on Form 10-K for the year ended December 31, 2005, filed with the SEC on February 27, 2006).* | ||
(10)(g) | Amendments to the CTS Corporation Pension Plan (incorporated by reference to Exhibit 10(a) to the Quarterly Report on Form 10-Q for the quarter ended April 2, 2006, filed with the SEC on April 26, 2006).* | ||
74 CTS CORPORATION
(10)(h) | Credit Agreement Between CTS Corporation and BMO Harris Bank N.A. dated August 10, 2015 (incorporated by reference to Exhibit 10.1 to the Form 8-K filed with the SEC on August 12, 2015). | ||
(10)(i) | Amendment to Credit Agreement between CTS Corporation and BMO Harris Bank N.A. (incorporated by reference to Exhibit 10.1 to the Form 8-K filed with the SEC on May 25, 2016). | ||
(10)(j) | Amendment No. 1 to the CTS Corporation 2004 Omnibus Long-term Incentive Plan (incorporated by reference to Exhibit 10(aa) to the Annual Report on Form 10-K filed with the SEC on May 15, 2007. | ||
(10)(k) | Prototype Individual Excess Benefit Retirement Plan (incorporated by reference to Exhibit 10(d) to the Quarterly Report on Form 10-Q for the quarter ended September 30, 2007, filed with the SEC on October 24, 2007).* | ||
(10)(l) | Amendments to the CTS Corporation Pension Plan (formerly known as the CTS Corporation Salaried Employees' Pension Plan) (incorporated by reference to Exhibit 10(bb) to the Annual Report on Form 10-K for the year ended December 31, 2008, filed with the SEC on February 23, 2009).* | ||
(10)(m) | CTS Corporation 2009 Omnibus Equity and Performance Incentive Plan (incorporated by reference to Exhibit 10.1 to the Current Report on Form 8-K, filed with the SEC on May 28, 2009).* | ||
(10)(n) | Form Restricted Stock Unit Agreement (Shares) (incorporated by reference to Exhibit 10.2 to the Current Report on Form 8-K, filed with the SEC on May 28, 2009).* | ||
(10)(o) | Form Restricted Stock Unit Agreement (Cash) (incorporated by reference to Exhibit 10.3 to the Current Report on Form 8-K, filed with the SEC on May 28, 2009).* | ||
(10)(p) | CTS Corporation Executive Severance Policy, effective as of September 10, 2009 (incorporated by reference to Exhibit 10 to the Quarterly Report on Form 10-Q for the quarter ended September 27, 2009, filed with the SEC on October 28, 2009).* | ||
(10)(q) | Amendments to the CTS Corporation Pension Plan (formerly known as the CTS Corporation Salaried Employees' Pension Plan) (incorporated by reference to Exhibit 10(w) to the Annual Report on Form 10-K for the year ended December 31, 2010, filed with the SEC on February 24, 2011).* | ||
(10)(r) | Letter Agreement dated February 19, 2010 by and among CTS Corporation, Toyota Motor Sales, U.S.A. Inc., Toyota Canada Inc. and Toyota Motor Engineering & Manufacturing North America, Inc. (incorporated by reference to Exhibit 10(a) to the Quarterly Report on form 10-Q for the quarter ended October 3, 2010, filed with the SEC October 27, 2010). | ||
(10)(s) | Prototype Change in Control Agreement (incorporated by reference to Exhibit 10(x) to the Annual Report on Form 10-K for the year ended December 31, 2011, filed with the SEC on February 23, 2012).* | ||
(10)(t) | CTS Corporation Management Incentive Plan, approved by the shareholders on May 23, 2012 (incorporated by reference to Appendix A to the Proxy Statement for the 2012 Annual Meeting of Shareholders, filed with the SEC on April 17, 2012).* | ||
(10)(u) | CTS Corporation 2013-2015 CEO Performance Restricted Stock Unit Plan dated February 8, 2013 (incorporated by reference to Exhibit 10(cc) to the Annual Report on Form 10-K for the year ended December 31, 2013, filed with the SEC on March 3, 2014).* | ||
(10)(v) | First Amendment to the CTS Corporation Executive Severance Policy (incorporated by reference to Exhibit 10(b) to the Quarterly Report on Form 10-Q for the quarter ended March 31, 2013, filed with the SEC on April 25, 2013).* | ||
(10)(w) | CTS Corporation 2014 Performance and Incentive Compensation Plan (incorporated by reference to Exhibit 10.1 to the Form 8-K, filed with the SEC on May 22, 2014).* | ||
(10)(x) | Transition Agreement dated June 26, 2015, by and between CTS Corporation and Anthony Urban(incorporated by reference to Exhibit 10.1 to the Form 8-K filed with the SEC on July 1, 2015). | ||
(21) | Subsidiaries. | ||
(23) | Consent of Grant Thornton LLP. | ||
(31)(a) | Certification pursuant to Section 302 of the Sarbanes-Oxley Act of 2002. | ||
(31)(b) | Certification pursuant to Section 302 of the Sarbanes-Oxley Act of 2002. | ||
(32)(a) | Certification pursuant to 18 U.S.C. Section 1350, as adopted pursuant to Section 906 of the Sarbanes-Oxley Act of 2002. | ||
CTS CORPORATION 75
(32)(b) | Certification pursuant to 18 U.S.C. Section 1350, as adopted pursuant to Section 906 of the Sarbanes-Oxley Act of 2002. | ||
101.INS | XBRL Instance Document | ||
101.SCH | XBRL Taxonomy Extension Schema Document | ||
101.CAL | XBRL Taxonomy Extension Calculation Linkbase Document | ||
101.DEF | XBRL Taxonomy Extension Definition Linkbase Document | ||
101.LAB | XBRL Taxonomy Extension Label Linkbase Document | ||
101.PRE | XBRL Taxonomy Extension Presentation Linkbase Document | ||
______________________________
* | Management contract or compensatory plan or arrangement. |
** | Pursuant to Item 601(b) (2) of Regulation S-K, certain exhibits and schedules have been omitted and we agree to furnish supplementally to the Securities and Exchange Commission a copy of any omitted exhibits upon request. |
76 CTS CORPORATION
SIGNATURES
Pursuant to the requirements of Section 13 or 15(d) of the Securities Exchange Act of 1934, the registrant has duly caused this report to be signed on its behalf by the undersigned, thereunto duly authorized.
CTS Corporation | |||
Date: February 24, 2017 | By: | /s/ Ashish Agrawal | |
Ashish Agrawal Vice President and Chief Financial Officer (Principal Financial and Accounting Officer) | |||
Pursuant to the requirements of the Securities Exchange Act of 1934, this report has been signed below by the following persons on behalf of the registrant and in the capacities and on the dates indicated.
Date: February 24, 2017 | By: | /s/ Kieran O'Sullivan | |
Kieran O'Sullivan Chairman, President, and Chief Executive Officer (Principal Executive Officer) | |||
Date: February 24, 2017 | By: | /s/ Robert A. Profusek | |
Robert A. Profusek Lead Director | |||
Date: February 24, 2017 | By: | /s/ Walter S. Catlow | |
Walter S. Catlow Director | |||
Date: February 24, 2017 | By: | /s/ Lawrence J. Ciancia | |
Lawrence J. Ciancia Director | |||
Date: February 24, 2017 | By: | /s/ Patricia K. Collawn | |
Patricia K. Collawn Director | |||
Date: February 24, 2017 | By: | /s/ Gordon Hunter | |
Gordon Hunter Director | |||
Date: February 24, 2017 | By: | /s/ William S. Johnson | |
William S. Johnson Director | |||
Date: February 24, 2017 | By: | /s/ Diana M. Murphy | |
Diana M. Murphy Director | |||
CTS CORPORATION 77
Management's Report on Internal Control Over Financial Reporting
CTS' management is responsible for establishing and maintaining adequate internal control over financial reporting, as such term is defined in Exchange Act Rule 13a-15(f). Under the supervision and with the participation of management, including CTS' Chief Executive Officer and Chief Financial Officer, CTS conducted an evaluation of the effectiveness of internal control over financial reporting based on the framework in Internal Control—Integrated Framework (2013 framework) issued by the Committee of Sponsoring Organizations of the Treadway Commission.
In its assessment of the effectiveness of internal control over financial reporting as of December 31, 2016, management determined that its internal control over financial reporting was effective as of December 31, 2016. Grant Thornton LLP, an independent registered public accounting firm, has audited CTS' internal control over financial reporting as of December 31, 2016, as stated in their report which is included herein.
CTS Corporation Lisle, IL February 24, 2017 | |
/s/ Kieran O'Sullivan | |
Kieran O'Sullivan Chairman, President and Chief Executive Officer (Principal Executive Officer) | |
/s/ Ashish Agrawal | |
Ashish Agrawal Vice President and Chief Financial Officer (Principal Financial and Accounting Officer) | |
78 CTS CORPORATION