Attached files
| file | filename |
|---|---|
| EX-32 - EX-32 - COMPUTER TASK GROUP INC | ctg-ex32_14.htm |
| EX-31.(B) - EX-31.(B) - COMPUTER TASK GROUP INC | ctg-ex31b_13.htm |
| EX-31.(A) - EX-31.(A) - COMPUTER TASK GROUP INC | ctg-ex31a_12.htm |
| EX-23 - EX-23 - COMPUTER TASK GROUP INC | ctg-ex23_11.htm |
| EX-21 - EX-21 - COMPUTER TASK GROUP INC | ctg-ex21_10.htm |
| EX-10.(S) - EX-10.(S) - COMPUTER TASK GROUP INC | ctg-ex10s_822.htm |
| EX-10.(R) - EX-10.(R) - COMPUTER TASK GROUP INC | ctg-ex10r_821.htm |
| EX-10.(O) - EX-10.(O) - COMPUTER TASK GROUP INC | ctg-ex10o_820.htm |
| EX-10.(G) - EX-10.(G) - COMPUTER TASK GROUP INC | ctg-ex10g_819.htm |
UNITED STATES
SECURITIES AND EXCHANGE COMMISSION
Washington, D.C. 20549
FORM 10-K
(Mark One)
|
☒ |
ANNUAL REPORT PURSUANT TO SECTION 13 OR 15(d) OF THE SECURITIES EXCHANGE ACT OF 1934 |
For the fiscal year ended December 31, 2016
OR
|
☐ |
TRANSITION REPORT PURSUANT TO SECTION 13 OR 15(d) OF THE SECURITIES EXCHANGE ACT OF 1934 |
For the Transition period from to
Commission File No. 1-9410
COMPUTER TASK GROUP, INCORPORATED
(Exact name of registrant as specified in its charter)
|
New York |
|
16-0912632 |
|
(State or other jurisdiction of incorporation or organization) |
|
(I.R.S. Employer Identification No.) |
|
800 Delaware Avenue, Buffalo, New York |
|
14209 |
|
(Address of principal executive offices) |
|
(Zip Code) |
Registrant’s telephone number, including area code: (716) 882-8000
Securities registered pursuant to Section 12(b) of the Act:
|
Title of each class |
|
Name of each exchange on which registered |
|
Common Stock, $.01 par value |
|
The NASDAQ Stock Market LLC |
Securities registered pursuant to Section 12(g) of the Act: None
Indicate by check mark if the registrant is a well-known seasoned issuer, as defined in Rule 405 of the Securities Act. YES ☐ NO ☒
Indicate by check mark if the registrant is not required to file reports pursuant to Section 13 or Section 15(d) of the Act. YES ☐ NO ☒
Indicate by check mark whether the registrant (1) has filed all reports required to be filed by Section 13 or 15(d) of the Securities Exchange Act of 1934 during the preceding 12 months (or for such shorter period that the registrant was required to file such reports), and (2) has been subject to such filing requirements for the past 90 days. YES ☒ NO ☐
Indicate by check mark whether the registrant has submitted electronically and posted on its corporate Website, if any, every Interactive Data File required to be submitted and posted pursuant to Rule 405 of Regulation S-T (232.405 of this chapter) during the preceding 12 months (or for such shorter period that the registrant was required to submit and post such files). YES ☒ NO ☐
Indicate by check mark if disclosure of delinquent filers pursuant to Item 405 of Regulation S-K (229.405 of this chapter) is not contained herein, and will not be contained, to the best of registrant’s knowledge, in definitive proxy or information statements incorporated by reference in Part III of this Form 10-K or any amendment to this Form 10-K. ☐
Indicate by check mark whether the registrant is a large accelerated filer, an accelerated filer, a non-accelerated filer, or a smaller reporting company. See the definitions of “large accelerated filer,” “accelerated filer” and “smaller reporting company” in Rule 12b-2 of the Exchange Act:
|
Large accelerated filer |
☐ |
Accelerated filer |
☒ |
|
|
|
|
|
|
Non-accelerated filer |
☐ (Do not check if a smaller reporting company) |
Smaller reporting company |
☐ |
Indicate by check mark whether the registrant is a shell company (as defined in Rule 12b-2 of the Act). YES ☐ NO ☒
The aggregate market value of the registrant’s voting and non-voting common equity held by non-affiliates, computed by reference to the price at which the common equity was last sold on the last business day of the registrant’s most recently completed second quarter was $77.6 million. Solely for the purposes of this calculation, all persons who are or may be executive officers or directors of the registrant have been deemed to be affiliates.
The total number of shares of Common Stock of the Registrant outstanding at February 17, 2017 was 15,694,865.
DOCUMENTS INCORPORATED BY REFERENCE
Certain sections of the Company’s definitive proxy statement to be filed with the Securities and Exchange Commission (SEC) within 120 days of the end of the Company’s fiscal year ended December 31, 2016, are incorporated by reference into Part III hereof. Except for those portions specifically incorporated by reference herein, such document shall not be deemed to be filed with the SEC as part of this annual report on Form 10-K.
|
Section |
|
Page |
|
Part I |
|
|
|
Item 1. |
1 |
|
|
Item 1A. |
6 |
|
|
Item 1B. |
11 |
|
|
Item 2. |
11 |
|
|
Item 3. |
11 |
|
|
Item 4. |
11 |
|
|
Part II |
|
|
|
Item 5. |
12 |
|
|
Item 6. |
14 |
|
|
Item 7. |
Management’s Discussion and Analysis of Financial Condition and Results of Operations |
15 |
|
Item 7A. |
27 |
|
|
Item 8. |
28 |
|
|
Item 9. |
Changes in and Disagreements With Accountants on Accounting and Financial Disclosure |
55 |
|
Item 9A. |
55 |
|
|
Item 9B. |
57 |
|
|
Part III |
|
|
|
Item 10. |
58 |
|
|
Item 11. |
58 |
|
|
Item 12. |
Security Ownership of Certain Beneficial Owners and Management and Related Stockholder Matters |
59 |
|
Item 13. |
Certain Relationships and Related Transactions, and Director Independence |
59 |
|
Item 14. |
59 |
|
|
Part IV |
|
|
|
Item 15. |
60 |
|
As used in this annual report on Form 10-K, references to “CTG,” “the Company” or “the Registrant” refer to Computer Task Group, Incorporated and its subsidiaries, unless the context suggests otherwise.
Forward-Looking Statements
This annual report on Form 10-K contains forward-looking statements made by the management of Computer Task Group, Incorporated (CTG, the Company or the Registrant) that are subject to a number of risks and uncertainties. These forward-looking statements are based on information as of the date of this report. The Company assumes no obligation to update these statements based on information from and after the date of this report. Generally, forward looking statements include words or phrases such as “anticipates,” “believes,” “estimates,” “expects,” “intends,” “plans,” “projects,” “could,” “may,” “might,” “should,” “will” and words and phrases of similar impact. The forward-looking statements include, but are not limited to, statements regarding future operations, industry trends or conditions and the business environment, and statements regarding future levels of or trends in business strategy and expectations, new business opportunities, cost control initiatives, business wins, market demand, revenue, operating expenses, capital expenditures, and financing. The forward-looking statements are made pursuant to safe harbor provisions of the Private Securities Litigation Reform Act of 1995. Numerous factors could cause actual results to differ materially from those in the forward-looking statements, including the following: (i) the availability to CTG of qualified professional staff, (ii) domestic and foreign industry competition for clients and talent, including technical, sales and management personnel, (iii) increased bargaining power of large clients, (iv) the Company's ability to protect confidential client data, (v) the partial or complete loss of the revenue the Company generates from International Business Machines Corporation (IBM) and SDI International (SDI), (vi) the uncertainty of clients' implementations of cost reduction projects, (vii) the effect of healthcare reform and initiatives, (viii) the mix of work between staffing and solutions, (ix) currency exchange risks, (x) risks associated with operating in foreign jurisdictions, (xi) renegotiations, nullification, or breaches of contracts with clients, vendors, subcontractors or other parties, (xii) the impact of current and future laws and government regulation, as well as repeal or modification of such, affecting the information technology (IT) solutions and staffing industry, taxes and the Company's operations in particular, (xiii) industry and economic conditions, including fluctuations in demand for IT services, (xiv) consolidation among the Company's competitors or clients, (xv) the need to supplement or change our IT services in response to new offerings in the industry or changes in client requirements for IT products and solutions, (xvi) the risks associated with acquisitions, and (xvii) the risks described in Item 1A of this annual report on Form 10-K and from time to time in the Company's reports filed with the Securities and Exchange Commission (SEC).
Overview
CTG was incorporated in Buffalo, New York on March 11, 1966, and its corporate headquarters are located at 800 Delaware Avenue, Buffalo, New York 14209 (716-882-8000). CTG is an IT solutions and staffing services company with operations in North America and Europe. CTG employs approximately 3,400 people worldwide. During 2016, the Company had eight operating subsidiaries: Computer Task Group of Canada, Inc., providing services in Canada; Computer Task Group Belgium N.V., CTG ITS S.A., Computer Task Group IT Solutions, S.A., Computer Task Group Luxembourg PSF, Computer Task Group (U.K.) Ltd., and CTG Health Solutions N.V., each primarily providing services in Europe, and Computer Task Information Technology Private Services Limited, providing services in India. Services provided in North America are primarily performed by the parent corporation, CTG.
Services
The Company primarily operates in one industry segment, providing IT services to its clients. At the highest level, CTG delivers services that are considered either IT solutions, or IT and other staffing. CTG delivers these primary services to all of the markets that it serves. The services provided typically encompass the IT business solution life cycle, including phases for planning, developing, implementing, managing, and ultimately maintaining the IT solution. A typical client is an organization with large, complex information and data processing requirements. The Company’s IT solutions and IT and other staffing services are further described as follows:
|
|
• |
IT Solutions: CTG’s IT solutions typically include engagements with a fixed duration and deliverables that achieve value-based outcomes by applying the right IT solutions to address clients’ business needs. These solutions include the implementation and optimization of packaged software applications, the development and deployment of customized software and solutions designed to fit the needs of a specific client or market, and the design and distribution of complex technology components. Additionally, IT Solutions services often include consulting services provided to clients at higher billable rates. |
1
|
|
• |
IT and Other Staffing: CTG’s staffing services address a range of IT and business resource needs, from filling specific talent gaps to managing high-volume staffing programs. CTG recruits, retains, and manages IT and other talent for its clients, which are primarily large technology service providers and other companies with multiple locations and a significant need for high-volume external IT, administrative, or other resources. |
IT solutions and IT staffing and other revenue as a percentage of consolidated revenue for the years ended December 31, 2016, 2015 and 2014 is as follows:
|
|
|
2016 |
|
|
2015 |
|
|
2014 |
|
|||
|
IT solutions |
|
|
29 |
% |
|
|
33 |
% |
|
|
38 |
% |
|
IT and other staffing |
|
|
71 |
% |
|
|
67 |
% |
|
|
62 |
% |
|
Total |
|
|
100 |
% |
|
|
100 |
% |
|
|
100 |
% |
Capabilities
CTG provides a full range of offerings spanning seven service areas that, collectively, address many of our clients’ most pressing technology and business challenges. CTG’s capabilities ensure that our clients are utilizing the right information technology to meet their business needs, maximizing the value from their IT systems, and operating in the most efficient and effective manner.
CTG’s flexible offerings are delivered as an IT solution or IT and other staffing service, or as a strategy or service offering, allowing CTG to meet the unique needs of each client. All offerings are supported with proven program and project management processes and tools that ensure the reliability, transparency, and accountability that CTG clients have come to expect.
CTG provides capabilities in the following service areas:
|
|
• |
Advisory and Planning: Supports our clients’ needs to evaluate, select, and design new technology, align technology and business strategy, and optimize technology for improved performance and benefits realization. |
|
|
• |
Application Services: Provides clients with a full range of technical support to maximize the value of enterprise software, with services that include development, deployment, integration, optimization, and application management and support. |
|
|
• |
Quality Assurance and Testing: Ensures new and legacy technologies are rigorously verified to meet business requirements and industry standards. CTG delivers full testing programs for clients or can help clients assess, develop, improve, implement, and automate their own programs, as well as provide testing training and certification. |
|
|
• |
IT Services Management (ITSM): Ensures the right processes, people, and technology are in place to support business goals. Offerings support our clients’ needs to deliver IT services in a more effective and efficient manner and future-proof IT to deal with changing business dynamics and threats with services including help/service desk, ITSM process improvement, technology and infrastructure implementation, disaster recovery and business continuity, and IT infrastructure outsourcing. |
|
|
• |
Information Management: Helps our clients manage and derive greater value and competitive advantage from data with services that include business intelligence and analytics, enterprise data warehouses, data governance, disclosure management, master data management, and legacy data archiving. |
|
|
• |
Regulatory Compliance: Assists our clients in understanding, preparing for, managing, and mitigating risk related to government regulations and industry standards. Offerings include audits and assessments, validation, and program management for highly-regulated industries such as healthcare and financial services, as well as cross-industry data privacy and security requirements. |
|
|
• |
Strategic Staffing: Addresses our clients’ needs ranging from staff augmentation and volume staffing to fill specific technical skills gaps, to fully-managed solutions to improve recruiting quality, speed, and cost. CTG also provides comprehensive vendor management and preferred-supplier solutions to help clients achieve significant improvements in managing contractors and technical-support processes. |
2
Vertical Markets
The Company promotes a majority of its services through five vertical market focus areas: Technology Service Providers, Manufacturing, Healthcare (which includes services provided to healthcare providers, health insurers (payers), and life sciences companies), Financial Services, and Energy. The remainder of CTG’s revenue is derived from general markets.
CTG’s revenue by vertical market as a percentage of consolidated revenue for the years ended December 31, 2016, 2015 and 2014 is as follows:
|
|
|
2016 |
|
|
2015 |
|
|
2014 |
|
|||
|
Technology service providers |
|
|
35.2 |
% |
|
|
31.1 |
% |
|
|
26.3 |
% |
|
Manufacturing |
|
|
24.2 |
% |
|
|
25.7 |
% |
|
|
24.0 |
% |
|
Healthcare |
|
|
18.2 |
% |
|
|
23.5 |
% |
|
|
28.6 |
% |
|
Financial services |
|
|
7.7 |
% |
|
|
7.1 |
% |
|
|
7.8 |
% |
|
Energy |
|
|
5.1 |
% |
|
|
5.4 |
% |
|
|
6.1 |
% |
|
General markets |
|
|
9.6 |
% |
|
|
7.2 |
% |
|
|
7.2 |
% |
|
Total |
|
|
100.0 |
% |
|
|
100.0 |
% |
|
|
100.0 |
% |
Revenue for the Company's technology service providers vertical market as a percentage of consolidated revenue increased in 2016 as compared with 2015 due to a change in business mix. Revenue from IBM, our largest client, which is included in this vertical market, remained consistent in 2016 as compared with 2015, which aided in minimizing the decrease in revenue in this vertical market. However, revenue from a number of our other vertical markets fell year-over-year. Demand from this vertical market did slow in the 2016 fourth quarter due to a reduction in requirements from IBM. The revenue increase for 2015 as compared with 2014 was due to strong demand for the first three quarters of 2015 from several of the Company's largest clients in its IT staffing services business unit, which are included in this vertical market. Demand from this vertical market did slow significantly in the 2015 fourth quarter, however, as several large clients cut back on their requirements for our services due to their own challenging financial results.
The revenue in our manufacturing vertical market is primarily generated from several large staffing clients, including Lenovo (through SDI as a vendor manager for Lenovo) which is our second largest client. Revenue from Lenovo and others in this vertical market fell throughout 2016 due to various reductions in requirements. However, a reduction in revenue in other vertical markets reduced the impact of these losses as a percentage of total revenue. Revenue from Lenovo increased by approximately $7 million in 2015 as compared with 2014 primarily as a result of the acquisition from IBM of the x86 server business.
In 2014, 2015 and 2016, the demand from our healthcare clients decreased. This decrease was directly related to the U.S. federal government sequestration which cut Medicare reimbursements to hospitals and health systems by 2% starting in April 2013. As a result, the Company’s healthcare revenue, primarily from electronic health records (EHR) and related projects, declined in 2014, and continued to decrease in 2015 and 2016 as the Company continues to transform its business from selling primarily EHR projects to advisory and technical services, outsourcing, and staff augmentation.
Revenue for the Company’s financial services vertical market as a percentage of consolidated revenue increased in 2016 as compared with 2015 due to a change in business mix. Revenue in this vertical market decreased slightly in 2016, while revenue from a number of the other vertical markets had larger reductions during this time period. During 2015, the percentage of revenue attributable to the financial services market decreased from 2014, primarily due to the fact that most of the revenue generated in this vertical market is in Europe, and there was a significant decrease in the value of the Euro in 2015 as compared with 2014.
Revenue for the Company's energy vertical market decreased as a percentage of consolidated revenue in 2016 as compared with 2015, and in 2015 as compared with 2014, as demand in this vertical market declined. Generally, the decrease in the price of oil caused several of our clients to reduce their overall spending, including requirements for IT services, in each of 2016, 2015 and 2014.
For the year ended December 31, 2016, CTG provided its services to approximately 450 clients in North America and Europe. In North America, the Company operates in the United States and Canada, with greater than 99% of 2016 North American revenue generated in the United States. In Europe, the Company operates in Belgium, Luxembourg, and the United Kingdom. Of total 2016 consolidated revenue of $324.9 million, approximately 78% was generated in North America and 22% in Europe. Two clients, IBM and Lenovo (through SDI as a vendor manager), each accounted for greater than 10% of CTG’s consolidated revenue in 2016.
3
Revenue Recognition and Backlog
The Company recognizes revenue when persuasive evidence of an arrangement exists, when the services have been rendered, when the price is determinable, and when collectibility of the amounts due is reasonably assured. For time-and-material contracts, revenue is recognized as hours are incurred and costs are expended. For contracts with periodic billing schedules, primarily monthly, revenue is recognized as services are rendered to the client. Revenue for fixed-price contracts is recognized per the proportional method of accounting using an input-based approach. On a given project, actual salary and indirect labor costs incurred are measured and compared against the total estimated costs of such items at the completion of the project. Revenue is recognized based upon the percentage-of-completion calculation of total incurred costs to total estimated costs. The Company infrequently works on fixed-price projects that include significant amounts of material or other non-labor related costs which could distort the percent complete within a percentage-of-completion calculation. The Company’s estimate of the total labor costs it expects to incur over the term of the contract is based on the nature of the project and our past experience on similar projects, and includes management judgments and estimates which affect the amount of revenue recognized on fixed-price contracts in any accounting period.
The Company’s revenue from contracts accounted for under time-and-material, progress billing, and percentage-of-completion methods as a percentage of consolidated revenue for the years ended December 31, 2016, 2015 and 2014 is as follows:
|
|
|
2016 |
|
|
2015 |
|
|
2014 |
|
|||
|
Time-and-material |
|
|
86.5 |
% |
|
|
88.6 |
% |
|
|
86.2 |
% |
|
Progress billing |
|
|
10.8 |
% |
|
|
9.5 |
% |
|
|
11.2 |
% |
|
Percentage-of-completion |
|
|
2.7 |
% |
|
|
1.9 |
% |
|
|
2.6 |
% |
|
Total |
|
|
100.0 |
% |
|
|
100.0 |
% |
|
|
100.0 |
% |
As of December 31, 2016 and 2015, the backlog for fixed-price and all managed-support contracts was approximately $29.7 million and $30.2 million, respectively. Approximately 75% or $22.2 million of the December 31, 2016 backlog is expected to be earned in 2017. Approximately 68% of the $30.2 million of backlog at December 31, 2015, or $20.7 million, was earned in 2016. Revenue is subject to slight seasonal variations, with a minor slowdown and a decrease in billable resource utilization in months of high vacation and legal holidays (July, August, and December). Backlog does not tend to be seasonal; however, it does fluctuate based upon the timing of entry into long-term contracts.
Competition
The IT services market, for both IT solutions and IT staffing services, is highly competitive. The market is also highly fragmented with many providers and no single competitor maintaining clear market leadership. Competition varies by location, the type of service provided, and the client to whom services are provided. The Company’s competition comes from four major channels: large national or international companies, including major accounting and consulting firms and large companies headquartered in India; hardware vendors and suppliers of packaged software systems; small local firms or individuals specializing in specific programming services or applications; and from a client’s internal IT staff. CTG competes against all four of these channels for its share of the market. The Company believes that to compete successfully it is necessary to have a local geographic presence, offer appropriate IT solutions, provide skilled professional resources, and price its services competitively.
Intellectual Property
The Company has registered its symbol and logo with the U.S. Patent and Trademark Office and has taken steps to preserve its rights in other countries where it operates. We regard patents, trademarks, copyrights and other intellectual property as important to our success, and we rely on them in the United States and foreign countries to protect our investments in products and technology. Our patents expire at various times, but we believe that the loss or expiration of any individual patent would not materially affect our business. We, like any other company, may be subject to claims of alleged infringement of the patents, trademarks and other intellectual property rights of third parties from time to time in the ordinary course of business. CTG has entered into agreements with various software and hardware vendors from time to time in the normal course of business, and has capitalized certain costs under software development projects.
4
Employees
CTG’s business depends on the Company’s ability to attract and retain qualified professional staff to provide services to its clients. The Company has a structured recruiting organization that works with its clients to meet their requirements by recruiting and providing high quality, motivated staff. The Company employs approximately 3,400 employees worldwide, with approximately 2,700 in the United States and Canada and 700 in Europe. Of these employees, approximately 3,100 are IT professionals and 300 are individuals who work in sales, recruiting, delivery, administrative and support positions. The Company believes that its relationship with its employees is good. No employees are covered by a collective bargaining agreement or are represented by a labor union. CTG is an equal opportunity employer.
Financial Information About Geographic Areas
The following table sets forth certain financial information relating to the performance of the Company for the years ended December 31, 2016, 2015, and 2014. This information should be read in conjunction with the audited consolidated financial statements and notes thereto included in Item 8, “Financial Statements and Supplementary Data” included in this report.
|
|
|
2016 |
|
|
2015 |
|
|
2014 |
|
|||
|
(amounts in thousands) |
|
|
|
|
|
|
|
|
|
|
|
|
|
Revenue from External Clients: |
|
|
|
|
|
|
|
|
|
|
|
|
|
United States |
|
$ |
253,955 |
|
|
$ |
301,826 |
|
|
$ |
314,500 |
|
|
Belgium (1) |
|
|
35,995 |
|
|
|
35,931 |
|
|
|
44,692 |
|
|
Other European countries |
|
|
34,634 |
|
|
|
31,376 |
|
|
|
33,652 |
|
|
Other country |
|
|
309 |
|
|
|
345 |
|
|
|
424 |
|
|
Total foreign revenue |
|
|
70,938 |
|
|
|
67,652 |
|
|
|
78,768 |
|
|
Total revenue |
|
$ |
324,893 |
|
|
$ |
369,478 |
|
|
$ |
393,268 |
|
|
Operating Income (loss): |
|
|
|
|
|
|
|
|
|
|
|
|
|
United States |
|
$ |
(35,739 |
) |
|
$ |
8,922 |
|
|
$ |
14,196 |
|
|
Luxembourg (2) |
|
|
2,943 |
|
|
|
2,720 |
|
|
|
2,446 |
|
|
Other European countries |
|
|
(574 |
) |
|
|
(1,041 |
) |
|
|
477 |
|
|
Other countries |
|
|
23 |
|
|
|
36 |
|
|
|
33 |
|
|
Total foreign operating income |
|
|
2,392 |
|
|
|
1,715 |
|
|
|
2,956 |
|
|
Total operating income (loss) |
|
$ |
(33,347 |
) |
|
$ |
10,637 |
|
|
$ |
17,152 |
|
|
Total Assets: |
|
|
|
|
|
|
|
|
|
|
|
|
|
United States |
|
$ |
91,117 |
|
|
$ |
133,214 |
|
|
$ |
138,996 |
|
|
Belgium (1) |
|
|
14,562 |
|
|
|
13,904 |
|
|
|
15,382 |
|
|
Luxembourg (2) |
|
|
18,842 |
|
|
|
13,988 |
|
|
|
13,985 |
|
|
Other European countries |
|
|
1,533 |
|
|
|
1,838 |
|
|
|
1,693 |
|
|
Other countries |
|
|
861 |
|
|
|
133 |
|
|
|
189 |
|
|
Total foreign assets |
|
|
35,798 |
|
|
|
29,863 |
|
|
|
31,249 |
|
|
Total assets |
|
$ |
126,915 |
|
|
$ |
163,077 |
|
|
$ |
170,245 |
|
|
(1) |
Revenue and assets for our Belgium operations have been disclosed separately as they exceed 10% of the consolidated balances in at least one of the years presented. |
|
(2) |
Operating income and total assets for our Luxembourg operations have been disclosed separately as they exceed 10% of the consolidated balance in at least one of the years presented. |
Available Company Information
The Company’s annual reports on Form 10-K, quarterly reports on Form 10-Q, current reports on Form 8-K, and all amendments to those reports filed or furnished pursuant to Section 13(a) or 15(d) of the Securities Exchange Act of 1934 (Exchange Act), and reports pertaining to the Company filed under Section 16 of the Exchange Act are available without charge on the Company’s website at www.ctg.com as soon as reasonably practicable after the Company electronically files the information with, or furnishes it to, the SEC. The Company’s code of ethics (Code of Conduct), committee charters and governance policies are also available without charge on the Company’s website at http://investors.ctg.com/governance.cfm. If applicable, the Company intends to disclose future amendments to, or waivers from, certain provisions of the Code of Conduct on the Company's website or in a current report on Form 8-K.
5
The following risk factors should be read carefully in connection with evaluating our business and the forward-looking information contained in this Annual Report on Form 10-K. The risk factors below represent what we believe are the known material risk factors with respect to the Company and our business. Any of the following risks could materially adversely affect our business, our operations, the industry in which we operate, our financial position or our future financial results.
Our business depends on the availability of a large number of highly qualified IT professionals, sales and management personnel, and our ability to recruit and retain these individuals.
We actively compete with many other IT service providers for qualified personnel, including professional IT staff, recruiters, sales people, and management. The availability of qualified personnel may affect our future ability to provide services and meet the requirements of our clients. An inability to fulfill client requirements at agreed upon rates due to a lack of available qualified personnel may adversely impact our revenue and operating results in the future.
Increased competition and the bargaining power of our large clients may cause our billing rates to decline, which would have an adverse effect on our revenue and, if we are unable to control our personnel costs accordingly, on our margins and operating results.
We have experienced reductions in the rates we bill some of our larger clients for services due to highly competitive market conditions. Additionally, we actively compete against many other companies for business at both new and existing clients. Billing rate reductions or competitive pressures may lead to a further decline in revenue. When faced with such pressures, if we are unable to make commensurate reductions in our personnel costs, our margins and operating results would be adversely affected.
We derive a significant portion of our revenue from two clients, and a significant reduction in the amount of requirements requested by these clients would have an adverse effect on our revenue and operating results.
IBM and SDI are CTG’s two largest clients. CTG provides services to various IBM divisions in a number of locations. SDI acts as a vendor manager for Lenovo, and all of the Company's revenue generated through SDI relates to CTG employees working at various divisions of Lenovo. During 2014, the National Technical Services Agreement (NTS Agreement) with IBM was renewed for three years until December 31, 2017. In 2016, 2015, and 2014, IBM accounted for $98.4 million or 30.3%, $99.2 million or 26.9%, and $90.5 million or 23.0% of the Company’s consolidated revenue, respectively. SDI accounted for $34.5 million or 10.6%, $44.0 million or 11.9%, and $36.6 million or 9.3% of the Company's consolidated revenue, respectively, during these periods. The Company’s accounts receivable from IBM at December 31, 2016 and 2015 amounted to $28.0 million and $26.4 million, respectively, and accounts receivable from SDI amounted to $5.6 million and $5.5 million, respectively.
During the 2016 third quarter, the Company was informed by IBM that there would be significant reductions in both requirements and billable rates for certain of the employees provided to this client beginning in the 2016 fourth quarter. Originally, these employee reductions could have totaled as much as 40% of the revenue earned from IBM. However, CTG was able to negotiate to retain a number of these requirements, although many of the retained employees were subject to reductions in billable rates. If IBM or Lenovo were to significantly reduce their requirements for the Company's services in future periods, our revenue and operating results would be adversely affected.
Our client contracts generally have a short term or are terminable on short notice, and a significant number of failures to renew contracts in place, or early terminations or renegotiations of our existing client contracts could adversely affect our results of operations.
Our clients typically retain us on a non-exclusive, engagement-by-engagement basis, rather than under exclusive long-term contracts. We performed 86.5% of our services on a time-and-materials basis during 2016. As such, our clients generally have the right to terminate a contract with us upon written notice without the payment of any financial penalty. Client projects may involve multiple engagements or stages, and there is a risk that a client may choose not to retain us for additional stages of a project, or that a client will cancel or delay additional planned engagements. These terminations, cancellations or delays could result from factors that are beyond our control and are unrelated to our work product or the progress of the project, but could be related to business or financial conditions of the client, changes in client strategies or the economy in general. When contracts are terminated, we lose the anticipated future revenue and we may not be able
6
to eliminate the associated costs required to support those contracts in a timely manner. Consequently, our operating results in subsequent periods may be lower than expected. Our clients can cancel or reduce the scope of their engagements with us on short notice. If they do so, we may be unable to reassign our professionals to new engagements without delay. The cancellation or reduction in scope of an engagement could, therefore, reduce the utilization rate of our professionals, which would have a negative impact on our business, financial condition, and results of operations. As a result of these and other factors, our past financial performance should not be relied on as a guarantee of similar or improved future performance. Due to these factors, we believe that our results from operations in the future may fluctuate from period to period.
The introduction of new IT services or changes in client requirements for IT services may render our existing IT Solutions or IT Staffing offerings obsolete or unnecessary, which, if we are unable to keep pace with these corresponding changes, could have an adverse effect on our business.
Our success depends, in part, on our ability to implement and deliver IT Solutions or IT and other staffing services that anticipate and keep pace with rapid and continuing changes in technology, industry standards and client preferences and requirements. We may not be successful in anticipating or responding to these developments on a timely basis, and our offerings may not be successful in the marketplace. Also, services, solutions and technologies developed by our competitors may make our solutions or staffing offerings uncompetitive or obsolete. Any one of these circumstances could have a material adverse effect on our ability to obtain and successfully complete client engagements.
We could be subject to liability and damage to our reputation resulting from cyber attacks or data breaches.
Cyber risks for companies providing information technology (IT) and professional services, especially in healthcare-related and financial services industries, continue to increase. This increase in risk may be attributed to the value of intellectual property, the value of personal information or data used for identity theft and fraud, the increasing sophistication of attacks, the variety of threat actors and their motives such as organized crime, hackers, terrorists, activists, insider threats, foreign governments, and third parties, and the reliance on electronic communications, mobile technologies, cloud-based resources, smart devices, and emerging technologies. The Company’s operations, business, and its customers rely on the secure processing, transmission, storage and availability of information, services, and resources provided by its IT environments. The Company’s complex IT environments support a variety of technologies, industries, services, delivery teams, and clients globally.
Although the Company has not experienced any prior material data breaches or cyber security incidents, its environments may be impacted by cyber attacks or cyber security incidents caused via the aforementioned threat actors or the Company's personnel. These cyber security incidents could result in information loss, result in the disruption of the Company's internal and client-facing operations and services, adversely affect its adherence with regulatory requirements, or result in a data breach. Information losses and data breaches could include the unauthorized disclosure, misuse, loss, and destruction of both the Company’s and its clients’ intellectual property, financial information, or other regulated or privacy-related information, including but not limited to United States-designated personally identifiable information (PII), personal data under the European General Data Protection Directive (GDPR), and protected health information (PHI) under the United States Health Insurance Portability and Accountability Act of 1996 (HIPAA).
The Company’s failure to protect sensitive data and reasonably address the requirements of regulated data under its control could result in reputational damage, fines and penalties, litigation costs, external investigations, compensation costs including reimbursement and monetary awards, and/or additional compliance costs which could have a material, adverse impact on the Company's operations. It could also have an adverse impact on the Company’s ability to maintain and execute new contracts with clients that produce or work with similar data, and make it more difficult to retain and recruit qualified personnel to perform its services in the future. As the cyber threat landscape continues to evolve or the Company’s cyber risk profile changes, it may be required to expend additional resources to implement new or enhance existing risk mitigation strategies.
The foreign currency exchange, legislative, tax, regulatory and economic risks associated with international operations could have an adverse effect on our operating results if we are unable to mitigate or hedge these risks.
We have operations in the United States and Canada in North America, in Belgium, Luxembourg, and the United Kingdom in Europe, and in India. Although our foreign operations conduct their business in their local currencies, these operations are subject to their own currency fluctuations, legislation, employment and tax law changes, and economic climates. These factors as they relate to our foreign operations are different than those of the United States. Although we actively manage these foreign operations with local management teams, our overall operating results may be negatively affected by local economic conditions, changes in foreign currency exchange rates, or tax, regulatory or other economic changes beyond our control.
7
Government cuts in healthcare programs, such as Medicare, and delays in legislative or regulatory healthcare mandates could cause a reduction in IT spending by our healthcare clients, which could materially and adversely affect our revenue and results of operations.
The Company’s growth efforts have previously been primarily focused in the healthcare market. Growth in this market depends on continued spending by our healthcare clients on IT projects. Cuts in government healthcare programs, such as sequestration, which cut Medicare reimbursements to hospitals and health systems in April 2013, may result in reduced expenditures by our healthcare clients on IT projects. If further government cuts in healthcare programs were to occur, whether due to the failure of Congress to adopt a budget, pass appropriations bills or raise the U.S. debt ceiling or for other reasons, there may be delays, reductions or cessation of funding to our clients, which could cause our clients to purchase less IT services from us, which could materially and adversely affect our revenue and results of operations.
In addition, delays in implementation of legislative or regulatory healthcare mandates could adversely affect the IT spending by our healthcare clients to implement such mandates. If the implementation of existing or contemplated legislative or regulatory healthcare mandates are deferred, the resulting reduction in IT spending by our healthcare clients could materially and adversely affect our revenue and results of operations.
Changes in government regulations and laws affecting the IT services industry, and the industries in which our clients operate, including accounting principles and interpretations, and the taxation of domestic operations could adversely affect our results of operations.
Changing laws, regulations and standards relating to corporate governance and public disclosure, including the Sarbanes-Oxley Act of 2002, the Dodd-Frank Wall Street Reform and Consumer Protection Act, the Patient Protection and Affordable Care Act (PPACA), and new SEC regulations, create uncertainty for companies such as ours. These new or updated laws, regulations and standards are subject to varying interpretations which, in many instances, is due to their lack of specificity. As a result, the application of these new standards and regulations in practice may evolve over time as new guidance is provided by regulatory and governing bodies. This could result in continuing uncertainty regarding compliance matters and higher costs necessitated by ongoing revisions to disclosure and governance practices. We are committed to maintaining high standards of corporate governance and public disclosure. As a result, our efforts to comply with evolving laws, tax regulations and other standards have resulted in, and are likely to continue to result in, increased general and administrative expenses and a diversion of management time and attention from revenue-generating activities to compliance activities. In particular, our continuing efforts to comply with Section 404 of the Sarbanes-Oxley Act of 2002 and the related regulations regarding our required assessment of our internal controls over financial reporting and our independent auditors’ audit of internal control require the commitment of significant internal, financial and managerial resources.
The Financial Accounting Standards Board (FASB), the SEC, and the Public Company Accounting Oversight Board (PCAOB) or other accounting rule making authorities have issued and may continue to issue new accounting rules or auditing standards that are different than those that we presently apply to our financial results. Such new accounting rules or auditing standards could require significant changes from the way we currently report our financial condition, results of operations or cash flows.
U.S. generally accepted accounting principles have been the subject of frequent changes in interpretations. As a result of the enactment of the Sarbanes-Oxley Act of 2002 and the review of accounting policies by the SEC as well as by national and international accounting standards bodies, the frequency of future accounting policy changes may accelerate. Such future changes in financial accounting standards may have a significant effect on our reported results of operations, including results of transactions entered into before the effective date of the changes.
We are subject to income and other taxes in the United States (federal and state) and numerous foreign jurisdictions. Our provisions for income and other taxes and our tax liabilities in the future could be adversely affected by numerous factors. These factors include, but are not limited to, income before taxes being lower than anticipated in countries with lower statutory tax rates and higher than anticipated in countries with higher statutory tax rates, changes in the valuation of deferred tax assets and liabilities, and changes in various federal, state and international tax laws, regulations, accounting principles or interpretations thereof, which could adversely impact our financial condition, results of operations and cash flows in future periods.
8
Existing and potential clients may outsource or consider outsourcing their IT requirements to foreign countries in which we may not currently have operations, which could have an adverse effect on our ability to obtain new clients or retain existing clients.
In recent years, more companies have started using, or are considering using, low cost offshore outsourcing centers to perform technology-related work and complete projects. Currently, we have partnered with clients to perform services outside of North America to mitigate and reduce this risk to our Company. However, the risk of additional outsourcing of IT solutions overseas to countries where we do not have operations could have a material, negative impact on our future operations.
Decreases in demand for IT Solutions and IT and Other Staffing services in the future would cause an adverse effect on our revenue and operating results.
The Company’s revenue and operating results are significantly affected by changes in demand for its services. In the past, when the world economy deteriorated, such as in 2008, there was a significant decline in demand for the Company’s services which negatively affected the Company’s revenue and operating results as compared with prior years. Declines in demand for the requirement for our IT services in 2017 or future years would adversely affect our operating results as it has in the past.
The IT services industry is highly competitive and fragmented, which means that our clients have a number of choices for providers of IT services and we may not be able to compete effectively.
The market for our services is highly competitive. The market is fragmented, and no company holds a dominant position. Consequently, our competition for client requirements and experienced personnel varies significantly by geographic area and by the type of service provided. Some of our competitors are larger and have greater technical, financial, and marketing resources and greater name recognition than we have in the markets we collectively serve. In addition, clients may elect to increase their internal IT systems resources to satisfy their custom software development and integration needs. Finally, our industry is being impacted by the growing use of lower-cost offshore delivery capabilities (primarily India and other parts of Asia). There can be no assurance that we will be able to continue to compete successfully with existing or future competitors or that future competition will not have a material adverse effect on our results of operations and financial condition.
If we are unable to collect our receivables or unbilled services, our results of operations, financial condition and cash flows could be adversely affected.
Our business depends on our ability to successfully obtain payment from our clients of the amounts they owe us for work performed. We evaluate the financial condition of our clients and typically bill and collect on reasonable cycles. We might, however, not accurately assess the creditworthiness of our clients, or macroeconomic conditions could also result in financial difficulties for our clients, including bankruptcy and insolvency. In certain industries, some clients have requested longer payment terms, which has adversely affected, and may continue to adversely affect, our cash flows. The timely collection of client balances also depends on our ability to complete our contractual commitments as required. If we are unable to meet our commitments, or bill our clients on a timely basis, our results of operations and cash flows could be adversely affected. We have established allowances for losses of receivables and unbilled services where we deem the amounts to be uncollectible. The uncollectible amounts due to the Company from clients could differ from those that we currently anticipate.
Our share price could fluctuate and be difficult to predict.
Our share price has fluctuated in the past and could continue to fluctuate in the future in response to various factors, both external and internal. These factors include:
|
|
• |
changes in macroeconomic or political factors unrelated to our business in the geographies in which we operate |
|
|
• |
general or industry-specific market conditions or changes in financial markets |
|
|
• |
our failure to meet our growth or financial objectives (including revenue, operating margins, and earnings per share targets) |
|
|
• |
our ability to generate cash flow to return cash to our shareholders at historical levels or levels expected by our shareholders |
9
|
|
• |
announcements by us or competitors about developments in our business or prospects |
|
|
• |
projections or speculation about our business by the media or investment analysts |
If we repatriate our cash balances from our foreign operations, we may be subject to additional tax liabilities.
We earn a portion of our operating income outside of the United States, and any repatriation of funds currently held in foreign jurisdictions to the United States may result in higher effective tax rates and additional tax liabilities for the Company. In addition, there have been proposals to change the tax laws in the United States that would significantly impact how United States-based multinational corporations are taxed on foreign earnings. Although we cannot predict whether or in what form, or in what time frame, any proposed legislation may be passed, if enacted, these tax laws could have a material adverse impact on our tax expense and cash flows.
Ineffective internal controls could impact the Company's business and operating results.
The Company's internal control over financial reporting may not prevent or detect misstatements because of the inherent limitations of internal controls, including the possibility of human error, the circumvention or overriding of controls, poorly designed or ineffective controls, or fraud. Internal controls that are deemed to be effective can provide only reasonable assurance with respect to the preparation and fair presentation of the Company's financial statements. If the Company fails to maintain the adequacy of its internal controls, including the failure to implement new or improve existing controls, or fails to properly execute or properly test these controls, the Company's business and operating results could be negatively impacted and the Company could fail to meet its financial reporting obligations.
Changing economic conditions and the effect of such changes on accounting estimates could have a material impact on our results of operations.
The Company has also made a number of estimates and assumptions relating to the reporting of its assets and liabilities and the disclosure of contingent assets and liabilities to prepare its consolidated financial statements pursuant to the rules and regulations of the SEC and other accounting rulemaking authorities. Such estimates primarily relate to the valuation of stock options for recording equity-based compensation expense, allowances for doubtful accounts receivable, investment valuation, discount rates associated with pension plans, incurred but not recorded claims related to the Company's self-insured medical plan, valuation allowances for deferred tax assets, legal matters, other contingencies and estimates of progress toward completion and direct profit or loss on contracts, as applicable. As future events and their effects cannot be determined with precision, actual results could differ from these estimates. Changes in the economic climates in which the Company operates may affect these estimates and will be reflected in the Company’s financial statements in the event they occur. Such changes could result in a material impact on the Company’s results of operations.
Risks to the Company from acquisitions include integration challenges, disruptions of the Company's core business, a failure to achieve objectives, and the assumption of liabilities.
The Company regularly evaluates acquisitions to aid the Company's growth in revenue and profits by expanding the services the Company offers, and its client base. Acquisitions often present significant challenges and risks relating to the integration of the business into the Company, and there can be no assurances that the Company will manage future acquisitions successfully, that the Company's core business will not be significantly disrupted after an acquisition is finalized, or that strategic acquisition opportunities will be available to the Company on acceptable terms. The risks from an acquisition include the Company failing to achieve strategic objectives and anticipated revenue and profit improvements, borrowing a significant amount of money to fund the acquisitions which creates financial stress for the Company's operations, as well as failing to retain the key personnel of the acquired business. Finally, the assumption of liabilities related to litigation or other legal proceedings involving the acquired business may present a significant risk.
We may require additional capital to support our business, and this capital may not be available to us on acceptable terms, if at all.
We have a revolving line of credit of up to $40 million available to us. At December 31, 2016, we had $4.7 million of borrowings outstanding under our revolving credit line. We may be dependent on our revolving credit facility to meet working capital and operational requirements, and access to our facility is dependent on, among other things, compliance with applicable covenants, including a leverage ratio (total outstanding debt divided by earnings before interest taxes, depreciation and amortization), a calculation of minimum tangible net worth, and a limit on annual expenditures for
10
property, equipment, and capitalized software. The amount available for borrowing under the credit facility could be significantly reduced due to poor operational performance, or other factors. Any loss or material reduction of our ability to access funds under the credit facility could materially and negatively impact our liquidity.
None.
The Company owns and occupies its headquarters building at 800 Delaware Avenue, and an office building at 700 Delaware Avenue, both located in Buffalo, New York. These buildings are operated by CTG of Buffalo, a subsidiary of the Company which is part of the Company’s North American operations. The corporate headquarters consists of approximately 48,000 square feet and is occupied by corporate administrative operations. The office building consists of approximately 42,000 square feet and is also occupied by corporate administrative operations. At December 31, 2016, these properties were not used as collateral as part of the Company’s existing revolving credit agreement.
During 2016, the Company listed both its corporate headquarters and corporate administrative office building as management is exploring a potential sale, for an amount in excess of $3.0 million each. As the carrying value of these buildings is approximately $1.2 million and $1.8 million at December 31, 2016, respectively, the Company does not expect to record a loss on the sale of either of these buildings if they are sold.
All of the remaining Company locations, totaling approximately 20 sites, are leased facilities. Most of these facilities are located in the United States, with approximately four of these locations in Europe in the countries of Belgium, Luxembourg and the United Kingdom, where our European operations are located, and one in Hyderabad, India. These facilities generally serve as sales and support offices and their size varies with the number of people employed at each office, ranging from 300 to 26,000 square feet. The Company’s lease terms generally vary from periods of less than a year to five years and typically have flexible renewal options. The Company believes that its presently owned and leased facilities are adequate to support its current and anticipated future needs.
The Company and its subsidiaries are involved from time to time in various legal proceedings arising in the ordinary course of business. Although the outcome of lawsuits or other proceedings involving the Company and its subsidiaries cannot be predicted with certainty and the amount of any liability that could arise with respect to such lawsuits or other proceedings cannot be predicted accurately, management does not expect these matters, if any, to have a material adverse effect on the financial position, results of operations, or cash flows of the Company.
Not applicable.
11
|
Item 5. |
Market for Registrant’s Common Equity, Related Stockholder Matters and Issuer Purchases of Equity Securities |
Stock Market Information
The Company’s common stock is traded on The NASDAQ Stock Market LLC under the symbol CTG. The following table sets forth the high and low sales prices for the Company’s common stock for each quarter of the previous two years.
|
Stock Price |
|
High |
|
|
Low |
|
||
|
Year Ended December 31, 2016 |
|
|
|
|
|
|
|
|
|
Fourth Quarter |
|
$ |
4.99 |
|
|
$ |
3.87 |
|
|
Third Quarter |
|
$ |
5.54 |
|
|
$ |
4.42 |
|
|
Second Quarter |
|
$ |
5.69 |
|
|
$ |
4.90 |
|
|
First Quarter |
|
$ |
6.71 |
|
|
$ |
4.70 |
|
|
Year Ended December 31, 2015 |
|
|
|
|
|
|
|
|
|
Fourth Quarter |
|
$ |
7.72 |
|
|
$ |
6.11 |
|
|
Third Quarter |
|
$ |
8.41 |
|
|
$ |
6.11 |
|
|
Second Quarter |
|
$ |
8.41 |
|
|
$ |
7.31 |
|
|
First Quarter |
|
$ |
9.69 |
|
|
$ |
7.27 |
|
On February 17, 2017, there were 2,096 holders of record of the Company’s common shares. The Company paid a quarterly dividend of $0.06 per common share during 2015, and for the first three quarters of 2016. The dividend was suspended in the 2016 fourth quarter. At December 31, 2016, as per the Company's revolving line of credit, the Company is required to meet certain financial covenants in order to pay dividends. The Company was in compliance with these financial covenants at both December 31, 2016 and 2015. For additional information regarding these financial covenants, see Item 7, "Management's Discussion and Analysis of Financial Condition and Results of Operations - Financial Condition and Liquidity." The determination of the timing, amount and the payment of dividends, if any, on the Company’s common stock in the future is at the discretion of the Board of Directors and will depend upon, among other things, the Company’s profitability, liquidity, financial condition, capital requirements, and compliance with the covenants under the Company's revolving credit agreement.
For information concerning common stock issued in connection with the Company’s equity compensation plans, see Item 12, “Security Ownership of Certain Beneficial Owners and Management and Related Stockholder Matters.”
Issuer Purchases of Equity Securities
During the 2016 fourth quarter, the Company’s Board of Directors authorized the repurchase of up to $10.0 million of its stock over the next two years. This share repurchase authorization replaces the Company’s previous share repurchase program. The information below does not include shares withheld by or surrendered to the Company either to satisfy the exercise cost for the cashless exercise of employee stock options, or to satisfy tax withholding obligations associated with employee equity awards as the number of shares is minor.
|
|
|
|
|
|
|
|
|
|
|
Total Number |
|
|
Maximum |
|
||
|
|
|
|
|
|
|
|
|
|
|
of Shares |
|
|
Dollar Amount |
|
||
|
|
|
Total |
|
|
Average |
|
|
Purchased as |
|
|
that May Yet |
|
||||
|
|
|
Number |
|
|
Price |
|
|
Part of Publicly |
|
|
be Purchased |
|
||||
|
|
|
of Shares |
|
|
Paid per |
|
|
Announced Plans |
|
|
Under the Plans |
|
||||
|
Period |
|
Purchased |
|
|
Share* |
|
|
or Programs |
|
|
Or Programs |
|
||||
|
October 1 - October 31 |
|
|
— |
|
|
$ |
— |
|
|
|
— |
|
|
$ |
— |
|
|
November 1 - November 30 |
|
|
93,317 |
|
|
$ |
4.14 |
|
|
|
93,317 |
|
|
$ |
9,613,347 |
|
|
December 1 - December 31 |
|
|
194,035 |
|
|
$ |
4.35 |
|
|
|
194,035 |
|
|
$ |
8,769,974 |
|
|
Total |
|
|
287,352 |
|
|
$ |
4.28 |
|
|
|
287,352 |
|
|
|
|
|
|
|
|
|
|
|
|
|
|
|
|
|
|
|
|
|
|
|
|
* Excludes broker commissions |
|
|
|
|
|
|
|
|
|
|
|
|
|
|
|
|
12
Company Performance Graph
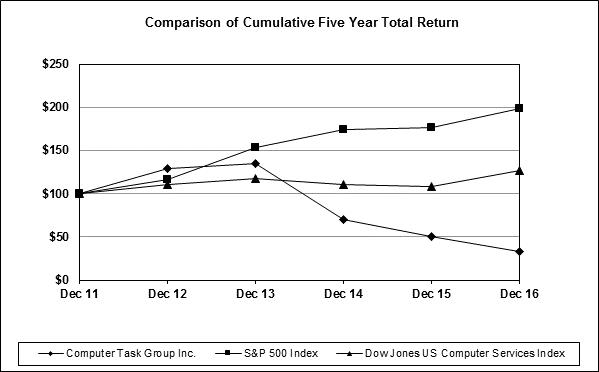
The following graph displays a five-year comparison of cumulative total shareholder returns for the Company’s common stock, the S&P 500 Index, and the Dow Jones U.S. Computer Services Index, assuming a base index of $100 at the end of 2011. The cumulative total return for each annual period within the five years presented is measured by dividing (1) the sum of (A) the cumulative amount of dividends for the period, assuming dividend reinvestment, and (B) the difference between the Company’s share price at the end and the beginning of the period by (2) the share price at the beginning of the period. The calculations were made excluding trading commissions and taxes.
|
|
|
Base Period |
|
|
Indexed Returns Years Ending |
|
||||||||||||||||||
|
|
|
December |
|
|
December |
|
|
December |
|
|
December |
|
|
December |
|
|
December |
|
||||||
|
|
|
2011 |
|
|
2012 |
|
|
2013 |
|
|
2014 |
|
|
2015 |
|
|
2016 |
|
||||||
|
Computer Task Group, Inc. |
|
$ |
100.00 |
|
|
$ |
129.47 |
|
|
$ |
135.11 |
|
|
$ |
69.68 |
|
|
$ |
50.11 |
|
|
$ |
33.05 |
|
|
S&P 500 Index |
|
$ |
100.00 |
|
|
$ |
116.00 |
|
|
$ |
153.57 |
|
|
$ |
174.60 |
|
|
$ |
177.01 |
|
|
$ |
198.18 |
|
|
Dow Jones U.S. Computer Services Index |
|
$ |
100.00 |
|
|
$ |
110.02 |
|
|
$ |
116.90 |
|
|
$ |
110.70 |
|
|
$ |
108.02 |
|
|
$ |
126.86 |
|
The information included under this section entitled “Company Performance Graph” is deemed not to be “soliciting material” or “filed” with the SEC, is not subject to the liabilities of Section 18 of the Exchange Act, and shall not be deemed incorporated by reference into any of the filings previously made or made in the future by the Company under the Exchange Act or the Securities Act of 1933, except to the extent the Company specifically incorporates any such information into a document that is filed.
13
Consolidated Summary—Five-Year Selected Financial Information
The selected operating data and financial position information set forth below for each of the years in the five-year period ended December 31, 2016 has been derived from the Company’s audited consolidated financial statements. This information should be read in conjunction with the audited consolidated financial statements and notes thereto included in Item 8, “Financial Statements and Supplementary Data” included in this report.
|
|
|
2016 |
|
|
2015 |
|
|
2014 |
|
|
2013 |
|
|
2012 |
|
|||||
|
(amounts in millions, except per-share data) |
|
(1) |
|
|
(2) |
|
|
(3) |
|
|
|
|
|
|
(4) |
|
||||
|
Operating Data |
|
|
|
|
|
|
|
|
|
|
|
|
|
|
|
|
|
|
|
|
|
Revenue |
|
$ |
324.9 |
|
|
$ |
369.5 |
|
|
$ |
393.3 |
|
|
$ |
419.0 |
|
|
$ |
424.4 |
|
|
Operating income (loss) |
|
$ |
(33.3 |
) |
|
$ |
10.6 |
|
|
$ |
17.2 |
|
|
$ |
24.7 |
|
|
$ |
24.5 |
|
|
Net income (loss) |
|
$ |
(34.6 |
) |
|
$ |
6.5 |
|
|
$ |
10.4 |
|
|
$ |
15.7 |
|
|
$ |
16.2 |
|
|
Basic net income (loss) per share |
|
$ |
(2.22 |
) |
|
$ |
0.42 |
|
|
$ |
0.68 |
|
|
$ |
1.02 |
|
|
$ |
1.07 |
|
|
Diluted net income (loss) per share |
|
$ |
(2.22 |
) |
|
$ |
0.41 |
|
|
$ |
0.64 |
|
|
$ |
0.92 |
|
|
$ |
0.96 |
|
|
Cash dividend per share |
|
$ |
0.18 |
|
|
$ |
0.24 |
|
|
$ |
0.24 |
|
|
$ |
0.20 |
|
|
$ |
— |
|
|
|
|
|
|
|
|
|
|
|
|
|
|
|
|
|
|
|
|
|
|
|
|
Financial Position |
|
|
|
|
|
|
|
|
|
|
|
|
|
|
|
|
|
|
|
|
|
Working capital |
|
$ |
53.7 |
|
|
$ |
53.0 |
|
|
$ |
69.2 |
|
|
$ |
67.5 |
|
|
$ |
63.5 |
|
|
Total assets |
|
$ |
126.9 |
|
|
$ |
163.1 |
|
|
$ |
170.2 |
|
|
$ |
174.4 |
|
|
$ |
166.2 |
|
|
Long-term debt |
|
$ |
4.7 |
|
|
$ |
1.2 |
|
|
$ |
— |
|
|
$ |
— |
|
|
$ |
— |
|
|
Shareholders’ equity |
|
$ |
78.8 |
|
|
$ |
117.7 |
|
|
$ |
111.0 |
|
|
$ |
113.8 |
|
|
$ |
102.8 |
|
|
(1) |
During 2016, the Company incurred $37.3 million related to goodwill impairment charges, and $1.5 million for severance charges for two former executives, which reduced operating income by a total of $38.8 million. These charges increased net loss by $38.3 million and basic and diluted loss per share by $2.45. |
|
(2) |
During 2015, the Company incurred approximately $1.1 million of costs relating to the disposal of one of the Company's capitalized software projects. The Company also incurred approximately $1.2 million of costs relating to severance charges in Europe. In total, these costs reduced operating income by $2.3 million, net income by $1.2 million, and basic and diluted net income per share by $0.08. |
Included in net income is $0.2 million from a non-taxable life insurance gain for a former executive that passed away in 2015.
|
(3) |
During 2014, the Company incurred $2.0 million in costs associated with the death of the Company's Chairman and CEO under his employment agreement. The Company also recorded an impairment charge totaling $1.5 million for capitalized software costs associated with one of its IT solutions. In total, these costs reduced operating income by $3.5 million, net income by $2.2 million, and basic and diluted net income per share by $0.14 and $0.13, respectively. |
|
(4) |
During 2012, the Company received life insurance proceeds upon the death of two of its former executives. In total, the Company received $1.3 million, which is included in net income, and equaled $0.08 basic and diluted net income per share. |
14
Forward-Looking Statements
This annual report on Form 10-K contains forward-looking statements made by the management of Computer Task Group, Incorporated (CTG, the Company or the Registrant) that are subject to a number of risks and uncertainties. These forward-looking statements are based on information as of the date of this report. The Company assumes no obligation to update these statements based on information from and after the date of this report. Generally, forward looking statements include words or phrases such as “anticipates,” “believes,” “estimates,” “expects,” “intends,” “plans,” “projects,” “could,” “may,” “might,” “should,” “will” and words and phrases of similar impact. The forward-looking statements include, but are not limited to, statements regarding future operations, industry trends or conditions and the business environment, and statements regarding future levels of or trends in business strategy and expectations, new business opportunities, cost control initiatives, business wins, market demand, revenue, operating expenses, capital expenditures, and financing. The forward-looking statements are made pursuant to safe harbor provisions of the Private Securities Litigation Reform Act of 1995. Numerous factors could cause actual results to differ materially from those in the forward-looking statements, including the following: (i) the availability to CTG of qualified professional staff, (ii) domestic and foreign industry competition for clients and talent, including technical, sales and management personnel, (iii) increased bargaining power of large clients, (iv) the Company's ability to protect confidential client data, (v) the partial or complete loss of the revenue the Company generates from International Business Machines Corporation (IBM) and SDI International (SDI), (vi) the uncertainty of clients' implementations of cost reduction projects, (vii) the effect of healthcare reform and initiatives, (viii) the mix of work between staffing and solutions, (ix) currency exchange risks, (x) risks associated with operating in foreign jurisdictions, (xi) renegotiations, nullification, or breaches of contracts with clients, vendors, subcontractors or other parties, (xii) the impact of current and future laws and government regulation, as well as repeal or modification of such, affecting the information technology (IT) solutions and staffing industry, taxes and the Company's operations in particular, (xiii) industry and economic conditions, including fluctuations in demand for IT services, (xiv) consolidation among the Company's competitors or clients, (xv) the need to supplement or change our IT services in response to new offerings in the industry or changes in client requirements for IT products and solutions, (xvi) the risks associated with acquisitions, and (xvii) the risks described in Item 1A of this annual report on Form 10-K and from time to time in the Company's reports filed with the Securities and Exchange Commission (SEC).
Industry Trends
The market demand for the Company’s services is heavily dependent on IT spending by major corporations, organizations and government entities in the markets and regions that we serve. The pace of technology advances and changes in business requirements and practices of our clients all have a significant impact on the demand for the services that we provide. Competition for new engagements and pricing pressure has been strong. In 2016 there was a further overall decline in demand for our services as compared with 2015 and 2014 as many of our healthcare clients did not begin new projects when existing projects ended due to their capital constraints. Additionally, the demand for our IT staffing and other services from certain of our large staffing clients diminished throughout 2016.
The Company primarily operates in one industry segment, providing IT services to its clients. These services include IT solutions and IT and other staffing. With IT solutions services, we generally take responsibility for the deliverables on a project and the services may include high-end consulting. When providing IT and other staffing services, we typically supply personnel to our clients who then, in turn, take their direction from the client’s managers. The Company at times provides administrative or warehouse employees to clients to supplement the IT staffing resources we place at those clients.
IT solutions and IT and other staffing revenue as a percentage of consolidated revenue for the years ended December 31, 2016, 2015 and 2014 is as follows:
|
|
|
2016 |
|
|
2015 |
|
|
2014 |
|
|||
|
IT solutions |
|
|
29 |
% |
|
|
33 |
% |
|
|
38 |
% |
|
IT and other staffing |
|
|
71 |
% |
|
|
67 |
% |
|
|
62 |
% |
|
Total |
|
|
100 |
% |
|
|
100 |
% |
|
|
100 |
% |
The Company promotes a majority of its services through five vertical market focus areas: Technology Service Providers, Manufacturing, Healthcare (which includes services provided to healthcare providers, health insurers (payers), and life sciences companies), Financial Services, and Energy. The remainder of CTG’s revenue is derived from general markets.
15
CTG’s revenue by vertical market as a percentage of consolidated revenue for the years ended December 31, 2016, 2015 and 2014 is as follows:
|
|
|
2016 |
|
|
2015 |
|
|
2014 |
|
|||
|
Technology service providers |
|
|
35.2 |
% |
|
|
31.1 |
% |
|
|
26.3 |
% |
|
Manufacturing |
|
|
24.2 |
% |
|
|
25.7 |
% |
|
|
24.0 |
% |
|
Healthcare |
|
|
18.2 |
% |
|
|
23.5 |
% |
|
|
28.6 |
% |
|
Financial services |
|
|
7.7 |
% |
|
|
7.1 |
% |
|
|
7.8 |
% |
|
Energy |
|
|
5.1 |
% |
|
|
5.4 |
% |
|
|
6.1 |
% |
|
General markets |
|
|
9.6 |
% |
|
|
7.2 |
% |
|
|
7.2 |
% |
|
Total |
|
|
100.0 |
% |
|
|
100.0 |
% |
|
|
100.0 |
% |
The IT services industry is extremely competitive and characterized by continuous changes in client requirements and improvements in technologies. Our competition varies significantly by geographic region, as well as by the type of service provided. Many of our competitors are larger than CTG, and have greater financial, technical, sales and marketing resources. In addition, the Company frequently competes with a client’s own internal IT staff. Our industry is being impacted by the growing use of lower-cost offshore delivery capabilities (primarily India and other parts of Asia). There can be no assurance that we will be able to continue to compete successfully with existing or future competitors or that future competition will not have a material adverse effect on our results of operations and financial condition.
Revenue Recognition
The Company recognizes revenue when persuasive evidence of an arrangement exists, when the services have been rendered, when the price is determinable, and when collectibility of the amounts due is reasonably assured. For time-and-material contracts, revenue is recognized as hours are incurred and costs are expended. For contracts with progress billing schedules, primarily monthly, revenue is recognized as services are rendered to the client. Revenue for fixed-price contracts is recognized per the proportional method of accounting using an input-based approach. On a given project, actual salary and indirect labor costs incurred are measured and compared against the total estimated costs of such items at the completion of the project. Revenue is recognized based upon the percentage-of-completion calculation of total incurred costs to total estimated costs. The Company infrequently works on fixed-price projects that include significant amounts of material or other non-labor related costs which could distort the percent complete within a percentage-of-completion calculation. The Company’s estimate of the total labor costs it expects to incur over the term of the contract is based on the nature of the project and our past experience on similar projects, and includes management judgments and estimates which affect the amount of revenue recognized on fixed-price contracts in any accounting period.
The Company’s revenue from contracts accounted for under time-and-material, progress billing, and percentage-of-completion methods as a percentage of consolidated revenue for the years ended December 31, 2016, 2015 and 2014 is as follows:
|
|
|
2016 |
|
|
2015 |
|
|
2014 |
|
|||
|
Time-and-material |
|
|
86.5 |
% |
|
|
88.6 |
% |
|
|
86.2 |
% |
|
Progress billing |
|
|
10.8 |
% |
|
|
9.5 |
% |
|
|
11.2 |
% |
|
Percentage-of-completion |
|
|
2.7 |
% |
|
|
1.9 |
% |
|
|
2.6 |
% |
|
Total |
|
|
100.0 |
% |
|
|
100.0 |
% |
|
|
100.0 |
% |
16
Results of Operations
The table below sets forth percentage information calculated as a percentage of consolidated revenue as reported on the Company’s consolidated statements of operations as included in Item 8, “Financial Statements and Supplementary Data” in this report.
|
Year Ended December 31, |
|
2016 |
|
|
2015 |
|
|
2014 |
|
|||
|
(percentage of revenue) |
|
|
|
|
|
|
|
|
|
|
|
|
|
Revenue |
|
|
100.0 |
% |
|
|
100.0 |
% |
|
|
100.0 |
% |
|
Direct costs |
|
|
81.8 |
% |
|
|
81.8 |
% |
|
|
79.8 |
% |
|
Selling, general and administrative expenses |
|
|
17.0 |
% |
|
|
15.3 |
% |
|
|
15.8 |
% |
|
Goodwill impairment charges |
|
|
11.5 |
% |
|
|
— |
% |
|
|
— |
% |
|
Operating income (loss) |
|
|
(10.3 |
)% |
|
|
2.9 |
% |
|
|
4.4 |
% |
|
Interest and other income (expense), net |
|
|
(0.1 |
)% |
|
|
— |
% |
|
|
(0.1 |
)% |
|
Income (loss) before income taxes |
|
|
(10.4 |
)% |
|
|
2.9 |
% |
|
|
4.3 |
% |
|
Provision for income taxes |
|
|
0.3 |
% |
|
|
1.1 |
% |
|
|
1.7 |
% |
|
Net income (loss) |
|
|
(10.7 |
)% |
|
|
1.8 |
% |
|
|
2.6 |
% |
2016 as compared with 2015
The Company recorded revenue in 2016 and 2015 as follows:
|
Year Ended December 31, |
|
% of total |
|
|
2016 |
|
|
% of total |
|
|
2015 |
|
|
Year-Over- Year Change |
|
|||||
|
(dollars in thousands) |
|
|
|
|
|
|
|
|
|
|
|
|
|
|
|
|
|
|
|
|
|
North America |
|
|
78.3 |
% |
|
$ |
254,264 |
|
|
|
81.8 |
% |
|
$ |
302,171 |
|
|
|
(15.9 |
)% |
|
Europe |
|
|
21.7 |
% |
|
|
70,629 |
|
|
|
18.2 |
% |
|
|
67,307 |
|
|
|
4.9 |
% |
|
Total |
|
|
100.0 |
% |
|
$ |
324,893 |
|
|
|
100.0 |
% |
|
$ |
369,478 |
|
|
|
(12.1 |
)% |
Reimbursable expenses billed to clients and included in revenue totaled $4.0 million and $6.5 million in 2016 and 2015, respectively. The decrease in reimbursable expenses year-over-year is primarily due to a reduction in the number of consultants in our healthcare vertical market, as many of those employees travel to client locations to perform services.
The revenue decrease in North America in 2016 as compared with 2015 was primarily due to a significant decrease in demand for the Company's IT solutions business, primarily in our healthcare vertical market, and a decrease in demand for our IT and other staffing services business from several large clients. The revenue increase in Europe is primarily due to strong demand for the Company’s services in the European markets we serve.
On a consolidated basis, IT solutions revenue decreased $27.3 million or 22.4% in 2016 as compared with 2015. The Company’s healthcare vertical market grew from 2008-2012 primarily from installing electronic health records (EHR) systems in hospitals and health systems. As of today, EHR installations are largely complete within the U.S. healthcare market. Beginning in late 2014, the Company began to see significant reductions in billable resources at a number of its larger healthcare clients which further decreased IT solutions revenue in the Company's healthcare vertical market as existing projects came to an end. This decrease in spending on healthcare IT projects continued throughout 2016 for the clients that we serve. As part of our strategy to shift to non-EHR services, the Company expanded its healthcare IT business development team in 2016 with individuals who have experience selling healthcare IT services such as advisory and technical services, outsourcing, and staff augmentation. However, in 2016 this team as a whole was not successful in reducing our revenue losses in this vertical market, and expanding the non-EHR healthcare related services we provide.
Also on a consolidated basis, IT and other staffing revenue decreased $17.3 million or 7.0% during 2016 as compared with 2015. The IT staffing decrease was primarily due to a decrease in demand from a number of the Company's largest staffing clients. Additionally, during the 2016 third quarter, the Company was informed by its largest client that there would be significant reductions in both requirements and billable rates for certain of the employees provided to this client beginning in the 2016 fourth quarter. Originally, these employee reductions could have totaled as much as 40% of the total revenue earned from this client. However, CTG was able to negotiate the retention of a number of these requirements, although many of the retained employees were subject to reductions in billable rates. The Company reduced its cost structure supporting its staffing clients in the 2016 fourth quarter to partially offset this loss in revenue and reductions in billable rates.
17
The Company’s headcount was approximately 3,400 employees at December 31, 2016, which was a 6% decrease from approximately 3,600 employees at December 31, 2015. Approximately 90% of this headcount is for technical resources, and 10% for support positions.
The increase in revenue in the Company’s European operations in 2016 as compared with the corresponding 2015 period was due to an increase in demand for the Company’s IT solutions services across a number of the vertical markets we serve, partially offset by weakness relative to the U.S. dollar of the currencies of Belgium, Luxembourg, and the United Kingdom, the countries in which the Company’s European subsidiaries operate. In Belgium and Luxembourg, the functional currency is the Euro, while in the United Kingdom the functional currency is the British Pound. In 2016 as compared with 2015, the average value of the Euro decreased 0.3%, and the average value of the British Pound decreased 11.3%. A significant portion of the Company's revenue from its European operations is generated in Belgium and Luxembourg. Had there been no change in these exchange rates from 2015 to 2016, total European revenue would have been approximately $0.6 million higher, or $71.2 million as compared with the $70.6 million reported. When considering the year-over-year change in revenue in constant currencies, revenue from our European operations increased 5.9%. Operating income was essentially unchanged in 2016 as compared with 2015 given the change in the exchange rates year-over-year.
The Company is currently assessing the potential impact, if any, that the United Kingdom’s pending exit from the European Union will have on the Company’s operations. As the total revenue generated by our British subsidiary is immaterial when compared with the Company’s total consolidated revenue, we do not expect the impact of the pending exit to have a material impact on the Company’s operations.
International Business Machines Corporation (IBM) was CTG’s largest client and accounted for $98.4 million or 30.3% and $99.2 million or 26.9% of the Company’s consolidated revenue in 2016 and 2015, respectively. During the 2014 fourth quarter, the NTS Agreement with IBM was renewed for three years until December 31, 2017. As part of the NTS Agreement, the Company also provides its services as a predominant supplier to IBM’s Integrated Technology Services and the Systems and Technology Group business units. This agreement accounted for approximately 89% of all of the services provided to IBM by the Company in 2016. As previously mentioned, although there could have been a significant reduction in the number of requirements from this client beginning in the 2016 fourth quarter, the headcount losses were partially mitigated as of the 2016 year-end, and the expected annual loss in revenue is approximately $15-20 million in 2017. The Company’s accounts receivable from IBM at December 31, 2016 and 2015 totaled $28.0 million and $26.4 million, respectively.
SDI was the Company's second largest client and accounted for $34.5 million or 10.6% and $44.0 million or 11.9% of the Company’s consolidated revenue in 2016 and 2015, respectively. SDI acts as a vendor manager for Lenovo, and all of the Company's revenue generated through SDI relates to CTG employees working at Lenovo. The Company's accounts receivable from SDI at December 31, 2016 and December 31, 2015 totaled $5.6 million and $5.5 million, respectively.
We expect to continue to derive a significant portion of our revenue from IBM and SDI in future years; however a significant decline or the loss of the revenue from these clients would have a significant negative effect on our operating results. No other client accounted for more than 10% of the Company’s revenue in 2016 or 2015.
Direct costs, defined as costs for billable staff including billable out-of-pocket expenses, were 81.8% of consolidated revenue in both 2016 and 2015. In the 2016 second quarter, the Company’s European operations recorded a payroll tax credit totaling approximately $0.7 million which reduced direct costs in 2016. The credited amounts returned certain costs incurred from 2011-2014, and the Company does not anticipate a significant credit in the future. In the 2015 second quarter, the Company recorded several charges totaling $2.1 million which increased direct costs. When considering these items, direct costs as a percentage of revenue in 2016 increased as compared with 2015. This increase was due to the significant shift in the mix of the Company's business to a much higher level of IT staffing revenue. These services are provided to the Company's largest IT staffing clients, which have much higher direct costs as a percentage of revenue as compared with the Company's IT solutions clients.
Selling, general and administrative (SG&A) expenses were 17.0% of revenue in 2016 as compared with 15.3% of revenue in 2015. The increase in SG&A expenses as a percentage of revenue in 2016 as compared with 2015 is primarily due to costs incurred by our operating units as the Company continues to make investments in sales, recruiting and delivery resources in order to focus on the Company’s long-term growth, and the loss of operating leverage from a decrease in revenue. Additionally, severance incurred for the resignation of two former executives totaled $1.5 million and was included in the 2016 results.
18
During the 2016 first quarter, the Company determined that a goodwill impairment indicator existed which required an interim impairment analysis. As a result of the analysis, the Company determined the implied fair value of its goodwill balance was below the carrying value. Accordingly, the Company recorded a non-tax deductible goodwill impairment charge of $21.5 million to reduce the value of its goodwill balance to the implied fair value. Additionally, during the 2016 third quarter, the Company determined that another goodwill impairment indicator existed which required a second interim impairment analysis. As a result of the analysis, the Company determined the implied fair value of its goodwill balance was again below the carrying value. Accordingly, the Company recorded a non-tax deductible goodwill impairment charge of $15.8 million to reduce the value of its goodwill balance to the implied fair value, which reduced the Company’s goodwill balance to $0.0.
The significant decrease in operating income in 2016 was due to the goodwill impairment charges taken in the 2016 first and third quarters totaling $37.3 million. Operating income (loss) was (10.3)% of revenue in 2016 as compared with 2.9% of revenue in 2015. Operating income (loss) from North American operations was reduced by goodwill impairment charges of $35.6 million, and totaled $(35.7) million in 2016 compared with $9.0 million in 2015. Operating income from our European operations was $2.4 million in 2016 compared with $1.7 million in 2015. The 2016 results in Europe were reduced by a goodwill impairment charge of approximately $1.7 million, offset by a payroll tax credit of $0.7 million recorded in the 2016 second quarter.
Other income (expense) was (0.1)% of revenue in 2016 and 0.0% of revenue in 2015. In 2015, the Company recorded a non-taxable life insurance gain of approximately $0.2 million as one of its former executives passed away in the 2015 fourth quarter. The Company received proceeds from the policy totaling approximately $0.4 million in the 2016 first quarter.
The Company’s effective tax rate (ETR) is calculated based upon the full year's operating results, and various tax related items. The Company’s normal ETR ranges from 38% to 40%. The ETR in 2016 was (3.3)%, while the 2015 ETR was 39.3%.
The ETR was lower than the normal range in 2016 primarily due to the non-deductible goodwill impairment charges totaling $37.3 million in the 2016 first and third quarters, and also due to the extension of the Work Opportunity Tax Credit (WOTC) and the Research and Development tax credit (R&D) which were renewed by the U.S. federal government in the 2015 fourth quarter and were effective for all of 2016. These credits totaled approximately $0.6 million.
Net loss for 2016 was (10.7)% of revenue or $(2.22) per diluted share, compared with net income of 1.8% of revenue or $0.41 per diluted share in 2015. Diluted earnings per share were calculated using 15.6 million weighted-average equivalent shares outstanding in 2016 and 15.9 million in 2015. The decrease in shares year-over-year is due to there being no dilutive effect of outstanding equity-based compensation grants in 2016 due to the net loss.
2015 as compared with 2014
The Company recorded revenue in 2015 and 2014 as follows:
|
Year Ended December 31, |
|
% of total |
|
|
2015 |
|
|
% of total |
|
|
2014 |
|
|
Year-Over- Year Change |
|
|||||
|
(dollars in thousands) |
|
|
|
|
|
|
|
|
|
|
|
|
|
|
|
|
|
|
|
|
|
North America |
|
|
81.8 |
% |
|
$ |
302,171 |
|
|
|
80.1 |
% |
|
$ |
314,924 |
|
|
|
(4.0 |
)% |
|
Europe |
|
|
18.2 |
% |
|
|
67,307 |
|
|
|
19.9 |
% |
|
|
78,344 |
|
|
|
(14.1 |
)% |
|
Total |
|
|
100.0 |
% |
|
$ |
369,478 |
|
|
|
100.0 |
% |
|
$ |
393,268 |
|
|
|
(6.0 |
)% |
Reimbursable expenses billed to clients and included in revenue totaled $6.5 million and $8.6 million in 2015 and 2014, respectively. The decrease in reimbursable expenses year-over-year is primarily due to a reduction in the number of consultants in our healthcare vertical market, as many of those employees travel to client locations to perform services.
The revenue decrease in North America in 2015 as compared with 2014 was primarily due to a significant decrease in demand for the Company's IT solutions business, primarily in our healthcare vertical market, offset by a modest increase in demand for our IT and other staffing services business. The revenue decrease in Europe is primarily due to a significant decrease in the value of the Euro and the British pound as compared with the U.S. dollar.
19
On a consolidated basis, IT solutions revenue decreased $27.7 million or 18.5% in 2015 as compared with 2014. The Company's IT solutions healthcare vertical market revenue began to decrease with the sequestration imposed by the U.S. government starting on April 1, 2013, which reduced Medicare reimbursements to hospitals and health systems by 2%. This reduction in revenue for our healthcare clients caused them to significantly reduce planned expenditures for IT services, primarily for electronic health records (EHR) and related projects, beginning in the latter half of 2013. By late 2014 and continuing through all of 2015, the Company experienced significant reductions in billable resources at several of its larger healthcare clients which further decreased IT solutions revenue in the Company's healthcare vertical market as EHR projects come to an end. At the end of 2015, a majority of the EHR implementation projects at our clients were substantially complete.
Also on a consolidated basis, IT and other staffing revenue increased $3.9 million or 1.6% during 2015 as compared with 2014. The year-to-date IT staffing increase was primarily due to an increase in demand from the Company's largest staffing clients. However, demand for our IT staffing services began to slow in the 2015 third quarter, and further slowed in the 2015 fourth quarter (and remained soft in 2016), as our largest IT staffing clients experienced declines in their business and cut back on their IT spending for the Company's services. The Company’s headcount was approximately 3,600 employees at December 31, 2015, which was a 5% decrease from approximately 3,800 employees at December 31, 2014.
The decrease in revenue in the Company’s European operations in 2015 as compared with the corresponding 2014 was due to weakness relative to the U.S. dollar of the currencies of Belgium, Luxembourg, and the United Kingdom, the countries in which the Company’s European subsidiaries operate. In Belgium and Luxembourg, the functional currency is the Euro, while in the United Kingdom the functional currency is the British Pound. In 2015 as compared with 2014, the average value of the Euro decreased 16.5%, while the average value of the British Pound decreased 7.2%. A significant portion of the Company's revenue from its European operations is generated in Belgium and Luxembourg. Had there been no change in these exchange rates from 2014 to 2015, total European revenue would have been approximately $13.0 million higher, or $80.3 million as compared with the $67.3 million reported. When considering the year-over-year change in revenue in constant currencies, the revenue from our European operations increased 2.5%. Operating income would have been approximately $0.4 million higher in 2015 as compared with 2014 if there had been no change in the exchange rates year-over-year.
International Business Machines Corporation (IBM) was CTG’s largest client and accounted for $99.2 million or 26.9% and $90.5 million or 23.0% of the Company’s consolidated revenue in 2015 and 2014, respectively. During the 2014 fourth quarter, the NTS Agreement with IBM was renewed for three years until December 31, 2017. As part of the NTS Agreement, the Company also provides its services as a predominant supplier to IBM’s Integrated Technology Services and the Systems and Technology Group business units. This agreement accounted for approximately 90.0% of all of the services provided to IBM by the Company in 2015.
In January 2014, IBM announced its intention to sell its x86 server division to Lenovo, and the initial closing of that sale occurred on September 29, 2014. A portion of the Company's 2014 revenue from IBM was related to the x86 server division. The Company retained a significant share of the revenue derived from the x86 server division subsequent to the transition of the division from IBM to Lenovo.
The Company’s accounts receivable from IBM at December 31, 2015 and 2014 totaled $26.4 million and $7.8 million, respectively. The increase in accounts receivable is due to the Company removing itself in the 2015 third quarter from an advance pay program with IBM. Under the program, payments due from IBM in 65 days were paid in 15 days for a fee.
SDI was the Company's second largest client and accounted for $44.0 million or 11.9% and $36.6 million or 9.3% of the Company’s consolidated revenue in 2015 and 2014, respectively. SDI acts as a vendor manager for Lenovo, and all of the Company's revenue generated through SDI relates to CTG employees working at Lenovo. The Company's accounts receivable from SDI at December 31, 2015 and December 31, 2014 totaled $5.5 million and $9.2 million, respectively.
We continued to derive a significant portion of our revenue from IBM and SDI in 2016. No other client accounted for more than 10% of the Company’s revenue in 2015 or 2014.
20
Direct costs, defined as costs for billable staff including billable out-of-pocket expenses, were 81.8% of consolidated revenue in 2015 and 79.8% of consolidated revenue in 2014. The increase in direct costs as a percentage of revenue in 2015 compared with 2014 was due to the significant shift in the mix of the Company's business to a much higher level of IT staffing revenue. These services are provided to the Company's largest IT staffing clients, which have much higher direct costs as a percentage of revenue as compared with the Company's IT solutions clients. Additionally, the Company recorded charges totaling $2.3 million in the 2015 second quarter for the impairment of capitalized software ($1.1 million) related to an IT medical model for chronic kidney disease, and for severance charges ($1.2 million) in the Company's European operations. The impairment of the capitalized software occurred after the Company performed a review and determined that it had no net realizable value. Although the Company had previously experienced some sales success with research institutions, the Company has been unable to sell the product to payers, its intended market, and discontinued the effort to sell the technology. Of the total charges of $2.3 million, approximately $2.1 million was recorded in direct costs. Finally, these increases in direct costs in 2015 were partially offset by a reduction of the Company's accrual for fringe benefit costs primarily related to medical expenses of $1.4 million as actual costs incurred in the 2015 fourth quarter were $1.2 million less than those incurred in 2014 fourth quarter, and significantly less than planned.
Selling, general and administrative (SG&A) expenses were 15.3% of revenue in 2015 as compared with 15.8% of revenue in 2014. The SG&A decrease as a percentage of revenue in 2015 as compared with 2014 was primarily due to disciplined cost control, primarily related to the SG&A expenses associated with our operating units, and $2.0 million included in the 2014 balance associated with the death in the 2014 fourth quarter of the Company's Chairman and CEO.
Operating income was 2.9% of revenue in 2015 as compared with 4.4% of revenue in 2014. The decrease in operating income year-over-year was due to the significant decrease in IT solutions in the Company's business mix which has higher margins than the Company's IT and other staffing services, and the charges taken in the 2015 second quarter totaling $2.3 million. In 2014, operating income included costs of $2.0 million associated with the death of the Company's Chairman and CEO, and the software impairment charge of $1.5 million. Operating income from North American operations was $9.0 million and $14.2 million in 2015 and 2014, respectively, while European operations generated operating income of $1.7 million and $2.9 million in the corresponding periods. Operating income in 2015 in the Company’s European operations was reduced by the second quarter severance charge totaling $1.2 million, and would have been approximately $0.4 million higher if there had been no change in foreign currency exchange rates year-over-year.
Other income (expense) was 0.0% of revenue in 2015, and (0.1)% of revenue in 2014. In 2015, the Company recorded a non-taxable life insurance gain of approximately $0.2 million as one of its former executives passed away in the 2015 fourth quarter. The Company received proceeds from the policy totaling about $0.4 million in the 2016 first quarter.
The Company’s effective tax rate (ETR) is calculated based upon the full year's operating results, and various tax related items. The Company’s normal ETR ranges from 38% to 40%. The ETR in 2015 was 39.3%, while the 2014 ETR was 38.9%.
Net income for 2015 was 1.8% of revenue or $0.41 per diluted share, compared with net income of 2.6% of revenue or $0.64 per diluted share in 2014. Diluted earnings per share were calculated using 15.9 million weighted-average equivalent shares outstanding in 2015 and 16.3 million in 2014. The decrease in shares year-over-year is due to a lesser dilutive effect of outstanding equity-based compensation grants in 2015.
Critical Accounting Policies
The preparation of financial statements and related disclosures in conformity with U.S. generally accepted accounting principles requires the Company’s management to make estimates, judgments and assumptions that affect the amounts reported in the consolidated financial statements and accompanying notes. The Company’s significant accounting policies are included in note 1 to the consolidated financial statements contained in this annual report on Form 10-K under Item 8, “Financial Statements and Supplementary Data.” These policies, along with the underlying assumptions and judgments made by the Company’s management in their application, have a significant impact on the Company’s consolidated financial statements. The Company identifies its most critical accounting policies as those that are the most pervasive and important to the portrayal of the Company’s financial position and results of operations, and that require the most difficult, subjective and/or complex judgments by management regarding estimates about matters that are inherently uncertain. The Company’s critical accounting policies are those related to goodwill valuation, and the valuation allowance for deferred income taxes.
21
Goodwill Valuation
The goodwill recorded on the Company's condensed consolidated balance sheet at December 31, 2015 related to CTG’s Healthcare Solutions (CTGHS) reporting unit. In accordance with current accounting guidance for “Intangibles - Goodwill and Other,” the Company performs goodwill impairment testing at least annually (in the Company’s fourth quarter), unless indicators of impairment exist in interim periods. The Company uses the two-step approach to test goodwill for potential impairment. Step One compares the estimated fair value of a reporting unit with goodwill to its carrying value. If the carrying value exceeds the estimated fair value, Step Two must be performed. Step Two compares the carrying value of the reporting unit to the fair value of all of the assets and liabilities of the reporting unit (including any unrecognized intangibles) as if the reporting unit was acquired in a business combination. If the carrying amount of a reporting unit’s goodwill exceeds the implied fair value of its goodwill, an impairment loss is recognized in an amount equal to the excess.
During the 2016 first quarter, the Company determined that a goodwill impairment indicator existed which required an interim impairment analysis. This impairment indicator was a significant and sustained decrease in the Company’s overall market capitalization, as the Company’s stock price in the 2016 first quarter fell by as much as 29% from its value at December 31, 2015. As a result of this indicator, the Company conducted an interim analysis of CTGHS to determine if an impairment existed. In performing the assessment, the Company estimated the fair value of CTGHS based on a combination of the income and market approaches. The income approach uses a discounted cash flow (DCF) method which utilizes the present value of expected future cash flows to estimate fair value of the reporting unit. The future cash flows for CTGHS was projected based on estimates of future revenue, operating income and other factors such as working capital and capital expenditures and a discount rate used in the present value calculation. As part of the projections, the Company took into account expected industry and market conditions for the healthcare industry, as well as trends currently affecting CTGHS. The market approach utilizes multiples of revenue and earnings before interest expense, taxes, depreciation and amortization (EBITDA) to estimate the fair value of the reporting unit. The market multiples used for CTGHS were based on competitor industry data, along with the market multiples for the Company and other factors. The Company also completed a comparison of its overall market capitalization to the market value of CTGHS and the Company’s other non-reporting business units. Based upon the analysis performed, the Company determined that the fair value of CTGHS was less than its carrying value, which required the Company to perform a Step Two goodwill impairment test.
As a result of the first quarter Step Two analysis, the Company determined the implied fair value of its goodwill balance was below the carrying value. Accordingly, the Company recorded a non-tax deductible goodwill impairment charge of $21.5 million to reduce the value of its goodwill balance to the implied fair value.
During the 2016 third quarter, the Company again determined that goodwill impairment indicators existed which required an interim impairment analysis. These impairment indicators were the unexpected decline in the revenue and profits of the CTGHS business unit, the resignation of both the sales leader (who was the Company’s former CEO) and delivery leader of CTGHS in the 2016 third quarter, effectively leaving the business unit without executive leadership, and a continued decrease in the Company’s overall market capitalization. As a result of these indicators, the Company conducted an interim analysis of CTGHS to determine if an impairment existed. In performing the assessment, the Company again performed the procedures it had previously performed in the 2016 first quarter, as detailed above. The most significant changes in our Step One analysis from the first quarter to the third quarter were reductions in the Company’s estimates of future revenue and operating income based upon the unexpected negative trends experienced in the third quarter, as well as the resulting reductions in the revenue and EBITDA market multiples that correlate to the decline in the Company’s overall market capitalization. Based upon the analysis performed, the Company determined that the fair value of CTGHS was less than its carrying value, which required the Company to perform a Step Two goodwill impairment test.
As a result of the third quarter Step Two analysis, the Company determined the implied fair value of its goodwill balance was below the carrying value. Accordingly, the Company recorded a non-tax deductible goodwill impairment charge in the 2016 third quarter of $15.8 million which reduced the value of its goodwill balance to the implied fair value, or $0.0 as of September 30, 2016.
22
Income Taxes—Valuation Allowances on Deferred Tax Assets
At December 31, 2016, the Company had a total of approximately $6.9 million of current and non-current deferred tax assets, net of deferred tax liabilities, recorded on its consolidated balance sheet. The deferred tax assets, net, primarily consist of deferred compensation, loss carryforwards and state taxes. The changes in deferred tax assets and liabilities from period to period are determined based upon the changes in differences between the basis of assets and liabilities for financial reporting purposes and the basis of assets and liabilities for tax purposes, as measured by the enacted tax rates when these differences are estimated to reverse. The Company has made certain assumptions regarding the timing of the reversal of these assets and liabilities, and whether taxable income in future periods will be sufficient to recognize all or a part of any gross deferred tax asset of the Company.
At December 31, 2016, the Company had deferred tax assets recorded resulting from net operating losses in previous years totaling approximately $1.0 million. The Company has analyzed each jurisdiction’s tax position, including forecasting potential taxable income in future periods and the expiration of the net operating loss carryforwards as applicable, and determined that it is unclear whether all of these deferred tax assets will be realized at any point in the future. Accordingly, at December 31, 2016, the Company had offset a portion of these assets with a valuation allowance totaling approximately $0.9 million, resulting in a net deferred tax asset from net operating loss carryforwards of approximately $0.1 million.
The Company’s deferred tax assets and their potential realizability are evaluated each quarter to determine if any changes should be made to the valuation allowance. Any change in the valuation allowance in the future could result in a change in the Company’s ETR. A 1% change in the ETR in 2016 would have increased or decreased net loss by approximately $335,000, or approximately $0.02 per diluted share.
Other Estimates
The Company has also made a number of estimates and assumptions relating to the reporting of its assets and liabilities and the disclosure of contingent assets and liabilities to prepare the consolidated financial statements pursuant to the rules and regulations of the SEC, the FASB, and other regulatory authorities. Such estimates primarily relate to the valuation of stock options for recording equity-based compensation expense, allowances for doubtful accounts receivable, investment valuation, discount rates associated with pension plans, incurred but not reported healthcare claims, legal matters, and estimates of progress toward completion and direct profit or loss on contracts, as applicable. As future events and their effect on the Company's operating results cannot be determined with precision, actual results could differ from these estimates. Changes in the economic climates in which the Company operates may affect these estimates and will be reflected in the Company’s financial statements in the event they occur.
Financial Condition and Liquidity
Cash provided by (used in) operating activities was $2.1 million, $(4.0) million and $7.4 million in 2016, 2015 and 2014, respectively. In 2016,the net loss was $(34.6) million, while other non-cash adjustments, primarily consisting of depreciation expense, equity-based compensation, deferred income taxes, deferred compensation, and goodwill impairment charges totaled $40.0 million. In 2015 and 2014, net income was $6.5 million and $10.4 million, respectively, while the corresponding non-cash adjustments netted to $4.9 million and $7.7 million, respectively.
Accounts receivable balances increased $0.7 million in 2016 as compared with 2015, increased $6.0 million in 2015 as compared with 2014, and increased $2.6 million in 2014 as compared with 2013. The increase in the accounts receivable balance in 2016 resulted from an increase in days sales outstanding (DSO). DSO is calculated by dividing accounts receivable obtained from the consolidated balance sheet by average daily revenue for the fourth quarter of the respective year. DSO was 85 days at December 31, 2016 as compared with DSO at December 31, 2015 of 76 days. The increase was due to the timing of payments received from our largest client in relation to quarter-end, and a general lengthening of payment terms from the largest clients in our IT staffing and other business. The increase in DSO was offset by a reduction in year-over-year revenue in the 2016 fourth quarter of 8.0%. The increase in the accounts receivable balance in 2015 as compared with 2014 resulted from an increase in DSO to 76 days at December 31, 2015 from 66 days at December 31, 2014 as the Company removed itself from an advance pay program with its largest client in 2015 where invoices that had previously been paid in 15 days for a fee were now paid in 70 days. The increase in DSO was partially offset by a decrease in revenue in the 2015 fourth quarter of approximately 14.3% when compared with the 2014 fourth quarter. The increase in the accounts receivable balance in 2014 as compared with 2013 resulted from an increase in DSO of four days from 62 days at December 31, 2013.
23
The cash surrender value of life insurance policies increased $0.8 million in 2016, increased $0.2 million in 2015, and increased $0.8 million in 2014. The increase in each of the years were due to normal appreciation of the existing cash surrender value that the Company has recorded which totaled approximately $31.0 million. Accounts payable decreased $1.1 million in 2016, decreased $1.2 million in 2015, and decreased $2.4 million in 2014. The decrease year-over-year in all years presented was primarily due to lower payables as the Company's business contracted, and the timing of certain payments near year-end. Accrued compensation was essentially unchanged in 2016 as compared with 2015 as the U.S. bi-weekly payroll was paid on the last business day of the year consistent with 2015, decreased $9.1 million in 2015 primarily due to the timing of the U.S. bi-weekly payroll which was paid on the last business day of the year in 2015 and lower headcount, and decreased $3.2 million in 2014 primarily due to lower incentive compensation. Income taxes receivable were essentially unchanged in 2016 due to the timing and amount of payments made in 2016, decreased $1.9 million in 2015 due to the timing of payments made in 2015, and increased $2.3 million in 2014 due to the timing of estimated payments made and lower taxable income.
Investing activities used $2.6 million, $2.0 million, and $3.7 million of cash in 2016, 2015 and 2014, respectively, primarily due to additions to property, equipment and capitalized software of $2.2 million in 2016, $1.9 million in 2015, and $3.1 million in 2014. The Company has no significant commitments for the purchase of property or equipment at December 31, 2016, and does not expect the amount to be spent in 2017 on additions to property, equipment and capitalized software to significantly vary from the amount spent in 2016.
As of December 31, 2016, the Company has both its corporate headquarters and corporate administrative office building listed as management is exploring a potential sale, each for an amount in excess of $3.0 million. As the carrying value of these buildings is approximately $1.2 million and $1.8 million at December 31, 2016, respectively, the Company does not expect to record a loss on the sale of either of these buildings if they are sold.
Financing activities used $0.5 million, used $23.0 million, and used $7.8 million of cash in 2016, 2015 and 2014, respectively. The Company recorded $0.3 million, $3.0 million, and $3.2 million during 2016, 2015, and 2014, respectively, from the proceeds from stock option exercises and excess tax benefits from equity-based compensation transactions. These amounts decreased in 2016 as compared with 2015 and 2014 primarily due to a lower average stock price in 2016 which led to fewer stock option exercises, and lower tax benefits from equity-based compensation activity.
The Company paid dividends totaling $2.9 million in 2016, $3.6 million in 2015 and $3.4 million in 2014. Dividends paid in 2016 were lower than previous years as the Company suspended the payment of its dividend in the 2016 fourth quarter.
During the 2016 fourth quarter, the Company’s Board of Directors authorized the repurchase of up to $10 million of its stock over the next two years. This share repurchase authorization replaced the Company’s previous buyback program. During 2016, 2015 and 2014, the Company used $1.2 million, $1.4 million, and $7.4 million, respectively, to purchase approximately 0.3 million, 0.2 million, and 0.5 million shares of its stock for treasury. Approximately $8.8 million, and 0.5 million and 0.6 million shares, respectively, remained authorized for future purchases under the Company’s share repurchase plans at December 31, 2016, 2015 and 2014, respectively. At December 31, 2016, 2015 and 2014, the Company also experienced changes in its cash account overdrafts, which are primarily due to the timing of payments near year-end, of $(0.4) million, $0.4 million, and $(0.4) million, respectively.
During 2015, the Company paid off loans it had previously taken against its owned life insurance policies totaling $22.8 million. The Company chose to pay off these loans as it could obtain bank financing at a lower rate of interest. No such payments were made in 2016 or 2014.
In April 2014, the Company's unsecured revolving credit agreement, which allowed the Company to borrow up to $35.0 million, expired. During April 2014, the Company entered into a new, demand line of credit with its banks totaling $40.0 million, which was extended for three years until April 2017. In October 2015, the Company entered into a new unsecured revolving credit agreement which replaced the demand line of credit and allows the Company to borrow up to $40.0 million. The agreement also allows under its provisions for the Company to borrow up to $17.5 million against the cash surrender value of the Company's life insurance policies. The new agreement expires in October 2018, and has interest rates ranging from 0 to 50 basis points over the prime rate, and 150 to 200 basis points over LIBOR. The Company can borrow under the agreement with either a prime rate or LIBOR rate borrowing at its discretion. There was $4.7 million, $1.2 million, and $0.0 outstanding under the Company’s lines of credit at December 31, 2016, 2015, and 2014, respectively. The Company borrows or repays its debt as needed based upon its working capital obligations, including the timing of the U.S. bi-weekly payroll.
24
The maximum amount outstanding under its credit agreements in 2016 and 2015 was $4.7 million and $10.0 million, respectively. The Company did not borrow any funds under its various credit agreements at any time during 2014. The average amounts outstanding during 2016 and 2015 were $1.9 million and $5.0 million, respectively, and carried weighted-average interest rates of 2.9% and 1.8%, respectively. Total commitment fees incurred in 2016, 2015 and 2014 totaled less than $0.1 million in each year, while interest paid in 2016 and 2015 also totaled less than $0.1 million in each year.
Under the new agreement, the Company is required to meet certain financial covenants in order to maintain borrowings under its revolving credit line, pay dividends, and make acquisitions. The covenants are measured quarterly, and at December 31, 2016, included a leverage ratio (total outstanding debt divided by earnings before interest, taxes, depreciation and amortization (EBITDA) which must be no greater than 2.75 to 1, a calculation of minimum tangible net worth (total shareholders' equity less goodwill and intangible assets) which must be no less than $49.5 million, and total annual expenditures for property, equipment and capitalized software must be no more than $5.0 million. The Company was in compliance with these covenants at December 31, 2016 as the leverage ratio was 0.66, the minimum tangible net worth was $80.9 million, and capital expenditures for property, equipment and capitalized software were $2.2 million in 2016. The Company was also in compliance with its covenants at December 31, 2015.
Of the total cash and cash equivalents reported on the consolidated balance sheet at December 31, 2016 of $9.4 million, approximately $8.6 million is held by the Company’s foreign operations and is considered to be indefinitely reinvested in those operations. The Company has not repatriated any of its cash and cash equivalents from its foreign operations in the past five years, and has no intention of doing so in the foreseeable future as the funds are generally required to meet the working capital needs of its foreign operations.
At December 31, 2016, the Company believes existing internally available funds, cash potentially generated from future operations, funds available under the Company's revolving line of credit totaling $35.3 million, and funds available to be borrowed against the cash surrender value of our life insurance policies of $17.5 million, will be sufficient to meet foreseeable working capital and capital expenditure needs, fund stock repurchases, pay a dividend (if any), fund acquisitions, and allow for future internal growth and expansion.
Off-Balance Sheet Arrangements
The Company did not have off-balance sheet arrangements or transactions in 2016, 2015 or 2014 other than guarantees in our European operations which support office leases and performance under government contracts. These guarantees totaled approximately $1.1 million at December 31, 2016.
Quantitative and Qualitative Disclosures about Market Risk
The Company’s primary market risk exposure consists of foreign currency exchange risk associated with the Company’s European operations. See Item 7A, “Quantitative and Qualitative Disclosure about Market Risk” in this report.
Recently Issued Accounting Standards
In May 2014, the Financial Accounting Standards Board (FASB) issued Accounting Standards Update No. 2014-09, "Revenue from Contracts with Customers (Topic 606)," ("ASU 2014-09"). ASU 2014-09 outlines a new, single comprehensive model for entities to use in accounting for revenue arising from contracts with customers and supersedes most current revenue recognition guidance, including industry-specific guidance. This new revenue recognition model provides a five-step analysis in determining when and how revenue is recognized. The new model will require revenue recognition to depict the transfer of promised goods or services to customers in an amount that reflects the consideration a company expects to receive in exchange for those goods or services. The pronouncement is effective for fiscal years, and interim periods within those years, beginning after December 15, 2017, and early adoption is only permitted in years beginning after December 31, 2016.
The Company currently records approximately 98% of its annual revenue on a time-and-materials and progress billing basis, with the remaining 2% recorded under a proportional method of accounting using an inputs based methodology for fixed price projects. For the 98% of the Company’s revenue recorded under the time-and-material method of accounting, the Company does not expect this new standard to change the timing or the amount of revenue that is recorded. The Company is currently evaluating the revenue recorded under its fixed price projects to determine if the manner or timing of revenue recognition would change for existing projects. However, the Company does not expect the impact of adopting this new accounting guidance will have a material impact on its consolidated operating results, and the related footnote disclosures.
25
In November 2015, the FASB issued ASU 2015-17, “Balance Sheet Classifications of Deferred Taxes,” which amended accounting guidance related to the presentation of deferred tax liabilities and assets. The amended guidance requires that all deferred tax liabilities and assets be classified as noncurrent on the balance sheet. This guidance is effective for reporting periods beginning after December 15, 2016. This guidance can also be applied either prospectively to all deferred tax liabilities and assets or retrospectively to all periods presented. Upon adoption of this guidance in 2017, the Company, given current financial results, would reclassify approximately $0.9 million from current to non-current assets.
In February 2016, the FASB issued ASU 2016-02, “Leases (Topic 842),” which sets out the principles for the recognition, measurement, presentation and disclosure of leases for both parties to a contract (i.e. lessees and lessors). The new standard requires lessees to apply a dual approach, classifying leases as either finance or operating leases based on the principle of whether or not the lease is effectively a financed purchase by the lessee. This classification will determine whether lease expense is recognized based on an effective interest method or on a straight line basis over the term of the lease, respectively. A lessee is also required to record a right-of-use asset and a lease liability for all leases with a term of greater than 12 months regardless of their classification. Leases with a term of 12 months or less will be accounted for similar to existing guidance for operating leases today. Topic 842 supersedes the previous leases standard, ASC 840, Leases. This guidance is effective for reporting periods beginning after December 15, 2018; however, early adoption is permitted. Entities are required to use a modified retrospective approach for leases that exist or are entered into after the beginning of the earliest comparative period in the financial statements. The Company is currently evaluating the impact that ASU 2016-02 will have on its condensed consolidated financial statements.
In March 2016, the FASB issued ASU 2016-09, “Improvements to Employee Share-Based Payment Accounting,” which amended accounting guidance related to seven aspects of the accounting for share-based payments award transactions. This guidance is effective for reporting periods beginning after December 15, 2016. Although the Company does not believe the impact of adopting ASU 2016-09 will have a material impact on its consolidated financial statements in 2017, the Company does anticipate recording approximately $0.1 million of additional tax expense for tax shortfalls in the 2017 first quarter that would previously have been recorded to capital in excess of par value.
Contractual Obligations
The Company intends to satisfy its contractual obligations from operating cash flows, and, if necessary, from draws on its demand credit line. A summary of the Company’s contractual obligations at December 31, 2016 is as follows:
|
(in millions) |
|
|
|
Total |
|
|
Less than 1 year |
|
|
Years 2-3 |
|
|
Years 4-5 |
|
|
More than 5 years |
|
|||||
|
Long-term debt |
|
A |
|
$ |
4.7 |
|
|
$ |
— |
|
|
$ |
4.7 |
|
|
$ |
— |
|
|
$ |
— |
|
|
Capital lease obligations |
|
B |
|
|
— |
|
|
|
— |
|
|
|
— |
|
|
|
— |
|
|
|
— |
|
|
Operating lease obligations |
|
C |
|
|
9.9 |
|
|
|
4.1 |
|
|
|
4.9 |
|
|
|
0.9 |
|
|
|
— |
|
|
Purchase obligations |
|
D |
|
|
3.0 |
|
|
|
2.1 |
|
|
|
0.9 |
|
|
|
— |
|
|
|
— |
|
|
Deferred compensation benefits (U.S.) |
|
E |
|
|
6.8 |
|
|
|
0.7 |
|
|
|
1.3 |
|
|
|
1.2 |
|
|
|
3.6 |
|
|
Deferred compensation benefits (Europe) |
|
F |
|
|
6.4 |
|
|
|
0.2 |
|
|
|
0.4 |
|
|
|
0.5 |
|
|
|
5.3 |
|
|
Other long-term liabilities |
|
G |
|
|
0.2 |
|
|
|
— |
|
|
|
0.1 |
|
|
|
0.1 |
|
|
|
— |
|
|
Total |
|
|
|
$ |
31.0 |
|
|
$ |
7.1 |
|
|
$ |
12.3 |
|
|
$ |
2.7 |
|
|
$ |
8.9 |
|
|
A |
The Company entered into a $40 million revolving line of credit (LOC) in October 2015. The Company uses this LOC to fund its working capital obligations as needed, primarily funding the U.S. bi-weekly payroll. A total of $4.7 million in borrowings was outstanding under the Agreement at December 31, 2016. |
|
B |
The Company does not have any capital lease obligations outstanding at December 31, 2016. |
|
C |
Operating lease obligations relate to the rental of office space, office equipment, and automobiles leased in the Company’s European operations. Total rental expense under operating leases in 2016, 2015 and 2014 was approximately $5.7 million, $6.1 million, and $7.0 million, respectively. |
|
D |
The Company’s purchase obligations in 2017, 2018 and 2019 total approximately $3.0 million, including $1.1 million for software maintenance, support and related fees, $0.6 million for telecommunications, $0.8 million for recruiting services, $0.2 million for professional organization memberships, $0.1 million for facility improvements and maintenance, and $0.2 million for computer-based training courses. |
26
|
E |
The Company is committed for deferred compensation benefits in the U.S. under two plans. The Executive Supplemental Benefit Plan (ESBP) provides certain former key executives with deferred compensation benefits. The ESBP was amended as of November 30, 1994 to freeze benefits for participants at that time. At December 31, 2016, 16 individuals are receiving benefits under this plan. The ESBP is deemed to be unfunded as the Company has not specifically identified Company assets to be used to discharge the deferred compensation benefit liabilities. |
The Company also has a non-qualified defined-contribution deferred compensation plan for certain key executives. Contributions to this plan in 2016 were $0.2 million. The Company anticipates making contributions totaling approximately $0.1 million in 2017 to this plan for amounts earned in 2016.
|
F |
The Company retained a contributory defined-benefit plan for its previous employees located in the Netherlands when the Company disposed of its subsidiary, CTG Nederland B.V. This plan was curtailed on January 1, 2003 for additional contributions. The Company does not anticipate making additional contributions to fund the plan in future years. |
|
G |
The Company has other long-term liabilities including payments for a postretirement benefit plan for several retired employees and their spouses, totaling fewer than 10 participants. |
The Company’s primary market risk exposure consists of foreign currency exchange risk associated with the Company’s European operations.
During 2016, revenue was affected by the year-over-year foreign currency exchange rate changes of Belgium, Luxembourg, and the United Kingdom, the countries in which the Company’s European subsidiaries operate. In Belgium and Luxembourg, the functional currency is the Euro, while in the United Kingdom the functional currency is the British Pound. Had there been no change in these exchange rates from 2015 to 2016, total European revenue would have been approximately $0.6 million higher in 2016, or $71.2 million as compared with the $70.6 million reported. Operating income in the Company’s European operations would not have been significantly impacted by the change in foreign currency exchange rates year-over-year.
The Company has historically not used any market rate sensitive instruments to hedge its foreign currency exchange risk as it conducts its foreign operations in local currencies, which generally limits risk. The Company believes the market risk related to intercompany balances in future periods will not have a material effect on its results of operations.
27
Report of Independent Registered Public Accounting Firm
The Board of Directors and Shareholders
Computer Task Group, Incorporated:
We have audited the accompanying consolidated balance sheets of Computer Task Group, Incorporated and subsidiaries as of December 31, 2016 and 2015, and the related consolidated statements of operations, comprehensive income (loss), cash flows, and changes in shareholders’ equity for each of the years in the three‑year period ended December 31, 2016. These consolidated financial statements are the responsibility of the Company’s management. Our responsibility is to express an opinion on these consolidated financial statements based on our audits.
We conducted our audits in accordance with the standards of the Public Company Accounting Oversight Board (United States). Those standards require that we plan and perform the audit to obtain reasonable assurance about whether the financial statements are free of material misstatement. An audit includes examining, on a test basis, evidence supporting the amounts and disclosures in the financial statements. An audit also includes assessing the accounting principles used and significant estimates made by management, as well as evaluating the overall financial statement presentation. We believe that our audits provide a reasonable basis for our opinion.
In our opinion, the consolidated financial statements referred to above present fairly, in all material respects, the financial position of Computer Task Group, Incorporated and subsidiaries as of December 31, 2016 and 2015, and the results of their operations and their cash flows for each of the years in the three‑year period ended December 31, 2016, in conformity with U.S. generally accepted accounting principles.
We also have audited, in accordance with the standards of the Public Company Accounting Oversight Board (United States), Computer Task Group, Incorporated’s internal control over financial reporting as of December 31, 2016, based on criteria established in Internal Control - Integrated Framework (2013) issued by the Committee of Sponsoring Organizations of the Treadway Commission (COSO), and our report dated February 24, 2017 expressed an unqualified opinion on the effectiveness of the Company’s internal control over financial reporting.
/s/ KPMG LLP
Buffalo, New York
February 24, 2017
28
Consolidated Statements of Operations
|
Year Ended December 31, |
|
2016 |
|
|
2015 |
|
|
2014 |
|
|||
|
(amounts in thousands, except per-share data) |
|
|
|
|
|
|
|
|
|
|
|
|
|
Revenue |
|
$ |
324,893 |
|
|
$ |
369,478 |
|
|
$ |
393,268 |
|
|
Direct costs |
|
|
265,711 |
|
|
|
302,318 |
|
|
|
313,930 |
|
|
Selling, general and administrative expenses |
|
|
55,200 |
|
|
|
56,523 |
|
|
|
62,186 |
|
|
Goodwill impairment charges |
|
|
37,329 |
|
|
|
— |
|
|
|
— |
|
|
Operating income (loss) |
|
|
(33,347 |
) |
|
|
10,637 |
|
|
|
17,152 |
|
|
Interest and other income |
|
|
188 |
|
|
|
79 |
|
|
|
111 |
|
|
Non-taxable life insurance gain |
|
|
— |
|
|
|
246 |
|
|
|
— |
|
|
Interest and other expense |
|
|
377 |
|
|
|
233 |
|
|
|
325 |
|
|
Income (loss) before income taxes |
|
|
(33,536 |
) |
|
|
10,729 |
|
|
|
16,938 |
|
|
Provision for income taxes |
|
|
1,102 |
|
|
|
4,219 |
|
|
|
6,588 |
|
|
Net income (loss) |
|
$ |
(34,638 |
) |
|
$ |
6,510 |
|
|
$ |
10,350 |
|
|
Net income (loss) per share: |
|
|
|
|
|
|
|
|
|
|
|
|
|
Basic |
|
$ |
(2.22 |
) |
|
$ |
0.42 |
|
|
$ |
0.68 |
|
|
Diluted |
|
$ |
(2.22 |
) |
|
$ |
0.41 |
|
|
$ |
0.64 |
|
|
Weighted average shares outstanding: |
|
|
|
|
|
|
|
|
|
|
|
|
|
Basic |
|
|
15,593 |
|
|
|
15,479 |
|
|
|
15,120 |
|
|
Diluted |
|
|
15,593 |
|
|
|
15,920 |
|
|
|
16,260 |
|
|
|
|
|
|
|
|
|
|
|
|
|
|
|
|
Cash dividend per common share |
|
$ |
0.18 |
|
|
$ |
0.24 |
|
|
$ |
0.24 |
|
The accompanying notes are an integral part of these consolidated financial statements.
29
Consolidated Statements of Comprehensive Income (Loss)
|
Year Ended December 31, |
|
2016 |
|
|
2015 |
|
|
2014 |
|
|||
|
(amounts in thousands) |
|
|
|
|
|
|
|
|
|
|
|
|
|
Net Income (loss) |
|
$ |
(34,638 |
) |
|
$ |
6,510 |
|
|
$ |
10,350 |
|
|
|
|
|
|
|
|
|
|
|
|
|
|
|
|
Foreign currency adjustment |
|
|
(758 |
) |
|
|
(1,875 |
) |
|
|
(2,274 |
) |
|
Change in pension loss, net of taxes of $71, $327 and $(428), in 2016, 2015 and 2014, respectively |
|
|
(1,365 |
) |
|
|
2,828 |
|
|
|
(4,614 |
) |
|
Other comprehensive income (loss) |
|
|
(2,123 |
) |
|
|
953 |
|
|
|
(6,888 |
) |
|
|
|
|
|
|
|
|
|
|
|
|
|
|
|
Comprehensive income (loss) |
|
$ |
(36,761 |
) |
|
$ |
7,463 |
|
|
$ |
3,462 |
|
The accompanying notes are an integral part of these consolidated financial statements.
30
|
December 31, |
|
2016 |
|
|
2015 |
|
||
|
(amounts in thousands, except share balances) |
|
|
|
|
|
|
|
|
|
Assets |
|
|
|
|
|
|
|
|
|
Current Assets: |
|
|
|
|
|
|
|
|
|
Cash and cash equivalents |
|
$ |
9,407 |
|
|
$ |
10,801 |
|
|
Accounts receivable, net of allowances of $469 and $377 in 2016 and 2015, respectively |
|
|
71,355 |
|
|
|
71,403 |
|
|
Prepaid and other current assets |
|
|
2,010 |
|
|
|
1,770 |
|
|
Deferred income taxes |
|
|
869 |
|
|
|
804 |
|
|
Total current assets |
|
|
83,641 |
|
|
|
84,778 |
|
|
Property, equipment and capitalized software, net |
|
|
5,863 |
|
|
|
5,488 |
|
|
Goodwill |
|
|
— |
|
|
|
37,231 |
|
|
Deferred income taxes |
|
|
6,017 |
|
|
|
5,573 |
|
|
Cash surrender value of life insurance |
|
|
31,024 |
|
|
|
29,753 |
|
|
Investments |
|
|
370 |
|
|
|
254 |
|
|
Total assets |
|
$ |
126,915 |
|
|
$ |
163,077 |
|
|
Liabilities and Shareholders’ Equity |
|
|
|
|
|
|
|
|
|
Current Liabilities: |
|
|
|
|
|
|
|
|
|
Accounts payable |
|
$ |
6,973 |
|
|
$ |
8,236 |
|
|
Accrued compensation |
|
|
17,365 |
|
|
|
17,541 |
|
|
Advance billings on contracts |
|
|
935 |
|
|
|
945 |
|
|
Dividend payable |
|
|
— |
|
|
|
925 |
|
|
Other current liabilities |
|
|
4,638 |
|
|
|
4,157 |
|
|
Total current liabilities |
|
|
29,911 |
|
|
|
31,804 |
|
|
Long-term debt |
|
|
4,725 |
|
|
|
1,225 |
|
|
Deferred compensation benefits |
|
|
12,993 |
|
|
|
11,904 |
|
|
Other long-term liabilities |
|
|
467 |
|
|
|
427 |
|
|
Total liabilities |
|
|
48,096 |
|
|
|
45,360 |
|
|
Shareholders’ Equity: |
|
|
|
|
|
|
|
|
|
Common stock, par value $0.01 per share, 150,000,000 shares authorized; 27,017,824 shares issued in both periods |
|
|
270 |
|
|
|
270 |
|
|
Capital in excess of par value |
|
|
123,947 |
|
|
|
125,226 |
|
|
Retained earnings |
|
|
84,223 |
|
|
|
121,798 |
|
|
Less: Treasury stock of 11,077,779 and 8,014,004 shares at cost, in 2016 and 2015, respectively |
|
|
(112,858 |
) |
|
|
(60,275 |
) |
|
Stock Trusts of 0 and 3,264,651 shares at cost, in 2016 and 2015, respectively |
|
|
— |
|
|
|
(54,662 |
) |
|
Accumulated other comprehensive loss |
|
|
(16,763 |
) |
|
|
(14,640 |
) |
|
Total shareholders’ equity |
|
|
78,819 |
|
|
|
117,717 |
|
|
Total liabilities and shareholders’ equity |
|
$ |
126,915 |
|
|
$ |
163,077 |
|
The accompanying notes are an integral part of these consolidated financial statements.
31
Consolidated Statements of Cash Flows
|
Year Ended December 31, |
|
2016 |
|
|
2015 |
|
|
2014 |
|
|||
|
(amounts in thousands) |
|
|
|
|
|
|
|
|
|
|
|
|
|
Cash flow from operating activities: |
|
|
|
|
|
|
|
|
|
|
|
|
|
Net income (loss) |
|
$ |
(34,638 |
) |
|
$ |
6,510 |
|
|
$ |
10,350 |
|
|
Adjustments: |
|
|
|
|
|
|
|
|
|
|
|
|
|
Depreciation and amortization expense |
|
|
1,647 |
|
|
|
1,962 |
|
|
|
2,974 |
|
|
Equity-based compensation expense |
|
|
1,626 |
|
|
|
1,317 |
|
|
|
3,088 |
|
|
Deferred income taxes |
|
|
(583 |
) |
|
|
425 |
|
|
|
204 |
|
|
Deferred compensation |
|
|
270 |
|
|
|
(10 |
) |
|
|
(103 |
) |
|
Goodwill impairment |
|
|
37,329 |
|
|
|
— |
|
|
|
— |
|
|
Write-off of capitalized software |
|
|
— |
|
|
|
1,186 |
|
|
|
1,546 |
|
|
Changes in assets and liabilities: |
|
|
|
|
|
|
|
|
|
|
|
|
|
Increase in accounts receivable |
|
|
(729 |
) |
|
|
(5,951 |
) |
|
|
(2,594 |
) |
|
(Increase) decrease in prepaid and other current assets |
|
|
(520 |
) |
|
|
23 |
|
|
|
(189 |
) |
|
Increase in cash surrender value of life insurance |
|
|
(809 |
) |
|
|
(184 |
) |
|
|
(780 |
) |
|
Decrease in accounts payable |
|
|
(1,143 |
) |
|
|
(1,166 |
) |
|
|
(2,372 |
) |
|
Increase (decrease) in accrued compensation |
|
|
132 |
|
|
|
(9,104 |
) |
|
|
(3,230 |
) |
|
Increase (decrease) in income taxes payable |
|
|
(242 |
) |
|
|
1,894 |
|
|
|
(2,261 |
) |
|
Increase (decrease) in advance billings on contracts |
|
|
29 |
|
|
|
(421 |
) |
|
|
(431 |
) |
|
Increase (decrease) in other current liabilities |
|
|
(354 |
) |
|
|
(650 |
) |
|
|
1,050 |
|
|
Increase in other long-term liabilities |
|
|
40 |
|
|
|
137 |
|
|
|
213 |
|
|
Net cash provided by (used) in operating activities |
|
|
2,055 |
|
|
|
(4,032 |
) |
|
|
7,465 |
|
|
Cash flow from investing activities: |
|
|
|
|
|
|
|
|
|
|
|
|
|
Additions to property and equipment |
|
|
(1,665 |
) |
|
|
(1,260 |
) |
|
|
(1,410 |
) |
|
Additions to capitalized software |
|
|
(522 |
) |
|
|
(641 |
) |
|
|
(1,683 |
) |
|
Premiums paid for life insurance |
|
|
(690 |
) |
|
|
(653 |
) |
|
|
(757 |
) |
|
Life insurance proceeds |
|
|
394 |
|
|
|
— |
|
|
|
— |
|
|
Deferred compensation plan investments, net |
|
|
(110 |
) |
|
|
534 |
|
|
|
109 |
|
|
Net cash used in investing activities |
|
|
(2,593 |
) |
|
|
(2,020 |
) |
|
|
(3,741 |
) |
|
Cash flow from financing activities: |
|
|
|
|
|
|
|
|
|
|
|
|
|
Proceeds from long-term debt, net |
|
|
3,500 |
|
|
|
1,225 |
|
|
|
— |
|
|
Proceeds from stock option plan exercises |
|
|
262 |
|
|
|
2,598 |
|
|
|
1,241 |
|
|
Excess tax benefits from equity-based compensation |
|
|
22 |
|
|
|
380 |
|
|
|
1,964 |
|
|
Proceeds from Employee Stock Purchase Plan |
|
|
215 |
|
|
|
276 |
|
|
|
323 |
|
|
Change in cash overdraft, net |
|
|
(362 |
) |
|
|
411 |
|
|
|
(424 |
) |
|
Dividends paid |
|
|
(2,890 |
) |
|
|
(3,624 |
) |
|
|
(3,422 |
) |
|
Payments against loans on life insurance policies |
|
|
— |
|
|
|
(22,827 |
) |
|
|
— |
|
|
Purchase of stock for treasury |
|
|
(1,244 |
) |
|
|
(1,406 |
) |
|
|
(7,432 |
) |
|
Net cash used in financing activities |
|
|
(497 |
) |
|
|
(22,967 |
) |
|
|
(7,750 |
) |
|
Effect of exchange rates on cash and cash equivalents |
|
|
(359 |
) |
|
|
(1,042 |
) |
|
|
(1,339 |
) |
|
Net decrease in cash and cash equivalents |
|
|
(1,394 |
) |
|
|
(30,061 |
) |
|
|
(5,365 |
) |
|
Cash and cash equivalents at beginning of year |
|
|
10,801 |
|
|
|
40,862 |
|
|
|
46,227 |
|
|
Cash and cash equivalents at end of year |
|
$ |
9,407 |
|
|
$ |
10,801 |
|
|
$ |
40,862 |
|
The accompanying notes are an integral part of these consolidated financial statements.
32
Consolidated Statements of Changes in Shareholders’ Equity
|
|
|
|
|
|
|
|
|
|
|
|
|
|
|
|
|
|
|
|
|
|
|
|
|
|
|
|
|
|
|
|
|
|
|
Accumulated |
|
|
|
|
|
|
|
|
|
|
|
|
|
|
|
|
|
|
|
|
|
Capital in |
|
|
|
|
|
|
|
|
|
|
|
|
|
|
|
|
|
|
|
|
|
|
Other |
|
|
|
|
|
|
Total |
|
|||
|
|
|
Common Stock |
|
|
Excess of |
|
|
Retained |
|
|
Treasury Stock |
|
|
Stock Trusts |
|
|
Comprehensive |
|
|
|
|
|
|
Shareholders’ |
|
|||||||||||||||||||
|
|
|
Shares |
|
|
Amount |
|
|
Par Value |
|
|
Earnings |
|
|
Shares |
|
|
Amount |
|
|
Shares |
|
|
Amount |
|
|
Income (loss) |
|
|
Other |
|
|
Equity |
|
|||||||||||
|
(amounts in thousands) |
|
|
|
|
|
|
|
|
|
|
|
|
|
|
|
|
|
|
|
|
|
|
|
|
|
|
|
|
|
|
|
|
|
|
|
|
|
|
|
|
|
|
|
|
|
Balances as of December 31, 2013 |
|
|
27,018 |
|
|
$ |
270 |
|
|
$ |
122,531 |
|
|
$ |
112,277 |
|
|
|
8,488 |
|
|
$ |
(57,163 |
) |
|
|
3,363 |
|
|
$ |
(55,083 |
) |
|
$ |
(8,705 |
) |
|
$ |
(285 |
) |
|
$ |
113,842 |
|
|
Employee Stock Purchase Plan share issuance |
|
|
— |
|
|
|
— |
|
|
|
145 |
|
|
|
— |
|
|
|
(24 |
) |
|
|
178 |
|
|
|
— |
|
|
|
— |
|
|
|
— |
|
|
|
— |
|
|
|
323 |
|
|
Stock Option Plan share issuance, net |
|
|
— |
|
|
|
— |
|
|
|
(2,082 |
) |
|
|
— |
|
|
|
(513 |
) |
|
|
3,056 |
|
|
|
— |
|
|
|
— |
|
|
|
— |
|
|
|
— |
|
|
|
974 |
|
|
Excess tax benefits from equity-based compensation |
|
|
— |
|
|
|
— |
|
|
|
1,964 |
|
|
|
— |
|
|
|
— |
|
|
|
— |
|
|
|
— |
|
|
|
— |
|
|
|
— |
|
|
|
— |
|
|
|
1,964 |
|
|
Restricted stock plan share issuance/forfeiture |
|
|
— |
|
|
|
— |
|
|
|
(247 |
) |
|
|
— |
|
|
|
84 |
|
|
|
(2,498 |
) |
|
|
— |
|
|
|
— |
|
|
|
— |
|
|
|
— |
|
|
|
(2,745 |
) |
|
Deferred compensation plan share issuance |
|
|
— |
|
|
|
— |
|
|
|
485 |
|
|
|
— |
|
|
|
(48 |
) |
|
|
348 |
|
|
|
— |
|
|
|
— |
|
|
|
— |
|
|
|
285 |
|
|
|
1,118 |
|
|
Purchase of stock |
|
|
— |
|
|
|
— |
|
|
|
— |
|
|
|
— |
|
|
|
499 |
|
|
|
(7,432 |
) |
|
|
— |
|
|
|
— |
|
|
|
— |
|
|
|
— |
|
|
|
(7,432 |
) |
|
Equity-based compensation |
|
|
— |
|
|
|
— |
|
|
|
3,088 |
|
|
|
— |
|
|
|
— |
|
|
|
— |
|
|
|
— |
|
|
|
— |
|
|
|
— |
|
|
|
— |
|
|
|
3,088 |
|
|
Net income |
|
|
— |
|
|
|
— |
|
|
|
— |
|
|
|
10,350 |
|
|
|
— |
|
|
|
— |
|
|
|
— |
|
|
|
— |
|
|
|
— |
|
|
|
— |
|
|
|
10,350 |
|
|
Dividends declared |
|
|
— |
|
|
|
— |
|
|
|
— |
|
|
|
(3,628 |
) |
|
|
— |
|
|
|
— |
|
|
|
— |
|
|
|
— |
|
|
|
— |
|
|
|
— |
|
|
|
(3,628 |
) |
|
Foreign currency adjustment |
|
|
— |
|
|
|
— |
|
|
|
— |
|
|
|
— |
|
|
|
— |
|
|
|
— |
|
|
|
— |
|
|
|
— |
|
|
|
(2,274 |
) |
|
|
— |
|
|
|
(2,274 |
) |
|
Pension loss adjustment, net of tax |
|
|
— |
|
|
|
— |
|
|
|
— |
|
|
|
— |
|
|
|
— |
|
|
|
— |
|
|
|
— |
|
|
|
— |
|
|
|
(4,614 |
) |
|
|
— |
|
|
|
(4,614 |
) |
|
Balances as of December 31, 2014 |
|
|
27,018 |
|
|
|
270 |
|
|
|
125,884 |
|
|
|
118,999 |
|
|
|
8,486 |
|
|
|
(63,511 |
) |
|
|
3,363 |
|
|
|
(55,083 |
) |
|
|
(15,593 |
) |
|
|
— |
|
|
|
110,966 |
|
|
Employee Stock Purchase Plan share issuance |
|
|
— |
|
|
|
— |
|
|
|
(5 |
) |
|
|
— |
|
|
|
(37 |
) |
|
|
281 |
|
|
|
— |
|
|
|
— |
|
|
|
— |
|
|
|
— |
|
|
|
276 |
|
|
Stock Option Plan share issuance, net |
|
|
— |
|
|
|
— |
|
|
|
(1,736 |
) |
|
|
— |
|
|
|
(551 |
) |
|
|
4,141 |
|
|
|
— |
|
|
|
— |
|
|
|
— |
|
|
|
— |
|
|
|
2,405 |
|
|
Excess tax benefits from equity-based compensation |
|
|
— |
|
|
|
— |
|
|
|
380 |
|
|
|
— |
|
|
|
— |
|
|
|
— |
|
|
|
— |
|
|
|
— |
|
|
|
— |
|
|
|
— |
|
|
|
380 |
|
|
Restricted stock plan share issuance/forfeiture |
|
|
— |
|
|
|
— |
|
|
|
(632 |
) |
|
|
— |
|
|
|
10 |
|
|
|
(352 |
) |
|
|
(98 |
) |
|
|
421 |
|
|
|
— |
|
|
|
— |
|
|
|
(563 |
) |
|
Deferred compensation plan share issuance |
|
|
— |
|
|
|
— |
|
|
|
18 |
|
|
|
— |
|
|
|
(76 |
) |
|
|
572 |
|
|
|
— |
|
|
|
— |
|
|
|
— |
|
|
|
— |
|
|
|
590 |
|
|
Purchase of stock |
|
|
— |
|
|
|
— |
|
|
|
— |
|
|
|
— |
|
|
|
182 |
|
|
|
(1,406 |
) |
|
|
— |
|
|
|
— |
|
|
|
— |
|
|
|
— |
|
|
|
(1,406 |
) |
|
Equity-based compensation |
|
|
— |
|
|
|
— |
|
|
|
1,317 |
|
|
|
— |
|
|
|
— |
|
|
|
— |
|
|
|
— |
|
|
|
— |
|
|
|
— |
|
|
|
— |
|
|
|
1,317 |
|
|
Net income |
|
|
— |
|
|
|
— |
|
|
|
— |
|
|
|
6,510 |
|
|
|
— |
|
|
|
— |
|
|
|
— |
|
|
|
— |
|
|
|
— |
|
|
|
— |
|
|
|
6,510 |
|
|
Dividends declared |
|
|
— |
|
|
|
— |
|
|
|
— |
|
|
|
(3,711 |
) |
|
|
— |
|
|
|
— |
|
|
|
— |
|
|
|
— |
|
|
|
— |
|
|
|
— |
|
|
|
(3,711 |
) |
|
Foreign currency adjustment |
|
|
— |
|
|
|
— |
|
|
|
— |
|
|
|
— |
|
|
|
— |
|
|
|
— |
|
|
|
— |
|
|
|
— |
|
|
|
(1,875 |
) |
|
|
— |
|
|
|
(1,875 |
) |
|
Pension loss adjustment, net of tax |
|
|
— |
|
|
|
— |
|
|
|
— |
|
|
|
— |
|
|
|
— |
|
|
|
— |
|
|
|
— |
|
|
|
— |
|
|
|
2,828 |
|
|
|
— |
|
|
|
2,828 |
|
|
Balances as of December 31, 2015 |
|
|
27,018 |
|
|
|
270 |
|
|
|
125,226 |
|
|
|
121,798 |
|
|
|
8,014 |
|
|
|
(60,275 |
) |
|
|
3,265 |
|
|
|
(54,662 |
) |
|
|
(14,640 |
) |
|
|
— |
|
|
|
117,717 |
|
(continued on next page)
33
|
|
|
|
|
|
|
|
|
|
|
|
|
|
|
|
|
|
|
|
|
|
|
|
|
|
|
|
|
|
|
|
|
|
|
Accumulated |
|
|
|
|
|
|
|
|
|
|
|
|
|
|
|
|
|
|
|
|
|
Capital in |
|
|
|
|
|
|
|
|
|
|
|
|
|
|
|
|
|
|
|
|
|
|
Other |
|
|
|
|
|
|
Total |
|
|||
|
|
|
Common Stock |
|
|
Excess of |
|
|
Retained |
|
|
Treasury Stock |
|
|
Stock Trusts |
|
|
Comprehensive |
|
|
|
|
|
|
Shareholders’ |
|
|||||||||||||||||||
|
|
|
Shares |
|
|
Amount |
|
|
Par Value |
|
|
Earnings |
|
|
Shares |
|
|
Amount |
|
|
Shares |
|
|
Amount |
|
|
Income (loss) |
|
|
Other |
|
|
Equity |
|
|||||||||||
|
(amounts in thousands) |
|
|
|
|
|
|
|
|
|
|
|
|
|
|
|
|
|
|
|
|
|
|
|
|
|
|
|
|
|
|
|
|
|
|
|
|
|
|
|
|
|
|
|
|
|
Balances as of December 31, 2015 |
|
|
27,018 |
|
|
|
270 |
|
|
|
125,226 |
|
|
|
121,798 |
|
|
|
8,014 |
|
|
|
(60,275 |
) |
|
|
3,265 |
|
|
|
(54,662 |
) |
|
|
(14,640 |
) |
|
|
— |
|
|
|
117,717 |
|
|
Employee Stock Purchase Plan share issuance |
|
|
— |
|
|
|
— |
|
|
|
(211 |
) |
|
|
— |
|
|
|
(44 |
) |
|
|
426 |
|
|
|
— |
|
|
|
— |
|
|
|
— |
|
|
|
— |
|
|
|
215 |
|
|
Stock Option Plan share issuance, net |
|
|
— |
|
|
|
— |
|
|
|
(820 |
) |
|
|
— |
|
|
|
(95 |
) |
|
|
1,082 |
|
|
|
— |
|
|
|
— |
|
|
|
— |
|
|
|
— |
|
|
|
262 |
|
|
Excess (deficient) tax benefits from equity-based compensation |
|
|
— |
|
|
|
— |
|
|
|
(233 |
) |
|
|
— |
|
|
|
— |
|
|
|
— |
|
|
|
— |
|
|
|
— |
|
|
|
— |
|
|
|
— |
|
|
|
(233 |
) |
|
Restricted stock plan share issuance/forfeiture |
|
|
— |
|
|
|
— |
|
|
|
(1,241 |
) |
|
|
— |
|
|
|
259 |
|
|
|
(1,286 |
) |
|
|
(503 |
) |
|
|
2,145 |
|
|
|
— |
|
|
|
— |
|
|
|
(382 |
) |
|
Deferred compensation plan share issuance |
|
|
— |
|
|
|
— |
|
|
|
(400 |
) |
|
|
— |
|
|
|
(105 |
) |
|
|
949 |
|
|
|
— |
|
|
|
— |
|
|
|
— |
|
|
|
— |
|
|
|
549 |
|
|
Purchase of stock |
|
|
— |
|
|
|
— |
|
|
|
— |
|
|
|
— |
|
|
|
287 |
|
|
|
(1,244 |
) |
|
|
— |
|
|
|
— |
|
|
|
— |
|
|
|
— |
|
|
|
(1,244 |
) |
|
Termination of stock trusts |
|
|
— |
|
|
|
— |
|
|
|
— |
|
|
|
— |
|
|
|
2,762 |
|
|
|
(52,510 |
) |
|
|
(2,762 |
) |
|
|
52,517 |
|
|
|
— |
|
|
|
— |
|
|
|
7 |
|
|
Equity-based compensation |
|
|
— |
|
|
|
— |
|
|
|
1,626 |
|
|
|
— |
|
|
|
— |
|
|
|
— |
|
|
|
— |
|
|
|
— |
|
|
|
— |
|
|
|
— |
|
|
|
1,626 |
|
|
Net income (loss) |
|
|
— |
|
|
|
— |
|
|
|
— |
|
|
|
(34,638 |
) |
|
|
— |
|
|
|
— |
|
|
|
— |
|
|
|
— |
|
|
|
— |
|
|
|
— |
|
|
|
(34,638 |
) |
|
Dividends declared |
|
|
— |
|
|
|
— |
|
|
|
— |
|
|
|
(2,937 |
) |
|
|
— |
|
|
|
— |
|
|
|
— |
|
|
|
— |
|
|
|
— |
|
|
|
— |
|
|
|
(2,937 |
) |
|
Foreign currency adjustment |
|
|
— |
|
|
|
— |
|
|
|
— |
|
|
|
— |
|
|
|
— |
|
|
|
— |
|
|
|
— |
|
|
|
— |
|
|
|
(758 |
) |
|
|
— |
|
|
|
(758 |
) |
|
Pension loss adjustment, net of tax |
|
|
— |
|
|
|
— |
|
|
|
— |
|
|
|
— |
|
|
|
— |
|
|
|
— |
|
|
|
— |
|
|
|
— |
|
|
|
(1,365 |
) |
|
|
— |
|
|
|
(1,365 |
) |
|
Balances as of December 31, 2016 |
|
|
27,018 |
|
|
$ |
270 |
|
|
$ |
123,947 |
|
|
$ |
84,223 |
|
|
|
11,078 |
|
|
$ |
(112,858 |
) |
|
|
— |
|
|
$ |
— |
|
|
$ |
(16,763 |
) |
|
$ |
— |
|
|
$ |
78,819 |
|
The accompanying notes are an integral part of these consolidated financial statements.
34
Notes to Consolidated Financial Statements
|
1. |
Summary of Significant Accounting Policies |
Basis of Presentation and Consolidation
The consolidated financial statements include the accounts of Computer Task Group, Incorporated, and its subsidiaries (the Company or CTG), located primarily in North America, Western Europe, and India. There are no unconsolidated entities, or off-balance sheet arrangements other than certain guarantees supporting office leases or the performance under government contracts in the Company's European operations. All inter-company accounts have been eliminated. Management of the Company has made a number of estimates and assumptions relating to the reporting of assets and liabilities and the disclosure of contingent assets and liabilities to prepare these consolidated financial statements in conformity with U.S. generally accepted accounting principles. Such estimates primarily relate to the valuation allowances for deferred tax assets, actuarial assumptions including discount rates and expected rates of return, as applicable, for the Company’s defined benefit plans, the allowance for doubtful accounts receivable, assumptions underlying stock option valuation, investment valuation, estimates of progress toward completion and direct profit or loss on contracts, legal matters, and other contingencies. The current economic environments in the United States, Canada, Western Europe, and India where the Company has operations have increased the degree of uncertainty inherent in these estimates and assumptions. Actual results could differ from those estimates.
The Company primarily operates in one industry segment, providing IT services to its clients. These services include IT Solutions and IT and other Staffing. CTG provides these primary services to all of the markets that it serves. The services provided typically encompass the IT business solution life cycle, including phases for planning, developing, implementing, managing, and ultimately maintaining the IT solution. A typical client is an organization with large, complex information and data processing requirements. The Company provides administrative or warehouse employees to clients from time to time to supplement the IT resources we place at those clients. The Company promotes a significant portion of its services through five vertical market focus areas: Technology Service Providers, Manufacturing, Healthcare (which includes services provided to healthcare providers, health insurers, and life sciences companies), Financial Services, and Energy. The Company focuses on these five vertical areas as it believes that these areas are either higher growth markets than the general IT services market and the general economy, or are areas that provide greater potential for the Company’s growth due to the size of the vertical market. The remainder of CTG’s revenue is derived from general markets.
CTG’s revenue by vertical market as a percentage of consolidated revenue for the years ended December 31, 2016, 2015 and 2014 is as follows:
|
|
|
2016 |
|
|
2015 |
|
|
2014 |
|
|||
|
Technology service providers |
|
|
35.2 |
% |
|
|
31.1 |
% |
|
|
26.3 |
% |
|
Manufacturing |
|
|
24.2 |
% |
|
|
25.7 |
% |
|
|
24.0 |
% |
|
Healthcare |
|
|
18.2 |
% |
|
|
23.5 |
% |
|
|
28.6 |
% |
|
Financial services |
|
|
7.7 |
% |
|
|
7.1 |
% |
|
|
7.8 |
% |
|
Energy |
|
|
5.1 |
% |
|
|
5.4 |
% |
|
|
6.1 |
% |
|
General markets |
|
|
9.6 |
% |
|
|
7.2 |
% |
|
|
7.2 |
% |
|
Total |
|
|
100.0 |
% |
|
|
100.0 |
% |
|
|
100.0 |
% |
Revenue and Cost Recognition
The Company recognizes revenue when persuasive evidence of an arrangement exists, when the services have been rendered, when the price is determinable, and when collectibility of the amounts due is reasonably assured. For time-and-material contracts, revenue is recognized as hours are incurred and costs are expended. For contracts with periodic billing schedules, primarily monthly, revenue is recognized as services are rendered to the client. Revenue for fixed-price contracts is recognized per the proportional method of accounting using an input-based approach. On a given project, actual salary and indirect labor costs incurred are measured and compared against the total estimated costs of such items at the completion of the project. Revenue is recognized based upon the percentage-of-completion calculation of total incurred costs to total estimated costs. The Company infrequently works on fixed-price projects that include significant amounts of material or other non-labor related costs which could distort the percent complete within a percentage-of-completion calculation. The Company’s estimate of the total labor costs it expects to incur over the term of the contract is based on the nature of the project and our past experience on similar projects, and includes management judgments and estimates which affect the amount of revenue recognized on fixed-price contracts in any accounting period. Loss on contracts, if any, are recorded at the time it is determined a loss exists on a project.
35
The Company’s revenue from contracts accounted for under time-and-material, progress billing, and percentage-of-completion methods as a percentage of consolidated revenue for the years ended December 31, 2016, 2015 and 2014 is as follows:
|
|
|
2016 |
|
|
2015 |
|
|
2014 |
|
|||
|
Time-and-material |
|
|
86.5 |
% |
|
|
88.6 |
% |
|
|
86.2 |
% |
|
Progress billing |
|
|
10.8 |
% |
|
|
9.5 |
% |
|
|
11.2 |
% |
|
Percentage-of-completion |
|
|
2.7 |
% |
|
|
1.9 |
% |
|
|
2.6 |
% |
|
Total |
|
|
100.0 |
% |
|
|
100.0 |
% |
|
|
100.0 |
% |
The Company includes billable expenses in its accounts as both revenue and direct costs. These billable expenses totaled $4.0 million, $6.5 million, and $8.6 million in 2016, 2015 and 2014, respectively.
Fair Value
Fair value is defined as the exchange price that would be received for an asset or paid for a liability in the principal or most advantageous market for the asset or liability, in an orderly transaction between market participants. The Company utilizes a fair value hierarchy for its assets and liabilities, as applicable, based upon three levels of input, which are:
Level 1—quoted prices in active markets for identical assets or liabilities (observable)
Level 2—inputs other than Level 1 that are observable, either directly or indirectly, such as quoted prices for similar assets or liabilities, quoted prices in inactive markets, or other inputs that are observable or can be supported by observable market data for essentially the full term of the asset or liability (observable)
Level 3—unobservable inputs that are supported by little or no market activity, but are significant to determining the fair value of the asset or liability (unobservable)
At December 31, 2016 and 2015, the carrying amounts of the Company’s cash of $9.4 million and $10.8 million, respectively, approximated fair value.
The Company is also allowed to elect an irrevocable option to measure, on a contract by contract basis, specific financial instruments and certain other items that are currently not being measured at fair value. The Company did not elect to apply the fair value provisions of this standard for any specific contracts during the years ended December 31, 2016 or 2015.
Life Insurance Policies
The Company has purchased life insurance on the lives of a number of former employees who are plan participants in the non-qualified defined benefit Executive Supplemental Benefit Plan. In total, there are policies on approximately 20 individuals, whose average age is 73 years old. These policies have generated cash surrender value, and the Company, prior to 2015, had taken loans against the policies.
At December 31, 2016 and December 31, 2015, these insurance policies had a gross cash surrender value of $30.1 million and $28.9 million, respectively, and was included on the consolidated balance sheet as “Cash surrender value of life insurance” under non-current assets. During 2015, the Company used approximately $22.8 million in cash to payoff all of the outstanding loans against these policies.
36
At December 31, 2016 and 2015, the total death benefit for the remaining policies was approximately $41.1 million and $40.4 million, respectively. Currently, upon the death of all of the plan participants, the Company would expect to receive approximately $40.5 million, and under current tax regulations, would record a non-taxable gain of approximately $10.4 million.
During the 2015 fourth quarter, one former employee covered by this life insurance passed away. The Company recorded a non-taxable gain totaling approximately $0.2 million in the quarter, and received the proceeds from the policy of approximately $0.4 million in the 2016 first quarter.
Taxes Collected from Clients
In instances where the Company collects taxes from its clients for remittance to governmental authorities, primarily in its European operations, revenue and expenses are not presented on a gross basis in the consolidated financial statements as such taxes are recorded in the Company's accounts on a net basis.
Cash and Cash Equivalents, and Cash Overdrafts
For purposes of the statement of cash flows, cash and cash equivalents are defined as cash on hand, demand deposits, and short-term, highly liquid investments with a maturity of three months or less. As the Company does not fund its bank accounts for the checks it has written until the checks are presented to the bank for payment, the "change in cash overdraft, net" line item as presented on the condensed consolidated statement of cash flows represents the increase or decrease in outstanding checks for a given period.
Trade Accounts Receivable
Trade accounts receivable balances are received on average approximately 85 days from the date of invoice. Generally, the Company does not work on any projects where amounts due are expected to be received greater than one year from the date of the invoice. Accordingly, the recorded book value for the Company’s accounts receivable equals fair value. Outstanding trade accounts receivable are generally considered past due when they remain unpaid after the contractual due date has passed. An allowance for doubtful accounts receivable (allowance) is established using management’s judgment. Specific identification of balances that are significantly past due and where client payments have not been recently received are generally added to the allowance unless the Company has direct knowledge that the client intends to make payment. Additionally, any balances which relate to a client that has declared bankruptcy or ceased its business operations are added to the allowance at the amount not expected to be received.
Bad debt expense, net of recoveries, was approximately $0.2 million, $0.3 million, and $(31,000) in 2016, 2015, and 2014, respectively.
Property, Equipment and Capitalized Software Costs
Property and equipment are generally stated at historical cost less accumulated depreciation. Depreciation is computed using the straight-line method based on estimated useful lives of one year to 30 years, and begins after an asset has been put into service. Leasehold improvements are generally depreciated over the shorter of the term of the lease or the useful life of the improvement. The cost of property or equipment sold or otherwise disposed of, along with related accumulated depreciation, is eliminated from the accounts, and the resulting gain or loss, if any, is reflected in current earnings. Maintenance and repairs are charged to expense when incurred, while significant improvements to existing assets are capitalized.
As of December 31, 2016 and December 31, 2015, the Company had capitalized costs relating to software projects developed for internal use. Amortization periods for these projects range from two to five years, and begin when the software, or enhancements thereto, is available for its intended use. Amortization periods are evaluated annually for propriety.
37
Impairment of Long-Lived Assets and Long-Lived Assets to Be Disposed Of
Long-lived assets are reviewed for impairment whenever events or changes in circumstances indicate that the carrying amount of an asset may not be recoverable. When such circumstances exist, the recoverability of assets to be held and used is measured by a comparison of the carrying amount of an asset to future cash flows expected to be generated by the asset. If such assets are considered to be impaired, the impairment to be recognized is measured by the amount by which the carrying amount of the assets exceeds the fair value of the assets. Assets to be disposed of by sale, if any, are reported at the lower of the carrying amount or fair value less costs to sell. The Company does not have any long-lived assets that are impaired at December 31, 2016.
During 2016, the Company listed both its corporate headquarters and corporate administrative office building as management is exploring a potential sale, for an amount in excess of $3.0 million each. As the carrying value of these buildings is approximately $1.2 million and $1.8 million at December 31, 2016, respectively, the Company does not expect to record a loss on the sale of either of these buildings if they are sold. These assets are not classified as “held for sale” in these consolidated financial statements as the Company is uncertain that a sale is probable and will occur in less than one year.
Leases
The Company is obligated under a number of short and long-term operating leases, primarily for the rental of office space, office equipment, and for automobiles in our European operations. In instances where the Company has negotiated leases that contain rent holidays or escalation clauses, the expense for those leases is recognized monthly on a straight-line basis over the term of the lease.
Goodwill
The goodwill recorded on the Company's condensed consolidated balance sheet at December 31, 2015 related to CTG’s Healthcare Solutions (CTGHS) reporting unit. In accordance with current accounting guidance for “Intangibles - Goodwill and Other,” the Company performs goodwill impairment testing at least annually (in the Company’s fourth quarter), unless indicators of impairment exist in interim periods. The Company uses the two-step approach to test goodwill for potential impairment. Step One compares the estimated fair value of a reporting unit with goodwill to its carrying value. If the carrying value exceeds the estimated fair value, Step Two must be performed. Step Two compares the carrying value of the reporting unit to the fair value of all of the assets and liabilities of the reporting unit (including any unrecognized intangibles) as if the reporting unit was acquired in a business combination. If the carrying amount of a reporting unit’s goodwill exceeds the implied fair value of its goodwill, an impairment loss is recognized in an amount equal to the excess.
During the 2016 first quarter, the Company determined that a goodwill impairment indicator existed which required an interim impairment analysis. This impairment indicator was a significant and sustained decrease in the Company’s overall market capitalization, as the Company’s stock price in the 2016 first quarter fell by as much as 29% from its value at December 31, 2015. As a result of this indicator, the Company conducted an interim analysis of CTGHS to determine if an impairment existed. In performing the assessment, the Company estimated the fair value of CTGHS based on a combination of the income and market approaches. The income approach uses a discounted cash flow (DCF) method which utilizes the present value of expected future cash flows to estimate fair value of the reporting unit. The future cash flows for CTGHS was projected based on estimates of future revenue, operating income and other factors such as working capital and capital expenditures and a discount rate used in the present value calculation. As part of the projections, the Company took into account expected industry and market conditions for the healthcare industry, as well as trends currently affecting CTGHS. The market approach utilizes multiples of revenue and earnings before interest expense, taxes, depreciation and amortization (EBITDA) to estimate the fair value of the reporting unit. The market multiples used for CTGHS were based on competitor industry data, along with the market multiples for the Company and other factors. The Company also completed a comparison of its overall market capitalization to the market value of CTGHS and the Company’s other non-reporting business units. Based upon the analysis performed, the Company determined that the fair value of CTGHS was less than its carrying value, which required the Company to perform a Step Two goodwill impairment test.
As a result of the first quarter Step Two analysis, the Company determined the implied fair value of its goodwill balance was below the carrying value. Accordingly, the Company recorded a non-tax deductible goodwill impairment charge of $21.5 million to reduce the value of its goodwill balance to the implied fair value.
38
During the 2016 third quarter, the Company again determined that goodwill impairment indicators existed which required an interim impairment analysis. These impairment indicators were the unexpected decline in the revenue and profits of the CTGHS business unit, the resignation of both the sales leader (who was the Company’s former CEO) and delivery leader of CTGHS in the 2016 third quarter, effectively leaving the business unit without executive leadership, and a continued decrease in the Company’s overall market capitalization. As a result of these indicators, the Company conducted an interim analysis of CTGHS to determine if an impairment existed. In performing the assessment, the Company again performed the procedures it had previously performed in the 2016 first quarter, as detailed above. The most significant changes in the Company’s Step One analysis from the first quarter to the third quarter were reductions in the Company’s estimates of future revenue and operating income based upon the unexpected negative trends experienced in the third quarter, as well as the resulting reductions in the revenue and EBITDA market multiples that correlate to the decline in our overall market capitalization. Based upon the analysis performed, the Company determined that the fair value of CTGHS was less than its carrying value, which required the Company to perform a Step Two goodwill impairment test.
As a result of the third quarter Step Two analysis, the Company determined the implied fair value of its goodwill balance was below the carrying value. Accordingly, the Company recorded a non-tax deductible goodwill impairment charge in the 2016 third quarter of $15.8 million which reduced the value of its goodwill balance to the implied fair value, or $0.0 as of September 30, 2016.
Other Intangible Assets
The Company recorded approximately $0.4 million of other intangible assets in 2013 resulting from the acquisition of etrinity, which was included in the Company’s healthcare vertical market. Previously, the Company did not have any intangible assets recorded on its accounts. These intangible assets included client relationships, trademarks, and non-compete agreements, and were being amortized over periods ranging from two to seven years. Amortization expense and an impairment charge (see “Goodwill” above) totaled approximately $0.2 million in 2016, and $0.1 million in each of 2015 and 2014. The balance for other intangible assets is $0.0 at December 31, 2016.
Income Taxes
The Company provides for deferred income taxes for the temporary differences between the financial reporting basis and the tax basis of the Company’s assets and liabilities. In assessing the realizability of deferred tax assets, management considers within each tax jurisdiction, whether it is more likely than not that some portion or all of the deferred tax assets will not be realized. Management considers the scheduled reversal of deferred tax liabilities, projected future taxable income, and tax-planning strategies in making this assessment. The Company recognizes, as applicable, accrued interest and penalties related to unrecognized tax benefits (if any) in tax expense.
The Company establishes an unrecognized tax benefit based upon the anticipated outcome of tax positions taken for financial statement purposes compared with positions taken on the Company’s tax returns. The Company records the benefit for unrecognized tax benefits only when it is more likely than not that the position will be sustained upon examination by the taxing authorities. The Company reviews its unrecognized tax benefits on a quarterly basis. Such reviews include consideration of factors such as the cause of the action, the degree of probability of an unfavorable outcome, the Company’s ability to estimate the liability, and the timing of the liability and how it will impact the Company’s other tax attributes.
Equity-Based Compensation
The Company records the fair value of equity-based compensation expense for all equity-based compensation awards granted subsequent to January 1, 2006. The calculated fair value cost of its equity-based compensation awards is recognized in the Company’s income statement over the period in which an employee or director is required to provide the services for the award. Compensation cost is not recognized for employees or directors that do not render the requisite services. The Company recognized the expense for equity-based compensation in its 2016, 2015, and 2014 statements of income on a straight-line basis based upon awards that are ultimately expected to vest. See note 10, “Equity-Based Compensation.”
39
Net Income (Loss) Per Share
Basic and diluted earnings (loss) per share (EPS) for the years ended December 31, 2016, 2015, and 2014 are as follows:
|
For the year ended |
|
Net Income (loss) |
|
|
Weighted Average Shares |
|
|
Earnings (loss) per Share |
|
|||
|
(amounts in thousands, except per-share data) |
|
|
|
|
|
|
|
|
|
|
|
|
|
December 31, 2016 |
|
|
|
|
|
|
|
|
|
|
|
|
|
Basic EPS |
|
$ |
(34,638 |
) |
|
|
15,593 |
|
|
$ |
(2.22 |
) |
|
Dilutive effect of outstanding equity instruments |
|
|
— |
|
|
|
— |
|
|
|
— |
|
|
Diluted EPS |
|
$ |
(34,638 |
) |
|
|
15,593 |
|
|
$ |
(2.22 |
) |
|
December 31, 2015 |
|
|
|
|
|
|
|
|
|
|
|
|
|
Basic EPS |
|
$ |
6,510 |
|
|
|
15,479 |
|
|
$ |
0.42 |
|
|
Dilutive effect of outstanding equity instruments |
|
|
— |
|
|
|
441 |
|
|
|
(0.01 |
) |
|
Diluted EPS |
|
$ |
6,510 |
|
|
|
15,920 |
|
|
$ |
0.41 |
|
|
December 31, 2014 |
|
|
|
|
|
|
|
|
|
|
|
|
|
Basic EPS |
|
$ |
10,350 |
|
|
|
15,120 |
|
|
$ |
0.68 |
|
|
Dilutive effect of outstanding equity instruments |
|
|
— |
|
|
|
1,140 |
|
|
|
(0.04 |
) |
|
Diluted EPS |
|
$ |
10,350 |
|
|
|
16,260 |
|
|
$ |
0.64 |
|
Weighted-average shares represent the average number of issued shares less treasury shares and shares held in the Stock Trusts, and for the basic EPS calculations, unvested restricted stock.
Certain options representing 1.9 million, 1.0 million, and 0.6 million shares of common stock were outstanding at December 31, 2016, 2015, and 2014, respectively, but were not included in the computation of diluted earnings per share as their effect on the computation would have been anti-dilutive.
Accumulated Other Comprehensive Loss
The components that comprised accumulated other comprehensive loss on the consolidated balance sheets at December 31, 2016 and 2015 are as follows:
|
(amounts in thousands) |
|
2016 |
|
|
2015 |
|
||
|
Foreign currency |
|
$ |
(8,444 |
) |
|
$ |
(7,686 |
) |
|
Pension loss, net of tax of $835 in 2016, and $906 in 2015 |
|
|
(8,319 |
) |
|
|
(6,954 |
) |
|
Accumulated other comprehensive loss |
|
$ |
(16,763 |
) |
|
$ |
(14,640 |
) |
During 2016, 2015 and 2014, actuarial losses were amortized to expense as follows:
|
(amounts in thousands) |
|
2016 |
|
|
2015 |
|
|
2014 |
|
|||
|
Amortization of actuarial losses |
|
$ |
285 |
|
|
$ |
390 |
|
|
$ |
201 |
|
|
Income tax |
|
|
(63 |
) |
|
|
(88 |
) |
|
|
(51 |
) |
|
Net of tax |
|
$ |
222 |
|
|
$ |
302 |
|
|
$ |
150 |
|
The amortization of actuarial losses is included in determining net periodic pension cost. See note 7, "Deferred Compensation Benefits" for additional information.
Foreign Currency
The functional currency of the Company’s foreign subsidiaries is the applicable local currency. The translation of the applicable foreign currencies into U.S. dollars is performed for assets and liabilities using current exchange rates in effect at the balance sheet date, for equity accounts using historical exchange rates, and for revenue and expense activity using the applicable month’s average exchange rates. The Company recorded nominal losses in 2016, 2015, and 2014 from foreign currency transactions for balances settled during the year or intended to be settled as of each respective year-end.
40
Guarantees
The Company has a number of guarantees in place in our European operations which support office leases and performance under government projects. These guarantees totaled approximately $1.1 million and $1.2 million at December 31, 2016 and 2015, respectively, and generally have expiration dates ranging from January 2017 through April 2020.
Recently Issued Accounting Standards
In May 2014, the Financial Accounting Standards Board (FASB) issued Accounting Standards Update No. 2014-09, "Revenue from Contracts with Customers (Topic 606)," ("ASU 2014-09"). ASU 2014-09 outlines a new, single comprehensive model for entities to use in accounting for revenue arising from contracts with customers and supersedes most current revenue recognition guidance, including industry-specific guidance. This new revenue recognition model provides a five-step analysis in determining when and how revenue is recognized. The new model will require revenue recognition to depict the transfer of promised goods or services to customers in an amount that reflects the consideration a company expects to receive in exchange for those goods or services. The pronouncement is effective for fiscal years, and interim periods within those years, beginning after December 15, 2017, and early adoption is only permitted in years beginning after December 31, 2016.
The Company currently records approximately 98% of its annual revenue on a time-and-material and progress billing basis, with the remaining 2% recorded under a proportional method of accounting using an inputs based methodology for fixed price projects. For the 98% of the Company’s revenue recorded under the time-and-material method of accounting, the Company does not expect this new standard to change the timing or the amount of revenue that is recorded. The Company is currently evaluating the revenue recorded under its fixed price projects to determine if the manner or timing of revenue recognition would change for existing projects. However, the Company does not expect the impact of adopting this new accounting guidance will have a material impact on its consolidated operating results, and related footnote disclosures.
In November 2015, the FASB issued ASU 2015-17, “Balance Sheet Classifications of Deferred Taxes,” which amended accounting guidance related to the presentation of deferred tax liabilities and assets. The amended guidance requires that all deferred tax liabilities and assets be classified as noncurrent on the balance sheet. This guidance is effective for reporting periods beginning after December 15, 2016. This guidance can also be applied either prospectively to all deferred tax liabilities and assets or retrospectively to all periods presented. Upon adoption of this guidance in 2017, the Company, given current financial results, would reclassify approximately $0.9 million from current to non-current assets.
In February 2016, the FASB issued ASU 2016-02, “Leases (Topic 842),” which sets out the principles for the recognition, measurement, presentation and disclosure of leases for both parties to a contract (i.e. lessees and lessors). The new standard requires lessees to apply a dual approach, classifying leases as either finance or operating leases based on the principle of whether or not the lease is effectively a financed purchase by the lessee. This classification will determine whether lease expense is recognized based on an effective interest method or on a straight line basis over the term of the lease, respectively. A lessee is also required to record a right-of-use asset and a lease liability for all leases with a term of greater than 12 months regardless of their classification. Leases with a term of 12 months or less will be accounted for similar to existing guidance for operating leases today. Topic 842 supersedes the previous leases standard, ASC 840, Leases. This guidance is effective for reporting periods beginning after December 15, 2018; however, early adoption is permitted. Entities are required to use a modified retrospective approach for leases that exist or are entered into after the beginning of the earliest comparative period in the financial statements. The Company is currently evaluating the impact that ASU 2016-02 will have on its condensed consolidated financial statements.
In March 2016, the FASB issued ASU 2016-09, “Improvements to Employee Share-Based Payment Accounting,” which amended accounting guidance related to seven aspects of the accounting for share-based payments award transactions. This guidance is effective for reporting periods beginning after December 15, 2016. Although the Company does not believe the impact of adopting ASU 2016-09 will have a material impact on its consolidated financial statements in 2017, the Company does anticipate recording approximately $0.1 million of additional tax expense for tax shortfalls in the 2017 first quarter that would previously have been recorded to capital in excess of par value.
41
|
2. |
Property, Equipment and Capitalized Software |
Property, equipment and capitalized software at December 31, 2016 and 2015 are summarized as follows:
|
December 31, |
|
Useful Life |
|
|
2016 |
|
|
2015 |
|
|||
|
(amounts in thousands) |
|
(years) |
|
|
|
|
|
|
|
|
|
|
|
Land |
|
|
— |
|
|
$ |
378 |
|
|
$ |
378 |
|
|
Buildings |
|
|
30 |
|
|
|
4,256 |
|
|
|
4,300 |
|
|
Equipment |
|
2 - 5 |
|
|
|
6,204 |
|
|
|
6,710 |
|
|
|
Furniture |
|
5 - 10 |
|
|
|
2,918 |
|
|
|
3,107 |
|
|
|
Capitalized software |
|
2 - 5 |
|
|
|
2,683 |
|
|
|
2,160 |
|
|
|
Other software |
|
1 - 5 |
|
|
|
1,999 |
|
|
|
2,679 |
|
|
|
Leasehold improvements |
|
3 - 10 |
|
|
|
5,051 |
|
|
|
4,737 |
|
|
|
|
|
|
|
|
|
|
23,489 |
|
|
|
24,071 |
|
|
Accumulated depreciation and amortization |
|
|
|
|
|
|
(17,626 |
) |
|
|
(18,583 |
) |
|
|
|
|
|
|
|
$ |
5,863 |
|
|
$ |
5,488 |
|
The Company recorded additions to capitalized software of $0.5 million and $0.6 million during the years ended December 31, 2016 and December 31, 2015, respectively. As of these dates the Company had capitalized a total of $2.7 million and $2.2 million, respectively, solely for software projects developed for commercial use. Accumulated amortization for these projects totaled $1.9 million and $1.7 million as of December 31, 2016 and 2015, respectively. Amortization expense for these projects totaled $0.2 million, $0.4 million, and $1.2 million in 2016, 2015, and 2014, respectively.
During the 2015 second quarter, the Company recorded expense for the impairment of one of its capitalized software projects related to IT medical management, primarily for chronic kidney disease, after determining that it had no net realizable value. Although the Company experienced some sales success with research institutions, the Company had been unable to sell the product to payers, its intended market, and discontinued the effort to sell the technology. The remaining net asset value, totaling approximately $1.1 million, was written-off to direct costs in the 2015 second quarter operating results.
During the 2014 fourth quarter, the Company recorded the expense for the impairment of its fraud, waste and abuse software solution after determining that it had no net realizable value. The impairment was a result of nominal sales results for this software solution in recent years, and the uncertainty of sales in the foreseeable future. The remaining net asset value, totaling approximately $1.5 million, was written-off to direct costs in the 2014 fourth quarter operating results.
|
3. |
Investments |
The Company’s investments consist of mutual funds which are part of the Computer Task Group, Incorporated Non-qualified Key Employee Deferred Compensation Plan. At December 31, 2016 and 2015, the Company’s investment balances, which are classified as trading securities, totaled approximately $0.4 million and $0.3 million, respectively, and were measured at fair value. As there is an active trading market for these funds, fair value was determined using Level 1 inputs (see note 1 “Summary of Significant Accounting Policies—Fair Value”). Unrealized gains and losses on these securities are recorded in earnings and were nominal in 2016, 2015, and 2014.
|
4. |
Debt |
In April 2014, the Company's unsecured revolving credit agreement, which allowed the Company to borrow up to $35.0 million, expired. During April 2014, the Company entered into a new, demand line of credit with its banks totaling $40.0 million, which was extended for three years until April 2017. In October 2015, the Company entered into a new unsecured revolving credit agreement which replaced the demand line of credit and allows the Company to borrow up to $40.0 million. The agreement also allows under its provisions for the Company to borrow up to $17.5 million against the cash surrender value of the Company's life insurance policies. The new agreement expires in October 2018, and has interest rates ranging from 0 to 50 basis points over the prime rate, and 150 to 200 basis points over LIBOR. The Company can borrow under the agreement with either a prime rate or LIBOR rate borrowing at its discretion. At December 31, 2016 and 2015, there was $4.7 million $1.2 million outstanding under the new revolving credit agreement. At December 31, 2014, there was no amount outstanding under the demand line of credit. The Company borrows or repays its debt as needed based upon its working capital obligations, including the timing of the U.S. bi-weekly payroll.
42
The maximum amount outstanding under its credit agreements in 2016 and 2015 was $4.7 million and $10.0 million, respectively. The Company did not borrow any funds under its various credit agreements at any time during 2014. In 2016 and 2015, the average amounts outstanding were $1.9 million and $5.0 million, respectively, and carried weighted-average interest rates of 2.9% and 1.8%, respectively. Total commitment fees incurred in 2016, 2015 and 2014 totaled less than $0.1 million in each year, while interest paid in 2016 and 2015 totaled less than $0.1 million in each year.
Under the new agreement, the Company is required to meet certain financial covenants in order to maintain borrowings under its revolving credit line, pay dividends, and make acquisitions. The covenants are measured quarterly, and at December 31, 2016, included a leverage ratio (total outstanding debt divided by earnings before interest, taxes, depreciation and amortization (EBITDA) which must be no greater than 2.75 to 1, a calculation of minimum tangible net worth (total shareholders' equity less goodwill and intangible assets) which must be no less than $49.5 million, and total annual expenditures for property, equipment and capitalized software must be no more than $5.0 million. The Company was in compliance with these covenants at December 31, 2016 as the leverage ratio was 0.66, the minimum tangible net worth was $80.9 million, and capital expenditures for property, equipment and capitalized software were $2.2 million in 2016. The Company was also in compliance with its covenants at December 31, 2015.
|
5. |
Income Taxes |
The provision for income taxes for 2016, 2015, and 2014 consists of the following:
|
|
|
2016 |
|
|
2015 |
|
|
2014 |
|
|||
|
(amounts in thousands) |
|
|
|
|
|
|
|
|
|
|
|
|
|
Domestic and foreign components of income (loss) before income taxes are as follows: |
|
|
|
|
|
|
|
|
|
|
|
|
|
Domestic |
|
$ |
(35,100 |
) |
|
$ |
9,867 |
|
|
$ |
14,885 |
|
|
Foreign |
|
|
1,564 |
|
|
|
862 |
|
|
|
2,053 |
|
|
Total income (loss) before income taxes |
|
$ |
(33,536 |
) |
|
$ |
10,729 |
|
|
$ |
16,938 |
|
|
The provision (benefit) for income taxes consists of: |
|
|
|
|
|
|
|
|
|
|
|
|
|
Current tax: |
|
|
|
|
|
|
|
|
|
|
|
|
|
U.S. federal |
|
$ |
47 |
|
|
$ |
2,212 |
|
|
$ |
4,023 |
|
|
Foreign |
|
|
1,533 |
|
|
|
1,085 |
|
|
|
1,505 |
|
|
U.S. state and local |
|
|
101 |
|
|
|
495 |
|
|
|
831 |
|
|
Total current tax |
|
|
1,681 |
|
|
|
3,792 |
|
|
|
6,359 |
|
|
Deferred tax: |
|
|
|
|
|
|
|
|
|
|
|
|
|
U.S. federal |
|
|
(584 |
) |
|
|
337 |
|
|
|
273 |
|
|
Foreign |
|
|
28 |
|
|
|
(19 |
) |
|
|
(97 |
) |
|
U.S. state and local |
|
|
(23 |
) |
|
|
109 |
|
|
|
53 |
|
|
Total deferred tax |
|
|
(579 |
) |
|
|
427 |
|
|
|
229 |
|
|
Total tax |
|
$ |
1,102 |
|
|
$ |
4,219 |
|
|
$ |
6,588 |
|
|
The effective and statutory income tax rate can be reconciled as follows: |
|
|
|
|
|
|
|
|
|
|
|
|
|
Tax at statutory rate of 35% / 34% |
|
$ |
(11,402 |
) |
|
$ |
3,648 |
|
|
$ |
5,928 |
|
|
State tax, net of federal benefit |
|
|
47 |
|
|
|
409 |
|
|
|
578 |
|
|
Non-taxable income |
|
|
(495 |
) |
|
|
(576 |
) |
|
|
(520 |
) |
|
Non-deductible expenses |
|
|
13,465 |
|
|
|
686 |
|
|
|
803 |
|
|
Change in estimate primarily related to foreign taxes |
|
|
46 |
|
|
|
192 |
|
|
|
134 |
|
|
Change in estimate primarily related to U.S. federal taxes |
|
|
0 |
|
|
|
178 |
|
|
|
— |
|
|
Tax credits |
|
|
(552 |
) |
|
|
(253 |
) |
|
|
(421 |
) |
|
Other, net |
|
|
(7 |
) |
|
|
(65 |
) |
|
|
86 |
|
|
Total tax |
|
$ |
1,102 |
|
|
$ |
4,219 |
|
|
$ |
6,588 |
|
|
Effective income tax rate |
|
|
(3.3 |
)% |
|
|
39.3 |
% |
|
|
38.9 |
% |
The Company’s effective tax rate (ETR) is calculated based upon the full year's operating results, and various tax related items. The Company’s normal ETR ranges from 38% to 40%. The ETR was lower than the normal range in 2016 primarily due to the non-deductible goodwill impairment charges totaling $37.3 million taken in the first and third quarters, and also due to the extension of the Work Opportunity Tax Credit (WOTC) and the Research and Development tax credit (R&D) which were renewed by the U.S. federal government in the 2015 fourth quarter and were effective for all of 2016.
43
The expected relationship between foreign income before taxes and the foreign provision for income taxes differs from the actual relationship above as a result of certain foreign losses incurred for which no tax benefit has been recognized. Management has determined that it is unclear whether operations in those jurisdictions will produce taxable income in future years sufficient to realize the benefit of the losses in those jurisdictions. In addition, certain costs deducted for financial statement purposes are not deductible for tax purposes in some foreign jurisdictions, such as various employee benefit costs, resulting in a substantial increase to foreign taxable income.
The Company’s deferred tax assets and liabilities at December 31, 2016 and 2015 consist of the following:
|
December 31, |
|
2016 |
|
|
2015 |
|
||
|
(amounts in thousands) |
|
|
|
|
|
|
|
|
|
Assets |
|
|
|
|
|
|
|
|
|
Deferred compensation |
|
$ |
6,735 |
|
|
$ |
6,548 |
|
|
Loss and credit carryforwards |
|
|
1,568 |
|
|
|
1,064 |
|
|
Accruals deductible for tax purposes when paid |
|
|
403 |
|
|
|
379 |
|
|
Depreciation |
|
|
63 |
|
|
|
61 |
|
|
Allowance for doubtful accounts |
|
|
150 |
|
|
|
107 |
|
|
State taxes |
|
|
593 |
|
|
|
596 |
|
|
Other |
|
|
24 |
|
|
|
— |
|
|
Gross deferred tax assets |
|
|
9,536 |
|
|
|
8,755 |
|
|
Deferred tax asset valuation allowance |
|
|
(2,650 |
) |
|
|
(2,349 |
) |
|
Gross deferred tax assets less valuation allowance |
|
|
6,886 |
|
|
|
6,406 |
|
|
Liabilities |
|
|
|
|
|
|
|
|
|
Other |
|
|
— |
|
|
|
(29 |
) |
|
Gross deferred tax liabilities |
|
|
— |
|
|
|
(29 |
) |
|
Net deferred tax assets |
|
$ |
6,886 |
|
|
$ |
6,377 |
|
|
Net deferred tax assets and liabilities are recorded as follows: |
|
|
|
|
|
|
|
|
|
Net current assets |
|
$ |
869 |
|
|
$ |
804 |
|
|
Net non-current assets |
|
|
6,017 |
|
|
|
5,573 |
|
|
Net deferred tax assets |
|
$ |
6,886 |
|
|
$ |
6,377 |
|
In assessing the realizability of deferred tax assets, management considers, within each taxing jurisdiction, whether it is more likely than not that all or some portion of the deferred tax assets will be realized, or that a valuation allowance is required. Management considers all available evidence, both positive and negative, in assessing realizability of its deferred tax assets. A key component of this assessment is management’s critical evaluation of current and future impacts of business and economic factors on the Company’s ability to generate future taxable income. Factors that may affect the Company’s ability to generate taxable income include, but are not limited to: increased competition, a decline in revenue or margins, a loss of market share, the availability of qualified professional staff, and a decrease in demand for the Company’s services. Based on the Company’s long history of profitability for tax purposes and expected profitability in future years and assessment of the factors discussed above, management has determined that it is more likely than not that it will realize its U.S. deferred tax assets, and accordingly no valuation allowance has been recorded against these assets. Additionally, management has determined that valuation allowances are required against its UK, Netherlands, and India deferred taxes. The total valuation allowance recorded against these deferred tax assets is $2.7 million, an increase of $0.3 million during the year.
The Company has various U.S. state net operating loss carryforwards of $0.1 million which begin to expire in 2021. The Company has U.S. federal credit carryovers of $0.6 million which expire in 2036. The Company has Netherlands net operating loss carryforwards of $0.4 million which expire between 2018 and 2024. The Company has United Kingdom net operating loss carryforwards of $4.1 million which have no expiration date.
The Company files income tax returns in the U.S. federal jurisdiction, and various states and foreign jurisdictions. With few exceptions, the Company is no longer subject to U.S. federal, state and local, or non-U.S. income tax examinations by tax authorities for years prior to 2012.
44
At December 31, 2016, the Company believes it has adequately provided for its tax-related liabilities, and that no reserve for unrecognized tax benefits is necessary. No significant change in the total amount of unrecognized tax benefits is expected within the next twelve months. The Company recognizes accrued interest and penalties related to unrecognized tax benefits (if any) in tax expense, as applicable. At December 31, 2016, the Company had no accrual for the payment of interest and penalties.
At December 31, 2016, the undistributed earnings of the Company’s foreign subsidiaries which totaled approximately $22.3 million, are considered to be indefinitely reinvested and, accordingly, no provision for taxes has been provided thereon. Given the complexities of the foreign tax credit calculations, it is not practicable to compute the tax liability that would be due upon distribution of those earnings in the form of dividends or liquidation or sale of the foreign subsidiaries.
The Company recorded tax expense (benefit) to capital in excess of par value in 2016, 2015, and 2014 in the amounts of $0.2 million, $(0.4) million, and $(2.0) million, respectively. These tax benefits have also been recognized in the consolidated balance sheets as an increase (reduction) of income taxes payable.
Net income tax payments during 2016, 2015, and 2014 totaled $2.1 million, $2.2 million, and $5.8 million, respectively.
|
6. |
Lease Commitments |
At December 31, 2016, the Company was obligated under a number of long-term operating leases, some of which contain renewal options with escalation clauses commensurate with local market fluctuations, however, generally limiting an annual increase to no more than 5.0% of the existing lease payment.
Minimum future obligations under such leases as of December 31, 2016 are summarized as follows:
|
(amounts in thousands) |
|
|
|
|
|
2017 |
|
$ |
4,106 |
|
|
2018 |
|
|
3,002 |
|
|
2019 |
|
|
1,895 |
|
|
2020 |
|
|
685 |
|
|
2021 |
|
|
261 |
|
|
Later years |
|
|
- |
|
|
Minimum future obligations |
|
$ |
9,949 |
|
The operating lease obligations relate to the rental of office space, office equipment, and automobiles leased in Europe. Total rental expense under such operating leases for 2016, 2015, and 2014 was approximately $5.7 million, $6.1 million, and $7.0 million, respectively.
|
7. |
Deferred Compensation Benefits |
The Company maintains a non-qualified defined-benefit Executive Supplemental Benefit Plan (ESBP) that provides certain former key executives with deferred compensation benefits, based on years of service and base compensation, payable during retirement. The plan was amended as of November 30, 1994, to freeze benefits for the participants in the plan at that time.
Net periodic pension cost for the years ended December 31, 2016, 2015, and 2014 for the ESBP is as follows:
|
Net Periodic Pension Cost—ESBP |
|
2016 |
|
|
2015 |
|
|
2014 |
|
|||
|
(amounts in thousands) |
|
|
|
|
|
|
|
|
|
|
|
|
|
Interest cost |
|
$ |
243 |
|
|
$ |
261 |
|
|
$ |
276 |
|
|
Amortization of actuarial loss |
|
|
173 |
|
|
|
240 |
|
|
|
138 |
|
|
Net periodic pension cost |
|
$ |
416 |
|
|
$ |
501 |
|
|
$ |
414 |
|
45
The Company also retained certain potential obligations related to a contributory defined-benefit plan for its previous employees located in the Netherlands (NDBP) when the Company disposed of its subsidiary, CTG Nederland, B.V. Benefits paid are a function of a percentage of career average pay. This plan was curtailed for additional contributions in January 2003. Net periodic pension cost was approximately $73,000, $72,000, and $90,000 for the years ending December 31, 2016, 2015 and 2014, respectively.
The change in benefit obligation and reconciliation of fair value of plan assets for the years ended December 31, 2016 and 2015 for the ESBP and NDBP are as follows:
|
|
|
ESBP |
|
|
NDBP |
|
||||||||||
|
Changes in Benefit Obligation |
|
2016 |
|
|
2015 |
|
|
2016 |
|
|
2015 |
|
||||
|
(amounts in thousands) |
|
|
|
|
|
|
|
|
|
|
|
|
|
|
|
|
|
Benefit obligation at beginning of period |
|
$ |
7,270 |
|
|
$ |
8,274 |
|
|
$ |
11,897 |
|
|
$ |
14,932 |
|
|
Interest cost |
|
|
243 |
|
|
|
261 |
|
|
|
240 |
|
|
|
203 |
|
|
Benefits paid |
|
|
(691 |
) |
|
|
(731 |
) |
|
|
(148 |
) |
|
|
(133 |
) |
|
Actuarial loss (gain) |
|
|
(22 |
) |
|
|
(534 |
) |
|
|
1,819 |
|
|
|
(1,597 |
) |
|
Effect of exchange rate changes |
|
|
— |
|
|
|
— |
|
|
|
(522 |
) |
|
|
(1,508 |
) |
|
Benefit obligation at end of period |
|
|
6,800 |
|
|
|
7,270 |
|
|
|
13,286 |
|
|
|
11,897 |
|
|
Reconciliation of Fair Value of Plan Assets |
|
|
|
|
|
|
|
|
|
|
|
|
|
|
|
|
|
Fair value of plan assets at beginning of period |
|
|
— |
|
|
|
— |
|
|
|
7,106 |
|
|
|
7,910 |
|
|
Actual return on plan assets |
|
|
— |
|
|
|
— |
|
|
|
221 |
|
|
|
142 |
|
|
Employer contributions |
|
|
691 |
|
|
|
731 |
|
|
|
— |
|
|
|
— |
|
|
Benefits paid |
|
|
(691 |
) |
|
|
(731 |
) |
|
|
(148 |
) |
|
|
(133 |
) |
|
Effect of exchange rate changes |
|
|
— |
|
|
|
— |
|
|
|
(259 |
) |
|
|
(813 |
) |
|
Fair value of plan assets at end of period |
|
|
— |
|
|
|
— |
|
|
|
6,920 |
|
|
|
7,106 |
|
|
Accrued benefit cost |
|
$ |
6,800 |
|
|
$ |
7,270 |
|
|
$ |
6,366 |
|
|
$ |
4,791 |
|
|
Accrued benefit cost is included in the consolidated balance sheet as follows: |
|
|
|
|
|
|
|
|
|
|
|
|
|
|
|
|
|
Current liabilities |
|
$ |
651 |
|
|
$ |
673 |
|
|
$ |
— |
|
|
$ |
— |
|
|
Non-current liabilities |
|
$ |
6,149 |
|
|
$ |
6,597 |
|
|
$ |
6,366 |
|
|
$ |
4,791 |
|
|
Discount rates: |
|
|
|
|
|
|
|
|
|
|
|
|
|
|
|
|
|
Benefit obligation |
|
|
3.41 |
% |
|
|
3.51 |
% |
|
|
1.30 |
% |
|
|
2.00 |
% |
|
Net periodic pension cost |
|
|
3.51 |
% |
|
|
3.30 |
% |
|
|
2.00 |
% |
|
|
1.50 |
% |
|
Salary increase rate |
|
|
— |
% |
|
|
— |
% |
|
|
— |
% |
|
|
— |
% |
|
Expected return on plan assets |
|
|
— |
% |
|
|
— |
% |
|
|
4.00 |
% |
|
|
4.00 |
% |
For the ESBP, the accumulated benefit obligation at December 31, 2016 and 2015 was $6.8 million and $7.3 million, respectively. The amounts included in other comprehensive loss relating to the pension loss adjustment in 2016 and 2015, net of tax, were approximately $(0.4) million and $(0.5) million, respectively. The discount rate used in 2016 was 3.41%, which is reflective of a series of bonds that are included in the Moody’s Aa long-term corporate bond yield whose cash flow approximates the payments to participants under the ESBP for the remainder of the plan. This rate was a decrease of 10 basis points from the rate used in the prior year and resulted in a increase in the plan’s liabilities of approximately $0.05 million. Benefits paid to participants are funded by the Company as needed, and are expected to total approximately $0.7 million in 2017. The plan is deemed unfunded as the Company has not specifically identified Company assets to be used to discharge the deferred compensation benefit liabilities. The Company has purchased insurance on the lives of certain plan participants in amounts considered sufficient to reimburse the Company for the costs associated with the plan for those participants. The Company does not anticipate making contributions to the plan other than for current year benefit payments as required in 2017 or future years.
For the NDBP, the accumulated benefit obligation at December 31, 2016 and 2015 was $13.3 million and $11.9 million, respectively. The discount rate used in 2016 was 1.3%, which is reflective of a series of corporate bonds whose cash flow approximates the payments to participants under the NDBP for the remainder of the plan. This rate was a decrease of 70 basis points from the rate used in the prior year due to changes in the economic environment in Europe, and resulted in a increase in the plan’s liabilities of $1.8 million in 2016.
46
The assets for the NDBP are held by Aegon, a financial services firm located in the Netherlands. The Company maintains a contract with Aegon to insure future benefit payments of the NDBP; however, due to certain terms of the agreement and potential obligations to the Company, the NDBP has not been settled. The benefit payments to be made in 2017 are expected to be paid by Aegon from plan assets. The assets for the plan are included in a general portfolio of government bonds, a portion of which is allocated to the NDBP based upon the estimated pension liability associated with the plan. The fair market value of the plan’s assets equals the contractual value of the NDBP in any given year. The fair value of the assets is determined using a Level 3 methodology (see note 1 “Summary of Significant Accounting Policies—Fair Value”). In 2016 and 2015, the plan investments had a targeted minimum return of 4.0%, which is consistent with historical returns and the 4.0% return guaranteed to the participants of the plan. Aegon intends to maintain the current investment strategy of investing plan assets solely in government bonds in 2017.
Anticipated benefit payments for the ESBP and the NDBP expected to be paid in future years are as follows:
|
|
|
ESBP |
|
|
NDBP |
|
||
|
(amounts in thousands) |
|
|
|
|
|
|
|
|
|
2017 |
|
$ |
662 |
|
|
$ |
150 |
|
|
2018 |
|
|
649 |
|
|
|
183 |
|
|
2019 |
|
|
649 |
|
|
|
208 |
|
|
2020 |
|
|
599 |
|
|
|
228 |
|
|
2021 |
|
|
576 |
|
|
|
234 |
|
|
2022 - 2026 |
|
|
2,428 |
|
|
|
1,424 |
|
|
Total |
|
$ |
5,563 |
|
|
$ |
2,427 |
|
For the ESBP and the NDBP, the amounts included in accumulated other comprehensive loss, net of tax, that have not yet been recognized as components of net periodic benefit cost as of December 31, 2016 are $1.4 million and $6.9 million, respectively, for unrecognized actuarial losses. The amounts included in accumulated other comprehensive loss, net of tax, that had not yet been recognized as components of net periodic benefit cost as of December 31, 2015 were $1.5 million and $5.4 million, respectively, also for unrecognized actuarial losses.
The amounts recognized in other comprehensive income (loss), net of tax, for 2016, 2015, and 2014, which primarily consist of an actuarial gain (loss) related to year-over-year changes in the discount rate, totaled $(1.4) million, $2.8 million, and $(4.6) million (primarily due to the decrease in the discount rate for the NDBP), respectively. Net periodic pension benefit (cost), and the amounts recognized in other comprehensive loss, net of tax, for the ESBP and the NDBP for 2016, 2015, and 2014 totaled $1.8 million, $2.3 million, and $(5.1) million, respectively.
The amounts in accumulated other comprehensive loss expected to be recognized as components of net periodic benefit cost during 2017 for the ESBP and the NDBP for unrecognized actuarial losses total $0.3 million.
The Company also maintains the Key Employee Non-Qualified Deferred Compensation Plan for certain key executives. Company contributions to this plan, if any, are based on annually defined financial performance objectives. There were $0.2 million in contributions to the plan in 2016 for amounts earned in 2015, $0.1 million in contributions to the plan in 2015 for amounts earned in 2014, and $0.2 million in contributions to the plan in 2014 for amounts earned in 2013. The Company anticipates making contributions in 2017 totaling approximately $0.1 million to this plan for amounts earned in 2016. The investments in the plan are included in the total assets of the Company, and are discussed in note 3, “Investments.” Participants in the plan have the ability to purchase stock units from the Company at current market prices using their available investment balances within the plan. In return for the funds received, the Company releases shares out of treasury stock equivalent to the number of share units purchased by the participants. These shares of common stock are not entitled to any voting rights, but will receive dividends in the event any are paid. The shares are being held by the Company, and will be released to the participants as prescribed by their payment elections under the plan.
The Company maintains the Non-Employee Director Deferred Compensation Plan for its non-employee directors. Cash contributions were made to the plan for certain of these directors totaling approximately $0.4 million in 2016, $0.5 million in 2015 and $0.4 million in 2014. At the time the contributions were made, the non-employee directors elected to purchase stock units from the Company at current market prices using their available investment balance within the plan. Consistent with the Key Employee Non-Qualified Deferred Compensation Plan, in return for funds received, the Company released shares out of treasury stock equivalent to the number of share units purchased by the participants. These shares of common stock are not entitled to any voting rights, but will receive dividends in the event any are paid. The shares are being held by the Company, and will be released to the participants as prescribed by their payment elections under the plan.
47
|
8. |
Employee Benefits |
401(k) Profit-Sharing Retirement Plan
The Company maintains a contributory 401(k) profit-sharing retirement plan covering substantially all U.S. employees. At its discretion, the Company may match up to 50% of the first 6% of eligible wages contributed by the participants. This match was indefinitely suspended as of January 1, 2017. Company contributions, net of forfeitures, which currently consist of cash and may include the Company’s stock, were funded and charged to operations in the amounts of $2.0 million, $3.0 million, and $2.3 million for 2016, 2015, and 2014, respectively.
Other Retirement Plans
The Company maintains various other defined contribution retirement plans covering substantially all of the remaining European employees. Company contributions charged to operations were $0.1 million in 2016, $0.2 million in 2015, and $0.2 million in 2014.
Employee Health Insurance
The Company provides various health insurance plans for its employees, including a self-insured plan for its salaried and hourly employees in the U.S. In 2015, the Company began offering compliant healthcare coverage as required under The Patient Protection and Affordable Care Act (PPACA). Where possible, the Company has passed the cost of this coverage on to its customers where the employees that elect this coverage are engaged.
|
9. |
Shareholders’ Equity |
Employee Stock Purchase Plan
Under the Company’s First Employee Stock Purchase Plan (ESPP), employees may apply up to 10% of their compensation to purchase the Company’s common stock. Shares are purchased at the closing market price on the business day preceding the date of purchase. As of December 31, 2016, approximately 136,000 shares remain unissued under the ESPP. During 2016, 2015, and 2014, approximately 44,000, 37,000, and 24,000 shares, respectively, were purchased under the ESPP at an average price of $4.91, $7.38, and $13.35 per share, respectively.
Stock Trusts
The Company previously maintained a Stock Employee Compensation Trust (SECT) to provide funding for existing employee stock plans and benefit programs. Shares of the Company’s common stock were purchased by and released from the SECT by the trustee of the SECT at the request of the compensation committee of the Board of Directors. During 2016, the SECT was dissolved, and all shares remaining in the SECT, totaling approximately 2.7 million shares, were transferred into treasury stock. There were 503,000 and 98,000 shares, respectively, released by the SECT during 2016 (prior to the dissolution of the SECT) and 2015, while no shares were released during 2014. No shares were purchased by the SECT during 2016, 2015, and 2014, and previously there were 3.2 million and 3.3 million shares in the SECT at December 31, 2015 and 2014, respectively.
The Company created an Omnibus Stock Trust (OST) to provide funding for various employee benefit programs. Shares of the Company’s common stock are released from the OST by the trustee at the request of the compensation committee of the Board of Directors. The OST was also dissolved during 2016, and the remaining 59,000 shares were transferred into treasury stock. There were no shares purchased or released by the OST during 2016, 2015, or 2014, and previously there were 59,000 shares in the OST at both December 31, 2015 and 2014.
Preferred Stock
At December 31, 2016 and 2015, the Company had 2.5 million shares of par value $0.01 preferred stock authorized for issuance, but none outstanding.
48
|
10. |
Equity-Based Compensation |
The Company issues stock options and restricted stock in exchange for employee and director services. In accordance with current accounting standards, the calculated cost of its equity-based compensation awards is recognized in the Company’s consolidated statements of income over the period in which an employee or director is required to provide the services for the award. Compensation cost will not be recognized for employees or directors that do not render the requisite services. The Company recognizes the expense for equity-based compensation in its consolidated income statements on a straight-line basis based upon the number of awards that are ultimately expected to vest.
Equity-based compensation expense, the corresponding tax benefit and net equity-based compensation expense for 2016, 2015 and 2014 are as follows:
|
|
|
2016 |
|
|
2015 |
|
|
2014 |
|
|||
|
(amounts in thousands) |
|
|
|
|
|
|
|
|
|
|
|
|
|
Equity-based compensation expense |
|
$ |
1,626 |
|
|
$ |
1,317 |
|
|
$ |
3,088 |
|
|
Tax benefit |
|
|
516 |
|
|
|
413 |
|
|
|
1,098 |
|
|
Net equity-based compensation expense |
|
$ |
1,110 |
|
|
$ |
904 |
|
|
$ |
1,990 |
|
On May 12, 2010, the shareholders approved the Company’s 2010 Equity Award Plan (2010 Plan). Under the provisions of the 2010 Plan, stock options, restricted stock, stock appreciation rights, and other awards may be granted or awarded to employees and directors of the Company, as well as non-employees. The compensation committee of the Board of Directors determines the nature, amount, pricing and vesting of the grants or awards. All options and awards remain in effect until the earliest of the expiration, exercise, or surrender date. Options generally become exercisable in four equal installments, typically beginning one year from the date of grant, and expire no more than 15 years from the date of grant. A total of 1,900,000 shares may be granted or awarded under the 2010 plan, 441,000 of which are available for grant as of December 31, 2016.
On April 26, 2000, the shareholders approved the Company’s 2000 Equity Award Plan (Equity Plan). Under the provisions of the Equity Plan, stock options, restricted stock, stock appreciation rights, and other awards could previously be granted or awarded to employees and directors of the Company. The compensation committee of the Board of Directors determined the nature, amount, pricing, and vesting of the grants or awards. All options and awards remain in effect until the earlier of the expiration, exercise, or surrender date. Options generally become exercisable in three or four equal annual installments, typically beginning one year from the date of grant, and expire no more than 15 years from the date of grant. In certain limited instances, options granted at fair market value were expected to vest nine and one-half years from the date of grant. There are no shares or options available for grant under this plan as of December 31, 2016.
Under the Company’s 1991 Restricted Stock Plan, a total of 800,000 shares of restricted stock may be granted to certain key employees, 44,000 of which are available for grant as of December 31, 2016.
The Company utilizes the Black-Scholes option-pricing model to estimate the fair value of stock options granted on the date of grant. The per-option weighted-average fair value on the date of grant of stock options granted in 2016, 2015, and 2014 was $0.96, $2.17, and $5.91, respectively.
The fair value of the options at the date of grant was estimated using the following weighted-average assumptions for the years ended December 31, 2016, 2015 and 2014:
|
|
|
2016 |
|
|
2015 |
|
|
2014 |
|
|||
|
Expected life (years) |
|
|
4.2 |
|
|
|
4.4 |
|
|
|
4.1 |
|
|
Dividend yield |
|
|
4.8 |
% |
|
|
3.2 |
% |
|
|
1.4 |
% |
|
Risk-free interest rate |
|
|
1.2 |
% |
|
|
1.4 |
% |
|
|
1.2 |
% |
|
Expected volatility |
|
|
36.2 |
% |
|
|
44.2 |
% |
|
|
48.0 |
% |
The Company used historical volatility calculated using daily closing prices for its common stock over periods that equal the expected term of the options granted to estimate the expected volatility for the grants made in 2014, 2015 and 2016. The risk-free interest rate assumption was based upon U.S. Treasury yields appropriate for the expected term of the Company’s stock options based upon the date of grant. The expected term of the stock options granted was based upon the options expected vesting schedule and historical exercise patterns. The expected dividend yield was based upon the Company’s recent history of paying dividends since 2013, and the expectation of paying dividends in the foreseeable future at the time of the grant in August 2016.
49
During 2014, 2015 and 2016, the Company issued restricted stock to certain employees. The stock vests over a period of four years, with 25% of the stock issued vesting one year from the date of grant, and another 25% vesting each year thereafter until the stock is fully vested. The Company is recognizing compensation expense for these shares ratably over the expected term of the restricted stock, or four years. In the event the Company issued stock to its independent directors, the stock vests at retirement. As the directors are eligible for retirement from the Company’s Board of Directors at any point in time, the Company will recognize the expense associated with these shares on the date of grant. The shares of restricted stock issued are considered outstanding, can be voted, and are eligible to receive dividends, if any are paid. However, the restricted shares do not include a non-forfeitable right for the holder to receive dividends and none will be paid in the event the awards do not vest. Accordingly, only vested shares of outstanding restricted stock are included in the calculation of basic earnings per share.
As of December 31, 2016, total remaining stock-based compensation expense for non-vested equity-based compensation was approximately $2.6 million, which is expected to be recognized on a weighted-average basis over the next 18 months. Historically, the Company has issued shares out of treasury stock or the SECT to fulfill the share requirements from stock option exercises and restricted stock grants.
A summary of stock option activity under the 2010 Plan and Equity Plan is as follows:
|
|
|
2010 Plan Options |
|
|
Weighted- Average Exercise Price |
|
|
Equity Plan Options |
|
|
Weighted- Average Exercise Price |
|
||||
|
Outstanding at December 31, 2013 |
|
|
660,471 |
|
|
$ |
15.93 |
|
|
|
2,472,147 |
|
|
$ |
4.67 |
|
|
Granted |
|
|
107,000 |
|
|
$ |
16.93 |
|
|
|
— |
|
|
$ |
— |
|
|
Exercised |
|
|
(5,000 |
) |
|
$ |
13.18 |
|
|
|
(601,800 |
) |
|
$ |
4.23 |
|
|
Canceled or forfeited |
|
|
(130,625 |
) |
|
$ |
17.02 |
|
|
|
— |
|
|
$ |
— |
|
|
Expired |
|
|
— |
|
|
$ |
— |
|
|
|
(1,750 |
) |
|
$ |
4.34 |
|
|
Outstanding at December 31, 2014 |
|
|
631,846 |
|
|
$ |
15.89 |
|
|
|
1,868,597 |
|
|
$ |
4.82 |
|
|
Granted |
|
|
282,500 |
|
|
$ |
7.51 |
|
|
|
— |
|
|
$ |
— |
|
|
Exercised |
|
|
— |
|
|
$ |
— |
|
|
|
(473,472 |
) |
|
$ |
4.66 |
|
|
Canceled or forfeited |
|
|
(13,500 |
) |
|
$ |
17.87 |
|
|
|
— |
|
|
$ |
— |
|
|
Expired |
|
|
(80,375 |
) |
|
$ |
13.49 |
|
|
|
(38,750 |
) |
|
$ |
4.13 |
|
|
Outstanding at December 31, 2015 |
|
|
820,471 |
|
|
$ |
13.21 |
|
|
|
1,356,375 |
|
|
$ |
4.89 |
|
|
Granted |
|
|
180,384 |
|
|
$ |
4.95 |
|
|
|
— |
|
|
$ |
— |
|
|
Exercised |
|
|
— |
|
|
$ |
— |
|
|
|
(182,500 |
) |
|
$ |
4.27 |
|
|
Canceled or forfeited |
|
|
— |
|
|
$ |
— |
|
|
|
— |
|
|
$ |
— |
|
|
Expired |
|
|
— |
|
|
$ |
— |
|
|
|
(2,950 |
) |
|
$ |
5.79 |
|
|
Outstanding at December 31, 2016 |
|
|
1,000,855 |
|
|
$ |
11.72 |
|
|
|
1,170,925 |
|
|
$ |
4.98 |
|
|
Options Exercisable at December 31, 2016 |
|
|
513,295 |
|
|
$ |
15.72 |
|
|
|
1,170,925 |
|
|
$ |
4.98 |
|
For 2016 and 2015, there were no shares exercised under the 2010 plan. There were 5,000 shares exercised under the 2010 plan in 2014, and the intrinsic value of those shares was $18,000. For 2016, 2015, and 2014, the intrinsic value of the options exercised under the Equity Plan was $0.3million, $1.6 million, and $5.8 million, respectively. At December 31, 2016, there were no options remaining outstanding under the 1991 Plan. There were 0, 127,000, and 0 shares exercised under the 1991 Plan during 2016, 2015 and 2014, respectively. The intrinsic value of the shares exercised under the 1991 Plan in 2015 was $0.2 million.
50
A summary of restricted stock activity under the 2010 Plan, the Equity Plan and the 1991 Restricted Stock Plan is as follows:
|
|
|
2010 Plan Restricted Stock |
|
|
Weighted- Average Fair Value |
|
|
Equity Plan Restricted Stock |
|
|
Weighted- Average Fair Value |
|
|
1991 Restricted Stock Plan |
|
|
Weighted- Average Fair Value |
|
||||||
|
Outstanding at Dec. 31, 2013 |
|
|
— |
|
|
$ |
— |
|
|
|
141,500 |
|
|
$ |
5.04 |
|
|
|
281,523 |
|
|
$ |
15.75 |
|
|
Granted |
|
|
11,700 |
|
|
$ |
16.93 |
|
|
|
— |
|
|
$ |
— |
|
|
|
125,200 |
|
|
$ |
16.62 |
|
|
Released |
|
|
— |
|
|
$ |
— |
|
|
|
— |
|
|
$ |
— |
|
|
|
(193,652 |
) |
|
$ |
15.26 |
|
|
Canceled or forfeited |
|
|
— |
|
|
$ |
— |
|
|
|
— |
|
|
$ |
— |
|
|
|
(39,838 |
) |
|
$ |
16.71 |
|
|
Outstanding at Dec. 31, 2014 |
|
|
11,700 |
|
|
$ |
16.93 |
|
|
|
141,500 |
|
|
$ |
5.04 |
|
|
|
173,233 |
|
|
$ |
16.70 |
|
|
Granted |
|
|
68,848 |
|
|
$ |
7.36 |
|
|
|
— |
|
|
$ |
— |
|
|
|
116,000 |
|
|
$ |
7.50 |
|
|
Released |
|
|
(2,924 |
) |
|
$ |
16.93 |
|
|
|
— |
|
|
$ |
— |
|
|
|
(74,008 |
) |
|
$ |
15.59 |
|
|
Canceled or forfeited |
|
|
— |
|
|
$ |
— |
|
|
|
— |
|
|
$ |
— |
|
|
|
(25,700 |
) |
|
$ |
16.92 |
|
|
Outstanding at Dec. 31, 2015 |
|
|
77,624 |
|
|
$ |
8.44 |
|
|
|
141,500 |
|
|
$ |
5.04 |
|
|
|
189,525 |
|
|
$ |
11.48 |
|
|
Granted |
|
|
537,160 |
|
|
$ |
4.74 |
|
|
|
— |
|
|
$ |
— |
|
|
|
16,371 |
|
|
$ |
4.95 |
|
|
Released |
|
|
(19,130 |
) |
|
$ |
8.82 |
|
|
|
(80,000 |
) |
|
$ |
4.97 |
|
|
|
(66,269 |
) |
|
$ |
13.05 |
|
|
Canceled or forfeited |
|
|
(188,736 |
) |
|
$ |
4.97 |
|
|
|
— |
|
|
$ |
— |
|
|
|
(55,275 |
) |
|
$ |
8.45 |
|
|
Outstanding at Dec. 31, 2016 |
|
|
406,918 |
|
|
$ |
5.14 |
|
|
|
61,500 |
|
|
$ |
5.13 |
|
|
|
84,352 |
|
|
$ |
10.96 |
|
Options Outstanding at December 31, 2016
A summary of stock options that were outstanding at December 31, 2016 for the 2010 Plan and the Equity Plan is as follows:
|
Range of Exercise Prices: |
|
Number of Options Outstanding |
|
|
Weighted Average Exercise Price |
|
|
Weighted Average Remaining Contractual Life in Years |
|
|
Aggregate Intrinsic Value |
|
||||
|
2010 Plan |
|
|
|
|
|
|
|
|
|
|
|
|
|
|
|
|
|
$4.95 - $7.52 |
|
|
462,884 |
|
|
$ |
6.51 |
|
|
|
8.9 |
|
|
$ |
— |
|
|
$12.16 - $13.75 |
|
|
254,875 |
|
|
$ |
13.31 |
|
|
|
8.6 |
|
|
|
— |
|
|
$15.04 - $16.93 |
|
|
125,096 |
|
|
$ |
15.86 |
|
|
|
6.5 |
|
|
|
— |
|
|
$20.68 - $21.41 |
|
|
158,000 |
|
|
$ |
21.14 |
|
|
|
9.4 |
|
|
|
— |
|
|
|
|
|
1,000,855 |
|
|
$ |
11.72 |
|
|
|
8.6 |
|
|
$ |
— |
|
|
Equity Plan |
|
|
|
|
|
|
|
|
|
|
|
|
|
|
|
|
|
$3.25 - $3.26 |
|
|
220,000 |
|
|
$ |
3.25 |
|
|
|
2.7 |
|
|
$ |
211,000 |
|
|
$4.15 - 4.90 |
|
|
473,925 |
|
|
$ |
4.70 |
|
|
|
3.5 |
|
|
|
318 |
|
|
$5.25 - $7.18 |
|
|
477,000 |
|
|
$ |
6.07 |
|
|
|
4.1 |
|
|
|
— |
|
|
|
|
|
1,170,925 |
|
|
$ |
4.98 |
|
|
|
3.6 |
|
|
$ |
211,318 |
|
51
Options Exercisable at December 31, 2016
A summary of stock options that are exercisable at December 31, 2016 for the 2010 Plan and the Equity Plan is as follows:
|
Range of Exercise Prices: |
|
Number of Options Exercisable |
|
|
Weighted Average Exercise Price |
|
|
Weighted Average Remaining Contractual Life in Years |
|
|
Aggregate Intrinsic Value |
|
||||
|
2010 Plan |
|
|
|
|
|
|
|
|
|
|
|
|
|
|
|
|
|
$4.95 - $7.52 |
|
|
18,075 |
|
|
$ |
7.48 |
|
|
|
8.9 |
|
|
$ |
— |
|
|
$12.16 - $13.75 |
|
|
254,875 |
|
|
$ |
13.31 |
|
|
|
8.6 |
|
|
|
— |
|
|
$15.04 - $16.93 |
|
|
97,721 |
|
|
$ |
15.55 |
|
|
|
6.3 |
|
|
|
— |
|
|
$20.68 - $21.41 |
|
|
142,624 |
|
|
$ |
21.19 |
|
|
|
9.8 |
|
|
|
— |
|
|
|
|
|
513,295 |
|
|
$ |
15.72 |
|
|
|
8.5 |
|
|
$ |
— |
|
|
Equity Plan |
|
|
|
|
|
|
|
|
|
|
|
|
|
|
|
|
|
$3.25 - $3.26 |
|
|
220,000 |
|
|
$ |
3.25 |
|
|
|
2.7 |
|
|
$ |
211,000 |
|
|
$4.15 - 4.90 |
|
|
473,925 |
|
|
$ |
4.70 |
|
|
|
3.5 |
|
|
|
318 |
|
|
$5.25 - $7.18 |
|
|
477,000 |
|
|
$ |
6.07 |
|
|
|
4.1 |
|
|
|
— |
|
|
|
|
|
1,170,925 |
|
|
$ |
4.98 |
|
|
|
3.6 |
|
|
$ |
211,318 |
|
The aggregate intrinsic values as calculated in the above charts detailing options that are outstanding and those that are exercisable, respectively, are based upon the Company’s closing stock price on December 31, 2016 of $4.21 per share.
|
11. |
Significant Customers |
In 2016, International Business Machines Corporation (IBM) was the Company’s largest customer. During the 2014 fourth quarter, our contract with IBM was renewed for three years until December 31, 2017. In 2016, 2015, and 2014, IBM accounted for $98.4 million or 30.3%, $99.2 million or 26.9%, and $90.5 million or 23.0% of the Company’s consolidated revenue, respectively. The Company’s accounts receivable from IBM at December 31, 2016 and 2015 amounted to $28.0 million and $26.4 million, respectively.
In January 2014, IBM announced its intention to sell its x86 server division to Lenovo, and the initial closing of that sale occurred on September 29, 2014. A portion of the Company's 2014 revenue from IBM was related to the x86 server division. The Company retained a significant share of the revenue derived from the x86 server division despite the transition of the division from IBM to Lenovo.
In 2016, SDI was the Company's second largest customer and accounted for $34.5 million or 10.6%, $44.0 million or 11.9%, and $36.6 million or 9.3% of the Company’s consolidated revenue in 2016, 2015, and 2014, respectively. SDI acts as a vendor manager for Lenovo, and all of the Company's revenue generated through SDI relates to CTG employees working at Lenovo. The Company's accounts receivable from SDI at December 31, 2016 and December 31, 2015 totaled $5.6 million and $5.5 million, respectively.
No other customer accounted for more than 10% of revenue in 2016, 2015, or 2014.
|
12. |
Contingencies |
The Company and its subsidiaries are involved from time to time in various legal proceedings and tax audits arising in the ordinary course of business. At December 31, 2016 and 2015, the Company was in discussion with various governmental agencies relative to tax matters, including income, sales and use, and property and franchise taxes. The outcome of these audits and legal proceedings, as applicable, involving the Company and its subsidiaries cannot be predicted with certainty, and the amount of any liability that could arise with respect to such audits cannot be accurately predicted. However, as none of these matters are individually or in the aggregate significant and as management has recorded an estimate of its potential liability for these audits at December 31, 2016 and 2015, and the Company does not have any open legal proceedings, the Company does not expect the conclusion of these matters to have a material adverse effect on the financial position, results of operations, or cash flows of the Company.
52
|
13. |
Enterprise-Wide Disclosures |
The Company operates in one industry segment, providing IT services to its clients. The services provided include managed and flexible staffing and the planning, design, implementation, and maintenance of comprehensive IT solutions. All of the Company’s revenue is generated from these services.
CTG’s reportable information is based on geographical areas. The accounting policies of the individual geographical areas are the same as those described in note 1, “Summary of Significant Accounting Policies.”
|
Financial Information About Geographic Areas |
|
2016 |
|
|
2015 |
|
|
2014 |
|
|||
|
(amounts in thousands) |
|
|
|
|
|
|
|
|
|
|
|
|
|
Revenue from External Customers: |
|
|
|
|
|
|
|
|
|
|
|
|
|
United States |
|
$ |
253,955 |
|
|
$ |
301,826 |
|
|
$ |
314,500 |
|
|
Belgium (1) |
|
|
35,995 |
|
|
|
35,931 |
|
|
|
44,692 |
|
|
Other European countries |
|
|
34,634 |
|
|
|
31,376 |
|
|
|
33,652 |
|
|
Other country |
|
|
309 |
|
|
|
345 |
|
|
|
424 |
|
|
Total foreign revenue |
|
|
70,938 |
|
|
|
67,652 |
|
|
|
78,768 |
|
|
Total revenue |
|
$ |
324,893 |
|
|
$ |
369,478 |
|
|
$ |
393,268 |
|
|
Long-lived Assets: |
|
|
|
|
|
|
|
|
|
|
|
|
|
United States |
|
$ |
4,280 |
|
|
$ |
4,208 |
|
|
$ |
5,759 |
|
|
United Kingdom (2) |
|
|
792 |
|
|
|
461 |
|
|
|
159 |
|
|
Other European countries |
|
|
791 |
|
|
|
819 |
|
|
|
875 |
|
|
Total long-lived assets |
|
$ |
5,863 |
|
|
$ |
5,488 |
|
|
$ |
6,793 |
|
|
Deferred Tax Assets, Net of Valuation Allowance: |
|
|
|
|
|
|
|
|
|
|
|
|
|
United States |
|
$ |
6,886 |
|
|
$ |
6,352 |
|
|
$ |
7,982 |
|
|
Europe |
|
|
0 |
|
|
|
54 |
|
|
|
56 |
|
|
Total deferred tax assets, net |
|
$ |
6,886 |
|
|
$ |
6,406 |
|
|
$ |
8,038 |
|
|
(1) |
Revenue for our Belgium operations has been disclosed separately as it exceeds 10% of consolidated revenue in at least one of the years presented. |
|
(2) |
Long-lived assets for our United Kingdom operations has been disclosed separately as it exceeds 10% of consolidated long-lived assets in at least one of the years presented. |
|
14. |
Quarterly Financial Data (Unaudited) |
|
|
|
Quarters |
|
|
|
|
|
|||||||||||||
|
|
|
First (1) |
|
|
Second |
|
|
Third (1) |
|
|
Fourth |
|
|
Total |
|
|||||
|
(amounts in thousands, except per-share data) |
|
|
|
|
|
|
|
|
|
|
|
|
|
|
|
|
|
|
|
|
|
2016 |
|
|
|
|
|
|
|
|
|
|
|
|
|
|
|
|
|
|
|
|
|
Revenue |
|
$ |
85,850 |
|
|
$ |
83,486 |
|
|
$ |
78,065 |
|
|
$ |
77,492 |
|
|
$ |
324,893 |
|
|
Direct costs |
|
|
71,305 |
|
|
|
67,574 |
|
|
|
64,193 |
|
|
|
62,639 |
|
|
|
265,711 |
|
|
Gross profit |
|
|
14,545 |
|
|
|
15,912 |
|
|
|
13,872 |
|
|
|
14,853 |
|
|
|
59,182 |
|
|
Selling, general, and administrative expenses |
|
|
13,467 |
|
|
|
14,026 |
|
|
|
14,567 |
|
|
|
13,140 |
|
|
|
55,200 |
|
|
Goodwill impairment charges |
|
|
21,544 |
|
|
|
— |
|
|
|
15,785 |
|
|
|
— |
|
|
|
37,329 |
|
|
Operating income |
|
|
(20,466 |
) |
|
|
1,886 |
|
|
|
(16,480 |
) |
|
|
1,713 |
|
|
|
(33,347 |
) |
|
Interest and other income (expense), net |
|
|
(62 |
) |
|
|
(97 |
) |
|
|
77 |
|
|
|
(107 |
) |
|
|
(189 |
) |
|
Income before income taxes |
|
|
(20,528 |
) |
|
|
1,789 |
|
|
|
(16,403 |
) |
|
|
1,606 |
|
|
|
(33,536 |
) |
|
Provision for income taxes |
|
|
329 |
|
|
|
530 |
|
|
|
(220 |
) |
|
|
463 |
|
|
|
1,102 |
|
|
Net income |
|
$ |
(20,857 |
) |
|
$ |
1,259 |
|
|
$ |
(16,183 |
) |
|
$ |
1,143 |
|
|
$ |
(34,638 |
) |
|
Basic net income per share |
|
$ |
(1.34 |
) |
|
$ |
0.08 |
|
|
$ |
(1.03 |
) |
|
$ |
0.07 |
|
|
$ |
(2.22 |
) |
|
Diluted net income per share |
|
$ |
(1.34 |
) |
|
$ |
0.08 |
|
|
$ |
(1.03 |
) |
|
$ |
0.07 |
|
|
$ |
(2.22 |
) |
|
|
|
|
|
|
|
|
|
|
|
|
|
|
|
|
|
|
|
|
|
|
|
Cash dividend declared per share |
|
$ |
0.06 |
|
|
$ |
0.06 |
|
|
$ |
0.06 |
|
|
$ |
— |
|
|
$ |
0.18 |
|
|
(1) |
The Company incurred goodwill impairment charges totaling $37.3 million during the 2016 first and third quarters. These charges reduced basic and diluted earnings per share by $2.39. During the 2016 third quarter, the Company |
53
|
incurred severance charges included in selling, general and administrative expenses of approximately $1.5 million, or $1.0 million net of tax, or $0.06 basic and diluted net income per share, relating to severance for two of the Company’s former executives. |
|
|
|
Quarters |
|
|
|
|
|
|||||||||||||
|
|
|
First |
|
|
Second (2) |
|
|
Third |
|
|
Fourth (3) |
|
|
Total |
|
|||||
|
(amounts in thousands, except per-share data) |
|
|
|
|
|
|
|
|
|
|
|
|
|
|
|
|
|
|
|
|
|
2015 |
|
|
|
|
|
|
|
|
|
|
|
|
|
|
|
|
|
|
|
|
|
Revenue |
|
$ |
97,477 |
|
|
$ |
94,744 |
|
|
$ |
93,055 |
|
|
$ |
84,202 |
|
|
$ |
369,478 |
|
|
Direct costs |
|
|
80,172 |
|
|
|
79,143 |
|
|
|
75,587 |
|
|
|
67,416 |
|
|
|
302,318 |
|
|
Gross profit |
|
|
17,305 |
|
|
|
15,601 |
|
|
|
17,468 |
|
|
|
16,786 |
|
|
|
67,160 |
|
|
Selling, general, and administrative expenses |
|
|
15,092 |
|
|
|
14,485 |
|
|
|
13,901 |
|
|
|
13,045 |
|
|
|
56,523 |
|
|
Operating income |
|
|
2,213 |
|
|
|
1,116 |
|
|
|
3,567 |
|
|
|
3,741 |
|
|
|
10,637 |
|
|
Interest and other income (expense), net |
|
|
(10 |
) |
|
|
(42 |
) |
|
|
(24 |
) |
|
|
168 |
|
|
|
92 |
|
|
Income before income taxes |
|
|
2,203 |
|
|
|
1,074 |
|
|
|
3,543 |
|
|
|
3,909 |
|
|
|
10,729 |
|
|
Provision for income taxes |
|
|
936 |
|
|
|
520 |
|
|
|
1,472 |
|
|
|
1,291 |
|
|
|
4,219 |
|
|
Net income |
|
$ |
1,267 |
|
|
$ |
554 |
|
|
$ |
2,071 |
|
|
$ |
2,618 |
|
|
$ |
6,510 |
|
|
Basic net income per share |
|
$ |
0.08 |
|
|
$ |
0.04 |
|
|
$ |
0.13 |
|
|
$ |
0.17 |
|
|
$ |
0.42 |
|
|
Diluted net income per share |
|
$ |
0.08 |
|
|
$ |
0.03 |
|
|
$ |
0.13 |
|
|
$ |
0.16 |
|
|
$ |
0.41 |
|
|
|
|
|
|
|
|
|
|
|
|
|
|
|
|
|
|
|
|
|
|
|
|
Cash dividend declared per share |
|
$ |
0.06 |
|
|
$ |
0.06 |
|
|
$ |
0.06 |
|
|
$ |
0.06 |
|
|
$ |
0.24 |
|
|
(2) |
Included in 2015 second quarter direct costs is approximately $1.1 million, or $0.6 million, net of tax, or $0.04 basic and diluted net income per share, relating to the disposal of one of the Company's capitalized software projects. Also included in the second quarter, primarily in direct costs and, in part, in selling, general and administrative expenses, is approximately $1.2 million, or $0.6 million, net of tax, or $0.04 basic and diluted net income per share, relating to severance charges in Europe. |
|
(3) |
Included in the fourth quarter, primarily in direct costs, is approximately $1.7 million from the reversal of costs accrued for fringe benefit expenses (primarily medical) resulting from a significant reduction in medical costs actually incurred in the 2015 fourth quarter as compared with the 2014 fourth quarter. Also included in interest and other income, net, is $0.2 million for a non-taxable life insurance gain for a former executive that passed away in the 2015 fourth quarter. |
54
None.
Evaluation of Disclosure Controls and Procedures
The Company’s management has evaluated, under the supervision and with the participation of the Company’s Chief Executive Officer and Chief Financial Officer, the effectiveness of the design and operations of the Company’s disclosure controls and procedures (as defined in Rule 13a-15(e) of the Exchange Act) as of the end of the period covered by this annual report. Based on that evaluation, the Company’s Chief Executive Officer and Chief Financial Officer have concluded that the Company’s disclosure controls and procedures were effective as of the end of the period covered by this annual report.
|
(a) |
Management’s Annual Report on Internal Control Over Financial Reporting |
The Company’s management is responsible for establishing and maintaining an adequate system of internal control over financial reporting. Internal control over financial reporting is a process designed to provide reasonable assurance regarding the reliability of financial reporting and the preparation of financial statements for external purposes in accordance with generally accepted accounting principles. A company’s internal control over financial reporting includes those policies and procedures that (i) pertain to the maintenance of records that, in reasonable detail, accurately and fairly reflect the transactions and dispositions of the assets of the Company; (ii) provide reasonable assurance that transactions are recorded as necessary to permit preparation of financial statements in accordance with generally accepted accounting principles, and that receipts and expenditures of the Company are being made only in accordance with authorizations of management and directors of the Company; and (iii) provide reasonable assurance regarding prevention or timely detection of unauthorized acquisition, use, or disposition of the Company’s assets that could have a material effect on the financial statements.
Because of its inherent limitations, a system of internal control over financial reporting can provide only reasonable assurance and may not prevent or detect misstatements. Therefore, even those systems determined to be effective can provide only reasonable assurance with respect to financial statement preparation and presentation. Further, because of changes in conditions, effectiveness of internal control over financial reporting may deteriorate.
Management of the Company conducted an evaluation of the effectiveness of the Company’s internal control over financial reporting based on the Internal Control-Integrated Framework (2013) issued by the Committee of Sponsoring Organizations of the Treadway Commission. Based on that evaluation, the Company’s management did not identify any control deficiencies it considered to be material weaknesses under the rules specified by the Public Company Accounting Oversight Board’s Auditing Standard No. 5, and therefore concluded that its internal control over financial reporting was effective as of December 31, 2016.
Our independent registered public accounting firm has issued an attestation report on the Company’s effectiveness of internal control over financial reporting. Their report appears in Item 9A(b), Attestation Report of the Registered Public Accounting Firm.
55
|
(b) |
Attestation Report of the Registered Public Accounting Firm |
Report of Independent Registered Public Accounting Firm
The Board of Directors and Shareholders
Computer Task Group, Incorporated:
We have audited Computer Task Group, Incorporated’s internal control over financial reporting as of December 31, 2016, based on criteria established in Internal Control - Integrated Framework (2013) issued by the Committee of Sponsoring Organizations of the Treadway Commission (COSO). Computer Task Group, Incorporated’s management is responsible for maintaining effective internal control over financial reporting and for its assessment of the effectiveness of internal control over financial reporting, included in the accompanying Management’s Annual Report on Internal Control Over Financial Reporting (Item 9A(a)). Our responsibility is to express an opinion on the Company’s internal control over financial reporting based on our audit.
We conducted our audit in accordance with the standards of the Public Company Accounting Oversight Board (United States). Those standards require that we plan and perform the audit to obtain reasonable assurance about whether effective internal control over financial reporting was maintained in all material respects. Our audit included obtaining an understanding of internal control over financial reporting, assessing the risk that a material weakness exists, and testing and evaluating the design and operating effectiveness of internal control based on the assessed risk. Our audit also included performing such other procedures as we considered necessary in the circumstances. We believe that our audit provides a reasonable basis for our opinion.
A company’s internal control over financial reporting is a process designed to provide reasonable assurance regarding the reliability of financial reporting and the preparation of financial statements for external purposes in accordance with generally accepted accounting principles. A company’s internal control over financial reporting includes those policies and procedures that (1) pertain to the maintenance of records that, in reasonable detail, accurately and fairly reflect the transactions and dispositions of the assets of the company; (2) provide reasonable assurance that transactions are recorded as necessary to permit preparation of financial statements in accordance with generally accepted accounting principles, and that receipts and expenditures of the company are being made only in accordance with authorizations of management and directors of the company; and (3) provide reasonable assurance regarding prevention or timely detection of unauthorized acquisition, use, or disposition of the company’s assets that could have a material effect on the financial statements.
Because of its inherent limitations, internal control over financial reporting may not prevent or detect misstatements. Also, projections of any evaluation of effectiveness to future periods are subject to the risk that controls may become inadequate because of changes in conditions, or that the degree of compliance with the policies or procedures may deteriorate.
In our opinion, Computer Task Group, Incorporated maintained, in all material respects, effective internal control over financial reporting as of December 31, 2016, based on criteria established in Internal Control - Integrated Framework (2013) issued by the Committee of Sponsoring Organizations of the Treadway Commission (COSO).
We also have audited, in accordance with the standards of the Public Company Accounting Oversight Board (United States), the consolidated balance sheets of Computer Task Group, Incorporated and subsidiaries as of December 31, 2016 and 2015, and the related consolidated statements of operations, comprehensive income (loss), cash flows, and changes in shareholders’ equity for each of the years in the three-year period ended December 31, 2016, and our report dated February 24, 2017 expressed an unqualified opinion on those consolidated financial statements.
/s/ KPMG LLP
Buffalo, New York
February 24, 2017
56
|
(c) |
Changes in Internal Control Over Financial Reporting |
The Company reviews, revises and improves the effectiveness of the Company’s internal controls on a continuous basis. The Company’s management, including its Chief Executive Officer and Chief Financial Officer, evaluated the effectiveness of the Company’s internal control over financial reporting as of the end of the period covered by this annual report. There were no changes in the Company’s internal control over financial reporting that occurred during the Company's last fiscal quarter, which ended on December 31, 2016, that materially affected, or are reasonably likely to materially affect, the Company’s internal control over financial reporting.
None
57
Except as otherwise set forth below, the information required in response to this item is incorporated herein by reference to the information set forth under “Election of Directors,” “Section 16(a) Beneficial Ownership Reporting Compliance,” “The Board of Directors and Committees” in relation to the “Audit Committee” and “Nominating and Corporate Governance Committee and Director Nomination Process” subsections, and “Corporate Governance and Website Information” in the Company’s Proxy Statement for the Annual Meeting of Stockholders scheduled to be held on May 3, 2017 (Proxy Statement) to be filed with the SEC not later than 120 days after the end of the year ended December 31, 2016, except insofar as information with respect to executive officers is presented in Part I, Item 1 of this report pursuant to General Instruction G(3) of Form 10-K.
Executive Officers of the Company
As of December 31, 2016, the following individuals were executive officers of the Company:
|
Name |
|
Age |
|
Office |
|
Period During Which Served as Executive Officer |
|
Other Positions and Offices with Registrant |
|
Arthur V. Crumlish |
|
62 |
|
President and Chief Executive Officer Senior Vice President |
|
July 21, 2016 to date September 24, 2001 to July 20, 2016 |
|
Director
|
|
|
|
|
|
|
|
|
|
|
|
Brendan M. Harrington |
|
50 |
|
Senior Vice President, Chief Financial Officer Interim Chief Executive Officer Senior Vice President, Chief Financial Officer |
|
April 6, 2015 to date Oct. 15, 2014 to April 5, 2015 Sept. 13, 2006 to Oct. 14, 2014 |
|
None |
|
|
|
|
|
|
|
|
|
|
|
Filip J. L. Gydé |
|
56 |
|
Senior Vice President Interim Executive Vice President of Operations Senior Vice President |
|
April 6, 2015 to date Oct. 15, 2014 to April 5, 2015 Oct. 1, 2000 to Oct. 14, 2014 |
|
None |
|
|
|
|
|
|
|
|
|
|
|
Peter P. Radetich |
|
62 |
|
Senior Vice President, General Counsel |
|
April 28, 1999 to date |
|
Secretary |
Mr. Crumlish was promoted to President and Chief Executive Officer on July 21, 2016. Previously, Mr. Crumlish was Senior Vice President since September 24, 2001 of the Company’s IT and Other Staffing Services organization. Prior to that, Mr. Crumlish was the Financial Controller of the Company’s IT and Other Staffing Services organization. Mr. Crumlish joined the Company in 1990.
Mr. Harrington currently serves as the Company’s Chief Financial Officer. Mr. Harrington was Interim Chief Executive Officer from October 15, 2014 to April 5, 2015. Previously he was Senior Vice President and Chief Financial Officer from September 13, 2006 to October 14, 2014, and Interim Chief Financial Officer and Treasurer from October 17, 2005 to September 12, 2006. Mr. Harrington joined the Company in February 1994 and served in a number of managerial financial positions in the Company’s corporate and European operations, including as the Director of Accounting since 2003, before being appointed Corporate Controller in May 2005.
Mr. Gydé currently serves as the Senior Vice President and General Manager for the Company's European operations. Mr. Gydé was Interim Executive Vice President of Operations from October 15, 2014 until April 5, 2015, responsible for operating activities of the overall Company. Previously he was Senior Vice President and General Manager of CTG Europe from October 1, 2000 through October 14, 2014. Prior to that, Mr. Gydé was Managing Director of the Company’s operations in Belgium. Mr. Gydé has been with the Company since May 1987.
Mr. Radetich joined the Company in June 1988 as Associate General Counsel, and was promoted to General Counsel and Secretary in April 1999.
The information required in response to this item is incorporated herein by reference to the information under the caption “The Board of Directors and Committees” and “Compensation Discussion and Analysis” (including all compensation tables) presented in the Proxy Statement.
58
|
Item 12. |
Security Ownership of Certain Beneficial Owners and Management and Related Stockholder Matters |
Except as set forth below, the information required in response to this item is incorporated herein by reference to the information under the caption “Security Ownership of the Company’s Common Shares by Certain Beneficial Owners and by Management” presented in the Proxy Statement.
The following table sets forth, as of December 31, 2016, certain information related to the Company’s compensation plans under which shares of its common stock are authorized for issuance:
|
|
|
Number of securities to be issued upon exercise of outstanding options, warrants and rights (a) |
|
|
Weighted-average exercise price of outstanding options, warrants and rights (b) |
|
|
Number of securities remaining available for future issuance under equity compensation plans (excluding securities listed in column (a)) (c) |
|
|||
|
Equity compensation plans approved by security holders: |
|
|
|
|
|
|
|
|
|
|
|
|
|
2010 Equity Award Plan |
|
|
1,000,855 |
|
|
$ |
11.72 |
|
|
|
441,000 |
|
|
2000 Equity Award Plan |
|
|
1,170,925 |
|
|
$ |
4.98 |
|
|
|
— |
|
|
1991 Restricted Stock Plan |
|
|
— |
|
|
$ |
— |
|
|
|
44,000 |
|
|
Equity compensation plans not approved by security holders: |
|
|
|
|
|
|
|
|
|
|
|
|
|
None |
|
|
— |
|
|
$ |
— |
|
|
|
— |
|
|
|
|
|
2,171,780 |
|
|
$ |
8.09 |
|
|
|
485,000 |
|
At December 31, 2016, the Company did not have any outstanding rights or warrants. All outstanding awards are either stock options or restricted stock.
The information required in response to this item is incorporated herein by reference to the information under the caption “Certain Relationships and Related Person Transactions,” “Audit Committee Review of Related Person Transactions,” “The Board of Directors and Committees,” and “Director Independence and Executive Sessions” presented in the Proxy Statement.
The information required in response to this item is incorporated herein by reference to the information under the caption “Appointment of Auditors and Fees” presented in the Proxy Statement.
59
PART IV
|
(a) |
Index to Consolidated Financial Statements and Financial Statement Schedule |
|
|
(1) |
Financial Statements: |
|
|
|
28 |
|
|
|
29 |
|
|
|
30 |
|
|
|
31 |
|
|
|
32 |
|
|
|
33 |
|
|
|
35 |
|
|
(2) |
Index to Consolidated Financial Statement Schedule |
|
|
|
Report of Independent Registered Public Accounting Firm on Financial Statement Schedule |
61 |
|
|
Financial statement schedule: |
|
|
|
62 |
|
|
(b) |
Exhibits |
|
|
|
The Exhibits to this annual report on Form 10-K are listed on the attached Exhibit Index |
|
60
Report of Independent Registered Public Accounting Firm
The Board of Directors and Shareholders
Computer Task Group, Incorporated:
Under date of February 24, 2017, we reported on the consolidated balance sheets of Computer Task Group, Incorporated and subsidiaries as of December 31, 2016 and 2015, and the related consolidated statements of operations, comprehensive income (loss), cash flows, and changes in shareholders’ equity for each of the years in the three-year period ended December 31, 2016, which are included in the annual report on Form 10-K for the year 2016. In connection with our audits of the aforementioned consolidated financial statements, we also audited the related consolidated financial statement schedule as listed in the accompanying index. This financial statement schedule is the responsibility of the Company’s management. Our responsibility is to express an opinion on this financial statement schedule based on our audits.
In our opinion, such financial statement schedule, when considered in relation to the basic consolidated financial statements taken as a whole, presents fairly, in all material respects, the information set forth therein.
|
/s/ KPMG LLP |
|
|
|
Buffalo, New York |
|
February 24, 2017 |
61
COMPUTER TASK GROUP, INCORPORATED
SCHEDULE II—VALUATION AND QUALIFYING ACCOUNTS
(amounts in thousands)
|
|
|
Balance at January 1 |
|
|
Additions |
|
|
|
Deductions |
|
|
|
Balance at December 31 |
|
||||
|
2016 |
|
|
|
|
|
|
|
|
|
|
|
|
|
|
|
|
|
|
|
Accounts deducted from accounts receivable - |
|
|
|
|
|
|
|
|
|
|
|
|
|
|
|
|
|
|
|
Allowance for doubtful accounts |
|
$ |
377 |
|
|
|
276 |
|
A |
|
|
(184 |
) |
A |
|
$ |
469 |
|
|
Accounts deducted from deferred tax assets - |
|
|
|
|
|
|
|
|
|
|
|
|
|
|
|
|
|
|
|
Deferred tax asset valuation allowance |
|
$ |
2,349 |
|
|
|
518 |
|
B |
|
|
(217 |
) |
B |
|
$ |
2,650 |
|
|
|
|
|
|
|
|
|
|
|
|
|
|
|
|
|
|
|
|
|
|
2015 |
|
|
|
|
|
|
|
|
|
|
|
|
|
|
|
|
|
|
|
Accounts deducted from accounts receivable - |
|
|
|
|
|
|
|
|
|
|
|
|
|
|
|
|
|
|
|
Allowance for doubtful accounts |
|
$ |
891 |
|
|
|
372 |
|
A |
|
|
(886 |
) |
A |
|
$ |
377 |
|
|
Accounts deducted from deferred tax assets - |
|
|
|
|
|
|
|
|
|
|
|
|
|
|
|
|
|
|
|
Deferred tax asset valuation allowance |
|
$ |
3,135 |
|
|
|
192 |
|
B |
|
|
(978 |
) |
B |
|
$ |
2,349 |
|
|
|
|
|
|
|
|
|
|
|
|
|
|
|
|
|
|
|
|
|
|
2014 |
|
|
|
|
|
|
|
|
|
|
|
|
|
|
|
|
|
|
|
Accounts deducted from accounts receivable - |
|
|
|
|
|
|
|
|
|
|
|
|
|
|
|
|
|
|
|
Allowance for doubtful accounts |
|
$ |
1,040 |
|
|
|
55 |
|
A |
|
|
(204 |
) |
A |
|
$ |
891 |
|
|
Accounts deducted from deferred tax assets - |
|
|
|
|
|
|
|
|
|
|
|
|
|
|
|
|
|
|
|
Deferred tax asset valuation allowance |
|
$ |
2,170 |
|
|
|
1,233 |
|
B |
|
|
(268 |
) |
B |
|
$ |
3,135 |
|
|
A |
These balances primarily reflect additions to the allowance charged to expense resulting from the normal course of business, less deductions for recovery of accounts that were previously reserved, and additions and deductions for foreign currency translation |
|
B |
These balances primarily reflect additions or deductions to the valuation allowance associated with the Netherlands defined-benefit plan and changes in foreign currency exchange rates, and deductions for expiring net operating loss carryforwards |
62
SIGNATURES
Pursuant to the requirements of Section 13 or 15(d) of the Securities Exchange Act of 1934, the registrant has duly caused this report to be signed on its behalf by the undersigned, thereunto duly authorized.
|
|
|
|
COMPUTER TASK GROUP, INCORPORATED |
|
|
|
|
|
By |
/s/ Arthur W. Crumlish |
|
|
Arthur W. Crumlish |
|
|
President and Chief Executive Officer |
Dated: February 24, 2017
Pursuant to the requirements of the Securities Exchange Act of 1934, this report has been signed below by the following persons on behalf of the registrant and in the capacities and on the dates indicated.
|
|
|
|
|||||
|
|
Signature |
|
Title |
|
Date |
||
|
(i) |
Principal Executive Officer |
|
President and Chief Executive Officer |
|
February 24, 2017 |
||
|
|
/s/ Arthur W. Crumlish |
|
|
|
|
||
|
|
Arthur W. Crumlish |
|
|
|
|
||
|
|
|
|
|
|
|
||
|
(ii) |
Principal Accounting and Principal Financial Officer |
|
Chief Financial Officer |
|
February 24, 2017 |
||
|
|
/s/ Brendan M. Harrington |
|
|
|
|
||
|
|
Brendan M. Harrington |
|
|
|
|
||
|
|
|
|
|
|
|
||
|
(iii) |
Directors |
|
|
|
|
||
|
|
|
|
|
|
|
||
|
|
/s/ Arthur W. Crumlish |
|
Director |
|
February 24, 2017 |
||
|
|
Arthur W. Crumlish |
|
|
|
|
||
|
|
|
|
|
|
|
||
|
|
/s/ James R. Helvey III |
|
Director |
|
February 24, 2017 |
||
|
|
James R. Helvey III |
|
|
|
|
||
|
|
|
|
|
|
|
||
|
|
/s/ David H. Klein |
|
Director |
|
February 24, 2017 |
||
|
|
David H. Klein |
|
|
|
|
||
|
|
|
|
|
|
|
||
|
|
/s/ Valerie Rahmani |
|
Director |
|
February 24, 2017 |
||
|
|
Valerie Rahmani |
|
|
|
|
||
|
|
|
|
|
|
|
||
|
|
/s/ Daniel J. Sullivan |
|
Chairman of the Board of Directors |
|
February 24, 2017 |
||
|
|
Daniel J. Sullivan |
|
|
|
|
||
63
|
Exhibit |
|
|
|
Description |
|
Reference |
|
3. |
|
(a) |
|
Restated Certificate of Incorporation of Registrant |
|
(1) |
|
|
|
(b) |
|
Restated By-laws of Registrant |
|
(2) |
|
4. |
|
(a) |
|
Restated Certificate of Incorporation of Registrant |
|
(1) |
|
|
|
(b) |
|
Restated By-laws of Registrant |
|
(2) |
|
|
|
(c) |
|
Specimen Common Stock Certificate |
|
(1) |
|
10. |
|
(a) |
|
Computer Task Group, Incorporated Non-Qualified Key Employee Deferred Compensation Plan 2007 Restatement |
|
(3) + |
|
|
|
(b) |
|
2016 Key Employee Compensation Plans |
|
(4) + |
|
|
|
(c) |
|
Computer Task Group, Incorporated 1991 Restricted Stock Plan |
|
(1) + |
|
|
|
(d) |
|
Computer Task Group, Incorporated 2000 Equity Award Plan |
|
(5) + |
|
|
|
(e) |
|
Computer Task Group, Incorporated Executive Supplemental Benefit Plan 1997 Restatement |
|
(1) + |
|
|
|
(f) |
|
First Amendment to the Computer Task Group, Incorporated Executive Supplemental Benefit Plan 1997 Restatement |
|
(1) + |
|
|
|
(g) |
|
Compensation Arrangements for the Named Executive Officers |
|
# + |
|
|
|
(h) |
|
Employment Agreement, dated February 13, 2017, between the Registrant and Arthur W. Crumlish |
|
(6) + |
|
|
|
(i) |
|
Officer Change in Control Agreement |
|
(7) + |
|
|
|
|
|
|
|
|
|
|
|
# |
|
Filed herewith |
|
|
|
|
|
+ |
|
Management contract or compensatory plan or arrangement |
|
|
|
|
|
(1) |
|
Filed as an Exhibit to the Registrant’s Form 10-K on February 20, 2015, and incorporated herein by reference (file No. 001-09410) |
|
|
|
|
|
(2) |
|
Filed as an Exhibit to the Registrant’s Form 8-K on September 19, 2016, and incorporated herein by reference (file No. 001-09410) |
|
|
|
|
|
(3) |
|
Filed as an Exhibit to the Registrant’s Annual Report on Form 10-K for the year ended December 31, 2006, and incorporated herein by reference (file No. 001-09410 filed on March 7, 2007) |
|
|
|
|
|
(4) |
|
Included in the Registrant’s definitive Proxy Statement dated April 2017 under the caption entitled “Baseline Compensation – Performance-Based Incentives - Annual Cash Incentive Compensation,” and incorporated herein by reference |
|
|
|
|
|
(5) |
|
Filed as an Exhibit to the Registrant’s Form 8-K on November 18, 2008, and incorporated herein by reference (file No. 001-09410) |
|
|
|
|
|
(6) |
|
Filed as an Exhibit to the Registrant’s Form 8-K on February 13, 2017, and incorporated herein by reference (file No. 001-09410) |
|
|
|
|
|
(7) |
|
Filed as an Exhibit to the Registrant’s Annual Report on Form 10-K for the year ended December 31, 2008, and incorporated herein by reference (file No. 001-09410 filed on February 26, 2009) |
|
|
64
EXHIBIT INDEX (Continued)
|
Exhibit |
|
|
|
Description |
|
Reference |
|
|
|
(j) |
|
Computer Task Group, Incorporated First Employee Stock Purchase Plan (Ninth Amendment and Restatement) |
|
(8) + |
|
|
|
(k) |
|
Computer Task Group, Incorporated 1991 Employee Stock Option Plan |
|
(9) + |
|
|
|
(l) |
|
Restated Computer Task Group, Incorporated 2010 Equity Award Plan |
|
(10) + |
|
|
|
(m) |
|
Computer Task Group, Incorporated Non-Employee Director Deferred Compensation Plan |
|
(11) + |
|
|
|
(n) |
|
Loan Agreement, dated as of October 30, 2015, among Computer Task Group, Incorporated, KeyBank National Association, and Manufacturers and Traders Trust Company |
|
(12) + |
|
|
|
(o) |
|
Computer Task Group, Incorporated Indemnification Agreement (Directors) |
|
# |
|
|
|
(p) |
|
Separation Agreement dated July 19, 2016 between Computer Task Group, Incorporated and Clifford B. Bleustein |
|
(13) + |
|
|
|
(q) |
|
Second Amendment to the Credit Agreement Dated November 16, 2016 with Keybank National Association as Administrative Agent for the Lenders as defined in the Credit Agreement |
|
(14) |
|
|
|
(r) |
|
Computer Task Group, Incorporated Indemnification Agreement (Executive Officers) |
|
# |
|
|
|
(s) |
|
Change in Control Agreement, 2017 |
|
# |
|
14. |
|
|
|
Code of Ethics |
|
(15) |
|
21. |
|
|
|
Subsidiaries of the Registrant |
|
# |
|
23. |
|
|
|
Consent of Experts and Counsel |
|
# |
|
31. |
|
(a) |
|
Certification Pursuant to Section 302 of the Sarbanes-Oxley Act of 2002 |
|
# |
|
|
|
(b) |
|
Certification Pursuant to Section 302 of the Sarbanes-Oxley Act of 2002 |
|
# |
|
32. |
|
|
|
Certification Pursuant to Section 906 of the Sarbanes-Oxley Act of 2002 |
|
## |
|
101.INS |
|
|
|
XBRL Instance Document |
|
# |
|
101.SCH |
|
|
|
XBRL Taxonomy Extension Schema Document |
|
# |
|
101.CAL |
|
|
|
XBRL Taxonomy Extension Calculation Linkbase |
|
# |
|
101.LAB |
|
|
|
XBRL Taxonomy Extension Label Linkbase |
|
# |
|
101.PRE |
|
|
|
XBRL Taxonomy Extension Presentation Linkbase |
|
# |
|
101.DEF |
|
|
|
XBRL Taxonomy Extension Definition Linkbase Document |
|
# |
|
|
|
|
|
|
|
|
|
|
|
# |
|
Filed herewith |
|
|
|
|
|
## |
|
Furnished herewith |
|
|
|
|
|
(8) |
|
Filed as Exhibit A to the Registrant's Proxy Statement on Schedule 14A dated April 4, 2012, for its Annual Meeting of Shareholders held on May 9, 2012 (file No. 001-09410 filed on April 4, 2012) |
|
|
|
|
|
(9) |
|
Filed as an Exhibit to the Registrant’s Annual Report on Form 10-K for the year ended December 31, 1996, and incorporated herein by reference (file No. 001-09410 filed on March 28,1997) |
|
|
|
|
|
(10) |
|
Filed as Appendix B to the Registrant's Proxy Statement on Schedule 14A, dated April 3, 2015, for its Annual Meeting of Shareholders held on May 6, 2015 (file No. 001-09410 filed on April 3, 2015) |
|
|
|
|
|
(11) |
|
Filed as Appendix A to the Registrant's Proxy Statement on Schedule 14A, dated April 2, 2010, for its Annual Meeting of Shareholders held on May 12, 2010 (file No. 001-09410 filed on March 31, 2010) |
|
|
|
|
|
(12) |
|
Filed as an Exhibit to the Registrant’s Form 8-K on November 2, 2015, and incorporated herein by reference (file No. 001-09410) |
|
|
|
|
|
(13) |
|
Filed as an Exhibit to the Registrant’s Form 8-K on July 22, 2016 and incorporated herein by reference (file No. 001-09410) |
|
|
|
|
|
(14) |
|
Filed as an Exhibit to the Registrant’s Form 8-K on November 17, 2016 and incorporated herein by reference (file No. 001-09410) |
|
|
|
|
|
(15) |
|
Included at the internet address specified in the Registrant’s definitive Proxy Statement dated April 1, 2017 under the caption entitled “Corporate Governance and Website Information,” and incorporated herein by reference |
|
|
65