Attached files
| file | filename |
|---|---|
| EX-32.2 - EXHIBIT 32.2 - AFFILIATED MANAGERS GROUP, INC. | amg_exhibit322x12312016.htm |
| EX-32.1 - EXHIBIT 32.1 - AFFILIATED MANAGERS GROUP, INC. | amg_exhibit321x12312016.htm |
| EX-31.2 - EXHIBIT 31.2 - AFFILIATED MANAGERS GROUP, INC. | amg_exhibit312x12312016.htm |
| EX-31.1 - EXHIBIT 31.1 - AFFILIATED MANAGERS GROUP, INC. | amg_exhibit311x12312016.htm |
| EX-23.1 - EXHIBIT 23.1 - AFFILIATED MANAGERS GROUP, INC. | amg_exhibit231x12312016.htm |
| EX-21.1 - EXHIBIT 21.1 - AFFILIATED MANAGERS GROUP, INC. | amg_exhibit211x12312016.htm |
| EX-10.15 - EXHIBIT 10.15 - AFFILIATED MANAGERS GROUP, INC. | amg_exhibit1015x12312016.htm |
UNITED STATES
SECURITIES AND EXCHANGE COMMISSION
Washington, D.C. 20549
___________________________________________________________________________
FORM 10-K
(Mark One) | ||
ý | ANNUAL REPORT PURSUANT TO SECTION 13 OR 15(d) OF THE SECURITIES EXCHANGE ACT OF 1934 | |
For the fiscal year ended December 31, 2016 | ||
OR | ||
o | TRANSITION REPORT PURSUANT TO SECTION 13 OR 15(d) OF THE SECURITIES EXCHANGE ACT OF 1934 | |
For the transition period from to | ||
Commission File Number 001-13459
__________________________________________________________________________

Affiliated Managers Group, Inc.
(Exact name of registrant as specified in its charter)
Delaware (State or other jurisdiction of incorporation or organization) | 04-3218510 (IRS Employer Identification Number) | |
777 South Flagler Drive, West Palm Beach, Florida, 33401 (Address of principal executive offices) | ||
(800) 345-1100
(Registrant’s telephone number, including area code)
Securities registered pursuant to Section 12(b) of the Act:
Title of each class | Name of each exchange on which registered | |
Common Stock ($0.01 par value) | New York Stock Exchange | |
Securities registered pursuant to Section 12(g) of the Act:
None
____________________________________________________________________________
Indicate by check mark if the registrant is a well-known seasoned issuer, as defined in Rule 405 of the Securities Act. Yes ý No o
Indicate by check mark if the registrant is not required to file reports pursuant to Section 13 or Section 15(d) of the Act. Yes o No ý
Indicate by check mark whether the registrant (1) has filed all reports required to be filed by Section 13 or 15(d) of the Securities Exchange Act of 1934 during the preceding 12 months (or for such shorter period that the Registrant was required to file such reports), and (2) has been subject to such filing requirements for the past 90 days. Yes ý No o
Indicate by check mark whether the registrant has submitted electronically and posted on its corporate Web site, if any, every Interactive Data File required to be submitted and posted pursuant to Rule 405 of Regulation S-T (§ 232.405 of this chapter) during the preceding 12 months (or for such shorter period that the registrant was required to submit and post such files). Yes ý No o
Indicate by check mark if disclosure of delinquent filers pursuant to Item 405 of Regulation S-K (§ 229.405 of this chapter) is not contained herein, and will not be contained, to the best of registrant’s knowledge, in definitive proxy or information statements incorporated by reference in Part III of this Form 10-K or any amendment to this Form 10-K. ý
Indicate by check mark whether the registrant is a large accelerated filer, an accelerated filer, a non-accelerated filer or a smaller reporting company. See the definitions of “large accelerated filer,” “accelerated filer” and “smaller reporting company” in Rule 12b-2 of the Exchange Act.
Large accelerated filer ý | Accelerated filer o | Non-accelerated filer o (Do not check if a smaller reporting company) | Smaller reporting company o | |||
Indicate by check mark whether the Registrant is a shell company (as defined in Rule 12b-2 of the Act). Yes o No ý
At June 30, 2016, the aggregate market value of the common stock held by non-affiliates of the registrant, based upon the closing price of $140.77 on that date on the New York Stock Exchange, was $7,547,517,704. Calculation of holdings by non-affiliates is based upon the assumption, for this purpose only, that executive officers, directors and any persons holding 10% or more of the registrant’s common stock are affiliates. There were 56,703,064 shares of the registrant’s common stock outstanding on February 21, 2017.
DOCUMENTS INCORPORATED BY REFERENCE
Portions of the definitive Proxy Statement to be delivered to shareholders in connection with the Annual Meeting of Shareholders to be held on or about June 13, 2017 are incorporated by reference into Part III.
FORM 10-K
TABLE OF CONTENTS
i
PART I
Forward-Looking Statements
Certain matters discussed in this Annual Report on Form 10-K, in our other filings with the Securities and Exchange Commission, in our press releases and in oral statements made with the approval of an executive officer may constitute“forward-looking statements” within the meaning of the Private Securities Litigation Reform Act of 1995. These statements include, but are not limited to, statements related to our expectations regarding the performance of our business, our financial results, our liquidity and capital resources and other non-historical statements, and may be prefaced with words such as “outlook,” “guidance,” “believes,” “expects,” “potential,” “continues,” “may,” “will,” “should,” “seeks,” “approximately,” “predicts,” “projects,” “intends,” “plans,” “estimates,” “pending investments,” “anticipates” or the negative version of these words or other comparable words. Such statements are subject to certain risks and uncertainties, including, among others, the factors discussed under the caption “Item 1A. Risk Factors.”
These factors (among others) could affect our financial performance and cause actual results to differ materially from historical earnings and those presently anticipated and projected. Forward-looking statements speak only as of the date they are made, and we will not undertake and we specifically disclaim any obligation to release publicly the result of any revisions which may be made to any forward-looking statements to reflect events or circumstances after the date of such statements or to reflect the occurrence of events, whether or not anticipated. In that respect, we caution readers not to place undue reliance on any such forward-looking statements.
Item 1. | Business |
We are a global asset management company with equity investments in leading boutique investment management firms, which we refer to as our “Affiliates.” Our innovative partnership approach allows each Affiliate’s management team to own significant equity in their firm and maintain operational autonomy. Our strategy is to generate shareholder value through the internal growth of existing Affiliates, as well as through investments in new Affiliates, and additional investments in existing Affiliates. In addition, we provide centralized assistance to our Affiliates in strategic matters, marketing, distribution, product development and operations. As of December 31, 2016, our aggregate assets under management were $688.7 billion (approximately $727 billion pro forma for investments which have since closed or are accounted for on a lag basis) in over 550 investment products across a broad range of active return-oriented strategies and distribution channels.
We hold meaningful equity interests in each of our Affiliates. In certain cases, we own a majority of the equity interests while in other cases we own a minority of the equity interests. In all cases, Affiliate management retains a significant equity interest in their own firm. Affiliate management equity ownership (along with our long-term ownership) aligns our interests, enhances Affiliate management equity incentives and preserves the opportunity for Affiliate management to participate directly in the long-term future growth of their firms. Our innovative partnership approach provides Affiliate management with a degree of liquidity and financial diversification and ensures that our Affiliates maintain investment and operational autonomy in managing their businesses, as well as their unique entrepreneurial culture and independence.
Given our long-term partnership approach, when we own a majority of the equity interests in an Affiliate, we address the ongoing succession planning issues facing the Affiliate’s principal owners as they transition incentives to future generations by facilitating the transfer of equity over time to the next generation of Affiliate management. When we own a minority of the equity interests in an Affiliate, we typically do not have an obligation to repurchase Affiliate equity interests, but may make additional investments to further facilitate Affiliate ownership transition.
Although we invest in boutique investment management firms that we anticipate will grow independently, given our partnership approach, we enhance our Affiliates’ growth prospects by providing access to the resources and scale of a global asset management company.
We are focused on investing globally in investment management firms that manage active return-oriented strategies, including traditional, alternative and wealth management firms. We identify high-quality boutique firms based on our thorough understanding of the asset management industry, and we have developed long-term relationships with a significant number of these firms. Within our target universe, we seek strong and stable boutiques that offer active return-oriented strategies, such as alternative strategies and global equity strategies. These boutiques are typically characterized by a strong multi-generational management team, entrepreneurial culture and commitment to building longer-term success.
We anticipate that we will have significant additional investment opportunities across the global asset management industry, most often in independent investment management firms, but also investments resulting from subsidiary divestitures, secondary sales and other special situations. We are well-positioned to execute upon these investment opportunities through our established process of identifying and cultivating investment prospects, our broad industry relationships and our substantial
1
experience and expertise in structuring and negotiating transactions. We have a strong, global reputation as an outstanding partner to our existing Affiliates, and are widely recognized in the marketplace as providing an innovative solution for the succession and strategic needs of boutique investment management firms.
Investment Management Operations
Through our Affiliates, we provide a comprehensive and diverse range of active return-oriented strategies and products to assist institutional, retail and high net worth clients worldwide in achieving their investment objectives. As of December 31, 2016, we managed $688.7 billion (approximately $727 billion pro forma for investments which have since closed or are accounted for on a lag basis) in predominantly alternative strategies and global equity strategies. Our Affiliates’ generally do not manage passive indexing strategies, exchange traded funds, fixed income or money market products, which typically carry lower fee rates than active return-oriented strategies.
Our Affiliates’ investment services and products are distributed by sales and marketing professionals developing new business through direct sales efforts and established relationships with consultants and intermediaries around the world. Our global distribution platform operates in key markets to extend the reach of our Affiliates’ own business development efforts and provide the necessary resources and expertise to ensure that our Affiliates’ products and services are responsive to the evolving demands of the global marketplace. We have offices in Sydney, serving investors in Australia and New Zealand; London, serving investors in the UK and continental Europe; Zurich, serving investors in Switzerland; Dubai, serving investors in the Middle East; and Hong Kong, serving investors in Asia. In addition, we have retail distribution platforms through our wholly-owned subsidiaries, AMG Funds, LLC in Greenwich, Connecticut and AMG Funds PLC in Dublin, Ireland, which provide retail investors with access to our Affiliates’ investment services through registered investment companies and a family of UCITS funds.
Our Affiliates currently manage active return-oriented strategies in over 550 investment products, including for non-U.S. clients in more than 50 countries.
Our Innovative Structure and Relationship with Affiliates
We establish and maintain long-term partnerships with the management equity owners of our Affiliates, believing that Affiliate management equity ownership (along with our long-term ownership) aligns our interests, enhances Affiliate management equity incentives and preserves management’s incentive to continue to grow their businesses. Our innovative partnership approach allows for Affiliate management to retain equity sufficient to address their particular needs and ensures that our Affiliates maintain investment and operational autonomy in managing their businesses, as well as their unique entrepreneurial culture and independence. Although the equity structure of each investment is tailored to meet the needs of the particular Affiliate, in all cases, we maintain a meaningful equity interest in the firm, with a significant equity interest retained by Affiliate management.
Each of our Affiliates operates through distinct entities, typically organized as limited liability companies or limited partnerships (or equivalent non-U.S. forms), which affords us the flexibility to design a separate operating agreement for each Affiliate that reflects our arrangements with respect to governance, economic participation, equity incentives and the other terms of our relationship. In each case, the operating agreement provides for a governance structure that gives Affiliate management the authority to manage and operate the business on a day-to-day basis. The operating agreement also reflects the specific terms of our economic participation in the Affiliate, which in each case uses a “structured partnership interest” to ensure alignment of our economic interests with those of Affiliate management.
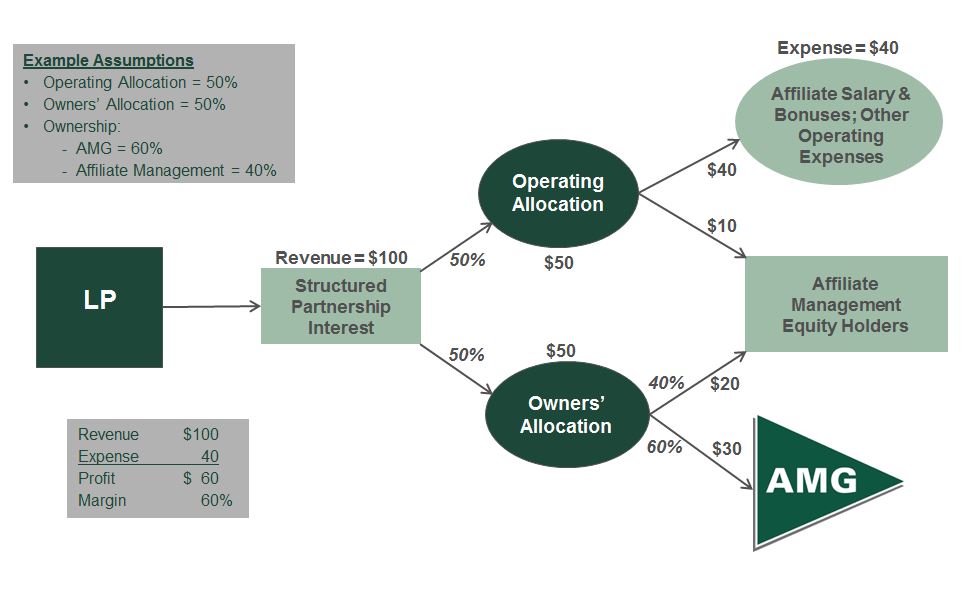
When we own a majority of the equity interests in an Affiliate, we primarily use structured partnership interests in which we share in the Affiliate’s revenue without regard to expenses. For these Affiliate investments, a set percentage of revenue is allocated to fund operating expenses, including compensation (the “Operating Allocation”), while the remaining revenue (the “Owners’ Allocation”) is allocated to us and Affiliate management in proportion to our respective ownership interests. See Exhibit 1. We and Affiliate management therefore participate in any increase or decrease in revenue through the Owners’ Allocation, and Affiliate management also participates in any increase or decrease in margin through the Operating Allocation.
2
Exhibit 1 (Typical Structured Partnership Interest) |
When we own a minority of the equity interests in an Affiliate, our structured partnership interest is either calculated by reference to the Affiliate’s revenue without regard to expenses or by reference to the Affiliate’s revenue less certain agreed-upon expenses. When our structured partnership interest is calculated by reference to an Affiliate’s revenue less certain agreed-upon expenses, we participate in increases and decreases both in revenue and the agreed-upon expenses included in the calculation. This structure allows us to benefit from any increase in revenue or any decrease in the expenses that are included in the calculation, but also directly exposes us to any decrease in revenue or any increase in such expenses, which we may not anticipate and which could be significant.
In structured partnership interests in which we share in an Affiliate’s revenue without regard to expenses, our contractual share of revenue generally has priority over distributions to Affiliate management.
When we own a majority of the equity interests in an Affiliate, we consolidate the Affiliate’s financial results in our Revenue, Operating expenses and Other non-operating (income) and expenses. When we own a minority interest, we generally use the equity method of accounting and our share of the Affiliate’s financial results is reported (net of intangible amortization) in Income from equity method investments. Whether we consolidate an Affiliate’s financial results or use the equity method of accounting, we maintain the same partnership approach and provide support and assistance in substantially the same manner for all Affiliates.
From time to time, we may change the structure of our arrangements with an Affiliate in order to better support the Affiliate’s growth strategy.
Competition
Our Affiliates compete with a large number of other domestic and foreign investment management firms, as well as with subsidiaries of larger financial organizations. These firms may have significantly greater financial, technological and marketing resources, captive distribution and assets under management and many offer an even broader array of investment products and services. Certain Affiliates are active in the same distribution channels and, from time to time, may compete with each other for clients. In addition, there are relatively few barriers to entry for new investment management firms, especially in the Institutional distribution channel. We believe that the most important factors affecting our Affiliates’ ability to compete for clients in our three principal distribution channels are the:
• | investment performance track records, investment style, discipline and reputation of our Affiliates and their management teams; |
• | depth and continuity of client relationships; |
• | diversity of products and level of client service offered; |
3
• | changes in investor preferences, such as the recent growth in passively managed products including index and exchange traded funds; |
• | maintenance of strong business relationships with major intermediaries; |
• | continued development, either organically or through new investments, of investment strategies to meet the changing needs and risk tolerances of investors; and |
• | continued success of our global distribution platform. |
The relative importance of each of these factors can vary depending on the distribution channel and the type of investment management service involved, as well as general market conditions. An Affiliate’s ability to retain and increase assets under management would be adversely affected if client accounts underperform in comparison to relevant benchmarks or peer groups, or if key personnel leave an Affiliate. The ability to compete with other investment management firms also depends, in part, on the relative attractiveness of an Affiliate’s active return-oriented investment strategies, market trends, fees or a combination of these factors.
We compete with a number of acquirers of and investors in investment management firms, including other investment management companies, private equity firms, sovereign wealth funds and larger financial organizations. We believe that the most important factors affecting our ability to compete for future investments are the:
• | degree to which target firms view our investment model, equity incentive structures and access to economies of scale as preferable (financially, operationally or otherwise) to acquisition or investment arrangements offered by others; and |
• | reputation and performance of our Affiliates, by which target firms may judge us and our future prospects. |
Government Regulation
Our and our Affiliates’ businesses are subject to complex and extensive regulation by various regulatory authorities and exchanges in jurisdictions around the world, including those summarized below. These regulations may change from time to time, including as a result of global financial regulatory reform initiatives. Our or our Affiliates’ businesses may be subject to regulatory inquiries by regulatory authorities, and these regulatory authorities may also conduct examinations or inspections of our operations or those of our Affiliates with or without notice. Any determination of a failure to comply with laws or regulations could result in disciplinary or enforcement action, fines, suspensions, or revocation or limitation of business activities or registration. See “Risk Factors.”
AMG Funds is an adviser registered with the U.S. Securities and Exchange Commission (SEC) under the Investment Advisers Act of 1940, as amended (Advisers Act), and sponsors approximately 70 U.S. mutual funds registered under the Investment Company Act of 1940, as amended (Investment Company Act) that are managed by Affiliates and unrelated investment managers. A number of our Affiliates also serve as advisers to mutual funds sponsored by them or by third parties. The Advisers Act imposes numerous obligations on registered investment advisers, including fiduciary duties, recordkeeping requirements, operational requirements and compliance and disclosure obligations. The Investment Company Act imposes additional obligations on fund advisers, including investment restrictions and other governance, compliance, reporting and fiduciary obligations relating to the management of mutual funds. New rules adopted by the SEC in 2016 may create additional reporting requirements for advisers and funds, and additional requirements for mutual funds in the areas of liquidity management.
Outside of the U.S., Affiliated Managers Group Limited (AMG Limited) is regulated by the Financial Conduct Authority in the UK, and is authorized as a promoter in Ireland by the Central Bank of Ireland. AMG Limited serves as the promoter for our Irish UCITS platform, which sponsors UCITS funds managed by Affiliates and marketed by AMG Limited in the UK and Europe. AMG Limited’s branch, AMG Limited (Dubai), is regulated as a representative office by the Dubai Financial Services Authority. Affiliated Managers Group (Hong Kong) Limited is regulated by the Securities and Futures Commission in Hong Kong, and Affiliated Managers Group Pty Ltd is regulated by the Australian Securities and Investments Commission in Australia. Our ability to transact business in these countries, and to conduct cross border activities, is subject to the availability of regulatory authorization.
Our Affiliates’ investment management operations are also subject to regulation by U.S. and non-U.S. authorities and exchanges. The majority of our Affiliates are registered as investment advisers under the Advisers Act, and many of our Affiliates are also subject to non-U.S. regulatory oversight. We have Affiliates domiciled in a number of jurisdictions, and these Affiliates are subject to regulation under the laws and regulations of and supervision by governmental authorities in each
4
of these jurisdictions. Our Affiliates also offer their products and services in many countries around the world, and are subject to various requirements relating to such activities. Many of our Affiliates sponsor registered and unregistered funds in the U.S. and in other jurisdictions, including Guernsey, Jersey, Ireland, Luxembourg, the British Virgin Islands and the Cayman Islands, and are subject to regulatory requirements in those jurisdictions and in the jurisdictions where those funds may be offered. Our Affiliates invest in publicly-traded securities of issuers across the globe and are subject to requirements in numerous jurisdictions for reporting of beneficial ownership positions and other requirements. Virtually all aspects of the asset management business, including strategy and product-related sales and distribution activities, are subject to regulation. These laws, rules and regulations are primarily intended to protect the clients of asset managers, and generally grant supervisory agencies and regulatory bodies broad administrative powers, including the power to set minimum capital requirements and to impose fines or limit or restrict an investment adviser from conducting its business in the event of a failure to comply with such laws and regulations.
We and our Affiliates are also subject to the Employee Retirement Income Security Act of 1974, as amended (ERISA), and related regulations, with respect to their retirement plan clients. ERISA imposes duties on persons who are fiduciaries under ERISA, and prohibits certain transactions involving related parties to a retirement plan. The Department of Labor administers ERISA and regulates investment advisers who service retirement plan clients, and has been increasingly active in proposing and adopting additional regulations applicable to the asset management industry. Rulemaking by the Department of Labor in 2016 extends the application of the fiduciary duty to brokers and other intermediaries in the context of retirement advice.
We and certain of our Affiliates are also members of the National Futures Association and regulated by the Commodity Futures Trading Commission (CFTC) with respect to the management of mutual funds and other products that utilize futures, swaps or other derivative products.
In addition, we and certain of our Affiliates are registered broker-dealers and members of the Financial Industry Regulatory Authority (FINRA), for the purpose of distributing funds or other asset management products. These broker-dealers are subject to net capital rules that mandate that they maintain certain levels of capital. FINRA has adopted extensive regulatory requirements relating to sales practices, registration of personnel, compliance and supervision, and compensation and disclosure. FINRA and the SEC conduct periodic examinations of member broker-dealers. The SEC, FINRA and state securities commissions may also conduct administrative proceedings that can result in censure, fine, suspension or expulsion of a broker-dealer, its officers or registered employees. We and our Affiliates may also be subject to regulatory capital requirements, including those of federal, state and non-U.S. regulatory agencies.
Due to the extensive laws and regulations to which we and our Affiliates are subject, we must devote substantial time, expense and effort to remaining current on, and addressing, legal and regulatory compliance matters. We and our Affiliates have experienced legal teams and compliance professionals in place to address the legal, regulatory and compliance requirements relating to our global operations, and have in place relationships with various legal and regulatory advisors in each of the countries where we and our Affiliates have business interests. We have established compliance programs for each of our operating subsidiaries, and each of our Affiliates has established a compliance program to address regulatory compliance requirements for its operations, and provides ongoing reporting to us on compliance matters.
Employees and Corporate Organization
As of December 31, 2016, we had approximately 4,100 employees, the substantial majority of whom were employed full-time by our Affiliates. Neither we nor our Affiliates are subject to any collective bargaining agreements, and we believe that our and our Affiliates’ labor relations are good. We were formed in 1993 as a corporation under the laws of the State of Delaware.
Our Web Site
Our web site is www.amg.com. Our web site provides information about us, and from time to time we may use it as a distribution channel of material company information. We routinely post financial and other important information regarding the Company in the “Investor Relations” section of our web site and we encourage investors to consult that section regularly. That section of our web site includes a link to another web site where one can obtain, free of charge, copies of our Annual Reports on Form 10-K, Quarterly Reports on Form 10-Q and Current Reports on Form 8-K, including exhibits, and any amendments to those reports filed or furnished with the SEC pursuant to Section 13(a) or 15(d) of the Securities Exchange Act of 1934, as amended. We make these reports available through our web site as soon as reasonably practicable after our electronic filing of such materials with, or the furnishing of them to, the SEC. The information contained or incorporated on our web site is not a part of this Annual Report on Form 10-K.
5
Item 1A. | Risk Factors |
We and our Affiliates face a variety of risks that are substantial and inherent in our businesses, including those related to markets, liquidity, credit, operational, legal and regulatory risks. The following are some of the more important factors that could affect our and our Affiliates’ businesses. Certain statements in “Risk Factors” are forward-looking statements. See “Forward-Looking Statements.”
Our financial results depend on the receipt of asset based and performance fees by our Affiliates, and are impacted by changes in our total assets under management as well as the relative levels of assets under management among our Affiliates.
Our financial results depend on the receipt of investment management fees by our Affiliates. Asset based fees are primarily based on a percentage of the value of assets under management, and vary with the nature of the account or product managed. In certain instances, our Affiliates are paid fees based on investment performance on an absolute basis or relative to a benchmark and, as such, are directly dependent upon investment results that may vary substantially from year to year. The total level of our assets under management generally or with particular Affiliates could be adversely affected by conditions outside of our control, including:
• | a decline in market value of such assets, including due to exchange rate fluctuations, or declines in the capital markets and in the equity markets in particular; |
• | changes in investor risk tolerance or investment preferences such as the recent growth in passively managed products including index and exchange traded funds, which could result in investor allocations away from active return-oriented strategies offered by our Affiliates; |
• | our Affiliates’ ability to maintain existing advisory relationships and fee structures; |
• | our or our Affiliates’ ability to market products and services, which may be impacted by volatility in the capital markets or in the prices of securities; |
• | the ability to market products and services available through AMG Funds; |
• | unanticipated changes in currency exchange rates, interest rates, inflation rates, or the yield curve; |
• | global economic conditions, exacerbated by changes in the equity or debt marketplaces; |
• | financial crises, political or diplomatic developments, war, terrorism or natural disasters; and |
• | other factors that are difficult to predict. |
A reduction in our assets under management would adversely affect the fees payable to our Affiliates and, ultimately, our results of operations and financial condition. Further, our structured partnership interests are tailored to meet the needs of each Affiliate and are therefore varied, and our revenue and profitability may be adversely affected by changes in the relative performance and the relative levels of assets under management among our Affiliates, independent of overall effective fee rates and our total level of assets under management. Additionally, certain Affiliates contribute significantly to our earnings and, therefore, changes in the assets under management at such Affiliates for any of the above reasons could have a disproportionate adverse impact on our earnings.
Our growth strategy depends upon the continued growth of our existing Affiliates and upon making investments in new boutique investment management firms or additional investments in existing Affiliates.
Our Affiliates may not maintain their respective levels of performance or contribute to our growth at their historical or currently anticipated levels. Also, our Affiliates may be unable to carry out their management succession plans, which may adversely affect their operations and revenue streams and thus our results of operations.
Our continued success in investing in boutique investment management firms will depend upon our ability to find suitable firms in which to invest or make additional investments in existing Affiliates, our ability to negotiate agreements with such firms on acceptable terms and our ability to raise the capital necessary to finance such transactions. We cannot be certain that we will be successful in making investments in such firms or that they will have favorable operating results following our investment, which could have an adverse effect on our financial condition and results of operations.
Historically, equity markets and our common stock have been volatile.
The market price of our common stock has experienced and may continue to experience volatility, and the broader equity markets have experienced and may again experience significant price and volume fluctuations. In addition, our announcements
6
of our quarterly financial and operating results, including changes in net client cash flows and assets under management, changes in our financial guidance or our failure to meet such guidance, changes in general conditions in the economy or the financial markets and other developments affecting us, our Affiliates or our competitors, as well as geopolitical, regulatory, economic, and business factors unrelated to us, could cause the market price of our common stock to fluctuate substantially.
If our reputation is harmed, we could suffer losses in our business and financial results.
Our business depends on earning and maintaining the trust and confidence of our Affiliates and our stockholders. Our reputation is critical to our business and is vulnerable to threats that may be difficult or impossible to control, and costly or impossible to remediate. For example, failure to comply with applicable laws, rules or regulations, errors in our public reports or litigation against us or any of our Affiliates, or the publicity surrounding these events, even if satisfactorily addressed, could adversely impact our reputation, our relationships with our Affiliates and our ability to negotiate agreements with new investment management firms, which could negatively impact our financial condition and results of operations.
Our and our Affiliates’ businesses are highly regulated.
Our and our Affiliates’ businesses are subject to complex and extensive regulation by various regulatory and self-regulatory authorities and exchanges in jurisdictions around the world, as detailed in “Government Regulation” in Item 1. This regulatory environment may be altered without notice by new laws or regulations, revisions to existing laws or regulations or new or revised interpretations, guidance or enforcement priorities. These laws and regulations impose requirements, restrictions and limitations on our and our Affiliates’ businesses, and compliance with these laws and regulations results in significant cost and expense. Any determination of a failure to comply with laws or regulations could result in disciplinary or enforcement action with penalties that may include the disgorgement of fees, fines, suspensions or censure of individual employees or revocation or limitation of business activities or registration. Further, if we or any of our Affiliates were to fail to comply with applicable laws, rules or regulations or be named as a subject of an investigation or other regulatory action, the public announcement and potential publicity surrounding any such investigation or action could have a material adverse effect on our stock price and result in increased costs even if we or our Affiliates were found not to have violated such laws, rules or regulations. The failure to satisfy regulatory requirements could subject us or our Affiliates to civil liability, criminal liability or sanctions that might materially impact our or our Affiliates’ businesses. Further, some of these laws and regulations limit the types of activities in which we or our Affiliates may engage, and any failure to manage our respective businesses to ensure compliance with applicable regulations and to avoid becoming subject to additional regulations could have a material adverse effect on our and our Affiliates’ businesses. As investment advisers, our Affiliates and AMG Funds are subject to numerous obligations, fiduciary duties and other regulatory requirements, where non-compliance could result in censure or termination of adviser status, litigation or reputational harm, any of which could have a material adverse effect on our stock price and results of operations.
In the U.S., the new presidential administration may significantly alter current regulation, including the Dodd-Frank Wall Street Reform and Consumer Protection Act, which may create uncertainty, or change the requirements applicable to our and our Affiliates’ businesses. Rulemaking under the Dodd-Frank Wall Street Reform and Consumer Protection Act continues to drive regulation in our industry for the time being, with new rules imposing additional restrictions and limitations on our and our Affiliates’ businesses. Rulemaking proposed by the SEC has created additional reporting requirements for advisers and funds, and additional requirements for mutual funds in the areas of liquidity management. For example, if the new administration proceeds with the derivatives rule proposal, and that rule is adopted as proposed, it could negatively impact our Affiliates’ ability to manage certain products. Further, rulemaking by the Department of Labor in 2016 extends the application of fiduciary duty standards under ERISA to brokers and other intermediaries in the context of retirement advice. If the Department of Labor proceeds with implementation of the new fiduciary rule, that rule may impact the way retirement products are sold and could negatively impact the distribution of Affiliate products into that channel.
Changes in laws or regulatory requirements, or the interpretation or application of such laws and regulatory requirements by regulatory authorities, may occur with short or no notice, and could have a material adverse impact on our and our Affiliates’ financial results and mode of operations. Globally, proposals have called for more stringent regulation of the financial services industry in which we and our Affiliates operate, which may make it more likely that changes will occur that could adversely affect our and our Affiliates’ businesses, increase compliance costs, require that we or our Affiliates curtail operations or investment offerings, or impact our access to capital and the market for our common stock. Regulators continue to consider whether asset managers or funds, or certain asset management products or activities, should be designated as systemically important, and therefore subject to additional regulation. In the UK and Europe, our and our Affiliates’ businesses may be impacted by financial services reform initiatives enacted or under consideration in the European Union, and by the UK’s vote on the referendum to exit the European Union, which could impact our or our Affiliates’ ability to conduct operations pursuant to a European passport. These new laws and regulations may also result in increased compliance costs and expenses, and non-compliance may result in fines and penalties.
7
Our and our Affiliates’ international operations are subject to foreign risks, including political, regulatory, economic and currency risks.
We and certain of our Affiliates operate offices or advise clients outside the U.S., and several Affiliates are based outside the U.S. Accordingly, we and certain of our Affiliates are subject to risks inherent in doing business internationally, in addition to the risks our businesses face more generally. These risks may include changes in applicable laws and regulatory requirements, difficulties in staffing and managing foreign operations, longer payment cycles, difficulties in collecting investment advisory fees receivable, different (and in some cases less stringent) legal, regulatory and accounting regimes, political instability, fluctuations in currency exchange rates, expatriation controls, expropriation risks and potential adverse tax consequences. In the UK, for example, our and our Affiliates’ businesses may be impacted by the UK’s vote on the referendum to exit the European Union. In addition, we and certain of our Affiliates are required to maintain minimum levels of capital, and such capital requirements may be increased from time to time, which may have the effect of limiting withdrawals of capital, repayment of intercompany loans and payment of distributions to us by these Affiliates. These or other risks related to our and our Affiliates’ non-U.S. operations may have an adverse effect on our business, financial condition and results of operations.
Failure to comply with the applicable laws, rules, regulations, codes, directives, notices or guidelines in any jurisdiction outside of the U.S. could result in a wide range of penalties and disciplinary actions, including fines, censures and the suspension or expulsion from a particular jurisdiction or market or the revocation of licenses, any of which could adversely affect our or our Affiliates’ reputations and operations. Regulators in jurisdictions outside of the U.S. could also change their policies or laws in a manner that might restrict or otherwise impede the ability to offer our Affiliates’ investment products and services in their respective markets, or we or our Affiliates may be unable to keep up with, or adapt to, the ever-changing, complex regulatory requirements in such jurisdictions or markets, which could further negatively impact our business.
Changes in tax laws or exposure to additional income tax liabilities could have a material impact on our financial condition, results of operations and liquidity.
We are subject to income taxes as well as non-income-based taxes in the U.S. and certain foreign jurisdictions. Tax laws, regulations and administrative practices in various jurisdictions may be subject to significant change, with or without notice, and significant judgment is required in estimating and evaluating our tax provision and accruals. Our effective tax rates could be affected by a change in the mix of earnings in countries with differing statutory tax rates, as well as changes in foreign currency exchange rates, changes to our existing business and changes in relevant tax, accounting or other laws, regulations, administrative practices and interpretations. We are subject to ongoing tax examinations by various tax authorities and may be subject to future tax examinations. We regularly assess the likely outcomes of these examinations in order to determine the appropriateness of our tax provision. However, tax authorities may disagree with certain positions we have taken and may assess additional taxes and/or penalties and interest. There can be no assurance that we will accurately predict the outcomes of these examinations and the actual outcomes could have a material impact on our financial condition and results of operations.
Future changes in U.S. or foreign tax laws, including those with retroactive effect, could materially impact our effective tax rate, overall tax expense and cash flow. The U.S. Congress and other government agencies in jurisdictions in which we do business have maintained a focus on the taxation of multinational companies. Proposals for fundamental U.S. corporate tax reform call for significant changes to the taxation of corporate profits and foreign earnings. If enacted, the proposed reforms could materially affect the valuation of our deferred tax assets and liabilities, the future deductibility of our interest expense and intangible assets, and the rates at which our foreign earnings would be taxed in the U.S. While the prospects for U.S. tax reform are uncertain, the current proposals being considered could have a significant impact on our financial condition and results of operations.
Our Affiliates’ autonomy limits our ability to alter their management practices and policies, and we may be held responsible for liabilities incurred by certain of them.
Although our agreements with Affiliates typically give us the authority to control and/or vote with respect to certain of their business activities, we generally are not directly involved in managing our Affiliates’ day-to-day activities, including investment management policies and procedures, fee levels, marketing, product development, client relationships, employment and compensation programs and compliance activities. As a consequence, our financial condition and results of operations may be adversely affected by problems stemming from the day-to-day operations of our Affiliates, where weaknesses or failures in internal processes or systems, legal or regulatory matters, or other operational challenges could lead to a disruption of our Affiliates’ operations, liability to their clients, exposure to claims or disciplinary action or reputational harm.
Some of our Affiliates are limited liability companies or limited partnerships (or equivalent non-U.S. forms) of which we, or entities controlled by us, are the general partner or managing member. Consequently, to the extent that any of these Affiliates
8
incur liabilities or expenses that exceed their ability to pay for them, we may be directly or indirectly liable for their payment. Similarly, an Affiliate’s payment of distributions to us may be subject to claims by potential creditors, and an Affiliate may default on distributions that are payable to us. In addition, with respect to each of these Affiliates, we may be held liable in some circumstances as a control person for the acts of the Affiliate or its employees. Our Affiliates also may face various claims, litigation or complaints from time to time and we cannot predict the eventual outcome of such matters, some of which may be resolved in a manner unfavorable to us or our Affiliates, or whether any matters could become material to a particular Affiliate or us in any reporting period. While we and our Affiliates maintain errors and omissions and general liability insurance in amounts believed to be adequate to cover certain potential liabilities, we cannot be certain that we will not have claims that exceed the limits of available insurance coverage, that the insurers will remain solvent and will meet their obligations to provide coverage or that insurance coverage will continue to be available to us and our Affiliates with sufficient limits and at a reasonable cost. A judgment in excess of available insurance coverage could have a material adverse effect on our financial condition and results of operations.
The agreed-upon expense allocation under our structured partnership interests in which we share in the Affiliate’s revenue without regard to expenses may not be large enough to pay for all of the respective Affiliate’s operating expenses.
In our typical structured partnership interests, the Affiliate allocates a specified percentage of Owners’ Allocation to us, while using the remainder of Owners’ Allocation along with the Operating Allocation for operating expenses and for distributions to Affiliate management. Our structured partnership interests, and these agreed allocations, may not anticipate changes in the revenue and operating expense base of the Affiliate, and the revenue remaining after our Owners’ Allocation may not be large enough to cover all of the Affiliate’s operating expenses. While our distributions generally have priority, we may elect to defer or forgo the receipt of our share of the Affiliate’s revenue to permit the Affiliate to fund such operating expenses, with the aim of maximizing the long-term benefits. We cannot be certain that any such deferral or forbearance would be of any greater benefit to us, and such a deferral or forbearance may have an adverse effect on our near- or long-term financial condition and results of operations. Further, unanticipated changes in revenue, operating expenses or other commitments could leave the Affiliate with a shortfall in remaining funds for distribution to us or to Affiliate management, which may have an adverse effect on our financial condition generally and on our results of operations for the applicable reporting period.
When our structured partnership interest is calculated by reference to the Affiliate’s revenue less certain agreed-upon expenses, we have direct exposure to fluctuations in revenue and operating expenses.
In the case of our structured partnership interests that are calculated by reference to an Affiliate’s revenue less certain agreed-upon expenses, we are allocated a set percentage of the Affiliate’s revenue less certain agreed-upon expenses, thereby participating in any increases or decreases in both revenue and the expenses that are included in the calculation. This structure allows us to benefit from any increase in revenue or any decrease in the expenses that are included in the calculation, but also directly exposes us to any decrease in revenue or any increase in such expenses, which we may not anticipate and which could be significant. Further, the impact of such decreases and increases in revenue or expenses at these Affiliates on our earnings and our stock price could increase if the portion of our earnings derived from such Affiliates increases.
We may restructure our relationships with Affiliates, and cannot be certain that any such restructurings will benefit us in the near- or long-term.
From time to time we may restructure our relationships with our Affiliates, which could, among other things, include changes to our structured partnership interests, including the calculation of our share of revenue and/or operating expenses. Such restructurings may be done in order to address an Affiliate’s succession planning, changes in their operating expense base, strategic planning or other developments. Any restructuring of our interest in an Affiliate may result in additional investments from us or a reduction of our interest in the Affiliate, and could impact our share of the Affiliate’s revenue and/or operating expenses. Any such restructurings could have an adverse impact on our financial condition and results of operations.
Our industry is highly competitive.
Our Affiliates compete with a broad range of domestic and foreign investment management firms, including public, private and client-owned investment advisors, firms managing passive strategies as well other firms managing active return-oriented strategies, firms associated with securities broker-dealers, financial institutions, insurance companies, private equity firms, sovereign wealth funds and other entities that serve our three principal distribution channels. This competition may reduce the fees that our Affiliates can obtain for investment management services. We believe that our Affiliates’ ability to compete effectively with other firms depends upon our Affiliates’ strategies, investment performance, reputations, and client-servicing capabilities, and the marketing and distribution of their investment strategies, among other factors. See “Competition” in Item 1. Our Affiliates may not compare favorably with their competitors in any or all of these categories. From time to time, our
9
Affiliates may also compete with each other for clients. Further, our Affiliates’ ability to compete with other investment management firms also depends, in part, on the relative attractiveness of their investment strategies, market trends, fees or a combination of these factors. Our Affiliates represent a diverse group of boutique investment management firms with predominantly active return-oriented strategies, rather than indexing strategies, exchange traded funds, fixed income or money market products, which typically carry lower fee rates. Changes in investor risk tolerance or investment preferences, such as recent growth in passively managed products including index and exchange traded funds, could result in investor allocation away from active return-oriented strategies.
The market for acquisitions of interests in boutique investment management firms is highly competitive. Many other public and private financial services companies, including commercial and investment banks, private equity firms, sovereign wealth funds, insurance companies and investment management firms, which may have significantly greater resources than we do, also invest in or buy boutique investment management firms. Further, our innovative partnership approach with our Affiliates is designed to provide enhanced incentives for management owners while enabling us to protect our interests, including through structured partnership interests and long-term employment agreements with key members of the firm. Target investment management firms may prefer investments in their firms under terms and structures offered by our competitors. We cannot guarantee that we will be able to compete effectively with such companies, that new competitors will not enter the market or that such competition will not make it more difficult or not feasible for us to maintain existing investments or to make new investments in boutique investment management firms.
The failure to consummate announced investments in new investment management firms could have an adverse effect on our financial condition and results of operations.
Consummation of our announced investments is generally subject to a number of closing conditions, contingencies and approvals, including but not limited to obtaining certain consents of the investment management firms’ clients and applicable regulatory approvals. In the event that an announced transaction is not consummated, we may experience a decline in the price of our common stock to the extent that the then-current market price reflects a market assumption that we will complete the announced transaction. In addition, the fact that a transaction did not close after we announced it publicly may negatively affect our ability and prospects to consummate transactions in the future. Finally, we must pay costs related to these investments, including transaction fees, even if the investments are not completed, which may have an adverse effect on our financial condition and results of operations.
We expect that we will need to raise additional capital in the future, and existing or future resources may not be available to us in sufficient amounts or on acceptable terms.
While we believe that our existing cash resources and cash flow from operations will be sufficient to meet our working capital needs for normal operations for the foreseeable future, our continuing acquisitions of interests in new boutique investment management firms and additional investments in existing Affiliates may require additional capital. Further, we are contingently liable to make additional purchase payments (of up to $396.9 million through 2019) upon the achievement of specified financial targets in connection with certain of our prior acquisitions. As of December 31, 2016, we expected to make payments of $10.3 million ($3.0 million in 2017) to settle such obligations. We also have committed to co-invest in certain investment partnerships, which commitments may be called in future periods.
Subject to certain limitations, majority-owned Affiliate equity interests generally provide holders the conditional right to put equity interests to us over time. Because these obligations are conditional and dependent upon the individual equity holder’s decision to sell his or her equity, it is difficult to predict the frequency and magnitude of these repurchases (our Redeemable non-controlling interests balance at December 31, 2016 was $673.5 million). We may also call all or a portion of these equity interests upon, among other events, the termination of an equity holder’s employment, although these rights may be limited or suspended in certain circumstances. These obligations may require more cash than is then available from operations. Thus, we may need to raise capital by making additional borrowings or by selling shares of our common stock or other equity or debt securities, or to otherwise refinance a portion of these obligations.
As of December 31, 2016, we had outstanding total debt of $2.3 billion. Our level of indebtedness may increase if we fund one or more future acquisitions through borrowings under our credit facilities. This additional indebtedness could increase our vulnerability to general adverse economic and industry conditions and would require us to dedicate a greater portion of our cash flow from operations to payments on our indebtedness.
The financing activities described above could increase our interest expense, decrease our net income (controlling interest) or dilute the interests of our existing stockholders. In addition, our access to further capital, and the cost of capital we are able to access, is influenced by a number of factors, including the state of global credit and equity markets, interest rates, credit spreads and our credit ratings. We are rated A3 by Moody’s Investors Service and BBB+ with a positive outlook by S&P Global Ratings. The rating agencies could decide to modify their outlook or downgrade our ratings or the entire investment
10
management industry, thereby making it difficult to access capital markets. In addition, a reduction in our credit rating could increase our borrowing costs.
Our debt agreements impose certain covenants relating to the conduct of our business, including financial covenants under our credit facilities, and, if amounts borrowed or outstanding under these agreements were subject to accelerated repayment, we may not have sufficient assets or liquidity to repay such amounts in full.
Our credit facilities require us to maintain specified financial ratios, including a maximum leverage ratio and a minimum interest coverage ratio, and also contain customary affirmative operating covenants and negative covenants that, among other things, place certain limitations on our and our subsidiaries’ ability to incur debt, merge or transfer assets and on our ability to create liens. The indentures governing our senior notes also contain restrictions on our ability to merge or transfer assets and on our ability to create liens. The breach of any covenant (either due to our actions or, in the case of financial covenants, due to a significant and prolonged market driven decline in our operating results) could result in a default under the applicable debt agreement. In the event of any such default, lenders that are party to the credit facilities could refuse to make further extensions of credit to us. Further, in the event of certain defaults, amounts borrowed under the credit facilities and/or outstanding under the senior notes, together with accrued interest and other fees, could become immediately due and payable. If any indebtedness under the credit facilities or the indentures governing the senior notes was subject to accelerated repayment, we may not have sufficient liquid assets to repay such indebtedness in full.
We have substantial intangibles on our balance sheet, and any impairment of our intangibles could adversely affect our financial condition and results of operations.
At December 31, 2016, our total assets were $8.7 billion, of which $4.1 billion were intangible assets, and $3.4 billion were equity method investments in Affiliates, an amount primarily composed of intangible assets. We cannot be certain that we will realize the value of such intangible assets. An impairment of our intangible assets or an other-than-temporary decline in the value of our equity investments could adversely affect our financial condition and results of operations.
We and our Affiliates rely on certain key personnel and cannot guarantee their continued service.
We depend on the efforts of our executive officers and our other officers and employees. Our executive officers, in particular, play an important role in the stability and growth of our existing Affiliates and in identifying potential investment opportunities. We do not have employment agreements with our executive officers, although each has a significant deferred equity interest in the Company and is subject to non-solicitation and non-competitive restrictions that may be triggered upon their departure. However, there is no guarantee that these officers will remain with the Company.
In addition, our Affiliates depend heavily on the services of key principals, who in many cases have managed their firms for many years. These principals often are primarily responsible for their firm’s investment decisions. Although we use a combination of economic incentives, transfer restrictions and, in some instances, non-solicitation and employment agreements in an effort to retain key management personnel, there is no guarantee that these principals will remain with their firms. Since certain Affiliates contribute significantly to our revenue, the loss of key management personnel at these Affiliates could have a disproportionately adverse impact on our business.
Investment management contracts are subject to termination on short notice.
Through our Affiliates, we derive almost all of our revenue from clients pursuant to investment management contracts. While certain Affiliates’ private equity and alternative products have long-term commitment periods, many of our Affiliates’ investment management contracts are terminable by the client without penalty upon relatively short notice (typically not longer than 60 days) and may not be assignable without consent. We cannot be certain that our Affiliates will be able to retain their existing clients or attract new clients. If their clients withdraw a substantial amount of funds, it is likely to harm our results of operations. In addition, investment management contracts with mutual funds are subject to annual approval by each fund’s board of directors.
Our or our Affiliates’ controls and procedures and risk management policies may be inadequate, fail or be circumvented, and procedures may be inadequate, and operational risk could adversely affect our or our Affiliates’ reputation and financial position.
We and our Affiliates have adopted various controls, procedures, policies and systems to monitor and manage risk in our and their businesses. While we currently believe that our and our Affiliates’ operational controls are effective, we cannot provide assurance that those controls, procedures, policies and systems will always be adequate to identify and manage the internal and external risks in our and our Affiliates’ various businesses. Furthermore, we or our Affiliates may have errors in business processes or fail to implement proper procedures in operating our or their businesses, which may expose us or our Affiliates to risk of financial loss or failure to comply with a regulatory requirement. We and our Affiliates are also subject to
11
the risk that employees or contractors, or other third parties, may deliberately seek to circumvent established controls to commit fraud or act in ways that are inconsistent with our or our Affiliates’ controls, policies and procedures. The financial and reputational impact of control failures can be significant.
In addition, our and our Affiliates’ businesses and the markets in which we and our Affiliates operate are continuously evolving. If our or our Affiliates’ risk framework is ineffective, either because of a failure to keep pace with changes in the financial markets, regulatory requirements, our or our Affiliates’ businesses, counterparties, clients or service providers or for other reasons, we or our Affiliates could incur losses, suffer reputational damage or be out of compliance with applicable regulatory or contractual mandates or expectations.
Provisions in our organizational documents, Delaware law and our debt agreements could delay or prevent a change in control of our company.
Provisions in our charter and by-laws and anti-takeover provisions under Delaware law could discourage, delay or prevent an unsolicited change in control of the Company. These provisions may also have the effect of making it more difficult for third parties to replace our executive officers without the consent of our Board of Directors. Provisions in our charter and by-laws that could delay or prevent an unsolicited change in control include:
• | the ability of our Board of Directors to issue preferred stock and to determine the terms, rights and preferences of the preferred stock without stockholder approval; and |
• | the prohibition on the right of stockholders to call meetings or act by written consent and limitations on the right of stockholders to present proposals or make nominations at stockholder meetings. |
Delaware law also imposes restrictions on mergers and other business combinations between us and any holder of 15 percent or more of our outstanding common stock. In addition, our credit facilities and the indentures governing our senior notes contain various covenants that limit our ability, among other things, to consolidate, merge, sell or otherwise dispose of all or substantially all of our assets. Further, given our long-term partnership approach, which is designed to preserve our Affiliates’ investment and operational autonomy and independence, a change in control may also be viewed negatively by our Affiliates, impacting their relationships with us.
These anti-takeover provisions and other factors may inhibit a change in control in circumstances that could give our stockholders the opportunity to realize a premium over the market price of our common stock, and may result in negative impacts on our financial results in periods following a change in control.
The sale or issuance of substantial amounts of our common stock, or the expectation that such sales or issuances will occur, could adversely impact the price of our common stock.
The sale or issuance of substantial amounts of our common stock in the public market could adversely impact its price. In connection with our financing activities, we have issued securities and entered into contracts, including our junior convertible trust preferred securities and equity distribution program, that may result in the issuance of our common stock upon the occurrence of certain events. We also have exercisable options outstanding and unvested restricted stock that have been awarded under our share-based incentive plans. Additionally, we have the right to settle certain Affiliate equity repurchase obligations with shares of our common stock. Moreover, in connection with future financing activities, we may issue additional convertible securities or shares of our common stock, including through forward equity transactions. Any such issuance of shares of our common stock could have the effect of substantially diluting the interests of our current equity holders. In the event that a large number of shares of our common stock are sold or issued in the public market, or the expectation that such sales or issuances will occur, the price of our common stock may decline as a result.
Failure to maintain and properly safeguard an adequate technology infrastructure may limit our or our Affiliates’ growth, result in losses or disrupt our or our Affiliates’ businesses.
Our and our Affiliates’ businesses are reliant upon financial, accounting and technology systems and networks to process, transmit and store information, including sensitive client and proprietary information, and to conduct many business activities and transactions with clients, advisors, vendors and other third parties. The failure to implement, maintain and safeguard an infrastructure commensurate with the size and scope of our and our Affiliates’ businesses could impede productivity and growth, which could adversely impact our financial condition and results of operations. Further, we and our Affiliates rely on third parties for certain aspects of our respective businesses, including financial intermediaries and technology infrastructure and service providers, including brokers, custodians, administrators and other agents, and these parties are also susceptible to similar risks.
12
Although we and our Affiliates take protective measures and endeavor to modify them as circumstances warrant, computer systems, software, networks and mobile devices, and those of third parties on whom we and our Affiliates rely, may be vulnerable to cyber-attacks, breaches, unauthorized access, theft, misuse, computer viruses or other malicious code and other events that could have a security impact. If any such events occur, it could jeopardize confidential, proprietary or other sensitive information of ours, our Affiliates and our respective clients, employees or counterparties that may be stored in, or transmitted through, internal or third-party computer systems, networks and mobile devices, or could otherwise cause interruptions or malfunctions in our and our Affiliates’ operations or those of our respective clients or counterparties. Despite efforts to ensure the integrity of systems and networks, it is possible that we, our Affiliates or third-party service providers may not be able to anticipate or to implement effective preventive measures against all threats, especially because the techniques used change frequently and can originate from a wide variety of sources. As a result, we or our Affiliates could experience disruption, significant losses, increased costs, reputational harm, regulatory actions or legal liability, any of which could have a material adverse effect on our financial condition and results of operations. We or our Affiliates may be required to spend significant additional resources to modify protective measures or to investigate and remediate vulnerabilities or other exposures, and we or our Affiliates may be subject to litigation and financial losses that are either not insured against fully or not fully covered through any insurance that we or our Affiliates maintain. Further, recent well-publicized security breaches at other companies have led to enhanced government and regulatory scrutiny of the measures taken by companies to protect against cyber-attacks, and may in the future result in heightened cyber security requirements, including additional regulatory expectations for oversight of vendors and service providers.
Our financial results could be adversely affected by the financial stability of other financial institutions.
We and our Affiliates routinely execute transactions with various counterparties in the financial services industry. Historical market volatility highlights the interconnection of the global markets and demonstrates how the deteriorating financial condition of one or more institutions may materially and adversely impact the performance of other institutions. We and our Affiliates may be exposed to credit, operational or other risk in the event that a counterparty with whom we or our Affiliates transact defaults on its obligations, or if there are other unrelated systemic failures in the markets.
13
Item 1B. | Unresolved Staff Comments |
None.
Item 2. | Properties |
We conduct our operations around the world using a combination of leased and owned facilities. While we believe we have suitable property resources currently, we will continue to evaluate our property needs and will complement these resources as necessary.
Our principal offices are located at 777 South Flagler Drive, West Palm Beach, Florida; 600 Hale Street, Prides Crossing, Massachusetts; and 35 Park Lane, London, England. We also lease offices in Greenwich, Connecticut; Conshohocken, Pennsylvania; Sydney, Australia; Toronto, Canada; Zurich, Switzerland; Hong Kong; and Dubai, United Arab Emirates. In addition, each of our Affiliates leases office space in the city or cities in which it conducts business, as appropriate for their respective business needs from time to time.
Item 3. | Legal Proceedings |
From time to time, we and our Affiliates may be parties to various claims, suits, complaints and regulatory inquiries, certain of which are described in the notes to our Consolidated Financial Statements. Currently, there are no such claims, suits, complaints or regulatory inquiries against us or our Affiliates that, in our opinion, would have a material adverse effect on our financial position, liquidity or results of operations.
Item 4. | Mine Safety Disclosures |
Not applicable.
14
PART II
Item 5. | Market for Registrant’s Common Equity, Related Stockholder Matters and Issuer Purchases of Equity Securities |
Our common stock is traded on the New York Stock Exchange (symbol: AMG). The following table sets forth the high and low prices as reported on the New York Stock Exchange since January 1, 2015 for the periods indicated.
High | Low | |||||||
2015 | ||||||||
First quarter | $ | 221.46 | $ | 191.36 | ||||
Second quarter | 230.63 | 211.98 | ||||||
Third quarter | 221.80 | 164.54 | ||||||
Fourth quarter | 190.74 | 141.68 | ||||||
2016 | ||||||||
First quarter | $ | 165.10 | $ | 115.97 | ||||
Second quarter | 179.85 | 131.16 | ||||||
Third quarter | 148.70 | 131.02 | ||||||
Fourth quarter | 162.85 | 130.48 | ||||||
The closing price for a share of our common stock as reported on the New York Stock Exchange on February 21, 2017 was $170.91. As of February 21, 2017, there were 18 stockholders of record, including banks, brokers and other financial institutions holding shares in omnibus accounts for their customers (in total representing substantially all of the beneficial holders of our common stock).
On January 30, 2017, we announced the initiation of a quarterly cash dividend program, and declared a $0.20 per share cash dividend. We paid the initial dividend on February 23, 2017 to all holders of record of our common stock as of February 9, 2017. We expect to continue paying quarterly cash dividends, although the declaration of future dividends will be at the discretion of our Board of Directors.
Issuer Purchases of Equity Securities
Our Board of Directors authorized share repurchase programs in January 2017 and May 2015, authorizing us to repurchase up to 1.9 million and 3.0 million shares of our common stock, respectively, which do not expire. Purchases may be made from time to time, at management's discretion, in the open market or in privately negotiated transactions, including through the use of derivative instruments. Upon the January 2017 authorization, we had 4.0 million total shares available for repurchase under the share repurchase programs.
15
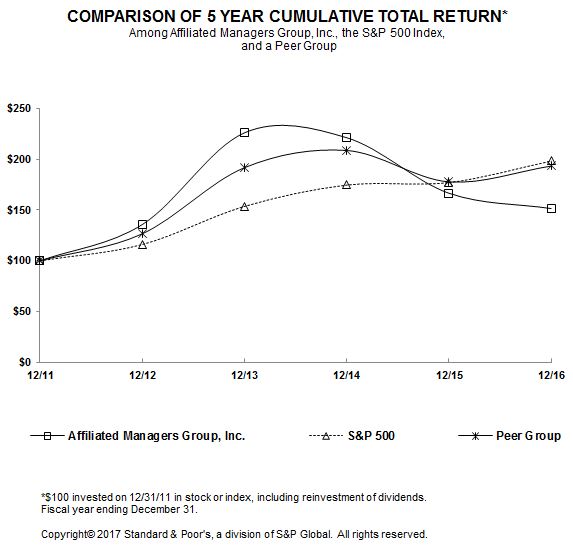
Performance Graph
The following graph compares the cumulative stockholder return on our common stock from December 31, 2011 through December 31, 2016, with the cumulative total return, during the same period, on the Standard & Poor’s 500 Index and a peer group comprising AllianceBernstein Holding L.P., Ameriprise Financial, Inc., BlackRock, Inc., Eaton Vance Corp., Franklin Resources, Inc., Invesco Ltd., Legg Mason, Inc., T. Rowe Price Group, Inc. and Waddell & Reed Financial, Inc. The comparison assumes the investment of $100 on December 31, 2011 in our common stock and each of the comparison indices and, in each case, assumes reinvestment of all dividends.
16
Item 6. | Selected Financial Data |
The following table presents selected financial data for the last five years. This data should be read in conjunction with, and is qualified in its entirety by reference to, the Consolidated Financial Statements and accompanying notes included elsewhere in this Annual Report on Form 10-K.
For the Years Ended December 31, | ||||||||||||||||||||
(in millions, except as noted and per share data) | 2012(1) | 2013(1) | 2014(1) | 2015(1) | 2016 | |||||||||||||||
Operating Measures | ||||||||||||||||||||
Assets under management (at period end, in billions) | $ | 431.8 | $ | 537.3 | $ | 620.2 | $ | 611.3 | $ | 688.7 | ||||||||||
Average assets under management (in billions) | 381.2 | 483.8 | 585.9 | 623.9 | 655.6 | |||||||||||||||
Consolidated Affiliate average assets under management (in billions) | $ | 276.2 | $ | 334.8 | $ | 387.8 | $ | 396.4 | $ | 373.4 | ||||||||||
Equity method Affiliate average assets under management (in billions) | 105.0 | 149.0 | 198.1 | 227.5 | 282.2 | |||||||||||||||
Revenue | $ | 1,805.5 | $ | 2,188.8 | $ | 2,510.9 | $ | 2,484.5 | $ | 2,194.6 | ||||||||||
Equity method revenue | 909.3 | 1,718.6 | 1,692.2 | 1,655.6 | 2,101.7 | |||||||||||||||
Financial Performance Measures | ||||||||||||||||||||
Net income (controlling interest) | $ | 157.0 | $ | 338.8 | $ | 433.9 | $ | 509.5 | $ | 472.8 | ||||||||||
Earnings per share (diluted) | $ | 2.96 | $ | 6.17 | $ | 7.70 | $ | 9.17 | $ | 8.57 | ||||||||||
Supplemental Financial Performance Measures | ||||||||||||||||||||
Adjusted EBITDA (controlling interest)(2) | $ | 543.4 | $ | 819.9 | $ | 900.8 | $ | 942.2 | $ | 945.5 | ||||||||||
Economic net income (controlling interest)(2) | 393.6 | 549.8 | 629.2 | 687.2 | 703.6 | |||||||||||||||
Economic earnings per share(2) | $ | 7.42 | $ | 9.94 | $ | 11.18 | $ | 12.47 | $ | 12.84 | ||||||||||
Balance Sheet Data | ||||||||||||||||||||
Total assets | $ | 6,161.4 | $ | 6,300.3 | $ | 7,683.5 | $ | 7,769.4 | $ | 8,749.1 | ||||||||||
Long-term debt | 1,604.9 | 1,365.2 | 1,880.3 | 1,879.4 | 2,109.6 | |||||||||||||||
Redeemable non-controlling interests | 477.5 | 641.9 | 645.5 | 612.5 | 673.5 | |||||||||||||||
Total equity | 3,041.4 | 3,144.6 | 3,643.2 | 3,769.1 | 4,426.5 | |||||||||||||||
(1) | We have revised our prior period financial statements to correct for an immaterial error. See Note 1 to the Consolidated Financial Statements in Item 8 for previously reported amounts for the annual periods ended December 31, 2014 and 2015. Net income (controlling interest) as previously reported for the years ended December 31, 2012 and 2013 was $174.0 million and $360.5 million, respectively, and Earnings per share (diluted) was $3.28 and $6.55, respectively. Economic net income (controlling interest) as previously reported for the years ended December 31, 2012 and 2013 was $408.8 million and $570.1 million, respectively, and Economic earnings per share was $7.71 and $10.31, respectively. |
(2) | Adjusted EBITDA (controlling interest) and Economic net income (controlling interest), including Economic earnings per share, are non-GAAP performance measures and are discussed in “Supplemental Financial Performance Measures” in Item 7. |
17
Item 7. | Management’s Discussion and Analysis of Financial Condition and Results of Operations |
The following Management’s Discussion and Analysis of Financial Condition and Results of Operations of Affiliated Managers Group, Inc. and its subsidiaries (collectively, the “Company”) should be read in conjunction with the “Forward-looking Statements” section set forth in Part I and the “Risk Factors” section set forth in Item 1A of Part I of this Annual Report on Form 10-K and in any more recent filings with the U.S. Securities and Exchange Commission, each of which describes these risks, uncertainties and other important factors in more detail.
Executive Overview
The following executive overview summarizes the significant trends affecting our results of operations and financial condition. This overview and the remainder of this Management’s Discussion and Analysis of Financial Condition and Results of Operations should be read in conjunction with the Consolidated Financial Statements of the Company and the notes thereto contained elsewhere in this Annual Report on Form 10-K.
We are a global asset management company with equity investments in leading boutique investment management firms, which we refer to as our “Affiliates.” Our innovative partnership approach allows each Affiliate’s management team to own significant equity in their firm and maintain operational autonomy. Our strategy is to generate shareholder value through the internal growth of existing Affiliates, as well as through investments in new Affiliates, and additional investments in existing Affiliates. In addition, we provide centralized assistance to our Affiliates in strategic matters, marketing, distribution, product development and operations. As of December 31, 2016, our assets under management were $688.7 billion (approximately $727 billion pro forma for investments which have since closed or are accounted for on a lag basis) in over 550 investment products across a broad range of active return-oriented strategies and distribution channels.
We hold meaningful equity interests in each of our Affiliates. In certain cases, we own a majority of the equity interests while in other cases we own a minority of the equity interests. When we own a majority of the equity interests of an Affiliate, we consolidate the Affiliate’s financial results in our Revenue, Operating expenses and Other non-operating (income) and expenses. When we own a minority of the equity interests of an Affiliate, we generally use the equity method of accounting and our share of the Affiliate’s financial results is reported (net of intangible amortization) in Income from equity method investments.
While we account for a majority of our Affiliates on a consolidated basis of accounting, a growing number of our Affiliates are accounted for on an equity method basis, including all of our 2016 investments in new Affiliates. As a result, equity method Affiliates represent a growing proportion of Net income (controlling interest), as evidenced by the increase in Income from equity method investments, as compared to our consolidated Affiliates which represent a decreasing proportion of Net income (controlling interest).
Whether we account for an Affiliate on a consolidated or equity method basis of accounting, we generally maintain the same partnership approach, provide support and assistance in substantially the same manner, and our operating model is generally the same. Furthermore, our Affiliates are impacted by similar marketplace factors and operational trends, which may not be observable when analyzing the financial results of consolidated and equity method Affiliates separately. Therefore, we believe our aggregate operating measures of assets under management, average assets under management and aggregate revenue, each of which incorporates the assets under management and revenues of all of our Affiliates regardless of the accounting treatment, have become increasingly important in providing management and investors with a more comprehensive view of the operating performance and material trends across our entire business. Aggregate revenue is calculated by combining the Revenue of our consolidated Affiliates with equity method revenue. We discuss both Revenue and equity method revenue in our Results of Operations.
The following table presents our key operating measures:
18
(in billions, except as noted) | 2015 | 2016 | % Change | ||||||||
Assets under management | $ | 611.3 | $ | 688.7 | 13 | % | |||||
Average assets under management | 623.9 | 655.6 | 5 | % | |||||||
Consolidated Affiliate average assets under management | $ | 396.4 | $ | 373.4 | (6 | )% | |||||
Equity method Affiliate average assets under management | 227.5 | 282.2 | 24 | % | |||||||
Revenue (in millions) | $ | 2,484.5 | $ | 2,194.6 | (12 | )% | |||||
Equity method revenue (in millions)(1) | 1,655.6 | 2,101.7 | 27 | % | |||||||
__________________________
(1) | Equity method revenue consists of asset based and performance fees earned by our equity method Affiliates. It is not derived from and differs from the revenue of our equity method Affiliates reported in Note 14 to our Consolidated Financial Statements as it excludes asset based and performance fees of our equity method Affiliates prior to the date of closing of the respective investment and does not include investment income or loss from any sponsored investment products that may need to be consolidated by our equity method Affiliates under GAAP. |
Assets under Management
Through our Affiliates, we predominantly manage active return-oriented strategies, rather than passive indexing strategies, exchange traded funds, fixed income or money market products, which typically carry lower fee rates. The following charts provide information regarding the composition of our assets under management by active return-oriented strategy:
Assets under Management by Strategy
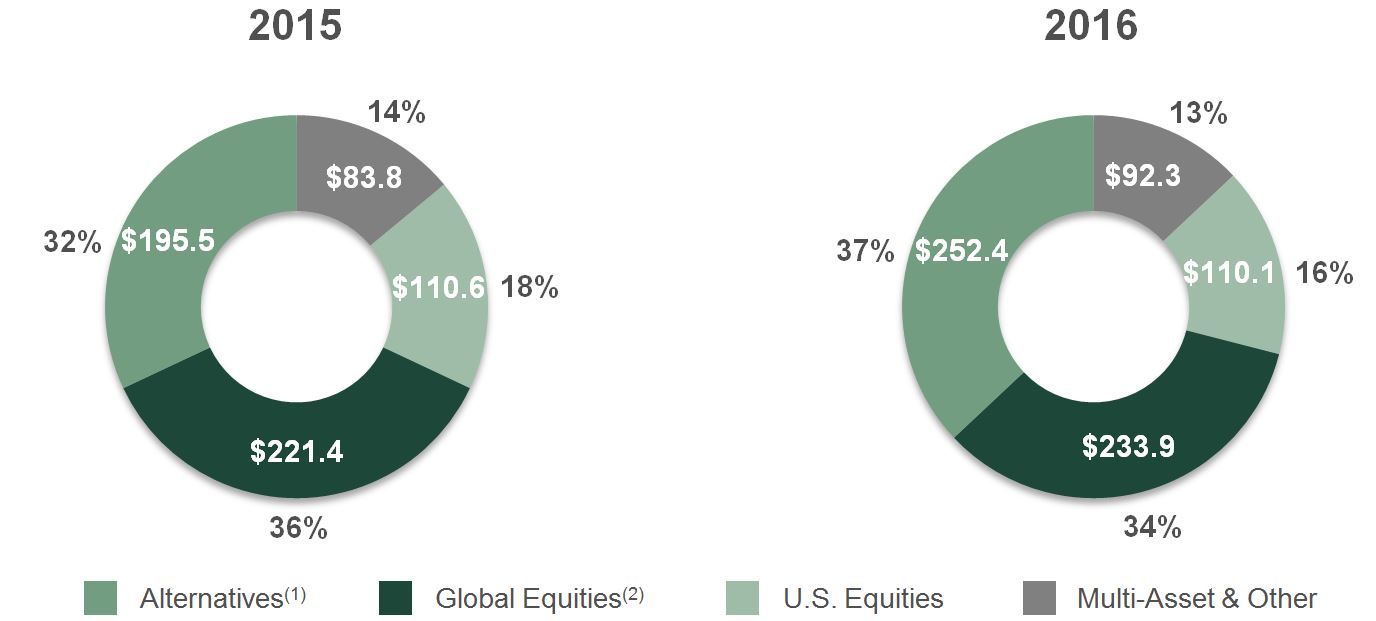
__________________________
(1) | Alternatives primarily include assets under management in long and short public equity, control equity, managed futures, multi-strategy, and other alternative and hedge fund strategies, as well as energy and infrastructure investments and primary and secondary private equity strategies. Alternative strategies generate earnings from (i) management fees from products subject to lock-ups or similar restrictions, (ii) management fees from products not subject to such restrictions and/or (iii) performance fees and carried interest. |
(2) | Global equities include emerging markets strategies, which accounted for 9% of our overall assets under management in both 2015 and 2016. |
19
The following table presents changes in our assets under management by active return-oriented strategy:
(in billions) | Alternatives | Global Equities | U.S. Equities | Multi-asset & Other | Total | ||||||||||||||
December 31, 2015 | $ | 195.5 | $ | 221.4 | $ | 110.6 | $ | 83.8 | $ | 611.3 | |||||||||
Client cash inflows and commitments | 48.3 | 33.0 | 18.8 | 18.3 | 118.4 | ||||||||||||||
Client cash outflows and realizations | (28.2 | ) | (36.5 | ) | (31.0 | ) | (15.3 | ) | (111.0 | ) | |||||||||
Net client cash flows | 20.1 | (3.5 | ) | (12.2 | ) | 3.0 | 7.4 | ||||||||||||
New investments | 35.4 | 0.0 | — | 1.9 | 37.3 | ||||||||||||||
Market changes | 2.6 | 21.9 | 12.7 | 3.9 | 41.1 | ||||||||||||||
Foreign exchange(1) | (0.7 | ) | (6.0 | ) | (0.1 | ) | (0.3 | ) | (7.1 | ) | |||||||||
Other | (0.5 | ) | 0.1 | (0.9 | ) | (0.0 | ) | (1.3 | ) | ||||||||||
December 31, 2016 | $ | 252.4 | $ | 233.9 | $ | 110.1 | $ | 92.3 | $ | 688.7 | |||||||||
__________________________
(1) | Foreign exchange reflects the impact of translating non-U.S. dollar denominated assets under management into U.S. dollars for reporting purposes. |
Also through our Affiliates, we manage active return-oriented strategies in our three principal distribution channels. The following charts provide information regarding the composition of our assets under management by distribution channel:
Assets under Management by Distribution Channel
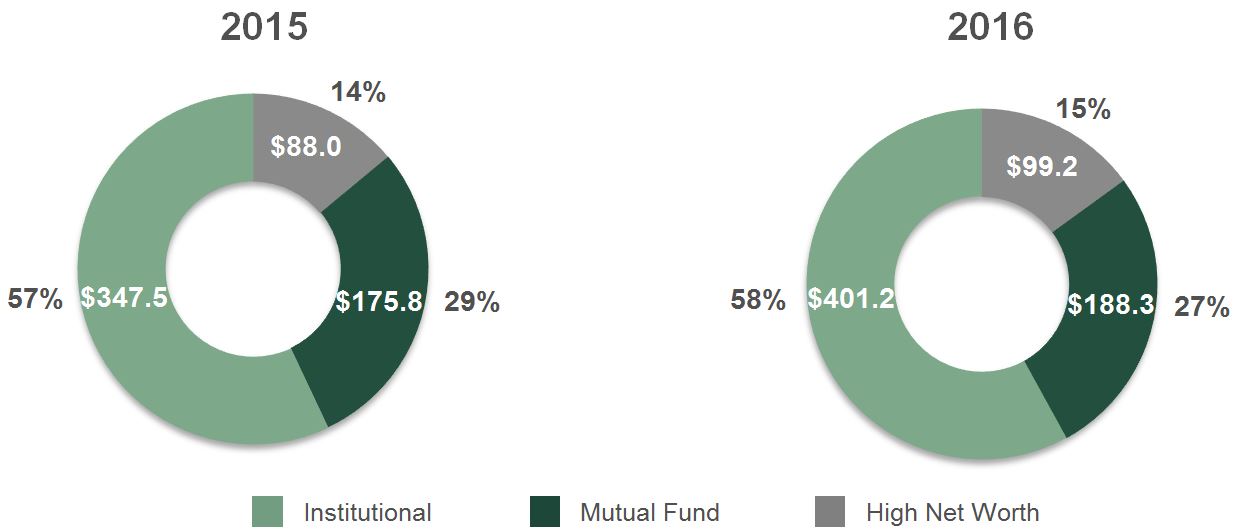
The following table presents changes in our assets under management by distribution channel:
(in billions) | Institutional | Mutual Fund | High Net Worth | Total | ||||||||||||
December 31, 2015 | $ | 347.5 | $ | 175.8 | $ | 88.0 | $ | 611.3 | ||||||||
Client cash inflows and commitments | 46.7 | 53.8 | 17.9 | 118.4 | ||||||||||||
Client cash outflows and realizations | (46.4 | ) | (51.1 | ) | (13.5 | ) | (111.0 | ) | ||||||||
Net client cash flows | 0.3 | 2.7 | 4.4 | 7.4 | ||||||||||||
New investments | 32.4 | 1.4 | 3.5 | 37.3 | ||||||||||||
Market changes | 22.6 | 15.2 | 3.3 | 41.1 | ||||||||||||
Foreign exchange(1) | (1.1 | ) | (6.2 | ) | 0.2 | (7.1 | ) | |||||||||
Other | (0.5 | ) | (0.6 | ) | (0.2 | ) | (1.3 | ) | ||||||||
December 31, 2016 | $ | 401.2 | $ | 188.3 | $ | 99.2 | $ | 688.7 | ||||||||
__________________________
(1) | Foreign exchange reflects the impact of translating non-U.S. dollar denominated assets under management into U.S. dollars for reporting purposes. |
20
Our assets under management increased $77.4 billion or 13% in 2016. This increase was due to an increase of $41.1 billion from market changes, principally in our Institutional and Mutual Fund distribution channels and primarily in global and U.S. equity strategies. The increase in assets under management was also due to a $37.3 billion increase from the addition of new equity method Affiliates, which primarily offer alternative strategies, principally in our Institutional distribution channel. We believe boutique investment management firms will continue to seek a long-term institutional partner with global scale and a long track record of success. We are well positioned to execute on opportunities to invest in leading traditional and alternative firms around the world, and believe that the transaction environment remains favorable.
The increase in assets under management in 2016 was also the result of a $7.4 billion increase from net client cash inflows, primarily in our High Net Worth and Mutual Fund distribution channels. This increase from net client cash inflows was primarily in alternative strategies, partially offset by net client cash outflows in our U.S. equity strategies and to a lesser extent global equity strategies. The increases in assets under management was partially offset by a $7.1 billion decrease from changes in foreign exchange and a $1.3 billion decrease from other changes.
Notwithstanding the recent growth in passively managed products industrywide, we continue to see meaningful client demand for active return-oriented strategies, as evidenced by our positive net client cash flows in 2016. In particular, we believe our positive net client cash flows in alternative strategies and multi-asset strategies were a reflection of continued investor demand for returns that are less correlated to traditional equity and fixed income markets. We expect client demand for alternative and multi-asset strategies to continue, and believe the best-performing active equity managers (whether global-, regional- or country-specific) will continue to have significant opportunities to grow from net client cash inflows. We believe we are well-positioned to benefit further from these trends.
The previously discussed changes in assets under management, and the timing of those changes, increased our average assets under management by $31.7 billion or 5% in 2016. Average assets under management reflects the particular billing patterns of products and client accounts and includes new Affiliates on a weighted average basis from the closing date of each investment. The increase in average assets under management in 2016 was primarily due to a 24% increase in average assets under management at equity method Affiliates, partially offset by a 6% decrease in average assets under management at consolidated Affiliates.
Aggregate Revenue
Our aggregate revenue is generally determined by the level of our average assets under management and the composition of our assets across our distribution channels and active return-oriented strategies. The 5% increase in our average assets under management in 2016 contributed to a 4% increase in our aggregate revenue. The increase in aggregate revenue was primarily due to an increase in equity method revenue of $446.1 million or 27%, principally due to an increase in average assets under management at equity method Affiliates. In 2016, we made investments in several new Affiliates which are accounted for under the equity method and continued to experience net client cash inflows into our alternative strategies and to a lesser extent multi-asset strategies at our equity method Affiliates. The increase in aggregate revenue was partially offset by a $289.9 million or 12% decrease in revenue at our consolidated Affiliates primarily due to a decrease in average assets under management at our consolidated Affiliates where we experienced outflows in our U.S. equity strategies and to a lesser extent global equity strategies. These outflows were principally in our Mutual Fund products which have higher fee rates and, therefore, not only contributed to a decrease in consolidated Affiliate average assets under management, but also resulted in a decrease in our ratio of average fees (calculated by dividing aggregate revenue by average assets under management). Our ratio of average fees also declined from a reduction in asset based fees related to renewal commissions as a result of a regulatory change affecting one of our UK-based Affiliates.
Financial Performance and Supplemental Performance Measures
The following table presents our key financial performance and supplemental performance measures:
(in millions) | 2015 | 2016 | % Change | ||||||||
Net income (controlling interest) | $ | 509.5 | $ | 472.8 | (7 | )% | |||||
Adjusted EBITDA (controlling interest)(1) | 942.2 | 945.5 | 0 | % | |||||||
Economic net income (controlling interest)(1) | 687.2 | 703.6 | 2 | % | |||||||
__________________________
(1) | Adjusted EBITDA (controlling interest) and Economic net income (controlling interest) are non-GAAP performance measures and are discussed in “Supplemental Financial Performance Measures.” |
21
We believe Adjusted EBITDA (controlling interest) is an important supplemental financial performance measure for our management and investors. Adjusted EBITDA (controlling interest) provides a comprehensive view of our share of the financial performance of our entire business before interest, taxes, depreciation and amortization and impairments, regardless of the accounting treatment of our Affiliates. Conversely, our GAAP financial performance measure, operating income, includes the non-controlling interests’ share of financial performance and does not include our share of earnings from our equity method Affiliates. Similarly, our GAAP financial performance measure, Income before income taxes, includes the non-controlling interests’ share of financial performance.
Our ownership level of consolidated Affiliates is higher than our ownership level of our equity method Affiliates and, as a result, we experience a greater proportion of an increase or decrease in revenue from our consolidated Affiliates than an increase or decrease in our equity method revenue. In 2016, while our equity method revenue increased 27%, our revenue from consolidated Affiliates decreased 12%, resulting in a $3.3 million increase in Adjusted EBITDA (controlling interests).
While our Adjusted EBITDA (controlling interest) increased in 2016, our Net income (controlling interest) decreased by $36.7 million or 7%, primarily due to an increase in other non-operating expenses of $44.2 million relating to Imputed interest expense and contingent payment arrangements. The increase in Imputed interest expense and contingent payment arrangements was primarily due to a $44.7 million non-cash gain on contingent payment obligations recorded in 2015, which did not reoccur to the same extent in 2016. The other changes in Net income (controlling interest) include an increase in Equity method intangible amortization of $24.9 million in 2016, primarily due to the full-year impact of our 2015 investments in new Affiliates and the partial-year impact of our 2016 investments in new Affiliates, offset by a decrease of $28.6 million in Income taxes primarily due to the decline in our share of Income before taxes.
We consider Economic net income (controlling interest) to be an important measure of our financial performance, as we believe it best represents our operating performance after tax and before our share of non-cash expenses relating to our acquisition of interests in our Affiliates. Our Economic net income (controlling interest) increased $16.4 million or 2% in 2016, which is greater than the increase in Adjusted EBITDA (controlling interest), primarily due to the incremental tax benefits related to our investments in new Affiliates in 2015 and 2016 and our reinvestment of foreign earnings in 2016.
Results of Operations
The following discussion includes the financial results of our consolidated and equity method Affiliates. As previously discussed, our consolidated Affiliates’ financial results are included in our Revenue, Operating expenses and Other non-operating (income) and expenses and our share of our equity method Affiliates’ financial results is reported (net of intangible amortization) in Income from equity method investments.
As discussed in “Executive Overview,” we supplementally prepare and disclose aggregate revenue, which incorporates the revenue of all of our Affiliates, regardless of the accounting treatment, as well as equity method revenue, which provides additional information on the factors impacting the operating results of our equity method Affiliates. These measures provide management with a more comprehensive view of the operating performance and material trends in our business, and have become increasingly important to management as the number and proportion of our equity method Affiliates have increased relative to our consolidated Affiliates.
Average assets under management reflects the particular billing patterns of products and client accounts. Therefore, we believe average assets under management more closely correlates to the billing cycle of each distribution channel and, as such, provides a more meaningful relationship to Revenue and to equity method revenue. In the Mutual Fund distribution channel, average assets under management generally represents an average of the daily net assets under management. For the Institutional and High Net Worth distribution channels, an account that bills in advance is included in the calculation of average assets under management on the basis of beginning of period assets under management, while an account that bills in arrears is reflected on the basis of end of period assets under management. Assets under management attributable to investments in new Affiliates are generally included on a weighted average basis for the period from the closing date of the respective new investment.
Additional investments in existing or new Affiliates will generally impact our financial results in the year of investment and, depending upon the timing, in the following year when the full-year financial results of the Affiliate investment are reflected in our financial statements.
Revenue
We derive most of our Revenue from asset based and performance fees from investment management services. Asset based fees are typically determined as a percentage fee charged on the value of a client’s assets under management. Performance fees are billed based upon investment performance, typically on an absolute basis or relative to a benchmark.
22
Performance fees are typically billed less frequently than asset based fees and, although performance fees inherently depend on investment performance and will vary from period to period, we anticipate performance fees will be a recurring component of our revenue.
Our Revenue is generally determined by the level of our consolidated Affiliate average assets under management and the composition of our assets across our distribution channels and active return-oriented strategies within our distribution channels, which realize different fee rates. Our ratio of asset based fees to consolidated Affiliate average assets under management (“ratio of average fees”) is calculated as asset based fees divided by consolidated Affiliate average assets under management and may change as a result of new investments, client cash flows, market changes, foreign exchange rate changes or changes in contractual fees. Therefore, changes in this ratio should not necessarily be viewed as an indicator of changes in contractual fee rates billed by our Affiliates to their clients.
The following tables summarize our consolidated Affiliate average assets under management and Revenue in total and by distribution channel. These amounts do not include average assets under management or revenue at equity method Affiliates, which are summarized separately in “Income from equity method investments.”
For the Years Ended December 31, | |||||||||||||||||
(in millions, except as noted) | 2014 | 2015 | % Change | 2016 | % Change | ||||||||||||
Consolidated Affiliate average assets under management (in billions) | $ | 387.8 | $ | 396.4 | 2 | % | $ | 373.4 | (6 | )% | |||||||
Revenue | $ | 2,510.9 | $ | 2,484.5 | (1 | )% | $ | 2,194.6 | (12 | )% | |||||||
Our Revenue decreased $289.9 million or 12% in 2016. This decrease was primarily due to a decrease in consolidated Affiliate average assets under management at existing Affiliates, which reduced asset based fees $184.9 million or 7%. This decrease was also the result of a decline in our ratio of average fees at existing Affiliates, which reduced asset based fees $126.0 million or 5%, including a reduction in asset based fees related to renewal commissions at one of our Affiliates in the UK. The reduction in asset based fees related to renewal commissions was the result of a regulatory change and was offset by a decline in distribution expenses at the Affiliate that reduced our Selling, general and administrative expenses. These decreases were partially offset by an increase in Revenue from the full-year impact of our 2015 investments in new Affiliates of $16.8 million or 1%, as well as an increase in performance and other fees at existing Affiliates of $4.2 million. The decline in our ratio of average fees was due to changes in the composition of our assets under management as well as the aforementioned decline in renewal commissions. The changes in the composition of our assets under management were primarily from decreases in assets under management in the Mutual Fund and Institutional distribution channels, which realize comparatively higher fee rates and by increases in assets under management in the High Net Worth distribution channel, which realizes comparatively lower fee rates.
Our Revenue decreased $26.4 million or 1% in 2015. This decrease was primarily due to a decrease in consolidated Affiliate average assets under management at existing Affiliates, which reduced asset based fees $108.5 million or 5%. This decrease was also the result of a decline in our ratio of average fees at existing Affiliates, which reduced asset based fees $38.0 million or 1%, as well as the result of a decline in performance and other fees at existing Affiliates of $11.6 million. These decreases were partially offset by increases in revenue from the full-year impact of our 2014 and partial-year impact of our 2015 investments in new Affiliates of $131.7 million or 5%. The decline in our ratio of average fees was due to changes in the composition of our assets under management across our distribution channels, primarily from decreases in assets under management in the Mutual Fund and Institutional distribution channels, which realize comparatively higher fee rates and by increases in assets under management in the High Net Worth distribution channel, which realizes comparatively lower fee rates.
The following sections discuss the changes in our revenue by distribution channel.
Institutional Distribution Channel
For the Years Ended December 31, | |||||||||||||||||
(in millions, except as noted) | 2014 | 2015 | % Change | 2016 | % Change | ||||||||||||
Consolidated Affiliate average assets under management (in billions) | $ | 188.6 | $ | 186.4 | (1 | )% | $ | 173.7 | (7 | )% | |||||||
Revenue | $ | 1,022.8 | $ | 979.4 | (4 | )% | $ | 878.5 | (10 | )% | |||||||
Our revenue in the Institutional distribution channel decreased $100.9 million or 10% in 2016. This decrease was due primarily to a decrease in consolidated Affiliate average assets under management at existing Affiliates, which reduced asset
23
based fees $71.3 million or 7%. This decrease was also the result of a decline in our ratio of average fees at existing Affiliates, which reduced asset based fees $33.5 million or 3%. These decreases were partially offset by increases in revenue from the full-year impact of our 2015 investments in new Affiliates of $2.8 million, as well as an increase in performance and other fees at existing Affiliates of $1.1 million. The decline in our ratio of average fees was due to a change in the composition of our assets under management within the distribution channel, primarily from decreases in assets under management in products that realize comparatively higher fee rates and by an increase in assets under management in products that realize comparatively lower fee rates.
Our revenue in the Institutional distribution channel decreased $43.4 million or 4% in 2015. This decrease was due primarily to a decrease in consolidated Affiliate average assets under management, which reduced asset based fees $53.2 million or 5%. This decrease was also the result of a decline in performance fees at existing Affiliates of $15.8 million or 2%, and decline in our ratio of average fees at existing Affiliates of $13.6 million or 1%. These decreases were partially offset by increases in revenue from the full-year impact of our 2014 and partial-year impact of our 2015 investments in new Affiliates of $39.2 million or 4%. The decline in our ratio of average fees was due to a change in the composition of our assets under management within the distribution channel, primarily from decreases in assets under management in products that realize comparatively higher fee rates and by an increase in assets under management in products that realize comparatively lower fee rates.
Mutual Fund Distribution Channel
For the Years Ended December 31, | |||||||||||||||||
(in millions, except as noted) | 2014 | 2015 | % Change | 2016 | % Change | ||||||||||||
Consolidated Affiliate average assets under management (in billions) | $ | 141.7 | $ | 143.2 | 1 | % | $ | 123.0 | (14 | )% | |||||||
Revenue | $ | 1,242.6 | $ | 1,238.2 | (0 | )% | $ | 1,036.0 | (16 | )% | |||||||
Our revenue in the Mutual Fund distribution channel decreased $202.2 million or 16% in 2016. This decrease was due primarily to a decrease in consolidated Affiliate average assets under management, which reduced asset based fees $164.3 million or 13%. This decrease was also the result of a decline in our ratio of average fees, which reduced asset based fees $40.3 million or 3%, including a reduction in asset based fees related to renewal commissions at one of our Affiliates in the UK. The reduction in asset based fees related to renewal commissions was the result of a regulatory change and was offset by a decline in distribution expenses at the Affiliate that reduced our Selling, general and administrative expenses. These decreases were partially offset by an increase in performance and other fees of $2.4 million. The decline in our ratio of average fees was due to a change in the composition of our assets under management as well as the aforementioned decline in renewal commissions. The change in the composition of our assets under management within the distribution channel was primarily from decreases in assets under management in products that realize comparatively higher fee rates and by increases in assets under management in products that realize comparatively lower fee rates.
Our revenue in the Mutual Fund distribution channel decreased $4.4 million in 2015. This decrease was due primarily to a decrease in consolidated Affiliate average assets under management at existing Affiliates, which reduced assets based fees $83.6 million or 7%. This decrease was partially offset by an increase in revenue from the full-year results of our 2014 investments in new Affiliates of $74.1 million or 6%, as well as an increase in performance and other fees at existing Affiliates of $5.6 million.
High Net Worth Distribution Channel
For the Years Ended December 31, | |||||||||||||||||
(in millions, except as noted) | 2014 | 2015 | % Change | 2016 | % Change | ||||||||||||
Consolidated Affiliate average assets under management (in billions) | $ | 57.5 | $ | 66.8 | 16 | % | $ | 76.7 | 15 | % | |||||||
Revenue | $ | 245.5 | $ | 266.9 | 9 | % | $ | 280.1 | 5 | % | |||||||
Our revenue in the High Net Worth distribution channel increased $13.2 million or 5% in 2016. The increase was primarily the result of an increase in consolidated Affiliate average assets under management at existing Affiliates, which increased asset based fees $14.3 million or 5%. The increase in revenue was also the result of an $14.0 million or 5% increase in asset based fees from the full-year impact of our 2015 investments in new Affiliates. These increases were partially offset by a decrease in our ratio of average fees at existing Affiliates, which decreased asset based fees $15.8 million or 5%. The decline in our ratio of average fees was due to a change in the composition of our assets under management within the distribution
24
channel, primarily from decreases in assets under management in products that realize comparatively higher fee rates and by increases in assets under management in products that realize comparatively lower fee rates.
Our revenue in the High Net Worth distribution channel increased $21.4 million or 9% in 2015. The increase was primarily the result of an increase in revenue from the full-year impact of our 2014 and the partial-year impact of our 2015 investments in new Affiliates of $18.4 million or 7%. The increase was also the result of an increase in consolidated Affiliate average assets under management at existing Affiliates, which increased asset based fees $10.9 million or 4%. These increases were partially offset by a decrease in our ratio of average fees at existing Affiliates which decreased asset based fees $6.6 million or 2% and a decline in performance and other fees at existing Affiliates of $1.3 million. The decline in our ratio of average fees was due to a change in the composition of our assets under management within the distribution channel, primarily from decreases in assets under management in products that realize comparatively higher fee rates and by increases in assets under management in products that realize comparatively lower fee rates.
Operating Expenses
The following table summarizes our consolidated operating expenses:
For the Years Ended December 31, | ||||||||||||||||||
(in millions) | 2014 | 2015 | % Change | 2016 | % Change | |||||||||||||
Compensation and related expenses | $ | 1,030.5 | $ | 1,027.7 | (0 | )% | $ | 932.4 | (9 | )% | ||||||||
Selling, general and administrative | 485.5 | 443.8 | (9 | )% | 398.1 | (10 | )% | |||||||||||
Intangible amortization and impairments | 122.2 | 115.4 | (6 | )% | 110.2 | (5 | )% | |||||||||||
Depreciation and other amortization | 16.9 | 18.8 | 11 | % | 19.5 | 4 | % | |||||||||||
Other operating expenses, net | 40.6 | 43.8 | 8 | % | 29.1 | (34 | )% | |||||||||||
Total operating expenses | $ | 1,695.7 | $ | 1,649.5 | (3 | )% | $ | 1,489.3 | (10 | )% | ||||||||
Our operating expenses were incurred primarily by our consolidated Affiliates, the substantial majority of which were incurred by Affiliates through which we share in revenue without regard to expenses. For these Affiliates, the Affiliate’s Operating Allocation percentage generally determines its operating expenses. Accordingly, our operating expenses are impacted by increases or decreases in each Affiliate’s revenue and corresponding increases or decreases in its respective Operating Allocation.
Compensation and related expenses decreased $95.3 million or 9% in 2016, primarily due to decreases in compensation expenses at existing Affiliates of $78.3 million or 8% and compensation expenses associated with Affiliate equity transactions of $28.7 million or 3%. These decreases were partially offset by an increase in compensation expenses from the full-year impact of our 2015 investments in new Affiliates of $7.0 million or 1%. These changes primarily relate to the non-controlling interests.
Compensation and related expenses decreased $2.8 million or (0)% in 2015, primarily due to decreases in compensation expenses at existing Affiliates of $46.8 million or 5% and compensation expenses associated with Affiliate equity transactions of $15.9 million or 2%. These decreases were partially offset by an increase in compensation expenses from the full-year impact of our 2014 and the partial-year impact of our 2015 investments in new Affiliates of $56.9 million or 6%. These changes primarily relate to the non-controlling interests.
Selling, general and administrative expenses decreased $45.7 million or 10% in 2016, primarily due to decreases in sub-advisory and distribution expenses, including renewal commissions, of $57.7 million or 13% at our Affiliates in the Mutual Fund distribution channel. This decrease was partially offset by a reserve of $15.0 million or 3% recorded by and attributable to Third Avenue Management LLC in connection with a proposed resolution of claims relating to the Focused Credit Fund.
Selling, general and administrative expenses decreased $41.7 million or 9% in 2015, primarily due to decreases in sub-advisory and distribution expenses of $50.0 million or 10% at our Affiliates in the Mutual Fund distribution channel and a decrease in acquisition-related professional fees of $5.8 million or 1%. These decreases were partially offset by an increase of $18.2 million or 4% from the full-year impact of our 2014 and the partial-year impact of our 2015 investments in new Affiliates.
Intangible amortization and impairments decreased $5.2 million or 5% in 2016, and $6.8 million or 6% in 2015. In 2016, the decrease was primarily due to certain assets being fully amortized in 2015, which decreased intangible amortization $13.2 million or 11% in 2016, partially offset by increases in intangible amortization of definite-lived assets at existing Affiliates of
25
$5.5 million or 5%. In 2015, the decrease was primarily due to certain assets being fully amortized in 2014, which reduced intangible amortization $7.1 million in 2015.
There were no significant changes in Depreciation and other amortization in 2016 or 2015.
Other operating expenses (net) decreased $14.7 million or 34% in 2016 and increased $3.2 million or 8% in 2015. In 2016, this decrease was primarily due to net gains on Affiliates’ consolidated investment products of $12.5 million. In 2015, this increase was primarily due to a $2.0 million increase in expenses from the full-year impact of our 2014 and the partial-year impact of our 2015 investments in new Affiliates.
Income from Equity Method Investments
When we own a minority of the equity interests in an Affiliate, we either share in the Affiliate’s revenue without regard to expenses or share in an Affiliate’s revenue less certain agreed-upon expenses. When we share in the Affiliate’s revenue without regard to expenses, we are allocated a set percentage of revenue, with the remaining revenue available to the Affiliate to fund its operating expenses and distributions to Affiliate management. When we share in the Affiliate’s revenue less certain agreed-upon expenses, our distributions are calculated by reference to the Affiliate’s revenue less certain agreed-upon expenses.
For our minority investments in our Affiliates, we generally use the equity method of accounting. Under the equity method of accounting, we only recognize our share of the Affiliate’s revenue without regard to expenses or less certain agreed-upon expenses, net of equity method intangible amortization in Income from equity method investments in our Consolidated Statements of Income.
Our equity method Affiliates derive most of their revenue from asset based and performance fees from investment management services. Our equity method Affiliates operate primarily in the Institutional distribution channel. Asset based fees are typically determined as a percentage fee charged on the value of a client’s assets under management. Performance fees are billed based upon investment performance, typically on an absolute basis or relative to a benchmark, primarily on our liquid and illiquid alternative and equity products.
Performance fees are typically billed less frequently than asset based fees and, although performance fees inherently depend on investment performance and will vary from period to period, we anticipate performance fees will be a recurring component of our Income from equity method investments.
The following table summarizes equity method earnings and equity method intangible amortization, which together comprise Income from equity method investments, as well as equity method Affiliate average assets under management and equity method revenue:
For the Years Ended December 31, | ||||||||||||||||||
(in millions, except as noted) | 2014 | 2015 | % Change | 2016 | % Change | |||||||||||||
Equity method earnings | $ | 314.0 | $ | 323.2 | 3 | % | $ | 388.0 | 20 | % | ||||||||
Equity method intangible amortization | (32.3 | ) | (34.3 | ) | 6 | % | (59.2 | ) | 73 | % | ||||||||
Income from equity method investments | $ | 281.7 | $ | 288.9 | 3 | % | $ | 328.8 | 14 | % | ||||||||
Operating Measures | ||||||||||||||||||
Equity method Affiliate average assets under management (in billions) | $ | 198.1 | $ | 227.5 | 15 | % | $ | 282.2 | 24 | % | ||||||||
Equity method revenue | $ | 1,692.2 | $ | 1,655.6 | (2 | )% | $ | 2,101.7 | 27 | % | ||||||||
Our equity method revenue increased $446.1 million or 27% in 2016. This increase was primarily due to an increase in revenue from the full-year impact of our 2015 and the partial-year impact of our 2016 investments in new Affiliates of $352.5 million or 21%. The increase was also the result of an increase in equity method Affiliate average assets under management at existing Affiliates, which increased asset based fees $133.3 million or 8%. These increases were partially offset by a decline in our ratio of average fees at existing Affiliates, which reduced asset based fees $21.7 million or 1%, as well as a decrease in performance and other fees at existing Affiliates of $18.0 million or 1%. The decline in our ratio of average fees was due to a change in the composition of our assets under management, primarily from decreases in assets under management in products that realize comparatively higher fee rates and by increases in assets under management in products that realize comparatively lower fee rates.
While equity method revenue increased 27% in 2016, equity method earnings increased $64.8 million or 20% in 2016, primarily due to the full-year impact of our 2015 and the partial-year impact of our 2016 investments in new Affiliates, in
26
which we own less of the equity interests, and an increase in expenses at Affiliates where our structured partnership interest is calculated by reference to the Affiliate’s revenue less certain agreed-upon expenses.
Equity method intangible amortization increased $24.9 million or 73% in 2016, primarily as a result of a $21.5 million increase from the full-year impact of our 2015 and the partial-year impact of our 2016 investments in new Affiliates.
Our equity method revenue decreased $36.6 million or 2% in 2015. This decrease was primarily due to a decline in performance fees at existing Affiliates of $206.0 million or 12%, as well as a decline in our ratio of average fees at existing Affiliates, which reduced asset based fees $20.4 million or 1%. The decline in our ratio of average fees was due to a change in the composition of our assets under management, primarily from decreases in assets under management in products that realize comparatively higher fee rates and by increases in assets under management in products that realize comparatively lower fee rates. These decreases were partially offset by an increase in equity method Affiliate average assets under management at existing Affiliates, which increased asset based fees $133.8 million or 8%, and the result of an increase in equity method revenue from the full-year impact of our 2014 and the partial-year impact of our 2015 investments in new Affiliates of $44.7 million or 3%.
Equity method earnings increased $9.2 million or 3% primarily due to the full-year impact in 2015 of our additional investment in an existing Affiliate in 2014, partially offset by the previously discussed decline in performance fees in 2015.
Equity method intangible amortization increased $2.0 million or 6% in 2015, primarily as a result a $4.3 million increase from the full-year impact of our 2014 and the partial-year impact of our 2015 investments in new Affiliates, partially offset by a $2.3 million decrease related to certain assets being fully amortized in 2014 and 2015.
Other Non-Operating (Income) and Expenses
The following table summarizes non-operating income and expense data:
For the Years Ended December 31, | ||||||||||||||||||
(in millions) | 2014 | 2015 | % Change | 2016 | % Change | |||||||||||||
Investment and other income | $ | (23.3 | ) | $ | (15.3 | ) | (34 | )% | $ | (33.8 | ) | 121 | % | |||||
Interest expense | 76.6 | 88.9 | 16 | % | 89.4 | 1 | % | |||||||||||
Imputed interest expense and contingent payment arrangements | 30.1 | (40.3 | ) | N.M.(1) | 3.9 | N.M.(1) | ||||||||||||
Income taxes | 246.1 | 263.4 | 7 | % | 235.6 | (11 | )% | |||||||||||
__________________________
(1) | Percentage change is not meaningful. |
Investment and other income increased $18.5 million or 121% in 2016, principally due to a $10.7 million increase in realized gains on the sales of available-for-sale securities and a $7.0 million increase in the fair value of Affiliates’ investments.
Investment and other income decreased $8.0 million or 34% in 2015, principally due to a $20.3 million decrease in the fair value of Affiliates’ investments, partially offset by a $9.0 million increase in realized gains on the sales of available-for-sale securities.
There was no significant change in our Interest expense in 2016. Interest expense increased $12.3 million or 16% in 2015, primarily as a result of the issuance of our senior notes in February 2014 and 2015, which collectively increased interest expense by $13.2 million in 2015.
Imputed interest expense and contingent payment arrangements increased $44.2 million in 2016, primarily due to a $44.7 million gain on the revaluation of our contingent payment arrangements in 2015 as compared to a $2.8 million gain recorded in 2016.
Imputed interest expense and contingent payment arrangements decreased $70.4 million in 2015, primarily due to a $44.7 million gain on the revaluation of our contingent payment arrangements in 2015 and an $18.8 million loss recognized on the settlement of certain of our junior convertible securities in 2014, which did not reoccur in 2015.
Income taxes decreased $27.8 million or 11% in 2016, primarily due to a decrease in Income before income taxes attributable to the controlling interest as well as the effect of foreign operations, including an increase in the indefinite reinvestment of certain foreign earnings.
Income taxes increased $17.3 million or 7% in 2015, primarily due to an increase in Income before income taxes
27
attributable to the controlling interest. In addition, in 2014 we restructured certain of our foreign subsidiaries and recorded a deferred tax benefit for the reversal of previously recorded deferred tax liabilities, which did not reoccur in 2016. The increase in Income taxes was partially offset by the indefinite reinvestment of a portion of our foreign earnings, the recording of a deferred tax benefit for a reduction in UK tax rates and a decline in Affiliate equity compensation, a non-deductible expense.
Net Income
The previously discussed changes in revenue and expenses had the following effect on Net income:
For the Years Ended December 31, | ||||||||||||||||||
(in millions) | 2014 | 2015 | % Change | 2016 | % Change | |||||||||||||
Net income | $ | 767.4 | $ | 827.2 | 8 | % | $ | 739.0 | (11 | )% | ||||||||
Net income (non-controlling interests) | 333.5 | 317.7 | (5 | )% | 266.2 | (16 | )% | |||||||||||
Net income (controlling interest) | 433.9 | 509.5 | 17 | % | 472.8 | (7 | )% | |||||||||||
Supplemental Financial Performance Measures
Adjusted EBITDA (controlling interest)
As supplemental information, we provide a non-GAAP measure that we refer to as Adjusted EBITDA (controlling interest). Adjusted EBITDA (controlling interest) represents our earnings before our share of interest expense, income taxes, depreciation, amortization, impairments and adjustments to our contingent payment obligations. We believe that many investors use this information when assessing the financial performance of companies in the investment management industry. This non-GAAP performance measure is provided in addition to, but not as a substitute for, Net income (controlling interest) or any other GAAP measures of financial performance. The title of this performance measure has been renamed from EBITDA (controlling interest) to Adjusted EBITDA (controlling interest). There has been no change in the calculation of this performance measure.
The following table provides a reconciliation of Net income (controlling interest) to Adjusted EBITDA (controlling interest):
(in millions) | 2014 | 2015 | 2016 | |||||||||
Net income (controlling interest) | $ | 433.9 | $ | 509.5 | $ | 472.8 | ||||||
Interest expense | 76.6 | 88.9 | 89.4 | |||||||||
Imputed interest expense and contingent payment arrangements(1) | 30.1 | (40.3 | ) | 3.9 | ||||||||
Income taxes | 231.6 | 257.8 | 229.2 | |||||||||
Depreciation and other amortization | 7.6 | 7.9 | 7.7 | |||||||||
Intangible amortization and impairments(2) | 121.0 | 118.4 | 142.5 | |||||||||
Adjusted EBITDA (controlling interest) | $ | 900.8 | $ | 942.2 | $ | 945.5 | ||||||
__________________________
(1) | During 2014, we redeemed certain of our junior convertible securities and recorded a loss of $18.8 million. During 2015 and 2016, we adjusted our estimate of our contingent payment obligations and recorded a gain of $44.7 million and $2.8 million, respectively. These amounts are included in Imputed interest expense and contingent payment arrangements in the Consolidated Statements of Income. |
(2) | Our reported intangible amortization includes amortization attributable to our non-controlling interests. For our equity method Affiliates, we do not separately report intangible amortization in our Consolidated Statements of Income. Our share of these Affiliates’ amortization is reported in Income from equity method investments. |
The following table summarizes the Intangible amortization and impairments shown above:
28
(in millions) | 2014 | 2015 | 2016 | |||||||||
Reported Intangible amortization and impairments | $ | 122.2 | $ | 115.4 | $ | 110.2 | ||||||
Intangible amortization—non-controlling interests | (33.5 | ) | (31.3 | ) | (26.9 | ) | ||||||
Equity method intangible amortization | 32.3 | 34.3 | 59.2 | |||||||||
Total | $ | 121.0 | $ | 118.4 | $ | 142.5 | ||||||
Economic Net Income (controlling interest) and Economic Earnings Per Share
As supplemental information, we also provide non-GAAP performance measures that we refer to as Economic net income (controlling interest) and Economic earnings per share. We consider Economic net income (controlling interest) and Economic earnings per share to be important measures of our financial performance, as we believe they best represent our operating performance before our share of non-cash expenses relating to our acquisition of interests in our Affiliates. Economic net income (controlling interest) and Economic earnings per share are used by our management and Board of Directors as our principal performance benchmarks, including as one of the measures for aligning executive compensation with stockholder value. These measures are provided in addition to, but not as substitutes for, other GAAP measures of financial performance, such as Net income (controlling interest) and Earnings per share (diluted).
Under our Economic net income (controlling interest) definition, we add to Net income (controlling interest) our share of pre-tax intangible amortization and impairments (including the portion attributable to equity method Affiliates), deferred taxes related to intangible assets, and other economic items, which include non-cash imputed interest (principally related to the accounting for convertible securities and contingent payment arrangements) and certain Affiliate equity expenses. We add back intangible amortization and impairments attributable to acquired client relationships because these expenses do not correspond to the changes in value of these assets, which do not diminish predictably over time. The portion of deferred taxes generally attributable to intangible assets (including goodwill) is added back because we believe it is unlikely these accruals will be used to settle material tax obligations. We add back non-cash imputed interest and reductions or increases in contingent payment arrangements to better reflect our contractual interest obligations. We add back non-cash expenses relating to certain transfers of equity between Affiliate partners when these transfers have no dilutive effect to shareholders.
Economic earnings per share represents Economic net income (controlling interest) divided by the Average shares outstanding (adjusted diluted). In this calculation, the potential share issuance in connection with our convertible securities is measured using a “treasury stock” method. Under this method, only the net number of shares of common stock equal to the value of these convertible securities in excess of par, if any, is deemed to be outstanding. We believe the inclusion of net shares under a treasury stock method best reflects the benefit of the increase in available capital resources (which could be used to repurchase shares of common stock) that occurs when these securities are converted and we are relieved of our debt obligation. This method does not take into account any increase or decrease in our cost of capital in an assumed conversion.
The following table provides a reconciliation of Net income (controlling interest) to Economic net income (controlling interest):
(in millions, except per share data) | 2014(1) | 2015(1) | 2016 | |||||||||
Net income (controlling interest) | $ | 433.9 | $ | 509.5 | $ | 472.8 | ||||||
Intangible amortization and impairments(2) | 121.0 | 118.4 | 142.5 | |||||||||
Intangible-related deferred taxes | 47.8 | 77.7 | 84.3 | |||||||||
Other economic items(3)(4) | 26.5 | (18.4 | ) | 4.0 | ||||||||
Economic net income (controlling interest) | $ | 629.2 | $ | 687.2 | $ | 703.6 | ||||||
Average shares outstanding (diluted) | 58.4 | 57.2 | 57.0 | |||||||||
Assumed issuance of junior convertible securities shares | (2.2 | ) | (2.2 | ) | (2.2 | ) | ||||||
Dilutive impact of junior convertible securities shares | 0.1 | 0.1 | — | |||||||||
Average shares outstanding (adjusted diluted) | 56.3 | 55.1 | 54.8 | |||||||||
Economic earnings per share | $ | 11.18 | $ | 12.47 | $ | 12.84 | ||||||
__________________________
(1) | We revised our prior period financial statements to correct for an immaterial error. See Note 1 to the Consolidated Financial Statements. Economic net income (controlling interest) as previously reported for 2014 and 2015 was $644.4 million and $691.2 million, respectively, and Economic earnings per share for 2014 and 2015 was $11.45 and $12.55, respectively. |
29
(2) | See note (2) to the table in “Adjusted EBITDA (controlling interest).” |
(3) | During 2014, 2015 and 2016, Other economic items were net of income taxes of $11.4 million, $15.2 million and $1.5 million, respectively. |
(4) | During 2014, we redeemed certain of our junior convertible securities and recorded a loss of $18.8 million ($11.6 million net of tax). During 2015 and 2016, we adjusted our estimate of our contingent payment obligations and recorded a gain of $44.7 million ($27.8 million net of tax) and $2.8 million ($1.7 million net of tax), respectively. These amounts are included in Imputed interest expense and contingent payment arrangements in the Consolidated Statements of Income. |
Liquidity and Capital Resources
In 2016, we met our cash requirements primarily through cash generated by operating activities, the settlement of our forward equity agreement and net borrowings under our credit facilities. Our principal uses of cash were for investments in new Affiliates, distributions to Affiliate equity holders and general working capital purposes.
We expect that our principal uses of cash for the foreseeable future will be for investments in new and existing Affiliates, distributions to Affiliate equity holders, payment of principal and interest on outstanding debt, share repurchases, the payment of cash dividends on our common stock and general working capital purposes. We anticipate that cash flows from operations, together with borrowings under our revolver and proceeds from our equity distribution program, will be sufficient to support our cash flow needs for the foreseeable future.
Cash and cash equivalents were $430.8 million and $563.8 million at December 31, 2016 and 2015, respectively, including $18.9 million and $98.6 million, respectively, in our wholly-owned foreign subsidiaries. If we repatriated the cash from our wholly-owned foreign subsidiaries, we do not anticipate that we would need to accrue or pay any significant additional U.S. taxes.
The following summarizes our operating, investing and financing cash flow activities:
For the Years Ended December 31, | ||||||||||||
(in millions) | 2014 | 2015 | 2016 | |||||||||
Operating cash flow | $ | 1,436.9 | $ | 1,208.4 | $ | 1,027.6 | ||||||
Investing cash flow | (1,268.1 | ) | (324.5 | ) | (1,332.2 | ) | ||||||
Financing cash flow | (77.6 | ) | (857.7 | ) | 200.9 | |||||||
Operating Cash Flow
In 2016, Cash flow from operating activities decreased $180.8 million, of which approximately 50% was attributable to the non-controlling interests. Cash flow from operating activities attributable to the controlling interest decreased primarily due to a timing difference between the receipt of cash distributions of our equity method earnings and the recording of such earnings in our Consolidated Statements of Income. In 2016, the net effect of these timing differences decreased cash flows to the controlling interest $64.5 million.
Cash flows from operations decreased $228.5 million in 2015, primarily from a $228.0 million decrease in Payables and accrued liabilities, and Other liabilities, which primarily resulted from an increase in payments of accrued compensation and distributions.
Investing Cash Flow
Net cash flows used in investing activities increased $1.0 billion in 2016 to $1.3 billion, primarily due to a $1.1 billion increase in cash used to make investments in Affiliates, which was attributable to the controlling interest.
Net cash flows used in investing activities decreased $943.6 million in 2015, primarily due to a $947.3 million decrease in cash used to make investments in Affiliates, which was attributable to the controlling interest.
Financing Cash Flow
Cash flows from financing activities increased $1.1 billion in 2016. This was primarily a result of a $408.0 million increase in the issuance of common stock, a $380.3 million decrease in repurchases of common stock, and a $227.7 million increase in net borrowings of senior debt, all of which were attributable to the controlling interest. We used available cash, proceeds from issuance of common stock and borrowings under our credit facilities to finance our investments in new Affiliates in 2016.
30
Cash flows used in financing activities increased $780.1 million in 2015. This was primarily a result of a $493.2 million decrease in borrowings of senior debt, a $235.4 million decrease in repayments of senior debt and convertible securities as well as a $222.9 million increase in repurchases of common stock, all of which were attributable to the controlling interest. These increases were partially offset by a $138.0 million decrease in distributions to non-controlling interests. We used available cash and borrowings under our credit facilities to finance our investments in new Affiliates in 2015.
The following table summarizes the carrying value of our outstanding indebtedness:
December 31, | ||||||||||||
(in millions) | 2014 | 2015 | 2016 | |||||||||
Senior bank debt | $ | 855.0 | $ | 645.0 | $ | 870.0 | ||||||
Senior notes | 736.8 | 944.6 | 945.1 | |||||||||
Convertible securities | 303.1 | 305.2 | 307.5 | |||||||||
Senior Bank Debt
We have a senior unsecured multicurrency revolving credit facility (the “revolver”) and a senior unsecured term loan facility (the “term loan” and, together with the revolver, the “credit facilities”). In 2016, we amended the revolver to increase commitments from $1.3 billion to $1.45 billion, and amended the term loan to increase borrowings from $350.0 million to $385.0 million. The credit facilities mature on September 30, 2020.
Subject to certain conditions, we may further increase the commitments under the revolver by up to $350.0 million and borrow up to an additional $65.0 million under the term loan. We pay interest on any outstanding obligations under the revolver and on the term loan at specified rates, based either on the LIBOR rate or the prime rate as in effect from time to time.
Under the terms of our credit facilities we are required to meet two financial ratio covenants. The first of these covenants is a maximum ratio of debt to EBITDA (the “bank leverage ratio”) of 3.25x. The second covenant is a minimum EBITDA to cash interest expense ratio of 3.00x (the “bank interest coverage ratio”). For purposes of calculating these ratios, share-based compensation and Affiliate equity expense are added back to EBITDA. The credit facilities are also subject to customary affirmative and negative covenants, including limitations on priority indebtedness, asset dispositions and fundamental corporate changes, and certain customary events of default. Many of these conditions and restrictions are subject to certain minimum thresholds and exceptions. As of December 31, 2016, our bank leverage and bank interest coverage ratios were 1.7x and 11.8x, respectively, and we were in compliance with all terms of our credit facilities. As of December 31, 2016, we had approximately $965 million of remaining capacity under our revolver, and could borrow all such capacity and remain in compliance with our credit facilities.
We are currently rated A3 by Moody’s Investors Service and BBB+ with a positive outlook by S&P Global Ratings. A downgrade of our credit rating, including a downgrade to below investment grade, would not trigger a default or have any other significant impact on the terms of our existing credit facilities. A reduction in our credit rating could, however, increase our borrowing costs. Additionally, a downgrade of our credit rating below investment grade in connection with a change in control would require us to make a repurchase offer on certain of our senior notes.
Senior Notes
At December 31, 2016, we had three senior notes outstanding, the principal terms of which are summarized below. In 2015, we redeemed, canceled and retired all $140.0 million principal amount outstanding of our 2022 senior notes at a redemption price equal to 100% of the principal amount plus accrued and unpaid interest.
31
2024 Senior Notes | 2025 Senior Notes | 2042 Senior Notes | ||||||||||
Issue date | February 2014 | February 2015 | August 2012 | |||||||||
Maturity date | February 2024 | August 2025 | August 2042 | |||||||||
Potential Call Date | Any Time (1) | Any Time (1) | August 2017 | |||||||||
Par value (in millions) | $ | 400.0 | $ | 350.0 | $ | 200.0 | ||||||
Call Price | As Defined (1) | As Defined (1) | At Par | |||||||||
Stated coupon | 4.25 | % | 3.50 | % | 6.375 | % | ||||||
Coupon frequency | Semi-annually | Semi-annually | Quarterly | |||||||||
__________________________
(1) | The 2024 and 2025 senior notes may be redeemed at any time, in whole or in part, at a make-whole redemption price plus accrued and unpaid interest. |
Convertible Securities
At December 31, 2016, we had junior convertible trust preferred securities outstanding (the “junior convertible securities”). The carrying value ($307.5 million as of December 31, 2016) is accreted to the principal amount at maturity ($430.8 million) over a remaining life of approximately 21 years. The junior convertible securities bear interest at 5.15% per annum, payable quarterly in cash. Each $50 security is convertible, at any time, into 0.25 shares of our common stock, which represents a conversion price of $200 per share, subject to customary anti-dilution adjustments. Holders of the junior convertible securities have no rights to put these securities to us. Upon conversion, holders will receive cash or shares of our common stock, or a combination thereof, at our election. We may redeem the junior convertible securities if the closing price of our common stock exceeds $260 per share for 20 trading days in a period of 30 consecutive trading days. The junior convertible securities are considered contingent payment debt instruments under federal income tax regulations, which require us to deduct interest in an amount greater than our reported interest expense. These deductions result in annual deferred tax liabilities of $10.2 million. These deferred tax liabilities will be reclassified directly to stockholders’ equity if our common stock is trading above certain thresholds at the time of the conversion of the securities.
Forward Equity and Equity Distribution Program
In 2016, we entered into an agreement to sell approximately 2.9 million shares of our common stock at a price of $167.25 per share on a forward basis. During the year, we issued 2.7 million shares to settle a portion of this forward equity sale and received proceeds of $440.3 million, and net settled 0.2 million shares for cash at an average share price of $144.59. As of December 31, 2016, no shares remain outstanding under this agreement.
In 2016, we entered into equity distribution and forward equity agreements with several major securities firms under which we, from time to time, may issue and sell shares of our common stock (immediately or on a forward basis) having an aggregate sales price of up to $500.0 million (the “equity distribution program”). As of December 31, 2016, no sales have occurred under the equity distribution program.
Derivatives
From time to time, we seek to offset our exposure to changing interest rates under our debt financing arrangements and certain of our Affiliates seek to offset their exposure to changing foreign currency exchange rates by entering into derivative contracts.
For the years ended December 31, 2015 and 2016, our Affiliates realized $3.2 million and $0.2 million of gains, respectively, and $1.7 million and $1.2 million of losses, respectively, upon the settlement of certain foreign currency forward contracts. Such realized gains and losses are presented in Revenue, Operating expenses or Investment and other income, depending on the risk being hedged. At December 31, 2016, our Affiliates had unrealized gains and losses related to outstanding foreign currency forward contracts of $0.6 million and $0.5 million, respectively. There were no foreign currency forward contracts outstanding at December 31, 2015. Such unrealized gains and losses are presented within Accumulated other comprehensive income.
Affiliate Equity
32
Many of our Affiliate agreements provide us with a conditional right to call and Affiliate equity holders with the conditional right to put their Affiliate equity interests to us at certain intervals. In cases where we own a minority interest in an Affiliate, we do not typically have such put and call arrangements. The purchase price of these conditional purchases is generally calculated based upon a multiple of the Affiliate’s cash flow distributions, which is intended to represent fair value. Affiliate equity holders are also permitted to sell their equity interests to other individuals or entities in certain cases, subject to our approval or other restrictions.
As of December 31, 2016, our current redemption value of $673.5 million for these interests has been presented as Redeemable non-controlling interests on our Consolidated Balance Sheets. Although the timing and amounts of these purchases are difficult to predict, we repurchased $69.1 million of Affiliate equity during 2016, and expect to repurchase approximately $100 million in 2017. In the event of a repurchase, we would become the owner of the cash flow associated with the repurchased equity.
Commitments
We have committed to co-invest in certain investment partnerships. As of December 31, 2016, these unfunded commitments totaled $92.2 million and may be called in future periods. In connection with a past acquisition agreement, we are contractually entitled to reimbursement from a prior owner of one of the Company’s Affiliates for $11.8 million of these commitments if they are called.
As of December 31, 2016, we were contingently liable, upon achievement by certain Affiliates of specified financial targets, to make payments through 2019 of up to $84.9 million associated with our consolidated Affiliates and $312.0 million associated with our equity method Affiliates. We expect to make payments of $10.3 million of the $84.9 million ($3.0 million in 2017) related to our consolidated Affiliates and no payments in 2017 related to our equity method Affiliates.
Affiliate equity interests provide holders with a conditional right to put their interests to us over time. In addition, in connection with an investment in an Affiliate accounted for under the equity method, we entered into an arrangement with a minority owner of the Affiliate that gives such owner the right to sell a portion of its ownership interest in the Affiliate to us annually beginning in 2018. The purchase price of these conditional purchases will be at fair market value on the date of the transaction.
We and certain of our Affiliates operate under regulatory authorities, which require that they maintain minimum financial or capital requirements.
Share Repurchases
Our Board of Directors authorized share repurchase programs in January 2017 and May 2015, authorizing us to repurchase up to 1.9 million and 3.0 million shares of our common stock, respectively, which do not expire. In 2016, we repurchased 0.2 million shares at an average price per share of $161.16, all of which occurred in the first three months of the year. Upon the January 2017 authorization, we had 4.0 million total shares available for repurchase under the share repurchase programs.
Contractual Obligations
The following table summarizes our contractual obligations as of December 31, 2016. Contractual debt obligations include cash payments of fixed interest.
Payments Due | ||||||||||||||||||||
(in millions) | Total | 2017 | 2018-2019 | 2020-2021 | Thereafter | |||||||||||||||
Contractual Obligations(1) | ||||||||||||||||||||
Senior bank debt | $ | 870.0 | $ | — | $ | — | $ | 870.0 | $ | — | ||||||||||
Senior notes | 1,516.1 | 42.1 | 84.0 | 84.0 | 1,306.0 | |||||||||||||||
Junior convertible securities | 896.8 | 22.2 | 44.4 | 44.4 | 785.8 | |||||||||||||||
Leases(2) | 218.9 | 37.7 | 66.4 | 57.4 | 57.4 | |||||||||||||||
Affiliate equity | 12.1 | 12.1 | — | — | — | |||||||||||||||
Total contractual obligations | $ | 3,513.9 | $ | 114.1 | $ | 194.8 | $ | 1,055.8 | $ | 2,149.2 | ||||||||||
Contingent Obligations | ||||||||||||||||||||
Contingent payment obligations(3) | $ | 10.3 | $ | 3.0 | $ | 7.3 | $ | — | $ | — | ||||||||||
33
__________________________
(1) | This table does not include liabilities for commitments to co-invest in certain investment partnerships or unrecognized tax benefits of $92.2 million and $26.8 million, respectively, as we cannot predict when such obligations will be paid. |
(2) | The controlling interest portion is $11.5 million through 2017, $22.2 million in 2018-2019, $19.3 million in 2020-2021 and $29.3 million thereafter. |
(3) | The contingent payment obligations disclosed in the table represent the expected settlement amounts associated with our investments in new Affiliates. The maximum settlement amount through 2017 is $209.9 million, $187.0 million in 2018-2019 and none thereafter. |
Recent Accounting Developments
See Note 1 of the Consolidated Financial Statements.
Critical Accounting Estimates and Judgments
The preparation of financial statements and related disclosures in conformity with GAAP requires us to make judgments, assumptions and estimates that affect the amounts reported in the Consolidated Financial Statements and accompanying notes. The following are our critical accounting estimates and judgments used in the preparation of the Consolidated Financial Statements, and actual results could differ materially from the amounts reported.
Fair Value Measurements
Accounting standards define fair value as the price that would be received to sell an asset or paid to transfer a liability in an orderly transaction between market participants at the measurement date. These standards establish a fair value hierarchy that gives the highest priority to quoted prices in active markets for identical assets or liabilities and the lowest priority to unobservable inputs.
We make judgments to determine the fair value of certain assets, liabilities and equity interests when allocating the purchase price of our new investments, when revaluing our contingent payment arrangements, when we issue or repurchase Affiliate equity interests and when we test our intangible assets or equity and cost method investments for impairment.
In determining fair values, we make assumptions about the growth rates, profitability and useful lives of existing and prospective client accounts, and consider historical and current market multiples, tax benefits, credit risk, interest rates and discount rates. We consider the reasonableness of our assumptions by comparing our valuation conclusions to observed market transactions, and in certain instances consult with third-party valuation firms.
Goodwill
Goodwill represents the future economic benefits arising from assets acquired in a business combination that are not individually identified and separately recognized, and is reported within the segments in which the Affiliate operates. Our goodwill impairment assessments are performed annually at the reporting unit level (in our case, our three distribution channels), or more frequently should circumstances suggest fair value has declined below the related carrying value. If we determine that the fair value has declined below our related carrying value, an impairment is recognized to reduce the carrying value to its fair value. We completed our annual goodwill impairment assessment and no impairments were identified. For purposes of our assessment, we considered various qualitative factors (including market multiples for asset management businesses) and determined that it was more-likely-than-not that the fair value of each of our reporting units was greater than its respective carrying amount, including goodwill. Only a substantial decline in the fair value of any of our reporting units would indicate that an impairment may exist.
Indefinite-Lived Intangible Assets
Indefinite-lived intangible assets include investment advisory contracts between our Affiliates and their sponsored investment products. Because the contracts are with the investment products themselves, and not with the underlying investors, and the contracts between our Affiliates and the investment products are typically renewed on an annual basis, industry practice under GAAP is to consider the contract life to be indefinite and, as a result, not amortizable.
We perform indefinite-lived intangible asset impairment tests annually, or more frequently should circumstances suggest fair value has declined below the related carrying value. If we determine that the fair value has declined below our related carrying value, an impairment is recognized to reduce the carrying value to its fair value. We completed our annual impairment assessment and no impairments were identified. For purposes of our assessment, we considered various qualitative factors
34
(including market multiples) and determined that it was more-likely-than-not that the fair value of each asset was greater than its carrying amount.
Definite-Lived Intangible Assets
Definite-lived intangible assets include investment advisory contracts between our Affiliates and their underlying investors, and are amortized over their estimated useful lives. We monitor the useful lives of these assets and revise them, if necessary. We review historical and projected attrition rates and other events that may influence our projections of the future economic benefit that we will derive from these relationships. Significant judgment is required to estimate the period that these assets will contribute to our cash flows and the pattern over which these assets will be consumed.
We perform definite-lived intangible asset impairment tests annually, or more frequently should circumstances suggest fair value has declined below the related carrying value. If we determine that the fair value has declined below our related carrying value, an impairment is recognized to reduce the carrying value to its fair value. We assess each of our definite-lived acquired client relationships for impairment by comparing their carrying value to the projected undiscounted cash flows of the acquired client relationships. We completed our annual assessment and noted that projected undiscounted cash flows over the remaining life of each of these assets exceed their carrying value and, accordingly, no impairments were identified.
Equity and Cost Method Investments
We evaluate equity and cost method investments for impairment by assessing whether the fair value of the investment has declined below its carrying value for a period we consider other-than-temporary. If we determine that a decline in fair value below our carrying value is other-than-temporary, an impairment is recognized to reduce the carrying value of the investment to its fair value.
For companies with quoted market prices in active markets, we use these prices to determine the fair value of our equity and cost method investments. For companies without quoted market prices in active markets, we determine the fair values by applying a market multiple to the estimated cash flows of each investment. Our fair value multiples are supported by observed transactions and discounted cash flow analyses that reflect assumptions of current and projected levels of Affiliate assets under management, fee rates and estimated expenses.
We completed our annual evaluation of equity and cost method investments and no impairments were identified.
Contingent Payment Arrangements
We periodically enter into contingent payment arrangements in connection with our business combinations. In these arrangements, the Company agrees to pay additional consideration upon achievement by certain Affiliates of specified financial targets. For consolidated Affiliates, we estimate the fair value of these potential future obligations by discounting the projected future payments (such estimates being dependent upon projected revenue) using current market rates. Our discount rates are developed with input from third-party valuation firms.
We then accrete these obligations to their expected payment amounts until they are measured. If the expected payment amounts subsequently change, the obligations are reduced or increased in the current period resulting in a gain or loss, respectively. Both gains and losses resulting from changes to expected payments and the accretion of these obligations to their expected payment amounts are reflected within Imputed interest expense and contingent payment arrangements in our Consolidated Statements of Income.
Redeemable Non-controlling Interests
Redeemable non-controlling interests represent the currently redeemable value of Affiliate equity interests. We may pay for these Affiliate equity purchases in cash, shares of our common stock or other forms of consideration, at our election.
We generally value these interests upon their transfer or repurchase by applying market multiples to cash flows, which is intended to represent fair value. The use of different assumptions could change the value of these interests, including the amount of compensation expense, if any, that we may report upon their transfer or repurchase.
Income Taxes
Our income tax expense, deferred tax assets and liabilities, and liabilities for unrecognized tax benefits reflect management’s best estimate of current and future taxes to be paid. We are subject to income taxes in the U.S. and numerous foreign jurisdictions.
Deferred income taxes arise from temporary differences between the tax basis of assets and liabilities and their reported amounts in the financial statements, which will result in taxable or deductible amounts in the future. We measure our deferred
35
tax liabilities based on enacted tax rates and projected state apportionment percentages for the years in which the differences are expected to reverse. The effect on deferred tax assets and liabilities of a change in tax rates is recognized in income tax expense in the period in which the change in tax rates is enacted. Our principal deferred tax assets relate to deferred compensation, state and foreign operating loss carryforwards and the indirect benefits of uncertain foreign tax positions. We regularly assess the recoverability of our deferred tax assets, considering all available positive and negative evidence, including future reversals of existing taxable temporary differences, projected future taxable income, tax-planning strategies, and results of recent operations. A valuation allowance is recorded to reduce the carrying values of deferred tax assets to the amount that is more-likely-than-not to be realized.
We record unrecognized tax benefits based on whether it is more-likely-than-not that uncertain tax positions will be sustained on the basis of the technical merits of the position. If it is determined an uncertain tax position is more-likely-than-not to be sustained, the Company recognizes the largest amount of tax benefit that is more than 50% likely to be realized upon ultimate settlement with the related tax authority.
We consider certain earnings of a foreign subsidiary to be indefinitely reinvested outside the U.S. Accordingly, we have not recorded a deferred tax liability related to these earnings. If we decide to repatriate these earnings, we would need to adjust our income tax provision in the period we determine that the earnings will no longer be indefinitely reinvested outside the U.S.
Share-Based Compensation and Affiliate Equity
We have share-based compensation arrangements covering directors, senior management and employees (including our Affiliates). We calculate share-based compensation using the fair value of the awards on the grant date. Our share-based compensation arrangements typically vest and become fully exercisable over three to five years of continued employment, and in some cases, are further subject to certain performance or market conditions. We recognize expense net of expected forfeitures on a straight-line basis over the requisite service period, including grants that are subject to graded vesting.
We estimate the fair value of stock option awards using the Black-Scholes option pricing model. The Black-Scholes model requires us to make assumptions about the volatility and dividend yield of our common stock and the expected life of our stock options. In measuring expected volatility, we consider both the historical volatility of our common stock, as well as the current implied volatility from traded options.
For restricted stock awards with service or performance conditions, we determine the fair value of the awards using our share price on the date of grant. For awards with market conditions, the fair value of the award is determined using a Monte Carlo simulation with inputs for expected volatility, a risk-free rate and expected dividends. Our estimate of expected volatility is developed in a manner consistent with that of our stock options.
From time to time, we grant equity interests in our Affiliates to Affiliate management and our officers, with vesting, forfeiture and repurchase terms established at the date of grant. The fair value of the equity interests is determined as of the date of grant using a discounted cash flow analysis. Key valuation assumptions include projected assets under management, fee rates and discount rates.
Item 7A. | Quantitative and Qualitative Disclosures About Market Risk |
Assets Under Management Market Price Risk
Our Revenue, equity method revenue and, therefore, our aggregate revenue are derived primarily from asset based fees that are typically determined as a percentage of the value of a client’s assets under management and performance fees determined as a percentage of the returns realized on a client’s assets under management. Such values are affected by changes in financial markets (including interest rates and foreign exchange rates) and, accordingly, declines in the financial markets will negatively impact our Revenue, equity method revenue and, therefore, our aggregate revenue.
As of December 31, 2016, we estimate a proportional 1% increase or decrease in the value of our assets under management would have resulted in an annualized increase or decrease in asset based fees in Revenue of $19.0 million for our consolidated Affiliates and in equity method revenue of $17.3 million for our equity method Affiliates. This proportional increase or decrease excludes assets under management on which asset based fees are charged on committed capital.
Interest Rate Risk
We have fixed rates of interest on our senior notes and on our junior convertible securities. While a change in market interest rates would not affect the interest expense incurred on our fixed rate securities, such a change may affect the fair value of these securities. We estimate that a 1% change in interest rates would have resulted in a net change in the fair value of our
36
fixed rate securities of $97.1 million, as of December 31, 2016. We pay a variable rate of interest on our revolver and term loan. We estimate that a 1% increase in interest rates would increase the interest expense related to our variable rate debt under our revolver and term loan outstanding by $8.7 million, as of December 31, 2016.
Foreign Currency Exchange Risk
Most of our Revenue and expenses are denominated in U.S. dollars. A portion of our revenue and expenses are denominated in foreign currencies, primarily pound sterling and Canadian dollars, and are impacted by movements in foreign exchange rates. In addition, the valuations of our foreign Affiliates are impacted by fluctuations in foreign exchange rates, which are recorded as a component of stockholders’ equity. To illustrate the effect of possible changes in currency exchange rates, as of December 31, 2016, we estimate a 1% change in the pound sterling and Canadian dollar to U.S. dollar exchange rates would have resulted in changes to stockholders’ equity of approximately $7 million and $2 million, respectively, and changes to Income before income taxes of $0.8 million and $0.3 million, respectively. During 2016, changes in currency in the pound sterling and Canadian dollar to U.S. dollar exchange rates decreased stockholders’ equity by $68.8 million.
Derivative Risk
From time to time, we seek to offset our exposure to changing interest rates under our debt financing arrangements, and our Affiliates seek to offset exposure to foreign currency exchange rates by entering into derivative contracts as described in “Liquidity and Capital Resources.”
There can be no assurance that our or our Affiliates hedging contracts will meet their overall objective or that we or our Affiliates will be successful in obtaining hedging contracts in the future.
Item 8. | Financial Statements and Supplementary Data |
Management’s Report on Internal Control Over Financial Reporting
Management of Affiliated Managers Group, Inc. (the “Company”) is responsible for establishing and maintaining adequate internal control over financial reporting. The Company’s internal control over financial reporting processes are designed by, or under the supervision of, the Company’s chief executive and chief financial officers and applied by the Company’s Board of Directors, management and other senior employees to provide reasonable assurance regarding the reliability of financial reporting and the preparation of the Company’s financial statements for external reporting purposes in accordance with accounting principles generally accepted in the U.S.
The Company’s internal control over financial reporting includes policies and procedures that pertain to the maintenance of records that, in reasonable detail, accurately and fairly reflect transactions and dispositions of assets; provide reasonable assurances that transactions are recorded as necessary to permit preparation of financial statements in accordance with accounting principles generally accepted in the U.S., and that receipts and expenditures are being made only in accordance with authorizations of management and the directors of the Company; and provide reasonable assurance regarding prevention or timely detection of unauthorized acquisition, use or disposition of the Company’s assets that could have a material effect on our financial statements.
As of December 31, 2016, management conducted an assessment of the effectiveness of the Company’s internal control over financial reporting based on the framework established in Internal Control—Integrated Framework (2013) issued by the Committee of Sponsoring Organizations of the Treadway Commission (COSO). Based on this assessment, management has determined that the Company’s internal control over financial reporting as of December 31, 2016 was effective.
The Company’s internal control over financial reporting as of December 31, 2016 has been audited by PricewaterhouseCoopers LLP, an independent registered public accounting firm, as stated in their report appearing in “Report of Independent Registered Public Accounting Firm,” which expresses an unqualified opinion on the effectiveness of the Company’s internal control over financial reporting as of December 31, 2016.
37
Report of Independent Registered Public Accounting Firm
To the Board of Directors and Stockholders of Affiliated Managers Group, Inc.:
In our opinion, the accompanying consolidated balance sheets and the related consolidated statements of income, comprehensive income, changes in equity and cash flows present fairly, in all material respects, the financial position of Affiliated Managers Group, Inc. and its subsidiaries at December 31, 2016 and December 31, 2015, and the results of their operations and their cash flows for each of the three years in the period ended December 31, 2016 in conformity with accounting principles generally accepted in the United States of America. In addition, in our opinion, the financial statement schedule listed under Item 15(a)(2) presents fairly, in all material respects, the information set forth therein when read in conjunction with the related consolidated financial statements. Also in our opinion, the Company maintained, in all material respects, effective internal control over financial reporting as of December 31, 2016, based on criteria established in Internal Control - Integrated Framework 2013 issued by the Committee of Sponsoring Organizations of the Treadway Commission (COSO). The Company's management is responsible for these financial statements and financial statement schedule, for maintaining effective internal control over financial reporting and for its assessment of the effectiveness of internal control over financial reporting, included in Management’s Report on Internal Control over Financial Reporting appearing under Item 8. Our responsibility is to express opinions on these financial statements, on the financial statement schedule, and on the Company's internal control over financial reporting based on our integrated audits. We conducted our audits in accordance with the standards of the Public Company Accounting Oversight Board (United States). Those standards require that we plan and perform the audits to obtain reasonable assurance about whether the financial statements are free of material misstatement and whether effective internal control over financial reporting was maintained in all material respects. Our audits of the financial statements included examining, on a test basis, evidence supporting the amounts and disclosures in the financial statements, assessing the accounting principles used and significant estimates made by management, and evaluating the overall financial statement presentation. Our audit of internal control over financial reporting included obtaining an understanding of internal control over financial reporting, assessing the risk that a material weakness exists, and testing and evaluating the design and operating effectiveness of internal control based on the assessed risk. Our audits also included performing such other procedures as we considered necessary in the circumstances. We believe that our audits provide a reasonable basis for our opinions.
A company’s internal control over financial reporting is a process designed to provide reasonable assurance regarding the reliability of financial reporting and the preparation of financial statements for external purposes in accordance with generally accepted accounting principles. A company’s internal control over financial reporting includes those policies and procedures that (i) pertain to the maintenance of records that, in reasonable detail, accurately and fairly reflect the transactions and dispositions of the assets of the company; (ii) provide reasonable assurance that transactions are recorded as necessary to permit preparation of financial statements in accordance with generally accepted accounting principles, and that receipts and expenditures of the company are being made only in accordance with authorizations of management and directors of the company; and (iii) provide reasonable assurance regarding prevention or timely detection of unauthorized acquisition, use, or disposition of the company’s assets that could have a material effect on the financial statements.
Because of its inherent limitations, internal control over financial reporting may not prevent or detect misstatements. Also, projections of any evaluation of effectiveness to future periods are subject to the risk that controls may become inadequate because of changes in conditions, or that the degree of compliance with the policies or procedures may deteriorate.
/s/ PricewaterhouseCoopers LLP
Boston, Massachusetts
February 24, 2017
38
AFFILIATED MANAGERS GROUP, INC.
CONSOLIDATED STATEMENTS OF INCOME
(in millions, except per share data)
For the Years Ended December 31, | ||||||||||||
2014 | 2015 | 2016 | ||||||||||
Revenue | $ | 2,510.9 | $ | 2,484.5 | $ | 2,194.6 | ||||||
Operating expenses: | ||||||||||||
Compensation and related expenses | 1,030.5 | 1,027.7 | 932.4 | |||||||||
Selling, general and administrative | 485.5 | 443.8 | 398.1 | |||||||||
Intangible amortization and impairments | 122.2 | 115.4 | 110.2 | |||||||||
Depreciation and other amortization | 16.9 | 18.8 | 19.5 | |||||||||
Other operating expenses, net | 40.6 | 43.8 | 29.1 | |||||||||
1,695.7 | 1,649.5 | 1,489.3 | ||||||||||
Operating income | 815.2 | 835.0 | 705.3 | |||||||||
Income from equity method investments | 281.7 | 288.9 | 328.8 | |||||||||
Other non-operating (income) and expenses: | ||||||||||||
Investment and other income | (23.3 | ) | (15.3 | ) | (33.8 | ) | ||||||
Interest expense | 76.6 | 88.9 | 89.4 | |||||||||
Imputed interest expense and contingent payment arrangements | 30.1 | (40.3 | ) | 3.9 | ||||||||
83.4 | 33.3 | 59.5 | ||||||||||
Income before income taxes | 1,013.5 | 1,090.6 | 974.6 | |||||||||
Income taxes | 246.1 | 263.4 | 235.6 | |||||||||
Net income | 767.4 | 827.2 | 739.0 | |||||||||
Net income (non-controlling interests) | (333.5 | ) | (317.7 | ) | (266.2 | ) | ||||||
Net income (controlling interest) | $ | 433.9 | $ | 509.5 | $ | 472.8 | ||||||
Average shares outstanding (basic) | 55.0 | 54.3 | 54.2 | |||||||||
Average shares outstanding (diluted) | 58.4 | 57.2 | 57.0 | |||||||||
Earnings per share (basic) | $ | 7.89 | $ | 9.37 | $ | 8.73 | ||||||
Earnings per share (diluted) | $ | 7.70 | $ | 9.17 | $ | 8.57 | ||||||
The accompanying notes are an integral part of the Consolidated Financial Statements.
39
AFFILIATED MANAGERS GROUP, INC.
CONSOLIDATED STATEMENTS OF COMPREHENSIVE INCOME
(in millions)
For the Years Ended December 31, | ||||||||||||
2014 | 2015 | 2016 | ||||||||||
Net income | $ | 767.4 | $ | 827.2 | $ | 739.0 | ||||||
Other comprehensive income (loss): | ||||||||||||
Controlling interest: | ||||||||||||
Foreign currency translation gain (loss) | (48.6 | ) | (72.8 | ) | (68.8 | ) | ||||||
Change in net realized and unrealized gain (loss) on derivative securities, net of tax | 1.1 | 1.1 | 0.7 | |||||||||
Change in net unrealized gain (loss) on investment securities, net of tax | 5.3 | 21.8 | (36.7 | ) | ||||||||
Other comprehensive income (loss) (Controlling interest) | (42.2 | ) | (49.9 | ) | (104.8 | ) | ||||||
Non-controlling interests: | ||||||||||||
Foreign currency translation gain (loss) | (13.4 | ) | (20.4 | ) | (46.5 | ) | ||||||
Change in net realized and unrealized gain (loss) on derivative securities, net of tax | (0.8 | ) | 0.8 | (0.6 | ) | |||||||
Change in net unrealized gain (loss) on investment securities, net of tax | (1.9 | ) | 0.3 | 1.5 | ||||||||
Other comprehensive income (loss) (Non-controlling interests) | (16.1 | ) | (19.3 | ) | (45.6 | ) | ||||||
Other comprehensive income (loss) | (58.3 | ) | (69.2 | ) | (150.4 | ) | ||||||
Comprehensive income | 709.1 | 758.0 | 588.6 | |||||||||
Comprehensive income (non-controlling interests) | (317.4 | ) | (298.4 | ) | (220.6 | ) | ||||||
Comprehensive income (controlling interest) | $ | 391.7 | $ | 459.6 | $ | 368.0 | ||||||
The accompanying notes are an integral part of the Consolidated Financial Statements.
40
AFFILIATED MANAGERS GROUP, INC.
CONSOLIDATED BALANCE SHEETS
(in millions, except par value)
December 31, | ||||||||
2015 | 2016 | |||||||
Assets | ||||||||
Cash and cash equivalents | $ | 563.8 | $ | 430.8 | ||||
Receivables | 391.2 | 383.3 | ||||||
Investments in marketable securities | 199.9 | 122.4 | ||||||
Other investments | 149.3 | 147.5 | ||||||
Fixed assets, net | 114.1 | 110.1 | ||||||
Goodwill | 2,668.4 | 2,628.1 | ||||||
Acquired client relationships, net | 1,686.4 | 1,497.4 | ||||||
Equity method investments in Affiliates | 1,937.1 | 3,368.3 | ||||||
Other assets | 59.2 | 61.2 | ||||||
Total assets | $ | 7,769.4 | $ | 8,749.1 | ||||
Liabilities and Equity | ||||||||
Payables and accrued liabilities | $ | 729.4 | $ | 729.3 | ||||
Senior bank debt | 643.3 | 868.6 | ||||||
Senior notes | 937.1 | 939.4 | ||||||
Convertible securities | 299.0 | 301.6 | ||||||
Deferred income taxes | 565.7 | 660.8 | ||||||
Other liabilities | 213.3 | 149.4 | ||||||
Total liabilities | 3,387.8 | 3,649.1 | ||||||
Commitments and contingencies (Note 10) | ||||||||
Redeemable non-controlling interests | 612.5 | 673.5 | ||||||
Equity: | ||||||||
Common stock ($0.01 par value, 153.0 shares authorized; 55.8 shares outstanding in 2015 and 58.5 shares outstanding 2016) | 0.6 | 0.6 | ||||||
Additional paid-in capital | 694.9 | 1,073.5 | ||||||
Accumulated other comprehensive income (loss) | (18.1 | ) | (122.9 | ) | ||||
Retained earnings | 2,581.6 | 3,054.4 | ||||||
3,259.0 | 4,005.6 | |||||||
Less: Treasury stock, at cost (2.0 shares in 2015 and 1.8 shares in 2016) | (421.9 | ) | (386.0 | ) | ||||
Total stockholders’ equity | 2,837.1 | 3,619.6 | ||||||
Non-controlling interests | 932.0 | 806.9 | ||||||
Total equity | 3,769.1 | 4,426.5 | ||||||
Total liabilities and equity | $ | 7,769.4 | $ | 8,749.1 | ||||
The accompanying notes are an integral part of the Consolidated Financial Statements.
41
AFFILIATED MANAGERS GROUP, INC.
CONSOLIDATED STATEMENTS OF CHANGES IN EQUITY
(in millions)
Total Stockholders’ Equity | ||||||||||||||||||||||||||||||
Shares Outstanding | Common Stock | Additional Paid-In Capital | Accumulated Other Comprehensive Income (Loss) | Retained Earnings | Treasury Stock at Cost | Non- controlling Interests | Total Equity | |||||||||||||||||||||||
December 31, 2013 | 53.9 | $ | 0.5 | $ | 552.9 | $ | 74.0 | $ | 1,638.2 | $ | (131.4 | ) | $ | 1,010.4 | $ | 3,144.6 | ||||||||||||||
Net income | — | — | — | — | 433.9 | — | 333.5 | 767.4 | ||||||||||||||||||||||
Other comprehensive income (loss) | — | — | — | (42.2 | ) | — | — | (16.1 | ) | (58.3 | ) | |||||||||||||||||||
Share-based compensation | — | — | 29.3 | — | — | — | — | 29.3 | ||||||||||||||||||||||
Common stock issued under share-based incentive plans | — | — | (134.4 | ) | — | — | 129.1 | — | (5.3 | ) | ||||||||||||||||||||
Tax benefit from share-based incentive plans | — | — | 60.2 | — | — | — | — | 60.2 | ||||||||||||||||||||||
Settlement of senior convertible securities | 1.9 | 0.1 | 276.4 | — | — | — | — | 276.5 | ||||||||||||||||||||||
Shares repurchases | — | — | — | — | — | (238.6 | ) | — | (238.6 | ) | ||||||||||||||||||||
Forward equity | — | — | (45.0 | ) | — | — | — | — | (45.0 | ) | ||||||||||||||||||||
Investments in Affiliates | — | — | — | — | — | — | 235.0 | 235.0 | ||||||||||||||||||||||
Affiliate equity activity: | ||||||||||||||||||||||||||||||
Affiliate equity expense | — | — | 47.4 | — | — | — | 37.0 | 84.4 | ||||||||||||||||||||||
Issuances | — | — | — | — | — | — | 10.8 | 10.8 | ||||||||||||||||||||||
Repurchases | — | — | 19.6 | — | — | — | (19.6 | ) | — | |||||||||||||||||||||
Changes in Redemption value of Redeemable non-controlling interests | — | — | (43.0 | ) | — | — | — | (43.0 | ) | |||||||||||||||||||||
Transfers to Redeemable non-controlling interests | — | — | — | — | — | — | (22.7 | ) | (22.7 | ) | ||||||||||||||||||||
Capital Contributions by Affiliate equity holders | — | — | — | — | — | — | 17.3 | 17.3 | ||||||||||||||||||||||
Distributions to non-controlling interests | — | — | — | — | — | — | (569.4 | ) | (569.4 | ) | ||||||||||||||||||||
December 31, 2014 | 55.8 | $ | 0.6 | $ | 763.4 | $ | 31.8 | $ | 2,072.1 | $ | (240.9 | ) | $ | 1,016.2 | $ | 3,643.2 | ||||||||||||||
Net income | — | — | — | — | 509.5 | — | 317.7 | 827.2 | ||||||||||||||||||||||
Other comprehensive income (loss) | — | — | — | (49.9 | ) | — | — | (19.3 | ) | (69.2 | ) | |||||||||||||||||||
Share-based compensation | — | — | 34.2 | — | — | — | — | 34.2 | ||||||||||||||||||||||
Common stock issued under share-based incentive plans | — | — | (131.0 | ) | — | — | 185.0 | — | 54.0 | |||||||||||||||||||||
Tax benefit from share-based incentive plans | — | — | 44.5 | — | — | — | — | 44.5 | ||||||||||||||||||||||
Shares repurchases | — | — | — | — | — | (366.0 | ) | — | (366.0 | ) | ||||||||||||||||||||
Investments in Affiliates | — | — | — | — | — | — | 33.8 | 33.8 | ||||||||||||||||||||||
Affiliate equity activity: | ||||||||||||||||||||||||||||||
Affiliate equity expense | — | — | 16.9 | — | — | — | 51.6 | 68.5 | ||||||||||||||||||||||
Issuances | — | — | 0.1 | — | — | — | 1.6 | 1.7 | ||||||||||||||||||||||
Repurchases | — | — | 48.4 | — | — | — | (0.4 | ) | 48.0 | |||||||||||||||||||||
Changes in Redemption value of Redeemable non-controlling interests | — | — | (81.6 | ) | — | — | — | (81.6 | ) | |||||||||||||||||||||
Transfers to Redeemable non-controlling interests | — | — | — | — | — | — | (49.5 | ) | (49.5 | ) | ||||||||||||||||||||
Capital Contributions by Affiliate equity holders | — | — | — | — | — | — | 11.7 | 11.7 | ||||||||||||||||||||||
Distributions to non-controlling interests | — | — | — | — | — | — | (431.4 | ) | (431.4 | ) | ||||||||||||||||||||
December 31, 2015 | 55.8 | $ | 0.6 | $ | 694.9 | $ | (18.1 | ) | $ | 2,581.6 | $ | (421.9 | ) | $ | 932.0 | $ | 3,769.1 | |||||||||||||
Net income | — | — | — | — | 472.8 | — | 266.2 | 739.0 | ||||||||||||||||||||||
Other comprehensive income (loss) | — | — | — | (104.8 | ) | — | — | (45.6 | ) | (150.4 | ) | |||||||||||||||||||
Share-based compensation | — | — | 39.2 | — | — | — | — | 39.2 | ||||||||||||||||||||||
Common stock issued under share-based incentive plans | — | — | (53.8 | ) | — | — | 69.3 | — | 15.5 | |||||||||||||||||||||
42
Shares repurchases | — | — | — | — | — | (33.4 | ) | — | (33.4 | ) | ||||||||||||||||||||
Forward equity | — | — | 5.2 | — | — | — | — | 5.2 | ||||||||||||||||||||||
Common stock issued under forward equity agreement | 2.7 | 0.0 | 440.3 | — | — | — | — | 440.3 | ||||||||||||||||||||||
Issuance costs and other | — | — | (3.0 | ) | — | — | — | — | (3.0 | ) | ||||||||||||||||||||
Affiliate equity activity: | ||||||||||||||||||||||||||||||
Affiliate equity expense | — | — | 10.0 | — | — | — | 31.2 | 41.2 | ||||||||||||||||||||||
Issuances | — | — | (2.8 | ) | — | — | — | 14.7 | 11.9 | |||||||||||||||||||||
Repurchases | — | — | 14.9 | — | — | — | 0.4 | 15.3 | ||||||||||||||||||||||
Changes in redemption value of Redeemable non-controlling interests | — | — | (71.4 | ) | — | — | — | — | (71.4 | ) | ||||||||||||||||||||
Transfers to Redeemable non-controlling interests | — | — | — | — | — | — | (42.6 | ) | (42.6 | ) | ||||||||||||||||||||
Capital contributions by Affiliate equity holders | — | — | — | — | — | — | 4.7 | 4.7 | ||||||||||||||||||||||
Distributions to non-controlling interests | — | — | — | — | — | — | (354.1 | ) | (354.1 | ) | ||||||||||||||||||||
December 31, 2016 | 58.5 | $ | 0.6 | $ | 1,073.5 | $ | (122.9 | ) | $ | 3,054.4 | $ | (386.0 | ) | $ | 806.9 | $ | 4,426.5 | |||||||||||||
The accompanying notes are an integral part of the Consolidated Financial Statements.
43
AFFILIATED MANAGERS GROUP, INC.
CONSOLIDATED STATEMENTS OF CASH FLOWS
(in millions)
For the Years Ended December 31, | ||||||||||||
2014 | 2015 | 2016 | ||||||||||
Cash flow from (used in) operating activities: | ||||||||||||
Net income | $ | 767.4 | $ | 827.2 | $ | 739.0 | ||||||
Adjustments to reconcile Net income to net cash flow from operating activities: | ||||||||||||
Intangible amortization and impairments | 122.2 | 115.4 | 110.2 | |||||||||
Depreciation and other amortization | 16.9 | 18.8 | 19.5 | |||||||||
Deferred income tax provision | 81.0 | 101.2 | 59.3 | |||||||||
Imputed interest expense and contingent payment arrangements | 30.1 | (40.3 | ) | 3.9 | ||||||||
Income from equity method investments, net of amortization | (281.7 | ) | (288.9 | ) | (328.8 | ) | ||||||
Distributions received from equity method investments | 366.9 | 346.1 | 346.4 | |||||||||
Amortization of issuance costs | 7.6 | 8.1 | 4.8 | |||||||||
Share-based compensation and Affiliate equity expense | 113.7 | 102.7 | 80.4 | |||||||||
Other non-cash items | 3.8 | (5.8 | ) | (24.8 | ) | |||||||
Changes in assets and liabilities: | ||||||||||||
Purchases of trading securities by Affiliate sponsored consolidated products | (1.9 | ) | (4.6 | ) | (86.2 | ) | ||||||
Sales of trading securities by Affiliate sponsored consolidated products | 1.3 | 4.1 | 82.8 | |||||||||
Decrease in receivables | 26.5 | 56.1 | 58.2 | |||||||||
(Increase) decrease in other assets | (6.5 | ) | 6.7 | (6.1 | ) | |||||||
Increase (decrease) in payables, accrued liabilities and other liabilities | 189.6 | (38.4 | ) | (31.0 | ) | |||||||
Cash flow from operating activities | 1,436.9 | 1,208.4 | 1,027.6 | |||||||||
Cash flow from (used in) investing activities: | ||||||||||||
Investments in Affiliates | (1,245.0 | ) | (297.7 | ) | (1,361.3 | ) | ||||||
Purchase of fixed assets | (19.2 | ) | (38.2 | ) | (20.2 | ) | ||||||
Purchase of investment securities | (21.2 | ) | (13.5 | ) | (16.0 | ) | ||||||
Sale of investment securities | 17.3 | 24.9 | 65.3 | |||||||||
Cash flow used in investing activities | (1,268.1 | ) | (324.5 | ) | (1,332.2 | ) | ||||||
Cash flow from (used in) financing activities: | ||||||||||||
Borrowings of senior debt | 1,746.5 | 1,253.3 | 1,350.0 | |||||||||
Repayments of senior debt and convertible securities | (1,020.6 | ) | (1,256.0 | ) | (1,125.0 | ) | ||||||
Issuance of common stock | 41.4 | 57.8 | 465.8 | |||||||||
Repurchase of common stock | (190.8 | ) | (413.7 | ) | (33.4 | ) | ||||||
Note and contingent payments | 14.4 | 20.5 | 4.9 | |||||||||
Distributions to non-controlling interests | (569.4 | ) | (431.4 | ) | (354.1 | ) | ||||||
Affiliate equity issuances and repurchases | (65.7 | ) | (120.6 | ) | (104.0 | ) | ||||||
Excess tax benefit from share-based compensation | 61.5 | 44.5 | — | |||||||||
Settlement of forward equity sale agreement | (45.0 | ) | 0.1 | — | ||||||||
Other financing items | (49.9 | ) | (12.2 | ) | (3.3 | ) | ||||||
Cash flow from (used in) financing activities | (77.6 | ) | (857.7 | ) | 200.9 | |||||||
Effect of foreign exchange rate changes on cash and cash equivalents | (10.2 | ) | (13.0 | ) | (27.2 | ) | ||||||
Net increase (decrease) in cash and cash equivalents | 81.0 | 13.2 | (130.9 | ) | ||||||||
Cash and cash equivalents at beginning of period | 469.6 | 550.6 | 563.8 | |||||||||
Net cash outflows upon the consolidation and deconsolidation of Affiliate sponsored products | — | — | (2.1 | ) | ||||||||
Cash and cash equivalents at end of period | $ | 550.6 | $ | 563.8 | $ | 430.8 | ||||||
Supplemental disclosure of cash flow information: | ||||||||||||
Interest paid | $ | 67.9 | $ | 76.4 | $ | 85.0 | ||||||
Income taxes paid | 110.7 | 89.6 | 152.3 | |||||||||
Supplemental disclosure of non-cash financing activities: | ||||||||||||
Settlement of 2006 junior convertible securities | 217.8 | — | — | |||||||||
Stock issued under incentive plans | 63.6 | 10.7 | 17.2 | |||||||||
Stock received for tax withholdings on share-based payments | 44.7 | 3.6 | 9.8 | |||||||||
Payables recorded for Share repurchases | 47.8 | — | — | |||||||||
Payables recorded for Affiliate equity repurchases | 21.5 | 62.3 | 12.1 | |||||||||
The accompanying notes are an integral part of the Consolidated Financial Statements.
44
AFFILIATED MANAGERS GROUP, INC.
NOTES TO CONSOLIDATED FINANCIAL STATEMENTS
1. | Business and Summary of Significant Accounting Policies |
(a) | Organization and Nature of Operations |
Affiliated Managers Group, Inc. (“AMG” or the “Company”) is a global asset management company with equity investments in leading boutique investment management firms, referred to as “Affiliates.” AMG’s Affiliates provide investment management services globally to institutional, retail and high net worth clients.
Each of AMG’s Affiliates operates through distinct entities, typically organized as limited liability companies or limited partnerships (or equivalent non-U.S. forms), which affords AMG the flexibility to design a separate operating agreement for each Affiliate. The operating agreements reflect the specific terms of AMG’s economic participation in the Affiliate through a “structured partnership interest.” AMG’s structured partnership interests typically consist of arrangements through which AMG shares in the Affiliate’s revenue without regard to expenses and also include arrangements through which AMG shares in the Affiliate’s revenue less certain agreed-upon expenses. When AMG owns a majority of the equity interests in an Affiliate and its structured partnership interest is calculated by reference to the Affiliate’s revenue without regard to expenses, a set percentage of revenue is allocated to fund operating expenses, including compensation (the “Operating Allocation”), while the remaining revenue (the “Owners’ Allocation”) is allocated to AMG and Affiliate management in proportion to their respective ownership interests. When AMG owns a minority of the equity interests in an Affiliate, its structured partnership interest is either calculated by reference to the Affiliate’s revenue without regard to expenses or by reference to the Affiliate’s revenue less certain agreed-upon expenses. When AMG’s interest is calculated by reference to an Affiliate’s revenue less certain agreed-upon expenses, AMG participates in increases and decreases both in revenue and the agreed-upon expenses included in the calculation. This structure allows AMG to benefit from any increase in revenue or any decrease in the expenses that are included in the calculation, but also directly exposes AMG to any decrease in revenue or any increase in such expenses, which AMG may not anticipate and which could be significant.
(b) | Basis of Presentation and Use of Estimates |
The financial statements are prepared in accordance with accounting principles generally accepted in the U.S. (“GAAP”). All dollar amounts, except per share data in the text and tables herein, are stated in millions unless otherwise indicated. Certain reclassifications have been made to prior years’ financial statements to conform to the current year’s presentation. The preparation of financial statements in conformity with GAAP requires management to make estimates and assumptions that affect the reported amounts and disclosures in the financial statements. Actual results could differ from those estimates.
Revision of Prior Periods
In the third quarter of 2016, the Company reviewed its accounting for Affiliate equity transactions in preparation for the adoption of Accounting Standard Update (“ASU”) 2016-09, Compensation - Stock Compensation: Improvements to Employee Share-Based Payment Accounting, which the Company has now adopted. During this review, the Company determined that it had incorrectly recorded deferred tax benefits, a non-cash item, on certain Affiliate equity transactions dating back to 2005. The Company assessed the impact of the error, both quantitatively and qualitatively, in accordance with the Securities and Exchange Commission’s Staff Accounting Bulletin (“SAB”) No. 99 and SAB No. 108 and concluded that it was not material to any of the Company’s previously issued Consolidated Financial Statements. The Company has revised its Consolidated Financial Statements for periods prior to 2016 to reflect the correction of the error in the periods in which the deferred tax benefits were recorded. The cumulative impact of the correction has been reflected as a reclassification between the beginning Retained earnings and Additional paid-in capital balances as of December 31, 2013 in the Consolidated Statements of Changes in Equity.
The tables below show the effect of the correction on the Consolidated Statements of Income and Consolidated Statements of Cash Flows for the years ended December 31, 2014 and 2015 and on the Consolidated Balance Sheet as of December 31, 2015. All financial information presented in these notes has been revised to reflect the correction of this error.
The revision had no impact on Income before income taxes, Total stockholders’ equity or Cash flow from operating activities.
45
AFFILIATED MANAGERS GROUP, INC.
NOTES TO CONSOLIDATED FINANCIAL STATEMENTS (Continued)
For the Year Ended 2014 | For the Year Ended 2015 | ||||||||||||||||||||||
Consolidated Statements of Income | As Previously Reported | Adjustments | As Revised | As Previously Reported | Adjustments | As Revised | |||||||||||||||||
Income taxes | $ | 227.9 | $ | 18.2 | $ | 246.1 | $ | 256.9 | $ | 6.5 | $ | 263.4 | |||||||||||
Net income | 785.6 | (18.2 | ) | 767.4 | 833.7 | (6.5 | ) | 827.2 | |||||||||||||||
Net income (controlling interest) | 452.1 | (18.2 | ) | 433.9 | 516.0 | (6.5 | ) | 509.5 | |||||||||||||||
Earnings per share (basic) | $ | 8.22 | $ | (0.33 | ) | $ | 7.89 | $ | 9.49 | $ | (0.12 | ) | $ | 9.37 | |||||||||
Earnings per share (diluted) | $ | 8.01 | $ | (0.31 | ) | $ | 7.70 | $ | 9.28 | $ | (0.11 | ) | $ | 9.17 | |||||||||
December 31, 2015 | |||||||||||
Consolidated Balance Sheet | As Previously Reported | Adjustments | As Revised | ||||||||
Additional paid-in capital | $ | 597.2 | $ | 97.7 | $ | 694.9 | |||||
Retained earnings | 2,679.3 | (97.7 | ) | 2,581.6 | |||||||
For the Year Ended 2014 | For the Year Ended 2015 | ||||||||||||||||||||||
Consolidated Statements of Cash Flows | As Previously Reported | Adjustments | As Revised | As Previously Reported | Adjustments | As Revised | |||||||||||||||||
Net income | $ | 785.6 | $ | (18.2 | ) | $ | 767.4 | $ | 833.7 | $ | (6.5 | ) | $ | 827.2 | |||||||||
Deferred income tax provision | 62.8 | 18.2 | 81.0 | 94.7 | 6.5 | 101.2 | |||||||||||||||||
(c) | Principles of Consolidation |
The Company assesses consolidation requirements pursuant to ASU 2015-02: Consolidation, which was adopted using the modified retrospective method and resulted in an effective date of adoption of January 1, 2016.
In evaluating whether an investment must be consolidated, the Company evaluates the risk, rewards, and significant terms of each of its Affiliate and other investments to determine if an investment is considered a voting rights entity (“VRE”) or a variable interest entity (“VIE”). An entity is a VRE when the total equity investment at risk is sufficient to enable the entity to finance its activities independently and when the equity holders have the obligation to absorb losses, the right to receive residual returns and the right to direct the activities of the entity that most significantly impact its economic performance. An entity is a VIE when it lacks one or more of the characteristics of a VRE. Assessing whether an entity is a VRE or VIE involves judgment. Upon the occurrence of certain events, management reviews and reconsiders its previous conclusion regarding the status of an entity as a VRE or a VIE.
The Company consolidates VREs when it has control over significant operating, financial and investing decisions of the investment or holds the majority voting interest. The Company consolidates VIEs when it has a controlling financial interest, which is defined as having the power to direct the activities that most significantly impact the VIE’s economic performance and the obligation to absorb losses of or the right to receive benefits from the entity that could potentially be significant to the VIE.
Investments in Affiliates
For the Company’s consolidated Affiliates, the portion of the Owners’ Allocation allocated to Affiliate management is included in Net income (non-controlling interests) in the Consolidated Statements of Income. Non-controlling interests on the Consolidated Balance Sheets include capital and undistributed Operating and Owners’ Allocation owned by Affiliate management of the Company’s consolidated Affiliates. The effect of any changes in the Company’s equity interests in its consolidated Affiliates resulting from the issuance or repurchase of an Affiliate’s equity by the Company or one of its Affiliates is included as a component of stockholders’ equity, net of any related income tax effects in the period of the change. The current redemption value of non-controlling interests has been presented as Redeemable non-controlling interests on the Consolidated Balance Sheets.
The Company applies the equity method of accounting to investments where the Company does not hold a controlling equity interest but has the ability to exercise significant influence over operating and financial matters. Other investments in
46
AFFILIATED MANAGERS GROUP, INC.
NOTES TO CONSOLIDATED FINANCIAL STATEMENTS (Continued)
which the Company owns less than a 20% interest and does not exercise significant influence are accounted for under the cost method. Under the cost method, income is recognized when dividends are declared.
Affiliate Sponsored Investment Vehicles
The Company’s consolidated Affiliates sponsor various investment products where they also act as the investment advisor, and in some cases these products are considered VIEs. These investment products are typically owned primarily by third-party investors; however, certain products are capitalized with seed capital investments from Affiliates.
Investors are generally entitled to substantially all of the economics of these VIEs, except for the management and performance fees earned by Affiliates or any gains or losses attributable to Affiliates’ investments in these products. As a result, Affiliates do not generally consolidate these VIEs unless the Affiliate’s interest in the product is considered substantial. When consolidating these VIEs, the Company retains the specialized investment company accounting principles of the underlying products, and all of the underlying investments are carried at fair value in Investments in marketable securities in the Consolidated Balance Sheets with corresponding changes in the investments’ fair values reflected in Other operating expenses (net) in the Consolidated Statements of Income. Purchases and sales of securities are presented within purchases and sales by Affiliate sponsored consolidated products in the Consolidated Statements of Cash Flows. When Affiliates no longer control these products, due to a reduction in ownership or other reasons, the products are deconsolidated.
(d) | Cash and Cash Equivalents |
The Company considers all highly liquid investments, including money market mutual funds, with original maturities of three months or less to be cash equivalents. Cash equivalents are stated at cost, which approximates market value due to the short-term maturity of these investments. Money market mutual funds with a floating net asset value (“NAV”) would not meet the definition of a cash equivalent if the fund has enacted liquidity fees or redemption gates.
(e) | Receivables |
The Company’s Affiliates earn asset based and performance fees, which are billed based on the terms of the related contracts. Billed but uncollected asset based and performance fees are presented within Receivables on the Consolidated Balance Sheets and are generally short-term in nature.
Certain of the Company’s Affiliates in the UK act as intermediaries between clients and their sponsored investment products. Normal settlement periods on transactions initiated by these clients with the sponsored investment products result in unsettled fund share receivables and payables that are presented on a gross basis within Receivables and Payables and accrued liabilities on the Consolidated Balance Sheets. The gross presentation of these receivables and offsetting payables reflects the legal relationship between the underlying investor and the Company’s Affiliates.
(f) | Investments in Marketable Securities |
Investments in marketable securities are classified as either trading or available-for-sale and carried at fair value. Unrealized gains or losses on investments classified as available-for-sale are reported, net of tax, as a separate component of Accumulated other comprehensive income (loss) in Equity until realized when they are reported in Investment and other income in the Consolidated Statements of Income. Realized and unrealized gains or losses related to trading securities are reported within Investment and other income. Realized gains and losses are recorded on trade date on a specific identified basis. If a decline in the fair value of an available-for-sale investment is determined to be other-than-temporary, the carrying amount of the asset is reduced to its fair value, and the difference is charged to Investment and other income in the period incurred.
(g) | Fair Value Measurements |
The Company determines the fair value of certain investment securities and other financial and non-financial assets and liabilities. Fair value is determined based on the price that would be received for an asset or paid to transfer a liability in an orderly transaction between market participants at the measurement date, utilizing a hierarchy of three different valuation techniques:
Level 1 - Unadjusted quoted market prices for identical instruments in active markets;
47
AFFILIATED MANAGERS GROUP, INC.
NOTES TO CONSOLIDATED FINANCIAL STATEMENTS (Continued)
Level 2 - Quoted prices for similar instruments in active markets; quoted prices for identical or similar instruments in markets that are not active; and model-derived valuations whose inputs, or significant value drivers, are observable; and
Level 3 - Prices reflect the Company’s own assumptions concerning unobservable inputs to the valuation model. These inputs require significant management judgment and reflect the Company’s assumptions that market participants would use in pricing the asset or liability.
(h) | Fixed Assets |
Fixed assets are recorded at cost and depreciated using the straight-line method over their estimated useful lives. The estimated useful lives of office equipment and furniture and fixtures range from three to ten years. Computer software developed or obtained for internal use is amortized over the estimated useful life of the software, generally three to seven years. Leasehold improvements are amortized over the shorter of their estimated useful lives or the term of the lease, and buildings are amortized over their expected useful lives. The costs of improvements that extend the life of a fixed asset are capitalized, while the cost of repairs and maintenance are expensed as incurred. Land is not depreciated.
(i) | Leases |
The Company and its Affiliates currently lease office space and equipment under various leasing arrangements. As these leases expire, it can be expected that in the normal course of business they will be renewed or replaced. Leases are classified as either capital leases or operating leases, as appropriate. Most lease agreements for office space that are classified as operating leases contain renewal options, rent escalation clauses or other inducements provided by the landlord. Rent expense is accrued to recognize lease escalation provisions and inducements provided by the landlord, if any, on a straight-line basis over the lease term and is reported in Other operating expenses on the Consolidated Statements of Income.
(j) | Equity Method Investments in Affiliates |
For Equity method investments in Affiliates, the Company’s share of the Affiliate’s revenue without regard to expenses or less certain agreed-upon expenses, net of amortization of intangible assets related to the Company’s investment, is included in Income from equity method investments in the Consolidated Statements of Income. The Company’s share of income taxes incurred directly by Affiliates accounted for under the equity method is recorded within Income taxes in the Consolidated Statements of Income because these taxes generally represent the Company’s share of the taxes incurred by Affiliates.
The Company periodically evaluates its equity method investments for impairment. In such impairment evaluations, the Company assesses if the fair value of the investment has declined below its carrying value for a period considered to be other-than-temporary. If the Company determines that a decline in fair value below the carrying value of the investment is other-than-temporary, then the reduction in carrying value would be recorded in Income from equity method investments.
(k) | Acquired Client Relationships and Goodwill |
Each Affiliate in which the Company makes an investment has identifiable assets arising from contractual or other legal rights with their clients (“acquired client relationships”). In determining the value of acquired client relationships, the Company analyzes the net present value of these Affiliates’ existing client relationships based on a number of factors, including: the Affiliate’s historical and potential future operating performance; the Affiliate’s historical and potential future rates of attrition of existing clients; the stability and longevity of existing client relationships; the Affiliate’s recent, as well as long-term, investment performance; the characteristics of the firm’s products and investment styles; the stability and depth of the Affiliate’s management team; and the Affiliate’s history and perceived franchise or brand value.
The Company has determined that certain of its acquired client relationships meet the criteria to be considered indefinite-lived assets because the Company expects both the renewal of these contracts and, therefore, the cash flows generated by these contracts to continue indefinitely. Accordingly, the Company does not amortize these intangible assets, but instead reviews these assets annually or more frequently whenever events or circumstances occur indicating that the recorded indefinite-lived assets may be impaired. Each reporting period, the Company assesses whether events or circumstances have occurred that indicate that the indefinite life criteria are no longer met. If the indefinite life criteria are no longer met, the Company would assess whether the carrying value of the assets exceeds its fair value, an impairment loss would be recorded in an amount equal to any such excess and these assets would be reclassified to definite-lived.
The expected useful lives of definite-lived acquired client relationships are determined based on an analysis of the historical and projected attrition rates of each Affiliate’s existing clients, and other factors that may influence the expected
48
AFFILIATED MANAGERS GROUP, INC.
NOTES TO CONSOLIDATED FINANCIAL STATEMENTS (Continued)
future economic benefit the Company will derive from the relationships. The expected lives of definite-lived acquired client relationships are analyzed annually or more frequently whenever events or circumstances have occurred that indicate the expected useful lives may no longer be appropriate.
The Company tests for the possible impairment of indefinite and definite-lived intangible assets annually or more frequently whenever events or changes in circumstances indicate that the carrying amount of the asset is not recoverable. If such indicators exist, the Company compares the fair value of the asset to the carrying value of the asset. If the carrying value is greater than the fair value, an impairment loss would be recorded in Intangible amortization and impairments in the Consolidated Statements of Income.
Goodwill represents the future economic benefits arising from assets acquired in a business combination that are not individually identified and separately recognized, and is reported within the segments in which the Affiliate operates. Goodwill is not amortized, but is instead reviewed for impairment. The Company assesses goodwill for impairment at least annually, or more frequently whenever events or circumstances occur indicating that the recorded goodwill may be impaired. If the carrying amount of goodwill exceeds the fair value, an impairment loss would be recorded in Intangible amortization and impairments.
(l) | Issuance Costs |
Issuance costs related to the Company’s senior bank debt are amortized over the remaining term of the senior unsecured multicurrency revolving credit facility (the “revolver”) and the senior unsecured term loan facility (the “term loan”). Issuance costs associated with the revolver and term loan are included in Other assets and as a reduction of the related debt balance, respectively, in the Consolidated Balance Sheets. Issuance costs associated with the Company’s senior notes are amortized over the shorter of the period to the first investor put date or the Company’s estimate of the expected term of the security, and are included as a reduction of the related debt balance in the Consolidated Balance Sheets. The expense resulting from the amortization of these issuance costs is reported in Interest expense in the Consolidated Statements of Income.
(m) | Derivative Financial Instruments |
The Company may utilize financial instruments, specifically interest rate derivative contracts to hedge certain interest rate exposures. In entering into these contracts, the Company intends to offset cash flow gains and losses that occur on its existing debt obligations with cash flow gains and losses on the contracts hedging these obligations.
From time to time, the Company’s Affiliates use foreign currency forward contracts to hedge the risk of foreign exchange rate movements. In entering into these contracts, the Affiliates intend to offset cash flow gains and losses on projected foreign currency-denominated revenues and expenses as a result of variability in foreign exchange rates.
The Company records derivatives on the balance sheet at fair value. If the Company’s derivatives qualify as cash flow hedges, the effective portion of the unrealized gain or loss is recorded in Accumulated other comprehensive income as a separate component of stockholders’ equity and reclassified to Investment and other income when the hedged cash flows are recorded in earnings. Hedge effectiveness is generally measured by comparing the present value of the cumulative change in the expected future variable cash flows of the hedged contract with the present value of the cumulative change in the expected future variable cash flows of the hedged item. To the extent that the critical terms of the hedged item and the derivative are not identical, hedge ineffectiveness would be reported in Investment and other income. If the Company’s or its Affiliates’ derivatives do not qualify as cash flow or fair value hedges, changes in the fair value of the derivatives are recognized as a gain or loss in Investment and other income.
(n) | Contingent Payment Arrangements |
The Company periodically enters into contingent payment arrangements in connection with its business combinations. In these arrangements, the Company agrees to pay additional consideration to the sellers to the extent that certain levels of revenue growth or other metrics are achieved. For consolidated Affiliates, the Company estimates the fair value of these potential future obligations at the time a business combination is consummated and records a liability primarily in Other liabilities on its Consolidated Balance Sheet. The Company then accretes the obligation to its expected payment amount over the period until the arrangement is measured. If the Company’s expected payment amount subsequently changes, the obligation is reduced or increased in the current period resulting in a gain or loss, respectively. Both gains and losses resulting from changes to expected payments and the accretion of these obligations to their expected payment amounts are reflected within Imputed interest expense and contingent payment arrangements. For Affiliates accounted for under the equity method of accounting, the Company records a liability when a payment becomes probable in Payables and accrued liabilities, with a corresponding increase to the carrying value of the Affiliate in Equity method investments in Affiliates in the Consolidated Balance Sheets.
49
AFFILIATED MANAGERS GROUP, INC.
NOTES TO CONSOLIDATED FINANCIAL STATEMENTS (Continued)
(o) | Income Taxes |
The Company accounts for income taxes using the asset and liability method, which requires the recognition of deferred tax assets and liabilities for the expected future tax consequences of differences between the financial reporting bases of assets and liabilities and their respective tax bases, using tax rates in effect for the year in which the differences are expected to reverse. The effect on deferred tax assets and liabilities of a change in tax rates is recognized in Income taxes in the Consolidated Statements of Income in the period when the change is enacted.
The Company regularly assesses the recoverability of its deferred income tax assets to determine whether these assets are more-likely-than-not to be realized. In making such a determination, the Company considers all available positive and negative evidence, including future reversals of existing taxable temporary differences, projected future taxable income, tax-planning strategies and results of recent operations. If the Company determines that it would be able to realize its deferred tax assets in the future in excess of their recorded amount, or that the recorded deferred tax assets are not realizable, the Company would adjust the deferred tax asset valuation allowance to record the deferred tax assets at their current value, which would increase or decrease Income taxes, respectively.
The Company records unrecognized tax benefits based on whether it is more-likely-than-not that the uncertain tax positions will be sustained on the basis of the technical merits of the position. If it is determined an uncertain tax position is more-likely-than-not to be sustained, the Company records the largest amount of tax benefit that is more than 50% likely to be realized upon ultimate settlement with the related tax authority in Income taxes. Interest and penalties related to unrecognized tax benefits are also recorded in Income taxes.
(p) | Foreign Currency Translation |
Assets and liabilities whose functional currency is not the U.S. dollar are translated into U.S. dollars using exchange rates in effect as of the balance sheet date. Revenue and expenses are translated into U.S. dollars using average exchange rates for the relevant period. Because of the long-term nature of the Company’s investments in Affiliates, net translation exchange gains and losses resulting from foreign currency translation are recorded in Accumulated comprehensive income as a separate component of stockholders’ equity. Foreign currency transaction gains and losses are reflected in Investment and other income.
(q) | Concentration of Credit Risk |
Financial instruments that potentially subject the Company to significant concentrations of credit risk consist principally of cash investments. The Company maintains cash and cash equivalents, investments and, at times, certain financial instruments with various high credit-quality financial institutions. These financial institutions are typically located in countries in which AMG and its Affiliates operate. For AMG and certain Affiliates, cash deposits at a financial institution may exceed Federal Deposit Insurance Corporation insurance limits.
(r) | Revenue Recognition |
The Company’s revenue primarily represents advisory fees billed by consolidated Affiliates for managing the assets of clients. Asset based advisory fees are recognized as services are rendered and are typically based upon a percentage of the value of a client’s assets under management. Any fees collected in advance are deferred and recognized as income over the period earned. Performance fees are generally assessed as a percentage of the investment performance realized on a client’s account. Performance fees are recognized when they are earned (i.e., when they become billable to customers and are not subject to claw-back) based on the contractual terms of agreements and when collection is reasonably assured. Carried interest is recognized upon the earlier of the termination of the investment product or when the likelihood of claw-back is improbable. Also included in revenue are commissions earned by broker-dealers, and administrative fees for services provided to Affiliate sponsored investment products.
The Company’s Affiliates have contractual arrangements with third parties to provide certain distribution-related services. These third parties are primarily compensated based on the value of client assets over time. Distribution-related revenues are presented in Revenue in the Consolidated Statements of Income gross of any related expenses when the Affiliate is the principal in its role as primary obligor under its sales and distribution arrangements. Distribution-related expenses are presented within Selling, general and administrative expenses in the Consolidated Statements of Income.
(s) | Earnings Per Share |
50
AFFILIATED MANAGERS GROUP, INC.
NOTES TO CONSOLIDATED FINANCIAL STATEMENTS (Continued)
The calculation of basic earnings per share is based on the weighted average number of shares of the Company’s common stock outstanding during the period. Diluted earnings per share is similar to basic earnings per share, but adjusts for the dilutive effect of the potential issuance of incremental shares of the Company’s common stock.
The Company had convertible securities outstanding during the periods presented and is required to apply the if-converted method to these securities in its calculation of diluted earnings per share. Under the if-converted method, shares that are issuable upon conversion are deemed outstanding, regardless of whether the securities are contractually convertible into the Company’s common stock at that time. For this calculation, the interest expense (net of tax) attributable to these dilutive securities is added back to Net income (controlling interest), reflecting the assumption that the securities have been converted. Issuable shares for these securities and related interest expense are excluded from the calculation if an assumed conversion would be anti-dilutive to diluted earnings per share.
(t) | Share-Based Compensation Plans |
The Company recognizes expenses for all share-based payments based on their grant date fair values over the requisite service period. The Company records these expenses only for awards that are expected to vest.
Prior to 2016, the Company reported any tax benefits realized upon the exercise of stock options or vesting of restricted stock that were in excess of the expense recognized for reporting purposes as a financing activity in the Consolidated Statements of Cash Flows. If the tax benefit ultimately realized was greater than or less than the expense recognized, the tax windfall or shortfall was recognized in stockholders’ equity. To the extent the shortfall exceeded the cumulative windfall tax benefits, the excess was recognized in Income taxes.
Beginning in 2016, all tax windfalls or shortfalls are recognized in Income taxes and have been classified as operating activities in the Consolidated Statements of Cash Flows. Taxes paid by the Company when it withholds shares to satisfy tax withholding obligations are classified as a financing activity.
(u) | Segment Information |
Management has assessed and determined that the Company operates in three business segments representing the Company’s three principal distribution channels: Institutional, Mutual Fund and High Net Worth, each of which has different client relationships.
Revenue and Income from equity method investments in the Institutional distribution channel are earned from relationships with public and private client entities, including foundations, endowments, sovereign wealth funds and retirement plans for corporations and municipalities. Revenue and Income from equity method investments in the Mutual Fund distribution channel are earned from advisory or sub-advisory relationships with active return-oriented mutual funds, UCITS and other retail products. Revenue and Income from equity method investments in the High Net Worth distribution channel are earned from relationships with high net worth and ultra-high net worth individuals, families, trusts, foundations, endowments and retirement plans.
In measuring Net income (controlling interest) by segment, the Company’s share of expenses incurred directly at Affiliates and AMG Funds is allocated to a particular segment pro rata to the revenue generated by the Affiliate and AMG Funds in such segment. All other operating and non-operating expenses not incurred directly by an Affiliate or AMG Funds are generally allocated to segments based on the relative contribution to Adjusted EBITDA (controlling interest) of the applicable Affiliate or AMG Funds in each segment.
(v) | Recent Accounting Developments |
Effective January 1, 2016, the Company adopted several updates to accounting standards as follows:
• | ASU 2015-02, Consolidation: Amendments to the Consolidation Analysis (“ASU 2015-02: Consolidation”); |
• | ASU 2015-03, Interest - Imputation of Interest: Simplifying the Presentation of Debt Issuance Costs; |
• | ASU 2015-07, Fair Value Measurement: Disclosures for Investments in Certain Entities that Calculate Net Asset Value per Share (or Its Equivalent); |
• | ASU 2015-16, Business Combinations: Simplifying the Accounting for Measurement-Period Adjustments; and |
• | ASU 2016-09, Stock Compensation: Improvements to Employee Share-Based Payment Accounting. |
The adoption of these updates did not have a significant impact on the Company’s Consolidated Financial Statements.
51
AFFILIATED MANAGERS GROUP, INC.
NOTES TO CONSOLIDATED FINANCIAL STATEMENTS (Continued)
In May 2014, the Financial Accounting Standards Board (the “FASB”) issued ASU 2014-09, Revenue from Contracts with Customers, as amended. The new standard provides a comprehensive model for revenue recognition. The standard is effective for interim and fiscal periods beginning after December 15, 2017. The Company is reviewing its and its Affiliates’ contracts with clients to evaluate the impact of this standard on its Consolidated Financial Statements, but it does not expect the adoption to significantly impact the timing of the recognition of the majority of its Revenue.
In January 2016, the FASB issued ASU 2016-01, Fair Value: Recognition and Measurement of Financial Assets and Liabilities. Under the new standard, all equity investments in unconsolidated entities (other than those accounted for using the equity method of accounting) will generally be measured at fair value through earnings. The standard is effective for interim and fiscal periods beginning after December 15, 2017. The Company is evaluating the impact of this standard on its Consolidated Financial Statements; any impact will be primarily dependent on equity investments in securities held by the Company at the time of adoption.
In February 2016, the FASB issued ASU 2016-02, Leases, which requires lessees to recognize assets and liabilities arising from most operating leases on the statement of financial position. The standard is effective for interim and fiscal periods beginning after December 15, 2018. The Company is evaluating the impact of this standard on its Consolidated Financial Statements.
In March 2016, the FASB issued ASU 2016-07, Investments - Equity Method and Joint Ventures: Simplifying the Transition to the Equity Method of Accounting, which simplifies the equity method of accounting by eliminating the need to apply the equity method retroactively to an investment that subsequently qualifies for such accounting treatment. The standard is effective for interim and fiscal periods beginning after December 15, 2016. The Company does not expect the adoption of this standard to have a significant impact on its Consolidated Financial Statements.
In August 2016, the FASB issued ASU 2016-15, Statement of Cash Flows - Classification of Certain Cash Receipts and Cash Payments, which clarifies how cash receipts and cash payments are classified in the statement of cash flows. The standard is effective for interim and fiscal periods beginning after December 15, 2017. The Company does not expect the adoption of this standard to have a significant impact on its Consolidated Financial Statements.
In January 2017, the FASB issued ASU 2017-01, Clarifying the Definition of a Business, which provides guidance on evaluating whether transactions should be accounted for as acquisitions (or disposals) of assets or businesses. The standard is effective for interim and fiscal periods beginning after December 15, 2017. The Company is evaluating the impact of this standard on its Consolidated Financial Statements.
In January 2017, the FASB issued ASU 2017-04, Intangibles - Goodwill and Other: Simplifying the Accounting for Goodwill Impairment, which simplifies goodwill impairment testing. A goodwill impairment will now be the amount by which a reporting unit’s carrying value exceeds its fair value, not to exceed the carrying amount of goodwill. The standard is effective for interim and fiscal periods beginning after December 15, 2019. The Company is evaluating the impact of this standard on its Consolidated Financial Statements.
2. | Investments in Marketable Securities |
Investments in marketable securities at December 31, 2015 and 2016 were $199.9 million and $122.4 million, respectively. The following is a summary of the cost, gross unrealized gains and losses and fair value of investments classified as available-for-sale and trading:
Available-for-Sale | Trading | |||||||||||||||
December 31, 2015 | December 31, 2016 | December 31, 2015 | December 31, 2016 | |||||||||||||
Cost | $ | 104.7 | $ | 66.1 | $ | 19.8 | $ | 34.4 | ||||||||
Unrealized Gains | 77.6 | 17.6 | 1.9 | 6.6 | ||||||||||||
Unrealized Losses | (1.8 | ) | (1.8 | ) | (2.3 | ) | (0.5 | ) | ||||||||
Fair Value | $ | 180.5 | $ | 81.9 | $ | 19.4 | $ | 40.5 | ||||||||
For the years ended December 31, 2015 and 2016, the Company received proceeds of $18.1 million and $61.1 million, respectively, from the sale of investments classified as available-for-sale and recorded gains of $8.8 million and $19.9 million, respectively. For the years ended December 31, 2015 and 2016, the Company realized gains on the sale of investments classified as trading of $0.8 million and $4.4 million, respectively. For the years ended December 31, 2015 and 2016, the
52
AFFILIATED MANAGERS GROUP, INC.
NOTES TO CONSOLIDATED FINANCIAL STATEMENTS (Continued)
Company realized losses on the sale of investments classified as trading of $0.1 million and $3.4 million, respectively. These gains and losses were recorded in Investment and other income.
3. | Other Investments |
Other investments consist of investments in funds advised by Affiliates that are carried at fair value. The income or loss related to these investments is recorded in Investment and other income.
4. | Variable Interest Entities |
The Company’s consolidated Affiliates act as the investment advisor for certain investment entities that are considered VIEs, and in connection with the adoption of ASU 2015-02: Consolidation, certain investment entities previously accounted for as VIEs no longer met the criteria for being a VIE and certain VREs became VIEs and were either consolidated or disclosed as VIEs.
The Company's Affiliates’ involvement with unconsolidated VIEs is generally limited to that of a service provider, and their investment, if any, represents an insignificant interest in the relevant investment entities’ assets under management. The Company's Affiliates’ exposure to risk in these entities is generally limited to any capital contribution it has made or is required to make and any earned but uncollected asset based and performance fees. The Company has not issued any investment performance guarantees to these VIEs or their investors.
The net assets and liabilities of unconsolidated VIEs and the Company’s maximum risk of loss were as follows:
December 31, 2015 | December 31, 2016 | |||||||||||||||
Unconsolidated VIE Net Assets | Carrying Value and Maximum Risk of Loss | Unconsolidated VIE Net Assets | Carrying Value and Maximum Risk of Loss | |||||||||||||
Sponsored investment funds | $ | 6,688.9 | $ | 1.4 | $ | 1,756.6 | $ | 9.4 | ||||||||
In addition, substantially all of the Company’s consolidated Affiliates are considered VIEs. The unconsolidated assets, net of liabilities and non-controlling interests, of Affiliates accounted for under the equity method of accounting were $1.2 billion and $1.0 billion, as of December 31, 2015 and 2016, respectively. The Company’s carrying value and maximum exposure to loss for these Affiliates was approximately $1.9 billion and $2.8 billion as of December 31, 2015 and 2016, respectively.
5. | Senior Bank Debt |
The Company has a senior unsecured multicurrency revolving credit facility and a senior unsecured term loan facility (together, the “credit facilities”). In 2016, the Company amended the revolver to increase commitments from $1.3 billion to $1.45 billion, and amended the term loan to increase borrowings from $350.0 million to $385.0 million. The credit facilities mature on September 30, 2020.
Subject to certain conditions, the Company may further increase the commitments under the revolver by up to $350.0 million and borrow up to an additional $65.0 million under the term loan. The Company pays interest on any outstanding obligations under the credit facilities at specified rates, based either on the LIBOR rate or the prime rate as in effect from time to time.
As of December 31, 2015 and 2016, the Company had outstanding borrowings under the revolver of $295.0 million and $485.0 million, respectively, and the weighted-average interest rate on outstanding borrowings was 2.52% and 1.88%, respectively. As of December 31, 2015 and 2016, the Company had outstanding borrowings under the term loan of $350.0 million and $385.0 million, respectively, and the weighted-average interest rate on outstanding borrowings was 1.45% and 1.87%, respectively. The Company pays commitment fees on the unused portion of its revolver. For the years ended December 31, 2015 and 2016, these fees amounted to $1.9 million and $1.0 million, respectively.
The credit facilities contain financial covenants with respect to leverage and interest coverage, as well as customary affirmative and negative covenants, including limitations on priority indebtedness, asset dispositions and fundamental corporate changes, and certain customary events of default.
6. | Senior Notes |
53
AFFILIATED MANAGERS GROUP, INC.
NOTES TO CONSOLIDATED FINANCIAL STATEMENTS (Continued)
At December 31, 2016, the Company had three senior notes outstanding, the principal terms of which are summarized below. In 2015, the Company redeemed, canceled and retired all $140.0 million principal amount outstanding of its 5.25% senior unsecured notes due 2022 at a redemption price equal to 100% of the principal amount plus accrued and unpaid interest.
2024 Senior Notes | 2025 Senior Notes | 2042 Senior Notes | ||||||||||
Issue date | February 2014 | February 2015 | August 2012 | |||||||||
Maturity date | February 2024 | August 2025 | August 2042 | |||||||||
Potential Call Date | Any Time (1) | Any Time (1) | August 2017 | |||||||||
Par value (in millions) | $ | 400.0 | $ | 350.0 | $ | 200.0 | ||||||
Call Price | As Defined (1) | As Defined (1) | At Par | |||||||||
Stated coupon | 4.25 | % | 3.50 | % | 6.375 | % | ||||||
Coupon frequency | Semi-annually | Semi-annually | Quarterly | |||||||||
(1) | The 2024 and 2025 senior notes may be redeemed at any time, in whole or in part, at a make-whole redemption price plus accrued and unpaid interest. |
7. | Convertible Securities |
At December 31, 2016, the Company had junior convertible trust preferred securities outstanding (the “junior convertible securities”).
The carrying value and principal amount at maturity of the junior convertible securities were as follows:
__________________________
December 31, 2015 | December 31, 2016 | |||||||||||||||
Carrying Value | Principal Amount at Maturity | Carrying Value | Principal Amount at Maturity | |||||||||||||
Junior convertible securities(1) | $ | 305.2 | $ | 430.8 | $ | 307.5 | $ | 430.8 | ||||||||
(1) | The carrying value is accreted to the principal amount at maturity over a remaining life of 21 years. |
The junior convertible securities bear interest at 5.15% per annum, payable quarterly in cash. Each $50 security is convertible, at any time, into 0.25 shares of the Company’s common stock, which represents a conversion price of $200 per share, subject to customary anti-dilution adjustments. Holders of the junior convertible securities have no rights to put these securities to the Company. Upon conversion, holders will receive cash or shares of the Company’s common stock, or a combination thereof, at the Company’s election. The Company may redeem the junior convertible securities if the closing price of its common stock exceeds $260 per share for 20 trading days in a period of 30 consecutive trading days. The junior convertible securities are considered contingent payment debt instruments under federal income tax regulations, which require the Company to deduct interest in an amount greater than its reported interest expense. These deductions result in annual deferred tax liabilities of $10.2 million. These deferred tax liabilities will be reclassified directly to stockholders’ equity if the Company’s common stock is trading above certain thresholds at the time of the conversion of the securities.
8. | Forward Equity and Equity Distribution Program |
In 2016, the Company entered into an agreement to sell approximately 2.9 million shares of the Company’s common stock at a price of $167.25 per share on a forward basis. During the year, the Company issued 2.7 million shares to settle a portion of this forward equity sale and received proceeds of $440.3 million, and net settled 0.2 million shares for cash at an average share price of $144.59. As of December 31, 2016, no shares remain outstanding under this agreement.
In 2016, the Company entered into equity distribution and forward equity agreements with several major securities firms under which the Company, from time to time, may issue and sell shares of its common stock (immediately or on a forward basis) having an aggregate sales price of up to $500.0 million (the “equity distribution program”). As of December 31, 2016, no sales have occurred under the equity distribution program.
54
AFFILIATED MANAGERS GROUP, INC.
NOTES TO CONSOLIDATED FINANCIAL STATEMENTS (Continued)
9. | Derivative Financial Instruments |
From time to time, the Company seeks to offset its exposure to changing interest rates under its debt financing arrangements and certain of its Affiliates seek to offset their exposure to changing foreign exchange rates by entering into derivative contracts.
For the years ended December 31, 2015 and 2016, the Company’s Affiliates realized $3.2 million and $0.2 million of gains, respectively, and $1.7 million and $1.2 million of losses, respectively, upon the settlement of certain foreign currency forward contracts. Such realized gains and losses are presented in Revenue, Operating expenses or Investment and other income, depending on the risk being hedged. At December 31, 2016, the Company’s Affiliates had unrealized gains and losses related to outstanding foreign currency forward contracts of $0.6 million and $0.5 million, respectively. Such unrealized gains and losses are presented within Accumulated other comprehensive income. There were no foreign currency forward contracts outstanding at December 31, 2015.
10. | Commitments and Contingencies |
From time to time, the Company and its Affiliates may be subject to claims, legal proceedings and other contingencies in the ordinary course of their business activities. Any such matters are subject to various uncertainties, and it is possible that some of these matters may be resolved in a manner unfavorable to the Company or its Affiliates. The Company and its Affiliates establish accruals, as necessary, for matters for which the outcome is probable and the amount of the liability can be reasonably estimated.
Third Avenue Management LLC (“Third Avenue”), one of the Company’s consolidated Affiliates, has been named as a defendant in various legal actions relating to the liquidation and closure of the Third Avenue Focused Credit Fund. The Company has been named as a co-defendant in one of these actions, as a purported control person. In the fourth quarter of 2016, Third Avenue recorded a reserve of $15.0 million in connection with the proposed resolution of all claims, including against the Company, related to the Focused Credit Fund, which is subject to court approvals. The entire amount of the reserve would be funded by Third Avenue and, therefore, the recording of the reserve had no impact on Net income (controlling interest).
The Company has committed to co-invest in certain Affiliate sponsored investment products. As of December 31, 2016, these unfunded commitments were $92.2 million and may be called in future periods. In connection with a past acquisition agreement, the Company is contractually entitled to reimbursement from a prior owner of one of the Company’s Affiliates for $11.8 million of these commitments if they are called.
As of December 31, 2016, Company was contingently liable, upon achievement by certain Affiliates of specified financial targets, to make payments through 2019 of up to $84.9 million associated with its consolidated Affiliates and $312.0 million associated with its equity method Affiliates. The Company expects to make payments of $10.3 million ($3.0 million in 2017) of the $84.9 million related to consolidated Affiliates and no payments related to the Company’s equity method Affiliates.
Affiliate equity interests provide holders with a conditional right to put their interests to the Company over time. See Note 20. In addition, in connection with an investment in an Affiliate accounted for under the equity method, the Company entered into an arrangement with a minority owner of the Affiliate that gives such owner the right to sell a portion of its ownership interest in the Affiliate to the Company annually beginning in 2018. The purchase price of these conditional purchases will be at fair market value on the date of the transaction.
The Company and certain Affiliates operate under regulatory authorities that require that they maintain minimum financial or capital requirements. Management is not aware of any significant violations of such requirements.
11. | Fair Value Measurements |
The following tables summarize the Company’s financial assets and liabilities that are measured at fair value on a recurring basis:
55
AFFILIATED MANAGERS GROUP, INC.
NOTES TO CONSOLIDATED FINANCIAL STATEMENTS (Continued)
Fair Value Measurements | ||||||||||||||||
December 31, 2015 | ||||||||||||||||
Level 1 | Level 2 | Level 3 | ||||||||||||||
Financial Assets | ||||||||||||||||
Cash equivalents | $ | 65.9 | $ | 65.9 | $ | — | $ | — | ||||||||
Investments in marketable securities(1) | ||||||||||||||||
Trading securities | 19.4 | 19.4 | — | — | ||||||||||||
Available-for-sale securities | 180.5 | 180.5 | — | — | ||||||||||||
Other investments(2) | 23.3 | 20.7 | 2.6 | — | ||||||||||||
Financial Liabilities(3) | ||||||||||||||||
Contingent payment arrangements | $ | 10.2 | $ | — | $ | — | $ | 10.2 | ||||||||
Affiliate equity obligations | 62.3 | — | — | 62.3 | ||||||||||||
Fair Value Measurements | ||||||||||||||||
December 31, 2016 | ||||||||||||||||
Level 1 | Level 2 | Level 3 | ||||||||||||||
Financial Assets | ||||||||||||||||
Cash equivalents | $ | 64.1 | $ | 64.1 | $ | — | $ | — | ||||||||
Investments in marketable securities(1) | ||||||||||||||||
Trading securities | 40.5 | 40.5 | — | — | ||||||||||||
Available for sale securities | 81.9 | 81.9 | — | — | ||||||||||||
Other investments(2) | 3.4 | 3.4 | — | — | ||||||||||||
Foreign currency forward contracts(3) | 0.6 | — | 0.6 | — | ||||||||||||
Financial Liabilities(3) | ||||||||||||||||
Contingent payment arrangements | $ | 8.6 | $ | — | $ | — | $ | 8.6 | ||||||||
Affiliate equity obligations | 12.1 | — | — | 12.1 | ||||||||||||
Foreign currency forward contracts | 0.5 | — | 0.5 | — | ||||||||||||
(1) | Principally investments in equity securities. |
(2) | The Company adopted ASU 2015-07 and no longer includes $126.0 million and $144.1 million as of December 31, 2015 and 2016, respectively, of investments in certain entities for which fair value was measured using NAV as a practical expedient. |
(3) | Amounts are presented within Other assets or Other liabilities. |
The following are descriptions of the significant financial assets and liabilities measured at fair value and the fair value methodologies used.
Cash equivalents consist primarily of highly liquid investments in daily redeeming money market funds, without enacted liquidity fees or redemption gates.
Investments in marketable securities consist primarily of investments in publicly traded securities and in funds advised by Affiliates that are valued at NAV. Publicly traded securities valued using unadjusted quoted market prices for identical instruments in active markets are classified as level 1. Publicly traded securities valued using quoted prices for similar instruments in active markets or quoted prices for identical or similar instruments in markets that are not active are classified as level 2.
Other investments consist primarily of funds advised by Affiliates that are valued using NAV. Investments in funds that calculate NAVs are classified as level 1. Investments in funds valued using other inputs that are observable or can be corroborated by observable market data, such as quoted prices for similar instruments in active markets or quoted prices for identical or similar instruments in markets that are not active, are classified as level 2.
56
AFFILIATED MANAGERS GROUP, INC.
NOTES TO CONSOLIDATED FINANCIAL STATEMENTS (Continued)
Contingent payment arrangements represent the present value of the expected future settlement of contingent payment arrangements related to the Company’s investments in consolidated Affiliates. The significant unobservable inputs that are used in the fair value measurement of these obligations are growth and discount rates. Increases in the growth rate result in a higher obligation while an increase in the discount rate results in a lower obligation.
Affiliate equity obligations include agreements to repurchase Affiliate equity. The significant unobservable inputs that are used in the fair value measurement of the agreements to repurchase Affiliate equity are growth and discount rates. Increases in the growth rate result in a higher obligation while an increase in the discount rate results in a lower obligation.
Foreign currency forward contracts use model-derived valuations in which all significant inputs are observable in active markets to determine fair value and are classified as level 2.
It is the Company’s policy to value financial assets or liabilities transferred as of the beginning of the period in which the transfer occurs. There were no significant transfers of financial assets or liabilities from level 1 to level 2 in 2015 or 2016.
Level 3 Financial Liabilities
The following table presents the changes in Level 3 liabilities:
For the Years Ended December 31, | ||||||||||||||||
2015 | 2016 | |||||||||||||||
Contingent Payment Arrangements | Affiliate Equity Obligations | Contingent Payment Arrangements | Affiliate Equity Obligations | |||||||||||||
Balance, beginning of period | $ | 59.3 | $ | 21.5 | $ | 10.2 | $ | 62.3 | ||||||||
Net (gains) losses | (40.9 | ) | (1) | (1.4 | ) | (1.6 | ) | (1) | 3.1 | |||||||
Purchases and issuances | 9.3 | 158.0 | — | 69.1 | ||||||||||||
Settlements and reductions | (17.5 | ) | (115.8 | ) | — | (122.4 | ) | |||||||||
Balance, end of period | $ | 10.2 | $ | 62.3 | $ | 8.6 | $ | 12.1 | ||||||||
Net change in unrealized (gains) losses relating to instruments still held at the reporting date | $ | (40.9 | ) | $ | — | $ | (1.6 | ) | $ | — | ||||||
(1) | Accretion and changes in the expected value of the Company’s contingent payment arrangements are recorded in Imputed interest expense and contingent payment arrangements. |
The following table presents certain quantitative information about the significant unobservable inputs used in valuing the Company’s level 3 financial liabilities:
Quantitative Information about Level 3 Fair Value Measurements | ||||||||||||||||
Valuation Techniques | Unobservable Input | Fair Value at December 31, 2015 | Range at December 31, 2015 | Fair Value at December 31, 2016 | Range at December 31, 2016 | |||||||||||
Contingent payment arrangements | Discounted cash flow | Growth rates | $ | 10.2 | 3% - 8% | $ | 8.6 | 3% - 8% | ||||||||
Discount rates | 15% | 14% - 15% | ||||||||||||||
Affiliate equity obligations | Discounted cash flow | Growth rates | 62.3 | 1% - 9% | 12.1 | 4% - 10% | ||||||||||
Discount rates | 14% - 15% | 15% - 16% | ||||||||||||||
Investments in Certain Entities that Calculate Net Asset Value
The Company uses the NAV of certain investments as their fair value. The NAVs provided by the investees have been derived from the fair values of the underlying assets and liabilities as of the measurement dates. The following table summarizes the nature of these investments and any related liquidity restrictions or other factors that may impact the ultimate value realized:
57
AFFILIATED MANAGERS GROUP, INC.
NOTES TO CONSOLIDATED FINANCIAL STATEMENTS (Continued)
December 31, 2015 | December 31, 2016 | |||||||||||||||
Category of Investment | Fair Value | Unfunded Commitments | Fair Value | Unfunded Commitments | ||||||||||||
Private equity(1) | $ | 126.0 | $ | 76.8 | $ | 137.8 | $ | 92.2 | ||||||||
Other funds(2) | 72.3 | — | 36.8 | — | ||||||||||||
$ | 198.3 | $ | 76.8 | $ | 174.6 | $ | 92.2 | |||||||||
__________________________
(1) | These funds primarily invest in a broad range of private equity funds, as well as make direct investments. Distributions will be received as the underlying assets are liquidated over the life of the funds, which is generally up to 15 years. The fair value of private equity funds is determined using NAV one quarter in arrears (adjusted for current period calls and distributions). |
(2) | These are multi-disciplinary funds that invest across various asset classes and strategies, including long/short equity, credit and real estate. Investments are generally redeemable on a daily, monthly or quarterly basis. |
Other Financial Assets and Liabilities Not Carried at Fair Value
The carrying amount of Receivables and Payables and accrued liabilities approximates fair value because of the short-term nature of these instruments. The carrying value of notes receivable approximates fair value because interest rates and other terms are at market rates. The carrying value of the credit facilities approximates fair value because the debt has variable interest based on selected short-term rates. The following table summarizes the Company’s other financial liabilities not carried at fair value:
December 31, 2015 | December 31, 2016 | |||||||||||||||||
Carrying Value | Fair Value | Carrying Value | Fair Value | Fair Value Hierarchy | ||||||||||||||
Senior notes | $ | 944.6 | $ | 966.3 | $ | 945.1 | $ | 936.0 | Level 2 | |||||||||
Convertible securities | 305.2 | 483.6 | 307.5 | 466.9 | Level 2 | |||||||||||||
12. | Business Combinations |
The Company completed majority investments in Baker Street Advisors, LLC on April 1, 2015 and myCIO Wealth Partners, L.P. on October 1, 2015. The Company’s purchase price allocations used financial models that included assumptions of market performance, net client cash flows and discount rates. The consideration paid (less net tangible assets acquired) will be deductible for U.S. tax purposes over a 15-year life.
The aggregate purchase price allocation for the 2015 investments was as follows:
Total | ||||
Consideration paid | $ | 76.1 | ||
Contingent payment obligations | 9.3 | |||
Non-controlling interests | 33.8 | |||
Enterprise value | $ | 119.2 | ||
Acquired client relationships | $ | 52.5 | ||
Tangible assets, net | 2.4 | |||
Goodwill | 64.3 | |||
$ | 119.2 | |||
58
AFFILIATED MANAGERS GROUP, INC.
NOTES TO CONSOLIDATED FINANCIAL STATEMENTS (Continued)
The excess of the enterprise value over the separately identifiable net assets acquired was recorded as goodwill and the segment allocation was as follows:
Total | |||
Institutional | 14.4 | % | |
Mutual Fund | — | % | |
High Net Worth | 85.6 | % | |
Unaudited pro forma financial results are set forth below, assuming these investments occurred on January 1, 2014 and the Company’s structured partnership interests had been in effect for the entire period.
For the Years Ended December 31, | ||||||||
2014 (Unaudited) | 2015 (Unaudited) | |||||||
Revenue | $ | 2,538.2 | $ | 2,499.4 | ||||
Net income (controlling interest) | 436.3 | 511.4 | ||||||
Earnings per share (basic) | $ | 7.93 | $ | 9.41 | ||||
Earnings per share (diluted) | $ | 7.74 | $ | 9.20 | ||||
The unaudited pro forma financial results are not necessarily indicative of the financial results had the investments been consummated at the beginning of the periods presented, nor are they necessarily indicative of the financial results expected in future periods. The unaudited pro forma financial results do not include the impact of transaction and integration related costs or benefits that may be expected to result from these investments.
The Company’s new investments contributed $15.3 million and $1.3 million to the Company’s Revenue and Net income, respectively, during 2015.
The Company had liabilities to related parties for contingent payment arrangements in connection with certain business combinations. The total payable was $10.2 million and $8.6 million as of December 31, 2015 and 2016, respectively, and was included in Other liabilities. In 2015, the Company made $17.5 million in payments associated with these liabilities. In 2016, no such payments were made. For the years ended December 31, 2015 and 2016, the Company adjusted its estimates of contingent payment obligations and recorded gains attributable to the controlling interest of $44.7 million and $2.8 million, respectively. These amounts are included in Imputed interest expense and contingent payment arrangements.
13. | Goodwill and Acquired Client Relationships |
The following tables present the change in Goodwill and components of Acquired client relationships, net of the Company’s consolidated Affiliates:
Goodwill | ||||||||||||||||
Institutional | Mutual Fund | High Net Worth | Total | |||||||||||||
Balance, as of December 31, 2014 | $ | 1,159.1 | $ | 1,125.3 | $ | 368.4 | $ | 2,652.8 | ||||||||
Goodwill acquired | 9.2 | — | 55.1 | 64.3 | ||||||||||||
Foreign currency translation | (27.0 | ) | (5.8 | ) | (15.9 | ) | (48.7 | ) | ||||||||
Balance, as of December 31, 2015 | $ | 1,141.3 | $ | 1,119.5 | $ | 407.6 | $ | 2,668.4 | ||||||||
Goodwill acquired | — | — | — | — | ||||||||||||
Foreign currency translation | (5.1 | ) | (37.0 | ) | 1.8 | (40.3 | ) | |||||||||
Balance, as of December 31, 2016 | $ | 1,136.2 | $ | 1,082.5 | $ | 409.4 | $ | 2,628.1 | ||||||||
During 2015 and 2016, the Company completed impairment assessments on its goodwill and no impairments were indicated. Only a substantial decline in the fair value of its reporting units would result in an indication of impairment.
59
AFFILIATED MANAGERS GROUP, INC.
NOTES TO CONSOLIDATED FINANCIAL STATEMENTS (Continued)
Acquired Client Relationships | ||||||||||||||||||||
Definite-lived | Indefinite-lived | Total | ||||||||||||||||||
Gross Book Value | Accumulated Amortization | Net Book Value | Net Book Value | Net Book Value | ||||||||||||||||
Balance, as of December 31, 2014 | $ | 1,255.1 | $ | (565.0 | ) | $ | 690.1 | $ | 1,088.3 | $ | 1,778.4 | |||||||||
New Investments | 52.5 | — | 52.5 | — | 52.5 | |||||||||||||||
Intangible amortization and impairments | — | (115.4 | ) | (115.4 | ) | — | (115.4 | ) | ||||||||||||
Foreign currency translation | (5.8 | ) | — | (5.8 | ) | (23.3 | ) | (29.1 | ) | |||||||||||
Balance, as of December 31, 2015 | $ | 1,301.8 | $ | (680.4 | ) | $ | 621.4 | $ | 1,065.0 | $ | 1,686.4 | |||||||||
New Investments | — | — | — | — | — | |||||||||||||||
Intangible amortization and impairments | — | (107.7 | ) | (107.7 | ) | (2.5 | ) | (110.2 | ) | |||||||||||
Foreign currency translation | (11.8 | ) | — | (11.8 | ) | (67.0 | ) | (78.8 | ) | |||||||||||
Balance, as of December 31, 2016 | $ | 1,290.0 | $ | (788.1 | ) | $ | 501.9 | $ | 995.5 | $ | 1,497.4 | |||||||||
Definite-lived acquired client relationships are amortized over their expected useful lives. As of December 31, 2016, these relationships were being amortized over a weighted average life of approximately ten years. The Company recorded amortization expense for these relationships of $115.4 million for the year ended December 31, 2015, as compared to $107.7 million for the year ended December 31, 2016, in Intangible amortization and impairments. Based on relationships existing as of December 31, 2016, the Company estimates that its consolidated annual amortization expense will be approximately $100 million for each of the next five years.
During 2015 and 2016, the Company completed impairment assessments on its definite-lived and indefinite-lived acquired client relationships and no impairments were indicated.
As of December 31, 2016, the fair values of the indefinite-lived intangible assets at two of the Company’s Affiliates, both managers of global equity funds, have recently experienced declines, and further declines in the fair values of these assets could result in future impairments.
14. | Equity Method Investments in Affiliates |
The following table presents the change in Equity method investments in Affiliates:
Total | |||
Balance, December 31, 2014 | $ | 1,783.5 | |
Equity method earnings | 323.2 | ||
Equity method intangible amortization | (34.3 | ) | |
Distributions from equity method investments | (346.1 | ) | |
Consideration for new investments | 223.4 | ||
Foreign currency translation | (4.7 | ) | |
Other(1) | (7.9 | ) | |
Balance, December 31, 2015 | $ | 1,937.1 | |
Equity method earnings | 388.0 | ||
Equity method intangible amortization | (59.2 | ) | |
Distributions from equity method investments | (346.4 | ) | |
Consideration for new investments | 1,361.3 | ||
Foreign currency translation | 8.0 | ||
Other(1) | 79.5 | ||
Balance, December 31, 2016 | $ | 3,368.3 | |
__________________________
60
AFFILIATED MANAGERS GROUP, INC.
NOTES TO CONSOLIDATED FINANCIAL STATEMENTS (Continued)
(1) | Includes incremental basis related to deferred income taxes of $4.3 million and $93.3 million in 2015 and 2016, respectively. |
In 2015, the Company completed minority investments in Abax Investments (Pty) Ltd and Ivory Investment Management, L.P. On January 4, 2016, the Company completed minority investments in Systematica Investments L.P. and Baring Private Equity Asia. The Company completed minority investments in Capula Investment Management LLP and CapeView Capital LLP on July 1, 2016, Partner Fund Management, L.P. on September 30, 2016 and Winton Group Ltd. on October 4, 2016. The purchase price allocations were measured using financial models that include assumptions of expected market performance, net client flows and discount rates. The majority of the consideration paid (less net tangible assets acquired) will be deductible for U.S. tax purposes over a 15-year life.
In 2015, the Company paid $23.3 million to settle a contingent payment related to an equity method Affiliate investment. The payment increased the Company’s carrying value of the Affiliate investment.
A portion of the purchase price attributable to the Company’s equity method Affiliates relates to definite-lived acquired client relationships. As of December 31, 2016, the definite-lived acquired relationships were being amortized over a weighted average life of approximately fourteen years. The Company recorded amortization expense in Income from equity method investments for these relationships of $34.3 million for the year ended December 31, 2015, as compared to $59.2 million for the year ended December 31, 2016. Based on relationships existing as of December 31, 2016, the Company estimates the annual amortization expense attributable to its current equity-method Affiliates to be approximately $80 million for each of the next five years.
As of December 31, 2016, the fair value of one of the Company’s Affiliates, which is a firm with a fundamental value-based investment approach, had recently experienced a decline, and further declines in the fair value of the Affiliate could result in a future impairment.
The following table presents summarized financial information for Affiliates accounted for under the equity method:
For the Years Ended December 31, | ||||||||||||
2014(1)(2) | 2015(1)(2) | 2016(2) | ||||||||||
Revenue | $ | 1,869.3 | $ | 2,217.1 | $ | 2,200.9 | ||||||
Net income | 253.8 | 431.5 | 1,068.9 | |||||||||
December 31, | ||||||||
2015(3) | 2016 | |||||||
Assets | $ | 30,663.4 | $ | 1,915.3 | ||||
Liabilities and Non-controlling interest | 29,434.7 | 862.4 | ||||||
__________________________
(1) | Revenue includes advisory fees for asset management services and net investment income from consolidated investment partnerships. |
(2) | Revenue and Net income reflect investments in new Affiliates for the full-year, regardless of the date of the Company’s investment. |
(3) | Assets consist primarily of investment securities in consolidated investment partnerships, which are generally held by non-controlling interests. |
The Company’s share of undistributed earnings from equity method investments was $134.3 million as of December 31, 2016.
15. | Fixed Assets and Lease Commitments |
Fixed assets consisted of the following:
61
AFFILIATED MANAGERS GROUP, INC.
NOTES TO CONSOLIDATED FINANCIAL STATEMENTS (Continued)
December 31, | ||||||||
2015 | 2016 | |||||||
Building and leasehold improvements | $ | 104.7 | $ | 103.5 | ||||
Software | 45.4 | 52.5 | ||||||
Equipment | 39.9 | 39.5 | ||||||
Furniture and fixtures | 22.4 | 20.8 | ||||||
Land, improvements and other | 18.6 | 17.9 | ||||||
Fixed assets, at cost | 231.0 | 234.2 | ||||||
Accumulated depreciation and amortization | (116.9 | ) | (124.1 | ) | ||||
Fixed assets, net | $ | 114.1 | $ | 110.1 | ||||
The Company and its consolidated Affiliates lease office space and equipment for their operations. At December 31, 2016, the Company’s aggregate future minimum payments for operating leases having initial or non-cancelable lease terms greater than one year were payable as follows:
Required Minimum Payments (1) | ||||
2017 | $ | 37.7 | ||
2018 | 34.7 | |||
2019 | 31.7 | |||
2020 | 30.0 | |||
2021 | 27.4 | |||
Thereafter | 57.4 | |||
__________________________
(1) | The controlling interest portion is $11.5 million through 2017, $11.4 million in 2018, $10.8 million in 2019, $10.0 million in 2020, $9.3 million in 2021 and $29.3 million thereafter. |
Consolidated rent expense for 2014, 2015 and 2016 was $30.5 million, $36.3 million and $35.5 million, respectively.
16. | Payables and Accrued Liabilities |
Payables and accrued liabilities consisted of the following:
December 31, | ||||||||
2015 | 2016 | |||||||
Accrued compensation | $ | 455.0 | $ | 418.5 | ||||
Unsettled fund share payables | 76.6 | 83.2 | ||||||
Accrued income taxes | 67.9 | 87.7 | ||||||
Accrued professional fees | 31.4 | 26.1 | ||||||
Other | 98.5 | 113.8 | ||||||
Payables and accrued liabilities | $ | 729.4 | $ | 729.3 | ||||
17. | Related Party Transactions |
A prior owner of one of the Company’s Affiliates retained an interest in certain of the Affiliate’s private equity investment partnerships. The prior owner’s interest is presented in the Company’s Consolidated Balance Sheets as either a liability in Other liabilities or as Non-controlling interests, depending on the structure of the prior owner’s investments in the partnerships. The total liability was $75.0 million and $67.8 million at December 31, 2015 and 2016, respectively. The total non-controlling interest was $5.1 million and $2.5 million at December 31, 2015 and 2016, respectively.
62
AFFILIATED MANAGERS GROUP, INC.
NOTES TO CONSOLIDATED FINANCIAL STATEMENTS (Continued)
In certain cases, Affiliate management owners and Company officers may serve as trustees or directors of certain mutual funds from which the Affiliate earns advisory fee revenue.
The Company has related party transactions in association with its business combinations, as more fully described in Note 12, as well as Affiliate equity transactions, as more fully described in Notes 20 and 21.
18. | Stockholders’ Equity |
Preferred Stock
The Company is authorized to issue up to 5.0 million shares of Preferred Stock. Any such Preferred Stock issued by the Company may rank prior to common stock as to dividend rights, liquidation preference or both, may have full or limited voting rights and may be convertible into shares of common stock.
Common Stock
The Company is authorized to issue up to 150.0 million shares of Voting Common Stock and 3.0 million shares of Class B Non-Voting Common Stock. As more fully described in Note 8, the Company is party to an equity distribution program under which the Company may sell shares of its common stock.
The Company’s Board of Directors authorized share repurchase programs in January 2017 and May 2015, authorizing the Company to repurchase up to 1.9 million and 3.0 million, respectively, shares of its common stock, which do not expire. In 2016, the Company repurchased 0.2 million shares at an average price per share of $161.16.
The following is a summary of the Company’s recent share repurchase activity:
Period | Shares Repurchased | Average Price | |||||
2014 | 1.2 | $ | 204.72 | ||||
2015 | 1.7 | 209.39 | |||||
2016 | 0.2 | 161.16 | |||||
Financial Instruments
The Company’s junior convertible securities contain an embedded right for holders to receive shares of the Company’s common stock under certain conditions. These arrangements, as well as the equity distribution program, meet the definition of equity and are not required to be accounted for separately as derivative instruments.
19. | Share-Based Compensation |
Share-Based Incentive Plans
The Company has established various plans under which it is authorized to grant restricted stock, restricted stock units, stock options and stock appreciation rights. Compensation payable under these plans is intended to qualify as performance-based compensation within the meaning of Section 162(m) of the Internal Revenue Code. The Company may also grant cash awards that can be notionally invested in one or more specified measurement funds, including the Company’s common stock. Awards granted under the Company’s share-based incentive plans typically participate in any dividends declared, but such amounts are deferred until delivery of the shares and are forfeitable if the requisite service is not satisfied. Dividends may be paid in cash or may be reinvested in the Company’s common stock.
Share-Based Incentive Compensation
The following is a summary of share-based compensation expense:
63
AFFILIATED MANAGERS GROUP, INC.
NOTES TO CONSOLIDATED FINANCIAL STATEMENTS (Continued)
Period | Share-Based Compensation Expense | Tax Benefit | ||||||
2014 | $ | 29.3 | $ | 11.3 | ||||
2015 | 34.2 | 13.2 | ||||||
2016 | 39.2 | 15.1 | ||||||
The excess tax benefit recognized from share-based incentive plans was $44.5 million and $5.1 million during the years ended December 31, 2015 and 2016, respectively. The excess tax benefit for the year ended December 31, 2015 was recorded as an increase to Additional paid-in capital and the excess tax benefit for the year ended December 31, 2016 was recorded as a reduction to Income taxes. The excess tax benefit for the year ended December 31, 2015 was classified as a financing cash flow and the excess tax benefit for the year ended December 31, 2016 was classified as an operating cash flow.
There was $70.6 million and $66.4 million of unrecognized compensation expense related to share-based compensation arrangements as of December 31, 2015 and 2016, respectively. The unrecognized compensation expense at December 31, 2016 will be recognized over a weighted average period of approximately three years (assuming no forfeitures).
Stock Options
The following table summarizes the transactions of the Company’s stock options:
Stock Options | Weighted Average Exercise Price | Weighted Average Remaining Contractual Life (years) | ||||||
Unexercised options outstanding—January 1, 2016 | 1.4 | $ | 96.18 | |||||
Options granted | 0.4 | 122.82 | ||||||
Options exercised | (0.4 | ) | 81.08 | |||||
Options forfeited | (0.0 | ) | 131.91 | |||||
Unexercised options outstanding—December 31, 2016 | 1.4 | 108.53 | 2.8 | |||||
Exercisable at December 31, 2016 | 0.9 | 101.38 | 1.3 | |||||
The Company granted stock options with fair values of $0.6 million, $1.0 million, and $16.4 million in 2014, 2015 and 2016, respectively. Stock options generally vest over a period of three to five years and expire seven to ten years after the grant date. All options have been granted with exercise prices equal to the fair market value of the Company’s common stock on the date of grant.
The Company generally uses treasury stock to settle stock option exercises. The total intrinsic value of options exercised during the years ended December 31, 2014, 2015 and 2016 was $92.6 million, $130.2 million and $27.7 million, respectively. The cash received for options exercised was $57.8 million and $25.6 million during the years ended December 31, 2015 and 2016, respectively. As of December 31, 2016, the intrinsic value of exercisable options outstanding was $43.1 million, and 3.1 million options were available for grant under the Company’s option plans.
The fair value of options granted was estimated using the Black-Scholes option pricing model. The weighted average fair value of options granted during the years ended December 31, 2014, 2015 and 2016 was $60.20, $54.92, and $39.02 per option, respectively, based on the weighted-average grant date assumptions stated below.
For the Years Ended December 31, | ||||||||
2014 | 2015 | 2016 | ||||||
Dividend yield | 0.0 | % | 0.0 | % | 0.0 | % | ||
Expected volatility(1) | 29.7 | % | 26.7 | % | 30.7 | % | ||
Risk-free interest rate(2) | 1.8 | % | 1.5 | % | 1.6 | % | ||
Expected life of options (in years)(3) | 5.0 | 5.0 | 5.7 | |||||
Forfeiture rate(3) | 0.0 | % | 0.0 | % | 0.0 | % | ||
64
AFFILIATED MANAGERS GROUP, INC.
NOTES TO CONSOLIDATED FINANCIAL STATEMENTS (Continued)
(1) | Expected volatility is based on historical and implied volatility. |
(2) | Risk-free interest rate is based on the U.S. Treasury yield curve in effect at the date of grant. |
(3) | Expected life of options (in years) is based on the Company’s historical and expected exercise behavior. |
Restricted Stock
The following table summarizes the transactions of the Company’s restricted stock:
Restricted Stock | Weighted Average Grant Date Value | |||||
Unvested units—January 1, 2016 | 0.6 | $ | 192.04 | |||
Units granted | 0.2 | 122.59 | ||||
Units vested | (0.2 | ) | 181.87 | |||
Units forfeited | (0.0 | ) | 171.51 | |||
Unvested units—December 31, 2016 | 0.6 | 168.84 | ||||
The Company granted awards with fair values of $8.0 million, $50.7 million, and $28.0 million in 2014, 2015 and 2016, respectively. These awards were valued based on the closing price of the Company’s common stock on the date of grant and contain vesting conditions requiring service over a period of four years. In certain circumstances, awards also require certain performance conditions to be satisfied, and the Company may elect to settle the awards in shares of the Company’s common stock or cash.
As of December 31, 2016, the Company had 1.3 million shares available for grant under its plans.
20. | Redeemable Non-Controlling Interests |
Affiliate equity interests provide holders with a ratable portion of ownership in one of the Company’s consolidated Affiliates. Affiliate equity holders generally have a conditional right to put their interests to the Company at certain intervals (between five and fifteen years from the date the equity interest is received or on an annual basis following an Affiliate equity holder’s departure). The current redemption value of the Company’s Affiliate equity interests is presented as Redeemable non-controlling interests on the Consolidated Balance Sheets. Changes in the current redemption value are recorded to Additional paid-in capital. The following table presents the changes in Redeemable non-controlling interests:
December 31, | |||||||
2015 | 2016 | ||||||
Balance, as of January 1 | $ | 645.5 | $ | 612.5 | |||
Repurchases of redeemable Affiliate equity | (161.3 | ) | (69.1 | ) | |||
Transfers from Non-controlling interests | 49.5 | 42.6 | |||||
Changes in redemption value | 81.6 | 71.4 | |||||
Changes attributable to consolidated products | (2.8 | ) | 16.1 | ||||
Balance, as of December 31 | $ | 612.5 | $ | 673.5 | |||
21. | Affiliate Equity |
Affiliate equity interests are allocated income in a manner that is consistent with the structured partnership interests in place at the respective Affiliate. The Company’s Affiliates generally pay quarterly distributions to Affiliate equity holders. Distributions paid to Affiliate equity holders were $569.4 million, $431.4 million and $354.1 million for the years ended December 31, 2014, 2015 and 2016, respectively.
Affiliate equity interests provide the Company a conditional right to call (on an annual basis following an Affiliate equity holder’s departure) and Affiliate equity holders have a conditional right to put their interests at certain intervals (between five
65
AFFILIATED MANAGERS GROUP, INC.
NOTES TO CONSOLIDATED FINANCIAL STATEMENTS (Continued)
and fifteen years from the date the equity interest is received or on an annual basis following an Affiliate equity holder’s departure). Affiliate equity holders are also permitted to sell their equity interests to other individuals or entities in certain cases, subject to the Company's approval or other restrictions. The purchase price of these conditional purchases are generally calculated based upon a multiple of cash flow distributions, which is intended to represent fair value. The Company, at its option, may pay for Affiliate equity purchases in cash, shares of its common stock or other forms of consideration and can consent to the transfer of these interests to other individuals or entities.
The Company periodically issues Affiliate equity interests to and repurchases Affiliate equity interests from its Affiliate equity holders. The amount of cash paid for repurchases was $32.6 million, $130.8 million and $115.8 million for the years ended December 31, 2014, 2015 and 2016, respectively. The total amount of cash received for issuances was $11.0 million, $6.1 million and $11.8 million for the years ended December 31, 2014, 2015 and 2016, respectively.
Sales and repurchases of Affiliate equity generally occur at fair value; however, the Company also grants Affiliate equity to its Affiliate partners, employees and officers as a form of compensation. If the equity is issued for consideration below the fair value of the equity or repurchased for consideration above the fair value of the equity, then such difference is recorded as compensation expense over the requisite service period.
The following is a summary of Affiliate equity expense:
2014 | 2015 | 2016 | |||||||||
Controlling interest | $ | 47.4 | $ | 16.9 | $ | 10.0 | |||||
Non-controlling interest | 37.0 | 51.6 | 31.2 | ||||||||
Total | $ | 84.4 | $ | 68.5 | $ | 41.2 | |||||
The following is a summary of unrecognized Affiliate equity expense:
Unrecognized Affiliate Equity Expense | |||||||||||
Period | Controlling Interest | Remaining Life | Non-Controlling Interest | Remaining Life | |||||||
2014 | $ | 29.5 | 3 years | $ | 41.6 | 6 years | |||||
2015 | 22.4 | 3 years | 51.9 | 5 years | |||||||
2016 | 31.3 | 4 years | 70.7 | 5 years | |||||||
The Company records amounts receivable from and payable to Affiliate equity holders in connection with the transfer of Affiliate equity interests that have not settled at the end of the period. The total receivable was $22.6 million and $22.9 million at December 31, 2015 and 2016, respectively, and was included in Other assets. The total payable was $62.3 million and $12.1 million as of December 31, 2015 and 2016, respectively, and was included in Other liabilities.
Effects of Changes in the Company’s Ownership in Affiliates
The Company periodically acquires interests from, and transfers interests to, Affiliate equity holders. Because these transactions do not result in a change of control, any gain or loss related to these transactions is recorded to Additional paid-in capital, which increases or decreases the controlling interest’s equity. No gain or loss related to these transactions is recognized in the Consolidated Statements of Income or Comprehensive Income.
While the Company presents the current redemption value of Affiliate equity within Redeemable Non-Controlling Interests with changes in the current redemption value increasing or decreasing the controlling interest’s equity over time, the following table discloses the cumulative effect that ownership changes had on the controlling interest’s equity related only to Affiliate equity transactions that settled during the periods:
66
AFFILIATED MANAGERS GROUP, INC.
NOTES TO CONSOLIDATED FINANCIAL STATEMENTS (Continued)
For the Years Ended December 31, | ||||||||||||
2014 | 2015 | 2016 | ||||||||||
Net income (controlling interest) | $ | 433.9 | $ | 509.5 | $ | 472.8 | ||||||
Increase in controlling interest paid-in capital from purchases and sales of Affiliate equity issuances | 4.1 | 0.9 | 1.6 | |||||||||
Decrease in controlling interest paid-in capital related to Affiliate equity repurchases | (33.2 | ) | (87.6 | ) | (38.0 | ) | ||||||
Net income attributable to controlling interest and transfers (to) or from Non-controlling interests | $ | 404.8 | $ | 422.8 | $ | 436.4 | ||||||
22. | Benefit Plans |
The Company has three defined contribution plans consisting of a qualified employee profit-sharing plan covering substantially all of its full-time employees and several of its Affiliates, and non-qualified plans for certain senior employees. AMG’s other Affiliates generally have separate defined contribution retirement plans. Under each of the qualified plans, AMG and each participating Affiliate, as the case may be, are able to make discretionary contributions for the benefit of qualified plan participants up to Internal Revenue Service limits.
The Company has a Deferred Compensation Plan that provides officers and directors of the Company the opportunity to voluntarily defer base salary, bonus payments and director fees, as applicable, on a pre-tax basis, and invest such deferred amounts in one or more specified measurement funds. While the Company has no obligation to do so, the Deferred Compensation Plan also provides the Company the opportunity to make discretionary contributions; in the event any such contributions are made, contributed amounts will be subject to vesting and forfeiture provisions.
Consolidated expenses related to the Company’s benefit plans in 2014, 2015 and 2016 were $17.2 million, $18.7 million and $18.9 million, respectively.
23. | Income Taxes |
The consolidated income tax provision includes taxes attributable to the controlling interest and, to a lesser extent, taxes attributable to non-controlling interests is as follows:
For the Years Ended December 31, | ||||||||||||
2014 | 2015 | 2016 | ||||||||||
Controlling interests: | ||||||||||||
Current tax | $ | 149.8 | $ | 152.4 | $ | 168.1 | ||||||
Intangible-related deferred taxes | 47.8 | 77.7 | 84.3 | |||||||||
Other deferred taxes | 34.0 | 27.7 | (23.2 | ) | ||||||||
Total controlling interests | 231.6 | 257.8 | 229.2 | |||||||||
Non-controlling interests: | ||||||||||||
Current tax | $ | 15.3 | $ | 9.8 | $ | 8.2 | ||||||
Deferred taxes | (0.8 | ) | (4.2 | ) | (1.8 | ) | ||||||
Total non-controlling interests | 14.5 | 5.6 | 6.4 | |||||||||
Provision for income taxes | $ | 246.1 | $ | 263.4 | $ | 235.6 | ||||||
Income before income taxes (controlling interest) | $ | 665.5 | $ | 767.3 | $ | 702.0 | ||||||
Effective tax rate attributable to controlling interests(1) | 34.8 | % | 33.6 | % | 32.6 | % | ||||||
__________________________
(1) | Taxes attributable to the controlling interest divided by Income before income taxes (controlling interest). |
The consolidated provision for income taxes consisted of the following:
67
AFFILIATED MANAGERS GROUP, INC.
NOTES TO CONSOLIDATED FINANCIAL STATEMENTS (Continued)
For the Years Ended December 31, | ||||||||||||
2014 | 2015 | 2016 | ||||||||||
Current: | ||||||||||||
Federal | $ | 93.8 | $ | 106.3 | $ | 103.4 | ||||||
State | 27.1 | 18.3 | 22.9 | |||||||||
Foreign | 44.2 | 37.6 | 50.0 | |||||||||
Total current | 165.1 | 162.2 | 176.3 | |||||||||
Deferred: | ||||||||||||
Federal | 89.0 | 103.8 | 62.3 | |||||||||
State | 2.8 | 14.8 | 10.0 | |||||||||
Foreign | (10.8 | ) | (17.4 | ) | (13.0 | ) | ||||||
Total deferred | 81.0 | 101.2 | 59.3 | |||||||||
Provision for income taxes | $ | 246.1 | $ | 263.4 | $ | 235.6 | ||||||
For financial reporting purposes, Income before income taxes consisted of the following:
For the Years Ended December 31, | ||||||||||||
2014 | 2015 | 2016 | ||||||||||
Domestic | $ | 784.1 | $ | 827.6 | $ | 688.1 | ||||||
International | 229.5 | 263.0 | 286.5 | |||||||||
$ | 1,013.6 | $ | 1,090.6 | $ | 974.6 | |||||||
The following table reconciles the U.S. federal statutory tax rate to the Company’s effective tax rate:
For the Years Ended December 31, | ||||||||
2014 | 2015 | 2016 | ||||||
Statutory U.S. federal tax rate | 35.0 | % | 35.0 | % | 35.0 | % | ||
State income taxes, net of federal benefit | 2.3 | 2.6 | 2.9 | |||||
Effect of foreign operations(1) | (5.3 | ) | (3.5 | ) | (4.6 | ) | ||
Equity Compensation | 2.5 | 0.8 | (0.4 | ) | ||||
Effect of changes in tax law, rates(2) | — | (0.8 | ) | (0.3 | ) | |||
Other | 0.3 | (0.5 | ) | — | ||||
Effective tax rate (controlling interest) | 34.8 | % | 33.6 | % | 32.6 | % | ||
Effect of income from non-controlling interests | (9.6 | ) | (9.2 | ) | (8.4 | ) | ||
Effective tax rate | 25.2 | % | 24.4 | % | 24.2 | % | ||
(1) | Effect of foreign operations includes the effect of undistributed foreign earnings the Company deems indefinitely reinvested in foreign operations, and the effect of differences in the financial reporting basis over tax basis in the Company’s investments in foreign subsidiaries considered permanent in duration. |
(2) | Effect of changes in tax law, rates reflects the impact of the reduction in the UK tax rates in years 2015 and 2016. |
Deferred income taxes reflect the expected future tax consequences of temporary differences between the financial reporting basis and tax basis of the Company’s assets and liabilities. The significant components of the Company’s deferred income taxes are as follows:
68
AFFILIATED MANAGERS GROUP, INC.
NOTES TO CONSOLIDATED FINANCIAL STATEMENTS (Continued)
December 31, | ||||||||
2015 | 2016 | |||||||
Deferred Tax Assets | ||||||||
Deferred compensation | $ | 30.5 | $ | 34.1 | ||||
State net operating loss carryforwards | 17.1 | 17.4 | ||||||
Foreign loss carryforwards | 12.3 | 14.6 | ||||||
Tax benefit of uncertain tax positions | 14.6 | 12.1 | ||||||
Foreign tax credits | — | 10.0 | ||||||
Accrued expenses | 4.4 | 3.9 | ||||||
Total deferred tax assets | 78.9 | 92.1 | ||||||
Valuation allowance | (20.5 | ) | (22.1 | ) | ||||
Deferred tax assets, net of valuation allowance | $ | 58.4 | $ | 70.0 | ||||
Deferred Tax Liabilities | ||||||||
Intangible asset amortization | $ | (320.2 | ) | $ | (396.8 | ) | ||
Non-deductible intangible amortization | (109.8 | ) | (177.0 | ) | ||||
Convertible securities interest | (99.8 | ) | (109.0 | ) | ||||
Deferred income | (92.8 | ) | (47.2 | ) | ||||
Other | (1.5 | ) | (0.8 | ) | ||||
Total deferred tax liabilities | (624.1 | ) | (730.8 | ) | ||||
Net deferred tax liability | $ | (565.7 | ) | $ | (660.8 | ) | ||
At December 31, 2016, the Company had available state net operating loss carryforwards of $489.7 million, which will expire over a 19-year period. At December 31, 2016, the Company had foreign loss carryforwards of $55.1 million, of which $47.7 million will expire over a 20-year period and the balance will carry forward indefinitely. At December 31, 2016, the Company had foreign tax credits of $10.0 million, which will expire in 2026.
The Company believes that it is more-likely-than-not that the benefit from a portion of the state and foreign loss carryforwards will not be realized and has, therefore, recorded a valuation allowance of $22.1 million on the deferred tax assets related to these state and foreign loss carryforwards. For the years ended December 31, 2015 and 2016, the Company increased its valuation allowance $2.1 million and $1.6 million, respectively, related to an increase in the loss carryforwards that are not expected to be realized.
The Company does not provide for U.S. income taxes on the excess of the financial reporting basis over tax basis in the Company’s investments in foreign subsidiaries considered permanent in duration. Such amount would generally become taxable upon the repatriation of assets from, or a sale or liquidation of, the subsidiaries. As of December 31, 2016, the amount of such difference was $222.9 million. The Company also considers certain undistributed earnings of a foreign subsidiary to be indefinitely reinvested and, accordingly, has not provided U.S. income taxes on these earnings. As of December 31, 2016, the cumulative amount of indefinitely reinvested foreign earnings was $65.0 million. Determination of the potential amount of unrecognized deferred U.S. income tax liability related to these amounts is not practicable because of the numerous assumptions associated with this hypothetical calculation. However, foreign tax credits would be available to reduce some portion of the deferred U.S. income tax liability.
A reconciliation of the changes in unrecognized tax benefits is as follows:
69
AFFILIATED MANAGERS GROUP, INC.
NOTES TO CONSOLIDATED FINANCIAL STATEMENTS (Continued)
For the Years Ended December 31, | ||||||||||||
2014 | 2015 | 2016 | ||||||||||
Balance, as of January 1 | $ | 20.4 | $ | 28.8 | $ | 26.9 | ||||||
Additions based on current year tax positions | 2.6 | 2.2 | 3.8 | |||||||||
Additions based on prior years’ tax positions | 10.8 | 1.6 | 0.6 | |||||||||
Reductions related to lapses of statutes of limitations | (4.1 | ) | (4.3 | ) | (4.7 | ) | ||||||
Additions (reductions) related to foreign exchange rates | (0.9 | ) | (1.4 | ) | 0.2 | |||||||
Balance, as of December 31 | $ | 28.8 | $ | 26.9 | $ | 26.8 | ||||||
Included in the balance of unrecognized tax benefits at December 31, 2014, 2015 and 2016 are $26.4 million, $25.3 million, and $26.0 million, respectively, of tax benefits that, if recognized, would favorably affect the Company’s effective tax rate.
The Company records accrued interest and penalties, if any, related to unrecognized tax benefits in Income taxes. The Company had $1.6 million, $1.8 million and $1.4 million in interest related to unrecognized tax benefits accrued at December 31, 2014, 2015 and 2016, respectively, which are included in the table above. For the years ended December 31, 2014, 2015 and 2016, no significant interest or penalties were recorded in Income taxes.
The Company is subject to U.S. federal, state and local, and foreign income tax in multiple jurisdictions. The Company is also periodically subject to tax examinations in these jurisdictions. The completion of examinations may result in the payment of additional taxes and/or the recognition of tax benefits. The Company is generally no longer subject to income tax examinations by U.S. federal, state and local, or foreign taxing authorities for periods prior to 2011.
The Company does not expect any significant changes to its liability for tax benefits during the next twelve months.
24. | Earnings Per Share |
The following is a reconciliation of the numerator and denominator used in the calculation of basic and diluted earnings per share available to common stockholders:
For the Years Ended December 31, | ||||||||||||
2014 | 2015 | 2016 | ||||||||||
Numerator | ||||||||||||
Net income (controlling interest) | $ | 433.9 | $ | 509.5 | $ | 472.8 | ||||||
Interest expense on convertible securities, net of taxes | 15.2 | 15.3 | 15.5 | |||||||||
Net income (controlling interest), as adjusted | $ | 449.1 | $ | 524.8 | $ | 488.3 | ||||||
Denominator | ||||||||||||
Average shares outstanding (basic) | 55.0 | 54.3 | 54.2 | |||||||||
Effect of dilutive instruments: | ||||||||||||
Stock options and restricted stock | 1.2 | 0.7 | 0.6 | |||||||||
Forward sale agreement | 0.0 | — | — | |||||||||
Junior convertible securities | 2.2 | 2.2 | 2.2 | |||||||||
Average shares outstanding (diluted) | 58.4 | 57.2 | 57.0 | |||||||||
Average shares outstanding (diluted) in the table above exclude the anti-dilutive effect of the following shares:
For the Years Ended December 31, | ||||||||
2014 | 2015 | 2016 | ||||||
Stock options and restricted stock units | 0.0 | 0.0 | 0.6 | |||||
Junior convertible securities | 0.4 | — | — | |||||
70
AFFILIATED MANAGERS GROUP, INC.
NOTES TO CONSOLIDATED FINANCIAL STATEMENTS (Continued)
As discussed further in Note 21, the Company may settle portions of its Affiliate equity purchases in shares of its common stock. Because it is the Company’s intent to settle these potential repurchases in cash, the calculation of diluted earnings per share excludes any potential dilutive effect from possible share settlements.
25. | Comprehensive Income |
The following tables show the tax effects allocated to each component of Other comprehensive income:
For the Year Ended December 31, 2014 | ||||||||||||
Pre-Tax | Tax Benefit (Expense) | Net of Tax | ||||||||||
Foreign currency translation gain (loss) | $ | (62.0 | ) | $ | — | $ | (62.0 | ) | ||||
Change in net realized and unrealized gain (loss) on derivative securities | 0.6 | (0.3 | ) | 0.3 | ||||||||
Change in net unrealized gain (loss) on investment securities | 5.6 | (2.2 | ) | 3.4 | ||||||||
Other comprehensive income (loss) | $ | (55.8 | ) | $ | (2.5 | ) | $ | (58.3 | ) | |||
For the Year Ended December 31, 2015 | ||||||||||||
Pre-Tax | Tax Benefit (Expense) | Net of Tax | ||||||||||
Foreign currency translation gain (loss) | $ | (93.2 | ) | $ | — | $ | (93.2 | ) | ||||
Change in net realized and unrealized gain (loss) on derivative securities | 2.3 | (0.4 | ) | 1.9 | ||||||||
Change in net unrealized gain (loss) on investment securities | 34.8 | (12.7 | ) | 22.1 | ||||||||
Other comprehensive income (loss) | $ | (56.1 | ) | $ | (13.1 | ) | $ | (69.2 | ) | |||
For the Year Ended December 31, 2016 | ||||||||||||
Pre-Tax | Tax Benefit (Expense) | Net of Tax | ||||||||||
Foreign currency translation gain (loss) | $ | (115.3 | ) | $ | — | $ | (115.3 | ) | ||||
Change in net realized and unrealized gain (loss) on derivative securities | 0.3 | (0.2 | ) | 0.1 | ||||||||
Change in net unrealized gain (loss) on investment securities | (58.3 | ) | 23.1 | (35.2 | ) | |||||||
Other comprehensive income (loss) | $ | (173.3 | ) | $ | 22.9 | $ | (150.4 | ) | ||||
The components of accumulated other comprehensive income (loss), net of taxes, were as follows:
Foreign Currency Translation Adjustment | Realized and Unrealized Losses on Derivative Securities | Unrealized Gain (Loss) on Investment Securities (1) | Total | |||||||||||||
Balance, as of December 31, 2014 | $ | (5.4 | ) | $ | (1.6 | ) | $ | 22.9 | $ | 15.9 | ||||||
Other comprehensive income (loss) before reclassifications | (93.2 | ) | 0.8 | 13.5 | (78.9 | ) | ||||||||||
Amounts reclassified from other comprehensive income | — | 1.1 | 8.6 | 9.7 | ||||||||||||
Net other comprehensive income (loss) | (93.2 | ) | 1.9 | 22.1 | (69.2 | ) | ||||||||||
Balance, as of December 31, 2015 | $ | (98.6 | ) | $ | 0.3 | $ | 45.0 | $ | (53.3 | ) | ||||||
Other comprehensive income (loss) before reclassifications | (115.3 | ) | (1.0 | ) | (22.5 | ) | (138.8 | ) | ||||||||
Amounts reclassified from other comprehensive income | — | 1.1 | (12.7 | ) | (11.6 | ) | ||||||||||
Net other comprehensive income (loss) | (115.3 | ) | 0.1 | (35.2 | ) | (150.4 | ) | |||||||||
Balance, as of December 31, 2016 | $ | (213.9 | ) | $ | 0.4 | $ | 9.8 | $ | (203.7 | ) | ||||||
(1) | See Note 2 for amounts reclassified from Other comprehensive income. |
71
AFFILIATED MANAGERS GROUP, INC.
NOTES TO CONSOLIDATED FINANCIAL STATEMENTS (Continued)
26. | Selected Quarterly Financial Data (Unaudited) |
The following is a summary of the quarterly results of operations of the Company for the years ended December 31, 2015 and 2016.
2015 | ||||||||||||||||
First Quarter | Second Quarter | Third Quarter | Fourth Quarter | |||||||||||||
Revenue | $ | 635.0 | $ | 646.6 | $ | 613.1 | $ | 589.8 | ||||||||
Operating income | 231.4 | 195.2 | 215.2 | 193.2 | ||||||||||||
Income before income taxes | 290.3 | 262.0 | 249.1 | 289.2 | ||||||||||||
Net income (controlling interest) | 126.7 | 127.6 | 107.7 | 147.5 | ||||||||||||
Earnings per share (diluted) | $ | 2.26 | $ | 2.29 | $ | 1.96 | $ | 2.67 | ||||||||
2016 | ||||||||||||||||
First Quarter | Second Quarter | Third Quarter | Fourth Quarter | |||||||||||||
Revenue | $ | 545.4 | $ | 554.1 | $ | 544.7 | $ | 550.3 | ||||||||
Operating income | 178.8 | 181.8 | 171.0 | 173.8 | ||||||||||||
Income before income taxes | 230.5 | 235.9 | 226.2 | 281.9 | ||||||||||||
Net income (controlling interest) | 104.0 | 108.3 | 110.2 | 150.2 | ||||||||||||
Earnings per share (diluted) | $ | 1.90 | $ | 1.98 | $ | 2.02 | $ | 2.67 | ||||||||
27. | Segment and Geographic Information |
Management has assessed and determined that the Company operates in three business segments representing the Company’s three principal distribution channels: Institutional, Mutual Fund and High Net Worth, each of which has different client relationships. The following table summarizes the Company’s financial results for each of the distribution channels:
As of and for the Year Ended December 31, 2014 | ||||||||||||||||
Institutional | Mutual Fund | High Net Worth | Total | |||||||||||||
Revenue | $ | 1,022.8 | $ | 1,242.6 | $ | 245.5 | $ | 2,510.9 | ||||||||
Net income (controlling interest) | 217.9 | 172.9 | 43.1 | 433.9 | ||||||||||||
Total assets | 3,731.4 | 3,077.5 | 874.6 | 7,683.5 | ||||||||||||
Goodwill | 1,159.1 | 1,125.3 | 368.4 | 2,652.8 | ||||||||||||
Equity method investments in Affiliates | 1,533.8 | 150.3 | 99.4 | 1,783.5 | ||||||||||||
As of and for the Year Ended December 31, 2015 | ||||||||||||||||
Institutional | Mutual Fund | High Net Worth | Total | |||||||||||||
Revenue | $ | 979.4 | $ | 1,238.2 | $ | 266.9 | $ | 2,484.5 | ||||||||
Net income (controlling interest) | 226.4 | 226.8 | 56.3 | 509.5 | ||||||||||||
Total assets | 3,717.1 | 3,070.5 | 981.8 | 7,769.4 | ||||||||||||
Goodwill | 1,141.3 | 1,119.5 | 407.6 | 2,668.4 | ||||||||||||
Equity method investments in Affiliates | 1,609.3 | 185.7 | 142.1 | 1,937.1 | ||||||||||||
72
AFFILIATED MANAGERS GROUP, INC.
NOTES TO CONSOLIDATED FINANCIAL STATEMENTS (Continued)
As of and for the Year Ended December 31, 2016 | ||||||||||||||||
Institutional | Mutual Fund | High Net Worth | Total | |||||||||||||
Revenue | $ | 878.5 | $ | 1,036.0 | $ | 280.1 | $ | 2,194.6 | ||||||||
Net income (controlling interest) | 246.7 | 177.8 | 48.3 | 472.8 | ||||||||||||
Total assets | 4,386.4 | 3,360.4 | 1,002.3 | 8,749.1 | ||||||||||||
Goodwill | 1,136.2 | 1,082.5 | 409.4 | 2,628.1 | ||||||||||||
Equity method investments in Affiliates | 2,796.9 | 412.2 | 159.2 | 3,368.3 | ||||||||||||
The following table presents Revenue and Fixed Assets, net of the Company by geographic location. Revenue by geographic location is primarily based on the location of an Affiliate.
For the Years Ended December 31, | |||||||||||
2014 | 2015 | 2016 | |||||||||
Revenue | |||||||||||
United States | $ | 1,731.5 | $ | 1,657.2 | $ | 1,477.5 | |||||
United Kingdom | 567.1 | 645.3 | 566.4 | ||||||||
Other | 212.3 | 182.0 | 150.7 | ||||||||
Total | $ | 2,510.9 | $ | 2,484.5 | $ | 2,194.6 | |||||
December 31, | |||||||||||
2014 | 2015 | 2016 | |||||||||
Fixed Assets, net | |||||||||||
United States | $ | 80.2 | $ | 98.6 | $ | 97.3 | |||||
United Kingdom | 11.9 | 12.3 | 9.9 | ||||||||
Other | 3.3 | 3.2 | 2.9 | ||||||||
Total | $ | 95.4 | $ | 114.1 | $ | 110.1 | |||||
28. | Subsequent Events |
On January 5, 2017, the Company completed a minority investment in Forbes Family Trust.
On January 30, 2017, the Company announced the initiation of a quarterly cash dividend program, and declared a $0.20 per share dividend, paid on February 23, 2017 to all holders of record of the Company’s common stock as of February 9, 2017.
As of February 21, 2017, the Company had repurchased 0.4 million shares of common stock, at an average share price of $159.91 in 2017.
73
Schedule II
Valuation and Qualifying Accounts
(in millions) | Balance Beginning of Period | Additions Charged to Costs and Expenses | Additions Charged to Other Accounts | Deductions | Balance End of Period | |||||||||||||||
Income Tax Valuation Allowance | ||||||||||||||||||||
Year Ending December 31, | ||||||||||||||||||||
2016 | $ | 20.5 | $ | 1.3 | $ | 0.3 | $ | — | $ | 22.1 | ||||||||||
2015 | 18.4 | 2.1 | — | — | 20.5 | |||||||||||||||
2014 | 36.6 | — | — | 18.2 | 18.4 | |||||||||||||||
Other Allowances(1) | ||||||||||||||||||||
Year Ending December 31, | ||||||||||||||||||||
2016 | $ | 10.6 | $ | 5.0 | $ | — | $ | 5.3 | $ | 10.3 | ||||||||||
2015 | 12.1 | 0.7 | — | 2.2 | 10.6 | |||||||||||||||
2014 | 8.8 | 4.7 | — | 1.4 | 12.1 | |||||||||||||||
(1) | Other Allowances represented reserves on notes received in connection with transfers of our interests in certain Affiliates as well as other receivable amounts, which we considered uncollectible. |
74
Item 9. | Changes in and Disagreements with Accountants on Accounting and Financial Disclosure |
None.
Item 9A. | Controls and Procedures |
As required by Rule 13a-15 under the Exchange Act, as of December 31, 2016, we carried out an evaluation under the supervision and with the participation of our management, including our Chief Executive Officer and Chief Financial Officer, of the effectiveness of the design and operation of our disclosure controls and procedures. Based upon that evaluation, the Chief Executive Officer and Chief Financial Officer concluded, as of the end of the period covered by this report, that our disclosure controls and procedures are effective to ensure that (i) information required to be disclosed by us in the reports we file or submit under the Exchange Act is recorded, processed, summarized and reported within the time periods specified in the Securities and Exchange Commission’s rules and forms, and (ii) such information is accumulated and communicated to our management, including our principal executive officer and principal financial officers as appropriate to allow timely decisions regarding required disclosure. In designing and evaluating our disclosure controls and procedures, we and our management recognize that any controls and procedures, no matter how well designed and operated, can provide only reasonable assurance of achieving the desired control objectives, and our management necessarily was required to apply its judgment in evaluating and implementing possible controls and procedures. Our disclosure controls and procedures are designed to provide reasonable assurance of achieving their stated objectives and our principal executive officer and principal financial officers concluded that our disclosure controls and procedures are effective at the reasonable assurance level. We review on an ongoing basis and document our disclosure controls and procedures, and our internal control over financial reporting, and we may from time to time make changes in an effort to enhance their effectiveness and ensure that our systems evolve with our business. See Item 8 for “Management’s Report on Internal Control over Financial Reporting,” which is incorporated by reference herein.
Our independent registered public accounting firm, PricewaterhouseCoopers LLP, has issued an attestation report on our internal control over financial reporting, which is included in Item 8.
No change in our internal control over financial reporting (as defined in Rules 13a-15(f) and 15d-15(f) under the Exchange Act) occurred during the fiscal quarter ended December 31, 2016 that has materially affected, or is reasonably likely to materially affect, our internal control over financial reporting.
Item 9B. | Other Information |
None.
75
PART III
Item 10. | Directors, Executive Officers and Corporate Governance |
Information required by this Item will be set forth in our proxy statement for our 2017 Annual Meeting of shareholders (to be filed within 120 days after December 31, 2016) (the “Proxy Statement”), and is incorporated herein by reference.
Item 11. | Executive Compensation |
Information required by this Item will be set forth in our Proxy Statement, and is incorporated herein by reference.
Item 12. | Security Ownership of Certain Beneficial Owners and Management and Related Stockholder Matters |
Information required by this Item will be set forth in our Proxy Statement, and is incorporated herein by reference.
Item 13. | Certain Relationships and Related Transactions and Director Independence |
Information required by this Item will be set forth in our Proxy Statement, and is incorporated herein by reference.
Item 14. | Principal Accountant Fees and Services |
Information required by this Item will be set forth in our Proxy Statement, and is incorporated herein by reference.
76
PART IV
Item 15. | Exhibits, Financial Statement Schedules |
(a) | (1) Financial Statements: See Item 8 of this Annual Report on Form 10-K. |
(2) Financial Statement Schedule: See Item 8 of this Annual Report on Form 10-K.
(3) Exhibits: See the Exhibit Index attached hereto and incorporated by reference herein.
Item 16. | Form 10-K Summary |
None.
77
SIGNATURES
Pursuant to the requirements of Section 13 or 15(d) of the Securities Exchange Act of 1934, the registrant has duly caused this report to be signed on its behalf by the undersigned, thereunto duly authorized.
AFFILIATED MANAGERS GROUP, INC. (Registrant) | ||||
Date: February 24, 2017 | By: | /s/ SEAN M. HEALEY | ||
Sean M. Healey Chief Executive Officer and Chairman of the Board of Directors | ||||
Pursuant to the requirements of the Securities Exchange Act of 1934, this report has been signed below by the following persons on behalf of the registrant and in the capacities and on the dates indicated.
Signature | Title | Date | ||
/s/ SEAN M. HEALEY | Chief Executive Officer and Chairman of the Board of Directors (Principal Executive Officer) | February 24, 2017 | ||
Sean M. Healey | ||||
/s/ JAY C. HORGEN | Chief Financial Officer and Treasurer (Principal Financial and Principal Accounting Officer) | February 24, 2017 | ||
Jay C. Horgen | ||||
/s/ SAMUEL T. BYRNE | Director | February 24, 2017 | ||
Samuel T. Byrne | ||||
/s/ DWIGHT D. CHURCHILL | Director | February 24, 2017 | ||
Dwight D. Churchill | ||||
/s/ GLENN EARLE | Director | February 24, 2017 | ||
Glenn Earle | ||||
/s/ NIALL FERGUSON | Director | February 24, 2017 | ||
Niall Ferguson | ||||
/s/ TRACY P. PALANDJIAN | Director | February 24, 2017 | ||
Tracy P. Palandjian | ||||
/s/ PATRICK T. RYAN | Director | February 24, 2017 | ||
Patrick T. Ryan | ||||
/s/ JIDE J. ZEITLIN | Director | February 24, 2017 | ||
Jide J. Zeitlin | ||||
78
Exhibit Index
3.1 | Amended and Restated Certificate of Incorporation(1) | |
3.2 | Amendment to Amended and Restated Certificate of Incorporation(2) | |
3.3 | Amendment to Amended and Restated Certificate of Incorporation(3) | |
3.4 | Amended and Restated By-laws(4) | |
4.1 | Specimen certificate for shares of common stock of the Registrant(1) | |
4.2 | Amended and Restated Declaration of Trust of AMG Capital Trust II, dated as of October 17, 2007, by and among Affiliated Managers Group, Inc., U.S. Bank National Association, successor in interest to Bank of America National Trust Delaware, successor by merger to LaSalle National Trust Delaware, as Delaware Trustee, U.S. Bank National Association, successor in interest to Bank of America, N.A., successor by merger to LaSalle Bank National Association, as Property Trustee and Institutional Administrator, and the holders from time to time of undivided beneficial interests in the assets of AMG Capital Trust II(5) | |
4.3 | Indenture, dated as of October 17, 2007, by and between Affiliated Managers Group, Inc. and U.S. Bank National Association, successor in interest to Bank of America, N.A., successor by merger to LaSalle Bank National Association, as Debenture Trustee(5) | |
4.4 | First Supplemental Indenture, dated as of January 10, 2014, by and between Affiliated Managers Group, Inc. and U.S. Bank National Association, successor in interest to Bank of America, N.A., successor by merger to LaSalle Bank National Association, as Debenture Trustee(6) | |
4.5 | Guarantee Agreement, dated as of October 17, 2007, by and between Affiliated Managers Group, Inc. and U.S. Bank National Association, successor in interest to Bank of America, N.A., successor by merger to LaSalle Bank National Association, as Guarantee Trustee(5) | |
4.6 | Indenture, dated as of August 8, 2012, by and between Affiliated Managers Group, Inc. and Wells Fargo Bank, National Association, as Trustee(7) | |
4.7 | First Supplemental Indenture related to the 6.375% Senior Notes due 2042, dated as of August 8, 2012, by and between Affiliated Managers Group, Inc. and Wells Fargo Bank, National Association, as Trustee, including the form of Global Note attached as Annex A thereto(7) | |
4.8 | Indenture, dated as of February 11, 2014, by and between Affiliated Managers Group, Inc. and U.S. Bank National Association, as Trustee(8) | |
4.9 | Supplemental Indenture related to the 4.250% Senior Notes due 2024, dated as of February 11, 2014, by and between Affiliated Managers Group, Inc. and U.S. Bank National Association, as Trustee, including the form of Global Note attached as Annex A thereto(8) | |
4.10 | Second Supplemental Indenture related to the 3.500% Senior Notes due 2025, dated as of February 13, 2015, by and between Affiliated Managers Group, Inc. and U.S. Bank National Association, as Trustee, including the form of Global Note attached as Annex A thereto(9) | |
10.1† | Affiliated Managers Group, Inc. Defined Contribution Plan(10) | |
10.2† | Affiliated Managers Group, Inc. Executive Incentive Plan(11) | |
10.3† | Affiliated Managers Group, Inc. Amended and Restated 1997 Stock Option and Incentive Plan(12) | |
10.4† | Affiliated Managers Group, Inc. Amended and Restated 2002 Stock Option and Incentive Plan(12) | |
10.5† | Affiliated Managers Group, Inc. 2006 Stock Option and Incentive Plan(3) | |
10.6† | Affiliated Managers Group, Inc. Amended and Restated Long-Term Stock and Investment Plan(6) | |
10.7† | Affiliated Managers Group, Inc. Executive Retention Plan(13) | |
10.8† | Affiliated Managers Group, Inc. Deferred Compensation Plan(14) | |
10.9† | Affiliated Managers Group, Inc. Long-Term Equity Interests Plan 2010, LP(15) | |
10.10† | Affiliated Managers Group, Inc. 2011 Stock Option and Incentive Plan(16) | |
10.11† | Affiliated Managers Group, Inc. Long-Term Equity Interests Plan 2011, LP(17) | |
10.12† | Affiliated Managers Group, Inc. Long-Term Equity Interests Plan, LP(18) | |
10.13† | Affiliated Managers Group, Inc. 2013 Incentive Stock Award Plan(19) | |
10.14† | Form of Restricted Stock Award Agreement pursuant to Affiliated Managers Group, Inc. 2013 Incentive Stock Award Plan(20) | |
10.15† | Form of Restricted Stock Unit Award Agreement pursuant to Affiliated Managers Group, Inc. 2013 Incentive Stock Award Plan* | |
10.16† | Form of Stock Option Agreement pursuant to Affiliated Managers Group, Inc. Stock Option and Incentive Plan(21) | |
10.17† | Form of Affiliated Managers Group, Inc. Award Agreement(6) | |
10.18† | Form of Indemnification Agreement entered into by each Director and Executive Officer(22) | |
79
10.19† | Service Agreement, dated as of June 7, 2011, by and between Affiliated Managers Group Limited and Andrew Dyson(23) | |
10.20 | Credit Agreement, dated as of September 22, 2015, among Affiliated Managers Group, Inc., Bank of America, N.A., and the several banks and other financial institutions from time to time party thereto as lenders, and the exhibits and schedules thereto(24) | |
10.21 | Commitments Increase and Joinder Agreement, dated as of June 3, 2016, among Affiliated Managers Group, Inc., Bank of America, N.A., and certain lenders party thereto(25) | |
10.22 | Term Credit Agreement, dated as of September 22, 2015, among Affiliated Managers Group, Inc., Bank of America, N.A., and the several banks and other financial institutions from time to time party thereto as lenders, and the exhibits and schedules thereto(24) | |
10.23 | Commitment Increase Agreement, dated as of June 3, 2016, among Affiliated Managers Group, Inc., Bank of America, N.A., and certain lenders party thereto(25) | |
10.24 | Form of Equity Distribution Agreement, dated as of June 6, 2016(25) | |
10.25 | Form of Confirmation Letter Agreement, dated as of June 6, 2016(25) | |
10.26 | Confirmation Letter Agreement, dated as of June 6, 2016(26) | |
10.27 | Form of Equity Distribution Agreement, dated as of August 16, 2016(27) | |
10.28 | Form of Master Confirmation Letter Agreement, dated as of August 16, 2016(27) | |
21.1 | Schedule of Subsidiaries* | |
23.1 | Consent of PricewaterhouseCoopers LLP* | |
31.1 | Certification of Registrant’s Chief Executive Officer pursuant to Section 302 of the Sarbanes‑Oxley Act of 2002* | |
31.2 | Certification of Registrant’s Chief Financial Officer pursuant to Section 302 of the Sarbanes‑Oxley Act of 2002* | |
32.1 | Certification of Registrant’s Chief Executive Officer pursuant to Section 906 of the Sarbanes‑Oxley Act of 2002** | |
32.2 | Certification of Registrant’s Chief Financial Officer pursuant to Section 906 of the Sarbanes‑Oxley Act of 2002** | |
101 | The following financial statements from the Registrant’s Annual Report on Form 10-K for the fiscal year ended December 31, 2016 are filed herewith, formatted in XBRL (eXtensible Business Reporting Language): (i) the Consolidated Statements of Income for the years ended December 31, 2016, 2015, and 2014, (ii) the Consolidated Balance Sheets at December 31, 2016 and December 31, 2015, (iii) the Consolidated Statement of Equity for the years ended December 31, 2016, 2015, and 2014, (iv) the Consolidated Statements of Cash Flows for the years ended December 31, 2016, 2015, and 2014, and (v) the Notes to the Consolidated Financial Statements. | |
† | Indicates a management contract or compensatory plan |
* | Filed herewith |
** | Furnished herewith |
(1) | Incorporated by reference to the Company’s Registration Statement on Form S-1 (No. 333-34679), filed August 29, 1997, as amended |
(2) | Incorporated by reference to the Company’s Registration Statement on Form S-8 (No. 333-129748), filed November 16, 2005 |
(3) | Incorporated by reference to the Company’s Proxy Statement on Schedule 14A (No. 001-13459), filed April 28, 2006 |
(4) | Incorporated by reference to the Company’s Quarterly Report on Form 10-Q (No. 001-13459), filed November 7, 2016 |
(5) | Incorporated by reference to the Company’s Current Report on Form 8-K (No. 001-13459), filed October 18, 2007 |
(6) | Incorporated by reference to the Company’s Annual Report on Form 10-K for the fiscal year ended December 31, 2013 (No. 001-13459), filed February 27, 2014 |
(7) | Incorporated by reference to the Company’s Quarterly Report on Form 10-Q (No. 001-13459), filed August 8, 2012 |
80
(8) | Incorporated by reference to the Company’s Current Report on Form 8-K (No. 001-13459), filed February 11, 2014 |
(9) | Incorporated by reference to the Company’s Current Report on Form 8-K (No. 001-13459), filed February 13, 2015 |
(10) | Incorporated by reference to the Company’s Annual Report on Form 10-K for the fiscal year ended December 31, 1999 (No. 001-13459), filed March 30, 2000 |
(11) | Incorporated by reference to the Company’s Proxy Statement on Schedule 14A (No. 001-13459), filed April 29, 2015 |
(12) | Incorporated by reference to the Company’s Quarterly Report on Form 10-Q (No. 001-13459), filed May 10, 2004 |
(13) | Incorporated by reference to the Company’s Quarterly Report on Form 10-Q (No. 001-13459), filed November 9, 2005 |
(14) | Incorporated by reference to the Company’s Annual Report on Form 10-K for the fiscal year ended December 31, 2008 (No. 001-13459), filed March 2, 2009, as amended |
(15) | Incorporated by reference to the Company’s Current Report on Form 8-K (No. 001-13459), filed December 17, 2010 |
(16) | Incorporated by reference to the Company’s Proxy Statement on Schedule 14A (No. 001-13459), filed April 19, 2011 |
(17) | Incorporated by reference to the Company’s Annual Report on Form 10-K for the fiscal year ended December 31, 2011 (No. 001-13459), filed February 23, 2012 |
(18) | Incorporated by reference to the Company’s Annual Report on Form 10-K for the fiscal year ended December 31, 2012 (No. 001-13459), filed February 22, 2013 |
(19) | Incorporated by reference to the Company’s Proxy Statement on Schedule 14A (No. 001-13459), filed April 30, 2013 |
(20) | Incorporated by reference to the Company’s Quarterly Report on Form 10-Q (No. 001-13459), filed November 12, 2013 |
(21) | Incorporated by reference to the Company’s Quarterly Report on Form 10-Q (No. 001-13459), filed August 5, 2016 |
(22) | Incorporated by reference to the Company’s Annual Report on Form 10-K for the fiscal year ended December 31, 2010 (No. 001-13459), filed March 1, 2011 |
(23) | Incorporated by reference to the Company’s Quarterly Report on Form 10-Q (No. 001-13459), filed May 8, 2012 |
(24) | Incorporated by reference to the Company’s Current Report on Form 8-K (No. 001-13459), filed September 22, 2015 |
(25) | Incorporated by reference to the Company’s Current Report on Form 8-K (No. 001-13459), filed June 6, 2016 |
(26) | Incorporated by reference to the Company’s Current Report on Form 8-K (No. 001-13459), filed June 8, 2016 |
(27) | Incorporated by reference to the Company’s Current Report on Form 8-K (No. 001-13459), filed August 17, 2016 |
81