Attached files
| file | filename |
|---|---|
| EX-32.2 - EXHIBIT 32.2 - Infinera Corp | infn-322x12312016.htm |
| EX-32.1 - EXHIBIT 32.1 - Infinera Corp | infn-321x12312016.htm |
| EX-31.2 - EXHIBIT 31.2 - Infinera Corp | infn-312x12312016.htm |
| EX-31.1 - EXHIBIT 31.1 - Infinera Corp | infn-311x12312016.htm |
| EX-23.1 - EXHIBIT 23.1 - Infinera Corp | infn-231x12312016.htm |
| EX-21.1 - EXHIBIT 21.1 - Infinera Corp | infn-211x12312016.htm |
| EX-10.4 - EXHIBIT 10.4 - Infinera Corp | infn-104x12312016.htm |
UNITED STATES
SECURITIES AND EXCHANGE COMMISSION
Washington, D.C. 20549
Form 10-K
x | ANNUAL REPORT PURSUANT TO SECTION 13 OR 15(d) OF THE SECURITIES EXCHANGE ACT OF 1934 |
For the fiscal year ended December 31, 2016
OR
¨ | TRANSITION REPORT PURSUANT TO SECTION 13 OR 15(d) OF THE SECURITIES EXCHANGE ACT OF 1934 |
For the transition period from to
Commission file number: 001-33486
Infinera Corporation
(Exact name of registrant as specified in its charter)
Delaware | 77-0560433 |
(State or other jurisdiction of incorporation or organization) | (IRS Employer Identification No.) |
140 Caspian Court
Sunnyvale, CA 94089
(Address of principal executive offices, including zip code)
(408) 572-5200
(Registrant’s telephone number, including area code)
Securities registered pursuant to Section 12(b) of the Act:
Title of Each Class | Name of Each Exchange on Which Registered |
Common Stock, $0.001 Par Value | The NASDAQ Global Select Market |
Securities registered pursuant to Section 12(g) of the Act: None
Indicate by check mark if the registrant is a well-known seasoned issuer, as defined in Rule 405 of the Securities Act. Yes x No ¨
Indicate by check mark if the registrant is not required to file reports pursuant to Section 13 or 15(d) of the Act. Yes ¨ No x
Indicate by check mark whether the registrant (1) has filed all reports required to be filed by Section 13 or 15(d) of the Securities Exchange Act of 1934 during the preceding 12 months (or for such shorter period that the registrant was required to file such reports), and (2) has been subject to such filing requirements for the past 90 days. Yes x No ¨
Indicate by check mark whether the registrant has submitted electronically and posted on its corporate Web site, if any, every Interactive Data File required to be submitted and posted pursuant to Rule 405 of Regulation S-T (§232.405 of this chapter) during the preceding 12 months (or for such shorter period that the registrant was required to submit and post such files). Yes x No ¨
Indicate by check mark if disclosure of delinquent filers pursuant to Item 405 of Regulation S-K (§229.405 of this chapter) is not contained herein, and will not be contained, to the best of registrant’s knowledge, in definitive proxy or information statements incorporated by reference in Part III of this Form 10-K or any amendment to this Form 10-K. x
Indicate by check mark whether the registrant is a large accelerated filer, an accelerated filer, a non-accelerated filer, or a smaller reporting company. See definitions of “large accelerated filer,” “accelerated filer,” and “smaller reporting company” in Rule 12b-2 of the Exchange Act. (Check one):
Large accelerated filer x | Accelerated filer ¨ | Non-accelerated filer ¨ | Smaller reporting company ¨ |
(Do not check if a smaller reporting company) | |||
Indicate by check mark whether the registrant is a shell company (as defined in Rule 12b-2 of the Exchange Act). Yes ¨ No x
The aggregate market value of the registrant’s common stock, $0.001 par value per share, held by non-affiliates of the registrant on June 25, 2016, the last business day of the registrant’s most recently completed second fiscal quarter, was approximately $1,017,455,960 (based on the closing sales price of the registrant’s common stock on that date). Shares of the registrant’s common stock held by each officer and director and each person who owns more than 5% or more of the outstanding common stock of the registrant have been excluded in that such persons may be deemed to be affiliates. This determination of affiliate status is not necessarily a conclusive determination for other purposes. As of February 15, 2017, 146,415,351 shares of the registrant’s common stock, $0.001 par value per share, were issued and outstanding.
DOCUMENTS INCORPORATED BY REFERENCE
Portions of the registrant’s definitive proxy statement relating to its 2017 Annual Meeting of Stockholders (the “2017 Proxy Statement”) are incorporated by reference into Part III of this Annual Report on Form 10-K where indicated. The 2017 Proxy Statement will be filed with the U.S. Securities and Exchange Commission within 120 days after the end of the fiscal year to which this report relates.
INFINERA CORPORATION
ANNUAL REPORT ON FORM 10-K
For the Fiscal Year Ended December 31, 2016
Table of Contents
Page | ||
Part I | ||
Item 1. | Business | |
Item 1A. | Risk Factors | |
Item 1B. | Unresolved Staff Comments | |
Item 2. | Properties | |
Item 3. | Legal Proceedings | |
Item 4. | Mine Safety Disclosures | |
Part II | ||
Item 5. | Market for Registrant’s Common Equity, Related Stockholder Matters and Issuer Purchases of Equity Securities | |
Item 6. | Selected Financial Data | |
Item 7. | Management’s Discussion and Analysis of Financial Condition and Results of Operations | |
Item 7A. | Quantitative and Qualitative Disclosures About Market Risk | |
Item 8. | Financial Statements and Supplementary Data | |
Item 9. | Changes in and Disagreements with Accountants on Accounting and Financial Disclosure | |
Item 9A. | Controls and Procedures | |
Item 9B. | Other Information | |
Part III | ||
Item 10. | Directors, Executive Officers and Corporate Governance | |
Item 11. | Executive Compensation | |
Item 12. | Security Ownership of Certain Beneficial Owners and Management and Related Stockholder Matters | |
Item 13. | Certain Relationships and Related Transactions, and Director Independence | |
Item 14. | Principal Accounting Fees and Services | |
Part IV | ||
Item 15. | Exhibits, Financial Statement Schedules | |
Part I
ITEM 1. BUSINESS
Overview
Infinera Corporation (“we,” “us,” “our” or “Infinera”) provides optical transport networking equipment, software and services to telecommunications service providers, internet content providers (“ICPs”), cable providers, wholesale and enterprise carriers, research and education institutions, enterprise customers, and government entities across the globe. Optical transport networks are deployed by customers facing significant demand for optical bandwidth prompted by increased use of high-speed internet access, mobile broadband, cloud-based services, high-definition video streaming services, virtual and augmented reality, the Internet of Things (IoT) and business Ethernet services.
Infinera is a leader in large-scale photonic integrated circuits (“PICs”), which is a key component inside many of our Intelligent Transport Network platforms. Infinera’s PIC technology optimizes the manufacturing process by using indium phosphide with which it is possible to fabricate all of the necessary optical functions on a single semiconductor chip. The Infinera Intelligent Transport Network architecture is highly scalable, flexible and open, which enables us to leverage our core competency of vertically integrated technologies. Our third-generation PICs, commercially available since 2012, transmit and receive 500 gigabits per second (“Gb/s”), and incorporate over 600 discrete optical functions into a pair of PICs. Our PICs, combined with our FlexCoherent digital signal processors (“DSPs”), increase the capacity-reach performance of our products to deliver coherent optical transmission. Similar to how silicon integrated circuits changed the dynamics of the computing industry by increasing computing performance and reliability while reducing physical size, power consumption and heat dissipation, we believe our PICs change the dynamics of the optical transport network industry by increasing optical performance and reliability while reducing physical size, power consumption and heat dissipation.
In 2016, we announced the Infinite Capacity Engine (ICE), our next-generation technology, which delivers a family of multi-terabit opto-electronic subsystems powered by our fourth-generation PIC and next-generation FlexCoherent DSP. The Infinite Capacity Engine is a family of different subsystems that can be customized for different network applications across our product portfolio, spanning the long-haul, subsea, datacenter interconnect (“DCI”) and metro markets.
Traditionally, we have focused on the long-haul portion of the optical transport market and a large portion of our revenue continues to be derived from long-haul and subsea customers. Over the past two years, we have significantly increased the number of products we offer, evolving from focusing entirely on the long-haul and subsea markets with the DTN-X Family of products to offering an end-to-end suite of solutions that spans terrestrial long-haul, subsea, DCI, and metro core and access.
In late 2014, we increased our addressable markets by introducing the Cloud Xpress platform for the DCI market. Since the initial introduction of the Cloud Xpress with 40 Gigabit Ethernet (“GbE”) client interfaces, we have enhanced our position by expanding our Cloud Xpress Family to also offer 10 GbE and 100 GbE client interfaces to meet customer-specific requirements. Our next-generation Cloud Xpress solution, due to be released during 2017, further optimizes space and power, and delivers 1.2 terabits per second (“Tb/s”) of capacity in a one rack unit (“RU”) box without the need for external multiplexers or amplifiers for distances up to 130km.
In the second half of 2015, we entered the metro market with the acquisition of Transmode AB (“Transmode”), a leader in metro packet-optical applications, based in Stockholm, Sweden. With our entrance into DCI and metro markets over the last few years, we are now able to provide our customers with an end-to-end portfolio of solutions. The XTM Series and XTG Series are designed to address the metro market, with 100 Gb/s metro core/regional transport capabilities and packet-optical solutions optimized for fast-growing applications in the access portion of the network, including mobile fronthaul and backhaul, triple-play and cable broadband aggregation, and business Ethernet services with Metro Ethernet Forum (“MEF”) certification. These products are complemented by the XTC-2 product designed for high-capacity handoffs of traffic from a long-haul network.
Our end-to-end packet-optical portfolio is designed to be managed with a single network management system. In addition to offering our traditional management system for wavelength-division multiplexing (“WDM”) operations, we also provide solutions for enabling programmability of our Intelligent Transport Networks with our Digital Network Administrator (“DNA”), network management system (“NMS”) and software-defined networking (“SDN”) via the Xceed Software Suite (“Xceed”). Our multi-layer SDN platform enables customers to write software applications that leverage the scalability, flexibility and openness of our Intelligent Transport Networks to deliver innovative services while efficiently using their network resources.
1
We believe that our portfolio of purpose-built products benefits our customers by providing a unique combination of highly scalable capacity and features that address various applications and ultimately simplify and automate transport network operations.
We were incorporated in December 2000 and originally operated under the name “Zepton Networks.” We are incorporated in the State of Delaware. Our principal executive offices are located at 140 Caspian Court, Sunnyvale, CA 94089. Our telephone number is (408) 572-5200. “Infinera,” “Infinera DTN,” “Infinera DTN-X,” “ATN,” “Infinera Intelligent Transport Network,” “FlexCoherent,” “Infinera FlexILS,” “Infinera Instant Bandwidth” and “Infinera FastSMP” are trademarks or service marks of Infinera Corporation in the United States, certain other countries and/or the European Union. Any other trademarks or trade names mentioned are the property of their respective owners.
Industry Background
Optical transport networking equipment carries digital information using light waves over fiber optic cables. With the advent of WDM systems, data is transmitted by using multiple wavelengths of light using different frequencies or colors over a single optical fiber. Customers deploy WDM systems to carry information between continents, across countries, between cities and within metropolitan areas, and in some cases all the way to the end user. Fiber optic networks are generally capable of carrying most types of communications traffic. We believe that a number of trends in the communications industry are driving demand for network bandwidth and ultimately will increase demand for optical transport networking systems. These trends include:
• | growth of cloud services; |
• | growth of bandwidth-intensive services like streaming high-definition video services; |
• | increasing use of connected virtual and augmented reality devices; |
• | proliferation of mobile services of Wi-Fi, 4G and future growth of 5G; and |
• | rise of the Internet of Things, driving massive growth in the number of network-connected devices. |
As network traffic grows, customers add transmission bandwidth to existing optical networks or purchase and deploy additional systems to address bandwidth demands and offer expanded services to their respective customers. In particular, consumers and businesses increasingly rely on the cloud for their application needs across compute, storage and network functions. Today many applications have transformed from function-specific deployments on dedicated hardware platforms to virtualized services implemented on generic hardware within cloud data centers. This transformation is leading to the creation of a simplified model of Layer C (cloud services) supported by the underlying Layer T (intelligent transport). As cloud adoption increases, large network operators are reporting a magnification effect on incoming traffic, such that a single request from an end-user can generate many times the amount of traffic between data centers as compared to the amount of traffic contained in the original request. This server-to-server traffic is also called east-west traffic, and this magnification effect is accelerating the deployment of high-bandwidth optical transport solutions to support cloud network infrastructures.
We believe that our customers seek the following solutions in order to increase their revenue and/or expand their service offerings:
• | high-bandwidth solutions that scale optical transmission bandwidth to meet increasing demand while providing wide-ranging granularity for service efficiency; |
• | efficient solutions with the right mix of integrated and disaggregated systems that optimize performance and increase reliability while reducing physical space, power consumption and heat dissipation, leading to lower operational expenses; |
• | easy-to-use solutions that are highly programmable and open, which help reduce the time and complexity of deploying new transmission bandwidth; |
• | improved integration between packet or Internet Protocol equipment such as routers and optical transport networking equipment; and |
• | strong encryption at the transport layer processed at line-rate speeds. |
We believe that the Infinera Intelligent Transport Network architecture is uniquely enabled to deliver improvements in these areas compared to competitive WDM systems. We also believe that our Intelligent Transport Networks enable our customers to deploy scalable, flexible and open solutions that simplify and automate optical network operations.
2
Strategy
Our goal is to be the preeminent provider of optical transport networking systems to our customers around the world. Key aspects of our strategy to achieve this goal include:
• | Proliferating our broad base of purpose-built technologies and products to existing customers, as well as obtain new customers. We have introduced multiple purpose-built products to allow us to address a broader portion of our existing customer networks but also to expand into adjacent markets. |
• | Enhancing our existing product portfolio for the long-haul, subsea, DCI and metro markets. We are enhancing existing products and building new products across long-haul, subsea, DCI and metro aggregation markets. We anticipate that these products will be released over the course of 2017 with a focus on advanced features and further integration to improve our cost structure. |
• | Improving the cadence under which new products are brought to market. Historically, we have brought new generations of our products based on our optical engine, which includes advanced PICs and DSPs, to market every four to five years. Current competitive market conditions include increased investments from our larger competitors that allows for faster cadences of new products. In addition, the emergence of certain component providers who build enhanced components have allowed other competitors to bring products to market much faster than they could have in the past. As a result, we have committed to bring new generations of our products to market approximately every two to three years. |
• | Continuing our commitment to provide world-class product quality and support services to our customers. We believe that providing the most reliable products and our customer experience capabilities are major differentiators. Our global customer service and technical support team is committed to making our customers successful by providing the highest quality support services to deploy, operate and maintain their networks. |
• | Maintaining and extending our technology lead. We intend to continually invest in key technologies such as various forms of the PIC, our FlexCoherent processor, application-specific integrated circuits (“ASICs”), software and other important technologies. We plan to incorporate the functionality of additional discrete functions into our PICs and take advantage of the advanced features in our new DSPs. In addition, we intend to pursue the expansion of our packet switching and bandwidth management capabilities in order to enhance the performance, scalability and economic advantages of our products. |
• | Continuing investment in vertically integrated manufacturing activities. We believe that our vertical integration and manufacturing capabilities serve as competitive advantages from a technology, supply chain and financial perspective, and we plan to continue to invest in our next-generation PIC technologies. We will supplement that strategy through the use of certain merchant components in certain cases where it can provide us with a performance, cost or time-to-market advantage. |
• | Investing in our network management system and SDN. We believe that we lead the industry in ease of use, facilitated through our Infinera Management System and Xceed suite of software products. We continue to invest in our software products, including adding capabilities such as Infinera Instant Bandwidth. We are extending the management and control capabilities across our entire portfolio with a goal of achieving end-to-end service provisioning. Based on customers’ desire for more programmable networks, we have added open application programming interfaces (“APIs”) to our Infinera Intelligent Transport Network architecture so they can be used by our customers to build more agile networks and deliver competitive services. |
Customers
Our customer verticals include:
• | Tier-1 carriers for domestic and international networks; |
• | Tier-2 and Tier-3 carriers; |
• | ICP and data center operators; |
• | wholesale carriers; |
• | submarine network operators; |
• | multiple system operators/cable companies; |
• | enterprise customers; and |
• | research and education/government entities. |
3
We sell our products both directly to customers who are end users, and to channel partners that sell on our behalf. We believe one of our strengths is the diversity of our customer base as we generate annual revenues from each of the verticals listed above, and have multiple customers within each vertical that have historically spent significantly on our solutions. We do not have long-term sales commitments from our customers. One customer accounted for over 10% of our revenue in 2016. Revenue from this customer accounted for 16% of our revenue in 2016. Two customers each accounted for over 10% of our revenue in 2015. These two customers accounted for 17% and 13%, respectively, of our revenue in 2015. One customer accounted for over 10% of our revenue in 2014. Revenue from this customer accounted for 19% of our revenue in 2014.
Technology
Infinera Intelligent Transport Network Architecture
We were founded with a vision of enabling an infinite pool of intelligent bandwidth upon which the next communications infrastructure is built upon. We have focused our efforts, time and capital on developing application-optimized platforms based on our Infinera Intelligent Transport Network architecture, which enables customers to create rich end-user experiences based on efficient, high-bandwidth transport by combining the following elements:
• | Scalable. The proliferation of data centers, rise of cloud computing, increasing consumption of video and growth in mobile access is fundamentally changing traffic characteristics in operator networks. Infinera Intelligent Transport Networks deliver multi-terabit coherent super-channels today. This technology allows a massive pool of bandwidth to be provisioned in a single operational motion. We expect to introduce products in the course of 2017 that will utilize our new Infinite Capacity Engine and deliver sliceable super-channels up to 2.4 Tb/s. Sliceable photonics provide wavelength granularity for wide-ranging control of the network. |
• | Flexible. Networks are growing in complexity with the proliferation of internet protocols, network layers and fiber interconnects. Complexity increases the time it takes to plan and deploy network services and increases the cost of maintenance, operation, power, space and cooling. By combining packet and Optical Transport Network (“OTN”) switching functions with WDM, integrated platforms offer a wide variety of services. Conversely, disaggregated platforms offer optimized functionality that prioritizes lowering overall network operating costs without compromising performance. Infinera Intelligent Transport Networks offer a mix of integrated and disaggregated platforms to reduce complexity in the network. |
• | Open. Network operators are facing intensifying competition to meet customer demand for immediate bandwidth needs and better visibility into the network. Our Intelligent Transport Networks feature highly programmable platforms with SDN APIs enabling networks to be open; this helps simplify end to end multi-layer provisioning. Additionally, there is growing demand from certain customers for line systems that are open, which entails having the ability to use transponders from one vendor over a different vendor’s line system. We are addressing this dynamic, both by seeking opportunities to sell our transponders over other vendors’ line systems and also offering an Infinera platform that supports both fixed and flexible grid technology, thus allowing a seamless mix of multi-vendor transponders. |
Infinera Photonic Integrated Circuits
We believe that our custom-built PICs and FlexCoherent processors, part of the Infinite Capacity Engine, are key components of our value proposition and a competitive advantage. We manufacture and package our PICs at our own facilities for use exclusively with our Infinera DTN, DTN-X Family and Cloud Xpress Family platforms. Our PICs are purpose-built for diverse network locations and applications. As a leader in photonic integration, we have protected the intellectual property associated with our PIC manufacturing through a combination of trade secrets, patents and contractual protections. We believe that as a result of the combination of the multiple disciplines that were required to develop our PIC, together with the intellectual property protections that we have established, it will be difficult for others to duplicate the technology we have developed. We believe that large-scale photonic integration using indium phosphide enables significantly improved manufacturing economics for optical networking, allowing future optical transport cost reductions to be viably sustained on a cost curve defined by volume manufacturing efficiencies, greater functional integration and increased device density.
Infinera FlexCoherent Processor
Optical transmission is based on a number of technologies, namely: phase modulation, polarization multiplexing, coherent detection and advanced digital signal processing. These “coherent technologies” are used by network operators to enable higher data capacities to be transmitted over their existing optical fiber infrastructure, typically using the same or better design rules than those used for the previous generation. We have integrated advanced coherent technologies onto our FlexCoherent DSP, such as cutting-edge Nyquist subcarriers and soft-decision forward error correction gain sharing techniques. The processor works in conjunction with our large-scale
4
PICs based on advanced photonics to construct the Infinite Capacity Engine for exceptional optical transport performance.
Super-Channels
The Infinera DTN-X Family of products and the Cloud Xpress Family are designed to support multiple channels of 100 Gb/s capacity in a single line card or unit depending on the platform form factor. This pool of bandwidth is managed as a single super-channel, up to 500 Gb/s that can be deployed in a single operational motion. In 2017, we expect to release products that will allow channels of up to 200 Gb/s and up to 2.4 Tb/s super channels. In order to achieve the same system capacity, competitive solutions would require the installation of discrete line modules or units, which in some cases could number as many as 10, each turned up with its own operational motion. Super-channels result in competitive advantages in the areas of space and power consumption, leading to lower operational costs and long-term system reliability, as well as significant reductions in time to install and repair.
Sliceable Photonics
Our soon to be released platforms are designed to provide up to 2.4 Tb/s of capacity in a single module with a single fiber pair using the Infinite Capacity Engine, while being able to slice the 2.4 Tb/s capacity into a 100 Gb/s wavelength or 100 Gb/s increments. Each increment can be tuned and routed in multiple separate directions, with each fully tuned to its own flexible grid frequency as well as having its own coherent modulation profile. This significantly reduces requirements for modules in networks, resulting in lower total cost of ownership and a highly flexible optical transport network. This solution simplifies traffic aggregation while providing 100 Gb/s economics at multi-terabit scale. It contrasts with competitive solutions that are being built without sliceable photonics technology and in which granularity gets progressively reduced as bandwidth increases, resulting in more fibers, more power consumption and more rack space.
Disaggregation
The Infinera Intelligent Transport Network is a mix of disaggregated and integrated platforms. Disaggregated platforms are optimized for certain applications that need point-to-point or point-to-multipoint interconnects. As a result, they are low-power compact units that are server-like and adopt the rack-and-stack operational model. The Infinera Cloud Xpress provides a point-to-point DCI solution and was the first small form factor platform in its category. We have also announced DTN-X XT Series meshponders, which are designed to leverage the Infinite Capacity Engine, combining muxponder technology with sliceable photonics in a server-like WDM appliance to deliver multi-terabit capacities along with fine-grained granularity for optical mesh networks. These meshponders are expected to be released over the course of 2017.
Integrated Digital Switching
Our unique PIC technology allows the Infinera DTN-X XTC Series platforms to fully integrate WDM transport and OTN switching capabilities in a single platform, without compromising overall system functionality or capacity. The integrated OTN switching capability along with generalized multi-protocol label switching automation allows customers to deploy Infinera FastSMP (Fast Shared Mesh Protection), a standards-based resiliency technique for networks to recover from local and network-wide multiple failures without the need to dedicate backup bandwidth for every active circuit. We implement this technology using a purpose-built hardware acceleration chip included in every single card of the Infinera DTN-X XTC Series platform, ensuring a sub-50 milliseconds recovery.
Infinera Instant Bandwidth
Infinera Instant Bandwidth enables customers to license a super-channel pool of bandwidth in 100 Gb/s increments. With Infinera Instant Bandwidth technology, which is available with the Infinera DTN-X XTC Series, DTN-X XT Series and Cloud Xpress platforms, customers can provision an additional 100 Gb/s of transmission capacity on demand without the deployment of any incremental equipment. The Infinera Instant Bandwidth technology is uniquely enabled by our super-channel capability and PICs, providing customers the ability to adopt a success-based business model for network growth. This technology has been extended to include a time-based capability offering network bandwidth in 100 Gb/s increments for a certain duration.
Infinera Packet-Optical Transport
Our packet-optical technologies included in both the Infinera DTN-X XTC Series and the XTM Series platforms offer the right amount of packet and optical switching integrated into efficient packet-optical platforms. This enables customers to support Ethernet and multi-protocol label switching (“MPLS”) packet transport, aggregation and service functions directly within the optical WDM layer. Operators can build highly efficient router interconnects and bandwidth engineering capabilities within the transport layer, without having to send the traffic to the router layer for transit. Our Intelligent Transport Networks not only enhance network efficiency but also provide scalable bandwidth and performance for revenue-yielding MEF-certified Carrier Ethernet and MPLS packet services.
5
Multi-layer Switching and Optimization
The Intelligent Transport Network combines coherent super-channels, WDM switching, non-blocking OTN switching and packet switching in a unified architecture for comprehensive flexibility. Wavelength switching using the Infinera FlexILS manages bulk WDM capacity while packet-OTN switching on the DTN-X XTC and XTM platforms manage sub-wavelength service capacity, providing a complete multi-layer transport and switched solution for any traffic mix. Operators can design and optimize their networks with the right set of platforms and tools from Infinera to achieve maximum efficiency.
Management, Control and Security
Unified network management, control and security is critical to achieving scale and service simplicity that maximizes the value of the network elements as well as the network as a whole. Infinera Management Suite is a feature-rich suite of tools that provides enhanced value for transport networks. Our Xceed suite of software products is a portfolio of SDN solutions that combines an open, multi-layer SDN control platform with applications that enhance revenue sources while increasing network efficiency. Xceed is designed for multi-layer networks and unified SDN control across end-to-end transport networks. Our advanced security capabilities within the Infinite Capacity Engine are designed to provide state-of-the-art encryption technologies at wire speed, with the highest levels of data protection.
Products and Services
Our product portfolio consists of the Infinera DTN-X Family (including the XTC Series, XTS Series and XT Series), the Infinera DTN platform, the Infinera Cloud Xpress Family, the Infinera XTM Series, the Infinera XTG Series and the Infinera FlexILS platform, addressing long-haul, subsea and metro networks end-to-end. The emerging DCI application is a subset of these networks. We also provide software solutions including the Xceed Software Suite and Infinera Management Suite to increase the efficiency and optimization of the network.
Product Portfolio
Infinera DTN-X Family
The Infinera DTN-X Family of next-generation terabit-class transport network platforms comprises the DTN-X XTC Series, DTN-X XTS Series and the DTN-X XT Series. The DTN-X Family is positioned to meet the needs of network operators seeking to offer new and innovative services with scalability, flexibility and openness. We have designed the DTN-X Family to integrate the Infinera Infinite Capacity Engine technology for long-haul, subsea, DCI and metro networks. The DTN-X Family is designed to support Infinera Instant Bandwidth, sliceable super-channels, in-flight wire-speed encryption and the Advanced Coherent Toolkit for enhanced capacity-reach performance.
The Infinera DTN-X XTC Series are multi-terabit packet optical transport platforms that integrate Ethernet and MPLS packet services with digital OTN switching and optical WDM transmission. The highest end XTC-10 platform provides fiber capacity of 9.5 Tb/s that is designed to support up to 25 Tb/s. The XTC-4 supports a half-rack platform for more space-constrained applications. The XTC-2/2E is the smallest platform, designed for metro applications or lower capacity sites requiring 100 Gb/s dense WDM. In most competitive solutions, network operators must make a choice between maximizing either the system’s transmission capacity or its switching capability. The DTN-X XTC platforms combine switching with WDM transport without compromising the performance of either function. These platforms also support a broad range of Ethernet and OTN client interfaces for flexibility and are designed for long-haul, subsea, regional and metro mesh networks that require 100 Gb/s wavelengths.
The Infinera DTN-X XT-500 is 2 RUs high with 500Gbps line-side capacity and a mix of 10/100GbE client interfaces. It provides high levels of reliability, low power consumption and operational simplicity. It integrates with the Infinera FlexILS line system and can be managed as a single node when combined with the XTC series. The XT 500 is designed for long-haul networks that require 100Gbps wavelengths as well as long-haul DCI applications.
The Infinera DTN-X XT Series and XTS Series are recently announced small-form-factor, server-like meshponder WDM platforms, which are designed to blend sliceable photonics and muxponder functionality to deliver hyperscalable WDM (up to 2.4 Tb/s) along with fine-grained granularity. The platforms expected to be released in 2017 are optimized for delivery of cloud scale network services over subsea, long-haul, DCI and metro networks.
Infinera DTN Platform
The Infinera DTN platform is built on 100 Gb/s PIC technology, integrating digital OTN switching with optical WDM transmission at 10 Gb/s wavelengths for a fiber capacity of 1.6 Tb/s and per-chassis capacity of 400 Gb/s. It supports a broad range of Ethernet and OTN client interfaces for flexibility. The platform is designed for long-haul, subsea and regional mesh networks that require 10 Gb/s wavelengths.
6
Infinera XTM Series
The Infinera XTM Series carrier-grade packet-optical transport platform enables high-performance metro networks with service-aware, application-specific capabilities. Supporting integrated packet-optical features, the XTM Series builds on key design philosophies such as low power, high density and high scalability. It offers advanced capabilities for 3G and 4G mobile infrastructure such as superior sync features for backhaul, WDM in cloud radio access network architecture and fronthaul. The platform supports the Intelligent WDM Passive Optical Network solution providing simple operations for FTTx (fiber to the X) applications along with Intelligent Small-form-factor Pluggables for transparent delivery of Synchronous Digital Hierarchy/Synchronous Optical Networking services over a packet-optical network. It provides error correction, OTN transport, Ethernet, MPLS - transport profile (“MPLS-TP”) and optics, all on one packet optical transport switch module. It includes a fully backwards compatible terabit scale packet-optical transport switching with a rich set of MEF Carrier Ethernet 2.0 and MPLS-TP service options. This platform is designed for application-rich packet-optical metro and regional networks providing cable, mobile, broadband and business services that require 10 Gb/s and 100 Gb/s wavelengths.
Infinera XTG Series
The Infinera XTG Series is a family of passive optical WDM products. Designed for metro access applications, it fits in a wide range of applications from controlled environments in central offices to street cabinets or even underground enclosures such as manhole applications that require environmentally hardened products, such as fiber to the curb, fiber to the building and high-security access networks. The XTG Series is fully compatible and interoperable with the XTM Series.
Infinera Cloud Xpress Platform
The Infinera Cloud Xpress Family includes multiple platforms designed to meet the varying needs of cloud service providers, ICPs, internet exchange service providers, enterprises and other large-scale data center operators. The first generation of the Cloud Xpress includes four models supporting varying configurations of 10 GbE, 40 GbE and 100 GbE Ethernet ports for client-side connectivity, and a 500 Gb/s WDM super-channel output, all in 2 RUs. Due to be released in 2017, our second generation, the Cloud Xpress 2, based on the Infinera Infinite Capacity Engine, is designed for scalable 100 GbE DCI over a 1.2 Tb/s super-channel output in 1 RU. These platforms are designed with a rack-and-stack form factor and a new software approach that enables them to easily plug into existing cloud provisioning systems using open SDN APIs, an approach similar to the server and storage infrastructure deployed in the cloud.
Infinera FlexILS Open Line System
The Infinera FlexILS open line system platform connects various Infinera and third-party terminal equipment platforms over long-distance fiber optic cable while providing switching, multiplexing, amplification and management channels. It is designed to support over 50 Tb/s of fiber capacity when used with the Infinera DTN-X platform over extended C-band and L-band. The platform supports a flexible grid architecture and provides unconstrained optical switching by eliminating the restrictions of fixed wavelengths per port (colorless), allows any wavelength to be added/dropped to/from any direction (directionless), and enables multiple copies of the same wavelength on a single add/drop structure (contentionless) for a comprehensive C/CD/CDC ROADM (Reconfigurable Optical Add Drop Multiplexer) solution up to 20 degrees. The FlexILS platform is designed to provide open APIs interfacing with SDN control for multi-layer switching when combined with other platforms featuring WDM, OTN and packet switching.
Software and Services
Infinera Xceed Software Suite
Infinera’s Xceed Software Suite delivers an open, purpose-built multi-layer SDN platform and revenue-ready applications, leveraging the scalability, flexibility and openness of Infinera transport networks. It is designed to deliver revenue-ready applications including Dynamic Bandwidth and Instant Virtual Networks and is built to be open, extensible and optimized for multi-layer control. The Xceed Software Suite controls networks from metro to long-haul, and takes advantage of terabit-scale, pre-deployed capacity to accelerate time-to-market for SDN-based applications and services. Infinera’s Xceed Software Suite is powered by open source software and interfaces with third-party solutions via open APIs to provide revenue-ready applications for agile, assured orchestration of new services.
Infinera Management Suite
The Infinera Management Suite is a network management system used by network operators to manage all Infinera platforms in an integrated manner. The suite includes DNA, a scalable, robust, feature-rich element management system for the entire Infinera product portfolio. The suite also includes Graphical Node Manager, an easy-to-use web-based management interface and Network Planning System for offline graphical modeling, planning and configuration capabilities.
7
Customer Support Services
In connection with our product offerings, we provide a comprehensive range of support services for all hardware and software products. These support services cover all phases of network ownership, from the initial installation through day-to-day maintenance activities and professional services. Our support services are designed to efficiently manage and maintain customer network operations in the face of today's ever-increasing demands for lower operational costs and minimized downtime.
Our support organization continues to scale and provide world-class services that successfully support customers in over 80 countries around the world. In addition, we continue to expand our services portfolio in order to meet the evolving needs of our customers.
Competition
Our current technologies and platforms support three transport equipment markets - long-haul/subsea, DCI and metro.
The optical transport networking equipment market for long-haul and subsea networks is highly competitive but has consolidated significantly over the last decade. The metro market is a highly competitive market that we entered in 2015. The DCI market, which is a subset of the long-haul and metro markets, is a relatively new market that we expect to be highly competitive. Competition in the markets we serve is based on any one or a combination of the following factors:
• | price and other commercial terms; |
• | functionality; |
• | form factor or density; |
• | power consumption; |
• | heat dissipation; |
• | customer qualification testing; |
• | existing business and customer relationships; |
• | the ability of products and services to meet customers’ immediate and future network requirements; |
• | installation and operational simplicity; |
• | service and support; |
• | security and encryption requirements; |
• | scalability and investment protection; and |
• | product lead times. |
Competition in the optical transport equipment market is intense, and we expect such competition to increase. In the long-haul market, our main competitors include WDM suppliers such as Ciena Corporation, Coriant, Huawei, Nokia and ZTE. In the metro market, we face the same competitors as in long-haul, plus Cisco Systems, Inc., ADVA Optical Networking and Fujitsu. In addition, there are several smaller but established companies that offer one or more products that compete with our offerings. During 2016, several competitors including many named above announced or started to ship competing small-form-factor DCI solutions. In addition to the current competitors, other companies have, or may in the future develop, products that are or could be competitive with our products. We also expect to encounter further consolidation in the markets in which we compete. Consolidation among our competitors could lead to a changing competitive landscape, capabilities and market share, which could harm our results of operations.
Some of our competitors have substantially greater name recognition and technical, financial and marketing resources along with better established relationships with service providers and other potential customers than we have. Many of our competitors have more resources and more experience in developing or acquiring new products and technologies and in creating market awareness for those products and technologies. In addition, many of our competitors have the financial resources to offer competitive products at aggressive pricing levels that could prevent us from competing effectively. Further, many of our competitors have built long-standing relationships with some of our prospective customers and have the ability to provide financing to customers and could, therefore, have an inherent advantage in selling products to those customers.
8
Sales and Marketing
We market and sell our products and related support services primarily through our direct sales force, supported by marketing and product management personnel. We also use distribution or support partners to enter new markets or when requested by a potential customer. Our sales team has significant previous experience with the buying process and sales cycles typical of high-value telecommunications products.
The sales process for our products entails discussions with prospective customers, analyzing their networks and identifying how they can utilize our systems capabilities within their networks. This process requires developing strong customer relationships, and we expect to leverage our sales force and customer support capabilities to establish relationships with both domestic and international service providers.
Over the course of the sales cycle, potential customers often test our products before buying. Prior to commercial deployment, the customer will generally perform a field trial of our products. Upon successful completion, the customer generally accepts the products installed in its network and may continue with commercial deployment of additional products. We anticipate that our sales cycle, from initial contact with a service provider through the signing of a purchase agreement, may, in some cases, take several quarters.
Direct Sales Force. Our sales team sells directly to service providers worldwide. We maintain a sales presence throughout the United States, as well as in a number of international locations, including Argentina, Australia, Belgium, China, France, Germany, Hong Kong, Italy, Japan, Netherlands, Singapore, South Africa, Spain, Sweden, Russia and the United Kingdom. We continued to expand our sales force in 2016 to increase our presence in certain key customer verticals and to support the sales of our expanded portfolio of products. Going forward, the addition of incremental sales headcount is expected to be success-based and in support of new customer accounts.
Indirect Sales Force. We have and will continue to employ business consultants and, resale and logistics partners to assist in our sales efforts and to accelerate and strengthen our customer relationships. We expect to work with business partners to assist our customers in the sale, deployment and maintenance of our systems and have entered into distribution and resale agreements to facilitate the sale and support of our products.
Marketing and Product Management. Our product management team is responsible for defining the product features and go-to-market plan required to maximize our success in the marketplace. Product management supports our sales efforts with product and application expertise. Our corporate marketing team works to create demand for our products by communicating our value proposition and differentiation through direct customer interaction, public relations, attendance at tradeshows and other events, as well as programs via the internet and other marketing channels.
Research and Development
Continued investment in research and development is critical to our business. To this end, we have assembled a team of engineers with expertise in various fields, including systems, sub-systems, software and components. Our research and development efforts are currently focused in Sunnyvale, California; Allentown, Pennsylvania; Beijing, China; Bangalore, India; Kanata, Canada; and Stockholm, Sweden. We have invested significant time and financial resources into the enhancement of existing products and the development of new products. We will continue to expand our product offerings and the capabilities of existing products in the future and plan to dedicate significant resources to these continued research and development efforts. We are continually increasing the scalability and software features of our current platforms. We are also working to develop new generations of optical engines, and we intend to enable further integration in the Infinera Intelligent Transport Network architecture through continued research and development. We also plan to increase the cadence by which we bring new products to market. We believe that these efforts will continue to allow us to be competitive in the markets we currently serve but will allow us to address adjacent markets to fuel our future growth.
Our research and development expenses were $232.3 million, $180.7 million and $133.5 million in 2016, 2015 and 2014, respectively.
Employees
As of December 31, 2016, we had 2,240 employees. A total of 1,034 of those employees were located outside of the United States. None of our U.S. employees are subject to a collective bargaining agreement. Employees in certain foreign jurisdictions may be represented by local workers’ councils and/or collective bargaining agreements, as may be customary or required in those jurisdictions. We have not experienced any work stoppages, and we consider our employee relationships to be good.
9
Manufacturing
We have invested significant time and capital to develop and improve the manufacturing process that we use to produce and package our products. This includes significant investments in personnel, equipment and the facilities needed to manufacture and package our products in Sunnyvale, California and Allentown, Pennsylvania. We also have invested in automating our manufacturing process and in training and maintaining the quality of our manufacturing workforce. As a leader in the development of photonic integration, our manufacturing processes have been developed over several years and are protected through a combination of trade secrets, patents and contractual protections. We believe that the investments we have made towards the manufacturing and packaging of our products provide us with a significant competitive advantage. We also believe that our current manufacturing facilities, including our fabrication facility for our PICs in Sunnyvale, California, can accommodate an increase in production capacity as our business continues to grow.
We also use contract manufacturers to assemble portions of our products. Each contract manufacturer procures components necessary to assemble the products in our forecast according to our specifications and bills of material. Despite outsourcing certain manufacturing operations for cost-effective scale and flexibility, we perform rigorous in-house quality control testing to ensure the reliability of our products. Our supply chain risk mitigation strategies are continuous and are institutionalized in our supply chain design for external manufacturing and for procurement of components. We currently use four contract manufacturers in six different countries, China, Malaysia, Mexico, Sweden, Hungary and Thailand, as well as the capability to redirect manufacturing to U.S. qualified factories of three electronic manufacturing services partners.
We expect all suppliers to comply with our Supplier Code of Conduct, which addresses the rights of workers to safe and healthy working conditions, environmental responsibility and compliance with applicable laws.
Backlog
As of December 31, 2016 and December 26, 2015, our total order backlog was approximately $74.0 million and $87.1 million, respectively. Our backlog represents purchase orders received from customers for future shipments. Our backlog is subject to future events that could cause the amount or timing of the related revenue to change, and, in certain cases, may be canceled without penalty. Orders in backlog may be fulfilled several quarters following receipt or may relate to multi-year support service obligations. As a result, we believe that backlog should not be viewed as an accurate indicator of future operating results for any particular period. A backlogged order may not result in revenue in a particular period, and the actual revenue may not be equal to our backlog amounts. Our presentation of backlog may not be comparable with that of other companies in our industry.
Intellectual Property
We believe our success depends upon our ability to protect our core technology and intellectual property. To accomplish this, we rely on a combination of intellectual property rights, including patents, trade secrets, copyrights and trademarks, as well as customary contractual protections.
Our PIC and PIC manufacturing processes, including design, fabrication and testing of our PICs, are protected through a combination of patents, trade secrets and contractual protections. However, there can be no assurances that these protections will be sufficient to provide us with a competitive advantage or that others have not or will not reverse engineer our designs or discover, develop or disclose the same or similar designs and manufacturing processes.
As of December 31, 2016, we held 386 U.S. patents and 80 international patents expiring between 2021 and 2036, and held 118 U.S. and 47 foreign pending patent applications. We do not know whether any of our pending patent applications will result in the issuance of patents or whether the examination process will require us to narrow our claims.
We may not receive any competitive advantages from the rights granted under our patents and other intellectual property. Any patents granted to us may be contested, circumvented or invalidated over the course of our business, and we may not be able to prevent third parties from infringing these patents. Therefore, the impact of these patents cannot be predicted with certainty.
We believe that the frequency of assertions of patent infringement is increasing as patent holders, including entities that are not in our industry and who purchase patents as an investment or to monetize such rights by obtaining royalties, use such actions as a competitive tactic as well as a source of additional revenue. For example, we are currently involved in litigation for alleged patent infringement. See Item 3. “Legal Proceedings” for additional information regarding this lawsuit. Any claim of infringement from a third party, even those without merit, could cause us to incur substantial costs defending against such claims, and could distract our management from running our business. Furthermore, a party making such a claim, if successful, could secure a judgment that requires us to pay substantial damages or could include an injunction or other court order that could prevent us from offering our
10
products. In addition, we might be required to seek a license for the use of such intellectual property, which may not be available on commercially reasonable terms or at all. Alternatively, we may be required to develop non-infringing technology, which would require significant effort and expense and may ultimately not be successful.
In addition to trade secret and patent protections, we generally control access to and the use of our proprietary software and other confidential information. This protection is accomplished through a combination of internal and external controls, including contractual protections with employees, contractors, customers and partners, and through a combination of U.S. and international copyright laws.
We license some of our software pursuant to agreements that impose restrictions on our customers’ ability to use such software, such as prohibiting reverse engineering and limiting the use of copies. We also seek to avoid disclosure of our intellectual property by relying on non-disclosure and assignment of intellectual property agreements with our employees and consultants that acknowledge our exclusive ownership of all intellectual property developed by the individual during the course of his or her work with us. The agreements also require that each person maintain the confidentiality of all proprietary information disclosed to them. Other parties may not comply with the terms of their agreements with us, and we may not be able to enforce our rights adequately against these parties. We also rely on contractual rights to establish and protect our proprietary rights in our products.
We incorporate open source software into our products. Although we monitor our use of open source software closely, the terms of many open source licenses have not been interpreted by U.S. courts, and there is a risk that such licenses could be construed in a manner that could impose unanticipated conditions or restrictions on our ability to commercialize our products. In such event, we could be required to seek licenses from third parties in order to continue offering our products, to re-engineer our products or to discontinue the sale of our products in the event re-engineering cannot be accomplished on a timely basis, any of which could adversely affect our business, operating results and financial condition.
Environmental Matters
We are committed to maintaining compliance with all environmental laws and regulations applicable to our operations, products and services. Our business and operations are subject to various federal, state, local and foreign laws and regulations that have been adopted with respect to the environment, including the Waste Electrical and Electronic Equipment (“WEEE”) Directive, Directive on the Restriction of the Use of Certain Hazardous Substances in Electrical and Electronic Equipment (“RoHS”), and Registration, Evaluation, Authorization, and Restriction of Chemicals (“REACH”) regulations adopted by the European Union. Environmental regulation is increasing and we expect that our operations will be subject to additional environmental compliance requirements, which may expose us to additional costs. We are also subject to disclosure requirements related to the presence of "conflict minerals" in our products. To date, our compliance costs relating to environmental regulations have not resulted in a material adverse effect on our business, results of operations or financial condition.
Business Segment Data and Our Foreign Operations
We operate in the single industry segment of optical transport networking systems. Information concerning revenue, results of operations and revenue by geographic area is set forth in Item 7. “Management’s Discussion and Analysis of Financial Condition and Results of Operations” and in Note 16, “Segment Information,” of Notes to Consolidated Financial Statements, both of which are incorporated herein by reference. Information concerning identifiable assets is also set forth in Note 16, “Segment Information,” of Notes to Consolidated Financial Statements. Information on risks attendant to our foreign operations is set forth below in Item 1A. “Risk Factors.”
Executive Officers
Our executive officers and their ages and positions as of December 31, 2016, are set forth below:
Name | Age | Position | |
Thomas J. Fallon | 55 | Chief Executive Officer and Director | |
David F. Welch, Ph.D. | 56 | Co-founder, President and Director | |
Brad D. Feller | 43 | Chief Financial Officer | |
Robert J. Jandro | 61 | Senior Vice President, Worldwide Sales | |
James L. Laufman | 51 | Senior Vice President, General Counsel and Corporate Secretary | |
Thomas J. Fallon has served as our Chief Executive Officer since January 2010 and as a member of our board of directors since July 2009. Mr. Fallon also served as our President from January 2010 to June 2013, and as our Chief Operating Officer from October 2006 to December 2009. From April 2004 to September 2006, Mr. Fallon served as our Vice President of Engineering and Operations. From August 2003 to March 2004, Mr. Fallon was Vice President, Corporate Quality and Development Operations at Cisco Systems, Inc., a networking and
11
telecommunications company. From March 1991 to August 2003, Mr. Fallon served in a variety of functions at Cisco, including General Manager of the Optical Transport Business Unit and Vice President of Service Provider Manufacturing. Prior to joining Cisco, Mr. Fallon also served in various manufacturing roles at Sun Microsystems and Hewlett Packard. Mr. Fallon currently serves on one other public company board, Hercules Technology Growth Capital, Inc., a specialty finance company. Mr. Fallon also serves on the Engineering Advisory Board of the Cockrell School at the University of Texas. Mr. Fallon holds B.S.M.E. and M.B.A. degrees from the University of Texas at Austin.
David F. Welch, Ph.D. co-founded our company and has served as our President since June 2013. Dr. Welch has served as our Executive Vice President, Chief Strategy Officer from January 2004 to June 2013, as our Chief Development Officer/Chief Technology Officer from May 2001 to January 2005, as our Chief Marketing Officer from January 2005 to January 2009, and as a member of our board of directors from May 2001 to November 2006, and from October 2010 to present. Prior to joining us, Dr. Welch served in various executive roles, including as Chief Technology Officer of the Transmission Products Group of JDS Uniphase Corporation, an optical component company, and Chief Technology Officer and Vice President of Corporate Development of SDL Inc., an optical component company. Dr. Welch holds over 130 patents, and has been awarded the Optical Society of America's (“OSA”) Adolph Lomb Medal, Joseph Fraunhofer Award, the John Tyndall Award and the IET JJ Thompson Medal for Achievement in Electronics, in recognition of his technical contributions to the optical industry. He is a Fellow of OSA and the Institute of Electrical and Electronics Engineers. Dr. Welch holds a B.S. in Electrical Engineering from the University of Delaware and a Ph.D. in Electrical Engineering from Cornell University.
Brad D. Feller was appointed as our Chief Financial Officer in March 2014 after joining us as Senior Vice President of Finance in January 2014. Prior to joining us, Mr. Feller served as Interim Chief Financial Officer of Marvell Technology Group Ltd., a fabless semiconductor company, from October 2012 to December 2013, and as Marvell's Vice President, Corporate Controller, from September 2008 to October 2012. Prior to Marvell, Mr. Feller served as Corporate Controller for Integrated Device Technology, Inc., a semiconductor company, from April 2005 to September 2008 and Financial Reporting Manager from October 2003 to April 2005. Prior to that, Mr. Feller served in various roles at Ernst & Young LLP in the technology practice. Mr. Feller is a certified public accountant (inactive) in the State of California and holds a B.S. degree in Business Administration from San Jose State University.
Robert J. Jandro has served as our Senior Vice President, Worldwide Sales, since May 2013. Prior to joining us, Mr. Jandro served as Vice President of Business Development of Openwater Software, Inc., a large data and analytics cloud company, from January 2008 to August 2012. From February 2004 to November 2006, Mr. Jandro served as Chief Executive Officer and President of Nsite Software, Inc., an early cloud company acquired by Business Objects. From March 2000 to August 2002, Mr. Jandro served as Executive Vice President of Global Sales and Services for ONI Systems, an optical networking company. Prior to that, Mr. Jandro worked at Oracle where he last served as the Group Vice President of Oracle’s Communications and Utilities Industries. Mr. Jandro holds a M.S. in Management from Northwestern University’s Kellogg Graduate School of Management and a B.S. in Business from the University of Missouri-St. Louis.
James L. Laufman has served as our Senior Vice President, General Counsel and Corporate Secretary since October 2014. Prior to joining us, Mr. Laufman served as Vice President and General Counsel of Marvell Semiconductor, Inc. from October 2008 to October 2014. From September 1999 to October 2008. Mr. Laufman served as Vice President, General Counsel and Secretary of Integrated Device Technology, Inc. Prior to that, Mr. Laufman served as Senior Corporate Counsel for Quantum Corporation from January 1999 to September 1999. From November 1994 to December 1998, Mr. Laufman served as Vice President and General Counsel of Rohm Corporation. From December 1990 to November 1994, Mr. Laufman worked as an Associate Attorney at the Berliner Cohen and Popelka Allard law firms specializing in the litigation and resolution of commercial transaction matters. Mr. Laufman holds a B.S. in Business Administration, Finance (cum laude) from California State University, Chico and a J.D. from Santa Clara University School of Law.
Available Information
Our website address is http://www.infinera.com. Information contained on our website or any website referred to in this Form 10-K is not incorporated by reference unless expressly noted. We file reports with the Securities and Exchange Commission (“SEC”), which we make available on our website free of charge. These reports include Annual Reports on Form 10-K, Quarterly Reports on Form 10-Q, Current Reports on Form 8-K and amendments to such reports, each of which is provided on our website as soon as reasonably practicable after we electronically file such materials with or furnish them to the SEC. You can also read and copy any materials we file with the SEC at the SEC’s Public Reference Room at 100 F Street, N.E., Washington, DC 20549. You can obtain additional information about the operation of the Public Reference Room by calling the SEC at 1-800-SEC-0330. In addition, the SEC maintains a website (http://www.sec.gov) that contains reports, proxy and information statements, and other information regarding issuers that file electronically with the SEC, including us.
12
ITEM 1A. RISK FACTORS
Investing in our securities involves a high degree of risk. Set forth below and elsewhere in this Annual Report on Form 10-K, and in other documents we file with the SEC, are risks and uncertainties that could cause our actual results to differ materially from the results contemplated by the forward-looking statements contained in this Annual Report on Form 10-K. Because of the following factors, as well as other variables affecting our operating results, past financial performance should not be considered as a reliable indicator of future performance and investors should not use historical trends to anticipate results or trends in future periods. If any of such risks and uncertainties actually occurs, our business, financial condition or operating results could differ materially from the plans, projections and other forward-looking statements included in the section titled “Management’s Discussion and Analysis of Financial Condition and Results of Operations” and elsewhere in this Annual Report on Form 10-K and in our other public filings.
Our quarterly results may vary significantly from period to period, which could make our future results difficult to predict and could cause our operating results to fall below investor or analyst expectations.
Our quarterly results, in particular, our revenue, gross margins, operating expenses, operating margins and net income (loss), have historically varied from period to period and may continue to do so in the future. As a result, comparing our operating results on a period-to-period basis may not be meaningful. Our budgeted expense levels are based, in large part, on our expectations of future revenue and the development efforts associated with that future revenue. Given the relatively fixed nature of our operating costs including those relating to our personnel and facilities, particularly for our engineering personnel, any substantial adjustment to our expenses to account for lower levels of revenue will be difficult to execute and may take significant time. Consequently, if our revenue does not meet projected levels in the short-term, our inventory levels and operating expenses would be high relative to revenue, resulting in potential operating losses. For example, in the third quarter of 2016 and fourth quarter of 2016, we had operating losses of $10.9 million and $45.9 million, respectively, as a result of lower than expected revenue, lower gross margins and increased operating expenses.
Factors that may contribute to fluctuations in our quarterly results, many of which are outside our control and may be difficult to predict, include:
• | fluctuations in demand, sales cycles and prices for products and services, including discounts given in response to competitive pricing pressures, as well as the timing of purchases by our key customers; |
• | changes in customers’ budgets for optical transport network equipment purchases and changes or variability in their purchasing cycles; |
• | fluctuations in our customer, product or geographic mix, including the impact of new customer deployments, which typically carry lower gross margins, and increased customer consolidation, which may affect our ability to grow revenue; |
• | the timing of new product releases; |
• | how quickly, or at all, the markets in which we operate adopt our solutions; |
• | order cancellations or reductions or delays in delivery schedules by our customers; |
• | our ability to control costs, including our operating expenses and the costs and availability of components we purchase for our products; |
• | our ability to maintain volumes and yields on products manufactured in our internal manufacturing facilities; |
• | any significant changes in the competitive dynamics of our market, including any new entrants, or customer or competitor consolidation; |
• | readiness of customer sites for installation of our products as well as the availability of third party suppliers to provide contract engineering and installation services for us; |
• | the timing of recognizing revenue in any given quarter, including the impact of revenue recognition standards and any future changes in U.S. GAAP or new interpretations of existing accounting rules; |
• | the impact of a significant natural disaster, such as an earthquake, severe weather, or tsunami or other flooding, as well as interruptions or shortages in the supply of utilities such as water and |
13
electricity, in a key location such as our Northern California facilities, which is located near major earthquake fault lines and in a designated flood zone; and
• | general economic conditions in domestic and international markets. |
Many factors affecting our results of operations are beyond our control and make it difficult to predict our results for a particular quarter or to accurately predict future revenue beyond a one-quarter time horizon. If our revenue or operating results do not meet the expectations of investors or securities analysts or fall below any guidance we provide to the market, the price of our common stock may decline substantially.
Any delays in the development and introduction of our new products or in releasing enhancements to our existing products may harm our business.
Because our products are based on complex technology, including, in some cases, the development of next-generation PICs and specialized ASICs (key components of our optical engine), we may experience unanticipated delays in developing, improving, manufacturing or deploying these products. The development process for our optical engines is lengthy, and any modifications to our PICs, including the development of our next-generation optical engines, entail significant development cost and risks.
At any given time, various new product introductions and enhancements to our existing products, including future products based on our next-generation PICs and specialized ASICs, are in the development phase and are not yet ready for commercial manufacturing or deployment. We rely on third parties, some of which are relatively early stage companies, to develop and manufacture components for our next-generation products, which can require custom development. The maturing process from laboratory prototype to customer trials, and subsequently to general availability, involves a significant number of simultaneous development efforts. These efforts often must be completed in a timely manner so that they may be introduced into the product development cycle for our systems, and include:
• | completion of product development, including the development and completion of our next-generation PICs and specialized ASICs, and the completion of associated module development, including modules developed by third parties; |
• | the qualification and multiple sourcing of critical components; |
• | validation of manufacturing methods and processes; |
• | extensive quality assurance and reliability testing and staffing of testing infrastructure; |
• | validation of software; and |
• | establishment of systems integration and systems test validation requirements. |
Each of these steps, in turn, presents risks of failure, rework or delay, any one of which could decrease the speed and scope of product introduction and marketplace acceptance of our products. New generations of our PICs, specialized ASICs and intensive software testing are important to the timely introduction of new products and enhancements to our existing products, and are subject to these development risks. In addition, unexpected intellectual property disputes, failure of critical design elements, and a host of other development execution risks may delay, or even prevent, the introduction of new products or enhancements to our existing products. If we do not develop and successfully introduce or enhance products in a timely manner, our competitive position will suffer. In addition, if we do not develop and successfully introduce or enhance products in sufficient time so as to satisfy our customer’s expectations, we may lose future business from such customers and harm our reputation and our customer relationships, either of which would harm our business and operating results.
14
Our ability to increase our revenue will depend upon continued growth of demand by consumers and businesses for additional network capacity and on the level and timing of capital spending by our customers.
Our future success depends on factors that increase the amount of data transmitted over communications networks and the growth of optical transport networks to meet the increased demand for optical capacity. These factors include the growth of mobile, video and cloud-based services, increased broadband connectivity and the continuing adoption of high-capacity, revenue-generating services. If demand for such bandwidth does not continue, or slows down, the need for increased bandwidth across networks and the market for optical transport networking equipment may not continue to grow and our product sales would be negatively impacted.
In addition, demand for our products depends on the level and timing of capital spending in optical networks by service providers as they construct, expand and upgrade the capacity of their optical networks. Capital spending is cyclical in our industry and spending by customers can change on short notice. Any future decisions by our customers to reduce capital spending, whether caused by weakening economic conditions, changes in government regulations relating to telecommunications and data networks, or other reasons, could have a material adverse effect on our business, results of operations and financial condition.
Increased consolidation among our customers in the communications networking industry could adversely affect our business, financial condition and results of operations.
We have seen increased consolidation in the communications networking industry. For example, during 2016, Charter Communications completed its acquisition of Time Warner Cable, Inc. and Altice completed its acquisition of Cablevision, and during the first quarter of 2017, Verizon completed its acquisition of XO Communications. In addition, in 2016, CenturyLink announced its intent to acquire Level 3 Communications. In the short term, customer consolidation can lead to changes in buying patterns, slowdown in spending, redeployment of existing equipment or re-architecture of parts of an existing network or future networks, as the combined companies evaluate the needs of the combined business. In the longer term, the significant purchasing power of these large companies could increase pricing and competitive pressures for us, including the potential for decreases in our average selling prices. If one of our customers is acquired by another company that does not rely on us to provide it with products or relies on another provider of similar products, we may lose that customer’s business. Such consolidation may further reduce the number of customers that generate a significant percentage of our net revenue and may exacerbate the risks relating to dependence on a small number of customers. Any of the foregoing results could adversely affect our business, financial condition and results of operations.
We are dependent on a small number of key customers for a significant portion of our revenue from period to period and the loss of, or a significant reduction in, orders from one or more of our key customers would reduce our revenue and harm our operating results.
A relatively small number of customers account for a large percentage of our revenue from period to period. For example, for the fiscal year 2016, our top two customers accounted for approximately 25% of our total revenue and for fiscal year 2015, our top two customers accounted for approximately 30% of our total revenue. As a result, our business will be harmed if any of our key customers do not generate as much revenue as we forecast, stop purchasing from us, delay anticipated product purchases, or substantially reduce their orders to us. In addition, our business will be harmed if we fail to maintain our competitive advantage with our key customers. While we view our diverse customer base across multiple customer verticals as a strength, we expect a relatively small number of customers to continue to account for a large percentage of revenue from period to period.
Our ability to continue to generate revenue from our key customers will depend on our ability to maintain strong relationships with these customers and introduce new products that are desirable to these customers at competitive prices, and we may not be successful at doing so. In most cases, our sales are made to these customers pursuant to standard purchase agreements rather than long-term purchase commitments, and orders may be canceled or reduced readily. In the event of a cancellation or reduction of an order, we may not have enough time to reduce operating expenses to minimize the effect of the lost revenue on our business. Our operating results will continue to depend on our ability to sell our products to our key customers.
15
Our gross margin may fluctuate from quarter-to-quarter and may be adversely affected by a number of factors, some of which are beyond our control.
Our gross margin fluctuates from period-to-period and varies by customer and by product. Over the past eight fiscal quarters, our gross margin has ranged from 38.1% to 47.8%. Our gross margin is likely to continue to fluctuate and will be affected by a number of factors, including:
• | the mix in any period of the types of customers purchasing our products as well as the product mix; |
• | significant new deployments to existing and new customers, often with a higher portion of lower margin common equipment as we deploy network footprint; |
• | pricing and commercial terms designed to secure long-term customer relationships; |
• | the volume of Infinera Instant Bandwidth-enabled solutions sold, and Infinera Instant Bandwidth licenses activated; |
• | price discounts negotiated by our customers; |
• | charges for excess or obsolete inventory; |
• | changes in the price or availability of components for our products; |
• | changes in our manufacturing costs, including fluctuations in yields and production volumes; and |
• | changes in warranty related costs. |
It is likely that the average unit prices of our products will decrease over time in response to competitive pricing pressures, increased negotiated sales discounts, new product introductions by us or our competitors or other factors. In addition, some of our customer contracts contain clauses that require us to annually decrease the sales price of our products to these customers. In response, we will need to reduce the cost of our products through manufacturing efficiencies, design improvements and cost reductions from our supply partners. If these efforts are not successful or if we are unable to reduce our costs by more than the reduction in the price of our products, our revenue and gross margin will decline, causing our operating results to decline. Fluctuations in gross margin may make it difficult to manage our business and achieve or maintain profitability.
Aggressive business tactics by our competitors may harm our business.
The markets in which we compete are extremely competitive and this often results in aggressive business tactics by our competitors, including:
• | aggressively pricing their optical transport products and other portfolio products, including offering significant one-time discounts and guaranteed future price decreases; |
• | offering optical products at a substantial discount or for free when bundled together with broader technology purchases, such as router or wireless equipment purchases; |
• | providing financing, marketing and advertising assistance to customers; |
• | influencing customer requirements to emphasize different product capabilities, which better suit their products; and |
• | offering to repurchase our equipment from existing customers. |
The level of competition and pricing pressure tend to increase when competing for larger high-profile opportunities or during periods of economic weakness when there are fewer network build-out projects. If we fail to compete successfully against our current and future competitors, or if our current or future competitors continue or expand their aggressive business tactics, including those described above, demand for our products could decline, we could experience delays or cancellations of customer orders, and/or we could be required to reduce our prices to compete in the market.
16
If we lose key personnel or fail to attract and retain additional qualified personnel when needed, our business may be harmed.
Our success depends to a significant degree upon the continued contributions of our key management, engineering, sales and marketing, and finance personnel, many of whom would be difficult to replace. For example, senior members of our engineering team have unique technical experience that would be difficult to replace. We do not have long-term employment contracts or key person life insurance covering any of our key personnel. Because our products are complex, we must hire and retain a large number of highly trained customer service and support personnel to ensure that the deployment of our products does not result in network disruption for our customers. We believe our future success will depend in large part upon our ability to identify, attract and retain highly skilled managerial, engineering, sales, marketing, finance, and customer service and support personnel. Competition for these individuals is intense in our industry, especially in the San Francisco Bay Area where we are headquartered. We may not succeed in identifying, attracting and retaining appropriate personnel. The loss of the services of any of our key personnel, the inability to identify, attract or retain qualified personnel in the future or delays in hiring qualified personnel, particularly engineers and sales personnel, could make it difficult for us to manage our business and meet key objectives, such as timely product introductions.
The markets in which we compete are highly competitive and we may not be able to compete effectively.
Competition in the optical transport networking equipment market is intense, and we expect such competition to increase. In the long-haul market, our main competitors include WDM suppliers, such as Ciena, Coriant, Huawei, Nokia and ZTE. In the metro market we face the same competitors as in long-haul, plus Cisco, ADVA and Fujitsu. In addition, there are several smaller but established companies that offer one or more products that compete with our offerings. During 2016, several competitors including many named above announced or started to ship competing small-form-factor DCI solutions.
Competition in the markets we serve is based on any one or a combination of the following factors:
• | price and other commercial terms; |
• | functionality; |
• | form factor or density; |
• | power consumption; |
• | heat dissipation; |
• | customer qualification testing; |
• | existing business and customer relationships; |
• | the ability of products and services to meet customers’ immediate and future network requirements; |
• | installation and operational simplicity; |
• | service and support; |
• | security and encryption requirements; |
• | scalability and investment protection; and |
• | product lead times. |
In addition to the current competitors, other companies have, or may in the future develop, products that are or could be competitive with our products. We also expect to encounter further consolidation in the markets in which we compete. Consolidation among our competitors could lead to a changing competitive landscape, capabilities and market share, which could harm our results of operations.
Some of our competitors have substantially greater name recognition and technical, financial and marketing resources along with better established relationships with service providers and other potential customers than we have. Many of our competitors have more resources and more experience in developing or acquiring new products and technologies and in creating market awareness for those products and technologies. In addition, many of our competitors have the financial resources to offer competitive products at aggressive pricing levels that could prevent us from competing effectively. Further, many of our competitors have built long-
17
standing relationships with some of our prospective customers and have the ability to provide financing to customers and could, therefore, have an inherent advantage in selling products to those customers.
We also compete with low-cost producers that can increase pricing pressure on us and a number of smaller companies that provide competition for a specific product, customer segment or geographic market. In addition, we may also face increased competition from system and component companies that develop products based on commoditized or off-the-shelf hardware. These competitors often base their products on the latest commercially available technologies. Due to the narrower focus of their efforts, these competitors may achieve commercial availability of their products more quickly than we can and may provide attractive alternatives to our customers.
We must respond to rapid technological change and comply with evolving industry standards and requirements for our products to be successful.
The optical transport networking equipment market is characterized by rapid technological change, changes in customer requirements and evolving industry standards. We continually invest in research and development to sustain or enhance our existing products, but the introduction of new communications technologies and the emergence of new industry standards or requirements could render our products obsolete. Further, in developing our products, we have made, and will continue to make, assumptions with respect to which standards or requirements will be adopted by our customers and competitors. If the standards or requirements adopted by our prospective customers are different from those on which we have focused our efforts, market acceptance of our products would be reduced or delayed and our business would be harmed.
We are continuing to invest a significant portion of our research and development efforts in the development of our next-generation products. We expect our competitors to continue to improve the performance of their existing products and to introduce new products and technologies and to influence customers’ buying criteria so as to emphasize product capabilities that we do not, or may not, possess. To be competitive, we must properly anticipate future customer requirements and we must continue to invest significant resources in research and development, sales and marketing, and customer support. If we do not anticipate these future customer requirements and invest in the technologies necessary to enable us to have and to sell the appropriate solutions, it may limit our competitive position and future sales, which would have an adverse effect on our business and financial condition. We may not have sufficient resources to make these investments and we may not be able to make the technological advances necessary to be competitive.
Our business and operations have experienced rapid growth in recent years, including growth related to the acquisition of Transmode, and if we do not effectively manage any future growth or are unable to improve our systems, processes and controls, our operating results may be adversely affected.
We have experienced rapid growth and increased demand for our products in recent years. In addition, in periods of strong growth, our employee headcount and number of end customers have increased significantly. For example, from the end of fiscal 2014 to the end of fiscal 2016, our headcount increased from 1,495 to 2,240 employees. The growth and expansion of our business and product and service offerings places a continuous significant strain on our management, and operational and financial resources. To manage any future growth effectively, we must continue to improve and expand our information technology and financial infrastructure, our operating and administrative systems, and our ability to manage headcount and retain key talent.
We may not be able to successfully scale improvements to our enterprise resource planning system or implement or scale improvements to our other systems, processes and controls in an efficient or timely manner, or in a manner that does not negatively affect our operating results. In addition, our existing systems, processes and controls may not prevent or detect all errors, omissions or fraud. We may experience difficulties in managing improvements to our systems, processes and controls, or in connection with third-party software, which could disrupt existing customer relationships, cause us to lose customers, or increase our technical support costs. Our failure to improve our systems, processes and controls, or their failure to operate in the intended manner, may result in our inability to manage the growth of our business and to accurately forecast our revenue, expenses and earnings, or to prevent certain losses. Failure to manage any future growth effectively could result in increased costs, negatively impact our customers’ satisfaction with our products and services, and harm our operating results.
18
Our large customers have substantial negotiating leverage, which may cause us to agree to terms and conditions that result in decreased revenue due to lower average selling prices and potentially increased cost of sales leading to lower gross margin, all of which would harm our operating results.
Many of our customers are large service providers that have substantial purchasing power and leverage in negotiating contractual arrangements with us. Our customers have and may continue to seek advantageous pricing, payment and other commercial terms. We have and may continue to agree to unfavorable commercial terms with these customers, including the potential of reducing the average selling price of our products, increasing cost of sales or agreeing to extended payment terms in response to these commercial requirements or competitive pricing pressures. To maintain acceptable operating results, we will need to comply with these commercial terms, develop and introduce new products and product enhancements on a timely basis, and continue to reduce our costs.
The manufacturing process for our PICs is very complex and the partial or complete loss of our manufacturing facilities, or a reduction in yields or an inability to scale capacity to meet customer demands could harm our business.
The manufacturing process for our PICs and certain components of our products is very complex. In the event that any of the manufacturing facilities utilized to build these components were fully or partially destroyed, as a result of fire, water damage, or otherwise, it would limit our ability to produce our products. Because of the complex nature of our manufacturing facilities, such loss would take a considerable amount of time to repair or rebuild. The partial or complete loss of any of our manufacturing facilities, or an event causing the interruption in our use of such facility for any extended period of time would cause our business, financial condition and operating results to be harmed.
Minor deviations in the PIC manufacturing process can cause substantial decreases in yields and, in some cases, cause production to be suspended. In the past, we have had significant variances in our PIC yields, including production interruptions and suspensions and may have continued yield variances, including additional interruptions or suspensions in the future. We expect our manufacturing yield for our next-generation PICs to be lower initially and increase as we achieve full production. Poor yields from our PIC manufacturing process or defects, integration issues or other performance problems in our products could limit our ability to satisfy customer demand requirements, and could damage customer relations and cause business reputation problems, harming our business and operating results.
Our inability to obtain sufficient manufacturing capacity to meet demand, either in our own facilities or through foundry or similar arrangements with third parties, could harm our relationships with our customers, our business and our operating results.
We are dependent on sole source and limited source suppliers for several key components, and if we fail to obtain these components on a timely basis, we will not meet our customers’ product delivery requirements.
We currently purchase several key components for our products from single or limited sources. In particular, we rely on our own production of certain components of our products, such as PICs, and on third parties, including sole and limited source suppliers, for certain of the components of our products, including ASICs, field-programmable gate arrays, processors, and other semiconductor and optical components. We have increased our reliance on third parties to develop and manufacture components for certain products, some of which require custom development. We purchase these components on a purchase order basis and have no long-term contracts with many of these sole source or limited source suppliers. If any of our sole source or limited source suppliers suffer from capacity constraints, lower than expected yields, deployment delays, work stoppages or any other reduction or disruption in output, they may be unable to meet our delivery schedule which could result in lost revenue, additional product costs and deployment delays that could harm our business and customer relationships. Further, our suppliers could enter into exclusive arrangements with our competitors, refuse to sell their products or components to us at commercially reasonable prices or at all, go out of business or discontinue their relationships with us. We may be unable to develop alternative sources for these components.
The loss of a source of supply, or lack of sufficient availability of key components, could require us to redesign products that use such components, which could result in lost revenue, additional product costs and deployment delays that could harm our business and customer relationships. In addition, if we do not receive
19
critical components for our products in a timely manner, we will be unable to deliver those components to our contract manufacturer in a timely manner and would, therefore, be unable to meet our prospective customers’ product delivery requirements. In the past, we have experienced delivery delays because of lack of availability of components or reliability issues with components that we were purchasing. In addition, some of our suppliers have gone out of business, merged with another supplier, or limited their supply of components to us, which may cause us to experience longer than normal lead times and supply delays. We may in the future experience a shortage of certain components as a result of our own manufacturing issues, manufacturing issues at our suppliers or contract manufacturers, capacity problems experienced by our suppliers or contract manufacturers, strong demand in the industry for such components, or other disruptions in our supply chain. In addition, global macroeconomic conditions are likely to continue to create pressure on us and our suppliers to accurately project overall component demand and manufacturing capacity. These supplier disruptions may continue to occur in the future, which could limit our ability to produce our products and cause us to fail to meet a customer’s delivery requirements. Any failure to meet our customers’ product delivery requirements could harm our reputation and our customer relationships, either of which would harm our business and operating results.
If we fail to accurately forecast demand for our products, we may have excess or insufficient inventory, which may increase our operating costs, decrease our revenue and harm our business.
We are required to generate forecasts of future demand for our products several months prior to the scheduled delivery to our prospective customers. This requires us to make significant investments before we know if corresponding revenue will be recognized. Lead times for materials and components, including ASICs, that we need to order for the manufacture of our products vary significantly and depend on factors such as the specific supplier, contract terms and demand for each component at a given time. In the past, we have experienced lengthening in lead times for certain components. If the lead times for components are lengthened, we may be required to purchase increased levels of such components to satisfy our delivery commitments to our customers.
If we overestimate market demand for our products and, as a result, increase our inventory in anticipation of customer orders that do not materialize, we will have excess inventory, which could result in increased risk of obsolescence and significant inventory write-downs. Furthermore, this will result in reduced production volumes and our fixed costs will be spread across fewer units, increasing our per unit costs. If we underestimate demand for our products, we will have inadequate inventory, which could slow down or interrupt the manufacturing of our products and result in delays in shipments and our ability to recognize revenue. In addition, we may be unable to meet our supply commitments to customers, which could result in a loss of certain customer opportunities or a breach of our customer agreements resulting in payment of damages.
If our contract manufacturers do not perform as we expect, our business may be harmed.
We rely on third party contract manufacturers to perform a portion of the manufacturing of our products, and our future success will depend on our ability to have sufficient volumes of our products manufactured in a cost-effective and quality-controlled manner. We have engaged third parties to manufacture certain elements of our products at multiple contract manufacturing sites located around the world but do not have long-term agreements in place with some of our manufacturers and suppliers that will guarantee product availability, or the continuation of particular pricing or payment terms. There are a number of risks associated with our dependence on contract manufacturers, including:
• | reduced control over delivery schedules, particularly for international contract manufacturing sites; |
• | reliance on the quality assurance procedures of third parties; |
• | potential uncertainty regarding manufacturing yields and costs; |
• | potential lack of adequate capacity during periods of high demand; |
• | potential uncertainty related to the use of international contract manufacturing sites; |
• | limited warranties on components; |
• | potential misappropriation of our intellectual property; and |
• | potential manufacturing disruptions (including disruptions caused by geopolitical events, military actions or natural disasters). |
20
Any of these risks could impair our ability to fulfill orders. Our contract manufacturers may not be able to meet the delivery requirements of our customers, which could decrease customer satisfaction and harm our product sales. If our contract manufacturers are unable or unwilling to continue manufacturing our products or components of our products in required volumes or our relationship with any of our contract manufacturers is discontinued for any reason, we would be required to identify and qualify alternative manufacturers, which could cause us to be unable to meet our supply requirements to our customers and result in the breach of our customer agreements. Qualifying a new contract manufacturer and commencing volume production is expensive and time-consuming and if we are required to change or qualify a new contract manufacturer, we could lose revenue and damage our customer relationships.
If we fail to protect our intellectual property rights, our competitive position could be harmed or we could incur significant expense to enforce our rights.
We depend on our ability to protect our proprietary technology. We rely on a combination of methods to protect our intellectual property, including limiting access to certain information, and utilizing trade secret, patent, copyright and trademark laws and confidentiality agreements with employees and third parties, all of which offer only limited protection. The steps we have taken to protect our proprietary rights may be inadequate to preclude misappropriation or unauthorized disclosure of our proprietary information or infringement of our intellectual property rights, and our ability to police such misappropriation, unauthorized disclosure or infringement is uncertain, particularly in countries outside of the United States. This is likely to become an increasingly important issue if we expand our operations and product development into countries that provide a lower level of intellectual property protection. We do not know whether any of our pending patent applications will result in the issuance of patents or whether the examination process will require us to narrow our claims, and even if patents are issued, they may be contested, circumvented or invalidated. Moreover, the rights granted under any issued patents may not provide us with a competitive advantage, and, as with any technology, competitors may be able to develop similar or superior technologies to our own now or in the future.
Protecting against the unauthorized use of our products, trademarks and other proprietary rights is expensive, difficult, time consuming and, in some cases, impossible. Litigation may be necessary in the future to enforce or defend our intellectual property rights, to protect our trade secrets or to determine the validity or scope of the proprietary rights of others. Such litigation could result in substantial cost and diversion of management resources, either of which could harm our business, financial condition and operating results. Furthermore, many of our current and potential competitors have the ability to dedicate substantially greater resources to enforce their intellectual property rights than we do. Accordingly, despite our efforts, we may not be able to prevent third parties from infringing upon or misappropriating our intellectual property.
Claims by others that we infringe their intellectual property could harm our business.
Our industry is characterized by the existence of a large number of patents and frequent claims and related litigation regarding patent and other intellectual property rights. In particular, many leading companies in the optical transport networking industry, including our competitors, have extensive patent portfolios with respect to optical transport networking technology. In addition, patent holding companies seek to monetize patents they have purchased or otherwise obtained. We expect that infringement claims may increase as the number of products and competitors in our market increases and overlaps occur. From time to time, third parties may assert exclusive patent, copyright, trademark and other intellectual property rights to technologies and related standards that are important to our business or seek to invalidate the proprietary rights that we hold. Competitors or other third parties have, and may continue to assert claims or initiate litigation or other proceedings against us or our manufacturers, suppliers or customers alleging infringement of their proprietary rights, or seeking to invalidate our proprietary rights, with respect to our products and technology. In addition, we have had certain patent licenses with third parties that have not been renewed, and if we cannot successfully renew these licenses, we could face claims of infringement. In the event that we are unsuccessful in defending against any such claims, or any resulting lawsuit or proceedings, we could incur liability for damages and/or have valuable proprietary rights invalidated.
Any claim of infringement from a third party, even one without merit, could cause us to incur substantial costs defending against the claim, and could distract our management from running our business. Furthermore, a party making such a claim, if successful, could secure a judgment that requires us to pay substantial damages or could include an injunction or other court order that could prevent us from offering our products. In addition, we might be required to seek a license for the use of such intellectual property, which may not be available on commercially reasonable terms or at all. Alternatively, we may be required to develop non-infringing technology,
21
which would require significant effort and expense and may ultimately not be successful. Any of these events could harm our business, financial condition and operating results. Competitors and other third parties have and may continue to assert infringement claims against our customers and sales partners. Any of these claims would require us to initiate or defend potentially protracted and costly litigation on their behalf, regardless of the merits of these claims, because we generally indemnify our customers and sales partners from claims of infringement of proprietary rights of third parties. If any of these claims succeed, we may be forced to pay damages on behalf of our customers or sales partners, which could have an adverse effect on our business, financial condition and operating results.
We may also be required to indemnify some customers under our contracts if a third party alleges, or a court finds, that our products have infringed upon the proprietary rights of other parties. From time to time, we have agreed to indemnify select customers for claims made against our products, where such claims allege infringement of third party intellectual property rights, including, but not limited to, patents, registered trademarks and/or copyrights. If we are required to make a significant payment under any of our indemnification obligations, our result of operations may be harmed.
We incorporate open source software into our products. Although we monitor our use of open source software closely, the terms of many open source licenses have not been interpreted by U.S. courts, and there is a risk that such licenses could be construed in a manner that could impose unanticipated conditions or restrictions on our ability to commercialize our products. In such event, we could be required to seek licenses from third parties in order to continue offering our products, to re-engineer our products or to discontinue the sale of our products in the event re-engineering cannot be accomplished on a timely basis, any of which could adversely affect our business, operating results and financial condition.
Our sales cycle can be long and unpredictable, which could result in an unexpected revenue shortfall in any given quarter.
Our products can have a lengthy sales cycle, which can extend from six to twelve months and may take even longer for larger prospective customers. Our prospective customers conduct significant evaluation, testing, implementation and acceptance procedures before they purchase our products. We incur substantial sales and marketing expenses and expend significant management effort during this time, regardless of whether we make a sale.
Because the purchase of our equipment involves substantial cost, most of our customers wait to purchase our equipment until they are ready to deploy it in their network. As a result, it is difficult for us to accurately predict the timing of future purchases by our customers. In addition, product purchases are often subject to budget constraints, multiple approvals and unplanned administrative processing and other delays. If sales expected from customers for a particular quarter are not realized in that quarter or at all, our revenue will be negatively impacted.
The trading price of our common stock has been volatile and is likely to be volatile in the future.
The trading prices of our common stock and the securities of other technology companies have been and may continue to be highly volatile. Factors affecting the trading price of our common stock include:
• | variations in our operating results; |
• | announcements of technological innovations, new services or service enhancements, the gain or loss of customers, strategic alliances or agreements by us or by our competitors; |
• | market conditions in our industry, the industries of our customers and the economy as a whole; |
• | changes in the estimates of our future operating results or external guidance on those results or changes in recommendations or business expectations by any securities analysts that elect to follow our common stock; |
• | recruitment or departure of key personnel; |
• | mergers and acquisitions by us, by our competitors or by our customers; and |
• | adoption or modification of regulations, policies, procedures or programs applicable to our business. |
22
In addition, if the market for technology stocks or the broader stock market experience a loss of investor confidence, the trading price of our common stock could decline for reasons unrelated to our business, financial condition or operating results. The trading price of our common stock might also decline in reaction to events that affect other companies in our industry even if these events do not directly affect us. Each of these factors, among others, could harm the value of your investment in our common stock. Some companies that have had volatile market prices for their securities have had securities class action lawsuits filed against them. If a suit were filed against us, regardless of its merits or outcome, it could result in substantial costs and divert management’s attention and resources.
Unfavorable macroeconomic and market conditions may adversely affect our industry, business and gross margin.
Our business depends on the overall demand for additional bandwidth capacity and on the economic health and willingness of our customers and potential customers to make capital commitments to purchase our products and services. As a result of macroeconomic or market uncertainty, we may face new risks that we have not yet identified. In addition, a number of the risks associated with our business, which are disclosed in these risk factors, may increase in likelihood, magnitude or duration.
In the past, unfavorable macroeconomic and market conditions have resulted in sustained periods of decreased demand for optical communications products. These conditions may also result in the tightening of credit markets, which may limit or delay our customers’ ability to obtain necessary financing for their purchases of our products. A lack of liquidity in the capital markets or the continued uncertainty in the global economic environment may cause our customers to delay or cancel their purchases, increase the time they take to pay or default on their payment obligations, each of which would negatively affect our business and operating results. Weakness and uncertainty in the global economy could cause some of our customers to become illiquid, delay payments or adversely affect our collection of their accounts, which could result in a higher level of bad debt expense. In addition, currency fluctuations could negatively affect our international customers’ ability or desire to purchase our products.
Challenging economic conditions have from time to time contributed to slowdowns in the telecommunications industry in which we operate. Such slowdowns may result in:
• | reduced demand for our products as a result of constraints on capital spending by our customers; |
• | increased price competition for our products, not only from our competitors, but also as a result of our customer’s or potential customer’s utilization of inventoried or underutilized products, which could put additional downward pressure on our near term gross profits; |
• | risk of excess or obsolete inventories; |
• | excess manufacturing capacity and higher associated overhead costs as a percentage of revenue; and |
• | more limited ability to accurately forecast our business and future financial performance. |
A lack of liquidity and economic uncertainty may adversely affect our suppliers or the terms on which we purchase products from these suppliers. It may also cause some of our suppliers to become illiquid. Any of these impacts could limit our ability to obtain components for our products from these suppliers and could adversely impact our supply chain or the delivery schedule to our customers. This also could require us to purchase more expensive components, or re-design our products, which could cause increases in the cost of our products and delays in the manufacturing and delivery of our products. Such events could harm our gross margin and harm our reputation and our customer relationships, either of which could harm our business and operating results.
23
Product performance problems, including undetected errors in our hardware or software, or deployment delays could harm our business and reputation.
The development and production of products with high technology content is complicated and often involves problems with software, components and manufacturing methods. Complex hardware and software systems, such as our products, can often contain undetected errors when first introduced or as new versions are released. In addition, errors associated with components we purchase from third parties, including customized components, may be difficult to resolve. We have experienced issues in the past in connection with our products, including failures due to the receipt of faulty components from our suppliers. In addition, performance issues can be heightened during periods where we are developing and introducing multiple new products to the market, as any performance issues we encounter in one technology or product could impact the performance or timing of delivery of other products. Our products may suffer degradation of performance and reliability over time.
If reliability, quality or network monitoring problems develop, a number of negative effects on our business could result, including:
• | reduced orders from existing customers; |
• | declining interest from potential customers; |
• | delays in our ability to recognize revenue or in collecting accounts receivables; |
• | costs associated with fixing software or hardware defects or replacing products; |
• | high service and warranty expenses; |
• | delays in shipments; |
• | high inventory excess and obsolescence expense; |
• | high levels of product returns; |
• | diversion of our engineering personnel from our product development efforts; and |
• | payment of liquidated damages, performance guarantees or similar penalties. |
Because we outsource the manufacturing of certain components of our products, we may also be subject to product performance problems as a result of the acts or omissions of third parties.
From time to time, we encounter interruptions or delays in the activation of our products at a customer’s site. These interruptions or delays may result from product performance problems or from issues with installation and activation, some of which are outside our control. If we experience significant interruptions or delays that we cannot promptly resolve, the associated revenue for these installations may be delayed or confidence in our products could be undermined, which could cause us to lose customers and fail to add new customers.
Our debt obligations may adversely affect our ability to raise additional capital and will be a burden on our future cash flows and cash resources, particularly if these obligations are settled in cash upon maturity or sooner upon an event of default.
In May 2013, we issued the $150.0 million of 1.75% convertible senior notes due June 1, 2018 ("the “Notes”). The degree to which we are leveraged could have important consequences, including, but not limited to, the following:
• | our ability to obtain additional financing in the future for working capital, capital expenditures, acquisitions, litigation, general corporate or other purposes may be limited; |
• | a substantial portion of our future cash balance may be dedicated to the payment of the principal of our indebtedness as we have the intention to pay the principal amount of the Notes in cash upon conversion if specified conditions are met or when due, such that we would not have those funds available for use in our business; and |
• | if, upon any conversion of the Notes we are required to satisfy our conversion obligation with shares of our common stock or if a make-whole fundamental change occurs, our existing stockholders’ interest in us would be diluted. |
24
Our ability to meet our payment obligations under our debt instruments depends on our future cash flow performance. This, to some extent, is subject to general economic, financial, competitive, legislative and regulatory factors, as well as other factors that may be beyond our control. There can be no assurance that our business will generate positive cash flow from operations, or that additional capital will be available to us, in an amount sufficient to enable us to meet our debt payment obligations and to fund other liquidity needs. If we are unable to generate sufficient cash flow to service our debt obligations, we may need to refinance or restructure our debt, sell assets, reduce or delay capital investments, or seek to raise additional capital. If we were unable to implement one or more of these alternatives, we may be unable to meet our debt payment obligations. As a result, we may be more vulnerable to economic downturns, less able to withstand competitive pressures and less flexible in responding to changing business and economic conditions.
We may issue additional shares of our common stock in connection with the conversion of the Notes, and thereby dilute our existing stockholders and potentially adversely affect the market price of our common stock.
In the event that some or all of the Notes are converted into common stock, the ownership interests of existing stockholders will be diluted, and any sales in the public market of any shares of our common stock issuable upon such conversion of the Notes could adversely affect the prevailing market price of our common stock. In addition, the anticipated conversion of the Notes could depress the market price of our common stock.
The make-whole fundamental change provisions of the Notes may delay or prevent an otherwise beneficial takeover attempt of us.
If a make-whole fundamental change such as an acquisition of our company occurs prior to the maturity of the Notes, under certain circumstances, the conversion rate for the Notes will increase such that additional shares of our common stock will be issued upon conversion of the Notes in connection with such make-whole fundamental change. The increase in the conversion rate will be determined based on the date on which the make-whole fundamental change occurs or becomes effective and the price paid (or deemed paid) per share of our common stock in such transaction. This increase will be dilutive to our existing stockholders. Our obligation to increase the conversion rate upon the occurrence of a make-whole fundamental change may, in certain circumstances, delay or prevent a takeover of us that might otherwise be beneficial to our stockholders.
If we need additional capital in the future, it may not be available to us on favorable terms, or at all.
Our business requires significant capital. We have historically relied on outside debt or equity financing as well as cash flow from operations to fund our operations, capital expenditures and expansion. We may require additional capital from equity or debt financings in the future to fund our operations or respond to competitive pressures or strategic opportunities. In the event that we require additional capital, we may not be able to secure timely additional financing on favorable terms, or at all. The terms of any additional financing may place limits on our financial and operating flexibility. If we raise additional funds through further issuances of equity, convertible debt securities or other securities convertible into equity, our existing stockholders could suffer dilution in their percentage ownership of our company, and any new securities we issue could have rights, preferences and privileges senior to those of holders of our common stock. If we are unable to obtain adequate financing or financing on terms satisfactory to us, if and when we require it, our ability to grow or support our business and to respond to business challenges could be limited and our business will be harmed.
Our international sales and operations subject us to additional risks that may harm our operating results.
Sales of our products into international markets are an important part of our business. During fiscal years 2016 and 2015, we derived approximately 38% and 32%, respectively, of our revenue from customers outside of the United States. We expect that significant management attention and financial resources will be required for our international activities over the foreseeable future as we continue to expand our international presence. We have a limited history and experience selling our products into international markets, such as Asia Pacific, Middle East and Africa, and Latin America. Furthermore, in some countries, our success in selling our products and growing revenue will depend in part on our ability to form relationships with local partners. Our inability to identify appropriate partners or reach mutually satisfactory arrangements for international sales of our products could impact our ability to maintain or increase international market demand for our products. In addition, many of the companies we compete against internationally have greater name recognition and a more substantial sales and marketing presence.
25
We have sales and support personnel in numerous countries worldwide. In addition, we have established development centers in Canada, China, India and Sweden. There is no assurance that our reliance upon development resources in international locations will enable us to achieve meaningful cost reductions or greater resource efficiency.
Our international operations are subject to inherent risks, and our future results could be adversely affected by a variety of factors, many of which are outside of our control, including:
• | greater difficulty in collecting accounts receivable and longer collection periods; |
• | difficulties of managing and staffing international offices, and the increased travel, infrastructure and legal compliance costs associated with multiple international locations; |
• | political, social and economic instability, including wars, terrorism, political unrest, boycotts, curtailment of trade and other business restrictions; |
• | tariff and trade barriers and other regulatory requirements or contractual limitations on our ability to sell or develop our products in certain foreign markets; |
• | less effective protection of intellectual property than is afforded to us in the United States or other developed countries; |
• | local laws and practices that favor local companies, including business practices that we are prohibited from engaging in by the Foreign Corrupt Practices Act and other anti-corruption laws and regulations; |
• | potentially adverse tax consequences; and |
• | effects of changes in currency exchange rates, particularly relative increases in the exchange rate of the U.S. dollar versus other currencies that could negatively affect our financial results and cash flows. |
International customers may also require that we comply with certain testing or customization of our products to conform to local standards. The product development costs to test or customize our products could be extensive and a material expense for us.
Our international operations are subject to increasingly complex foreign and U.S. laws and regulations, including but not limited to anti-corruption laws, such as the Foreign Corrupt Practices Act and the UK Bribery Act and equivalent laws in other jurisdictions, antitrust or competition laws, and data privacy laws, among others. Violations of these laws and regulations could result in fines and penalties, criminal sanctions against us, our officers, or our employees, prohibitions on the conduct of our business and on our ability to offer our products and services in one or more countries, and could also materially affect our reputation, our international expansion efforts, our ability to attract and retain employees, our business, and our operating results. Although we have implemented policies, procedures and training designed to ensure compliance with these laws and regulations, there can be no complete assurance that any individual employee, contractor or agent will not violate our policies. Additionally, the costs of complying with these laws (including the costs of investigations, auditing and monitoring) could also adversely affect our current or future business.
As we continue to expand our business globally, our success will depend, in large part, on our ability to effectively anticipate and manage these and other risks and expenses associated with our international operations. For example, political instability and uncertainty in the European Union and, in particular, the United Kingdom's pending exit from the E.U. (Brexit) as well as other countries potentially choosing to exit the E.U., could slow economic growth in the region, affect foreign exchange rates, and could further discourage near-term economic activity, including our customers delaying purchases of our products. Our failure to manage any of these risks successfully could harm our international operations and reduce our international sales, and business generally, adversely affecting our business, operating results and financial condition.
26
We may be adversely affected by fluctuations in currency exchange rates.
A portion of our sales and expenses stem from countries outside of the United States, and are in currencies other than U.S. dollars, and therefore subject to foreign currency fluctuation. Accordingly, fluctuations in foreign currency rates could have a material impact on our financial results in future periods. We may enter into other financial contracts to reduce the impact of foreign currency fluctuations. We currently enter into foreign currency exchange forward contracts to reduce the impact of foreign currency fluctuations on accounts receivable. These forward contracts reduce the impact of currency exchange rate movements on certain transactions, but do not cover all foreign-denominated transactions and therefore do not entirely eliminate the impact of fluctuations in exchange rates that could negatively affect our results of operations and financial condition.
Our effective tax rate may increase or fluctuate, which could increase our income tax expense and reduce our net income.
Our effective tax rate can be adversely affected by several factors, many of which are outside of our control, including:
• | changes in the valuation of our deferred tax assets and liabilities, and in deferred tax valuation allowances; |
• | changes in the relative proportions of revenues and income before taxes in the various jurisdictions in which we operate that have differing statutory tax rates; |
• | changing tax laws, regulations, rates and interpretations in multiple jurisdictions in which we operate; |
• | changes in accounting and tax treatment of equity-based compensation; |
• | changes to the financial accounting rules for income taxes; and |
• | the resolution of issues arising from tax audits. |
The international tax environment continues to change as a result of both coordinated actions by governments and unilateral measures designed by individual countries, both intended to tackle concerns over base erosion and profit shifting (“BEPS”) and perceived international tax avoidance techniques. The recommendations of the BEPS Project led by the Organization for Economic Cooperation and Development are involved in much of the coordinated activity, although the timing and methods of implementation vary. Additionally, comprehensive U.S. tax reform has been stated to be a priority for the U.S. Congress and the new administration. Such changes in tax laws or their interpretation, if adopted, could adversely affect our effective tax rates and our results.
If we fail to maintain effective internal control over financial reporting in the future, the accuracy and timing of our financial reporting may be adversely affected.
We are required to comply with Section 404 of the Sarbanes-Oxley Act of 2002. The provisions of the act require, among other things, that we maintain effective internal control over financial reporting and disclosure controls and procedures. Preparing our financial statements involves a number of complex processes, many of which are done manually and are dependent upon individual data input or review. These processes include, but are not limited to, calculating revenue, deferred revenue and inventory costs. While we continue to automate our processes and enhance our review and put in place controls to reduce the likelihood for errors, we expect that for the foreseeable future, many of our processes will remain manually intensive and thus subject to human error.
Any acquisitions we make could disrupt our business and harm our financial condition and operations.
We may make strategic acquisitions of businesses, technologies and other assets. For example, we completed the acquisition of Transmode in August 2015. If we are not able to achieve the anticipated strategic benefits of such acquisitions, it could adversely affect our business, financial condition and results of operations. In addition, the market price of our common stock could be adversely affected if the integration or the anticipated financial and strategic benefits of such acquisitions are not realized as rapidly as, or to the extent anticipated by investors and analysts.
27
The expansion of our business through acquisitions allows us to complement our technological capabilities and address new markets. In the event of any future acquisitions, we may not ultimately strengthen our competitive position or achieve our goals, or they may be viewed negatively by customers, financial markets or investors and we could:
• | issue stock that would dilute our current stockholders’ percentage ownership; |
• | incur debt and assume other liabilities; |
• | use a substantial portion of our cash resources; or |
• | incur amortization expenses related to other intangible assets and/or incur large and immediate write-offs. |
Acquisitions can result in adverse tax consequences, warranty or product liability exposure related to acquired assets, additional stock-based compensation expense, and write-up of acquired inventory to fair value. In addition, we may record goodwill and other purchased intangible assets in connection with an acquisition and incur impairment charges in the future. If our actual results, or the plans and estimates used in future impairment analyses, are less favorable than the original estimates used to assess the recoverability of these assets, we could incur additional impairment charges.
Acquisitions also involve numerous risks that could disrupt our ongoing business and distract our management team, including:
• | problems integrating the acquired operations, technologies or products with our own; |
• | diversion of management’s attention from our core business; |
• | adverse impact on overall company operating results; |
• | adverse effects on existing business relationships with suppliers and customers; |
• | risks associated with entering new markets; and |
• | loss of key employees. |
Our failure to adequately manage the risks associated with an acquisition could have an adverse effect on our business, financial condition and operating results.
Unforeseen health, safety and environmental costs could harm our business.
Our manufacturing operations use substances that are regulated by various federal, state and international laws governing health, safety and the environment, including the Waste Electrical and Electronic Equipment Directive, Directive on the Restriction of the Use of Certain Hazardous Substances in Electrical and Electronic Equipment, and the Registration, Evaluation, Authorization, and Restriction of Chemicals regulations adopted by the European Union. If we experience a problem with complying with these regulations, it could cause an interruption or delay in our manufacturing operations or could cause us to incur liabilities for any costs related to health, safety or environmental remediation. We could also be subject to liability if we do not handle these substances in compliance with safety standards for storage and transportation and applicable laws. If we experience a problem or fail to comply with such safety standards, our business, financial condition and operating results may be harmed.
28
We are subject to governmental regulations that could adversely affect our business.
We are subject to export control laws that limit which products we sell and where and to whom we sell our products. These export control laws also limit our ability to conduct product development activities in certain countries. In addition, various countries regulate the import of certain technologies and have enacted laws that could limit our ability to distribute our products or could limit our customers’ ability to implement our products in those countries. Changes in our products or changes in import and export regulations may create delays in the introduction of our products in international markets, prevent our customers with international operations from deploying our products throughout their global systems or, in some cases, prevent the import and export of our products to certain countries altogether. Any change in import and export regulations or related legislation, shift in approach to the enforcement or scope of existing regulations, or change in the countries, persons or technologies targeted by such regulations, could result in decreased use of our products by, or in our decreased ability to export or sell our products to, existing or potential customers with international operations. Failure to comply with these and similar laws on a timely basis, or at all, decreased use of our products or any limitation on our ability to export or sell our products would adversely affect our business, financial condition and operating results.
Our product or manufacturing standards could also be impacted by new or revised environmental rules and regulations or other social initiatives. For instance, the SEC adopted new disclosure requirements in 2012 relating to the sourcing of certain minerals from the Democratic Republic of Congo and certain other adjoining countries. Those rules, which required reporting for the first time in calendar 2014, could adversely affect our costs, the availability of minerals used in our products and our relationships with customers and suppliers.
The Federal Communications Commission (“FCC”) has jurisdiction over the entire U.S. communications industry and, as a result, our products and our U.S. customers are subject to FCC rules and regulations. Current and future FCC regulations, including regulations on net neutrality or generally affecting communications services, our products or our customers’ businesses could negatively affect our business. In addition, international regulatory standards could impair our ability to develop products for international customers in the future. Moreover, many jurisdictions are evaluating or implementing regulations relating to cybersecurity, privacy and data protection, which can affect the market and requirements for networking and communications equipment. Delays caused by our compliance with regulatory requirements could result in postponements or cancellations of product orders. Further, we may not be successful in obtaining or maintaining any regulatory approvals that may, in the future, be required to operate our business. Any failure to obtain such approvals could harm our business and operating results.
Natural disasters, terrorist attacks or other catastrophic events could harm our operations.
Our headquarters and the majority of our infrastructure, including our PIC fabrication manufacturing facility, are located in Northern California, an area that is susceptible to earthquakes, floods and other natural disasters. Further, a terrorist attack aimed at Northern California or at the United States energy or telecommunications infrastructure could hinder or delay the development and sale of our products. In the event that an earthquake, terrorist attack or other man-made or natural catastrophe were to destroy any part of our facilities, or certain of our contract manufacturers’ facilities, destroy or disrupt vital infrastructure systems or interrupt our operations for any extended period of time, our business, financial condition and operating results would be harmed.
29
Security incidents, such as data breaches and cyber-attacks, could compromise our intellectual property and proprietary or confidential information and cause significant damage to our business and reputation.
In the ordinary course of our business, we maintain sensitive data on our networks, including data related to our intellectual property and data related to our business, customers and business partners, which is considered proprietary or confidential information. We believe that companies in the technology industry have been increasingly subject to a wide variety of security incidents, cyber-attacks and other attempts to gain unauthorized access. While the secure maintenance of this information is critical to our business and reputation, our network and storage applications may be subject to unauthorized access by hackers or breached due to operator error, malfeasance or other system disruptions. It may be difficult to anticipate or immediately detect such security incidents or data breaches and the damage caused as a result. Accordingly, a data breach, cyber-attack, or unauthorized access or disclosure of our information, could compromise our intellectual property and reveal proprietary or confidential business information. In addition, these security incidents could also cause us to incur significant remediation costs and expenses, disrupt key business operations, subject us to liability and divert attention of management and key information technology resources, any of which could cause significant harm to our business and reputation.
Anti-takeover provisions in our charter documents and Delaware law could discourage, delay or prevent a change in control of our company and may affect the trading price of our common stock.
We are a Delaware corporation and the anti-takeover provisions of the Delaware General Corporation Law, which apply to us, may discourage, delay or prevent a change in control by prohibiting us from engaging in a business combination with an interested stockholder for a period of three years after the person becomes an interested stockholder, even if a change of control would be beneficial to our existing stockholders. In addition, our amended and restated certificate of incorporation and amended and restated bylaws may discourage, delay or prevent a change in our management or control over us that stockholders may consider favorable. Our amended and restated certificate of incorporation and amended and restated bylaws:
• | authorize the issuance of “blank check” convertible preferred stock that could be issued by our board of directors to thwart a takeover attempt; |
• | establish a classified board of directors, as a result of which the successors to the directors whose terms have expired will be elected to serve from the time of election and qualification until the third annual meeting following their election; |
• | require that directors only be removed from office for cause and only upon a supermajority stockholder vote; |
• | provide that vacancies on the board of directors, including newly-created directorships, may be filled only by a majority vote of directors then in office rather than by stockholders; |
• | prevent stockholders from calling special meetings; and |
• | prohibit stockholder action by written consent, requiring all actions to be taken at a meeting of the stockholders. |
30
ITEM 1B. UNRESOLVED STAFF COMMENTS
Not applicable.
ITEM 2. PROPERTIES
Our headquarters are located in Sunnyvale, California. We lease facilities in North America, Europe and Asia. The following is a summary of the locations, functions and approximate square footage of those facilities as of December 31, 2016:
Location | Function | Square Footage | |
Sunnyvale, CA | Corporate headquarters and manufacturing | 321,000 | |
Allentown, PA | Manufacturing and research and development | 60,000 | |
Annapolis Junction, MD | Research and development, service and support | 12,000 | |
Carrollton, TX | Sales, service and support | 5,000 | |
Kanata, Canada | Research and development | 13,000 | |
Stockholm, Sweden | Research and development, sales, service and support | 78,000 | |
London, United Kingdom | Sales, service and support | 6,000 | |
Bangalore, India | Software development | 122,000 | |
Beijing, China | Research and development | 22,000 | |
Hong Kong, China | Sales, service and support | 2,000 | |
Tokyo, Japan | Sales and support | 2,000 | |
The above leases expire between 2017 and 2029. We intend to add new facilities or to expand existing facilities as we add employees, and we believe that suitable additional or substitute space will be available as needed to accommodate any such expansion of our operations. We believe that our existing facilities are adequate to meet our business needs through the next 12 months.
ITEM 3. LEGAL PROCEEDINGS
On November 23, 2016, Oyster Optics, LLP (“Oyster Optics”) filed a complaint against us in the United States District Court for the Eastern District of Texas. The complaint asserts U.S. Patent Nos. 6,469,816, 6,476,952, 6,594,055, 7,099,592, 7,620,327, 8,374,511 and 8,913,898 (collectively, the “Oyster Optics patents in suit”). The complaint seeks unspecified damages and a permanent injunction. We believe that we do not infringe any valid and enforceable claim of the Oyster Optics patents in suit, and intend to litigate this action vigorously. Because this action is in the early stages, we are unable to reasonably estimate the possible loss or range of loss, if any, arising from this matter.
In addition to the matter described above, we are subject to various legal proceedings, claims and litigation arising in the ordinary course of business. While the outcome of these matters is currently not determinable, we do not expect that the ultimate costs to resolve these matters will have a material effect on our consolidated financial position, results of operations or cash flows.
ITEM 4. MINE SAFETY DISCLOSURES
Not Applicable.
31
PART II
ITEM 5. | MARKET FOR REGISTRANT’S COMMON EQUITY, RELATED STOCKHOLDER MATTERS AND ISSUER PURCHASES OF EQUITY SECURITIES |
Our common stock is listed on the NASDAQ Global Select Market under the symbol “INFN.” The following table sets forth, for the time periods indicated, the high and low sales prices of our common stock as reported on the NASDAQ Global Select Market.
High | Low | ||||||
Fourth Quarter 2016 | $ | 9.62 | $ | 7.23 | |||
Third Quarter 2016 | $ | 13.24 | $ | 8.20 | |||
Second Quarter 2016 | $ | 16.25 | $ | 10.95 | |||
First Quarter 2016 | $ | 19.16 | $ | 13.02 | |||
Fourth Quarter 2015 | $ | 22.85 | $ | 16.98 | |||
Third Quarter 2015 | $ | 25.24 | $ | 18.35 | |||
Second Quarter 2015 | $ | 22.95 | $ | 17.58 | |||
First Quarter 2015 | $ | 19.70 | $ | 13.00 | |||
As of February 15, 2017, there were 102 registered holders of record of Infinera’s common stock. A substantially greater number of holders of Infinera common stock are “street name” or beneficial holders, whose shares are held by banks, brokers and other financial institutions.
We have not paid any cash dividends on our common stock and do not intend to pay any cash dividends on common stock in the near future.
32
STOCK PERFORMANCE GRAPH
The following graph compares the cumulative five-year total return provided stockholders on our common stock relative to the cumulative total returns of the NASDAQ Composite Index and the NASDAQ Telecommunications Index. An investment of $100 (with reinvestment of all dividends, if any) is assumed to have been made in our common stock and in each of the indexes on December 31, 2011 and its relative performance is tracked through December 31, 2016. The NASDAQ Telecommunications Index contains securities of NASDAQ-listed companies classified according to the Industry Classification Benchmark as Telecommunications and Telecommunications Equipment. They include providers of fixed-line and mobile telephone services, and makers and distributors of high-technology communication products. This graph is not deemed to be “filed” with the SEC or subject to the liabilities of Section 18 of the Securities Exchange Act of 1934, as amended (the “Exchange Act”), and the graph shall not be deemed to be incorporated by reference into any prior or subsequent filing by Infinera under the Securities Act of 1933 or the Exchange Act.
COMPARISON OF FIVE YEAR CUMULATIVE TOTAL RETURN*
Among Infinera Corporation, the NASDAQ Composite Index,
and the NASDAQ Telecommunications Index
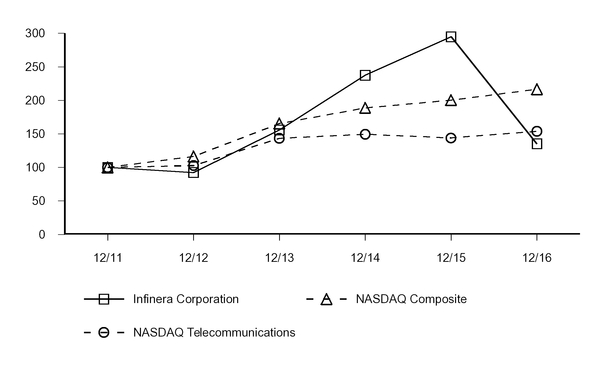
*$100 invested on December 31, 2011 in our common stock or December 31, 2011 in the NASDAQ Composite Index and the NASDAQ Telecommunications Index, with reinvestment of all dividends, if any. Indexes calculated on month-end basis.
33
ITEM 6. SELECTED FINANCIAL DATA
You should read the following selected consolidated historical financial data below in conjunction with the section titled “Management’s Discussion and Analysis of Financial Condition and Results of Operations” and the consolidated financial statements, related notes and other financial information included elsewhere in this Annual Report on Form 10-K.
We derived the statements of operations data for the years ended December 31, 2016, December 26, 2015 and December 27, 2014 and the balance sheet data as of December 31, 2016 and December 26, 2015 from our audited consolidated financial statements and related notes, which are included elsewhere in this Annual Report on Form 10-K. We derived the statements of operations data for the years ended December 28, 2013 and December 29, 2012 and the balance sheet data as of December 27, 2014, December 28, 2013 and December 29, 2012 from our audited consolidated financial statements and related notes which are not included in this Annual Report on Form 10-K. We have not declared or distributed any cash dividends.
Years Ended | |||||||||||||||||||
December 31, 2016 | December 26, 2015 | December 27, 2014 | December 28, 2013 | December 29, 2012 | |||||||||||||||
(In thousands, except per share data) | |||||||||||||||||||
Revenue | $ | 870,135 | $ | 886,714 | $ | 668,079 | $ | 544,122 | $ | 438,437 | |||||||||
Gross profit | $ | 393,718 | $ | 403,477 | $ | 288,304 | $ | 218,639 | $ | 157,569 | |||||||||
Net income (loss) | $ | (24,430 | ) | $ | 50,950 | $ | 13,659 | $ | (32,119 | ) | $ | (85,330 | ) | ||||||
Net income (loss) attributable to Infinera Corporation | $ | (23,927 | ) | $ | 51,413 | $ | 13,659 | $ | (32,119 | ) | $ | (85,330 | ) | ||||||
Net income (loss) per common share attributable to Infinera Corporation: | |||||||||||||||||||
Basic | $ | (0.17 | ) | $ | 0.39 | $ | 0.11 | $ | (0.27 | ) | $ | (0.77 | ) | ||||||
Diluted | $ | (0.17 | ) | $ | 0.36 | $ | 0.11 | $ | (0.27 | ) | $ | (0.77 | ) | ||||||
Weighted average number of shares used in computing basic and diluted net income (loss) per common share: | |||||||||||||||||||
Basic | 142,989 | 133,259 | 123,672 | 117,425 | 110,739 | ||||||||||||||
Diluted | 142,989 | 143,171 | 128,565 | 117,425 | 110,739 | ||||||||||||||
Total cash and cash equivalents, investments and restricted cash | $ | 360,056 | $ | 356,479 | $ | 390,816 | $ | 365,313 | $ | 187,554 | |||||||||
Cost-method investments | $ | 7,000 | $ | 14,500 | $ | 14,500 | $ | 9,000 | $ | 9,000 | |||||||||
Intangible assets, net | $ | 108,475 | $ | 156,319 | $ | 361 | $ | 416 | $ | 470 | |||||||||
Goodwill | $ | 176,760 | $ | 191,560 | $ | — | $ | — | $ | — | |||||||||
Total assets | $ | 1,198,583 | $ | 1,226,294 | $ | 818,016 | $ | 700,926 | $ | 528,170 | |||||||||
Long-term debt, net | $ | 133,586 | $ | 125,440 | $ | 116,894 | $ | 109,164 | $ | — | |||||||||
Common stock and additional paid-in capital | $ | 1,354,227 | $ | 1,300,441 | $ | 1,077,351 | $ | 1,025,781 | $ | 930,730 | |||||||||
Infinera stockholders' equity | $ | 762,328 | $ | 762,151 | $ | 481,907 | $ | 417,810 | $ | 356,136 | |||||||||
Noncontrolling interest | $ | — | $ | 14,910 | $ | — | $ | — | $ | — | |||||||||
Total stockholders’ equity | $ | 762,328 | $ | 777,061 | $ | 481,907 | $ | 417,810 | $ | 356,136 | |||||||||
34
ITEM 7. | MANAGEMENT’S DISCUSSION AND ANALYSIS OF FINANCIAL CONDITION AND RESULTS OF OPERATIONS |
This Annual Report on Form 10-K contains “forward-looking statements” that involve risks and uncertainties, as well as assumptions that, if they never materialize or prove incorrect, could cause our results to differ materially from those expressed or implied by such forward-looking statements. Such forward-looking statements include our expectations regarding revenue, gross margin, expenses, cash flows and other financial items; any statements of the plans, strategies and objectives of management for future operations and personnel; factors that may affect our operating results; anticipated customer activity; statements concerning new products or services, including new product features and delivery dates; statements related to capital expenditures; statements related to future economic conditions, performance, market growth or our sales cycle; statements related to our convertible senior notes; statements related to the effects of litigation on our financial position, results of operations or cash flows; statements related to the timing and impact of transfer pricing reserves or our effective tax rate; statements as to industry trends and other matters that do not relate strictly to historical facts or statements of assumptions underlying any of the foregoing. These statements are often identified by the use of words such as “anticipate,” “believe,” “continue,” “could,” “estimate,” “expect," “intend,” “may,” or “will,” and similar expressions or variations. These statements are based on the beliefs and assumptions of our management based on information currently available to management. Such forward-looking statements are subject to risks, uncertainties and other factors that could cause actual results and the timing of certain events to differ materially from future results expressed or implied by such forward-looking statements. Factors that could cause or contribute to such differences include, but are not limited to, those identified below, and those discussed in the section titled “Risk Factors” included in Item 1A of this Annual Report on Form 10-K. You should review these risk factors for a more complete understanding of the risks associated with an investment in our securities. Such forward-looking statements speak only as of the date of this report. We disclaim any obligation to update any forward-looking statements to reflect events or circumstances after the date of such statements. The following discussion and analysis should be read in conjunction with our “Selected Financial Data” included in Item 6 of this Annual Report on Form 10-K and consolidated financial statements and notes thereto included elsewhere in this Annual Report on Form 10-K.
Overview
We provide optical transport networking equipment, software and services to telecommunications service providers, ICPs, cable providers, wholesale and enterprise carriers, research and education institutions, enterprise customers, and government entities across the globe. Optical transport networks are deployed by customers facing significant demand for optical bandwidth prompted by increased use of high-speed internet access, mobile broadband, cloud-based services, high-definition video streaming services, virtual and augmented reality, the internet of Things (IoT) and business Ethernet services. Our end-to-end packet-optical portfolio is designed to be managed with a single network management system.
In 2016, we announced the Infinite Capacity Engine (ICE), our next-generation technology, which delivers a family of multi-terabit opto-electronic subsystems powered by our fourth-generation PIC and next-generation FlexCoherent DSP. The Infinite Capacity Engine is a family of different subsystems that can be customized for different network applications across our product portfolio, spanning the long-haul, subsea, DCI and metro markets.
Traditionally, we have focused on the long-haul portion of the optical transport market and a large portion of our revenue continues to be derived from long-haul and subsea customers. Over the past two years, we have significantly increased the number of products we offer, evolving from focusing entirely on the long-haul and subsea markets with the DTN-X Family of products to offering an end-to-end suite of solutions that spans terrestrial long-haul, subsea, DCI, and metro core and access.
In late 2014, we increased our addressable markets by introducing the Cloud Xpress platform for the DCI market. Since the initial introduction of the Cloud Xpress with 40 GbE client interfaces, we have enhanced our position by expanding our Cloud Xpress Family.
In the second half of 2015, we entered the metro market with the acquisition of Transmode, a leader in metro packet-optical applications. WIth our entrance into the DCI and metro markets over the last few years, we are now able to provide our customers with an end-to-end portfolio of solutions. The XTM Series and XTG Series are designed to address the metro market, with 100 Gb/s metro core/regional transport capabilities and packet-
35
optical solutions optimized for fast-growing applications in the access portion of the network, including mobile fronthaul and backhaul, triple-play and cable broadband aggregation, and business Ethernet services with MEF certification. These products are complemented by the XTC-2 product designed for high-capacity handoffs of traffic from a long-haul network.
We primarily sell our products through our direct sales force, with a small portion sold indirectly through resellers. We derived 93%, 93% and 95% of our revenue from direct sales to customers for 2016, 2015 and 2014, respectively. We expect to continue generating a substantial majority of our revenue from direct sales in the future.
We are headquartered in Sunnyvale, California, with employees located throughout the Americas, Europe and the Asia Pacific region.
2016 Financial and Business Performance
Total revenue decreased by 2% in 2016 compared to 2015. Delayed product transitions impacted the short-term competitiveness of our products negatively impacting revenue. In addition, revenue was negatively impacted by the consolidation of some of our major customers and changes in their buying patterns, including shifting spend to other parts of their networks. Gross margin decreased to 45.2% in 2016 from 45.5% in 2015. In the second half of 2016, we experienced downward pressure on gross margin levels as we made investments to secure future business with existing and prospective customers across our end markets.
During the year, we continued to diversify our customer base by providing an end-to-end portfolio of packet-optical solutions for long-haul, subsea, DCI and metro markets. We generated a majority of our revenue from the long-haul market, despite the downturn we experienced during the second half of 2016. The general slowdown in the long-haul market was exacerbated by significant consolidation among our largest customers. In addition, we faced a technology shortfall around spectral efficiencies, which limited our ability to win substantial business in the subsea market. In DCI, we made solid progress with our Cloud Xpress platform as we grew with existing customers and also won new customers in this market. During 2016, we made solid progress in broadening the deployments of our metro solutions both with existing and new customers.
Our goal is to be the preeminent provider of optical transport networking systems to telecommunications service providers, ICPs, cable providers, wholesale and enterprise carriers, research and education institutions, enterprise customers, and government entities across the globe. Our ability to grow revenue in 2017 will be largely dependent on the timing of delivering of our next-generation products and their adoption by key customers in the market. This growth will depend on the continued acceptance of our products, growth of communications traffic and the proliferation of next-generation bandwidth-intensive services, which are expected to drive the need for increased levels of bandwidth. In the short-term, we expect to see heightened variability in our margins as we work to diversify our business and continue to make strategic investments to win new footprint with both existing and new customers as well as when we bring our new products to market over the course of fiscal 2017. Given our current revenue levels and necessity of investing in current and future opportunities, we anticipate that research and development expenses will remain at elevated levels as a percentage of revenue during 2017.
Over a longer period of time, we believe that we can further leverage our vertically-integrated manufacturing model, which combined with the introduction of additional purpose-built products, the ability to continue to sell incremental bandwidth capacity into deployed networks, and expense management, can result in improved profitability and cash flow.
Our near-term quarter-over-quarter revenue may likely be volatile and could be impacted by several factors, including delivery of our next-generation products, general economic and market conditions, customer buying patterns, market acceptance of new products, acquisitions of new customers, and the timing of large customer network deployments.
One customer accounted for approximately 16% of our revenue in 2016. Two customers accounted for approximately 17% and 13%, respectively, of our revenue in 2015. One customer accounted for approximately 19% of our revenue in 2014.
36
Results of Operations
Revenue
The results of operations for 2016 reflects the inclusion of the Transmode business, which was acquired on August 20, 2015. The following sets forth, for the periods presented, certain consolidated statements of operations information (in thousands, except percentages):
Years Ended | ||||||||||||||||||||
December 31, 2016 | % of total revenue | December 26, 2015 | % of total revenue | Change | % Change | |||||||||||||||
Revenue: | ||||||||||||||||||||
Product | $ | 751,167 | 86 | % | $ | 769,230 | 87 | % | $ | (18,063 | ) | (2 | )% | |||||||
Services | 118,968 | 14 | % | 117,484 | 13 | % | 1,484 | 1 | % | |||||||||||
Total revenue | $ | 870,135 | 100 | % | $ | 886,714 | 100 | % | $ | (16,579 | ) | (2 | )% | |||||||
Cost of revenue: | ||||||||||||||||||||
Product | $ | 433,266 | 50 | % | $ | 436,916 | 49 | % | $ | (3,650 | ) | (1 | )% | |||||||
Services | 43,151 | 5 | % | 46,321 | 5 | % | (3,170 | ) | (7 | )% | ||||||||||
Total cost of revenue | $ | 476,417 | 55 | % | $ | 483,237 | 54 | % | $ | (6,820 | ) | (1 | )% | |||||||
Gross profit | $ | 393,718 | 45.2 | % | $ | 403,477 | 45.5 | % | $ | (9,759 | ) | (2 | )% | |||||||
Years Ended | ||||||||||||||||||||
December 26, 2015 | % of total revenue | December 27, 2014 | % of total revenue | Change | % Change | |||||||||||||||
Revenue: | ||||||||||||||||||||
Product | $ | 769,230 | 87 | % | $ | 572,276 | 86 | % | $ | 196,954 | 34 | % | ||||||||
Services | 117,484 | 13 | % | 95,803 | 14 | % | 21,681 | 23 | % | |||||||||||
Total revenue | $ | 886,714 | 100 | % | $ | 668,079 | 100 | % | $ | 218,635 | 33 | % | ||||||||
Cost of revenue: | ||||||||||||||||||||
Product | $ | 436,916 | 49 | % | $ | 340,856 | 51 | % | $ | 96,060 | 28 | % | ||||||||
Services | 46,321 | 5 | % | 38,919 | 6 | % | 7,402 | 19 | % | |||||||||||
Total cost of revenue | $ | 483,237 | 54 | % | $ | 379,775 | 57 | % | $ | 103,462 | 27 | % | ||||||||
Gross profit | $ | 403,477 | 45.5 | % | $ | 288,304 | 43.2 | % | $ | 115,173 | 40 | % | ||||||||
2016 Compared to 2015. Product revenue decreased by $18.1 million, or 2%, in 2016 from 2015. We experienced a slowdown in spending from multiple key customers partly due to the effects of significant customer consolidation during the second half of 2016, which resulted in decreased revenue compared to 2015. This decrease was partially offset by increased revenue due to the inclusion of a full year's worth of revenue from Transmode metro products.
Services revenue increased by $1.5 million, or 1%, in 2016 from 2015, primarily due to higher on-going support services as we grew our installed base over the last year.
With the introduction of our next-generation products, we believe our wholesale and ICP verticals should continue to be strong for the foreseeable future. With the slowdown in spending from multiple long-haul customers and our metro opportunity still in its early phases, our telco customer verticals could remain challenged for the next few quarters. We currently expect that total revenue in the first quarter of 2017 will be slightly lower on a sequential basis compared to the prior quarter.
37
2015 Compared to 2014. Total product revenue increased by $197.0 million, or 34%, in 2015 from 2014. The increase was primarily driven by continued momentum associated with the Infinera DTN-X platform through both new network builds and capacity adds to existing networks. Additionally, we benefited from the inclusion of revenue from Transmode's metro products since the acquisition. In 2015, we also experienced significant growth in revenue associated with our Cloud Xpress platform, which was introduced during the fourth quarter of 2014. These increases were partially offset by a reduction in sales of the DTN platform, reflecting the continued shift to 100 Gb/s network deployments.
Services revenue increased by $21.7 million, or 23%, in 2015 from 2014. The increase was primarily due to higher on-going support services as we continued to grow our installed base. Additionally, during 2015, we experienced higher levels of deployment services as customers built new networks utilizing our teams’ expertise. Our services revenue also benefited from the inclusion of Transmode's services revenue since the acquisition.
The following table summarizes our revenue by geography and sales channel for the periods presented (in thousands, except percentages):
Years Ended | ||||||||||||||||||||
December 31, 2016 | % of total revenue | December 26, 2015 | % of total revenue | Change | % Change | |||||||||||||||
Total revenue by geography | ||||||||||||||||||||
Domestic | $ | 541,889 | 62 | % | $ | 602,433 | 68 | % | $ | (60,544 | ) | (10 | )% | |||||||
International | 328,246 | 38 | % | 284,281 | 32 | % | 43,965 | 15 | % | |||||||||||
$ | 870,135 | 100 | % | $ | 886,714 | 100 | % | $ | (16,579 | ) | (2 | )% | ||||||||
Total revenue by sales channel | ||||||||||||||||||||
Direct | $ | 809,681 | 93 | % | $ | 825,952 | 93 | % | $ | (16,271 | ) | (2 | )% | |||||||
Indirect | 60,454 | 7 | % | 60,762 | 7 | % | (308 | ) | (1 | )% | ||||||||||
$ | 870,135 | 100 | % | $ | 886,714 | 100 | % | $ | (16,579 | ) | (2 | )% | ||||||||
Years Ended | ||||||||||||||||||||
December 26, 2015 | % of total revenue | December 27, 2014 | % of total revenue | Change | % Change | |||||||||||||||
Total revenue by geography | ||||||||||||||||||||
Domestic | $ | 602,433 | 68 | % | $ | 476,172 | 71 | % | $ | 126,261 | 27 | % | ||||||||
International | 284,281 | 32 | % | 191,907 | 29 | % | 92,374 | 48 | % | |||||||||||
$ | 886,714 | 100 | % | $ | 668,079 | 100 | % | $ | 218,635 | 33 | % | |||||||||
Total revenue by sales channel | ||||||||||||||||||||
Direct | $ | 825,952 | 93 | % | $ | 633,619 | 95 | % | $ | 192,333 | 30 | % | ||||||||
Indirect | 60,762 | 7 | % | 34,460 | 5 | % | 26,302 | 76 | % | |||||||||||
$ | 886,714 | 100 | % | $ | 668,079 | 100 | % | $ | 218,635 | 33 | % | |||||||||
2016 Compared to 2015. Domestic revenue decreased by $60.5 million, or 10%, during 2016 compared to 2015, primarily driven by customers across multiple end markets slowing spend due to a variety of factors including shifts of spending to other parts of customer networks, the build-up of inventory at customer sites, along with customer consolidation and competitive challenges in certain markets.
International revenue increased by $44.0 million, or 15%, during 2016 compared to 2015, primarily led by the Europe, Middle East and Africa (“EMEA”) region due to the inclusion of revenue from Transmode, which generates most of its revenue from the EMEA region.
2015 Compared to 2014. Domestic revenue increased by $126.3 million, or 27%, during 2015 compared to 2014, primarily driven by customers in our wholesale and enterprise carrier and ICP verticals. Many
38
of our largest customers are based in this region, including our two greater than 10% of revenue customers for the year.
International revenue increased by $92.4 million, or 48%, during 2015 compared to 2014. In 2015, growth in the EMEA region was primarily driven by customers in our wholesale and enterprise carrier and ICP verticals, and the inclusion of revenue from Transmode’s metro products across various verticals since the acquisition. Within the Other Americas region, during 2015, we experienced significant growth with our wholesale and enterprise carrier customers expanding into the Latin America region, including large subsea deployments, as well as continued traction with multiple carriers based in this region. Within the Asia Pacific and Japan region, we also had strong growth in 2015 compared to 2014 primarily within the subsea market as customers expanded their footprints.
Cost of Revenue and Gross Margin
2016 Compared to 2015. Gross margin decreased to 45.2% in 2016 from 45.5% in 2015, primarily driven by the impact of reduced volumes on our manufacturing infrastructure. We also experienced downward pressure on gross margin throughout the year as we made strategic pricing decisions to secure future business with existing and prospective customers across our end markets. Additionally, 2015 included a full year of purchase accounting costs, primarily related to amortization of intangibles associated with the Transmode acquisition.
2015 Compared to 2014. Gross margin increased to 45.5% in 2015 from 43.2% in 2014. Gross margin increased primarily as a result of financial leverage gained from our vertically integrated operating model. As volumes continue to grow, we are able to spread our fixed manufacturing costs over a much broader base of units. In addition, we continued to see an increased level of capacity additions to existing customer networks both in the form of line card additions and additional licenses under the Infinera Instant Bandwidth program. These capacity additions carry a higher gross margin profile than the footprint builds of new networks. These increases were partially offset by the impact of purchase accounting adjustments of $13.3 million.
We currently expect that gross margin in the first quarter of 2017 will be slightly lower compared to the fourth quarter of 2016 as we experience continued downward pressure on gross margin in the near-term while we make investments to secure future business with existing and prospective customers across our end markets. In addition, the absorption of fixed costs over a smaller volume of units will negatively impact our gross margin. We expect to see heightened variability in our margins as we work to diversify our business and continue to make strategic investments to win new footprint with both existing and new customers as well as when we bring our new products to market over the course of fiscal 2017.
Operating Expenses
The following table summarizes our operating expenses for the periods presented (in thousands, except percentages):
Years Ended | ||||||||||||||||||||
December 31, 2016 | % of total revenue | December 26, 2015 | % of total revenue | Change | % Change | |||||||||||||||
Research and development | $ | 232,291 | 27 | % | $ | 180,703 | 20 | % | $ | 51,588 | 29 | % | ||||||||
Sales and marketing | 118,858 | 14 | % | 101,398 | 11 | % | 17,460 | 17 | % | |||||||||||
General and administrative | 68,343 | 8 | % | 61,640 | 7 | % | 6,703 | 11 | % | |||||||||||
Total operating expenses | $ | 419,492 | 49 | % | $ | 343,741 | 38 | % | $ | 75,751 | 22 | % | ||||||||
Years Ended | ||||||||||||||||||||
December 26, 2015 | % of total revenue | December 27, 2014 | % of total revenue | Change | % Change | |||||||||||||||
Research and development | $ | 180,703 | 20 | % | $ | 133,484 | 20 | % | $ | 47,219 | 35 | % | ||||||||
Sales and marketing | 101,398 | 11 | % | 79,026 | 12 | % | 22,372 | 28 | % | |||||||||||
General and administrative | 61,640 | 7 | % | 48,452 | 7 | % | 13,188 | 27 | % | |||||||||||
Total operating expenses | $ | 343,741 | 38 | % | $ | 260,962 | 39 | % | $ | 82,779 | 32 | % | ||||||||
39
The following table summarizes the stock-based compensation expense included in our operating expenses for the periods presented (in thousands):
Years Ended | |||||||||||
December 31, 2016 | December 26, 2015 | December 27, 2014 | |||||||||
Research and development | $ | 13,732 | $ | 11,055 | $ | 8,927 | |||||
Sales and marketing | 11,043 | 8,081 | 7,477 | ||||||||
General and administration | 9,295 | 7,354 | 6,383 | ||||||||
Total | $ | 34,070 | $ | 26,490 | $ | 22,787 | |||||
Research and Development Expenses
2016 Compared to 2015. Research and development expenses increased $51.6 million, or 29%, in 2016 from 2015 primarily due to increased personnel costs of $34.5 million as a result of incremental headcount primarily from the acquisition of Transmode and an $11.3 million impairment on acquired in-process technology resulting from our decision to abandon previously acquired technologies related to Transmode. Additionally, we had increased spending on prototype and other engineering materials of $7.4 million, incremental outside professional services costs of $2.1 million and other engineering expenses of $1.0 million to support the development of our next generation of products. These increases were partially offset by a decrease in management bonuses of $4.7 million.
2015 Compared to 2014. Research and development expenses increased $47.2 million, or 35%, in 2015 from 2014 primarily due to increased personnel costs of $23.8 million as a result of incremental headcount to support our expanding product roadmap. In addition, we had increased spending on prototype and other engineering materials of $12.8 million in 2015 compared to 2014, as we further enhanced our product portfolio to ensure we deliver on our next generation platforms. During 2015, we also incurred increased costs of outside professional services of $7.1 million and higher discretionary spending of $3.5 million to support our growing business compared to 2014. The inclusion of the Transmode business increased research and development expenses by $10.1 million in 2015.
Sales and Marketing Expenses
2016 Compared to 2015. Sales and marketing expenses increased $17.5 million, or 17%, in 2016 from 2015 primarily due to increased personnel costs of $14.5 million as a result of incremental headcount primarily from the acquisition of Transmode and to support the expansion of our business into new markets and customer verticals. In addition, the increase also included amortization of intangible assets of $3.9 million, higher professional services costs of $1.3 million and an increase in discretionary spending of $0.2 million. These increases were partially offset by a decrease in management bonuses of $2.4 million.
2015 Compared to 2014. Sales and marketing expenses increased $22.4 million, or 28%, in 2015 from 2014 primarily driven by increased personnel costs of $11.7 million as a result of higher sales commissions and incremental headcount to support the continued expansion of our business into new markets and customer verticals. We also had increased discretionary spending of $2.6 million, amortization of intangible assets of $2.2 million, prototype and lab trial spending of $2.0 million, and other marketing expenses of $3.9 million. The inclusion of the Transmode business during 2015 increased sales and marketing expense by $12.1 million.
General and Administrative Expenses
2016 Compared to 2015. General and administrative expenses increased $6.7 million, or 11%, in 2016 from 2015 primarily due to increased personnel costs of $9.3 million as a result of incremental headcount from the acquisition of Transmode and to a lesser extent, to scale our infrastructure to support the business. In addition, during 2016, we incurred increased facilities and related costs of $1.3 million and higher depreciation expense of $1.2 million. These increases were partially offset by a decrease in management bonuses of $2.6 million and professional services costs of $2.5 million.
2015 Compared to 2014. General and administrative expenses increased $13.2 million, or 27%, in 2015 from 2014. During 2015, the increases were primarily due to acquisition-related expenses related to the Transmode acquisition of $6.8 million. Additionally, we incurred increased personnel costs of $4.6 million driven
40
by incremental headcount and higher discretionary spending of $1.7 million to support our growing business. The inclusion of the Transmode business increased general and administrative expenses by $2.2 million.
Other Income (Expense), Net
Years Ended | |||||||||||
December 31, 2016 | December 26, 2015 | December 27, 2014 | |||||||||
(In thousands) | |||||||||||
Interest income | $ | 2,478 | $ | 1,837 | $ | 1,456 | |||||
Interest expense | (12,887 | ) | (11,941 | ) | (11,021 | ) | |||||
Other gain (loss), net | 7,002 | 2,399 | (1,365 | ) | |||||||
Total other income (expense), net | $ | (3,407 | ) | $ | (7,705 | ) | $ | (10,930 | ) | ||
2016 Compared to 2015. Interest income increased $0.6 million primarily due to a higher return on investments. Interest expense for 2016 increased $0.9 million due to cash interest payments and an increase of amortization of discount and issuance costs related to the Notes. The change in other gain (loss), net, during 2016 was primarily due to a $9.0 million gain on the sale of a cost-method investment, partially offset by losses due to foreign currency exchange. Other gain (loss), net, for 2015 mainly comprised of $1.3 million of gains due to foreign currency exchange rate changes and a $1.1 million gain primarily from foreign currency forward contracts that we entered into to hedge currency exposures associated with the cash portion of the offer to acquire Transmode.
2015 Compared to 2014. Interest income increased mainly due to a higher average investment balance due to cash generated from the business during the year. Interest expense for 2015 increased by $0.9 million due to an increase of amortization of discount and issuance costs related to the Notes. Other gain (loss), net, for 2015 mainly comprised of $1.3 million of gains due to foreign currency exchange rate changes and a $1.1 million gain primarily from foreign currency forward contracts that we entered into to hedge currency exposures associated with the cash portion of the offer to acquire Transmode. Other gain (loss), net, for 2014 mainly comprised of $1.4 million of losses due to foreign currency exchange rate changes.
Income Tax Provision
We recognized an income tax benefit of $4.8 million on a loss before income tax benefit of $29.2 million, income tax expense of $1.1 million on income before income taxes of $52.0 million, and $2.8 million on income before income taxes of $16.4 million in fiscal years 2016, 2015 and 2014, respectively. The resulting effective tax rates were (16.3)%, 2.1% and 16.8% for 2016, 2015, and 2014, respectively. The 2016 and 2015 effective tax rates differ from the expected statutory rate of 35% based upon the utilization of unbenefited U.S. loss carryforwards, offset by state income taxes, non-deductible stock-based compensation expenses and foreign taxes provided on foreign subsidiary earnings. The 2016 income tax benefit compared to the 2015 income tax expense primarily relates to the tax benefit of acquisition related amortization expenses and charges, lower state income taxes because of lower profit in our U.S. operations, and reduction in tax reserves, offset by an increase in taxable foreign profits in certain jurisdictions. The tax expense for 2015 was less than 2014 due to acquisition related amortization expenses and charges offset by higher state taxes, additional tax reserves, and an increase in taxable foreign profits.
Because of our significant loss carryforward position and corresponding full valuation allowance, in all periods, we have not been subject to federal or state tax on its U.S. income because of the availability of loss carryforwards, with the exception of amounts for certain states’ taxes for which the losses are limited by statute or amount in 2016 and more significantly in 2015, and federal and state taxes associated with a discontinued US subsidiary. If these losses and other tax attributes become fully utilized, our taxes will increase significantly to a more normalized, expected rate on U.S. earnings. The release of transfer pricing reserves in the future will have a beneficial impact to tax expense, but the timing of the impact depends on factors such as expiration of the statute of limitations or settlements with tax authorities. No significant releases are expected in the near future based on information available at this time.
41
The valuation allowance for deferred tax assets as of December 31, 2016 and December 26, 2015 was $200.5 million and $169.2 million, respectively. The net change in the valuation allowance was an increase of $31.2 million and decrease of $30.5 million for the years ended December 31, 2016 and December 26, 2015, respectively.
The ultimate realization of deferred tax assets is dependent upon the generation of future taxable income during the periods in which those temporary differences become deductible. We must consider all positive and negative evidence, including our forecasts of taxable income over the applicable carryforward periods, our current financial performance, our market environment, and other factors in evaluating the need for a full or partial valuation allowance against our net U.S. deferred tax assets. Based on the available objective evidence, management believes it is more likely than not that the domestic net deferred tax assets will not be realizable in the foreseeable future. Accordingly, we have provided a full valuation allowance against our domestic deferred tax assets, net of deferred tax liabilities, as of December 31, 2016 and December 26, 2015.
To the extent that we determine that deferred tax assets are realizable on a more likely than not basis, and adjustment is needed, that adjustment will be recorded in the period that the determination is made and would generally decrease the valuation allowance and record a corresponding benefit to earnings.
As of December 31, 2016, we had net operating loss carryforwards of approximately $205.9 million for federal tax purposes and $104.0 million for state tax purposes. The carryforward balance reflects expected utilization of both federal and state net operating losses for the year ended December 31, 2016. Federal net operating loss carryforwards will begin to expire in 2025 while certain unutilized California losses have expired in 2016. Additionally, we have federal and California research and development credits available to reduce future income taxes payable of approximately $35.0 million and $39.4 million, respectively, as of December 31, 2016. Infinera Canada Inc., an indirect wholly owned subsidiary, has Scientific Research and Experimental Development Expenditures (“SRED”) credits available of $2.2 million to offset future Canadian income tax payable as of December 31, 2016. The federal research credits will begin to expire in the year 2022 if not utilized and the California research credits have no expiration date. Canadian SRED credits will begin to expire in the year 2030 if not fully utilized.
On March 30, 2016, FASB issued Accounting Standards Update 2016-09, “Improvements to Employee Share-Based Payment Accounting” (“ASU 2016-09”), which we early adopted as of June 26, 2016. As a result of the adoption of ASU 2016-09, excess windfall tax benefits and tax deficiencies related to our stock option exercises and vestings of restricted stock units (“RSUs”) are recognized as an income tax benefit or expense in our condensed consolidated statements of operations. The adoption of ASU 2016-09 did not have any material impact on our income tax expense for the year ended December 31, 2016 due primarily to our valuation allowance position.
Under the Tax Reform Act of 1986, the amount of benefit from net operating loss and tax credit carryforwards may be impaired or limited in certain circumstances. Events which cause limitations in the amount of net operating losses that we may utilize in any one year include, but are not limited to, a cumulative ownership change of more than 50 percent as defined over a three-year testing period. As of December 31, 2016, we had determined that while ownership changes had occurred in the past, the resulting limitations were not significant enough to impact the utilization of the tax attributes against our taxable profits earned to date.
In determining future taxable income, we make assumptions to forecast federal, state and international operating income, the reversal of temporary differences, and the implementation of any feasible and prudent tax planning strategies. The assumptions require significant judgment regarding the forecasts of future taxable income, and are consistent with our income forecasts used to manage our business.
42
Liquidity and Capital Resources
Years Ended | |||||||||||
December 31, 2016 | December 26, 2015 | December 27, 2014 | |||||||||
(In thousands) | |||||||||||
Net cash flow provided by (used in): | |||||||||||
Operating activities | $ | 38,377 | $ | 133,176 | $ | 35,963 | |||||
Investing activities | $ | (12,115 | ) | $ | (91,475 | ) | $ | (96,059 | ) | ||
Financing activities | $ | (8,866 | ) | $ | 20,983 | $ | 22,861 | ||||
Years Ended | |||||||
December 31, 2016 | December 26, 2015 | ||||||
(In thousands) | |||||||
Cash and cash equivalents | $ | 162,641 | $ | 149,101 | |||
Short-term and long-term investments | 182,476 | 202,068 | |||||
Restricted cash | 14,939 | 5,310 | |||||
$ | 360,056 | $ | 356,479 | ||||
Cash, cash equivalents and short-term investments consist of highly-liquid investments in certificates of deposits, money market funds, commercial paper, corporate bonds and U.S. treasuries. Long-term investments primarily consist of corporate bonds. Our restricted cash balance amounts are primarily pledged as collateral for certain stand-by and commercial letters of credit related to customer proposal guarantees, value added tax licenses and property leases. Additionally, our restricted cash balance in 2016 consists of a security pledge related to the Transmode acquisition and an escrow account to fund our facility expansion.
Operating Activities
Net cash provided by operating activities was $38.4 million for 2016, $133.2 million for 2015 and $36.0 million for 2014.
Net loss for 2016 was $24.4 million, which included non-cash charges of $116.3 million, compared to a net income of $51.0 million for 2015, which included non-cash charges of $80.1 million. Net income for 2014 was $13.7 million, which included non-cash charges of $66.5 million.
Net cash used in working capital was $53.5 million for 2016. Accounts receivables decreased by $33.9 million as our revenue levels decreased significantly during the second half of 2016. Inventory levels increased by $64.1 million as a result of stocking more components due to longer lead times with component suppliers, building up our PIC die bank inventory for our current generation of products to allow us to shift manufacturing capacity to our next generation PICs, building up new product inventory, as well as lower shipment volumes in recent periods. Accounts payable decreased by $28.3 million primarily due to lower business volume during 2016. Deferred revenue increased $21.4 million primarily due to higher ongoing support services as we continued to grow our installed base.
Net cash provided by working capital was $2.1 million for 2015. Accounts receivables increased by $16.0 million primarily due to the timing of invoicing in the period and inventory levels increased by $17.1 million to support the higher expected demand including multiple new products. Accounts payable increased by $19.2 million primarily reflecting the volume of the business and timing of payments during the period. Accrued warranty increased by $10.8 million due to general warranty reserves, the incremental cost to support the increased installed base and higher repair costs.
Net cash used to fund working capital was $44.2 million for 2014. Accounts receivables increased by $54.0 million primarily due to higher revenue levels and the timing of invoicing of network deployments and collections during the period. Inventory levels increased by $25.5 million to support the higher expected demand.
43
Accounts payable increased by $18.8 million primarily reflecting increased inventory purchases and timing of payments during the period. Accrued liabilities increased by $11.9 million primarily reflecting higher levels of compensation related accruals.
Investing Activities
Net cash used in investing activities for 2016 was $12.1 million, including $43.3 million of capital expenditures to support our growing business and $7.0 million invested in a new cost-method investment. Partially offsetting those spend activities were proceeds from the sale of a cost-method investment of $23.5 million and net proceeds of $18.8 million associated with purchases and maturities of investments during the year. In addition, we spent
Net cash used in investing activities for 2015 was $91.5 million, including the payment of $144.4 million in connection with the acquisition of Transmode and $42.0 million of capital expenditures to support our growing business. Partially offsetting those spend activities, we had net proceeds of $93.8 million associated with purchases, maturities and sales of investments during the year as we rearranged our portfolio to fund the acquisition and realized a $1.1 million of gain from foreign currency exchange forward contracts.
Net cash used in investing activities for 2014 was $96.1 million. This included net cash used of $65.9 million associated with purchases, maturities and sales of investments and $23.1 million of capital expenditures. We also invested an additional $5.5 million in an existing cost-method equity investment during 2014.
Financing Activities
Net proceeds from financing activities were $8.9 million, $21.0 million and $22.9 million for 2016, 2015 and 2014, respectively. Financing activities in 2016 included $16.8 million related to the purchase of the noncontrolling interest upon award on advance title to acquire the remaining 4.2% of Transmode shares and $6.1 million associated with the security pledge related to the Transmode acquisition. For more information regarding the security pledge, see Note 6, “Business Combination” to the Notes to Condensed Consolidated Financial Statements. Additionally, financing activities in 2016 included net proceeds from the exercise of stock options and the issuance of shares under our 2007 Employee Stock Purchase Plan (“ESPP”). These proceeds were offset by the minimum tax withholdings paid on behalf of certain employees for net share settlements of restricted stock units.
Financing activities in 2015 and 2014 primarily included net proceeds from the exercise of stock options and purchase of shares under our ESSP. Financing activities during 2015 also included proceeds from the exercise of stock options. These proceeds were offset by the minimum tax withholdings paid on behalf of employees for net share settlements of restricted stock units.
Liquidity
We believe that our current cash, cash equivalents and investments, and purchases under our ESPP will be sufficient to meet our anticipated cash needs for working capital and capital expenditures for at least the next 12 months. If these sources of cash are insufficient to satisfy our liquidity requirements beyond 12 months, we may require additional capital from equity or debt financings to fund our operations, to respond to competitive pressures or strategic opportunities, or otherwise. We may not be able to secure timely additional financing on favorable terms, or at all. The terms of any additional financings may place limits on our financial and operating flexibility. If we raise additional funds through further issuances of equity, convertible debt securities or other securities convertible into equity, our existing stockholders could suffer dilution in their percentage ownership of us, and any new securities we issue could have rights, preferences and privileges senior to those of holders of our common stock.
In May 2013, we issued the Notes, which will mature on June 1, 2018, unless earlier purchased by us or converted. Interest is payable semi-annually in arrears on June 1 and December 1 of each year, commencing December 1, 2013. The net proceeds from the Notes issuance were approximately $144.5 million and were intended to be used for working capital and other general corporate purposes.
During the quarter ended December 31, 2016, the closing price of our common stock did not meet the conversion criteria; therefore, holders of the Notes may not convert their notes during the first quarter of 2017. Any conversion of the Notes prior to their maturity or acceleration of the repayment of the Notes could have a material adverse effect on our cash flows, business, results of operations and financial condition, if we choose to
44
settle the amounts in cash. Should the closing price conditions be met during the 30 consecutive trading days prior to the end of the first quarter of 2017 or a future quarter, the Notes will be convertible at their holders’ option during the immediately following quarter. Under current market conditions, we do not expect the Notes will be converted in the short-term, even if the conversion criteria is met. Holders may also convert their Notes at any time on or after December 1, 2017 until the close of business on the second scheduled trading day immediately preceding the maturity date.
Upon conversion, it is our intention to pay cash equal to the lesser of the aggregate principal amount or the conversion value of the Notes. For any remaining conversion obligation, we intend to pay cash, shares of common stock or a combination of cash and shares of common stock, at our election. As of December 31, 2016, long-term debt, net, was $133.6 million, which represents the liability component of the $150.0 million principal balance, net of $16.4 million of unamortized debt discount and debt issuance costs. The debt discount and debt issuance costs are currently being amortized over the remaining term until maturity of the Notes on June 1, 2018. To the extent that the holders of the Notes request conversion during an early conversion window, we may require funds for repayment of such Notes prior to their maturity date.
As of December 31, 2016, contractual obligations related to the Notes are payments of $2.6 million due in 2017 and $151.3 million due in 2018. These amounts represent principal and interest cash payments over the term of the Notes. Any future redemption or conversion of the Notes could impact the amount or timing of our cash payments. For more information regarding the Notes, see Note 11, “Convertible Senior Notes” to the Notes to Consolidated Financial Statements.
As of December 31, 2016, we had $304.3 million of cash, cash equivalents, and short-term investments, including $43.2 million of cash and cash equivalents held by our foreign subsidiaries. Our cash in foreign locations is used primarily for operational activities in those locations, and we do not currently have the need or the intent to repatriate those funds to the United States. Our policy with respect to undistributed foreign subsidiaries’ earnings is to consider those earnings to be indefinitely reinvested. If we were to repatriate these funds, we would be required to accrue and pay U.S. taxes on such amounts, however, due to our significant net operating loss carryforward position for both federal and state tax purposes, as well as the full valuation allowance provided against our U.S. and state net deferred tax assets, we would currently be able to offset any such tax obligations in their entirety. However, foreign withholding taxes may be applicable.
Contractual Obligations
The following is a summary of our contractual obligations as of December 31, 2016:
Payments Due by Period | |||||||||||||||||||
Total | Less than 1 year | 1 - 3 years | 3 - 5 years | More than 5 years | |||||||||||||||
(In thousands) | |||||||||||||||||||
Purchase obligations(1) | $ | 111,932 | $ | 111,932 | $ | — | $ | — | $ | — | |||||||||
Operating leases(2) | 55,589 | 12,073 | 22,460 | 12,713 | 8,343 | ||||||||||||||
Convertible senior notes, including interest | 153,938 | 2,625 | 151,313 | — | — | ||||||||||||||
Total contractual obligations(3) | $ | 321,459 | $ | 126,630 | $ | 173,773 | $ | 12,713 | $ | 8,343 | |||||||||
(1) | We have service agreements with our major production suppliers under which we are committed to purchase certain parts. |
(2) | We lease facilities under non-cancelable operating lease agreements. These leases have varying terms that range from one to 12 years, and contain leasehold improvement incentives, rent holidays and escalation clauses. In addition, some of these leases have renewal options for up to five years. We also have contractual commitments to remove leasehold improvements and return certain properties to a specified condition when the leases terminate. At the inception of a lease with such conditions, we record an asset retirement obligation liability and a corresponding capital asset in an amount equal to the estimated fair value of the obligation. Leasehold improvements are amortized using the straight-line method over the shorter of the lease term or estimated useful life of the asset. An assumption of lease renewal where a renewal option exists is used only when the renewal has been determined to be reasonably assured. The estimated useful life of leasehold improvements is one to 12 years. |
45
(3) | Tax liabilities of $2.8 million related to uncertain tax positions are not included in the table because we cannot reliably estimate the timing and amount of future payments, if any. |
The Company had $8.7 million of standby letters of credit and bank guarantees outstanding as of December 31, 2016. These consisted of $4.5 million related to property leases, $3.1 million related to customer performance guarantees and $1.1 million related to a value added tax and customs authorities' licenses. We had $5.2 million of standby letters of credit outstanding as of December 26, 2015. These consisted of $3.1 million related to customer performance guarantees, $1.2 million related to a value added tax license and $0.9 million related to property leases.
Off-Balance Sheet Arrangements
As of December 31, 2016, we did not have any relationships with unconsolidated entities or financial partnerships, such as entities often referred to as structured finance or special purpose entities, which would have been established for the purpose of facilitating off-balance sheet arrangements or other contractually narrow or limited purposes.
Critical Accounting Policies and Estimates
Our consolidated financial statements are prepared in accordance with U.S. generally accepted accounting principles (“U.S. GAAP”). These accounting principles require us to make certain estimates, assumptions and judgments that can affect the reported amounts of assets and liabilities and disclosure of contingent assets and liabilities as of the date of the consolidated financial statements, as well as the reported amounts of revenue and expenses during the periods presented. Significant estimates, assumptions and judgments made by management include revenue recognition, stock-based compensation, inventory valuation, accrued warranty and accounting for income taxes. Management believes that the estimates, assumptions and judgments upon which they rely are reasonable based upon information available to them at the time that these estimates and judgments are made. To the extent there are material differences between these estimates and actual results, our consolidated financial statements will be affected.
Revenue Recognition
Many of our product sales are sold in combination with installation and deployment services along with initial hardware and software support. Periodically, our product sales are also sold with spares management, on-site hardware replacement services, network management operations, software subscription, extended hardware warranty or training. Initial software and hardware support services are generally delivered over a one-year period in connection with the initial purchase. Software warranty provides customers with maintenance releases during the warranty support period and hardware warranty provides replacement or repair of equipment that fails to perform in line with specifications. Software subscription service includes software warranty and additionally provides customers with rights to receive unspecified software product upgrades released during the support period.
Spares management and on-site hardware replacement services include the replacement of defective units at customer sites in accordance with specified service level agreements. Network operations management includes the day-to-day operation of a customer's network. These services are generally delivered on an annual basis. Training services include the right to a specified number of instructor-led or web based training classes, and installation and deployment services may include customer site assessments, equipment installation and testing. These services are generally delivered over a 30 to 120 day period.
We recognize product revenue when all of the following have occurred: (1) we have entered into a legally binding arrangement with the customer; (2) delivery has occurred, which is when product title and risk of loss have transferred to the customer; (3) customer payment is deemed fixed or determinable; and (4) collectability is reasonably assured.
We allocate revenue to each element in our multiple-element arrangements based upon their relative selling prices. We determine the selling price for each deliverable based on a selling price hierarchy. The selling price for a deliverable is based on its vendor specific objective evidence (“VSOE”) if available, third party evidence (“TPE”) if VSOE is not available, or estimated selling price (“ESP”) if neither VSOE nor TPE is available. Revenue allocated to each element is then recognized when the basic revenue recognition criteria for that element has been met.
46
VSOE of selling price is used in the selling price allocation in all instances where it exists. VSOE of selling price for products and services is determined when a substantial majority of the selling prices fall within a reasonable range when sold separately. In certain instances, we are not able to establish VSOE for all deliverables in an arrangement with multiple elements. This mainly occurs where insufficient standalone sales transactions have occurred or where pricing for that element has not been consistent.
TPE of selling price can be established by evaluating largely interchangeable competitor products or services in standalone sales to similarly situated customers. As our products contain a significant element of proprietary technology and the solution offered differs substantially from that of competitors, it is typically difficult to obtain the reliable standalone competitive pricing necessary to establish TPE.
ESP represents the best estimate of the price at which we would transact a sale if the product or service was sold on a standalone basis. We determine ESP for a product or service by considering multiple factors including, but not limited to market conditions, competitive landscape, gross margin objectives and pricing practices. The determination of ESP is made through formal approval by our management, taking into consideration the overall go-to-market pricing strategy.
As our go-to-market strategies evolve, we may modify our pricing practices in the future, which could result in changes in selling prices, including both VSOE and ESP. As a result, our future revenue recognition for multiple element arrangements could differ from that recorded in the current period. We regularly review VSOE, TPE, and ESP and maintain internal controls over the establishment and update of these inputs.
We limit the amount of revenue recognition for delivered elements to the amount that is not contingent on the future delivery of products or services, future performance obligations or subject to customer-specified return or refund privileges. We evaluate each deliverable in an arrangement to determine whether they represent separate units of accounting.
We have a limited number of software offerings which are not required to deliver the tangible product’s essential functionality and can be sold separately. Revenue from sales of these software products and related post-contract support will continue to be accounted for under software revenue recognition rules. Our multiple-element arrangements may therefore have a software deliverable that is subject to the existing software revenue recognition guidance. The revenue for these multiple-element arrangements is allocated to the software deliverable and the non-software deliverables based on the relative selling prices of all of the deliverables in the arrangement using the hierarchy in the revenue recognition accounting guidance. Revenue related to these offerings have historically not been material.
Services revenue includes software subscription services, installation and deployment services, spares management, on-site hardware replacement services, network operations management, extended hardware warranty services and training. Revenue from software subscription, spares management, on-site hardware replacement services, network operations management and extended hardware warranty contracts is deferred and is recognized ratably over the contractual support period, which is generally one year. Revenue related to training and installation and deployment services is recognized as the services are completed.
Contracts and customer purchase orders are generally used to determine the existence of an arrangement. In addition, shipping documents and customer acceptances, when applicable, are used to verify delivery and transfer of title. Revenue is recognized only when title and risk of loss pass to customers and when the revenue recognition criteria have been met. In instances where acceptance of the product occurs upon formal written acceptance, revenue is recognized only after such written acceptance has been received. We assess whether the fee is fixed or determinable based on the payment terms associated with the transaction. Payment terms to customers generally range from net 30 to 120 days from invoice, which are considered to be standard payment terms. We assess our ability to collect from our customers based primarily on the creditworthiness and past payment history of the customer.
For sales to resellers, the same revenue recognition criteria apply. It is our practice to identify an end user prior to shipment to a reseller. We do not offer rights of return or price protection to our resellers.
Shipping charges billed to customers are included in product revenue and related shipping costs are included in product cost. We report revenue net of any required taxes collected from customers and remitted to government authorities, with the collected taxes recorded as current liabilities until remitted to the relevant government authority.
47
Stock-Based Compensation
Stock-based compensation cost is measured at the grant date based on the fair value of the award, and is recognized as expense over the requisite service period (generally the vesting period) under the straight-line amortization method. The expected forfeiture rate was estimated based on our historical forfeiture data and compensation costs were recognized only for those equity awards expected to vest. The estimation of the forfeiture rate required judgment, and to the extent actual forfeitures differed from expectations, changes in estimate were recorded as an adjustment in the period when such estimates were revised. We historically recorded stock-based compensation expense by applying the forfeiture rates and adjusted estimated forfeiture rates to actual. During the third fiscal quarter beginning on June 26, 2016, we elected to early adopt ASU 2016-09. We also elected to change our accounting policy to account for forfeitures when they occur on a modified retrospective basis.
We make a number of estimates and assumptions in determining stock-based compensation related to stock options including the following:
• | The expected term represents the weighted-average period that the stock options are expected to be outstanding prior to being exercised. The expected term is estimated based on our historical data on employee exercise patterns and post vesting termination behavior to estimate expected exercises over the contractual term of grants. |
• | Expected volatility of our stock has been historically based on the weighted-average implied and historical volatility of Infinera and its peer group. The peer group is comprised of similar companies in the same industrial sector. As we gained more historical volatility data, the weighting of our own data in the expected volatility calculation associated with options gradually increased to 100% by 2013. |
We estimate the fair value of the rights to acquire stock under our ESPP using the Black-Scholes option pricing formula. Our ESPP provides for consecutive six-month offering periods and we use our own historical volatility data in the valuation of ESPP shares.
We granted performance stock units (“PSUs”) to our executive officers and senior management in 2014, 2015 and 2016 as part of our annual refresh grant process. These PSUs entitle our executive officers and senior management to receive a number of shares of the Company's common stock based on its stock price performance compared to a specified target composite index for the same period. These PSUs vest over the span of one year, two years and three years, and the number of shares to be issued upon vesting ranges from 0 to 2.0 times the number of PSUs granted depending on the relative performance of the Company's common stock price compared to the target composite index. This performance metric is classified as a market condition.
We use a Monte Carlo simulation model to determine the fair value of PSUs on the date of grant. The Monte Carlo simulation model is based on a discounted cash flow approach, with the simulation of a large number of possible stock price outcomes for our stock and the target composite index. The use of the Monte Carlo simulation model requires the input of a number of assumptions including expected volatility of our stock price, expected volatility of target composite index, correlation between changes in our stock price and changes in the target composite index, risk-free interest rate, and expected dividends as applicable. Expected volatility of our stock is based on the weighted-average historical volatility of our stock. Expected volatility of target composite index is based on the historical data. Correlation is based on the historical relationship between our stock price and the target composite index average. The risk-free interest rate is based upon the treasury zero-coupon yield appropriate for the term of the PSU as of the grant date. The expected dividend yield is zero for us as we do not expect to pay dividends in the future. The expected dividend yield for the target composite index is the annual dividend yield expressed as a percentage of the composite average of the target composite index on the grant date.
In addition, we have granted other PSUs to certain employees that only vest upon the achievement of specific operational performance criteria.
48
Accounting for Income Taxes
As part of the process of preparing our consolidated financial statements, we are required to estimate our taxes in each of the jurisdictions in which we operate. We estimate actual current tax expense together with assessing temporary differences resulting from different treatment of items, such as accruals and allowances not currently deductible for tax purposes. These differences result in deferred tax assets and liabilities, which are included in our consolidated balance sheets. In general, deferred tax assets represent future tax benefits to be received when certain expenses previously recognized in our consolidated statements of operations become deductible expenses under applicable income tax laws or loss or credit carryforwards are utilized. Accordingly, realization of our deferred tax assets is dependent on future taxable income within the respective jurisdictions against which these deductions, losses and credits can be utilized within the applicable future periods.
We must assess the likelihood that some portion or all of our deferred tax assets will be recovered from future taxable income within the respective jurisdictions, and to the extent we believe that recovery does not meet the “more-likely-than-not” standard, we must establish a valuation allowance. The ultimate realization of deferred tax assets is dependent upon the generation of future taxable income during the periods in which those temporary differences become deductible. Management judgment is required in determining our provision for income taxes, our deferred tax assets and liabilities and any valuation allowance recorded against our net deferred tax assets. In evaluating the need for a full or partial valuation allowance, all positive and negative evidence must be considered, including our forecasts of taxable income over the applicable carryforward periods, our current financial performance, our market environment, and other factors. Based on the available objective evidence, at December 31, 2016, management believes it is more likely than not that the domestic net deferred tax assets will not be realizable in the foreseeable future. Accordingly, the domestic net deferred tax assets were fully reserved with a valuation allowance. To the extent that we determine that deferred tax assets are realizable on a more likely than not basis, and adjustment is needed, that adjustment will be recorded in the period that the determination is made and would generally decrease the valuation allowance and record a corresponding benefit to earnings.
Inventory Valuation
Inventories consist of raw materials, work-in-process and finished goods and are stated at standard cost adjusted to approximate the lower of actual cost or market. Costs are recognized utilizing the first-in, first-out method. Market value is based upon an estimated selling price reduced by the estimated cost of disposal. The determination of market value involves numerous judgments including estimated average selling prices based upon recent sales volumes, industry trends, existing customer orders, current contract price, future demand and pricing and technological obsolescence of our products.
Inventory that is obsolete or in excess of our forecasted demand or is anticipated to be sold at a loss is written down to its estimated net realizable value based on historical usage and expected demand. In valuing our inventory costs and deferred inventory costs, we considered whether the utility of the products delivered or expected to be delivered at less than cost, primarily comprised of common equipment, had declined. We concluded that, in the instances where the utility of the products delivered or expected to be delivered was less than cost, it was appropriate to value the inventory costs and deferred inventory costs at cost or market, whichever is lower, thereby recognizing the cost of the reduction in utility in the period in which the reduction occurred or can be reasonably estimated. We have, therefore, recognized inventory write-downs as necessary in each period in order to reflect inventory at the lower of cost or market.
We consider whether we should accrue losses on firm purchase commitments related to inventory items. Given that the net realizable value of common equipment is below contracted purchase price, we have also recorded losses on these firm purchase commitments in the period in which the commitment is made. When the inventory parts related to these firm purchase commitments are received, that inventory is recorded at the purchase price less the accrual for the loss on the purchase commitment.
49
Accrued Warranty
We warrant that our products will operate substantially in conformity with product specifications. Hardware warranties provide the purchaser with protection in the event that the product does not perform to product specifications. During the warranty period, the purchaser’s sole and exclusive remedy in the event of such defect or failure to perform is limited to the correction of the defect or failure by repair, refurbishment or replacement, at our sole option and expense. Our hardware warranty periods generally range from one to five years from date of acceptance for hardware and our software warranty is 90 days. Upon delivery of our products, we provide for the estimated cost to repair or replace products that may be returned under warranty. The hardware warranty accrual is based on actual historical returns and cost of repair experience and the application of those historical rates to our in-warranty installed base. The provision for warranty claims fluctuates depending upon the installed base of products and the failure rates and costs of repair associated with these products under warranty. Furthermore, our costs of repair vary based on repair volume and our ability to repair, rather than replace, defective units. In the event that actual product failure rates and costs to repair differ from our estimates, revisions to the warranty provision are required. In addition, from time to time, specific hardware warranty accruals may be made if unforeseen technical problems arise with specific products. We regularly assess the adequacy of our recorded warranty liabilities and adjust the amounts as necessary.
Business Combinations
Accounting for acquisitions requires our management to estimate the fair value of the assets and liabilities acquired, which involves a number of judgments, assumptions and estimates that could materially affect the timing or amounts recognized in our financial statements. The items involving the most significant assumptions, estimates, and judgments include determining the fair value of the following:
• | intangible assets including valuation methodology, estimations of future cash flows and discount rates, as well as the estimated useful life of the intangible assets; |
• | the acquired company’s brand, as well as assumptions about the period of time the acquired brand will continue to be used; and |
• | deferred tax assets and liabilities, uncertain tax positions and tax-related valuation allowances, which are initially estimated as of the acquisition date. |
While we use our best estimates and assumptions to accurately value assets acquired and liabilities assumed at the acquisition date, our estimates are inherently uncertain and subject to refinement. As a result, during the measurement period, which may be up to one year following the acquisition date, we record adjustments to the assets acquired and liabilities assumed with the corresponding offset to goodwill.
Recent Accounting Pronouncements
See Note 2, “Significant Accounting Policies,” to the Notes to Consolidated Financial Statements for a full description of recent accounting pronouncements including the respective expected dates of adoptions and effects on us.
50
ITEM 7A. | QUANTITATIVE AND QUALITATIVE DISCLOSURES ABOUT MARKET RISK |
Foreign Currency Risk
We operate in international markets, which expose us to market risk associated with foreign currency exchange rate fluctuations between the U.S. dollar and various foreign currencies, the most significant of which is the euro and Swedish kronor (“SEK”). Historically, the majority of our revenue contracts are denominated in U.S. dollars, with the most significant exception being in Europe, where we invoice primarily in euros and SEK. Additionally, a portion of our expenses, primarily the cost of personnel for research and development, sales and sales support to deliver technical support on our products and professional services, and the cost to manufacture, are denominated in foreign currencies, primarily the Indian rupee, the euro, SEK and the British pound. Revenue resulting from selling in local currencies and costs incurred in local currencies are exposed to foreign currency exchange rate fluctuations that can affect our operating income. As exchange rates vary, operating income may differ from expectations.
We currently enter into foreign currency exchange forward contracts to reduce the impact of currency exchange rate movements on certain transactions, but do not cover all foreign-denominated transactions and therefore do not entirely eliminate the impact of fluctuations in exchange rates that could negatively affect our results of operations and financial condition.
We enter into foreign currency exchange forward contracts to reduce the impact of foreign currency fluctuations on accounts receivable and restricted cash denominated in euros and British pound. As a result, we do not expect a significant impact to our results from a change in exchange rates on foreign denominated accounts receivable balances and restricted cash in the near-term. Gains and losses on these contracts are intended to offset the impact of foreign exchange rate fluctuations on the underlying foreign currency denominated accounts receivables and restricted cash. Accordingly, the effect of an immediate 10% adverse change in foreign exchange rates on these transactions during 2016 would not be material to our results of operations.
During 2016, we also entered into foreign currency exchange contracts to reduce the volatility of cash flows primarily related to forecasted revenues and expenses denominated in euros, British pound and SEK. The contracts are settled for U.S. dollars and SEK at maturity and at rates agreed to at inception of the contracts. The gains and losses on these foreign currency derivatives are recorded to the consolidated statement of operations line item, in the current period, to which the item that is being economically hedged is recorded. The effect of an immediate 10% adverse change in foreign exchange rates on these transactions during 2016 would not be material to our results of operations.
Interest Rate Sensitivity
We had cash and cash equivalents, short-term and long-term investments, and short-term and long-term restricted cash totaling $360.0 million and $356.5 million as of December 31, 2016 and December 26, 2015, respectively. As of December 31, 2016, we have invested in certificates of deposit, money market funds, commercial paper, U.S. agency notes, corporate bonds and U.S. treasuries. The unrestricted cash and cash equivalents are held for working capital purposes. We do not enter into investments for speculative purposes. We believe that we do not have any material exposure to changes in the fair value as a result of changes in interest rates. Declines in interest rates, however, will reduce future investment income. If overall interest rates fell by 10% in 2016 and 2015, our interest income would have declined approximately $0.2 million and $0.2 million, respectively, assuming consistent investment levels.
Market Risk and Market Interest Risk
Holders may convert the Notes prior to maturity upon the occurrence of certain circumstances. Upon conversion, we will pay or deliver, as the case may be, cash, shares of our common stock or a combination of cash and shares of our common stock, at our election. If our common stock price is above the initial conversion price of $12.58 upon conversion or at maturity, the amount of cash or shares of common stock required to pay the conversion premium is not fixed and would increase if our common stock price increases.
As of December 31, 2016, the fair value of the Notes was $154.3 million. The fair value was calculated using a valuation model. The fair value of the Notes is subject to interest rate risk, market risk and other factors due to the convertible feature. The fair value of the Notes will generally increase as interest rates fall and decrease as interest rates rise. In addition, the fair value of the Notes will generally increase as our common
51
stock price increases and will generally decrease as our common stock price declines in value. The interest and market value changes affect the fair value of the Notes but do not impact our financial position, cash flows or results of operations due to the fixed nature of the debt obligation. Additionally, we do not carry the Notes at fair value. We present the fair value of the Notes for required disclosure purposes only.
See Note 11, “Convertible Senior Notes,” to the Notes to Consolidated Financial Statements for further information.
52
ITEM 8. FINANCIAL STATEMENTS AND SUPPLEMENTARY DATA
INDEX TO CONSOLIDATED FINANCIAL STATEMENTS
Page | |
Reports of Ernst & Young LLP, Independent Registered Public Accounting Firm | |
Consolidated Balance Sheets | |
Consolidated Statements of Operations | |
Consolidated Statements of Comprehensive Income (Loss) | |
Consolidated Statements of Stockholders’ Equity | |
Consolidated Statements of Cash Flows | |
Notes to Consolidated Financial Statements | |
53
Report of Ernst & Young LLP, Independent Registered Public Accounting Firm
The Board of Directors and Stockholders
Infinera Corporation
We have audited the accompanying consolidated balance sheets of Infinera Corporation as of December 31, 2016 and December 26, 2015, and the related consolidated statements of operations, comprehensive income (loss), stockholders’ equity and cash flows for each of the three years in the period ended December 31, 2016. Our audits also included the financial statement schedule listed in the Index at Item 15(a). These financial statements and schedule are the responsibility of the Company’s management. Our responsibility is to express an opinion on these financial statements and schedule based on our audits.
We conducted our audits in accordance with the standards of the Public Company Accounting Oversight Board (United States). Those standards require that we plan and perform the audit to obtain reasonable assurance about whether the financial statements are free of material misstatement. An audit includes examining, on a test basis, evidence supporting the amounts and disclosures in the financial statements. An audit also includes assessing the accounting principles used and significant estimates made by management, as well as evaluating the overall financial statement presentation. We believe that our audits provide a reasonable basis for our opinion.
In our opinion, the financial statements referred to above present fairly, in all material respects, the consolidated financial position of Infinera Corporation at December 31, 2016 and December 26, 2015, and the consolidated results of its operations and its cash flows for each of the three years in the period ended December 31, 2016, in conformity with U.S. generally accepted accounting principles. Also, in our opinion, the related financial statement schedule, when considered in relation to the basic financial statements taken as a whole, presents fairly in all material respects the information set forth therein.
We also have audited, in accordance with the standards of the Public Company Accounting Oversight Board (United States), Infinera Corporation’s internal control over financial reporting as of December 31, 2016, based on criteria established in Internal Control-Integrated Framework issued by the Committee of Sponsoring Organizations of the Treadway Commission (2013 framework) and our report dated February 23, 2017 expressed an unqualified opinion thereon.
/s/ ERNST & YOUNG LLP
San Jose, California
February 23, 2017
54
Report of Ernst & Young LLP, Independent Registered Public Accounting Firm
The Board of Directors and Stockholders
Infinera Corporation
We have audited Infinera Corporation’s internal control over financial reporting as of December 31, 2016, based on criteria established in Internal Control-Integrated Framework issued by the Committee of Sponsoring Organizations of the Treadway Commission (2013 framework) (the COSO criteria). Infinera Corporation’s management is responsible for maintaining effective internal control over financial reporting, and for its assessment of the effectiveness of internal control over financial reporting included in the accompanying Management’s Report on Internal Control Over Financial Reporting. Our responsibility is to express an opinion on the company’s internal control over financial reporting based on our audit.
We conducted our audit in accordance with the standards of the Public Company Accounting Oversight Board (United States). Those standards require that we plan and perform the audit to obtain reasonable assurance about whether effective internal control over financial reporting was maintained in all material respects. Our audit included obtaining an understanding of internal control over financial reporting, assessing the risk that a material weakness exists, testing and evaluating the design and operating effectiveness of internal control based on the assessed risk, and performing such other procedures as we considered necessary in the circumstances. We believe that our audit provides a reasonable basis for our opinion.
A company’s internal control over financial reporting is a process designed to provide reasonable assurance regarding the reliability of financial reporting and the preparation of financial statements for external purposes in accordance with generally accepted accounting principles. A company’s internal control over financial reporting includes those policies and procedures that (1) pertain to the maintenance of records that, in reasonable detail, accurately and fairly reflect the transactions and dispositions of the assets of the company; (2) provide reasonable assurance that transactions are recorded as necessary to permit preparation of financial statements in accordance with generally accepted accounting principles, and that receipts and expenditures of the company are being made only in accordance with authorizations of management and directors of the company; and (3) provide reasonable assurance regarding prevention or timely detection of unauthorized acquisition, use or disposition of the company’s assets that could have a material effect on the financial statements.
Because of its inherent limitations, internal control over financial reporting may not prevent or detect misstatements. Also, projections of any evaluation of effectiveness to future periods are subject to the risk that controls may become inadequate because of changes in conditions, or that the degree of compliance with the policies or procedures may deteriorate.
In our opinion, Infinera Corporation maintained, in all material respects, effective internal control over financial reporting as of December 31, 2016, based on the COSO criteria.
We also have audited, in accordance with the standards of the Public Company Accounting Oversight Board (United States), the consolidated balance sheets of Infinera Corporation as of December 31, 2016 and December 26, 2015, and the related consolidated statements of operations, comprehensive income (loss), stockholders’ equity and cash flows for each of the three years in the period ended December 31, 2016 of Infinera Corporation and our report dated February 23, 2017 expressed an unqualified opinion thereon.
/s/ ERNST & YOUNG LLP
San Jose, California
February 23, 2017
55
INFINERA CORPORATION
CONSOLIDATED BALANCE SHEETS
(In thousands, except par values)
December 31, 2016 | December 26, 2015 | ||||||
ASSETS | |||||||
Current assets: | |||||||
Cash and cash equivalents | $ | 162,641 | $ | 149,101 | |||
Short-term investments | 141,697 | 125,561 | |||||
Short-term restricted cash | 8,490 | — | |||||
Accounts receivable, net of allowance for doubtful accounts of $772 in 2016 and $630 in 2015 | 150,370 | 186,243 | |||||
Inventory | 232,955 | 174,699 | |||||
Prepaid expenses and other current assets | 34,270 | 29,511 | |||||
Total current assets | 730,423 | 665,115 | |||||
Property, plant and equipment, net | 124,800 | 110,861 | |||||
Intangible assets | 108,475 | 156,319 | |||||
Goodwill | 176,760 | 191,560 | |||||
Long-term investments | 40,779 | 76,507 | |||||
Cost-method investments | 7,000 | 14,500 | |||||
Long-term restricted cash | 6,449 | 5,310 | |||||
Other non-current assets | 3,897 | 4,009 | |||||
Total assets | $ | 1,198,583 | $ | 1,224,181 | |||
LIABILITIES AND STOCKHOLDERS’ EQUITY | |||||||
Current liabilities: | |||||||
Accounts payable | $ | 62,486 | $ | 92,554 | |||
Accrued expenses | 31,580 | 33,736 | |||||
Accrued compensation and related benefits | 46,637 | 49,887 | |||||
Accrued warranty | 16,930 | 17,889 | |||||
Deferred revenue | 58,900 | 42,977 | |||||
Total current liabilities | 216,533 | 237,043 | |||||
Long-term debt, net | 133,586 | 123,327 | |||||
Accrued warranty, non-current | 23,412 | 20,955 | |||||
Deferred revenue, non-current | 19,362 | 13,881 | |||||
Deferred tax liability, non-current | 25,327 | 35,731 | |||||
Other long-term liabilities | 18,035 | 16,183 | |||||
Commitments and contingencies (Note 12) | |||||||
Stockholders’ equity: | |||||||
Preferred stock, $0.001 par value Authorized shares—25,000 and no shares issued and outstanding | — | — | |||||
Common stock, $0.001 par value Authorized shares—500,000 in 2016 and 2015 Issued and outstanding shares—145,021 in 2016 and 140,197 in 2015 | 145 | 140 | |||||
Additional paid-in capital | 1,354,082 | 1,300,301 | |||||
Accumulated other comprehensive income (loss) | (28,324 | ) | 1,123 | ||||
Accumulated deficit | (563,575 | ) | (539,413 | ) | |||
Total Infinera Corporation stockholders’ equity | 762,328 | 762,151 | |||||
Noncontrolling interest | — | 14,910 | |||||
Total stockholders' equity | 762,328 | 777,061 | |||||
Total liabilities and stockholders’ equity | $ | 1,198,583 | $ | 1,224,181 | |||
The accompanying notes are an integral part of these consolidated financial statements.
56
INFINERA CORPORATION
CONSOLIDATED STATEMENTS OF OPERATIONS
(In thousands, except per share data)
Years Ended | |||||||||||
December 31, 2016 | December 26, 2015 | December 27, 2014 | |||||||||
Revenue: | |||||||||||
Product | $ | 751,167 | $ | 769,230 | $ | 572,276 | |||||
Services | 118,968 | 117,484 | 95,803 | ||||||||
Total revenue | 870,135 | 886,714 | 668,079 | ||||||||
Cost of revenue: | |||||||||||
Cost of product | 433,266 | 436,916 | 340,856 | ||||||||
Cost of services | 43,151 | 46,321 | 38,919 | ||||||||
Total cost of revenue | 476,417 | 483,237 | 379,775 | ||||||||
Gross profit | 393,718 | 403,477 | 288,304 | ||||||||
Operating expenses: | |||||||||||
Research and development | 232,291 | 180,703 | 133,484 | ||||||||
Sales and marketing | 118,858 | 101,398 | 79,026 | ||||||||
General and administrative | 68,343 | 61,640 | 48,452 | ||||||||
Total operating expenses | 419,492 | 343,741 | 260,962 | ||||||||
Income (loss) from operations | (25,774 | ) | 59,736 | 27,342 | |||||||
Other income (expense), net: | |||||||||||
Interest income | 2,478 | 1,837 | 1,456 | ||||||||
Interest expense | (12,887 | ) | (11,941 | ) | (11,021 | ) | |||||
Other gain (loss), net | 7,002 | 2,399 | (1,365 | ) | |||||||
Total other income (expense), net | (3,407 | ) | (7,705 | ) | (10,930 | ) | |||||
Income (loss) before income taxes | (29,181 | ) | 52,031 | 16,412 | |||||||
Provision for (benefit from) income taxes | (4,751 | ) | 1,081 | 2,753 | |||||||
Net income (loss) | (24,430 | ) | 50,950 | 13,659 | |||||||
Less: Loss attributable to noncontrolling interest | (503 | ) | (463 | ) | — | ||||||
Net income (loss) attributable to Infinera Corporation | $ | (23,927 | ) | $ | 51,413 | $ | 13,659 | ||||
Net income (loss) per common share attributable to Infinera Corporation: | |||||||||||
Basic | $ | (0.17 | ) | $ | 0.39 | $ | 0.11 | ||||
Diluted | $ | (0.17 | ) | $ | 0.36 | $ | 0.11 | ||||
Weighted average shares used in computing net income (loss) per common share: | |||||||||||
Basic | 142,989 | 133,259 | 123,672 | ||||||||
Diluted | 142,989 | 143,171 | 128,565 | ||||||||
The accompanying notes are an integral part of these consolidated financial statements.
57
INFINERA CORPORATION
CONSOLIDATED STATEMENTS OF COMPREHENSIVE INCOME (LOSS)
(In thousands)
Years Ended | |||||||||||
December 31, 2016 | December 26, 2015 | December 27, 2014 | |||||||||
Net income (loss) | $ | (24,430 | ) | $ | 50,950 | $ | 13,659 | ||||
Other comprehensive income (loss): | |||||||||||
Unrealized gain (loss) on available-for-sale investments | 297 | (62 | ) | (320 | ) | ||||||
Foreign currency translation adjustment | (29,625 | ) | 5,803 | (812 | ) | ||||||
Tax effect on items related to available-for-sale investments | (119 | ) | — | — | |||||||
Net change in accumulated other comprehensive income (loss) | (29,447 | ) | 5,741 | (1,132 | ) | ||||||
Less: Comprehensive loss attributable to noncontrolling interest | (503 | ) | (463 | ) | — | ||||||
Comprehensive income (loss) attributable to Infinera Corporation | $ | (53,374 | ) | $ | 57,154 | $ | 12,527 | ||||
The accompanying notes are an integral part of these consolidated financial statements.
58
INFINERA CORPORATION
CONSOLIDATED STATEMENTS OF STOCKHOLDERS’ EQUITY
For the Years Ended December 27, 2014, December 26, 2015 and December 31, 2016
(In thousands)
Common Stock | Additional Paid-in Capital | Accumulated Other Comprehensive Income (Loss) | Accumulated Deficit | Total Stockholders' Equity | Noncontrolling Interest | Total | |||||||||||||||||||||||||
Shares | Amount | ||||||||||||||||||||||||||||||
Balance at December 28, 2013 | 119,887 | $ | 120 | 1,025,661 | $ | (3,486 | ) | $ | (604,485 | ) | $ | 417,810 | $ | — | $ | 417,810 | |||||||||||||||
Stock options exercised | 2,001 | 2 | 13,981 | — | — | 13,983 | — | 13,983 | |||||||||||||||||||||||
ESPP shares issued | 1,438 | 1 | 10,727 | — | 10,728 | — | 10,728 | ||||||||||||||||||||||||
Shares withheld for tax obligations | (217 | ) | — | (1,846 | ) | — | — | (1,846 | ) | — | (1,846 | ) | |||||||||||||||||||
Restricted stock units released | 3,051 | 3 | (3 | ) | — | — | — | — | — | ||||||||||||||||||||||
Stock-based compensation | — | — | 28,705 | — | — | 28,705 | — | 28,705 | |||||||||||||||||||||||
Other comprehensive loss | — | — | — | (1,132 | ) | — | (1,132 | ) | — | (1,132 | ) | ||||||||||||||||||||
Net income | — | — | — | — | 13,659 | 13,659 | — | 13,659 | |||||||||||||||||||||||
Balance at December 27, 2014 | 126,160 | $ | 126 | $ | 1,077,225 | $ | (4,618 | ) | $ | (590,826 | ) | $ | 481,907 | $ | — | $ | 481,907 | ||||||||||||||
Stock options exercised | 1,787 | 2 | 13,092 | — | — | 13,094 | — | 13,094 | |||||||||||||||||||||||
ESPP shares issued | 1,229 | 1 | 12,252 | — | — | 12,253 | — | 12,253 | |||||||||||||||||||||||
Shares withheld for tax obligations | (300 | ) | — | (5,227 | ) | — | — | (5,227 | ) | — | (5,227 | ) | |||||||||||||||||||
Restricted stock units released | 3,448 | 3 | (3 | ) | — | — | — | — | — | ||||||||||||||||||||||
Issuance of common stock related to acquisition | 7,873 | 8 | 169,499 | — | — | 169,507 | — | 169,507 | |||||||||||||||||||||||
Stock-based compensation | — | — | 32,621 | — | — | 32,621 | — | 32,621 | |||||||||||||||||||||||
Noncontrolling interest investment | — | — | — | — | — | — | 15,373 | 15,373 | |||||||||||||||||||||||
Tax benefit from share-based award activity | — | — | 842 | — | — | 842 | — | 842 | |||||||||||||||||||||||
Other comprehensive income | — | — | — | 5,741 | — | 5,741 | — | 5,741 | |||||||||||||||||||||||
Net income | — | — | — | — | 51,413 | 51,413 | (463 | ) | 50,950 | ||||||||||||||||||||||
Balance at December 26, 2015 | 140,197 | $ | 140 | $ | 1,300,301 | $ | 1,123 | $ | (539,413 | ) | $ | 762,151 | $ | 14,910 | $ | 777,061 | |||||||||||||||
The accompanying notes are an integral part of these consolidated financial statements.
59
INFINERA CORPORATION
CONSOLIDATED STATEMENTS OF STOCKHOLDERS’ EQUITY
For the Years Ended December 27, 2014, December 26, 2015 and December 31, 2016 —
(Continued)
(In thousands)
Common Stock | Additional Paid-in Capital | Accumulated Other Comprehensive Income (Loss) | Accumulated Deficit | Total Stockholders' Equity | Noncontrolling Interest | Total | |||||||||||||||||||||||||
Shares | Amount | ||||||||||||||||||||||||||||||
Balance at December 26, 2015 | 140,197 | $ | 140 | $ | 1,300,301 | $ | 1,123 | $ | (539,413 | ) | $ | 762,151 | $ | 14,910 | $ | 777,061 | |||||||||||||||
Stock options exercised | 825 | 1 | 4,094 | — | — | 4,095 | — | 4,095 | |||||||||||||||||||||||
ESPP shares issued | 1,369 | 1 | 13,607 | — | — | 13,608 | — | 13,608 | |||||||||||||||||||||||
Shares withheld for tax obligations | (287 | ) | — | (3,657 | ) | — | — | (3,657 | ) | — | (3,657 | ) | |||||||||||||||||||
Restricted stock units released | 2,917 | 3 | (3 | ) | — | — | — | — | — | ||||||||||||||||||||||
Stock-based compensation | — | — | 42,552 | — | — | 42,552 | — | 42,552 | |||||||||||||||||||||||
Noncontrolling interest investment | — | — | — | — | — | — | (14,407 | ) | (14,407 | ) | |||||||||||||||||||||
Squeeze-out Proceedings | — | — | (2,812 | ) | — | — | (2,812 | ) | — | (2,812 | ) | ||||||||||||||||||||
Cumulative-effect adjustment from adoption of ASU 2016-09 | — | — | — | — | (235 | ) | (235 | ) | — | (235 | ) | ||||||||||||||||||||
Tax benefit from share-based award activity | — | — | — | — | — | — | — | — | |||||||||||||||||||||||
Other comprehensive loss | — | — | — | (29,447 | ) | — | (29,447 | ) | — | (29,447 | ) | ||||||||||||||||||||
Net loss | — | — | — | — | (23,927 | ) | (23,927 | ) | (503 | ) | (24,430 | ) | |||||||||||||||||||
Balance at December 31, 2016 | 145,021 | $ | 145 | $ | 1,354,082 | $ | (28,324 | ) | $ | (563,575 | ) | $ | 762,328 | $ | — | $ | 762,328 | ||||||||||||||
The accompanying notes are an integral part of these consolidated financial statements.
60
INFINERA CORPORATION
CONSOLIDATED STATEMENTS OF CASH FLOWS
(In thousands)
Years Ended | |||||||||||
December 31, 2016 | December 26, 2015 | December 27, 2014 | |||||||||
Cash Flows from Operating Activities: | |||||||||||
Net income (loss) | $ | (24,430 | ) | $ | 50,950 | $ | 13,659 | ||||
Adjustments to reconcile net income (loss) to net cash provided by operating activities: | |||||||||||
Depreciation and amortization | 61,489 | 35,777 | 25,917 | ||||||||
Amortization of debt discount and issuance costs | 10,260 | 9,281 | 8,395 | ||||||||
Amortization of premium on investments | 1,069 | 2,917 | 3,772 | ||||||||
Impairment on acquired in-process research and development | 11,295 | — | — | ||||||||
Realized gain on sale of cost-method investments | (8,983 | ) | — | — | |||||||
Stock-based compensation expense | 40,533 | 32,580 | 28,394 | ||||||||
Other (gain) loss | 672 | (442 | ) | (12 | ) | ||||||
Changes in assets and liabilities: | |||||||||||
Accounts receivable | 33,895 | (15,971 | ) | (53,948 | ) | ||||||
Inventory | (64,095 | ) | (17,116 | ) | (25,486 | ) | |||||
Prepaid expenses and other assets | (5,501 | ) | (3,248 | ) | (8,324 | ) | |||||
Accounts payable | (28,254 | ) | 19,223 | 18,810 | |||||||
Accrued liabilities and other expenses | (11,012 | ) | 8,448 | 15,998 | |||||||
Deferred revenue | 21,439 | 10,777 | 8,788 | ||||||||
Net cash provided by operating activities | 38,377 | 133,176 | 35,963 | ||||||||
Cash Flows from Investing Activities: | |||||||||||
Purchase of available-for-sale investments | (124,077 | ) | (186,737 | ) | (302,398 | ) | |||||
Proceeds from sales of available-for-sale investments | — | 67,303 | 28,481 | ||||||||
Proceeds from maturities and calls of investments | 142,898 | 213,234 | 208,051 | ||||||||
Purchase of cost-method investments | (7,000 | ) | — | (5,500 | ) | ||||||
Proceeds from sale of cost-method investments | 23,483 | — | — | ||||||||
Purchase of property and equipment | (43,335 | ) | (42,018 | ) | (23,122 | ) | |||||
Acquisition of business, net of cash acquired | — | (144,445 | ) | — | |||||||
Realized gain from forward contract for business acquisition | — | 1,053 | — | ||||||||
Change in restricted cash | (4,084 | ) | 135 | (1,571 | ) | ||||||
Net cash used in investing activities | (12,115 | ) | (91,475 | ) | (96,059 | ) | |||||
Cash Flows from Financing Activities: | |||||||||||
Security pledge related to Squeeze-out Proceedings | (6,086 | ) | — | — | |||||||
Acquisition of noncontrolling interest | (16,771 | ) | — | — | |||||||
Proceeds from issuance of common stock | 17,648 | 25,351 | 24,707 | ||||||||
Minimum tax withholding paid on behalf of employees for net share settlement | (3,657 | ) | (5,227 | ) | (1,846 | ) | |||||
Excess tax benefit from stock option transactions | — | 859 | — | ||||||||
Net cash provided by (used in) financing activities | (8,866 | ) | 20,983 | 22,861 | |||||||
Effect of exchange rate changes on cash | (3,856 | ) | (78 | ) | (600 | ) | |||||
Net change in cash and cash equivalents | 13,540 | 62,606 | (37,835 | ) | |||||||
Cash and cash equivalents at beginning of period | 149,101 | 86,495 | 124,330 | ||||||||
Cash and cash equivalents at end of period | $ | 162,641 | $ | 149,101 | $ | 86,495 | |||||
Supplemental disclosures of cash flow information: | |||||||||||
Cash paid for income taxes, net of refunds | $ | 6,625 | $ | 4,570 | $ | 1,697 | |||||
Cash paid for interest | $ | 2,776 | $ | 2,647 | $ | 2,625 | |||||
Supplemental schedule of non-cash investing and financing activities: | |||||||||||
Transfer of inventory to fixed assets | $ | 5,597 | $ | 9,314 | $ | 2,569 | |||||
Common stock issued in connection with acquisition | $ | — | $ | 169,507 | $ | — | |||||
The accompanying notes are an integral part of these consolidated financial statements.
61
INFINERA CORPORATION
NOTES TO CONSOLIDATED FINANCIAL STATEMENTS
1. Organization and Basis of Presentation
Infinera Corporation (“Infinera” or the “Company”), headquartered in Sunnyvale, California, was founded in December 2000 and incorporated in the State of Delaware. Infinera provides optical transport networking equipment, software and services to telecommunications service providers, Internet Content Providers, cable providers, wholesale and enterprise carriers, research and education institutions, enterprise customers, and government entities across the globe. Optical transport networks are deployed by customers facing significant demand for optical bandwidth prompted by increased use of high-speed internet access, mobile broadband, cloud-based services, high-definition video streaming services, virtual and augmented reality, the Internet of Things (IoT) and business Ethernet services.
During the third quarter of 2015, the Company completed its public offer to the shareholders of Transmode AB (“Transmode”), acquiring 95.8% of the outstanding common shares and voting interest in Transmode. This acquisition was accounted for as a business combination, and accordingly, the Company has consolidated the financial results of Transmode with its financial results for the period from August 20, 2015, the date the acquisition closed (the "Acquisition Date"). The noncontrolling interest position is reported as a separate component of consolidated equity attributable to Transmode's shareholders. The noncontrolling interest in the Transmode entity's net loss is reported as a separate component of consolidated net income attributable to Transmode's shareholders. In August 2016, the Company received advance title to acquire the remaining 4.2% of Transmode shares not tendered in the initial offer.
The Company operates and reports financial results on a fiscal year of 52 or 53 weeks ending on the last Saturday of December in each year. Accordingly, fiscal year 2016 was a 53-week year that ended on December 31, 2016, and 2015 and 2014 were 52-week years that ended on December 26, 2015 and December 27, 2014, respectively. The next 53-week year will end on December 31, 2022.
The consolidated financial statements include the accounts of the Company and its wholly-owned subsidiaries. All intercompany balances and transactions have been eliminated. The Company reclassified certain amounts reported in previous periods to conform to the current presentation.
2. Significant Accounting Policies
Use of Estimates
The consolidated financial statements are prepared in accordance with U.S. generally accepted accounting principles (“U.S. GAAP”). These accounting principles require the Company to make certain estimates, assumptions and judgments that can affect the reported amounts of assets and liabilities and disclosure of contingent assets and liabilities as of the date of the consolidated financial statements, as well as the reported amounts of revenue and expenses during the periods presented. Significant estimates, assumptions and judgments made by management include revenue recognition, stock-based compensation, inventory valuation, accrued warranty, business combinations and accounting for income taxes. Other estimates, assumptions and judgments made by management include allowances for sales returns, allowances for doubtful accounts, useful life of property, plant and equipment, fair value measurement of the liability component of the convertible senior notes and derivative instruments. Management believes that the estimates, assumptions and judgments upon which they rely are reasonable based upon information available to them at the time that these estimates and judgments are made. To the extent there are material differences between these estimates and actual results, the Company’s consolidated financial statements will be affected.
62
INFINERA CORPORATION
NOTES TO CONSOLIDATED FINANCIAL STATEMENTS—(Continued)
Revenue Recognition
Many of the Company's product sales are sold in combination with installation and deployment services along with initial hardware and software support. Periodically, the Company's product sales are also sold with spares management, on-site hardware replacement services, network management operations, software subscription, extended hardware warranty or training. Initial software and hardware support services are generally delivered over a one-year period in connection with the initial purchase. Software warranty provides customers with maintenance releases during the warranty support period and hardware warranty provides replacement or repair of equipment that fails to perform in line with specifications. Software subscription service includes software warranty and additionally provides customers with rights to receive unspecified software product upgrades released during the support period.
Spares management and on-site hardware replacement services include the replacement of defective units at customer sites in accordance with specified service level agreements. Network operations management includes the day-to-day operation of a customer's network. These services are generally delivered on an annual basis. Training services include the right to a specified number of instructor-led or web based training classes, and installation and deployment services may include customer site assessments, equipment installation and testing. These services are generally delivered over a 30 to120 day period.
The Company recognizes product revenue when all of the following have occurred: (1) it has entered into a legally binding arrangement with the customer; (2) delivery has occurred, which is when product title and risk of loss have transferred to the customer; (3) customer payment is deemed fixed or determinable; and (4) collectability is reasonably assured.
The Company allocates revenue to each element in its multiple-element arrangements based upon their relative selling prices. The Company determines the selling price for each deliverable based on a selling price hierarchy. The selling price for a deliverable is based on its vendor specific objective evidence (“VSOE”) if available, third party evidence (“TPE”) if VSOE is not available, or estimated selling price (“ESP”) if neither VSOE nor TPE is available. Revenue allocated to each element is then recognized when the basic revenue recognition criteria for that element has been met.
VSOE of selling price is used in the selling price allocation in all instances where it exists. VSOE of selling price for products and services is determined when a substantial majority of the selling prices fall within a reasonable range when sold separately. In certain instances, the Company is not able to establish VSOE for all deliverables in an arrangement with multiple elements. This mainly occurs where insufficient standalone sales transactions have occurred or where pricing for that element has not been consistent.
TPE of selling price can be established by evaluating largely interchangeable competitor products or services in standalone sales to similarly situated customers. As the Company’s products contain a significant element of proprietary technology and the solution offered differs substantially from that of competitors, it is typically difficult to obtain the reliable standalone competitive pricing necessary to establish TPE.
ESP represents the best estimate of the price at which the Company would transact a sale if the product or service was sold on a standalone basis. The Company determines ESP for a product or service by considering multiple factors including, but not limited to market conditions, competitive landscape, gross margin objectives and pricing practices. The determination of ESP is made through formal approval by the Company’s management, taking into consideration the overall go-to-market pricing strategy. The Company regularly reviews VSOE, TPE and ESP and maintains internal controls over the establishment and update of these inputs.
The Company limits the amount of revenue recognition for delivered elements to the amount that is not contingent on the future delivery of products or services, future performance obligations or subject to customer-specified return or refund privileges. The Company evaluates each deliverable in an arrangement to determine whether they represent separate units of accounting.
The Company has a limited number of software offerings which are not required to deliver the tangible product’s essential functionality and can be sold separately. Revenue from sales of these software products and related post-contract support will continue to be accounted for under software revenue recognition rules. The Company’s multiple-element arrangements may therefore have a software deliverable that is subject to the
63
INFINERA CORPORATION
NOTES TO CONSOLIDATED FINANCIAL STATEMENTS—(Continued)
existing software revenue recognition guidance. The revenue for these multiple-element arrangements is allocated to the software deliverable and the non-software deliverables based on the relative selling prices of all of the deliverables in the arrangement using the hierarchy in the revenue recognition accounting guidance. Revenue related to these offerings have historically not been material.
Services revenue includes software subscription services, installation and deployment services, spares management, on-site hardware replacement services, network operations management, extended hardware warranty services and training. Revenue from software subscription, spares management, on-site hardware replacement services, network operations management and extended hardware warranty contracts is deferred and is recognized ratably over the contractual support period, which is generally one year. Revenue related to training and installation and deployment services is recognized as the services are completed.
Contracts and customer purchase orders are generally used to determine the existence of an arrangement. In addition, shipping documents and customer acceptances, when applicable, are used to verify delivery and transfer of title. Revenue is recognized only when title and risk of loss pass to customers and when the revenue recognition criteria have been met. In instances where acceptance of the product occurs upon formal written acceptance, revenue is recognized only after such written acceptance has been received. The Company assesses whether the fee is fixed or determinable based on the payment terms associated with the transaction. Payment terms to customers generally range from net 30 to 120 days from invoice, which are considered to be standard payment terms. The Company assesses its ability to collect from its customers based primarily on the creditworthiness and past payment history of the customer.
For sales to resellers, the same revenue recognition criteria apply. It is the Company’s practice to identify an end user prior to shipment to a reseller. The Company does not offer rights of return or price protection to its resellers.
Shipping charges billed to customers are included in product revenue and related shipping costs are included in product cost. The Company reports revenue net of any required taxes collected from customers and remitted to government authorities, with the collected taxes recorded as current liabilities until remitted to the relevant government authority.
Commission Expense
Sales commissions are recorded as sales and marketing expense and accrued compensation and related benefits. The Company generally records commission expense when it bills the customers; thus no contract acquisition costs are capitalized.
Stock-Based Compensation
Stock-based compensation cost is measured at the grant date based on the fair value of the award, and is recognized as expense over the requisite service period (generally the vesting period) under the straight-line amortization method. The expected forfeiture rate was estimated based on the Company's historical forfeiture data and compensation costs were recognized only for those equity awards expected to vest. The estimation of the forfeiture rate required judgment, and to the extent actual forfeitures differed from expectations, changes in estimate were recorded as an adjustment in the period when such estimates were revised. The Company historically recorded stock-based compensation expense by applying the forfeiture rates and adjusted estimated forfeiture rates to actual. During the third fiscal quarter beginning on June 26, 2016, the Company elected to early adopt ASU 2016-09. The Company also elected to change its accounting policy to account for forfeitures when they occur on a modified retrospective basis.
The Company makes a number of estimates and assumptions in determining stock-based compensation related to stock options including the following:
• | The expected term represents the weighted-average period that the stock options are expected to be outstanding prior to being exercised. The expected term is estimated based on the Company’s historical data on employee exercise patterns and post vesting termination behavior to estimate expected exercises over the contractual term of grants. |
64
INFINERA CORPORATION
NOTES TO CONSOLIDATED FINANCIAL STATEMENTS—(Continued)
• | Expected volatility of the Company’s stock has been historically based on the weighted-average implied and historical volatility of Infinera and its peer group. The peer group is comprised of similar companies in the same industrial sector. As the Company gained more historical volatility data, the weighting of its own data in the expected volatility calculation associated with options gradually increased to 100% by 2013. |
The Company estimates the fair value of the rights to acquire stock under its Employee Stock Purchase Plan (“ESPP”) using the Black-Scholes option pricing formula. The Company’s ESPP provides for consecutive six-month offering periods and the Company uses its own historical volatility data in the valuation of ESPP shares.
The Company accounts for the fair value of restricted stock units (“RSUs”) using the closing market price of the Company’s common stock on the date of grant. For new-hire grants, RSUs typically vest ratably on an annual basis over four years. For annual refresh grants, RSUs typically vest ratably on an annual basis over three or four years.
The Company granted performance stock units (“PSUs”) to its executive officers and senior management in 2014, 2015 and 2016 as part of the Company's annual refresh grant process. These PSUs entitle the Company's executive officers and senior management to receive a number of shares of the Company's common stock based on its stock price performance compared to a specified target composite index for the same period. These PSUs vest over the span of one year, two years and three years, and the number of shares to be issued upon vesting ranges from 0 to 2.0 times the number of PSUs granted depending on the relative performance of the Company's common stock price compared to the targeted composite index. This performance metric is classified as a market condition.
The Company uses a Monte Carlo simulation model to determine the fair value of PSUs on the date of grant. The Monte Carlo simulation model is based on a discounted cash flow approach, with the simulation of a large number of possible stock price outcomes for the Company's stock and the target composite index. The use of the Monte Carlo simulation model requires the input of a number of assumptions including expected volatility of the Company's stock price, expected volatility of target composite index, correlation between changes in the Company's stock price and changes in the target composite index, risk-free interest rate, and expected dividends as applicable. Expected volatility of the Company's stock is based on the weighted-average historical volatility of its stock. Expected volatility of target composite index is based on the historical and implied data. Correlation is based on the historical relationship between the Company's stock price and the target composite index average. The risk-free interest rate is based upon the treasury zero-coupon yield appropriate for the term of the PSU as of the grant date. The expected dividend yield is zero for the Company as it does not expect to pay dividends in the future. The expected dividend yield for the target composite index is the annual dividend yield expressed as a percentage of the composite average of the target composite index on the grant date.
In addition, the Company has granted other PSUs to certain employees that only vest upon the achievement of specific operational performance criteria.
Research and Development
All costs to develop the Company’s hardware products are expensed as incurred. Software development costs are capitalized beginning when a product’s technological feasibility has been established and ending when a product is available for general release to customers. Generally, the Company’s software products are released soon after technological feasibility has been established. As a result, costs subsequent to achieving technological feasibility have not been significant and all software development costs have been expensed as incurred.
Advertising
All advertising costs are expensed as incurred. Advertising expenses in 2016, 2015 and 2014 were $1.9 million, $1.8 million and $1.5 million, respectively.
65
INFINERA CORPORATION
NOTES TO CONSOLIDATED FINANCIAL STATEMENTS—(Continued)
Accounting for Income Taxes
As part of the process of preparing the Company’s consolidated financial statements, the Company is required to estimate its taxes in each of the jurisdictions in which it operates. The Company estimates actual current tax expense together with assessing temporary differences resulting from different treatment of items, such as accruals and allowances not currently deductible for tax purposes. These differences result in deferred tax assets and liabilities, which are included in the Company’s consolidated balance sheets. In general, deferred tax assets represent future tax benefits to be received when certain expenses previously recognized in the Company’s consolidated statements of operations become deductible expenses under applicable income tax laws or loss or credit carryforwards are utilized. Accordingly, realization of the Company’s deferred tax assets is dependent on future taxable income within the respective jurisdictions against which these deductions, losses and credits can be utilized within the applicable future periods.
The Company must assess the likelihood that some portion or all of its deferred tax assets will be recovered from future taxable income within the respective jurisdictions, and to the extent the Company believes that recovery does not meet the “more-likely-than-not” standard, the Company must establish a valuation allowance. The ultimate realization of deferred tax assets is dependent upon the generation of future taxable income during the periods in which those temporary differences become deductible. Management judgment is required in determining the Company’s provision for income taxes, the Company’s deferred tax assets and liabilities and any valuation allowance recorded against its net deferred tax assets. In evaluating the need for a full or partial valuation allowance, all positive and negative evidence must be considered, including the Company's forecasts of taxable income over the applicable carryforward periods, its current financial performance, its market environment, and other factors. Based on the available objective evidence, at December 31, 2016, management believes it is more likely than not that the domestic net deferred tax assets will not be realizable in the foreseeable future. Accordingly, the domestic net deferred tax assets were fully reserved with a valuation allowance. To the extent that the Company determines that deferred tax assets are realizable on a more likely than not basis, and adjustment is needed, that adjustment will be recorded in the period that the determination is made and would generally decrease the valuation allowance and record a corresponding benefit to earnings.
Foreign Currency Translation and Transactions
The Company considers the functional currencies of its foreign subsidiaries to be the local currency. Assets and liabilities recorded in foreign currencies are translated at the exchange rate as of the balance sheet date, and costs and expenses are translated at average exchange rates in effect during the period. Equity transactions are translated using historical exchange rates. The effects of foreign currency translation adjustments are recorded as a separate component of Accumulated other comprehensive income (loss) in the accompanying consolidated balance sheets.
For all non-functional currency account balances, the re-measurement of such balances to the functional currency will result in either a foreign exchange transaction gain or loss which is recorded to other gain (loss), net in the same period that the re-measurement occurred. Aggregate foreign exchange transactions recorded in 2016, 2015 and 2014 were a loss of $1.8 million, a gain of $2.4 million and a loss of $1.4 million, respectively.
The Company entered into foreign currency exchange forward contracts to reduce the impact of foreign exchange fluctuations on earnings from accounts receivable balances denominated in euros and British pounds, and restricted cash denominated in euros.
During 2016, the Company also entered into foreign currency exchange contracts to reduce the volatility of cash flows primarily related to forecasted revenues and expenses denominated in euro, British pound and Swedish kronor (“SEK”). The contracts are settled for U.S. dollars and SEK at maturity and at rates agreed to at inception of the contracts. The gains and losses on these foreign currency derivatives are recorded to the condensed consolidated statement of operations line item, in the current period, to which the item that is being economically hedged is recorded.
66
INFINERA CORPORATION
NOTES TO CONSOLIDATED FINANCIAL STATEMENTS—(Continued)
Cash, Cash Equivalents and Short-term and Long-term Investments
The Company considers all highly liquid instruments with an original maturity at the date of purchase of 90 days or less to be cash equivalents. These instruments may include cash, money market funds, commercial paper and U.S. treasuries. The Company maintains its cash in bank deposit accounts which, at times, may exceed federally insured limits. The Company has not experienced any losses in such accounts.
Cash, cash equivalents and short-term investments consist of highly-liquid investments in certificates of deposits, money market funds, commercial paper, U.S. agency notes, corporate bonds and U.S. treasuries. Long-term investments primarily consist of certificates of deposits, U.S. agency notes and corporate bonds. The Company considers all debt instruments with original maturities at the date of purchase greater than 90 days and remaining time to maturity of one year or less to be short-term investments. The Company classifies debt instruments with remaining maturities greater than one year as long-term investments, unless the Company intends to settle its holdings within one year or less and in such case it is considered to be short-term investments. The Company determines the appropriate classification of its marketable securities at the time of purchase and re-evaluates such designations as of each balance sheet date.
Available-for-sale investments are stated at fair market value with unrealized gains and losses recorded in Accumulated other comprehensive income (loss) in the Company’s consolidated balance sheets. The Company evaluates its available-for-sale marketable debt securities for other-than-temporary impairments and records any credit loss portion in Other income (expense), net, in the Company’s consolidated statements of operations. The amortized cost of debt securities is adjusted for amortization of premiums and accretion of discounts to maturity and for any credit losses incurred on these securities. Gains and losses are recognized when realized in the Company’s consolidated statements of operations under the specific identification method. Because the Company does not intend to sell its debt securities and it is not more likely than not that it will be required to sell the investment before recovery of their amortized cost basis, which may be maturity.
Fair Value Measurement of Investments
Pursuant to the accounting guidance for fair value measurements and its subsequent updates, fair value is defined as the price that would be received from selling an asset or paid to transfer a liability in an orderly transaction between market participants at the measurement date. When determining the fair value measurements for assets and liabilities required or permitted to be recorded at fair value, the Company considers the principal or most advantageous market in which it would transact and it considers assumptions that market participants would use when pricing the asset or liability.
Valuation techniques used by the Company are based upon observable and unobservable inputs. Observable or market inputs reflect market data obtained from independent sources, while unobservable inputs reflect the Company’s assumptions about market participant assumptions based on the best information available. Observable inputs are the preferred source of values. These two types of inputs create the following fair value hierarchy:
Level 1 | – | Quoted prices in active markets for identical assets or liabilities. | ||
Level 2 | – | Quoted prices for similar instruments in active markets, quoted prices for identical or similar instruments in markets that are not active, and model-based valuation techniques for which all significant assumptions are observable in the market or can be corroborated by observable market data for substantially the full term of the assets or liabilities. | ||
Level 3 | – | Prices or valuations that require management inputs that are both significant to the fair value measurement and unobservable. | ||
The Company measures its cash equivalents, foreign currency exchange forward contracts and debt securities at fair value and classifies its securities in accordance with the fair value hierarchy. The Company’s money market funds and U.S. treasuries are classified within Level 1 of the fair value hierarchy and are valued based on quoted prices in active markets for identical securities.
The Company classifies the following assets within Level 2 of the fair value hierarchy as follows:
67
INFINERA CORPORATION
NOTES TO CONSOLIDATED FINANCIAL STATEMENTS—(Continued)
Certificates of Deposit
The Company reviews market pricing and other observable market inputs for the same or similar securities obtained from a number of industry standard data providers. In the event that a transaction is observed for the same or similar security in the marketplace, the price on that transaction reflects the market price and fair value on that day. In the absence of any observable market transactions for a particular security, the fair market value at period end would be equal to the par value. These inputs represent quoted prices for similar assets or these inputs have been derived from observable market data.
Commercial Paper
The Company reviews market pricing and other observable market inputs for the same or similar securities obtained from a number of industry standard data providers. In the event that a transaction is observed for the same or similar security in the marketplace, the price on that transaction reflects the market price and fair value on that day and then follows a revised accretion schedule to determine the fair market value at period end. In the absence of any observable market transactions for a particular security, the fair market value at period end is derived by accreting from the last observable market price. These inputs represent quoted prices for similar assets or these inputs have been derived from observable market data accreted mathematically to par.
U.S. Agency Notes
The Company reviews trading activity and pricing for its U.S. agency notes as of the measurement date. When sufficient quoted pricing for identical securities is not available, the Company uses market pricing and other observable market inputs for similar securities obtained from a number of industry standard data providers. These inputs represent quoted prices for similar assets in active markets or these inputs have been derived from observable market data.
Corporate Bonds
The Company reviews trading activity and pricing for each of the corporate bond securities in its portfolio as of the measurement date and determines if pricing data of sufficient frequency and volume in an active market exists in order to support Level 1 classification of these securities. If sufficient quoted pricing for identical securities is not available, the Company obtains market pricing and other observable market inputs for similar securities from a number of industry standard data providers. In instances where multiple prices exist for similar securities, these prices are used as inputs into a distribution-curve to determine the fair market value at period end.
Foreign Currency Exchange Forward Contracts
As discussed in Note 5, "Derivative Instruments," to the Notes to Condensed Consolidated Financial Statements, the Company mainly holds non-speculative foreign exchange forward contracts to hedge certain foreign currency exchange exposures. The Company estimates the fair values of derivatives based on quoted market prices or pricing models using current market rates. Where applicable, these models project future cash flows and discount the future amounts to a present value using market-based observable inputs including interest rate curves, credit risk, foreign exchange rates, and forward and spot prices for currencies.
As of December 31, 2016, none of the Company’s existing securities were classified as Level 3 securities.
68
INFINERA CORPORATION
NOTES TO CONSOLIDATED FINANCIAL STATEMENTS—(Continued)
Accounts Receivable and Allowances for Doubtful Accounts
Accounts receivable are recorded at the invoiced amount and do not bear interest. The Company reviews its aging by category to identify significant customers or invoices with known dispute or collectability issues. The Company makes judgments as to its ability to collect outstanding receivables based on various factors including ongoing customer credit evaluations and historical collection experience. The Company provides an allowance for receivable amounts that are potentially uncollectible.
Allowances for Sales Returns
Customer product returns are approved on a case by case basis. Specific reserve provisions are made based upon a specific review of all the approved product returns where the customer has yet to return the products to generate the related sales return credit at the end of a period. Estimated sales returns are provided for as a reduction to revenue. At December 31, 2016, December 26, 2015 and December 27, 2014, revenue was reduced for estimated sales returns by $0.6 million, $0.6 million and $0.2 million, respectively.
Concentration of Risk
Financial instruments that are potentially subject to concentrations of credit risk consist primarily of cash equivalents, short-term investments, long-term investments and accounts receivable. Investment policies have been implemented that limit investments to investment-grade securities.
The risk with respect to accounts receivable is mitigated by ongoing credit evaluations that the Company performs on its customers. As the Company continues to expand its sales internationally, it may experience increased levels of customer credit risk associated with those regions. Collateral is generally not required for accounts receivable but may be used in the future to mitigate credit risk associated with customers located in certain geographical regions.
As of December 31, 2016, two customers accounted for approximately 17% and 15% of the Company's net accounts receivable balance, respectively. As of December 26, 2015, one customer accounted for approximately 17% of the Company’s net accounts receivable balance.
To date, a few of the Company’s customers have accounted for a significant portion of its revenue. One customer accounted for over 10% of the Company’s revenue in 2016. Revenue from this customer accounted for 16% of the Company's revenue in 2016. Two customers each accounted for over 10% of the Company's revenue in 2015. These two customers accounted for 17% and 13%, respectively, of the Company's revenue in 2015. One customer accounted for over 10% of the Company's revenue in 2014. Revenue from this customer accounted for 19% of the Company's revenue in 2014.
The Company depends on a sole source or limited source suppliers for several key components and raw materials. The Company generally purchases these sole source or limited source components and raw materials through standard purchase orders and does not have long-term contracts with many of these limited-source suppliers. While the Company seeks to maintain sufficient reserve stock of such components and raw materials, the Company’s business and results of operations could be adversely affected if any of our sole source or limited source suppliers suffer from capacity constraints, lower than expected yields, deployment delays, work stoppages or any other reduction or disruption in output.
Derivative Instruments
The Company is exposed to foreign currency exchange rate fluctuations in the normal course of its business. As part of its risk management strategy, the Company uses derivative instruments, specifically forward contracts, to reduce the impact of foreign exchange fluctuations on earnings. The forward contracts are with high-quality institutions and the Company monitors the creditworthiness of the counter parties consistently. The Company’s objective is to offset gains and losses resulting from these exposures with gains and losses on the derivative contracts used to hedge them, thereby reducing volatility of earnings or protecting fair values of assets. None of the Company’s derivative instruments contain credit-risk related contingent features, any rights to reclaim cash collateral or any obligation to return cash collateral. The Company does not have any leveraged derivatives. The Company does not use derivative contracts for trading or speculative purposes.
69
INFINERA CORPORATION
NOTES TO CONSOLIDATED FINANCIAL STATEMENTS—(Continued)
The Company enters into foreign currency exchange forward contracts to manage its exposure to fluctuations in foreign exchange rates that arise primarily from its euro and British pound denominated receivables and euro denominated restricted cash balance amounts that are pledged as collateral for certain stand-by letters of credit. Gains and losses on these contracts are intended to offset the impact of foreign exchange rate changes on the underlying foreign currency denominated accounts receivables and restricted cash, and therefore, do not subject the Company to material balance sheet risk. The Company also entered into foreign currency exchange contracts to reduce the volatility of cash flows primarily related to forecasted revenues and expenses denominated in euros, British pound and SEK. These contracts are settled for U.S. dollars and SEK at maturity and at rates agreed to at inception of the contracts. The forward contracts are with one high-quality institution and the Company consistently monitors the creditworthiness of the counterparty. The forward contracts entered into during 2016 were denominated in euros, British pounds and SEK, and the contracts are settled for reporting currencies at maturity at rates agreed to at inception of the contracts.
Inventory Valuation
Inventories consist of raw materials, work-in-process and finished goods and are stated at standard cost adjusted to approximate the lower of actual cost or market. Costs are recognized utilizing the first-in, first-out method. Market value is based upon an estimated selling price reduced by the estimated cost of disposal. The determination of market value involves numerous judgments including estimated average selling prices based upon recent sales volumes, industry trends, existing customer orders, current contract price, future demand and pricing and technological obsolescence of the Company’s products.
Inventory that is obsolete or in excess of the Company’s forecasted demand or is anticipated to be sold at a loss is written down to its estimated net realizable value based on historical usage and expected demand. In valuing its inventory costs and deferred inventory costs, the Company considered whether the utility of the products delivered or expected to be delivered at less than cost, primarily comprised of common equipment, had declined. The Company concluded that, in the instances where the utility of the products delivered or expected to be delivered was less than cost, it was appropriate to value the inventory costs and deferred inventory costs at cost or market, whichever is lower, thereby recognizing the cost of the reduction in utility in the period in which the reduction occurred or can be reasonably estimated. The Company has, therefore, recognized inventory write-downs as necessary in each period in order to reflect inventory at the lower of actual cost or market.
The Company considers whether it should accrue losses on firm purchase commitments related to inventory items. Given that the net realizable value of common equipment is below contractual purchase price, the Company has also recorded losses on these firm purchase commitments in the period in which the commitment is made. When the inventory parts related to these firm purchase commitments are received, that inventory is recorded at the purchase price less the accrual for the loss on the purchase commitment.
Property, Plant and Equipment
Property, plant and equipment are stated at cost. This includes enterprise-level business software that the Company customizes to meets its specific operational needs. Depreciation is calculated using the straight-line method over the estimated useful lives of the respective assets. Leasehold improvements are amortized using the straight-line method over the shorter of the lease term or estimated useful life of the asset. An assumption of lease renewal where a renewal option exists is used only when the renewal has been determined to be reasonably assured. Repair and maintenance costs are expensed as incurred. The estimated useful life for each asset category is as follows:
Estimated Useful Lives | |
Laboratory and manufacturing equipment | 1.5 to 10 years |
Furniture and fixtures | 3 to 5 years |
Computer hardware and software | 1.5 to 7 years |
Leasehold improvements | 1 to 12 years |
The Company regularly reviews long-lived assets for impairment whenever events or changes in circumstances indicate that the carrying amount of these assets may not be recoverable or that the useful life is
70
INFINERA CORPORATION
NOTES TO CONSOLIDATED FINANCIAL STATEMENTS—(Continued)
shorter than originally estimated. If impairment indicators are present and the projected future undiscounted cash flows are less than the carrying value of the assets, the carrying values are reduced to the estimated fair value. If assets are determined to be recoverable, but the useful lives are shorter than originally estimated, the carrying value of the assets is depreciated over the newly determined remaining useful lives.
Accrued Warranty
The Company warrants that its products will operate substantially in conformity with product specifications. Hardware warranties provide the purchaser with protection in the event that the product does not perform to product specifications. During the warranty period, the purchaser’s sole and exclusive remedy in the event of such defect or failure to perform is limited to the correction of the defect or failure by repair, refurbishment or replacement, at the Company’s sole option and expense. The Company's hardware warranty periods generally range from one to five years from date of acceptance for hardware and the Company's software warranty is 90 days. Upon delivery of the Company's products, the Company provides for the estimated cost to repair or replace products that may be returned under warranty. The hardware warranty accrual is based on actual historical returns and cost of repair experience and the application of those historical rates to the Company's in-warranty installed base. The provision for warranty claims fluctuates depending upon the installed base of products and the failure rates and costs of repair associated with these products under warranty. Furthermore, the Company's costs of repair vary based on repair volume and its ability to repair, rather than replace, defective units. In the event that actual product failure rates and costs to repair differ from the Company's estimates, revisions to the warranty provision are required. In addition, from time to time, specific hardware warranty accruals may be made if unforeseen technical problems arise with specific products. The Company regularly assesses the adequacy of its recorded warranty liabilities and adjusts the amounts as necessary.
Business Combinations
Accounting for acquisitions requires our management to estimate the fair value of the assets and liabilities acquired, which involves a number of judgments, assumptions and estimates that could materially affect the timing or amounts recognized in the Company's financial statements. The items involving the most significant assumptions, estimates and judgments include determining the fair value of the following:
• | Intangible assets, including valuation methodology, estimations of future cash flows and discount rates, as well as the estimated useful life of the intangible assets; |
• | the acquired company’s brand, as well as assumptions about the period of time the acquired brand will continue to be used; |
• | deferred tax assets and liabilities, uncertain tax positions and tax-related valuation allowances, which are initially estimated as of the acquisition date; |
While the Company uses its best estimates and assumptions to accurately value assets acquired and liabilities assumed at the acquisition date, the estimates are inherently uncertain and subject to refinement. As a result, during the measurement period, which may be up to one year following the acquisition date, the Company records adjustments to the assets acquired and liabilities assumed with the corresponding offset to goodwill.
Amortization of Intangible Assets
Intangible assets with finite lives are carried at cost, less accumulated amortization. Amortization is computed over the estimated useful lives of the respective assets. In-process research and development represents the fair value of incomplete research and development projects that have not reached technological feasibility as of the date of acquisition. Initially, these assets are not subject to amortization. Once projects have been completed they are transferred to developed technology, which are subject to amortization, while assets related to projects that have been abandoned are impaired and expensed to research and development.
Impairment of Intangible Assets and Goodwill
Goodwill is evaluated for impairment on an annual basis in the fourth quarter of the Company's fiscal year, and whenever events or changes in circumstances indicate the carrying amount of goodwill may not be recoverable. The Company has elected to first assess qualitative factors to determine whether it is more likely
71
INFINERA CORPORATION
NOTES TO CONSOLIDATED FINANCIAL STATEMENTS—(Continued)
than not that the fair value of its single reporting unit is less than its carrying amount. If the Company determines that it is more likely than not that the fair value of its single reporting unit is less than its carrying amount, then the two-step goodwill impairment test will be performed. The first step, identifying a potential impairment, compares the fair value of its single reporting unit with its carrying amount. If the carrying amount exceeds its fair value, the second step will be performed; otherwise, no further step is required. The second step, measuring the impairment loss, compares the implied fair value of the goodwill with the carrying amount of the goodwill. Any excess of the goodwill carrying amount over the implied fair value is recognized as an impairment loss. The Company evaluates events and changes in circumstances that could indicate carrying amounts of purchased intangible assets may not be recoverable. When such events or changes in circumstances occur, the Company assesses the recoverability of these assets by determining whether or not the carrying amount will be recovered through undiscounted expected future cash flows. If the total of the future undiscounted cash flows is less than the carrying amount of an asset, the Company records an impairment loss for the amount by which the carrying amount of the asset exceeds the fair value of the asset.
Recent Accounting Pronouncements
In January 2017, the Financial Accounting Standards Board (the “FASB”) issued ASU No. 2017-04, “Simplifying the Test for Goodwill Impairment ” (“ASU 2017-04”). The guidance eliminates Step 2 of the goodwill impairment test, which requires a hypothetical purchase price allocation. A goodwill impairment will now be the amount by which a reporting unit’s carrying value exceeds its fair value, not to exceed the carrying amount of goodwill. The same one-step impairment test will be applied to goodwill at all reporting units, even those with zero or negative carrying amounts. Entities will be required to disclose the amount of goodwill at reporting units with zero or negative carrying amounts. ASU 2017-04 is effective for the Company's annual or any interim goodwill impairment tests in fiscal years beginning after the fourth quarter of 2019. Early adoption is permitted for interim or annual goodwill impairment tests performed on testing dates after January 1, 2017. The Company is currently evaluating the impact the adoption of ASU 2017-04 will have on its consolidated financial statements.
In November 2016, the FASB issued ASU No. 2016-18, “Statement of Cash Flows (Topic 230): Restricted Cash” (“ASU 2016-18”), which requires that a statement of cash flows explain the change during the period in the total of cash, cash equivalents, and amounts generally described as restricted cash or restricted cash equivalents. As such, restricted cash and restricted cash equivalents should be included with cash and cash equivalents when reconciling the beginning-of-period and ending-of-period total amounts shown on the statement of cash flows. The Company is required to adopt ASU 2016-18 for fiscal years, and for interim periods within those fiscal years, beginning after the fourth quarter of 2017 on a retrospective basis. Early adoption is permitted, including adoption in an interim period. Subsequent to the adoption of ASU 2016-18 the change in restricted cash would be excluded from the change in cash flows from financing activities and included in the change in total cash, restricted cash and cash equivalents as reported in the statement of cash flows. The Company is currently evaluating the impact the adoption of ASU 2016-18 will have on its consolidated financial statements.
In August 2016, the FASB issued Accounting Standards Update 2016-15, “Statement of Cash Flows (Topic 320): Classification of Certain Cash Receipts and Cash Payments” (“ASU 2016-15”), which addresses eight specific cash flow issues with the objective of reducing the existing diversity in practice in how certain transactions are presented and classified in the statement of cash flows. This guidance is effective for the Company in its first quarter of fiscal 2018 and will be applied on a retrospective basis. Early adoption is permitted. The Company is currently evaluating the impact the adoption of ASU 2016-15 will have on its consolidated financial statements.
In June 2016, the FASB issued Accounting Standards Update 2016-13, “Financial Instruments - Credit Losses (Topic 326): Measurement of Credit Losses on Financial Instruments” (“ASU 2016-13”), which requires measurement and recognition of expected credit losses for financial assets held. This guidance is effective for the Company in its first quarter of fiscal 2020 and early adoption is permitted. The Company is currently evaluating the impact the adoption of ASU 2016-13 will have on its consolidated financial statements.
In May 2016, the FASB issued Accounting Standards Update 2016-11, “Revenue Recognition (Topic 605) and Derivatives and Hedging (Topic 815): Rescission of SEC Guidance Because of Accounting Standards Updates 2014-09 and 2014-16 Pursuant to Staff Announcements at the March 3, 2016 EITF Meeting (SEC
72
INFINERA CORPORATION
NOTES TO CONSOLIDATED FINANCIAL STATEMENTS—(Continued)
Update)” (“ASU 2016-11”), which rescinds various standards codified as part of Topic 605, Revenue Recognition in relation to the future adoption of Topic 606. These rescissions include changes to topics pertaining to revenue and expense recognition for freight services in process, accounting for shipping and handling fees and costs, and accounting for consideration given by a vendor to a customer. This guidance is effective for the Company in its first quarter of fiscal 2018 and early adoption is permitted. The Company is currently evaluating the impact the adoption of ASU 2016-11 will have on its consolidated financial statements.
In March 2016, the FASB issued Accounting Standards Update 2016-09, “Improvements to Employee Share-Based Payment Accounting” (“ASU 2016-09”), which includes provisions intended to simplify various aspects related to how share-based payments are accounted for and presented in the financial statements, including the income tax effects of share-based payments and accounting for forfeitures. ASU 2016-09 requires companies to record excess tax benefits and tax deficiencies as income tax benefit or expense in the statement of operations when the awards vest or are settled, eliminates the requirement to reclassify cash flows related to excess tax benefits from operating activities to financing activities on the statement of cash flows, and allows for an accounting policy election to either estimate the number of forfeitures (current U.S. GAAP) or account for forfeitures when they occur, amongst other provisions.
The Company elected to early adopt ASU 2016-09 as of its third fiscal quarter that began on June 26, 2016. The Company also elected to change its accounting policy to account for forfeitures when they occur on a modified retrospective basis. The adoption of ASU 2016-09 and the change in the Company’s accounting policy resulted in a $0.2 million increase to additional paid-in capital and accumulated deficit as of December 27, 2015. The Company also recorded $0.3 million of stock-based compensation expense during 2016 to true-up for the differential between the amount of stock-based compensation cost previously recorded for the first six months ended June 25, 2016 and the amount that would have been recorded without assuming forfeitures. Additionally, the Company adopted the change in presentation in the condensed consolidated statement of cash flows related to excess tax benefits on a prospective basis. Accordingly, prior periods have not been adjusted. There was no impact for the change in presentation in the condensed consolidated statement of cash flows related to statutory tax withholding requirements as the Company has historically classified the statutory tax withholding as a financing activity in its consolidated statement of cash flows.
In February 2016, the FASB issued Accounting Standards Update 2016-02, “Leases (Topic 842)” (“ASU 2016-02”), which amends the existing accounting standards for leases. The new standard requires lessees to record a right-of-use asset and a corresponding lease liability on the balance sheet (with the exception of short-term leases). For lessees, leases will continue to be classified as either operating or financing in the income statement. This guidance is effective for the Company in its first quarter of fiscal 2019 and early adoption is permitted. ASU 2016-02 is required to be applied with a modified retrospective approach and requires application of the new standard at the beginning of the earliest comparative period presented. The Company is currently evaluating the impact the adoption of ASU 2016-02 will have on its consolidated financial statements.
In September 2015, the FASB issued Accounting Standards Update 2015-16, “Business Combinations and Simplifying the Accounting for Measurement-Period Adjustments” (“ASU 2015-16”), which eliminates the requirement for an acquirer in a business combination to account for measurement-period adjustments retrospectively. Instead, an acquirer will recognize a measurement-period adjustment during the period in which it determines the amount of the adjustment. The Company adopted ASU 2015-16 during the first quarter of fiscal 2016. The Company's adoption of ASU 2015-16 had no impact on the Company's financial position, results of operations or cash flow.
In July 2015, the FASB issued Accounting Standards Update 2015-11, “Simplifying the Measurement of Inventory” (“ASU 2015-11”), to simplify the guidance on the subsequent measurement of inventory, excluding inventory measured using last-in, first-out or the retail inventory method. Under ASU 2015-11, inventory should be at the lower of cost and net realizable value. This guidance is effective for the Company in its first quarter of fiscal 2017. The Company is currently evaluating the impact the adoption of ASU 2015-11 will have on its consolidated financial statements.
In April 2015, the FASB issued Accounting Standards Update 2015-03, “Simplifying the Presentation of Debt Issuance Costs” (“ASU 2015-03”), which changes the presentation of debt issuance costs in financial statements. ASU 2015-03 requires an entity to present such costs in the balance sheet as a direct deduction
73
INFINERA CORPORATION
NOTES TO CONSOLIDATED FINANCIAL STATEMENTS—(Continued)
from the related debt liability rather than as an asset. Amortization of the costs will continue to be reported as interest expense. The Company adopted ASU 2015-03 during the first quarter of fiscal 2016. The December 26, 2015 balance sheet was retrospectively adjusted to reclassify $2.1 million from other non-current assets to a reduction of the Notes payable liability.
In May 2014, the FASB issued Accounting Standards Update 2014-09, “Revenue from Contracts from Customers (Topic 606)” (“ASU 2014-09”), which creates a single, joint revenue standard that is consistent across all industries and markets for companies that prepare their financial statements in accordance with GAAP. Under ASU 2014-09, an entity is required to recognize revenue upon the transfer of promised goods or services to customers in an amount that reflects the consideration the entity expects to be entitled to receive in exchange for those goods or services. In July 2015, the FASB decided to delay the effective date of the new revenue standard by one year. In April 2016, the FASB issued Accounting Standards Update 2016-10, “Revenue from Contracts with Customers (Topic 606): Identifying Performance Obligations and Licensing,” which clarifies the implementation guidance on identifying performance obligations and licensing. In May 2016, the FASB issued Accounting Standards Update 2016-12, “Revenue from Contracts with Customers (Topic 606): Narrow-Scope Improvements and Practical Expedients,” which amends the guidance on collectability, noncash consideration, presentation of sales tax and transition. In December 2016, the FASB issued Accounting Standards Update 2016-20, “Technical Corrections and Improvements to Topic 606, Revenue from Contracts with Customers,” to increase stakeholders' awareness of the proposals and to expedite improvements to ASU 2014-09. These standards will be effective for the Company's first quarter of 2018. The Company has not yet selected a transition method and it is currently evaluating the effect that the updated standard will have on its consolidated financial statements and related disclosures.
The Company is still in the process of completing its analysis and assessing all potential impacts of the new standard. In terms of the Company’s evaluation efforts, it has assigned internal resources and engaged a third party service provider to assist in the evaluation assessment phase and documentation of new policies and processes. Furthermore, the Company has made and will continue to make investments in systems and processes to enable timely and accurate reporting under the new standard. The Company currently expects that necessary operational changes will be implemented prior to the adoption date.
3. Fair Value Measurements
The following tables represent the Company’s fair value hierarchy for its marketable securities measured at fair value on a recurring basis (in thousands):
As of December 31, 2016 | As of December 26, 2015 | ||||||||||||||||||||||
Fair Value Measured Using | Fair Value Measured Using | ||||||||||||||||||||||
Level 1 | Level 2 | Total | Level 1 | Level 2 | Total | ||||||||||||||||||
Assets | |||||||||||||||||||||||
Money market funds | $ | 41,773 | $ | — | $ | 41,773 | $ | 37,829 | $ | — | $ | 37,829 | |||||||||||
Certificates of deposit | — | 1,881 | 1,881 | — | 5,001 | 5,001 | |||||||||||||||||
Commercial paper | — | 39,310 | 39,310 | — | 10,997 | 10,997 | |||||||||||||||||
Corporate bonds | — | 88,324 | 88,324 | — | 163,400 | 163,400 | |||||||||||||||||
U.S. agency notes | — | 11,759 | 11,759 | — | 10,717 | 10,717 | |||||||||||||||||
U.S. treasuries | 52,092 | — | 52,092 | 24,853 | — | 24,853 | |||||||||||||||||
Foreign currency exchange forward contracts | $ | — | $ | 187 | $ | 187 | $ | — | $ | 490 | $ | 490 | |||||||||||
Total assets | $ | 93,865 | $ | 141,461 | $ | 235,326 | $ | 62,682 | $ | 190,605 | $ | 253,287 | |||||||||||
Liabilities | |||||||||||||||||||||||
Foreign currency exchange forward contracts | $ | — | $ | (71 | ) | $ | (71 | ) | $ | — | $ | (44 | ) | $ | (44 | ) | |||||||
74
INFINERA CORPORATION
NOTES TO CONSOLIDATED FINANCIAL STATEMENTS—(Continued)
During 2016 and 2015, there were no transfers of assets or liabilities between Level 1 and Level 2. As of December 31, 2016 and December 26, 2015, none of the Company’s existing securities were classified as Level 3 securities.
Cash, cash equivalents and investments were as follows (in thousands):
December 31, 2016 | |||||||||||||||
Adjusted Amortized Cost | Gross Unrealized Gains | Gross Unrealized Losses | Fair Value | ||||||||||||
Cash | $ | 109,978 | $ | — | $ | — | $ | 109,978 | |||||||
Money market funds | 41,773 | — | — | 41,773 | |||||||||||
Commercial paper | 8,892 | — | (1 | ) | 8,891 | ||||||||||
U.S. agency notes | 1,999 | — | — | 1,999 | |||||||||||
Total cash and cash equivalents | $ | 162,642 | $ | — | $ | (1 | ) | $ | 162,641 | ||||||
Certificates of deposit | 1,881 | — | — | 1,881 | |||||||||||
Commercial paper | 30,425 | — | (6 | ) | 30,419 | ||||||||||
Corporate bonds | 63,097 | 1 | (59 | ) | 63,039 | ||||||||||
U.S. agency notes | 7,285 | — | (8 | ) | 7,277 | ||||||||||
U.S. treasuries | 39,093 | 9 | (21 | ) | 39,081 | ||||||||||
Total short-term investments | $ | 141,781 | $ | 10 | $ | (94 | ) | $ | 141,697 | ||||||
Corporate bonds | 25,374 | — | (89 | ) | 25,285 | ||||||||||
U.S. agency notes | 2,499 | — | (16 | ) | 2,483 | ||||||||||
U.S. treasuries | 13,032 | 2 | (23 | ) | 13,011 | ||||||||||
Total long-term investments | $ | 40,905 | $ | 2 | $ | (128 | ) | $ | 40,779 | ||||||
Total cash, cash equivalents and investments | $ | 345,328 | $ | 12 | $ | (223 | ) | $ | 345,117 | ||||||
75
INFINERA CORPORATION
NOTES TO CONSOLIDATED FINANCIAL STATEMENTS—(Continued)
December 26, 2015 | |||||||||||||||
Adjusted Amortized Cost | Gross Unrealized Gains | Gross Unrealized Losses | Fair Value | ||||||||||||
Cash | $ | 98,372 | $ | — | $ | — | $ | 98,372 | |||||||
Money market funds | 37,829 | — | — | 37,829 | |||||||||||
Commercial paper | 6,000 | — | — | 6,000 | |||||||||||
U.S. treasuries | 6,900 | — | — | 6,900 | |||||||||||
Total cash and cash equivalents | $ | 149,101 | $ | — | $ | — | $ | 149,101 | |||||||
Certificates of deposit | 3,120 | — | — | 3,120 | |||||||||||
Commercial paper | 4,997 | — | — | 4,997 | |||||||||||
Corporate bonds | 111,608 | — | (148 | ) | 111,460 | ||||||||||
U.S. agency notes | 2 | — | — | 2 | |||||||||||
U.S. treasuries | 5,986 | — | (4 | ) | 5,982 | ||||||||||
Total short-term investments | $ | 125,713 | $ | — | $ | (152 | ) | $ | 125,561 | ||||||
Certificates of deposit | 1,880 | 1 | — | 1,881 | |||||||||||
Corporate bonds | 52,189 | — | (249 | ) | 51,940 | ||||||||||
U.S. agency notes | 10,784 | — | (69 | ) | 10,715 | ||||||||||
U.S. treasuries | 12,010 | — | (39 | ) | 11,971 | ||||||||||
Total long-term investments | $ | 76,863 | $ | 1 | $ | (357 | ) | $ | 76,507 | ||||||
Total cash, cash equivalents and investments | $ | 351,677 | $ | 1 | $ | (509 | ) | $ | 351,169 | ||||||
As of December 31, 2016, the Company’s available-for-sale investments have a contractual maturity term of up to 24 months. Gross realized gains and losses on short-term and long-term investments were insignificant for all periods. The specific identification method is used to account for gains and losses on available-for-sale investments.
As of December 31, 2016, the Company had $304.3 million of cash, cash equivalents and short-term investments, including $43.2 million of cash and cash equivalents held by its foreign subsidiaries. The Company's cash in foreign locations is used for operational and investing activities in those locations, and the Company does not currently have the need or the intent to repatriate those funds to the United States.
4. | Cost-method Investments |
In 2016, the Company invested $7.0 million in a privately-held company. In addition to the $7.0 million investment, the transaction included a customer supply agreement and warrants to purchase up to $10.0 million of additional shares of preferred stock. The warrants vest and become exercisable upon certain conditions being met.
Additionally, in 2016, the Company recognized a gain of $9.0 million from the sale of an existing cost-method investment. As of December 31, 2016 and December 26, 2015, the Company's cost-method investments balance was $7.0 million and $14.5 million, respectively. These investments are accounted for as cost-basis investments as the Company owns less than 20% of the voting securities and does not have the ability to exercise significant influence over operating and financial policies of either entity. The Company's investments are carried at historical cost in its consolidated financial statements. The Company regularly evaluates the carrying value of its cost-method investments for impairment. If the Company believes that the carrying value of the cost basis investments are in excess of estimated fair value, the Company’s policy is to record an impairment charge in other income (expense), net, in the accompanying condensed consolidated statements of operations to adjust the carrying value to estimated fair value, when the impairment is deemed other-than-temporary. As of December 31, 2016 and December 26, 2015, no event had occurred that would adversely affect the carrying value of these investments. The Company did not record any impairment charges during 2016, 2015 and 2014.
76
INFINERA CORPORATION
NOTES TO CONSOLIDATED FINANCIAL STATEMENTS—(Continued)
5. Derivative Instruments
Foreign Currency Exchange Forward Contracts
The Company transacts business in various foreign currencies and has international sales, cost of sales, and expenses denominated in foreign currencies, and carries foreign-currency-denominated monetary assets and liabilities, subjecting the Company to foreign currency risk. The Company’s primary foreign currency risk management objective is to protect the U.S. dollar value of future cash flows and minimize the volatility of reported earnings. The Company utilizes foreign currency forward contracts, primarily short term in nature.
Historically, the Company enters into foreign currency exchange forward contracts to manage its exposure to fluctuation in foreign exchange rates that arise from its euro and British pound denominated receivables and restricted cash balances. Gains and losses on these contracts are intended to offset the impact of foreign exchange rate fluctuations on the underlying foreign currency denominated accounts receivables and restricted cash, and therefore, do not subject the Company to material balance sheet risk.
During 2016, the Company also entered into foreign currency exchange contracts to reduce the volatility of cash flows primarily related to forecasted revenues and expenses denominated in euros, British pound and SEK. The contracts are settled for U.S. dollars and SEK at maturity and at rates agreed to at inception of the contracts. The gains and losses on these foreign currency derivatives are recorded to the consolidated statement of operations line item, in the current period, to which the item that is being economically hedged is recorded.
In April 2015, the Company entered into a foreign currency exchange forward contract with a notional amount of SEK 831 million ($95.3 million) to hedge currency exposures associated with the cash consideration of the offer to acquire Transmode. In July 2015, the Company entered into a series of additional foreign currency exchange option contracts to purchase up to an additional SEK 1.3 billion ($153.8 million) and to sell up to SEK 650 million ($76.9 million), which achieves the economic equivalent of a “participating forward” in order to hedge the anticipated foreign currency cash outflows associated with the additional cash consideration related to the enhanced offer to acquire the shares of Transmode. As these contracts are not formally designated as hedges, the gains and losses were recognized in the statement of operations. For 2015, the Company recorded a realized gain of $1.6 million, which was included in Other gain (loss), net, in the accompanying condensed consolidated statements of operations.
The before-tax effect of foreign currency exchange forward contracts was a loss of $0.9 million for 2016, a gain of $3.8 million for 2015 and a gain of $1.6 million in 2014, included in Other gain (loss), net, in the consolidated statements of operations. In each of these periods, the impact of the gross gains and losses were offset by foreign exchange rate fluctuations on the underlying foreign currency denominated amounts.
As of December 31, 2016, the Company did not designate foreign currency exchange forward contracts as hedges for accounting purposes and accordingly, changes in the fair value are recorded in the accompanying consolidated statements of operations. These contracts were with two high-quality institutions and the Company consistently monitors the creditworthiness of the counterparties.
77
INFINERA CORPORATION
NOTES TO CONSOLIDATED FINANCIAL STATEMENTS—(Continued)
The fair value of derivative instruments not designated as hedging instruments in the Company’s consolidated balance sheets was as follows (in thousands):
As of December 31, 2016 | As of December 26, 2015 | ||||||||||||||||||||||
Gross Notional(1) | Prepaid Expenses and Other Assets | Other Accrued Liabilities | Gross Notional(1) | Prepaid Expenses and Other Assets | Other Accrued Liabilities | ||||||||||||||||||
Foreign currency exchange forward contracts | |||||||||||||||||||||||
Related to euro denominated receivables | $ | 23,887 | $ | 137 | $ | (71 | ) | $ | 46,753 | $ | 319 | $ | (44 | ) | |||||||||
Related to British pound denominated receivables | $ | 6,353 | $ | 48 | $ | — | $ | 6,686 | $ | 171 | $ | — | |||||||||||
Related to euro denominated restricted cash | $ | 242 | $ | 2 | $ | — | $ | 252 | $ | — | $ | — | |||||||||||
Total | $ | 187 | $ | (71 | ) | $ | 490 | $ | (44 | ) | |||||||||||||
(1) | Represents the face amounts of forward contracts that were outstanding as of the period noted. |
6.Business Combination
On the Acquisition Date, the Company completed its public offer to the shareholders of Transmode, acquiring 95.8% of the outstanding common shares and voting interest in Transmode. Transmode is a metro packet-optical networking company based in Stockholm, Sweden. The combination of the two companies brings together a complementary set of customers, products, and technologies into one company.
Shortly after the Acquisition Date, the Company initiated compulsory acquisition proceedings in accordance with Swedish law (the “Squeeze-out Proceedings”) in order to acquire the remaining 4.2% or 1.2 million Transmode shares, not tendered through the end of the offer period. As of the Acquisition Date, the fair value of the noncontrolling interest was approximately $15.4 million, which was based on the implied enterprise value of Transmode at the Acquisition Date. In August 2016, the Company received advance title and paid an undisputed purchase price of $16.8 million to acquire the remaining 4.2% of Transmode shares not tendered in the initial offer. The additional $16.8 million paid resulted in the elimination of the noncontrolling interest and an increase in additional paid-in capital. As of December 31, 2016, the Company continues to maintain a security pledge of approximately $6.1 million required by Swedish law. The final amount and timing of the final disposition will be determined by an arbitration tribunal at the completion of the Squeeze-out Proceedings, which is currently expected in 2017.
Noncontrolling interest was as follows (in thousands):
December 31, 2016 | December 26, 2015 | ||||||
Beginning noncontrolling interest | $ | 14,910 | $ | — | |||
Noncontrolling interest investment | — | 15,373 | |||||
Acquisition of noncontrolling interest | (14,407 | ) | — | ||||
Loss attributable to noncontrolling interest | (503 | ) | (463 | ) | |||
Ending noncontrolling interest | $ | — | $ | 14,910 | |||
78
INFINERA CORPORATION
NOTES TO CONSOLIDATED FINANCIAL STATEMENTS—(Continued)
7. | Goodwill and Intangible Assets |
Goodwill
Goodwill is recorded when the purchase price of an acquisition exceeds the fair value of the net tangible and identified intangible assets acquired.
The following table presents details of the Company’s goodwill for the year ended December 31, 2016 (in thousands):
Balance as of December 26, 2015 | $ | 191,560 | |
Foreign currency translation adjustments | (14,800 | ) | |
Accumulated impairment loss | — | ||
Balance as of December 31, 2016 | $ | 176,760 | |
The gross carrying amount of goodwill may change due to the effects of foreign currency fluctuations as these assets are denominated in SEK.
Intangible Assets
The following table presents details of the Company’s intangible assets as of December 31, 2016 and December 26, 2015 (in thousands):
December 31, 2016 | |||||||||||||
Gross Carrying Amount | Accumulated Amortization | Net Carrying Amount | Weighted Average Remaining Useful Life (In Years) | ||||||||||
Intangible assets with finite lives: | |||||||||||||
Trade names | $ | 220 | $ | (220 | ) | $ | — | 0.0 | |||||
Customer relationships | 46,125 | (7,793 | ) | 38,332 | 6.6 | ||||||||
Developed technology | 94,320 | (24,715 | ) | 69,605 | 3.7 | ||||||||
Other intangible assets | 819 | (567 | ) | 252 | 4.6 | ||||||||
Total intangible assets with finite lives | $ | 141,484 | $ | (33,295 | ) | $ | 108,189 | 4.7 | |||||
Acquired in-process technology | 286 | — | 286 | ||||||||||
Total intangible assets | $ | 141,770 | $ | (33,295 | ) | $ | 108,475 | ||||||
79
INFINERA CORPORATION
NOTES TO CONSOLIDATED FINANCIAL STATEMENTS—(Continued)
December 26, 2015 | |||||||||||||
Gross Carrying Amount | Accumulated Amortization | Net Carrying Amount | Weighted Average Remaining Useful Life (In Years) | ||||||||||
Intangible assets with finite lives: | |||||||||||||
Trade names | $ | 239 | $ | (168 | ) | $ | 71 | 0.2 | |||||
Customer relationships | 49,991 | (2,197 | ) | 47,794 | 7.7 | ||||||||
Developed technology | 94,256 | (6,629 | ) | 87,627 | 4.6 | ||||||||
Other intangible assets | 819 | (513 | ) | 306 | 5.6 | ||||||||
Total intangible assets with finite lives | $ | 145,305 | $ | (9,507 | ) | $ | 135,798 | 5.7 | |||||
Acquired in-process technology | 20,521 | — | 20,521 | ||||||||||
Total intangible assets | $ | 165,826 | $ | (9,507 | ) | $ | 156,319 | ||||||
The gross carrying amount of intangible assets and the related amortization expense of intangible assets may change due to the effects of foreign currency fluctuations as these assets are denominated in SEK. Amortization expense was $26.0 million and $9.0 million for the years ended December 31, 2016 and December 26, 2015, respectively.
Intangible assets are carried at cost less accumulated amortization. Amortization expenses are recorded to the appropriate cost and expense categories. During 2016, the Company transferred $3.8 million of its in-process technology to developed technology, which is being amortized over a maximum useful life of seven years. In-process technology of $0.3 million as of December 31, 2016 is not subject to amortization. As such, the Company excluded it in the future amortization expense table below. Additionally, during 2016, the Company recorded an impairment charge of $11.3 million related to in-process research and development, resulting from the Company's decision to abandon previously acquired in-process technologies.
The following table summarizes the Company’s estimated future amortization expense of intangible assets with finite lives as of December 31, 2016 (in thousands):
Fiscal Years | |||||||||||||||||||||||
Total | 2017 | 2018 | 2019 | 2020 | 2021 and Thereafter | ||||||||||||||||||
Total future amortization expense | $ | 108,189 | $ | 24,924 | $ | 24,924 | $ | 24,364 | $ | 17,779 | $ | 16,198 | |||||||||||
80
INFINERA CORPORATION
NOTES TO CONSOLIDATED FINANCIAL STATEMENTS—(Continued)
8. Balance Sheet Details
Restricted Cash
The Company’s long-term restricted cash balance is primarily comprised of certificates of deposit and money market funds, of which the majority is not insured by the Federal Deposit Insurance Corporation. These amounts primarily collateralize the Company’s issuances of stand-by and commercial letters of credit and bank guarantees. Additionally, the Company’s long-term restricted cash balance includes a leave encashment fund for India employees and a corporate bank card deposit for employees in the United Kingdom. The short-term restricted cash balance consists of a security pledge related to the Transmode acquisition Squeeze-out Proceedings and an escrow account to fund our facility expansion.
The following table provides details of selected balance sheet items (in thousands):
December 31, 2016 | December 26, 2015 | ||||||
Inventory: | |||||||
Raw materials | $ | 33,158 | $ | 27,879 | |||
Work in process | 74,533 | 52,599 | |||||
Finished goods | 125,264 | 94,221 | |||||
Total | $ | 232,955 | $ | 174,699 | |||
Property, plant and equipment, net: | |||||||
Computer hardware | $ | 12,775 | $ | 11,097 | |||
Computer software(1) | 26,779 | 22,548 | |||||
Laboratory and manufacturing equipment | 222,311 | 189,168 | |||||
Furniture and fixtures | 2,075 | 1,897 | |||||
Leasehold improvements | 42,267 | 38,946 | |||||
Construction in progress | 33,633 | 31,060 | |||||
Subtotal | $ | 339,840 | $ | 294,716 | |||
Less accumulated depreciation and amortization(2) | (215,040 | ) | (183,855 | ) | |||
Total | $ | 124,800 | $ | 110,861 | |||
Accrued expenses: | |||||||
Loss contingency related to non-cancelable purchase commitments | $ | 5,555 | $ | 6,821 | |||
Professional and other consulting fees | 4,955 | 5,363 | |||||
Taxes payable | 2,384 | 3,295 | |||||
Royalties | 5,375 | 4,290 | |||||
Other accrued expenses | 13,311 | 13,967 | |||||
Total | $ | 31,580 | $ | 33,736 | |||
(1) | Included in computer software at December 31, 2016 and December 26, 2015 were $9.1 million and $7.9 million, respectively, related to enterprise resource planning (“ERP”) systems that the Company implemented. The unamortized ERP costs at December 31, 2016 and December 26, 2015 were $4.0 million and $4.0 million, respectively. |
(2) | Depreciation expense was $35.5 million, $26.8 million and $25.9 million (which includes depreciation of capitalized ERP costs of $1.2 million, $1.2 million and $1.1 million, respectively) for 2016, 2015 and 2014, respectively. |
81
INFINERA CORPORATION
NOTES TO CONSOLIDATED FINANCIAL STATEMENTS—(Continued)
9. Comprehensive Income (Loss)
Other comprehensive income (loss) includes certain changes in equity that are excluded from net income (loss). The following table sets forth the changes in accumulated other comprehensive income (loss) by component for the periods presented (in thousands):
Unrealized Gain (Loss) on Available-for-Sale Securities | Foreign Currency Translation | Accumulated Tax Effect | Total | ||||||||||||
Balance at December 28, 2013 | $ | (124 | ) | $ | (2,602 | ) | $ | (760 | ) | $ | (3,486 | ) | |||
Other comprehensive loss before reclassifications | (320 | ) | (812 | ) | — | (1,132 | ) | ||||||||
Amounts reclassified from accumulated other comprehensive loss | — | — | — | — | |||||||||||
Net current-period other comprehensive loss | (320 | ) | (812 | ) | — | (1,132 | ) | ||||||||
Balance at December 27, 2014 | $ | (444 | ) | $ | (3,414 | ) | $ | (760 | ) | $ | (4,618 | ) | |||
Other comprehensive income before reclassifications | (62 | ) | 5,803 | — | 5,741 | ||||||||||
Amounts reclassified from accumulated other comprehensive loss | — | — | — | — | |||||||||||
Net current-period other comprehensive income | (62 | ) | 5,803 | — | 5,741 | ||||||||||
Balance at December 26, 2015 | $ | (506 | ) | $ | 2,389 | $ | (760 | ) | $ | 1,123 | |||||
Other comprehensive loss before reclassifications | 297 | (29,625 | ) | (119 | ) | (29,447 | ) | ||||||||
Amounts reclassified from accumulated other comprehensive loss | — | — | — | — | |||||||||||
Net current-period other comprehensive loss | 297 | (29,625 | ) | (119 | ) | (29,447 | ) | ||||||||
Balance at December 31, 2016 | $ | (209 | ) | $ | (27,236 | ) | $ | (879 | ) | $ | (28,324 | ) | |||
10. Basic and Diluted Net Income (Loss) Per Common Share
Basic net income (loss) per common share is computed by dividing net income (loss) attributable to Infinera Corporation by the weighted average number of common shares outstanding during the period. Diluted net income (loss) attributable to Infinera Corporation per common share is computed using net income (loss) attributable to Infinera Corporation and the weighted average number of common shares outstanding plus potentially dilutive common shares outstanding during the period. Potentially dilutive common shares include the assumed exercise of outstanding stock options, assumed release of outstanding RSU and PSUs, and assumed issuance of common stock under the ESPP using the treasury stock method. Potentially dilutive common shares also include the assumed conversion of convertible senior notes from the conversion spread (as discussed in Note 11, "Convertible Senior Notes"). The Company includes the common shares underlying PSUs in the calculation of diluted net income per share only when they become contingently issuable. In net loss periods, these potentially diluted common shares have been excluded from the diluted net loss calculation.
82
INFINERA CORPORATION
NOTES TO CONSOLIDATED FINANCIAL STATEMENTS—(Continued)
The following table sets forth the computation of net income (loss) per common share attributable to Infinera Corporation - basic and diluted (in thousands, except per share amounts):
Years Ended | |||||||||||
December 31, 2016 | December 26, 2015 | December 27, 2014 | |||||||||
Numerator: | |||||||||||
Net income (loss) attributable to Infinera Corporation | $ | (23,927 | ) | $ | 51,413 | $ | 13,659 | ||||
Denominator: | |||||||||||
Basic weighted average common shares outstanding | 142,989 | 133,259 | 123,672 | ||||||||
Effect of dilutive securities: | |||||||||||
Employee equity plans | — | 5,686 | 4,778 | ||||||||
Assumed conversion of convertible senior notes from conversion spread | — | 4,226 | 115 | ||||||||
Dilutive weighted average common shares outstanding | 142,989 | 143,171 | 128,565 | ||||||||
Net income (loss) per common share attributable to Infinera Corporation | |||||||||||
Basic | $ | (0.17 | ) | $ | 0.39 | $ | 0.11 | ||||
Diluted | $ | (0.17 | ) | $ | 0.36 | $ | 0.11 | ||||
The Company incurred a net loss during 2016, and as a result, potential common shares from options, RSUs, PSUs and assumed release of outstanding stock under the ESPP were not included in the diluted shares used to calculate net loss per share, as their inclusion would have been anti-dilutive.
During 2015 and 2014, the Company included the dilutive effects of the Notes in the calculation of diluted net income per common share as the applicable average market price was above the conversion price of the Notes. The dilutive impact of the Notes (as defined in Note 11, "Convertible Senior Notes") for the year was based on the average dilution of the four quarters, which is calculated as the difference between the Company's average stock price during the period and the conversion price of the Notes. Given the average market price at the end of 2016 was below the conversion price, no shares were included in the dilutive share count. Upon conversion of the Notes, it is the Company’s intention to pay cash equal to the lesser of the aggregate principal amount or the conversion value of the Notes being converted, therefore, only the conversion spread relating to the Notes would be included in the Company’s diluted earnings per share calculation unless their effect is anti-dilutive.
The effects of certain potentially outstanding shares were not included in the calculation of diluted net income per share for years ended December 26, 2015 and December 27, 2014 because their effect were anti-dilutive under the treasury stock method or the performance condition of the award had not been met.
The following sets forth the potentially dilutive shares excluded from the computation of the diluted net income (loss) per share because their effect was anti-dilutive (in thousands):
As of | ||||||||
December 31, 2016 | December 26, 2015 | December 27, 2014 | ||||||
Stock options outstanding | 2,042 | 8 | 362 | |||||
Restricted stock units | 5,302 | 415 | 331 | |||||
Performance stock units | 896 | 73 | 124 | |||||
Employee stock purchase plan shares | 1,010 | 225 | 741 | |||||
Total | 9,250 | 721 | 1,558 | |||||
83
INFINERA CORPORATION
NOTES TO CONSOLIDATED FINANCIAL STATEMENTS—(Continued)
11. | Convertible Senior Notes |
In May 2013, the Company issued the $150.0 million of 1.75% convertible senior notes due June 1, 2018 (the “Notes”), which will mature on June 1, 2018, unless earlier unless earlier purchased by the Company or converted. Interest is payable semi-annually in arrears on June 1 and December 1 of each year, commencing December 1, 2013. The net proceeds to the Company were approximately $144.5 million.
The Notes are governed by an indenture dated as of May 30, 2013 (the “Indenture”), between the Company, as issuer, and U.S. Bank National Association, as trustee. The Notes are unsecured and do not contain any financial covenants or any restrictions on the payment of dividends, the incurrence of senior debt or other indebtedness, or the issuance or repurchase of securities by the Company.
Upon conversion, it is the Company's intention to pay cash equal to the lesser of the aggregate principal amount or the conversion value of the Notes. For any remaining conversion obligation, The Company intends to pay cash, shares of common stock or a combination of cash and shares of common stock, at the Company's election. The initial conversion rate is 79.4834 shares of common stock per $1,000 principal amount of Notes, subject to anti-dilution adjustments. The initial conversion price is approximately $12.58 per share of common stock.
Throughout the term of the Notes, the conversion rate may be adjusted upon the occurrence of certain events, including for any cash dividends. Holders of the Notes will not receive any cash payment representing accrued and unpaid interest upon conversion of a Note. Accrued but unpaid interest will be deemed to be paid in full upon conversion rather than canceled, extinguished or forfeited. Holders may convert their Notes under the following circumstances:
• | during any fiscal quarter commencing after the fiscal quarter ending on September 28, 2013 (and only during such fiscal quarter) if the last reported sale price of the common stock for at least 20 trading days (whether or not consecutive) during a period of 30 consecutive trading days ending on the last trading day of the immediately preceding fiscal quarter is greater than or equal to 130% of the conversion price on each applicable trading day; |
• | during the five business day period after any five consecutive trading day period (the “measurement period”) in which the trading price per $1,000 principal amount of Notes for each trading day of the measurement period was less than 98% of the product of the last reported sale price of the Company’s common stock and the conversion rate on each such trading day; |
• | upon the occurrence of specified corporate events described under the Indenture, such as a consolidation, merger or binding share exchange; or |
• | at any time on or after December 1, 2017 until the close of business on the second scheduled trading day immediately preceding the maturity date, holders may convert their Notes at any time, regardless of the foregoing circumstances. |
If the Company undergoes a fundamental change as defined in the Indenture governing the Notes, holders may require the Company to repurchase for cash all or any portion of their Notes at a repurchase price equal to 100% of the principal amount of the Notes to be repurchased, plus accrued and unpaid interest to, but excluding, the fundamental change repurchase date. In addition, upon the occurrence of a “make-whole fundamental change” (as defined in the Indenture), the Company will, in certain circumstances, increase the conversion rate by a number of additional shares for a holder that elects to convert its Notes in connection with such make-whole fundamental change.
84
INFINERA CORPORATION
NOTES TO CONSOLIDATED FINANCIAL STATEMENTS—(Continued)
The net carrying amounts of the debt obligation were as follows (in thousands):
December 31, 2016 | December 26, 2015 | ||||||
Principal | $ | 150,000 | $ | 150,000 | |||
Unamortized discount (1) | (15,114 | ) | (24,560 | ) | |||
Unamortized issuance cost (1) | (1,300 | ) | (2,113 | ) | |||
Net carrying amount | $ | 133,586 | $ | 123,327 | |||
(1) | Unamortized debt conversion discount and issuance costs will be amortized over the remaining life of the Notes, which is approximately 17 months. |
As of December 31, 2016 and December 26, 2015, the carrying amount of the equity component of the Notes was $43.3 million.
In accounting for the issuance of the Notes, the Company separated the Notes into liability and equity components. The carrying amount of the liability component was calculated by measuring the fair value of a similar debt instrument that does not have an associated convertible feature. The carrying amount of the equity component representing the conversion option was determined by deducting the fair value of the liability component from the par value of the Notes. The equity component is not remeasured as long as it continues to meet the conditions for equity classification. The excess of the principal amount of the liability component over its carrying amount (“debt discount”) is amortized to interest expense over the term of the Notes.
In accounting for the issuance costs of $5.5 million related to the Notes, the Company allocated the total amount incurred to the liability and equity components of the Notes based on their relative values. Issuance costs attributable to the liability component were recorded as other non-current assets and will be amortized to interest expense over the term of the Notes. ASU 2015-03 requires an entity to present such costs in the balance sheet as a direct deduction from the related debt liability rather than as an asset. The Company adopted ASU 2015-03 during the first quarter of 2016. The December 26, 2015 balance sheet was retrospectively adjusted to reclassify $2.1 million from other non-current assets to a reduction of the Notes payable liability.
The issuance costs attributable to the equity component were netted with the equity component in stockholders’ equity. Additionally, the Company initially recorded a deferred tax liability of $17.0 million in connection with the issuance of the Notes, and a corresponding reduction in valuation allowance. The impact of both was recorded to stockholders’ equity.
The Company determined that the embedded conversion option in the Notes does not require separate accounting treatment as a derivative instrument because it is both indexed to the Company’s own stock and would be classified in stockholder’s equity if freestanding.
The following table sets forth total interest expense recognized related to the Notes (in thousands):
Years Ended | |||||||||||
December 31, 2016 | December 26, 2015 | December 27, 2014 | |||||||||
Contractual interest expense | $ | 2,625 | $ | 2,625 | $ | 2,626 | |||||
Amortization of debt issuance costs | 813 | 735 | 665 | ||||||||
Amortization of debt discount | 9,447 | 8,546 | 7,730 | ||||||||
Total interest expense | $ | 12,885 | $ | 11,906 | $ | 11,021 | |||||
The coupon rate was 1.75%. For the years ended December 31, 2016 and December 26, 2015, the debt discount and debt issuance costs were amortized, using an annual effective interest rate of 10.23%, to interest expense over the term of the Notes.
85
INFINERA CORPORATION
NOTES TO CONSOLIDATED FINANCIAL STATEMENTS—(Continued)
As of December 31, 2016, the fair value of the Notes was $154.3 million. The fair value was determined based on the quoted bid price of the Notes in an over-the-counter market on December 30, 2016. The Notes are classified as Level 2 of the fair value hierarchy.
During the three months ended December 31, 2016, the closing price of the Company's common stock did not meet the conversion criteria; therefore, holders of the Notes may not convert their notes during the first quarter of 2017. Should the closing price conditions be met during the 30 consecutive trading days prior to the end of the first quarter of 2017 or a future quarter, the Notes will be convertible at their holders’ option during the immediately following quarter. Based on the closing price of the Company’s common stock of $8.49 on December 30, 2016, the if-converted value of the Notes did not exceed their principal amount.
12. | Commitments and Contingencies |
Operating Leases
The Company leases facilities under non-cancelable operating lease agreements. These leases have varying terms that range from one to 12 years, and contain leasehold improvement incentives, rent holidays and escalation clauses. In addition, some of these leases have renewal options for up to five years. The Company has contractual commitments to remove leasehold improvements and return certain properties to a specified condition when the leases terminate. At the inception of a lease with such conditions, the Company records an asset retirement obligation liability and a corresponding capital asset in an amount equal to the estimated fair value of the obligation. Asset retirement obligations were $3.6 million and $2.8 million as of December 31, 2016 and December 26, 2015, respectively. These obligations are classified as other long-term liabilities on the accompanying consolidated balance sheets.
The Company recognizes rent expense on a straight-line basis over the lease period factoring in leasehold improvement incentives, rent holidays and escalation clauses. Rent expense for all leases was $11.0 million, $8.6 million and $7.2 million for 2016, 2015 and 2014, respectively. The Company did not have any sublease rental income for 2016, 2015 and 2014.
Future annual minimum operating lease payments at December 31, 2016 were as follows (in thousands):
2017 | 2018 | 2019 | 2020 | 2021 | Thereafter | Total | |||||||||||||||||||||
Operating lease payments | $ | 12,073 | $ | 11,723 | $ | 10,737 | $ | 9,445 | $ | 3,268 | $ | 8,343 | $ | 55,589 | |||||||||||||
Purchase Commitments
The Company has service agreements with its major production suppliers, where the Company is committed to purchase certain parts. These obligations are typically less than the Company’s purchase needs. As of December 31, 2016, December 26, 2015 and December 27, 2014, these non-cancelable purchase commitments were $111.9 million, $137.4 million and $128.3 million, respectively.
Future purchase commitments at December 31, 2016 were as follows (in thousands):
2017 | 2018 | 2019 | 2020 | 2021 | Thereafter | Total | |||||||||||||||||||||
Purchase obligations | $ | 111,932 | $ | — | $ | — | $ | — | $ | — | $ | — | $ | 111,932 | |||||||||||||
The contractual obligation tables above exclude tax liabilities of $2.8 million related to uncertain tax positions because the Company cannot reliably estimate the timing and amount of future payments, if any.
86
INFINERA CORPORATION
NOTES TO CONSOLIDATED FINANCIAL STATEMENTS—(Continued)
Legal Matters
On November 23, 2016, Oyster Optics, LLP (“Oyster Optics”) filed a complaint against the Company in the United States District Court for the Eastern District of Texas. The complaint asserts U.S. Patent Nos. 6,469,816, 6,476,952, 6,594,055, 7,099,592, 7,620,327, 8,374,511 and 8,913,898 (collectively, the “Oyster Optics patents in suit”). The complaint seeks unspecified damages and a permanent injunction. The Company believes that it does not infringe any valid and enforceable claim of the Oyster Optics patents in suit, and intends to litigate this action vigorously. Because this action is in the early stages, the Company is unable to reasonably estimate the possible loss or range of loss, if any, arising from this matter.
In addition to the matter described above, the Company is subject to various legal proceedings, claims and litigation arising in the ordinary course of business. While the outcome of these matters is currently not determinable, the Company does not expect that the ultimate costs to resolve these matters will have a material effect on its consolidated financial position, results of operations or cash flows.
Loss Contingencies
The Company is subject to the possibility of various losses arising in the ordinary course of business. These may relate to disputes, litigation and other legal actions. In the preparation of its quarterly and annual financial statements, the Company considers the likelihood of loss or the incurrence of a liability, including whether it is probable, reasonably possible or remote that a liability has been incurred, as well as the Company’s ability to reasonably estimate the amount of loss, in determining loss contingencies. In accordance with U.S. GAAP, an estimated loss contingency is accrued when it is probable that a liability has been incurred and the amount of loss can be reasonably estimated. The Company regularly evaluates current information to determine whether any accruals should be adjusted and whether new accruals are required. As of December 31, 2016, the Company has accrued the estimated liabilities associated with these potential loss contingencies.
Indemnification Obligations
From time to time, the Company enters into certain types of contracts that contingently require it to indemnify parties against third party claims. The terms of such indemnification obligations vary. These contracts may relate to: (i) certain real estate leases under which the Company may be required to indemnify property owners for environmental and other liabilities, and other claims arising from the Company’s use of the applicable premises; and (ii) certain agreements with the Company’s officers, directors and certain key employees, under which the Company may be required to indemnify such persons for liabilities.
In addition, the Company has agreed to indemnify certain customers for claims made against the Company’s products, where such claims allege infringement of third party intellectual property rights, including, but not limited to, patents, registered trademarks, and/or copyrights. Under the intellectual property indemnification clauses, the Company may be obligated to defend the customer and pay for the damages awarded against the customer under an infringement claim as well as the customer’s attorneys’ fees and costs. These indemnification obligations generally do not expire after termination or expiration of the agreement containing the indemnification obligation. In certain cases, there are limits on and exceptions to the Company’s potential liability for indemnification. The Company cannot estimate the amount of potential future payments, if any, that it might be required to make as a result of these agreements. The maximum potential amount of any future payments that the Company could be required to make under these indemnification obligations could be significant. To date, the Company has not incurred any material costs as a result of the indemnification obligations and has not accrued any liabilities related to such obligations in the Company’s consolidated financial statements.
As permitted under Delaware law and the Company’s charter and bylaws, the Company has agreements whereby it indemnifies certain of its officers and each of its directors. The term of the indemnification period is for the officer’s or director’s lifetime for certain events or occurrences while the officer or director is, or was, serving at the Company’s request in such capacity. The maximum potential amount of future payments the Company could be required to make under these indemnification agreements could be significant; however, the Company has a director and officer insurance policy that may reduce its exposure and enable it to recover all or a portion of any future amounts paid. As a result of its insurance policy coverage, the Company believes the estimated fair value of these indemnification agreements is minimal.
87
INFINERA CORPORATION
NOTES TO CONSOLIDATED FINANCIAL STATEMENTS—(Continued)
13. Guarantees
Product Warranties
Activity related to product warranty was as follows (in thousands):
December 31, 2016 | December 26, 2015 | ||||||
Beginning balance | $ | 38,844 | $ | 27,040 | |||
Charges to operations | 25,135 | 31,258 | |||||
Utilization | (16,884 | ) | (15,114 | ) | |||
Change in estimate(1) | (6,753 | ) | (4,340 | ) | |||
Balance at the end of the period | $ | 40,342 | $ | 38,844 | |||
(1) | The Company records hardware warranty liabilities based on the latest quality and cost information available as of that date. The changes in estimate shown here are due to changes in overall actual failure rates, the mix of new versus used units related to replacement of failed units, and changes in the estimated cost of repair. Over time, the Company's failure rates and repair costs have generally declined leading to favorable changes in warranty reserves. |
Letters of Credit and Bank Guarantees
The Company had $8.7 million of standby letters of credit and bank guarantees outstanding as of December 31, 2016. These consisted of $4.5 million related to property leases, $3.1 million related to customer performance guarantees and $1.1 million related to a value added tax and customs authorities' licenses. The Company had $5.2 million of standby letters of outstanding as of December 26, 2015. These consisted of $3.1 million related to customer performance guarantees, $1.2 million related to a value added tax license and $0.9 million related to property leases.
As of December 31, 2016 and December 26, 2015, the Company has a line of credit for approximately $1.1 million and $1.5 million, respectively, to support the issuance of letters of credit, of which $0.3 million had been issued and outstanding for both periods. The Company has pledged approximately $4.5 million and $4.7 million of assets of a subsidiary to secure this line of credit and other obligations as of December 31, 2016 and December 26, 2015, respectively.
14. | Stockholders’ Equity |
2000 Stock Plan, 2007 Equity Incentive Plan, 2016 Equity Incentive Plan and Employee Stock Purchase Plan
In December 2000, the Company adopted the 2000 Stock Plan (“2000 Plan”). Under the 2000 Plan, as amended, the Company had reserved an aggregate of 14.2 million shares of its common stock for issuance. As of December 31, 2016, options to purchase 20 thousand shares of the Company’s common stock were outstanding under the 2000 Plan. The Company has not granted any additional options or other awards under the 2000 Plan since the Company's initial public offering (the “IPO”) in 2007. The 2000 Plan expired on December 6, 2010. However, the 2000 Plan will continue to govern the terms and conditions of the outstanding options previously granted under the 2000 Plan since prior to the IPO.
In February 2007, the Company’s board of directors adopted the 2007 Equity Incentive Plan (“2007 Plan”) and the Company’s stockholders approved the 2007 Plan in May 2007. The Company has reserved a total of 46.8 million shares of common stock for issuance under the 2007 Plan. Upon stockholder approval of the 2016 Equity Incentive Plan (“2016 Plan”), the Company has ceased granting equity awards under the 2007 Plan, however the 2007 Plan will continue to govern the terms and conditions of the outstanding options previously granted under the 2007 Plan. As December 31, 2016, options to purchase 1.6 million shares of the Company's common stock were outstanding and 5.5 million RSUs were outstanding under the 2007 Plan.
88
INFINERA CORPORATION
NOTES TO CONSOLIDATED FINANCIAL STATEMENTS—(Continued)
In February 2016, the Company's board of directors adopted the 2016 Plan and the Company's stockholders approved the 2016 Plan in May 2016. As of December 31, 2016, the Company reserved a total of 7.5 million shares of common stock for issuance of stock options, RSUs and PSUs to employees, non-employees, consultants and members of the Company's board of directors, pursuant to the 2016 Plan, plus any shares subject to awards granted under the Company’s 2007 Equity Incentive Plan (the “2007 Plan”) that, after the effective date of the 2016 Plan, expire, are forfeited or otherwise terminate without having been exercised in full to the extent such awards were exercisable, and shares issued pursuant to awards granted under the 2007 Plan that, after the effective date of the 2016 Plan, are forfeited to or repurchased by the Company due to failure to vest. The 2016 Plan has a maximum term of 10 years from the date of adoption, or it can be earlier terminated by the Company's board of directors.
The ESPP was adopted by the board of directors in February 2007 and approved by the stockholders in May 2007. The ESPP was last amended by the stockholders in May 2014 to increase the shares authorized under the ESPP to 16.6 million shares of common stock. The ESPP has a 20-year term. Eligible employees may purchase the Company’s common stock through payroll deductions at a price equal to 85% of the lower of the fair market values of the stock as of the beginning or the end of six-month offering periods. An employee’s payroll deductions under the ESPP are limited to 15% of the employee’s compensation and employees may not purchase more than $25,000 of stock during any calendar year.
Shares Reserved for Future Issuances
Common stock reserved for future issuance was as follows (in thousands):
December 31, 2016 | ||
Outstanding stock options and awards | 7,853 | |
Reserved for future option and award grants | 7,096 | |
Reserved for future ESPP | 4,664 | |
Total common stock reserved for stock options and awards | 19,613 | |
89
INFINERA CORPORATION
NOTES TO CONSOLIDATED FINANCIAL STATEMENTS—(Continued)
Stock-based Compensation Plans
The Company has stock-based compensation plans pursuant to which the Company has granted stock options, RSUs and PSUs. The Company also has an ESPP for all eligible employees. The following tables summarize the Company’s equity award activity and related information (in thousands, except per share data):
Number of Options | Weighted-Average Exercise Price Per Share | Aggregate Intrinsic Value | ||||||||
Outstanding at December 28, 2013 | 6,367 | $ | 7.26 | $ | 17,452 | |||||
Options granted | 25 | $ | 9.02 | |||||||
Options exercised | (2,001 | ) | $ | 6.99 | $ | 8,182 | ||||
Options canceled | (93 | ) | $ | 12.38 | ||||||
Outstanding at December 27, 2014 | 4,298 | $ | 7.29 | $ | 32,833 | |||||
Options granted | — | $ | — | |||||||
Options exercised | (1,787 | ) | $ | 7.33 | $ | 21,566 | ||||
Options canceled | — | $ | — | |||||||
Outstanding at December 26, 2015 | 2,511 | $ | 7.26 | $ | 28,288 | |||||
Options granted | — | $ | — | |||||||
Options exercised | (825 | ) | $ | 4.97 | $ | 4,433 | ||||
Options canceled | (31 | ) | $ | 12.46 | ||||||
Outstanding at December 31, 2016 | 1,655 | $ | 8.30 | $ | 965 | |||||
Exercisable at December 31, 2016 | 1,649 | $ | 8.30 | $ | 965 | |||||
Number of Restricted Stock Units | Weighted-Average Grant Date Fair Value Per Share | Aggregate Intrinsic Value | ||||||||
Outstanding at December 28, 2013 | 6,583 | $ | 7.72 | $ | 64,443 | |||||
RSUs granted | 2,705 | $ | 8.80 | |||||||
RSUs released | (2,797 | ) | $ | 7.84 | $ | 24,858 | ||||
RSUs canceled | (449 | ) | $ | 7.85 | ||||||
Outstanding at December 27, 2014 | 6,042 | $ | 8.14 | $ | 90,085 | |||||
RSUs granted | 2,202 | $ | 18.48 | |||||||
RSUs released | (3,035 | ) | $ | 7.88 | $ | 53,892 | ||||
RSUs canceled | (277 | ) | $ | 10.95 | ||||||
Outstanding at December 26, 2015 | 4,932 | $ | 12.76 | $ | 91,285 | |||||
RSUs granted | 2,992 | $ | 13.94 | |||||||
RSUs released | (2,303 | ) | $ | 11.06 | $ | 26,407 | ||||
RSUs canceled | (328 | ) | $ | 13.9 | ||||||
Outstanding at December 31, 2016 | 5,293 | $ | 14.1 | $ | 44,939 | |||||
90
INFINERA CORPORATION
NOTES TO CONSOLIDATED FINANCIAL STATEMENTS—(Continued)
Number of Performance Stock Units | Weighted-Average Grant Date Fair Value Per Share | Aggregate Intrinsic Value | ||||||||
Outstanding at December 28, 2013 | 721 | $ | 7.04 | $ | 7,054 | |||||
PSUs granted | 508 | $ | 8.34 | |||||||
PSUs released | (255 | ) | $ | 6.36 | $ | 2,097 | ||||
PSUs canceled | (98 | ) | $ | 7.18 | ||||||
Outstanding at December 27, 2014 | 876 | $ | 7.49 | $ | 13,067 | |||||
PSUs granted | 332 | $ | 18.23 | |||||||
PSU performance earned(1) | 129 | $ | 7.32 | |||||||
PSUs released | (413 | ) | $ | 7.00 | $ | 7,231 | ||||
PSUs canceled | (193 | ) | $ | 8.03 | ||||||
Outstanding at December 26, 2015 | 731 | $ | 12.35 | $ | 13,540 | |||||
PSUs granted | 647 | $ | 15.28 | |||||||
PSU performance earned(1) | 234 | $ | 12.28 | |||||||
PSUs released | (614 | ) | $ | 11.34 | $ | 8,077 | ||||
PSUs canceled | (94 | ) | $ | 15.18 | ||||||
Outstanding at December 31, 2016 | 904 | $ | 14.13 | $ | 7,672 | |||||
Expected to vest as of December 31, 2016 | 81 | $ | 691 | |||||||
(1) | Represents the additional PSUs awarded resulting from the achievement of performance goals above the performance targets established at grant. |
The aggregate intrinsic value of unexercised options is calculated as the difference between the closing price of the Company’s common stock of $8.49 at December 30, 2016 and the exercise prices of the underlying stock options. The aggregate intrinsic value of the options which have been exercised is calculated as the difference between the fair market value of the common stock at the date of exercise and the exercise price of the underlying stock options. The aggregate intrinsic value of unreleased RSUs and unreleased PSUs is calculated using the closing price of the Company's common stock of $8.49 at December 30, 2016. The aggregate intrinsic value of RSUs and PSUs released is calculated using the fair market value of the common stock at the date of release.
The following table presents total stock-based compensation cost for instruments granted but not yet amortized, net of estimated forfeitures, of the Company’s equity compensation plans as of December 31, 2016. These costs are expected to be amortized on a straight-line basis over the following weighted-average periods (in thousands, except for weighted-average period):
Unrecognized Compensation Expense, Net | Weighted- Average Period (in years) | ||||
Stock options | $ | 24 | 1.0 | ||
RSUs | $ | 53,340 | 2.4 | ||
PSUs | $ | 5,346 | 1.5 | ||
91
INFINERA CORPORATION
NOTES TO CONSOLIDATED FINANCIAL STATEMENTS—(Continued)
The following table summarizes information about options outstanding at December 31, 2016.
Options Outstanding | Vested and Exercisable Options | |||||||||||||||
Exercise Price | Number of Shares | Weighted- Average Remaining Contractual Life | Weighted- Average Exercise Price | Number of Shares | Weighted- Average Exercise Price | |||||||||||
(In thousands) | (In years) | (In thousands) | ||||||||||||||
$6.30 - $ 7.25 | 293 | 2.74 | $ | 6.86 | 293 | $ | 6.86 | |||||||||
$7.45 - $ 7.61 | 400 | 1.74 | $ | 7.54 | 400 | $ | 7.54 | |||||||||
$7.68 - $ 8.19 | 250 | 3.63 | $ | 8.06 | 250 | $ | 8.06 | |||||||||
$ 8.58 | 509 | 4.11 | $ | 8.58 | 509 | $ | 8.58 | |||||||||
$9.02 - $ 22.36 | 203 | 2.20 | $ | 11.46 | 197 | $ | 11.54 | |||||||||
1,655 | 2.99 | $ | 8.30 | 1,649 | $ | 8.30 | ||||||||||
Employee Stock Options
The weighted-average remaining contractual term of options outstanding and exercisable was 3.0 years as of December 31, 2016. The Company did not grant any stock options during 2016 or 2015. Total fair value of stock options granted to employees and directors that vested during 2016 was insignificant and was approximately $0.2 million and $0.8 million for 2015 and 2014, respectively, based on the grant date fair value. Amortization of stock-based compensation expense related to stock options in 2016 was insignificant, and was $0.2 million and $0.7 million in 2015 and 2014, respectively.
The estimated values of stock options, as well as assumptions used in calculating these values were based on estimates as follows (expense amounts in thousands):
Year Ended | |
Employee and Director Stock Options | December 27, 2014 |
Volatility | 52% |
Risk-free interest rate | 1.3% |
Expected life | 4.3 years |
Estimated fair value | 3.85 |
Employee Stock Purchase Plan
The fair value of the ESPP shares was estimated at the date of grant using the following assumptions:
Years Ended | |||||
December 31, 2016 | December 26, 2015 | December 27, 2014 | |||
Volatility | 56% - 67% | 39% - 53% | 46% - 51% | ||
Risk-free interest rate | 0.51% - 0.52% | 0.13% - 0.26% | 0.02% - 0.11% | ||
Expected life | 0.5 years | 0.5 years | 0.3 - 0.5 years | ||
Estimated fair value | $3.16 - $4.53 | $5.15 - $6.43 | $2.05 - $2.57 | ||
92
INFINERA CORPORATION
NOTES TO CONSOLIDATED FINANCIAL STATEMENTS—(Continued)
The Company’s ESPP activity for the following periods was as follows (in thousands):
Years Ended | |||||||||||
December 31, 2016 | December 26, 2015 | December 27, 2014 | |||||||||
Stock-based compensation expense | $ | 6,094 | $ | 4,472 | $ | 3,760 | |||||
Employee contributions | $ | 13,609 | $ | 12,253 | $ | 10,728 | |||||
Shares purchased | 1,369 | 1,229 | 1,438 | ||||||||
Restricted Stock Units
The Company granted RSUs to employees and members of the Company’s board of directors to receive shares of the Company’s common stock. All RSUs awarded are subject to each individual's continued service to the Company through each applicable vesting date. The Company accounted for the fair value of the RSUs using the closing market price of the Company’s common stock on the date of grant. Amortization of stock-based compensation expense related to RSUs in 2016, 2015 and 2014 was approximately $29.6 million, $22.9 million and $21.6 million, respectively.
Performance Stock Units
Pursuant to the 2007 Plan, the Company has granted PSUs to certain of the Company’s executive officers, senior management and certain employees. All PSUs awarded are subject to each individual's continued service to the Company through each applicable vesting date and if the performance metrics are not met within the time limits specified in the award agreements, the PSUs will be canceled.
A number of PSUs granted to the Company’s executive officers and senior management are based on the total shareholder return of the Company's common stock price as compared to the total shareholder return of the S&P North American Technology Multimedia Networking Index (“SPGIIPTR”) over the span of one year, two years and three years. The number of shares to be issued upon vesting of these PSUs range from 0 to 2.0 times the target number of PSUs granted depending on the Company’s performance against the SPGIIPTR.
The ranges of estimated values of the PSUs granted that are compared to the SPGIIPTR, as well as the assumptions used in calculating these values were based on estimates as follows:
2016 | 2015 | 2014 | ||||
Index | SPGIIPTR | SPGIIPTR | SPGIIPTR | |||
Index volatility | 18% | 18% - 19% | 25% | |||
Infinera volatility | 55% | 48% | 49% - 50% | |||
Risk-free interest rate | 0.95% - 1.07% | 0.97% - 1.10% | 0.66% - 0.71% | |||
Correlation with index | 0.58 - 0.59 | 0.52 | 0.60 | |||
Estimated fair value | $10.31 - $16.62 | $18.08 - $19.29 | $6.59 - $7.60 | |||
93
INFINERA CORPORATION
NOTES TO CONSOLIDATED FINANCIAL STATEMENTS—(Continued)
In addition, the Company has granted other PSUs to certain employees that only vest upon the achievement of specific operational performance criteria.
The following table summarizes by grant year, the Company’s PSU activity for the year ended December 31, 2016 (in thousands):
Grant Year | |||||||||||||||
Total Number of Performance Stock Units | 2013 | 2014 | 2015 | 2016 | |||||||||||
Outstanding at December 26, 2015 | 731 | 147 | 260 | 324 | — | ||||||||||
PSUs granted | 647 | — | — | — | 647 | ||||||||||
PSUs performance earned(1) | 234 | 70 | 53 | 111 | — | ||||||||||
PSUs released | (614 | ) | (210 | ) | (179 | ) | (225 | ) | — | ||||||
PSUs canceled | (94 | ) | (7 | ) | (11 | ) | (62 | ) | (14 | ) | |||||
Outstanding at December 31, 2016 | 904 | — | 123 | 148 | 633 | ||||||||||
(1) | Represents the additional PSUs awarded resulting from the achievement of performance goals above the performance targets established at grant since the original grants were at 100% of target amounts. |
Amortization of stock-based compensation expense related to PSUs in 2016, 2015 and 2014 was approximately $6.6 million, $5.0 million and $2.2 million, respectively.
Stock-based Compensation Expense
The following tables summarize the effects of stock-based compensation on the Company’s consolidated balance sheets and statements of operations for the periods presented (in thousands):
Years Ended | |||||||||||
December 31, 2016 | December 26, 2015 | December 27, 2014 | |||||||||
Stock-based compensation effects in inventory | $ | 4,911 | $ | 3,129 | $ | 3,088 | |||||
Stock-based compensation effects in fixed assets | $ | 67 | $ | 93 | $ | 119 | |||||
Stock-based compensation effects in net income (loss) before income taxes | |||||||||||
Cost of revenue | $ | 2,966 | $ | 2,405 | $ | 1,921 | |||||
Research and development | 13,732 | 11,055 | 8,927 | ||||||||
Sales and marketing | 11,043 | 8,081 | 7,477 | ||||||||
General and administrative | 9,295 | 7,354 | 6,383 | ||||||||
37,036 | 28,895 | 24,708 | |||||||||
Cost of revenue—amortization from balance sheet (1) | 3,497 | 3,685 | 3,686 | ||||||||
Total stock-based compensation expense | $ | 40,533 | $ | 32,580 | $ | 28,394 | |||||
(1) | Represents stock-based compensation expense deferred to inventory and deferred inventory costs in prior periods and recognized in the current period. |
94
INFINERA CORPORATION
NOTES TO CONSOLIDATED FINANCIAL STATEMENTS—(Continued)
15. | Income Taxes |
The following is a geographic breakdown of the provision for (benefit from) income taxes (in thousands):
Years Ended | |||||||||||
December 31, 2016 | December 26, 2015 | December 27, 2014 | |||||||||
Current: | |||||||||||
Federal | $ | 32 | $ | — | $ | — | |||||
State | 861 | 1,239 | 446 | ||||||||
Foreign | 2,288 | 3,482 | 2,423 | ||||||||
Total current | $ | 3,181 | $ | 4,721 | $ | 2,869 | |||||
Deferred: | |||||||||||
Federal | $ | — | $ | — | $ | — | |||||
State | — | — | — | ||||||||
Foreign | (7,932 | ) | (3,640 | ) | (116 | ) | |||||
Total deferred | $ | (7,932 | ) | $ | (3,640 | ) | $ | (116 | ) | ||
Total provision (benefit) | $ | (4,751 | ) | $ | 1,081 | $ | 2,753 | ||||
Loss before provision for income taxes from international operations was $23.1 million and $6.3 million, respectively, for the years ended December 31, 2016 and December 26, 2015. Income before provision for income taxes from international operations was $5.6 million for the year ended December 27, 2014.
The provisions benefit for (benefit from) income taxes differ from the amount computed by applying the statutory federal income tax rates as follows:
Years Ended | ||||||||
December 31, 2016 | December 26, 2015 | December 27, 2014 | ||||||
Expected tax (benefit) at federal statutory rate | (35.0 | )% | 35.0 | % | 35.0 | % | ||
State taxes, net of federal benefit | 2.2 | % | 1.5 | % | 1.8 | % | ||
Research credits | (8.9 | )% | (5.0 | )% | (11.4 | )% | ||
Stock-based compensation | 22.3 | % | 9.6 | % | 14.7 | % | ||
Change in valuation allowance | (5.9 | )% | (43.0 | )% | (25.3 | )% | ||
Foreign rate differential | 9.4 | % | 4.0 | % | 2.0 | % | ||
Other | (0.4 | )% | — | % | — | % | ||
Effective tax rate | (16.3 | )% | 2.1 | % | 16.8 | % | ||
The Company recognized an income tax benefit of $4.8 million on a loss before income taxes of $29.2 million, income tax expense of $1.1 million on income before income taxes of $52.0 million and income tax expense of $2.8 million on income before income taxes of $16.4 million in fiscal years 2016, 2015 and 2014, respectively. The resulting effective tax rates were (16.3)%, 2.1% and 16.8% for 2016, 2015 and 2014, respectively. The 2016 and 2015 effective tax rates differ from the expected statutory rate of 35% based upon the utilization of unbenefited U.S. loss carryforwards, offset by state income taxes, non-deductible stock-based compensation expenses and foreign taxes provided on foreign subsidiary earnings. The 2016 income tax benefit compared to the 2015 income tax expense primarily relates to the tax benefit of acquisition related amortization expenses and charges, lower state income taxes because of lower profit in our U.S. operations, and reduction in tax reserves, offset by an increase in taxable foreign profits in certain jurisdictions. The tax expense for 2015 was
95
INFINERA CORPORATION
NOTES TO CONSOLIDATED FINANCIAL STATEMENTS—(Continued)
less than 2014 due to acquisition related amortization expenses and charges offset by higher state taxes, additional tax reserves, and an increase in taxable foreign profits.
Because of the Company's significant loss carryforward position and corresponding full valuation allowance, in all periods, the Company has not been subject to federal or state tax on its U.S. income because of the availability of loss carryforwards, with the exception of certain states’ taxes for which the losses are limited by statute or amount in 2016 and more significantly in 2015, and fed and state taxes associated with a discontinued US subsidiary. If these losses and other tax attributes become fully utilized, our taxes will increase significantly to a more normalized, expected rate on U.S. earnings. The release of transfer pricing reserves in the future will have a beneficial impact to tax expense, but the timing of the impact depends on factors such as expiration of the statute of limitations or settlements with tax authorities. No significant releases are expected in the near future based on information available at this time.
Deferred income taxes reflect the net effects of temporary differences between the carrying amounts of assets and liabilities for financial reporting purposes and the amounts used for income tax purposes. Significant components of the Company’s deferred tax assets are as follows (in thousands):
Years Ended | |||||||
December 31, 2016 | December 26, 2015 | ||||||
Deferred tax assets: | |||||||
Net operating losses | $ | 77,670 | $ | 67,973 | |||
Research credits | 47,405 | 42,093 | |||||
Nondeductible accruals | 42,507 | 38,978 | |||||
Inventory valuation | 30,449 | 21,550 | |||||
Property, plant and equipment | 1,692 | 989 | |||||
Intangible assets | 119 | 796 | |||||
Stock-based compensation | 9,412 | 9,299 | |||||
Total deferred tax assets | $ | 209,254 | $ | 181,678 | |||
Valuation allowance | (200,476 | ) | (169,240 | ) | |||
Net deferred tax assets | $ | 8,778 | $ | 12,438 | |||
Deferred tax liabilities: | |||||||
Depreciation | (239 | ) | (232 | ) | |||
Accruals, reserves and prepaid expenses | (4,008 | ) | (3,874 | ) | |||
Acquired intangible assets | (24,088 | ) | (34,894 | ) | |||
Convertible senior notes | (5,653 | ) | (9,070 | ) | |||
Total deferred tax liabilities | $ | (33,988 | ) | $ | (48,070 | ) | |
Net deferred tax liabilities | $ | (25,210 | ) | $ | (35,632 | ) | |
The ultimate realization of deferred tax assets is dependent upon the generation of future taxable income during the periods in which those temporary differences become deductible. The Company must consider all positive and negative evidence, including the Company's forecasts of taxable income over the applicable carryforward periods, its current financial performance, its market environment, and other factors in evaluating the need for a full or partial valuation allowance against its net U.S. deferred tax assets. Based on the available objective evidence, management believes it is more likely than not that the domestic net deferred tax assets will not be realizable in the foreseeable future. Accordingly, the Company has provided a full valuation allowance against its domestic deferred tax assets, net of deferred tax liabilities, as of December 31, 2016 and December 26, 2015.
96
INFINERA CORPORATION
NOTES TO CONSOLIDATED FINANCIAL STATEMENTS—(Continued)
To the extent that the Company determines that deferred tax assets are realizable on a more likely than not basis, and adjustment is needed, that adjustment will be recorded in the period that the determination is made and would generally decrease the valuation allowance and record a corresponding benefit to earnings.
As of December 31, 2016, the Company has net operating loss carryforwards of approximately $205.9 million for federal tax purposes and $104.0 million for state tax purposes. The carryforward balance reflects expected utilization of both federal and state net operating losses for the year ended December 31, 2016. Federal net operating loss carryforwards will begin to expire in 2025 while certain unutilized California losses have expired in 2016. Additionally, the Company has federal and California research and development credits available to reduce future income taxes payable of approximately $35.0 million and $39.4 million, respectively, as of December 31, 2016. Infinera Canada Inc., an indirect wholly owned subsidiary, has Scientific Research and Experimental Development Expenditures (“SRED”) credits available of $2.2 million to offset future Canadian income tax payable as of December 31, 2016. The federal research credits will begin to expire in the year 2022 if not utilized and the California research credits have no expiration date. Canadian SRED credits will begin to expire in the year 2030 if not fully utilized.
On March 30, 2016, FASB issued Accounting Standards Update 2016-09, which the Company early adopted as of June 26, 2016. As a result of the adoption of ASU 2016-09, excess windfall tax benefits and tax deficiencies related to our stock option exercises and RSU vestings are recognized as an income tax benefit or expense in our condensed consolidated statements of operations. The adoption of ASU 2016-09 did not have any material impact on our income tax expense for the year ended December 31, 2016 due primarily to our valuation allowance position.
Under the Tax Reform Act of 1986, the amount of benefit from net operating loss and tax credit carryforwards may be impaired or limited in certain circumstances. Events which cause limitations in the amount of net operating losses that the Company may utilize in any one year include, but are not limited to, a cumulative ownership change of more than 50 percent as defined over a three-year testing period. As of December 31, 2016, the Company had determined that while ownership changes had occurred in the past, the resulting limitations were not significant enough to impact the utilization of the tax attributes against its taxable profits earned to date.
The Company’s policy with respect to its undistributed foreign subsidiaries’ earnings is to consider those earnings to be indefinitely reinvested and, accordingly, no related provision for U.S. federal and state income taxes has been provided. Upon distribution of those earnings in the form of dividends or otherwise, the Company may be subject to both U.S. income taxes (subject to an adjustment for foreign tax credits) and withholding taxes in the various foreign countries. At December 31, 2016, the undistributed earnings approximated $28.5 million. The future tax consequence of the remittance of these earnings is negligible because of the significant net operating loss carryforwards for U.S. and state purposes and full valuation allowance provided against such carryforwards.
The aggregate changes in the balance of gross unrecognized tax benefits were as follows (in thousands):
December 31, 2016 | December 26, 2015 | December 27, 2014 | |||||||||
Beginning balance | $ | 19,130 | $ | 16,978 | $ | 15,148 | |||||
Tax position related to current year | |||||||||||
Additions | 2,548 | 2,891 | 1,990 | ||||||||
Tax positions related to prior years | |||||||||||
Additions | 1,292 | — | 140 | ||||||||
Reductions | — | (497 | ) | (76 | ) | ||||||
Lapses of statute of limitations | (688 | ) | (242 | ) | (224 | ) | |||||
Ending balance | $ | 22,282 | $ | 19,130 | $ | 16,978 | |||||
97
INFINERA CORPORATION
NOTES TO CONSOLIDATED FINANCIAL STATEMENTS—(Continued)
As of December 31, 2016, the cumulative unrecognized tax benefit was $22.3 million, of which $20.0 million was netted against deferred tax assets, which would have otherwise been subjected with a full valuation allowance. Of the total unrecognized tax benefit as of December 31, 2016, approximately $2.3 million, if recognized, would impact the Company’s effective tax rate.
As of December 31, 2016, December 26, 2015 and December 27, 2014, the Company had $0.5 million, $0.5 million and $0.4 million, respectively, of accrued interest or penalties related to unrecognized tax benefits, of which less than $0.2 million was included in the Company’s provision for income taxes in each of the years ended December 31, 2016, December 26, 2015 and December 27, 2014, respectively.
The Company’s policy is to include interest and penalties related to unrecognized tax benefits within the Company’s provision for income taxes.
The Company is potentially subject to examination by the Internal Revenue Service and the relevant state income taxing authorities under the statute of limitations for years 2002 and forward.
The Company has received assessments of tax resulting from transfer pricing examinations in India for all but two years in the range of fiscal years ending March 2005 through March 2014. While some of the assessment years have been settled with no change from the original tax return position, the Company intends to appeal all remaining assessment years, and does not expect a significant adjustment to unrecognized tax benefits as a result of these inquiries. The Company believes that the resolution of these disputed issues will not have a material impact on our financial statements.
The Company does not currently believe there to be a reasonable possibility of a significant change in total unrecognized tax benefits that would occur within the next 12 months and, as such, amounts are classified as other long-term liabilities on the accompanying consolidated balance sheets as of December 31, 2016.
16. | Segment Information |
Operating segments are defined as components of an enterprise about which separate financial information is available that is evaluated regularly by the chief operating decision maker, or decision making group, in deciding how to allocate resources and in assessing performance. The Company’s chief operating decision maker is the Company’s Chief Executive Officer ("CEO"). The Company’s CEO reviews financial information presented on a consolidated basis, accompanied by information about revenue by geographic region for purposes of allocating resources and evaluating financial performance. The Company has one business activity as a provider of optical transport networking equipment, software and services. Accordingly, the Company is considered to be in a single reporting segment and operating unit structure.
Revenue by geographic region is based on the shipping address of the customer. The following tables set forth revenue and long-lived assets by geographic region (in thousands):
Revenue
Years Ended | |||||||||||
December 31, 2016 | December 26, 2015 | December 27, 2014 | |||||||||
Americas: | |||||||||||
United States | $ | 541,889 | $ | 602,433 | $ | 476,172 | |||||
Other Americas | 40,036 | 65,075 | 34,379 | ||||||||
$ | 581,925 | $ | 667,508 | $ | 510,551 | ||||||
Europe, Middle East and Africa | 243,783 | 174,380 | 132,271 | ||||||||
Asia Pacific and Japan | 44,427 | 44,826 | 25,257 | ||||||||
Total revenue | $ | 870,135 | $ | 886,714 | $ | 668,079 | |||||
98
INFINERA CORPORATION
NOTES TO CONSOLIDATED FINANCIAL STATEMENTS—(Continued)
Property, plant and equipment, net
December 31, 2016 | December 26, 2015 | ||||||
United States | $ | 117,715 | $ | 102,702 | |||
Other Americas | 218 | 173 | |||||
117,933 | 102,875 | ||||||
Europe, Middle East and Africa | 3,822 | 5,417 | |||||
Asia Pacific and Japan | 3,045 | 2,569 | |||||
Total property, plant and equipment, net | $ | 124,800 | $ | 110,861 | |||
17. | Employee Benefit Plan |
Defined Contribution Plans
The Company has established a savings plan under Section 401(k) of the Internal Revenue Code (the “401(k) Plan”). As allowed under Section 401(k) of the Internal Revenue Code, the 401(k) Plan provides tax-deferred salary contributions for eligible U.S. employees. Employee contributions are limited to a maximum annual amount as set periodically by the Internal Revenue Code. The Company made voluntary cash contributions and matched a portion of employee contributions of $2.1 million and $1.7 million for 2016 and 2015, respectively. Expenses related to the 401(k) Plan were insignificant for 2016, 2015 and 2014.
In connection with the Company's acquisition of Transmode during the third quarter of 2015, the Company has an ITP pension plan covering its Swedish employees. Commitments for old-age and survivors' pension for salaried employees in Sweden are vested through an insurance policy. Expenses related to the ITP pension plan were $2.6 million for 2016 and $0.8 million from the Acquisition Date through December 26, 2015.
The Company also provides defined contribution plans in certain foreign countries where required by local statute or at the Company's discretion.
99
INFINERA CORPORATION
NOTES TO CONSOLIDATED FINANCIAL STATEMENTS—(Continued)
18. | Financial Information by Quarter (Unaudited) |
The following table sets forth the Company’s unaudited quarterly consolidated statements of operations data for 2016 and 2015. The data has been prepared on the same basis as the audited consolidated financial statements and related notes included in this report. The table includes all necessary adjustments, consisting only of normal recurring adjustments that the Company considers necessary for a fair presentation of this data.
For the Three Months Ended (Unaudited) | |||||||||||||||||||||||||||||||
2016 | 2015 | ||||||||||||||||||||||||||||||
Dec. 31 | Sep. 24 | Jun. 25 | Mar. 26 | Dec. 26 | Sep. 26 | Jun. 27 | Mar. 28 | ||||||||||||||||||||||||
(In thousands, except per share data) | |||||||||||||||||||||||||||||||
Revenue: | |||||||||||||||||||||||||||||||
Product | $ | 151,365 | $ | 156,188 | $ | 227,532 | $ | 216,082 | $ | 227,040 | $ | 202,365 | $ | 178,982 | $ | 160,843 | |||||||||||||||
Services | 29,678 | 29,264 | 31,290 | 28,736 | 32,994 | 30,107 | 28,364 | 26,019 | |||||||||||||||||||||||
Total revenue | 181,043 | 185,452 | 258,822 | 244,818 | 260,034 | 232,472 | 207,346 | 186,862 | |||||||||||||||||||||||
Cost of revenue: | |||||||||||||||||||||||||||||||
Cost of product | 101,702 | 91,064 | 122,438 | 118,062 | 130,765 | 117,154 | 99,491 | 89,506 | |||||||||||||||||||||||
Cost of services | 10,309 | 9,786 | 12,638 | 10,418 | 13,505 | 12,513 | 11,059 | 9,244 | |||||||||||||||||||||||
Total cost of revenue | 112,011 | 100,850 | 135,076 | 128,480 | 144,270 | 129,667 | 110,550 | 98,750 | |||||||||||||||||||||||
Gross profit | 69,032 | 84,602 | 123,746 | 116,338 | 115,764 | 102,805 | 96,796 | 88,112 | |||||||||||||||||||||||
Operating expenses | 114,900 | 95,461 | 107,664 | 101,467 | 101,975 | 88,545 | 80,266 | 72,955 | |||||||||||||||||||||||
Income (loss) from operations | (45,868 | ) | (10,859 | ) | 16,082 | 14,871 | 13,789 | 14,260 | 16,530 | 15,157 | |||||||||||||||||||||
Other income (expense), net | 5,589 | (2,854 | ) | (3,295 | ) | (2,847 | ) | (2,013 | ) | (5,901 | ) | 2,384 | (2,175 | ) | |||||||||||||||||
Income (loss) before income taxes | (40,279 | ) | (13,713 | ) | 12,787 | 12,024 | 11,776 | 8,359 | 18,914 | 12,982 | |||||||||||||||||||||
Provision for (benefit from) income taxes | (4,026 | ) | (2,416 | ) | 1,475 | 216 | (392 | ) | (151 | ) | 1,008 | 616 | |||||||||||||||||||
Net income (loss) | $ | (36,253 | ) | $ | (11,297 | ) | $ | 11,312 | $ | 11,808 | $ | 12,168 | $ | 8,510 | $ | 17,906 | $ | 12,366 | |||||||||||||
Less: Net loss attributable to noncontrolling interest | — | (125 | ) | (171 | ) | (207 | ) | (463 | ) | — | — | — | |||||||||||||||||||
Net income (loss) attributable to Infinera Corporation | $ | (36,253 | ) | $ | (11,172 | ) | $ | 11,483 | $ | 12,015 | $ | 12,631 | $ | 8,510 | $ | 17,906 | $ | 12,366 | |||||||||||||
Net income (loss) per common share attributable to Infinera Corporation | |||||||||||||||||||||||||||||||
Basic | $ | (0.25 | ) | $ | (0.08 | ) | $ | 0.08 | $ | 0.09 | $ | 0.09 | $ | 0.06 | $ | 0.14 | $ | 0.10 | |||||||||||||
Diluted | $ | (0.25 | ) | $ | (0.08 | ) | $ | 0.08 | $ | 0.08 | $ | 0.08 | $ | 0.06 | $ | 0.13 | $ | 0.09 | |||||||||||||
The Company operates and reports financial results on a fiscal year of 52 or 53 weeks ending on the last Saturday of December in each year. Accordingly, fiscal year 2016 was a 53-week year that ended on December 31, 2016, and fiscal year 2015 was a 52-week year that ended on December 26, 2015 . The quarters for fiscal years 2016 and 2015 were 14-week and 13-week quarters, respectively.
During the third quarter of 2015, the Company completed its public offer to the shareholders of Transmode, acquiring 95.8% of the outstanding common shares and voting interest in Transmode. This acquisition was accounted for as a business combination, and accordingly, the Company has consolidated the financial results of Transmode with its financial results since the Acquisition Date.
During the fourth quarter of 2016, the Company recorded an impairment charge of $11.3 million related to in-process research and development, resulting from the Company's decision to abandon previously acquired in-process technologies. Additionally, during the same period, the Company recognized a gain of $9.0 million on the sale of a cost-method investment.
100
ITEM 9. | CHANGES IN AND DISAGREEMENTS WITH ACCOUNTANTS ON ACCOUNTING AND FINANCIAL DISCLOSURE |
None.
ITEM 9A. | CONTROLS AND PROCEDURES |
Attached as exhibits to this Form 10-K are certifications of our Chief Executive Officer (“CEO”) and Chief Financial Officer (“CFO”), which are required in accordance with Rule 13a-14 of the Exchange Act. This “Controls and Procedures” section includes information concerning the internal controls and controls evaluation referred to in the certifications.
Evaluation of Disclosure Controls and Procedures
An evaluation was performed by our management, with the participation of our CEO and our CFO, of the effectiveness of our disclosure controls and procedures (as defined in Rules 13a-15(e) and 15d -15(e) under the Exchange Act). Disclosure controls and procedures are designed to ensure that information required to be disclosed in our reports filed or submitted under the Exchange Act is recorded, processed, summarized and reported within the time periods specified in the SEC’s rules and forms and that such information is accumulated and communicated to management, including our CEO and CFO, as appropriate, to allow timely decisions regarding required disclosure. Based on this evaluation, our CEO and CFO concluded that, as of December 31, 2016, our disclosure controls and procedures are effective.
Inherent Limitations on Effectiveness of Controls
The Company's management, including the CEO and CFO, does not expect that our disclosure controls or our internal controls over financial reporting will prevent or detect all errors and all fraud. A control system, no matter how well designed and operated, can provide only reasonable, not absolute, assurance that the control system’s objectives will be met. The design of a control system must reflect the fact that there are resource constraints, and the benefits of controls must be considered relative to their costs. Further, because of the inherent limitations in all control systems, no evaluation of controls can provide absolute assurance that misstatements due to error or fraud will not occur or that all control issues and instances of fraud, if any, have been detected. The design of any system of controls is based in part on certain assumptions about the likelihood of future events, and there can be no assurance that any design will succeed in achieving its stated goals under all potential future conditions. Projections of any evaluation of the effectiveness of controls to future periods are subject to risks. Over time, controls may become inadequate because of changes in business conditions or deterioration in the degree of compliance with policies or procedures.
Changes in Internal Control over Financial Reporting
During the fourth quarter of fiscal 2016, there were no changes in the Company’s internal control over financial reporting that have materially affected, or are reasonably likely to materially affect, the Company’s internal control over financial reporting.
Management’s Report on Internal Control Over Financial Reporting
The Company's management, with the participation of our CEO and CFO, is responsible for establishing and maintaining adequate internal control over financial reporting (as defined in Rules 13a-15(f) and 15d-15(f) under the Exchange Act) to provide reasonable assurance regarding the reliability of our financial reporting and the preparation of financial statements for external purposes in accordance with U.S. GAAP.
Management assessed the effectiveness of our internal control over financial reporting as of December 31, 2016, the end of our fiscal year. Management based its assessment on the framework established in the 2013 Internal Control - Integrated Framework issued by the Committee of Sponsoring Organizations of the Treadway Commission (“2013 COSO framework”). Management’s assessment included evaluation of elements such as the design and operating effectiveness of key financial reporting controls, process documentation, accounting policies, and our overall control environment. This assessment is supported by testing and monitoring performed by our internal audit and finance personnel utilizing the 2013 COSO framework.
101
Based on our assessment, management has concluded that our internal control over financial reporting was effective as of the end of our fiscal year 2016 to provide reasonable assurance regarding the reliability of financial reporting and the preparation of financial statements for external reporting purposes in accordance with U.S. generally accepted accounting principles.
The effectiveness of our internal control over financial reporting as of the end of fiscal year 2016 has been audited by Ernst & Young, LLP, an independent registered public accounting firm, as stated in their report which is included elsewhere herein.
ITEM 9B. | OTHER INFORMATION |
None.
102
PART III
ITEM 10. DIRECTORS, EXECUTIVE OFFICERS AND CORPORATE GOVERNANCE
Information responsive to this item is incorporated herein by reference to our definitive proxy statement with respect to our 2017 Annual Meeting of Stockholders to be filed with the SEC within 120 days after the end of the fiscal year covered by this Annual Report on Form 10-K. For information pertaining to our executive offers, refer to the section entitled “Executive Officers” in Part 1, Item 1 of this Annual Report on Form 10-K.
As part of our system of corporate governance, our board of directors has adopted a code of business conduct and ethics. The code applies to all of our employees, officers (including our principal executive officer, principal financial officer, principal accounting officer or controller, or persons performing similar functions), agents and representatives, including our independent directors and consultants, who are not employees of Infinera, with regard to their Infinera-related activities. The full text of our code of business conduct and ethics is posted on our web site at http://www.infinera.com. We intend to disclose future amendments to certain provisions of our code of business conduct and ethics, or waivers of such provisions, applicable to any principal executive officer, principal financial officer, principal accounting officer or controller, or persons performing similar functions or our directors on our web site identified above. The inclusion of our web site address in this report does not include or incorporate by reference the information on our web site into this report.
ITEM 11. | EXECUTIVE COMPENSATION |
Information responsive to this item is incorporated herein by reference to our definitive proxy statement with respect to our 2017 Annual Meeting of Stockholders to be filed with the SEC within 120 days after the end of the fiscal year covered by this Annual Report on Form 10-K.
ITEM 12. | SECURITY OWNERSHIP OF CERTAIN BENEFICIAL OWNERS AND MANAGEMENT AND RELATED STOCKHOLDER MATTERS |
Information responsive to this item is incorporated herein by reference to our definitive proxy statement with respect to our 2017 Annual Meeting of Stockholders to be filed with the SEC within 120 days after the end of the fiscal year covered by this Annual Report on Form 10-K.
ITEM 13. | CERTAIN RELATIONSHIPS AND RELATED TRANSACTIONS, AND DIRECTOR INDEPENDENCE |
Information responsive to this item is incorporated herein by reference to our definitive proxy statement with respect to our 2017 Annual Meeting of Stockholders to be filed with the SEC within 120 days after the end of the fiscal year covered by this Annual Report on Form 10-K.
ITEM 14. | PRINCIPAL ACCOUNTING FEES AND SERVICES |
Information responsive to this item is incorporated herein by reference to our definitive proxy statement with respect to our 2017 Annual Meeting of Stockholders to be filed with the SEC within 120 days after the end of the fiscal year covered by this Annual Report on Form 10-K.
103
PART IV
ITEM 15. | EXHIBITS, FINANCIAL STATEMENT SCHEDULES |
(a)(1) Consolidated Financial Statements
This Annual Report on Form 10-K contains the following financial statements which appear under Part II, Item 8 of this Form 10-K on the pages noted below:
Page | |
Reports of Ernst & Young LLP, Independent Registered Public Accounting Firm | |
Consolidated Balance Sheets | |
Consolidated Statements of Operations | |
Consolidated Statement of Comprehensive Income (Loss) | |
Consolidated Statements of Stockholders’ Equity | |
Consolidated Statements of Cash Flows | |
Notes to Consolidated Financial Statements | |
(a)(2) Financial Statement Schedule
Schedule II: Valuation and Qualifying Accounts
Years Ended | |||||||||||
December 31, 2016 | December 26, 2015 | December 27, 2014 | |||||||||
(In thousands) | |||||||||||
Deferred tax asset, valuation allowance | |||||||||||
Beginning balance | $ | 169,240 | $ | 199,698 | $ | 202,747 | |||||
Additions | 31,913 | 15,266 | 17,276 | ||||||||
Reductions | (677 | ) | (45,724 | ) | (20,325 | ) | |||||
Ending balance | $ | 200,476 | $ | 169,240 | $ | 199,698 | |||||
Allowance for doubtful accounts | |||||||||||
Beginning balance | $ | 630 | $ | 38 | $ | 43 | |||||
Additions | 772 | 657 | 18 | ||||||||
Reductions | (630 | ) | (65 | ) | (23 | ) | |||||
Ending balance | $ | 772 | $ | 630 | $ | 38 | |||||
Schedules not listed above have been omitted because the information required to be set forth therein is not applicable or is shown in the consolidated financial statements or notes thereto.
(a)(3) Exhibits.
See Index to Exhibits. The Exhibits listed in the accompanying Index to Exhibits are filed or incorporated by reference as part of this Annual Report on Form 10-K.
104
INDEX TO EXHIBITS
Exhibit No. | Description | |
3.1 | Amended and Restated Certificate of Incorporation, incorporated herein by reference to Exhibit 3.1 of the Registrant’s Current Report on Form 8-K (No. 001-33486), filed with the SEC on June 12, 2007. | |
3.2 | Amended and Restated Bylaws, incorporated herein by reference to Exhibit 3.1 of the Registrant’s Current Report on Form 8-K (No. 001-33486), filed with the SEC on February 29, 2016. | |
4.1 | Form of Common Stock Certificate, incorporated herein by reference to Exhibit 4.1 of the Registrant’s Form S-1/A (No. 333-140876), filed with the SEC on April 27, 2007. | |
4.2 | Indenture dated May 30, 2013, between the Registrant and U.S. Bank National Association, as trustee, incorporated herein by reference to Exhibit 4.1 of the Registrant’s Current Report on Form 8-K (No. 001-33486), filed with the SEC on May 30, 2013. | |
10.1* | Form of Indemnification Agreement between Registrant and each of its directors and executive officers, incorporated herein by reference to Exhibit 10.1 of the Registrant’s Form S-1 (No. 333-140876), filed with the SEC on February 26, 2007. | |
10.2* | 2000 Stock Plan, as amended, and forms of stock option agreements thereunder, incorporated herein by reference to Exhibit 10.2 of the Registrant’s Form S-1 (No. 333-140876), filed with the SEC on February 26, 2007. | |
10.3* | 2007 Equity Incentive Plan, incorporated herein by reference to Exhibit 10.3 of the Registrant’s Annual Report on Form 10-K (No. 001-33486), filed with the SEC on February 18, 2015. | |
10.4* | Infinera Corporation 2007 Employee Stock Purchase Plan. | |
10.5* | Form of 2007 Employee Stock Purchase Plan Subscription Agreement, incorporated herein by reference to Exhibit 10.2 of the Registrant's Current Report on Form 8-K (no. 001-33486), filed with the SEC on May 20, 2014. | |
10.6* | Bonus Plan, incorporated by reference herein to Exhibit 10.1 of the Registrant’s Current Report on 8-K (No. 001-33486), filed with the SEC on February 14, 2011. | |
10.7* | Form of Section 16 Officer Restricted Stock Unit Agreement under the 2007 Equity Incentive Plan, incorporated herein by reference to Exhibit 10.7 of the Registrant’s Annual Report on Form 10-K (No. 001-33486), filed with the SEC on February 18, 2015. | |
10.8* | Form of Section 16 Officer Performance Share Agreement under the 2007 Equity Incentive Plan, incorporated herein by reference to Exhibit 10.8 of the Registrant’s Annual Report on Form 10-K (No. 001-33486), filed with the SEC on February 18, 2015. | |
10.9* | Form of Director Restricted Stock Unit Agreement under the 2007 Equity Incentive Plan, incorporated herein by reference to Exhibit 10.9 of the Registrant’s Annual Report on Form 10-K (No. 001-33486), filed with the SEC on February 18, 2015. | |
10.10* | Form of Stock Option Agreement under the 2007 Equity Incentive Plan, incorporated herein by reference to Exhibit 10.1 of the Registrant’s Quarterly Report on Form 10-Q (No. 001-33486), filed with the SEC on May 5, 2010. | |
10.11* | Form of CEO Amended and Restated Change of Control Severance Agreement, incorporated herein by reference to Exhibit 10.10 of the Registrant’s Annual Report on Form 10-K (No. 001-33486), filed with the SEC on March 5, 2013. | |
10.12* | Form of Section 16 Officer Amended and Restated Change of Control Severance Agreement, incorporated herein by reference to Exhibit 10.11 of the Registrant’s Annual Report on Form 10-K (No. 001-33486), filed with the SEC on March 5, 2013. | |
10.13* | Executive Clawback Policy, incorporated herein by reference to Exhibit 10.2 of the Registrant’s Current Report on Form 8-K (No. 001-33486), filed with the SEC on January 17, 2013. | |
10.14 | Purchase Agreement dated May 23, 2013, between the Registrant and Morgan Stanley and Co. LLC and Goldman, Sachs & Co., as representatives of the initial purchasers, incorporated herein by reference to Exhibit 10.1 of the Registrant’s Current Report on Form 8-K (No. 001-33486), filed with the SEC on May 24, 2013. | |
10.15* | Executive Severance Policy, incorporated herein by reference to Exhibit 10.19 of the Registrant’s Annual Report on Form 10-K (No. 001-33486), filed with the SEC on February 18, 2015. | |
10.16* | Infinera Corporation 2016 Equity Incentive Plan, incorporated herein by reference to Exhibit 10.1 of the Registrant’s Current Report on Form 8-K (No. 001-33486), filed with the SEC on May 17, 2016. | |
105
Exhibit No. | Description | |
10.17* | Form of Notice of Grant of Restricted Stock Units under the 2016 Equity Incentive Plan, incorporated herein by reference to Exhibit 10.2 of the Registrant’s Current Report on Form 8-K (No. 001-33486), filed with the SEC on May 17, 2016. | |
10.18* | Form of Notice of Grant of Restricted Stock Units for Directors under the 2016 Equity Incentive Plan, incorporated herein by reference to Exhibit 10.3 of the Registrant’s Current Report on Form 8-K (No. 001-33486), filed with the SEC on May 17, 2016. | |
10.19* | Form of Notice of Grant of Performance Shares under the 2016 Equity Incentive Plan, incorporated herein by reference to Exhibit 10.4 of the Registrant’s Current Report on Form 8-K (No. 001-33486), filed with the SEC on May 17, 2016. | |
21.1 | Subsidiaries. | |
23.1 | Consent of Ernst & Young LLP, Independent Registered Public Accounting Firm. | |
31.1 | Certification of Chief Executive Officer pursuant to Rule 13a-14(a) and Rule 15d-14(a) of the Securities Exchange Act of 1934, as amended, as adopted pursuant to Section 302 of the Sarbanes-Oxley Act of 2002. | |
31.2 | Certification of Chief Financial Officer pursuant to Rule 13a-14(a) and Rule 15d-14(a) of the Securities Exchange Act of 1934, as amended, as adopted pursuant to Section 302 of the Sarbanes-Oxley Act of 2002. | |
32.1** | Certification of Chief Executive Officer pursuant to 18 U.S.C. Section 1350, as adopted pursuant to Section 906 of the Sarbanes-Oxley Act of 2002. | |
32.2** | Certification of Chief Financial Officer pursuant to 18 U.S.C. Section 1350, as adopted pursuant to Section 906 of the Sarbanes-Oxley Act of 2002. | |
101.INS | XBRL Instance Document | |
101.SCH | XBRL Taxonomy Extension Schema Document | |
101.CAL | XBRL Taxonomy Extension Calculation Linkbase Document | |
101.DEF | XBRL Taxonomy Extension Definition Linkbase Document | |
101.LAB | XBRL Taxonomy Extension Label Linkbase Document | |
101.PRE | XBRL Taxonomy Extension Presentation Linkbase Document | |
* | Management contracts or compensation plans or arrangements in which directors or executive officers are eligible to participate. |
** | This exhibit shall not be deemed “filed” for purposes of Section 18 of the Securities Exchange Act of 1934 or otherwise subject to the liabilities of that section, nor shall it be deemed incorporated by reference in any filings under the Securities Act of 1933 or the Securities Act of 1934, whether made before or after the date hereof and irrespective of any general incorporation language in any filings. |
106
SIGNATURES
Pursuant to the requirements of Section 13 or 15(d) of the Securities Exchange Act of 1934, the Registrant has duly caused this report to be signed on its behalf by the undersigned, thereunto duly authorized.
Dated: February 23, 2017
Infinera Corporation | |||
By: | /s/ BRAD D. FELLER | ||
Brad D. Feller Chief Financial Officer Principal Financial and Accounting Officer | |||
KNOW ALL PERSONS BY THESE PRESENTS, that each person whose signature appears below constitutes and appoints Thomas J. Fallon and Brad D. Feller, and each of them individually, his or her attorneys-in-fact, each with the power of substitution, for him or her in any and all capacities, to sign any amendments to this Annual Report on Form 10-K, and to file the same, with exhibits thereto and other documents in connection therewith, with the Securities and Exchange Commission, hereby ratifying and confirming all that each of said attorneys-in-fact, or his substitute or substitutes, may do or cause to be done by virtue hereof.
107
Pursuant to the requirements of the Securities Exchange Act of 1934, this report has been signed below by the following persons on behalf of the Registrant and in the capacities and on the dates indicated.
Name and Signature | Title | Date |
/s/ THOMAS J. FALLON | Chief Executive Officer and Director and Principal Executive Officer | February 23, 2017 |
Thomas J. Fallon | ||
/s/ BRAD D. FELLER | Chief Financial Officer, Principal Financial and Accounting Officer | February 23, 2017 |
Brad D. Feller | ||
/s/ DAVID F. WELCH, PH.D. | Co-founder, President and Director | February 23, 2017 |
David F. Welch, Ph.D. | ||
/s/ KAMBIZ Y. HOOSHMAND | Chairman of the Board | February 23, 2017 |
Kambiz Y. Hooshmand | ||
/s/ JOHN P. DAANE | Director | February 23, 2017 |
John P. Daane | ||
/s/ MARCEL GANI | Director | February 23, 2017 |
Marcel Gani | ||
/s/ PAUL J. MILBURY | Director | February 23, 2017 |
Paul J. Milbury | ||
/s/ RAJAL M. PATEL | Director | February 23, 2017 |
Rajal M. Patel | ||
/s/ MARK A. WEGLEITNER | Director | February 23, 2017 |
Mark A. Wegleitner | ||
108