Attached files
| file | filename |
|---|---|
| EX-32.2 - EXHIBIT 32.2 - BROADSOFT, INC. | bsft-20161231x10kxexx322.htm |
| EX-32.1 - EXHIBIT 32.1 - BROADSOFT, INC. | bsft-20161231x10kxexx321.htm |
| EX-31.2 - EXHIBIT 31.2 - BROADSOFT, INC. | bsft-20161231x10kxexx312.htm |
| EX-31.1 - EXHIBIT 31.1 - BROADSOFT, INC. | bsft-20161231x10kxexx311.htm |
| EX-23.1 - EXHIBIT 23.1 - BROADSOFT, INC. | bsft-20161231x10kxexx231.htm |
| EX-21.1 - EXHIBIT 21.1 - BROADSOFT, INC. | bsft-20161231x10kxexx211.htm |
| EX-10.12 - EXHIBIT 10.12 - BROADSOFT, INC. | bsft-20161231x10kxexx1012.htm |
| EX-10.11 - EXHIBIT 10.11 - BROADSOFT, INC. | bsft-20161231x10kxexx1011.htm |
UNITED STATES
SECURITIES AND EXCHANGE COMMISSION
WASHINGTON, D.C. 20549
______________________________________________
FORM 10-K
______________________________________________
(Mark One)
ý | ANNUAL REPORT PURSUANT TO SECTION 13 OR 15(d) OF THE SECURITIES EXCHANGE ACT OF 1934 |
For the Year Ended December 31, 2016
or
¨ | TRANSITION REPORT PURSUANT TO SECTION 13 OR 15(d) OF THE SECURITIES EXCHANGE ACT OF 1934 |
Commission file number 001-34777
______________________________________________
BroadSoft, Inc.
(Exact name of registrant as specified in its charter)
______________________________________________
Delaware | 52 2130962 |
(State or other jurisdiction of incorporation or organization) | (I.R.S. Employer Identification No.) |
9737 Washingtonian Boulevard, Suite 350, Gaithersburg, MD | 20878 |
(Address of principal executive offices) | (Zip Code) |
(301) 977-9440
Registrant’s telephone number, including area code:
(former name, former address and former fiscal year, if changed since last report)
______________________________________________
Securities Registered Pursuant to Section 12(b) of the Act
Title of Each Class | Name of Each Exchange on Which Registered |
Common Stock, $0.01 par value | NASDAQ Stock Market, LLC |
Securities Registered Pursuant to Section 12(g) of the Act: None
______________________________________________
Indicate by check mark if the registrant is a well-known seasoned issuer, as defined in Rule 405 of the Securities Act. Yes ý No ¨
Indicate by check mark if the registrant is not required to file reports pursuant to Section 13 or Section 15(d) of the Act. Yes ¨ No ý
Indicate by check mark whether the registrant (1) has filed all reports required to be filed by Section 13 or 15(d) of the Securities Exchange Act of 1934 during the preceding 12 months (or for such shorter period that the registrant was required to file such reports), and (2) has been subject to such filing requirements for the past 90 days. Yes ý No ¨
Indicate by check mark whether the registrant has submitted electronically and posted on its corporate Web site, if any, every Interactive Data File required to be submitted and posted pursuant to Rule 405 of Regulation S-T (§ 232.405 of this chapter) during the preceding 12 months (or for such shorter period that the registrant was required to submit and post such files). Yes ý No ¨
Indicate by check mark if disclosure of delinquent filers pursuant to Item 405 of Regulation S-K (§ 229.405 of this chapter) is not contained herein, and will not be contained, to the best of registrant’s knowledge, in definitive proxy or information statements incorporated by reference in Part III of this Form 10-K or any amendment to this Form 10-K. ý
Indicate by check mark whether the registrant is a large accelerated filer, an accelerated filer, a non-accelerated filer, or a smaller reporting company. See definitions of “large accelerated filer,” “accelerated filer” and “smaller reporting company” in Rule 12b-2 of the Exchange Act. (Check one):
Large accelerated filer | ý | Accelerated filer | ¨ |
Non-accelerated filer | ¨ (Do not check if a smaller reporting company) | Smaller Reporting Company | ¨ |
Indicate by check mark whether the registrant is a shell company (as defined in Rule 12b-2 of the Exchange Act). Yes ¨ No ý
The aggregate market value of the voting and non-voting common equity held by non-affiliates computed by reference to the price at which the common equity was last sold as of June 30, 2016 was $1,194,829,173.
The number of shares of the registrant’s common stock, par value $0.01 per share, outstanding as of February 20, 2017 was 30,472,084.
DOCUMENTS INCORPORATED BY REFERENCE
Portions of the registrant’s definitive proxy statement for its 2017 annual meeting of stockholders to be filed pursuant to Regulation 14A with the Securities and Exchange Commission not later than 120 days after the registrant’s fiscal year ended December 31, 2016, are incorporated by reference into Part III of this Form 10-K.
TABLE OF CONTENTS
PART I | ||
Item 1. | ||
Item 1A. | ||
Item 1B. | ||
Item 2. | ||
Item 3. | ||
Item 4. | ||
PART II | ||
Item 5. | ||
Item 6. | ||
Item 7. | ||
Item 7A. | ||
Item 8. | ||
Item 9. | ||
Item 9A. | ||
Item 9B. | ||
PART III | ||
Item 10. | ||
Item 11. | ||
Item 12. | ||
Item 13. | ||
Item 14. | ||
PART IV | ||
Item 15. | ||
Item 16. | ||
Exhibit Index | ||
i
Forward-Looking Statements
This Annual Report on Form 10-K contains forward-looking statements, within the meaning of the Private Securities Litigation Reform Act of 1995, that involve substantial risks and uncertainties. All statements other than statements of historical facts contained in this Annual Report on Form 10-K are forward-looking statements. In some cases, you can identify forward-looking statements by terminology such as “believe,” “will,” “may,” “estimate,” “continue,” “anticipate,” “intend,” “should,” “plan,” “expect,” “predict,” “could,” “potentially” or the negative of these terms or other similar expressions. Forward-looking statements in this Annual Report on Form 10-K may include statements about:
• | our dependence on the success of BroadWorks; |
• | our ability to continue to develop, and to successfully deploy, our BroadCloud SaaS offering, expand this offering geographically and increase the associated recurring service revenue; |
• | any potential loss of or reductions in orders from certain significant customers; |
• | our dependence on our service provider customers to sell services using our applications; |
• | claims that we infringe the intellectual property rights of others; |
• | our ability to protect our intellectual property; |
• | competitive factors, including, but not limited to, industry consolidation, entry of new competitors into our market, and new product and marketing initiatives by our competitors; |
• | our ability to predict our revenue, operating results and gross margin accurately; |
• | the length and unpredictability of our sales cycles; |
• | our ability to expand our product offerings; |
• | our international operations, including foreign currency exchange risk, financial markets risk as well as changes in global trade agreements; |
• | our significant reliance on distribution partners in certain international markets; |
• | our ability to manage our growth, including our increased headcount; |
• | the attraction and retention of qualified employees and key personnel; |
• | the interoperability of our products with service provider networks; |
• | our ability to realize the benefits of our recent acquisitions and the successful integration of the personnel, technologies, and customers from such acquisitions; |
• | the quality of our products and services, including any undetected errors or bugs in our software; and |
• | our ability to maintain proper and effective internal controls. |
The outcome of the events described in these forward-looking statements is subject to known and unknown risks, uncertainties and other factors that could cause actual results to differ materially from the results anticipated by these forward-looking statements, including those factors we discuss in the “Risk Factors” section of this Annual Report on Form 10-K and in our other filings with the Securities and Exchange Commission, or SEC. You should read these factors and the other cautionary statements made in this Annual Report on Form 10-K as being applicable to all related forward-looking statements wherever they appear in this Annual Report on Form 10-K. These risks are not exhaustive. Although we believe that the expectations reflected in the forward-looking statements are based on reasonable assumptions, we can give no assurance that we will attain these expectations or that any deviations will not be material. Except as required by law, we undertake no obligation to update publicly any forward-looking statements for any reason after the date of this Annual Report on Form 10-K to conform these statements to actual results or to changes in our expectations.
ii
PART I
Item 1. | Business |
Overview
We are the leading global provider of software and services that enable telecommunications service providers to deliver hosted, cloud-based Unified Communications, or UC, to their enterprise customers.
Traditionally, many enterprises have utilized premise-based private branch exchanges, or PBX’s, to connect their offices and people to public telephony networks. Hosted UC enables the delivery of PBX features without the need for premise-based equipment. Hosted UC can be delivered through service providers using their own internet protocol, or IP-based networks and their mobile networks, as well as over the public internet (also known as "over the top" or OTT). In addition to voice telephony, UC offers additional features such as full integration with mobile devices, high definition, or HD, voice and video calling and conferencing, instant messaging and presence, or IM&P, team collaboration and desktop sharing.
We believe we are well positioned to enable service providers to capitalize on increasing demand by enterprises for such UC services by enabling them to efficiently and cost-effectively offer a broad suite of services to their end-users. Our service provider customers, who are located in more than 80 countries, are delivering services and have deployed over 13 million UC subscriber lines worldwide using our software. We count among our customers 25 of the top 30 telecommunications service providers globally, as measured by revenue for the year ended December 31, 2015.
BroadSoft Business
Our BroadSoft Business solution is a communications and collaboration offering that enables telecommunications service providers to offer businesses and other enterprises UC features and functionalities on a cloud-delivered basis without the need for traditional premise-based PBX equipment. Our technology is designed to meet service providers’ stringent requirements for service availability, network integration and scale and to address the needs of: various business segments, such as micro, small, medium and large enterprises; market segments such as hospitality, government, education, contact centers and healthcare; and industries requiring call center functionality.
The capabilities of our BroadSoft Business offering can be accessed through desk phones, smartphones, tablets, laptops and PCs and as a result, BroadSoft Business provides full support for today’s distributed workforce and mobile employees. Our solution can also be deployed across multiple access networks and technologies, including fixed line/fiber and traditional mobile 3G networks, as well as voice over LTE, or VoLTE, networks and voice over wifi, or VoWiFi. BroadSoft Business includes our UC-One, Team-One and CC-One applications.
• | UC-One: UC-One is our suite of cloud communications and collaboration solutions that provide integrated business, such as phone services, messaging and presence, audio and video conferencing, screen sharing, file sharing and virtual meeting rooms. The features work seamlessly across devices, allowing end-users to utilize the functionalities both in the office and using mobile devices. |
• | Team-One: Team-One is our collaboration solution that allows users to chat, track notes, share files and organize projects into shareable workspaces. The Team-One solution integrates with more than 50 popular applications, including Google Drive and Salesforce. |
• | CC-One: CC-One is our contact center solution. CC-One enables enterprises to have omni-channel interactions over web, email, chat and social media with customers, while also providing integrated collaboration between call center agents and the back office through voice, chat and video. CC-One functionality also includes predictive analytics, permitting more efficient routing of calls and analysis of agent and customer behavior. |
The benefits of BroadSoft Business to enterprises and end users include:
• | Solution Breadth and Flexibility. These applications are scalable and can be used by businesses of varying sizes, from very small businesses of two employees to the largest global enterprises with hundreds of thousands of employees in multiple locations. Capacity can be purchased as needed by enterprises in response to business and operational needs. |
• | Multi-Location and Ease of Use. Because BroadSoft Business is cloud and IP-based, an enterprise can provide uniform communications functionality across its entire organization, enabling a consistent and simplified user experience. It also provides a single console to manage all the communication and collaboration needs for businesses with geographically dispersed offices and mobile workers, greatly streamlining business operations and reducing operational costs. |
1
• | Enhanced Mobility. Our solution provides the flexibility to work from the office, at home or on the move, with the full range of services available irrespective of location or end user device. |
• | Business Continuity. Because BroadSoft Business is cloud-based, in the event an enterprise has a business interruption issue, the enterprise’s core communications and collaboration services would remain unaffected. |
• | Openness. We have an active ecosystem of development partners who use our open APIs to create complementary offerings designed for specific market segments or industry verticals. |
• | Lower Total Cost of Ownership. We believe that enterprises will experience a lower total cost of ownership compared to legacy premise-based solutions. Because BroadSoft Business is cloud-based, there are significantly lower capital investment requirements, fewer highly trained personnel required and reduced costs given the inherent flexibility of per-user based costs. |
Our UC-One offering is available to service providers either as a BroadWorks software solution or as a BroadCloud software as a service, or SaaS, cloud-delivered solution. Team-One and CC-One are solely offered as SaaS cloud-delivered solutions.
Software. BroadWorks is our application server software offering, with the software generally deployed on industry-standard servers located in the service provider’s data centers. With BroadWorks implemented as an application server in its infrastructure, the service provider is responsible for the development and implementation of the overall solution and integration with the service provider’s network, operations, support and billing systems. This deployment model gives the service provider the maximum flexibility to define its UC-One offering. In this model, revenue is derived from perpetual software license and annual maintenance and support fees, as well as associated professional services. Since our inception, the majority of our revenue has been derived from such software licensing.
BroadCloud. BroadCloud is our cloud SaaS platform, providing BroadWorks and associated managed services for service providers and other customers. In this model, we have implemented UC-One and other BroadWorks capabilities, as well as Team One and Contact Center One, within our own data centers and provide operations capabilities covering sales and order management, service delivery, device provisioning, customer service and billing. We believe that through BroadCloud, service providers can accelerate their deployments of BroadSoft Business services and reduce their capital expenditures and the internal costs of implementing UC services. Generally, service providers utilizing our BroadCloud offering pay us on a monthly recurring basis based on the total number of subscriber lines the service provider has deployed. We recently made a substantial investment in our BroadCloud platform such that we now offer two deployment models: (a) a fully managed services option where billing, provisioning and direct end user support is provided by us, and (b) a platform as a service, or PaaS, option, which is BroadWorks hosted by us without the associated managed services, for those service providers wanting to deploy their own provisioning systems, customer premise equipment, telephony and user experience. This PaaS service delivery model gives service providers greater control, flexibility and customization over the services and delivery of cloud solution, at a lower price point.
Company
We were incorporated in Delaware in 1998 and we began selling BroadWorks in 2001. We sell our products to service providers both directly and indirectly through distribution partners, such as telecommunications equipment vendors, value-added resellers, or VARs, and other distributors.
Industry
Traditionally, many enterprises have used premise-based PBX’s to connect their offices and people to the public telephone network. These PBX offerings were primarily voice communications based. We believe several trends are driving enterprises of all sizes to embrace the change from premise-based to cloud-based delivery of PBX functionality:
• | The increasing demand by enterprises to move business applications to the cloud for operational savings, flexibility and expanded services; |
• | The desire by enterprises to drive greater team collaboration and workplace productivity through communications and collaboration tools; |
• | The demand by enterprises to offer broader communications services such as HD voice and video calling and conferencing across their organizations; |
• | The increasingly distributed nature of enterprises’ operations and workforces and the desire to provide fully integrated UC to them; |
• | The proliferation of mobile devices used by employees and other workers; and |
2
• | The rapid expansion of high quality IP bandwidth, particularly the expansion of wireless bandwidth such as Wi-Fi and VoLTE. |
We believe that service providers are well-positioned to address these market demands. A number of our service provider customers have made significant investments in their IP-based and mobile networks. Many have a long track record of reliably delivering these business critical services. We believe that as UC solutions are increasingly being offered over fixed-line and mobile networks, service providers can achieve significant competitive advantages in delivering such services over their networks. Further, we believe service providers have a significant incentive to offer UC services to their enterprise customers as competitive and regulatory pressures have commoditized their historical revenue streams. In addition, we believe that larger service providers are becoming more focused on implementing transformations of their fixed and mobile networks from traditional circuit switched networks to their IP-based broadband networks. As these service providers embark on such projects, many are incorporating application servers like BroadWorks to enable them to offer enhanced business services that were previously offered over their circuit switched networks.
We believe this trend is evident in both fixed-line transformations and increasingly in service providers’ investment in their mobile VoLTE networks. We further believe this trend is a positive development for us, as service providers both replace services to their business users on their traditional networks and provide new business services. We believe we are well-positioned to meet carrier demand for these large network transformation projects, and have won several transformation projects around the world over the past year with Tier 1 service providers. These projects have contributed, and will continue to contribute, significant revenue and billings as we meet project milestones and provide professional services to our customers. We also believe these further enhance our role as a strategic partner to our service provider customers, while providing increased opportunities for license seat growth over a multi-year period with such customers.
Demand for Voice and Multimedia Services
Service providers are providing UC services to enterprise and consumer customers. Enterprise subscribers include small, medium and large businesses, universities and governments and range in size from a few end-users to tens of thousands. Consumer subscribers include individuals and families purchasing communications services for their personal and residential use.
Enterprises
Enterprises require communications features and functionality that are varied and, in many cases, complex. Four-digit dialing, multi-party conferencing and video conferencing are common enterprise needs. Historically, enterprises have purchased voice and data access from service providers and deployed customer premise-based equipment, or CPE, such as PBXs to help deliver this functionality. In the past, enterprises often choose PBXs because they frequently required greater features and functionality than could previously be obtained efficiently from service providers’ legacy voice networks.
Using our core communications platform, we believe service providers can enhance the quality and functionality of their communications offerings and increase the volume of communication services delivered to customers as hosted offerings. Concurrently, we believe a number of trends are driving increased demand for hosted communication services, including:
• | Shift towards Unified Communications and other collaboration tools. We believe enterprises expect their communication tools to address their, and their employees', desire for solutions that allow employees and teams to collaborate and to drive workplace productivity. This is the driving focus of our expanded BroadSoft Business portfolio of UC-One, Team-One and CC-One. |
• | Increased acceptance of cloud-based services. Enterprises are increasingly obtaining mission-critical IT services, such as computing and storage, from the cloud. We believe the positive experiences and savings enterprises can achieve with cloud-based IT systems will drive enterprises to continue to move other important functions, such as communications services, into the cloud. |
• | Mobile smartphones and tablets are driving accelerated change and increased adoption on UC and collaboration tools. As mobile and other communications services are increasingly integrated, the difficulty of using a CPE-based approach is compounded by the complexity of these additions. Enterprise and consumer users are demanding their communications services be integrated across their fixed-line, personal computer and mobile devices. Hosted services deliver communications services from a network, are centrally managed by or on behalf of the service provider and deliver uniform service across an enterprise. We believe it is far easier to offer integrated services for mobile devices in a hosted environment than in a CPE-based environment. Hosted services also enable enterprises to integrate employee-owned mobile devices within the enterprise (often referred to as “bring your own device”). |
• | New IP-based 4G Wireless Networks. We believe all the trends described above will accelerate even further as service providers deploy and adapt 4G wireless networks, such as LTE networks. This |
3
transition will, we believe, become even more pronounced as service providers move to offering fully IP-based voice and telephony services, commonly referred to as VoLTE.
• | Accelerating rate of technology change. Communications technology is evolving rapidly, with an increase in the number of ways people interact and the frequent introduction of new devices and services. Keeping pace with this change becomes difficult and expensive in a CPE-based environment where the investment to interoperate with new devices or provide new services must be fully borne by the enterprise. Furthermore, CPE vendors operate proprietary systems with typically higher prices and a limited selection of end-point devices. As new services are added, equipment upgrades are often required and, unless the equipment of all constituents within the enterprise is upgraded, functionality can remain limited. |
The BroadSoft Solution
To meet market opportunities and competitive challenges, many service providers are offering BroadSoft Business capabilities to their enterprise customers, with service providers doing so using one or more of our deployment options.
BroadSoft’s offerings provide service providers several key advantages, including:
• | Rapid delivery of feature-rich enterprise and consumer multimedia services. We believe our solutions provide the most extensive set of UC features and applications available for both enterprise and consumer applications. We also believe BroadWorks is the most feature rich application server for fixed-line, mobile and cable broadband access networks. Our BroadCloud SaaS platform allows service providers to quickly market to their customer's cloud-based PBX functionality as well as additional, complementary UC offerings and allows end-users to access UC services from a multitude of devices. |
• | Demonstrated adoption globally across many service provider networks. We have service provider customers in more than 80 countries who have purchased and/or are delivering services utilizing our software. |
• | Broad interoperability across network equipment vendors, network architectures and devices. BroadWorks interoperates with all significant network architectures, access types, infrastructures and protocols and integrates and interoperates with the major network equipment vendors’ core network solutions. |
• | Extensive technology and device partner ecosystem. BroadWorks interoperates with more than 900 devices, including more than 800 CPE devices, such as IP phones, computer-based soft-phones, conferencing devices, IP gateways, mobile phones and consumer electronics. |
• | Scalable architecture and carrier-grade reliability. Our applications are designed to scale to support hundreds of millions of subscribers with a carrier-grade level of reliability. |
• | Leadership in emerging standards and requirements. We are actively involved in the development of the IP Multimedia Subsystem, or IMS, SIP and VoLTE standards, as well as several other standards that we expect to shape our market in the future. Our BroadWorks application server supports what we believe is the world’s largest IMS deployment, based on the number of subscribers. |
Our Strategy
Our goal is to strengthen our position as the leading global provider of software and services that enable service providers to deliver cloud-based UC to their enterprise customers. To achieve this goal, our strategy is to deliver an increasingly feature rich set of services to address the needs of a broader spectrum of business customer types and their end-users. Key elements of our strategy include:
• | Accelerate the adoption of UC solutions by providing communications centric UC and collaboration capabilities. BroadSoft Business is driven by our vision of extending UC to help drive how enterprises and people communicate, interact and collaborate by integrating their communication and collaborative tools with contextual intelligence. We also intend to accelerate UC adoption and our service provider customers’ time to market by promoting and expanding our UC and collaboration offerings. Our BroadCloud SaaS solutions enables our service providers to offer UC features and functions through a service offering that we host and manage. We intend to expand the geographic availability of our BroadCloud SaaS offerings beyond the United States, United Kingdom, Germany, Japan and France. |
• | Extend our technology leadership and product depth and breadth. We intend to continue to provide industry leading UC and collaboration solutions through product innovation and substantial investment in research and development |
4
for new features, applications and services. We believe that we can leverage our market position in UC to provide additional collaboration capabilities to our service provider customers and their end enterprise users.
• | Improve brand awareness through our “Powered by BroadSoft” campaign. Our “Powered by BroadSoft” effort is intended to improve our brand awareness with end-users, and to assist our service provider customers in their selling efforts to end enterprise customers. |
• | Broaden demand by enterprises and assist our service provider customers by developing more market segment directed UC offerings. We enable service providers to develop UC offerings targeted towards specific business segments, including small, medium and large enterprises and market segments such as hospitality, government, education, contact center and healthcare. |
• | Drive revenue growth by: |
• | Assisting our current service provider customers to sell more of their currently deployed BroadWorks and BroadCloud SaaS offerings. We support our service provider customers by regularly offering enhanced and new features to their current applications, as well as providing tools and training to help them market their services to subscribers. We have also launched our “Powered by BroadSoft” initiative which is designed to increase end-user awareness of our products. |
• | Expanding our BroadCloud SaaS offering. We believe that service providers will increasingly find that using our BroadCloud SaaS offering to deliver UC solutions to their customers will accelerate their time to market and product introduction cycles. We have expanded our BroadCloud offerings to include full service offerings where we provide additional services to our service provider customers, such as provisioning and billing, as well as BroadCloud PaaS, a more limited, less expensive option where we provide cloud based access to BroadWorks without the business support capabilities of BroadCloud. |
• | Continuing to acquire new customers and increase usage by existing customers. Our customers are located around the world and include many of the top telecommunications services providers globally. We believe we are well positioned to continue to acquire new customers, particularly with the addition of our BroadCloud offerings and our focus on developing UC solutions based on enterprise size and vertical market segments. We also believe we will continue to expand our presence within our existing customers through their deployment of more of our offerings. |
• | Pursuing selected acquisitions and collaborations that complement our strategy. We intend to continue to pursue acquisitions and collaborations that we believe are strategic to strengthen our industry leadership position, expand our geographic presence or allow us to offer new or complementary products or services. |
Our Platform
Service providers can offer their subscribers a comprehensive portfolio of enterprise and consumer communications services using BroadWorks and BroadCloud. We typically license and price BroadWorks on a per-subscriber, per-feature package basis and we typically sell our BroadCloud services on a per-month per-user basis. We can deploy BroadWorks or BroadCloud in a variety of network configurations, matching the needs of fixed-line, mobile and cable service providers.
BroadSoft Enterprise Solutions
BroadSoft Business
Our BroadSoft Business solution includes three enterprise applications. We offer our UC-One offering to service providers either as a BroadWorks software solution, which is premise based at the customer, or as a hosted BroadCloud SaaS solution. Our team collaboration application, Team-One, and our contact center application, CC-One, are both solely offered on our BroadCloud platform.
Hosted Unified Communications
Hosted UC products, available as either software deployed within a service provider's network or on a SaaS basis hosted and managed by us, enable service providers to offer enterprises advanced IP PBX and UC features through a hosted service rather than through premise-based equipment, such as PBXs. As enterprise needs become more complex and as enterprise budgets are more closely controlled, we believe enterprise demand for cost-effective and feature-rich applications such as multimedia, mobility and UC is growing. We also believe the delivery of advanced IP PBX and UC features in a hosted model is simpler to implement and more cost efficient for both the service provider and enterprise customer than premise-based alternatives.
The advanced IP PBX and UC features we offer to enterprises through hosted UC applications include:
• | PBX functionality such as call control, call waiting, call forwarding and conference calling, in each case across multiple locations; |
5
• | HD voice and video conferencing; |
• | UC features, such as IM&P and email integration and collaboration; |
• | integration of offerings across fixed-line and mobile devices and networks; |
• | integrated voice, video and fax messaging; |
• | enhanced features such as auto attendants, call centers and conferencing; |
• | open APIs for third-party application development that complements the core call control functionality; |
• | clients, which are devices and software that request information, for feature control and administration; |
• | regulatory functions such as emergency calling (E911) and lawful intercept (CALEA); and |
• | geographic redundancy and disaster recovery. |
SIP Trunking
Our BroadWorks SIP Trunking solution enables service providers to provide IP interconnectivity and additional services to enterprises that already have premise-based PBXs. With SIP Trunking, service providers are able to bundle voice and data over a single converged IP pipe, creating a more economical offering than can be achieved with separate voice and data connections. We believe our solution enables service providers to differentiate their SIP Trunking service offerings and increase revenue by offering enhanced services such as UC, video, mobility, global four-digit dialing and business continuity.
BroadSoft Xcelerate and Xtended Programs
Our BroadSoft Xcelerate program focuses on and fosters successful go-to-market initiatives with our service provider customers, from target offers to sales and marketing efforts. Our go-to-market resources help service providers prepare to launch, market and sell their service offerings to their end-users. We generally seek to help our service providers accelerate the launch and deployment of our applications to their subscribers by providing them with a best-practices framework and resources such as templates and planning guides.
Our BroadSoft Xtended program is designed to enable our service provider customers to create and/or deploy highly differentiated IP-based communications services using BroadWorks. BroadSoft Xtended is premised on two operating principles:
• | Expanding familiarity with web services APIs. The powerful RESTful Xtended Services Interface, or Xsi, exposes our BroadWorks software to other applications; and |
• | Maintaining community. An innovative developer community driven by the BroadSoft Xtended developer program. |
Technology
We have invested significant time and financial resources into the development of our suite of product offerings. Our BroadWorks code base comprises over twelve million lines of software code refined over 15 years and 22 major releases. While the predominant industry approach has been to use proprietary standards, which greatly limits interoperability, our technology strategy is to adopt and extend leading open standards with the objectives of providing the widest level of interoperability in the industry. Our products implement a diverse set of industry protocols such as SIP, DIAMETER, SNMP, SOAP and RESTful-based interfaces, allowing for the successful penetration of the service provider market across different types of architectures, access types and infrastructures.
Our technology includes software-based server functions and software clients designed for scalability and performance. Our server functions provide a number of discrete capabilities, including call control and signaling, media processing and provisioning interfaces to back office infrastructure. Our software clients run on a variety of devices, including smartphones, tablets and personal computers. Our open interfaces allow service providers to quickly and easily integrate with mobile applications, back office systems, web portals and network infrastructure and also permits them to deploy applications that complement the functionality of the servers. Because the solution reaches the service provider’s subscribers, we believe this end-to-end integration is critical to ensure the usability, look and feel of the service offering is superior.
The key elements of our technology are:
• | SIP. We believe we have the industry’s most customer-tested and fully functioned SIP stack. Because we developed the software ourselves, we can rapidly customize it and resolve any related issues. We have developed SIP extensions for many advanced PBX functions such as advanced call control and bridged line appearances. Our SIP stack provides programmable controls on a per-device basis to allow |
6
for maximum compatibility and interoperability. We have validated our stack and deployed it with leading IMS core network vendors;
• | Call control. We have developed a patented architecture for service definition, service execution, interface abstraction, event routing and service precedence. This provides an extensible pattern for creating and adding new services and/or interfaces without an impact on existing functionality. Interfaces are abstracted so that services can be written to work with any protocol. This approach yields a product we believe is easier to test and consequently has fewer defects. BroadSoft has evolved the service operating system to natively support the IMS call model; |
• | Geographic redundancy. We have designed a geographically redundant solution tailored for call control that requires no special software and uses standard IP networking configurations with standard IP addressing. This solution supports seamless failover for server outages and IP networking issues. It also allows for placement of servers in any geography without distance limitations. The solution is supported by leading IMS core network vendors and session border controller vendors. Our BroadWorks solution has proven greater than 99.999% reliability with over ten years of historical data; |
• | Common OAMP platform. BroadWorks has a common management container for all BroadSoft servers, providing consistent functions for operations, administration, management and provisioning, or OAMP. It supports identical carrier grade management interfaces on all servers and includes functions for command line interfaces, alarms, statistics, configuration, charging, security and provisioning. It is fully tested and validated with leading carrier network management systems and customer care systems and proven carrier grade in Tier 1 telecommunications service providers. It works on standard servers, as well as virtualized servers; |
• | Media resource framework. We have developed a completely software-based media resource framework for dual-tone multi-frequency detection, media playback, recording, conferencing and repeating. The framework supports all de facto standard audio and video codecs. It supports the Internet Engineering Task Force, or IETF, and the 3rd Generation Partnership Project, or 3GPP, standard protocols, including the standard format for specifying interactive voice dialogues between a human and a computer, or VoiceXML, and call control extensible markup language, or CCXML, which provides telephony support to VoiceXML. The framework can be integrated with all leading voice recognition and text-to-speech engines. We believe using a completely software-based platform not only provides us with a technical advantage over our competition, but also a strong commercial advantage since we can bundle this technology with BroadWorks; |
• | Client technology. We support a full suite of smartphone, tablet and personal computer voice over IP, or VoIP, clients. These clients provide audio and video calling, IM, presence, conferences, collaboration and service management. They are designed to be integrated with our network software and cloud services, providing a superior user experience; |
• | IMS and VoLTE. Our products support IMS interfaces, adhering to a 3GPP specifications. We provide a fully functional Telephony Application Server (TAS) and Media Resource Function (MRF), supporting VoLTE and fixed-line applications. We have IMS deployments, providing both business and consumer applications; and |
• | Network Function Virtualization (NFV). BroadWorks is a suite of Virtual Network Functions (VNFs) that are supported in an NFV environment. BroadWorks VNFs utilize standard IT virtualization technology. This allows our customers to consolidate their networks onto industry standard high volume servers, located in their data centers. |
Global Support Services
Providing a broad range of professional support services is an integral part of our business model. We offer services designed to deliver comprehensive support to our service provider customers and distribution partners through every stage of product deployment. Our services can be categorized as follows:
• | Pre-sales support. Our worldwide sales engineering group works with our direct sales force to provide demonstrations, architecture consulting, interoperability testing and related services in connection with product sales opportunities to establish the capability, functionality, scalability and interoperability of our software with a service provider’s network; |
7
• | Professional services. Our professional services group provides installation services, such as planning, consulting and staging of software on the customer’s hardware, as well as network integration services, project management and remote upgrades. We also offer our customers the option of longer-term engagements in the form of “resident engineering” services. In addition, we offer a full suite of consulting services including network planning, network architecture definition, back office consulting and solution verification; |
• | Global operations centers. We maintain operations centers in several locations around the world to provide our customers with product life-cycle services, such as platform support and maintenance services. We also host our BroadCloud SaaS offerings in select operations centers. Members of our technical assistance center and regional project management and professional services teams provide remote assistance to customers via these locations and our in-depth web support portal, including periodic updates for our software products and product documentation. To respond to our customers’ needs, our technical assistance personnel are available 24 hours a day, seven days a week and accessible by phone, e-mail and, when required, on-site via a professional services engagement; and |
• | Training. We offer an array of training services to our customers, which include systems administration, provisioning and advanced diagnostic courses. We present these courses regularly at our regional centers and headquarters and we also can deliver versions of the courses at customer sites. We also offer product and feature training via streaming video courses, which we refer to as our eLearning offerings, as well as a full product certification program that is available through our BroadSoft University website. |
We believe our commitment to providing high-quality services to our customers provides us with a competitive advantage by helping us to retain customers and to identify new revenue opportunities.
Sales and Marketing
We market and sell our products and services directly, through our internal sales force, and indirectly, through our distribution partners, such as VARs and system integrators. For the years ended December 31, 2016, 2015 and 2014, approximately 87%, 89% and 87%, respectively, of our revenue was generated through direct sales.
Direct sales. Our direct sales team sells our products and services to service providers worldwide and supports the sales efforts of our various distribution partners.
Distribution partners. We periodically enter into non-exclusive distribution or reseller agreements with distribution partners, such as VARs and system integrators. We predominantly engage with a distribution partner in connection with marketing to international service providers. Our agreements with our distribution partners typically have a duration of one to two years and provide for a full spectrum of sales and marketing services, product implementation services, technical and training support and warranty protection. These agreements generally do not contain minimum sales requirements and we ordinarily do not offer contractual rights of return or price protection to our distribution partners. Our partners include many of the largest networking and telecommunications equipment vendors in the world, as well as regionally focused system and network integrators. We may seek to selectively add distribution partners, particularly in countries outside the United States, to complement or expand our business.
Marketing and product management. Our marketing and product management teams focus their marketing efforts on increasing our Company and brand awareness, heightening product awareness and specifying our competitive advantages, as well as generating qualified sales leads from existing and prospective customers. As part of marketing our products and services, we communicate enhancements and new capabilities, convey reference solutions that we develop with our partners and announce successful end-user market offerings jointly with our service providers. Within our industry, we work to influence next generation service architectures and service provider requirements globally by actively contributing to industry-related standards organizations, conferences, publications and analyst consulting services. Additionally, we work closely with service providers to develop subscriber loyalty and share successful best practices through user conferences, on-site seminars, our BroadSoft Xcelerate program, monthly webinars, social networking campaigns and newsletters.
Customers
We have several hundred service provider customers in more than 80 countries, including 25 of the top 30 telecommunications service providers globally, as measured by revenue in the year ended December 31, 2015, who are delivering services utilizing our software. These companies have either purchased products or services directly from us or have purchased our software through one of our distribution partners. Our customers are located around the world and include many of the top telecommunications service providers globally. Our customers include fixed-line, mobile, cable and Internet service providers.
8
As a result of the diversity of service providers comprising our customer base, our products are used in a broad array of services, applications, network types and business models worldwide.
Revenue from customers located outside the United States represented 48%, 38% and 51% of our total revenue in 2016, 2015 and 2014, respectively. For the year ended December 31, 2016, Verizon accounted for 10% of our total revenue. For the year ended December 31, 2015, no single customer exceeded 10% of our total revenue. For the year ended December 31, 2014, Telstra Corporation Limited accounted for 13% of our total revenue.
Research and Development
Continued investment in research and development is critical to our business. We have assembled a team of engineers primarily engaged in research and development, with expertise in various fields of communications and software development. Our research and development department is responsible for designing, developing and enhancing our software products and performing product testing and quality assurance activities, as well as ensuring the interoperability of our products with third-party hardware and software products. We also validate and produce solution guides for joint reference solutions with our partners that specify infrastructure components and management functions. We employ advanced software development tools, including automated testing, performance and capacity testing, source code control, requirements traceability and defect tracking systems. Research and development expense totaled $77.2 million, $60.7 million and $50.1 million for 2016, 2015 and 2014, respectively.
Competition
The market for IP application offerings is extremely competitive, rapidly evolving and subject to changing technology. We expect competition to persist and intensify in the future. We believe that the principal competitive factors in our industry include product features and performance, interoperability, time required for application deployment, scalability, customer support offerings, customer relationships, partner relationships, pricing and total deployment costs.
Currently, we compete with network equipment companies such as Ericsson AB, GENBAND, Inc., Huawei Technologies Co. Ltd, Metaswitch Networks Ltd and Nokia Corporation for service provider customers. Some of the network equipment companies with which we have non-exclusive distributor partnerships may also provide, as a package, their own network equipment in combination with application software that they have developed and which may compete with us. Additionally, we compete indirectly, through our service provider customers, with other companies that offer UC capabilities to enterprises, including Avaya, Inc, Cisco Systems, Inc., Microsoft Corporation and Mitel Networks Corporation, as well as over-the-top UC providers such as RingCentral, Inc. and 8x8, Inc. Some of the companies that offer UC capabilities may also offer such capabilities on a wholesale or reseller basis to service providers for those service providers to offer to their customers. Such arrangements may compete with our offerings to service providers.
Many of our current and potential competitors may have significantly greater financial, technical, marketing and other resources than we do and may be able to devote greater resources to the development, promotion, sale and support of their products. Our competitors may also have more extensive customer bases and broader customer relationships than we do, including relationships with our potential customers. In addition, many of these companies have longer operating histories and greater brand recognition than we do.
Intellectual Property
Our success depends upon our ability to protect our core technology and intellectual property. To accomplish this, we rely on a combination of intellectual property rights, including patents, trade secrets, copyrights and trademarks, as well as customary confidentiality and other contractual protections. We have a number of United States and foreign patents and pending applications that relate to various aspects of our products and technology. While we believe that our patents have value, no single patent is essential to us or to any of our principal products or services. Our registered trademarks in the United States and a significant number of other countries throughout the world include BroadSoft and BroadWorks.
In addition to the protections described above, we generally control access to and use of our proprietary software and other confidential information through the use of internal and external controls, including contractual protections with employees, consultants, customers and vendors, and our software is protected by U.S. and international copyright laws. We also incorporate a number of third-party software programs into our products, including BroadWorks, pursuant to license agreements. Our software is not substantially dependent on any third-party software, with the exception of database technology that is provided by Oracle pursuant to a license agreement expiring in 2020, although our software does utilize open source code. Notwithstanding the use of this open source code, we do not believe that our usage requires public disclosure of our own source code nor do we believe the use of open source code is material to our business.
9
We may not receive competitive advantages from the rights granted under our patent and other intellectual property rights. If our products, patents or patent applications are found to conflict with any patents held by third parties, we could be prevented from selling our products, our patents may be declared invalid or our patent applications may not result in issued patents. In foreign countries, we may not receive effective patent, copyright and trademark protection. We may be required to initiate litigation to enforce any patents issued to us, or to determine the scope or validity of a third party’s patent or other proprietary rights. In addition, we are currently subject to lawsuits, and in the future we may be subject to additional lawsuits by third parties seeking to enforce their own intellectual property rights. See Item 3, Legal Proceedings.
We license our software to customers pursuant to agreements that impose restrictions on the customers’ ability to use the software, including prohibitions on reverse engineering and limitations on the use of copies. We also seek to avoid disclosure of our intellectual property by requiring employees and consultants with access to our proprietary information to execute nondisclosure and assignment of intellectual property agreements and by restricting access to our source code. Our employees and consultants may not comply with the terms of these agreements and we may not be able to adequately enforce our rights against these non-compliant parties.
Employees
As of December 31, 2016, we had 1,597 employees in 23 countries, 600 of whom were primarily engaged in research and development, 343 of whom were primarily engaged in sales and marketing, 468 of whom were primarily engaged in providing customer support, cloud operations and professional support services and 186 of whom were primarily engaged in administration and finance. As of December 31, 2016, we had 732 employees located in the United States. None of our employees is represented by a labor union or covered by a collective bargaining agreement. We consider our relationship with our employees to be good.
Available Information
Our Annual Report on Form 10-K, Quarterly Reports on Form 10-Q, Current Reports on Form 8-K, and other filings with the SEC, and all amendments to these filings, are available, free of charge, on our Investor Relations website at www.investors.broadsoft.com as soon as reasonably practicable following our filing of any of these reports with the SEC. You can also obtain copies free of charge by contacting our Investor Relations department at our office address listed below. The public may read and copy any materials we file with the SEC at the SEC's Public Reference Room at 100 F Street NE, Room 1580, Washington, DC 20549. The public may obtain information on the operation of the Public Reference Room by calling the SEC at 1-800-SEC-0330. The SEC maintains an Internet site that contains reports, proxy, and information statements, and other information regarding issuers that file electronically with the SEC at www.sec.gov. The information posted on or accessible through these websites are not incorporated into this filing.
Our Corporate Information
Our principal executive office is located at 9737 Washingtonian Boulevard, Suite 350, Gaithersburg, Maryland 20878 and our telephone number is (301) 977-9440. Our website address is www.broadsoft.com.
10
Item 1A. | Risk Factors |
Set forth below and elsewhere in this Annual Report on Form 10-K, and in other documents we file with the SEC, are risks and uncertainties that could cause actual results to differ materially from the results contemplated by the forward-looking statements contained in this Annual Report on Form 10-K. Because of the following factors, as well as other variables affecting our operating results, past financial performance should not be considered as a reliable indicator of future performance and investors should not use historical trends to anticipate results or trends in future periods.
Risks Related to Our Business
We are substantially dependent upon the commercial success of one product, BroadWorks, which is sold as an application server software offering and also provides the underlying capabilities of our BroadCloud hosted offering. If the market for BroadWorks does not continue to grow, our overall revenue may decline or remain unchanged, which would adversely affect our overall operating results and financial condition.
Our revenue growth depends substantially upon the commercial success of our voice and multimedia application server software, BroadWorks. We derive a significant portion of our revenue from licensing BroadWorks and related products and services. During the years ended December 31, 2016, 2015 and 2014, BroadWorks licenses and related services represented 85%, 84% and 82% of our revenue, respectively. We expect revenue from BroadWorks and related products and services to continue to account for the significant majority of our revenue for the foreseeable future.
We generally sell licenses of BroadWorks on a perpetual basis and deliver new versions and upgrades to customers who purchase maintenance contracts; consequently, our future license software revenue is dependent, in part, on the success of our efforts to sell additional BroadWorks licenses to our existing service provider customers, as well as licenses to new customers. The sale of new or additional licenses to service providers depends upon the number of their customers subscribing to IP-based communications services rather than traditional services and the purchasing by those subscribers of additional service offerings that use our applications. These service providers may choose not to expand their use of, or make additional purchases of, BroadWorks or might delay additional purchases we expect. These events could occur for a number of reasons, including because their customers are not subscribing to IP-based communications services in the quantities expected, because services based on our applications are not sufficiently popular or because service providers migrate to a software solution other than BroadWorks. If service providers do not adopt BroadWorks, or do not purchase and successfully deploy BroadWorks or sell services using BroadWorks to their end-users, our revenue could grow at a slower rate or decrease.
In addition, because our sales are derived substantially from one product, our share price could be disproportionately affected by market perceptions of current or anticipated competing products, allegations of intellectual property infringement or other matters. These perceptions, even if untrue, could cause our stock price to decline.
If the significant investments we have recently made to grow our BroadCloud hosted service offering are unsuccessful in increasing revenues from that product, our overall revenue may decline or fail to grow, which would adversely affect our operating results and financial condition
We have been, and will continue to, devote considerable resources and allocate capital expenditures to growing our BroadCloud software-as-a-service revenue. There can be no assurance that we will meet our revenue targets for this service and if we fail to achieve our revenue goals, our growth and operating results will be materially adversely affected. Additionally, new or existing customers may choose to purchase our SaaS solutions rather than BroadWorks. If our customers’ purchases trend away from BroadWorks perpetual licenses toward our BroadCloud hosted solutions, or customers defer or cancel BroadWorks orders due to evaluating BroadCloud, our BroadWorks revenues, and our revenues and/or timing of revenues generally, may be adversely affected, which could adversely affect our results of operations and financial condition.
Our success depends in large part on service providers’ continued deployment of, and investment in, their IP-based networks.
Our products are predominantly used by service providers to deliver voice and multimedia services over IP-based networks. As a result, our success depends significantly on these service providers’ continued deployment of, and investment in, their IP-based networks, and increased demand by their end-users for UC capabilities. Service providers’ deployment of IP-based networks and their migration of communications services to IP-based networks is still in its early stages, and these service providers’ continued deployment of, and investment in, IP-based networks depends on a number of factors outside of our control. Our expenditures to increase service providers' sell-through sales of our products to their end-users may not be successful and we may not realize a return on this investment. Among other elements, service providers’ legacy networks include PBXs, Class 5 switches and other equipment that may adequately perform certain basic functions and could have
11
remaining useful lives of 20 or more years and, therefore, may continue to operate reliably for a lengthy period of time. Many other factors may cause service providers to delay their deployment of, or reduce their investments in, their IP-based networks, including capital constraints, available capacity on legacy networks, competitive and pricing conditions within the telecommunications industry and regulatory issues. If service providers do not continue deploying and investing in their IP-based networks at the rates we expect, for these or other reasons, our growth and operating results will be materially adversely affected.
The loss of, or a significant reduction in orders from, one or more major customers or through one or more major distribution partners would reduce our revenue and harm our results.
For the year ended December 31, 2016, we had one customer Verizon that accounted for 10% of our total revenue. For the year ended December 31, 2015, there were no customers that generated 10% or more of our total revenue. For the year ended December 31, 2014, Telstra Corporation Limited accounted for 13% of our total revenue. Our customer agreements do not require our customers to purchase any minimum amount of our products or services. Because of the variability of the buying practices of our larger customers, the composition of our most significant customers is likely to change over time. If we experience a loss of one or more significant customers or distribution partners, or if we suffer a substantial reduction in orders from one or more of our significant customers or distribution partners and we are unable to sell directly or indirectly to new customers or increase orders from other existing customers to offset lost revenue, our business will be harmed.
Our revenue, operating results and gross margin can fluctuate significantly and unpredictably from quarter to quarter and from year to year, and we expect they will continue to do so, which could cause the trading price of our stock to decline.
The rate at which our customers order our products, and the size of these orders, are highly variable and difficult to predict. In the past, we have experienced significant variability in our customer purchasing practices on a quarterly and annual basis, and we expect that this variability will continue, as a result of a number of factors, many of which are beyond our control, including:
• | demand for our products and the timing and size of customer orders; |
• | customers' budgetary constraints; |
• | length of sales cycles; |
• | length of time of deployment of our products by our customers; |
• | competitive pressures; and |
• | general economic conditions. |
As a result of this volatility in our customers’ purchasing practices, our license software revenue has historically fluctuated unpredictably on a quarterly and annual basis and we expect this to continue for the foreseeable future.
Our budgeted expense levels depend in part on our expectations of future revenue. Because any substantial adjustment to expenses to account for lower levels of revenue is difficult and takes time, if our revenue declines, our operating expenses and general overhead would likely be high relative to revenue, which could have a material adverse effect on our operating margin and operating results.
In addition to the unpredictability of customer orders, our quarterly and annual results of operations are also subject to significant fluctuation as a result of the application of accounting regulations and related interpretations and policies regarding revenue recognition under generally accepted accounting principles in the United States, or U.S. GAAP. Compliance with these revenue recognition rules has resulted in certain instances in our deferral of the recognition of revenue in connection with the sale of our software licenses, maintenance and services. The majority of our deferred revenue balance consists of software license orders that do not meet all the criteria for revenue recognition and the undelivered portion of maintenance. Although we typically use standardized license agreements designed to meet current revenue recognition criteria under U.S. GAAP, we must often negotiate and revise terms and conditions of these standardized agreements, particularly in multi-element transactions with larger customers who often desire customized features, which causes us to defer revenue until all elements are delivered. As our transactions increase in complexity with the sale of larger, multi-product licenses that may be integrated into or with other systems or third party technology, negotiation of mutually acceptable terms and conditions with our customers can require us to defer recognition of revenue on such licenses.
The cumulative effects of these factors could result in large fluctuations and unpredictability in our quarterly and annual operating results. This variability and unpredictability could result in our failing to meet the expectations of securities industry analysts or investors for any period. If we fail to meet or exceed such expectations for these or any other reasons, the market price of our shares could fall substantially and we could face costly securities class action suits. Therefore, you should not rely
12
on our operating results in any quarter or year as being indicative of our financial performance, including our operating results for any future period.
Changes in accounting principles or standards, or in the way they are applied, could result in unfavorable accounting charges or effects and unexpected financial reporting fluctuations, and could adversely affect our reported operating results.
We prepare our consolidated financial statements in conformity with U.S. GAAP. These principles are subject to interpretation by the SEC and various bodies formed to interpret and create appropriate accounting principles and guidance. A change in existing principles, standards or guidance can have a significant effect on our reported results, may retroactively affect previously reported results, could cause unexpected financial reporting fluctuations and may require us to make costly changes to our operational processes.
The Financial Accounting Standards Board, or FASB, issued a new accounting standard for revenue recognition in May 2014 - Accounting Standards Update (ASU) 2014-09, “Revenue from Contracts with Customers (Topic 606)” - that supersedes nearly all existing U.S. GAAP revenue recognition guidance. Although we are currently in the process of evaluating the impact of ASU 2014-09 on our consolidated financial statements, it will change the way we account for certain software and software related transactions in 2018, the first year that such new rules will be effective. Adoption of the standard could have a significant impact on our financial statements and may retroactively affect the accounting treatment of transactions completed before adoption.
Lengthy and unpredictable sales cycles may force us either to assume unfavorable pricing or payment terms and conditions or to abandon a sale altogether.
Our initial sales cycle for a new customer ranges generally between six and 12 months and sometimes more than two years. Our sales cycle can be very unpredictable due to:
• | the generally lengthy service provider product testing, evaluation and approval process for our products, including internal reviews and capital expenditure approvals; |
• | the evolving nature of the market, which may lead prospective customers to postpone their purchasing decisions pending resolution of standards or adoption of technology by others; |
• | our service provider customers increasingly asking us to participate in complex transactions involving multiple parties developing a platform or telecommunications solution for the service provider; and |
• | customers making critical decisions regarding the design and implementation of large network deployments engaging in very lengthy procurement processes. |
Additionally, after we make an initial software sale to a customer, its implementation of our products can be very time consuming, often requiring six to 24 months or more, particularly in the case of larger service providers. This lengthy implementation and deployment process can result in a significant delay before we receive additional software orders from that customer.
As a result of these lengthy sales cycles, we are sometimes required to assume terms or conditions that negatively affect pricing or payment for our products to consummate a sale, which can negatively affect our gross margin and results of operations. Alternatively, if service providers ultimately insist upon terms and conditions that we deem too onerous or not to be commercially prudent, we may incur substantial expenses and devote time and resources to potential relationships that never result in completed sales or revenue. If this result becomes prevalent, it could have a material adverse impact on our results of operations.
We may fail to achieve our financial forecasts due to inaccurate sales forecasts or other factors.
Our revenues are difficult to forecast, and, as a result, our quarterly operating results can fluctuate substantially. We use a “pipeline” system, a common industry practice, to forecast sales and trends in our business. Our sales personnel monitor the status of all proposals and estimate when a customer will make a purchase decision and the dollar amount of the sale. These estimates are aggregated periodically to generate a sales pipeline. Our pipeline estimates can prove to be unreliable both in a particular quarter and over a longer period of time, in part because the “conversion rate” or “closure rate” of the pipeline into contracts can be very difficult to estimate. A reduction in the conversion rate, or in the pipeline itself, could cause us to plan or budget incorrectly and adversely affect our business or results of operations. In particular, a slowdown in capital spending or economic conditions generally can unexpectedly reduce the conversion rate in particular periods as purchasing decisions are delayed, reduced in amount or cancelled. The conversion rate can also be affected by the tendency of some of our customers to wait until the end of a fiscal period in the hope of obtaining more favorable terms, which can also impede our ability to
13
negotiate, execute and deliver upon these contracts in a timely manner. In addition, for companies that were recently acquired by us, we have limited ability to predict how their pipelines will convert into sales or revenues for a number of quarters following the acquisition. Conversion rates post-acquisition may be quite different from the acquired companies’ historical conversion rates. Differences in conversion rates and customer behavior can also be affected by changes in our business practices implement by us for our newly acquired companies
Because a significant portion of our cost structure is largely fixed in the short-term, revenue shortfalls tend to have a disproportionately negative impact on our profitability. The number of large new software licenses transactions increases the risk of fluctuations in our quarterly results because a delay in even a small number of these transactions could cause our quarterly revenues and profitability to fall significantly short of our predictions.
Infringement claims are common in our industry and third parties, including competitors, have and could in the future assert infringement claims against us including for past infringement, which could force us to redesign our software and incur significant costs.
The IP-based communications industry is highly competitive and IP-based technologies are complex. Companies file patents covering these technologies frequently and maintain programs to protect their intellectual property portfolios. Some of these companies actively search for, and routinely bring claims against, alleged infringers. Our products are technically complex and compete with the products of significantly larger companies.
We periodically receive notices from, or have lawsuits filed against us by, others claiming we are infringing their intellectual property rights, principally patent rights. We expect the number of such claims may increase for a variety of reasons, including:
• | the expansion of our product lines through product development and acquisitions; |
• | our real or perceived success in selling our products to our customers; |
• | the proliferation of non-practicing entities asserting intellectual property infringement claims; |
• | an increase in the number of competitors in our industry segments, the resulting increase in the number of related products and services and the overlap in the functionality of those products and services; and |
• | an increase in the risk that our competitors and third parties could use their own intellectual property rights to seek to restrain our freedom to operate and exploit our products, or to otherwise block us from taking full advantage of our markets. |
Regardless of the merit of third-party direct claims that we infringe their rights or indemnification claims arising out of such third party claims, these claims could:
• | be time consuming and costly to defend; |
• | divert our management’s attention and resources; |
• | cause product shipment and installation delays; |
• | require us to redesign our products, which may not be feasible or cost-effective; |
• | cause us to cease producing, licensing or using software or products that incorporate challenged intellectual property; |
• | damage our reputation and cause customer reluctance to license our products; or |
• | require us to pay amounts for past infringement or enter into royalty or licensing agreements to obtain the right to use a necessary product or component, which may not be available on terms acceptable to us, or at all. |
It is possible that other companies hold patents covering technologies similar to one or more of the technologies that we incorporate into our products. In addition, new patents may be issued covering these technologies. Unless and until the U.S. Patent and Trademark Office issues a patent to an applicant, there is no reliable way to assess the scope of the potential patent. We currently face, and may in the future face claims of infringement from both holders of issued patents and, depending upon the timing, scope and content of patents that have not yet been issued, patents issued in the future. The application of patent law to the software industry is particularly uncertain because the time that it takes for a software-related patent to issue is lengthy, which increases the likelihood of pending patent applications claiming inventions whose priority dates may pre-date development of our own proprietary software.
The results of litigation and claims cannot be predicted with certainty, and an unsuccessful outcome in a claim of intellectual property infringement could have a material adverse effect on our business. Moreover, even if litigation or claims are resolved
14
in our favor or without significant cash settlements, the time and resources necessary to litigate or resolve them could harm our business, our operating results, financial condition or reputation.
We are generally obligated to indemnify our customers for certain expenses and liabilities resulting from intellectual property infringement claims regarding our products, which could force us to incur substantial costs.
We have agreed, and expect to continue to agree, to indemnify our customers for certain expenses or liabilities resulting from claimed infringement of intellectual property rights of third parties with respect to our products. As a result, in the case of infringement claims against these customers, we could be required to indemnify them for losses resulting from such claims or to refund license fees they have paid to us. Some of our customers have sought, and we expect certain of our customers in the future to seek, indemnification from us in connection with infringement claims brought against them. In addition, some of our customers have tendered to us the defense of claims brought against them for infringement, and we have received these requests with increasing frequency in recent years. We evaluate each such request on a case-by-case basis and we may not succeed in refuting all such claims.
If a customer elects to invest resources in enforcing a claim for indemnification against us, we could incur significant costs disputing it. If we do not succeed in disputing such claim, we could face substantial liability, which may have a material adverse impact on our results of operations.
We may be unable to adequately protect our intellectual property rights in internally developed systems and software and efforts to protect them may be costly.
Our ability to compete effectively is dependent in part upon the maintenance and protection of systems and software that we have developed internally. While we hold issued patents and pending patent applications covering certain elements of our technology, patent laws may not provide adequate protection for portions of the technology that are important to our business. In addition, our pending patent applications may not result in issued patents.
The “America Invents Act” provides U.S. patent priority based on “first to conceive and file.” That is, the first person or entity to file a patent application on a particular subject matter is deemed to have priority over any other applicant who files an application on the same subject matter in the future, regardless of who first conceived or reduced to practice the claimed invention. This change in patent priority law may make it more difficult for us to obtain U.S. patents in the future.
The act also created alternative avenues to challenge the validity of issued U.S. patents other than the existing methods of litigation and reexaminations. These avenues make it easier and less expensive for third parties to petition the U.S. Patent and Trademark Office to cancel one or more issued patent claims. The act also provides a new defense to infringement based upon prior commercial use for any patents issued on or after the date of enactment of the act. This new defense may make it more difficult for a U.S. patent holder to successfully assert an infringement claim against a third party that has commercially used the patented technology at least one year prior to the earlier of the effective date of the claimed invention, or the date on which the claimed invention was disclosed to the public. These provisions may make it more difficult for us to protect our intellectual property rights in our U.S. patents.
We have largely relied on copyright, trade secret and, to a lesser extent, trademark laws, as well as confidentiality procedures and agreements with our employees, consultants, customers and vendors, to control access to, and distribution of, technology, software, documentation and other confidential information. Despite these precautions, it may be possible for a third party to copy or otherwise obtain and use our technology without authorization. If this were to occur, we could lose revenue as a result of competition from products infringing our technology and we may be required to initiate litigation to protect our proprietary rights and market position.
U.S. patent, copyright and trade secret laws offer us only limited protection and the laws of some foreign countries do not protect proprietary rights to the same extent. Accordingly, defense of our proprietary technology may become an increasingly important issue as we continue to expand our operations and product development into countries that provide a lower level of intellectual property protection than the United States. Policing unauthorized use of our technology is difficult and the steps we take may not prevent misappropriation of the technology we rely on. If competitors are able to use our technology without recourse, our ability to compete would be harmed and our business would be materially and adversely affected.
We may elect to initiate litigation in the future to enforce or protect our proprietary rights or to determine the validity and scope of the rights of others. That litigation may not be ultimately successful and could result in substantial costs to us, the diversion of our management attention and harm to our reputation, any of which could materially and adversely affect our business and results of operations.
15
We may not be able to obtain necessary licenses of third-party technology on acceptable terms, or at all, which could delay product sales and development and adversely impact product quality.
We have incorporated third-party licensed technology into our current products. For example, we use a third-party database as the core database for our applications server. We anticipate that we are also likely to need to license additional technology from third parties to develop new products or product enhancements in the future.
Third-party licenses may not be available or continue to be available to us on commercially reasonable terms. The inability to retain any third-party licenses required in our current products or to obtain any new third-party licenses to develop new products and product enhancements could require us to obtain substitute technology of lower quality or performance standards or at greater cost, and delay or prevent us from making these products or enhancements, any of which could seriously harm the competitive position of our products.
Our software must interoperate with many different networks, software applications and hardware products, and this interoperability will depend on the continued prevalence of open standards.
Our software is designed to interoperate with our customers’ existing and planned networks, which have varied and complex specifications, utilize multiple protocol standards, software applications and products from numerous vendors and contain multiple products that have been added over time. As a result, we must attempt to ensure that our software interoperates effectively with these existing and planned networks. To meet these requirements, we have and must continue to undertake development and testing efforts that require significant capital and employee resources. We may not accomplish these development efforts quickly or cost-effectively, or at all. If our software does not interoperate effectively, installations could be delayed or orders for our software could be canceled, which would harm our revenue, gross margins and our reputation, potentially resulting in the loss of existing and potential customers. The failure of our software to interoperate effectively with our customers’ networks may result in significant warranty, support and repair costs, divert the attention of our engineering personnel from our software development efforts and cause significant customer relations problems.
We have entered into arrangements with a number of equipment and software vendors for the use or integration of their technology with our software. These arrangements give us access to, and enable our software to interoperate with, various products that we do not otherwise offer. If these relationships terminate, we may have to devote substantially more resources to the development of alternative software and processes, and our efforts may not be as effective as the combined solutions under our current arrangements. In some cases, these other vendors are either companies that we compete with directly, or companies that have extensive relationships with our existing and potential customers and may have influence over the purchasing decisions of those customers. Some of our competitors may have stronger relationships with some of our existing and potential vendors and, as a result, our ability to have successful interoperability arrangements with these companies may be harmed. Our failure to establish or maintain key relationships with third-party equipment and software vendors may harm our ability to successfully market and sell our software.
Additionally, the interoperability of our software with multiple different networks is significantly dependent on the continued prevalence of standards for IP multimedia services, such as IMS. Some of our existing and potential competitors are network equipment providers who could potentially benefit from the deployment of their own proprietary non-standards-based architectures. If resistance to open standards by network equipment providers becomes prevalent, it could make it more difficult for our software to interoperate with our customers’ networks, which would have a material adverse effect on our ability to license our software to service providers.
We may not be able to detect errors or defects in our software until after full deployment and product liability claims by customers could result in substantial costs.
Our software is sophisticated and is designed to be deployed in large and complex telecommunications networks. Because of the nature of our software, it can only be fully tested when substantially deployed in very large networks with high volumes of telecommunications traffic. Some of our customers have only recently begun to commercially deploy our software and they may discover errors or defects in the software, or the software may not operate as expected. Because we may not be able to detect these problems until full deployment, any errors or defects in our software could affect the functionality of the networks in which it is deployed. As a result, the time it may take us to rectify errors can be critical to our customers. Because of the complexity of our software, it may take a material amount of time for us to resolve errors or defects, if we can resolve them at all. The likelihood of such errors or defects is heightened as we acquire new products from third parties, whether as a result of acquisitions or otherwise.
16
If one of our software products fails, and we are unable to fix the errors or other performance problems expeditiously, or at all, we could experience:
• | damage to our reputation, which may result in the loss of existing or potential customers and market share; |
• | payment of liquidated damages for performance failures; |
• | loss of, or delay in, revenue recognition; |
• | increased service, support, warranty, product replacement and product liability insurance costs, as well as a diversion of development resources; and |
• | costly and time-consuming legal actions by our customers, which could result in significant damages. |
Any of the above events would likely have a material adverse impact on our business, revenue, results of operations, financial condition and reputation.
Data privacy concerns could result in additional cost and liability to us or inhibit sales of our offerings.
Use of the BroadWorks platform and our BroadCloud offerings can involve the storage and transmission of an end-user’s business and personally identifiable information. Thus, maintaining the security of computers, computer networks and data storage resources is a critical issue for us and our service provider customers, as security breaches could result in the loss of and/or unauthorized access to this information. Data privacy is a significant issue in the United States, Europe, and in many other countries where we offer our hosted services. The regulatory framework for privacy issues worldwide is complex, dynamic and likely to remain uncertain for the foreseeable future.
In the United States, there are multiple state and federal laws governing the collection, use and disclosure of the information we store and process in our systems. For example, the Electronic Communications Privacy Act protects electronic communications, among other things; The Federal Trade Commission Act, which prohibits unfair and deceptive privacy practices, covers acts that are unfair or deceptive to consumers; Customer Proprietary Network Information rules restrict use of call records; the Computer Fraud and Abuse Act protects users from unauthorized collection of data from a computer or device; the Communications Assistance for Law Enforcement Act of 1994 requires VoIP operators to assist law enforcement with communications monitoring; and the Cable Privacy Act of 1984 places restrictions on disclosure of any personally identifiable information related to a cable subscriber, among other things.
Internationally, virtually every jurisdiction in which we operate has established its own data security and privacy legal framework with which we, our service providers and our customers must comply, including the Data Protection Directive established in the European Union and the Federal Data Protection Act in Germany, which place broad restrictions on use and collection of personal data, including restrictions on cross-border data flows. The rules being adopted in each jurisdiction could change and those changes standards may impose requirements that are inconsistent with our, and our service providers’, existing data management practices or the features of our hosted services. Further, many federal, state and foreign government bodies and agencies have introduced and are currently considering additional laws and regulations. If passed, we will likely incur additional expenses and costs associated with complying with such laws. In addition to government regulation, privacy advocacy and industry groups may propose new and different self-regulatory standards that either legally or contractually apply to us. Our customers may also propose other new and different privacy standards contractually. There are also changes to various privacy arrangements between the United States and foreign governments. On July 12, 2016, the European Commission determined the new E.U.-U.S. Privacy Shield Framework adequate to enable data transfers under EU law. On January 12, 2017, the Swiss Government determined the new Swiss-U.S. Privacy Shield Framework is a valid legal mechanism to enable personal data transfers under Swiss law. As with previous frameworks, these new frameworks could be challenged, and if challenged and ruled inadequate, could result in uncertainty relating to the transfer of data.
Because the interpretation and application of privacy and data protection laws are still uncertain and industry standards are constantly in flux, it is possible that these laws and industry standards may impose requirements that are inconsistent with our, and our service providers’, existing data management practices or the features of our hosted services. If so, in addition to the possibility of fines, lawsuits and other claims and contractual requirements, we and our service providers could be required or compelled to fundamentally change our business activities and practices or modify our hosted services, which could have an adverse effect on our business. Any inability to adequately address privacy concerns, even if unfounded, or comply with applicable privacy or data protection laws, regulations and policies and industry standards, could result in additional costs and other burdens imposed by, the privacy laws, regulations and policies that are applicable to the businesses of our customers may limit the use or adoptions of, and reduce the overall demand for, our hosted services. Privacy and security concerns, whether
17
valid or not valid, may inhibit market adoption of our hosted services particularly in certain foreign countries that perceive the United States as having lesser privacy protections.
If our security measures are breached or unauthorized access to data on our cloud-based networks is otherwise obtained, we may incur significant liabilities under U.S. and foreign laws and our hosted services may be perceived as being vulnerable causing customers to reduce their use of, or stop using, our hosted services.
Our cloud-based services are offered to our customers from hosting facilities located both in the U.S. and in certain countries outside the U.S., and involve the storage and transmission of a large amount of data, and may include personally identifiable data. Security breaches could result in the loss of unauthorized disclosure of this information, degradation of our services or denial of ability of users to access our products and service. If our security measures are breached even as a result of third-party action, employee error, malfeasance or otherwise, such breaches could result in negative publicity that causes our reputation and brand to be damaged, cause our business to suffer, and result in significant legal fines and other financial exposure.
Perpetrators of cyber-attacks may be able to develop and deploy viruses, worms, ransomware, malware and other malicious software programs that attack our products and services, our networks or otherwise exploit any security vulnerabilities of our products, services and networks. Because the techniques used to obtain unauthorized access to networks, or to sabotage systems, change frequently and generally are not recognized until launched against a target, we may be unable to anticipate these techniques or to implement adequate preventative measures. A cyber-attack may cause additional costs, such as investigative and remediation costs, and the costs of providing individuals and/or data owners with notice of the breach, legal fees and the costs of any additional fraud detection activities required by a court or third party. We devote significant resources to addressing security vulnerabilities in our products and services through engineering more secure products and services, enhancing security and reliability features in our products and services, educating our employees on cyber-security and how to mitigate risk posed by potential attacks, deploying security updates to address security vulnerabilities and seeking to respond to known security incidents in sufficient time to minimize any potential adverse impact. We can make no assurance that we will be able to detect, prevent, timely and adequately address or mitigate the negative effects of cyber-attacks or other security breaches.
In the United States, there are multiple state and federal laws governing the security and protection of the information we store and process in our systems. For example, the Federal Trade Commission, or the FTC, frequently investigates and brings enforcement actions against businesses whose data protection, disclosure, or sharing practices are perceived by the FTC as being unfair or deceptive to consumers. Many states require companies to use reasonable safeguards to protect data and most states require that, in the event of a breach of our data security systems involving sensitive data, we notify every person potentially affected by such breach and to pay considerable damages. Because techniques used to obtain unauthorized access or sabotage systems change frequently and are often difficult to identify until they are launched against a target, we may be unable to anticipate these techniques or to implement adequate preventative measures. Further, as the regulatory focus on privacy issues continues to increase and worldwide laws and regulations concerning the protection of personal information expand and become more complex, these potential risks to our business will intensify.
We have no direct control over the substance of the content within our hosted network. U.S. law, in the form of Section 230 of the Communications Decency Act, or the CDA, provides considerable protections for any indirect liability as a result of storing infringing or even illegal content. The CDA provides a safe harbor against claims that content stored on our cloud-based network invades consumer privacy or is indecent, offensive, libelous, profane, pornographic or illegal. The CDA’s safe harbor only offers us partial protection, however, because it only limits our legal liability against allegations that our service provider customer illegally uploaded information to our servers; it offers no protection whatsoever for claims arising from a breach of our security measures.
Any or all of these data privacy concerns could negatively impact our ability to attract new service provider customers and increase engagement by existing service provider customers, cause existing service provider customers to elect to terminate their subscriptions or reduce or delay future purchases, subject us to third-party lawsuits, regulatory fines or other action or liability, thereby increasing our costs and diverting management resources which could materially harm our operating results.
Man-made problems such as computer viruses or terrorism may disrupt our operations and could adversely affect our operating results and financial condition.
Despite our implementation of network security measures, our servers are vulnerable to computer viruses, break-ins and similar disruptions from unauthorized tampering with our computer systems. Any such event could have a material adverse effect on our business, operating results and financial condition. Efforts to limit the ability of third parties to disrupt the operations of the Internet or undermine our own security efforts may be ineffective. In addition, the continued threat of terrorism and heightened security and military action in response to this threat, or any future acts of terrorism, may cause further disruptions to the
18
economies of the United States and other countries and create further uncertainties or otherwise materially harm our business, operating results and financial condition. Likewise, events such as widespread electrical blackouts could have similar negative impacts. To the extent that such disruptions or uncertainties result in delays or cancellations of customer orders or the manufacture or shipment of our products, our business, operating results, financial condition and reputation could be materially and adversely affected.
Any significant disruption in our SaaS hosting network infrastructure, interruptions or delays in services, whether caused by us or third parties on whom we rely, could impair the delivery of our products and harm our business.
We currently host our BroadCloud service and provide such services on a SaaS basis to our service provider customers. This hosting network infrastructure is a critical part of our business operations and we rely on third parties to provide certain portions of this infrastructure. We do not control the operations of the third-party infrastructure providers on which some of our cloud services are deployed and BroadCloud, and these facilities, are vulnerable to any information security breaches, power outages, telecommunications failures or other issues that the data center may experience. Our third party data center providers are also subject to break-ins, computer viruses, sabotage, intentional acts of vandalism and other misconduct. The occurrence of any of these disasters or other unanticipated problems could result in lengthy interruptions in our service. Furthermore, the availability of our platform could be interrupted by a number of additional factors, including our customers’ inability to access the Internet, the failure of our network or software systems due to human or other error, security breaches or ability of the infrastructure to handle spikes in customer usage. We have in the past experienced, and may in the future experience, interruptions, delays and outages in service and availability from time to time due to such factors. Interruptions in our service may reduce our revenue, cause us to issue credits or pay penalties under our agreements with certain customers, cause customers to terminate their subscriptions and adversely affect our renewal rates and our ability to attract new customers. Our business will also be harmed if our customers and potential customers believe our service is unreliable.
The quality of our support and services offerings is important to our customers, and if we fail to offer high quality support and services, customers may not buy our software and our revenue may decline.
Once our products are deployed within our customers’ networks, our customers generally depend on our support organization to resolve issues relating to those products. A high level of support is critical for the successful marketing and sale of our software. If we are unable to provide the necessary level of support and service to our customers, we could experience:
• | loss of customers and market share; |
• | a failure to attract new customers, including in new geographic regions; |
• | increased service, support and warranty costs and a diversion of development resources; and |
• | network performance penalties, including liquidated damages for periods of time that our customers’ networks are inoperable. |
Any of the above results would likely have a material adverse impact on our business, revenue, results of operations, financial condition and reputation.
If we do not introduce and sell new and enhanced products in a timely manner, customers may not buy our products and our revenue may decline.
The market for communications software and services is characterized by rapid technological advances, frequent introductions of new products including via new deployment models such as cloud-based service offerings, evolving industry standards and recurring or unanticipated changes in customer requirements and deployment model preferences. To succeed, we must effectively anticipate, and adapt in a timely manner to, customer requirements and continue to develop or acquire new products and features that meet market demands and technology and architectural trends. This requires us to identify, gain access to or develop new technologies or service models. The introduction of new or enhanced products also requires that we carefully manage the transition from older products to minimize disruption in customer ordering practices and ensure that new products can be timely delivered to meet demand. We may also require additional capital to achieve these objectives and we may be unable to obtain adequate financing on terms satisfactory to us, or at all, when we require it. As a result, our ability to continue to support our business growth and to respond to business challenges could be significantly limited. It is also possible that we may allocate significant amounts of cash and other development resources to product technologies or business models for which market demand is lower than anticipated and, as a result, are abandoned. For example, we have devoted considerable resources to the development of BroadSoft Business, our suite of applications comprising a communications and collaboration offering that enables telecommunications service providers to offer businesses and other enterprises UC features and functionalities on a cloud delivered basis without the need for traditional premise-based PBX equipment.
19
We cannot guarantee our investment in BroadSoft Business will be successful or generate additional revenue from existing or new customers.
Developing our products is expensive and complex and involves uncertainties. We may not have sufficient resources to successfully manage lengthy product development cycles. For the years ended December 31, 2016, 2015 and 2014, our research and development expenses were $77.2 million, or 23% of our total revenue, $60.7 million, or 22% of our total revenue, and $50.1 million, or 23% of our total revenue, respectively. We believe we must continue to dedicate a significant amount of resources to our research and development efforts to remain competitive. These investments may take several years to generate positive returns and they may never do so. In addition, we may experience design, manufacturing, marketing and other difficulties that could delay or prevent the development, introduction or marketing of new products and enhancements. If we fail to meet our development targets, demand for our products will decline.
Furthermore, because our products are based on complex technology, we can experience unanticipated delays in developing, improving or deploying them. Each phase in the development of our products presents serious risks of failure, rework or delay, any one of which could impact the timing and cost effective development of such product and could jeopardize customer acceptance of the product. Intensive software testing and validation are critical to the timely introduction of enhancements to several of our products and schedule delays sometimes occur in the final validation phase. Unexpected intellectual property disputes, failure of critical design elements and a variety of other execution risks may also delay or even prevent the introduction of these products. In addition, the introduction of new products by competitors, the emergence of new industry standards or the development of entirely new technologies to replace existing product offerings could render our existing or future products obsolete. If our products become technologically obsolete, customers may purchase solutions from our competitors and we may be unable to sell our products in the marketplace and generate revenue, which would likely have a material adverse effect on our financial condition, results of operations or cash flows.
We may have difficulty managing our growth, which could limit our ability to increase sales and adversely affect our business, operating results and financial condition.
We have experienced significant growth in sales and operations in recent years. We expect to continue to expand our research and development, sales, marketing and support activities. Our historical growth has placed, and planned further growth is expected to continue to place, significant demands on our management, as well as our financial and operational resources, to:
• | manage a larger organization; |
• | increase our sales and marketing efforts and add additional sales and marketing personnel in various regions worldwide; |
• | recruit, hire and train additional qualified staff; |
• | control expenses; |
• | manage operations in multiple global locations and time zones; |
• | broaden our customer support capabilities; |
• | integrate acquisitions, retain customers and grow the operations of such acquired businesses; |
• | implement appropriate operational, administrative and financial systems to support our growth; and |
• | maintain effective financial disclosure controls and procedures. |
If we fail to manage our growth effectively, we may not be able to execute our business strategies and our business, financial condition and results of operations would be adversely affected.
We depend largely on the continued services of our co-founders, Michael Tessler, our President and Chief Executive Officer, and Scott Hoffpauir, our Chief Technology Officer, and the loss of either of them may impair our ability to grow our business.
The success of our business is largely dependent on the continued services of our senior management and other highly qualified technical and management personnel. In particular, we depend to a considerable degree on the vision, skills, experience and effort of our co-founders, Michael Tessler, our President and Chief Executive Officer, and Scott Hoffpauir, our Chief Technology Officer. Neither of these officers is bound by a written employment agreement and either of them therefore may terminate employment with us at any time with no advance notice. The replacement of either of these two officers would likely involve significant time and costs and the loss of either of these officers would significantly delay or prevent the achievement of our business objectives.
20
If we are unable to retain or hire key personnel, our ability to develop, market and sell products could be harmed.
We believe that there is, and will continue to be, intense competition for highly skilled technical and other personnel with experience in our industry in the Washington, D.C. area, where our headquarters are located, and in other locations where we maintain offices. We must provide competitive compensation packages and a high-quality work environment to hire, retain and motivate employees. If we are unable to retain and motivate our existing employees and attract qualified personnel to fill key positions, we may be unable to manage our business effectively, including the development, marketing and sale of existing and new products, which could have a material adverse effect on our business, financial condition and operating results. To the extent we hire personnel from competitors, we may be subject to allegations that they have been improperly solicited or divulged proprietary or other confidential information. Additionally, the new administration of the U.S. government has enacted, and may enact in the future, measures that may restrict our ability to hire immigrants in the United States, which may harm our recruiting efforts and adversely affect our ability to attract and retain key personnel.
Volatility in, or lack of performance of, our stock price may also affect our ability to attract and retain key personnel. Our executive officers and other employees may be more likely to terminate their employment with us if the shares they own or the shares underlying their vested options have significantly appreciated in value relative to the original purchase prices of the shares or the exercise prices of the options, or if the exercise prices of the options that they hold are significantly above the market price of our common stock. If we are unable to retain our employees, our business, operating results and financial condition will be harmed.
Potential changes in trade relations arising from policy initiatives implemented by the current administration could have a material adverse effect on our business, cash flow operating results and the trading price of our common stock.
For the year ended December 31, 2016, we generated approximately 48% of our total revenue from international sales, including 3% from sales in Mexico. The new administration has created uncertainty with respect to trade relations between the United States and many of its trade partners, including Mexico. If the administration imposes tariffs or other restrictions on imported products, or relations with nations where certain international customers are located otherwise deteriorate, such countries could retaliate by imposing similar tariffs or restrictions on products imported from the United States. Additionally, such measures could cause negative sentiments toward the United States or us by our international customers, If revenue generated from international customers declines significantly, either as a result of administration policies regarding foreign trade or the effects of such policies on foreign currency exchange rates, it could have a material adverse effect on our business, cash flow operating results and the trading price of our common stock.
Our exposure to the credit risks of our customers may make it difficult to collect accounts receivable and could adversely affect our operating results and financial condition.
In the course of our sales to customers, we may encounter difficulty collecting accounts receivable and could be exposed to risks associated with uncollectible accounts receivable. Economic conditions may impact some of our customers’ ability to pay their accounts payable.
While we attempt to monitor these situations carefully and attempt to take appropriate measures to collect accounts receivable balances, we have written down accounts receivable and written off doubtful accounts in prior periods and may be unable to avoid accounts receivable write-downs or write-offs of doubtful accounts in the future. Such write-downs or write-offs could negatively affect our operating results for the period in which they occur and could harm our operating results.
General global economic conditions could adversely affect our operating results and financial condition.
As a company with significant global sales, we are subject to the risks arising from global economic and market conditions. The worldwide economy underwent significant turmoil in the past several years. While the United States economy has strengthened, economic indicators in Europe and Asia are mixed and negative economic and market conditions persist, and the rate and pace of recovery in individual economies is uncertain. The continuing uncertainty about future global economic conditions could negatively impact our current and prospective customers by affecting their buying decisions or ability to obtain financing for significant purchases and operations. Specific economic trends, such as declines in the demand for infrastructure spending by service providers, or softness in corporate telecommunications software spending, could have an even more direct, and harmful, impact on our business. As a result, we could experience fewer orders, longer sales cycles, slower adoption of new technologies by our customers and increased price competition, any of which could materially and adversely affect our business, results of operations and financial condition.
We have made a number of acquisitions, and we may undertake additional strategic transactions to further expand our business, which may pose risks to our business and dilute the ownership of our stockholders.
21
Acquisitions have been, and are expected to continue to be, an important part of our strategy to grow our business and augment our product offerings. Whether we realize the anticipated benefits from these and prior transactions will depend in part upon our ability to service and satisfy new customers gained as part of these acquisitions, the continued integration of the acquired businesses, the performance of the acquired products, the capacities of the technologies acquired and the personnel hired in connection with these transactions. Accordingly, our results of operations could be adversely affected by transaction-related charges, amortization of intangible assets and charges for impairment of long-term assets.
We have evaluated, and expect to continue to evaluate, other potential strategic transactions. We may in the future acquire businesses, products, technologies or services to expand our product offerings, capabilities and customer base, enter new markets or increase our market share. We cannot predict the number, timing or size of future acquisitions, or the effect that any such acquisitions might have on our operating results. Because of our size, any of these transactions could be material to our financial condition and results of operations. While we have experience with such transactions, the anticipated benefits of acquisitions may never materialize. Some of the areas where we may face acquisition-related risks include:
• | diverting management time and potentially disrupting business; |
• | difficulties entering into new markets or vertical segments in which we are not experienced or where competitors may have stronger positions; |
• | expenses, distractions and potential claims resulting from acquisitions, whether or not they are completed; |
• | reducing our cash available for operations and other uses; |
• | an uncertain revenue and earnings stream from the acquired company, which could dilute our earnings; |
• | retaining and integrating employees from any businesses we acquire; |
• | integrating and supporting acquired businesses, products or technologies into our sales channel; |
• | integrating various accounting, management, information, human resources and other systems to permit effective management; |
• | additional regulatory compliance obligations resulting from an acquired business; |
• | the issuance of dilutive equity securities or the incurrence or assumption of debt to finance the acquisition; |
• | incurring possible impairment charges, contingent liabilities, amortization expense or write-offs of goodwill; |
• | unexpected capital expenditure requirements; |
• | insufficient revenues to offset increased expenses associated with the acquisitions; |
• | undetected errors or unauthorized use of a third-party’s code in products of the acquired companies; |
• | increasing or maintaining the security standards for acquired technology consistent with our other services; |
• | entry into markets in which we have no or limited direct prior experience and where competitors have stronger market positions and which are highly competitive; |
• | assuming pre-existing contractual relationships of an acquired company that we would not have otherwise entered into, the termination or modification of which may be costly or disruptive to our business; |
• | being subject to unfavorable revenue recognition or other accounting treatment as a result of an acquired company’s practices; |
• | opportunity costs associated with committing time and capital to such acquisitions; and |
• | acquisition-related litigation, including intellectual property infringement claims. |
Foreign acquisitions involve risks in addition to those mentioned above, including those related to integration of operations across different cultures and languages, our ability to enforce contracts in various jurisdictions, currency risks and the particular economic, political and regulatory risks associated with specific countries. We may not be able to address these risks successfully, or at all, without incurring significant costs, delays or other operating problems that could disrupt our business and have a material adverse effect on our financial condition.
22
Our use of open source software could impose limitations on our ability to commercialize our products.
We incorporate open source software into our products. Although we closely monitor our use of open source software, the terms of many open source software licenses have not been interpreted by U.S. courts, and there is a risk that such licenses could be construed in a manner that could impose unanticipated conditions or restrictions on our ability to sell our products. In such event, we could be required to make our proprietary software generally available to third parties, including competitors, at no cost, to seek licenses from third parties to continue offering our products, to re-engineer our products or to discontinue the sale of our products in the event re-engineering cannot be accomplished on a timely basis or at all, any of which could adversely affect our revenues and operating expenses.
If we fail to maintain proper and effective internal controls, our ability to produce accurate financial statements could be impaired, which would adversely affect our operating results, our ability to operate our business and our stock price.
Ensuring that we have adequate internal financial and accounting controls and procedures in place to produce accurate financial statements is a costly and time-consuming effort that needs to be re-evaluated frequently. Although we believe we have effective internal controls, we may in the future have material weaknesses in our internal financial and accounting controls and procedures.
The Sarbanes-Oxley Act of 2002, or the Sarbanes-Oxley Act, requires that we test our internal control over financial reporting and disclosure controls and procedures. Compliance with Section 404 of the Sarbanes-Oxley Act requires that we incur substantial expense and expend significant management time on compliance-related issues. Moreover, if we are not able to comply with the requirements of Section 404 in the future, or if we or our independent registered public accounting firm identify deficiencies in our internal control over financial reporting that are deemed to be material weaknesses, the market price of our stock may decline and we could be subject to sanctions or investigations by NASDAQ, the SEC or other regulatory authorities, which would require significant additional financial and management resources.
Changes in effective tax rates or adverse outcomes resulting from examination of our income or other tax returns could adversely affect our operating results and financial condition.
Our future effective tax rates could be subject to volatility or adversely affected by a number of factors, including:
• | earnings being lower than anticipated in countries where we have lower statutory tax rates and higher than anticipated earnings in countries where we have higher statutory tax rates; |
• | changes in the valuation of our deferred tax assets and liabilities; |
• | expiration of, or lapses in, the research and development tax credit laws; |
• | expiration or non-utilization of net operating losses; |
• | tax effects of stock-based compensation; |
• | costs related to intercompany restructurings; or |
• | changes in tax laws, regulations, accounting principles or interpretations thereof. |
In addition, we are subject to the continuous examination of our income tax returns by the Internal Revenue Service and other tax authorities. We regularly assess the likelihood of adverse outcomes resulting from these examinations to determine the adequacy of our provision for income taxes.
Outcomes from these continuous examinations could have a material adverse effect on our financial condition, results of operations or cash flows.
We incurred significant indebtedness through the sale of our 2018 Notes and 2022 Notes, and we may incur additional indebtedness in the future. The indebtedness created by the sale of our 2018 Notes and 2022 Notes and any future indebtedness we incur exposes us to risks that could adversely affect our business, financial condition and results of operations.
We incurred $120 million of senior indebtedness in June 2011 when we issued $120 million aggregate principal amount of notes due in 2018, or the 2018 Notes, and incurred $201.3 million of senior indebtedness in September 2015 when we issued $201.3 million aggregate principal amount of notes due in 2022, or the 2022 Notes.
As of December 31, 2016, we had an aggregate of $201.0 million of consolidated indebtedness related to the 2018 Notes and 2022 Notes, which we refer to collectively as the Notes. We may also incur additional long-term indebtedness or obtain additional working capital lines of credit to meet future financing needs. Our indebtedness could have significant negative consequences for our business, results of operations, cash flows and financial condition, including:
23
• | increasing our vulnerability to adverse economic and industry conditions; |
• | limiting our ability to obtain additional financing; |
• | requiring the dedication of a substantial portion of our cash flow from operations to service our indebtedness, thereby reducing the amount of our cash flow available for other purposes; |
• | limiting our flexibility in planning for, or reacting to, changes in our business; and |
• | placing us at a possible competitive disadvantage with less leveraged competitors and competitors that may have better access to capital resources. |
We cannot assure you that we will continue to maintain sufficient cash reserves or that our business will continue to generate cash flow from operations at levels sufficient to permit us to pay principal, premium, if any, and interest on our indebtedness, or that our cash needs will not increase. If we are unable to generate sufficient cash flow or otherwise obtain funds necessary to make required payments, or if we fail to comply with the various requirements of the Notes, or any indebtedness that we may incur in the future, we would be in default, which would permit the holders of the Notes and such other indebtedness to accelerate the maturity of the Notes and such other indebtedness and could cause defaults under the Notes and such other indebtedness. Any default under the Notes or any indebtedness that we may incur in the future could have a material adverse effect on our business, results of operations and financial condition.
The repurchase rights and events of default features of the Notes, if triggered, may adversely affect our financial condition and operating results.
In the event the repurchase rights features of the Notes are triggered, holders of the Notes will be entitled to require us to repurchase all or a portion of their Notes. If the events of default features of the Notes are triggered, holders of the Notes may declare the principal amount of the Notes, plus accrued and unpaid interest thereon, to be immediately due and payable. In either event, we would be required to make cash payments to satisfy our obligations, which could adversely affect our liquidity. In addition, even if holders do not elect to exercise their repurchase rights or declare their Notes immediately due and payable, we could be required under applicable accounting rules to reclassify all or a portion of the outstanding principal of the Notes as a current rather than long-term liability, which could result in a material reduction of our net working capital.
Risks Related to the Telecommunications Industry
We face intense competition in our markets, especially from larger, better-known companies, and we may lack sufficient financial or other resources to maintain or improve our competitive position.
The worldwide markets for our products and services are highly competitive and continually evolving and we expect competition from both established and new companies to increase. Currently, we compete with established network equipment companies such as Avaya Inc., GENBAND, Inc., Huawei Technologies Co. Ltd, Metaswitch Networks and Nokia Corporation for service provider customers. Additionally, we compete indirectly, through our service provider customers, with other companies that offer UC capabilities to enterprises, including Cisco Systems, Inc., Ericsson AB, Microsoft Corporation and Mitel Networks Corporation, as well as over-the-top UC providers such as RingCentral, Inc. and 8x8, Inc. Some of the network equipment companies with which we have non-exclusive distributor partnerships may also provide, as a package, their own network equipment in combination with IP application software that they have developed.
Many of our existing and potential competitors have substantially greater financial, technical, marketing, intellectual property and distribution resources than we have. Their resources may enable them to develop superior products, or they could aggressively price, finance and bundle their product offerings to attempt to gain market adoption or to increase market share. In addition, our customers could also begin using open source software, such as Asterisk, which is incorporated in the products of Digium, Inc., as an alternative to BroadWorks. If our competitors offer deep discounts on certain products in an effort to gain market share or to sell other products or services, or if a significant number of our customers use open source software as an alternative to BroadWorks, we may then need to lower the prices of our products and services, change our pricing models, or offer other favorable terms to compete successfully, which would reduce our margins and adversely affect our operating results.
In addition to price competition, increased competition may result in other aggressive business tactics from our competitors, such as:
• | emphasizing their own size and perceived stability against our smaller size and narrower recognition; |
• | providing customers “one-stop shopping” options for the purchase of network equipment and application server software; |
• | offering customers financing assistance; |
24
• | making early announcements of competing products and employing extensive marketing efforts; |
• | assisting customers with marketing and advertising directed at their subscribers; and |
• | asserting infringement of their intellectual property rights. |
The tactics described above can be particularly effective in the concentrated base of service provider customers to whom we offer our products. Our inability to compete successfully in our markets would harm our operating results and our ability to achieve and maintain profitability.
Over-the-top business models, which provide telecommunications services directly to end-users through third-party network connections, may reduce demand for our services.
Our revenue is largely derived from our service provider customers’ end-users accessing telecommunications services through service provider networks. The emergence of over-the-top services that provide telecommunications services directly to customers over third-party network connections, such as those offered by 8x8, Inc. and RingCentral, Inc., may cause end-users of our service provider customers to reduce their demand for telecommunications through carrier-branded services or to demand carrier-branded services for free or at reduced pricing. Service providers may fail to offer branded services that can compete with these over-the-top services. If end-users do not find service provider-branded services compelling or cost-effective, or demand that our service provider customers provide such communications services for free, or if we are unable to expand or modify our service offerings to compete with, or sell to, potential customers in this market, demand for our services may be reduced, which would harm our business.
Our business depends upon the success of service providers selling IP-based communications services.
We sell software licenses or provide cloud-based UC service offerings to service providers, who then seek to persuade their customers to subscribe to IP-based communications services that use our software. The number of licenses or subscriptions a service provider purchases from us is based in large part on the number of customers the service provider expects will subscribe to its IP-based communications services. When the number of customers using the service provider’s IP services running on our software exceeds the number of licenses or subscriptions, the service provider must purchase additional licenses or subscriptions from us. Accordingly, the growth of our business depends upon the success of service providers in attracting new subscribers to IP-based communications services. Our dependence on service providers exposes us to a number of risks, including the risk that service providers will not succeed in growing and maintaining their IP subscriber base.
If service providers do not succeed in growing and maintaining their IP subscriber base for any reason, then our business, financial condition and results of operations would be harmed.
Competitive pressures in the telecommunications industry may increase and impact our customers’ purchasing decisions, which could reduce our revenue.
Our customers are under increasing competitive pressure from companies within their industry and other participants that offer, or seek to offer, overlapping or similar services. These pressures are likely to continue to cause our customers to seek to minimize the costs of the software platforms that they purchase and may cause static or reduced expenditures by our customers or potential customers. These competitive pressures may also result in pricing becoming a more important factor in the purchasing decisions of our customers. Increased focus on pricing may favor low-cost vendors and our larger competitors that can spread the effect of price discounts across a broader offering of products and services and across a larger customer base.
We expect the developments described above to continue to affect our business by:
• | potentially making it difficult to accurately forecast revenue and manage our business; |
• | exposing us to potential unexpected declines in revenue; and |
• | exposing us to potential losses because we expect that a high percentage of our operating expenses will continue to be fixed in the short-term. |
Any one or a combination of the above effects could materially and adversely affect our business, operating results and financial condition.
Consolidation in the telecommunications industry will likely continue and result in delays or reductions in capital expenditure plans and increased competitive pricing pressures, which could reduce our revenue.
The telecommunications industry has experienced significant consolidation over the past several years. We expect this trend to continue as companies attempt to strengthen or retain their market positions in an evolving industry and as businesses are
25
acquired or are unable to continue operations. Consolidation among our customers, distribution partners and technology partners may cause delays or reductions in capital expenditure plans and increased competitive pricing pressures as the number of available customers and partners declines and their relative purchasing power increases in relation to suppliers. Additionally, the acquisition of one of our customers, distribution partners or technology partners by a company that uses or sells the products of one of our competitors could result in our loss of the customer or partner if the acquiring company elects to switch the acquired company to our competitor’s products. Moreover, the consolidation in the number of potential customers and distribution partners could increase the risk of quarterly and annual fluctuations in our revenue and operating results. Any of these factors could adversely affect our business, financial condition and results of operations.
Regulation of IP-based networks and commerce in the United States and elsewhere may increase, compliance with these regulations may be time-consuming, difficult and costly and, if we fail to comply, our sales might decrease.
In general, the telecommunications industry is highly regulated. However, to date Congress and the Federal Communications Commission, or the FCC, have imposed less regulation on IP-based services and networks. We could be adversely affected by regulation of IP-based services or networks in any country where we do business, including the United States. Regulatory treatment of VoIP telephony outside the United States varies from country to country and often the laws are unclear. We currently distribute our products and services directly to service providers and through resellers that may be subject to telecommunications regulations in their home countries. The failure by us or our customers or resellers to comply with these laws and regulations could reduce our revenue and profitability. As we expand our BroadCloud offerings and operations internationally, we have been and expect to continue to be subject to additional government regulations. Such regulations could include matters such as using or providing VoIP services or protocols, encryption technology and access charges for service providers. The existence of such regulations could prohibit entry into a target market or force us to withdraw products in one or more jurisdictions. As a result, overall demand for our products could decrease and, at the same time, the cost of selling our products could increase, either of which, or the combination of both, could have a material adverse effect on our business, operating results and financial condition.
In addition, the convergence of the public switched telephone network, or PSTN, and IP-based networks could become subject to governmental regulation, including the imposition of access fees or other tariffs, and such regulation could adversely affect the market for our products and services. User uncertainty regarding future policies and regulations may also affect demand for communications products such as ours. We may be required, or we may otherwise deem it necessary or advisable, to alter our products to address actual or anticipated changes in the regulatory environment. Our inability to timely alter our products or address any regulatory changes may have a material adverse effect on our financial condition, results of operations or cash flows.
We are subject to certain FCC rules and regulations, including with respect to the provision of enhanced 911 services, or E911 services, disability access requirements, communications assistance for law enforcement requirements, customer proprietary network information requirements, and other requirements. We are unable to predict the impact, if any, that future legislation, judicial decisions or FCC or other regulations concerning hosted VoIP service providers generally may have on our business, financial condition, and results of operations, and if we fail to comply with applicable state or federal rules associated with such services, including the provision of E911 services, we may be exposed to significant liability.
Risks Related to Our International Operations
We are exposed to risks related to our international operations and failure to manage these risks may adversely affect our operating results and financial condition.
We market, license and service our products globally and have a number of offices around the world. For the years ended December 31, 2016, 2015 and 2014, 48%, 38% and 51% of our revenue, respectively, was attributable to our international customers. As of December 31, 2016, 54% of our employees were located abroad. We expect that our international activities will continue to be dynamic over the foreseeable future as we pursue additional opportunities in international markets. Therefore, we are subject to risks associated with having worldwide operations. These international operations will require significant management attention and financial resources.
International operations are subject to inherent risks and our future results could be adversely affected by a number of factors, including:
• | requirements or preferences for domestic products, which could reduce demand for our products; |
• | differing technical standards, existing or future regulatory and certification requirements and required product features and functionality; |
• | management communication and integration problems related to entering new markets with different languages, cultures and political systems; |
26
• | greater difficulty in collecting accounts receivable and longer collection periods; |
• | difficulties and costs of staffing and managing foreign operations; |
• | the uncertainty of protection for intellectual property rights in some countries and complex data privacy regulations in various jurisdictions; |
• | potentially adverse tax consequences, including regulatory requirements regarding our ability to repatriate profits to the United States; and |
• | political and economic instability and terrorism. |
Additionally, our international operations expose us to risks of fluctuations in foreign currency exchange rates. To date, the significant majority of our international sales have been denominated in U.S. dollars, although most of our expenses associated with our international operations are denominated in local currencies. As a result, a decline in the value of the U.S. dollar relative to the value of these local currencies could have a material adverse effect on the gross margins and profitability of our international operations. Additionally, an increase in the value of the U.S. dollar relative to the value of these local currencies results in our products being more expensive to potential customers and could have an adverse impact on our pricing or our ability to sell our products internationally. As of December 31, 2016, we had not used risk management techniques to hedge the risks associated with these fluctuations; however, beginning in the first quarter of 2017, we began using a hedging program. Even if we were to implement hedging strategies, not every exposure can be hedged and, where hedges are put in place based on expected foreign currency exchange exposure, they are based on forecasts that may vary or that may later prove to have been inaccurate. As a result, fluctuations in foreign currency exchange rates or our failure to successfully hedge against these fluctuations could have a material adverse effect on our operating results and financial condition.
We rely significantly on distribution partners to sell our products in certain international markets, the loss of which could materially reduce our revenue.
We sell our products to telecommunication service providers both directly and indirectly through distribution partners such as telecommunications equipment vendors, VARs and other distributors. We believe that establishing and maintaining successful relationships with these distribution partners is, and will continue to be, important to our financial success. Recruiting and retaining qualified distribution partners and training them in our technology and product offerings requires significant time and resources. To develop and expand our distribution channel, we must continue to scale and improve our processes and procedures that support our channel, including investment in systems and training.
In addition, existing and future distribution partners will only partner with us if we are able to provide them with competitive products on terms that are commercially reasonable to them. If we fail to maintain the quality of our products or to update and enhance them, existing and future distribution partners may elect to partner with one or more of our competitors. In addition, the terms of our arrangements with our distribution partners must be commercially reasonable for both parties. If we are unable to reach agreements that are beneficial to both parties, then our distribution partner relationships will not succeed.
The reduction in or loss of sales by these distribution partners could materially reduce our revenue. If we fail to maintain relationships with our distribution partners, fail to develop new relationships with other distribution partners in new markets, fail to manage, train or incentivize existing distribution partners effectively or fail to provide distribution partners with competitive products on terms acceptable to them, or if these partners are not successful in their sales efforts, our revenue may decrease and our operating results could suffer.
We have no long-term contracts or minimum purchase commitments with any VARs or telecommunications equipment vendors, and our contracts with these distribution partners do not prohibit them from offering products or services that compete with ours, including products they currently offer or may develop in the future and incorporate into their own systems. Some of our competitors may have stronger relationships with our distribution partners than we do and we have limited control, if any, as to whether those partners implement our products, rather than our competitors’ products, or whether they devote resources to market and support our competitors’ products, rather than our offerings. Our failure to establish and maintain successful relationships with distribution partners could materially adversely affect our business, operating results and financial condition.
We are subject to governmental export and import controls that could subject us to liability or impair our ability to compete in international markets.
Our products are subject to United States export controls and may be exported outside the United States only with the required level of export license or through an export license exception, because certain of our products contain encryption technology. In addition, various countries regulate the import of certain encryption technology and have enacted laws that could limit our ability to distribute certain of our products or could limit our customers’ ability to implement these products in those countries. Changes in our products or changes in export and import regulations may create delays in the introduction of our products in
27
international markets, prevent our customers with international operations from deploying our products throughout their networks or, in some cases, prevent the export or import of our products to certain countries altogether. Any change in export or import laws and regulations, shifts in approach to the enforcement or scope of existing laws and regulations, or change in the countries, persons or technologies targeted by such regulations, could result in decreased use of our products by, or in our decreased ability to export or sell our products to, existing or potential customers with international operations. Any decreased use of our products or limitation on our ability to export or sell our products would likely adversely affect our business, operating results and financial condition.
We may not successfully sell our products in certain geographic markets or develop and manage new sales channels in accordance with our business plan.
We expect to continue to sell our products in certain geographic markets where we do not have significant current business and to a broader customer base. To succeed in certain of these markets, we believe we will need to develop and manage new sales channels and distribution arrangements. Because we have limited experience in developing and managing such channels, we may not be successful in further penetrating certain geographic regions or reaching a broader customer base. Failure to develop or manage additional sales channels effectively would limit our ability to succeed in these markets and could adversely affect our ability to grow our customer base and revenue.
Failure to comply with the United States Foreign Corrupt Practices Act, or FCPA, and similar laws associated with our activities outside the United States could subject us to penalties and other adverse consequences.
As a substantial portion of our revenue is, and we expect will continue to be, from jurisdictions outside of the United States, we face significant risks if we fail to comply with the FCPA and other laws that prohibit us and other business entities with whom we do business from making improper payments or offers of payment to governments and their officials and political parties for the purpose of obtaining or retaining business. Although we have implemented policies and procedures designed to ensure compliance with these laws and regulations, there can be no assurance that our employees, contractors or resellers will not violate our policies. If we are found to be liable for violations of the FCPA or similar anti-corruption laws in international jurisdictions, either due to our own acts or out of inadvertence, or due to the acts or inadvertence of others, including employees or vendors of acquired entities located outside of the United States, we could suffer from criminal or civil penalties that could have a material and adverse effect on our business, operating results and financial condition.
Risks Related to Ownership of Our Common Stock
Our stock price has been and may continue to be highly volatile, and you may not be able to sell shares of our common stock at or above the price you paid.
Our stock price has been and may continue to be highly volatile and it could be subject to wide fluctuations in response to various factors, some of which are beyond our control. These factors include those discussed in this “Risk Factors” section and others such as:
• | a slowdown in the telecommunications industry or the general economy; |
• | quarterly or annual variations in our results of operations or those of our competitors; |
• | changes in earnings estimates or recommendations by securities analysts; |
• | announcements by us or our competitors of new products or services, significant contracts, commercial relationships, capital commitments or acquisitions; |
• | developments with respect to intellectual property rights; |
• | our ability to develop and market new and enhanced products on a timely basis; |
• | our commencement of, or involvement in, litigation; |
• | departure of key personnel; and |
• | changes in governmental regulations. |
In addition, in recent years, the stock markets generally, and the market for technology stocks in particular, have experienced extreme price and volume fluctuations that have often been unrelated or disproportionate to the operating performance of those companies. During the period from January 1, 2015 to December 31, 2016, our common stock traded at prices ranging from $26.89 to $48.30. Broad market and industry factors may seriously affect the market price of our common stock, regardless of our actual operating performance. In the past, class action litigation has often been instituted against companies whose securities have experienced periods of volatility in market price. Securities litigation brought against us following volatility in
28
our stock price, regardless of the merit or ultimate results of such litigation could result in substantial costs, which would hurt our financial condition and operating results and divert management’s attention and resources from our business.
Securities analysts may not publish favorable research or reports about our business or may publish no information which could cause our stock price or trading volume to decline.
The trading market for our common stock will be influenced by the research and reports industry or financial analysts publish about us and our business. We do not control these analysts. If any of the analysts who cover us issue an adverse opinion regarding our stock price, our stock price would likely decline. If one or more of these analysts cease coverage of our company or fail to regularly publish reports covering us, we could lose visibility in the market, which in turn could cause our stock price or trading volume to decline.
We do not intend to pay dividends for the foreseeable future and our stock may not appreciate in value.
We currently intend to retain our future earnings, if any, to finance the operation and growth of our business and do not expect to pay any cash dividends in the foreseeable future. As a result, the success of an investment in shares of our common stock will depend upon any future appreciation in its value. There is no guarantee that shares of our common stock will appreciate in value or that the price at which our stockholders have purchased their shares will be able to be maintained.
Provisions in our charter documents and under Delaware law could discourage potential acquisition proposals, could delay, deter or prevent a change in control and could limit the price certain investors might be willing to pay for our common stock.
Our certificate of incorporation and bylaws include provisions that may delay or prevent an acquisition of us or a change in our management. These provisions include a classified board of directors with three-year staggered terms, a prohibition on actions by written consent of our stockholders and the ability of our board of directors to issue preferred stock without stockholder approval. In addition, because we are incorporated in Delaware, we are governed by the provisions of Section 203 of the Delaware General Corporation Law, which prohibits stockholders owning in excess of 15% of our outstanding voting stock from merging or combining with us in certain circumstances. Although we believe these provisions collectively provide for an opportunity to receive higher bids by requiring potential acquirers to negotiate with our board of directors, they would apply even if the offer may be considered beneficial by some stockholders. In addition, these provisions may frustrate or prevent attempts by our stockholders to replace or remove our current management by making it more difficult for stockholders to replace members of our board of directors, which is responsible for appointing the members of our management.
These provisions could discourage potential acquisition proposals or could delay, deter or prevent a change in control, including transactions that may be in the best interests of our stockholders. Additionally, these provisions could limit the price certain investors might be willing to pay for our common stock.
Provisions in the indentures for the Notes may deter or prevent a business combination.
Under the terms of the indentures governing the Notes, the occurrence of certain merger and business combination transactions could require us to repurchase all or a portion of the Notes, or, in some circumstances, increase the conversion rate applicable to the Notes. In addition, the indentures for the Notes prohibits us from engaging in certain mergers or business combination transactions unless, among other things, the surviving entity assumes our obligations under the Notes. These and other provisions could prevent or deter a third party from acquiring us even where the acquisition could be beneficial to our stockholders.
We may issue additional shares of our common stock or instruments convertible into shares of our common stock, including additional shares associated with the potential conversion of the Notes, which could materially and adversely affect the market price of our common stock and cause dilution to existing stockholders.
Upon conversion of the Notes, we will repay the principal portion of the Notes in cash, but we will deliver shares of common stock to the note holder in respect of any conversion value of the Notes. Additionally, we are not restricted from issuing additional shares of our common stock or other instruments convertible into, or exchangeable or exercisable for, shares of our common stock. If we issue additional shares of our common stock, including upon the conversion of the Notes, or if we issue additional instruments convertible into shares of our common stock, it may materially and adversely affect the market price of our common stock. The issuance of additional shares of our common stock, including upon conversion of some or all of the Notes, will also dilute the ownership interests of existing holders of our common stock. Dilution will be greater if the conversion rate of the Notes is adjusted upon the occurrence of certain events specified in the indentures to the Notes.
29
Item 1B. | Unresolved Staff Comments |
None.
Item 2. | Properties |
Our principal offices occupy 35,000 square feet of leased office space in Gaithersburg, Maryland which we lease pursuant to a sublease with a sublessor. We also maintain sales, development or technical assistance offices in Phoenix, Arizona; San Jose and Sunnyvale, California; Richardson and Houston, Texas; Tulsa, Oklahoma; Boca Raton, Florida; McLean, Virginia; Cedar Rapids, Iowa; Montreal, Canada; Belfast, Northern Ireland; Crawley, United Kingdom; Chennai and Bangalore, India; Paris, France; Seoul, South Korea; Sydney, Australia; Tokyo, Japan; Sophia, Bulgaria; Cologne, Germany; and Helsinki, Finland.
Item 3. | Legal Proceedings |
We are subject to litigation and claims arising in the ordinary course of business. While we intend to defend ourselves vigorously, we cannot be certain of any particular outcome and an adverse outcome in this lawsuit could have a material adverse effect on our business. We are not aware of any pending or threatened legal proceeding against us that could have a material adverse effect on our business, operating results or financial condition. The software and communications infrastructure industries are characterized by frequent claims and litigation, including claims regarding patent and other intellectual property rights as well as improper hiring practices and claims for indemnification. As a result, we may be involved in various legal proceedings from time to time.
Item 4. | Mine Safety Disclosures |
Not applicable.
30
PART II
Item 5. | Market for Registrant’s Common Equity, Related Stockholder Matters and Issuer Purchases of Equity Securities |
Market Information for Common Stock
Our common stock is traded on the NASDAQ Global Select Market under the symbol “BSFT."
The following table sets forth for the indicated periods the high and low sales prices of our common stock as reported on the NASDAQ Global Select Market.
2016 | |||||||||||||||
First Quarter | Second Quarter | Third Quarter | Fourth Quarter | ||||||||||||
High | $ | 41.09 | $ | 44.49 | $ | 48.01 | $ | 48.40 | |||||||
Low | 26.99 | 35.01 | 39.89 | 37.75 | |||||||||||
2015 | |||||||||||||||
First Quarter | Second Quarter | Third Quarter | Fourth Quarter | ||||||||||||
High | $ | 35.76 | $ | 38.83 | $ | 36.80 | $ | 40.90 | |||||||
Low | 26.42 | 31.51 | 27.84 | 28.37 | |||||||||||
Dividend Policy
We have never declared or paid dividends on our capital stock. We currently intend to retain all available funds and any future earnings to support operations and to finance the growth and development of our business. We do not intend to declare or pay cash dividends on our common stock in the foreseeable future. Any future determination to pay dividends will be made at the discretion of our board of directors, subject to applicable laws, and will depend upon, among other factors, our results of operations, financial condition, contractual restrictions and capital requirements.
Stockholders
As of February 21, 2017, there were 17 registered stockholders of record of our common stock.
Stock Performance Graph
The graph set forth below compares the cumulative total stockholder return on an initial investment of $100 in our common stock between December 31, 2011 and December 31, 2016, with the comparative cumulative total return of such amount on (a) the NASDAQ Telecommunications Index and (b) the NASDAQ Composite Index, over the same period. We have not paid any cash dividends and, therefore, the cumulative total return calculation for us is based solely upon stock price appreciation and not upon reinvestment of cash dividends.
The comparisons shown in the graph below are based upon historical data. We caution that the stock price performance shown in the graph below is not necessarily indicative of, nor is it intended to forecast, the potential future performance of our common stock. Data for BroadSoft common stock, the NASDAQ Telecommunications Index and the NASDAQ Composite Index was prepared based on publicly available information.
31
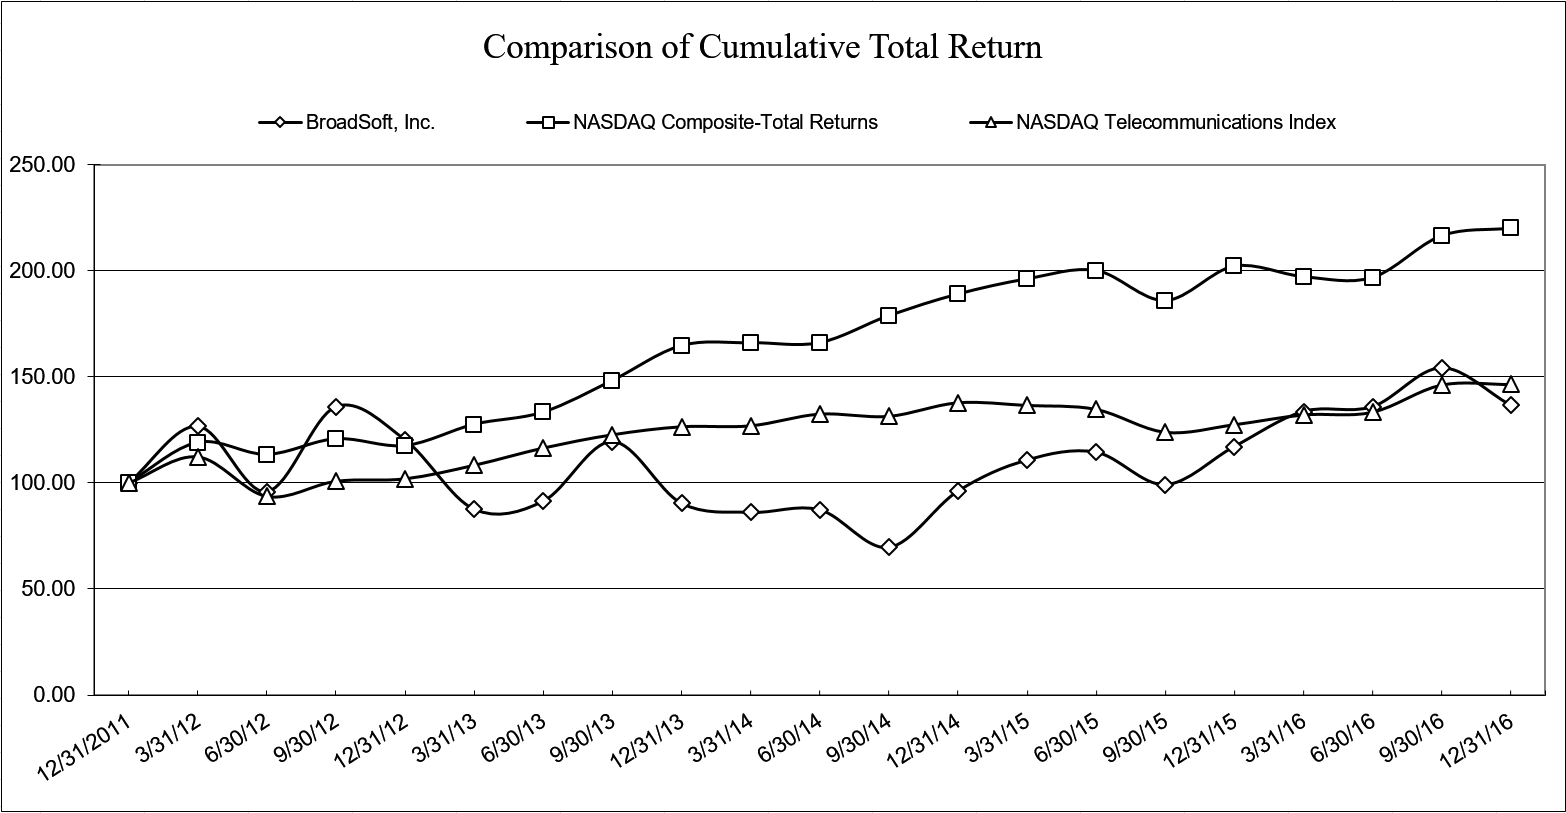
The information presented above in the stock performance graph shall not be deemed to be “soliciting material” or to be “filed” with the SEC or subject to Regulation 14A or 14C, except to the extent that we subsequently specifically request that such information be treated as soliciting material or specifically incorporate it by reference into a filing under the Securities Act of 1933, as amended, or a filing under the Securities Exchange Act of 1934, as amended.
Recent Sale of Unregistered Securities
None.
Purchases of Equity Securities by the Issuer and Affiliated Purchasers
None.
32
Item 6. | Selected Consolidated Financial Data |
You should read the following selected consolidated financial data together with “Management’s Discussion and Analysis of Financial Condition and Results of Operations,” our consolidated financial statements and the related notes included in this Annual Report on Form 10-K.
We derived the consolidated financial data for the years ended December 31, 2016, 2015 and 2014 and as of December 31, 2016 and 2015 from our audited consolidated financial statements, which are included elsewhere in this Annual Report on Form 10-K. We derived the consolidated financial data for the years ended December 31, 2013 and 2012 and as of December 31, 2014, 2013 and 2012 from financial statements that are not included in this Annual Report on Form 10-K. Historical results are not necessarily indicative of the results to be expected in any future periods.
Statements of Operations Data:
Years Ended December 31, | |||||||||||||||||||
2016 | 2015 | 2014 | 2013 | 2012 | |||||||||||||||
(in thousands, except per share data) | |||||||||||||||||||
Statements of Operations: | |||||||||||||||||||
Revenue: | |||||||||||||||||||
License software | $ | 129,313 | $ | 119,808 | $ | 103,311 | $ | 94,408 | $ | 89,750 | |||||||||
Subscription and maintenance support | 146,615 | 112,836 | 92,492 | 69,357 | 58,249 | ||||||||||||||
Professional services and other | 65,034 | 46,199 | 21,054 | 14,728 | 16,843 | ||||||||||||||
Total revenue | 340,962 | 278,843 | 216,857 | 178,493 | 164,842 | ||||||||||||||
Cost of revenue: | |||||||||||||||||||
License software | 7,585 | 10,231 | 9,755 | 8,867 | 8,420 | ||||||||||||||
Subscription and maintenance support | 46,717 | 38,602 | 32,984 | 20,359 | 14,729 | ||||||||||||||
Professional services and other | 36,875 | 28,925 | 14,955 | 10,415 | 8,905 | ||||||||||||||
Total cost of revenue | 91,177 | 77,758 | 57,694 | 39,641 | 32,054 | ||||||||||||||
Gross profit | 249,785 | 201,085 | 159,163 | 138,852 | 132,788 | ||||||||||||||
Operating expenses: | |||||||||||||||||||
Sales and marketing | 107,142 | 83,806 | 69,471 | 56,822 | 46,036 | ||||||||||||||
Research and development | 77,202 | 60,749 | 50,125 | 45,271 | 35,060 | ||||||||||||||
General and administrative | 49,934 | 41,287 | 32,993 | 29,992 | 22,769 | ||||||||||||||
Total operating expenses | 234,278 | 185,842 | 152,589 | 132,085 | 103,865 | ||||||||||||||
Income from operations | 15,507 | 15,243 | 6,574 | 6,767 | 28,923 | ||||||||||||||
Other expense, net | 13,231 | 15,100 | 8,477 | 6,798 | 6,480 | ||||||||||||||
Income (loss) before income taxes | 2,276 | 143 | (1,903 | ) | (31 | ) | 22,443 | ||||||||||||
Provision for (benefit from) income taxes | 1,460 | (36 | ) | (2,199 | ) | (406 | ) | 7,612 | |||||||||||
Net income | $ | 816 | $ | 179 | $ | 296 | $ | 375 | $ | 14,831 | |||||||||
Net income per common share: | |||||||||||||||||||
Basic | $ | 0.03 | $ | 0.01 | $ | 0.01 | $ | 0.01 | $ | 0.54 | |||||||||
Diluted | $ | 0.03 | $ | 0.01 | $ | 0.01 | $ | 0.01 | $ | 0.53 | |||||||||
Weighted average common shares outstanding: | |||||||||||||||||||
Basic | 29,670 | 29,113 | 28,654 | 28,116 | 27,581 | ||||||||||||||
Diluted | 30,898 | 29,818 | 29,365 | 28,711 | 28,215 | ||||||||||||||
Stock-based compensation expense included above: | |||||||||||||||||||
Cost of revenue | $ | 8,340 | $ | 7,227 | $ | 3,862 | $ | 3,122 | $ | 1,399 | |||||||||
Sales and marketing | 18,056 | 13,821 | 9,856 | 8,984 | 3,734 | ||||||||||||||
Research and development | 15,062 | 11,844 | 10,164 | 8,800 | 3,380 | ||||||||||||||
General and administrative | 10,049 | 7,552 | 6,391 | 6,526 | 3,001 | ||||||||||||||
33
Balance Sheet Data:
As of December 31, | |||||||||||||||||||
2016 | 2015 | 2014 | 2013 | 2012 | |||||||||||||||
(in thousands) | |||||||||||||||||||
Consolidated Balance Sheet Data: | |||||||||||||||||||
Cash and cash equivalents | $ | 82,993 | $ | 175,857 | $ | 101,543 | $ | 69,866 | $ | 90,545 | |||||||||
Working capital | 227,778 | 234,506 | 156,322 | 156,101 | 157,381 | ||||||||||||||
Total assets | 651,200 | 592,374 | 436,151 | 382,018 | 322,023 | ||||||||||||||
Convertible senior notes, notes payable and bank loans, less current portion | 201,015 | 188,331 | 95,628 | 89,722 | 84,632 | ||||||||||||||
Total liabilities | 349,966 | 335,341 | 223,190 | 189,159 | 163,438 | ||||||||||||||
Total stockholders’ equity | 301,234 | 257,033 | 212,961 | 192,859 | 158,585 | ||||||||||||||
34
Item 7. | Management’s Discussion and Analysis of Financial Condition and Results of Operations |
Company Overview
We are the leading global provider of software and services that enable telecommunications service providers to deliver hosted, cloud-based Unified Communications, or UC, to their enterprise customers.
Traditionally, many enterprises have utilized premise-based private branch exchanges, or PBX’s, to connect their offices and people to public telephony networks. Hosted UC enables the delivery of PBX features without the need for premise-based equipment. Hosted UC can be delivered through service providers using their own internet protocol, or IP-based networks and their mobile networks, as well as over the public internet (also known as "over the top" or ''OTT''). In addition to voice telephony, UC offers additional features such as full integration with mobile devices, high definition, or HD, voice and video calling and conferencing, instant messaging and presence, or IM&P, and web collaboration.
We believe we are well positioned to enable service providers to capitalize on increasing demand by enterprises for such UC services by enabling them to efficiently and cost-effectively offer a broad suite of services to their end-users. Our service provider customers, who are located in over 80 countries, are delivering services and have deployed over 13 million UC subscriber lines worldwide using our software. We count among our customers 25 of the top 30 telecommunications service providers globally, as measured by revenue for the year ended December 31, 2015.
Executive Summary
We believe the adoption of cloud-based unified communications and collaboration capabilities by enterprises will continue and even accelerate over the next several years. We also believe that service providers using our products and services are strongly positioned to take advantage of this demand. Our objective is to provide our service provider customers with the service and software offerings they need to effectively address this market opportunity and their end-user customer needs.
We expect revenue growth from our UC and collaboration solutions during 2017, which growth we believe is largely driven by increased market acceptance of hosted UC offerings and our continued market leadership. We believe service providers, including converged and mobile operators, have determined that our UC solutions provide significant product expansions to their enterprise offerings, and help them grow their enterprise customer base and revenue and raise average revenue per user.
Our BroadSoft Business solutions, which are either delivered via our BroadCloud SaaS platform or through our BroadWorks server software that resides within the service provider’s network, enable service providers to rapidly and efficiently deliver a UC experience regardless of end-user device and whether or not the end-user has fixed-line or wireless access. In addition, we believe that mobile network centric UC offerings will become an increasingly important trend in the UC market, and we believe that our service provider customers are in a strong position to take advantage of this market trend. In 2016, major service provider customers of ours, such as Verizon Wireless, Rogers Communications and Vodafone Germany, announced and marketed such mobile centric offerings based on our BroadWorks platform.
During 2017, our BroadCloud SaaS offerings will continue to be a particularly important area of investment and marketing focus for us. Many of our service provider customers are interested in accessing the capabilities of our BroadWorks features and functions through a service offering hosted and managed by us. We believe that service providers choose our SaaS offerings to accelerate their time to market and reduce their capital and implementation costs and that delivering innovative solutions to our customers will drive our revenue growth. During 2017, we expect to continue to invest in our SaaS offerings and expand the geographic availability of these offerings.
We are expanding our BroadSoft Business capabilities by enabling enterprises and people to be more flexible and dynamically communicate, interact and collaborate by helping them integrate their communication and collaborative tools. Our goal is to enable service providers to adopt BroadSoft Business as the centerpiece in what we have entitled "The Future of Work." BroadSoft Business includes UC-One, our UC offering; Team-One, our enterprise collaboration solution; and CC-One, our contact center offering. We believe that BroadSoft Business is the leading integrated offering of UC, collaboration and contact center capabilities. BroadSoft Business enables us to provide our service provider customers significant expansion of their communication and collaboration capabilities and options, driven by demands of these customers for these capabilities increasingly delivered on mobile platforms. During 2017, we expect to continue our strategic investments in, and expansion of, our BroadSoft Business solutions.
Finally, we have assisted several of our largest service provider customers on projects to begin transforming most, if not all, of their legacy fixed and mobile circuit switched networks to IP-based networks, driven in part by the movement to migrate their wireless networks to VoLTE. Much of our work has been to provide our customers with UC capabilities in these network transformations. In 2016, we gained acceptance from these customers of our initial implementations of certain of these projects, which contributed to our financial results. In 2017, we expect to continue to see positive revenue impact from these
35
projects and believe existing transformation projects, as well as new opportunities with certain of our major service provider customers, could drive significant growth for us over the next several years.
Key Financial Highlights
Some of our key U.S. GAAP financial highlights for the year ended December 31, 2016 include:
• | Total revenue increased by 22%, or $62.1 million, to $341.0 million, compared to $278.8 million for 2015; |
• | Gross profit increased to $249.8 million, or 73% of revenue, compared to $201.1 million, or 72% of revenue for 2015; |
• | Income from operations was $15.5 million, compared to $15.2 million for 2015; |
• | Net income was $0.8 million, compared to $0.2 million for 2015; |
• | Net income per diluted share was $0.03 per share, compared to $0.01 per share for 2015; |
• | Billings (revenue plus net change in deferred revenue) increased by 18% to $339.1 million, compared to $288.4 million for 2015; |
• | Deferred revenue decreased by $1.9 million, compared to an increase of $9.6 million for 2015; and |
• | Cash provided by operating activities was $67.1 million, compared to $44.8 million for 2015. |
Some of our key non-GAAP financial highlights for the year ended December 31, 2016 include:
• | Non-GAAP gross profit increased to $264.7 million, or 78% of revenue, compared to $214.4 million, or 77% of revenue in 2015; |
• | Non-GAAP income from operations was $73.6 million, or 22% of total revenue, compared to $61.8 million, or 22% of total revenue, in 2015; |
• | Non-GAAP net income was $71.1 million, compared to $58.6 million in 2015; and |
• | Non-GAAP net income per diluted share was $2.30 per common share, compared to $1.96 per common share in 2015. |
For a discussion of these non-GAAP financial measures and a reconciliation of GAAP and non-GAAP financial results, please refer to “Non-GAAP Financial Measures” included elsewhere in this Management’s Discussion and Analysis of Financial Condition and Results of Operations.
Components of Operating Results
Revenue
We derive our revenue primarily from software licenses, subscription and maintenance support and professional services and other. We recognize revenue when all revenue recognition criteria have been met in accordance with revenue recognition guidance. This guidance provides that revenue should be recognized when persuasive evidence of an arrangement exists, delivery has occurred, the price is fixed or determinable and collection is probable.
Our total revenue consists of the following:
License software. We derive license software revenue primarily from the sale of perpetual software licenses. We generally price our software based on the packages of features and applications provided and on the number of subscriber licenses sold. These factors impact the average selling price of our licenses and the comparability of average selling prices. Our license software revenue may vary significantly from quarter to quarter or from year to year as a result of long sales and deployment cycles, variations in customer ordering practices and the application of management’s judgment in applying complex revenue recognition rules. Our deferred license software revenue balance consists of software orders that do not meet all the criteria for revenue recognition. We are unable to predict with certainty the proportion of orders that will meet all the criteria for revenue recognition relative to those orders that will not meet all such criteria and, as a result, it is difficult to forecast whether recognized license software revenue and deferred license software revenue will continue to increase or decrease in a given period. As of December 31, 2016, our deferred license software revenue balance was $17.7 million, the current portion of which was $17.6 million.
36
Subscription and maintenance support. Subscription and maintenance support revenue includes recurring revenue from annual maintenance support contracts for our software licenses and from subscriptions related to our SaaS offerings.
Rates for maintenance support, including subsequent renewal rates, are typically established based upon a specific percentage of net license fees as set forth in the contract with the customer. Maintenance support revenue is recognized ratably over the maintenance support period, assuming all other revenue recognition criteria have been met. Our annual maintenance support contracts provide for technical support and software updates and upgrades, on a when and if available basis. Our typical warranty on licensed software is 90 days and, during this period, our customers are entitled to receive maintenance and support without the purchase of maintenance services. After the expiration of the warranty period, our customers must purchase maintenance support services to continue receiving such support.
With respect to our SaaS subscriptions, we are paid a recurring fee typically calculated based on the number of seats and type of services purchased or a usage fee based on the actual number of transactions. The recurring fee is typically billed monthly.
Our deferred subscription and maintenance support revenue balance consists of maintenance support and subscription orders that do not meet all the criteria for revenue recognition. As of December 31, 2016, our deferred subscription and maintenance support revenue balance was $72.6 million, the current portion of which was $63.2 million.
Professional services and other. Professional services and other revenue primarily includes revenue from professional service engagements consisting of implementation, training, consulting and design and customization services. Our professional services and other deferred revenue balance consists of orders that do not meet all the criteria for revenue recognition. As of December 31, 2016, our deferred professional services and other revenue balance was $19.0 million, the current portion of which was $16.2 million.
Cost of Revenue
Our total cost of revenue consists of the following:
• | Cost of license software revenue. A majority of the cost of license software revenue consists of amortization of acquired intangibles, personnel-related expenses and royalties paid to third parties whose technology or products are sold as part of BroadWorks. A significant amount of the royalty fees are for the underlying embedded database technology within BroadWorks for which we currently incur a fixed expense per quarter. Personnel-related expenses include salaries, benefits, bonuses, reimbursement of expenses and stock-based compensation. Such costs are expensed in the period in which they are incurred. |
• | Cost of subscription and maintenance support revenue. Cost of subscription and maintenance support revenue consists primarily of personnel-related expenses and other direct costs associated with support and maintenance obligations to our customers who have licensed our software and BroadCloud SaaS solutions, including maintenance and support expenses due to our use of third party software, amortization of acquired intangibles and operating expenses associated with the delivery of BroadCloud SaaS solutions. |
• | Cost of professional services and other revenue. Cost of professional services and other revenue consists primarily of personnel-related expenses and other direct costs associated with the delivery of our professional services, which are expensed in the period in which they are incurred. |
Gross Profit
Gross profit is the calculation of total revenue minus cost of revenue. Our gross profit as a percentage of revenue, or gross margin, has been and will continue to be affected by a variety of factors, including:
• | Mix of license software, subscription and maintenance support and professional services and other revenue. We generate higher gross margins on license software revenue compared to subscription and maintenance support or professional services and other revenue. |
• | Growth or decline of license software revenue. A significant portion of cost of license software revenue is fixed and is expensed in the period in which it is incurred. This cost consists primarily of royalty fees to our embedded database provider and amortization of acquired technology. If license software revenue increases, these fixed fees will decline as a percentage of revenue. If license software revenue declines, these fixed fees will increase as a percentage of revenue. |
• | Impact of deferred revenue. If any revenue recognition criteria have not been met, the applicable revenue derived from the arrangement is deferred, including license software, subscription and maintenance support, and professional services and other revenue, until all elements of revenue recognition criteria have been met. |
37
However, the cost of revenue, including the costs of license software, subscription and maintenance support and professional services and other revenue, is typically expensed in the period in which it is incurred. Therefore, if relatively more revenue is deferred in a particular period, gross margin would decline in that period. Because the ability to recognize revenue on orders depends largely on the terms of the sale arrangement and we are not able to predict with certainty the proportion of orders that will not meet all the criteria for revenue recognition, we cannot forecast whether any historical trends in gross margin will continue.
• | Intangible amortization related to mergers and acquisitions. Over the last several years, our business combinations resulted in a number of intangibles assets. These intangible assets are amortized over their useful lives, resulting in additional expense impacting gross profit over the applicable period. We may undertake additional strategic transactions in the future that would result in additional intangible amortization expense. |
Billings (Revenue Plus Net Change in Deferred Revenue)
We believe billings, which we calculate as revenue plus the net change in our deferred revenue balance for a particular period, is a key measure of our sales activity for that period.
Billings are as follows (in thousands):
Year ended December 31, | |||||||||||
2016 | 2015 | 2014 | |||||||||
Beginning of period deferred revenue balance | $ | 111,054 | $ | 101,456 | $ | 77,662 | |||||
End of period deferred revenue balance | 109,189 | 111,054 | 101,456 | ||||||||
Increase (decrease) in deferred revenue | (1,865 | ) | 9,598 | 23,794 | |||||||
Revenue | 340,962 | 278,843 | 216,857 | ||||||||
Billings | $ | 339,097 | $ | 288,441 | $ | 240,651 | |||||
Operating Expenses
We grew our total headcount to 1,597 employees at December 31, 2016 from 1,247 employees at December 31, 2015, and we expect to continue hiring additional employees to support our anticipated growth.
Operating expenses consist of sales and marketing, research and development and general and administrative expenses. Salaries and other personnel costs are the most significant component of each of these expense categories. We expect our operating expenses to increase in 2017 primarily due to increases in headcount and stock-based compensation expense.
Sales and marketing expenses. Sales and marketing expenses consist primarily of salaries and personnel costs for our sales and marketing employees, including stock-based compensation, commissions, benefits and bonuses. Additional expenses include marketing programs, consulting, travel and other related overhead.
Research and development expenses. Research and development expenses consist primarily of salaries and personnel costs for development employees, including stock-based compensation, benefits and bonuses. Additional expenses include costs related to development, quality assurance and testing of new software and enhancement of existing software, consulting, travel and other related overhead. We engage third-party international and domestic consulting firms for various research and development efforts, such as software development, documentation, quality assurance and software support. We intend to continue to invest in our research and development efforts, including by hiring additional development personnel and by using third-party consulting firms for various research and development efforts. We believe continuing to invest in research and development efforts is essential to maintaining our competitive position.
General and administrative expenses. General and administrative expenses consist primarily of salary and personnel costs for administration, finance and accounting, legal, information systems and human resources employees, including stock-based compensation, benefits and bonuses. Additional expenses include consulting and professional fees, travel, insurance and other administrative expenses.
38
Stock-Based Compensation
We include stock-based compensation as part of cost of revenue and operating expenses in connection with the grant of stock-based awards to our directors, employees and consultants. We apply the fair value method in accordance with authoritative guidance for determining the cost of stock-based compensation. The total cost of the grant is measured based on the estimated fair value of the award at the date of grant. The fair value of service-only awards is recognized as stock-based compensation expense on a straight-line basis over the requisite service period, which is the vesting period, of the award. The fair value of awards with a performance condition continues to be recognized as stock-based compensation on a graded basis over the requisite vesting period of the award. For the years ended December 31, 2016, 2015 and 2014, we recorded stock-based compensation expense of $51.5 million, $40.4 million and $30.3 million, respectively.
Based on stock-based awards outstanding as of December 31, 2016, we expect to recognize future expense related to the non-vested portions of such stock-based awards in the amount of $66.7 million over a weighted average period of approximately 1.86 years.
Other Expense, Net
Other expense, net, consists primarily of interest income, interest expense, loss on repurchase of convertible senior notes and foreign currency translation gains and losses. Interest income represents interest received on our cash and cash equivalents. Interest expense consists primarily of the interest related to our 2018 convertible senior notes, or the 2018 Notes, and our 2022 convertible senior notes, or the 2022 Notes. Loss on repurchase of convertible senior notes relates to the fair value in excess of the carrying value of the portion of the 2018 Notes repurchased in 2015. Foreign currency translation gains and losses relate to the revaluation of foreign currency denominated trade receivables.
Income Tax Expense
Income tax expense consists of U.S. federal, state and foreign income taxes. We are required to pay income taxes in certain states and foreign jurisdictions. Historically, we have not been required to pay significant U.S. federal income taxes due to our accumulated net operating losses. As of December 31, 2016 and 2015, we had net operating loss carryforwards, or NOLs, to utilize in the U.S of $34.5 million and $35.9 million, respectively. Additionally, we have $16.5 million and $11.1 million of tax credit carryforwards for tax return purposes as of December 31, 2016 and 2015, respectively. The U.S. NOLs and tax credit carryforwards are scheduled to begin to expire in 2019 and 2020, respectively. As of December 31, 2016 and 2015, we had a remaining valuation allowance of $1.8 million and $0.3 million, respectively, which primarily relate to certain foreign NOLs and capital losses that more likely than not will not be realized.
Recent Accounting Pronouncements
In May 2014, the FASB issued Accounting Standards Update 2014-09, Revenue from Contracts with Customers: Topic 606 ("ASU 2014-09"), which supersedes nearly all existing revenue recognition guidance under U.S. GAAP. The core principle is to recognize revenue when promised goods or services are transferred to customers in an amount that reflects the consideration that is expected to be received for those goods or services. The standard defines a five step process to achieve this core principle and, in doing so, it is possible more judgment and estimates may be required within the revenue recognition process than are required under existing U.S. GAAP, including identifying performance obligations in the contract, estimating the amount of variable consideration to include in the transaction price and allocating the transaction price to each separate performance obligation. The standard allows entities to apply either of two methods: (a) retrospective application to each prior reporting period presented with the option to elect certain practical expedients as defined within ASU 2014-09 (''full retrospective method''); or (b) retrospective application with the cumulative effect of initially applying the standard recognized at the date of initial application and providing certain additional disclosures as defined per ASU 2014-09 (''modified retrospective method''). In August 2015, the FASB issued Accounting Standards Update 2015-14, Revenue from Contracts with Customers: Topic 606 ("ASU 2015-14"), which defers the effective date for ASU 2014-09 to annual reporting periods beginning after December 15, 2017, including interim reporting periods within that reporting period.
While we have not yet completed our final review of the impact of the new standard, we expect that the new standard will impact the timing of revenue recognition for certain software and software related contracts. Due to the complexity of our contracts, the actual timing of revenue recognition required under the new standard will be dependent on contract-specific terms. We are still in the process of evaluating the impact of the new standard related to costs incurred to fulfill a contract. We will adopt the new standard on January 1, 2018 using the modified retrospective method. We will continue to evaluate the standard as well as additional changes, modifications or interpretations that may impact our current conclusions.
39
In February 2016, the FASB issued Accounting Standards Update 2016-02, Leases: Topic 842 ("ASU 2016-02"), which provides updated guidance on lease accounting. ASU 2016-02 is effective for annual reporting periods beginning after December 15, 2018, including interim periods within that annual period, with early adoption permitted. We are evaluating the impact of adopting this new standard on our financial statements.
In March 2016, the FASB issued Accounting Standards Update 2016-09, Compensation-Stock Compensation: Topic 718 ("ASU 2016-09"), which provides updated guidance on several aspects of the accounting for share-based payment transactions. ASU 2016-09 is effective for annual reporting periods beginning after December 15, 2016, including interim periods within those annual periods, with early adoption permitted. We adopted this guidance on January 1, 2017. The Company is unable to estimate the impact of adoption as it is dependent upon future stock option exercises which cannot be predicted.
In August 2016, the FASB issued Accounting Standards Update 2016-16, Income Taxes: Topic 740: Intra-Entity Transfers of Assets Other Than Inventory (“ASU 2016-16”) which requires the recognition of the income tax consequences of an intra-entity transfer of an asset other than inventory when the transfer occurs. The new standard is effective for annual reporting periods beginning after December 15, 2017, including interim reporting periods within those annual reporting periods, with early adoption permitted. We are evaluating the impact of adopting this new standard on our financial statements.
In January 2017, the FASB issued Accounting Standards Update 2017-01, Business Combinations: Topic 805: Clarifying the Definition of a Business (“ASU 2017-01”), which clarifies the definition of a business with the objective of adding guidance to assist entities with evaluating whether transactions should be accounted for as acquisitions (or disposals) of assets or businesses. The new standard is effective for annual periods beginning after December 15, 2017, including interim periods within those periods. We are evaluating the impact of adopting this new standard on our financial statements.
In January 2017, the FASB issued Accounting Standards Update 2017-04, Intangibles - Goodwill and Other: Topic 350: Simplifying the Test for Goodwill Impairment (“ASU 2017-04”), which modifies the concept of impairment from the condition that exists when the carrying amount of goodwill exceeds its implied fair value to the condition that exists when the carrying amount of a reporting unit exceeds its fair value. The new standard is effective for annual periods beginning after December 15, 2019, with early adoption permitted, including interim periods within those periods. While we continue to assess the potential impact of this standard, the adoption of this standard is not expected to have a material impact on our financial statements.
Critical Accounting Policies and Significant Judgments and Estimates
Our management’s discussion and analysis of our financial condition and results of operations is based on our consolidated financial statements, which have been prepared in accordance with U.S. GAAP. The preparation of these consolidated financial statements requires us to make estimates and assumptions that affect the reported amounts of assets and liabilities, disclosure of contingent assets and liabilities at the date of the consolidated financial statements and the reported amounts of revenue and expenses during the reported period. In accordance with U.S. GAAP, we base our estimates on historical experience and on various other assumptions that we believe are reasonable under the circumstances. Actual results may differ from these estimates under different assumptions or conditions.
While our significant accounting policies are more fully described in Note 2 to our consolidated financial statements appearing elsewhere in this Annual Report on Form 10-K, we believe the following accounting policies are critical to the process of making significant judgments and estimates in the preparation of our consolidated financial statements.
Revenue Recognition
We derive our revenue from the sale of software licenses and related maintenance for those licenses, subscription and usage fees related to our cloud offerings and the sale of professional services.
Revenue is recognized when persuasive evidence of an arrangement exists, delivery has occurred or services have been rendered, the arrangement fee is fixed or determinable and collectability of the related receivable is probable. In making judgments regarding revenue recognition, we analyze various factors, including the nature and terms of the specific transaction, the creditworthiness of our customers, our historical experience, accuracy of prior estimates and overall market and economic conditions. Moreover, in connection with the sale of a number of products and services under a single contractual arrangement (a multiple element arrangement), we make judgments as to whether there is sufficient vendor specific objective evidence (“VSOE”) to enable the allocation of fair value among the various elements in software arrangements that contain multiple elements and as to relative selling prices for multiple element arrangements that do not contain software elements. In determining relative selling prices for products and services, we consider, among other things, our use of discounts from list prices, prices we charge for similar offerings and our historical pricing practices. Changes in judgments related to these items, or deterioration in market or economic conditions, could materially impact the timing and amount of revenue recognized.
40
License Software Revenue
We sell software licenses to service providers through our direct sales force and indirectly through distribution partners.
For direct sales, we generally consider a purchase order or executed sales quote, when combined with a master license agreement, to constitute evidence of an arrangement. In the case of sales through distribution partners, we generally consider a purchase order or executed sales quote, when combined with a reseller or similar agreement with the distribution partner, and evidence of the distribution partner’s customer, to constitute evidence of an arrangement. For sales through distribution partners for which we are not able to ascertain proof of the distribution partner’s customer, we defer revenue until we are able to do so.
We consider delivery to have occurred when the customer is given electronic access to the licensed software and a license key for the software has been delivered or made available. Instances where all ordered software features are not delivered are considered to be partial deliveries. Since we cannot determine VSOE of an undelivered software feature in the case of a partial delivery, we defer revenue recognition on all elements of such order until delivery of all ordered software features is complete.
Acceptance of our licensed software generally occurs upon delivery. From time to time, we have agreed with certain customers to a specific set of acceptance criteria. In such cases, we may defer revenue until these acceptance criteria have been met.
Our sales generally consist of multiple elements: software licenses; maintenance support; and professional services. We calculate the amount of revenue allocated to the software license by determining the fair value of the undelivered elements, which often are maintenance support and professional services, and subtracting it from the total order amount. We establish VSOE of the fair value of maintenance support based on the renewal price as stated in the agreement and as charged in the first optional renewal period under the arrangement. Our VSOE for professional services is determined based on an analysis of our historical daily rates when these professional services are sold separately from software licenses.
The warranty period for our licensed software is generally 90 days. During this period, the customer receives technical support and has the right to unspecified product upgrades on an if-and-when available basis. For these periods, we defer a portion of the license fee and recognize it ratably over the warranty period. The revenue is reflected under the subscription and maintenance support revenue line item in the consolidated income statement.
Our license software revenue is subject to significant fluctuation as a result of the application of accounting regulations and related interpretations and policies regarding revenue recognition. We do not believe license revenue to be the only meaningful measure of our level of sales activity during the periods reported because of the impact of software license orders for these periods that were not yet recognized as revenue and therefore were recorded as deferred license software revenue. Our deferred license software revenue balance consists of software orders that do not meet all the criteria for revenue recognition. We are unable to predict with certainty the proportion of orders that will meet all the criteria for revenue recognition relative to those orders that will not meet all such criteria, as a result, it is difficult to forecast whether historical trends in recognized license software revenue, and corresponding changes in deferred license revenue, will continue.
Subscription and Maintenance Support Revenue
We typically sell software in combination with maintenance support. Maintenance support is generally renewable annually at the option of the customer. Rates for maintenance support, including subsequent renewal rates, are typically established based upon a specific percentage of net license fees as set forth in the contract with the customer. Maintenance support revenue is recognized ratably over the maintenance support period, assuming all other revenue recognition criteria have been met.
Under our SaaS subscriptions, we are paid a recurring fee calculated typically based on the number of seats and type of services purchased or a usage fee based on actual number of transactions. Typically, the recurring fee is billed monthly or annually based on the terms of the arrangement and the usage fee is billed one month in arrears. Revenue is recognized ratably over the contract term beginning with the date our service is made available to customers.
We enter into arrangements with multiple-elements that generally include subscription and professional services. To treat deliverables in a multiple-element arrangement as separate units of accounting, the deliverables must have standalone value upon delivery. If the deliverables have standalone value upon delivery, we account for each deliverable separately. Subscription services have standalone value as such services are often sold separately. In determining whether professional services have standalone value, we consider the following factors for each professional services agreement: availability of the services from other vendors; the nature of the professional services; the timing of when the professional services contract, statement of work or order was signed in comparison to the subscription service start date; and the contractual dependence of the subscription service on the customer’s satisfaction with the professional services work.
Per the accounting guidance, when multiple-elements included in an arrangement are separated into different units of accounting, the arrangement consideration is allocated to the identified separate units based on a relative selling price hierarchy.
41
We determine the relative selling price for each element based on its VSOE, if available, or our best estimate of selling price, or BESP, if VSOE is not available. We have determined that third-party evidence is not a practical alternative due to differences in our service offerings compared to other parties and the availability of relevant third-party pricing information.
We determined BESP by considering our overall pricing objectives and market conditions. Significant pricing practices taken into consideration include our discounting practices, our price lists, our go-to-market strategy, historical standalone sales and contract prices. As our go-to-market strategies evolve, we may modify our pricing practices in the future, which could result in changes in relative selling prices, including both VSOE and BESP.
Professional Services Revenue
Professional services are generally either daily-rate or fixed-fee arrangements. Revenue from daily-rate arrangements is typically recognized as services are performed. Revenue related to fixed-fee arrangements is typically recognized upon completion of all of the deliverables. Services are generally not considered essential to the functionality of the licensed software.
Software Development Costs
Software development costs for software to be sold, leased or marketed that is incurred prior to the establishment of technological feasibility are expensed as incurred as research and development expense. Software development costs incurred subsequent to the establishment of technological feasibility, if any, are capitalized until the software is available for general release to customers. For each software release, judgment is required to evaluate when technological feasibility has occurred. We have determined that technological feasibility has been established at approximately the same time as our general release of such software to customers. Therefore, to date, we have not capitalized any related software development costs.
Internal-Use Software Development Costs
Costs associated with customized internal-use software systems, which include development costs associated with our SaaS platforms, that have reached the application development stage are capitalized. Such capitalized costs include costs directly associated with the development of the applications. Capitalization of such costs begins when the preliminary project stage is complete and ceases at the point in which the project is substantially complete and is ready for its intended purpose. Internal-use software is amortized on a straight-line basis over the estimated useful life of three years. Costs related to preliminary project stage and post implementation activities are expensed as incurred.
Accounts Receivable and Allowance for Doubtful Accounts
Accounts receivable are stated at realizable value, net of an allowance for doubtful accounts that is maintained for estimated losses that would result from the inability of some customers to make payments. The allowance is based on an analysis of past due amounts and ongoing credit evaluations. Customers are generally evaluated for creditworthiness through a credit review process at the time of each order. Our collection experience has been consistent with our estimates.
Business Combinations
In a business combination, we allocate the purchase price to the acquired business’ identifiable assets and liabilities at their acquisition date fair values. The excess of the purchase price over the amount allocated to the identifiable assets and liabilities, if any, is recorded as goodwill. The excess, if any, of the fair value of the identifiable assets acquired and liabilities assumed over the consideration transferred is recognized as a gain within other income in the consolidated statements of operations as of the acquisition date.
To date, the assets acquired and liabilities assumed in our business combinations have primarily consisted of acquired working capital and definite-lived intangible assets. The carrying value of acquired working capital approximates its fair value, given the short-term nature of these assets and liabilities. We estimate the fair value of definite-lived intangible assets acquired using a discounted cash flow approach, which includes an analysis of the future cash flows expected to be generated by such assets and the risk associated with achieving such cash flows. The key assumptions used in the discounted cash flow model include the discount rate that is applied to the discretely forecasted future cash flows to calculate the present value of those cash flows and the estimate of future cash flows attributable to the acquired intangible assets, which include revenue, operating expenses and taxes. Our estimates are inherently uncertain and subject to refinement. As a result, during the measurement period, which may be up to one year from the acquisition date, we may record adjustments to the fair value of assets acquired and liabilities assumed, with the corresponding offset to goodwill.
42
Goodwill
Goodwill represents the excess of (a) the aggregate of the fair value of consideration transferred in a business combination over (b) the fair value of assets acquired, net of liabilities assumed. Goodwill is not amortized, but is subject to annual impairment tests as described below.
We test goodwill for impairment annually on December 31, or more frequently if events or changes in business circumstances indicate the asset might be impaired. Examples of such events or circumstances include the following:
• | a significant adverse change in our business climate; |
• | unanticipated competition; |
• | a loss of key personnel; |
• | a more likely than not expectation that a significant portion of our business will be sold; or |
• | the testing for recoverability of a significant asset group within the reporting unit. |
We first may assess qualitative factors to determine if it is more likely than not that the fair value of a reporting unit is less than its carrying amount as a basis for determining whether it is necessary to perform the two-step goodwill impairment test included in U.S. GAAP. To the extent our assessment identifies adverse conditions, or if we elect to bypass the qualitative assessment, goodwill is tested for impairment at the reporting unit level using a two-step approach. The first step is to compare the fair value of the reporting unit to the carrying value of the net assets assigned to the reporting unit. If the fair value of the reporting unit is greater than the carrying value of the net assets assigned to the reporting unit, the assigned goodwill is not considered impaired. If the fair value is less than the reporting unit’s carrying value, step two is required to measure the amount of the impairment, if any. In the second step, the fair value of goodwill is determined by deducting the fair value of the reporting unit’s identifiable assets and liabilities from the fair value of the reporting unit as a whole, as if the reporting unit had just been acquired and the purchase price were being initially allocated. If the carrying value of goodwill exceeds the implied fair value, an impairment charge would be recorded to operating expenses in the consolidated statements of operations in the period the determination is made.
We have determined that we have one reporting unit, BroadSoft, Inc., which is the consolidated entity. Based on our completion of the first step of the two-step goodwill impairment test, there was no indication of impairment as of December 31, 2016, 2015 or 2014. However, there can be no assurance that goodwill will not be impaired at any time in the future.
Intangible Assets
We acquired intangible assets in connection with certain of our business acquisitions. These assets were recorded at their estimated fair values at the acquisition date and are amortized over their respective estimated useful lives using a method of amortization that reflects the pattern in which the economic benefits of the intangible assets are used. Estimated useful lives are determined based on our historical use of similar assets and the expectation of future realization of cash flows attributable to the intangible assets. Changes in circumstances, such as technological advances or changes to our business model, could result in the actual useful lives differing from our current estimates. In those cases where we determine that the useful life of an intangible asset should be shortened, we amortize the net book value in excess of the estimated salvage value over its revised remaining useful life. We did not revise our previously assigned useful life estimates attributed to any of our intangible assets during the years ended December 31, 2016, 2015 or 2014.
The estimated useful lives used in computing amortization of intangible assets are as follows:
Customer relationships | 3 - 8 years |
Developed technology | 2 - 6 years |
Trade names | 1 - 7 years |
Impairment of Long-Lived Assets
We review our long-lived assets, including property and equipment and intangible assets, for impairment whenever events or changes in circumstances indicate the carrying amount of an asset or an asset group may not be recoverable. Typical indicators that an asset may be impaired include, but are not limited to:
• | a significant adverse change in the extent or manner in which a long-lived asset is being used or in its physical condition; |
43
• | a current-period operating or cash flow loss combined with a history of operating or cash flow losses or a projection or forecast that demonstrates continuing losses associated with the use of a long-lived asset; or |
• | a current expectation that, more likely than not, a long-lived asset will be sold or otherwise disposed of significantly before the end of its previously estimated useful life. |
Recoverability of assets to be held and used is measured by a comparison of the carrying amount of the assets to future undiscounted net cash flows expected to be generated. Recoverability measurement and estimating of undiscounted cash flows for assets to be held and used is done at the lowest possible levels for which there are identifiable cash flows. If such assets are considered impaired, generally the amount of impairment recognized would be equal to the amount by which the carrying amount of the assets exceeds the fair value of the assets, which we would compute using a discounted cash flow approach. Assets to be disposed of are recorded at the lower of the carrying amount or fair value less costs to sell. Estimating future cash flows attributable to our long-lived assets requires significant judgment and projections may vary from cash flows eventually realized. There were no triggering events to cause us to record an impairment charge during the years ended December 31, 2016, 2015 or 2014.
Income Taxes
We use the liability method of accounting for income taxes as set forth in the authoritative guidance for accounting for income taxes. This method requires an asset and liability approach for the recognition of deferred tax assets and liabilities for the expected future tax consequences attributable to temporary differences between the carrying amounts of assets and liabilities for financial reporting purposes and their respective tax bases, and for operating loss and tax credit carryforwards. Deferred tax assets and liabilities are measured by applying enacted statutory tax rates applicable to the future years in which deferred amounts are expected to be settled or realized.
We operate in various tax jurisdictions and are subject to audit by various tax authorities. We recognize and measure benefits for uncertain tax positions using a two-step approach. The first step is to evaluate the tax position taken or expected to be taken in a tax return by determining if the weight of available evidence indicates that it is more likely than not that the tax position will be sustained upon audit, including resolution of any related appeals or litigation processes. For tax positions that are more likely than not to be sustained upon audit, the second step is to measure the tax benefit as the largest amount that is more than 50% likely to be realized upon settlement. Significant judgment is required to evaluate uncertain tax positions. Changes in facts and circumstances could have a material impact on our effective tax rate and results of operations.
Results of Operations
Comparison of the Years Ended December 31, 2016 and 2015
Revenue
Year ended December 31, | Period-to-Period Change | |||||||||||||||||||
2016 | 2015 | |||||||||||||||||||
Amount | Percent of Total Revenue | Amount | Percent of Total Revenue | Amount | Percentage | |||||||||||||||
(dollars in thousands) | ||||||||||||||||||||
Revenue by Type: | ||||||||||||||||||||
License software | $ | 129,313 | 38 | % | $ | 119,808 | 43 | % | $ | 9,505 | 8 | % | ||||||||
Subscription and maintenance support | 146,615 | 43 | 112,836 | 40 | 33,779 | 30 | ||||||||||||||
Professional services and other | 65,034 | 19 | 46,199 | 17 | 18,835 | 41 | ||||||||||||||
Total revenue | $ | 340,962 | 100 | % | $ | 278,843 | 100 | % | $ | 62,119 | 22 | % | ||||||||
Revenue by Geography: | ||||||||||||||||||||
North America | $ | 192,824 | 56 | % | $ | 180,791 | 65 | % | $ | 12,033 | 7 | % | ||||||||
EMEA | 98,138 | 29 | 61,187 | 22 | 36,951 | 60 | ||||||||||||||
Emerging Markets | 50,000 | 15 | 36,865 | 13 | 13,135 | 36 | ||||||||||||||
Total revenue | $ | 340,962 | 100 | % | $ | 278,843 | 100 | % | $ | 62,119 | 22 | % | ||||||||
Total revenue for 2016 increased by 22%, or $62.1 million, to $341.0 million, compared to 2015. This growth was driven by a 8% increase in license software revenue, a 30% increase in subscription and maintenance support revenue and a 41% increase
44
in professional services and other revenue. Deferred revenue decreased by $1.9 million for 2016, compared to an increase of $9.6 million in 2015.
North America revenue for 2016 increased by 7%, or $12.0 million, to $192.8 million, compared to 2015. The increase in North America revenue for 2016 was primarily due to an increase in subscription and maintenance support revenue, along with an increase in professional services and other revenues, partially offset by a decrease in software revenue.
Europe, Middle East and Africa, or EMEA, revenue for 2016 increased by 60%, or $37.0 million, to $98.1 million compared to 2015. The increase in EMEA revenue in 2016 was due to an increase in license software revenue, subscription and maintenance support revenue and professional services and other revenue.
Asia Pacific, the Caribbean and Latin America, or Emerging Markets, revenue for 2016 increased by 36%, or $13.1 million, to $50.0 million compared to 2015. The increase in Emerging Markets revenue was primarily due to an increase in license software revenue and subscription and maintenance support revenue.
License Software
License software revenue for 2016 increased by 8%, or $9.5 million, to $129.3 million. The increase in revenue for 2016 reflects an increase in license software revenue in EMEA and APAC, partially offset by a decrease in license software revenue in North America. Deferred license software revenue decreased by $15.5 million in 2016, compared to an increase of $6.7 million in 2015.
Subscription and Maintenance Support
Subscription and maintenance support revenue for 2016 increased by 30%, or $33.8 million, to $146.6 million, compared to 2015. The increase in subscription and maintenance support revenue was the result of growth in our subscription revenue associated with our SaaS platforms, which included contributions from recent acquisitions, and growth in our maintenance support revenue. Our SaaS subscription revenue for 2016 increased by $17.0 million to $51.6 million, compared to 2015. Our maintenance support revenue grew as a result of growth in the installed base of our customers who purchase maintenance support. Deferred subscription and maintenance support revenue increased by $11.2 million in 2016, compared to an increase of $8.6 million in 2015.
Professional Services and Other
Professional services and other revenue for 2016 increased by 41%, or $18.8 million, to $65.0 million, compared to 2015. The increase in professional services and other revenue for 2016 was primarily due to increased professional services activity, including contributions from recent acquisitions, and also due to revenue recognized from several large projects as we reached milestones for those projects. Deferred professional services and other revenue increased by $2.5 million in 2016, compared to a decrease of $5.7 million in 2015.
45
Cost of Revenue and Gross Profit
Year ended December 31, | Period-to-Period Change | |||||||||||||||||||
2016 | 2015 | |||||||||||||||||||
Amount | Percent of Related Revenue | Amount | Percent of Related Revenue | Amount | Percentage | |||||||||||||||
(dollars in thousands) | ||||||||||||||||||||
Cost of Revenue: | ||||||||||||||||||||
License software | $ | 7,585 | 6 | % | $ | 10,231 | 9 | % | $ | (2,646 | ) | (26 | )% | |||||||
Subscription and maintenance support | 46,717 | 32 | 38,602 | 34 | 8,115 | 21 | ||||||||||||||
Professional services and other | 36,875 | 57 | 28,925 | 63 | 7,950 | 27 | ||||||||||||||
Total cost of revenue | $ | 91,177 | 27 | % | $ | 77,758 | 28 | % | $ | 13,419 | 17 | % | ||||||||
Gross Profit: | ||||||||||||||||||||
License software | $ | 121,728 | 94 | % | $ | 109,577 | 91 | % | $ | 12,151 | 11 | % | ||||||||
Subscription and maintenance support | 99,898 | 68 | 74,234 | 66 | 25,664 | 35 | ||||||||||||||
Professional services and other | 28,159 | 43 | 17,274 | 37 | 10,885 | 63 | ||||||||||||||
Total gross profit | $ | 249,785 | 73 | % | $ | 201,085 | 72 | % | $ | 48,700 | 24 | % | ||||||||
For 2016, our gross margin increased to 73% as compared to 72% in 2015 and our gross profit increased by 24%, or $48.7 million, to $249.8 million. We experienced an increase in gross profit across all of our revenue streams for 2016. The total gross profit growth is primarily due to higher revenue growth relative to the growth in cost of revenue.
For 2016, license software gross margin increased to 94% as compared to 91% in 2015 and license software gross profit increased by 11% to $121.7 million. License software cost of revenue decreased by 26%, or $2.6 million, to $7.6 million in 2016. The decrease in license software cost of revenue was primarily due to a $1.3 million decrease in personnel-related costs and a $0.8 million decrease in equipment and software expenses. The increase in license software gross profit was driven by revenue growth and a decrease in license software cost of revenue.
For 2016, subscription and maintenance support gross margin increased to 68% as compared to 66% in 2015 and subscription and maintenance support gross profit increased by 35% to $99.9 million. Subscription and maintenance support cost of revenue increased by 21%, or $8.1 million, to $46.7 million in 2016. The increase in subscription and maintenance support cost of revenue was related to our continued investment in our product offerings, primarily investment in our SaaS offerings. The increase was primarily due to a $2.1 million increase in personnel-related costs, a $4.9 million increase in operational costs associated with hosting our SaaS offerings and $0.7 million increase in third party software maintenance costs. The increase in subscription and maintenance support gross profit was driven by higher revenue growth relative to growth in subscription and maintenance services cost of revenue.
For 2016, professional services and other gross margin increased to 43% as compared to 37% in 2015 and professional services and other gross profit increased by 63% to $28.2 million. Professional services and other cost of revenue increased by 27%, or $8.0 million, to $36.9 million in 2016. The increase in professional services and other cost of revenue was primarily due to a $7.3 million increase in personnel-related costs, which includes the impact of recent acquisitions. The increase in professional services and other gross profit was driven by higher revenue growth relative to growth in professional services and other cost of revenue.
Operating Expenses
46
Year ended December 31, | Period-to-Period Change | |||||||||||||||||||
2016 | 2015 | |||||||||||||||||||
Amount | Percent of Total Revenue | Amount | Percent of Total Revenue | Amount | Percentage | |||||||||||||||
(dollars in thousands) | ||||||||||||||||||||
Sales and marketing | $ | 107,142 | 31 | % | $ | 83,806 | 30 | % | $ | 23,336 | 28 | % | ||||||||
Research and development | 77,202 | 23 | 60,749 | 22 | 16,453 | 27 | ||||||||||||||
General and administrative | 49,934 | 15 | 41,287 | 15 | 8,647 | 21 | ||||||||||||||
Total operating expenses | $ | 234,278 | 69 | % | $ | 185,842 | 67 | % | $ | 48,436 | 26 | % | ||||||||
Sales and Marketing. Sales and marketing expense increased by 28%, or $23.3 million, to $107.1 million for 2016. The increase was primarily due to a $18.0 million increase in personnel-related costs, a $1.8 million increase in travel expenses, a $0.8 million increase in equipment and software expenses and a $2.1 million increase in marketing program expenses, partially offset by a $1.2 million decrease in outside consulting expenses.
Research and Development. Research and development expense increased by 27%, or $16.5 million, to $77.2 million for 2016. The increase was primarily due to a $13.1 million increase in personnel-related costs, a $1.4 million increase in consulting expenses, a $0.7 million increase in overhead costs, primarily related to increase in depreciation and rent expenses, and a $0.5 million increase in equipment and software expenses. This increase in expenses was primarily driven by the acquisitions we made during 2016.
General and Administrative. General and administrative expense increased by 21%, or $8.6 million, to $49.9 million for 2016. The increase was primarily related to a $6.5 million increase in personnel-related costs and a $0.5 million increase in consulting expenses. This increase in expenses was primarily driven by the acquisitions we made during 2016.
Income from Operations
We had income from operations of $15.5 million for 2016, compared to $15.2 million in 2015.
Other Expense
Year ended December 31, | Period-to-Period Change | |||||||||||||||||||
2016 | 2015 | |||||||||||||||||||
Amount | Percent of Total Revenue | Amount | Percent of Total Revenue | Amount | Percentage | |||||||||||||||
(dollars in thousands) | ||||||||||||||||||||
Interest expense | $ | 15,756 | 5 | % | $ | 10,656 | 3 | % | $ | 5,100 | 48 | % | ||||||||
Interest income | (2,680 | ) | 1 | (1,270 | ) | * | (1,410 | ) | 111 | |||||||||||
Other, net | 155 | * | 5,714 | 2 | (5,559 | ) | 97 | |||||||||||||
Total other expense, net | $ | 13,231 | 6 | % | $ | 15,100 | 5 | % | $ | (1,869 | ) | (12 | )% | |||||||
* | Less than 1% |
Total other expense, net decreased by $1.9 million for 2016 compared to 2015. The decrease in total other expenses, net was related to a $1.4 million increase in interest income related to our investments, a decrease of $1.4 million in foreign currency translation losses related to the revaluation of foreign denominated trade receivables compared to prior year and the loss of $4.2 million related to the repurchase of a portion of the 2018 Notes in 2015. This decrease was partially offset by an increase in interest expense of $5.1 million related to our Notes.
Provision for Income Taxes
Provision for income taxes was $1.5 million for the year ended December 31, 2016, compared to an immaterial amount for the year ended December 31, 2015. For the year ended December 31, 2016, the tax provision was primarily impacted by an increase in the valuation allowance for some of our foreign jurisdictions and non-deductible share-based compensation partially offset by research tax credits generated in 2016 and prior years. The increase in the income tax provision in 2016 compared to 2015 was primarily related to an increase in our valuation allowance and jurisdictional mix in earnings, partially offset by research and development credits generated in 2016 and prior years.
47
Comparison of the Years Ended December 31, 2015 and 2014
Revenue
Year ended December 31, | Period-to-Period Change | |||||||||||||||||||
2015 | 2014 | |||||||||||||||||||
Amount | Percent of Total Revenue | Amount | Percent of Total Revenue | Amount | Percentage | |||||||||||||||
(dollars in thousands) | ||||||||||||||||||||
Revenue by Type: | ||||||||||||||||||||
License software | $ | 119,808 | 43 | % | $ | 103,311 | 47 | % | $ | 16,497 | 16 | % | ||||||||
Subscription and maintenance support | 112,836 | 40 | 92,492 | 43 | 20,344 | 22 | ||||||||||||||
Professional services and other | 46,199 | 17 | 21,054 | 10 | 25,145 | 119 | ||||||||||||||
Total revenue | $ | 278,843 | 100 | % | $ | 216,857 | 100 | % | $ | 61,986 | 29 | % | ||||||||
Revenue by Geography: | ||||||||||||||||||||
North America | $ | 180,791 | 65 | % | $ | 112,198 | 52 | % | $ | 68,593 | 61 | % | ||||||||
EMEA | 61,187 | 22 | 54,950 | 25 | 6,237 | 11 | ||||||||||||||
Emerging Markets | 36,865 | 13 | 49,709 | 23 | (12,844 | ) | (26 | ) | ||||||||||||
Total revenue | $ | 278,843 | 100 | % | $ | 216,857 | 100 | % | $ | 61,986 | 29 | % | ||||||||
Total revenue for 2015 increased by 29%, or $62.0 million, to $278.8 million, compared to 2014. This growth was driven by a 16% increase in license software revenue, a 22% increase in subscription and maintenance support revenue and a 119% increase in professional services and other revenue. Deferred revenue increased by $9.6 million for 2015, compared to an increase of $23.8 million in 2014.
North America revenue for 2015 increased by 61%, or $68.6 million, to $180.8 million, compared to 2014. The increase in North America revenue in 2015 was primarily due to an increase in license software revenue, subscription and maintenance support revenue and professional services and other revenue.
EMEA revenue for 2015 increased by 11%, or $6.2 million, to $61.2 million, compared to 2014. The increase in EMEA revenue in 2015 was primarily due to an increase in license software revenue and subscription and maintenance support revenue, partially offset by a decrease in professional services and other revenue.
Emerging Markets revenue for 2015 decreased by 26%, or $12.8 million, to $36.9 million, compared to 2014. The decrease in Emerging Markets revenue was primarily due to the recognition of revenue in the prior year related to a multi-year project for an Emerging Markets service provider customer.
License Software
License software revenue for 2015 increased by 16%, or $16.5 million, to $119.8 million, compared to 2014. The increase in revenue for 2015 reflects an increase in license software revenue in North America and EMEA, partially offset by a decrease in license software revenue in Emerging Markets. Deferred license software revenue increased by $6.7 million in 2015, compared to an increase of $6.3 million in 2014.
Subscription and Maintenance Support
Subscription and maintenance support revenue for 2015 increased by 22%, or $20.3 million, to $112.8 million, compared to 2014. The increase in subscription and maintenance support revenue was the result of growth in our subscription revenue associated with our SaaS platforms, which included contributions from recent acquisitions, and growth in our maintenance support revenue. Our SaaS subscription revenue for 2015 increased by $8.9 million to $34.6 million, compared to 2014. Our maintenance support revenue grew as a result of growth in the installed base of our customers who purchase maintenance support. Deferred subscription and maintenance support revenue increased by $8.6 million in 2015, compared to an increase of $5.8 million in 2014.
Professional Services and Other
Professional services and other revenue for 2015 increased by 119%, or $25.1 million, to $46.2 million, compared to 2014. The increase in professional services and other revenue for 2015 was primarily due to revenue recognized from several large
48
projects as we reached milestones for those projects, and also due to increased professional services activity, including contributions from recent acquisitions. Deferred professional services and other revenue decreased by $5.7 million in 2015, compared to an increase of $11.7 million in 2014.
Cost of Revenue and Gross Profit
Year ended December 31, | Period-to-Period Change | |||||||||||||||||||
2015 | 2014 | |||||||||||||||||||
Amount | Percent of Related Revenue | Amount | Percent of Related Revenue | Amount | Percentage | |||||||||||||||
(dollars in thousands) | ||||||||||||||||||||
Cost of Revenue: | ||||||||||||||||||||
License software | $ | 10,231 | 9 | % | $ | 9,755 | 9 | % | $ | 476 | 5 | % | ||||||||
Subscription and maintenance support | 38,602 | 34 | 32,984 | 36 | 5,618 | 17 | ||||||||||||||
Professional services and other | 28,925 | 63 | 14,955 | 71 | 13,970 | 93 | ||||||||||||||
Total cost of revenue | $ | 77,758 | 28 | % | $ | 57,694 | 27 | % | $ | 20,064 | 35 | % | ||||||||
Gross Profit: | ||||||||||||||||||||
License software | $ | 109,577 | 91 | % | $ | 93,556 | 91 | % | $ | 16,021 | 17 | % | ||||||||
Subscription and maintenance support | 74,234 | 66 | 59,508 | 64 | 14,726 | 25 | ||||||||||||||
Professional services and other | 17,274 | 37 | 6,099 | 29 | 11,175 | 183 | ||||||||||||||
Total gross profit | $ | 201,085 | 72 | % | $ | 159,163 | 73 | % | $ | 41,922 | 26 | % | ||||||||
For 2015, gross margin decreased to 72% as compared to 73% in 2014 and our gross profit increased by 26%, or $41.9 million, to $201.1 million. We experienced an increase in gross profit across all of our revenue streams for 2015. The total gross profit growth was primarily due to higher revenue growth relative to the growth in cost of revenue.
For 2015, license software gross margin remained approximately unchanged at 91% as compared to 2014 and license software gross profit increased by 17% to $109.6 million. License software cost of revenue increased by 5%, or $0.5 million, to $10.2 million in 2015. This increase was primarily due to a $0.8 million increase in intangible amortization related to our acquisitions. The increase in license software gross profit was driven by higher revenue growth relative to the growth in license software cost of revenue.
For 2015, subscription and maintenance support gross margin increased to 66% as compared to 64% in 2014 and subscription and maintenance support gross profit increased by 25% to $74.2 million. Subscription and maintenance support cost of revenue increased by 17%, or $5.6 million, to $38.6 million in 2015. The increase in subscription and maintenance support cost of revenue was related to our continued investment in our product offerings, primarily investment in our SaaS offerings, including a $3.0 million increase in personnel-related costs and a $2.5 million increase in operating costs associated with hosting our SaaS solutions. The increase in subscription and maintenance support gross profit was driven by higher revenue growth relative to growth in subscription and maintenance services cost of revenue.
For 2015, professional services and other gross margin increased to 37% as compared to 29% in 2014 and professional services and other gross profit increased by 183% to $17.3 million. Professional services and other cost of revenue increased 93%, or $14.0 million, to $28.9 million in 2015. The increase in professional services and other cost of revenue was primarily due to a $9.7 million increase in personnel-related costs, which includes the impact of acquisitions we made during 2015. The increase was also due to a $1.2 million increase in hardware expense and a $1.1 million increase in travel expenses. The increase in professional services and other gross profit was driven by higher revenue growth relative to growth in professional services and other cost of revenue.
Operating Expenses
49
Year ended December 31, | Period-to-Period Change | |||||||||||||||||||
2015 | 2014 | |||||||||||||||||||
Amount | Percent of Total Revenue | Amount | Percent of Total Revenue | Amount | Percentage | |||||||||||||||
(dollars in thousands) | ||||||||||||||||||||
Sales and marketing | $ | 83,806 | 30 | % | $ | 69,471 | 32 | % | $ | 14,335 | 21 | % | ||||||||
Research and development | 60,749 | 22 | 50,125 | 23 | 10,624 | 21 | ||||||||||||||
General and administrative | 41,287 | 15 | 32,993 | 15 | 8,294 | 25 | ||||||||||||||
Total operating expenses | $ | 185,842 | 67 | % | $ | 152,589 | 70 | % | $ | 33,253 | 22 | % | ||||||||
Sales and Marketing. Sales and marketing expense increased by 21%, or $14.3 million, to $83.8 million for 2015. The increase was primarily due to a $9.3 million increase in personnel-related costs, a $2.1 million increase in outside consulting expenses, a $0.7 million increase in equipment and software expenses and a $0.6 million increase in travel expenses.
Research and Development. Research and development expense increased by 21%, or $10.6 million, to $60.7 million for 2015. The increase was primarily due to an $8.9 million increase in personnel-related costs, a $0.8 million increase in depreciation expenses and a $0.7 million increase in equipment and software expenses.
General and Administrative. General and administrative expense increased by 25%, or $8.3 million, to $41.3 million for 2015. The increase was primarily related to a $3.6 million increase in personnel-related costs and a $4.1 million increase in third party legal and consulting expenses.
Income from Operations
We had income from operations of $15.2 million for 2015, compared to $6.6 million in 2014.
Other Expense
Year ended December 31, | Period-to-Period Change | |||||||||||||||||||
2015 | 2014 | |||||||||||||||||||
Amount | Percent of Total Revenue | Amount | Percent of Total Revenue | Amount | Percentage | |||||||||||||||
(dollars in thousands) | ||||||||||||||||||||
Interest expense | $ | 10,656 | 3 | % | $ | 7,706 | 3 | % | $ | 2,950 | 38 | % | ||||||||
Interest income | (1,270 | ) | * | (530 | ) | * | (740 | ) | 140 | |||||||||||
Other, net | 5,714 | 2 | 1,300 | 1 | 4,414 | 340 | ||||||||||||||
Total other expense, net | $ | 15,100 | 5 | % | $ | 8,476 | 4 | % | $ | 6,624 | 78 | % | ||||||||
* | Less than 1% |
Total other expense, net increased by $6.6 million for 2015 compared to 2014. The increase in total other expenses was related to the loss of $4.2 million related to the repurchase of a portion of the 2018 Notes, interest expense of $3.2 million related to the 2022 Notes and a $0.7 million increase in foreign currency translation losses related to the revaluation of foreign denominated trade receivables compared to 2014, partially offset by an increase in interest income of $0.7 million related to our investments and a decrease in interest expense of $0.7 million related to the 2018 Notes.
Benefit from Income Taxes
Benefit from income taxes was an immaterial amount for the year ended December 31, 2015, compared to $2.2 million for the year ended December 31, 2014. For the year ended December 31, 2015, the tax provision was primarily impacted by research tax credits generated in 2015 and prior years, partially offset by non-deductible share-based compensation. The decrease in the income tax benefit in 2015 compared to 2014 was primarily related to the release of a valuation allowance in 2014 due to expected realization of our deferred tax assets in certain foreign jurisdictions.
50
Liquidity and Capital Resources
Resources
We fund our operations principally with cash provided by operating activities. Cash flow from operations was $67.1 million, $44.8 million and $54.8 million for the years ended December 31, 2016, 2015 and 2014, respectively.
Cash and Cash Equivalents, Accounts Receivable and Working Capital
The following table presents a summary of our cash and cash equivalents, accounts receivable, working capital and cash flows as of the dates and for the periods indicated (in thousands):
December 31, 2016 | December 31, 2015 | ||||||
Cash and cash equivalents | $ | 82,993 | $ | 175,857 | |||
Accounts receivable, net | 121,817 | 108,113 | |||||
Working capital | 227,778 | 234,506 | |||||
Year ended December 31, | |||||||||||
2016 | 2015 | 2014 | |||||||||
Cash provided by (used in): | |||||||||||
Operating activities | $ | 67,097 | $ | 44,786 | $ | 54,759 | |||||
Investing activities | (156,087 | ) | (88,011 | ) | (17,558 | ) | |||||
Financing activities | (2,467 | ) | 118,918 | (4,135 | ) | ||||||
Our cash and cash equivalents at December 31, 2016 were held for working capital and other general corporate purposes and were invested primarily in demand deposit accounts or money market funds. We do not enter into investments for trading or speculative purposes.
Operating Activities
Operating activities consist primarily of net income adjusted for changes in other current and long-term assets and liabilities and non-cash items. Non-cash items primarily consist of stock-based compensation expense, depreciation and amortization, provision for deferred income taxes, non-cash interest on convertible debt, tax windfall benefits from stock option exercises and amortization of software licenses.
For the year ended December 31, 2016, net cash provided by operating activities was $67.1 million, compared to $44.8 million for 2015. The increase was primarily due to an increase from the aggregate changes in non-cash items of $21.5 million and increase in net income of $0.6 million, partially offset by a $0.2 million decrease from the net change in other current and long-term assets and liabilities.
For the year ended December 31, 2015, net cash provided by operating activities was $44.8 million, compared to $54.8 million for 2014. The decrease was primarily due to a $26.2 million decrease from the net change in other current and long-term assets and liabilities and a decrease in net income of $0.1 million, partially offset by a $16.3 million increase from the aggregate changes in non-cash items.
For the year ended December 31, 2014, net cash provided by operating activities was $54.8 million, compared to $31.9 million in 2013. The increase was primarily due to a $11.4 million increase from the aggregate changes in non-cash items and a $11.5 million increase from the net change in other current and long-term assets and liabilities.
Investing Activities
Our investing activities have consisted primarily of purchases of marketable securities, property and equipment and the acquisitions of businesses.
For the year ended December 31, 2016, net cash used in investing activities was $156.1 million, compared to $88.0 million for 2015. This increase was primarily attributable to a $51.7 million increase in net purchases of marketable securities, $13.5 million increase in cash used for acquisitions and a $2.9 million increase in purchases of property and equipment.
51
For the year ended December 31, 2015, net cash used in investing activities was $88.0 million, compared to $17.6 million for 2014. This increase was primarily attributable to a $50.0 million increase in net purchases of marketable securities, $17.5 million increase in cash used for acquisitions and a $2.4 million increase in purchases of property and equipment.
For the year ended December 31, 2014, net cash used in investing activities was $17.6 million, compared to $57.4 million for 2013. This decrease was primarily attributable to a $34.1 million decrease in cash used for acquisitions and a $9.9 million decrease in net purchases of marketable securities, partially offset by a $4.7 million increase in purchases of property and equipment.
Financing Activities
Our financing activities have consisted primarily of net proceeds from the exercises of stock options and taxes paid on the vesting of restricted stock units.
For the year ended December 31, 2016, net cash used in financing activities was $2.5 million, compared to net cash provided by financing activities of $118.9 million for 2015. Net cash used in financing activities in 2016 consisted of proceeds from the exercise of stock options of $15.2 million, partially offset by taxes paid on the vesting of restricted stock units of $17.9 million.
For the year ended December 31, 2015, net cash provided by financing activities was $118.9 million, compared to net cash used in financing activities of $4.1 million for 2014. Net cash provided by financing activities in 2015 consisted of proceeds from the 2022 Notes of $194.8 million and proceeds from the exercise of stock options of $6.2 million, partially offset by our repurchase of a portion of the 2018 Notes for $48.6 million, our repurchase of 790,880 shares of our common stock for $25.0 million, and taxes paid on the vesting of restricted stock units of $10.3 million.
For the year ended December 31, 2014, net cash used in financing activities was $4.1 million, compared to net cash provided by financing activities of $4.8 million for 2013. Net cash used in financing activities in 2014 consisted of taxes paid on the vesting of restricted stock units of $7.8 million, partially offset by our tax windfall benefits from stock option exercises of $3.0 million and proceeds from the exercise of stock options of $0.7 million.
Borrowings and Credit Facilities
2022 Convertible Senior Notes
In September 2015, we issued $201.3 million aggregate principal amount of the 2022 Notes, with net proceeds of $194.8 million. The 2022 Notes are general unsecured obligations, with interest payable semi-annually in cash at a rate of 1.0% per annum, and will mature on September 1, 2022, unless earlier repurchased, redeemed or converted.
The initial conversion rate for the 2022 Notes is $38.72 per share. The conversion price is subject to adjustment in some events, but will not be adjusted for accrued and unpaid interest. In addition, following certain corporate events that occur prior to the maturity date or if we issue a notice of redemption on or after September 1, 2019, we will increase the conversion rate for a holder who elects to convert its 2022 Notes in connection with such a corporate event or during the related redemption period in certain circumstances. Upon conversion, we will pay or deliver, as the case may be, cash, shares of our common stock or a combination of cash and shares of our common stock, at our election. It is our current intent to settle conversions through combination settlement with a specified dollar amount per $1,000 principal amount of 2022 Notes of $1,000. See Note 9, Borrowings, contained elsewhere in this Annual Report on Form 10-K for additional details about the 2022 Notes.
2018 Convertible Senior Notes
In June 2011, we issued $120.0 million aggregate principal amount of our 2018 Notes, with net proceeds of $116 million. The 2018 Notes are our senior unsecured obligations, with interest payable semi-annually in cash at a rate of 1.50% per annum, and will mature on July 1, 2018, unless earlier repurchased, redeemed or converted.
Concurrently with the closing of the 2022 Notes offering, we repurchased $50.9 million principal amount of the 2018 Notes in privately negotiated transactions for an aggregate purchase price of $53.4 million.
The initial conversion rate for the 2018 Notes is $41.99 per share. The conversion price will be subject to adjustment in some events, but will not be adjusted for accrued interest. In addition, if a make-whole fundamental change, as defined in the indenture governing the 2018 Notes (the “2018 Indenture”), occurs prior to the maturity date, we will in some cases increase the conversion rate for a holder that elects to convert its 2018 Notes in connection with such make-whole fundamental change. Upon conversion, we will pay cash up to the aggregate principal amount of the 2018 Notes to be converted and deliver shares of our common stock in respect of the remainder, if any, of the conversion obligation in excess of the aggregate principal amount of the 2018 Notes being converted. See Note 9, Borrowings, contained elsewhere in this Annual Report on Form 10-K for additional details about the 2018 Notes.
Operating and Capital Expenditure Requirements
52
We believe that the cash generated from operations, our current cash, cash equivalents and short-term and long-term investment balances and interest income we earn on these balances will be sufficient to meet our anticipated cash requirements through at least the next 12 months. In the future, we expect our operating and capital expenditures to grow, through organic growth and acquisitions, as we increase headcount, expand our business activities, grow our customer base and implement and enhance our information technology systems. As sales grow, we expect our accounts receivable balance to increase. Any such increase in accounts receivable may not be completely offset by increases in accounts payable and accrued expenses, which would likely result in greater working capital requirements.
If our available cash resources are insufficient to satisfy our liquidity requirements, we may seek to sell additional equity or convertible debt securities or enter into a credit facility. The sale of equity and convertible debt securities may result in dilution to our stockholders and those securities may have rights senior to those of our common shares. If we raise additional funds through the issuance of convertible debt securities, these securities could contain covenants that would restrict our operations. We may require additional capital beyond our currently anticipated amounts. Additional capital may not be available on reasonable terms, or at all.
Contractual Obligations
We have contractual obligations for non-cancelable office space, notes payable and other short-term and long-term liabilities. The following table discloses aggregate information about our contractual obligations as of December 31, 2016 and periods in which payments are due (in thousands):
Payments Due by Year | |||||||||||||||||||
Total | 2017 | 2018-2019 | 2020-2021 | After 2021 | |||||||||||||||
Convertible senior notes, including interest * ^ | $ | 283,985 | $ | 3,049 | $ | 73,648 | $ | 4,025 | $ | 203,263 | |||||||||
Operating lease obligations | 21,563 | 5,807 | 8,195 | 4,082 | 3,479 | ||||||||||||||
Total | $ | 305,548 | $ | 8,856 | $ | 81,843 | $ | 8,107 | $ | 206,742 | |||||||||
* | Contractual interest obligations related to our Notes totaled $13.6 million at December 31, 2016, including $3.1 million, $4.5 million, $4.0 million and $2.0 million due in years 2017, 2018-2019, 2020-2021 and thereafter, respectively. |
^ | Principal payment obligations for the 2018 Notes are $69.1 million, due in July 2018, and principal payment obligations for the 2022 Notes are $201.3 million, due in September 2022. |
As of December 31, 2016, we had unrecognized tax benefits of $8.6 million. We do not expect to recognize any of these benefits in 2017. Furthermore, we are not able to provide a reliable estimate of the timing of future payments relating to these unrecognized benefits.
Off-Balance Sheet Arrangements
As of December 31, 2016, we did not have any significant off-balance sheet arrangements, as defined in Item 303(a)(4)(ii) of SEC Regulation S-K.
Non-GAAP Financial Measures
In addition to our U.S. GAAP operating results, we use certain non-GAAP financial measures when planning, monitoring, and evaluating our performance. We consider these non-GAAP financial measures to be useful metrics for management and investors because they exclude the effect of certain non-cash expenses, such as stock-based compensation expense, amortization of acquired intangibles expense, non-cash interest expense on our convertible senior notes and non-cash tax benefit or expense included in our tax provision, so management and investors can compare our core business operating results over multiple periods. While we believe that these non-GAAP financial measures are useful in evaluating our business, this information should be considered as supplemental in nature and is not meant as a substitute for operating results in accordance with U.S. GAAP. In addition, other companies, including companies in our industry, may calculate such measures differently, which reduces its usefulness as a comparative measure. We believe that these non-GAAP measures reflect our ongoing business in a manner that allows for meaningful period-to-period comparisons and analysis of trends in our business, as they exclude certain expenses.
The presentation of non-GAAP net income, non-GAAP net income per basic and diluted share, non-GAAP cost of revenue, non-GAAP gross profit, non-GAAP income from operations and other non-GAAP financial measures in this Annual Report on Form 10-K is not meant to be a substitute for “net income,” “net income per share,” “cost of revenue,” “gross profit,” “income from operations” or other financial measures presented in accordance with GAAP, but rather should be evaluated in
53
conjunction with such data. Our definition of “non-GAAP net income,” “non-GAAP net income per share,” "non-GAAP cost of revenue," “non-GAAP gross profit,” “non-GAAP income from operations” and other non-GAAP financial measures may differ from similarly titled non-GAAP measures used by other companies and may differ from period to period. In reporting non-GAAP measures in the future, we may make other adjustments for expenses and gains we do not consider reflective of core operating performance in a particular period and may modify “non-GAAP net income,” “non-GAAP net income per share,” "non-GAAP cost of revenue," “non-GAAP gross profit,” “non-GAAP income from operations” and such other non-GAAP measures by excluding these expenses and gains.
Non-GAAP cost of revenue, license software cost of revenue, subscription and maintenance cost of revenue and professional services and other cost of revenue. We define non-GAAP cost of revenue as a cost of revenue less stock-based compensation expense and amortization expense for acquired intangible assets. We consider non-GAAP cost of revenue to be a useful metric for management and our investors because it excludes the effect of certain non-cash expenses so management and investors can compare our cost of revenue over multiple periods.
Non-GAAP gross profit, license software gross profit, subscription and maintenance support gross profit and professional services and other gross profit. We define non-GAAP gross profit as gross profit plus stock-based compensation expense and amortization expense for acquired intangible assets. We consider non-GAAP gross profit to be a useful metric for management and our investors because it excludes the effect of certain non-cash expenses so management and investors can compare our sales margins over multiple periods.
Non-GAAP income from operations. We define non-GAAP income from operations as income from operations plus stock-based compensation expense and amortization expense for acquired intangible assets. We consider non-GAAP income from operations to be a useful metric for management and investors because it excludes the effect of certain non-cash expenses so management and investors can compare our core business operating results over multiple periods.
Non-GAAP operating expenses, sales and marketing expense, research and development expense and general and administrative expense. We define non-GAAP operating expenses as operating expense less stock-based compensation expense allocated to sales and marketing, research and development and general and administrative expenses. Similarly, we define non-GAAP sales and marketing, research and development and general and administrative expenses as the relevant GAAP measure less stock-based compensation expense allocated to the particular expense item.
Non-GAAP net income and net income per share. We define non-GAAP net income as net income plus stock-based compensation expense, amortization expense for acquired intangible assets, non-cash interest expense on our convertible senior notes, foreign currency transaction gains and losses, loss on repurchase of our convertible senior notes and non-cash tax expense included in the GAAP tax provision. We define non-GAAP income per share as non-GAAP net income divided by the weighted average shares outstanding.
54
Years Ended December 31, | |||||||||||
2016 | 2015 | 2014 | |||||||||
(In thousands) | |||||||||||
Non-GAAP cost of revenue: | |||||||||||
GAAP license cost of revenue | $ | 7,585 | $ | 10,231 | $ | 9,755 | |||||
(percent of related revenue) | 6 | % | 9 | % | 9 | % | |||||
Less: | |||||||||||
Stock-based compensation expense | 584 | 1,017 | 738 | ||||||||
Amortization of acquired intangible assets | 1,452 | 1,718 | 871 | ||||||||
Non-GAAP license cost of revenue | $ | 5,549 | $ | 7,496 | $ | 8,146 | |||||
(percent of related revenue) | 4 | % | 6 | % | 8 | % | |||||
GAAP subscription and maintenance support cost of revenue | $ | 46,717 | $ | 38,602 | $ | 32,984 | |||||
(percent of related revenue) | 32 | % | 34 | % | 36 | % | |||||
Less: | |||||||||||
Stock-based compensation expense | 3,423 | 3,006 | 2,287 | ||||||||
Amortization of acquired intangible assets | 4,456 | 3,977 | 4,520 | ||||||||
Non-GAAP subscription and maintenance support cost of revenue | $ | 38,838 | $ | 31,619 | $ | 26,177 | |||||
(percent of related revenue) | 26 | % | 28 | % | 28 | % | |||||
GAAP professional services and other cost of revenue | $ | 36,875 | $ | 28,925 | $ | 14,955 | |||||
(percent of related revenue) | 57 | % | 63 | % | 71 | % | |||||
Less: | |||||||||||
Stock-based compensation expense | 4,333 | 3,204 | 837 | ||||||||
Amortization of acquired intangible assets | 700 | 408 | - | ||||||||
Non-GAAP professional services and other cost of revenue | $ | 31,842 | $ | 25,313 | $ | 14,118 | |||||
(percent of related revenue) | 49 | % | 55 | % | 67 | % | |||||
55
Years Ended December 31, | |||||||||||
2016 | 2015 | 2014 | |||||||||
(In thousands) | |||||||||||
Non-GAAP gross profit: | |||||||||||
GAAP gross profit | $ | 249,785 | $ | 201,085 | $ | 159,163 | |||||
(percent of total revenue) | 73 | % | 72 | % | 73 | % | |||||
Plus: | |||||||||||
Stock-based compensation expense | 8,340 | 7,227 | 3,862 | ||||||||
Amortization of acquired intangible assets | 6,608 | 6,103 | 5,391 | ||||||||
Non-GAAP gross profit | $ | 264,733 | $ | 214,415 | $ | 168,416 | |||||
(percent of total revenue) | 78 | % | 77 | % | 78 | % | |||||
GAAP license gross profit | $ | 121,728 | $ | 109,577 | $ | 93,556 | |||||
(percent of related revenue) | 94 | % | 91 | % | 91 | % | |||||
Plus: | |||||||||||
Stock-based compensation expense | 584 | 1,017 | 738 | ||||||||
Amortization of acquired intangible assets | 1,452 | 1,718 | 871 | ||||||||
Non-GAAP license gross profit | $ | 123,764 | $ | 112,312 | $ | 95,165 | |||||
(percent of related revenue) | 96 | % | 94 | % | 92 | % | |||||
GAAP subscription and maintenance support gross profit | $ | 99,898 | $ | 74,234 | $ | 59,508 | |||||
(percent of related revenue) | 68 | % | 66 | % | 64 | % | |||||
Plus: | |||||||||||
Stock-based compensation expense | 3,423 | 3,006 | 2,287 | ||||||||
Amortization of acquired intangible assets | 4,456 | 3,977 | 4,520 | ||||||||
Non-GAAP subscription and maintenance support gross profit | $ | 107,777 | $ | 81,217 | $ | 66,315 | |||||
(percent of related revenue) | 74 | % | 72 | % | 72 | % | |||||
GAAP professional services and other gross profit | $ | 28,159 | $ | 17,274 | $ | 6,099 | |||||
(percent of related revenue) | 43 | % | 37 | % | 29 | % | |||||
Plus: | |||||||||||
Stock-based compensation expense | 4,333 | 3,204 | 837 | ||||||||
Amortization of acquired intangible assets | 700 | 408 | — | ||||||||
Non-GAAP professional services and other gross profit | $ | 33,192 | $ | 20,886 | $ | 6,936 | |||||
(percent of related revenue) | 51 | % | 45 | % | 33 | % | |||||
56
Years Ended December 31, | |||||||||||
2016 | 2015 | 2014 | |||||||||
(In thousands) | |||||||||||
Non-GAAP income from operations: | |||||||||||
GAAP income from operations | $ | 15,507 | $ | 15,243 | $ | 6,574 | |||||
(percent of total revenue) | 5 | % | 5 | % | 3 | % | |||||
Plus: | |||||||||||
Stock-based compensation expense | 51,507 | 40,444 | 30,273 | ||||||||
Amortization of acquired intangible assets | 6,608 | 6,103 | 5,391 | ||||||||
Non-GAAP income from operations | $ | 73,622 | $ | 61,790 | $ | 42,238 | |||||
(percent of total revenue) | 22 | % | 22 | % | 19 | % | |||||
GAAP operating expense | $ | 234,278 | $ | 185,842 | $ | 152,589 | |||||
(percent of total revenue) | 69 | % | 67 | % | 70 | % | |||||
Less: | |||||||||||
Stock-based compensation expense | 43,167 | 33,217 | 26,411 | ||||||||
Non-GAAP operating expense | $ | 191,111 | $ | 152,625 | $ | 126,178 | |||||
(percent of total revenue) | 56 | % | 55 | % | 58 | % | |||||
GAAP sales and marketing expense | $ | 107,142 | $ | 83,806 | $ | 69,471 | |||||
(percent of total revenue) | 31 | % | 30 | % | 32 | % | |||||
Less: | |||||||||||
Stock-based compensation expense | 18,056 | 13,821 | 9,856 | ||||||||
Non-GAAP sales and marketing expense | $ | 89,086 | $ | 69,985 | $ | 59,615 | |||||
(percent of total revenue) | 26 | % | 25 | % | 27 | % | |||||
GAAP research and development expense | $ | 77,202 | $ | 60,749 | $ | 50,125 | |||||
(percent of total revenue) | 23 | % | 22 | % | 23 | % | |||||
Less: | |||||||||||
Stock-based compensation expense | 15,062 | 11,844 | 10,164 | ||||||||
Non-GAAP research and development expense | $ | 62,140 | $ | 48,905 | $ | 39,961 | |||||
(percent of total revenue) | 18 | % | 18 | % | 18 | % | |||||
GAAP general and administrative expense | $ | 49,934 | $ | 41,287 | $ | 32,993 | |||||
(percent of total revenue) | 15 | % | 15 | % | 15 | % | |||||
Less: | |||||||||||
Stock-based compensation expense | 10,049 | 7,552 | 6,391 | ||||||||
Non-GAAP general and administrative expense | $ | 39,885 | $ | 33,735 | $ | 26,602 | |||||
(percent of total revenue) | 12 | % | 12 | % | 12 | % | |||||
57
Years Ended December 31, | |||||||||||
2016 | 2015 | 2014 | |||||||||
(In thousands, except per share data) | |||||||||||
Non-GAAP net income and income per share: | |||||||||||
GAAP net income | $ | 816 | $ | 179 | $ | 296 | |||||
(percent of total revenue) | * | * | * | ||||||||
Adjusted for: | |||||||||||
Stock-based compensation expense | 51,507 | 40,444 | 30,273 | ||||||||
Amortization of acquired intangible assets | 6,608 | 6,103 | 5,391 | ||||||||
Non-cash interest expense on our convertible senior notes | 12,683 | 8,617 | 5,906 | ||||||||
Foreign currency transaction losses (gains) | 201 | 1,962 | 1,300 | ||||||||
Loss on repurchase of convertible senior notes | — | 3,752 | — | ||||||||
Non-cash tax provision | (738 | ) | (2,477 | ) | (3,018 | ) | |||||
Non-GAAP net income | $ | 71,078 | $ | 58,580 | $ | 40,148 | |||||
(percent of total revenue) | 21 | % | 21 | % | 19 | % | |||||
GAAP net income per basic common share | $ | 0.03 | $ | 0.01 | $ | 0.01 | |||||
Adjusted for: | |||||||||||
Stock-based compensation expense | 1.74 | 1.39 | 1.06 | ||||||||
Amortization of acquired intangible assets | 0.22 | 0.21 | 0.19 | ||||||||
Non-cash interest expense on our convertible senior notes | 0.43 | 0.30 | 0.21 | ||||||||
Foreign currency transaction losses (gains) | 0.01 | 0.07 | 0.05 | ||||||||
Loss on repurchase of convertible senior notes | — | 0.13 | — | ||||||||
Non-cash tax provision | (0.02 | ) | (0.09 | ) | (0.11 | ) | |||||
Non-GAAP net income per basic common share | $ | 2.40 | $ | 2.01 | $ | 1.40 | |||||
GAAP net income per diluted common share | $ | 0.03 | $ | 0.01 | $ | 0.01 | |||||
Adjusted for: | |||||||||||
Stock-based compensation expense | 1.67 | 1.36 | 1.03 | ||||||||
Amortization of acquired intangible assets | 0.21 | 0.20 | 0.18 | ||||||||
Non-cash interest expense on our convertible senior notes | 0.41 | 0.29 | 0.20 | ||||||||
Foreign currency transaction losses (gains) | 0.01 | 0.07 | 0.04 | ||||||||
Loss on repurchase of convertible senior notes | — | 0.13 | — | ||||||||
Non-cash tax provision | (0.02 | ) | (0.08 | ) | (0.10 | ) | |||||
Non-GAAP net income per diluted common share | $ | 2.30 | $ | 1.96 | $ | 1.37 | |||||
* | Less than 1% |
58
Item 7A. | Quantitative and Qualitative Disclosures About Market Risk |
We are exposed to market risk related to changes in interest rates and foreign currency exchange rates. As of December 31, 2016, we had not used derivative financial instruments for speculative, hedging or trading purposes, however, beginning in the first quarter of 2017, we began using a hedging program to manage foreign currency exchange risk and in the future we may enter into interest rate hedging arrangements to manage interest rate risk.
Interest Rate Risk
The interest rate is fixed on all our outstanding loan balances; consequently, we do not have exposure to risks due to increases in the variable rates tied to indexes. We maintain a short-term investment portfolio consisting mainly of highly liquid short-term money market funds, which we consider to be cash equivalents. These securities and investments earn interest at variable rates and, as a result, decreases in market interest rates would generally result in decreased interest income. At December 31, 2016, we had long-term debt of $270.4 million associated with our convertible senior notes, which are fixed rate instruments. We would not expect a 10% change in interest rates to have a material impact on our results of operations.
Foreign Currency Exchange Risk
Our results of operations and cash flows are subject to fluctuations because of changes in foreign currency exchange rates, particularly changes in exchange rates between the U.S. dollar and the Euro and British Pound, the currencies of countries where we currently have our most significant international operations. On a historical basis, invoicing has largely been denominated in U.S. dollars; however, we expect an increasing proportion of our future business to be conducted in currencies other than U.S. dollars. Our expenses are generally denominated in the currencies of the countries in which our operations are located, with our most significant operations at present located in the United States, the United Kingdom, Germany, India and Canada. As a result, our results of operations would generally be adversely affected by a decline in the value of the U.S. dollar relative to these foreign currencies. However, we believe this exposure is not material at this time. As we continue to grow our international operations, our exposure to foreign currency risk will likely become more significant. As of December 31, 2016, we had not used risk management techniques to hedge the risks associated with these fluctuations; however, beginning in the first quarter of 2017, we began using a hedging program.
Fluctuations in foreign currencies impact the amount of total assets and liabilities that we report for our foreign subsidiaries upon the translation of these amounts into U.S. Dollars. In particular, the amount of cash and cash equivalents that we report in U.S. Dollars would be impacted by a significant fluctuation in foreign currency exchange rates. Based on our cash and cash equivalent balances held in foreign currencies at December 31, 2016, if overall foreign currency exchange rates in comparison to the U.S. Dollar uniformly weakened by 10%, the amount of cash and cash equivalents we would report in U.S. Dollars would decrease by approximately $2.6 million, assuming constant foreign currency cash and cash equivalents balances, although the actual effects may differ materially from this hypothetical analysis.
59
Item 8. | Financial Statements and Supplementary Data |
Index to Consolidated Financial Statements
Consolidated Financial Statements | |
Financial Statement Schedule | |
60
REPORT OF INDEPENDENT REGISTERED PUBLIC ACCOUNTING FIRM
To the Board of Directors and Stockholders of BroadSoft, Inc.:
In our opinion, the consolidated financial statements listed in the accompanying index present fairly, in all material respects, the financial position of BroadSoft, Inc. and its subsidiaries at December 31, 2016 and December 31, 2015, and the results of their operations and their cash flows for each of the three years in the period ended December 31, 2016 in conformity with accounting principles generally accepted in the United States of America. In addition, in our opinion, the financial statement schedule listed in the accompanying index presents fairly, in all material respects, the information set forth therein when read in conjunction with the related consolidated financial statements. Also in our opinion, the Company maintained, in all material respects, effective internal control over financial reporting as of December 31, 2016, based on criteria established in Internal Control - Integrated Framework (2013) issued by the Committee of Sponsoring Organizations of the Treadway Commission (COSO). The Company's management is responsible for these financial statements and financial statement schedule, for maintaining effective internal control over financial reporting and for its assessment of the effectiveness of internal control over financial reporting, included in Management's Annual Report on Internal Control over Financial Reporting under Item 9A. Our responsibility is to express opinions on these financial statements, on the financial statement schedule, and on the Company's internal control over financial reporting based on our integrated audits. We conducted our audits in accordance with the standards of the Public Company Accounting Oversight Board (United States). Those standards require that we plan and perform the audits to obtain reasonable assurance about whether the financial statements are free of material misstatement and whether effective internal control over financial reporting was maintained in all material respects. Our audits of the financial statements included examining, on a test basis, evidence supporting the amounts and disclosures in the financial statements, assessing the accounting principles used and significant estimates made by management, and evaluating the overall financial statement presentation. Our audit of internal control over financial reporting included obtaining an understanding of internal control over financial reporting, assessing the risk that a material weakness exists, and testing and evaluating the design and operating effectiveness of internal control based on the assessed risk. Our audits also included performing such other procedures as we considered necessary in the circumstances. We believe that our audits provide a reasonable basis for our opinions.
A company’s internal control over financial reporting is a process designed to provide reasonable assurance regarding the reliability of financial reporting and the preparation of financial statements for external purposes in accordance with generally accepted accounting principles. A company’s internal control over financial reporting includes those policies and procedures that (i) pertain to the maintenance of records that, in reasonable detail, accurately and fairly reflect the transactions and dispositions of the assets of the company; (ii) provide reasonable assurance that transactions are recorded as necessary to permit preparation of financial statements in accordance with generally accepted accounting principles, and that receipts and expenditures of the company are being made only in accordance with authorizations of management and directors of the company; and (iii) provide reasonable assurance regarding prevention or timely detection of unauthorized acquisition, use, or disposition of the company’s assets that could have a material effect on the financial statements.
Because of its inherent limitations, internal control over financial reporting may not prevent or detect misstatements. Also, projections of any evaluation of effectiveness to future periods are subject to the risk that controls may become inadequate because of changes in conditions, or that the degree of compliance with the policies or procedures may deteriorate.
/s/PricewaterhouseCoopers LLP
Baltimore, Maryland
February 23, 2017
61
BroadSoft, Inc.
CONSOLIDATED BALANCE SHEETS
(in thousands, except share and per share data)
December 31, 2016 | December 31, 2015 | ||||||
Assets: | |||||||
Current assets: | |||||||
Cash and cash equivalents | $ | 82,993 | $ | 175,857 | |||
Short-term investments | 136,428 | 72,531 | |||||
Accounts receivable, net of allowance for doubtful accounts of $108 and $85 at December 31, 2016 and December 31, 2015, respectively | 121,817 | 108,113 | |||||
Other current assets | 17,431 | 13,155 | |||||
Total current assets | 358,669 | 369,656 | |||||
Long-term assets: | |||||||
Property and equipment, net | 22,626 | 19,481 | |||||
Long-term investments | 144,159 | 102,385 | |||||
Intangible assets, net | 27,839 | 18,835 | |||||
Goodwill | 82,758 | 72,275 | |||||
Deferred tax assets | 7,042 | 1,661 | |||||
Other long-term assets | 8,107 | 8,081 | |||||
Total long-term assets | 292,531 | 222,718 | |||||
Total assets | $ | 651,200 | $ | 592,374 | |||
Liabilities and stockholders’ equity: | |||||||
Current liabilities: | |||||||
Accounts payable and accrued expenses | $ | 33,854 | $ | 28,667 | |||
Deferred revenue, current portion | 97,037 | 106,483 | |||||
Total current liabilities | 130,891 | 135,150 | |||||
Convertible senior notes | 201,015 | 188,331 | |||||
Deferred revenue | 12,152 | 4,571 | |||||
Other long-term liabilities | 5,908 | 7,289 | |||||
Total liabilities | $ | 349,966 | $ | 335,341 | |||
Commitments and contingencies (Note 12) | |||||||
Stockholders’ equity: | |||||||
Preferred stock, $0.01 par value per share; 5,000,000 shares authorized at December 31, 2016 and December 31, 2015; no shares issued and outstanding at December 31, 2016 and December 31, 2015 | — | — | |||||
Common stock, par value $0.01 per share; 100,000,000 shares authorized at December 31, 2016 and December 31, 2015; 30,353,127 and 29,080,197 shares issued and outstanding at December 31, 2016 and December 31, 2015, respectively | 304 | 291 | |||||
Additional paid-in capital | 383,268 | 333,153 | |||||
Accumulated other comprehensive loss | (21,845 | ) | (13,810 | ) | |||
Accumulated deficit | (60,493 | ) | (62,601 | ) | |||
Total stockholders’ equity | 301,234 | 257,033 | |||||
Total liabilities and stockholders’ equity | $ | 651,200 | $ | 592,374 | |||
The accompanying notes are an integral part of these consolidated financial statements.
62
BroadSoft, Inc.
CONSOLIDATED STATEMENTS OF OPERATIONS
(in thousands, except per share data)
Year Ended December 31, | |||||||||||
2016 | 2015 | 2014 | |||||||||
Revenue: | |||||||||||
License software | $ | 129,313 | $ | 119,808 | $ | 103,311 | |||||
Subscription and maintenance support | 146,615 | 112,836 | 92,492 | ||||||||
Professional services and other | 65,034 | 46,199 | 21,054 | ||||||||
Total revenue | 340,962 | 278,843 | 216,857 | ||||||||
Cost of revenue: | |||||||||||
License software | 7,585 | 10,231 | 9,755 | ||||||||
Subscription and maintenance support | 46,717 | 38,602 | 32,984 | ||||||||
Professional services and other | 36,875 | 28,925 | 14,955 | ||||||||
Total cost of revenue | 91,177 | 77,758 | 57,694 | ||||||||
Gross profit | 249,785 | 201,085 | 159,163 | ||||||||
Operating expenses: | |||||||||||
Sales and marketing | 107,142 | 83,806 | 69,471 | ||||||||
Research and development | 77,202 | 60,749 | 50,125 | ||||||||
General and administrative | 49,934 | 41,287 | 32,993 | ||||||||
Total operating expenses | 234,278 | 185,842 | 152,589 | ||||||||
Income from operations | 15,507 | 15,243 | 6,574 | ||||||||
Other expense: | |||||||||||
Interest expense | 15,756 | 10,656 | 7,706 | ||||||||
Interest income | (2,680 | ) | (1,270 | ) | (529 | ) | |||||
Other, net | 155 | 5,714 | 1,300 | ||||||||
Total other expense, net | 13,231 | 15,100 | 8,477 | ||||||||
Income (loss) before income taxes | 2,276 | 143 | (1,903 | ) | |||||||
Provision for (benefit from) income taxes | 1,460 | (36 | ) | (2,199 | ) | ||||||
Net income | $ | 816 | $ | 179 | $ | 296 | |||||
Net income per common share: | |||||||||||
Basic | $ | 0.03 | $ | 0.01 | $ | 0.01 | |||||
Diluted | $ | 0.03 | $ | 0.01 | $ | 0.01 | |||||
Weighted average common shares outstanding: | |||||||||||
Basic | 29,670 | 29,113 | 28,654 | ||||||||
Diluted | 30,898 | 29,818 | 29,365 | ||||||||
Stock-based compensation expense included above: | |||||||||||
Cost of revenue | $ | 8,340 | $ | 7,227 | $ | 3,862 | |||||
Sales and marketing | 18,056 | 13,821 | 9,856 | ||||||||
Research and development | 15,062 | 11,844 | 10,164 | ||||||||
General and administrative | 10,049 | 7,552 | 6,391 | ||||||||
The accompanying notes are an integral part of these consolidated financial statements.
63
BroadSoft, Inc.
CONSOLIDATED STATEMENTS OF COMPREHENSIVE INCOME
(in thousands)
Year ended December 31, | |||||||||||
2016 | 2015 | 2014 | |||||||||
Net income | $ | 816 | $ | 179 | $ | 296 | |||||
Other comprehensive loss, net of tax: | |||||||||||
Foreign currency translation adjustment | (8,667 | ) | (5,418 | ) | (6,061 | ) | |||||
Unrealized gain (loss) on investments | 632 | (680 | ) | (126 | ) | ||||||
Total other comprehensive loss, net of tax | (8,035 | ) | (6,098 | ) | (6,187 | ) | |||||
Comprehensive loss | $ | (7,219 | ) | $ | (5,919 | ) | $ | (5,891 | ) | ||
The accompanying notes are an integral part of these consolidated financial statements.
64
BroadSoft, Inc.
CONSOLIDATED STATEMENTS OF STOCKHOLDERS’ EQUITY
(in thousands)
Total Stockholders' Equity | Common Stock Par Value $0.01 Per Share | Additional Paid-in Capital | Accumulated Other Comprehensive Loss | Accumulated Deficit | ||||||||||||||||||
Shares | Amount | |||||||||||||||||||||
Balance December 31, 2013 | $ | 192,859 | 28,305 | $ | 283 | $ | 232,183 | $ | (1,525 | ) | $ | (38,082 | ) | |||||||||
Issuance of common stock for exercise of stock options and vesting of RSUs, net of effect of early exercise of stock options and withholding tax | (7,085 | ) | 638 | 7 | (7,092 | ) | — | — | ||||||||||||||
Stock-based compensation expense | 30,225 | — | — | 30,225 | — | — | ||||||||||||||||
Tax windfall benefits on exercises of stock options | 2,853 | — | — | 2,853 | — | — | ||||||||||||||||
Foreign currency translation adjustment | (6,061 | ) | — | — | — | (6,061 | ) | — | ||||||||||||||
Unrealized loss on investments | (126 | ) | — | — | — | (126 | ) | — | ||||||||||||||
Net income | 296 | — | — | — | — | 296 | ||||||||||||||||
Balance December 31, 2014 | $ | 212,961 | 28,943 | $ | 290 | $ | 258,169 | $ | (7,712 | ) | $ | (37,786 | ) | |||||||||
Issuance of common stock for exercise of stock options and vesting of RSUs, net of effect of withholding tax | (4,110 | ) | 928 | 9 | (4,119 | ) | — | — | ||||||||||||||
Repurchase of common stock | (25,002 | ) | (791 | ) | (8 | ) | — | — | (24,994 | ) | ||||||||||||
Equity component of 2022 convertible senior notes issuance, net of issuance costs | 67,792 | — | — | 67,792 | — | — | ||||||||||||||||
Equity component of 2018 convertible senior notes repurchase | (6,751 | ) | — | — | (6,751 | ) | — | — | ||||||||||||||
Deferred tax liability related to convertible senior notes, net | (23,503 | ) | — | — | (23,503 | ) | — | — | ||||||||||||||
Stock-based compensation expense | 40,938 | — | — | 40,938 | — | — | ||||||||||||||||
Tax windfall benefits on exercises of stock options | 627 | — | — | 627 | — | — | ||||||||||||||||
Foreign currency translation adjustment | (5,418 | ) | — | — | — | (5,418 | ) | — | ||||||||||||||
Unrealized loss on investments | (680 | ) | — | — | — | (680 | ) | — | ||||||||||||||
Net income | 179 | — | — | — | — | 179 | ||||||||||||||||
Balance December 31, 2015 | $ | 257,033 | 29,080 | $ | 291 | $ | 333,153 | $ | (13,810 | ) | $ | (62,601 | ) | |||||||||
Issuance of common stock for exercise of stock options and vesting of RSUs and PSUs, net of effect of withholding tax | (2,763 | ) | 1,273 | 13 | (2,776 | ) | — | — | ||||||||||||||
Stock-based compensation expense | 52,469 | — | — | 52,469 | — | — | ||||||||||||||||
Tax windfall benefits on exercises of stock options | 1,714 | — | — | 422 | — | 1,292 | ||||||||||||||||
Foreign currency translation adjustment | (8,667 | ) | — | — | — | (8,667 | ) | — | ||||||||||||||
Unrealized gain on investments | 632 | — | — | — | 632 | — | ||||||||||||||||
Net income | 816 | — | — | — | — | 816 | ||||||||||||||||
Balance December 31, 2016 | $ | 301,234 | 30,353 | $ | 304 | $ | 383,268 | $ | (21,845 | ) | $ | (60,493 | ) | |||||||||
The accompanying notes are an integral part of these consolidated financial statements.
65
BroadSoft, Inc.
CONSOLIDATED STATEMENTS OF CASH FLOWS
(in thousands)
Year Ended December 31, | |||||||||||
2016 | 2015 | 2014 | |||||||||
Cash flows from operating activities: | |||||||||||
Net income | $ | 816 | $ | 179 | $ | 296 | |||||
Adjustment to reconcile net income to net cash provided by operating activities: | |||||||||||
Depreciation and amortization | 17,993 | 15,836 | 12,391 | ||||||||
Amortization of software licenses | 3,401 | 2,848 | 3,342 | ||||||||
Stock-based compensation expense | 51,507 | 40,444 | 30,273 | ||||||||
Provision for doubtful accounts | 313 | 4 | 274 | ||||||||
Benefit from deferred income taxes | (2,031 | ) | (2,741 | ) | (3,477 | ) | |||||
Excess tax benefits related to stock-based compensation | (296 | ) | (1,809 | ) | (2,950 | ) | |||||
Payment of original notes issuance discount | — | (1,094 | ) | — | |||||||
Non-cash interest expense on convertible senior notes | 12,684 | 8,617 | 5,906 | ||||||||
Changes in operating assets and liabilities, net of acquisitions: | |||||||||||
Accounts receivable | (12,499 | ) | (23,935 | ) | (14,806 | ) | |||||
Other current and long-term assets | (7,606 | ) | (4,896 | ) | (4,056 | ) | |||||
Accounts payable, accrued expenses and other long-term liabilities | 4,815 | 2,234 | 4,655 | ||||||||
Current and long-term deferred revenue | (2,000 | ) | 9,099 | 22,911 | |||||||
Net cash provided by operating activities | 67,097 | 44,786 | 54,759 | ||||||||
Cash flows from investing activities: | |||||||||||
Purchases of property and equipment | (15,738 | ) | (12,876 | ) | (10,523 | ) | |||||
Payments for acquisitions, net of cash acquired | (34,678 | ) | (21,172 | ) | (3,650 | ) | |||||
Purchases of marketable securities | (281,111 | ) | (252,467 | ) | (122,991 | ) | |||||
Proceeds from sale of marketable securities | 106,355 | 128,827 | 10,000 | ||||||||
Proceeds from maturities of marketable securities | 69,085 | 69,677 | 109,042 | ||||||||
Change in restricted cash | — | — | 564 | ||||||||
Net cash used in investing activities | (156,087 | ) | (88,011 | ) | (17,558 | ) | |||||
Cash flows from financing activities: | |||||||||||
Proceeds from the exercise of stock options | 15,181 | 6,187 | 710 | ||||||||
Taxes paid on vesting of RSUs | (17,944 | ) | (10,297 | ) | (7,795 | ) | |||||
Excess tax benefits related to stock-based compensation | 296 | 1,809 | 2,950 | ||||||||
Repurchase of common stock | — | (25,002 | ) | — | |||||||
Proceeds from issuance of 2022 convertible senior notes, net of issuance costs | — | 194,822 | — | ||||||||
Repurchase of 2018 convertible senior notes | — | (48,601 | ) | — | |||||||
Net cash provided by (used in) financing activities | (2,467 | ) | 118,918 | (4,135 | ) | ||||||
Effect of exchange rate changes on cash and cash equivalents | (1,407 | ) | (1,379 | ) | (1,389 | ) | |||||
Net increase (decrease) in cash and cash equivalents | (92,864 | ) | 74,314 | 31,677 | |||||||
Cash and cash equivalents, beginning of year | 175,857 | 101,543 | 69,866 | ||||||||
Cash and cash equivalents, end of year | $ | 82,993 | $ | 175,857 | $ | 101,543 | |||||
Supplemental disclosures: | |||||||||||
Cash paid for interest | $ | 3,000 | $ | 1,418 | $ | 1,801 | |||||
Cash paid for income taxes | $ | 3,572 | $ | 2,377 | $ | 1,678 | |||||
Change in accounts payable and accrued expenses for purchase of property and equipment | $ | 1,523 | $ | 2,153 | $ | 688 | |||||
The accompanying notes are an integral part of these consolidated financial statements.
66
1. Nature of Business
BroadSoft, Inc. (“BroadSoft” or the “Company”), a Delaware corporation, was formed in 1998. The Company is the leading global provider of software and services that enable telecommunications service providers to deliver hosted, cloud-based Unified Communications, or UC, to their enterprise customers.
2. Summary of Significant Accounting Policies
Principles of Consolidation
The accompanying consolidated financial statements include the accounts and results of operations of the Company and its wholly owned subsidiaries. All intercompany balances and transactions have been eliminated in the accompanying consolidated financial statements.
Use of Estimates
The preparation of financial statements in conformity with United States generally accepted accounting principles (“U.S. GAAP”) requires management to make estimates and assumptions that affect the reported amounts of assets and liabilities at the date of the financial statements and the reported amounts of revenues and expenses during the reporting period. Actual amounts could differ from these estimates.
Cash Equivalents
The Company considers all highly liquid instruments purchased with an original maturity of three months or less to be cash equivalents. Cash equivalents are held in money market accounts.
Investments in Marketable Securities
Marketable debt securities that the Company does not intend to hold to maturity are classified as available-for-sale, are carried at fair value and are included on the Company’s consolidated balance sheet as either short-term or long-term investments depending on their maturity. Investments with original maturities greater than three months that mature less than one year from the consolidated balance sheet date are classified as short-term investments. Investments with maturities greater than one year from the consolidated balance sheet date are classified as long-term investments. Available-for-sale investments are marked-to-market at the end of each reporting period, with unrealized holding gains or losses, which represent temporary changes in the fair value of the investment, reflected in accumulated other comprehensive income (loss), a separate component of stockholders’ equity. The transfers from accumulated other comprehensive income into net income is immaterial. The Company’s primary objective when investing excess cash is preservation of principal. The following table summarizes the Company's investments:
67
December 31, 2016 | December 31, 2015 | ||||||||||
Contracted Maturity | Carrying Value | Contracted Maturity | Carrying Value | ||||||||
(in thousands) | (in thousands) | ||||||||||
Money market funds | demand | $ | 44,962 | demand | $ | 123,170 | |||||
Total cash equivalents | $ | 44,962 | $ | 123,170 | |||||||
U.S. agency notes | 120 - 156 days | 60,103 | 50 - 365 days | 39,467 | |||||||
Commercial paper | 137 days | 1,993 | — | ||||||||
Corporate bonds | 10 - 363 days | 66,820 | 12 - 319 days | 33,064 | |||||||
Asset-backed securities | 107 - 258 days | 7,512 | — | ||||||||
Total short-term investments | $ | 136,428 | $ | 72,531 | |||||||
U.S. agency notes | 380 - 516 days | 93,922 | 486 - 851 days | 44,175 | |||||||
Corporate bonds | 381 - 488 days | 42,202 | 376 - 846 days | 58,210 | |||||||
Asset-backed securities | 410 - 464 days | 8,035 | — | ||||||||
Total long-term investments | $ | 144,159 | $ | 102,385 | |||||||
The following table summarizes the cost and fair value of the Company's investments at December 31, 2016 (in thousands):
Cost | Gross Unrealized Gains | Gross Unrealized Losses | Fair Value | ||||||||||||
U.S. agency notes | $ | 154,272 | $ | 12 | $ | (261 | ) | $ | 154,023 | ||||||
Commercial paper | 1,993 | — | — | 1,993 | |||||||||||
Corporate bonds | 109,133 | 10 | (120 | ) | 109,023 | ||||||||||
Asset-backed securities | 15,545 | 4 | (1 | ) | 15,548 | ||||||||||
Total investments | $ | 280,943 | $ | 26 | $ | (382 | ) | $ | 280,587 | ||||||
The following table summarizes the cost and fair value of the Company's investments at December 31, 2015 (in thousands):
Cost | Gross Unrealized Gains | Gross Unrealized Losses | Fair Value | ||||||||||||
U.S. agency notes | $ | 83,977 | $ | — | $ | (334 | ) | $ | 83,643 | ||||||
Corporate bonds | 91,537 | 2 | (266 | ) | 91,273 | ||||||||||
Total investments | $ | 175,514 | $ | 2 | $ | (600 | ) | $ | 174,916 | ||||||
Fair Value Measurements
The following table summarizes the carrying and fair value of the Company’s financial assets (in thousands):
December 31, 2016 | December 31, 2015 | ||||||||||||||
Carrying Value | Fair Value | Carrying Value | Fair Value | ||||||||||||
Assets | |||||||||||||||
Cash equivalents* | $ | 44,962 | $ | 44,962 | $ | 123,170 | $ | 123,170 | |||||||
Short and long-term investments | 280,587 | 280,587 | 174,916 | 174,916 | |||||||||||
Total assets | $ | 325,549 | $ | 325,549 | $ | 298,086 | $ | 298,086 | |||||||
68
* | Excludes $38.0 million and $52.7 million of operating cash balances as of December 31, 2016 and 2015, respectively. |
The carrying amounts of the Company’s other financial instruments, accounts receivable, accounts payable and accrued expenses, approximate their respective fair values due to their short term nature. (See Note 9 Borrowings for additional information on fair value of debt.)
The Company uses a three-tier fair value measurement hierarchy to classify and disclose all assets and liabilities measured at fair value on a recurring basis, as well as assets and liabilities measured at fair value on a non-recurring basis, in periods subsequent to their initial measurement. The three tiers are defined as follows:
• | Level 1. Observable inputs based on unadjusted quoted prices in active markets for identical instruments and include the Company’s investments in money market funds and certificates of deposit; |
• | Level 2. Inputs valued using quoted market prices for similar instruments, nonbinding market prices that are corroborated by observable market data and include the Company’s investments and marketable securities in U.S. agency notes, commercial paper and corporate bonds; and |
• | Level 3. Unobservable inputs for which there is little or no market data, which require the Company to develop its own assumptions. |
Assets Measured at Fair Value on a Recurring Basis
The Company evaluates its financial assets subject to fair value measurements on a recurring basis to determine the appropriate level of classification for each reporting period. This determination requires significant judgments to be made. There were no transfers between classification levels during the periods. The following table summarizes the values (in thousands):
December 31, 2016 | Level 1 | Level 2 | Level 3 | ||||||||||||
Money market funds | $ | 44,962 | $ | 44,962 | $ | — | $ | — | |||||||
Total cash equivalents* | 44,962 | 44,962 | — | — | |||||||||||
U.S. agency notes | 154,024 | — | 154,024 | — | |||||||||||
Commercial paper | 1,993 | — | 1,993 | — | |||||||||||
Corporate bonds | 109,022 | — | 109,022 | — | |||||||||||
Asset-backed securities | 15,548 | — | 15,548 | — | |||||||||||
Total investments | 280,587 | — | 280,587 | — | |||||||||||
Total cash equivalents and investments | $ | 325,549 | $ | 44,962 | $ | 280,587 | $ | — | |||||||
December 31, 2015 | Level 1 | Level 2 | Level 3 | ||||||||||||
Money market funds | $ | 123,170 | $ | 123,170 | $ | — | $ | — | |||||||
Total cash equivalents* | 123,170 | 123,170 | — | — | |||||||||||
U.S. agency notes | 83,643 | — | 83,643 | — | |||||||||||
Corporate bonds | 91,273 | — | 91,273 | — | |||||||||||
Total investments | 174,916 | — | 174,916 | — | |||||||||||
Total cash equivalents and investments | $ | 298,086 | $ | 123,170 | $ | 174,916 | $ | — | |||||||
* | Excludes $38.0 million and $52.7 million of operating cash balances as of December 31, 2016 and 2015, respectively. |
Assets Measured at Fair Value on a Nonrecurring Basis
The Company measures certain assets, including property and equipment, goodwill and intangible assets, at fair value on a nonrecurring basis. These assets are recognized at fair value when they are deemed to be impaired. During the years ended
69
December 31, 2016 and 2015, there were no assets or liabilities measured at fair value on a nonrecurring basis subsequent to their initial recognition.
Concentration of Credit Risk
Financial instruments that subject the Company to significant concentrations of credit risk consist primarily of cash and cash equivalents, marketable securities and accounts receivable. All of the Company’s cash and cash equivalents and marketable securities are held at financial institutions that management believes to be of high credit quality. The Company’s cash and cash equivalent accounts may exceed federally insured limits at times. The Company has not experienced any losses on cash and cash equivalents to date. To manage accounts receivable risk, the Company evaluates the creditworthiness of its customers and maintains an allowance for doubtful accounts.
The following customers represented 10% or more of revenue for the periods presented:
Year Ended December 31, | |||||||
2016 | 2015 | 2014 | |||||
Revenue | |||||||
Company A | * | * | 13 | % | |||
Company B | 10 | % | * | * | |||
* | Represented less than 10% |
Accounts Receivable and Allowance for Doubtful Accounts
Accounts receivable are derived from sales to customers. Each customer is evaluated for creditworthiness through a credit review process at the time of each order. Accounts receivable are stated at realizable value, net of an allowance for doubtful accounts that is maintained for estimated losses that would result from the inability of some customers to make payments as they become due. The allowance is based on an analysis of past due amounts and ongoing credit evaluations. Collection experience has been consistent with the Company’s estimates.
Property and Equipment
Property and equipment are stated at cost, less accumulated depreciation and amortization. Replacements and major improvements are capitalized; maintenance and repairs are charged to expense as incurred.
Depreciation is calculated using the straight-line method over the estimated useful lives of the related assets per the table below:
Equipment | 3 - 5 years |
Software | 1.5 - 3 years |
Furniture and fixtures | 5 years |
Leasehold improvements are amortized over the shorter of the term of the lease and the estimated useful life of the assets.
Business Combinations
In a business combination, the Company allocates the purchase price to the acquired business’ identifiable assets and liabilities at their acquisition date fair values. The excess of the purchase price over the amount allocated to the identifiable assets and liabilities, if any, is recorded as goodwill. The excess, if any, of the fair value of the identifiable assets acquired and liabilities assumed over the consideration transferred is recognized as a gain within other income in the consolidated statement of operations as of the acquisition date.
To date, the assets acquired and liabilities assumed in the Company’s business combinations have primarily consisted of acquired working capital, definite-lived intangible assets and goodwill. The carrying value of acquired working capital approximates its fair value, given the short-term nature of these assets and liabilities. The Company estimates the fair value of definite-lived intangible assets acquired using a discounted cash flow approach, which includes an analysis of the future cash flows expected to be generated by such assets and the risk associated with achieving such cash flows. The key assumptions used in the discounted cash flow model include the discount rate that is applied to the discretely forecasted future cash flows to calculate the present value of those cash flows and the estimate of future cash flows attributable to the acquired intangible,
70
which include revenue, operating expenses and taxes. The Company's estimates are inherently uncertain and subject to refinement. As a result, during the measurement period, which may be up to one year from the acquisition date, the Company may record adjustments to the fair value of assets acquired and liabilities assumed, with the corresponding offset to goodwill.
Goodwill
Goodwill represents the excess of (a) the aggregate of the fair value of consideration transferred in a business combination, over (b) the fair value of assets acquired, net of liabilities assumed. Goodwill is not amortized, but is subject to annual impairment tests as described below.
The Company tests goodwill for impairment annually on December 31, or more frequently if events or changes in business circumstances indicate the asset might be impaired. The Company may first assess qualitative factors to determine if it is more likely than not that the fair value of a reporting unit is less than its carrying amount as a basis for determining whether it is necessary to perform the two-step goodwill impairment test included in U.S. GAAP. To the extent the assessment identifies adverse conditions, or if the Company elects to bypass the qualitative assessment, goodwill is tested for impairment at the reporting unit level using a two-step approach. The first step is to compare the fair value of the reporting unit to the carrying value of the net assets assigned to the reporting unit. If the fair value of the reporting unit is greater than the carrying value of the net assets assigned to the reporting unit, the assigned goodwill is not considered impaired. If the fair value is less than the reporting unit’s carrying value, step two is performed to measure the amount of the impairment, if any. In the second step, the fair value of goodwill is determined by deducting the fair value of the reporting unit’s identifiable assets and liabilities from the fair value of the reporting unit as a whole, as if the reporting unit had just been acquired and the purchase price were being initially allocated. If the carrying value of goodwill exceeds the implied fair value, an impairment charge would be recorded to operating expenses in the consolidated statement of operations in the period the determination is made.
The Company has determined that it has one reporting unit, BroadSoft, Inc., which is the consolidated entity. Based on the Company’s completion of the first step of the two-step goodwill impairment test, there was no indication of impairment as of December 31, 2016, 2015 or 2014. (See Note 4 Goodwill and Intangibles.)
Identifiable Intangible Assets
The Company acquired intangible assets in connection with certain of its business acquisitions. These assets were recorded at their estimated fair values at the acquisition date and are amortized over their respective estimated useful lives using a method of amortization that reflects the pattern in which the economic benefits of the intangible assets are used. Estimated useful lives are determined based on the Company’s historical use of similar assets and the expectation of future realization of revenue attributable to the intangible assets. In those cases where the Company determines that the useful life of an intangible asset should be shortened, the Company amortizes the net book value in excess of the estimated salvage value over its revised remaining useful life. The Company did not revise the useful life estimates attributed to any of the Company’s intangible assets during the years ended December 31, 2016, 2015 or 2014. (See Note 4 Goodwill and Intangibles.)
The estimated useful lives used in computing amortization are as follows:
Customer relationships | 3 - 8 years |
Developed technology | 2 - 6 years |
Trade names | 1 - 7 years |
Impairment of Long-Lived Assets
The Company reviews long-lived assets, including property and equipment and definite-lived intangible assets, for impairment whenever events or changes in circumstances indicate the carrying amount of an asset may not be recoverable. Recoverability of assets to be held and used is measured by a comparison of the carrying amount of the assets to future undiscounted net cash flows expected to be generated by the assets. Recoverability measurement and estimating of undiscounted cash flows for assets to be held and used is done at the lowest possible levels for which there are identifiable cash flows. If such assets are considered impaired, the amount of impairment recognized would be equal to the amount by which the carrying amount of the assets exceeds the fair value of the assets, which the Company would compute using a discounted cash flow approach. Assets to be disposed of are recorded at the lower of the carrying amount or fair value less costs to sell. There was no impairment of long-lived assets during the years ended December 31, 2016, 2015 or 2014.
71
Deferred Financing Costs
The Company amortizes deferred financing costs using the effective-interest method and records such amortization as interest expense.
Revenue Recognition
The Company’s revenue is generated from the sales of software licenses and related maintenance for those licenses, subscription and usage fees related to the SaaS offerings and professional services. The Company’s software licenses, subscription and maintenance contracts and professional services are sold directly through its own sales force and indirectly through distribution partners.
License Software
Revenue from software licenses is recognized when the following four basic criteria are met as follows:
• | Persuasive evidence of an arrangement. For direct sales, an agreement signed by the Company and by the customer, in conjunction with a non-cancelable purchase order or executed sales quote from the customer, is deemed to represent persuasive evidence of an arrangement. For sales through distribution partners, a purchase order or executed sales quote, in conjunction with a reseller agreement with the distribution partner and evidence of the distribution partner's customer, is deemed to represent persuasive evidence of an arrangement. Revenue is deferred for sales through a distribution partner without proof of the distribution partner's customer. |
• | Delivery has occurred. Delivery is deemed to have occurred when the customer is given electronic access to the licensed software and a license key for the software has been delivered or made available. If an arrangement contains a requirement to deliver additional elements essential to the functionality of the delivered element, revenue associated with the arrangement is recognized when delivery of the final element has occurred. |
• | Fees are fixed or determinable. The Company considers the fee to be fixed or determinable unless the fee is subject to refund or adjustment or is not payable within normal payment terms. If the fee is subject to refund or adjustment, revenue is recognized when the refund or adjustment right lapses. If payment terms exceed the Company’s normal terms, revenue is recognized as the amounts become due and payable or upon the receipt of cash if collection is not probable. |
• | Collection is probable. Each customer is evaluated for creditworthiness through a credit review process at the inception of an arrangement. Collection is deemed probable if, based upon the Company’s evaluation, the Company expects that the customer will be able to pay amounts under the arrangement as payments become due. If it is determined that collection is not probable, revenue is deferred and recognized upon cash collection. |
The warranty period for the Company’s licensed software is generally 90 days.
The Company delivers its licensed software primarily by utilizing electronic media.
Subscription and Maintenance Support
The Company typically sells annual maintenance support contracts in combination with license software sales. Maintenance support enables the customer to continue receiving software maintenance and support after the warranty period has expired. Maintenance support is renewable at the option of the customer. When customers prepay for annual maintenance support, the related revenue is deferred and recognized ratably over the term of the maintenance period. Generally, rates for maintenance support, including subsequent renewal rates, are established based upon a specific percentage of net license fees as set forth in the arrangement. Maintenance support typically includes the right to unspecified product upgrades on an if-and-when available basis.
The Company’s subscription revenue is generated from a recurring fee and/or a usage based fee from customers purchasing the Company's SaaS offerings. Under these arrangements, the Company is generally paid a recurring fee calculated based on the number of seats and type of service purchased or a usage fee based on the actual number of transactions. Revenue related to the recurring fee is recognized ratably over the contract term beginning with the date our service is made available to the customer. The usage fee is recognized as revenue in the period in which the transactions occur. Subscription agreements do not provide customers with the right to take possession of the underlying software at any time.
72
Professional Services and Other
Revenue from professional services includes implementation, training and consulting and design and customization services. Professional services are generally either daily-rate or fixed-fee arrangements. Revenue from daily-rate arrangements is typically recognized as services are performed. Revenue related to fixed-fee arrangements are typically recognized upon completion of all of the deliverables. Services are generally not considered essential to the functionality of the licensed software.
Costs related to shipping and handling and billable travel expenses are included in cost of revenue.
Multiple Element Arrangements
The Company accounts for multiple element arrangements that consist of software and software-related services, collectively referred to as “software elements,” in accordance with industry specific accounting guidance for software and software-related transactions. For such transactions, the Company generally allocates revenue to the software license by determining the fair value of the undelivered elements, which is usually maintenance support and professional services. The Company establishes vendor-specific objective evidence ("VSOE") of the fair value of the maintenance support based on the renewal price as stated in the agreement and as charged in the first optional renewal period under the arrangement. VSOE for professional services is determined based on an analysis of our historical daily rates when these professional services are sold separately from the software license.
For the Company's cloud offering with multiple element arrangements that include subscription and professional services, the Company allocates revenue to all deliverables based on their relative selling prices. In such circumstances, the Company uses the following hierarchy to determine the selling price to be used for allocating revenue to deliverables (a) vendor-specific objective evidence of fair value, (b) third-party evidence of selling price and (c) best estimate of the selling price. Best estimate of selling price reflects the Company’s estimates of what the selling prices of elements would be if they were sold on a stand-alone basis. Factors considered by the Company in developing relative selling prices for products and services include the discounting practices, price lists, go-to-market strategy, historical standalone sales and contract prices.
Research and Development
Research and development expenses consist primarily of personnel and related expenses for the Company's research and development staff, including salaries, benefits, bonuses and stock-based compensation and the cost of certain third-party contractors. Research and development costs, other than software development expenses qualifying for capitalization, are expensed as incurred.
Software Development Costs
Software development costs for software to be sold, leased or marketed that is incurred prior to the establishment of technological feasibility are expensed as incurred as research and development expense. Software development costs incurred subsequent to the establishment of technological feasibility, if any, are capitalized until the software is available for general release to customers. The Company has determined that technological feasibility has been established at approximately the same time as the general release of such software to customers. Therefore, to date, the Company has not capitalized any related software development costs.
Internal-Use Software Development Costs
The Company capitalizes costs associated with customized internal-use software systems that have reached the application development stage. Such capitalized costs include costs directly associated with the development of the applications. Capitalization of such costs begins when the preliminary project stage is complete and ceases at the point the project is substantially complete and is ready for its intended purpose. Internal-use software is amortized on a straight-line basis over the estimated useful life. Costs incurred during the preliminary development stage, as well as maintenance and training costs, are expensed as incurred.
The Company capitalized $3.5 million and $2.2 million in internal-use software during the years ended December 31, 2016 and 2015, respectively. Capitalized internal-use software is included in property and equipment.
The Company recorded amortization expense related to these assets of $1.9 million, $1.5 million and $0.7 million during the years ended December 31, 2016, 2015 and 2014, respectively.
73
Deferred Revenue
Deferred revenue represents amounts billed to or collected from customers for which the related revenue has not been recognized because one or more of the revenue recognition criteria have not been met. The current portion of deferred revenue is expected to be recognized as revenue within 12 months from the balance sheet date.
Deferred revenue consists of the following (in thousands):
December 31, 2016 | December 31, 2015 | ||||||
License software | $ | 17,662 | $ | 33,200 | |||
Subscription and maintenance support | 72,559 | 61,399 | |||||
Professional services and other | 18,968 | 16,455 | |||||
Total | $ | 109,189 | $ | 111,054 | |||
Current portion | $ | 97,037 | $ | 106,483 | |||
Non-current portion | 12,152 | 4,571 | |||||
Total | $ | 109,189 | $ | 111,054 | |||
Cost of Revenue
Cost of revenue includes (a) royalties and other fees paid to third parties whose technology or products are sold as part of the Company’s products, (b) direct costs to manufacture and distribute product, (c) direct costs to provide product support and professional support services, (d) direct costs associated with delivery of the Company's SaaS offerings and (e) amortization expense related to acquired intangible assets.
Income Taxes
The Company uses the liability method of accounting for income taxes as set forth in the authoritative guidance for accounting for income taxes. This method requires an asset and liability approach for the recognition of deferred tax assets and liabilities for the expected future tax consequences attributable to temporary differences between the carrying amounts of assets and liabilities for financial reporting purposes and their respective tax bases, and for operating loss and tax credit carryforwards. Deferred tax assets and liabilities are measured by applying enacted statutory tax rates applicable to the future years in which deferred amounts are expected to be settled or realized.
The Company currently has significant deferred tax assets, primarily resulting from net operating loss carryforwards, deferred revenue and stock-based compensation expense. The Company has a valuation allowance of $1.8 million against its net deferred tax assets. Management weighs the positive and negative evidence to determine if it is more likely than not that some or all of the deferred tax assets will be realized.
The Company accounts for uncertainty in income taxes using a two-step approach to recognize and measure tax benefits when the realization of the benefits is uncertain. The first step is to determine whether the benefit is to be recognized; the second step is to determine the amount to be recognized. Income tax benefits should be recognized when, based on the technical merits of a tax position, the entity believes that if a dispute arose with the taxing authority and were taken to a court of last resort, it is more likely than not (i.e., a probability of greater than 50 percent) that the tax position would be sustained as filed. If a position is determined to be more likely than not of being sustained, the reporting enterprise should recognize the largest amount of tax benefit that is greater than 50 percent likely of being realized upon ultimate settlement with the taxing authority. The Company’s practice is to recognize interest and penalties related to income tax matters in income tax expense.
Stock-Based Compensation
The Company applies the fair value method for determining the cost of stock-based compensation for employees, directors and consultants. Under this method, the total cost of a stock option grant is measured based on the estimated fair value of the stock option award at the date of the grant, using the Black-Scholes valuation model. The fair value of a restricted stock unit ("RSU") is based on the market value of the Company’s common stock on the date of grant. The fair value of a performance stock unit ("PSU") is based on the market price of the Company’s stock on the date of grant and assumes that the performance criteria will be met and the target payout level will be achieved. Compensation cost is adjusted for subsequent changes in the outcome of performance-related conditions until the award vests. The fair value of PSUs with a market condition is estimated on the date of
74
award, using a Monte Carlo simulation valuation model to estimate the total return ranking of the Company’s stock in relation to the target index of companies over each performance period. Compensation cost on PSUs with a market condition is not adjusted for subsequent changes regardless of the level of ultimate vesting. For service only awards, the total cost related to the portion of awards granted that is ultimately expected to vest is recognized as stock-based compensation expense on a straight-line basis over the requisite service period of the grant. For PSUs, the total cost related to the portion of the awards granted that is ultimately expected to vest is recognized as stock-based compensation expense on a graded basis over the requisite service period of the grant.
Estimated Fair Value of Share-Based Payments
For awards granted subsequent to January 1, 2016, the Company used the Black-Scholes valuation model. For awards granted prior to January 1, 2016, the Company used the binomial options pricing model, or binomial lattice valuation model. The fair value of the stock option awards calculated using Black-Scholes valuation model is consistent with the fair value of the stock option awards calculated using binomial lattice valuation model.
Black-Scholes valuation model requires the input of highly subjective assumptions, including the the expected term of the option, the expected volatility of the price of the Company's common stock, risk-free interest rates, and the expected dividend yield of the Company's common stock. The assumptions used in the Company valuation model represent management’s best estimates. These estimates involve inherent uncertainties and the application of management’s judgment. If factors change and different assumptions are used, our stock-based compensation expense could be materially different in the future.
Fair value of the stock options was estimated at the grant date, using the following weighted average assumptions:
Year ended December 31, | ||||||||
2016 | 2015 | 2014 | ||||||
Average assumptions: | ||||||||
Risk-free interest rate | 1.3 | % | 1.5 | % | 1.7 | % | ||
Expected dividend yield | — | % | — | % | — | % | ||
Expected volatility | 47 | % | 52 | % | 53 | % | ||
Expected term (years) | 5.6 years | 6.9 years | 7.6 years | |||||
The Company has assumed no dividend yield because dividends are not expected to be paid in the near future, which is consistent with the Company’s history of not paying dividends. The risk-free interest rate assumption is based upon observed interest rates for constant maturity U.S. Treasury securities appropriate for the term of the Company’s employee stock options. The expected term of an option represents the period that Company's stock-based awards are expected to be outstanding and is calculated using a combination of historical exercise experience adjusted to reflect the current vesting period of options being valued, and partial life cycles of outstanding options. Expected volatility is based on the historical volatility of the Company and comparable public companies.
The Company’s estimate of pre-vesting forfeitures, or forfeiture rate, is based on an analysis of historical behavior by option holders.
Net Income Per Common Share
Basic net income per common share is computed based on the weighted average number of outstanding shares of common stock. Diluted income per common share adjusts the basic weighted average common shares outstanding for the potential dilution that could occur if stock options, RSUs, PSUs and convertible securities were exercised or converted into common stock.
The following table presents a reconciliation of the numerator and denominator of the basic and diluted earnings per share computation. In the table below, net income represents the numerator and weighted average common shares outstanding represents the denominator:
75
Year Ended December 31, | |||||||||||
2016 | 2015 | 2014 | |||||||||
(in thousands, except per share data) | |||||||||||
Net income | $ | 816 | $ | 179 | $ | 296 | |||||
Weighted average basic common shares outstanding | 29,670 | 29,113 | 28,654 | ||||||||
Dilutive effect of stock-based awards | 976 | 705 | 711 | ||||||||
Dilutive effect of premium feature of the Notes | 252 | — | — | ||||||||
Weighted average diluted common shares outstanding | 30,898 | 29,818 | 29,365 | ||||||||
Earnings per share: | |||||||||||
Basic | $ | 0.03 | $ | 0.01 | $ | 0.01 | |||||
Diluted | $ | 0.03 | $ | 0.01 | $ | 0.01 | |||||
Due to the settlement features of the Notes, the Company only includes the impact of the premium feature in the diluted earnings per common share calculation when the average stock price exceeds the conversion price of the Notes. The average stock price did not exceed the conversion price for the 2022 Notes for the year ended December 31, 2015 or exceed the conversion price for the 2018 Notes for years ended December 31, 2016, 2015 or 2014.
The weighted average number of shares outstanding used in the computation of diluted income per share does not include the effect of stock-based awards convertible into 730,704, 1,203,399 and 1,369,462 shares for the years ended December 31, 2016, 2015 and 2014 respectively, as the effect would have been anti-dilutive because their exercise prices exceeded the average market price of the Company's common stock during these years.
Foreign Currency
The functional currency of operations located outside the United States is the respective local currency. The financial statements of each operation are translated into U.S. dollars using period-end exchange rates for assets and liabilities and average exchange rates during the period for revenue and expenses. Translation effects are included in accumulated other comprehensive income. The transfers from accumulated other comprehensive income into net income is immaterial.
Recent Accounting Pronouncements
In May 2014, the FASB issued Accounting Standards Update 2014-09, Revenue from Contracts with Customers: Topic 606 ("ASU 2014-09"), which supersedes nearly all existing revenue recognition guidance under U.S. GAAP. The core principle is to recognize revenue when promised goods or services are transferred to customers in an amount that reflects the consideration that is expected to be received for those goods or services. The standard defines a five step process to achieve this core principle and, in doing so, it is possible more judgment and estimates may be required within the revenue recognition process than are required under existing U.S. GAAP, including identifying performance obligations in the contract, estimating the amount of variable consideration to include in the transaction price and allocating the transaction price to each separate performance obligation. The standard allows entities to apply either of two methods: (a) retrospective application to each prior reporting period presented with the option to elect certain practical expedients as defined within ASU 2014-09 (''full retrospective method''); or (b) retrospective application with the cumulative effect of initially applying the standard recognized at the date of initial application and providing certain additional disclosures as defined per ASU 2014-09 (''modified retrospective method''). In August 2015, the FASB issued Accounting Standards Update 2015-14, Revenue from Contracts with Customers: Topic 606 ("ASU 2015-14"), which defers the effective date for ASU 2014-09 to annual reporting periods beginning after December 15, 2017, including interim reporting periods within that reporting period.
While we have not yet completed our final review of the impact of the new standard, we expect that the new standard will impact the timing of revenue recognition for certain software and software related contracts. Due to the complexity of our contracts, the actual timing of revenue recognition required under the new standard will be dependent on contract-specific terms. We are still in the process of evaluating the impact of the new standard related to costs incurred to fulfill a contract. We will adopt the new standard on January 1, 2018 using the modified retrospective method. We will continue to evaluate the standard as well as additional changes, modifications or interpretations that may impact our current conclusions.
In February 2016, the FASB issued Accounting Standards Update 2016-02, Leases: Topic 842 ("ASU 2016-02"), which provides updated guidance on lease accounting. ASU 2016-02 is effective for annual reporting periods beginning after
76
December 15, 2018, including interim periods within that annual period, with early adoption permitted. The Company is evaluating the impact of adopting this new standard on its financial statements.
In March 2016, the FASB issued Accounting Standards Update 2016-09, Compensation-Stock Compensation: Topic 718 ("ASU 2016-09"), which provides updated guidance on several aspects of the accounting for share-based payment transactions. ASU 2016-09 is effective for annual reporting periods beginning after December 15, 2016, including interim periods within those annual periods, with early adoption permitted. The Company will adopt this guidance on January 1, 2017. The Company is unable to estimate the impact of adoption as it is dependent upon future stock option exercises which can not be predicted.
In August 2016, the FASB issued Accounting Standards Update 2016-16, Income Taxes: Topic 740: Intra-Entity Transfers of Assets Other Than Inventory (“ASU 2016-16”) which requires the recognition of the income tax consequences of an intra-entity transfer of an asset other than inventory when the transfer occurs. The new standard is effective for annual reporting periods beginning after December 15, 2017, including interim reporting periods within those annual reporting periods, with early adoption permitted. The Company is evaluating the impact of adopting this new standard on its financial statements.
In January 2017, the FASB issued Accounting Standards Update 2017-01, Business Combinations: Topic 805: Clarifying the Definition of a Business (“ASU 2017-01”), which clarifies the definition of a business with the objective of adding guidance to assist entities with evaluating whether transactions should be accounted for as acquisitions (or disposals) of assets or businesses. The new standard is effective for annual periods beginning after December 15, 2017, including interim periods within those periods. The Company is evaluating the impact of adopting this new standard on its financial statements.
In January 2017, the FASB issued Accounting Standards Update 2017-04, Intangibles - Goodwill and Other: Topic 350: Simplifying the Test for Goodwill Impairment (“ASU 2017-04”), which modifies the concept of impairment from the condition that exists when the carrying amount of goodwill exceeds its implied fair value to the condition that exists when the carrying amount of a reporting unit exceeds its fair value. The new standard is effective for annual periods beginning after December 15, 2019, including interim periods within those periods. While the Company continues to assess the potential impact of this standard, the adoption of this standard is not expected to have a material impact on its financial statements.
3. Acquisitions
VoIP Logic LLC
On October 28, 2016, the Company completed its acquisition of all of the outstanding units of VoIP Logic LLC ("VoIP Logic"), a wholesale provider of BroadWorks-based cloud communications services to service providers who want greater control of their platform and to maintain their own administrative systems. This cloud offering was added to the Company's BroadCloud portfolio. The total consideration paid for VoIP Logic was $13.4 million, which was funded with cash on hand. The Company incurred $0.5 million of transaction costs for financial advisory and legal services related to the acquisition, which are included in general and administrative expenses, in the Company’s consolidated statements of operations.
The consolidated financial statements include the results of VoIP Logic from the date of acquisition. The purchase price has been allocated to the assets acquired and liabilities assumed based on fair values as of the acquisition date.
The following table summarizes the fair value of the assets acquired and liabilities assumed at the acquisition date of October 28, 2016 (in thousands):
Cash and cash equivalents | $ | 69 | |
Accounts receivable | 388 | ||
Prepaid and other assets | 21 | ||
Property and equipment | 182 | ||
Trade name | 100 | ||
Customer relationships | 7,900 | ||
Goodwill | 5,065 | ||
Accounts payable and accrued expenses | (375 | ) | |
Total consideration | $ | 13,350 | |
Customer relationships represent the fair value of the underlying relationships and agreements with VoIP customers. The trade name and customer relationships are being amortized on a straight-line basis over a period of three and eight years respectively, which in general reflects the estimated cash flows to be generated from such assets.
77
The excess of purchase consideration over the fair value of the net tangible and identifiable intangible assets acquired of $5.1 million was recorded as goodwill. The goodwill balance is attributable to the assembled workforce and the synergies expected as a result of the acquisition. In accordance with U.S. GAAP, goodwill associated with this acquisition will not be amortized but will be tested for impairment on an annual basis. Goodwill associated with this acquisition is deductible for tax purposes over 15 years.
Transera Communications, Inc.
On February 4, 2016, the Company completed its acquisition of all the stock of Transera Communications, Inc. ("Transera"), which was subsequently renamed BroadSoft Contact Center, Inc. Transera provides cloud-based contact center software and the acquisition enables the Company to offer its customers a comprehensive cloud contact center solution that is complementary to, and integrates with, its BroadWorks and SaaS platform. The total consideration paid for Transera was $19.8 million, which was funded with cash on hand. The Company incurred $0.5 million of transaction costs for financial advisory and legal services related to the acquisition, which are included in general and administrative expenses, in the Company’s consolidated statements of operations.
The consolidated financial statements include the results of Transera from the date of acquisition. The purchase price has been allocated to the assets acquired and liabilities assumed based on fair values as of the acquisition date. The following table summarizes the fair value of the assets acquired and liabilities assumed at the acquisition date of February 4, 2016 (in thousands):
Cash and cash equivalents | $ | 365 | |
Accounts receivable | 1,623 | ||
Prepaid and other assets | 285 | ||
Property and equipment | 155 | ||
Deferred tax assets | 3,496 | ||
Trade name | 160 | ||
Customer relationships | 4,100 | ||
Developed technology | 3,050 | ||
Goodwill | 7,825 | ||
Deferred revenue | (111 | ) | |
Accounts payable and accrued expenses | (1,148 | ) | |
Total consideration | $ | 19,800 | |
The trade name represents the fair value of the Transera trade name that the Company intends to use for a fixed period of time. Customer relationships represent the fair value of the underlying relationships and agreements with Transera customers. Developed technology represents the fair value of Transera's intellectual property. The trade name, customer relationships and developed technology are being amortized on a straight-line basis over a period of three years, seven years and five years, respectively, which in general reflects the estimated cash flows to be generated from such assets. The weighted-average amortization period for depreciable intangible assets acquired is approximately six years.
The excess of purchase consideration over the fair value of the net tangible and identifiable intangible assets acquired of $7.8 million was recorded as goodwill. The goodwill balance is attributable to the assembled workforce and the synergies expected as a result of the acquisition. In accordance with U.S. GAAP, goodwill associated with this acquisition will not be amortized but will be tested for impairment on an annual basis. Goodwill associated with this acquisition is not deductible for tax purposes.
mPortal Inc.
On June 3, 2015, the Company completed its acquisition of all of the stock of mPortal Inc. ("mPortal"), a professional services company, which was subsequently within the Company renamed BroadSoft Design, Inc. The acquisition enabled the Company to offer its customers the ability to deliver customizable UC experiences to a wide range of business end users. The total consideration paid for mPortal was $14.8 million. The Company funded the acquisition with $14.3 million of cash on hand and $0.5 million of restricted stock units. The Company incurred $0.7 million of transaction costs for financial advisory and legal services related to the acquisition that are included in general and administrative expenses as incurred, in the Company’s consolidated statements of operations for the year ended December 31, 2015.
78
The consolidated financial statements include the results of mPortal from the date of acquisition. The purchase price has been allocated to the assets acquired and liabilities assumed based on fair values as of the acquisition date.
The following table summarizes the fair value of the assets acquired and liabilities assumed at the acquisition date of June 3, 2015 (in thousands):
Cash and cash equivalents | $ | 2,748 | |
Accounts receivable | 1,920 | ||
Prepaid and other assets | 293 | ||
Deferred tax assets | 2,404 | ||
Property and equipment | 15 | ||
Customer relationships | 5,600 | ||
Goodwill | 2,497 | ||
Accounts payable and accrued expenses | (677 | ) | |
Total consideration | $ | 14,800 | |
Customer relationships represent the fair value of the underlying relationships and agreements with mPortal customers. The customer relationships intangible asset is being amortized on a straight-line basis over a period of eight years, which in general reflects the cash flows generated.
The excess of purchase consideration over the fair value of the net tangible and identifiable intangible assets acquired of $2.5 million was recorded as goodwill. The goodwill balance is attributable to the assembled workforce and the synergies expected as a result of the acquisition. In accordance with U.S. GAAP, goodwill associated with this acquisition will not be amortized but will be tested for impairment on an annual basis. Goodwill associated with this acquisition is not deductible for tax purposes.
Pro Forma Financial Information for Acquisitions of mPortal, Transera Communications, Inc. and VoIP Logic (unaudited)
The businesses acquired in 2016 contributed aggregate revenue of $8.8 million and net losses of $5.0 million for the period from the relevant acquisition date to December 31, 2016. The businesses acquired in 2015 contributed aggregate revenue of $7.6 million and net losses of $0.8 million for the period from the acquisition date to December 31, 2015. The acquisitions the Company completed in 2014 were not considered to be material, individually or in the aggregate.
The unaudited pro forma statements of operations data below gives effect to the acquisitions as if they had occurred as of the beginning of the year prior to the acquisition. The following data includes adjustments for amortization of intangibles and acquisition costs. The pro forma information as presented below is for informational purposes only and is not necessarily indicative of the results of operations that would have been achieved if the acquisitions had been in effect for the periods presented.
Year Ended December 31, | |||||||||||
2016 | 2015 | 2014 | |||||||||
(In thousands except per share data) | |||||||||||
Revenue | $ | 346,844 | $ | 298,974 | $ | 233,576 | |||||
Net (loss) income | 1,103 | (1,785 | ) | (1,311 | ) | ||||||
Net (loss) income per common share, basic | $ | 0.04 | $ | (0.06 | ) | $ | (0.05 | ) | |||
Net (loss) income per common share, diluted | $ | 0.04 | $ | (0.06 | ) | $ | (0.05 | ) | |||
4. Goodwill and Intangibles
The Company has concluded it has a single reporting unit. Accordingly, on an annual basis management performs the impairment assessment required under FASB guidelines at the consolidated enterprise level. The Company performed an impairment test of the Company’s goodwill and determined that no impairment of goodwill existed at December 31, 2016 or 2015.
The following table provides a summary of the changes in the carrying amounts of goodwill (in thousands):
79
Balance, December 31, 2014 | $ | 65,303 | |
Increase in goodwill related to acquisitions | 9,123 | ||
Other | (2,151 | ) | |
Balance, December 31, 2015 | 72,275 | ||
Increase in goodwill related to acquisitions | 13,638 | ||
Other | (3,155 | ) | |
Balance, December 31, 2016 | $ | 82,758 | |
For the year ended December 31, 2016, the increase in ''goodwill related to acquisitions'' consists of $5.1 million of goodwill related to the acquisition of VoIP Logic in October 2016, $7.8 million of goodwill related to the acquisition of Transera in February 2016, $0.9 million of goodwill related to the acquisition of an enterprise messaging-based team communication and collaboration software application company in May 2016 and a $(0.2) million measurement period adjustment related to a cloud-based communications provider located in Japan acquired in November 2015.
For the year ended December 31, 2015, the increase in "goodwill related to acquisitions" consists of $3.3 million of goodwill related to the immaterial acquisition of a hosted voice over IP (VoIP) OSS provider in January 2015, $2.5 million of goodwill related to the acquisition of mPortal in June 2015 and $3.3 million of goodwill related to the immaterial acquisition of a cloud-based communications provider located in Japan in November 2015.
Any change in the goodwill amounts resulting from foreign currency translations are presented as “Other” in the above table.
The Company’s acquired intangible assets are subject to amortization. The following is a summary of intangible assets (in thousands):
December 31, 2016 | December 31, 2015 | ||||||||||||||||||||||
Gross Carrying Amount | Accumulated Amortization | Net Amount | Gross Carrying Amount | Accumulated Amortization | Net Amount | ||||||||||||||||||
Customer relationships | $ | 28,252 | $ | 6,259 | $ | 21,993 | $ | 17,571 | $ | 3,721 | $ | 13,850 | |||||||||||
Developed technology | 12,952 | 7,446 | 5,506 | 13,277 | 8,489 | 4,788 | |||||||||||||||||
Trade name | 550 | 210 | 340 | 298 | 101 | 197 | |||||||||||||||||
Total | $ | 41,754 | $ | 13,915 | $ | 27,839 | $ | 31,146 | $ | 12,311 | $ | 18,835 | |||||||||||
Amortization expense on intangible assets was $6.6 million, $5.8 million and $5.4 million in 2016, 2015 and 2014, respectively. In addition, in 2016, 2015 and 2014, the Company retired $4.5 million, $5.9 million and $1.3 million of fully amortized intangible assets, respectively, impacting both the gross carrying amount and accumulated amortization by this amount. As of December 31, 2016, future amortization expense on intangible assets is expected to be as follows (in thousands):
2017 | $ | 6,429 | |
2018 | 5,105 | ||
2019 | 4,729 | ||
2020 | 4,140 | ||
2021 | 2,883 | ||
2022 and thereafter | 4,553 | ||
Total amortization expense | $ | 27,839 | |
80
5. Property and Equipment
Property and equipment consists of the following (in thousands):
December 31, | |||||||
2016 | 2015 | ||||||
Equipment | $ | 31,999 | $ | 26,767 | |||
Software | 16,887 | 11,460 | |||||
Furniture and fixtures | 2,133 | 1,645 | |||||
Leasehold improvements | 6,580 | 5,605 | |||||
57,599 | 45,477 | ||||||
Less accumulated depreciation and amortization | (34,973 | ) | (25,996 | ) | |||
Property and equipment, net | $ | 22,626 | $ | 19,481 | |||
Depreciation and amortization expense related to property and equipment for the years ended December 31, 2016, 2015 and 2014 was $11.4 million, $9.8 million and $7.0 million, respectively.
6. Accounts Payable and Other Current Liabilities
Accounts payable and other current liabilities consist of the following (in thousands):
December 31, | |||||||
2016 | 2015 | ||||||
Accounts payable and accrued expenses | $ | 14,676 | $ | 12,102 | |||
Accrued compensation | 15,021 | 11,670 | |||||
Other | 4,157 | 4,895 | |||||
$ | 33,854 | $ | 28,667 | ||||
7. Software Licenses
The Company has entered into an agreement with a third-party that provides the Company the right to distribute its software on an unlimited basis through December 2020.
For the period from June 2012 to May 2016, the Company had a fixed cost associated with these distribution rights of $10.2 million, which was amortized to cost of revenue over the four-year period beginning June 2012, based on the straight line method.
For the period from June 2016 to December 2020, the Company has a fixed cost associated with these distribution rights of $17.3 million, and if annual billed license software revenue over the extended term exceeds $850 million, the Company will be required to pay additional fees. The $17.3 million is being amortized to cost of revenue over the extended term beginning in June 2016, based on the straight line method.
Amortization expense related to these agreements was $3.3 million, $2.6 million and $2.6 million for each of the years ended December 31, 2016, 2015 and 2014, respectively.
81
8. Income Taxes
The following table presents the components of the income before income taxes and the provision for (benefit from) income taxes (in thousands):
Year ended December 31, | |||||||||||
2016 | 2015 | 2014 | |||||||||
Income (loss) before income taxes: | |||||||||||
United States | $ | 4,260 | $ | (1,488 | ) | $ | (4,769 | ) | |||
Foreign | (1,984 | ) | 1,631 | 2,866 | |||||||
Income (loss) before income taxes | $ | 2,276 | $ | 143 | $ | (1,903 | ) | ||||
Provision for (benefit from) income taxes: | |||||||||||
Current: | |||||||||||
Federal and state | $ | 848 | $ | 965 | $ | 4,718 | |||||
Foreign | 2,571 | 3,244 | 1,726 | ||||||||
Total current | $ | 3,419 | $ | 4,209 | $ | 6,444 | |||||
Deferred: | |||||||||||
Federal and state | $ | (2,354 | ) | $ | (4,018 | ) | $ | (5,360 | ) | ||
Foreign | 395 | (227 | ) | (3,283 | ) | ||||||
Total deferred | $ | (1,959 | ) | $ | (4,245 | ) | $ | (8,643 | ) | ||
Provision for (benefit from) income taxes | $ | 1,460 | $ | (36 | ) | $ | (2,199 | ) | |||
The following table presents the components of net deferred tax assets (liabilities) and the related valuation allowance (in thousands):
December 31, | |||||||
2016 | 2015 | ||||||
Deferred tax assets: | |||||||
Net operating loss carry-forward | $ | 2,795 | $ | 2,509 | |||
Deferred revenue | 8,718 | 8,296 | |||||
Depreciation and amortization | 1,581 | 1,428 | |||||
Research tax credit carry-forward | 4,961 | 2,869 | |||||
Accrued expenses | 1,565 | 2,927 | |||||
Stock-based compensation | 10,094 | 8,181 | |||||
Other | 10,136 | 7,726 | |||||
Total deferred tax assets | $ | 39,850 | $ | 33,936 | |||
Valuation allowance | (1,813 | ) | (312 | ) | |||
Net deferred tax assets | $ | 38,037 | $ | 33,624 | |||
Deferred tax liabilities: | |||||||
Acquired intangibles | $ | (7,734 | ) | $ | (6,181 | ) | |
Convertible debt discount | (23,978 | ) | (28,213 | ) | |||
Other | (177 | ) | (537 | ) | |||
Total deferred tax liabilities | $ | (31,889 | ) | $ | (34,931 | ) | |
Net deferred tax assets | $ | 6,148 | $ | (1,307 | ) | ||
82
The Company has $34.4 million and $35.9 million of U.S. net operating loss carryforwards as of December 31, 2016 and 2015, respectively. Additionally, the Company has $16.5 million and $11.1 million of tax credit carryforwards for tax return purposes as of December 31, 2016 and 2015, respectively. The U.S. net operating loss and tax credit carryforwards are scheduled to begin to expire in 2019 and 2020, respectively.
The Company has excluded certain U.S. net operating loss carryforwards from the calculation of deferred tax assets presented above, as they represent excess stock option deductions that do not reduce the Company’s income taxes payable. The excess tax benefits associated with stock option exercises and restricted stock vesting are recorded directly to stockholders' equity when realized. The Company uses a “with-and-without” method to determine the tax benefit realized from excess stock option deductions under the FASB's updated authoritative guidance on share-based payments. Accordingly, the Company recognizes the benefits of carryforwards in the following order: (a) net operating losses from items other than excess stock option deductions; (b) other tax credit carryforwards from items other than excess stock option deductions; and (c) net operating losses from excess stock option deductions. The amount of excess tax benefits not included in the deferred tax assets were $19.6 million and $17.9 million as of December 31, 2016 and 2015, respectively. As of December 31, 2016, the excess tax benefits not recognized are related to net operating losses of $34.4 million (tax effect of $12.8 million) and foreign tax credits of $4.2 million.
The Company has not recorded a deferred tax liability for undistributed earnings of $10.2 million of certain foreign subsidiaries, since such earnings are considered to be reinvested indefinitely. If the earnings were distributed, the Company would be subject to federal income and foreign withholding taxes. Determination of an unrecognized deferred income tax liability with respect to such earnings is not practicable.
Under the provisions of Internal Revenue Code Section 382, certain substantial changes in the Company’s ownership may result in a limitation on the amount of U.S. net operating loss carryforwards that could be utilized annually to offset future taxable income and taxes payable. A portion of the Company’s net operating loss carryforwards are subject to an annual limitation under Section 382 of the Internal Revenue Code. The Company does not expect that this limitation will impact its ability to utilize all of our net operating losses prior to their expiration.
A deferred tax asset should be reduced by a valuation allowance if, based on the weight of all available evidence, it is more likely than not (a likelihood of more than 50%) that some portion or the entire deferred tax asset will not be realized. The valuation allowance should be sufficient to reduce the deferred tax asset to the amount that is more likely than not to be realized. The determination of whether a deferred tax asset is realizable is based on weighting all available evidence, including both positive and negative evidence. The realization of deferred tax assets, including carryforwards and deductible temporary differences, depends upon the existence of sufficient taxable income of the same character during the carryback or carryforward period. The accounting guidance requires the consideration of all sources of taxable income available to realize the deferred tax asset, including the future reversal of existing temporary differences, future taxable income exclusive of reversing temporary differences and carryforwards, taxable income in carryback years and tax-planning strategies.
As of December 31, 2016, the Company has a remaining valuation allowance of $1.8 million, which relates to certain foreign NOLs that are not more likely than not to be realized. The Company will continue to evaluate the need for a valuation allowance in foreign jurisdictions and may remove the valuation allowance in subsequent periods, which may have an impact on the results of operations.
The following table presents the provisions for income taxes compared with income taxes based on the federal statutory tax rate of 35% (in thousands):
83
Year ended December 31, | |||||||||||
2016 | 2015 | 2014 | |||||||||
Tax provision (benefit) based on federal statutory rate | $ | 800 | $ | 50 | $ | (666 | ) | ||||
State taxes | 411 | 490 | 430 | ||||||||
Impact of foreign operations | 180 | 201 | (508 | ) | |||||||
Other permanent items | 414 | 144 | 193 | ||||||||
IRC 162(m) add back | 699 | 222 | 456 | ||||||||
Stock-based compensation | 1,202 | 1,096 | 1,002 | ||||||||
Change in income tax valuation allowance | 1,506 | 16 | (2,804 | ) | |||||||
Business tax credits | (4,357 | ) | (2,302 | ) | (2,314 | ) | |||||
Finland intellectual property transfer | (387 | ) | (324 | ) | (81 | ) | |||||
Meals and entertainment | 464 | 432 | 198 | ||||||||
Acquisition costs | 163 | 248 | 128 | ||||||||
Change in tax rates | 365 | (309 | ) | 1,767 | |||||||
Provision for (benefit from) income taxes | $ | 1,460 | $ | (36 | ) | $ | (2,199 | ) | |||
The Company has separately disclosed the tax effect of items in excess of $0.3 million.
Accounting for Uncertainty in Income Taxes
The Company applies guidance for uncertainty in income taxes that requires the application of a more likely than not threshold to the recognition and de-recognition of uncertain tax positions. If the recognition threshold is met, this guidance permits the Company to recognize a tax benefit measured at the largest amount of the tax benefit that, in the Company’s judgment, is more likely than not to be realized upon settlement.
During the year ended December 31, 2016, the Company's unrecognized income tax benefits increased primarily due to an increase in our research and development tax credit study for 2016 and prior years, permanent establishment exposure for a few of our branches, as well as an anticipated accounting method change for our US jurisdictions. During the years ended December 31, 2015 and 2014, there was no material adjustment in the liability for unrecognized income tax benefits.
A reconciliation of the beginning and ending amount of unrecognized tax benefits is as follows (in thousands):
Year ended December 31, | |||||||||||
2016 | 2015 | 2014 | |||||||||
Unrecognized tax benefits balance at January 1, | $ | 4,927 | $ | 4,619 | $ | 4,875 | |||||
Additions for tax positions of prior years | 1,395 | 413 | 243 | ||||||||
Additions for tax provisions of current year | 2,449 | 453 | — | ||||||||
Settlements of tax positions of prior years | (146 | ) | (558 | ) | (499 | ) | |||||
Unrecognized tax benefits balance at December 31, | $ | 8,625 | $ | 4,927 | $ | 4,619 | |||||
The amount of the unrecognized tax benefit if realized that would impact the rate is $6.8 million, $4.9 million and $4.6 million for years ended December 31, 2016, 2015 and 2014 respectively.
The Company records interest and penalties as a component of its income tax provision. The Company recorded interest and penalties of $0.4 million and $0.1 million for the years ended December 31, 2016 and 2015. The Company had not accrued interest with respect to uncertain tax positions in the prior years because unfavorable resolution of those positions would not result in cash tax due for those prior years.
The Company files income tax returns in the United States and in various foreign jurisdictions. The Company is no longer subject to U.S. Federal income tax examinations for years prior to 2013, with the exception that operating loss or tax credit carryforwards generated prior to 2013 may be subject to tax audit adjustment. The Company is no longer subject to state and local or foreign income tax examinations by tax authorities for years prior to 2009.
84
9. Borrowings
2022 Convertible Senior Notes
In September 2015, the Company issued $201.3 million aggregate principal amount of 1.00% convertible senior notes due in 2022 (the “2022 Notes”). The 2022 Notes are general unsecured obligations of the Company, with interest payable semi-annually in cash at a rate of 1.00% per annum, and will mature on September 1, 2022, unless earlier converted, redeemed or repurchased.
The 2022 Notes may be converted by the holders at their option on any day prior to the close of business on the business day immediately preceding June 1, 2022 only under the following circumstances: (a) during any calendar quarter commencing after the calendar quarter ended on December 31, 2015 (and only during such calendar quarter), if the last reported sale price of the common stock for at least 20 trading days (whether or not consecutive) during the period of 30 consecutive trading days ending on the last trading day of the immediately preceding calendar quarter is greater than or equal to 130% of the conversion price on each applicable trading day; (b) during the five business day period after any ten consecutive trading day period (the “measurement period”) in which the trading price, as defined in the indenture governing the 2022 Notes (the "2022 Indenture"), per $1,000 principal amount of 2022 Notes for each trading day of the measurement period was less than 98% of the product of the last reported sale price of the Company's common stock and the conversion rate on each such trading day; (c) if the Company calls any or all of the 2022 Notes for redemption, at any time prior to the close of business on the second scheduled trading day immediately preceding the relevant redemption date; or (d) upon the occurrence of specified corporate events. The 2022 Notes will be convertible, regardless of the foregoing circumstances, at any time from, and including, June 1, 2022 through the second scheduled trading day immediately preceding the maturity date.
The initial conversion rate for the 2022 Notes is 25.8249 shares of the Company’s common stock per $1,000 principal amount of 2022 Notes, equivalent to a conversion price of $38.72 per share of common stock. The conversion rate will be subject to adjustment in some events, but will not be adjusted for any accrued and unpaid interest. In addition, following certain corporate events that occur prior to the maturity date or if the Company issues a notice of redemption on or after September 1, 2019 as described below, the Company will increase the conversion rate for a holder who elects to convert its 2022 Notes in connection with such a corporate event or during the related redemption period in certain circumstances. Upon conversion, the Company will pay or deliver, as the case may be, cash, shares of the Company's common stock or a combination of cash and shares of the Company's common stock, at the Company's election. It is the Company's current intent to settle conversions through combination settlement with a specified dollar amount per $1,000 principal amount of 2022 Notes of $1,000. While the 2022 Notes were not convertible as of December 31, 2016, if the 2022 Notes were convertible, shares would have been distributed upon conversion because the conversion price was below the stock price as of such date.
Holders of the 2022 Notes may require the Company to repurchase some or all of the 2022 Notes for cash upon a fundamental change, as defined in the 2022 Indenture, at a repurchase price equal to 100% of the principal amount of the 2022 Notes being repurchased, plus any accrued and unpaid interest up to, but excluding, the relevant repurchase date.
The Company may not redeem the 2022 Notes prior to September 1, 2019. Beginning September 1, 2019, the Company may redeem for cash all or a portion of the 2022 Notes, at the Company's option, if the last reported sale price of the common stock is equal to or greater than 140% of the conversion price then in effect for at least 20 trading days (whether or not consecutive) during any 30 consecutive trading day period (including the last trading day of such period) ending within the five trading days immediately preceding the date on which the Company provides notice of redemption, at a redemption price equal to 100% of the principal amount of the 2022 Notes to be redeemed, plus accrued and unpaid interest to, but excluding, the redemption date. No sinking fund is provided for the 2022 Notes.
The Company has separately accounted for the liability and equity components of the convertible debt instrument by allocating the gross proceeds from the issuance of the 2022 Notes between the liability component and the embedded conversion option, or equity component. This allocation was done by first estimating an interest rate at the time of issuance for similar notes that do not include the embedded conversion option. This interest rate, estimated at 7.4%, was used to compute the initial fair value of the liability component of $131.3 million. The excess of the gross proceeds received from the issuance of the 2022 Notes over the initial amount allocated to the liability component of $70.0 million was allocated to the embedded conversion option, or equity component. This excess is reported as a debt discount and will be subsequently amortized as interest expense, using the effective interest method, through September 2022, the maturity date of the 2022 Notes. Offering costs, consisting of the initial purchasers’ discount and offering expenses payable by the Company, were $6.4 million. These offering costs were allocated to the liability component and the equity component based on the relative valuations of such components. As a result, $4.2 million of the offering costs were classified as debt issuance costs and recorded on the balance sheet as a deduction from
85
the carrying amount of the 2022 Notes liability. The remaining $2.2 million of offering costs were allocated to the equity component.
The fair value of the 2022 Notes as of December 31, 2016 and 2015 was $241.5 million and $221.1 million, respectively. The carrying amount of the equity component of the 2022 Notes was $59.5 million at December 31, 2016. The unamortized offering costs classified as debt issuance costs and recorded as a direct deduction to the carrying amount of the debt liability at December 31, 2016 were $3.4 million, which are being amortized as interest expense through the September 2022 maturity date of the 2022 Notes.
2018 Convertible Senior Notes
In June 2011, the Company issued $120.0 million aggregate principal amount of 1.50% convertible senior notes due in 2018 (the “2018 Notes”). The 2018 Notes are senior unsecured obligations of the Company, with interest payable semi-annually in cash at a rate of 1.50% per annum, and will mature on July 1, 2018, unless earlier repurchased, redeemed or converted.
Concurrently with the closing of the 2022 Notes offering, the Company repurchased $50.9 million principal amount of the 2018 Notes in privately negotiated transactions for an aggregate purchase price of $53.4 million. The Company recorded an extinguishment loss of $4.2 million on the repurchase, including $0.5 million associated with unamortized issuance costs. This loss was recorded in other expense within the consolidated statement of operations. The remaining purchase price was allocated between the liability component and the equity component based upon the fair value of the debt immediately prior to the repurchase at $42.4 million and $6.8 million, respectively.
The 2018 Notes may be converted by the holders at their option on any day prior to the close of business on the scheduled trading day immediately preceding April 1, 2018 only under the following circumstances: (a) during the five business-day period after any ten consecutive trading-day period (the “measurement period”) in which the trading price per Note for each day of that measurement period was less than 98% of the product of the last reported sale price of the common stock and the applicable conversion rate on each such day; (b) during any calendar quarter (and only during such quarter) after the calendar quarter ended September 30, 2011, if the last reported sale price of the common stock for 20 or more trading days in a period of 30 consecutive trading days ending on the last trading day of the immediately preceding calendar quarter exceeds 130% of the applicable conversion price in effect on the last trading day of the immediately preceding calendar quarter; (c) upon the occurrence of specified corporate events; or (d) if the Company calls the 2018 Notes for redemption. The 2018 Notes will be convertible, regardless of the foregoing circumstances, at any time from, and including, April 1, 2018 through the second scheduled trading day immediately preceding the maturity date.
The initial conversion rate for the 2018 Notes is 23.8126 shares of the Company’s common stock per $1,000 principal amount of 2018 Notes, equivalent to a conversion price of $41.99 per share of the common stock. The conversion price will be subject to adjustment in some events, but will not be adjusted for accrued interest. In addition, if a make-whole fundamental change, as defined in the indenture governing the 2018 Notes (the “2018 Indenture”), occurs prior to the maturity date, the Company will in some cases increase the conversion rate for a holder that elects to convert its 2018 Notes in connection with such make-whole fundamental change. Upon conversion, the Company will pay cash up to the aggregate principal amount of the 2018 Notes to be converted and deliver shares of the common stock in respect of the remainder, if any, of the conversion obligation in excess of the aggregate principal amount of the 2018 Notes being converted. While the 2018 Notes were not convertible as of December 31, 2016, if the 2018 Notes were convertible, shares would have been distributed upon conversion because the conversion price was below the stock price as of such date.
Holders of the 2018 Notes may require the Company to repurchase some or all of the 2018 Notes for cash, subject to certain exceptions, upon a fundamental change, as defined in the 2018 Indenture, at a repurchase price equal to 100% of the principal amount of the 2018 Notes being repurchased, plus any accrued and unpaid interest up to but excluding the relevant repurchase date.
The Company may not redeem the 2018 Notes prior to July 1, 2015. Beginning July 1, 2015, the Company may redeem for cash all or part of the 2018 Notes (except for the 2018 Notes that the Company is required to repurchase as described above) if the last reported sale price of the common stock exceeds 140% of the applicable conversion price for 20 or more trading days in a period of 30 consecutive trading days ending on the trading day immediately prior to the date of the redemption notice. The redemption price will equal the sum of 100% of the principal amount of the 2018 Notes to be redeemed, plus accrued and unpaid interest, plus a “make-whole premium” payment. The Company must make the make-whole premium payments on all 2018 Notes called for redemption prior to the maturity date, including 2018 Notes converted after the date the Company delivered the notice of redemption.
The Company has separately accounted for the liability and equity components of the convertible debt instrument by allocating the gross proceeds from the issuance of the 2018 Notes between the liability component and the embedded conversion option,
86
or equity component. This allocation was done by first estimating an interest rate at the time of issuance for similar notes that do not include the embedded conversion option. This interest rate, estimated at 8%, was used to compute the initial fair value of the liability component of $79.4 million. The excess of the gross proceeds received from the issuance of the 2018 Notes over the initial amount allocated to the liability component of $40.6 million, was allocated to the embedded conversion option, or equity component. This excess is reported as a debt discount and subsequently amortized as interest expense, using the effective interest method, through July 2018, the maturity date of the 2018 Notes. Offering costs, consisting of the initial purchasers’ discount and offering expenses payable by the Company, were $4.3 million. These offering costs were allocated to the liability component and the equity component based on the relative valuations of such components. As a result, $2.9 million of the offering costs were classified as debt issuance costs and recorded on the balance sheet as a deduction from the carrying amount of the 2018 Notes liability. The remaining $1.4 million of offering costs were allocated to the equity component.
Concurrently with the closing of the 2022 Notes offering, the Company repurchased $50.9 million principal amount of the 2018 Notes in privately negotiated transactions for an aggregate purchase price of $53.4 million. The Company recorded an extinguishment loss of $4.2 million on the repurchase, including $0.5 million associated with unamortized issuance costs. This loss was recorded in other expense within the consolidated statement of operations. The remaining purchase price was allocated between the liability component and the equity component based upon the fair value of the debt immediately prior to the repurchase at $42.4 million and $6.8 million, respectively.
The fair value of the 2018 Notes as of December 31, 2016 and 2015 was $80.2 million and $75.3 million, respectively. The carrying amount of the equity component of the Notes was $6.1 million at December 31, 2016. The unamortized offering costs at December 31, 2016 were $0.4 million which are being amortized as interest expense through the July 2018 maturity date of the Notes.
The following table shows the amounts recorded within the Company’s financial statements with respect to the combined 2022 Notes and 2018 Notes (collectively, the "Notes") (in thousands):
December 31, 2016 | December 31, 2015 | ||||||
Convertible debt principal | $ | 270,355 | $ | 270,355 | |||
Unamortized debt discount | (65,590 | ) | (77,440 | ) | |||
Unamortized debt issuance costs | (3,750 | ) | (4,584 | ) | |||
Net carrying amount of convertible debt | $ | 201,015 | $ | 188,331 | |||
The following table presents the interest expense recognized related to the Notes (in thousands):
Year ended December 31, | |||||||||||
2016 | 2015 | 2014 | |||||||||
Contractual interest expense | $ | 3,049 | $ | 2,039 | $ | 1,800 | |||||
Amortization of debt issuance costs | 834 | 1,022 | 406 | ||||||||
Accretion of debt discount | 11,847 | 7,595 | 5,500 | ||||||||
Interest expense | $ | 15,730 | $ | 10,656 | $ | 7,706 | |||||
The net proceeds from the 2018 Note and 2022 Note offerings were $115.7 million and $194.8 million, respectively, after deducting discounts to the initial purchasers and offering expenses payable by the Company.
Fair Value of Borrowings
Fair value for the Company’s borrowings is estimated using quoted market price of the Notes at December 31, 2016 and 2015, quoted market prices for similar instruments and by observable market data. The Company believes its creditworthiness and the financial market in which it operates has not materially changed since entering into the arrangements. If measured at fair value in the financial statements, long-term debt (including the current portion) would be classified as Level 2 in the fair value hierarchy.
The aggregate maturities of borrowings as of December 31, 2016 were as follows (in thousands):
87
2017 | $ | — | |
2018 | 69,105 | ||
2019-2020 | — | ||
2021 and thereafter | 201,250 | ||
$ | 270,355 | ||
10. Stockholders’ Equity
Preferred Stock
Pursuant to the Company’s amended and restated certificate of incorporation filed on June 21, 2010, the Company is authorized to issue 5,000,000 shares of preferred stock. The board of directors has the authority, without action by its stockholders, to designate and issue shares of preferred stock in one or more series and to fix the rights, preferences, privileges and restrictions thereof. These rights, preferences and privileges could include dividend rights, conversion rights, voting rights, terms of redemption, liquidation preferences, sinking fund terms and the number of shares constituting any series or the designation of such series, any or all of which may be greater than the rights of common stock. The issuance of the Company’s preferred stock could adversely affect the voting power of holders of common stock and the likelihood that such holders will receive dividend payments and payments upon liquidation and could have the effect of delaying, preventing or deterring a change in control. To date, the board of directors has not designated any rights, preference or powers of any preferred stock and no shares of preferred stock have been issued.
88
11. Stock-based Compensation
Equity Incentive Plans
In 1999, the Company adopted the 1999 Stock Incentive Plan (the “1999 Plan”). The 1999 Plan provided for the grant of incentive stock options, nonqualified stock options, restricted stock awards and stock appreciation rights. The 1999 Plan terminated in June 2009 whereby no new options or awards are permitted to be granted. In April 2009, the Company adopted the 2009 Equity Incentive Plan. This plan provides for the grant of incentive stock options, nonqualified stock options, restricted stock awards, RSUs and stock appreciation rights. In June 2010, the 2009 Equity Incentive Plan was amended and restated to provide for, among other things, annual increases in the share reserve (as amended and restated, the “2009 Plan”).
The term of stock-based grants is up to ten years, except that certain stock-based grants made after 2005 have a term of five years. For grants made under the 2009 Plan prior to January 1, 2015, the requisite vesting period is typically four years and for grants made subsequent to January 1, 2015, the requisite vesting period is typically three years. On each of January 1, 2015 and 2016, 1,250,000 shares were added to the 2009 Plan. At December 31, 2016, the Company had 708,642 shares of common stock available for issuance under the 2009 Plan.
Stock-based compensation expense recognized by the Company is as follows (in thousands):
Year ended December 31, | |||||||||||
2016 | 2015 | 2014 | |||||||||
Stock options | $ | 8,156 | $ | 7,572 | $ | 6,814 | |||||
Restricted stock units | 41,727 | 31,719 | 19,585 | ||||||||
Performance stock units | 1,624 | 1,153 | 3,874 | ||||||||
Total recognized stock-based compensation expense | $ | 51,507 | $ | 40,444 | $ | 30,273 | |||||
Stock Options
The following table presents a summary related to stock options for the year ended December 31, 2016:
Number of Options Outstanding | Weighted Average Exercise Price | Weighted Average Remaining Contractual Term (years) | Aggregate Intrinsic Value | |||||||||
(in thousands) | ||||||||||||
Balance, December 31, 2015 | 1,999,875 | $ | 29.48 | |||||||||
Granted | 617,950 | 37.62 | ||||||||||
Exercised | (474,409 | ) | 32.00 | |||||||||
Forfeited | (148,697 | ) | 32.65 | |||||||||
Expired | (10,436 | ) | 32.79 | |||||||||
Balance, December 31, 2016 | 1,984,283 | $ | 31.15 | 7.26 | $ | 20,798 | ||||||
Vested and exercisable at December 31, 2016 | 975,131 | $ | 27.67 | 5.69 | $ | 13,243 | ||||||
In 2016, 2015 and 2014, the Company granted stock options with a weighted-average grant date fair value of $16.60, $15.75 and $12.91, respectively. The intrinsic value of stock options exercised in 2016, 2015 and 2014 was $4.9 million, $5.2 million and $1.6 million, respectively, and cash received from stock options exercised was $15.2 million, $6.2 million and $0.7 million, respectively.
At December 31, 2016, unrecognized stock-based compensation expense, net of estimated forfeitures, relating to unvested stock options was $13.2 million which amount is scheduled to be recognized as stock-based compensation expense over a weighted average period of 1.9 years. To the extent the actual forfeiture rate is different than what the Company has anticipated at December 31, 2016, stock-based compensation expense will differ from expectations.
Restricted Stock Units
89
The following table presents a summary of activity for RSUs (excluding RSUs that are subject to performance-based vesting conditions):
Number of RSUs | Weighted Average Grant Date Fair Value | |||||
Balance, December 31, 2015 | 1,512,022 | $ | 33.20 | |||
Granted | 1,567,621 | 38.27 | ||||
Vested | (1,112,838 | ) | 34.47 | |||
Forfeited | (107,394 | ) | 34.71 | |||
Balance, December 31, 2016 | 1,859,411 | $ | 36.63 | |||
The RSUs generally vest over three or four years from the vesting commencement date and on vesting the holder receives one share of Company common stock for each RSU.
At December 31, 2016, unrecognized stock-based compensation expense related to unvested RSUs was $53.2 million, which is scheduled to be recognized over a weighted average period of 1.9 years. To the extent the actual forfeiture rate is different than what the Company has anticipated at December 31, 2016, stock-based compensation expense will differ from expectations.
Performance Stock Units
The following table presents a summary of activity for PSUs:
Number of PSUs | Weighted Average Grant Date Fair Value | |||||
Balance, December 31, 2015 | 550,088 | $ | 26.87 | |||
Granted | 5,000 | 45.90 | ||||
Vested | (116,506 | ) | 30.13 | |||
Forfeited | (33,798 | ) | 23.72 | |||
Balance, December 31, 2016 | 404,784 | $ | 26.44 | |||
The PSUs generally vest over three or four years from the vesting commencement date, subject to the satisfaction of certain performance conditions, and on vesting the holder receives one share of Company common stock for each PSU.
At December 31, 2016, unrecognized stock-based compensation expense related to unvested PSUs was $0.3 million, which is scheduled to be recognized over a weighted average period of 0.6 years.
Tax Benefits
Upon adoption of the FASB’s guidance on stock-based compensation, the Company elected the alternative transition method (short cut method) provided for calculating the tax effects of stock-based compensation. The alternative transition method includes simplified methods to establish the beginning balance of the additional paid-in capital pool (“APIC pool”) related to the tax effects of employee stock-based compensation, and to determine the subsequent impact on the APIC pool and consolidated statements of cash flows related to the tax effect of employee stock-based compensation awards that are outstanding upon adoption. As of December 31, 2016, the Company’s APIC pool balance was $11.2 million.
The Company applies a with-and-without approach in determining its intra-period allocation of tax expense or benefit attributable to stock-based compensation deductions. Tax deductions in excess of previously recorded benefits (windfalls) included in net operating loss carryforwards but not reflected in deferred tax assets for the years ended December 31, 2016 and 2015 are $55.5 million and $50.4 million, respectively.
12. Commitments and Contingencies
Leases
The Company leases office space under non-cancelable operating leases with various expiration dates through 2024. Rent expense was $5.7 million, $4.7 million and $3.6 million for the years ended December 31, 2016, 2015 and 2014, respectively.
The following table presents future minimum lease payments under the non-cancelable operating leases (in thousands):
Operating Leases | |||
Years Ending December 31: | |||
2017 | $ | 5,807 | |
2018 | 5,024 | ||
2019 | 3,171 | ||
2020 | 2,132 | ||
2021 and thereafter | 5,429 | ||
Total future minimum lease payments | $ | 21,563 | |
Indemnifications and Contingencies
In the normal course of business, the Company enters into contracts and agreements that may contain representations and warranties and provide for general indemnifications. The Company’s exposure under these agreements is unknown because it involves claims that may be made in the future, but have not yet been made. The Company has not paid any material settlement amounts related to indemnification obligations to date.
In accordance with its bylaws and certain agreements, the Company has indemnification obligations to its officers and directors for certain events or occurrences, subject to certain limits, while they are serving at the Company’s request in such capacity. There have been no claims to date under these indemnification obligations.
In addition, the Company is involved in litigation incidental to the conduct of its business. The Company is not a party to any lawsuit or proceeding that, in the opinion of management, is probable to have a material adverse effect on its financial position, results of operations or cash flows.
13. Segment and Geographic Information
Operating segments are defined as components of an enterprise about which separate financial information is available that is evaluated regularly by the chief operating decision maker, in deciding how to allocate resources and in assessing performance. The Company’s chief operating decision maker is its Chief Executive Officer (“CEO”). The CEO reviews financial information presented on a consolidated basis, along with information about revenue by geographic region for purposes of allocating resources and evaluating financial performance. Discrete information on a geographic basis, except for revenue, is not provided below the consolidated level to the CEO. The Company has concluded that it operates in one segment and has provided the required enterprise-wide disclosures.
Revenue by geographic area is based on the location of the end-user carrier. The following table presents revenue and long-lived assets, net, by geographic area (in thousands):
Year Ended December 31, | |||||||||||
2016 | 2015 | 2014 | |||||||||
Revenue: | |||||||||||
North America | $ | 192,824 | $ | 180,791 | $ | 112,198 | |||||
EMEA | 98,138 | 61,187 | 54,950 | ||||||||
Emerging Markets | 50,000 | 36,865 | 49,709 | ||||||||
Total revenue | $ | 340,962 | $ | 278,843 | $ | 216,857 | |||||
North America includes $177.5 million, $172.0 million and $106.8 million of United States revenue for the years ended December 31, 2016, 2015 and 2014.
90
December 31, 2016 | December 31, 2015 | ||||||
Long-Lived Assets, net | |||||||
North America | $ | 22,909 | $ | 21,135 | |||
EMEA | 4,683 | 5,008 | |||||
Emerging Markets | 2,932 | 1,171 | |||||
Total long-lived assets, net | $ | 30,524 | $ | 27,314 | |||
North America includes $22.6 million and $20.9 million of United States long-lived assets as of December 31, 2016 and 2015.
14. 401(k) Defined Contribution Plan
The Company maintains a tax-qualified 401(k) retirement plan that provides eligible U.S. employees with an opportunity to save for retirement on a tax advantaged basis. The Company has a 401(k) plan covering all eligible employees. Beginning January 1, 2012, the Company matches a portion of the employees’ eligible contributions according to the 401(k) plan document. Matching contributions to the plan during the years ended December 31, 2016, 2015 and 2014 were $2.1 million, $1.8 million and $0.8 million, respectively.
91
15. Quarterly Financial Data (Unaudited) (in thousands, except per share data):
March 31, 2016 | June 30, 2016 | September 30, 2016 | December 31, 2016 | ||||||||||||
Total revenue | $ | 73,136 | $ | 81,721 | $ | 84,122 | $ | 101,983 | |||||||
Gross profit | 52,338 | 59,175 | 60,369 | 77,903 | |||||||||||
Income (loss) from operations | (419 | ) | 553 | 1,567 | 13,806 | ||||||||||
Net income (loss) | (1,509 | ) | (2,895 | ) | (605 | ) | 5,826 | ||||||||
Net income (loss) per share: | |||||||||||||||
Basic | $ | (0.05 | ) | $ | (0.10 | ) | $ | (0.02 | ) | $ | 0.19 | ||||
Diluted | $ | (0.05 | ) | $ | (0.10 | ) | $ | (0.02 | ) | $ | 0.18 | ||||
March 31, 2015 | June 30, 2015 | September 30, 2015 | December 31, 2015 | ||||||||||||
Total revenue | $ | 55,671 | $ | 64,484 | $ | 69,097 | $ | 89,591 | |||||||
Gross profit | 39,661 | 44,249 | 47,451 | 69,724 | |||||||||||
Income (loss) from operations | (1,275 | ) | (4,928 | ) | 822 | 20,624 | |||||||||
Net income (loss) | (2,905 | ) | (5,288 | ) | (3,250 | ) | 11,622 | ||||||||
Net income (loss) per share: | |||||||||||||||
Basic | $ | (0.10 | ) | $ | (0.18 | ) | $ | (0.11 | ) | $ | 0.40 | ||||
Diluted | $ | (0.10 | ) | $ | (0.18 | ) | $ | (0.11 | ) | $ | 0.39 | ||||
92
Item 9. | Changes in and Disagreements with Accountants on Accounting and Financial Disclosure |
None.
Item 9A. | Controls and Procedures |
Evaluation of Disclosure Controls and Procedures
Our management, with the participation of our chief executive officer and our chief financial officer, evaluated the effectiveness of our disclosure controls and procedures as of December 31, 2016. The term “disclosure controls and procedures,” as defined in Rules 13a-15(e) and 15d-15(e) under the Securities Exchange Act of 1934, as amended, or the Exchange Act, means controls and other procedures of a company that are designed to ensure that information required to be disclosed by a company in the reports that it files or submits under the Exchange Act is recorded, processed, summarized and reported, within the time periods specified in the SEC’s rules and forms. Disclosure controls and procedures include, without limitation, controls and procedures designed to ensure that information required to be disclosed by a company in the reports that it files or submits under the Exchange Act is accumulated and communicated to the company’s management, including its principal executive and principal financial officers, as appropriate to allow timely decisions regarding required disclosure. Management recognizes that any controls and procedures, no matter how well designed and operated, can provide only reasonable assurance of achieving their objectives and management necessarily applies its judgment in evaluating the cost-benefit relationship of possible controls and procedures. Based on the evaluation of our disclosure controls and procedures as of December 31, 2016, our chief executive officer and chief financial officer concluded that, as of such date, our disclosure controls and procedures were effective at the reasonable assurance level.
Management’s Annual Report on Internal Control over Financial Reporting
Our management is responsible for establishing and maintaining adequate internal control over our financial reporting (as defined in Rules 13a-15(f) and 15d-15(f) of the Exchange Act). We assessed the effectiveness of our internal control over financial reporting as of December 31, 2016, using the criteria established in Internal Control—Integrated Framework issued by the Committee of Sponsoring Organizations of the Treadway Commission (2013 framework). Based upon this assessment, our management concluded that, as of December 31, 2016, our internal control over financial reporting was effective. The effectiveness of our internal control over financial reporting as of December 31, 2016 has been audited by PricewaterhouseCoopers LLP, an independent registered public accounting firm, which appears under Item 8 of this Annual Report on Form 10-K.
Changes in Internal Control over Financial Reporting
There was no change in our internal control over financial reporting identified in connection with the evaluation required by Rule 13a-15(d) and 15d-15(d) of the Exchange Act that occurred during the quarter ended December 31, 2016 that has materially affected, or is reasonably likely to materially affect, our internal control over financial reporting.
Item 9B. | Other Information |
Not applicable.
93
PART III
We will file a definitive Proxy Statement for our 2017 Annual Meeting of Stockholders (the “2017 Proxy Statement”) with the SEC, pursuant to Regulation 14A, not later than 120 days after the end of our fiscal year. Accordingly, certain information required by Part III has been omitted under General Instruction G(3) to Form 10-K. Only those sections of the 2017 Proxy Statement that specifically address the items set forth herein are incorporated by reference.
Item 10. | Directors, Executive Officers and Corporate Governance |
The information required by Item 10 is hereby incorporated by reference from our 2017 Proxy Statement under the captions “Election of Directors” and “Section 16(a) Beneficial Ownership Reporting Compliance.”
Item 11. | Executive Compensation |
The information required by Item 11 is hereby incorporated by reference from our 2017 Proxy Statement under the captions “Executive Compensation” and “Director Compensation.”
The information required to be disclosed by Item 201(d) of Regulation S-K regarding equity securities authorized for issuance under our equity incentive plans is hereby incorporated by reference from our 2017 Proxy Statement under the caption “Securities Authorized for Issuance under Equity Compensation Plans.”
Item 12. | Security Ownership of Certain Beneficial Owners and Management and Related Stockholder Matters |
The information required by Item 12 is hereby incorporated by reference from our 2017 Proxy Statement under the caption “Security Ownership of Certain Beneficial Owners and Management.”
Item 13. | Certain Relationships and Related Transactions, and Director Independence |
The information required by Item 13 is hereby incorporated by reference from our 2017 Proxy Statement under the captions “Transactions with Related Persons” and “Independence of the Board of Directors.”
Item 14. | Principal Accountant Fees and Services |
The information required by Item 14 is hereby incorporated by reference from our 2017 Proxy Statement under the caption “Independent Registered Public Accounting Firm Fees.”
94
PART IV
Item 15. | Exhibits and Financial Statement Schedules |
(a) Financial Statements
The financial statements filed as part of this report are listed on the index to financial statements on page 61.
(b) Financial Statement Schedule
The following financial statement schedule is filed as a part of this Annual Report on Form 10-K.
SCHEDULE II—CONSOLIDATED VALUATION AND QUALIFYING ACCOUNTS
(In thousands)
Balance at Beginning of Year | Amounts Charged to Operations (1) | Deductions (2) | Additions Acquired from Business Combinations | Balance at End of Year | ||||||||||
Allowance for doubtful accounts: | ||||||||||||||
Year Ended December 31, 2014 | 128 | 274 | (116 | ) | — | 286 | ||||||||
Year Ended December 31, 2015 | 286 | 4 | (205 | ) | — | 85 | ||||||||
Year Ended December 31, 2016 | 85 | 313 | (290 | ) | — | 108 | ||||||||
Allowance for deferred tax assets: | ||||||||||||||
Year Ended December 31, 2014 | 3,297 | (3,033 | ) | — | — | 264 | ||||||||
Year Ended December 31, 2015 | 264 | 5 | — | 43 | 312 | |||||||||
Year Ended December 31, 2016 | 312 | 1,652 | (151 | ) | — | 1,813 | ||||||||
_______________________
(1) | Amount represents charges to bad debt and increase to or (release of) our valuation allowance. |
(2) | Amount represents recoveries of accounts receivable previously charged to the allowance and utilization of net operating losses against the valuation allowance. |
(c) Exhibits
The following exhibits are incorporated by reference or filed herewith.
See Exhibit Index
Item 16. | Form 10-K Summary |
Not applicable.
95
SIGNATURES
Pursuant to the requirements of Section 13 or 15(d) of the Securities Exchange Act of 1934, as amended, the registrant has duly caused this report to be signed on its behalf by the undersigned, thereunto duly authorized.
BROADSOFT, INC. | ||
By: | /s/ JAMES A. THOLEN | |
James A. Tholen | ||
Chief Financial Officer | ||
February 23, 2017 | ||
Pursuant to the requirements of the Securities Exchange Act of 1934, this report has been signed by the following persons on behalf of the registrant and in the capacities and on the dates indicated:
Signatures | Title | Date |
/S/ MICHAEL TESSLER | President, Chief Executive | February 23, 2017 |
Michael Tessler | Officer and Director (Principal Executive Officer) | |
/S/ JAMES A. THOLEN | Chief Financial Officer | February 23, 2017 |
James A. Tholen | (Principal Financial Officer) | |
/S/ DENNIS D. DOURGARIAN | Chief Accounting Officer | February 23, 2017 |
Dennis D. Dourgarian | (Principal Accounting Officer) | |
/S/ JOHN D. MARKLEY, JR | Director and Chairman of the | February 23, 2017 |
John D. Markley, Jr. | Board | |
/S/ DAVID BERNARDI | Director | February 23, 2017 |
David Bernardi | ||
/S/ JANE A. DIETZE | Director | February 23, 2017 |
Jane A. Dietze | ||
/S/ JOHN J. GAVIN, JR | Director | February 23, 2017 |
John J. Gavin, Jr. | ||
/S/ ANDREW M. GEISSE | Director | February 23, 2017 |
Andrew M. Geisse | ||
/S/ PAUL J. MAGELLI | Director | February 23, 2017 |
Paul J. Magelli | ||
/S/ DOUGLAS L. MAINE | Director | February 23, 2017 |
Douglas L. Maine | ||
/S/ EVA M. SAGE-GAVIN | Director | February 23, 2017 |
Eva M. Sage-Gavin | ||
96
Exhibit Index
Exhibit Number | Description of Document |
3.1(1) | Amended and Restated Certificate of Incorporation of the Registrant. |
3.2(2) | Second Amended and Restated Bylaws of the Registrant. |
4.1(3) | Specimen Stock Certificate evidencing shares of common stock. |
4.2(4) | Fourth Amended and Restated Registration Rights Agreement, dated as of June 26, 2007. |
4.3(5) | First Amendment to Fourth Amended and Restated Registration Rights Agreement, dated as of November 25, 2008. |
4.4(6) | Second Amendment to Fourth Amended and Restated Registration Rights Agreement, dated as of December 23, 2008. |
4.5(7) | Third Amendment to Fourth Amended and Restated Registration Rights Agreement, dated as of October 19, 2009. |
4.6(8) | Fourth Amendment to Fourth Amended and Restated Registration Rights Agreement, dated as of March 26, 2010. |
4.7(9) | Indenture, dated as of June 20, 2011, by and between the Registrant and Wells Fargo Bank, N.A., as Trustee. |
4.8(10) | Form of Note representing the Registrant’s 1.50% Convertible Senior Notes due 2018. |
4.9(11) | Indenture, dated as of September 15, 2015, by and between BroadSoft, Inc. and Wells Fargo Bank, N.A., as Trustee. |
4.10(12) | Form of Note representing the Registrations 1.0% Convertible Senior Notes due 2022 |
10.1*(13) | BroadSoft, Inc. 1999 Stock Incentive Plan, as amended. |
10.2*(14) | Form of Stock Option Grant Agreement for BroadSoft, Inc. 1999 Stock Incentive Plan. |
10.3*(15) | Form of Common Stock Purchase Agreement and Stock Restriction Agreement for BroadSoft, Inc. 1999 Stock Incentive Plan. |
10.4*(16) | BroadSoft, Inc. Amended and Restated 2009 Equity Incentive Plan. |
10.5*(17) | Form of Stock Option Agreement for BroadSoft, Inc. Amended and Restated 2009 Equity Incentive Plan. |
10.6*(18) | Form of Restricted Stock Unit Award Agreement for BroadSoft, Inc. Amended and Restated 2009 Equity Incentive Plan. |
10.7*(19) | Form of Indemnity Agreement entered into between the Registrant and certain of its directors and its executive officers. |
10.8(20) | Form of Indemnity Agreement entered into between the Registrant and certain of its directors. |
10.9*(21) | Form of Executive Change in Control Severance Benefits Agreement entered into between the Registrant and its executive officers. |
10.10(22) | Sublease Agreement, by and between Marriott International Administrative Services, Inc. and the Registrant, dated as of April 13, 2010. |
10.11 | BroadSoft, Inc. Non-Employee Director Compensation Policy. |
10.12*(23) | BroadSoft, Inc. 2016 Executive Officer Annual Bonus Plan Document |
10.13*(24) | Form of Performance Stock Unit Award Agreement for BroadSoft, Inc. Amended and Restated 2009 Equity Incentive Plan |
21.1 | Subsidiaries of the Registrant. |
23.1 | Consent of PricewaterhouseCoopers LLP, Independent Registered Public Accounting Firm. |
97
31.1 | Certification of Chief Executive Officer pursuant to Section 302 of the Sarbanes Oxley Act of 2002. |
31.2 | Certification of Chief Financial Officer pursuant to Section 302 of the Sarbanes Oxley Act of 2002. |
32.1 | Certification of Chief Executive Officer pursuant to Section 906 of the Sarbanes Oxley Act of 2002. |
32.2 | Certification of Chief Financial Officer pursuant to Section 906 of the Sarbanes Oxley Act of 2002. |
101.INS XBRL | Instance Document |
101.SCH XBRL | Taxonomy Extension Schema |
101.CAL XBRL | Taxonomy Extension Calculation Linkbase |
101.DEF XBRL | Taxonomy Extension Definition Linkbase |
101.LAB XBRL | Taxonomy Extension Label Linkbase |
101.PRE XBRL | Taxonomy Extension Presentation Linkbase |
(1) | Filed as exhibit 3.1 to the Registrant’s Current Report on Form 8-K (File No. 001-34777) filed with the Securities and Exchange Commission on June 25, 2010 and incorporated herein by reference. |
(2) | Filed as exhibit 3.1 to the Registrant’s Current Report on Form 8-K (File No. 001-34777) filed with the Securities and Exchange Commission on November 20, 2013 and incorporated herein by reference. |
(3) | Filed as exhibit 4.1 to the Registrant’s Registration Statement on Form S-1 (Registration No. 333-165484) filed with the Securities and Exchange Commission on June 1, 2010 and incorporated herein by reference. |
(4) | Filed as exhibit 4.5 to the Registrant’s Registration Statement on Form S-1 (Registration No. 333-165484) filed with the Securities and Exchange Commission on March 15, 2010 and incorporated herein by reference. |
(5) | Filed as exhibit 4.6 to the Registrant’s Registration Statement on Form S-1 (Registration No. 333-165484) filed with the Securities and Exchange Commission on March 15, 2010 and incorporated herein by reference. |
(6) | Filed as exhibit 4.7 to the Registrant’s Registration Statement on Form S-1 (Registration No. 333-165484) filed with the Securities and Exchange Commission on March 15, 2010 and incorporated herein by reference. |
(7) | Filed as exhibit 4.8 to the Registrant’s Registration Statement on Form S-1 (Registration No. 333-165484) filed with the Securities and Exchange Commission on March 15, 2010 and incorporated herein by reference. |
(8) | Filed as exhibit 4.9 to the Registrant’s Registration Statement on Form S-1 (Registration No. 333-165484) filed with the Securities and Exchange Commission on April 16, 2010 and incorporated herein by reference. |
(9) | Filed as exhibit 4.1 to the Registrant’s Current Report on Form 8-K (File No. 001-34777) filed with the Securities and Exchange Commission on June 21, 2011 and incorporated by reference herein. |
(10) | Filed as exhibit 4.2 to the Registrant’s Current Report on Form 8-K (File No. 001-34777) filed with the Securities and Exchange Commission on June 21, 2011 and incorporated by reference herein. |
(11) | Filed as exhibit 4.1 to the Registrant’s Current Report on Form 8-K (File No. 001-34777) filed with the Securities and Exchange Commission on September 15, 2015 and incorporated by reference herein. |
(12) | Filed as exhibit 4.2 to the Registrant’s Current Report on Form 8-K (File No. 001-34777) filed with the Securities and Exchange Commission on September 15, 2015 and incorporated by reference herein. |
(13) | Filed as exhibit 10.1 to the Registrant’s Registration Statement on Form S-1 (Registration No. 333-165484) filed with the Securities and Exchange Commission on March 15, 2010 and incorporated herein by reference. |
(14) | Filed as exhibit 10.2 to the Registrant’s Registration Statement on Form S-1 (Registration No. 333-165484) filed with the Securities and Exchange Commission on March 15, 2010 and incorporated herein by reference. |
(15) | Filed as exhibit 10.3 to the Registrant’s Registration Statement on Form S-1 (Registration No. 333-165484) filed with the Securities and Exchange Commission on March 15, 2010 and incorporated herein by reference. |
(16) | Filed as exhibit 10.5 to the Registrant’s Annual Report on Form 10-K filed with the Securities and Exchange Commission on March 7, 2011 and incorporated by reference herein. |
(17) | Filed as exhibit 10.6 to the Registrant’s Registration Statement on Form S-1 (Registration No. 333-165484) filed with the Securities and Exchange Commission on June 1, 2010 and incorporated herein by reference. |
98
(18) | Filed as exhibit 10.7 to the Registrant’s Registration Statement on Form S-1 (Registration No. 333-165484) filed with the Securities and Exchange Commission on June 1, 2010 and incorporated herein by reference. |
(19) | Filed as exhibit 10.8 to the Registrant’s Registration Statement on Form S-1 (Registration No. 333-165484) filed with the Securities and Exchange Commission on March 15, 2010 and incorporated herein by reference. |
(20) | Filed as exhibit 10.9 to the Registrant’s Registration Statement on Form S-1 (Registration No. 333-165484) filed with the Securities and Exchange Commission on March 15, 2010 and incorporated herein by reference. |
(21) | Filed as exhibit 10.10 to the Registrant’s Registration Statement on Form S-1 (Registration No. 333-165484) filed with the Securities and Exchange Commission on March 15, 2010 and incorporated herein by reference. |
(22) | Filed as exhibit 10.19 to the Registrant’s Registration Statement on Form S-1 (Registration No. 333-165484) filed with the Securities and Exchange Commission on April 16, 2010 and incorporated herein by reference. |
(23) | Previously filed, with certain portions redacted pursuant to a confidential treatment request, as exhibit 10.1 to the Registrant's Quarterly Report on Form 10-Q filed with the Securities and Exchange Commission on May 4, 2016. |
(24) | Filed as exhibit 10.13 to the Registrant’s Annual Report on Form 10-K filed with the Securities and Exchange Commission on February 25, 2015 and incorporated by reference herein. |
* | Denotes management compensation plan or arrangement. |
^ | Confidential treatment has been granted with respect to certain portions of this exhibit. A complete copy of the document, including the redacted portions, has been filed separately with the SEC. |
99