Attached files
| file | filename |
|---|---|
| EX-31.1 - EX-31.1 - Avery Dennison Corp | a2230940zex-31_1.htm |
| EX-23 - EX-23 - Avery Dennison Corp | a2230940zex-23.htm |
| EX-32.2 - EX-32.2 - Avery Dennison Corp | a2230940zex-32_2.htm |
| EX-32.1 - EX-32.1 - Avery Dennison Corp | a2230940zex-32_1.htm |
| EX-31.2 - EX-31.2 - Avery Dennison Corp | a2230940zex-31_2.htm |
| EX-21 - EX-21 - Avery Dennison Corp | a2230940zex-21.htm |
| EX-12 - EX-12 - Avery Dennison Corp | a2230940zex-12.htm |
| 10-K - 10-K - Avery Dennison Corp | a2230940z10-k.htm |
| |
Segment | Segment | Segment | |||
|---|---|---|---|---|---|---|
| Label and Graphic Materials | Retail Branding and Information Solutions | Industrial and Healthcare Materials | ||||
| | | | | | | |
| BUSINESSES | Label and Packaging Materials Graphics Solutions Reflective Solutions |
Retail Branding and Information Solutions Printer Solutions |
Performance Tapes Fastener Solutions Vancive Medical Technologies |
|||
| | | | | | | |
| 2016 SALES IN MILLIONS | $4,187 | $1,445 | $454 | |||
| | | | | | | |
| % OF SALES | 69% | 24% | 7% | |||
| | | | | | | |
| GLOBAL BRAND | Avery Dennison® Fasson® |
Avery Dennison® Monarch® |
Avery Dennison® Vancive Medical TechnologiesTM |
|||
| | | | | | | |
| DESCRIPTION | The technologies and materials of our Label and Graphic Materials businesses enhance brands' shelf, store and street appeal; inform shoppers of ingredients; protect brand security; improve operational efficiency and customer product performance; and provide visual information that enhances safety. | Our Retail Branding and Information Solutions provides intelligent, creative, and sustainable solutions that elevate brands and accelerate performance through the global retail supply chain. | Our Industrial and Healthcare Materials businesses provide tapes products, including coated and adhesives transfer tapes; fasteners, primarily precision-extruded and injection-molded plastic devices; and wound care, ostomy, surgical and electromedical device applications for manufacturers, clinicians and patients. | |||
| | | | | | | |
| PRODUCTS/SOLUTIONS | Pressure-sensitive labeling materials; packaging materials and solutions; roll-fed sleeve; engineered films; graphic imaging media; reflective materials | Creative services; brand embellishments; graphic tickets; tags and labels; sustainable packaging; inventory visibility and loss prevention solutions; data management services; price tickets; printers and scanners; radio-frequency identification inlays and tags; brand protection and security solutions | Pressure-sensitive tapes for automotive, building and construction; electronics; general industrial; diaper tapes and closures; fasteners; skin-contact adhesives; surgical, wound care, ostomy and securement products; medical barrier films | |||
| | | | | | | |
| MARKET SEGMENTS | Food; beverage; wine and spirits; home and personal care products; pharmaceuticals; durables; fleet vehicle/automotive; architectural/retail; promotional/advertising; traffic; safety; transportation | Apparel manufacturing and retail supply chain; food service and supply chain; hard goods and supply chain; pharmaceutical supply chain; logistics | Original equipment manufacturing; personal care; electronics; building and construction; retail supply chain; medical | |||
| | | | | | | |
| CUSTOMERS | Label converters; package designers; packaging engineers and manufacturers; industrial manufacturers; printers; distributors; designers; advertising agencies; government agencies; sign manufacturers; graphics vendors | Apparel and footwear brands; manufacturers and retailers; food service, grocery and pharmaceutical supply chains; consumer goods brands; automotive manufacturers; transportation companies | Tape converters; original equipment manufacturers; original design manufacturers; construction firms; personal care product manufacturers; manufacturers and retailers; medical device manufacturers | |||
| | | | | | | |
| WEBSITES | www.label.averydennison.com www.graphics.averydennison.com www.reflectives.averydennison.com |
www.rbis.averydennison.com www.rfid.averydennison.com |
www.tapes.averydennison.com www.vancive.averydennison.com |
|||
| | | | | | | |
| LEADERS | Georges Gravanis President Label and Graphic Materials |
Deon Stander Vice President and General Manager Retail Branding and Information Solutions |
Michael Johansen Vice President and General Manager Industrial and Healthcare Materials |
|||
| | | | | | | |
Note: In the fourth quarter of 2016, we changed our operating structure to align with our overall business strategy. The reportable segments above reflect our new operating and reporting structure.
Avery Dennison Corporation
Safe Harbor Statement
The matters discussed in this Annual Report contain "forward-looking statements" within the meaning of the Private Securities Litigation Reform Act of 1995. These statements, which are not statements of historical fact, contain estimates, assumptions, projections and/or expectations regarding future events, which may or may not occur. Words such as "aim," "anticipate," "assume," "believe," "continue," "could," "estimate," "expect," "foresee," "guidance," "intend," "may," "might," "objective," "plan," "potential," "project," "seek," "shall," "should," "target," "will," "would," or variations thereof, and other expressions that refer to future events and trends, identify forward-looking statements. These forward-looking statements, and financial or other business targets, are subject to certain risks and uncertainties, which could cause our actual results to differ materially from the expected results, performance or achievements expressed or implied by such forward-looking statements.
Certain risks and uncertainties are discussed in more detail under "Risk Factors" and "Management's Discussion and Analysis of Financial Condition and Results of Operations" in our Annual Report on Form 10-K for the fiscal year ended December 31, 2016 and include, but are not limited to, risks and uncertainties relating to the following: fluctuations in demand affecting sales to customers; worldwide and local economic conditions; changes in political conditions; changes in governmental laws and regulations; fluctuations in currency exchange rates and other risks associated with foreign operations, including in emerging markets; the financial condition and inventory strategies of customers; changes in customer preferences; fluctuations in cost and availability of raw materials; our ability to generate sustained productivity improvement; our ability to achieve and sustain targeted cost reductions; the impact of competitive products and pricing; loss of significant contracts or customers; collection of receivables from customers; selling prices; business mix shift; execution and integration of acquisitions and completion of potential dispositions; timely development and market acceptance of new products, including sustainable or sustainably-sourced products; investment in development activities and new production facilities; amounts of future dividends and share repurchases; customer and supplier concentrations; successful implementation of new manufacturing technologies and installation of manufacturing equipment; disruptions in information technology systems, including cyber-attacks or other intrusions to network security; successful installation of new or upgraded information technology systems; data security breaches; volatility of financial markets; impairment of capitalized assets, including goodwill and other intangibles; credit risks; our ability to obtain adequate financing arrangements and maintain access to capital; fluctuations in interest and tax rates; changes in tax laws and regulations, and uncertainties associated with interpretations of such laws and regulations; outcome of tax audits; fluctuations in pension, insurance, and employee benefit costs; the impact of legal and regulatory proceedings, including with respect to environmental, health and safety; protection and infringement of intellectual property; the impact of epidemiological events on the economy and our customers and suppliers; acts of war, terrorism, and natural disasters; and other factors.
We believe that the most significant risk factors that could affect our financial performance in the near-term include: (1) the impacts of global economic conditions and political uncertainty on underlying demand for our products and foreign currency fluctuations; (2) competitors' actions, including pricing, expansion in key markets, and product offerings; (3) the degree to which higher costs can be offset with productivity measures and/or passed on to customers through selling price increases, without a significant loss of volume; and (4) the execution and integration of acquisitions.
Our forward-looking statements are made only as of the date hereof. We assume no duty to update these forward-looking statements to reflect new, changed or unanticipated events or circumstances, other than as may be required by law.
| 1 Avery Dennison Corporation 2016 Annual Report | | |
Avery Dennison Corporation
Five-Year Summary
(Dollars in millions, except percentages |
2016 | 2015 | 2014 | (1) | 2013 | 2012 | |||||||||||||||||||||||||
| | | | | | | | | | | | | | | | | | | | | | | | | | | | | | | | |
and per share amounts) |
Dollars | % | Dollars | % | Dollars | % | Dollars | % | Dollars | % | |||||||||||||||||||||
| | | | | | | | | | | | | | | | | | | | | | | | | | | | | | | | |
For the Year |
|||||||||||||||||||||||||||||||
Net sales |
$ | 6,086.5 | 100.0 | $ | 5,966.9 | 100.0 | $ | 6,330.3 | 100.0 | $ | 6,140.0 | 100.0 | $ | 5,863.5 | 100.0 | ||||||||||||||||
Gross profit |
1,699.7 | 27.9 | 1,645.8 | 27.6 | 1,651.2 | 26.1 | 1,637.7 | 26.7 | 1,529.5 | 26.1 | |||||||||||||||||||||
Marketing, general and administrative expense |
1,097.5 | 18.0 | 1,108.1 | 18.6 | 1,158.9 | 18.3 | 1,174.2 | 19.1 | 1,152.6 | 19.7 | |||||||||||||||||||||
Interest expense |
59.9 | 1.0 | 60.5 | 1.0 | 63.3 | 1.0 | 60.9 | 1.0 | 72.5 | 1.2 | |||||||||||||||||||||
Other expense, net (2) |
65.2 | 1.1 | 68.3 | 1.1 | 68.2 | 1.1 | 36.6 | .6 | 68.8 | 1.2 | |||||||||||||||||||||
Income from continuing operations before taxes |
477.1 | 7.8 | 408.9 | 6.9 | 360.8 | 5.7 | 366.0 | 6.0 | 235.6 | 4.0 | |||||||||||||||||||||
Provision for income taxes |
156.4 | 2.6 | 134.5 | 2.3 | 113.5 | 1.8 | 124.3 | 2.0 | 76.1 | 1.3 | |||||||||||||||||||||
Income from continuing operations |
320.7 | 5.3 | 274.4 | 4.6 | 247.3 | 3.9 | 241.7 | 3.9 | 159.5 | 2.7 | |||||||||||||||||||||
(Loss) income from discontinued operations, net of tax |
– | N/A | (.1 | ) | N/A | (2.2 | ) | N/A | (28.5 | ) | N/A | 57.8 | N/A | ||||||||||||||||||
Net income |
320.7 | 5.3 | 274.3 | 4.6 | 245.1 | 3.9 | 213.2 | 3.5 | 217.3 | 3.7 | |||||||||||||||||||||
| | | | | | | | | | | | | | | | | | | | | | | | | | | | | | | | |
|
2016 |
2015 |
2014 |
2013 |
2012 |
||||||||||||||||||||||||||
| | | | | | | | | | | | | | | | | | | | | | | | | | | | | | | | |
Per Share Information |
|||||||||||||||||||||||||||||||
Income per common share from continuing operations |
$ | 3.60 | $ | 3.01 | $ | 2.64 | $ | 2.46 | $ | 1.56 | |||||||||||||||||||||
(Loss) income per common share from discontinued operations |
– | – | (.03 | ) | (.29 | ) | .56 | ||||||||||||||||||||||||
Net income per common share |
3.60 | 3.01 | 2.61 | 2.17 | 2.12 | ||||||||||||||||||||||||||
Income per common share from continuing operations, assuming dilution |
3.54 | 2.95 | 2.58 | 2.41 | 1.54 | ||||||||||||||||||||||||||
(Loss) income per common share from discontinued operations, assuming dilution |
– | – | (.02 | ) | (.28 | ) | .56 | ||||||||||||||||||||||||
Net income per common share, assuming dilution |
3.54 | 2.95 | 2.56 | 2.13 | 2.10 | ||||||||||||||||||||||||||
Dividends per common share |
1.60 | 1.46 | 1.34 | 1.14 | 1.08 | ||||||||||||||||||||||||||
Weighted average number of common shares outstanding (in millions) |
89.1 | 91.0 | 93.8 | 98.4 | 102.6 | ||||||||||||||||||||||||||
Weighted average number of common shares outstanding, assuming dilution (in millions) |
90.7 | 92.9 | 95.7 | 100.1 | 103.5 | ||||||||||||||||||||||||||
Market price per share at fiscal year-end |
$ | 70.22 | $ | 62.66 | $ | 51.79 | $ | 50.48 | $ | 34.40 | |||||||||||||||||||||
Market price per share range |
58.16 to 78.84 |
51.07 to 66.18 |
41.28 to 52.67 |
34.92 to 50.65 |
26.38 to 34.97 |
||||||||||||||||||||||||||
| | | | | | | | | | | | | | | | | | | | | | | | | | | | | | | | |
At End of Year |
|||||||||||||||||||||||||||||||
Property, plant and equipment, net (3) |
$ | 915.2 | $ | 847.9 | $ | 875.3 | $ | 922.5 | $ | 1,015.5 | |||||||||||||||||||||
Total assets (4) |
4,396.4 | 4,133.7 | 4,356.9 | 4,608.3 | 5,113.2 | ||||||||||||||||||||||||||
Long-term debt and capital leases |
713.4 | 963.6 | 940.1 | 944.6 | 697.6 | ||||||||||||||||||||||||||
Total debt |
1,292.5 | 1,058.9 | 1,144.4 | 1,021.5 | 1,217.8 | ||||||||||||||||||||||||||
Shareholders' equity (4) |
925.5 | 965.7 | 1,047.7 | 1,468.1 | 1,536.6 | ||||||||||||||||||||||||||
| | | | | | | | | | | | | | | | | | | | | | | | | | | | | | | | |
Other Information |
|||||||||||||||||||||||||||||||
Depreciation and amortization expense (3) |
$ | 180.1 | $ | 188.3 | $ | 201.6 | $ | 204.3 | $ | 211.0 | |||||||||||||||||||||
Research and development expense (3) |
89.7 | 91.9 | 102.5 | 96.0 | 98.6 | ||||||||||||||||||||||||||
Effective tax rate (3) |
32.8 |
% |
32.9 |
% |
31.5 |
% |
34.0 |
% |
32.3 |
% |
|||||||||||||||||||||
| | | | | | | | | | | | | | | | | | | | | | | | | | | | | | | | |
- (1)
- Results for 2014 reflected a 53-week period.
- (2)
- Included pre-tax charges for severance and related costs, asset impairment charges, lease and other contract cancellation costs, and other items.
- (3)
- Amounts are for continuing operations only.
- (4)
- Amounts are for continuing and discontinued operations.
| | | 2 |
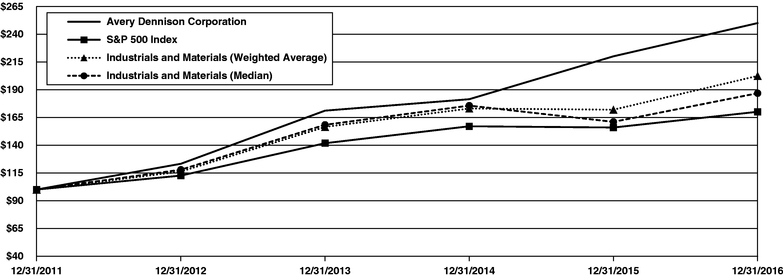
Stockholder Return Performance
The graph below compares the cumulative stockholder return on our common stock, including the reinvestment of dividends, with the return on the S&P 500® Stock Index, the average return (weighted by market capitalization) of the S&P 500® Materials and Industrials subsets (the "Market Basket"), and the median return of the Market Basket, in each case for the five-year period ending December 31, 2016.
Comparison of Five-Year Cumulative Total Return as of December 31, 2016
Total Return Analysis (1)
| |
12/31/2011 |
12/31/2012 |
12/31/2013 |
12/31/2014 |
12/31/2015 |
12/31/2016 |
|||||||||||||
|---|---|---|---|---|---|---|---|---|---|---|---|---|---|---|---|---|---|---|---|
| | | | | | | | | | | | | | | | | | | | |
Avery Dennison Corporation |
$ | 100.00 | $ | 123.24 | $ | 171.14 | $ | 181.46 | $ | 220.14 | $ | 250.10 | |||||||
S&P 500 Index |
100.00 | 112.58 | 141.77 | 157.06 | 155.92 | 170.12 | |||||||||||||
Market Basket (Weighted Average) (2) |
100.00 | 116.19 | 156.46 | 173.07 | 172.00 | 202.46 | |||||||||||||
Market Basket (Median) |
100.00 | 117.86 | 158.37 | 175.68 | 161.04 | 186.86 | |||||||||||||
| | | | | | | | | | | | | | | | | | | | |
- (1)
- Assumes $100.00 invested on December 31, 2011 and the reinvestment of dividends.
- (2)
- Average weighted by market capitalization.
Historical stock price performance is not necessarily indicative of future stock price performance.
| 3 Avery Dennison Corporation 2016 Annual Report | | |
Management's Discussion and Analysis of Financial Condition and Results of Operations
Management's Discussion and Analysis of Financial Condition and Results of Operations, or MD&A, provides management's views on our financial condition and results of operations, should be read in conjunction with the accompanying Consolidated Financial Statements and notes thereto, and includes the following sections:
We report our financial results in conformity with accounting principles generally accepted in the United States of America, or GAAP, and also communicate with investors using certain non-GAAP financial measures. These non-GAAP financial measures are not in accordance with, nor are they a substitute for or superior to, the comparable GAAP financial measures. These non-GAAP financial measures are intended to supplement the presentation of our financial results that are prepared in accordance with GAAP. Based upon feedback from investors and financial analysts, we believe that the supplemental non-GAAP financial measures we provide are useful to their assessments of our performance and operating trends, as well as liquidity.
Our non-GAAP financial measures exclude the impact of certain events, activities or strategic decisions. The accounting effects of these events, activities or decisions, which are included in the GAAP financial measures, may make it difficult to assess our underlying performance in a single period. By excluding the accounting effects, both positive and negative, of certain items (e.g. restructuring charges, legal settlements, certain effects of strategic transactions and related costs, losses from debt extinguishments, gains and losses from curtailment and settlement of pension obligations, gains or losses on sales of certain assets, and other items), we believe that we are providing meaningful supplemental information to facilitate an understanding of our core operating results and liquidity measures. These non-GAAP financial measures are used internally to evaluate trends in our underlying performance, as well as to facilitate comparison to the results of competitors for a single period. While some of the items we exclude from GAAP financial measures recur, they tend to be disparate in amount, frequency, or timing.
We use the following non-GAAP financial measures in this MD&A:
- •
- Organic sales change refers to the increase or decrease in sales excluding the estimated impact of currency translation, product line exits, acquisitions and divestitures, and, where applicable, the extra week in our fiscal year. The estimated impact of currency translation is calculated on a constant currency basis, with prior period results translated at current period average exchange rates to exclude the effect of currency fluctuations.
- •
- Sales change (ex. currency) refers to the increase or decrease in sales excluding the estimated impact of currency translation.
- •
- Free cash flow refers to cash flow from operations, less payments for property, plant and equipment, software and other deferred charges, plus proceeds from sales of property, plant and equipment, plus (minus) net proceeds from sales (purchases) of investments, plus (minus) free cash outflow (inflow) from discontinued operations. We believe that free cash flow assists investors by indicating the amount of cash we have available for debt reductions, dividends, share repurchases, and acquisitions.
- •
- Operational working capital refers to trade accounts receivable and inventories, net of accounts payable, and excludes cash and cash equivalents, short-term borrowings, deferred taxes, other current assets and other current liabilities, as well as net current assets or liabilities held-for-sale. We believe that operational working capital assists investors in assessing our working capital requirements because it excludes the impact of fluctuations attributable to our financing and other activities (which affect cash and cash equivalents, deferred taxes, other current assets, and other current liabilities) that tend to be disparate in amount, frequency, or timing, and that may increase the volatility of working capital as a percentage of sales from period to period. The items excluded from this measure are not significantly influenced by our day-to-day activities managed at the operating level and do not necessarily reflect the underlying trends in our operations.
- •
- Net debt to EBITDA ratio refers to total debt (including capital leases) less cash and cash equivalents, divided by EBITDA, which refers to net income before interest, taxes, depreciation and amortization. We believe the net debt to EBITDA ratio is meaningful because investors view it as a useful measurement of our leverage position.
We believe that organic sales change and sales change (ex. currency) assist investors in evaluating the sales growth from the ongoing activities of our businesses and better enable them to evaluate our results from period to period.
Fiscal Year
Normally, our fiscal years consist of 52 weeks, but every fifth or sixth fiscal year consists of 53 weeks. Our 2016 and 2015 fiscal years consisted of 52-week periods ending December 31, 2016 and January 2, 2016, respectively. Our 2014 fiscal year consisted of a 53-week period ending January 3, 2015.
Segment Information
In the fourth quarter of 2016, we changed our operating structure to align with our overall business strategy, and our Chief Executive Officer, who is also our chief operating decision maker, requested changes in the information that he regularly reviews for purposes of allocating resources and assessing performance. As a result of these events, our fiscal year 2016 results are reported based on our new reportable segments, as described in Note 15, "Segment Information," to the
| | | 4 |
Management's Discussion and Analysis of Financial Condition and Results of Operations
Consolidated Financial Statements. We have reclassified certain prior period amounts to reflect our new operating structure.
Net Sales
The factors impacting the reported sales change are shown in the table below:
| |
2016 |
2015 |
|||||
|---|---|---|---|---|---|---|---|
| | | | | | | | |
Reported sales change |
2 | % | (6 | )% | |||
Foreign currency translation |
3 | 9 | |||||
| | | | | | | | |
Sales change (ex. currency) |
5 | % | 3 | % | |||
| | | | | | | | |
Extra week in 2014 fiscal year |
– | 1 | |||||
Acquisitions/divestitures |
(1 | ) | 1 | ||||
| | | | | | | | |
Organic sales change |
4 | % | 5 | % | |||
| | | | | | | | |
In both years, net sales increased on an organic basis primarily due to higher volume.
Income from Continuing Operations
Income from continuing operations increased from approximately $274 million in 2015 to approximately $321 million in 2016. Major factors affecting the change in income from continuing operations in 2016 compared to 2015 included:
Positive factors:
- •
- Higher volume
- •
- Benefits from productivity initiatives, including savings from restructuring actions, net of transition costs
- •
- Lower restructuring charges
Offsetting factors:
- •
- Loss from settlement of pension obligations
- •
- Higher employee-related costs
- •
- Net impact of pricing and raw material input costs
- •
- Higher income taxes
- •
- Geographic mix
- •
- Foreign currency translation
Cost Reduction Actions
2015/2016 Actions
During fiscal year 2016, we recorded $20.9 million in restructuring charges, net of reversals, related to restructuring actions initiated during the third quarter of 2015 ("2015/2016 Actions") that we expect to continue through 2017. These charges consisted of severance and related costs for the reduction of approximately 440 positions, lease cancellation costs, and asset impairment charges.
During fiscal year 2015, we recorded $26.1 million in restructuring charges, net of reversals, related to our 2015/2016 Actions. These charges consisted of severance and related costs for the reduction of approximately 430 positions, lease cancellation costs, and asset impairment charges.
No employees impacted by our 2015/2016 Actions taken through December 31, 2016 remained employed by us as of such date.
2014/2015 Actions
During fiscal year 2015, we recorded $33.4 million in restructuring charges, net of reversals, related to restructuring actions we initiated in 2014 that continued through the second quarter of 2015 ("2014/2015 Actions"). These charges consisted of severance and related costs for the reduction of approximately 605 positions, lease cancellation costs, and asset impairment charges.
No employees impacted by our 2014/2015 Actions remained employed by us as of December 31, 2016.
Impact of Cost Reduction Actions
During fiscal year 2016, we realized more than $80 million in savings, net of transition costs, from our 2015/2016 Actions and 2014/2015 Actions.
We anticipate incremental savings, net of transition costs, from our 2015/2016 actions of approximately $40 million to $50 million in 2017. We estimate cash restructuring costs of approximately $25 million in 2017.
Restructuring charges were included in "Other expense, net" in the Consolidated Statements of Income. Refer to Note 13, "Cost Reduction Actions," to the Consolidated Financial Statements for more information.
Acquisitions
On August 1, 2016, we completed the acquisition of the European business of Mactac ("Mactac") from Platinum Equity through the purchase of Evergreen Holding V, LLC. Mactac manufactures pressure-sensitive materials that primarily complement our existing graphics portfolio. The total consideration for this acquisition, net of cash received, was approximately $220 million, which we funded primarily through existing credit facilities. Due to the allowable time required to complete our assessment, the valuation of certain acquired assets and liabilities, including environmental liabilities and taxes, is currently pending. This acquisition was not material to our Consolidated Financial Statements.
In December 2016, we announced our agreement to acquire Hanita Coatings, a pressure-sensitive manufacturer of specialty films and laminates, from Kibbutz Hanita Coatings and Tene Investment Funds for a purchase price of $75 million, subject to customary adjustments. We expect to complete this acquisition in the first quarter of 2017.
In February 2017, we announced our agreement to acquire Yongle Tape Company Ltd. ("Yongle Tape"), a manufacturer of specialty tapes and related products used in a variety of industrial markets, from Yongle Tape's management and ShawKwei & Partners. The purchase price is $190 million, which is subject to customary adjustments, with an additional earn-out opportunity of up to $55 million to be paid based on the acquired business' achievement of certain performance targets over the next two years. We expect to complete this acquisition in mid-2017.
We expect to fund the acquisitions of Hanita Coatings and Yongle Tape with cash and credit facilities available at the time of closing.
| 5 Avery Dennison Corporation 2016 Annual Report | | |
Management's Discussion and Analysis of Financial Condition and Results of Operations
Free Cash Flow
| (In millions) |
2016 |
2015 |
2014 |
|||||||
|---|---|---|---|---|---|---|---|---|---|---|
| | | | | | | | | | | |
Net cash provided by operating activities |
$ | 585.3 | $ | 473.7 | $ | 354.9 | ||||
Purchases of property, plant and equipment |
(176.9 | ) | (135.8 | ) | (147.9 | ) | ||||
Purchases of software and other deferred charges |
(29.7 | ) | (15.7 | ) | (27.1 | ) | ||||
Proceeds from sales of property, plant and equipment |
8.5 | 7.6 | 4.3 | |||||||
(Purchases) sales of investments, net |
(.1 | ) | (.5 | ) | .3 | |||||
Plus: free cash outflow from discontinued operations |
– | .1 | .2 | |||||||
| | | | | | | | | | | |
Free cash flow |
$ | 387.1 | $ | 329.4 | $ | 184.7 | ||||
| | | | | | | | | | | |
In 2016, free cash flow increased compared to 2015 primarily due to higher net income, lower severance payments, benefits from changes in operational working capital, and lower income tax payments, net of refunds, partially offset by higher capital and software expenditures, higher incentive compensation paid in 2016 for the 2015 performance year, and higher pension plan contributions.
In 2015, free cash flow increased compared to 2014 primarily due to the timing of vendor payments, higher operating income, lower incentive compensation paid in 2015 for the 2014 performance year, and lower capital and software expenditures, partially offset by the timing of collections from customers and higher payments for taxes.
See "Analysis of Results of Operations" and "Liquidity" for more information.
Outlook
Certain factors that we believe may contribute to our 2017 results, including acquisitions announced in 2016, are described below:
- •
- We expect net sales to increase by 1.5% to 3.5%.
- •
- Assuming the continuation of currency rates in effect during January 2017, we expect currency translation to reduce pre-tax operating income by approximately $22 million.
- •
- We expect our full year effective tax rate to be in the low-thirty percent range.
- •
- We anticipate capital and software expenditures of approximately $215 million.
- •
- We estimate cash restructuring costs of approximately $25 million in 2017.
ANALYSIS OF RESULTS OF OPERATIONS
Income from Continuing Operations before Taxes
| (In millions, except percentages) |
2016 |
2015 |
2014 |
|||||||
|---|---|---|---|---|---|---|---|---|---|---|
| | | | | | | | | | | |
Net sales |
$ | 6,086.5 | $ | 5,966.9 | $ | 6,330.3 | ||||
Cost of products sold |
4,386.8 | 4,321.1 | 4,679.1 | |||||||
| | | | | | | | | | | |
Gross profit |
1,699.7 | 1,645.8 | 1,651.2 | |||||||
Marketing, general and administrative expense |
1,097.5 | 1,108.1 | 1,158.9 | |||||||
Interest expense |
59.9 | 60.5 | 63.3 | |||||||
Other expense, net |
65.2 | 68.3 | 68.2 | |||||||
| | | | | | | | | | | |
Income from continuing operations before taxes |
$ | 477.1 | $ | 408.9 | $ | 360.8 | ||||
| | | | | | | | | | | |
Gross profit margin |
27.9 |
% |
27.6 |
% |
26.1 |
% |
||||
| | | | | | | | | | | |
Gross Profit Margin
Gross profit margin in 2016 improved compared to 2015 primarily reflecting benefits from productivity initiatives, including savings from restructuring, net of transition costs, and higher volume, and partially offset by higher employee-related costs, the net impact of pricing and raw material input costs, and unfavorable geographic mix.
Gross profit margin in 2015 improved compared to 2014 primarily reflecting benefits from productivity initiatives, including savings from restructuring, net of transition costs, higher volume, the impact of changes in foreign currency rates, and the net impact of pricing and raw material input costs, partially offset by higher employee-related costs and changes in product mix in our Retail Branding and Information Solutions ("RBIS") reportable segment.
Marketing, General and Administrative Expense
Marketing, general and administrative expense decreased in 2016 compared to 2015 reflecting benefits from productivity initiatives, including savings from restructuring, net of transition costs, and the favorable impact of foreign currency translation, partially offset by higher employee-related costs.
Marketing, general and administrative expense decreased in 2015 compared to 2014 reflecting the impact of currency and benefits from productivity initiatives, including savings from restructuring, net of transition costs, partially offset by higher employee-related costs.
Interest Expense
Interest expense in 2016 was comparable to 2015.
Interest expense decreased approximately $3 million in 2015 compared to 2014 reflecting a decrease in foreign short-term debt, the extra week in our 2014 fiscal year, and the maturity of a series of our medium-term notes, partially offset by an increase in commercial paper borrowings.
| | | 6 |
Management's Discussion and Analysis of Financial Condition and Results of Operations
Other Expense, net
| (In millions) |
2016 |
2015 |
2014 |
|||||||
|---|---|---|---|---|---|---|---|---|---|---|
| | | | | | | | | | | |
Other expense, net by type |
||||||||||
Restructuring charges: |
||||||||||
Severance and related costs |
$ | 14.7 | $ | 52.5 | $ | 54.7 | ||||
Asset impairment charges and lease and other contract cancellation costs |
5.2 | 7.0 | 11.4 | |||||||
Other items: |
||||||||||
Net loss from curtailment and settlement of pension obligations |
41.4 | .3 | 1.6 | |||||||
Net gains on sales of assets |
(1.1 | ) | (1.7 | ) | (2.5 | ) | ||||
Transaction costs |
5.0 | – | – | |||||||
Legal settlements |
– | (.3 | ) | – | ||||||
Loss on sale of a product line and related exit costs |
– | 10.5 | – | |||||||
Indefinite-lived intangible asset impairment charge |
– | – | 3.0 | |||||||
| | | | | | | | | | | |
Other expense, net |
$ | 65.2 | $ | 68.3 | $ | 68.2 | ||||
| | | | | | | | | | | |
Refer to Note 13, "Cost Reduction Actions," to the Consolidated Financial Statements for more information regarding charges associated with restructuring.
Refer to Note 6, "Pension and Other Postretirement Benefits," to the Consolidated Financial Statements for more information regarding the net loss from curtailment and settlement of pension obligations.
Net Income and Earnings per Share
| (In millions, except percentages and per share amounts) |
2016 |
2015 |
2014 |
|||||||
|---|---|---|---|---|---|---|---|---|---|---|
| | | | | | | | | | | |
Income from continuing operations before taxes |
$ | 477.1 | $ | 408.9 | $ | 360.8 | ||||
Provision for income taxes |
156.4 | 134.5 | 113.5 | |||||||
| | | | | | | | | | | |
Income from continuing operations |
320.7 | 274.4 | 247.3 | |||||||
Loss from discontinued operations, net of tax |
– | (.1 | ) | (2.2 | ) | |||||
| | | | | | | | | | | |
Net income |
$ | 320.7 | $ | 274.3 | $ | 245.1 | ||||
| | | | | | | | | | | |
Net income per common share |
$ | 3.60 | $ | 3.01 | $ | 2.61 | ||||
Net income per common share, assuming dilution |
3.54 | 2.95 | 2.56 | |||||||
| | | | | | | | | | | |
Effective tax rate for continuing operations |
32.8 |
% |
32.9 |
% |
31.5 |
% |
||||
| | | | | | | | | | | |
Provision for Income Taxes
The 2016 effective tax rate for continuing operations included a tax expense of $7.6 million associated with the cost to repatriate non-permanently reinvested current earnings of certain foreign subsidiaries and a tax expense of $46.3 million related to the U.S. income and foreign withholding taxes resulting from changes in indefinite reinvestment assertions on certain foreign earnings; benefits from changes in certain tax reserves, including interest and penalties, of $16.8 million resulting from settlements of certain foreign audits and $5.4 million resulting from expirations of statutes of limitations; benefits of $6.7 million from the release of valuation allowances against certain deferred tax assets in a foreign jurisdiction associated with a structural simplification approved by the tax authority and $3.6 million from the release of valuation allowances on certain state deferred tax assets; and a tax expense of $8.4 million from deferred tax adjustments resulting from enacted tax rate changes in certain foreign jurisdictions.
We assess the available positive and negative evidence to estimate if sufficient future taxable income will be generated to use existing deferred tax assets. On the basis of this evaluation, we record valuation allowances only with respect to the portion of the deferred tax asset that is more likely than not to be realized. However, the amount of the deferred tax asset considered realizable could be adjusted if estimates of future taxable income during the carryforward period changes or if objective negative evidence in the form of cumulative losses is no longer present. For example, if our U.S. profitability improves at a higher-than-expected rate, it is possible that the remaining valuation allowances on state deferred tax assets could be subject to further releases.
In connection with our initiatives to simplify our corporate legal entity and intercompany financing structures, we evaluated the facts and circumstances surrounding the indefinite reinvestment assertions on certain foreign earnings that would be affected as a result of our actions to improve structural and operational efficiency. Our evaluation considered working capital, long-term liquidity, capitalization improvement, acquisition plans, and alignment of the existing structure with long-term strategic plans. As a result of this evaluation, we determined that the excess of the amount for financial reporting over the tax basis of investments in certain foreign subsidiaries is subject to reversal in the foreseeable future. As a result, we recorded a tax provision for the effects of changes in indefinite reinvestment assertions in 2016.
The 2015 effective tax rate for continuing operations included a tax expense of $20 million associated with the tax cost to repatriate non-permanently reinvested 2015 earnings of certain foreign subsidiaries; benefits from changes in certain tax reserves, including interest and penalties, of $5.8 million resulting from settlements of audits and $8.2 million resulting from expirations of statutes of limitations; and a tax benefit of $2.6 million from the extension of the federal research and development credit.
The 2014 effective tax rate for continuing operations included tax benefits for changes in certain tax reserves, including interest and penalties, of $10.2 million resulting from settlements of audits and $18.1 million resulting from expirations of statutes of limitations; a repatriation tax benefit of $9.8 million related to certain foreign losses; a tax expense of $9.1 million from the taxable inclusion of a net foreign currency gain related to the revaluation of certain intercompany loans; a tax expense of $10.6 million related to our change in estimate of the potential outcome of uncertain tax issues in China and Germany; and a state tax expense of $2.5 million primarily related to gains arising as a result of certain foreign reorganizations.
On December 18, 2015, the Protecting Americans from Tax Hikes Act of 2015 ("PATH Act") was enacted, which included a provision making permanent the federal research and development tax credit for the tax years 2015 and beyond. The PATH Act also retroactively extended the controlled foreign corporation ("CFC") look-through rule that had expired on December 31, 2014. For periods during which the look-through rule was effective, U.S. federal income tax on certain dividends, interest, rents, and royalties received or accrued by a CFC of a U.S. multinational enterprise from a related CFC are deferred. The
| 7 Avery Dennison Corporation 2016 Annual Report | | |
Management's Discussion and Analysis of Financial Condition and Results of Operations
retroactive effects of the extension of the CFC look-through rule did not have a material impact on our effective tax rate or operating results. The extension of the CFC look-through rule is currently scheduled to expire on December 31, 2019.
Due to recent changes in the U.S. government, U.S. tax reform may be enacted in the near future. Significant changes that could occur include a reduction of the corporate income tax rate, a one-time deemed repatriation of untaxed foreign earnings, border adjustability, territoriality, and various increases to the tax base. Due to the lack of clarity regarding if, how, and when any such tax reform will be enacted, the potential impact of U.S. tax reform is unclear. We continue to closely monitor these developments.
Refer to Note 14, "Taxes Based on Income," to the Consolidated Financial Statements for more information.
RESULTS OF OPERATIONS BY REPORTABLE SEGMENT
Operating income refers to income from continuing operations before interest and taxes.
Label and Graphic Materials
| (In millions) |
2016 |
2015 |
2014 |
|||||||
|---|---|---|---|---|---|---|---|---|---|---|
| | | | | | | | | | | |
Net sales including intersegment sales |
$ | 4,250.7 | $ | 4,093.4 | $ | 4,362.9 | ||||
Less intersegment sales |
(63.4 | ) | (61.3 | ) | (64.2 | ) | ||||
| | | | | | | | | | | |
Net sales |
$ | 4,187.3 | $ | 4,032.1 | $ | 4,298.7 | ||||
Operating income (1) |
516.2 | 453.4 | 396.9 | |||||||
| | | | | | | | | | | |
(1) Included charges associated with restructuring in all years, transaction costs in 2016, gain on sale of asset in 2015, and losses from curtailment and settlement of pension obligations in 2015 and 2014. |
$ | 13.0 | $ | 12.1 | $ | 41.5 | ||||
| | | | | | | | | | | |
Net Sales
The factors impacting the reported sales change are shown in the table below:
| |
2016 |
2015 |
|||||
|---|---|---|---|---|---|---|---|
| | | | | | | | |
Reported sales change |
4 | % | (6 | )% | |||
Foreign currency translation |
3 | 10 | |||||
Acquisitions |
(1 | ) | – | ||||
Extra week in 2014 fiscal year |
– | 1 | |||||
| | | | | | | | |
Organic sales change (1) |
5 | % | 5 | % | |||
| | | | | | | | |
- (1)
- Totals may not sum due to rounding.
In both years, net sales increased on an organic basis primarily due to higher volume.
In 2016, net sales increased on an organic basis at a low-teen digit rate in emerging markets, at a mid-single digit rate in Western Europe, and at a low-single digit rate in North America.
In 2015, net sales increased on an organic basis at mid-single digit rates in both Western Europe and emerging markets and at a low-single digit rate in North America.
Operating Income
Operating income increased in 2016 compared to 2015 due to higher volume and benefits from productivity initiatives, including savings from restructuring, net of transition costs, partially offset by the net impact of pricing and raw material input costs, unfavorable geographic mix, the unfavorable impact of foreign currency translation, and higher employee-related costs.
Operating income increased in 2015 compared to 2014 due to benefits from productivity initiatives, including savings from restructuring, net of transition costs, higher volume, lower restructuring charges, and the net impact of pricing and raw material input costs, partially offset by higher employee-related costs and the unfavorable impact of foreign currency translation.
Retail Branding and Information Solutions
| (In millions) |
2016 |
2015 |
2014 |
|||||||
|---|---|---|---|---|---|---|---|---|---|---|
| | | | | | | | | | | |
Net sales including intersegment sales |
$ | 1,448.3 | $ | 1,446.3 | $ | 1,518.5 | ||||
Less intersegment sales |
(2.9 | ) | (2.9 | ) | (2.5 | ) | ||||
| | | | | | | | | | | |
Net sales |
$ | 1,445.4 | $ | 1,443.4 | $ | 1,516.0 | ||||
Operating income (1) |
102.6 | 51.6 | 68.5 | |||||||
| | | | | | | | | | | |
(1) Included charges associated with restructuring in all years, loss on sale of a product line and related transaction and exit costs in 2016 and 2015, gains on sales of assets in 2016 and 2014, legal settlement in 2015, indefinite-lived intangible asset impairment charge in 2014, and loss from settlement of pension obligation in 2014. |
$ | 9.8 | $ | 45.7 | $ | 22.0 | ||||
| | | | | | | | | | | |
Net Sales
The factors impacting the reported sales change are shown in the table below:
| |
2016 |
2015 |
|||||
|---|---|---|---|---|---|---|---|
| | | | | | | | |
Reported sales change |
– | % | (5 | )% | |||
Foreign currency translation |
2 | 4 | |||||
Product line divestiture |
2 | 2 | |||||
Extra week in 2014 fiscal year |
– | 1 | |||||
| | | | | | | | |
Organic sales change (1) |
3 | % | 3 | % | |||
| | | | | | | | |
- (1)
- Totals may not sum due to rounding.
In 2016, net sales increased on an organic basis primarily due to higher volume from sales of radio-frequency identification products.
In 2015, net sales increased on an organic basis primarily due to higher volume.
Operating Income
Operating income increased in 2016 compared to 2015 due to higher volume, lower restructuring charges, benefits from productivity initiatives, including savings from restructuring, net of transition costs, and the loss on sale of a product line and related transaction and exit costs in the prior year, partially offset by higher employee-related costs and the impact of strategic pricing actions.
Operating income decreased in 2015 compared to 2014 due to higher employee-related costs, higher restructuring charges, the impact of strategic pricing actions, and the loss on sale of a product line and related exit costs, partially offset by benefits from productivity initiatives, including savings from restructuring, net of transition costs, as well as higher volume.
| | | 8 |
Management's Discussion and Analysis of Financial Condition and Results of Operations
Industrial and Healthcare Materials
| (In millions) |
2016 |
2015 |
2014 |
|||||||
|---|---|---|---|---|---|---|---|---|---|---|
| | | | | | | | | | | |
Net sales including intersegment sales |
$ | 461.0 | $ | 506.2 | $ | 534.7 | ||||
Less intersegment sales |
(7.2 | ) | (14.8 | ) | (19.1 | ) | ||||
| | | | | | | | | | | |
Net sales |
$ | 453.8 | $ | 491.4 | $ | 515.6 | ||||
Operating income (1) |
54.6 | 57.1 | 45.2 | |||||||
| | | | | | | | | | | |
(1) Included charges associated with restructuring in all years and transaction costs in 2016. |
$ | 1.9 | $ | 8.0 | $ | 4.3 | ||||
| | | | | | | | | | | |
Net Sales
The factors impacting the reported sales change are shown in the table below:
| |
2016 |
2015 |
|||||
|---|---|---|---|---|---|---|---|
| | | | | | | | |
Reported sales change |
(8 | )% | (5 | )% | |||
Foreign currency translation |
2 | 9 | |||||
Acquisition |
(2 | ) | – | ||||
Extra week in 2014 fiscal year |
– | 1 | |||||
| | | | | | | | |
Organic sales change |
(8 | )% | 5 | % | |||
| | | | | | | | |
In 2016, net sales decreased on an organic basis primarily due to lower volume in the Performance Tapes product group. Net sales decreased on an organic basis at a high-single digit rate for the Performance Tapes product group primarily due to a personal care program loss.
In 2015, net sales increased on an organic basis primarily due to higher volume. Net sales increased on an organic basis at a mid-teen digit rate for the Performance Tapes product group.
Operating Income
Operating income decreased in 2016 compared to 2015 primarily due to lower volume, partially offset by benefits from productivity initiatives, including savings from restructuring, net of transition costs, and lower restructuring charges.
Operating income increased in 2015 compared to 2014 primarily due to benefits from productivity initiatives, including savings from restructuring, net of transition costs, the net impact of pricing and raw material input costs, and higher volume, partially offset by the impact of unfavorable product mix and higher restructuring charges.
Liquidity
Operating Activities
| (In millions) |
2016 |
2015 |
2014 |
|||||||
|---|---|---|---|---|---|---|---|---|---|---|
| | | | | | | | | | | |
Net income |
$ | 320.7 | $ | 274.3 | $ | 245.1 | ||||
Depreciation and amortization |
180.1 | 188.3 | 201.6 | |||||||
Provision for doubtful accounts and sales returns |
54.4 | 46.5 | 45.2 | |||||||
Loss on sale of businesses |
– | – | 3.4 | |||||||
Indefinite-lived intangible asset impairment charge |
– | – | 3.0 | |||||||
Net losses from asset impairments and sales/disposals of assets |
1.5 | 12.2 | 10.2 | |||||||
Stock-based compensation |
27.2 | 26.3 | 28.3 | |||||||
Loss from settlement of pension obligations |
41.4 | – | – | |||||||
Other non-cash expense and loss |
46.2 | 50.1 | 44.2 | |||||||
Trade accounts receivable |
(88.2 | ) | (135.9 | ) | (65.4 | ) | ||||
Inventories |
(19.6 | ) | (34.4 | ) | (33.0 | ) | ||||
Other current assets |
(7.6 | ) | 3.9 | (33.7 | ) | |||||
Accounts payable |
31.6 | 65.5 | (62.8 | ) | ||||||
Accrued liabilities |
32.4 | 7.0 | (18.2 | ) | ||||||
Income taxes (deferred and accrued) |
38.2 | (10.8 | ) | (2.6 | ) | |||||
Other assets |
(1.2 | ) | (.3 | ) | (3.5 | ) | ||||
Long-term retirement benefits and other liabilities |
(71.8 | ) | (19.0 | ) | (6.9 | ) | ||||
| | | | | | | | | | | |
Net cash provided by operating activities |
$ | 585.3 | $ | 473.7 | $ | 354.9 | ||||
| | | | | | | | | | | |
For cash flow purposes, changes in assets and liabilities and other adjustments exclude the impact of foreign currency translation (discussed below in "Analysis of Selected Balance Sheet Accounts").
In 2016, cash flow provided by operating activities increased compared to 2015 due to higher net income, lower severance payments, benefits from changes in operational working capital, and lower income tax payments, net of refunds, partially offset by higher incentive compensation paid in 2016 for the 2015 performance year and higher pension contributions.
In 2015, cash flow provided by operating activities increased compared to 2014 due to the timing of vendor payments, higher net income and lower incentive compensation paid in 2015 for the 2014 performance year, partially offset by the timing of collections from customers and higher payments for taxes.
| 9 Avery Dennison Corporation 2016 Annual Report | | |
Management's Discussion and Analysis of Financial Condition and Results of Operations
Investing Activities
| (In millions) |
2016 |
2015 |
2014 |
|||||||
|---|---|---|---|---|---|---|---|---|---|---|
| | | | | | | | | | | |
Purchases of property, plant and equipment |
$ | (176.9 | ) | $ | (135.8 | ) | $ | (147.9 | ) | |
Purchases of software and other deferred charges |
(29.7 | ) | (15.7 | ) | (27.1 | ) | ||||
Proceeds from sales of property, plant and equipment |
8.5 | 7.6 | 4.3 | |||||||
(Purchases) sales of investments, net |
(.1 | ) | (.5 | ) | .3 | |||||
Payments for acquisitions and equity method investments, net of cash acquired |
(237.2 | ) | – | – | ||||||
Other |
– | 1.5 | – | |||||||
| | | | | | | | | | | |
Net cash used in investing activities |
$ | (435.4 | ) | $ | (142.9 | ) | $ | (170.4 | ) | |
| | | | | | | | | | | |
Capital and Software Spending
In 2016, we invested in new equipment to support growth in Asia, North America, and Europe and to improve manufacturing productivity. In 2015 and 2014, we invested in new equipment to support growth, primarily in Asia and Europe, and to improve manufacturing productivity.
Information technology investments in 2016 and 2015 were primarily associated with standardization initiatives in Asia and North America. Information technology investments in 2014 were primarily associated with standardization initiatives in Europe and North America.
Payments for Acquisitions and Equity Method Investments, Net of Cash Acquired
In connection with the Mactac acquisition, we paid consideration, net of cash received, of approximately $220 million, which we funded primarily through existing credit facilities. We also made payments for a small acquisition and an investment accounted for using the equity method.
Refer to Note 2, "Acquisitions," to the Consolidated Financial Statements for more information.
Other
In May 2015, we received $1.5 million from the sale of a product line in our RBIS reportable segment.
Financing Activities
| (In millions) |
2016 |
2015 |
2014 |
|||||||
|---|---|---|---|---|---|---|---|---|---|---|
| | | | | | | | | | | |
Net change in borrowings and repayments of debt |
$ | 232.2 | $ | (105.8 | ) | $ | 124.9 | |||
Dividends paid |
(142.5 | ) | (133.1 | ) | (125.1 | ) | ||||
Share repurchases |
(262.4 | ) | (232.3 | ) | (355.5 | ) | ||||
Proceeds from exercises of stock options, net |
71.0 | 104.0 | 34.2 | |||||||
Other |
(4.5 | ) | (.1 | ) | (2.0 | ) | ||||
| | | | | | | | | | | |
Net cash used in financing activities |
$ | (106.2 | ) | $ | (367.3 | ) | $ | (323.5 | ) | |
| | | | | | | | | | | |
Borrowings and Repayment of Debt
In March 2016, we entered into an agreement to establish a Euro-Commercial Paper Program pursuant to which we may issue unsecured commercial paper notes up to a maximum aggregate amount outstanding of $500 million. Proceeds from issuances under this program may be used for general corporate purposes. The maturities of the notes may vary, but may not exceed 364 days from the date of issuance. Our payment obligations with respect to any notes issued under this program are backed by our revolving credit facility (the "Revolver"). There are no financial covenants under this program. As of December 31, 2016, $209 million was outstanding under this program.
In 2016, our commercial paper borrowings were used primarily to fund share repurchase activity, the Mactac acquisition, capital expenditures, and dividend payments. In 2015, our U.S. commercial paper borrowings were used primarily to fund share repurchase activity, dividend payments, and capital and software expenditures.
Refer to Note 2, "Acquisitions," and Note 4, "Debt and Capital Leases," to the Consolidated Financial Statements for more information.
Refer to "Capital Resources" below for further information on 2016 and 2015 borrowings and repayment of debt.
Dividend Payments
We paid dividends of $1.60 per share in 2016 compared to $1.46 per share in 2015. In April 2016, we increased our quarterly dividend to $.41 per share, representing an 11% increase from our previous dividend rate of $.37 per share.
Share Repurchases
From time to time, our Board of Directors ("Board") authorizes the repurchase of shares of our outstanding common stock. Repurchased shares may be reissued under our stock option and incentive plan or used for other corporate purposes. In 2016, we repurchased approximately 3.8 million shares of our common stock at an aggregate cost of $262.4 million. In 2015, we repurchased approximately 3.9 million shares of our common stock at an aggregate cost of $232.3 million.
On December 4, 2014, our Board authorized the repurchase of shares of our common stock in the aggregate amount of up to $500 million (exclusive of any fees, commissions or other expenses related to such purchases), in addition to any outstanding shares authorized under any previous Board authorization. This authorization is the only one currently in effect and it will remain in effect until shares in the amount authorized have been repurchased. As of December 31, 2016, shares of our common stock in the aggregate amount of approximately $105 million remained authorized for repurchase under this Board authorization.
Proceeds from Exercises of Stock Options, net
The number of stock options exercised was approximately 1.4 million, 2.5 million, and 1 million in 2016, 2015, and 2014, respectively. Refer to Note 12, "Long-Term Incentive Compensation," to the Consolidated Financial Statements for more information.
Analysis of Selected Balance Sheet Accounts
Long-lived Assets
Goodwill increased by approximately $107 million to $794 million at year-end 2016, which primarily reflected the preliminary valuation of goodwill associated with the Mactac acquisition, partially offset by the impact of foreign currency translation.
Other intangibles resulting from business acquisitions, net, increased by approximately $21 million to $67 million at year-end 2016,
| | | 10 |
Management's Discussion and Analysis of Financial Condition and Results of Operations
which primarily reflected the valuation of other intangibles resulting from the Mactac acquisition, partially offset by current year amortization expense and the impact of foreign currency translation.
Refer to Note 3, "Goodwill and Other Intangibles Resulting from Business Acquisitions," to the Consolidated Financial Statements for more information.
Other assets decreased by approximately $3 million to $403 million at year-end 2016, which primarily reflected amortization expense related to software and other deferred charges, net of purchases, and the impact of foreign currency translation, partially offset by an increase in the cash surrender value of our corporate-owned life insurance policies.
Shareholders' Equity Accounts
The balance of our shareholders' equity decreased by approximately $40 million to $926 million at year-end 2016, which reflected the effect of share repurchases, dividend payments, and the net increase in "Accumulated other comprehensive loss." These decreases were partially offset by net income and the use of treasury shares to settle exercises of stock options and vesting of stock-based awards and fund contributions to our U.S. defined contribution plan.
The balance of our treasury stock increased by approximately $185 million to $1.77 billion at year-end 2016, which primarily reflected share repurchase activity, partially offset by the use of treasury shares to settle exercises of stock options and vesting of stock-based awards and fund contributions to our U.S. defined contribution plan.
Accumulated other comprehensive loss increased by approximately $69 million to $752 million at year-end 2016 primarily due to net actuarial losses in our pension and other postretirement plans as a result of lower discount rates and the unfavorable impact of foreign currency translation, partially offset by the effect of certain pension settlements related to our U.S. pension plan.
Refer to Note 6, "Pension and other postretirement benefits," to the Consolidated Financial Statements for more information.
Impact of Foreign Currency Translation
| (In millions) |
2016 |
2015 |
|||||
|---|---|---|---|---|---|---|---|
| | | | | | | | |
Change in net sales |
$ | (147 | ) | $ | (528 | ) | |
Change in net income from continuing operations |
(12 | ) | (34 | ) | |||
| | | | | | | | |
In 2016, international operations generated approximately 75% of our net sales. Our future results are subject to changes in political and economic conditions in the regions in which we operate and the impact of fluctuations in foreign currency exchange and interest rates.
The unfavorable impact of foreign currency translation on net sales in 2016 compared to 2015 was primarily related to sales in China and Argentina, as well as euro-denominated sales.
Operations are treated as being in a hyperinflationary economy based on the cumulative inflation rate over the past three years. We had no operations in hyperinflationary economies in fiscal years 2016, 2015, or 2014.
Effect of Foreign Currency Transactions
The impact on net income from transactions denominated in foreign currencies is largely mitigated because the costs of our products are generally denominated in the same currencies in which they are sold. In addition, to reduce our income and cash flow exposure to transactions in foreign currencies, we enter into foreign exchange forward, option and swap contracts where available and appropriate.
Analysis of Selected Financial Ratios
We utilize the financial ratios discussed below to assess our financial condition and operating performance.
Working Capital (Deficit) and Operational Working Capital Ratios
Working capital (deficit) (current assets minus current liabilities), as a percentage of net sales, was (1.6)% in 2016 compared to 5.3% in 2015 primarily driven by an increase in short-term debt associated with the reclassification of senior notes due on October 1, 2017 to the current portion of long-term debt and an increase in commercial paper borrowings to fund the Mactac acquisition, partially offset by increases in inventory, trade accounts receivable, and cash and cash equivalents.
Operational working capital, as a percentage of net sales, is reconciled with working capital (deficit) below. Our objective is to minimize our investment in operational working capital, as a percentage of sales, to maximize our cash flow and return on investment.
| (In millions, except percentages) |
2016 |
2015 |
|||||
|---|---|---|---|---|---|---|---|
| | | | | | | | |
(A) Working capital (deficit) |
$ | (99.5 | ) | $ | 316.3 | ||
Reconciling items: |
|||||||
Cash and cash equivalents |
(195.1 | ) | (158.8 | ) | |||
Current refundable income taxes and other current assets |
(182.8 | ) | (170.7 | ) | |||
Assets held for sale |
(6.8 | ) | (2.5 | ) | |||
Short-term borrowings and current portion of long-term debt and capital leases |
579.1 | 95.3 | |||||
Current income taxes payable and other current accrued liabilities |
583.3 | 549.2 | |||||
| | | | | | | | |
(B) Operational working capital |
$ | 678.2 | $ | 628.8 | |||
| | | | | | | | |
(C) Net sales |
$ | 6,086.5 | $ | 5,966.9 | |||
| | | | | | | | |
Working capital (deficit), as a percentage of net sales (A) ÷ (C) |
(1.6 | )% | 5.3 | % | |||
| | | | | | | | |
Operational working capital, as a percentage of net sales (B) ÷ (C) |
11.1 | % | 10.5 | % | |||
| | | | | | | | |
Accounts Receivable Ratio
The average number of days sales outstanding was 62 days in 2016 compared to 60 days in 2015, calculated using the four-quarter average accounts receivable balance divided by the average daily sales in 2016 and 2015, respectively. The increase in the average number of days sales outstanding from the prior year reflected the timing of collections, partially offset by the impact of increased accounts receivable reserves.
Inventory Ratio
Average inventory turnover was 8.2 in 2016 compared to 8.6 in 2015, calculated using the annual cost of sales in 2016 and 2015, respectively, divided by the four-quarter average inventory balance. The decrease in the current year average inventory turnover primarily reflected the timing of inventory purchases.
Accounts Payable Ratio
The average number of days payable outstanding was 71 days in 2016 compared to 70 days in 2015, calculated using the four-quarter average accounts payable balance divided by the average daily cost of products sold in 2016 and 2015, respectively. The increase in average
| 11 Avery Dennison Corporation 2016 Annual Report | | |
Management's Discussion and Analysis of Financial Condition and Results of Operations
number of days payable outstanding from the prior year primarily reflected the timing of vendor payments and the impact of foreign currency translation.
Net Debt to EBITDA Ratio
| (In millions, except ratios) |
2016 |
2015 |
2014 |
|||||||
|---|---|---|---|---|---|---|---|---|---|---|
| | | | | | | | | | | |
Net income |
$ | 320.7 | $ | 274.3 | $ | 245.1 | ||||
Reconciling items: |
||||||||||
Interest expense |
59.9 | 60.5 | 63.3 | |||||||
Provision for income taxes |
156.4 | 134.5 | 113.5 | |||||||
Depreciation |
117.5 | 125.2 | 135.5 | |||||||
Amortization |
62.5 | 62.9 | 65.9 | |||||||
| | | | | | | | | | | |
EBITDA |
$ | 717.0 | $ | 657.4 | $ | 623.3 | ||||
| | | | | | | | | | | |
Total debt and capital leases |
$ | 1,292.5 | $ | 1,058.9 | $ | 1,144.4 | ||||
Less cash and cash equivalents |
(195.1 | ) | (158.8 | ) | (207.2 | ) | ||||
| | | | | | | | | | | |
Net debt |
$ | 1,097.4 | $ | 900.1 | $ | 937.2 | ||||
| | | | | | | | | | | |
Net debt to EBITDA ratio |
1.5 | 1.4 | 1.5 | |||||||
| | | | | | | | | | | |
The net debt to EBITDA ratio was higher in 2016 compared to 2015 primarily due to higher net debt as a result of higher commercial paper borrowings primarily to fund the Mactac acquisition and share repurchase activity, partially offset by higher net income.
The net debt to EBITDA ratio was lower in 2015 compared to 2014 primarily due to higher net income and lower net debt as a result of lower commercial paper borrowings.
Financial Covenants
The Revolver contains financial covenants requiring that we maintain specified ratios of total debt and interest expense in relation to certain measures of income. As of December 31, 2016 and January 2, 2016, we were in compliance with our financial covenants.
Fair Value of Debt
The estimated fair value of our long-term debt is primarily based on the credit spread above U.S. Treasury securities on notes with similar rates, credit rating, and remaining maturities. The fair value of short-term borrowings, which includes commercial paper issuances and short-term lines of credit, approximates carrying value given the short duration of these obligations. The fair value of our total debt was $1.31 billion at December 31, 2016 and $1.08 billion at January 2, 2016. Fair value amounts were determined based primarily on Level 2 inputs. Refer to Note 1, "Summary of Significant Accounting Policies," to the Consolidated Financial Statements for more information.
Capital Resources
Capital resources include cash flows from operations, cash and cash equivalents and debt financing. At year-end 2016, we had cash and cash equivalents of $195.1 million held in accounts at third-party financial institutions.
Our cash balances are held in numerous locations throughout the world. At year-end 2016, the majority of our cash and cash equivalents was held by our foreign subsidiaries.
To meet U.S. cash requirements, we have several cost-effective liquidity options available. These options include borrowing funds at reasonable rates, including borrowings from foreign subsidiaries, and repatriating foreign earnings. However, if we were to repatriate incremental foreign earnings, we may be subject to additional taxes in the U.S.
In October 2014, we amended and restated the Revolver, increasing the amount available from certain domestic and foreign banks from $675 million to $700 million. The amendment also extended the Revolver's maturity date from December 22, 2016 to October 3, 2019 and adjusted pricing to reflect favorable market conditions. The maturity date may be extended for additional one-year periods under certain circumstances. The commitments under the Revolver may be increased by up to $325 million, subject to lender approval and customary requirements. The Revolver is used as a back-up facility for our commercial paper program and can be used to finance other corporate requirements.
No balances were outstanding under the Revolver as of year-end 2016 or 2015. Commitment fees associated with the Revolver in 2016, 2015, and 2014 were $1.1 million, $1.9 million, and $1.3 million, respectively.
In addition to the Revolver, we have significant short-term lines of credit available in various countries totaling approximately $300 million at December 31, 2016. These lines may be cancelled at any time by us or the issuing banks. Short-term borrowings outstanding under our lines of credit were $72.9 million and $65 million at December 31, 2016 and January 2, 2016, respectively, with a weighted-average interest rate of 6.5% and 8.7%, respectively.
In March 2016, we entered into an agreement to establish a Euro-Commercial Paper Program pursuant to which we may issue unsecured commercial paper notes up to a maximum aggregate amount outstanding of $500 million. Proceeds from issuances under this program may be used for general corporate purposes. The maturities of the notes may vary, but may not exceed 364 days from the date of issuance. Our payment obligations with respect to any notes issued under this program are backed by the Revolver. There are no financial covenants under this program. As of December 31, 2016, $209 million was outstanding under this program.
We had $44.5 million and $28 million of borrowings from U.S. commercial paper issuances outstanding at year-end 2016 and 2015, respectively, with a weighted-average interest rate of .9% and .7%, respectively.
We had medium-term notes of $45 million outstanding at each year-end 2016 and 2015. During the second quarter of 2015, we repaid $5 million of medium-term notes.
Refer to Note 4, "Debt and Capital Leases," to the Consolidated Financial Statements for more information.
We are exposed to financial market risk resulting from changes in interest and foreign currency rates, and to possible liquidity and credit risks of our counterparties.
Capital from Debt
Our total debt increased by approximately $234 million to $1.29 billion at year-end 2016 compared to $1.06 billion at year-end 2015, primarily reflecting an increase in commercial paper borrowings used to fund share repurchase activity, the Mactac acquisition, dividend payments, and capital expenditures, as well as an increase in short-term borrowings to support operational requirements. Refer to "Borrowings and Repayment of Debt" above for more information.
Credit ratings are a significant factor in our ability to raise short- and long-term financing. The credit ratings assigned to us also impact the interest rates paid and our access to commercial paper, credit facilities,
| | | 12 |
Management's Discussion and Analysis of Financial Condition and Results of Operations
and other borrowings. A downgrade of our short-term credit ratings could impact our ability to access the commercial paper markets. If our access to commercial paper markets were to become limited, the Revolver and our other credit facilities would be available to meet our short-term funding requirements, if necessary. When determining a credit rating, we believe that rating agencies primarily consider our competitive position, business outlook, consistency of cash flows, debt level and liquidity, geographic dispersion and management team. We remain committed to maintaining an investment grade rating.
During 2017, we are exploring the possible incurrence of long-term debt to refinance some of our outstanding commercial paper and other indebtedness and for general corporate purposes.
Contractual Obligations, Commitments and Off-Balance Sheet Arrangements
Contractual Obligations at End of Year 2016
| |
Payments Due by Period | |||||||||||||||||||||
|---|---|---|---|---|---|---|---|---|---|---|---|---|---|---|---|---|---|---|---|---|---|---|
| (In millions) |
Total |
2017 |
2018 |
2019 |
2020 |
2021 |
Thereafter |
|||||||||||||||
| | | | | | | | | | | | | | | | | | | | | | | |
Short-term borrowings |
$ | 326.3 | $ | 326.3 | $ | – | $ | – | $ | – | $ | – | $ | – | ||||||||
Long-term debt |
945.0 | 250.0 | – | – | 265.0 | – | 430.0 | |||||||||||||||
Payments related to long-term capital leases |
41.1 | 5.4 | 5.4 | 5.3 | 5.0 | 4.8 | 15.2 | |||||||||||||||
Interest on long-term debt |
276.6 | 46.6 | 34.2 | 34.2 | 24.0 | 19.6 | 118.0 | |||||||||||||||
Operating leases |
137.8 | 40.0 | 29.6 | 20.0 | 13.9 | 8.8 | 25.5 | |||||||||||||||
Pension and postretirement benefit payments (unfunded plans) |
126.2 | 16.0 | 36.1 | 10.6 | 9.2 | 9.8 | 44.5 | |||||||||||||||
| | | | | | | | | | | | | | | | | | | | | | | |
Total contractual obligations |
$ | 1,853.0 | $ | 684.3 | $ | 105.3 | $ | 70.1 | $ | 317.1 | $ | 43.0 | $ | 633.2 | ||||||||
| | | | | | | | | | | | | | | | | | | | | | | |
We enter into operating leases primarily for office and warehouse space and equipment for information technology, machinery, and transportation. The table above includes minimum annual rental commitments on operating leases having initial or remaining non-cancelable lease terms of one year or more.
The table above does not include:
- •
- Purchase obligations or open purchase orders at year-end – It is impracticable for us to obtain this information or provide a reasonable estimate thereof due to the decentralized nature of our purchasing systems. In addition, purchase orders are generally at fair value and cancelable without penalty.
- •
- Cash funding requirements for pension benefits payable to certain eligible current and future retirees under our funded plans – Benefits under our funded pension plans are paid through a trust or trust equivalent. Cash funding requirements for our funded plans, which can be significantly impacted by earnings on investments, the discount rate, changes in the plans, and funding laws and regulations, are not included as we are not able to estimate required contributions to the trust or trust equivalent. Refer to Note 6, "Pension and Other Postretirement Benefits," to the Consolidated Financial Statements for information regarding expected contributions to our plans.
- •
- Deferred compensation plan benefit payments – It is impracticable for us to obtain a reasonable estimate for 2017 and beyond due to the volatility of the payment amounts and certain events that could trigger immediate payment of benefits to participants. In addition, participant account balances are marked-to-market monthly and benefit payments are adjusted annually. Refer to Note 6, "Pension and Other Postretirement Benefits," to the Consolidated Financial Statements for more information.
- •
- Cash awards to employees under incentive compensation plans – The amounts to be paid to employees under these awards are based on our stock price and, if applicable, achievement of certain performance objectives as of the end of their respective performance periods, and, therefore, we cannot reasonably estimate the amounts to be paid on the vesting dates. Refer to Note 12, "Long-term Incentive Compensation," to the Consolidated Financial Statements for further information on cash awards.
- •
- Unfunded termination indemnity benefits to certain employees outside of the U.S. – These benefits are subject to applicable agreements, local laws and regulations. We have not incurred significant costs related to these arrangements.
- •
- Unrecognized tax benefit reserves of $89.5 million – The resolution of the balance, including the timing of payments, is contingent upon various unknown factors and cannot be reasonably estimated. Refer to Note 14, "Taxes Based on Income," to the Consolidated Financial Statements for further information on unrecognized tax benefits.
- •
- Acquisition-related obligations – Obligations related to recently announced acquisitions, including Hanita Coatings and Yongle Tape. These acquisitions are subject to customary regulatory approvals.
The preparation of financial statements in conformity with GAAP requires management to make estimates and assumptions for the reporting period and as of the financial statement date. These estimates and assumptions affect the reported amounts of assets and liabilities, the disclosure of contingent liabilities and the reported amounts of revenue and expense. Actual results could differ from those estimates.
Critical accounting estimates are those that are important to our financial condition and results, and which require us to make difficult, subjective and/or complex judgments. Critical accounting estimates cover accounting matters that are inherently uncertain because their future resolution is unknown. We believe our critical accounting estimates include accounting for goodwill, pension and postretirement benefits, taxes based on income, long-term incentive compensation, litigation matters, and environmental expenditures.
| 13 Avery Dennison Corporation 2016 Annual Report | | |
Management's Discussion and Analysis of Financial Condition and Results of Operations
Goodwill
Our reporting units are composed of either a discrete business or an aggregation of businesses with similar economic characteristics. We have the following reporting units: materials; retail branding and information solutions; reflective solutions; performance tapes; fastener solutions; adhesives; and medical solutions. In performing the required impairment tests, we primarily apply a present value (discounted cash flow) method to determine the fair value of the reporting units with goodwill. We perform our annual impairment test of goodwill during the fourth quarter.
Certain factors may result in the need to perform an impairment test prior to the fourth quarter, including significant underperformance of a business relative to expected operating results, significant adverse economic and industry trends, significant decline in our market capitalization for an extended period of time relative to net book value, or a decision to divest a portion of a reporting unit.
We determine goodwill impairment using a two-step process. The first step is to identify if a potential impairment exists by comparing the fair value of a reporting unit with its carrying amount, including goodwill. If the fair value of a reporting unit exceeds its carrying amount, goodwill of the reporting unit is not considered to have a potential impairment and the second step of the impairment test is not necessary. However, if the carrying amount of a reporting unit exceeds its fair value, the second step is performed to determine if goodwill is impaired and to measure the amount of impairment loss to recognize, if any.
The second step, if necessary, compares the implied fair value of goodwill with the carrying amount of goodwill. If the implied fair value of goodwill exceeds the carrying amount, then goodwill is not considered impaired. However, if the carrying amount of goodwill exceeds the implied fair value, an impairment loss is recognized in an amount equal to that excess.
In consultation with outside specialists, we estimate the fair value of our reporting units using various valuation techniques, with the primary technique being a discounted cash flow analysis. A discounted cash flow analysis requires us to make various assumptions about the reporting units, including sales, operating margins, growth rates, and discount rates. Assumptions about discount rates are based on a weighted-average cost of capital for comparable companies. Assumptions about sales, operating margins, and growth rates are based on our forecasts, business plans, economic projections, anticipated future cash flows and marketplace data. Assumptions are also made for varying perpetual growth rates for periods beyond the long-term business plan period. We base our fair value estimates on projected financial information and assumptions that we believe are reasonable. However, actual future results may differ from those estimates and projections, and those differences may be material. The valuation methodology used to estimate the fair value of reporting units requires inputs and assumptions that reflect current market conditions, as well as the impact of planned business and operational strategies that require management judgment. The estimated fair value could increase or decrease depending on changes in the inputs and assumptions. Our annual first step impairment analysis in the fourth quarter of 2016 indicated that the fair values of our reporting units exceeded their respective carrying amounts, including goodwill. The fair value of the reporting units tested exceeded their carrying amounts by 79% to 442%.
Pension and Postretirement Benefits
Assumptions used in determining projected benefit obligations and the fair value of plan assets for our defined benefit pension plans and other postretirement benefit plans are evaluated by management in consultation with outside actuaries. In the event that we determine that changes are warranted in the assumptions used, such as the discount rate, expected long-term rate of return, or health care costs, future pension and postretirement benefit expenses could increase or decrease. Due to changes in market conditions or participant population, the actuarial assumptions that we use may differ from actual results, which could have a significant impact on our pension and postretirement liability and related cost.
Discount Rate
In consultation with our actuaries, we annually review and determine the discount rates to be used in connection with valuing our postretirement obligations. The assumed discount rate for each pension plan reflects market rates for high quality corporate bonds currently available. Our discount rate is determined by evaluating yield curves consisting of large populations of high quality corporate bonds. The projected pension benefit payment streams are then matched with the bond portfolios to determine a rate that reflects the liability duration unique to our plans. As of December 31, 2016, a .25% increase in the discount rate in the U.S. would have decreased our year-end projected benefit obligation by approximately $28 million and would have increased expected periodic benefit cost for the coming year by approximately $.2 million. Conversely, a .25% decrease in the discount rate in the U.S. would have increased our year-end projected benefit obligation by approximately $29 million and would have decreased expected periodic benefit cost for the coming year by approximately $.3 million. As of December 31, 2016, a .25% increase in the discount rate associated with our international plans would have decreased our year-end projected benefit obligation by $39 million and would have increased expected periodic benefit cost for the coming year by approximately $3 million. Conversely, a .25% decrease in the discount rate associated with our foreign plans would have increased our year-end projected benefit obligation by approximately $42 million and would have decreased expected periodic benefit cost for the coming year by approximately $2 million.
In 2016, we used a full yield curve approach to estimate the service and interest cost components of net periodic benefit cost for our pension and other postretirement benefit plans. Under this approach, we applied multiple discount rates from a yield curve composed of the rates of return on several hundred high-quality, fixed income corporate bonds available at the measurement date. We believe this approach provides a more precise measurement of service and interest cost by aligning the timing of the plans' liability cash flows to the corresponding rates on the yield curve. Historically, we estimated the service and interest cost components using a single weighted-average discount rate derived from the yield curve used to measure the benefit obligation at the beginning of the period.
Long-term Return on Assets
We determine the long-term rate of return assumption for plan assets by reviewing the historical and expected returns of both the equity and fixed income markets, taking into account our asset allocation, the correlation between returns in our asset classes, and the
| | | 14 |
Management's Discussion and Analysis of Financial Condition and Results of Operations
mix of active and passive investments. Additionally, current market conditions, including interest rates, are evaluated and market data is reviewed for reasonableness and appropriateness. An increase or decrease of .25% on the long-term return on assets in the U.S. would have decreased or increased, respectively, our 2017 periodic benefit cost by approximately $2 million. An increase or decrease of .25% on the long-term return on assets associated with our international plans would have decreased or increased, respectively, our 2017 periodic benefit cost by approximately $1 million.
Taxes Based on Income
Deferred income tax assets represent amounts available to reduce income taxes payable on taxable income in future years. These assets arise because of temporary differences between the financial reporting and tax bases of assets and liabilities, as well as from net operating loss and tax credit carryforwards. These amounts are adjusted, as appropriate, to reflect changes in tax rates expected to be in effect when the temporary differences reverse. We evaluate the recoverability of these future tax deductions and credits by assessing the adequacy of future expected taxable income from all sources, including reversal of taxable temporary differences, forecasted operating earnings and available tax planning strategies. Our assessment of these sources of income relies heavily on estimates. We use historical experience along with operating forecasts to evaluate expected taxable income for the future. To the extent we do not consider it more likely than not that a deferred tax asset will be recovered, a valuation allowance is established in the period we make such a determination. A tax planning strategy is defined as "an action that: is prudent and feasible; an enterprise ordinarily might not take, but would take to prevent an operating loss or tax credit carryforward from expiring unused; and would result in realization of deferred tax assets." We also established valuation allowances associated with certain acquired net deferred tax assets. If, based on our estimates of future taxable income, it is later determined that it is more likely than not that a deferred tax asset will be realized, we would release the valuation allowance to current earnings.
Our income tax rate is significantly affected by the different tax rates applicable to our operations in the jurisdictions in which we do business. In addition to local country tax law and regulations, this rate depends on the extent earnings are indefinitely reinvested outside the United States. Indefinite reinvestment is determined in accordance with the Accounting Standards Codification ("ASC") 740-30-25-17 using management's judgment about and intentions concerning estimates of our future financial results, cash flows, capital investment plans and our actions to return cash to shareholders.
We calculate our current and deferred tax provision based on estimates and assumptions that could differ from the actual results reflected in income tax returns filed in subsequent years. Adjustments based on filed returns are recorded when identified.
Tax laws are complex and subject to different interpretations by taxpayers and respective governmental taxing authorities. We review our tax positions quarterly and adjust the balances as new information becomes available. Significant judgment is required in determining our tax expense and in evaluating our tax positions, including evaluating uncertainties. Our estimate of the potential outcome of any uncertain tax issue is subject to management's assessment of relevant facts and circumstances existing at the balance sheet date, taking into consideration existing laws, regulations and practices of any governmental authorities exercising jurisdiction over our operations. For example, in 2016, the European Commission concluded that certain tax benefits granted by certain countries, including the Netherlands, Luxembourg, Belgium, and Ireland, to other companies constituted illegal state aid. We continue to monitor state aid developments since they involve jurisdictions in which we have significant operations, and consider these matters in determining our uncertain tax positions.
Further information is available in Note 14, "Taxes Based on Income," to the Consolidated Financial Statements.
Long-Term Incentive Compensation
We have not capitalized expense associated with our long-term incentive compensation.
Changes in estimated forfeiture rates are recorded as cumulative adjustments in the period estimates are revised.
Valuation of Stock-Based Awards
Our stock-based compensation expense is based on the fair value of awards, adjusted for estimated forfeitures, and amortized on a straight-line basis over the requisite service period for stock options, restricted stock units ("RSUs"), and performance units ("PUs"). The compensation expense related to market-leveraged stock units ("MSUs") is based on the fair value of awards, adjusted for estimated forfeitures, and amortized on a graded-vesting basis over their respective performance periods.
Compensation expense for awards with a market condition as a performance objective, which includes PUs and MSUs, is not adjusted if the condition is not met, as long as the requisite service period is met.
The fair value of stock options is estimated as of the date of grant using the Black-Scholes option-pricing model. This model requires input assumptions for our expected dividend yield, expected stock price volatility, risk-free interest rate and the expected option term.
The following assumptions are used in estimating the fair value of granted stock options:
Risk-free interest rate is based on the 52-week average of the Treasury-Bond rate that has a term corresponding to the expected option term.
Expected stock price volatility represents an average of implied and historical volatility.
Expected dividend yield is based on the current annual dividend divided by the 12-month average of our monthly stock price prior to the date of grant.
Expected option term is determined based on historical experience under our stock option and incentive plans.
The fair value of RSUs and the component of PUs that is subject to achievement of performance objectives based on a performance condition is determined based on the fair market value of our common stock as of the date of grant, adjusted for foregone dividends.
The fair value of stock-based awards that are subject to achievement of performance objectives based on a market condition, which includes MSUs and the other component of PUs, is determined using the Monte-Carlo simulation model, which utilizes multiple input variables, including expected stock price volatility and other assumptions appropriate for determining fair value, to estimate the probability of satisfying the target performance objectives established for the award.
Certain of these assumptions are based on management's estimates, in consultation with outside specialists. Significant changes in assumptions for future awards and actual forfeiture rates could
| 15 Avery Dennison Corporation 2016 Annual Report | | |
Management's Discussion and Analysis of Financial Condition and Results of Operations
materially impact stock-based compensation expense and our results of operations.
Valuation of Cash-Based Awards
Cash-based awards consist of long-term incentive units ("LTI Units") granted to eligible employees. Cash-based awards are classified as liability awards and remeasured at each quarter-end over the applicable vesting or performance period. In addition to LTI Units with terms and conditions that mirror those of RSUs, we also grant certain employees LTI Units with terms and conditions that mirror those of PUs and MSUs.
Accounting for Income Taxes for Stock-Based Compensation
We use the short-cut method to calculate the historical pool of windfall tax benefits related to employee and non-employee director stock-based compensation awards. In addition, we follow the tax law ordering approach to determine the sequence in which deductions and net operating loss carryforwards are utilized, as well as the direct-only approach to calculate the amount of windfall or shortfall tax benefits.
Litigation Matters
We are involved in various lawsuits, claims, inquiries and other regulatory and compliance matters, most of which are routine to the nature of our business. When it is probable that a loss will be incurred and where a range of the loss can be reasonably estimated, the best estimate within the range is accrued. When the best estimate within the range cannot be determined, the low end of the range is accrued. The ultimate resolution of these claims could affect future results of operations should our exposure be materially different from our estimates or should liabilities be incurred that were not previously accrued. Potential insurance reimbursements are not offset against potential liabilities.
Environmental Expenditures
Environmental expenditures are generally expensed. However, environmental expenditures for newly acquired assets and those which extend or improve the economic useful life of existing assets are capitalized and amortized over the shorter of the estimated useful life of the acquired asset or the remaining life of the existing asset. We review our estimates of costs of compliance with environmental laws related to remediation and cleanup of various sites, including sites in which governmental agencies have designated us as a potentially responsible party. When it is probable that a loss will be incurred and where a range of the loss can be reasonably estimated, the best estimate within the range is accrued. When the best estimate within the range cannot be determined, the low end of the range is accrued. Potential insurance reimbursements are not offset against potential liabilities.
RECENT ACCOUNTING REQUIREMENTS
Refer to Note 1, "Summary of Significant Accounting Policies," to the Consolidated Financial Statements for this information.
MARKET-SENSITIVE INSTRUMENTS AND RISK MANAGEMENT
Risk Management
We are exposed to the impact of changes in interest rates and foreign currency exchange rates.
We generally do not purchase or hold foreign currency or interest rate or commodity contracts for trading purposes.
Our objective in managing our exposure to foreign currency changes is to reduce the risk to our earnings and cash flow associated with foreign exchange rate changes. As a result, we enter into foreign exchange forward, option and swap contracts to reduce risks associated with the value of our existing foreign currency assets, liabilities, firm commitments and anticipated foreign revenues and costs, when available and appropriate. The gains and losses on these contracts are intended to offset changes in the related exposures. We do not hedge our foreign currency exposure in a manner that would entirely eliminate the effects of changes in foreign exchange rates on our net income.
Our objective in managing our exposure to interest rate changes is to reduce the impact of interest rate changes on earnings and cash flows. To achieve our objectives, we may periodically use interest rate contracts to manage our exposure to interest rate changes.
Additionally, we enter into certain natural gas futures contracts to reduce the risks associated with domestic natural gas anticipated to be used in manufacturing and operations. These amounts are not material to our financial statements.
In the normal course of operations, we also face other risks that are either non-financial or non-quantifiable. These risks principally include changes in economic or political conditions, other risks associated with foreign operations, commodity price risk and litigation risk, which are not reflected in the analyses that follow.
Foreign Exchange Value-At-Risk
We use a Value-At-Risk ("VAR") model to determine the estimated maximum potential one-day loss in earnings associated with our foreign exchange positions and contracts. This approach assumes that market rates or prices for foreign exchange positions and contracts are normally distributed. VAR model estimates were made assuming normal market conditions. The model includes all of our debt as well as all interest rate and foreign exchange derivative contracts and market sensitive equity investments. Forecasted transactions, firm commitments, and accounts receivable and accounts payable denominated in foreign currencies, which certain of these instruments are intended to hedge, were excluded from the model.
In both 2016 and 2015, the VAR was estimated using a variance-covariance methodology. The currency correlation was based on one-year historical data obtained from one of our domestic banks. A 95% confidence level was used for a one-day time horizon.
The estimated maximum potential one-day loss in earnings for our foreign exchange positions and contracts was $1.6 million at year-end 2016 and $1 million at year-end 2015.
The VAR model is a risk analysis tool and does not purport to represent actual losses in fair value that we could incur, nor does it consider the potential effect of favorable changes in market factors.
Interest Rate Sensitivity
In 2016, an assumed 20 basis point move in interest rates affecting our variable-rate borrowings (10% of our weighted-average interest rate on floating rate debt) would have increased interest expense by approximately $.5 million.
In 2015, an assumed 40 basis point move in interest rates affecting our variable-rate borrowings (10% of our weighted-average interest rate on floating rate debt) would have increased interest expense by approximately $.7 million.
| | | 16 |
| (Dollars in millions, except per share amount) |
December 31, 2016 |
January 2, 2016 |
|||||
|---|---|---|---|---|---|---|---|
| | | | | | | | |
Assets |
|||||||
Current assets: |
|||||||
Cash and cash equivalents |
$ | 195.1 | $ | 158.8 | |||
Trade accounts receivable, less allowances of $47.8 and $31.5 at year-end 2016 and 2015, respectively |
1,001.0 | 964.7 | |||||
Inventories, net |
519.1 | 478.7 | |||||
Refundable income taxes |
30.3 | 30.9 | |||||
Assets held for sale |
6.8 | 2.5 | |||||
Other current assets |
152.5 | 139.8 | |||||
| | | | | | | | |
Total current assets |
1,904.8 | 1,775.4 | |||||
Property, plant and equipment, net |
915.2 | 847.9 | |||||
Goodwill |
793.6 | 686.2 | |||||
Other intangibles resulting from business acquisitions, net |
66.7 | 45.8 | |||||
Non-current deferred income taxes |
313.2 | 372.2 | |||||
Other assets |
402.9 | 406.2 | |||||
| | | | | | | | |
|
$ | 4,396.4 | $ | 4,133.7 | |||
| | | | | | | | |
Liabilities and Shareholders' Equity |
|||||||
Current liabilities: |
|||||||
Short-term borrowings and current portion of long-term debt and capital leases |
$ | 579.1 | $ | 95.3 | |||
Accounts payable |
841.9 | 814.6 | |||||
Accrued payroll and employee benefits |
217.4 | 194.6 | |||||
Accrued trade rebates |
95.2 | 85.4 | |||||
Income taxes payable |
37.9 | 45.1 | |||||
Other accrued liabilities |
232.8 | 224.1 | |||||
| | | | | | | | |
Total current liabilities |
2,004.3 | 1,459.1 | |||||
Long-term debt and capital leases |
713.4 | 963.6 | |||||
Long-term retirement benefits and other liabilities |
660.9 | 637.4 | |||||
Non-current deferred and payable income taxes |
92.3 | 107.9 | |||||
Commitments and contingencies (see Notes 7 and 8) |
|||||||
Shareholders' equity: |
|||||||
Common stock, $1 par value per share, authorized – 400,000,000 shares at year-end 2016 and 2015; issued – 124,126,624 shares at year-end 2016 and 2015; outstanding – 88,308,860 shares and 89,967,697 shares at year-end 2016 and 2015, respectively |
124.1 | 124.1 | |||||
Capital in excess of par value |
852.0 | 834.0 | |||||
Retained earnings |
2,473.3 | 2,277.6 | |||||
Treasury stock at cost, 35,817,764 shares and 34,158,927 shares at year-end 2016 and 2015, respectively |
(1,772.0 | ) | (1,587.0 | ) | |||
Accumulated other comprehensive loss |
(751.9 | ) | (683.0 | ) | |||
| | | | | | | | |
Total shareholders' equity |
925.5 | 965.7 | |||||
| | | | | | | | |
|
$ | 4,396.4 | $ | 4,133.7 | |||
| | | | | | | | |
See Notes to Consolidated Financial Statements
| 17 Avery Dennison Corporation 2016 Annual Report | | |
Consolidated Statements of Income
| (In millions, except per share amounts) |
2016 |
2015 |
2014 |
|||||||
|---|---|---|---|---|---|---|---|---|---|---|
| | | | | | | | | | | |
Net sales |
$ | 6,086.5 | $ | 5,966.9 | $ | 6,330.3 | ||||
Cost of products sold |
4,386.8 | 4,321.1 | 4,679.1 | |||||||
| | | | | | | | | | | |
Gross profit |
1,699.7 | 1,645.8 | 1,651.2 | |||||||
Marketing, general and administrative expense |
1,097.5 | 1,108.1 | 1,158.9 | |||||||
Interest expense |
59.9 | 60.5 | 63.3 | |||||||
Other expense, net |
65.2 | 68.3 | 68.2 | |||||||
| | | | | | | | | | | |
Income from continuing operations before taxes |
477.1 | 408.9 | 360.8 | |||||||
Provision for income taxes |
156.4 | 134.5 | 113.5 | |||||||
| | | | | | | | | | | |
Income from continuing operations |
320.7 | 274.4 | 247.3 | |||||||
Loss from discontinued operations, net of tax |
– | (.1 | ) | (2.2 | ) | |||||
| | | | | | | | | | | |
Net income |
$ | 320.7 | $ | 274.3 | $ | 245.1 | ||||
| | | | | | | | | | | |
Per share amounts: |
||||||||||
Net income (loss) per common share: |
||||||||||
Continuing operations |
$ | 3.60 | $ | 3.01 | $ | 2.64 | ||||
Discontinued operations |
– | – | (.03 | ) | ||||||
| | | | | | | | | | | |
Net income per common share |
$ | 3.60 | $ | 3.01 | $ | 2.61 | ||||
| | | | | | | | | | | |
Net income (loss) per common share, assuming dilution: |
||||||||||
Continuing operations |
$ | 3.54 | $ | 2.95 | $ | 2.58 | ||||
Discontinued operations |
– | – | (.02 | ) | ||||||
| | | | | | | | | | | |
Net income per common share, assuming dilution |
$ | 3.54 | $ | 2.95 | $ | 2.56 | ||||
| | | | | | | | | | | |
Dividends per common share |
$ | 1.60 | $ | 1.46 | $ | 1.34 | ||||
| | | | | | | | | | | |
Weighted average number of shares outstanding: |
||||||||||
Common shares |
89.1 | 91.0 | 93.8 | |||||||
Common shares, assuming dilution |
90.7 | 92.9 | 95.7 | |||||||
| | | | | | | | | | | |
See Notes to Consolidated Financial Statements
| | | 18 |
Consolidated Statements of Comprehensive Income
| (In millions) |
2016 |
2015 |
2014 |
|||||||
|---|---|---|---|---|---|---|---|---|---|---|
| | | | | | | | | | | |
Net income |
$ | 320.7 | $ | 274.3 | $ | 245.1 | ||||
Other comprehensive (loss) income, net tax: |
||||||||||
Foreign currency translation: |
||||||||||
Translation loss |
(53.7 | ) | (139.0 | ) | (149.8 | ) | ||||
Pension and other postretirement benefits: |
||||||||||
Net loss recognized from actuarial gain/loss and prior service cost/credit |
(62.9 | ) | (18.9 | ) | (125.2 | ) | ||||
Reclassifications to net income |
44.2 | 22.9 | 16.9 | |||||||
Cash flow hedges: |
||||||||||
Gains (losses) recognized on cash flow hedges |
.7 | (.5 | ) | .1 | ||||||
Reclassifications to net income |
2.8 | (2.0 | ) | .9 | ||||||
| | | | | | | | | | | |
Other comprehensive loss, net of tax |
(68.9 | ) | (137.5 | ) | (257.1 | ) | ||||
| | | | | | | | | | | |
Total comprehensive income (loss), net of tax |
$ | 251.8 | $ | 136.8 | $ | (12.0 | ) | |||
| | | | | | | | | | | |
See Notes to Consolidated Financial Statements
| 19 Avery Dennison Corporation 2016 Annual Report | | |
Consolidated Statements of Shareholders' Equity
| (Dollars in millions, except per share amounts) |
Common stock, $1 par value |
Capital in excess of par value |
Retained earnings |
Treasury stock |
Accumulated other comprehensive loss |
Total |
|||||||||||||
|---|---|---|---|---|---|---|---|---|---|---|---|---|---|---|---|---|---|---|---|
| | | | | | | | | | | | | | | | | | | | |
Balance as of December 28, 2013 |
$ | 124.1 | $ | 812.3 | $ | 1,992.3 | $ | (1,172.2 | ) | $ | (288.4 | ) | $ | 1,468.1 | |||||
Net income |
– | – | 245.1 | – | – | 245.1 | |||||||||||||
Other comprehensive loss, net of tax |
– | – | – | – | (257.1 | ) | (257.1 | ) | |||||||||||
Repurchase of 7,416,167 shares for treasury |
– | – | – | (355.5 | ) | – | (355.5 | ) | |||||||||||
Issuance of 1,299,931 shares under stock-based compensation plans, including tax of $(4.1) |
– | 11.6 | (2.0 | ) | 43.2 | – | 52.8 | ||||||||||||
Contribution of 396,781 shares to 401(k) Plan |
– | – | 6.2 | 13.2 | – | 19.4 | |||||||||||||
Dividends: $1.34 per share |
– | – | (125.1 | ) | – | – | (125.1 | ) | |||||||||||
| | | | | | | | | | | | | | | | | | | | |
Balance as of January 3, 2015 |
$ | 124.1 | $ | 823.9 | $ | 2,116.5 | $ | (1,471.3 | ) | $ | (545.5 | ) | $ | 1,047.7 | |||||
Net income |
– | – | 274.3 | – | – | 274.3 | |||||||||||||
Other comprehensive loss, net of tax |
– | – | – | – | (137.5 | ) | (137.5 | ) | |||||||||||
Repurchase of 3,858,376 shares for treasury |
– | – | – | (232.3 | ) | – | (232.3 | ) | |||||||||||
Issuance of 3,019,001 shares under stock-based compensation plans, including tax of $10.6 |
– | 10.1 | 11.8 | 104.5 | – | 126.4 | |||||||||||||
Contribution of 348,116 shares to 401(k) Plan |
– | – | 8.1 | 12.1 | – | 20.2 | |||||||||||||
Dividends: $1.46 per share |
– | – | (133.1 | ) | – | – | (133.1 | ) | |||||||||||
| | | | | | | | | | | | | | | | | | | | |
Balance as of January 2, 2016 |
$ | 124.1 | $ | 834.0 | $ | 2,277.6 | $ | (1,587.0 | ) | $ | (683.0 | ) | $ | 965.7 | |||||
Net income |
– | – | 320.7 | – | – | 320.7 | |||||||||||||
Other comprehensive loss, net of tax |
– | – | – | – | (68.9 | ) | (68.9 | ) | |||||||||||
Repurchase of 3,781,528 shares for treasury |
– | – | – | (262.4 | ) | – | (262.4 | ) | |||||||||||
Issuance of 1,842,165 shares under stock-based compensation plans, including tax of $12.3 |
– | 18.0 | 7.7 | 67.2 | – | 92.9 | |||||||||||||
Contribution of 280,526 shares to 401(k) Plan |
– | – | 9.8 | 10.2 | – | 20.0 | |||||||||||||
Dividends: $1.60 per share |
– | – | (142.5 | ) | – | – | (142.5 | ) | |||||||||||
| | | | | | | | | | | | | | | | | | | | |
Balance as of December 31, 2016 |
$ | 124.1 | $ | 852.0 | $ | 2,473.3 | $ | (1,772.0 | ) | $ | (751.9 | ) | $ | 925.5 | |||||
| | | | | | | | | | | | | | | | | | | | |
See Notes to Consolidated Financial Statements
| | | 20 |
Consolidated Statements of Cash Flows
| (In millions) |
2016 |
2015 |
2014 |
|||||||
|---|---|---|---|---|---|---|---|---|---|---|
| | | | | | | | | | | |
Operating Activities |
||||||||||
Net income |
$ | 320.7 | $ | 274.3 | $ | 245.1 | ||||
Adjustments to reconcile net income to net cash provided by operating activities: |
||||||||||
Depreciation |
117.5 | 125.2 | 135.5 | |||||||
Amortization |
62.6 | 63.1 | 66.1 | |||||||
Provision for doubtful accounts and sales returns |
54.4 | 46.5 | 45.2 | |||||||
Loss on sale of businesses |
– | – | 3.4 | |||||||
Indefinite-lived intangible asset impairment charge |
– | – | 3.0 | |||||||
Net losses from asset impairments and sales/disposals of assets |
1.5 | 12.2 | 10.2 | |||||||
Stock-based compensation |
27.2 | 26.3 | 28.3 | |||||||
Loss from settlement of pension obligations |
41.4 | – | – | |||||||
Other non-cash expense and loss |
46.2 | 50.1 | 44.2 | |||||||
Changes in assets and liabilities and other adjustments: |
||||||||||
Trade accounts receivable |
(88.2 | ) | (135.9 | ) | (65.4 | ) | ||||
Inventories |
(19.6 | ) | (34.4 | ) | (33.0 | ) | ||||
Other current assets |
(7.6 | ) | 3.9 | (33.7 | ) | |||||
Accounts payable |
31.6 | 65.5 | (62.8 | ) | ||||||
Accrued liabilities |
32.4 | 7.0 | (18.2 | ) | ||||||
Taxes on income |
(14.1 | ) | (23.7 | ) | 15.3 | |||||
Deferred income taxes |
52.3 | 12.9 | (17.9 | ) | ||||||
Other assets |
(1.2 | ) | (.3 | ) | (3.5 | ) | ||||
Long-term retirement benefits and other liabilities |
(71.8 | ) | (19.0 | ) | (6.9 | ) | ||||
| | | | | | | | | | | |
Net cash provided by operating activities |
585.3 | 473.7 | 354.9 | |||||||
| | | | | | | | | | | |
Investing Activities |
||||||||||
Purchases of property, plant and equipment |
(176.9 | ) | (135.8 | ) | (147.9 | ) | ||||
Purchases of software and other deferred charges |
(29.7 | ) | (15.7 | ) | (27.1 | ) | ||||
Proceeds from sales of property, plant and equipment |
8.5 | 7.6 | 4.3 | |||||||
(Purchases) sales of investments, net |
(.1 | ) | (.5 | ) | .3 | |||||
Payments for acquisitions and equity method investments, net of cash acquired |
(237.2 | ) | – | – | ||||||
Other |
– | 1.5 | – | |||||||
| | | | | | | | | | | |
Net cash used in investing activities |
(435.4 | ) | (142.9 | ) | (170.4 | ) | ||||
| | | | | | | | | | | |
Financing Activities |
||||||||||
Net increase (decrease) in borrowings (maturities of three months or less) |
234.9 | (98.4 | ) | 126.5 | ||||||
Repayments of debt (maturities greater than three months) |
(2.7 | ) | (7.4 | ) | (1.6 | ) | ||||
Dividends paid |
(142.5 | ) | (133.1 | ) | (125.1 | ) | ||||
Share repurchases |
(262.4 | ) | (232.3 | ) | (355.5 | ) | ||||
Proceeds from exercises of stock options, net |
71.0 | 104.0 | 34.2 | |||||||
Other |
(4.5 | ) | (.1 | ) | (2.0 | ) | ||||
| | | | | | | | | | | |
Net cash used in financing activities |
(106.2 | ) | (367.3 | ) | (323.5 | ) | ||||
| | | | | | | | | | | |
Effect of foreign currency translation on cash balances |
(7.4 | ) | (11.9 | ) | (4.9 | ) | ||||
| | | | | | | | | | | |
Increase (decrease) in cash and cash equivalents |
36.3 | (48.4 | ) | (143.9 | ) | |||||
Cash and cash equivalents, beginning of year |
158.8 | 207.2 | 351.1 | |||||||
| | | | | | | | | | | |
Cash and cash equivalents, end of year |
$ | 195.1 | $ | 158.8 | $ | 207.2 | ||||
| | | | | | | | | | | |
See Notes to Consolidated Financial Statements
| 21 Avery Dennison Corporation 2016 Annual Report | | |
Notes to Consolidated Financial Statements
NOTE 1. SUMMARY OF SIGNIFICANT ACCOUNTING POLICIES
Nature of Operations
We develop identification and decorative solutions for businesses worldwide. Our products include pressure-sensitive labeling technology and materials; films for graphic and reflective applications; brand and price tickets, tags and labels (including radio-frequency identification ("RFID") inlays); performance tapes; and pressure-sensitive adhesive products for surgical, wound care, ostomy, and electromedical applications.
Principles of Consolidation
The consolidated financial statements include the accounts of majority-owned subsidiaries. Intercompany accounts, transactions, and profits are eliminated in consolidation. We apply the equity method of accounting for investments in which we have significant influence but not a controlling interest.
Segment Information
In the fourth quarter of 2016, we changed our operating structure to align with our overall business strategy, and our Chief Executive Officer, who is also our chief operating decision maker, requested changes in the information that he regularly reviews for purposes of allocating resources and assessing performance. As a result of these events, our fiscal year 2016 results are reported based on our new reportable segments, as described in Note 15, "Segment Information." We have reclassified certain prior period amounts to reflect our new operating structure.
Fiscal Year
Normally, our fiscal years consist of 52 weeks, but every fifth or sixth fiscal year consists of 53 weeks. Our 2016 and 2015 fiscal years consisted of 52-week periods ending December 31, 2016 and January 2, 2016, respectively. Our 2014 fiscal year consisted of a 53-week period ending January 3, 2015.
Financial Presentation
As further discussed in Note 16, "Supplemental Financial Information," we have classified certain costs associated with the divestiture of our former Office and Consumer Products ("OCP") and Designed and Engineered Solutions ("DES") businesses as discontinued operations in the Consolidated Statements of Income for fiscal years 2015 and 2014. Unless otherwise noted, the results and financial condition of discontinued operations have been excluded from the notes to our Consolidated Financial Statements. Certain prior year amounts have been reclassified to conform to the current year presentation.
Use of Estimates
The preparation of financial statements in conformity with accounting principles generally accepted in the United States of America, or GAAP, requires management to make estimates and assumptions for the reporting period and as of the date of the financial statements. These estimates and assumptions affect the reported amounts of assets and liabilities, the disclosure of contingent liabilities and the reported amounts of revenue and expense. Actual results could differ from these estimates.
Cash and Cash Equivalents
Cash and cash equivalents generally consist of cash on hand, deposits in banks, cash-in-transit, and bank drafts and short-term investments with maturities of three months or less when purchased or received. The carrying value of these assets approximates fair value due to the short maturity of the instruments.
Accounts Receivable
We record trade accounts receivable at the invoiced amount. The allowance for doubtful accounts reserve represents allowances for customer trade accounts receivable that are estimated to be partially or entirely uncollectible. The customer complaint reserve represents estimated sales returns and allowances. These allowances are used to reduce gross trade receivables to their net realizable values. We record these allowances based on estimates related to the following:
- •
- Customer-specific allowances;
- •
- Amounts based upon an aging schedule; and
- •
- An amount based on our historical experience.
No single customer represented 10% or more of our net sales in, or trade accounts receivable at, year-end 2016 or 2015. However, during 2016, 2015, and 2014, our ten largest customers by net sales represented approximately 14%, 15%, and 13% of our net sales, respectively. As of December 31, 2016 and January 2, 2016, our ten largest customers by trade accounts receivable represented approximately 14% of our trade accounts receivable. These customers were concentrated primarily in our Label and Graphic Materials reportable segment. We generally do not require our customers to provide collateral.
Inventories
Inventories are stated at the lower of cost or net realizable value and are categorized as raw materials, work-in-progress, or finished goods. Cost is determined using the first-in, first-out method. Inventory reserves are recorded to cost of products sold for damaged, obsolete, excess and slow-moving inventory and we establish a lower cost basis for the inventory. We use estimates to record these reserves. Slow-moving inventory is reviewed by category and may be partially or fully reserved for depending on the type of product, level of usage, and the length of time the product has been included in inventory.
Property, Plant and Equipment
Depreciation is generally computed using the straight-line method over the estimated useful lives of the assets, ranging from ten to forty-five years for buildings and improvements and three to fifteen years for machinery and equipment. Leasehold improvements are depreciated over the shorter of the useful life of the asset or the term of the associated leases. Maintenance and repair costs are expensed as incurred; renewals and betterments are capitalized. Upon the sale or retirement of assets, the accounts are relieved of the cost and the related accumulated depreciation, with any resulting gain or loss included in net income.
Software
We capitalize internal and external software costs that are incurred during the application development stage of software development, including costs incurred for the design, coding, installation to hardware, testing, and upgrades and enhancements that provide the software or hardware with additional functionalities and capabilities. Internal and
| | | 22 |
Notes to Consolidated Financial Statements
external software costs during the preliminary project stage are expensed, as are those costs during the post-implementation and/or operation stage, including internal and external training costs and maintenance costs. Capitalized software, which is included in "Other assets" in the Consolidated Balance Sheets, is amortized on a straight-line basis over the estimated useful life of the software, which is generally between five and ten years.
Impairment of Long-lived Assets
Impairment charges are recorded when the carrying amounts of long-lived assets are determined not to be recoverable. Recoverability is measured by comparing the undiscounted cash flows expected from their use and eventual disposition to the carrying value of the related asset or asset group. The amount of impairment loss is calculated as the excess of the carrying value over the fair value. Historically, changes in market conditions and management strategy have caused us to reassess the carrying amount of our long-lived assets.
Goodwill and Other Intangibles Resulting from Business Acquisitions
Business combinations are accounted for by the acquisition method, with the excess of the acquisition cost over the fair value of net tangible assets and identified intangible assets acquired considered goodwill. As a result, we disclose goodwill separately from other intangible assets. Other identifiable intangibles include customer relationships, patents and other acquired technology, trade names and trademarks, and other intangibles.
We have the following reporting units: materials; retail branding and information solutions; reflective solutions; performance tapes; fastener solutions; adhesives; and medical solutions. In performing the required impairment tests, we primarily apply a present value (discounted cash flow) method to determine the fair value of the reporting units with goodwill. We perform our annual impairment test of goodwill during the fourth quarter.
Certain factors may result in the need to perform an impairment test prior to the fourth quarter, including significant underperformance of a business relative to expected operating results, significant adverse economic and industry trends, significant decline in our market capitalization for an extended period of time relative to net book value, or a decision to divest a portion of a reporting unit.
We determine goodwill impairment using a two-step process. The first step is to identify if a potential impairment exists by comparing the fair value of a reporting unit with its carrying amount, including goodwill. If the fair value of a reporting unit exceeds its carrying amount, goodwill of the reporting unit is not considered to have a potential impairment and the second step of the impairment test is not necessary. However, if the carrying amount of a reporting unit exceeds its fair value, the second step is performed to determine if goodwill is impaired and to measure the amount of impairment loss to recognize, if any.
The second step, if necessary, compares the implied fair value of goodwill with the carrying amount of goodwill. If the implied fair value of goodwill exceeds the carrying amount, then goodwill is not considered impaired. However, if the carrying amount of goodwill exceeds the implied fair value, an impairment loss is recognized in an amount equal to that excess.
In consultation with outside specialists, we estimate the fair value of our reporting units using various valuation techniques, with the primary technique being a discounted cash flow analysis. A discounted cash flow analysis requires us to make various assumptions about the reporting units, including sales, operating margins, growth rates, and discount rates. Assumptions about discount rates are based on a weighted-average cost of capital for comparable companies. Assumptions about sales, operating margins, and growth rates are based on our forecasts, business plans, economic projections, anticipated future cash flows, and marketplace data. Assumptions are also made for varying perpetual growth rates for periods beyond the long-term business plan period. We base our fair value estimates on projected financial information and assumptions that we believe are reasonable. However, actual future results may differ from those estimates and projections, and those differences may be material. The valuation methodology used to estimate the fair value of reporting units requires inputs and assumptions that reflect current market conditions, as well as the impact of planned business and operational strategies that require management judgment. The estimated fair value could increase or decrease depending on changes in the inputs and assumptions.
We test indefinite-lived intangible assets, consisting of trade names and trademarks, for impairment in the fourth quarter or whenever events or circumstances indicate that it is more likely than not that their carrying amounts exceed their fair values. Fair value is estimated as the discounted value of future revenues using a royalty rate that a third party would pay for use of the asset. Variation in the royalty rates could impact the estimate of fair value. If the carrying amount of an asset exceeds its fair value, an impairment loss is recognized in an amount equal to that excess.
See also Note 3, "Goodwill and Other Intangibles Resulting from Business Acquisitions."
Foreign Currency
Asset and liability accounts of international operations are translated into U.S. dollars at current rates. Revenues and expenses are translated at the weighted-average currency rate for the fiscal year. Gains and losses resulting from hedging the value of investments in certain international operations and from the translation of balance sheet accounts are recorded directly as a component of other comprehensive income.
Financial Instruments
We enter into foreign exchange hedge contracts to reduce our risk from exchange rate fluctuations associated with receivables, payables, loans and firm commitments denominated in certain foreign currencies that arise primarily as a result of our operations outside the U.S. We enter into interest rate contracts to help manage our exposure to certain interest rate fluctuations. We also enter into futures contracts to hedge certain price fluctuations for a portion of our anticipated domestic purchases of natural gas. The maximum length of time for which we hedge our exposure to the variability in future cash flows for forecasted transactions is 36 months.
On the date we enter into a derivative contract, we determine whether the derivative will be designated as a hedge. Derivatives not designated as hedges are recorded on the balance sheets at fair value, with changes in fair value recognized in earnings. Derivatives designated as hedges are classified as either (1) hedges of the fair value of a recognized asset or liability or an unrecognized firm commitment ("fair value" hedges) or (2) hedges of a forecasted transaction or the variability of cash flows that are to be received or paid in connection with a recognized asset or liability ("cash flow" hedges). Our policy is not to
| 23 Avery Dennison Corporation 2016 Annual Report | | |
Notes to Consolidated Financial Statements
purchase or hold any foreign currency, interest rate or commodity contracts for trading purposes.
We assess, both at the inception of the hedge and on an ongoing basis, whether hedges are highly effective. If it is determined that a hedge is not highly effective, we prospectively discontinue hedge accounting. For cash flow hedges, the effective portion of the related gains and losses is recorded as a component of other comprehensive income, and the ineffective portion is reported in earnings. Amounts in accumulated other comprehensive income (loss) are reclassified into earnings in the same period during which the hedged transaction affects earnings. In the event that the anticipated transaction is no longer likely to occur, we recognize the change in fair value of the instrument in current period earnings. Changes in fair value hedges are recognized in current period earnings. Changes in the fair value of underlying hedged items (such as recognized assets or liabilities) are also recognized in current period earnings and offset the changes in the fair value of the derivative.
In the Consolidated Statements of Cash Flows, hedges are classified in the same category as the item hedged, primarily in operating activities.
See also Note 5, "Financial Instruments."
Fair Value Measurements
We define fair value as the price that would be received from selling an asset or paid to transfer a liability in an orderly transaction between market participants at the measurement date. When determining the fair value measurements for assets and liabilities which are required to be recorded at fair value, we consider the principal or most advantageous market in which we would transact and the market-based risk measurements or assumptions that market participants would use in pricing the asset or liability.
We determine fair value based on a three-tier fair value hierarchy, which we use to prioritize the inputs used in measuring fair value. These tiers consist of Level 1, defined as observable inputs such as quoted prices in active markets; Level 2, defined as inputs other than quoted prices in active markets that are either directly or indirectly observable; and Level 3, defined as unobservable inputs in which little or no market data exists, therefore requiring us to develop our own assumptions to determine the best estimate of fair value.
Revenue Recognition
Sales are recognized when persuasive evidence of an arrangement exists, pricing is determinable, delivery has occurred based on applicable sales terms, and collection is reasonably assured. Sale terms are free on board (f.o.b.) shipping point or f.o.b. destination, depending upon local business customs. In regions where f.o.b. shipping point terms are utilized, sales are recorded at the time of shipment because this is when title and risk of loss are transferred. In regions where f.o.b. destination terms are utilized, sales are recorded when the products are delivered to the customer's delivery site, because this is when title and risk of loss are transferred. Furthermore, sales, provisions for estimated returns, and the cost of products sold are recorded at the time title transfers to customers and when the customers assume the risks and rewards of ownership. Actual product returns are charged against estimated sales return allowances.
Sales rebates and discounts are common practices in the industries in which we operate. Volume, promotional, price, cash and other discounts and customer incentives are accounted for as a reduction to gross sales. Rebates and discounts are recorded based upon estimates at the time products are sold. These estimates are based on our historical experience for similar programs and products. We review these rebates and discounts on an ongoing basis and accruals for rebates and discounts are adjusted, if necessary, as additional information becomes available.
Research and Development
Research and development costs are related to research, design, and testing of new products and applications and are expensed as incurred.
Long-Term Incentive Compensation
No long-term incentive compensation expense was capitalized in 2016, 2015, or 2014.
Changes in estimated forfeiture rates are recorded as cumulative adjustments in the period that the estimates are revised.
Valuation of Stock-Based Awards
Our stock-based compensation expense is based on the fair value of awards, adjusted for estimated forfeitures, and amortized on a straight-line basis over the requisite service period for stock options and restricted stock units ("RSUs"). Compensation expense for performance units ("PUs") is based on the fair value of awards, adjusted for estimated forfeitures, and amortized on a straight-line basis as these awards cliff-vest at the end of the requisite service period. The compensation expense related to market-leveraged stock units ("MSUs") is based on the fair value of awards, adjusted for estimated forfeitures, and amortized on a graded-vesting basis over their respective performance periods.
Compensation expense for awards with a market condition as a performance objective, which includes PUs and MSUs, is not adjusted if the condition is not met, as long as the requisite service period is met.
The fair value of stock options is estimated as of the date of grant using the Black-Scholes option-pricing model. This model requires input assumptions for our expected dividend yield, expected stock price volatility, risk-free interest rate, and the expected option term.
The fair value of RSUs and the component of PUs that is subject to the achievement of performance objectives based on a performance condition is determined based on the fair market value of our common stock as of the date of grant, adjusted for foregone dividends.
The fair value of stock-based awards that are subject to achievement of performance objectives based on a market condition, which includes MSUs and the other component of PUs, is determined using the Monte-Carlo simulation model, which utilizes multiple input variables, including expected stock price volatility and other assumptions appropriate for determining fair value, to estimate the probability of satisfying the target performance objectives established for the award.
Certain of these assumptions are based on management's estimates, in consultation with outside specialists. Significant changes in assumptions for future awards and actual forfeiture rates could materially impact stock-based compensation expense and our results of operations.
Valuation of Cash-Based Awards
Cash-based awards consist of long-term incentive units ("LTI Units") granted to eligible employees. Cash-based awards are classified as liability awards and remeasured at each quarter-end over the applicable vesting or performance period. In addition to LTI Units
| | | 24 |
Notes to Consolidated Financial Statements
with terms and conditions that mirror those of RSUs, we also grant certain employees LTI Units with terms and conditions that mirror those of PUs and MSUs.
Accounting for Income Taxes for Stock-Based Compensation
We use the short-cut method to calculate the historical pool of windfall tax benefits related to non-employee director and employee stock-based compensation awards. In addition, we follow the tax law ordering approach to determine the sequence in which deductions and net operating loss carryforwards are utilized, as well as the direct-only approach to calculate the amount of windfall or shortfall tax benefits.
See also Note 12, "Long-term Incentive Compensation."
Taxes Based on Income
Our provision for income taxes is determined using the asset and liability approach following the provisions of ASC 740, Accounting for Income Taxes. Under this approach, deferred income taxes represent the expected future tax consequences of temporary differences between the carrying amounts and tax basis of assets and liabilities. We record a valuation allowance to reduce our deferred tax assets when uncertainty regarding their realizability exists. We recognize and measure our uncertain tax positions following the more likely than not threshold for financial statement recognition and measurement for tax positions taken or expected to be taken in a tax return.
See also Note 14, "Taxes Based on Income."
Recent Accounting Requirements
In January 2017, the Financial Accounting Standards Board ("FASB") issued amended guidance that simplifies the subsequent measurement of goodwill. This amended guidance eliminates step two of the goodwill impairment test, and a goodwill impairment will be the amount by which a reporting unit's carrying value exceeds its fair value, not to exceed the carrying amount of goodwill. This guidance will be effective for fiscal years and interim periods beginning after December 15, 2019 and early adoption is permitted. While we are currently assessing the timing of our adoption of this guidance, we do not anticipate that its adoption will have a significant impact on our financial position, results of operations, cash flows, or disclosures.
In January 2017, the FASB issued guidance that changes the definition of a business to assist entities with evaluating when a set of transferred assets and activities is a business. This guidance will be effective for fiscal years and interim periods beginning after December 15, 2017 and early adoption is permitted. While we are currently assessing the timing of our adoption of this guidance, we do not anticipate that its adoption will have a significant impact on our financial position, results of operations, cash flows, and disclosures.
In October 2016, the FASB issued guidance that requires companies to recognize the income tax effects of intra-entity sales and transfers of assets other than inventory in the period in which the transfer occurs. This guidance will be effective for fiscal years and interim periods beginning after December 15, 2017 and early adoption is permitted. The guidance requires modified retrospective adoption. We are currently assessing the timing of our adoption of this guidance and its impact on our financial position, results of operations, cash flows, and disclosures.
In August 2016, the FASB issued guidance to reduce the diversity in the presentation of certain cash receipts and cash payments presented and classified in the statement of cash flows. This guidance requires retrospective adoption and will be effective for fiscal years and interim periods beginning after December 15, 2017. Early adoption is permitted. We are currently assessing the impact of this guidance on our cash flows.
In March 2016, the FASB issued guidance to simplify several aspects of the accounting for share-based payment transactions, including the income tax consequences, classification of awards as either equity or liabilities, and classification on the statement of cash flows. The guidance will be effective for fiscal years and interim periods beginning after December 15, 2016, and early adoption is permitted. Different components of the guidance require prospective, retrospective and/or modified retrospective adoption. We are currently assessing the impact of this guidance on our financial position, results of operations, cash flows, and disclosures.
In March 2016, the FASB issued guidance on accounting for leases that requires lessees to recognize most leases on their balance sheets for the rights and obligations created by those leases. This guidance also requires enhanced disclosures regarding the amount, timing, and uncertainty of cash flows arising from leases and will be effective for interim and annual periods beginning after December 15, 2018. Early adoption is permitted. A modified retrospective approach is required for adoption with respect to all leases that exist at or commence after the date of initial application with an option to use certain practical expedients. We are currently assessing the impact of this guidance on our financial position, results of operations, cash flows, and disclosures.
In May 2014, and in subsequent updates, the FASB issued revised guidance on revenue recognition. This revised guidance provides a single comprehensive model for accounting for revenue arising from contracts with customers and supersedes most current revenue recognition guidance, including industry-specific guidance. This revised guidance will require an entity to recognize revenue when it transfers promised goods or services to customers in an amount that reflects the consideration to which the entity expects to be entitled in exchange for those goods or services. This update creates a five-step model that requires entities to exercise judgment when considering the terms of contract(s), which includes (i) identifying the contract(s) with the customer, (ii) identifying the separate performance obligations in the contract, (iii) determining the transaction price, (iv) allocating the transaction price to the separate performance obligations, and (v) recognizing revenue when each performance obligation is satisfied. This revised guidance also requires additional disclosure about the nature, amount, timing and uncertainty of revenue and cash flows arising from customer contracts, including qualitative and quantitative information about contracts with customers, significant judgments and changes in judgments and assets recognized from costs incurred to obtain or fulfill a contract. This revised guidance is effective for fiscal years beginning after December 15, 2017, and interim periods within those fiscal years, and can be applied retrospectively either to each prior reporting period presented ("full retrospective") or with the cumulative effect of adoption recognized at the date of initial application ("modified retrospective"). Early adoption is permitted for fiscal periods beginning after December 15, 2016. We expect to adopt the new standard under the modified retrospective approach in the first quarter of 2018. Based on the information we have evaluated to date, we do not anticipate that the adoption of this revised guidance will have a significant impact on our financial position, results of operations, or cash flows.
| 25 Avery Dennison Corporation 2016 Annual Report | | |
Notes to Consolidated Financial Statements
NOTE 2. ACQUISITIONS
On August 1, 2016, we completed the acquisition of the European business of Mactac ("Mactac") from Platinum Equity through the purchase of Evergreen Holding V, LLC. Mactac manufactures pressure-sensitive materials that primarily complement our existing graphics portfolio. The total consideration for this acquisition, net of cash received, was approximately $220 million, which we funded primarily through existing credit facilities. Due to the allowable time required to complete our assessment, the valuation of certain acquired assets and liabilities, including environmental liabilities and taxes, is currently pending. This acquisition was not material to our Consolidated Financial Statements.
In December 2016, we announced our agreement to acquire Hanita Coatings, a pressure-sensitive manufacturer of specialty films and laminates, from Kibbutz Hanita Coatings and Tene Investment Funds for a purchase price of $75 million, subject to customary adjustments. We expect to complete this acquisition in the first quarter of 2017.
In February 2017, we announced our agreement to acquire Yongle Tape Company Ltd. ("Yongle Tape"), a manufacturer of specialty tapes and related products used in a variety of industrial markets, from Yongle Tape's management and ShawKwei & Partners. The purchase price is $190 million, which is subject to customary adjustments, with an additional earn-out opportunity of up to $55 million to be paid based on the acquired business' achievement of certain performance targets over the next two years. We expect to complete this acquisition in mid-2017.
NOTE 3. GOODWILL AND OTHER INTANGIBLES RESULTING FROM BUSINESS ACQUISITIONS
Goodwill
Results from our annual goodwill impairment test in the fourth quarter of 2016 indicated that no impairment occurred in 2016. The fair value of these assets was primarily based on Level 3 inputs.
Changes in the net carrying amount of goodwill for 2016 and 2015 by reportable segment were as follows:
| (In millions) |
Label and Graphic Materials |
Retail Branding and Information Solutions |
Industrial and Healthcare Materials |
Total |
|||||||||
|---|---|---|---|---|---|---|---|---|---|---|---|---|---|
| | | | | | | | | | | | | | |
Goodwill as of January 3, 2015 |
$ | 306.6 | $ | 415.0 | $ | – | $ | 721.6 | |||||
Acquisition adjustments |
– | (.4 | ) | – | (.4 | ) | |||||||
Translation adjustments |
(28.7 | ) | (6.3 | ) | – | (35.0 | ) | ||||||
| | | | | | | | | | | | | | |
Goodwill as of January 2, 2016 |
277.9 | 408.3 | – | 686.2 | |||||||||
Acquired during the current period (1) |
107.8 | – | 14.3 | 122.1 | |||||||||
Transfer (2) |
– | (53.1 | ) | 53.1 | – | ||||||||
Translation adjustments |
(12.4 | ) | (1.3 | ) | (1.0 | ) | (14.7 | ) | |||||
| | | | | | | | | | | | | | |
Goodwill as of December 31, 2016 |
$ | 373.3 | $ | 353.9 | $ | 66.4 | $ | 793.6 | |||||
| | | | | | | | | | | | | | |
- (1)
- Goodwill acquired during the current period primarily related to the Mactac acquisition.
- (2)
- In connection with our operating structure changes in 2016, we allocated goodwill associated with our fastener solutions reporting unit from Retail Branding and Information Solutions ("RBIS") to Industrial and Healthcare Materials ("IHM") based on the relative fair values of our fastener solutions and RBIS reporting units. Prior to 2016, no reporting units within IHM had allocated goodwill. Refer to Note 1, "Summary of Significant Accounting Policies," for more information.
The carrying amounts of goodwill at December 31, 2016 and January 2, 2016 were net of accumulated impairment losses of $820 million, which were included in our RBIS reportable segment.
In connection with the Mactac acquisition, we recognized goodwill based on our expectation of synergies and other benefits of combining our businesses. These synergies and benefits include the use of our existing commercial infrastructure to expand sales of products of the acquired business in a cost-efficient manner. The amount of goodwill recognized is not expected to be deductible for income tax purposes.
Indefinite-Lived Intangible Assets
Results from our annual indefinite-lived intangible assets impairment test in the fourth quarter of 2016 indicated that no impairment occurred in 2016.
The carrying value of indefinite-lived intangible assets resulting from business acquisitions, consisting of trade names and trademarks, was $20.3 million and $7.8 million at December 31, 2016 and January 2, 2016, respectively. In connection with the Mactac acquisition in 2016, we acquired approximately $13 million of indefinite-lived intangible assets, which consist of trade names. These intangible assets were not subject to amortization as they were classified as indefinite-lived assets.
| | | 26 |
Notes to Consolidated Financial Statements
Finite-Lived Intangible Assets
In connection with the Mactac acquisition in 2016, we acquired approximately $29 million of identifiable intangible assets, which consist of customer relationships and patents and other acquired technology. The table below summarizes the amounts and weighted useful lives of these intangible assets:
| |
Amount (in millions) |
Weighted-average amortization period (in years) |
|||||
|---|---|---|---|---|---|---|---|
| | | | | | | | |
Customer relationships |
$ | 26.1 | 15 | ||||
Patents and other acquired technology |
2.5 | 4 | |||||
| | | | | | | | |
The following table sets forth our finite-lived intangible assets resulting from business acquisitions at December 31, 2016 and January 2, 2016, which continue to be amortized:
| |
2016 | 2015 | |||||||||||||||||
|---|---|---|---|---|---|---|---|---|---|---|---|---|---|---|---|---|---|---|---|
| (In millions) |
Gross Carrying Amount |
Accumulated Amortization |
Net Carrying Amount |
Gross Carrying Amount |
Accumulated Amortization |
Net Carrying Amount |
|||||||||||||
| | | | | | | | | | | | | | | | | | | | |
Customer relationships (1) |
$ | 247.1 | $ | 209.4 | $ | 37.7 | $ | 224.3 | $ | 193.9 | $ | 30.4 | |||||||
Patents and other acquired technology (1) |
52.0 | 46.7 | 5.3 | 49.0 | 45.3 | 3.7 | |||||||||||||
Trade names and trademarks |
21.4 | 18.2 | 3.2 | 22.0 | 18.7 | 3.3 | |||||||||||||
Other intangibles |
11.7 | 11.5 | .2 | 11.8 | 11.2 | .6 | |||||||||||||
| | | | | | | | | | | | | | | | | | | | |
Total |
$ | 332.2 | $ | 285.8 | $ | 46.4 | $ | 307.1 | $ | 269.1 | $ | 38.0 | |||||||
| | | | | | | | | | | | | | | | | | | | |
- (1)
- Includes respective finite-lived intangible assets acquired from the Mactac acquisition.
Amortization expense from continuing operations for finite-lived intangible assets resulting from business acquisitions was $19.9 million for 2016, $20.5 million for 2015, and $24.4 million for 2014.
The estimated amortization expense for finite-lived intangible assets resulting from business acquisitions for each of the next five fiscal years is expected to be as follows:
| (In millions) |
Estimated Amortization Expense |
|||
|---|---|---|---|---|
| | | | | |
2017 |
$ | 12.2 | ||
2018 |
4.9 | |||
2019 |
4.0 | |||
2020 |
3.3 | |||
2021 |
3.0 | |||
| | | | | |
NOTE 4. DEBT AND CAPITAL LEASES
Short-Term Borrowings
We had $44.5 million and $28 million of borrowings from U.S. commercial paper issuances outstanding at December 31, 2016 and January 2, 2016, respectively, with a weighted-average interest rate of .9% and .7%, respectively.
In March 2016, we entered into an agreement to establish a Euro-Commercial Paper Program pursuant to which we may issue unsecured commercial paper notes up to a maximum aggregate amount outstanding of $500 million. Proceeds from issuances under this program may be used for general corporate purposes. The maturities of the notes may vary, but may not exceed 364 days from the date of issuance. Our payment obligations with respect to any notes issued under this program are backed by our revolving credit facility (the "Revolver"). There are no financial covenants under this program. As of December 31, 2016, $209 million was outstanding under this program.
Short-Term Credit Facilities
In October 2014, we amended and restated the Revolver, increasing the amount available from certain domestic and foreign banks from $675 million to $700 million. The amendment also extended the Revolver's maturity date from December 22, 2016 to October 3, 2019 and adjusted pricing to reflect favorable market conditions. The maturity date may be extended for additional one-year periods under certain circumstances. The commitments under the Revolver may be increased by up to $325 million, subject to lender approval and customary requirements. The Revolver is used as a back-up facility for our commercial paper program and can be used for other corporate purposes.
No balances were outstanding under the Revolver as of December 31, 2016 or January 2, 2016. Commitment fees associated with the Revolver in 2016, 2015, and 2014 were $1.1 million, $1.9 million, and $1.3 million, respectively.
In addition to the Revolver, we have significant short-term lines of credit available in various countries totaling approximately $300 million at December 31, 2016. These lines may be cancelled at any time by us or the issuing banks. Short-term borrowings outstanding under our lines of credit were $72.9 million and $65 million at December 31, 2016 and January 2, 2016, respectively, with a weighted-average interest rate of 6.5% and 8.7%, respectively.
From time to time, certain of our subsidiaries provide guarantees on certain arrangements with banks. Our exposure to these guarantees is not material.
| 27 Avery Dennison Corporation 2016 Annual Report | | |
Notes to Consolidated Financial Statements
Long-Term Borrowings and Capital Leases
Long-term debt, including its respective interest rates, and capital lease obligations at year-end consisted of the following:
| (In millions) |
2016 |
2015 |
|||||
|---|---|---|---|---|---|---|---|
| | | | | | | | |
Long-term debt and capital leases |
|||||||
Medium-term notes: |
|||||||
Series 1995 due 2020 through 2025 |
$ | 44.9 | $ | 44.9 | |||
Long-term notes: |
|||||||
Senior notes due 2017 at 6.6% |
249.7 | 249.4 | |||||
Senior notes due 2020 at 5.4% |
249.3 | 249.0 | |||||
Senior notes due 2023 at 3.4% |
248.4 | 248.2 | |||||
Senior notes due 2033 at 6.0% |
148.6 | 148.6 | |||||
Capital leases |
25.2 | 26.0 | |||||
Less amount classified as current (1) |
(252.7 | ) | (2.5 | ) | |||
| | | | | | | | |
Total long-term debt and capital leases (2) |
$ | 713.4 | $ | 963.6 | |||
| | | | | | | | |
- (1)
- In 2016, we reclassified approximately $250 million of senior notes due on October 1, 2017 from long-term debt to current portion of long-term debt.
- (2)
- Includes unamortized debt issuance cost and debt discount of $3.6 million and $.4 million as of year-end 2016 and $4.4 million and $.5 million as of year-end 2015, respectively.
At year-end 2016, our medium-term notes had maturities from 2020 through 2025 and accrued interest at a weighted-average fixed rate of 7.5%.
Maturities of long-term debt and capital lease payments for each of the next five fiscal years and thereafter are expected to be as follows:
| Year |
(In millions) |
|||
|---|---|---|---|---|
| | | | | |
2017 (classified as current) |
$ | 254.1 | ||
2018 |
4.1 | |||
2019 |
4.0 | |||
2020 |
268.6 | |||
2021 |
3.5 | |||
2022 and thereafter |
440.9 | |||
| | | | | |
The maturities of capital lease payments in the table above include $5 million of imputed interest, $1.1 million of which is expected to be paid in 2017.
In May 2015, we extended and amended the lease on our Mentor, Ohio facility for an additional ten years. This facility is used primarily as the North American headquarters and research center of our Label and Graphic Materials business. Because ownership of the facility transfers to us at the end of the lease term, it was accounted for as a capital lease. The carrying value of the lease at December 31, 2016 was approximately $22 million, of which approximately $20 million was included in "Long-term debt and capital leases" and approximately $2 million was included in "Short-term borrowings and current portion of long-term debt and capital leases" in the Consolidated Balance Sheets at December 31, 2016.
Other
The Revolver contains financial covenants requiring that we maintain specified ratios of total debt and interest expense in relation to certain measures of income. As of December 31, 2016 and January 2, 2016, we were in compliance with our financial covenants.
Our total interest costs from continuing operations in 2016, 2015, and 2014 were $63.5 million, $63.5 million, and $67.2 million, respectively, of which $3.6 million, $3 million, and $3.9 million, respectively, were capitalized as part of the cost of assets.
The estimated fair value of our long-term debt is primarily based on the credit spread above U.S. Treasury securities on notes with similar rates, credit ratings, and remaining maturities. The fair value of short-term borrowings, which includes commercial paper issuances and short-term lines of credit, approximates carrying value given the short duration of these obligations. The fair value of our total debt was $1.31 billion at December 31, 2016 and $1.08 billion at January 2, 2016. Fair value amounts were determined based primarily on Level 2 inputs, which are inputs other than quoted prices in active markets that are either directly or indirectly observable. Refer to Note 1, "Summary of Significant Accounting Policies," for more information.
NOTE 5. FINANCIAL INSTRUMENTS
As of December 31, 2016, the aggregate U.S. dollar equivalent notional value of our outstanding commodity contracts and foreign exchange contracts was $2.8 million and $1.55 billion, respectively.
We recognize derivative instruments as either assets or liabilities at fair value in the Consolidated Balance Sheets. We designate commodity forward contracts on forecasted purchases of commodities and foreign exchange contracts on forecasted transactions as cash flow hedges and designate foreign exchange contracts on existing balance sheet items as fair value hedges.
The following table shows the fair value and balance sheet locations of derivatives as of December 31, 2016:
| |
Asset | Liability | |||||||||
|---|---|---|---|---|---|---|---|---|---|---|---|
| (In millions) |
Balance Sheet Location |
Fair Value |
Balance Sheet Location |
Fair Value |
|||||||
| | | | | | | | | | | | |
Foreign exchange contracts |
Other current assets | $ | 4.6 | Other accrued liabilities | $ | 7.8 | |||||
Commodity contracts |
Other current assets | .5 | Other accrued liabilities | – | |||||||
Commodity contracts |
Other assets | .1 | |||||||||
| | | | | | | | | | | | |
|
$ | 5.2 | $ | 7.8 | |||||||
| | | | | | | | | | | | |
| | | 28 |
Notes to Consolidated Financial Statements
The following table shows the fair value and balance sheet locations of derivatives as of January 2, 2016:
| |
Asset | Liability | |||||||||
|---|---|---|---|---|---|---|---|---|---|---|---|
| (In millions) |
Balance Sheet Location |
Fair Value |
Balance Sheet Location |
Fair Value |
|||||||
| | | | | | | | | | | | |
Foreign exchange contracts |
Other current assets | $ | 5.6 | Other accrued liabilities | $ | 4.5 | |||||
Commodity contracts |
Other current assets | – | Other accrued liabilities | .7 | |||||||
| | | | | | | | | | | | |
|
$ | 5.6 | $ | 5.2 | |||||||
| | | | | | | | | | | | |
Fair Value Hedges
For derivative instruments that are designated and qualify as fair value hedges, the gain or loss on the derivative and the offsetting loss or gain on the hedged item attributable to the hedged risk are recognized in current earnings, resulting in no material net impact to income.
The following table shows the components of the net gains (losses) recognized in income related to fair value hedge contracts. The corresponding gains or losses on the underlying hedged items approximated the net gains (losses) on these fair value hedge contracts.
| (In millions) |
Location of Net Gains (Losses) in Income |
2016 |
2015 |
2014 |
||||||||
|---|---|---|---|---|---|---|---|---|---|---|---|---|
| | | | | | | | | | | | | |
Foreign exchange contracts |
Cost of products sold | $ | 2.8 | $ | 2.9 | $ | (1.6 | ) | ||||
Foreign exchange contracts |
Marketing, general and administrative expense | 4.1 | 2.9 | (43.3 | ) | |||||||
| | | | | | | | | | | | | |
|
$ | 6.9 | $ | 5.8 | $ | (44.9 | ) | |||||
| | | | | | | | | | | | | |
Cash Flow Hedges
For derivative instruments that are designated and qualify as cash flow hedges, the effective portion of the gain or loss on the derivative is reported as a component of "Accumulated other comprehensive loss" and reclassified into earnings in the same period(s) during which the hedged transaction impacts earnings. Gains and losses on the derivatives, representing either hedge ineffectiveness or hedge components excluded from the assessment of effectiveness, are recognized in current earnings.
Gains (losses), before taxes, recognized in "Accumulated other comprehensive loss" (effective portion) on derivatives related to cash flow hedge contracts were as follows:
| (In millions) |
2016 |
2015 |
2014 |
|||||||
|---|---|---|---|---|---|---|---|---|---|---|
| | | | | | | | | | | |
Foreign exchange contracts |
$ | .2 | $ | (.1 | ) | $ | 1.3 | |||
Commodity contracts |
.6 | (.7 | ) | (1.2 | ) | |||||
| | | | | | | | | | | |
|
$ | .8 | $ | (.8 | ) | $ | .1 | |||
| | | | | | | | | | | |
The amounts recognized in income related to the ineffective portion of, and the amount excluded from, effectiveness testing for cash flow hedges and derivatives not designated as hedging instruments were immaterial in 2016, 2015, and 2014.
As of December 31, 2016, we expected a net loss of approximately $2.6 million to be reclassified from "Accumulated other comprehensive loss" to earnings within the next 12 months.
NOTE 6. PENSION AND OTHER POSTRETIREMENT BENEFITS
Defined Benefit Plans
We sponsor a number of defined benefit plans, the accrual of benefits under some of which has been frozen, covering eligible employees in the U.S. and certain other countries. Benefits payable to an employee are based primarily on years of service and the employee's compensation during the course of his or her employment with us.
We are also obligated to pay unfunded termination indemnity benefits to certain employees outside of the U.S., which are subject to applicable agreements, laws and regulations. We have not incurred significant costs related to these benefits, and, therefore, no related costs are included in the disclosures below.
In December 2015, we offered eligible former employees who were vested participants in the Avery Dennison Pension Plan (the "ADPP"), our U.S. pension plan, the opportunity to receive their benefits immediately as either a lump-sum payment or an annuity, rather than waiting until they are retirement eligible under the terms of the plan. In the second quarter of 2016, approximately $70 million of pension obligations related to this plan were settled from existing plan assets and a non-cash pre-tax settlement charge of $41.4 million was recorded in "Other expense, net" in the Consolidated Statements of Income. This settlement required us to remeasure the remaining net pension obligations of the ADPP. As a result, we recognized approximately $72 million of additional net pension obligations with a corresponding increase in actuarial losses recorded in "Accumulated other comprehensive loss," primarily due to lower discount rates in effect when the plan was remeasured.
Employees who participated in the ADPP between December 1, 1986 and November 30, 1997 may also have had a benefit in a Stock Holding and Retirement Enhancement Account ("SHARE Account") associated with our defined contribution plan. The ADPP is a floor offset plan that coordinated the amount of projected benefit obligation to an eligible participant with his or her SHARE Account such that the total benefit payable to an eligible participant would equal the greater of the value of the participant's benefit from the ADPP or the value of the participant's SHARE Account. Lower than expected asset returns on the participant balances in the SHARE Account could have increased the projected benefit obligation under the ADPP. In the fourth quarter of 2013, we amended our plan documents to require participants to make an early election either to (a) receive their assets in the SHARE Account as a distribution, in which case their retirement benefit under the ADPP would be offset by the annuity equivalent of these assets or (b) transfer their SHARE Account assets to the ADPP and receive the full ADPP retirement benefit in annuity form, rather than wait to make such election upon termination of employment. These amendments resulted in an actuarial loss of approximately $20 million to the ADPP in 2013. By October 2014, all participants with a SHARE Account completed their elections and the existing SHARE Accounts were terminated, which resulted in the recording of an additional actuarial loss of $12 million. These actuarial losses are subject to future amortization.
| 29 Avery Dennison Corporation 2016 Annual Report | | |
Notes to Consolidated Financial Statements
Plan Assets
Our investment management of the ADPP assets utilizes a liability driven investment (LDI) strategy. Under an LDI strategy, the assets are invested in a diversified portfolio that is split into a growth portfolio and a liability hedging portfolio. The growth portfolio consists primarily of equity and high-yield fixed income securities. The liability hedging portfolio consists primarily of investment grade fixed income securities and cash and is intended, over time, to more closely match the liabilities of the plan. The investment objective of the portfolio is to improve the funded status of the plan; as funded status reaches certain trigger points, the portfolio moves to a more conservative asset allocation by increasing the allocation to the liability hedging portfolio. The current target allocation is 65% in the growth portfolio and 35% in the liability hedging portfolio, subject to periodic fluctuations due to market movements. The plan assets are diversified across asset classes, striving to balance risk and return within the limits of prudent risk-taking and Section 404 of the Employee Retirement Income Security Act of 1974, as amended. Because many of the pension liabilities are long-term, the investment horizon is also long-term, but the investment plan must also ensure adequate near-term liquidity to fund benefit payments.
Assets in our international plans are invested in accordance with locally accepted practices and primarily include equity securities, fixed income securities, insurance contracts and cash. Asset allocations and investments vary by country and plan. Our target plan asset investment allocation for our international plans combined is 38% in equity securities, 49% in fixed income securities and cash, and 13% in insurance contracts and other investments, subject to periodic fluctuations in these respective asset classes.
Fair Value Measurements
The following is a description of the valuation methodologies used for assets measured at fair value:
Cash is valued at nominal value. Mutual funds are valued at fair value as determined by quoted market prices, based upon the net asset value ("NAV") of shares held at year-end. Pooled funds are structured as collective trusts, not publicly traded, and valued by calculating NAV per unit based on the NAV of the underlying funds/trusts as a practical expedient for the fair value of the pooled funds. Insurance contracts are valued at book value, which approximates fair value and is calculated using the prior year balance plus or minus investment returns and changes in cash flows.
The methods described above may produce a fair value calculation that may not be indicative of net realizable value or reflective of future fair values. Furthermore, while we believe the valuation methods are appropriate and consistent with other market participants, the use of different methodologies or assumptions to determine the fair value of certain financial instruments could result in a different fair value measurement at the reporting date.
The following table sets forth, by level within the fair value hierarchy (as applicable), U.S. plan assets (all in the ADPP) at fair value:
| |
|
Fair Value Measurements Using | |||||||||||
|---|---|---|---|---|---|---|---|---|---|---|---|---|---|
| (In millions) |
Total |
Quoted Prices in Active Markets (Level 1) |
Significant Other Observable Inputs (Level 2) |
Significant Other Unobservable Inputs (Level 3) |
|||||||||
| | | | | | | | | | | | | | |
2016 |
|||||||||||||
Cash |
$ | – | $ | – | $ | – | $ | – | |||||
Pooled funds – liability hedging portfolio (1) |
269.0 | ||||||||||||
Pooled funds – growth portfolio (1) |
403.1 | ||||||||||||
| | | | | | | | | | | | | | |
Total U.S. plan assets |
$ | 672.1 | |||||||||||
| | | | | | | | | | | | | | |
2015 |
|||||||||||||
Cash |
$ | – | $ | – | $ | – | $ | – | |||||
Pooled funds – liability hedging portfolio (1) |
335.9 | ||||||||||||
Pooled funds – growth portfolio (1) |
368.9 | ||||||||||||
Other assets (2) |
.1 | ||||||||||||
| | | | | | | | | | | | | | |
Total U.S. plan assets |
$ | 704.9 | |||||||||||
| | | | | | | | | | | | | | |
- (1)
- Pooled funds that are measured at fair value using the NAV per share (or its equivalent) practical expedient have not been classified in the fair value hierarchy. The fair value amounts presented in this table are intended to reconcile to total U.S. plan assets.
- (2)
- Includes accrued recoverable taxes.
| | | 30 |
Notes to Consolidated Financial Statements
The following table sets forth, by level within the fair value hierarchy (as applicable), international plan assets at fair value:
| |
|
Fair Value Measurements Using | |||||||||||
|---|---|---|---|---|---|---|---|---|---|---|---|---|---|
| (In millions) |
Total |
Quoted Prices in Active Markets (Level 1) |
Significant Other Observable Inputs (Level 2) |
Significant Other Unobservable Inputs (Level 3) |
|||||||||
| | | | | | | | | | | | | | |
2016 |
|||||||||||||
Cash |
$ | 3.0 | $ | 3.0 | $ | – | $ | – | |||||
Insurance contracts |
30.5 | – | – | 30.5 | |||||||||
Pooled funds – fixed income securities (1) |
284.2 | ||||||||||||
Pooled funds – equity securities (1) |
223.4 | ||||||||||||
Pooled funds – other investments (1) |
43.1 | ||||||||||||
| | | | | | | | | | | | | | |
Total international plan assets at fair value |
$ | 584.2 | |||||||||||
| | | | | | | | | | | | | | |
2015 |
|||||||||||||
Cash |
$ | .8 | $ | .8 | $ | – | $ | – | |||||
Insurance contracts |
21.4 | – | – | 21.4 | |||||||||
Pooled funds – fixed income securities (1) |
275.7 | ||||||||||||
Pooled funds – equity securities (1) |
218.1 | ||||||||||||
Pooled funds – other investments (1) |
36.1 | ||||||||||||
| | | | | | | | | | | | | | |
Total international plan assets at fair value |
$ | 552.1 | |||||||||||
| | | | | | | | | | | | | | |
- (1)
- Pooled funds that are measured at fair value using the NAV per share (or its equivalent) practical expedient have not been classified in the fair value hierarchy. The fair value amounts presented in this table are intended to reconcile to total international plan assets.
The following table presents a reconciliation of Level 3 international plan asset activity during the year ended December 31, 2016:
| |
Level 3 Assets | |||
|---|---|---|---|---|
| (In millions) |
Insurance Contracts |
|||
| | | | | |
Balance at January 2, 2016 |
$ | 21.4 | ||
Acquisition (1) |
8.9 | |||
Net realized and unrealized gain |
.5 | |||
Purchases |
2.6 | |||
Settlements |
(1.5 | ) | ||
Impact of changes in foreign currency exchange rates |
(1.4 | ) | ||
| | | | | |
Balance at December 31, 2016 |
$ | 30.5 | ||
| | | | | |
- (1)
- In connection with the Mactac acquisition completed in August 2016, we assumed plan assets associated with two defined benefit plans in Belgium.
Postretirement Health Benefits
We provide postretirement health benefits to certain retired U.S. employees up to the age of 65 under a cost-sharing arrangement and provide supplemental Medicare benefits to certain U.S. retirees over the age of 65. Our policy is to fund the cost of the postretirement benefits from operating cash flows. While we have not expressed any intent to terminate postretirement health benefits, we may do so at any time, subject to applicable laws and regulations.
Plan Assumptions
Discount Rate
In consultation with our actuaries, we annually review and determine the discount rates used to value our postretirement obligations. The assumed discount rate for each pension plan reflects market rates for high quality corporate bonds currently available. Our discount rate is determined by evaluating yield curves consisting of large populations of high quality corporate bonds. The projected pension benefit payment streams are then matched with bond portfolios to determine a rate that reflects the liability duration unique to our plans.
In 2016, we began using a full yield curve approach to estimate the service and interest cost components of net periodic benefit cost for our pension and other postretirement benefit plans. Under this approach, we applied multiple discount rates from a yield curve composed of the rates of return on several hundred high-quality, fixed income corporate bonds available at the measurement date. We believe this approach provides a more precise measurement of service and interest cost by aligning the timing of the plans' liability cash flows to the corresponding rates on the yield curve. Historically, we estimated the service and interest cost components using a single weighted-average discount rate derived from the yield curve used to measure the benefit obligation at the beginning of the period.
Long-term Return on Assets
We determine the long-term rate of return assumption for plan assets by reviewing the historical and expected returns of both the equity and fixed income markets, taking into account our asset allocation, the correlation between returns in our asset classes, and the mix of active and passive investments. Additionally, current market
| 31 Avery Dennison Corporation 2016 Annual Report | | |
Notes to Consolidated Financial Statements
conditions, including interest rates, are evaluated and market data is reviewed for reasonableness and appropriateness.
Healthcare Cost Trend Rate
Our practice is to fund the cost of postretirement benefits from operating cash flows. For measurement purposes, a 7% annual rate of increase in the per capita cost of covered health care benefits was assumed for 2017. This rate is expected to decrease to 5% by 2024.
A one-percentage-point change in assumed health care cost trend rates would have the following effects:
| (In millions) |
One-percentage-point Increase |
One-percentage-point Decrease |
|||||
|---|---|---|---|---|---|---|---|
| | | | | | | | |
Effect on total of service and interest cost components |
$ | .01 | $ | (.01 | ) | ||
Effect on postretirement benefit obligations |
.3 | (.3 | ) | ||||
| | | | | | | | |
Measurement Date
We measure the actuarial value of our benefit obligations and plan assets using the calendar month-end closest to our fiscal year-end and adjust for any contributions or other significant events between the measurement date and our fiscal year-end.
Plan Balance Sheet Reconciliations
The following table provides a reconciliation of benefit obligations, plan assets, funded status of the plans and accumulated other comprehensive loss for our defined benefit plans:
Plan Benefit Obligations
| |
Pension Benefits | U.S. Postretirement Health Benefits |
|||||||||||||||||
|---|---|---|---|---|---|---|---|---|---|---|---|---|---|---|---|---|---|---|---|
| |
2016 |
2015 |
2016 |
2015 |
|||||||||||||||
| (In millions) |
U.S. |
Int'l |
U.S. |
Int'l |
|
|
|||||||||||||
| | | | | | | | | | | | | | | | | | | | |
Change in projected benefit obligations |
|||||||||||||||||||
Projected benefit obligations at beginning of year |
$ | 1,088.9 | $ | 674.7 | $ | 1,161.1 | $ | 737.1 | $ | 5.9 | $ | 8.0 | |||||||
Service cost |
.4 | 13.9 | .4 | 13.8 | – | – | |||||||||||||
Interest cost |
34.4 | 16.4 | 45.8 | 17.3 | .2 | .2 | |||||||||||||
Participant contribution |
– | 2.9 | – | 3.1 | .5 | .8 | |||||||||||||
Amendments |
– | (.6 | ) | – | (.7 | ) | – | – | |||||||||||
Actuarial loss (gain) |
39.1 | 123.8 | (58.3 | ) | (1.4 | ) | (.2 | ) | (1.4 | ) | |||||||||
Plan transfers |
– | – | – | 2.5 | – | – | |||||||||||||
Acquisition (1) |
– | 14.6 | – | – | – | – | |||||||||||||
Benefits paid |
(59.9 | ) | (21.8 | ) | (60.1 | ) | (19.0 | ) | (1.4 | ) | (1.7 | ) | |||||||
Curtailments |
– | (.3 | ) | – | (2.7 | ) | – | – | |||||||||||
Settlements (2) |
(69.2 | ) | – | – | (13.3 | ) | – | – | |||||||||||
Foreign currency translation |
– | (60.7 | ) | – | (62.0 | ) | – | – | |||||||||||
| | | | | | | | | | | | | | | | | | | | |
Projected benefit obligations at end of year |
$ | 1,033.7 | $ | 762.9 | $ | 1,088.9 | $ | 674.7 | $ | 5.0 | $ | 5.9 | |||||||
| | | | | | | | | | | | | | | | | | | | |
Accumulated benefit obligations at end of year |
$ | 1,033.7 | $ | 704.8 | $ | 1,088.9 | $ | 625.4 | |||||||||||
| | | | | | | | | | | | | | | | | | | | |
- (1)
- In connection with the Mactac acquisition completed in August 2016, we assumed benefit obligations associated with two defined benefit plans in Belgium.
- (2)
- In 2016, settlements were related to the lump-sum pension payments associated with the ADPP.
| | | 32 |
Notes to Consolidated Financial Statements
Plan Assets
| |
Pension Benefits | U.S. Postretirement Health Benefits |
|||||||||||||||||
|---|---|---|---|---|---|---|---|---|---|---|---|---|---|---|---|---|---|---|---|
| |
2016 |
2015 |
2016 |
2015 |
|||||||||||||||
| (In millions) |
U.S. |
Int'l |
U.S. |
Int'l |
|
|
|||||||||||||
| | | | | | | | | | | | | | | | | | | | |
Change in plan assets |
|||||||||||||||||||
Plan assets at beginning of year |
$ | 704.9 | $ | 552.1 | $ | 778.9 | $ | 618.1 | $ | – | $ | – | |||||||
Actual return on plan assets |
42.9 | 79.4 | (28.3 | ) | (7.4 | ) | – | – | |||||||||||
Plan transfers |
– | – | – | (.3 | ) | – | – | ||||||||||||
Acquisition (1) |
– | 8.9 | – | – | – | – | |||||||||||||
Employer contributions |
53.4 | 13.8 | 14.4 | 14.3 | .9 | .9 | |||||||||||||
Participant contributions |
– | 2.9 | – | 3.1 | .5 | .8 | |||||||||||||
Benefits paid |
(59.9 | ) | (21.8 | ) | (60.1 | ) | (19.0 | ) | (1.4 | ) | (1.7 | ) | |||||||
Settlements (2) |
(69.2 | ) | – | – | (4.6 | ) | – | – | |||||||||||
Foreign currency translation |
– | (51.1 | ) | – | (52.1 | ) | – | – | |||||||||||
| | | | | | | | | | | | | | | | | | | | |
Plan assets at end of year |
$ | 672.1 | $ | 584.2 | $ | 704.9 | $ | 552.1 | $ | – | $ | – | |||||||
| | | | | | | | | | | | | | | | | | | | |
- (1)
- In connection with the Mactac acquisition completed in August 2016, we assumed plan assets associated with two defined benefit plans in Belgium.
- (2)
- In 2016, settlements were related to the lump-sum pension payments associated with the ADPP.
Funded Status
| |
Pension Benefits | U.S. Postretirement Health Benefits |
|||||||||||||||||
|---|---|---|---|---|---|---|---|---|---|---|---|---|---|---|---|---|---|---|---|
| |
2016 |
2015 |
2016 |
2015 |
|||||||||||||||
| (In millions) |
U.S. |
Int'l |
U.S. |
Int'l |
|
|
|||||||||||||
| | | | | | | | | | | | | | | | | | | | |
Funded status of the plans |
|||||||||||||||||||
Other accrued liabilities |
$ | (13.5 | ) | $ | (2.0 | ) | $ | (13.4 | ) | $ | (2.2 | ) | $ | (.8 | ) | $ | (1.2 | ) | |
Long-term retirement benefits and other liabilities (1) |
(348.1 | ) | (176.7 | ) | (370.6 | ) | (120.4 | ) | (4.2 | ) | (4.7 | ) | |||||||
| | | | | | | | | | | | | | | | | | | | |
Plan assets less than benefit obligations |
$ | (361.6 | ) | $ | (178.7 | ) | $ | (384.0 | ) | $ | (122.6 | ) | $ | (5.0 | ) | $ | (5.9 | ) | |
| | | | | | | | | | | | | | | | | | | | |
- (1)
- In accordance with our funding strategy, we have the option to fund certain of these liabilities with proceeds from our corporate-owned life insurance policies.
| |
Pension Benefits | U.S. Postretirement Health Benefits |
||||||||||||||||||||||||||
|---|---|---|---|---|---|---|---|---|---|---|---|---|---|---|---|---|---|---|---|---|---|---|---|---|---|---|---|---|
| |
2016 |
2015 |
2014 |
2016 |
2015 |
2014 |
||||||||||||||||||||||
| |
U.S. |
Int'l |
U.S. |
Int'l |
U.S. |
Int'l |
|
|
|
|||||||||||||||||||
| | | | | | | | | | | | | | | | | | | | | | | | | | | | | |
Weighted-average assumptions used to determine year-end benefit obligations |
||||||||||||||||||||||||||||
Discount rate |
4.25 | % | 2.12 | % | 4.55 | % | 2.95 | % | 4.00 | % | 2.54 | % | 3.95 | % | 4.13 | % | 3.50 | % | ||||||||||
Compensation rate increase |
– | 2.27 | – | 2.21 | – | 2.22 | – | – | – | |||||||||||||||||||
| | | | | | | | | | | | | | | | | | | | | | | | | | | | | |
For U.S. and international plans combined, the projected benefit obligations and fair value of plan assets for pension plans with projected benefit obligations in excess of plan assets were $1.80 billion and $1.26 billion, respectively, at year-end 2016 and $1.77 billion and $1.26 billion, respectively, at year-end 2015.
For U.S. and international plans combined, the accumulated benefit obligations and fair value of plan assets for pension plans with accumulated benefit obligations in excess of plan assets were $1.74 billion and $1.26 billion, respectively, at year-end 2016 and $1.38 billion and $910.9 million, respectively, at year-end 2015.
| 33 Avery Dennison Corporation 2016 Annual Report | | |
Notes to Consolidated Financial Statements
Accumulated Other Comprehensive Loss
The following table sets forth the pre-tax amounts recognized in "Accumulated other comprehensive loss" in the Consolidated Balance Sheets:
| |
Pension Benefits | U.S. Postretirement Health Benefits |
|||||||||||||||||
|---|---|---|---|---|---|---|---|---|---|---|---|---|---|---|---|---|---|---|---|
| |
2016 |
2015 |
2016 |
2015 |
|||||||||||||||
| (In millions) |
U.S. |
Int'l |
U.S. |
Int'l |
|
|
|||||||||||||
| | | | | | | | | | | | | | | | | | | | |
Net actuarial loss |
$ | 564.2 | $ | 213.6 | $ | 585.5 | $ | 171.9 | $ | 18.5 | $ | 20.4 | |||||||
Prior service cost (credit) |
17.5 | (4.9 | ) | 18.7 | (4.9 | ) | (16.4 | ) | (19.6 | ) | |||||||||
Net transition obligation |
– | .2 | – | .3 | – | – | |||||||||||||
| | | | | | | | | | | | | | | | | | | | |
Net amount recognized in accumulated other comprehensive loss |
$ | 581.7 | $ | 208.9 | $ | 604.2 | $ | 167.3 | $ | 2.1 | $ | .8 | |||||||
| | | | | | | | | | | | | | | | | | | | |
The following table sets forth the pre-tax amounts, including those of discontinued operations, recognized in "Other comprehensive loss (income)":
| |
Pension Benefits | U.S. Postretirement Health Benefits |
||||||||||||||||||||||||||
|---|---|---|---|---|---|---|---|---|---|---|---|---|---|---|---|---|---|---|---|---|---|---|---|---|---|---|---|---|
| |
2016 |
2015 |
2014 |
2016 |
2015 |
2014 |
||||||||||||||||||||||
| (In millions) |
U.S. |
Int'l |
U.S. |
Int'l |
U.S. |
Int'l |
|
|
|
|||||||||||||||||||
| | | | | | | | | | | | | | | | | | | | | | | | | | | | | |
Net actuarial loss (gain) |
$ | 39.1 | $ | 48.9 | $ | 21.1 | $ | 11.3 | $ | 135.6 | $ | 51.3 | $ | (.2 | ) | $ | (1.4 | ) | $ | .3 | ||||||||
Prior service (credit) cost |
– | (.6 | ) | – | (.7 | ) | – | (7.3 | ) | – | – | – | ||||||||||||||||
Amortization of unrecognized: |
||||||||||||||||||||||||||||
Net actuarial loss |
(19.0 | ) | (7.0 | ) | (20.0 | ) | (9.4 | ) | (16.2 | ) | (5.2 | ) | (1.7 | ) | (2.2 | ) | (2.8 | ) | ||||||||||
Prior service (cost) credit |
(1.2 | ) | .4 | (1.2 | ) | .3 | (1.2 | ) | (.4 | ) | 3.2 | 3.3 | 3.3 | |||||||||||||||
Net transition obligation |
– | (.1 | ) | – | – | – | – | – | – | – | ||||||||||||||||||
Curtailments |
– | – | – | .2 | – | (.6 | ) | – | – | – | ||||||||||||||||||
Settlements |
(41.4 | ) | – | – | (4.3 | ) | (.6 | ) | (.4 | ) | – | – | – | |||||||||||||||
| | | | | | | | | | | | | | | | | | | | | | | | | | | | | |
Net amount recognized in other comprehensive (income) loss |
$ | (22.5 | ) | $ | 41.6 | $ | (.1 | ) | $ | (2.6 | ) | $ | 117.6 | $ | 37.4 | $ | 1.3 | $ | (.3 | ) | $ | .8 | ||||||
| | | | | | | | | | | | | | | | | | | | | | | | | | | | | |
Plan Income Statement Reconciliations
The following table sets forth the components of net periodic benefit cost, which are recorded in income from continuing operations, for our defined benefit plans:
| |
Pension Benefits | U.S. Postretirement Health Benefits |
||||||||||||||||||||||||||
|---|---|---|---|---|---|---|---|---|---|---|---|---|---|---|---|---|---|---|---|---|---|---|---|---|---|---|---|---|
| |
2016 |
2015 |
2014 |
2016 |
2015 |
2014 |
||||||||||||||||||||||
| (In millions) |
U.S. |
Int'l |
U.S. |
Int'l |
U.S. |
Int'l |
|
|
|
|||||||||||||||||||
| | | | | | | | | | | | | | | | | | | | | | | | | | | | | |
Service cost |
$ | .4 | $ | 13.9 | $ | .4 | $ | 13.8 | $ | .4 | $ | 12.9 | $ | – | $ | – | $ | – | ||||||||||
Interest cost |
34.4 | 16.4 | 45.8 | 17.3 | 47.9 | 23.8 | .1 | .3 | .3 | |||||||||||||||||||
Actuarial (gain) loss |
(.2 | ) | – | .4 | – | 4.0 | – | – | – | – | ||||||||||||||||||
Expected return on plan assets |
(42.7 | ) | (21.4 | ) | (51.5 | ) | (21.5 | ) | (51.9 | ) | (26.0 | ) | – | – | – | |||||||||||||
Amortization of actuarial loss |
19.0 | 7.0 | 20.0 | 9.4 | 16.2 | 5.2 | 1.7 | 2.2 | 2.8 | |||||||||||||||||||
Amortization of prior service cost (credit) |
1.2 | (.4 | ) | 1.2 | (.3 | ) | 1.2 | .4 | (3.2 | ) | (3.3 | ) | (3.3 | ) | ||||||||||||||
Amortization of transition obligation |
– | .1 | – | – | – | – | – | – | – | |||||||||||||||||||
Recognized (gain) loss on curtailments |
– | (.2 | ) | – | (.2 | ) | – | .6 | – | – | – | |||||||||||||||||
Recognized loss on settlements(1) |
41.4 | – | – | 4.3 | .6 | .4 | – | – | – | |||||||||||||||||||
| | | | | | | | | | | | | | | | | | | | | | | | | | | | | |
Net periodic benefit cost (credit) |
$ | 53.5 | $ | 15.4 | $ | 16.3 | $ | 22.8 | $ | 18.4 | $ | 17.3 | $ | (1.4 | ) | $ | (.8 | ) | $ | (.2 | ) | |||||||
| | | | | | | | | | | | | | | | | | | | | | | | | | | | | |
- (1)
- In 2016, we recognized a loss on settlements related to the ADPP as a result of making the lump-sum pension payments described above. In 2015, we recognized a loss on settlements related to pension plans in Germany and France as a result of the sale of a product line in our RBIS reportable segment. We also recognized a loss on settlements for events in Switzerland in 2015 and 2014. These losses on settlements were recorded in "Other expense, net" in Consolidated Statements of Income.
The following table sets forth the weighted-average assumptions used to determine net periodic cost:
| |
Pension Benefits | U.S. Postretirement Health Benefits |
||||||||||||||||||||||||||
|---|---|---|---|---|---|---|---|---|---|---|---|---|---|---|---|---|---|---|---|---|---|---|---|---|---|---|---|---|
| |
2016 |
2015 |
2014 |
2016 |
2015 |
2014 |
||||||||||||||||||||||
| |
U.S. |
Int'l |
U.S. |
Int'l |
U.S. |
Int'l |
|
|
|
|||||||||||||||||||
| | | | | | | | | | | | | | | | | | | | | | | | | | | | | |
Discount rate |
4.55 | % | 2.95 | % | 4.00 | % | 2.54 | % | 4.85 | % | 3.88 | % | 4.13 | % | 3.50 | % | 3.45 | % | ||||||||||
Expected return on assets |
7.25 | 4.14 | 7.50 | 4.27 | 7.75 | 4.82 | – | – | – | |||||||||||||||||||
Compensation rate increase |
– | 2.24 | – | 2.22 | – | 2.24 | – | – | – | |||||||||||||||||||
| | | | | | | | | | | | | | | | | | | | | | | | | | | | | |
| | | 34 |
Notes to Consolidated Financial Statements
Plan Contributions
We make contributions to our defined benefit plans sufficient to meet the minimum funding requirements of applicable laws and regulations, plus additional amounts, if any, we determine to be appropriate. The following table sets forth our expected contributions in 2017:
| (In millions) |
|
|||
|---|---|---|---|---|
| | | | | |
U.S. |
$ | 13.8 | ||
Int'l |
13.0 | |||
U.S. postretirement health benefits |
.8 | |||
| | | | | |
Future Benefit Payments
Anticipated future benefit payments, which reflect expected service periods for eligible participants, were as follows:
| |
Pension Benefits | U.S. Postretirement Health Benefits |
||||||||
|---|---|---|---|---|---|---|---|---|---|---|
| (In millions) |
U.S. |
Int'l |
|
|||||||
| | | | | | | | | | | |
2017 |
$ | 61.6 | $ | 16.0 | $ | .8 | ||||
2018 |
83.2 | 16.7 | .5 | |||||||
2019 |
58.9 | 20.1 | .5 | |||||||
2020 |
59.1 | 19.2 | .4 | |||||||
2021 |
60.7 | 19.5 | .4 | |||||||
2022 - 2026 |
305.1 | 120.0 | 1.5 | |||||||
| | | | | | | | | | | |
Estimated Amortization Amounts in Accumulated Other Comprehensive Loss
Our estimates of fiscal year 2017 amortization of amounts included in "Accumulated other comprehensive loss" were as follows:
| |
Pension Benefits |
U.S. Postretirement Health Benefits |
||||||||
|---|---|---|---|---|---|---|---|---|---|---|
| (In millions) |
U.S. |
Int'l |
|
|||||||
| | | | | | | | | | | |
Net actuarial loss |
$ | 18.4 | $ | 10.1 | $ | 1.6 | ||||
Prior service cost (credit) |
.9 | (.4 | ) | (3.3 | ) | |||||
Net transition obligation |
– | .1 | – | |||||||
| | | | | | | | | | | |
Net loss (gain) to be recognized |
$ | 19.3 | $ | 9.8 | $ | (1.7 | ) | |||
| | | | | | | | | | | |
Defined Contribution Plans
We sponsor various defined contribution plans worldwide, the largest of which is the Avery Dennison Corporation Employee Savings Plan ("Savings Plan"), a 401(k) plan for our U.S. employees.
We recognized expense from continuing operations of $20 million, $20.2 million, and $19.4 million in 2016, 2015, and 2014, respectively, related to our employer contributions and employer match of participant contributions to the Savings Plan.
Other Retirement Plans
We have deferred compensation plans which permit eligible employees and directors to defer a portion of their compensation. The compensation voluntarily deferred by the participant, together with certain employer contributions, earns specified and variable rates of return. As of year-end 2016 and 2015, we had accrued $78.7 million and $77.9 million, respectively, for our obligations under these plans. A portion of the interest on certain of our contributions may be forfeited by participants if their employment terminates before age 55 other than by reason of death or disability.
Our Directors Deferred Equity Compensation Plan allows our non-employee directors to elect to receive their cash compensation in deferred stock units ("DSUs") issued under our stock option and incentive plan. Dividend equivalents, representing the value of dividends per share paid on shares of our common stock and calculated with reference to the number of DSUs held as of a quarterly dividend record date, are credited in the form of additional DSUs on the applicable payable date. A director's DSUs are converted into shares of our common stock upon his or her resignation or retirement. Approximately .1 million DSUs were outstanding as of year-end 2016 and 2015, with an aggregate value of $10.2 million and $8 million, respectively.
We hold corporate-owned life insurance policies, the proceeds from which are payable to us upon the death of covered participants. The cash surrender values of these policies, net of outstanding loans, which are included in "Other assets" in the Consolidated Balance Sheets, were $230.6 million and $227.1 million at year-end 2016 and 2015, respectively.
NOTE 7. COMMITMENTS
Minimum annual rental commitments on operating leases having initial or remaining non-cancelable lease terms of one year or more are as follows:
| Year |
(In millions) |
|||
|---|---|---|---|---|
| | | | | |
2017 |
$ | 40.0 | ||
2018 |
29.6 | |||
2019 |
20.0 | |||
2020 |
13.9 | |||
2021 |
8.8 | |||
2022 and thereafter |
25.5 | |||
| | | | | |
Total minimum lease payments |
$ | 137.8 | ||
| | | | | |
Rent expense for operating leases from continuing operations was approximately $58 million in both 2016 and 2015 and $67 million in 2014. Operating leases primarily relate to office and warehouse space and equipment for information technology, machinery, and transportation. The terms of these leases do not impose significant restrictions or unusual obligations.
Refer to Note 4, "Debt and Capital Leases," for information on capital lease obligations.
NOTE 8. CONTINGENCIES
Legal Proceedings
We are involved in various lawsuits, claims, inquiries, and other regulatory and compliance matters, most of which are routine to the nature of our business. When it is probable that a loss will be incurred and where a range of the loss can be reasonably estimated, the best estimate within the range is accrued. When the best estimate within the range cannot be determined, the low end of the range is accrued. The ultimate resolution of these claims could affect future results of operations should our exposure be materially different from our estimates or should liabilities be incurred that were not previously
| 35 Avery Dennison Corporation 2016 Annual Report | | |
Notes to Consolidated Financial Statements
accrued. Potential insurance reimbursements are not offset against potential liabilities.
Because of the uncertainties associated with claims resolution and litigation, future expenses to resolve these matters could be higher than the liabilities we have accrued; however, we are unable to reasonably estimate a range of potential expenses. If information were to become available that allowed us to reasonably estimate a range of potential expenses in an amount higher or lower than what we have accrued, we would adjust our accrued liabilities accordingly. Additional lawsuits, claims, inquiries, and other regulatory and compliance matters could arise in the future. The range of expenses for resolving any future matters would be assessed as they arise; until then, a range of potential expenses for such resolution cannot be determined. Based upon current information, we believe that the impact of the resolution of these matters would not be, individually or in the aggregate, material to our financial position, results of operations or cash flows.
Environmental Expenditures
Environmental expenditures are generally expensed. However, environmental expenditures for newly acquired assets and those which extend or improve the economic useful life of existing assets are capitalized and amortized over the shorter of the estimated useful life of the acquired asset or the remaining life of the existing asset. We review our estimates of costs of compliance with environmental laws related to remediation and cleanup of various sites, including sites in which governmental agencies have designated us as a potentially responsible party ("PRP"). When it is probable that a loss will be incurred and where a range of the loss can be reasonably estimated, the best estimate within the range is accrued. When the best estimate within the range cannot be determined, the low end of the range is accrued. Potential insurance reimbursements are not offset against potential liabilities.
As of December 31, 2016, we have been designated by the U.S. Environmental Protection Agency ("EPA") and/or other responsible state agencies as a PRP at thirteen waste disposal or waste recycling sites that are the subject of separate investigations or proceedings concerning alleged soil and/or groundwater contamination. No settlement of our liability related to any of the sites has been agreed upon. We are participating with other PRPs at these sites and anticipate that our share of remediation costs will be determined pursuant to agreements that we negotiate with the EPA or other governmental authorities.
These estimates could change as a result of changes in planned remedial actions, remediation technologies, site conditions, the estimated time to complete remediation, environmental laws and regulations, and other factors. Because of the uncertainties associated with environmental assessment and remediation activities, future expenses to remediate these sites could be higher than the liabilities we have accrued; however, we are unable to reasonably estimate a range of potential expenses. If information were to become available that allowed us to reasonably estimate a range of potential expenses in an amount higher or lower than what we have accrued, we would adjust our environmental liabilities accordingly. In addition, we may be identified as a PRP at additional sites in the future. The range of expenses for remediation of any future-identified sites would be addressed as they arise; until then, a range of expenses for such remediation cannot be determined.
The activity in 2016 and 2015 related to our environmental liabilities was as follows:
| (In millions) |
2016 |
2015 |
|||||
|---|---|---|---|---|---|---|---|
| | | | | | | | |
Balance at beginning of year |
$ | 17.7 | $ | 26.2 | |||
Charges (reversals), net |
11.6 | 1.2 | |||||
Payments |
(8.0 | ) | (9.7 | ) | |||
| | | | | | | | |
Balance at end of year |
$ | 21.3 | $ | 17.7 | |||
| | | | | | | | |
As of December 31, 2016 and January 2, 2016, approximately $8 million and $7 million, respectively, of the balance was classified as short-term and included in "Other accrued liabilities" in the Consolidated Balance Sheets.
NOTE 9. FAIR VALUE MEASUREMENTS
Recurring Fair Value Measurements
The following table provides the assets and liabilities carried at fair value, measured on a recurring basis, as of December 31, 2016:
| |
|
Fair Value Measurements Using | |||||||||||
|---|---|---|---|---|---|---|---|---|---|---|---|---|---|
| (In millions) |
Total |
Quoted Prices in Active Markets (Level 1) |
Significant Other Observable Inputs (Level 2) |
Significant Other Unobservable Inputs (Level 3) |
|||||||||
| | | | | | | | | | | | | | |
Assets |
|||||||||||||
Trading securities |
$ | 18.1 | $ | 11.7 | $ | 6.4 | $ | – | |||||
Derivative assets |
5.2 | .6 | 4.6 | – | |||||||||
Bank drafts |
14.3 | 14.3 | – | – | |||||||||
Liabilities |
|||||||||||||
Derivative liabilities |
$ | 7.8 | $ | – | $ | 7.8 | $ | – | |||||
| | | | | | | | | | | | | | |
| | | 36 |
Notes to Consolidated Financial Statements
The following table provides the assets and liabilities carried at fair value, measured on a recurring basis, as of January 2, 2016:
| |
|
Fair Value Measurements Using | |||||||||||
|---|---|---|---|---|---|---|---|---|---|---|---|---|---|
| (In millions) |
Total |
Quoted Prices in Active Markets (Level 1) |
Significant Other Observable Inputs (Level 2) |
Significant Other Unobservable Inputs (Level 3) |
|||||||||
| | | | | | | | | | | | | | |
Assets |
|||||||||||||
Trading securities |
$ | 17.9 | $ | 11.3 | $ | 6.6 | $ | – | |||||
Derivative assets |
5.6 | – | 5.6 | – | |||||||||
Bank drafts |
24.8 | 24.8 | – | – | |||||||||
Liabilities |
|||||||||||||
Derivative liabilities |
$ | 5.2 | $ | .7 | $ | 4.5 | $ | – | |||||
| | | | | | | | | | | | | | |
Trading securities include fixed income securities (primarily U.S. government and corporate debt securities) measured at fair value using quoted prices/bids and a money market fund measured at fair value using NAV. As of December 31, 2016, trading securities of $.5 million and $17.6 million were included in "Cash and cash equivalents" and "Other current assets," respectively, in the Consolidated Balance Sheets. As of January 2, 2016, trading securities of $.3 million and $17.6 million were included in "Cash and cash equivalents" and "Other current assets," respectively, in the Consolidated Balance Sheets. Derivatives that are exchange-traded are measured at fair value using quoted market prices and classified within Level 1 of the valuation hierarchy. Derivatives measured based on foreign exchange rate inputs that are readily available in public markets are classified within Level 2 of the valuation hierarchy. Bank drafts (maturities greater than three months) are valued at face value due to their short-term nature and were included in "Other current assets" in the Consolidated Balance Sheets.
We utilized an income approach to estimate the fair values of the identifiable intangibles acquired from Mactac, using primarily Level 3 inputs. The discount rates we used to value these assets were between 10.5% and 12.5%.
NOTE 10. NET INCOME PER COMMON SHARE
Net income per common share was computed as follows:
| (In millions, except per share amounts) |
2016 |
2015 |
2014 |
|||||||||
|---|---|---|---|---|---|---|---|---|---|---|---|---|
| | | | | | | | | | | | | |
(A) |
Income from continuing operations |
$ | 320.7 | $ | 274.4 | $ | 247.3 | |||||
(B) |
Loss from discontinued operations, net of tax |
– | (.1 | ) | (2.2 | ) | ||||||
| | | | | | | | | | | | | |
(C) |
Net income available to common shareholders |
$ | 320.7 | $ | 274.3 | $ | 245.1 | |||||
| | | | | | | | | | | | | |
(D) |
Weighted average number of common shares outstanding |
89.1 | 91.0 | 93.8 | ||||||||
|
Dilutive shares (additional common shares issuable under stock-based awards) |
1.6 | 1.9 | 1.9 | ||||||||
| | | | | | | | | | | | | |
(E) |
Weighted average number of common shares outstanding, assuming dilution |
90.7 | 92.9 | 95.7 | ||||||||
| | | | | | | | | | | | | |
Net income (loss) per common share: |
||||||||||||
Continuing operations (A) ÷ (D) |
$ | 3.60 | $ | 3.01 | $ | 2.64 | ||||||
Discontinued operations (B) ÷ (D) |
– | – | (.03 | ) | ||||||||
| | | | | | | | | | | | | |
Net income per common share (C) ÷ (D) |
$ | 3.60 | $ | 3.01 | $ | 2.61 | ||||||
| | | | | | | | | | | | | |
Net income (loss) per common share, assuming dilution: |
||||||||||||
Continuing operations (A) ÷ (E) |
$ | 3.54 | $ | 2.95 | $ | 2.58 | ||||||
Discontinued operations (B) ÷ (E) |
– | – | (.02 | ) | ||||||||
| | | | | | | | | | | | | |
Net income per common share, assuming dilution (C) ÷ (E) |
$ | 3.54 | $ | 2.95 | $ | 2.56 | ||||||
| | | | | | | | | | | | | |
Certain stock-based compensation awards were not included in the computation of net income per common share, assuming dilution, because they would not have had a dilutive effect. Stock-based compensation awards excluded from the computation totaled approximately .2 million shares in 2016, 1 million shares in 2015, and 3 million shares in 2014.
| 37 Avery Dennison Corporation 2016 Annual Report | | |
Notes to Consolidated Financial Statements
NOTE 11. SUPPLEMENTAL EQUITY AND COMPREHENSIVE INCOME INFORMATION
Common Stock and Share Repurchase Program
Our Certificate of Incorporation authorizes five million shares of $1 par value preferred stock (of which none are outstanding), with respect to which our Board of Directors ("Board") may fix the series and terms of issuance, and 400 million shares of $1 par value voting common stock.
From time to time, our Board authorizes the repurchase of shares of our outstanding common stock. Repurchased shares may be reissued under our stock option and incentive plan or used for other corporate purposes. In 2016, we repurchased approximately 3.8 million shares of our common stock at an aggregate cost of $262.4 million.
On December 4, 2014, our Board authorized the repurchase of shares of our common stock in the aggregate amount of up to $500 million (exclusive of any fees, commissions, or other expenses related to such purchases), in addition to any outstanding shares authorized under any previous Board authorization. This authorization is the only one currently in effect and it will remain in effect until shares in the amount authorized have been repurchased. As of December 31, 2016, shares of our common stock in the aggregate amount of approximately $105 million remained authorized for repurchase under this Board authorization.
Treasury Shares Reissuance
We fund a portion of our employee-related expenses using shares of our common stock held in treasury. We record net gains or losses associated with our use of treasury shares to retained earnings.
Other Comprehensive Income
The changes in "Accumulated other comprehensive loss" (net of tax) for 2016 and 2015 were as follows:
| (In millions) |
Foreign Currency Translation |
Pension and Other Postretirement Benefits |
Cash Flow Hedges |
Total |
|||||||||
|---|---|---|---|---|---|---|---|---|---|---|---|---|---|
| | | | | | | | | | | | | | |
Balance as of January 3, 2015 |
$ | (19.9 | ) | $ | (525.6 | ) | $ | – | $ | (545.5 | ) | ||
Other comprehensive loss before reclassifications, net of tax |
(139.0 | ) | (18.9 | ) | (.5 | ) | (158.4 | ) | |||||
Reclassifications to net income, net of tax |
– | 22.9 | (2.0 | ) | 20.9 | ||||||||
| | | | | | | | | | | | | | |
Net current-period other comprehensive (loss) income, net of tax |
(139.0 | ) | 4.0 | (2.5 | ) | (137.5 | ) | ||||||
| | | | | | | | | | | | | | |
Balance as of January 2, 2016 |
$ | (158.9 | ) | $ | (521.6 | ) | $ | (2.5 | ) | $ | (683.0 | ) | |
Other comprehensive (loss) income before reclassifications, net of tax |
(53.7 | ) | (62.9 | ) | .7 | (115.9 | ) | ||||||
Reclassifications to net income, net of tax |
– | 44.2 | 2.8 | 47.0 | |||||||||
| | | | | | | | | | | | | | |
Net current-period other comprehensive (loss) income, net of tax |
(53.7 | ) | (18.7 | ) | 3.5 | (68.9 | ) | ||||||
| | | | | | | | | | | | | | |
Balance as of December 31, 2016 |
$ | (212.6 | ) | $ | (540.3 | ) | $ | 1.0 | $ | (751.9 | ) | ||
| | | | | | | | | | | | | | |
The amounts reclassified from "Accumulated other comprehensive loss" to increase (decrease) income from continuing operations were as follows:
| (In millions) |
2016 |
2015 |
2014 |
Affected Line Item in the Statements Where Net Income is Presented |
|||||||
|---|---|---|---|---|---|---|---|---|---|---|---|
| | | | | | | | | | | | |
Cash flow hedges: |
|||||||||||
Foreign exchange contracts |
$ | (3.0 | ) | $ | 3.9 | $ | (1.2 | ) | Cost of products sold | ||
Commodity contracts |
(.7 | ) | (1.3 | ) | .1 | Cost of products sold | |||||
Interest rate contracts |
(.1 | ) | (.1 | ) | (.1 | ) | Interest expense | ||||
| | | | | | | | | | | | |
|
(3.8 | ) | 2.5 | (1.2 | ) | Total before tax | |||||
|
1.0 | (.5 | ) | .3 | Provision for income taxes | ||||||
| | | | | | | | | | | | |
|
(2.8 | ) | 2.0 | (.9 | ) | Net of tax | |||||
| | | | | | | | | | | | |
Pension and other postretirement benefits (1) |
(66.8 | ) | (33.3 | ) | (24.1 | ) | |||||
|
22.6 | 10.4 | 7.2 | Provision for income taxes | |||||||
| | | | | | | | | | | | |
|
(44.2 | ) | (22.9 | ) | (16.9 | ) | Net of tax | ||||
| | | | | | | | | | | | |
Total reclassifications for the period |
$ | (47.0 | ) | $ | (20.9 | ) | $ | (17.8 | ) | Total, net of tax | |
| | | | | | | | | | | | |
- (1)
- See Note 6, "Pension and Other Postretirement Benefits," for more information.
The following table sets forth the income tax (benefit) expense allocated to each component of other comprehensive loss:
| (In millions) |
2016 |
2015 |
2014 |
|||||||
|---|---|---|---|---|---|---|---|---|---|---|
| | | | | | | | | | | |
Pension and other postretirement benefits: |
||||||||||
Net loss recognized from actuarial gain/loss and prior service cost/credit |
$ | (24.2 | ) | $ | (11.4 | ) | $ | (54.7 | ) | |
Reclassifications to net income |
22.6 | 10.4 | 7.2 | |||||||
Cash flow hedges: |
||||||||||
Gains (losses) recognized on cash flow hedges |
.1 | (.3 | ) | .1 | ||||||
Reclassifications to net income |
1.0 | (.5 | ) | .3 | ||||||
| | | | | | | | | | | |
Income tax benefit related to items of other comprehensive loss |
$ | (.5 | ) | $ | (1.8 | ) | $ | (47.1 | ) | |
| | | | | | | | | | | |
| | | 38 |
Notes to Consolidated Financial Statements
NOTE 12. LONG-TERM INCENTIVE COMPENSATION
Equity Awards
Stock-Based Compensation
We maintain various stock option and incentive plans and grant our annual stock-based compensation awards to eligible employees in February and non-employee directors in May. Certain awards granted to retirement-eligible employees vest in full upon retirement; awards to these employees are accounted for as fully vested on the date of grant.
Stock-based compensation expense from continuing operations and the total related recognized tax benefit were as follows:
| (In millions) |
2016 |
2015 |
2014 |
|||||||
|---|---|---|---|---|---|---|---|---|---|---|
| | | | | | | | | | | |
Stock-based compensation expense |
$ | 27.2 | $ | 26.3 | $ | 28.3 | ||||
Tax benefit |
8.5 | 8.2 | 10.5 | |||||||
| | | | | | | | | | | |
This expense was included in "Marketing, general and administrative expense" in the Consolidated Statements of Income.
As of December 31, 2016, we had approximately $37 million of unrecognized compensation expense from continuing operations related to unvested stock-based awards, which is expected to be recognized over the remaining weighted-average requisite service period of approximately two years.
Stock Options
Stock options granted to non-employee directors and employees may be granted at no less than 100% of the fair market value of our common stock on the date of the grant. Options generally vest ratably over a three-year period for non-employee directors and over a four-year period for employees. Options expire ten years from the date of grant.
The fair value of stock options is estimated as of the date of grant using the Black-Scholes option-pricing model. This model requires input assumptions for our expected dividend yield, expected stock price volatility, risk-free interest rate and the expected option term. The following assumptions are used in estimating the fair value of granted stock options:
Risk-free interest rate is based on the 52-week average of the Treasury-Bond rate that has a term corresponding to the expected option term.
Expected stock price volatility represents an average of the implied and historical volatility.
Expected dividend yield is based on the current annual dividend divided by the 12-month average of our monthly stock price prior to grant.
Expected option term is determined based on historical experience under our stock option and incentive plans.
The weighted-average grant date fair value per share for stock options granted in 2016 was $14.17. No stock options were granted in fiscal years 2015 and 2014.
The underlying weighted-average assumptions used were as follows:
| |
2016 |
|||
|---|---|---|---|---|
| | | | | |
Risk-free interest rate |
1.75 | % | ||
Expected stock price volatility |
24.58 | % | ||
Expected dividend yield |
2.58 | % | ||
Expected option term |
6.5 years | |||
| | | | | |
The following table sets forth stock option information during 2016:
| |
Number of options (in thousands) |
Weighted-average exercise price |
Weighted-average remaining contractual life (in years) |
Aggregate intrinsic value (in millions) |
|||||||
|---|---|---|---|---|---|---|---|---|---|---|---|
| | | | | | | | | | | | |
Outstanding at January 2, 2016 |
2,369.9 | $ | 45.30 | 3.68 | $ | 43.8 | |||||
Granted |
141.1 | 73.96 | |||||||||
Exercised |
(1,384.1 | ) | 51.35 | ||||||||
Forfeited or expired |
(11.7 | ) | 58.16 | ||||||||
| | | | | | | | | | | | |
Outstanding at December 31, 2016 |
1,115.2 | $ | 41.29 | 4.72 | $ | 32.8 | |||||
Options vested and expected to vest at December 31, 2016 |
1,091.3 | 40.57 | 4.62 | 32.8 | |||||||
Options exercisable at December 31, 2016 |
974.1 | $ | 36.55 | 4.04 | $ | 32.8 | |||||
| | | | | | | | | | | | |
The total intrinsic value of stock options exercised was $31.7 million in 2016, $43.3 million in 2015, and $15.4 million in 2014. We received approximately $71 million in 2016, $104 million in 2015, and $34.2 million in 2014 from the exercise of stock options. The tax benefit associated with these exercised options was $11.3 million in 2016, $15.6 million in 2015, and $5.3 million in 2014. The intrinsic value of a stock option is based on the amount by which the market value of the underlying stock exceeds the exercise price of the option.
Performance Units ("PUs")
PUs are performance-based awards granted to eligible employees under our stock option and incentive plan. PUs are payable in shares of our common stock at the end of a three-year cliff vesting period provided that certain performance objectives are achieved at the end of the period. Over the performance period, the estimated number of shares of our common stock issuable upon vesting is adjusted upward or downward based upon the probability of the achievement of the performance objectives established for the award. The actual number of shares issued can range from 0% to 200% of the target shares at the time of grant. The weighted-average grant date fair value for PUs was $68.04, $51.37, and $47.85 in 2016, 2015, and 2014, respectively.
| 39 Avery Dennison Corporation 2016 Annual Report | | |
Notes to Consolidated Financial Statements
The following table summarizes information related to awarded PUs:
| |
Number of PUs (in thousands) |
Weighted- average grant-date fair value |
|||||
|---|---|---|---|---|---|---|---|
| | | | | | | | |
Unvested at January 2, 2016 |
447.1 | $ | 47.63 | ||||
Granted at target |
244.7 | 68.04 | |||||
Adjustment for above-target performance (1) |
155.6 | 43.91 | |||||
Vested |
(315.6 | ) | 43.82 | ||||
Forfeited/cancelled |
(41.0 | ) | 54.84 | ||||
| | | | | | | | |
Unvested at December 31, 2016 |
490.8 | $ | 58.47 | ||||
| | | | | | | | |
- (1)
- Reflects awards granted in excess of target as a result of our achieving above-target performance for the 2013-2015 performance period.
The fair value of vested PUs was $13.8 million in 2016 and $12.2 million in 2015. In 2014, the PUs granted in 2011 were cancelled as the performance objective was not met as of the end of the three-year performance period.
Market-Leveraged Stock Units ("MSUs")
MSUs are performance-based awards granted to eligible employees under our stock option and incentive plan. MSUs are payable in shares of our common stock over a four-year period provided that the performance objective is achieved as of the end of each vesting period. MSUs accrue dividend equivalents during the vesting period, which are earned and paid only at vesting provided that, at a minimum, threshold performance is achieved. The number of shares earned is based upon our absolute total shareholder return at each vesting date and can range from 0% to 200% of the target amount of MSUs subject to vesting. Each of the four vesting periods represents one tranche of MSUs and the fair value of each of these four tranches was determined using the Monte-Carlo simulation model, which utilizes multiple input variables, including expected stock price volatility and other assumptions, to estimate the probability of achieving the performance objective established for the award. The weighted-average grant date fair value for MSUs was $72.93, $56.46, and $52.76 in 2016, 2015, and 2014, respectively.
The following table summarizes information related to awarded MSUs:
| |
Number of MSUs (in thousands) |
Weighted- average grant-date fair value |
|||||
|---|---|---|---|---|---|---|---|
| | | | | | | | |
Unvested at January 2, 2016 |
606.1 | $ | 55.04 | ||||
Granted at target |
182.9 | 72.93 | |||||
Adjustments for above-target performance (1) |
67.4 | 51.58 | |||||
Vested |
(264.3 | ) | 46.88 | ||||
Forfeited/cancelled |
(61.4 | ) | 57.80 | ||||
| | | | | | | | |
Unvested at December 31, 2016 |
530.7 | $ | 62.09 | ||||
| | | | | | | | |
- (1)
- Reflects adjustments as a result of achieving above-target performance for each of the performance periods paid out in 2016.
The fair value of vested MSUs was $12.4 million in 2016, $9.8 million in 2015, and $5.6 million in 2014.
Restricted Stock Units ("RSUs")
RSUs are service-based awards granted to eligible employees under our stock option and incentive plan, which generally vest ratably over a period of three years for non-employee directors and four years for employees provided that directorship or employment continues through the applicable vesting date. If that condition is not met, unvested RSUs are generally forfeited. The weighted-average grant date fair value for RSUs was $67.66, $53.29, and $45.91 in 2016, 2015, and 2014, respectively.
The following table summarizes information related to awarded RSUs:
| |
Number of RSUs (in thousands) |
Weighted- average grant-date fair value |
|||||
|---|---|---|---|---|---|---|---|
| | | | | | | | |
Unvested at January 2, 2016 |
214.6 | $ | 40.96 | ||||
Granted |
52.8 | 67.66 | |||||
Vested |
(147.3 | ) | 36.14 | ||||
Forfeited/cancelled |
(2.4 | ) | 38.74 | ||||
| | | | | | | | |
Unvested at December 31, 2016 |
117.7 | $ | 58.87 | ||||
| | | | | | | | |
The fair value of vested RSUs was $5.3 million, $8.4 million, and $9.5 million in 2016, 2015, and 2014, respectively.
Cash Awards
Long-Term Incentive Units ("LTI Units")
LTI Units are granted to eligible employees under our long-term incentive unit plan. LTI Units are service-based awards that generally vest ratably over a four-year period. The settlement value equals the number of vested LTI Units multiplied by the average of the high and low market prices of our common stock on the vesting date. The compensation expense related to these awards is amortized on a straight-line basis and the fair value is remeasured using the estimated percentage of units expected to be earned multiplied by the average of the high and low market prices of our common stock at each quarter-end.
We also grant cash-based awards in the form of performance and market-leveraged LTI Units to eligible employees. Performance LTI Units are payable in cash at the end of a three-year cliff vesting period provided that certain performance objectives are achieved at the end of the performance period. Market-leveraged LTI Units are payable in cash and vest ratably over a period of four years. The number of performance and market-leveraged LTI Units earned at vesting is adjusted upward or downward based upon the probability of achieving the performance objectives established for the respective award and the actual number of units issued can range from 0% to 200% of the target units subject to vesting. The performance and market-leveraged LTI Units are remeasured using the estimated percentage of units expected to be earned multiplied by the average of the high and low market prices of our common stock at each quarter-end over their respective performance periods. The compensation expense related to performance LTI Units is amortized on a straight-line basis over their respective performance periods. The compensation expense related to market-leveraged LTI Units is amortized on a graded-vesting basis over their respective performance periods.
The compensation expense from continuing operations related to LTI Units was $23.8 million in 2016, $27.1 million in 2015, and $17.8 million in 2014. This expense was included in "Marketing, general
| | | 40 |
Notes to Consolidated Financial Statements
and administrative expense" in the Consolidated Statements of Income. The total recognized tax benefit related to LTI Units was $7.8 million in 2016, $8.6 million in 2015, and $5.7 million in 2014.
NOTE 13. COST REDUCTION ACTIONS
Restructuring Charges
We have compensation plans that provide eligible employees with severance in the event of an involuntary termination due to qualifying cost reduction actions. We calculate severance using benefit formulas under the respective plans. Accordingly, we record provisions for severance and other exit costs (including asset impairment charges and lease and other contract cancellation costs) when they are probable and estimable. In the absence of a plan or established local practice in overseas jurisdictions, liabilities for restructuring charges are recognized when incurred.
2015/2016 Actions
During fiscal year 2016, we recorded $20.9 million in restructuring charges, net of reversals, related to restructuring actions initiated during the third quarter of 2015 ("2015/2016 Actions") that we expect to continue through 2017. These charges consisted of severance and related costs for the reduction of approximately 440 positions, lease cancellation costs, and asset impairment charges.
During fiscal year 2015, we recorded $26.1 million in restructuring charges, net of reversals, related to our 2015/2016 Actions. These charges consisted of severance and related costs for the reduction of approximately 430 positions, lease cancellation costs, and asset impairment charges.
No employees impacted by our 2015/2016 Actions taken through December 31, 2016 remained employed by us as of such date.
2014/2015 Actions
During fiscal year 2015, we recorded $33.4 million in restructuring charges, net of reversals, related to restructuring actions we initiated in 2014 that continued through the second quarter of 2015 ("2014/2015 Actions"). These charges consisted of severance and related costs for the reduction of approximately 605 positions, lease cancellation costs, and asset impairment charges.
During fiscal year 2014, we recorded $66.5 million in restructuring charges, net of reversals, related to our 2014/2015 Actions. These charges consisted of severance and related costs for the reduction of approximately 1,420 positions, lease cancellation costs, and asset impairment charges.
No employees impacted by our 2014/2015 Actions remained employed by us as of December 31, 2016.
Accruals for severance and related costs and lease cancellation costs were included in "Other accrued liabilities" in the Consolidated Balance Sheets. Asset impairment charges were based on the estimated market value of the assets, less selling costs, if applicable. Restructuring charges in continuing operations were included in "Other expense, net" in the Consolidated Statements of Income.
During 2016, restructuring charges and payments were as follows:
| (In millions) |
Accrual at January 2, 2016 |
Charges (Reversals), net |
Cash Payments |
Non-cash Impairment |
Foreign Currency Translation |
Accrual at December 31, 2016 |
|||||||||||||
|---|---|---|---|---|---|---|---|---|---|---|---|---|---|---|---|---|---|---|---|
| | | | | | | | | | | | | | | | | | | | |
2015/2016 Actions |
|||||||||||||||||||
Severance and related costs |
$ | 8.4 | $ | 15.7 | $ | (20.9 | ) | $ | – | $ | .1 | $ | 3.3 | ||||||
Asset impairment charges |
– | 4.1 | – | (4.1 | ) | – | – | ||||||||||||
Lease cancellation costs |
.2 | 1.1 | (1.1 | ) | – | – | .2 | ||||||||||||
2014/2015 Actions |
|||||||||||||||||||
Severance and related costs |
4.8 | (.9 | ) | (3.2 | ) | – | – | .7 | |||||||||||
Prior actions |
|||||||||||||||||||
Severance and related costs |
.7 | (.1 | ) | – | – | – | .6 | ||||||||||||
| | | | | | | | | | | | | | | | | | | | |
Total |
$ | 14.1 | $ | 19.9 | $ | (25.2 | ) | $ | (4.1 | ) | $ | .1 | $ | 4.8 | |||||
| | | | | | | | | | | | | | | | | | | | |
During 2015, restructuring charges and payments were as follows:
| (In millions) |
Accrual at January 3, 2015 |
Charges (Reversals), net |
Cash Payments |
Non-cash Impairment |
Foreign Currency Translation |
Accrual at January 2, 2016 |
|||||||||||||
|---|---|---|---|---|---|---|---|---|---|---|---|---|---|---|---|---|---|---|---|
| | | | | | | | | | | | | | | | | | | | |
2015/2016 Actions |
|||||||||||||||||||
Severance and related costs |
$ | – | $ | 22.7 | $ | (14.3 | ) | $ | – | $ | – | $ | 8.4 | ||||||
Asset impairment charges |
– | 2.9 | – | (2.9 | ) | – | – | ||||||||||||
Lease cancellation costs |
– | .5 | (.3 | ) | – | – | .2 | ||||||||||||
2014/2015 Actions |
|||||||||||||||||||
Severance and related costs |
16.8 | 29.8 | (40.9 | ) | – | (.9 | ) | 4.8 | |||||||||||
Asset impairment charges |
– | 3.3 | – | (3.3 | ) | – | – | ||||||||||||
Lease cancellation costs |
.1 | .3 | (.4 | ) | – | – | – | ||||||||||||
Prior actions |
|||||||||||||||||||
Severance and related costs |
.8 | – | – | – | (.1 | ) | .7 | ||||||||||||
| | | | | | | | | | | | | | | | | | | | |
Total |
$ | 17.7 | $ | 59.5 | $ | (55.9 | ) | $ | (6.2 | ) | $ | (1.0 | ) | $ | 14.1 | ||||
| | | | | | | | | | | | | | | | | | | | |
| 41 Avery Dennison Corporation 2016 Annual Report | | |
Notes to Consolidated Financial Statements
The table below shows the total amount of restructuring charges incurred by reportable segment and Corporate:
| (In millions) |
2016 |
2015 |
2014 |
|||||||
|---|---|---|---|---|---|---|---|---|---|---|
| | | | | | | | | | | |
Restructuring charges by reportable segment and Corporate |
||||||||||
Label and Graphic Materials |
$ | 8.5 | $ | 13.6 | $ | 40.1 | ||||
Retail Branding and Information Solutions |
10.5 | 35.7 | 21.3 | |||||||
Industrial and Healthcare Materials |
.9 | 8.0 | 4.3 | |||||||
Corporate |
– | 2.2 | .4 | |||||||
| | | | | | | | | | | |
Total |
$ | 19.9 | $ | 59.5 | $ | 66.1 | ||||
| | | | | | | | | | | |
NOTE 14. TAXES BASED ON INCOME
Taxes based on income (loss) were as follows:
| (In millions) |
2016 |
2015 |
2014 |
|||||||
|---|---|---|---|---|---|---|---|---|---|---|
| | | | | | | | | | | |
Current: |
||||||||||
U.S. federal tax |
$ | 10.1 | $ | 26.4 | $ | 14.5 | ||||
State taxes |
.6 | (.1 | ) | (.2 | ) | |||||
International taxes |
77.3 | 92.7 | 116.0 | |||||||
| | | | | | | | | | | |
|
88.0 | 119.0 | 130.3 | |||||||
| | | | | | | | | | | |
Deferred: |
||||||||||
U.S. federal tax |
64.4 | 6.3 | (16.1 | ) | ||||||
State taxes |
(3.0 | ) | .5 | 1.9 | ||||||
International taxes |
7.0 | 8.7 | (2.6 | ) | ||||||
| | | | | | | | | | | |
|
68.4 | 15.5 | (16.8 | ) | ||||||
| | | | | | | | | | | |
Provision for income taxes |
$ | 156.4 | $ | 134.5 | $ | 113.5 | ||||
| | | | | | | | | | | |
The principal items accounting for the difference between taxes computed at the U.S. statutory rate and taxes recorded were as follows:
| (In millions) |
2016 |
2015 |
2014 |
|||||||
|---|---|---|---|---|---|---|---|---|---|---|
| | | | | | | | | | | |
Computed tax at 35% of income before taxes |
$ | 167.0 | $ | 143.1 | $ | 126.2 | ||||
Increase (decrease) in taxes resulting from: |
||||||||||
State taxes, net of federal tax benefit |
2.2 | 1.3 | 1.4 | |||||||
Foreign earnings taxed at different rates (1) |
27.0 | (7.5 | ) | (14.9 | ) | |||||
Valuation allowance |
(11.9 | ) | .9 | 9.9 | ||||||
Corporate-owned life insurance |
(4.3 | ) | (1.9 | ) | (4.2 | ) | ||||
U.S. federal research and development tax credits |
(2.9 | ) | (2.6 | ) | (1.6 | ) | ||||
Tax contingencies and audit settlements |
(20.7 | ) | 5.1 | (1.5 | ) | |||||
Other items, net |
– | (3.9 | ) | (1.8 | ) | |||||
| | | | | | | | | | | |
Provision for income taxes |
$ | 156.4 | $ | 134.5 | $ | 113.5 | ||||
| | | | | | | | | | | |
- (1)
- Included foreign earnings taxed in the U.S., net of credits, in all years.
Income (loss) from continuing operations before taxes from our U.S. and international operations was as follows:
| (In millions) |
2016 |
2015 |
2014 |
|||||||
|---|---|---|---|---|---|---|---|---|---|---|
| | | | | | | | | | | |
U.S. |
$ | 17.9 | $ | 33.9 | $ | (.1 | ) | |||
International |
459.2 | 375.0 | 360.9 | |||||||
| | | | | | | | | | | |
Income from continuing operations before taxes |
$ | 477.1 | $ | 408.9 | $ | 360.8 | ||||
| | | | | | | | | | | |
The effective tax rate for continuing operations was 32.8%, 32.9%, and 31.5% for fiscal years 2016, 2015, and 2014, respectively.
The 2016 effective tax rate for continuing operations included a tax expense of $7.6 million associated with the cost to repatriate non-permanently reinvested current earnings of certain foreign subsidiaries and a tax expense of $46.3 million related to the U.S. income and foreign withholding taxes resulting from changes in indefinite reinvestment assertions on certain foreign earnings; benefits from changes in certain tax reserves, including interest and penalties, of $16.8 million resulting from settlements of certain foreign audits and $5.4 million resulting from expirations of statutes of limitations; benefits of $6.7 million from the release of valuation allowances against certain deferred tax assets in a foreign jurisdiction associated with a structural simplification approved by the tax authority and $3.6 million from the release of valuation allowances on certain state deferred tax assets; and a tax expense of $8.4 million from deferred tax adjustments resulting from enacted tax rate changes in certain foreign jurisdictions.
We assess the available positive and negative evidence to estimate if sufficient future taxable income will be generated to use existing deferred tax assets. On the basis of this evaluation, we record valuation allowances only with respect to the portion of the deferred tax asset that is more likely than not to be realized. However, the amount of the deferred tax asset considered realizable could be adjusted if estimates of future taxable income during the carryforward period changes or if objective negative evidence in the form of cumulative losses is no longer present. For example, if our U.S. profitability improves at a higher-than-expected rate, it is possible that the remaining valuation allowances on state deferred tax assets could be subject to further releases.
In connection with our initiatives to simplify our corporate legal entity and intercompany financing structures, we evaluated the facts and circumstances surrounding the indefinite reinvestment assertions on certain foreign earnings that would be affected as a result of our actions to improve structural and operational efficiency. Our evaluation considered working capital, long-term liquidity, capitalization improvement, acquisition plans, and alignment of the existing structure with long-term strategic plans. As a result of this evaluation, we determined that the excess of the amount for financial reporting over the tax basis of investments in certain foreign subsidiaries is subject to reversal in the foreseeable future. As a result, we recorded a tax provision for the effects of changes in indefinite reinvestment assertions in 2016.
The 2015 effective tax rate for continuing operations included tax expense of $20 million associated with the tax cost to repatriate non-permanently reinvested 2015 earnings of certain foreign subsidiaries; benefits from changes in certain tax reserves, including interest and penalties, of $5.8 million resulting from settlements of audits and $8.2 million resulting from expirations of statutes of limitations; and
| | | 42 |
Notes to Consolidated Financial Statements
a tax benefit of $2.6 million from the extension of the federal research and development credit.
The 2014 effective tax rate for continuing operations included tax benefits for changes in certain tax reserves, including interest and penalties, of $10.2 million resulting from settlements of audits and $18.1 million resulting from expirations of statutes of limitations; a repatriation tax benefit of $9.8 million related to certain foreign losses; a tax expense of $9.1 million from the taxable inclusion of a net foreign currency gain related to the revaluation of certain intercompany loans; a tax expense of $10.6 million related to our change in estimate of the potential outcome of uncertain tax issues in China and Germany; and a state tax expense of $2.5 million primarily related to gains arising as a result of certain foreign reorganizations.
On December 18, 2015, the Protecting Americans from Tax Hikes Act of 2015 ("PATH Act") was enacted, which included a provision making permanent the federal research and development tax credit for the tax years 2015 and beyond. The PATH Act also retroactively extended the controlled foreign corporation ("CFC") look-through rule that had expired on December 31, 2014. For periods during which the look-through rule was effective, U.S. federal income tax on certain dividends, interest, rents, and royalties received or accrued by a CFC of a U.S. multinational enterprise from a related CFC are deferred. The retroactive effects of the extension of the CFC look-through rule did not have a material impact on our effective tax rate or operating results. The extension of the CFC look-through rule is currently scheduled to expire on December 31, 2019.
Due to recent changes in the U.S. government, U.S. tax reform may be enacted in the near future. Significant changes that could occur include a reduction of the corporate income tax rate, a one-time deemed repatriation of untaxed foreign earnings, border adjustability, territoriality, and various increases to the tax base. Due to the lack of clarity regarding if, how, and when any such tax reform will be enacted, the potential impact of U.S. tax reform is unclear. We continue to closely monitor these developments.
Deferred income taxes for approximately $1.9 billion of undistributed earnings of foreign subsidiaries have not been provided as of December 31, 2016 since these amounts are intended to be indefinitely reinvested in foreign operations. It is not practicable to calculate the deferred taxes associated with these earnings because of the variability of multiple factors that would need to be assessed at the time of any assumed repatriation; however, foreign tax credits would likely be available to reduce federal income taxes in the event of distribution. In making this assertion, we evaluate, among other factors, the profitability of our U.S. and foreign operations and the need for cash within and outside the U.S., including cash requirements for capital improvements, acquisitions, market expansion, dividends, and stock repurchases.
Deferred income taxes reflect the temporary differences between the amounts at which assets and liabilities are recorded for financial reporting purposes and the amounts utilized for tax purposes. The primary components of the temporary differences that gave rise to our deferred tax assets and liabilities were as follows:
| (In millions) |
2016 |
2015 |
|||||
|---|---|---|---|---|---|---|---|
| | | | | | | | |
Accrued expenses not currently deductible |
$ | 42.1 | $ | 35.1 | |||
Net operating losses |
195.9 | 253.3 | |||||
Tax credit carryforwards |
111.3 | 114.4 | |||||
Stock-based compensation |
28.4 | 37.3 | |||||
Pension and other postretirement benefits |
207.7 | 204.6 | |||||
Inventory reserves |
7.1 | 6.9 | |||||
Other assets |
.9 | 8.9 | |||||
Valuation allowance |
(60.4 | ) | (73.0 | ) | |||
| | | | | | | | |
Total deferred tax assets (1) |
533.0 | 587.5 | |||||
| | | | | | | | |
Depreciation and amortization |
(86.1 | ) | (101.0 | ) | |||
Repatriation accrual (2) |
(62.1 | ) | (9.8 | ) | |||
Foreign operating loss recapture |
(79.8 | ) | (108.3 | ) | |||
Other liabilities |
(2.3 | ) | (2.9 | ) | |||
| | | | | | | | |
Total deferred tax liabilities (1) |
(230.3 | ) | (222.0 | ) | |||
| | | | | | | | |
Total net deferred tax assets |
$ | 302.7 | $ | 365.5 | |||
| | | | | | | | |
- (1)
- Reflect gross amounts before jurisdictional netting of deferred tax assets and liabilities.
- (2)
- Included in the repatriation accruals as of December 31, 2016 and January 2, 2016 was a net deferred tax liability of $62.4 million and $12.5 million, respectively, associated with the future tax cost to repatriate non-permanently reinvested earnings of our foreign subsidiaries, which is offset by a contra deferred tax liability of $.3 million and $2.7 million, respectively, related to unrealized foreign exchange losses associated with earnings of our foreign subsidiaries that can be repatriated to the U.S. in future periods without incurring any additional U.S. federal income tax.
A valuation allowance is recorded to reduce deferred tax assets to the amount that is more likely than not to be realized. The valuation allowance at December 31, 2016 and January 2, 2016 was $60.4 million and $73 million, respectively.
Net operating loss carryforwards of foreign subsidiaries at December 31, 2016 and January 2, 2016 were $689.9 million and $825.8 million, respectively. Tax credit carryforwards of both domestic and foreign subsidiaries at December 31, 2016 and January 2, 2016
| 43 Avery Dennison Corporation 2016 Annual Report | | |
Notes to Consolidated Financial Statements
totaled $111.3 million and $114.4 million, respectively. If unused, foreign net operating losses and tax credit carryforwards will expire as follows:
| (In millions) |
Net Operating Losses (1) |
Tax Credits |
|||||
|---|---|---|---|---|---|---|---|
| | | | | | | | |
Expires in 2017 |
$ | 10.0 | $ | .6 | |||
Expires in 2018 |
12.6 | 13.1 | |||||
Expires in 2019 |
4.7 | 33.1 | |||||
Expires in 2020 |
5.4 | 15.8 | |||||
Expires in 2021 |
4.1 | .4 | |||||
Expires in 2022 |
9.6 | 9.6 | |||||
Expires in 2023 |
6.7 | 5.1 | |||||
Expires in 2024 |
11.2 | .3 | |||||
Expires in 2025 |
4.4 | 7.2 | |||||
Expires in 2026 |
.5 | 3.7 | |||||
Expires in 2027 |
.2 | .2 | |||||
Expires in 2028 |
.5 | .1 | |||||
Expires in 2029 |
– | .1 | |||||
Expires in 2030 |
– | .1 | |||||
Expires in 2031 |
– | .1 | |||||
Expires in 2032 |
– | 1.6 | |||||
Expires in 2033 |
– | 2.9 | |||||
Expires in 2034 |
– | 2.5 | |||||
Expires in 2035 |
– | 3.4 | |||||
Expires in 2036 |
– | 3.0 | |||||
Indefinite life/no expiration |
620.0 | 8.4 | |||||
| | | | | | | | |
Total |
$ | 689.9 | $ | 111.3 | |||
| | | | | | | | |
- (1)
- Net operating losses are presented before tax effect and valuation allowance.
Based on current projections, certain indefinite-lived foreign net operating losses may take up to 50 years to be fully utilized.
At December 31, 2016, we had net operating loss carryforwards in certain state jurisdictions of $516 million before tax effect. Based on our current ability to generate state taxable income, it is more likely than not that the majority of these carryforwards will not be realized before they expire. Accordingly, a valuation allowance has been recorded on $513.7 million of the carryforwards.
We do not anticipate the expected expiration of our remaining tax holidays in Thailand and Vietnam in 2017 to have a material effect on our effective tax rate, operating results, or financial condition.
Unrecognized Tax Benefits
As of December 31, 2016, our unrecognized tax benefits totaled $89.5 million, $71.5 million of which, if recognized, would reduce our annual effective income tax rate. As of January 2, 2016, our unrecognized tax benefits totaled $107.3 million, $89 million of which, if recognized, would reduce our annual effective income tax rate.
Where applicable, we record potential accrued interest and penalties related to unrecognized tax benefits from our global operations in income tax expense. As a result, we recognized tax benefit of $3.1 million, tax expense of $1.3 million, and tax benefit of $1.3 million in the Consolidated Statements of Income in 2016, 2015, and 2014, respectively. We have accrued $22.3 million and $26.1 million for interest and penalties, net of tax benefit, in the Consolidated Balance Sheets at December 31, 2016 and January 2, 2016, respectively.
A reconciliation of the beginning and ending amounts of unrecognized tax benefits is set forth below:
| (In millions) |
2016 |
2015 |
|||||
|---|---|---|---|---|---|---|---|
| | | | | | | | |
Balance at beginning of year |
$ | 107.3 | $ | 122.6 | |||
Additions for tax positions of the current year |
6.9 | 11.1 | |||||
Reductions for tax positions of prior years |
(15.7 | ) | (4.0 | ) | |||
Settlements with tax authorities |
(2.1 | ) | (4.5 | ) | |||
Expirations of statutes of limitations |
(4.2 | ) | (8.6 | ) | |||
Changes due to translation of foreign currencies |
(2.7 | ) | (9.3 | ) | |||
| | | | | | | | |
Balance at end of year |
$ | 89.5 | $ | 107.3 | |||
| | | | | | | | |
The amount of income taxes we pay is subject to ongoing audits by taxing jurisdictions around the world. Our estimate of the potential outcome of any uncertain tax issue is subject to our assessment of the relevant risks, facts, and circumstances existing at the time. We believe that we have adequately provided for reasonably foreseeable outcomes related to these matters. However, our future results may include favorable or unfavorable adjustments to our estimated tax liabilities in the period the assessments are made or resolved, which may impact our effective tax rate. As of the date the 2016 financial statements are being issued, we and our U.S. subsidiaries have completed the Internal Revenue Service's Compliance Assurance Process Program through 2015. We also expect the current German tax audit for tax years 2006-2010 to be completed in 2017. We are subject to routine tax examinations in other jurisdictions. With some exceptions, we and our subsidiaries are no longer subject to income tax examinations by tax authorities for years prior to 2006.
It is reasonably possible that, during the next 12 months, we may realize a decrease in our uncertain tax positions, including interest and penalties, of approximately $16 million, primarily as a result of audit settlements and closing tax years.
NOTE 15. SEGMENT INFORMATION
Segment Reporting
We have the following reportable segments:
- •
- Label and Graphic Materials – manufactures and sells pressure-sensitive labeling technology and materials and films for graphic and reflective applications;
- •
- Retail Branding and Information Solutions – designs, manufactures and sells a wide variety of branding and information products and services, including brand and price tickets, tags and labels (including RFID inlays), and related services, supplies and equipment; and
- •
- Industrial and Healthcare Materials – manufactures performance tapes, fastener solutions, and an array of pressure-sensitive adhesive products for various medical applications.
Intersegment sales are recorded at or near market prices and are eliminated in determining consolidated sales. We evaluate performance based on income from operations before interest expense and taxes. General corporate expenses are also excluded from the computation of income from operations for the segments.
We do not disclose total assets by reportable segment since we neither generate nor review such information internally. As our reporting structure is not organized or reviewed internally by country, results by individual country are not provided.
| | | 44 |
Notes to Consolidated Financial Statements
Financial information from continuing operations by reportable segment is set forth below:
| (In millions) |
2016 |
2015 |
2014 |
|||||||
|---|---|---|---|---|---|---|---|---|---|---|
| | | | | | | | | | | |
Net sales to unaffiliated customers |
||||||||||
Label and Graphic Materials |
$ | 4,187.3 | $ | 4,032.1 | $ | 4,298.7 | ||||
Retail Branding and Information Solutions |
1,445.4 | 1,443.4 | 1,516.0 | |||||||
Industrial and Healthcare Materials |
453.8 | 491.4 | 515.6 | |||||||
| | | | | | | | | | | |
Net sales to unaffiliated customers |
$ | 6,086.5 | $ | 5,966.9 | $ | 6,330.3 | ||||
| | | | | | | | | | | |
Intersegment sales |
||||||||||
Label and Graphic Materials |
$ | 63.4 | $ | 61.3 | $ | 64.2 | ||||
Retail Branding and Information Solutions |
2.9 | 2.9 | 2.5 | |||||||
Industrial and Healthcare Materials |
7.2 | 14.8 | 19.1 | |||||||
| | | | | | | | | | | |
Intersegment sales |
$ | 73.5 | $ | 79.0 | $ | 85.8 | ||||
| | | | | | | | | | | |
Income from continuing operations before taxes |
||||||||||
Label and Graphic Materials |
$ | 516.2 | $ | 453.4 | $ | 396.9 | ||||
Retail Branding and Information Solutions |
102.6 | 51.6 | 68.5 | |||||||
Industrial and Healthcare Materials |
54.6 | 57.1 | 45.2 | |||||||
Corporate expense |
(136.4 | ) | (92.7 | ) | (86.5 | ) | ||||
Interest expense |
(59.9 | ) | (60.5 | ) | (63.3 | ) | ||||
| | | | | | | | | | | |
Income from continuing operations before taxes |
$ | 477.1 | $ | 408.9 | $ | 360.8 | ||||
| | | | | | | | | | | |
Capital expenditures |
||||||||||
Label and Graphic Materials |
$ | 118.8 | $ | 68.3 | $ | 100.6 | ||||
Retail Branding and Information Solutions |
50.9 | 51.0 | 37.3 | |||||||
Industrial and Healthcare Materials |
7.2 | 19.6 | 14.3 | |||||||
| | | | | | | | | | | |
Capital expenditures |
$ | 176.9 | $ | 138.9 | $ | 152.2 | ||||
| | | | | | | | | | | |
Depreciation and amortization expense |
||||||||||
Label and Graphic Materials |
$ | 103.1 | $ | 104.9 | $ | 108.2 | ||||
Retail Branding and Information Solutions |
64.3 | 70.6 | 79.2 | |||||||
Industrial and Healthcare Materials |
12.7 | 12.8 | 14.2 | |||||||
| | | | | | | | | | | |
Depreciation and amortization expense |
$ | 180.1 | $ | 188.3 | $ | 201.6 | ||||
| | | | | | | | | | | |
Other expense, net by reportable segment |
||||||||||
Label and Graphic Materials |
$ | 13.0 | $ | 12.1 | $ | 41.5 | ||||
Retail Branding and Information Solutions |
9.8 | 45.7 | 22.0 | |||||||
Industrial and Healthcare Materials |
1.9 | 8.0 | 4.3 | |||||||
Corporate |
40.5 | 2.5 | .4 | |||||||
| | | | | | | | | | | |
Other expense, net |
$ | 65.2 | $ | 68.3 | $ | 68.2 | ||||
| | | | | | | | | | | |
Other expense, net by type |
||||||||||
Restructuring charges: |
||||||||||
Severance and related costs |
$ | 14.7 | $ | 52.5 | $ | 54.7 | ||||
Asset impairment charges and lease and other contract cancellation costs |
5.2 | 7.0 | 11.4 | |||||||
Other items: |
||||||||||
Net loss from curtailment and settlement of pension obligations |
41.4 | .3 | 1.6 | |||||||
Net gains on sales of assets |
(1.1 | ) | (1.7 | ) | (2.5 | ) | ||||
Transaction costs |
5.0 | – | – | |||||||
Legal settlements |
– | (.3 | ) | – | ||||||
Loss on sale of product line and related exit costs |
– | 10.5 | – | |||||||
Indefinite-lived intangible asset impairment charge |
– | – | 3.0 | |||||||
| | | | | | | | | | | |
Other expense, net |
$ | 65.2 | $ | 68.3 | $ | 68.2 | ||||
| | | | | | | | | | | |
Within our Industrial and Healthcare Materials reportable segment, net sales to unaffiliated customers for the combined Performance Tapes and Vancive Medical Technologies product groups were $377.4 million, $414.6 million, and $440 million in 2016, 2015, and 2014, respectively.
Revenues from continuing operations by geographic area are set forth below. Revenues are attributed to geographic areas based on the location from which the product is shipped.
| (In millions) |
2016 |
2015 |
2014 |
|||||||
|---|---|---|---|---|---|---|---|---|---|---|
| | | | | | | | | | | |
Net sales to unaffiliated customers |
||||||||||
U.S. |
$ | 1,525.6 | $ | 1,546.8 | $ | 1,529.4 | ||||
Europe |
1,838.8 | 1,753.0 | 2,074.4 | |||||||
Asia |
1,996.1 | 1,924.0 | 1,914.2 | |||||||
Latin America |
450.5 | 466.3 | 522.9 | |||||||
Other international |
275.5 | 276.8 | 289.4 | |||||||
| | | | | | | | | | | |
Net sales to unaffiliated customers |
$ | 6,086.5 | $ | 5,966.9 | $ | 6,330.3 | ||||
| | | | | | | | | | | |
Net sales to unaffiliated customers in Asia included sales in China (including Hong Kong) of $1.14 billion in both 2016 and 2015 and $1.11 billion in 2014.
| 45 Avery Dennison Corporation 2016 Annual Report | | |
Notes to Consolidated Financial Statements
Property, plant and equipment, net, in our U.S. and international operations was as follows:
| (In millions) |
2016 |
2015 |
2014 |
|||||||
|---|---|---|---|---|---|---|---|---|---|---|
| | | | | | | | | | | |
Property, plant and equipment, net |
||||||||||
U.S. |
$ | 278.5 | $ | 263.4 | $ | 261.5 | ||||
International |
636.7 | 584.5 | 613.8 | |||||||
| | | | | | | | | | | |
Property, plant and equipment, net |
$ | 915.2 | $ | 847.9 | $ | 875.3 | ||||
| | | | | | | | | | | |
NOTE 16. SUPPLEMENTAL FINANCIAL INFORMATION
Inventories
Net inventories at year-end were as follows:
| (In millions) |
2016 |
2015 |
|||||
|---|---|---|---|---|---|---|---|
| | | | | | | | |
Raw materials |
$ | 185.0 | $ | 180.5 | |||
Work-in-progress |
156.8 | 143.0 | |||||
Finished goods |
177.3 | 155.2 | |||||
| | | | | | | | |
Inventories, net |
$ | 519.1 | $ | 478.7 | |||
| | | | | | | | |
Property, Plant and Equipment
Major classes of property, plant and equipment, stated at cost, at year-end were as follows:
| (In millions) |
2016 |
2015 |
|||||
|---|---|---|---|---|---|---|---|
| | | | | | | | |
Land |
$ | 29.3 | $ | 30.4 | |||
Buildings and improvements |
565.3 | 579.3 | |||||
Machinery and equipment |
1,949.5 | 1,922.3 | |||||
Construction-in-progress |
117.3 | 67.9 | |||||
| | | | | | | | |
Property, plant and equipment |
2,661.4 | 2,599.9 | |||||
Accumulated depreciation |
(1,746.2 | ) | (1,752.0 | ) | |||
| | | | | | | | |
Property, plant and equipment, net |
$ | 915.2 | $ | 847.9 | |||
| | | | | | | | |
Software
Capitalized software costs at year-end were as follows:
| (In millions) |
2016 |
2015 |
|||||
|---|---|---|---|---|---|---|---|
| | | | | | | | |
Cost |
$ | 415.5 | $ | 398.2 | |||
Accumulated amortization |
(297.9 | ) | (270.8 | ) | |||
| | | | | | | | |
Software, net |
$ | 117.6 | $ | 127.4 | |||
| | | | | | | | |
Software amortization expense from continuing operations was $37.9 million in 2016, $37.6 million in 2015, and $36.4 million in 2014.
Equity Method Investment
In October 2016, we acquired a 22.6% interest in PragmatIC Printing Limited ("PragmatIC"), a company that develops flexible electronics technology. PragmatIC's primary assets are intangible assets related to its technology. We used the equity method to account for this investment. The carrying value of this investment was $9.5 million as of December 31, 2016 and was included in "Other assets" in the Consolidated Balance Sheets.
Research and Development
Research and development expense from continuing operations, which is included in "Marketing, general and administrative expense" in the Consolidated Statements of Income, was as follows:
| (In millions) |
2016 |
2015 |
2014 |
|||||||
|---|---|---|---|---|---|---|---|---|---|---|
| | | | | | | | | | | |
Research and development expense |
$ | 89.7 | $ | 91.9 | $ | 102.5 | ||||
| | | | | | | | | | | |
Supplemental Cash Flow Information
Cash paid for interest and income taxes, including amounts paid for discontinued operations, was as follows:
| (In millions) |
2016 |
2015 |
2014 |
|||||||
|---|---|---|---|---|---|---|---|---|---|---|
| | | | | | | | | | | |
Interest, net of capitalized amounts |
$ | 58.9 | $ | 60.1 | $ | 61.6 | ||||
Income taxes, net of refunds |
106.1 | 129.9 | 108.8 | |||||||
| | | | | | | | | | | |
Currency Effects
Gains and losses resulting from foreign currency transactions are included in income in the period incurred. Transactions in foreign currencies (including receivables, payables and loans denominated in currencies other than the functional currency), including hedging impacts, decreased net income by $1.6 million, $6.1 million, and $8.7 million in 2016, 2015, and 2014, respectively.
We had no operations in hyperinflationary economies in fiscal years 2016, 2015, or 2014.
Discontinued Operations
Loss from discontinued operations, net of tax, for 2015 included tax expense related to the completion of certain tax returns related to the sale of our former OCP and DES businesses. The loss from discontinued operations, net of tax, for 2014 reflected costs related to the resolution of certain post-closing adjustments in the third quarter of 2014. We continue to be subject to certain indemnification obligations under the terms of the purchase agreement. In addition, the tax liability associated with the sale is subject to the completion of tax return filings in certain foreign jurisdictions in which we operated the OCP and DES businesses.
Sale of Product Line
In May 2015, we sold certain assets and transferred certain liabilities associated with a product line in our RBIS reportable segment for $1.5 million. The pre-tax loss from the sale, when combined with exit costs related to the sale, totaled $8.5 million. The exit costs included $3.4 million of severance costs. In the first quarter of 2015, we recorded an impairment charge of approximately $2 million related to certain long-lived assets in this product line. This loss and these costs were included in "Other expense, net" in the Consolidated Statements of Income.
| | | 46 |
Notes to Consolidated Financial Statements
NOTE 17. QUARTERLY FINANCIAL INFORMATION (Unaudited)
| (In millions, except per share data) |
First Quarter |
Second Quarter |
Third Quarter |
Fourth Quarter |
|||||||||
|---|---|---|---|---|---|---|---|---|---|---|---|---|---|
| | | | | | | | | | | | | | |
2016 |
|||||||||||||
Net sales |
$ | 1,485.5 | $ | 1,541.5 | $ | 1,508.7 | $ | 1,550.8 | |||||
Gross profit |
422.6 | 434.1 | 417.6 | 425.4 | |||||||||
Net income |
89.6 | 80.0 | 89.1 | 62.0 | |||||||||
Net income per common share |
1.00 | .90 | 1.00 | .70 | |||||||||
Net income per common share, assuming dilution |
.98 | .88 | .98 | .69 | |||||||||
| | | | | | | | | | | | | | |
2015 |
|||||||||||||
Net sales |
$ | 1,528.0 | $ | 1,516.0 | $ | 1,468.1 | $ | 1,454.8 | |||||
Gross profit |
430.0 | 417.6 | 405.9 | 392.3 | |||||||||
Income from continuing operations |
71.9 | 64.7 | 81.3 | 56.5 | |||||||||
(Loss) income from discontinued operations, net of tax |
– | (1.0 | ) | .4 | .5 | ||||||||
Net income |
71.9 | 63.7 | 81.7 | 57.0 | |||||||||
Net income (loss) per common share: |
|||||||||||||
Continuing operations |
.79 | .71 | .89 | .62 | |||||||||
Discontinued operations |
– | (.01 | ) | – | .01 | ||||||||
Net income per common share |
.79 | .70 | .89 | .63 | |||||||||
Net income (loss) per common share, assuming dilution: |
|||||||||||||
Continuing operations |
.78 | .69 | .87 | .61 | |||||||||
Discontinued operations |
– | (.01 | ) | .01 | .01 | ||||||||
Net income per common share, assuming dilution |
.78 | .68 | .88 | .62 | |||||||||
| | | | | | | | | | | | | | |
"Other expense, net" is presented by type for each quarter below:
| (In millions) |
First Quarter |
Second Quarter |
Third Quarter |
Fourth Quarter |
|||||||||
|---|---|---|---|---|---|---|---|---|---|---|---|---|---|
| | | | | | | | | | | | | | |
2016 |
|||||||||||||
Restructuring charges: |
|||||||||||||
Severance and related costs |
$ | 5.2 | $ | 3.6 | $ | 1.9 | $ | 4.0 | |||||
Asset impairment charges and lease cancellation costs |
.4 | 2.8 | .7 | 1.3 | |||||||||
Other items: |
|||||||||||||
Loss from settlement of pension obligations |
– | 41.4 | – | – | |||||||||
Loss (gain) on sales of assets |
– | .3 | – | (1.4 | ) | ||||||||
Transaction costs |
– | 2.1 | 2.0 | .9 | |||||||||
| | | | | | | | | | | | | | |
Other expense, net |
$ | 5.6 | $ | 50.2 | $ | 4.6 | $ | 4.8 | |||||
| | | | | | | | | | | | | | |
2015 |
|||||||||||||
Restructuring charges: |
|||||||||||||
Severance and related costs |
$ | 13.5 | $ | 16.8 | $ | 4.7 | $ | 17.5 | |||||
Asset impairment charges and lease cancellation costs |
.4 | 3.2 | 1.9 | 1.5 | |||||||||
Other items: |
|||||||||||||
Net loss from curtailment and settlement of pension obligations |
– | – | – | .3 | |||||||||
Loss on sale of product line and related exit costs |
2.6 | 7.7 | .2 | – | |||||||||
Legal settlements |
(.5 | ) | – | .2 | – | ||||||||
Gain on sale of assets |
(1.7 | ) | – | – | – | ||||||||
| | | | | | | | | | | | | | |
Other expense, net |
$ | 14.3 | $ | 27.7 | $ | 7.0 | $ | 19.3 | |||||
| | | | | | | | | | | | | | |
| 47 Avery Dennison Corporation 2016 Annual Report | | |
STATEMENT OF MANAGEMENT RESPONSIBILITY FOR FINANCIAL STATEMENTS
The consolidated financial statements and accompanying information are the responsibility of and were prepared by management. The statements were prepared in conformity with accounting principles generally accepted in the United States of America and, as such, include amounts that are based on management's best estimates and judgments.
Oversight of management's financial reporting and internal accounting control responsibilities is exercised by our Board of Directors, through its Audit and Finance Committee, which is comprised solely of independent directors. The Committee meets periodically with financial management, internal auditors and our independent registered public accounting firm to obtain reasonable assurance that each is meeting its responsibilities and to discuss matters concerning auditing, internal accounting control and financial reporting. The independent registered public accounting firm and our internal audit department have free access to, and periodically meet with, the Audit and Finance Committee without management present.
MANAGEMENT'S REPORT ON INTERNAL CONTROL OVER FINANCIAL REPORTING
Management is responsible for establishing and maintaining adequate internal control over financial reporting, as that term is defined in Exchange Act Rule 13a-15(f) or 15(d)-15(f). Under the supervision and with the participation of management, including our chief executive officer and chief financial officer, we conducted an evaluation of the effectiveness of internal control over financial reporting based on the framework in Internal Control – Integrated Framework (2013) issued by the Committee of Sponsoring Organizations of the Treadway Commission. Based on our evaluation under the framework in Internal Control – Integrated Framework (2013), management has concluded that internal control over financial reporting was effective as of December 31, 2016. Management's assessment of the effectiveness of internal control over financial reporting as of December 31, 2016 has been audited by PricewaterhouseCoopers LLP, an independent registered public accounting firm, as stated in their report included herein.
/s/ Mitchell R. Butier |
/s/ Anne L. Bramman |
|
| | | |
| Mitchell R. Butier President and Chief Executive Officer |
Anne L. Bramman Senior Vice President and Chief Financial Officer |
| | | 48 |
Report of Independent Registered Public Accounting Firm
To the Board of Directors and Shareholders of Avery Dennison Corporation:
In our opinion, the accompanying consolidated balance sheets and the related consolidated statements of income, comprehensive income, shareholders' equity and cash flows present fairly, in all material respects, the financial position of Avery Dennison Corporation and its subsidiaries (the Company) at December 31, 2016 and January 2, 2016, and the results of their operations and their cash flows for each of the three years in the period ended December 31, 2016 in conformity with accounting principles generally accepted in the United States of America. Also in our opinion, the Company maintained, in all material respects, effective internal control over financial reporting as of December 31, 2016, based on criteria established in Internal Control – Integrated Framework (2013) issued by the Committee of Sponsoring Organizations of the Treadway Commission (COSO). The Company's management is responsible for these financial statements, for maintaining effective internal control over financial reporting and for its assessment of the effectiveness of internal control over financial reporting, included in the accompanying Management's Report on Internal Control Over Financial Reporting. Our responsibility is to express opinions on these financial statements and on the Company's internal control over financial reporting based on our integrated audits. We conducted our audits in accordance with the standards of the Public Company Accounting Oversight Board (United States). Those standards require that we plan and perform the audits to obtain reasonable assurance about whether the financial statements are free of material misstatement and whether effective internal control over financial reporting was maintained in all material respects. Our audits of the financial statements included examining, on a test basis, evidence supporting the amounts and disclosures in the financial statements, assessing the accounting principles used and significant estimates made by management, and evaluating the overall financial statement presentation. Our audit of internal control over financial reporting included obtaining an understanding of internal control over financial reporting, assessing the risk that a material weakness exists, and testing and evaluating the design and operating effectiveness of internal control based on the assessed risk. Our audits also included performing such other procedures as we considered necessary in the circumstances. We believe that our audits provide a reasonable basis for our opinions.
A company's internal control over financial reporting is a process designed to provide reasonable assurance regarding the reliability of financial reporting and the preparation of financial statements for external purposes in accordance with generally accepted accounting principles. A company's internal control over financial reporting includes those policies and procedures that (i) pertain to the maintenance of records that, in reasonable detail, accurately and fairly reflect the transactions and dispositions of the assets of the company; (ii) provide reasonable assurance that transactions are recorded as necessary to permit preparation of financial statements in accordance with generally accepted accounting principles, and that receipts and expenditures of the company are being made only in accordance with authorizations of management and directors of the company; and (iii) provide reasonable assurance regarding prevention or timely detection of unauthorized acquisition, use, or disposition of the company's assets that could have a material effect on the financial statements.
Because of its inherent limitations, internal control over financial reporting may not prevent or detect misstatements. Also, projections of any evaluation of effectiveness to future periods are subject to the risk that controls may become inadequate because of changes in conditions, or that the degree of compliance with the policies or procedures may deteriorate.
| /s/ PRICEWATERHOUSECOOPERS LLP | ||
| | | |
| PricewaterhouseCoopers LLP | ||
Los Angeles, California February 23, 2017 |
| 49 Avery Dennison Corporation 2016 Annual Report | | |
Corporate
Information
Independent Registered Public Accounting Firm
PricewaterhouseCoopers LLP
Los Angeles, California
Registrar and Transfer Agent
Broadridge
Corporate Issuer Solutions, Inc.
P.O. Box 1342
Brentwood, NY 11717
(888) 682-5999
(720) 864-4993 (international)
(855) 627-5080 (hearing impaired)
https://investor.broadridge.com
Annual Meeting
Our Annual Meeting of Stockholders will be held at 1:30 p.m. Pacific Time on April 27, 2017 at the Embassy Suites, 800 North Central Avenue, Glendale, California 91203.
The Direct Share Purchase and Sale Program
Shareholders of record may reinvest their cash dividends in additional shares of our common stock at market price. Investors may also invest optional cash payments of up to $12,500 per month in our common stock at market price. Investors not yet participating in the program, as well as brokers and custodians who hold our common stock on behalf of clients, may obtain a copy of the program by contacting Broadridge Corporate Issuer Solutions, Inc.
Direct Deposit of Dividends
Shareholders may receive their quarterly dividend payments by direct deposit into their checking or savings accounts. For more information, contact Broadridge Corporate Issuer Solutions, Inc.
Other Information
We are including, as Exhibits 31.1 and 31.2 to our Annual Report on Form 10-K for fiscal year 2016 filed with the Securities and Exchange Commission ("SEC"), certificates of our Chief Executive Officer and Chief Financial Officer pursuant to Section 302 of the Sarbanes-Oxley Act of 2002. We submitted to the New York Stock Exchange ("NYSE") an unqualified annual written affirmation, along with the Chief Executive Officer's certificate that he is not aware of any violation by the Company of NYSE's corporate governance listing standards, on April 29, 2016.
A copy of our Annual Report on Form 10-K, as filed with the SEC, will be furnished to shareholders and interested investors free of charge upon written request to our Corporate Secretary. Copies may also be downloaded from our investor website at www.investors.averydennison.com.
Corporate Headquarters
Avery
Dennison Corporation
207 Goode Avenue
Glendale, California 91203
Phone: (626) 304-2000
Stock and Dividend Data
Our
common stock is listed on the NYSE.
Ticker symbol: AVY
| |
2016 | 2015 | |||||||||||
|---|---|---|---|---|---|---|---|---|---|---|---|---|---|
| |
High |
Low |
High |
Low |
|||||||||
| | | | | | | | | | | | | | |
Market Price |
|||||||||||||
First Quarter |
$ | 72.86 | $ | 58.16 | $ | 54.64 | $ | 51.15 | |||||
Second Quarter |
77.12 | 71.11 | 63.18 | 51.07 | |||||||||
Third Quarter |
78.84 | 71.13 | 64.65 | 55.59 | |||||||||
Fourth Quarter |
78.04 | 68.61 | 66.18 | 58.61 | |||||||||
| | | | | | | | | | | | | | |
| |
2016 |
2015 |
|||||
|---|---|---|---|---|---|---|---|
| | | | | | | | |
Dividends per Common Share |
|||||||
First Quarter |
$ | .37 | $ | .35 | |||
Second Quarter |
.41 | .37 | |||||
Third Quarter |
.41 | .37 | |||||
Fourth Quarter |
.41 | .37 | |||||
| | | | | | | | |
|
$ | 1.60 | $ | 1.46 | |||
| | | | | | | | |
Number of shareholders of record as of year-end |
5,106 |
5,357 |
|||||
| | | | | | | | |
| | | 50 |