Attached files
| file | filename |
|---|---|
| EX-32.2 - EXHIBIT 32.2 - GREENLIGHT CAPITAL RE, LTD. | glre-20161231exhibit322.htm |
| EX-32.1 - EXHIBIT 32.1 - GREENLIGHT CAPITAL RE, LTD. | glre-20161231exhibit321.htm |
| EX-31.2 - EXHIBIT 31.2 - GREENLIGHT CAPITAL RE, LTD. | glre-20161231exhibit312.htm |
| EX-31.1 - EXHIBIT 31.1 - GREENLIGHT CAPITAL RE, LTD. | glre-20161231exhibit311.htm |
| EX-23.1 - EXHIBIT 23.1 - GREENLIGHT CAPITAL RE, LTD. | glre-20161231exhibit231bdo.htm |
| EX-12.1 - EXHIBIT 12.1 - GREENLIGHT CAPITAL RE, LTD. | glre-20161231exhibit121.htm |
UNITED STATES
SECURITIES AND EXCHANGE COMMISSION
Washington, D.C. 20549
FORM 10-K
x | ANNUAL REPORT PURSUANT TO SECTION 13 OR 15(d) OF THE SECURITIES EXCHANGE ACT OF 1934 |
For the fiscal year ended December 31, 2016
OR
o | TRANSITION REPORT PURSUANT TO SECTION 13 OR 15(d) OF THE SECURITIES EXCHANGE ACT OF 1934 |
For the transition period from to
Commission file number 001-33493
Greenlight Capital Re, Ltd.
(Exact Name of Registrant as Specified in Its Charter)
Cayman Islands | N/A |
(State or Other Jurisdiction of Incorporation or Organization) | (I.R.S. Employer Identification No.) |
65 Market Street, Suite 1207, Camana Bay
P.O. Box 31110
Grand Cayman, KY1-1205
Cayman Islands
(Address of Principal Executive Offices)
Registrant’s telephone number, including area code: 345-943-4573
Securities registered pursuant to Section 12(b) of the Act:
Title of Class | Name of Exchange on Which Registered |
Class A ordinary shares, $0.10 par value per share | The Nasdaq Stock Market LLC |
Securities registered pursuant to Section 12(g) of the Act: None
Indicate by check mark if the registrant is a well-known seasoned issuer, as defined in Rule 405 of the Securities Act. Yes x No o
Indicate by check mark if the registrant is not required to file reports pursuant to Section 13 or Section 15(d) of the Act. Yes o No x
Indicate by check mark whether the registrant (1) has filed all reports required to be filed by Section 13 or 15(d) of the Securities Exchange Act of 1934 during the preceding 12 months (or for such shorter period that the registrant was required to file such reports), and (2) has been subject to such filing requirements for the past 90 days. Yes x No o
Indicate by check mark whether the registrant has submitted electronically and posted on its corporate web site, if any, every Interactive Data File required to be submitted and posted pursuant to Rule 405 of Regulations S-T during the preceding 12 months (or for such shorter period that the registrant was required to submit and post such files). Yes x No o
Indicate by check mark if disclosure of delinquent filers pursuant to Item 405 of Regulation S-K is not contained herein, and will not be contained, to the best of registrant’s knowledge, in definitive proxy or information statements incorporated by reference in Part III of this Form 10-K or any amendment to this Form 10-K. x
Indicate by check mark whether the registrant is a large accelerated filer, an accelerated filer, a non-accelerated filer, or a smaller reporting company. See the definitions of ‘‘large accelerated filer,’’ ‘‘accelerated filer,’’ and ‘‘smaller reporting company’’ in Rule 12b-2 of the Exchange Act. (Check one):
Large accelerated filer x Accelerated filer o Non-accelerated filer o Smaller reporting company o
Indicate by check mark whether the registrant is a shell company (as defined in Rule 12b-2 of the Act). Yes o No x
The aggregate market value of voting and non-voting Class A ordinary shares held by non-affiliates of the registrant as of June 30, 2016 was $592,307,211 based on the closing price of the registrant’s Class A ordinary shares reported on the Nasdaq Global Select Market on June 30, 2016, the last business day of the registrant’s most recently completed second fiscal quarter. Solely for the purpose of this calculation and for no other purpose, the non-affiliates of the registrant are assumed to be all shareholders of the registrant other than (i) directors of the registrant, (ii) executive officers of the registrant who are identified as ‘‘named executives’’ pursuant to Item 11 of this Form 10-K, (iii) any shareholder that beneficially owns 10% or more of the registrant’s common shares and (iv) any shareholder that has one or more of its affiliates on the registrant’s board of directors. Such exclusion is not intended, nor shall it be deemed, to be an admission that such persons are affiliates of the registrant.
Class A Ordinary Shares, $0.10 par value | 31,111,432 |
Class B Ordinary Shares, $0.10 par value | 6,254,895 |
(Class) | Outstanding as of February 17, 2017 |
DOCUMENTS INCORPORATED BY REFERENCE
Portions of the proxy statement for the registrant’s 2017 annual meeting of shareholders, to be filed subsequently with the Securities and Exchange Commission, or the SEC, pursuant to Regulation 14A, under the Securities Exchange Act of 1934, as amended, or the Exchange Act, relating to the registrant’s annual general meeting of shareholders scheduled to be held on April 26, 2017 are incorporated by reference in Part III of this annual report on Form 10-K.
1
GREENLIGHT CAPITAL RE, LTD.
TABLE OF CONTENTS
Page | ||
ITEM 1. | ||
ITEM 1A. | ||
ITEM 1B. | ||
ITEM 2. | ||
ITEM 3. | ||
ITEM 4. | ||
ITEM 5. | ||
ITEM 6. | ||
ITEM 7. | ||
ITEM 7A. | ||
ITEM 8. | ||
ITEM 9. | ||
ITEM 9A. | ||
ITEM 9B. | ||
ITEM 10. | ||
ITEM 11. | ||
ITEM 12. | ||
ITEM 13. | ||
ITEM 14. | ||
ITEM 15. | ||
2
PART I
Special Note About Forward-Looking Statements
Certain statements in Management’s Discussion and Analysis, other than purely historical information, including estimates, projections, statements relating to our business plans, objectives and expected operating results, and the assumptions upon which those statements are based, are “forward-looking statements” within the meaning of the Private Securities Litigation Reform Act of 1995, Section 27A of the Securities Act of 1933 and Section 21E of the Securities Exchange Act of 1934, as amended (the “Exchange Act”). These forward-looking statements generally are identified by the words “believe,” “project,” “predict,” “expect,” “anticipate,” “estimate,” “intend,” “plan,” “may,” “should,” “will,” “would,” “will be,” “will continue,” “will likely result,” and similar expressions. Forward-looking statements are based on current expectations and assumptions that are subject to risks and uncertainties which may cause actual results to differ materially from the forward-looking statements. A detailed discussion of risks and uncertainties that could cause actual results and events to differ materially from such forward-looking statements is included in the section entitled “Risk Factors” (refer to Part I, Item 1A) and include but are not limited to:
● | Our results will likely fluctuate from period to period and may not be indicative of our long-term prospects; | |
● | If our losses and loss adjustment expenses greatly exceed our loss reserves, our financial condition may be significantly and negatively affected; | |
● | Our investment portfolio may be concentrated in a few large positions which could result in large losses; | |
● | The property and casualty reinsurance market may be affected by cyclical trends; | |
● | The effect of emerging claim and coverage issues on our business is uncertain; | |
● | Rating agencies may downgrade or withdraw either of our ratings; | |
● | We depend on DME Advisors, LP (“DME Advisors”), to implement our investment strategy; | |
● | Loss of key executives could adversely impact our ability to implement our business strategy; and | |
● | Currency fluctuations could result in exchange rate losses and negatively impact our business. | |
We caution that the foregoing list of important factors is not intended to be and is not exhaustive. We undertake no obligation to publicly update or revise any forward-looking statements, whether as a result of new information, future events, or otherwise and all subsequent written and oral forward-looking statements attributable to us or individuals acting on our behalf are expressly qualified in their entirety by this paragraph. If one or more risks or uncertainties materialize, or if our underlying assumptions prove to be incorrect, actual results may vary materially from what we projected. Any forward-looking statements in this Form 10-K reflect our current view with respect to future events and are subject to these and other risks, uncertainties and assumptions relating to our operations, results of operations, growth, strategy and liquidity. Readers are cautioned not to place undue reliance on the forward-looking statements which speak only to the dates on which they were made.
We intend to communicate certain events that we believe may have a material adverse impact on our operations or financial position, including property and casualty catastrophic events and material losses in our investment portfolio, in a timely manner through a public announcement. Other than as required by the Exchange Act, we do not intend to make public announcements regarding reinsurance or investments events that we do not believe, based on management’s estimates and current information, will have a material adverse impact on our operations or financial position.
3
Item 1. BUSINESS
Unless otherwise indicated or unless the context otherwise requires, all references in this annual report on Form 10-K to “the Company,” “we,” “us,” “our” and similar expressions are references to Greenlight Capital Re, Ltd. and its consolidated subsidiaries. Unless otherwise indicated or unless the context otherwise requires, all references in this annual report to entity names are as set forth in the following table:
Reference | Entity’s legal name |
Greenlight Capital Re | Greenlight Capital Re, Ltd. |
Greenlight Re | Greenlight Reinsurance, Ltd. |
GRIL | Greenlight Reinsurance Ireland, Designated Activity Company |
Verdant | Verdant Holding Company, Ltd. |
Company Overview
Greenlight Capital Re is a holding company that was incorporated in July 2004 under the laws of the Cayman Islands. In August 2004, we raised gross proceeds of $212.2 million from private placements of Greenlight Capital Re’s Class A ordinary shares and Class B ordinary shares, or, collectively, the ordinary shares. On May 24, 2007, Greenlight Capital Re raised proceeds of $208.3 million, net of underwriting fees, in an initial public offering of Class A ordinary shares, as well as an additional $50.0 million from a private placement of Class B ordinary shares.
We are a Cayman Islands headquartered global property and casualty reinsurer with a reinsurance and investment strategy that we believe differentiates us from most of our competitors. We conduct our reinsurance operations through two licensed and regulated reinsurance entities: Greenlight Re, based in the Cayman Islands, and GRIL, based in Dublin, Ireland. Greenlight Re provides multi-line property and casualty reinsurance globally, while GRIL focuses mainly on the European market and primarily serves clients located in Europe. Our goal is to build long-term shareholder value by selectively offering customized reinsurance solutions, in markets where capacity and alternatives are limited, which we believe will yield favorable long-term returns on equity.
We aim to complement our underwriting results with a non-traditional investment approach in order to achieve higher rates of return over the long term than reinsurance companies that employ more traditional, fixed-income investment strategies. We manage our investment portfolio according to a value-oriented philosophy, in which we take long positions in perceived undervalued securities and short positions in perceived overvalued securities. In addition, from time to time, we make long-term strategic investments in insurance companies and general agents to complement our strategy and strengthen our client relationships. To facilitate such strategic investments, we formed Verdant, which, among other activities, has made and may make strategic investments in a select group of property and casualty insurers and general agents in the United States.
Because we employ an opportunistic underwriting philosophy, period-to-period comparisons of our underwriting results may not be meaningful. In addition, our historical investment results may not necessarily be indicative of future performance. Due to the nature of our reinsurance and investment strategies, our operating results will likely fluctuate from period to period.
Description of Business
Greenlight Re is licensed and regulated by the Cayman Islands Monetary Authority (“CIMA”) to write property and casualty reinsurance business as well as long term business (e.g., life insurance, long term disability, long term care, etc.); however, to date we have not written any long term business. GRIL is licensed and regulated by the Central Bank of Ireland (“CBI”) to write property and casualty reinsurance business. Currently, we manage our business on the basis of one operating segment: property and casualty reinsurance. We currently offer excess of loss and quota share products in the property and casualty market. Our underwriting operations are designed to capitalize on inefficiencies that we perceive exist in the traditional approach to underwriting. We believe that we conduct our business differently from traditional reinsurers in multiple ways, including:
4
● | we aim to build a reinsurance portfolio comprised principally of high frequency and low severity contracts with favorable ultimate economic results measured after all loss payments have been made rather than focusing on interim reported results when losses may be incurred but not yet reported or paid; | |
● | we focus on offering customized reinsurance solutions to select customers at times and in markets where capacity and alternatives are limited rather than primarily pursuing and participating in broadly available traditional property and casualty opportunities; | |
● | we generally seek to act as the lead underwriter on a majority of the contracts we underwrite in an effort to obtain greater influence in negotiating pricing, terms and conditions. We may from time to time participate in contracts that have been negotiated and priced by another party. For example, on some longer duration casualty business that is comprised of larger, syndicated reinsurance placements, we may follow the market on these transactions; | |
● | we maintain a small group of experienced generalist underwriters that work in teams and that are capable of underwriting many lines of property and casualty business rather than a large staff of underwriters, each with an individual, specific focus on certain lines of business; | |
● | we implement a “cradle to grave” service philosophy where the same deal team underwrites and services each reinsurance contract rather than separating underwriting and servicing duties among many employees; and | |
● | we compensate our management with a cash bonus structure largely dependent on our underwriting results over a multi-year period rather than on premium volume or preliminary underwriting results in any given financial accounting period. | |
Our investment strategy, like our reinsurance strategy, is designed to maximize returns over the long term while minimizing the risk of capital loss. Unlike the investment strategies of many of our traditional competitors, which invest primarily in fixed-income securities either directly or through fixed-fee arrangements with one or more investment managers, our investment strategy is to invest in long and short positions primarily in publicly-traded equity and corporate debt instruments exclusively through a joint venture with DME Advisors LLC (“DME”). Our investment advisor, DME Advisors, is compensated with a fixed annual fee based on assets under management and DME is compensated on the positive performance of our portfolio, subject to a loss carry forward. DME Advisors, which makes investments on our behalf, is a value-oriented investment advisor that analyzes companies’ available financial data, business strategies and prospects in an effort to identify undervalued and overvalued securities. DME Advisors and DME are both controlled by David Einhorn, the Chairman of our Board of Directors and the President of Greenlight Capital, Inc. DME Advisors has the contractual right to manage substantially all of our investable assets until December 31, 2019, and is required to follow our investment guidelines and to act in a manner that is fair and equitable in allocating investment opportunities to us. However, DME Advisors is not otherwise restricted with respect to the nature or timing of making investments for our account.
We measure our success by long-term growth in book value per share, which we believe is the most comprehensive gauge of the performance of our business. Accordingly, our incentive compensation plans are designed to align employee and shareholder interests. Compensation under our cash bonus plan is largely dependent on the ultimate underwriting returns of our business measured over a multi-year period, rather than premium targets or estimated underwriting profitability for the year in which we initially underwrote the business.
We characterize the reinsurance risks we assume as frequency or severity and aim to balance the risks and opportunities of our underwriting activities by creating a diversified portfolio of both types of businesses, although over the long term we generally have a preference for frequency business.
Frequency business is characterized as contracts containing a potentially large number of smaller losses emanating from multiple events. Clients generally buy this protection to increase their own underwriting capacity and typically select a reinsurer based upon the reinsurer’s financial strength, service and expertise. We expect the results of frequency business to be less volatile than those of severity business from period to period due to its greater predictability. We also expect that over time the profit margins and return on equity of our frequency business will be lower than those of our severity business.
Severity business is typically characterized as contracts with the potential for significant losses emanating from one event or multiple events. Clients generally buy this protection to reduce volatility from their balance sheets, and accordingly, we expect the results of severity business to be volatile from period to period. However, over the long term, we also expect that our severity business will generate higher profit margins and return on equity than our frequency business.
5
While we intend to continue to add to, and diversify, our portfolio, our allocation of risk will vary based on our perception of the opportunities available in each line of business. Moreover, our focus on certain lines will fluctuate based upon market conditions and we may only offer or underwrite a limited number of lines in any given period. We intend to continue to:
● | target markets where we believe capacity and alternatives are underserved or constrained; | |
● | seek clients with expertise in their respective lines of business; | |
● | employ strict underwriting discipline; | |
● | select reinsurance opportunities with anticipated favorable returns on capital over the life of the contract; and | |
● | strengthen and expand relationships with existing clients; including by making strategic investments from time to time. | |
The following table sets forth our gross premiums written by line of business*:
Year ended December 31 | |||||||||||||||||||||
2016 | 2015 | 2014 | |||||||||||||||||||
($ in thousands) | |||||||||||||||||||||
Property | |||||||||||||||||||||
Commercial | $ | 16,180 | 3.0 | % | $ | 15,633 | 3.1 | % | $ | 11,826 | 3.6 | % | |||||||||
Motor | 39,551 | 7.4 | 34,529 | 6.9 | 24,008 | 7.4 | |||||||||||||||
Personal | 47,893 | 8.9 | 57,495 | 11.5 | 63,997 | 19.8 | |||||||||||||||
Total Property | 103,624 | 19.3 | 107,657 | 21.5 | 99,831 | 30.8 | |||||||||||||||
Casualty | |||||||||||||||||||||
General Liability | 34,450 | 6.4 | 27,620 | 5.5 | 11,234 | 3.5 | |||||||||||||||
Motor | 227,030 | 42.4 | 203,624 | 40.6 | 127,858 | 39.4 | |||||||||||||||
Professional | 37,847 | 7.1 | 65,607 | 13.1 | 26,129 | 8.1 | |||||||||||||||
Workers' Compensation | 25,456 | 4.7 | 12,646 | 2.5 | 730 | 0.2 | |||||||||||||||
Total Casualty | 324,783 | 60.6 | 309,497 | 61.7 | 165,951 | 51.2 | |||||||||||||||
Specialty | |||||||||||||||||||||
Accident & Health | 52,114 | 9.7 | 56,784 | 11.3 | 43,837 | 13.5 | |||||||||||||||
Financial | 34,658 | 6.5 | 6,699 | 1.3 | 5,067 | 1.6 | |||||||||||||||
Marine | 9,127 | 1.7 | 9,283 | 1.8 | 5,120 | 1.6 | |||||||||||||||
Other | 11,766 | 2.2 | 12,204 | 2.4 | 4,217 | 1.3 | |||||||||||||||
Total Specialty | 107,665 | 20.1 | 84,970 | 16.8 | 58,241 | 18.0 | |||||||||||||||
$ | 536,072 | 100.0 | % | $ | 502,124 | 100.0 | % | $ | 324,023 | 100.0 | % | ||||||||||
* During the year ended December 31, 2016, the Company revised its classification of its lines of business. As a result, the gross written premiums in the above table relating to certain lines of business previously reported for the years ended December 31, 2015 and 2014, have been reclassified to conform to the current period presentation. |
6
The following table sets forth our gross premiums written by the geographic area of the risk insured:
Year ended December 31 | |||||||||||||||||||||
2016 | 2015 | 2014 | |||||||||||||||||||
($ in thousands) | |||||||||||||||||||||
U.S. and Caribbean | $ | 432,144 | 80.6 | % | $ | 383,236 | 76.3 | % | $ | 275,402 | 85.0 | % | |||||||||
Worldwide (1) | 97,810 | 18.2 | 104,336 | 20.8 | 31,106 | 9.6 | |||||||||||||||
Europe | 6,250 | 1.2 | 14,085 | 2.8 | 17,432 | 5.4 | |||||||||||||||
Asia (2) | (132 | ) | — | 467 | 0.1 | 83 | — | ||||||||||||||
$ | 536,072 | 100.0 | % | $ | 502,124 | 100.0 | % | $ | 324,023 | 100.0 | % | ||||||||||
(1) | “Worldwide” is comprised of contracts that reinsure risks in more than one geographic area and do not specifically exclude the U.S. |
(2) | The negative balance represents reversal of premiums due to premium adjustments, termination of contracts or premium returned upon novation or commutation of contracts. |
Additional information about our business is set forth in “Item 7 — Management’s Discussion and Analysis of Financial Condition and Results of Operations” and Note 15 to our consolidated financial statements included herein.
Marketing and Distribution
A majority of our business is sourced through reinsurance brokers. Brokerage distribution channels provide us with access to an efficient, variable cost and global distribution system without the significant time and expense that would be incurred in creating a wholly-owned distribution network. We believe that our financial strength rating, unencumbered balance sheet and superior client service are essential for creating long-term relationships with clients and brokers.
We aim to build and strengthen long-term relationships with global reinsurance brokers. Our management team has significant relationships with most of the primary and specialty broker intermediaries in the reinsurance marketplace. We believe that by maintaining close relationships with brokers we will be able to continue to obtain access to a broad range of reinsurance clients and opportunities. We focus on the quality and financial strength of any brokerage firm with which we do business. Brokers do not have the authority to bind us to any reinsurance contract.
Reinsurance brokers receive a brokerage commission that is usually a percentage of gross premiums written. We seek to become the first choice of brokers and clients by providing:
● | customized solutions that address the specific business needs of our clients; | |
● | rapid and substantive responses to proposal and pricing quote requests; | |
● | timely payment of claims; | |
● | financial security; and | |
● | clear indication of risks we will and will not underwrite. | |
The following table sets forth the premiums sourced from brokers who each accounted for more than 10% of our gross written premiums:
Year ended December 31 | |||||||||||||||||||||
2016 | 2015 | 2014 | |||||||||||||||||||
($ in thousands) | |||||||||||||||||||||
Largest broker | $ | 274,816 | 51.3 | % | $ | 278,003 | 55.4 | % | $ | 161,405 | 49.8 | % | |||||||||
2nd largest broker | 104,684 | 19.5 | 110,246 | 22.0 | 61,809 | 19.1 | |||||||||||||||
3rd largest broker | — | — | — | — | 40,773 | 12.6 | |||||||||||||||
$ | 379,500 | 70.8 | % | $ | 388,249 | 77.4 | % | $ | 263,987 | 81.5 | % | ||||||||||
7
We meet frequently in the Cayman Islands, Ireland and elsewhere with brokers and senior representatives of clients and prospective clients. All contract submissions are received, reviewed and approved in our offices in the Cayman Islands or Ireland. Due to our dependence on brokers, the inability to obtain business from them could adversely affect our business strategy. See “Item 1A. Risk Factors — Risks Related to Our Business — The inability to obtain business provided from brokers could adversely affect our business strategy and results of operations.” In addition, we may assume a degree of the credit risk of our reinsurance brokers. See “Item 1A. Risk Factors — Risks Related to Our Business — We may be subject to the credit risk of our brokers, cedents and agents.”
Underwriting and Risk Management
We have established a strong underwriting platform that is organized into several underwriting teams comprised of both generalist underwriters and actuaries. We believe that experienced deal teams, coupled with our approach to underwriting, allows us to deploy our capital in a variety of lines of business and to capitalize on opportunities that we believe offer favorable returns on equity over the long term. Our underwriters and actuaries have expertise in a number of lines of business and we also look to outside consultants on a fee-for-service basis to help us with niche areas of expertise when we deem it appropriate. We generally apply the following underwriting and risk management principles:
Economics of Results
Our primary goal is to build a reinsurance portfolio that has attractive economic results. We may underwrite a reinsurance contract that may not demonstrate immediate short-term accounting benefits if we believe it will provide a favorable return on capital over the life of the contract. In pricing our products, we assume investment returns that approximate the risk-free rate, which we review and adjust, if necessary, on an annual basis.
Actuarially Based Pricing
We have developed and use proprietary actuarial models and also use several commercially available tools to price our business. Our models not only consider conventional underwriting metrics, but also incorporate a component for risk aversion that places greater weight on scenarios that result in greater losses. We price each transaction based on our view of the merits and structure of the transaction.
Team Approach
Each transaction typically is assigned to a deal team comprised of at least one underwriter and an actuary to evaluate underwriting, structuring and pricing. Prior to committing capital to any transaction, the deal team creates a deal analysis memorandum that highlights the key components of the proposed transaction and presents the proposed transaction to a senior group of staff, including underwriting, actuarial, risk management and finance. This group is provided an opportunity to critically evaluate the proposed transaction. Additionally, our Chief Executive Officer or Chief Underwriting Officer must agree that the transaction meets our underwriting guidelines before we submit a firm proposal. Our Chief Executive Officer and Chief Underwriting Officer maintain the exclusive ultimate authority to bind contracts.
Act as Lead Underwriter
Typically, one reinsurer acts as the lead underwriter in negotiating principal policy terms and pricing of reinsurance contracts. We aim to act as the lead underwriter for the majority of the aggregate premiums that we underwrite. We believe that lead underwriting is an important factor in achieving long-term success, as lead underwriters typically have greater influence in negotiating pricing, terms and conditions. In addition, we believe that reinsurers that lead policies are generally solicited for a broader range of business and have greater access to attractive opportunities. However, we may from time to time participate in contracts that have been negotiated and priced by another party. For example, on some longer duration casualty business that is comprised of larger, syndicated reinsurance placements, we may follow the market on these transactions.
Alignment of Company and Client’s Interests
We seek to ensure that each contract we underwrite aligns our interests with our client’s interests. Specifically, depending upon the opportunity we may seek to:
8
● | pay our clients a commission based upon a predetermined percentage of the profit we realize on the business, which we refer to as a profit commission; | |
● | provide that the client pays a predetermined amount of all losses before our reinsurance policy incurs a loss payment, which we refer to as self-insured retentions; | |
● | provide that the client pays a predetermined proportion of all losses above a predetermined amount, which we refer to as co-participation; and/or | |
● | charge the client a premium for reinstatement of reinsurance coverage to the full amount, which we refer to as reinstatement premium, if coverage has been reduced as a result of a reinsurance loss payment. | |
We believe that through profit commissions, self-insured retentions, co-participation, reinstatement premiums and other terms within the contract, our clients are provided with an incentive to manage our interests. We believe that aligning our interests with our clients’ interests promotes accurate reporting of information, timely settling and management of claims and limits the potential for disputes.
Detailed Contract Diligence
We are highly selective in the contracts we choose to underwrite and spend a significant amount of time with our clients and brokers to understand the risks and appropriately structure the contracts. Where necessary, we conduct or contract for on-site audits or reviews of the clients’ underwriting files, systems and operations. We usually obtain significant amounts of data from our clients to conduct a thorough actuarial modeling analysis. As part of our pricing and underwriting process, we assess, among other factors:
● | the client’s and industry’s historical loss data; | |
● | the expected duration for claims to fully develop; | |
● | the client’s pricing and underwriting strategies; | |
● | the geographic areas in which the client is doing business and its market share; | |
● | the reputation and financial strength of the client; | |
● | the reputation and expertise of the broker; | |
● | the likelihood of establishing a long-term relationship with the client and the broker; and | |
● | reports provided by independent industry specialists. | |
Underwriting Authorities
We use actuarial models that we produce and apply our underwriting guidelines to analyze each reinsurance opportunity before we commit capital. The Underwriting Committee of our Board of Directors, which we refer to as the Underwriting Committee, sets parameters for zonal and aggregate property catastrophic caps and limits for maximum loss potential under any individual contract. The Underwriting Committee must approve any exceptions to the established limits. Our approach to risk control imposes an absolute loss limit on our natural catastrophic exposures as well as an estimate of probable maximum losses, and we have also established zonal and aggregate limits. We manage all non-catastrophic exposures and other risks by analyzing our maximum loss potential on a contract-by-contract basis. The maximum underwriting authorities, as set by our Underwriting Committee, may be amended from time to time, including as and when our capital base changes.
Retrocessional Coverage
We may, from time to time, purchase retrocessional coverage for one or more of the following reasons: to manage our overall exposure, to reduce our net liability on individual risks, to obtain additional underwriting capacity and to balance our underwriting portfolio. Additionally, retrocession can be used as a mechanism to share the risks and rewards of business written and, therefore, can be used as a tool to align our interests with those of our counterparties.
The amount of retrocessional coverage that we purchase varies based on numerous factors, some of which include the inherent riskiness of the portfolio of business we write and the level of our capital base. Given our opportunistic approach to underwriting, which may change the composition and inherent riskiness of our underwriting portfolio on an annual basis, it is not possible to predict the level of retrocessional coverage that we will purchase in any given year. To date, our retrocessional coverage has been primarily used as a tool to align our interests with those of our counterparties.
We intend to only purchase uncollateralized retrocessional coverage from a reinsurer with a minimum financial strength rating of “A- (Excellent)” from A.M. Best Company, Inc. (“A.M. Best”) or an equivalent rating from a recognized rating
9
service. For non-rated reinsurers, we monitor and obtain collateral in the form of cash, funds withheld, letters of credit, regulatory trusts or other collateral in the form of guarantees. As of December 31, 2016, the aggregate amount due from reinsurers from retrocessional coverages represents 0.9% (2015: 1.1%) of our gross outstanding loss reserves. For further details please see Note 8 to the consolidated financial statements. We regularly evaluate the financial condition of our reinsurers to assess their ability to honor their obligations. At December 31, 2016 and 2015, no provision for uncollectible losses recoverable was considered necessary.
Capital Allocation
We allocate capital to each contract that we bind. Our capital allocation methodology uses the probability and magnitude of potential for economic loss. We allocate capital for the period from each contract’s inception until the risk is resolved. We have developed a proprietary return on equity capital allocation model to evaluate and price each reinsurance contract that we underwrite. We use different return on equity thresholds depending on the type and risk characteristics of the business we underwrite.
Claims Management
Our claims management process begins upon receipt of claims submissions from our clients, which the underwriter reviews for authorization prior to entry and settlement. Additionally, our in-house claims manager and general counsel are responsible for overseeing the review of claims and providing approval for complex or large claim settlements. We believe this ensures that we pay claims consistently within the terms and conditions of each contract. Depending on the size of the claim payment, additional approvals for payment must be obtained from our executive officers.
Where necessary, we conduct or contract for on-site claims and underwriting audits at cedents and third party claims handlers, particularly for large accounts and for those whose performance differs from our expectations. Through these audits, we evaluate and monitor ceding companies’ claims-handling practices, including the organization of their claims departments, their fact-finding and investigation techniques, their loss notifications, the adequacy of their reserves, their negotiation and settlement practices and their adherence to claims-handling guidelines.
We recognize that fair interpretation of our reinsurance agreements with our clients and timely payment of covered claims are valuable services to our clients.
Reserves
Our reserving philosophy is to set reserves to our best estimate of the actual results that stem from the risks underwritten. Our actuaries provide reserving estimates on a quarterly basis calculated to meet our estimated future obligations. We reserve on a transaction by transaction basis. We engage independent external actuaries who review and provide an opinion on these estimates at least once a year. Due to the use of different assumptions, accounting treatment and loss experience, the amount we establish as reserves with respect to individual risks, transactions or classes of business may be greater or less than those established by clients or ceding companies. Reserves may also include unearned premiums, premium deposits, profit sharing earned but not yet paid, claims reported but not yet paid, claims incurred but not reported and claims in the process of settlement.
Reserves do not represent an exact calculation of liability. Rather, reserves represent our best estimate of the expected cost of the ultimate settlement and administration of the claim. Although the methods for establishing reserves are well-tested, some of the major assumptions about anticipated loss emergence patterns are subject to unanticipated fluctuation. We base these estimates on our assessment of facts and circumstances then known, as well as estimates of future trends in claim severity and frequency, judicial theories of liability and other factors, including the actions of third parties, which are beyond our control.
10
Collateral Arrangements and Letter of Credit Facilities
We are licensed and admitted as an insurer only in the Cayman Islands and the European Economic Area. Many jurisdictions, such as the United States, do not permit clients to take credit for reinsurance on their statutory financial statements if such reinsurance is obtained from unlicensed or non-admitted insurers without appropriate collateral. As a result, we anticipate that all of our U.S. clients and a portion of our non-U.S. clients will require us to provide collateral for the contracts we bind with them. We expect this collateral to take the form of funds withheld, trust arrangements or letters of credit. As of December 31, 2016, we had letter of credit facilities with an aggregate capacity of $600.0 million (2015: $720.0 million). As of December 31, 2016, we had issued letters of credit totaling $255.4 million (2015: $245.6 million) to clients. Additionally, as of December 31, 2016, we had pledged $86.4 million (2015: $78.6 million) as collateral through trust arrangements. The failure to maintain, replace or increase our letter of credit facilities and trust arrangements on commercially acceptable terms may significantly and negatively affect our ability to implement our business strategy. See “Item 1A. Risk Factors — Risks Relating to Our Business — Our failure to maintain sufficient collateral arrangements or to increase our collateral capacity on commercially acceptable terms as we grow could significantly and negatively affect our ability to implement our business strategy.”
Competition
The reinsurance industry is highly competitive. We compete with major reinsurers, most of which are well established, have significant operating histories and strong financial strength ratings, and have developed long-standing client relationships.
Our competitors include Chubb, Everest Re, General Re Corporation, Hannover Re Group, Munich Reinsurance Company, PartnerRe Ltd., Swiss Reinsurance Company, Third Point Reinsurance Ltd. and Transatlantic Reinsurance Company, as well as smaller companies and other niche reinsurers. Although we seek to provide coverage where capacity and alternatives are limited, we directly compete with these larger companies due to the breadth of their coverage across the property and casualty market in substantially all lines of business.
Ratings
Currently, our reinsurance subsidiaries, Greenlight Re and GRIL are both rated “A- (Excellent)” by A.M. Best. On November 3, 2016, A.M. Best revised Greenlight Re’s rating of “A (Excellent)” to “A- (Excellent”) with a stable outlook. The “A- (Excellent)” rating from A.M. Best is the fourth highest of 13 ratings. We believe that a strong rating is an important factor in the marketing of reinsurance products to clients and brokers. These ratings reflect the rating agency’s opinion of our reinsurance subsidiaries’ financial strength, operating performance and ability to meet obligations. It is not an evaluation directed toward the protection of investors or a recommendation to buy, sell or hold our Class A ordinary shares.
The failure to maintain a strong rating may significantly and negatively affect our ability to implement our business strategy. See “Item 1A. Risk Factors — Risks Relating to Our Business —A downgrade or withdrawal of either of our A.M. Best ratings may significantly and negatively affect our ability to implement our business strategy successfully.”
Regulations
Cayman Islands Insurance Regulation
The legislative framework for the carrying on of insurance and reinsurance business in and from within the Cayman Islands is comprised of The Insurance Law, 2010 and underlying regulations thereto (the “Law”) which was brought into force in the Cayman Islands effective as of November 1, 2012.
Greenlight Re holds a Class D insurer license issued in accordance with the terms of the Law and is subject to regulation by CIMA.
As the holder of a Class D insurer license, Greenlight Re is permitted to carry on reinsurance business from the Cayman Islands, but, except with the prior written approval of CIMA, may not carry on any insurance or reinsurance business where the underlying risk originates and resides in the Cayman Islands.
Greenlight Re is required to comply with the following principal requirements under the Law:
11
● | to maintain capital and a margin of solvency in accordance with the capital and solvency requirements prescribed by the Law; | |
● | to carry on its business in accordance with the terms of the license application submitted to CIMA and to seek the prior approval of CIMA for any proposed change thereto; | |
● | to maintain adequate arrangements for the management of risks and a system of governance as approved by CIMA; | |
● | to maintain a minimum of at least two directors and to seek the prior approval of CIMA in respect of the appointment of directors and officers and to provide CIMA with information in connection therewith and notification of any changes thereto; | |
● | to have a place of business in the Cayman Islands and to maintain such resources, including staff and facilities, books and records as CIMA considers appropriate having regard for the nature and scale of the business of Greenlight Re; | |
● | to submit to CIMA an annual return in the prescribed form together with: | |
1. financial statements prepared in accordance with any internationally recognized accounting standards, audited by an independent auditor approved by CIMA; | ||
2. an actuarial valuation of Greenlight Re’s assets and liabilities, certified by an actuary approved by CIMA; | ||
3. certification of solvency prepared by a person approved by CIMA in accordance with the prescribed requirements; | ||
4. confirmation that the information contained in Greenlight Re’s license application, as modified by any subsequent changes, remains correct; | ||
5. such other information as may be prescribed by CIMA; and | ||
● | to pay an annual license fee. | |
It is the duty of CIMA:
● | to maintain a general review of insurance practices in the Cayman Islands; | |
● | to examine the affairs or business of any licensee or other person carrying on, or who has carried on, insurance business in order to ensure that the Law has been complied with and that the licensee is in a sound financial position and is carrying on its business in a fit and proper manner; | |
● | to examine and report on the annual returns delivered to CIMA in terms of the Law; and | |
● | to examine and make recommendations with respect to, among other things, proposals for the revocation of licenses and cases of suspected insolvency of licensed entities. | |
Where CIMA believes that a licensee is committing, or is about to commit or pursue, an act that is an unsafe or unsound business practice, CIMA may direct the licensee to cease or refrain from committing the act or pursuing the offending course of conduct. Failure to comply with such a CIMA direction may be punishable on summary conviction by a fine of up to 100,000 Cayman Islands dollars (which is approximately US$120,000) or to imprisonment for a term of five years or to both, and on conviction on indictment to a fine of 500,000 Cayman Islands dollars (which is approximately US$600,000) or to imprisonment for a term of ten years or to both and to an additional 10,000 Cayman Islands dollars (which is approximately US$12,000) for every day after conviction that the breach continues.
Whenever CIMA believes that a licensee is or may become unable to meet its obligations as they fall due, is carrying on business in a manner likely to be detrimental to the public interest or to the interest of its creditors or policyholders, has contravened the terms of the Law or has otherwise behaved in such a manner so as to cause CIMA to call into question the licensee’s fitness, CIMA may take one of a number of steps, including requiring the licensee to take steps to rectify the matter, suspending the license of the licensee, revoking the license, imposing conditions upon the license and amending or revoking any such condition, requiring the substitution of any director, manager or officer of the licensee, at the expense of the licensee,
12
appointing a person to advise the licensee on the proper conduct of its affairs and to report to CIMA thereon, at the expense of the licensee, appointing a person to assume control of the licensee’s affairs or otherwise requiring such action to be taken by the licensee as CIMA considers necessary. To date, we have not been subject to any such actions from CIMA.
Other Regulations in the Cayman Islands
As Cayman Islands exempted companies, Greenlight Capital Re and Greenlight Re may not carry on business or trade locally in the Cayman Islands except in furtherance of their business outside the Cayman Islands, and are prohibited from soliciting the public of the Cayman Islands to subscribe for any of their securities or debt. We are further required to file a return with the Registrar of Companies in January of each year and to pay an annual registration fee at that time.
The Cayman Islands has no exchange controls restricting dealings in currencies or securities.
Ireland Insurance Regulations
Our Irish subsidiary, GRIL, is authorized as a non-life reinsurance undertaking by the CBI. The Solvency II Directive 2009/138/EC (known as “Solvency II”) introduced a new European regulatory regime for insurers and reinsurers and has been transposed into Irish law by the European Union (Insurance and Reinsurance) Regulations 2015 (the “Irish Regulations”) which became effective on January 1, 2016. Solvency II is supplemented by European Commission Delegated Regulations (EU) 2015/35, other European Commission “delegated acts” and binding technical standard, and guidelines issued by the European Insurance and Occupational Pensions Authority (“Delegated Acts and Guidelines”). GRIL is required to comply at all times with the Irish Regulations, the Irish Insurance Acts 1909 to 2015, regulations relating to insurance business or reinsurance business promulgated under the European Communities Act 1972, the Irish Central Bank Acts 1942 to 2015 as amended, regulations promulgated thereunder and directions, guidelines and codes of conduct issued by CBI (collectively the “Irish Insurance Acts and Regulations”). In addition, GRIL is required to comply with the Delegated Acts and Guidelines and must meet risk-based solvency requirements imposed under Solvency II on insurers and reinsurers across all member states, including Ireland. Solvency II and the Delegated Acts and Guidelines set out classification and eligibility requirements, including the characteristics required for any capital contribution to qualify as regulatory capital.
Overview of Investments
Our investment portfolio is managed by DME Advisors, a value-oriented investment advisor that analyzes companies’ available financial data, business strategies and prospects in an effort to identify undervalued and overvalued securities. DME Advisors is controlled by David Einhorn, the Chairman of our Board of Directors and the President of Greenlight Capital, Inc. Effective January 1, 2017, we entered into a third amended and restated agreement (the “venture agreement”), wherein the Company, Greenlight Re, GRIL, and DME have agreed to create a joint venture for the purposes of managing certain jointly held assets. The venture agreement, which replaces the previous agreement dated January 1, 2014, expires on December 31, 2019 and will renew automatically for successive three-year periods, unless at least 90 days prior to the end of the then current term, DME notifies the other participants of its desire to terminate the venture agreement or any other participant notifies DME of its desire to withdraw from the venture agreement. Simultaneously with the venture agreement, we entered into an amended and restated investment advisory agreement (the “advisory agreement”) with DME Advisors to provide discretionary advisory services relating to the assets and liabilities of the venture. The advisory agreement term period mirrors that of the venture agreement.
Pursuant to the venture agreement and the advisory agreement, DME Advisors has the exclusive right to manage substantially all of our investable assets, subject to the investment guidelines adopted by the respective Boards of Directors of Greenlight Re and GRIL, for so long as the venture agreement is in effect. DME Advisors receives a monthly management fee based on an annual rate of 1.5% of the capital account balance of each participant. In addition, DME receives a performance allocation based on the positive performance change in such participant’s capital account equal to 20% of net profits calculated per annum, subject to a loss carry forward provision.
The loss carry forward provision allows DME to earn a reduced performance allocation of 10% on profits in any year subsequent to the year in which a participant’s capital account (other than DME) incurs a loss, until all the losses are recouped and an additional amount equal to 150% of the loss is earned. DME is not entitled to a performance allocation in a year in which such participant’s capital account incurs a loss.
DME Advisors is required to follow our investment guidelines and act in a manner that it considers fair and equitable in allocating investment opportunities to us, but the advisory agreement does not otherwise impose any specific obligations or requirements concerning the allocation of time, effort or investment opportunities to us or any restrictions on the nature or timing of investments for our account, or other accounts that DME Advisors or its affiliates may manage. In addition, DME
13
Advisors can outsource to sub-advisors without our consent or approval. In the event that DME Advisors and any of its affiliates attempt to simultaneously invest in the same opportunity, the opportunity will be allocated pro-rata as reasonably determined by DME Advisors and its affiliates. Affiliates of DME Advisors presently serve as general partner or investment advisor of Greenlight Capital, L.P., Greenlight Capital Qualified, L.P., Greenlight Capital Offshore, Ltd., Greenlight Capital Offshore Qualified, Ltd., Greenlight Capital Offshore Partners, Greenlight Capital (Gold), L.P., Greenlight Capital Offshore (Gold), Ltd., Greenlight Capital Offshore Master (Gold), Ltd., Greenlight Masters, L.P., Greenlight Masters Qualified, L.P., Greenlight Masters Offshore, Ltd., Greenlight Masters Offshore I, Ltd., Greenlight Masters Offshore Partners and Greenlight Masters Partners (collectively the “Greenlight Funds”).
We have agreed to use commercially reasonable efforts to cause all of our current and future subsidiaries to enter into substantially similar venture agreements, provided that any such agreement shall be terminable on the same date that the venture agreement is terminable.
We have agreed to release DME and DME Advisors and their affiliates from, and to indemnify and hold them harmless against, any liability arising out of the venture agreement and the advisory agreement, subject to certain exceptions. Furthermore, DME and DME Advisors and their affiliates have agreed to indemnify us against any liability incurred in connection with certain actions.
Greenlight Re or GRIL may also withdraw as a participant under the venture agreement prior to the expiration of its term at any time only ‘‘for cause,’’ which the venture agreement defines as:
● | a material violation of applicable law relating to DME’s or DME Advisors’ advisory business; | |
● | DME’s or DME Advisors’ gross negligence, willful misconduct or reckless disregard of any of DME’s obligations under the venture agreement or DME Advisors’ obligations under the advisory agreement; | |
● | a material breach by DME or DME Advisors of Greenlight Re’s or GRIL’s investment guidelines that is not cured within a 15-day period; or | |
● | a material breach by DME or DME Advisors of its obligations to return and deliver assets as we may request. | |
In addition, GRIL may withdraw as a participant under the venture agreement prior to the expiration of its term due to unsatisfactory long term performance of DME Advisors, as determined solely by the Board of Directors of GRIL on each anniversary date of the venture agreement.
Investment Strategy
DME Advisors implements a value-oriented investment strategy by taking long positions in perceived undervalued securities and short positions in perceived overvalued securities. DME Advisors aims to achieve high absolute rates of return while minimizing the risk of capital loss. DME Advisors attempts to determine the risk/return characteristics of potential investments by analyzing factors such as the risk that expected cash flows will not be obtained, the volatility of the cash flows, the leverage of the underlying business and the security’s liquidity, among others.
Our Board of Directors conducts reviews of our investment portfolio activities and oversees our investment guidelines to meet our investment objectives. We believe our investment approach, while less predictable than traditional fixed-income portfolios, complements our reinsurance business and will achieve higher rates of return over the long term than reinsurance companies that invest predominantly in fixed-income securities. Our investment guidelines are designed to maintain adequate liquidity to fund our reinsurance operations and to protect against unexpected events.
DME Advisors, which is contractually obligated to adhere to our investment guidelines, makes investment decisions on our behalf, which may include buying publicly listed equity securities and corporate debt, selling securities short and investing in private placements, futures, currencies, commodities, credit default swaps, interest rate swaps, sovereign debt, derivatives and other instruments. As of December 31, 2016, DME Advisors was in compliance with our investment guidelines.
14
Investment Guidelines
The investment guidelines adopted by the respective Boards of Directors of Greenlight Re and GRIL, which may be amended or modified from time to time, take into account restrictions imposed on us by regulators, our liability mix, requirements to maintain an appropriate claims paying rating by ratings agencies and requirements of lenders.
As of the date hereof, the investment guidelines for Greenlight Re currently state:
● | Composition of Investments: At least 80% of the assets in the investment portfolio will be held in debt or equity securities (including swaps) of publicly-traded companies (or their subsidiaries), governments of the Organization of Economic Co-operation and Development, (the “OECD”) and high income countries, cash, cash equivalents and gold. No more than 10% of the assets in the investment portfolio will be held in private equity securities. | |
● | Concentration of Investments: Other than cash, cash equivalents, United States government obligations and gold, no single investment in the investment portfolio will constitute more than 20% of the portfolio. | |
● | Liquidity: Assets will be invested in such fashion that Greenlight Re has a reasonable expectation that it can meet any of its liabilities as they become due. Greenlight Re will review with the investment advisor the liquidity of the portfolio on a periodic basis. | |
● | Monitoring: Greenlight Re will require the investment advisor to re-evaluate each position in the investment portfolio and to monitor changes in intrinsic value and trading value and provide monthly reports on the investment portfolio to Greenlight Re as Greenlight Re may reasonably determine. | |
● | Leverage: The investment portfolio may not employ greater than 15% indebtedness for borrowed money, including net margin balances, for extended time periods. The investment advisor may employ, in the normal course of business, up to 30% indebtedness for periods of less than 30 days. | |
Currency hedging activities are excluded from leverage calculations. Where the investment advisor enters into a secondary investment with the primary purpose of reducing the risk of another existing investment then the investment advisor may exclude the secondary investment from the calculation of leverage provided that the investment advisor receives approval from the Company’s Chief Financial Officer. Such authority is limited such that no more than 10% of indebtedness may be excluded from leverage calculations for such secondary investments. | ||
The investment guidelines for GRIL are identical to Greenlight Re’s except for concentration of investments and leverage, which for GRIL are as follows:
● | Concentration of Investments: Other than cash, cash equivalents and United States government obligations, (1) no single investment in the investment portfolio will constitute more than 10% of the portfolio, (2) the 10 largest investments shall not constitute greater than 50% of the total investment portfolio, and (3) the investment portfolio shall at all times be comprised of a minimum of 50 debt or equity securities of publicly traded companies (or their subsidiaries). | |
● | Credit default swaps: The sale of credit default swaps is prohibited. | |
● | Leverage: The investment portfolio may not employ greater than 5% indebtedness for borrowed money, including net margin balances, for extended time periods. The investment advisor may use, in the normal course of business, an aggregate of up to 20% net margin leverage for periods of less than 30 days. | |
15
Investment Results
Composition
The following table represents the fair value of the total long positions in our investment portfolio as reported in the consolidated financial statements:
December 31 | ||||||||||||||
2016 | 2015 | |||||||||||||
($ in thousands) | ||||||||||||||
Debt instruments | $ | 22,473 | 2.0 | % | $ | 39,087 | 3.3 | % | ||||||
Equities – listed | 828,486 | 74.0 | 890,653 | 76.2 | ||||||||||
Exchange traded funds | 15,515 | 1.4 | 15,341 | 1.3 | ||||||||||
Commodities | 137,296 | 12.3 | 98,046 | 8.4 | ||||||||||
Private and unlisted equity securities | 18,767 | 1.7 | 21,037 | 1.8 | ||||||||||
1,022,537 | 91.4 | 1,064,164 | 91.0 | |||||||||||
Funds and cash held with brokers and swap counterparties | 22,541 | 2.0 | 120,276 | 10.3 | ||||||||||
Financial contracts, net | 74,144 | 6.6 | (15,030 | ) | (1.3 | ) | ||||||||
Total long investments | $ | 1,119,222 | 100.0 | % | $ | 1,169,410 | 100.0 | % | ||||||
The following table represents the fair value of our total short positions as reported in the consolidated financial statements:
December 31 | ||||||||||||||
2016 | 2015 | |||||||||||||
($ in thousands) | ||||||||||||||
Equities – listed | $ | 770,267 | 89.6 | % | $ | 796,054 | 90.2 | % | ||||||
Exchange traded funds | — | — | 12,427 | 1.4 | ||||||||||
Sovereign debt – Non U.S. | 89,635 | 10.4 | 74,425 | 8.4 | ||||||||||
Total short investments | $ | 859,902 | 100.0 | % | $ | 882,906 | 100.0 | % | ||||||
DME Advisors also reports the composition of our managed portfolio on a delta adjusted and notional exposure basis, which it believes is the appropriate manner in which to assess the exposure and profile of investments and is the way in which it manages the portfolio. This exposure analysis does not include cash (U.S. dollar and foreign currencies), gold and other commodities, credit default swaps, sovereign debt, foreign currency derivatives, interest rate options and other macro positions. In addition, under this methodology, the exposure for total return swaps is reported at full notional amount. The notional amount of a derivative contract is the underlying value upon which payment obligations are computed. For an equity total return swap, for example, the notional amount is the number of shares underlying the swap multiplied by the market price of those shares. Options are reported at their delta adjusted basis. The delta of an option is the sensitivity of the option price to the underlying stock (or commodity) price. The delta adjusted basis is the number of shares underlying the option multiplied by the delta and the underlying stock (or commodity) price.
The following table represents the composition of our investment portfolio based on the percentage of assets in our investment account managed by DME Advisors:
December 31 | ||||||||||||
2016 | 2015 | |||||||||||
Long % | Short % | Long % | Short % | |||||||||
Debt instruments | 1.9 | % | — | % | 1.9 | % | — | % | ||||
Equities & related derivatives | 96.3 | (72.9 | ) | 86.0 | (74.0 | ) | ||||||
Private and unlisted equity securities | 1.3 | — | 1.6 | — | ||||||||
Total | 99.5 | % | (72.9 | )% | 89.5 | % | (74.0 | )% | ||||
As of December 31, 2016, our exposure to gold on a delta adjusted basis was 11.9% (2015: 10.7%).
16
The following table represents the composition of our investment portfolio, by industry sector, based on the percentage of assets in our investment account managed by DME Advisors as of December 31, 2016:
Sector | Long % | Short % | Net % | ||||||
Basic Materials | 8.7 | % | (3.5 | )% | 5.2 | % | |||
Consumer Cyclical | 33.1 | (12.7 | ) | 20.4 | |||||
Consumer Non-Cyclical | 2.2 | (0.6 | ) | 1.6 | |||||
Energy | 7.6 | (13.7 | ) | (6.1 | ) | ||||
Financial | 11.9 | (9.4 | ) | 2.5 | |||||
Healthcare | 10.6 | (7.6 | ) | 3.0 | |||||
Industrial | 9.2 | (15.6 | ) | (6.4 | ) | ||||
Technology | 10.0 | (9.7 | ) | 0.3 | |||||
Utilities | 6.2 | (0.1 | ) | 6.1 | |||||
Total | 99.5 | % | (72.9 | )% | 26.6 | % | |||
The following table represents the composition of our investment portfolio, by the market capitalization of the underlying security, based on the percentage of assets in our investment account managed by DME Advisors as of December 31, 2016:
Capitalization | Long % | Short % | Net % | ||||||
Mega Cap Equity (≥$25 billion) | 42.0 | % | (28.2 | )% | 13.8 | % | |||
Large Cap Equity (≥$5 billion and <$25 billion) | 33.7 | (32.9 | ) | 0.8 | |||||
Mid Cap Equity (≥$1 billion and <$5 billion) | 15.0 | (11.8 | ) | 3.2 | |||||
Small Cap Equity (<$1 billion) | 5.6 | — | 5.6 | ||||||
Debt Instruments | 1.9 | — | 1.9 | ||||||
Other Investments | 1.3 | — | 1.3 | ||||||
Total | 99.5 | % | (72.9 | )% | 26.6 | % | |||
Investment Returns
A summary of our consolidated net investment income is as follows:
Year ended December 31 | ||||||||||||
2016 | 2015 | 2014 | ||||||||||
($ in thousands) | ||||||||||||
Realized gains (losses) | $ | (113,836 | ) | $ | 22,227 | $ | 352,133 | |||||
Change in unrealized gains and losses | 209,993 | (265,401 | ) | (187,753 | ) | |||||||
Investment related foreign exchange gains (losses) | 2,988 | (3,725 | ) | 14,797 | ||||||||
Interest and dividend income, net of withholding taxes | 23,915 | 15,313 | 31,423 | |||||||||
Interest, dividend and other expenses | (22,334 | ) | (31,092 | ) | (38,892 | ) | ||||||
Investment advisor compensation | (24,543 | ) | (19,246 | ) | (49,133 | ) | ||||||
Net investment income (loss) | $ | 76,183 | $ | (281,924 | ) | $ | 122,575 | |||||
17
Our investment return is based on the total assets in our investment account, which includes the majority of our equity capital and collected premiums. Investment returns, net of all fees and expenses, by quarter and for the last five years are as follows: (1)
Quarter | 2016 | 2015 | 2014 | 2013 | 2012 | ||||||||||
1st | 2.5 | % | (1.8 | )% | (0.7 | )% | 5.8 | % | 6.5 | % | |||||
2nd | (3.4 | ) | (1.5 | ) | 8.1 | 2.0 | (3.3 | ) | |||||||
3rd | 3.1 | (14.2 | ) | (3.7 | ) | 4.0 | 8.8 | ||||||||
4th | 5.0 | (4.0 | ) | 5.3 | 6.6 | (4.4 | ) | ||||||||
Full Year | 7.2 | % | (20.2 | )% | 8.7 | % | 19.6 | % | 7.1 | % | |||||
(1) Investment returns are calculated monthly and compounded to calculate the quarterly and annual returns. Actual investment income may vary depending on cash flows into and out of the investment account. Past performance is not necessarily indicative of future results.
DME Advisors and its affiliates manage and expect to manage other client accounts besides ours, some of which have, or may have, objectives similar to ours. Because of the similarity or potential similarity of our investment portfolio to these other client accounts, and because, as a matter of ordinary course, DME Advisors and its affiliates provide their clients, including us, with results of their respective investment portfolios on the last day of each month, those other clients indirectly may have material non-public information regarding our investment portfolio. To address this issue, and to comply with Regulation FD, we present, prior to the start of trading on the first business day of each month, our largest disclosed long positions, a summary of our consolidated net investment returns, information on our long and short exposures and from time to time certain other material information relating to our investment portfolio, on our website, www.greenlightre.ky. DME Advisors may choose not to disclose certain positions to its clients in order to protect its investment strategy. Therefore, we present on our website the largest positions held by us that are disclosed by DME Advisors or its affiliates to their other clients.
Internal Risk Management
Our risk manager is responsible for the construct and review of our internal risk management function. We review our investment portfolio together with our reinsurance operations on a periodic basis to ensure that we have sufficient capital to withstand losses on either or both of our investment and reinsurance portfolios under stressed scenarios. With the assistance of DME Advisors, we periodically analyze both our assets and liabilities including the numerous components of risk in our portfolio, such as concentration risk and liquidity risk.
Information Technology
Our information technology infrastructure is currently housed in our corporate offices in Grand Cayman, Cayman Islands. We have implemented backup procedures to ensure that data is backed up on a daily basis and can be restored in an appropriate time frame as needed.
We have a disaster recovery plan with respect to our information technology infrastructure that includes data and systems replication between our Cayman Islands office and Dublin office and other off-site locations. We believe we can access our core systems with insignificant outages and restore operation of our secondary systems in the event that our primary systems are unavailable due to a disaster or otherwise.
Employees
As of December 31, 2016, we had 35 full-time employees, 29 who were based in Grand Cayman, Cayman Islands and 6 who were based in Dublin, Ireland. We believe that our employee relations are good. None of our employees are subject to collective bargaining agreements, and we are not aware of any current efforts to implement such agreements.
18
Additional Information
Our website address is www.greenlightre.ky and we make available, free of charge, on or through our website, links to our annual reports on Form 10-K and quarterly reports on Form 10-Q including XBRL instance documents, current reports on Form 8-K and other documents we file with or furnish to the SEC, as soon as reasonably practicable after such material is electronically filed with or furnished to the SEC. In order to comply with Regulation FD, our investment returns are posted on our website on a monthly basis. Additionally, our Code of Business Conduct and Ethics is available on our website.
ITEM 1A. RISK FACTORS
Any of these factors could result in a significant or material adverse effect on our results of operations or financial condition. Additional risk factors not presently known to us or that we currently deem immaterial may also impair our business or results of operations.
Risks Relating to Our Business
Our results of operations will likely fluctuate from period to period and may not be indicative of our long-term prospects.
The performance of our reinsurance operations and our investment portfolio will likely fluctuate from period to period. Fluctuations will result from a variety of factors, including:
● | reinsurance contract pricing; | |
● | our assessment of the quality of available reinsurance opportunities; | |
● | the volume and mix of reinsurance products we underwrite; | |
● | loss experience on our reinsurance liabilities; | |
● | the performance of our investment portfolio; and | |
● | our ability to assess and integrate our risk management strategy properly. | |
In particular, we seek attractive opportunities to underwrite products and make investments to achieve favorable returns on equity over the long term. Our investment strategy to invest primarily in long and short positions in publicly-traded equity and debt instruments is subject to market volatility and is likely to be more volatile than traditional fixed-income portfolios that are comprised primarily of investment grade bonds. In addition, our differentiated strategy and focus on long-term growth in book value will result in fluctuations in total premiums written from period to period as we concentrate on underwriting contracts that we believe will generate better long-term, rather than short-term, results. Accordingly, our short-term results of operations may not be indicative of our long-term prospects.
Competitors with greater resources may make it difficult for us to effectively market our products or offer our products at a profit.
The reinsurance industry is highly competitive. We compete with major reinsurers, many of which have substantially greater financial, marketing and management resources than we do. Competition in the types of business that we underwrite is based on many factors, including:
● | premium charges; | |
● | ability to obtain terms and conditions appropriate with the risk being assumed and in accordance with our underwriting guidelines; | |
● | the general reputation and perceived financial strength of the reinsurer; | |
● | relationships with reinsurance brokers; | |
● | ratings assigned by independent rating agencies; | |
● | speed of claims payment and reputation; and | |
● | the experience and reputation of the members of our underwriting team in the particular lines of reinsurance we seek to underwrite. | |
Additionally, although the members of our underwriting deal teams have experience across many property and casualty lines, they may not have the requisite or specialized experience or expertise to compete for all transactions that fall within our
19
strategy of offering customized frequency and severity contracts at times and in markets where capacity and alternatives may be limited.
Our competitors include Chubb, Everest Re, General Re Corporation, Hannover Re Group, Munich Reinsurance Company, PartnerRe Ltd., Swiss Reinsurance Company and Transatlantic Reinsurance Company. Although we seek to provide coverage where capacity and alternatives are limited, we directly compete with these larger companies due to the breadth of their coverage across the property and casualty market in substantially all lines of business. We also compete with other reinsurers, such as Third Point Reinsurance Ltd., that may have similar investment strategies and often seek similar underwriting opportunities.
Further, our ability to compete may be harmed if insurance industry participants continue to consolidate. Consolidated entities may try to use their enhanced market power to negotiate price reductions for our products and services. If competitive pressures reduce our prices, we would expect to write less business. If and when the insurance industry further consolidates, competition for customers may become more intense, and the importance of acquiring and properly servicing each customer may become greater. We could incur greater expenses relating to customer acquisition and retention, further reducing our operating margins. In addition, insurance companies that merge may be able to spread their risks across a consolidated, larger capital base so that they require less reinsurance. The number of companies offering retrocessional reinsurance may decline. Reinsurance intermediaries could also consolidate, potentially adversely impacting our ability to access business and distribute our products. We could also experience more robust competition from larger, better capitalized competitors. Any of the foregoing could significantly, and negatively, affect our business or our results of operations.
We cannot assure you that we will be able to compete successfully in the reinsurance market. Our failure to compete effectively could significantly and negatively affect our financial condition and results of operations and may increase the likelihood that we may be deemed to be a passive foreign investment company or an investment company. See “Item 1A. Risk Factors - Risks Relating to Insurance and Other Regulations — We are subject to the risk of possibly becoming an investment company under U.S. federal securities law.”
A downgrade or withdrawal of either of our A.M. Best ratings may significantly and negatively affect our ability to implement our business strategy successfully.
Companies, insurers and reinsurance brokers use ratings from independent rating agencies as an important means of assessing the financial strength and quality of reinsurers. On November 3, 2016, A.M. Best revised Greenlight Re’s rating of “A (Excellent)” with a negative outlook, to “A- (Excellent”) with a stable outlook. A- (Excellent) is the fourth highest of 13 ratings that A.M. Best issues. These ratings reflect the rating agency’s opinion of our reinsurance subsidiaries’ financial strength, operating performance and ability to meet obligations. It is not an evaluation directed toward the protection of investors or a recommendation to buy, sell or hold our Class A ordinary shares. A.M. Best periodically reviews our ratings and may revise one or more of our ratings downward or revoke them at its sole discretion based primarily on its analysis of our balance sheet strength, operating performance and business profile. Factors that may affect such an analysis include:
● | if we change our business practices from our organizational business plan in a manner that no longer supports our A.M. Best ratings; | |
● | if unfavorable financial or market trends impact us; | |
● | if our actual losses significantly exceed our loss reserves; | |
● | if A.M. Best alters its capital adequacy assessment methodology in a manner that would adversely affect the rating of either reinsurer; | |
● | if we are unable to retain our senior management and other key personnel; or | |
● | if our investment portfolio incurs significant losses. | |
If A.M. Best downgrades or withdraws either of our ratings, we could be severely limited or prevented from writing any new reinsurance contracts, which would significantly and negatively affect our ability to implement our business strategy.
Some of our reinsurance contracts provide the client with the right to terminate the agreement if our A.M. Best ratings are downgraded below certain rating thresholds. We expect that similar provisions will also be included in some contracts in the future. See - “A downgrade in our ratings below specified levels or a significant decrease in our capital or surplus could enable certain clients to terminate reinsurance agreements or to require additional collateral.”
20
If our losses and loss adjustment expenses greatly exceed our loss reserves, our financial condition may be significantly and negatively affected.
Our results of operations and financial condition depend upon our ability to assess accurately the potential losses and loss adjustment expenses associated with the risks we reinsure. Reserves are estimates at a given time of claims an insurer ultimately expects to pay, based upon facts and circumstances then known, predictions of future events, estimates of future trends in claim severity and other variable factors. The inherent uncertainties of estimating loss reserves generally are greater for reinsurance companies as compared to primary insurers, primarily due to:
● | the lapse of time from the occurrence of an event to the reporting of the claim and the ultimate resolution or settlement of the claim; | |
● | the diversity of development patterns among different types of reinsurance treaties; and | |
● | the necessary reliance on the client for information regarding claims. | |
On the majority of premiums we underwrite, our estimation of reserves may be less reliable than the reserve estimations of a reinsurer with a greater volume of business and an established loss history. Actual losses and loss adjustment expenses paid may deviate substantially from the estimates of our loss reserves contained in our financial statements and could negatively affect our results of operations. If we determine our loss reserves to be inadequate, we will increase our loss reserves with a corresponding reduction in our net income and capital in the period in which we identify the deficiency, and such a reduction would also negatively affect our results of operations. If our losses and loss adjustment expenses greatly exceed our loss reserves, our financial condition may be significantly and negatively affected. For a summary of the effects of reserve re-estimation on prior year reserves and net income, see “Part II. Item 7. Management’s Discussion and Analysis of Financial Condition and Results of Operations - Critical Accounting Policies, Loss and Loss Adjustment Expense Reserves.“
The effect of emerging claim and coverage issues on our business is uncertain.
As industry practices and legal, judicial and regulatory conditions change, unexpected issues related to claims and coverage may emerge. Various provisions of our contracts, such as limitations or exclusions from coverage or choice of forum, may be difficult to enforce in the manner we intend, due to, among other things, disputes relating to coverage and choice of legal forum. These issues may adversely affect our business by either extending coverage beyond the period that we intended or by increasing the number or size of claims. In some instances, these changes may not manifest themselves until many years after we have issued insurance or reinsurance contracts that are affected by these changes. As a result, we may not be able to ascertain the full extent of our liabilities under our insurance or reinsurance contracts for many years following the issuance of our contracts. The effects of unforeseen development or substantial government intervention could adversely impact our ability to adhere to our goals.
The property and casualty reinsurance market may be affected by cyclical trends.
We write reinsurance in the property and casualty markets. The property and casualty reinsurance industry is cyclical. Primary insurers’ underwriting results, prevailing general economic and market conditions, liability retention decisions of companies and primary insurers and reinsurance premium rates influence the demand for property and casualty reinsurance. Prevailing prices and available surplus to support assumed business influence reinsurance supply. Supply may fluctuate in response to changes in return on capital realized in the reinsurance industry, the frequency and severity of losses and prevailing general economic and market conditions.
As a result, the reinsurance business historically has been a cyclical industry characterized by periods of intense price competition due to high levels of available underwriting capacity as well as periods when shortages of capacity have permitted favorable premium levels and changes in terms and conditions. The supply of available reinsurance capital has increased over the past several years and may increase further, either as a result of capital provided by new entrants or by the commitment of additional capital by existing insurers or reinsurers.
Continued increases in the supply of reinsurance may have consequences for the reinsurance industry generally and for us, including fewer contracts written, lower premium rates, increased expenses for customer acquisition and retention, less favorable policy terms and conditions and/or lower premium volume.
Unpredictable developments, including courts granting increasingly larger awards for certain damages, natural disasters (such as catastrophic hurricanes, windstorms, tornadoes, earthquakes, wildfires and floods), fluctuations in interest rates,
21
changes in the investment environment that affect market prices of investments and inflationary pressures, affect the industry’s profitability. The effects of cyclicality could significantly and negatively affect our financial condition and results of operations.
The global economic downturns and any significant weakness in the U.S. economy could harm our business, our liquidity and financial condition and our stock price.
Weak economic conditions may adversely affect (among other aspects of our business) the demand for and claims made under our products, the ability of customers, counterparties and others to establish or maintain their relationships with us, our ability to access and efficiently use internal and external capital resources and our investment performance. Volatility in the U.S. and other securities markets may adversely affect our investment portfolio and our stock price.
A downgrade in our ratings below specified levels or a significant decrease in our capital or surplus could enable certain clients to terminate reinsurance agreements or to require additional collateral.
Certain of our assumed reinsurance contracts contain provisions that permit our clients to cancel the contract or require additional collateral in the event of a downgrade in our ratings below specified levels or a reduction of our capital or surplus below specified levels over the course of the agreement. Whether a client would exercise such cancellation rights would likely depend, among other things, on the reason the provision is triggered, the prevailing market conditions, the degree of unexpired coverage and the pricing and availability of replacement reinsurance coverage.
If any such provisions were to become exercisable, we cannot predict whether or how many of our clients would actually exercise such rights or the extent to which they would have a significant and negative effect on our financial condition, results of operations or future prospects but they could have a significant adverse effect on the operations of our Company.
If we lose or are unable to retain our senior management and other key personnel and are unable to attract qualified personnel, our ability to implement our business strategy could be delayed or hindered, which, in turn, could significantly and negatively affect our business.
Our future success depends, to a significant extent, on the efforts of our senior management and other key personnel to implement our business strategy. We believe there are only a limited number of available, qualified executives with substantial experience in our industry. We could face challenges attracting and retaining personnel in the Cayman Islands and/or in Dublin, Ireland. Accordingly, the loss of the services of one or more of the members of our senior management or other key personnel, or our inability to hire and retain other key personnel, could prevent us from continuing to implement our business strategy and, consequently, significantly and negatively affect our business.
We do not currently maintain key man life insurance with respect to any of our senior management, including our Chief Executive Officer, Chief Financial Officer, or Chief Underwriting Officer. If any member of senior management dies or becomes incapacitated, or leaves the Company to pursue employment opportunities elsewhere, we would be solely responsible for locating an adequate replacement for such senior management and for bearing any related cost. To the extent that we are unable to locate an adequate replacement or are unable to do so within a reasonable period of time, our business may be significantly and negatively affected.
Our ability to implement our business strategy could be adversely affected by Cayman Islands employment restrictions.
Under Cayman Islands law, persons who are not Caymanian, do not possess Caymanian status, or are not otherwise entitled to reside and work in the Cayman Islands pursuant to provisions of the Immigration Law (2015 Revision) of the Cayman Islands, which we refer to as the Immigration Law, may not engage in any gainful occupation in the Cayman Islands without an appropriate governmental work permit. Such a work permit may be granted or extended on a continuous basis for a maximum period of nine years (after having been legally and ordinarily resident in the Cayman Islands for a period of eight years a person may apply for permanent residence in accordance with the provisions of the Immigration Law) upon showing that, after proper public advertisement, no Caymanian or person of Caymanian status, or other person legally and ordinarily resident in the Cayman Islands who meets the minimum standards for the advertised position is available. The failure of these work permits to be granted or extended could prevent us from continuing to implement our business strategy.
Operational risks, including human or systems failures, are inherent in our business.
Operational risks and losses can result from, among other things, fraud, errors, failure to document transactions properly or to obtain proper internal authorization, failure to comply with regulatory requirements, information technology failures or external events.
22
We believe that our modeling, underwriting and information technology and application systems are critical to our business. We utilize modeling tools to facilitate our pricing, reserving, and risk management tools to manage risks in our reinsurance portfolio. These models help us to control risk accumulation, inform management and other stakeholders of capital requirements and to improve the risk/return profile or minimize the amount of capital required to cover the risks in each reinsurance contract. However, given the inherent uncertainty of modeling techniques and the application of such techniques, these models and databases may not accurately address the emergence of a variety of matters which might be deemed to impact certain of our coverages. These models have been developed internally and in some cases they make use of third party software. The construction of these models and the selection of assumptions requires significant actuarial judgment. Furthermore, these models typically rely on either cedent or industry data, both of which may be incomplete or may be subject to errors. Accordingly, these models may understate the exposures we are assuming and our financial results may be adversely impacted, perhaps significantly.
Moreover, our information technology and application systems have been an important part of our underwriting process and our ability to compete successfully. We have also licensed certain systems and data from third parties. We cannot be certain that we will have access to these, or comparable, service providers, or that our information technology or application systems will continue to operate as intended. Like all companies, our information technology and application systems may be vulnerable to data breaches, interruptions or failures due to events that may be beyond our control, including, but not limited to, natural disasters, theft, terrorist attacks, malicious cyber-attacks, computer viruses, hackers and general technology failures. A major defect or failure in our internal controls or information technology and application systems could result in management distraction, result in a violation of applicable privacy or other laws, harm our reputation, cause a loss of customers or give rise to monetary fines or penalties or otherwise increase expenses. We believe appropriate controls and mitigation procedures are in place to prevent significant risk of data breaches, interruptions or failures in, information technology and application systems, but internal controls provide only a reasonable, not absolute, assurance as to the absence of errors or irregularities and any ineffectiveness of such controls and procedures could have a material adverse effect on our business.
Our failure to maintain sufficient collateral arrangements or to increase our collateral capacity on commercially acceptable terms as we grow could significantly and negatively affect our ability to implement our business strategy.
We are not licensed or admitted as a reinsurer in any jurisdiction other than the Cayman Islands and the European Economic Area. Certain jurisdictions, including the United States, do not permit insurance companies to take credit for reinsurance obtained from unlicensed or non-admitted insurers on their statutory financial statements unless appropriate security measures are implemented. Consequently, certain clients will require us to provide collateral often in the form of a letter of credit, a trust agreement or funds withheld. When we provide collateral, we are customarily required to provide collateral to the letter of credit provider or beneficiary of the trust agreement. Our ability to provide collateral, and the costs at which we provide collateral, are primarily dependent on the composition of our investment portfolio.
Typically, letters of credit are collateralized and trust agreements are funded with fixed-income securities or cash. Banks may be willing to accept our investment portfolio as collateral, but on terms that may be less favorable to us than reinsurance companies that invest solely or predominantly in fixed-income securities. The inability to renew, maintain or obtain letters of credit collateralized by our investment portfolio or fund trust agreements may significantly limit the amount of reinsurance we can write or require us to modify our investment strategy.
Our investment portfolio is used to provide collateral so that letters of credit and trust agreements can be issued. In the event of a decline in the market value of our investment portfolio that results in a collateral shortfall, we have the right, at our option, to reduce the outstanding obligations under the applicable letter of credit facility or trust agreement, to deposit additional collateral or to change the collateral composition in order to cure the shortfall. If the shortfall is not cured within the prescribed time period, an event of default will immediately occur. We will be prohibited from issuing additional collateral until any shortfall is cured.
Our access to funds under our existing credit facilities is dependent on the ability of the banks that are parties to the facilities to meet their funding commitments. Those banks may not be able to meet their funding commitments if they experience shortages of capital and liquidity or if they experience excessive volumes of borrowing requests within a short period of time, and we might be forced to replace credit sources in a difficult market.
Any significant consolidation in the financial industry could lead to increased reliance on and exposure to particular institutions. If we cannot obtain adequate capital or sources of credit on favorable terms, or at all, our business, operating results and financial condition could be adversely affected. It is possible that, in the future, rating agencies may reduce our existing ratings. If one or more of our ratings were downgraded, we could incur higher borrowing costs and our ability to access
23
the capital markets could be impacted. Our inability to obtain adequate capital could have a significant and negative effect on our business, financial condition and results of operations.
We may need additional collateral capacity as we grow, and if we are unable to renew, maintain or increase our collateral facilities or are unable to do so on commercially acceptable terms we may need to liquidate all or a portion of our investment portfolio and invest in a fixed-income portfolio or other forms of investment acceptable to our clients and banks as collateral, which could significantly and negatively affect our ability to implement our business strategy.
Our failure to comply with restrictive covenants contained in our current or future credit facilities could trigger prepayment obligations, which could adversely affect our business, financial condition and results of operations.
Each of our credit facilities requires us and/or certain of our subsidiaries to comply with certain covenants, including restrictions on our ability to place a lien or charge on pledged assets, issue debt and in certain circumstances on the payment of dividends. Our failure to comply with these or other covenants could result in an event of default under one or more credit facilities or any credit facility we may enter into in the future, which, if not cured or waived, could result in us being required to repay the amounts outstanding under these facilities prior to maturity. As a result, our business, financial condition and results of operations could be significantly and negatively affected.
The inability to obtain business provided from brokers could adversely affect our business strategy and results of operations.
Since we began underwriting operations in April 2006, substantially all of our business has been placed through brokered transactions, which involve a limited number of reinsurance brokers which exposes us to concentration risk. In 2016, we had two brokers (2015: two brokers) who each accounted for more than 10% of our gross written premiums, and in the aggregate they accounted for approximately 70.8% (2015: 77.4%) of our gross premiums written. Because broker-produced business is concentrated with a small number of brokers, we are exposed to concentration risk. To lose or fail to expand all or a substantial portion of the business provided through brokers, many of whom may not be familiar with our Cayman Islands jurisdiction, could significantly and negatively affect our business and results of operations.
We may need additional capital in the future in order to operate our business, and such capital may not be available to us or may not be available to us on favorable terms.
We may need to raise additional capital in the future through public or private equity or debt offerings or otherwise in order to:
● | fund liquidity needs caused by underwriting or investment losses; | |
● | replace capital lost in the event of significant reinsurance losses or adverse reserve developments or significant investment losses; | |
● | satisfy collateral requirements that may be imposed by our clients or by regulators; | |
● | meet applicable statutory jurisdiction requirements; | |
● | meet rating agency capital requirements; or | |
● | respond to competitive pressures. | |
Additional capital may not be available on terms favorable to us, or at all. Further, any additional capital raised through the sale of equity could dilute existing ownership interest in our company and may cause the market price of our Class A ordinary shares to decline. Additional capital raised through the issuance of debt may result in creditors having rights, preferences and privileges senior or otherwise superior to those of our Class A ordinary shares.
Our property and property catastrophe reinsurance operations may make us vulnerable to losses from catastrophes and may cause our results of operations to vary significantly from period to period.
Certain of our reinsurance operations expose us to claims arising out of unpredictable catastrophic events, such as hurricanes, hailstorms, tornadoes, windstorms, severe winter weather, earthquakes, floods, droughts, fires, explosions, volcanic eruptions and other natural or man-made disasters such as acts of war or terrorism, cyber attacks, major aircraft crashes, riots or political unrest. The incidence and severity of catastrophes are inherently unpredictable but the loss experience of property catastrophe reinsurers has been generally characterized as low frequency and high severity. Claims from catastrophic events could reduce our earnings and cause substantial volatility in our results of operations for any fiscal quarter or year and adversely affect our financial condition. Corresponding reductions in our surplus levels could impact our ability to write new reinsurance policies.
24
Catastrophic losses are a function of the insured exposure in the affected area and the severity of the event. Because accounting regulations do not permit reinsurers to reserve for catastrophic events until they occur, claims from catastrophic events could cause substantial volatility in our financial results for any fiscal quarter or year and could significantly and negatively affect our financial condition and results of operations.
We depend on our clients’ evaluations of the risks associated with their insurance underwriting, which may subject us to reinsurance losses.
In some of our proportional reinsurance business, in which we assume an agreed percentage of each underlying insurance contract being reinsured, or quota share contracts, we do not expect to separately evaluate each of the original individual risks assumed under these reinsurance contracts. Therefore, we will be largely dependent on the original underwriting decisions made by ceding companies. We will be subject to the risk that the clients may not have adequately evaluated the insured risks and that the premiums ceded may not adequately compensate us for the risks we assume. We also do not expect to separately evaluate each of the individual claims made on the underlying insurance contracts under quota share contracts. Therefore, we will be dependent on the original claims decisions made by our clients.
We could face unanticipated losses from political instability which could have a material adverse effect on our financial condition and results of operations.
We could be exposed to unexpected losses on our reinsurance contracts resulting from political instability and other politically driven events globally. These risks are inherently unpredictable and recent events may indicate an increased frequency and severity of losses. It is difficult to predict the timing of these events or to estimate the amount of loss that any given occurrence will generate. To the extent that losses from these risks occur, our financial condition and results of operations could be significantly and negatively affected.
Changing climate conditions may adversely affect our financial condition, profitability or cash flows.
Climate change, to the extent it produces extreme changes in temperatures and changes in weather patterns, could impact the frequency or severity of weather events and wildfires. Further, it could impact the affordability and availability of homeowners insurance, which could have an impact on pricing. Changes in weather patterns could also affect the frequency and severity of other natural catastrophe events to which we may be exposed.
We may be subject to the credit risk of our brokers, cedents and agents.
In accordance with industry practice, we frequently pay amounts owed on claims under our policies to reinsurance brokers, and these brokers, in turn, remit these amounts to the ceding companies that have reinsured a portion of their liabilities with us. In some jurisdictions, if a broker fails to make such a payment, we might remain liable to the client for the deficiency notwithstanding the broker’s obligation to make such payment. Conversely, in certain jurisdictions, when the client pays premiums for policies to reinsurance brokers for payment to us, these premiums are considered to have been paid and the client will no longer be liable to us for these premiums, whether or not we have actually received them. Consequently, we assume a degree of credit risk associated with brokers around the world.
In addition, we are also exposed to the credit risk of our cedents and agents, who, pursuant to their contracts with us, may be required to pay us profit commission, additional premiums, reinstatement premiums, and adjustments to ceding commissions over a period of time, which in some cases may extend beyond the initial period of risk coverage. Insolvency, liquidity problems, distressed financial condition or the general effects of an economic recession may increase the risk that our cedents or agents may not pay a part of or the full amount of their obligations to us. To the extent our cedents or agents become unable to pay us, we would be required to recognize a downward adjustment to our premiums receivable or reinsurance recoverables, as applicable, in our financial statements. While we generally seek to mitigate this risk through, among other things, collateral agreements, funds withheld, corporate guarantees and right of offset of receivables against any losses payable, an increased inability of customers to fulfill their obligations to us could have an adverse effect on our financial condition and results of operations.
Our reinsurance balances receivable at December 31, 2016 totaled $219.1 million, which included premiums and ceding commissions receivable, a majority of which are not collateralized. We cannot assure you that such receivables will be collected or that valuation allowances or write downs for uncollectible recoverable amounts will not be required in future periods.
25
We may be unable to purchase reinsurance for the liabilities we reinsure, and if we successfully purchase such reinsurance, we may be unable to collect, which could adversely affect our business, financial condition and results of operations.
We purchase reinsurance for certain liabilities we reinsure, which we refer to as retrocessional coverage, in order to mitigate the effect of a potential concentration of losses upon our financial condition. The insolvency or inability or refusal of a retrocessionaire to make payments under the terms of its agreement with us could have an adverse effect on us because we remain liable to our client. From time to time, market conditions have limited, and in some cases have prevented, reinsurers from obtaining the types and amounts of retrocessional coverage that they consider necessary for their business needs. Accordingly, we may not be able to obtain our desired amounts of retrocessional coverage or negotiate terms that we deem appropriate or acceptable or obtain retrocessional coverage from entities with satisfactory creditworthiness. Our failure to establish adequate retrocessional arrangements or the failure of our retrocessional arrangements to protect us from overly concentrated risk exposure could significantly and negatively affect our business, financial condition and results of operations.
The failure of any risk management and loss limitation methods we employ, as well as an unexpected accumulation of attritional losses, could have a material adverse effect on our financial condition and results of operations.
We seek to limit our loss exposure in a variety of ways, including by writing many of our reinsurance contracts on an excess of loss basis, adhering to maximum limitations on policies written in defined geographical zones, limiting program size for each client, establishing per risk and per occurrence limitations for each event, employing coverage restrictions and following prudent underwriting guidelines for each program written. In the case of proportional treaties, we generally seek per occurrence limitations or loss ratio caps to limit the impact of losses from any one event. We also seek to limit our loss exposure through geographic diversification. Notwithstanding these loss limitation techniques, one or more future catastrophic or other events could result in claims that substantially exceed our expectations in ways limiting the applicability of these techniques, which could have a material adverse effect on our financial condition and results of operations.
Currency fluctuations could result in exchange rate losses and negatively impact our business.
Our functional currency is the U.S. dollar. However, we expect that we will write a portion of our business and receive premiums and pay claims in currencies other than the U.S. dollar. We may incur foreign currency exchange gains or losses as we ultimately receive premiums and settle claims in foreign currencies. In addition, DME Advisors may invest a portion of our portfolio in securities or cash denominated in currencies other than the U.S. dollar. Consequently, we may experience exchange rate losses to the extent any of our foreign currency exposure is not hedged, which could significantly and negatively affect our business. If we do seek to hedge our foreign currency exposure through the use of forward foreign currency exchange contracts or currency swaps, we will be subject to the risk that our counterparties to the arrangements fail to perform.
There are differences under Cayman Islands corporate law and Delaware corporate law with respect to interested party transactions which may benefit certain of our shareholders at the expense of other shareholders.
Under Cayman Islands corporate law, a director may vote on a contract or transaction where the director has an interest as a shareholder, director, officer or employee provided such interest is disclosed. None of our contracts will be deemed to be void because any director is an interested party in such transaction and interested parties will not be held liable for monies owed to the Company.
Under Delaware law, interested party transactions are voidable.
Risks Relating to Insurance and Other Regulations
Any suspension or revocation of our reinsurance license would materially impact our ability to do business and implement our business strategy.
We are presently licensed as a reinsurer only in the Cayman Islands and the European Economic Area. The suspension or revocation of our licenses to do business as a reinsurance company in either of these jurisdictions for any reason would mean that we would not be able to enter into any new reinsurance contracts in that jurisdiction until the suspension ended or we became licensed in another jurisdiction. Any such suspension or revocation of our license would negatively impact our reputation in the reinsurance marketplace and could have a material adverse effect on our results of operations.
CIMA may take a number of actions, including suspending or revoking a reinsurance license whenever CIMA believes that a licensee is or may become unable to meet its obligations, is carrying on business in a manner likely to be detrimental to
26
the public interest or to the interest of its creditors or policyholders, has contravened the terms of the Law or has otherwise behaved in such a manner so as to cause CIMA to call into question the licensee’s fitness.
Further CIMA may suspend or revoke our license if:
● | we cease to carry on reinsurance business; | |
● | the direction and management of our reinsurance business has not been conducted in a fit and proper manner; | |
● | a person holding a position as a director, manager or officer is not a fit and proper person to hold the respective position; or | |
● | we become bankrupt or go into liquidation or we are wound up or otherwise dissolved. | |
Similarly, if CIMA suspended or revoked our license, we could lose our exemption under the Investment Company Act of 1940, as amended (the “Investment Company Act”) (See “— We are subject to the risk of possibly becoming an investment company under U.S. federal securities law.”)
Our reinsurance subsidiaries are subject to minimum capital and surplus requirements, and our failure to meet these requirements could subject us to regulatory action.
The Insurance (Capital and Solvency) (Classes B, C, and D Insurers) Regulations, 2012 (the “Capital and Solvency Regulations”) impose on Greenlight Re a minimum capital requirement of US$50 million, a prescribed capital requirement of US$276.0 million and a requirement to maintain solvency equal to or in excess of the total prescribed capital requirement (the “Capital Requirements”). As of December 31, 2016, Greenlight Re was in compliance with the Capital Requirements.
Under the prudential regime applying prior to the introduction of Solvency II, GRIL, our Irish subsidiary, was required to maintain statutory reserves, particularly in respect of underwriting liabilities. Solvency II has introduced risk-based solvency requirements which GRIL is required to comply with as of January 1, 2016, including calculating and maintaining a minimum capital requirement and solvency capital requirement. As of December 31, 2016, GRIL’s minimum capital requirement and solvency capital requirement was approximately $10 million and $40 million, respectively. As of December 31, 2016, GRIL has been in compliance with the capital requirements required under the Irish Insurance Acts and Regulations.
Any failure to meet applicable requirements or minimum statutory capital requirements could subject us to further examination or action by regulators, including restrictions on dividend payments, limitations on our writing of additional business or engaging in financial or other activities, enhanced supervision, financial or other penalties or liquidation. Further, any changes in existing risk based capital requirements or minimum statutory capital requirements may require us to increase our statutory capital levels, which we might be unable to do.
We are a holding company that depends on the ability of our subsidiaries to pay dividends.
We are a holding company and do not have any significant operations or assets other than our ownership of the shares of our subsidiaries. Dividends and other permitted distributions from our subsidiaries are our primary source of funds to meet ongoing cash requirements, including future debt service payments, if any, and other expenses, and to pay dividends to our shareholders if we choose to do so. Some of our subsidiaries are subject to significant regulatory restrictions limiting their ability to declare and pay dividends. The inability of our subsidiaries to pay dividends in an amount sufficient to enable us to meet our cash requirements at the holding company level could have an adverse effect on our operations and our ability to pay dividends to our shareholders if we choose to do so and/or meet our debt service obligations, if any.
To the extent any of our subsidiaries located in jurisdictions other than the Cayman Islands consider declaring dividends, such subsidiaries are required to comply with restrictions set forth under applicable law and regulations in such other jurisdictions. These restrictions could adversely impact the Company.
27
We are subject to the risk of possibly becoming an investment company under U.S. federal securities law.
In the United States, the Investment Company Act regulates certain companies that invest in or trade securities. We rely on an exemption under the Investment Company Act for an entity organized and regulated as a foreign insurance company which is engaged primarily and predominantly in the reinsurance of risks on insurance agreements. The law in this area is subjective and there is a lack of guidance as to the meaning of “primarily and predominantly” under the relevant exemption to the Investment Company Act. For example, there is no standard for the amount of premiums that need to be written relative to the level of an entity’s capital in order to qualify for the exemption. If this exemption were deemed inapplicable, we would have to register under the Investment Company Act as an investment company. Registered investment companies are subject to extensive, restrictive and potentially adverse regulation relating to, among other things, operating methods, management, capital structure, leverage, dividends and transactions with affiliates. Registered investment companies are not permitted to operate their business in the manner in which we operate our business, nor are registered investment companies permitted to have many of the relationships that we have with our affiliated companies. Accordingly, we likely would not be permitted to engage DME Advisors as our investment advisor, unless we obtained board and shareholder approvals under the Investment Company Act. If DME Advisors were not our investment advisor, we would seek to identify and retain another investment advisor with a value-oriented investment philosophy. If we could not identify or retain such an advisor, we would be required to make substantial modifications to our investment strategy. Any such changes to our investment strategy could significantly and negatively impact our investment results, financial condition and our ability to implement our business strategy.
If at any time it were established that we had been operating as an investment company in violation of the registration requirements of the Investment Company Act, there would be a risk, among other material adverse consequences, that we could become subject to monetary penalties or injunctive relief, or both, or that we would be unable to enforce contracts with third parties or that third parties could seek to obtain rescission of transactions with us undertaken during the period in which it was established that we were an unregistered investment company.
To the extent that the laws and regulations change in the future so that contracts we write are deemed not to be reinsurance contracts, we will be at greater risk of not qualifying for the Investment Company Act exception. Additionally, it is possible that our classification as an investment company would result in the suspension or revocation of our reinsurance license.
Insurance regulations to which we are, or may become, subject, and potential changes thereto, could have a significant and negative effect on our business.
We currently are admitted to do business in the Cayman Islands and the European Economic Area. Our operations in each of these jurisdictions are subject to varying degrees of regulation and supervision. The laws and regulations of the jurisdictions in which our subsidiaries are domiciled require that, among other things, these subsidiaries maintain minimum levels of statutory or regulatory capital, surplus and liquidity, meet solvency standards, submit to periodic examinations of their financial condition and restrict payments of dividends and reductions of capital. Statutes, regulations and policies that our subsidiaries are subject to may also restrict the ability of these subsidiaries to write insurance and reinsurance policies, make certain investments and distribute funds.
More specifically with respect to our Irish subsidiary, European legislation known as “Solvency II”, was introduced with effect from January 1, 2016 and governs the prudential regulation of insurers and reinsurers, and requires insurers and reinsurers in Europe to meet risk-based solvency requirements. It also imposes group solvency and governance requirements on groups with insurers and/or reinsurers operating in the European Economic Area. A number of European Commission delegated acts and technical standards have been adopted, which set out more detailed requirements based on the overarching provisions of the Solvency II Directive. However, further delegated acts, technical standards and guidance are likely to be published on an ongoing basis.
Although we do not presently expect that we will be admitted to do business in any other jurisdiction other than the Cayman Islands and the European Economic Area, we cannot assure you that insurance regulators in the United States or elsewhere will not review our activities and claim that we are subject to such jurisdiction’s licensing requirements. In addition, we are subject to indirect regulatory requirements imposed by jurisdictions that may limit our ability to provide reinsurance. For example, our ability to write reinsurance may be subject, in certain cases, to arrangements satisfactory to applicable regulatory bodies, and proposed legislation and regulations may have the effect of imposing additional requirements upon, or restricting the market for, non-U.S. reinsurers such as Greenlight Re and GRIL, with whom domestic companies may place business. We do not know of any such proposed legislation pending at this time.
We may not be able to comply fully with, or obtain desired exemptions from, revised statutes, regulations and policies that currently, or may in the future, govern the conduct of our business. Failure to comply with, or to obtain desired
28
authorizations and/or exemptions under, any applicable laws could result in restrictions on our ability to do business or undertake activities that are regulated in one or more of the jurisdictions in which we operate and could subject us to fines and other sanctions.
In addition, governmental authorities worldwide have become increasingly interested in potential risks posed by the insurance industry as a whole, and to the commercial and financial systems in general. While we cannot predict the exact nature, timing or scope of possible governmental initiatives, there may be increased regulatory intervention in our industry in the future. Changes in the laws or regulations to which our subsidiaries are subject or may become subject, or in the interpretations thereof by enforcement or regulatory agencies, could have a material adverse effect on our business.
Risks Relating to Our Investment Strategy and Our Investment Advisor
We have limited control as to how our investment portfolio is allocated and its performance depends on the ability of DME Advisors to select and manage appropriate investments.
DME Advisors acts as our exclusive investment advisor for our investment portfolio and recommends appropriate investment opportunities. Although DME Advisors is contractually obligated to follow our investment guidelines, we cannot assure shareholders as to how assets will be allocated to different investment opportunities, including long and short positions and derivatives trading, which could increase the level of risk to which our investment portfolio will be exposed. In addition, DME Advisors can outsource to sub-advisors without our consent or approval.
The performance of our investment portfolio depends to a great extent on the ability of DME Advisors to select and manage appropriate investments. Our advisory agreement with DME Advisors terminates on December 31, 2019, unless extended, and we have limited ability to terminate the advisory agreement earlier. We cannot assure you that DME Advisors will be successful in meeting our investment objectives or that the advisory agreement with DME Advisors will be renewed. The failure of DME Advisors to perform adequately could significantly and negatively affect our business, results of operations and financial condition.
We depend upon DME Advisors to implement our investment strategy.
We depend upon DME Advisors to implement our investment strategy. Accordingly, the diminution or loss of the services of DME Advisors could significantly affect our business. DME Advisors, in turn, is dependent on the talents, efforts and leadership of DME Advisors’ principals. The diminution or loss of the services of DME Advisors’ principals, or diminution or loss of their reputation and integrity or any negative market or industry perception arising from that diminution or loss, could have a material adverse effect on our business. In addition, the loss of DME Advisors’ key personnel, or DME Advisors’ inability to hire and retain other key personnel, over which we have no control, could delay or prevent DME Advisors from fully implementing our investment strategy on our behalf, and consequently, could significantly and negatively affect our business.
Our advisory agreement with DME Advisors does not allow us to terminate the agreement in the event that DME Advisors loses any or all of its principals or key personnel. The advisory agreement expires on the date on which the venture agreement expires or terminates for any reason. The venture agreement requires that we utilize the advisory services of DME Advisors or its affiliates exclusively until December 31, 2019, subject to limited termination provisions. See “— The venture agreement has limited termination provisions.”
Our investment performance may suffer as a result of adverse capital market developments or other factors that impact our liquidity, which could in turn adversely affect our financial condition and results of operations.
We may derive a significant portion of our income from our investment portfolio. As a result, our operating results depend in part on the performance of our investment portfolio. We strive to structure our investments in a manner that recognizes our liquidity needs for future liabilities. We cannot assure you that DME Advisors will successfully structure our investments in relation to our anticipated liabilities. Failure to do so could force us to liquidate investments at a significant loss or at prices that are not optimal, which could significantly and adversely affect our financial results.
The risks associated with DME Advisors’ value-oriented investment strategy may be substantially greater than the risks associated with traditional fixed-income investment strategies. In addition, making long equity investments in an up or rising market may increase the risk of not generating profits on these investments and we may incur losses if the market declines. Similarly, making short equity investments in a down or falling market may increase the risk of not generating profits on these investments and we may incur losses if the market rises. The success of our investment strategy may also be affected by general
29
economic conditions. Unexpected market volatility and illiquidity associated with our investments could significantly and negatively affect our investment portfolio results.
Potential conflicts of interest with DME Advisors may exist that could adversely affect us.
In addition to managing the investment portfolio, DME Advisors, the principals and their affiliates may engage in investment and trading activities for their own accounts and/or for the accounts of third parties. None of DME Advisors or its principals, including David Einhorn, Chairman of our Board of Directors and the President of Greenlight Capital, Inc., are obligated to devote any specific amount of time to the affairs of our Company. Affiliates of DME Advisors, including Greenlight Capital, Inc., manage and expect to continue to manage other client accounts, some of which have objectives similar to ours, including collective investment vehicles managed by DME Advisors’ affiliates and in which DME Advisors or its affiliates may have an equity interest. Pursuant to our advisory agreement with DME Advisors, DME Advisors has the exclusive right to manage our investment portfolio and is required to follow our investment guidelines and act in a manner that is fair and equitable in allocating investment opportunities to us, but the agreement does not otherwise impose any specific obligations or requirements concerning allocation of time, effort or investment opportunities to us or any restriction on the nature or timing of investments for our account or other accounts that DME Advisors or its affiliates may manage. If we compete for any investment opportunity with another entity that DME Advisors or its affiliates manage, DME Advisors is not required to afford us any exclusivity or priority. DME Advisors’ interest and the interests of its affiliates, including Greenlight Capital, Inc., may at times conflict, possibly to DME Advisors’ detriment, which in turn may potentially adversely affect our investment opportunities and returns.
Although Mr. Einhorn, Chairman of our Board of Directors, recused himself from the vote by the Board of Directors of Greenlight Re approving and adopting Greenlight Re’s investment guidelines, he is not, under Cayman Islands law, legally restricted from participating in making decisions with respect to Greenlight Re’s investment guidelines. Accordingly, his involvement as a member of the Boards of Directors of Greenlight Capital Re, Ltd. and Greenlight Re may lead to a conflict of interest.
DME Advisors and its affiliates may also manage accounts whose advisory fee schedules, investment objectives and policies differ from ours, which may cause DME Advisors and its affiliates to effect trading in one account that may have an adverse effect on another account, including ours. We are not entitled to inspect the trading records of DME Advisors, or its principals, that are not related to our Company.
Our investment portfolio may be concentrated in a few large positions which could result in large losses.
Our investment guidelines provide that DME Advisors may commit up to 20% of Greenlight Re’s assets under management (10% for GRIL) to any one investment. In addition, GRIL’s investment guidelines require that the 10 largest investments shall not constitute more than 50% of the total investment portfolio and GRIL’s investment portfolio shall at all times be comprised of a minimum of 50 debt or equity securities of publicly traded companies. Accordingly, from time to time we may hold a few, relatively large security positions in relation to our capital. As of December 31, 2016, we were invested in approximately 88 equity and debt securities and the largest five long and short positions comprised an aggregate of 46% and 21%, respectively, of our investment portfolio. Since our investment portfolio may not be widely diversified, it may be subject to more rapid changes in value than would be the case if the investment portfolio were required to maintain a wide diversification among companies, securities and types of securities.
We are exposed to credit risk primarily from the possibility that counterparties may default on their obligations to us.
We are exposed to credit risk primarily from the possibility that counterparties may default on their obligations to us. The amount of the maximum exposure to credit risk is indicated by the carrying value of our financial assets. In addition, we hold the securities of our investment portfolio with several prime brokers and have credit risk from the possibility that one or more of them may default on their obligations to us. Other than our investment in derivative contracts and corporate debt, if any, and the fact that our investments are held by prime brokers and custodians on our behalf, we have no other significant concentrations of credit risk.
Issuers or borrowers whose securities or debt we hold, customers, reinsurers, clearing agents, exchanges, clearing houses and other financial intermediaries and guarantors may default on their obligations to us due to bankruptcy, insolvency, lack of liquidity, adverse economic conditions, operational failure, fraud or other reasons. Such defaults could have a significant and negative effect on our results of operations, financial condition and cash flows. Additionally, the underlying assets supporting our financial contracts may deteriorate causing these securities to incur losses.
30
DME Advisors may trade on margin and use other forms of financial leverage, which could potentially adversely affect our revenues.
Our investment guidelines provide DME Advisors with the ability to trade on margin and use other forms of financial leverage. Fluctuations in the market value of our investment portfolio could have a disproportionately large effect in relation to our capital. Any event which may adversely affect the value of positions we hold could significantly and negatively affect the net asset value of our investment portfolio and thus our results of operations.
DME Advisors may effectuate short sales that subject us to unlimited loss potential.
DME Advisors may enter into transactions in which it sells a security it does not own, which we refer to as a short sale, in anticipation of a decline in the market value of the security. Short sales for our account theoretically will involve unlimited loss potential since the market price of securities sold short may continuously increase. We may mitigate such losses by replacing the securities sold short before the market price has increased significantly. Under adverse market conditions, DME Advisors might have difficulty purchasing securities to meet short sale delivery obligations and may have to cover short sales at suboptimal prices.
DME Advisors may transact in derivative instruments, which may increase the risk of our investment portfolio.
Derivative instruments, or derivatives, include futures, options, swaps, structured securities and other instruments and contracts that derive their value from one or more underlying securities, financial benchmarks, currencies, commodities or indices. There are a number of risks associated with derivatives trading. Because many derivatives are leveraged, and thus provide significantly more market exposure than the money paid or deposited when the transaction is entered into, a relatively small adverse market movement may result in a substantial loss, and may potentially expose us to a loss exceeding the original amount invested. Derivatives may also expose us to liquidity risk as there may not be a liquid market within which to close or dispose of outstanding derivative contracts. The counterparty risk lies with each party with whom we contract for the purpose of making derivative investments. In the event of the counterparty’s default, we will generally only rank as an unsecured creditor and risk the loss of all or a portion of the amounts we are contractually entitled to receive.
The compensation arrangements of DME and DME Advisors may create an incentive to effect transactions that are risky or speculative.
Pursuant to the venture agreement and the advisory agreement, we are obligated to pay the following:
● | a 1.5% annual management fee to DME Advisors, regardless of the performance of our investment account, payable monthly based on the capital account balance of each participant; and | |
● | a performance allocation to DME based on the positive performance change in such participant’s capital account equal to 20% of net profits calculated per annum, subject to a loss carry forward provision. | |
The loss carry forward provision allows DME to earn reduced performance allocation of 10% of profits in any year subsequent to the year in which our investment account managed by DME Advisors incurs a loss, until all losses are recouped and an additional amount equal to 150% of the loss is earned.
While the performance compensation arrangement provides that losses will be carried forward as an offset against net profits in subsequent periods, DME and DME Advisors generally will not otherwise be penalized for losses or decreases in the value of our portfolio. These performance compensation arrangements may create an incentive for DME Advisors to engage in transactions that focus on the potential for short-term gains rather than long-term growth or that are particularly risky or speculative.
DME Advisors’ representatives’ service on boards and committees may place trading restrictions on our investments and may subject us to indemnification liability.
DME Advisors may from time to time place its or its affiliates’ representatives on creditors’ committees and/or boards of certain companies in which we have invested. While such representation may enable DME Advisors to enhance the sale value of our investments, it may also prevent us from freely disposing of our investments and may subject us to indemnification liability. The advisory agreement provides for the indemnification of DME Advisors or any other person designated by DME Advisors for claims arising from such board representation.
As of December 31, 2016, representatives of DME Advisors (including Mr. Einhorn) sat on the board of Green Brick Partners Inc., whose securities are publicly traded and were included in our portfolio as of December 31, 2016.
31
The ability to use “soft dollars” may provide DME Advisors with an incentive to select certain brokers that may take into account benefits to be received by DME Advisors.
DME Advisors is entitled to use so-called “soft dollars” generated by commissions paid in connection with transactions for our investment portfolio to pay for certain of DME Advisors’ operating and overhead costs, including the payment of all or a portion of its costs and expenses of operation. “Soft dollars” are a means of paying brokerage firms for their services through commission revenue, rather than through direct payments. DME Advisors’ right to use soft dollars may give DME Advisors an incentive to select brokers or dealers for our transactions, or to negotiate commission rates or other execution terms, in a manner that takes into account the soft dollar benefits received by DME Advisors rather than giving exclusive consideration to the interests of our investment portfolio and, accordingly, may create a conflict. However, DME Advisors only uses soft dollars to pay for expenses that would otherwise be borne by us and certain other co-managed funds.
The venture agreement has limited termination provisions.
The venture agreement has limited termination provisions which restrict our ability to manage our investment portfolio outside of DME Advisors. Because the venture agreement contains exclusivity and limited termination provisions, we are unable to use investment managers other than DME Advisors for so long as the agreement is in effect. The current venture agreement term ends on December 31, 2019 and will automatically renew for successive three-year terms unless at least 90 days prior to the end of the then current term, DME notifies us of its desire to terminate the venture agreement, or Greenlight Re or GRIL notifies DME of their desire to withdraw from the venture agreement. Greenlight Re or GRIL may also withdraw as participants under the venture agreement prior to the expiration of the venture agreement’s term at any time only “for cause”, which is defined as:
● | a material violation of applicable law relating to DME’s or DME Advisors’ advisory business; | |
● | DME’s or DME Advisors’ gross negligence, willful misconduct or reckless disregard of DME’s obligations under the venture agreement or DME Advisors’ obligations under the advisory agreement; | |
● | a material breach by DME or DME Advisors of Greenlight Re’s or GRIL’s investment guidelines that is not cured within a 15-day period; or | |
● | a material breach by DME or DME Advisors of its obligations to return and deliver assets as we may request. | |
In addition, GRIL may withdraw as a participant under the venture agreement prior to the expiration of its term due to unsatisfactory long term performance of DME or DME Advisors, as determined solely by the Board of Directors of GRIL on each anniversary date of the venture agreement.
Greenlight Re may not withdraw or terminate the venture agreement on the basis of performance. If Greenlight Re becomes dissatisfied with the results of the investment performance of DME or DME Advisors, we will be unable to hire new investment managers until the venture agreement expires by its terms or is terminated for cause.
Certain of our investments may have limited liquidity and lack valuation data, which could create a conflict of interest.
Our investment guidelines provide DME Advisors with the flexibility to invest in certain securities with limited liquidity or no public market. This lack of liquidity may adversely affect the ability of DME Advisors to execute trade orders at desired prices and may impact our ability to fulfill our payment obligations. To the extent that DME Advisors invests in securities or instruments for which market quotations are not readily available, under the terms of the advisory agreement the valuation of such securities and instruments for purposes of compensation to DME Advisors will be determined by DME Advisors, whose determination, subject to audit verification, will be conclusive and binding in the absence of bad faith or manifest error. Because the advisory agreement gives DME Advisors the power to determine the value of securities with no readily discernible market value, and because the calculation of DME Advisors’ fee is based on the value of the investment account, a conflict may exist or arise.
In addition, for all securities traded on public exchanges, each exchange typically has the right to suspend or limit trading in all securities it lists. Such a suspension could render it impossible to liquidate positions and thereby expose us to losses.
Increased regulation or scrutiny of alternative investment advisors may affect DME Advisors’ ability to manage our investment portfolio or affect our business reputation.
The regulatory environment for investment managers is evolving, and changes in the regulation of managers may adversely affect the ability of DME Advisors to obtain the leverage it might otherwise obtain or to pursue its trading strategies. In addition, the securities and futures markets are subject to comprehensive statutes, regulations and margin
32
requirements. The SEC, other regulators and self-regulatory organizations and exchanges are authorized to take extraordinary actions in the event of market emergencies. The regulation of derivatives transactions and funds that engage in such transactions is an evolving area of law and is subject to modification by government and judicial action. Any future regulatory change could have a significant negative impact on our financial condition and results of operations.
Short sale transactions have been subject to increased regulatory scrutiny, including the imposition of restrictions on short selling certain securities and reporting requirements. Our ability to execute a short selling strategy may be materially and adversely impacted by temporary and/or new permanent rules, interpretations, prohibitions, and restrictions adopted in response to these adverse market events. Temporary restrictions and/or prohibitions on short selling activity may be imposed by regulatory authorities with little or no advance notice and may impact prior and future trading activities of our investment portfolio. Additionally, the SEC, its non-U.S. counterparts, other governmental authorities and/or self-regulatory organizations may at any time promulgate permanent rules or interpretations consistent with such temporary restrictions or that impose additional or different permanent or temporary limitations or prohibitions. The SEC might impose different limitations and/or prohibitions on short selling from those imposed by various non-U.S. regulatory authorities. These different regulations, rules or interpretations might have different effective periods.
Regulatory authorities may, from time-to-time, impose restrictions that adversely affect our ability to borrow certain securities in connection with short sale transactions. In addition, traditional lenders of securities might be less likely to lend securities under certain market conditions. As a result, we may not be able to effectively pursue a short selling strategy due to a limited supply of securities available for borrowing. We may also incur additional costs in connection with short sale transactions, including, in the event that DME Advisors is required to enter into a borrowing arrangement in advance of any short sales. Moreover, the ability to continue to borrow a security is not guaranteed and we are subject to strict delivery requirements. The inability to deliver securities within the required time frame may subject us to mandatory close out by the executing broker-dealer. A mandatory close out may subject us to unintended costs and losses. Certain action or inaction by third parties, such as executing broker-dealers or clearing broker-dealers, may materially impact our ability to effect short sale transactions.
We may invest in securities based outside the United States which may be riskier than securities of United States issuers.
Under our investment guidelines, DME Advisors may invest in securities of issuers organized or based outside the United States. These investments may be subject to a variety of risks and other special considerations not affecting securities of U.S. issuers. Particularly within the Euro-zone, there is increasing market concern as to the potential default of government issuers. Should governments default on their obligations, there could be a negative impact on both the Company’s direct holdings as well as non-government issues held within the country of default. Many foreign securities markets are not as developed or efficient as those in the United States. Securities of some foreign issuers are less liquid and more volatile than securities of comparable U.S. issuers. Similarly, volume and liquidity in many foreign securities markets are less than in the United States and, at times, price volatility can be greater than in the United States. Non-U.S. issuers may be subject to less stringent financial reporting and informational disclosure standards, regulatory oversight, practices and requirements than those applicable to U.S. issuers.
Risks Relating to our Class A Ordinary Shares
A shareholder may be required to sell its Class A ordinary shares.
Our Third Amended and Restated Memorandum and Articles of Association, or Articles, provide that we have the option, but not the obligation, to require a shareholder to sell its Class A ordinary shares for their fair market value to us, to other shareholders or to third parties if our Board of Directors determines that ownership of our Class A ordinary shares by such shareholder may result in adverse tax, regulatory or legal consequences to us, any of our subsidiaries or any of our shareholders and that such sale is necessary to avoid or cure such adverse consequences.
Provisions of our Articles, the Companies Law of the Cayman Islands and our corporate structure may each impede a takeover, which could adversely affect the value of our Class A ordinary shares.
Our Articles contain certain provisions that could make it more difficult for a third party to acquire us, even if doing so would be beneficial to our shareholders. Our Articles provide that a director may only be removed for “cause” as defined in the Articles, upon the affirmative vote of not less than 50% of the votes cast at a meeting at which more than 50% of our issued and outstanding Class A ordinary shares are represented. Further, under our Articles, a director may only be removed without cause upon the affirmative vote of not less than 80% of the votes cast at a meeting at which more than 50% of our issued and outstanding Class A ordinary shares are represented.
33
Our Articles permit our Board of Directors to issue preferred shares from time to time, with such rights and preferences as they consider appropriate. Our Board of Directors may authorize the issuance of preferred shares with terms and conditions and under circumstances that could have an effect of discouraging a takeover or other transaction, deny shareholders the receipt of a premium on their Class A ordinary shares in the event of a tender or other offer for Class A ordinary shares and have a depressive effect on the market price of the Class A ordinary shares.
As compared to mergers under corporate law in the United States, it may be more difficult to consummate a merger of two or more companies in the Cayman Islands or the merger of one or more Cayman Islands companies with one or more overseas companies, even if such transaction would be beneficial to our shareholders. Cayman Islands law has statutory provisions that provide for the reconstruction and amalgamation of companies, which are commonly referred to, in the Cayman Islands, as “schemes of arrangement”. The Companies Law (as amended) of the Cayman Islands (the “Companies Law”) provides for the merger or consolidation of two or more companies that are Cayman Islands entities or the merger of one or more Cayman Islands companies with one or more overseas companies, where the surviving entity is either a Cayman Islands company or an overseas company. Prior to the adoption of certain amendments to the Companies Law, the “scheme of arrangement” was the only vehicle available to consolidate companies and Cayman Islands law did not provide for mergers as that term is understood under corporate law in the United States. Although the current merger provisions have made it faster and easier for companies to merge or consolidate than the “schemes of arrangement” statutory provision, these provisions do not replace the “schemes of arrangement” provision which continues to apply. The procedural and legal requirements necessary to consummate these transactions under the merger provisions of the Companies Law or the “schemes of arrangement” provision may be more rigorous and take longer to complete than the procedures typically required to consummate a merger in the United States.
Under Cayman Islands law and practice, a “scheme of arrangement” must be approved at a shareholders’ meeting by each class of shareholders, in each case, by a majority of the number of holders of each class of an entity’s shares that are present and voting, either in person or by proxy, at such a meeting, which holders must also represent 75% in value of such class issued that are present and voting, either in person or by proxy, at such meeting, excluding the shares owned by the parties to the scheme of arrangement. A merger requires approval by special resolution of the shareholders of each company (which normally requires, as a minimum, a two thirds majority of shareholders voting together as one class) and such other authorization, if any, as may be specified in such constituent company’s articles of association.
Although a merger under the Companies Law does not require court approval, the convening of these meetings and the terms of an amalgamation under the “schemes of arrangement” provision must be sanctioned by the Grand Court of the Cayman Islands. Although there is no requirement to seek the consent of the creditors of the parties involved in the scheme of arrangement, the Grand Court typically seeks to ensure that the creditors have consented to the transfer of their liabilities to the surviving entity or that the scheme of arrangement does not otherwise materially adversely affect the creditors’ interests. Furthermore, the Grand Court will only approve a scheme of arrangement if it is satisfied that:
● | the statutory provisions as to majority vote have been complied with; | |
● | the shareholders have been fairly represented at the meeting in question; | |
● | the scheme of arrangement is such as a businessman would reasonably approve; and | |
● | the scheme of arrangement is not one that would more properly be sanctioned under some other provision of the Companies Law. | |
In addition, David Einhorn, Chairman of our Board of Directors, owns all of the outstanding Class B ordinary shares. As a result, we will not be able to enter into a scheme of arrangement without the approval of Mr. Einhorn as the holder of our Class B ordinary shares.
Holders of Class A ordinary shares may have difficulty obtaining or enforcing a judgment against us, and they may face difficulties in protecting their interests because we are incorporated under Cayman Islands law.
Because we are a Cayman Islands company, there is uncertainty as to whether the Grand Court of the Cayman Islands would recognize or enforce judgments of United States courts obtained against us predicated upon the civil liability provisions of the securities laws of the United States or any state thereof, or be competent to hear original actions brought in the Cayman Islands against us predicated upon the securities laws of the United States or any state thereof.
We are incorporated as an exempted company limited by shares under the Companies Law. A significant amount of our assets are located outside of the United States. As a result, it may be difficult for persons purchasing Class A ordinary shares to effect service of process within the United States upon us or to enforce judgments against us or judgments obtained in U.S.
34
courts predicated upon the civil liability provisions of the federal securities laws of the United States or any state of the United States.
Although there is no statutory enforcement in the Cayman Islands of judgments obtained in the United States, the courts of the Cayman Islands will, based on the principle that a judgment by a competent foreign court will impose upon the judgment debtor an obligation to pay the sum for which judgment has been given, recognize and enforce a foreign judgment of a court of competent jurisdiction if such judgment is final, for a liquidated sum, not in respect of taxes or a fine or penalty if not inconsistent with a Cayman Islands judgment in respect of the same matters, and was not obtained in a manner, and is not of a kind, the enforcement of which is contrary to the public policy of the Cayman Islands. There is doubt, however, as to whether the courts of the Cayman Islands will, in an original action in the Cayman Islands, recognize or enforce judgments of U.S. courts predicated upon the civil liability provisions of the securities laws of the United States or any state of the United States on the grounds that such provisions are penal in nature.
A Cayman Islands court may stay proceedings if concurrent proceedings are being brought elsewhere.
Unlike many jurisdictions in the United States, Cayman Islands law does not specifically provide for shareholder appraisal rights on a merger or consolidation of an entity. This may make it more difficult for shareholders to assess the value of any consideration they may receive in a merger or consolidation or to require that the offeror give a shareholder additional consideration if he believes the consideration offered is insufficient.
Shareholders of Cayman Islands exempted companies such as ours have no general rights under Cayman Islands law to inspect corporate records and accounts. Our directors have discretion under our Articles to determine whether or not, and under what conditions, the corporate records may be inspected by shareholders, but are not obligated to make them available to shareholders. This fact may make it more difficult for shareholders to obtain the information needed to establish any facts necessary for a shareholder motion or to solicit proxies from other shareholders in connection with a proxy contest.
Subject to limited exceptions, under Cayman Islands law, a minority shareholder may not bring a derivative action against our Board of Directors.
Provisions of our Articles may reallocate the voting power of our Class A ordinary shares and subject holders of Class A ordinary shares to SEC compliance.
In certain circumstances, the total voting power of our Class A ordinary shares held by any one person will be reduced to less than 9.9% of the total issued and outstanding ordinary shares, and the total voting power of the Class B ordinary shares will be reduced to 9.5% of the total voting power of the total issued and outstanding ordinary shares. In the event a holder of our Class A ordinary shares acquires shares representing 9.9% or more of the total voting power of our total ordinary shares or the Class B ordinary shares represent more than 9.5% of the total voting power of our total outstanding shares, there will be an effective reallocation of the voting power of the Class A ordinary shares or Class B ordinary shares which may cause a shareholder to acquire 5% or more of the voting power of the total ordinary shares.
Such a shareholder may become subject to the reporting and disclosure requirements of Sections 13(d) and (g) of the Exchange Act. Such a reallocation also may result in an obligation to amend previous filings made under Section 13(d) or (g) of the Exchange Act. Under our Articles, we have no obligation to notify shareholders of any adjustments to their voting power. Shareholders should consult their own legal counsel regarding the possible reporting requirements under Section 13 of the Exchange Act.
As of December 31, 2016, David Einhorn owned 16.7% of the issued and outstanding ordinary shares, which given that each Class B share is entitled to ten votes, causes him to exceed the 9.5% limitation imposed on the total voting power of the Class B ordinary shares. Thus, the voting power held by the Class B ordinary shares that is in excess of the 9.5% limitation will be reallocated pro-rata to holders of Class A ordinary shares according to their percentage interest in the Company. However, no shareholder will be allocated voting rights that would cause it to have 9.9% or more of the total voting power of our ordinary shares. The allocation of the voting power of the Class B ordinary shares to a holder of Class A ordinary shares will depend upon the total voting power of the Class B ordinary shares outstanding, as well as the percentage of Class A ordinary shares held by a shareholder and the other holders of Class A ordinary shares. Accordingly, we cannot estimate with precision what multiple of a vote per share a holder of Class A ordinary shares will be allocated as a result of the anticipated reallocation of voting power of the Class B ordinary shares.
35
Risks Relating to Taxation
We may become subject to taxation in the Cayman Islands, which would negatively affect our results.
Under current Cayman Islands law, we are not obligated to pay any taxes in the Cayman Islands on either income or capital gains. The Governor-in-Cabinet of Cayman Islands has granted us an exemption from the imposition of any such tax on us until February 1, 2025. We cannot be assured that after such date we would not be subject to any such tax. If we were to become subject to taxation in the Cayman Islands, our financial condition and results of operations could be significantly and negatively affected.
Greenlight Capital Re, Greenlight Re and/or GRIL may be subject to United States federal income taxation.
Greenlight Capital Re and Greenlight Re are incorporated under the laws of the Cayman Islands, and GRIL is incorporated under the laws of Ireland. These entities intend to operate in a manner that will not cause us to be treated as engaging in a trade or business within the United States and will not cause us to be subject to current United States federal income taxation on Greenlight Capital Re’s, Greenlight Re’s and/or GRIL’s net income. However, because there are no definitive standards provided by the Internal Revenue Code, regulations or court decisions as to the specific activities that constitute being engaged in the conduct of a trade or business within the United States, and as any such determination is essentially factual in nature, we cannot assure you that the United States Internal Revenue Service (the “IRS”), will not successfully assert that Greenlight Capital Re, Greenlight Re and/or GRIL are engaged in a trade or business within the United States. If the IRS were to successfully assert that Greenlight Capital Re, Greenlight Re, and/or GRIL have been engaged in a trade or business within the United States in any taxable year, various adverse tax consequences could result, including the following: Greenlight Capital Re, Greenlight Re and/or GRIL may become subject to current United States federal income taxation on its net income from sources within the United States; Greenlight Capital Re, Greenlight Re and/or GRIL may be subject to United States federal income tax on a portion of its net investment income, regardless of its source; Greenlight Capital Re, Greenlight Re, and/or GRIL may not be entitled to deduct certain expenses that would otherwise be deductible from the income subject to United States taxation; and Greenlight Capital Re, Greenlight Re and/or GRIL may be subject to United States branch profits tax on profits deemed to have been distributed out of the United States.
United States persons who own Class A ordinary shares may be subject to United States federal income taxation on our undistributed earnings and may recognize ordinary income upon disposition of Class A ordinary shares.
Passive Foreign Investment Company. Significant potential adverse United States federal income tax consequences, including certain reporting requirements, generally apply to any United States person who owns shares in a passive foreign investment company, or a PFIC. We believe that each of Greenlight Capital Re and Greenlight Re was a PFIC in 2006, 2005 and 2004. We do not believe, although we cannot assure you, that none of Greenlight Capital Re, Greenlight Re or GRIL has been a PFIC from 2007 onwards. We cannot provide assurance that none of Greenlight Capital Re, Greenlight Re or GRIL will be a PFIC in any future taxable year.
In general, any of Greenlight Capital Re, Greenlight Re or GRIL would be a PFIC for a taxable year if either (i) 75% or more of its income constitutes “passive income” or (ii) 50% or more of its assets produce “passive income”, or are held for the production of passive income. Passive income generally includes interest, dividends and other investment income but does not include income derived in the active conduct of an insurance business by a corporation predominantly engaged in an insurance business. This exception for insurance companies is intended to ensure that a bona fide insurance entity’s income is not treated as passive income, except to the extent such income is attributable to financial reserves in excess of the reasonable needs of the insurance business. We believe that we are currently operating and intend to continue operating our business with financial reserves at a level that should not cause us to be deemed PFICs, although we cannot assure you the IRS will not successfully challenge this conclusion. If we are unable to underwrite sufficient amount of risks, any of Greenlight Capital Re, Greenlight Re or GRIL may become a PFIC.
In addition, sufficient risk must be transferred under an insurance entity’s contracts with its insureds in order to qualify for the insurance exception. Whether our insurance contracts possess adequate risk transfer for purposes of determining whether income under our contracts is insurance income, and whether we are predominantly engaged in an insurance business, are subjective in nature and there is very little authority on these issues. We cannot assure you that the IRS will not successfully challenge our interpretation of the scope of the active insurance company exception and our qualification for the exception. Further, the IRS may issue regulatory or other guidance that causes us to fail to qualify for the active insurance company exception on a prospective or retroactive basis. Therefore, we cannot assure you that we will satisfy the exception for insurance companies and will not be treated as PFICs currently or in the future.
36
Controlled Foreign Corporation. United States persons who, directly or indirectly or through attribution rules, own 10% or more of the total combined voting power of our shares, which we refer to as United States 10% shareholders, may be subject to the controlled foreign corporation, or CFC, rules. Under the CFC rules, each United States 10% shareholder must annually include his pro-rata share of the CFC’s “subpart F income” in his gross income in the year earned by the CFC, even if no distributions are made. In general, a foreign insurance company will be treated as a CFC only if United States 10% shareholders collectively own more than 25% of the total combined voting power or total value of the entity’s shares for an uninterrupted period of 30 days or more during any year. We believe that the dispersion of our Class A ordinary shares among holders and the restrictions placed on transfer, issuance or repurchase of our Class A ordinary shares (including the ownership limitations described below), will generally prevent shareholders who acquire Class A ordinary shares from being United States 10% shareholders. In addition, because our Articles prevent any person from holding 9.9% or more of the total combined voting power of our shares (whether held directly, indirectly or constructively), unless such provision is waived by the unanimous consent of our Board of Directors, we believe no persons holding Class A ordinary shares should be viewed as United States 10% shareholders of a CFC for purposes of the CFC rules. We cannot assure you, however, that these rules will not apply to you. If you are a United States person, we strongly urge you to consult your own tax advisor concerning the CFC rules.
Related Person Insurance Income. If:
● | our gross income attributable to insurance or reinsurance policies where the direct or indirect insureds are our direct or indirect United States shareholders or persons related to such United States shareholders equals or exceeds 20% of our gross insurance income in any taxable year; and | |
● | direct or indirect insureds and persons related to such insureds owned directly or indirectly 20% or more of the voting power or value of our stock, | |
a United States person who owns Class A ordinary shares directly or indirectly on the last day of the taxable year would most likely be required to include their pro-rata share of our related person insurance income for the taxable year in their income. This amount would be determined as if such related person insurance income were distributed proportionally to United States persons at that date. We do not expect that we will knowingly enter into reinsurance agreements in which, in the aggregate, the direct or indirect insureds are, or are related to, owners of 20% or more of the Class A ordinary shares. We do not believe that the 20% gross insurance income threshold will be met. However, we cannot assure you that this is or will continue to be the case. Consequently, we cannot assure you that a person who is a direct or indirect United States shareholder will not be required to include amounts in its income in respect of related person insurance income in any taxable year.
If a United States shareholder is treated as disposing of shares in a foreign insurance corporation that has related person insurance income and in which United States persons own 25% or more of the voting power or value of the entity’s shares, any gain from the disposition will generally be treated as a dividend to the extent of the United States shareholder’s portion of the corporation’s undistributed earnings and profits that were accumulated during the period that the United States shareholder owned the shares. In addition, the shareholder will be required to comply with certain reporting requirements, regardless of the amount of shares owned by the direct or indirect United States shareholder. Although not free from doubt, we believe these rules should not apply to dispositions of Class A ordinary shares because Greenlight Capital Re is not directly engaged in the insurance business and because proposed United States Treasury regulations applicable to this situation appear to apply only in the case of shares of corporations that are directly engaged in the insurance business. We cannot assure you, however, that the IRS will interpret the proposed regulations in this manner or that the proposed regulations will not be promulgated in final form in a manner that would cause these rules to apply to dispositions of Class A ordinary shares.
United States tax-exempt organizations who own Class A ordinary shares may recognize unrelated business taxable income.
If you are a United States tax-exempt organization you may recognize unrelated business taxable income if a portion of our subpart F insurance income is allocated to you. In general, subpart F insurance income will be allocated to you if we are a CFC as discussed above and you are a United States 10% shareholder or there is related person insurance income and certain exceptions do not apply. Although we do not believe that any United States persons will be allocated subpart F insurance income, we cannot assure you that this will be the case. If you are a United States tax-exempt organization, we advise you to consult your own tax advisor regarding the risk of recognizing unrelated business taxable income.
Proposed changes in United States tax regulations and laws could subject United States persons who own Class A ordinary shares to United States income taxation on our undistributed earnings and may cause us to undertake changes to the manner in which we conduct our business.
37
In April 2015, the IRS issued proposed regulations that would provide guidance regarding the exclusion of the investment income of a foreign insurance company from the definition of “passive income” for the purposes of the PFIC rules. Furthermore, in June 2015, U.S. Senator Ron Wyden, a member of the U.S. Senate Finance Committee, introduced a bill that provides a “bright line” annual test that a foreign company must satisfy in order to qualify as an insurance company for purposes of the insurance company exception to the PFIC rules.
We are monitoring developments with respect to both the IRS proposed regulations and the Wyden bill. At this time, we cannot predict whether or what, if any, regulations will be adopted or legislation will be enacted. If regulations are adopted or legislation enacted that cause us to fail to meet the requirements of the insurance company exception, such failure could have a material adverse effect on the taxation of our shareholders who are U.S. persons. In that event we may undertake changes to the manner in which we conduct our business, which could have a material effect on our results of operations.
The tax laws and interpretations regarding whether an entity is engaged in a United States trade or business, is a CFC, has related party insurance income or is a PFIC are subject to change, possibly on a retroactive basis. New regulations or pronouncements interpreting or clarifying such rules may be forthcoming from the IRS. We are not able to predict if, when or in what form such guidance will be provided and whether such guidance will have a retroactive effect.
If investments held by GRIL are determined not to be integral to the insurance and reinsurance business carried on by GRIL, additional Irish tax could be imposed and our business and financial results could be materially adversely affected.
Based on administrative practice, taxable income derived from investments made by GRIL is generally taxed in Ireland at the rate of 12.5% on the grounds that such investments either form part of the permanent capital required by regulatory authorities, or are otherwise integral to the insurance and reinsurance business carried on by GRIL. GRIL intends to operate in such a manner so that the level of investments held by GRIL does not exceed the amount that is integral to the insurance and reinsurance businesses carried on by GRIL. If, however, investment income earned by GRIL exceeds these thresholds or if the administrative practice of the Irish Revenue Commissioners changes, Irish corporation tax could apply to such investment income at a higher rate (currently 25%) instead of the general 12.5% rate, and our results of operations could be materially adversely affected.
The impact of the initiative of the OECD to eliminate harmful tax practices is uncertain and could adversely affect our tax status in the Cayman Islands.
The OECD has published reports and launched a global dialogue among member and non-member countries on measures to limit harmful tax competition. These measures are largely directed at counteracting the effects of tax neutral jurisdictions and preferential tax regimes in countries around the world. While the Cayman Islands is currently on the list of jurisdictions that have substantially implemented the internationally agreed tax standard, we are not able to predict if additional requirements will be imposed and if so whether changes arising from such additional requirements will subject us to additional taxes.
ITEM 1B. UNRESOLVED STAFF COMMENTS
None.
ITEM 2. PROPERTIES
We currently occupy our office space in Grand Cayman, Cayman Islands under operating lease agreements which will expire on June 30, 2018, unless we renew the leases for an additional five year term. Additionally, we have an operating lease agreement for office space in Dublin, Ireland which expires in 2031 but provides us an option to terminate the lease in 2021 without any penalty. We believe that for the foreseeable future the office spaces in the Cayman Islands and Ireland will be sufficient for conducting our operations.
ITEM 3. LEGAL PROCEEDINGS
38
From time to time, in the normal course of business, we may be involved in formal and informal dispute resolution procedures, which may include arbitration or litigation, the outcomes of which determine our rights and obligations under our reinsurance contracts and other contractual agreements. In some disputes, we may seek to enforce our rights under an agreement or to collect funds owing to us. In other matters, we may resist attempts by others to collect funds or enforce alleged rights. While the final outcome of legal disputes cannot be predicted with certainty, we do not believe that any of our existing contractual disputes, when finally resolved, will have a material adverse effect on our business, financial condition or operating results.
ITEM 4. MINE SAFETY DISCLOSURES
Not applicable.
PART II
ITEM 5. MARKET FOR REGISTRANT’S COMMON EQUITY, RELATED STOCKHOLDER MATTERS AND ISSUER PURCHASES OF EQUITY SECURITIES
Market Information
Our Class A ordinary shares began publicly trading on the Nasdaq Global Select Market on May 24, 2007 under the symbol “GLRE”. The following table sets forth, for the periods indicated, the high and low reported sale price per share of our Class A ordinary shares on the Nasdaq Global Select Market.
2016 | 2015 | |||||||||||||||
High | Low | High | Low | |||||||||||||
First Quarter | $ | 22.13 | $ | 16.05 | $ | 33.23 | $ | 30.42 | ||||||||
Second Quarter | $ | 22.07 | $ | 18.79 | $ | 31.91 | $ | 29.14 | ||||||||
Third Quarter | $ | 21.86 | $ | 18.97 | $ | 30.05 | $ | 22.13 | ||||||||
Fourth Quarter | $ | 24.10 | $ | 19.25 | $ | 25.20 | $ | 17.86 | ||||||||
Holders
As of January 31, 2017, the number of holders of record of our Class A ordinary shares was approximately 44, not including beneficial owners of shares registered in nominee or street name who represent approximately 97.0% of the Class A ordinary shares issued and outstanding.
Dividends
Since inception, we have not paid any cash dividends on our Class A ordinary shares or Class B ordinary shares, or collectively, our ordinary shares.
Holders of ordinary shares are entitled to receive dividends when, as and if declared by the Board of Directors in accordance with the provisions of our Articles and the Companies Law. In the event of a liquidation, dissolution or winding-up of the Company, the holders of ordinary shares are entitled to share equally and ratably in our assets, if any remain after the payment of all of our debts and liabilities and the liquidation preference of any outstanding preferred shares.
We currently do not intend to declare and pay dividends on our ordinary shares in the foreseeable future. However, if we decide to pay dividends, we cannot assure you that sufficient cash will be available to pay such dividends. In addition, a letter of credit facility prohibits us from paying dividends during an event of default as defined in the letter of credit agreement. Our future dividend policy will also depend on the requirements of any future financing agreements to which we may be a party and other factors considered relevant by our Board of Directors, such as our results of operations and cash flows, our financial position and capital requirements, general business conditions, rating agency guidelines, legal, tax, regulatory and any contractual restrictions on the payment of dividends. Further, any future declaration and payment of dividends is discretionary and our Board of Directors may at any time modify or revoke our dividend policy on our ordinary shares. Finally, our ability to pay dividends also depends on the ability of our subsidiaries to pay dividends to us. Although Greenlight Capital Re is not subject to any significant legal prohibitions on the payment of dividends, Greenlight Re and GRIL are subject to regulatory constraints that affect their ability to pay dividends and include minimum net worth requirements. As of December 31, 2016,
39
Greenlight Re and GRIL both exceeded the minimum statutory capital requirements. Any dividends we pay will be declared and paid in U.S. dollars.
Performance Graph
Presented below is a line graph comparing the yearly percentage change in the cumulative total shareholder return on our Class A ordinary shares from May 24, 2007 (the date on which our Class A ordinary shares were first listed on the Nasdaq Global Select Market) through December 31, 2016 against the total return index for the Russell 2000 Index, or RUT, and the S&P 500 Property & Casualty Insurance Index, or S&P Insurance Index, for the same period. The performance graph assumes $100 invested on May 24, 2007 in the ordinary shares of Greenlight Capital Re, the RUT and the S&P Insurance Index. The performance graph also assumes that all dividends are reinvested.
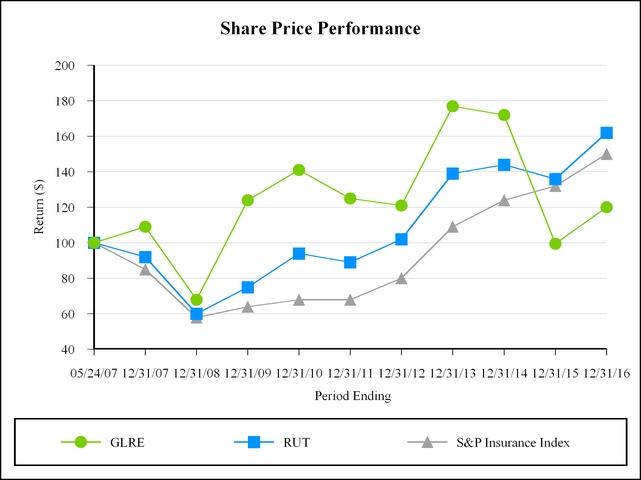
The performance reflected in the graph above is not necessarily indicative of future performance.
This graph is not “soliciting material,” is not deemed filed with the SEC and is not to be incorporated by reference in any filing by us under the Securities Act or the Exchange Act, whether made before or after the date hereof and irrespective of any general incorporation language in any such filing.
Purchases of Equity Securities by the Issuer and Affiliated Purchasers
Our board of directors has adopted a share repurchase plan authorizing the Company to repurchase Class A ordinary shares. From time to time, the repurchase plan has been re-approved or modified at the election of our Board of Directors. On April 27, 2016, our Board of Directors amended the share repurchase plan to extend the duration of the repurchase plan to June 30, 2017 and reinstated the authorization for the Company to purchase up to 2.0 million Class A ordinary shares or securities convertible into Class A ordinary shares in the open market, through privately negotiated transactions or Rule 10b5-1 stock trading plans. As of December 31, 2016, 2.0 million Class A ordinary shares remained authorized for repurchase under the share repurchase plan. The Company is not required to repurchase any Class A ordinary shares and the repurchase plan may be
40
modified, suspended or terminated at any time without prior notice. No Class A ordinary shares were repurchased by the Company during the year ended December 31, 2016.
ITEM 6. SELECTED FINANCIAL DATA
The following table sets forth our selected historical consolidated statement of income data for the fiscal years ended December 31, 2016, 2015, 2014, 2013 and 2012, as well as our selected historical consolidated balance sheet data as of December 31, 2016, 2015, 2014, 2013 and 2012, which are derived from our audited consolidated financial statements. The audited consolidated financial statements are prepared in conformity with accounting principles generally accepted in the United States of America (“U.S. GAAP”) and have been audited by BDO USA, LLP, an independent registered public accounting firm.
These historic results are not necessarily indicative of results for any future period. You should read the following selected financial data in conjunction with our consolidated financial statements and related notes thereto contained in “Item 8. Financial Statements and Supplementary Data” and “Item 7. Management’s Discussion and Analysis of Financial Condition and Results of Operations” included in this filing and all other information appearing elsewhere or incorporated into this filing by reference.
Year ended December 31 | ||||||||||||||||||||
2016 | 2015 | 2014 | 2013 | 2012 | ||||||||||||||||
($ in thousands, except per share and share amounts) | ||||||||||||||||||||
Selected Consolidated Statement of Income Data | ||||||||||||||||||||
Gross premiums written | $ | 536,072 | $ | 502,124 | $ | 324,023 | $ | 535,702 | $ | 427,844 | ||||||||||
Net premiums earned | 513,118 | 408,387 | 354,240 | 547,899 | 466,714 | |||||||||||||||
Net investment income (loss) | 76,183 | (281,924 | ) | 122,575 | 218,140 | 78,941 | ||||||||||||||
Loss and loss adjustment expenses incurred, net | 380,815 | 317,097 | 234,986 | 338,493 | 366,601 | |||||||||||||||
Acquisition costs, net | 134,534 | 116,207 | 107,665 | 171,872 | 142,721 | |||||||||||||||
General and administrative expenses | 25,808 | 23,434 | 24,500 | 20,958 | 16,755 | |||||||||||||||
Net income (loss) | $ | 44,881 | $ | (326,425 | ) | $ | 109,592 | $ | 225,699 | $ | 14,598 | |||||||||
Earnings (Loss) Per Share Data (1) | ||||||||||||||||||||
Basic | $ | 1.20 | $ | (8.90 | ) | $ | 2.94 | $ | 6.13 | $ | 0.40 | |||||||||
Diluted | 1.20 | (8.90 | ) | 2.89 | 6.01 | 0.39 | ||||||||||||||
Weighted average number of ordinary shares used in the determination of earnings and loss per share | ||||||||||||||||||||
Basic | 37,267,145 | 36,670,466 | 37,242,687 | 36,838,128 | 36,702,128 | |||||||||||||||
Diluted | 37,340,018 | 36,670,466 | 37,874,387 | 37,585,167 | 37,361,338 | |||||||||||||||
Underwriting Income (Loss) and Selected Ratios | ||||||||||||||||||||
Underwriting income (loss) * | $ | (18,814 | ) | $ | (41,909 | ) | $ | (4,908 | ) | $ | 22,311 | $ | (53,315 | ) | ||||||
Loss ratio (2) | 74.2 | % | 77.6 | % | 66.3 | % | 61.8 | % | 78.5 | % | ||||||||||
Acquisition cost ratio (3) | 26.2 | % | 28.5 | % | 30.4 | % | 31.4 | % | 30.6 | % | ||||||||||
Underwriting expense ratio (4) | 3.2 | % | 4.2 | % | 4.7 | % | 2.8 | % | 2.3 | % | ||||||||||
Combined ratio (5) | 103.6 | % | 110.3 | % | 101.4 | % | 96.0 | % | 111.4 | % | ||||||||||
Prior to January 1, 2016, the combined ratio included all general and administrative expenses. However, in order to more accurately reflect the underwriting results in the combined ratio, effective from January 1, 2016, we have included only underwriting related expenses in the combined ratio calculation. Underwriting expenses include those expenses directly related to underwriting activities as well as an allocation of other general and administrative expenses. Therefore, the underwriting expense ratio is the ratio of underwriting expenses to net premiums earned. In addition, the underwriting expense ratio includes any gain or loss resulting from deposit accounted contracts as well as any amortized cost of weather derivative swaps entered into as part of our underwriting activities. The underwriting expense ratios and combined ratios for the prior period have been reclassified in the above table for comparability purposes.
41
December 31 | ||||||||||||||||||||
2016 | 2015 | 2014 | 2013 | 2012 | ||||||||||||||||
($ in thousands, except per share and share amounts) | ||||||||||||||||||||
Selected Consolidated Balance Sheet Data | ||||||||||||||||||||
Total investments | $ | 1,022,537 | $ | 1,064,164 | $ | 1,430,978 | $ | 1,393,679 | $ | 1,177,928 | ||||||||||
Cash and cash equivalents | 39,858 | 112,162 | 12,030 | 3,722 | 21,890 | |||||||||||||||
Restricted cash and cash equivalents | 1,202,651 | 1,236,589 | 1,296,914 | 1,334,074 | 1,206,837 | |||||||||||||||
Total assets | 2,664,693 | 2,712,522 | 2,995,292 | 3,095,276 | 2,722,753 | |||||||||||||||
Securities sold, not yet purchased, at fair value | 859,902 | 882,906 | 1,090,731 | 1,111,690 | 908,368 | |||||||||||||||
Due to prime brokers | 319,830 | 396,453 | 211,070 | 314,702 | 326,488 | |||||||||||||||
Loss and loss adjustment expense reserves ^ | 306,641 | 305,997 | 264,243 | 329,894 | 356,470 | |||||||||||||||
Unearned premium reserves | 222,527 | 211,954 | 128,736 | 173,057 | 188,185 | |||||||||||||||
Total liabilities | 1,773,006 | 1,863,749 | 1,801,251 | 2,008,972 | 1,862,343 | |||||||||||||||
Total equity | 891,687 | 848,773 | 1,194,041 | 1,086,304 | 860,410 | |||||||||||||||
Adjusted book value* (6) | 874,242 | 825,391 | 1,165,151 | 1,051,595 | 821,708 | |||||||||||||||
Diluted adjusted book value* (7) | $ | 876,362 | $ | 836,944 | $ | 1,184,779 | $ | 1,067,623 | $ | 840,683 | ||||||||||
Ordinary shares outstanding | ||||||||||||||||||||
Basic | 37,366,327 | 37,027,467 | 37,384,543 | 37,046,814 | 36,702,128 | |||||||||||||||
Diluted (8) | 37,489,647 | 37,744,807 | 38,516,460 | 38,257,545 | 38,193,418 | |||||||||||||||
Per Share Data | ||||||||||||||||||||
Basic adjusted book value per share* (9) | $ | 23.40 | $ | 22.29 | $ | 31.17 | $ | 28.39 | $ | 22.39 | ||||||||||
Fully diluted adjusted book value per share* (10) | 23.38 | 22.17 | 30.76 | 27.91 | 22.01 | |||||||||||||||
(1) | Basic earnings per share is calculated by dividing net income by the weighted average number of common shares and participating securities outstanding for the period. Diluted earnings per share is calculated by taking into account the effects of exercising all dilutive stock options. In the event of a net loss, any stock options outstanding are excluded from the calculation of diluted loss per share. Unvested stock awards which contain non-forfeitable rights to dividends or dividend equivalents, whether paid or unpaid (referred to as “participating securities”) are included in the number of shares outstanding for both basic and diluted earnings per share calculations. In the event of a net loss, the participating securities are excluded from both basic and diluted loss per share. |
(2) | The loss ratio is calculated by dividing net loss and loss adjustment expenses incurred by net premiums earned. |
(3) | The acquisition cost ratio is calculated by dividing net acquisition costs by net premiums earned. |
(4) | The underwriting expense ratio is the ratio of underwriting expenses to net premiums earned. |
(5) | The combined ratio is the sum of the loss ratio, acquisition cost ratio and underwriting expense ratio. |
(6) | Adjusted book value equals total equity minus non-controlling interest in joint venture. |
(7) | Diluted adjusted book value is the adjusted book value plus the proceeds from the exercise of in-the-money options issued and outstanding at year end. |
(8) | Diluted number of shares outstanding is the sum of basic shares outstanding and the in-the-money options and restricted stock units issued and outstanding at year end. |
(9) | Basic adjusted book value per share is calculated by dividing adjusted book value by the number of shares and share equivalents issued and outstanding at year end. |
(10) | Fully diluted adjusted book value per share is calculated by dividing the diluted adjusted book value by the diluted number of shares outstanding at year end. |
* | Adjusted book value, diluted adjusted book value, basic adjusted book value per share, fully diluted adjusted book value per share and underwriting income (loss) are non-GAAP measures. For a reconciliation of the non-GAAP measures to the most comparable GAAP measures, refer to “Item 7. Management’s Discussion and Analysis of Financial Condition and Results of Operations — Results of Operations”. |
^ | For detailed discussion of change in loss and loss adjustment expenses, refer to “Item 7. Management’s Discussion and Analysis of Financial Condition and Results of Operations — Financial Condition” and Note 7 to the consolidated financial statements. |
42
ITEM 7. MANAGEMENT’S DISCUSSION AND ANALYSIS OF FINANCIAL CONDITION AND RESULTS OF OPERATIONS
References to “we,” “us,” “our,” “our company,” or “the Company” refer to Greenlight Capital Re, Ltd. (“GLRE”) and its wholly-owned subsidiaries, Greenlight Reinsurance, Ltd, (“Greenlight Re”), Greenlight Reinsurance Ireland, Ltd. (“GRIL”) and Verdant Holding Company, Ltd. (“Verdant”), unless the context dictates otherwise. References to our “Ordinary Shares” refers collectively to our Class A Ordinary Shares and Class B Ordinary Shares.
The following is a discussion and analysis of our results of operations for the years ended December 31, 2016, 2015 and 2014 and financial condition as of December 31, 2016 and 2015. The following discussion should be read in conjunction with the audited consolidated financial statements and accompanying notes, which appear elsewhere in this filing.
General
We are a global specialty property and casualty reinsurer, headquartered in the Cayman Islands, with a reinsurance and investment strategy that we believe differentiates us from most of our competitors. Our goal is to build long-term shareholder value by selectively offering customized reinsurance solutions, in markets where capacity and alternatives are limited, which we believe will yield favorable long-term returns on equity.
We aim to complement our underwriting results with a non-traditional investment approach in order to achieve higher rates of return over the long term than reinsurance companies that employ more traditional, fixed-income investment strategies. We manage our investment portfolio according to a value-oriented philosophy, in which we take long positions in perceived undervalued securities and short positions in perceived overvalued securities.
Because we employ an opportunistic underwriting philosophy, period-to-period comparisons of our underwriting results may not be meaningful. In addition, our historical investment results may not necessarily be indicative of future performance. Due to the nature of our reinsurance and investment strategies, our operating results will likely fluctuate from period to period.
Outlook and Trends
The reinsurance industry has experienced significant consolidation in the last several years, fueled by many traditional participants with excess capital looking to strengthen their positions in their core markets. We believe further consolidation will likely continue but do not believe that consolidation will result in a significant reduction in total capital within the industry. Rather, we expect the industry consolidation to create concentrations of capital in fewer, larger participants, and that with a reduction in the number of competitors in the industry, pricing may partially stabilize. Further, while some opportunities may become available on an attractive basis to only the largest reinsurance companies in the industry, we believe that the consolidation trend may create new opportunities for us if less capacity is available in the market as a result of the industry consolidating.
We do not believe that the over-capitalization of the market is uniform across all industry participants and there are many insurers and reinsurers with lower financial security profiles than ours that have and will continue to suffer disproportionately. We believe the value proposition of our reinsurance offering and our differentiated underwriting strategy positions us well to compete for new, targeted business in niche areas that we know and can service well.
A key part of our underwriting strategy is to identify and partner with companies that have suffered dislocation. Accordingly, given declining or flat investment earnings for fixed income investors resulting from a prolonged low interest rate environment, we believe underwriting opportunities may increase, which we intend to pursue where we believe pricing is economically rational. Conversely, if attractive opportunities are not available on economically rational terms, we anticipate that we will seek to maintain or even reduce premium writings rather than accept mispriced risk in order to conserve our capital for a more opportune environment. We believe that significant price increases could occur if financial and credit markets experience adverse shocks that result in the loss of capital of insurers and reinsurers, or if there are major catastrophic events, especially in North America.
In the past, our underwriting results have reported adverse development primarily relating to construction defect exposure from certain general liability contracts. Effective September 30, 2016, we novated the contracts containing construction defect losses and have thereby mitigated the risk of future deterioration of loss reserves relating to construction defect exposure.
43
We have recently observed stability and favorable trends in our underlying rates for our non-standard automobile business, which we believe adequately compensates the insurers for increased claims frequency trends in private passenger auto. We expect to have a high concentration of premium in this line for the foreseeable future.
We have observed an increase in the demand for U.S. health stop loss insurance as more employers seek to control health care costs by pursuing alternatives to first dollar health care plans subject to the Affordable Care Act. We believe that the majority of the demand has been underwritten by large carriers that elect to not purchase reinsurance, although we also believe that a portion has been underwritten by managing general underwriters, who often rely heavily on quota share reinsurance. We intend to seek to increase our market share from managing general underwriters that have increased exposures in this line. We will continue to monitor any changes to the Affordable Care Act under the new U.S. administration and react to potential impacts to this line of business.
Private U.S. mortgage insurers appear to be increasingly seeking quota share reinsurance options as a result of the implementation of the Private Mortgage Insurers Eligibility Requirements (PMIERS) in the United States, which effectively increases the cost of capital for the private mortgage insurers. We believe the credit underwriting standards for U.S. mortgages are good and as a result the risk-adjusted profitability of these portfolios is acceptable. We expect that reinsurance of U.S. mortgage risk will be a growing part of our underwriting portfolio during 2017.
Our casualty business is generally comprised of larger, syndicated reinsurance placements for general casualty, professional liability and workers’ compensation. For most of this business, we are not the lead underwriter, and instead have followed the market on these transactions. This business has a longer duration of claim payments than other types of business we have historically written, which leads to a build-up of reserves and exposure over a longer period of time. While our casualty business has grown in recent years, we expect this portion of our business to remain at current levels during 2017 unless we find new attractive opportunities.
We have noted that pricing for property catastrophe retro and other property catastrophe business is under severe competitive pressure and we believe much of the business in the market is being priced below expected losses. As such, since 2015, we have decreased our focus in this line of business unless there is a market changing event that improves expected profitability.
Underlying rates for property - personal lines business relating to Florida homeowners’ insurance have continued to decline and water damage claims and fraudulent assignment of benefit (“AOB”) claims continue to increase the expected losses. The Florida Legislature did not address the AOB problem during the legislative session in 2016. Our expectation is that AOB claims will continue during 2017 resulting in less attractive profit margins on this business. Despite this, the reinsurance terms and conditions continue to be highly competitive. During 2016, we significantly reduced our exposure to Florida homeowners’ insurance as we did not renew any of our existing quota share contracts. While we added new property contracts with exposures in Florida, we are monitoring changes to the legal and political environment with regards to the AOB issue.
On November 3, 2016, A.M. Best revised Greenlight Re’s rating of “A (Excellent)” to “A- (Excellent”) with a stable outlook. While the rating revision is likely to make certain new business production more difficult, we don’t believe that our current book of business is particularly rating sensitive and our strong relationships with our partners will allow us to continue to experience the high renewal rate that we have historically experienced. At the January 1, 2017 renewal period, our renewals were at historically comparable levels and we continue to see new opportunities.
While competitive market conditions have made finding and successfully underwriting new business that meets our targeted return hurdles challenging, we believe that we have a strong pipeline of attractive opportunities with counterparties that seek highly customized structures, terms and conditions, which aligns well with our underwriting strategy. We intend to continue to monitor market conditions and pursue opportunities to best position ourselves to participate in future under-served or capacity-constrained markets as they arise, and intend to offer products that we believe will generate favorable returns on equity over the long term. Accordingly, our underlying results and product line concentrations in any given period may vary, perhaps significantly, and are not necessarily indicative of our future results of operations.
Our investment portfolio had a net long exposure of 26.6% as of December 31, 2016. Our goal for 2017 is to protect capital in an uncertain environment and to find investment opportunities on both our long and short portfolios that we believe will generate positive returns. Despite a Federal Reserve interest rate increase in December 2016, monetary policy remains very accommodative globally. Additionally, there are many global economic and political risks that are coming to the forefront. Global equity markets had a difficult 2016 with many global market indices falling. Given the current investment environment, we deem it appropriate to maintain comparatively lower gross and net equity exposures and to hold a significant position in gold and other macro positions.
44
Segments
We manage our business on the basis of one operating segment, property and casualty reinsurance, in accordance with the qualitative and quantitative criteria established by U.S. GAAP. Within the property and casualty reinsurance segment, we analyze our underwriting operations using two categories:
● | frequency business; and | |
● | severity business. | |
Frequency business is generally characterized as contracts containing a potentially large number of small losses emanating from multiple events. Clients generally buy this protection to increase their own underwriting capacity and typically select a reinsurer based upon the reinsurer’s financial strength, service and expertise. We expect the results of frequency business to be less volatile than those of severity business from period to period due to greater predictability. We also expect that over time the profit margins and return on equity of our frequency business will be lower than those of our severity business.
Severity business is generally characterized as contracts with the potential for significant losses emanating from one event or multiple events. Clients generally buy this protection to remove volatility from their balance sheets, and accordingly, we expect the results of severity business to be volatile from period to period. However, over the long term, we also expect that our severity business will generate higher profit margins and return on equity than those of our frequency business.
Revenues
We derive our revenues from two principal sources:
● | premiums from reinsurance on property and casualty business assumed; and | |
● | income from investments. | |
Premiums from reinsurance on property and casualty business assumed are directly related to the number, type and pricing of contracts we write. For financial reporting purposes, we earn premiums over the contract period in proportion to the period of risk covered.
Income from our investments is primarily comprised of interest income, dividends, net realized gains and losses, and changes in unrealized gains and losses on investment securities. We also derive interest income from money market funds and notes receivable.
In addition, we may from time to time derive other income from gains on deposit accounted contracts, fees generated from advisory services and fees relating to overrides, profit commissions and early termination of contracts.
Expenses
Our expenses consist primarily of the following:
● | underwriting losses and loss adjustment expenses; | |
● | acquisition costs; | |
● | investment-related expenses; and | |
● | general and administrative expenses. | |
Loss and loss adjustment expenses are a function of the amount and type of reinsurance contracts we write and of the loss experience of the underlying coverage. As described below, loss and loss adjustment expenses include an actuarial analysis of the estimated losses, including losses incurred during the period and changes in estimates from prior periods. Depending on the nature of the contract, loss and loss adjustment expenses may be paid over a period of years.
Acquisition costs primarily consist of brokerage fees, ceding commissions, premium taxes, profit commissions, letters of credit fees, federal excise tax, and other direct expenses we incur that are directly related to underwriting reinsurance contracts. We amortize deferred acquisition costs relating to successfully bound reinsurance contracts over the related contract term.
45
Investment-related expenses primarily consist of interest expense on borrowings, dividend expense on short sales, management fees and performance compensation that we pay to our investment advisor. We net these expenses against investment income in our consolidated financial statements.
General and administrative expenses consist primarily of salaries and benefits and related costs, including costs associated with our incentive compensation plan, bonuses and stock compensation expenses. General and administrative expenses also include professional fees, travel and entertainment, information technology, rent and other general operating expenses.
For stock option expenses, we calculate compensation cost using the Black-Scholes option pricing model and expense stock options over their vesting period, which is typically three years. For restricted stock awards and restricted stock units, we calculate compensation cost using the grant date fair value of each award and expense the stock awards over their vesting period, which is typically three years for employees and one year for directors.
Critical Accounting Policies
Our consolidated financial statements contain certain amounts that are inherently subjective in nature and have required management to make assumptions and best estimates to determine reported values. If certain factors, including those described in “Part I. Item IA. — Risk Factors”, cause actual events or results to differ materially from our underlying assumptions or estimates, there could be a material adverse effect on our results of operations, financial condition or liquidity. We believe that the following accounting policies affect the more significant estimates used in the preparation of our consolidated financial statements. The descriptions below are summarized and have been simplified for clarity. A more detailed description of our significant accounting policies as well as recently issued accounting standards is included in Note 2 to the consolidated financial statements.
Premium Revenues and Risk Transfer. Our property and casualty reinsurance premiums are recorded as premiums written based upon contract terms and information received from ceding companies and their brokers. For excess of loss reinsurance contracts, premiums are typically stated as a percentage of the subject premiums written by the client, subject to a minimum and deposit premium. The minimum and deposit premium is typically based on an estimate of subject premiums expected to be written by the client during the contract term. The minimum and deposit premium is reported initially as premiums written and adjusted, if necessary, in subsequent periods once the actual subject premium is known. For catastrophe contracts that contractually require the payment of a reinstatement premium equal to or greater than the original premium upon the occurrence of a full limit loss, the reinstatement premiums are earned over the original contract period. Reinstatement premiums that are contractually calculated on a pro-rata basis of the original premiums are earned over the remaining coverage period.
For each quota share or proportional property and casualty reinsurance contract we underwrite, our client estimates gross premiums written at inception of the contract. We generally account for such premiums using our best estimates and then adjust our estimates based on actual reports provided by our client and based on our expectations of industry developments. As the contract progresses, we monitor actual premiums received in conjunction with correspondence from the client in order to refine our estimate. Variances from initial gross premiums written estimates can be greater for quota share contracts than for excess of loss contracts. All premiums on quota share contracts are earned over the risk coverage period. Unearned premiums consist of the unexpired portion of reinsurance provided.
At the inception of each of our reinsurance contracts, we receive premium estimates from the client, which, together with historical and industry data, are used to estimate what we believe will be the ultimate premium payable pursuant to each contract. We receive actual premiums written by each client as the client reports the actual results of the underlying insurance writings to us on a monthly or quarterly basis (depending on the terms of the contract). We book the actual premiums written when we receive them from our client. Each reporting period we estimate the amount of premiums that are written for stub periods that have not yet been reported to us by the client. For example, for December year-end we may have to estimate December premiums ceded under certain contracts since the client may not be required to report the actual results to us until after we have finalized our audited financial statements. Typically, premium estimates are only used for unreported stub periods, which accounts for a small percentage of our reported premiums written. We believe that estimating premiums written for these stub periods is standard reinsurance industry practice.
We are able to confirm the accuracy and completeness of premiums reported by our clients by either reviewing the client’s statutory filings and/or performing an audit of the client, as per the terms of the contract. Discrepancies between premiums ceded and reported under a contract are, in our experience, rare. To date, we have not had any material discrepancy in premiums reported by a client that required a dispute resolution process.
46
We account for reinsurance contracts in accordance with U.S. GAAP. Assessing whether or not a reinsurance contract meets the conditions for risk transfer requires judgment. The determination of risk transfer is critical to reporting premiums written and is based, in part, on the use of actuarial and pricing models and assumptions. If we determine that a reinsurance contract does not transfer sufficient risk, or if a contract provides retroactive reinsurance coverage, we use deposit accounting. Any losses on such contracts are charged to earnings immediately and recorded in the consolidated statements of income as other expense. Any gains relating to such contracts are deferred and amortized over the estimated remaining settlement period. All such deferred gains are included in reinsurance balances payable in the consolidated balance sheets. Amortized gains are recorded in the consolidated statements of income as other income.
Investments. Our investments in debt and equity securities that are classified as “trading securities” are carried at fair value in accordance with U.S. GAAP. The fair values of the listed equities are derived based on the last reported price on the balance sheet date as reported by a recognized exchange. The fair values of listed equities that have restrictions on sale or transfer which expire within one year, are determined by adjusting the observed market price of the equity using a liquidity discount based on observable market inputs. The fair values of debt instruments are generally derived based on the average of multiple market maker or broker quotes which are considered to be binding. Where quotes are not available, debt instruments are valued using cash flow models using assumptions and estimates that may be subjective and non-observable.
The fair values of our investments in commodities are based on the commodity’s last reported price on the balance sheet date as reported by a recognized commodities exchange. Our investments in private and unlisted equity securities and limited partnerships are all carried at fair value, based on broker or market maker quotes, or based on management’s assumptions developed from available information, using the services of our investment advisor including the most recent net asset values obtained from the managers of those underlying investments. Investments in private equity funds are valued based on unadjusted net asset values reported by the funds’ managers.
For securities classified as “trading securities” and “other investments”, any realized and unrealized gains or losses are determined on the basis of specific identification method (by reference to cost or amortized cost, as appropriate) and included in net investment income in the consolidated statements of income.
Financial contracts which include total return swaps, credit default swaps, options, futures and other derivative instruments are recorded at their fair value with any unrealized gains and losses included in net investment income in the consolidated statements of income. Fair values on total return swaps are based on the underlying security’s fair value which is obtained from closing prices on a recognized exchange (for equity or commodity swaps), or from market maker or broker quotes. Fair values for credit default swaps trading in an active market are based on market maker or broker quotes taking into account credit spreads on identical contracts. Exchange traded option contracts are recorded at fair value based on quoted prices in active markets. For over the counter (“OTC”) options and exchange traded options where a quoted price in an active market is not available, we obtain multiple market maker quotes to determine the fair values. Fair values for other derivative instruments are determined based on multiple broker or market maker quotes taking into account the liquidity and the availability of an active market for the derivative.
Loss and Loss Adjustment Expense Reserves.
We establish loss and loss adjustment expense reserves for contracts based on estimates of the ultimate cost of all losses including losses incurred but not reported (“IBNR”). These estimated ultimate reserves are based on our actuarial estimates derived from reports received from ceding companies, industry data and historical experience. We review these estimates periodically on a contract by contract basis and adjust the reserves based on our expectation of the ultimate experience of losses on each contract. Since reserves are estimates, the final settlement of losses may vary from the reserves established. Any adjustments to the estimates, which may be material, are recorded in the period they are determined. Please refer to Note 7 of our consolidated financial statements for a more detailed explanation of our loss reserving methodology and the loss development tables by accident year as required under U.S. GAAP. Our historical development of estimated reserves by underwriting year for the last ten years is presented below under the section “Financial Condition”.
Because of the uncertainties that surround our estimates of loss and loss adjustment expense reserves, we cannot be certain that ultimate loss and loss adjustment expense payments will not exceed our estimates, or be less than our estimates. If our estimated reserves are deficient, we would be required to increase loss reserves in the period in which such deficiencies are identified, which would cause a charge to our earnings and a reduction of our capital. Similarly, if our estimated reserves are excessive, we would decrease loss reserves in such period in which the excess is identified.
Given the uncertainties involved in estimating ultimate reserves and since we reserve to a point estimate on an individual contract basis, our estimated reserves may be deficient or excessive. Historical development of estimated reserves is not an accurate reflection of future loss development. Additionally, external factors can influence prior year loss development. For
47
example, changes in specific tort law which may cause ultimate loss awards to increase or decrease could have a material effect on our loss reserve development. We are unable to predict with accuracy the magnitude or direction that such external factors may have on our estimated loss reserves.
Acquisition Costs. We capitalize brokerage fees, ceding commissions, premium taxes and other direct expenses that relate directly to and vary with the writing of reinsurance contracts. Acquisition costs are deferred subject to ultimate recoverability and amortized over the related period of risk covered. Acquisition costs also include profit commissions. Certain contracts include provisions for profit commissions to be paid to the ceding insurer based upon the ultimate loss experience of the contracts. The methodology for calculating profit commissions is specific to the individual contracts and varies from contract to contract. Typically profit commissions are calculated and accrued based on the expected ultimate loss experience for such contracts and recorded when the expected loss experience indicates that a profit commission is probable under the contract terms. Profit commission reserves, if any, are included in reinsurance balances payable on the consolidated balance sheets.
Bonus Accruals. Under the Company’s bonus program, each employee’s target bonus consists of two components: a discretionary component based on a qualitative assessment of each employee’s performance and a quantitative component based on the return on deployed equity (“RODE”) for each underwriting year relating to reinsurance operations. The qualitative portion of an employee’s annual bonus is accrued at each employee’s target amount, which may differ significantly from the actual amount awarded. The quantitative portion of each employee’s annual bonus is accrued based on the expected RODE for each underwriting year and adjusted for changes in the expected RODE and actual investment return each quarter until all losses are settled and the underwriting year is declared closed. The quantitative bonus is calculated and paid in annual installments between three to five from the end of the fiscal year in which the business was underwritten. Any subsequent changes to the quantitative bonus are incorporated into the following open underwriting year. The Compensation Committee of our Board of Directors approves all quantitative bonuses prior to being paid. The expected RODE calculation utilizes proprietary models which require significant estimation and judgment. Actual RODE may vary significantly from the expected RODE and any adjustments to the quantitative bonus estimates, which may be material, are recorded in the period in which they are determined.
Share-Based Payments. We have established a stock incentive plan for directors, employees and consultants. U.S. GAAP requires us to recognize share-based compensation transactions using the fair value at the grant date of the award. We calculate the compensation for restricted stock awards and restricted stock units (“RSUs”) based on the price of the Company’s common shares at the grant date and recognize the expense, adjusted for estimated forfeitures, over the vesting period. We estimate the forfeiture rate for restricted stock awards and RSUs based on our historical experience and our expectations of future forfeitures. The forfeiture rate reduces the unamortized grant date fair value of unvested outstanding restricted stock awards and RSUs as well as the associated stock compensation expense. As restricted shares and RSUs are forfeited, the number of outstanding restricted shares and RSUs is reduced and the remaining unamortized grant date fair value is compared to the assumed forfeiture levels, and if deemed necessary, true-up adjustments are recorded. For the year ended December 31, 2016, we have assumed a forfeiture rate of 6% (2015: 0% and 2014: 0%) for restricted stock awards and RSUs granted, in order to reflect the anticipated forfeitures and more accurately record the share-based compensation expense.
Share purchase options are expensed over the vesting period on a graded vesting basis. Determining the fair value of share option awards at the grant date requires significant estimation and judgment. We use an option-pricing model (Black-Scholes pricing model) to assist in the calculation of fair value. The estimate of expected volatility is based on the daily historical trading data of our Class A ordinary shares from the date that these shares commenced trading (May 24, 2007) to the grant date.
If actual results differ significantly from these estimates and assumptions, particularly in relation to our estimation of volatility which requires significant judgment, share-based compensation expense, primarily with respect to future share-based awards, could be materially impacted.
Key Financial Measures and Non-GAAP Measures
In addition to the consolidated financial statements, management uses certain key financial measures, some of which are not prescribed under U.S. GAAP rules and standards (“non-GAAP financial measures”), to evaluate our financial performance and the overall growth in shareholder value. Generally, a non-GAAP financial measure, as defined in SEC Regulation G, is a numerical measure of a company’s historical or future financial performance, financial position, or cash flows that either excludes or includes amounts that are not normally excluded or included in the most directly comparable measure calculated and presented in accordance with U.S. GAAP. Management believes that these measures, which may be calculated or defined differently by other companies, provide a consistent and comparable measure of performance of its businesses to help shareholders understand performance trends and allow for a more complete understanding of the Company’s business. Non-GAAP financial measures
48
should not be viewed as a substitute for those determined in accordance with U.S. GAAP. The key non-GAAP financial measures used in this report are:
• | Basic adjusted book value per share; |
• | Fully diluted adjusted book value per share; |
• | Net underwriting income (loss); |
Basic Adjusted Book Value Per Share and Fully Diluted Adjusted Book Value Per Share
We believe that long-term growth in fully diluted adjusted book value per share is the most relevant measure of our financial performance because it provides management and investors a yardstick by which to monitor the shareholder value generated. In addition, fully diluted adjusted book value per share may be useful to our investors, shareholders and other interested parties to form a basis of comparison with other companies within the property and casualty reinsurance industry.
Basic adjusted book value per share is considered a non-GAAP financial measure because it excludes from the total equity the non-controlling interest in a joint venture. Fully diluted adjusted book value per share is also considered a non-GAAP financial measure and represents basic adjusted book value per share combined with the impact from dilution of all in-the-money stock options and RSUs issued and outstanding as of any period end. We adjust the total equity by excluding the non-controlling interest in a joint venture because it does not reflect the equity attributable to our shareholders. Basic adjusted book value per share and fully diluted adjusted book value per share should not be viewed as substitutes for the comparable U.S. GAAP measures.
The following table presents a reconciliation of the non-GAAP financial measures basic adjusted and fully diluted adjusted book value per share to the most comparable U.S. GAAP measure.
December 31, 2016 | December 31, 2015 | December 31, 2014 | |||||||||
($ in thousands, except per share and share amounts) | |||||||||||
Basic adjusted and fully diluted adjusted book value per share numerator: | |||||||||||
Total equity (U.S. GAAP) | $ | 891,687 | $ | 848,773 | $ | 1,194,041 | |||||
Less: Non-controlling interest in joint venture | (17,445 | ) | (23,382 | ) | (28,890 | ) | |||||
Basic adjusted book value per share numerator | 874,242 | 825,391 | 1,165,151 | ||||||||
Add: Proceeds from in-the-money stock options issued and outstanding | 2,120 | 11,553 | 19,628 | ||||||||
Fully diluted adjusted book value per share numerator | $ | 876,362 | $ | 836,944 | $ | 1,184,779 | |||||
Basic adjusted and fully diluted adjusted book value per share denominator: | |||||||||||
Ordinary shares issued and outstanding for basic adjusted book value per share denominator | 37,366,327 | 37,027,467 | 37,384,543 | ||||||||
Add: In-the-money stock options and RSUs issued and outstanding | 123,320 | 717,340 | 1,131,917 | ||||||||
Fully diluted adjusted book value per share denominator | 37,489,647 | 37,744,807 | 38,516,460 | ||||||||
Basic adjusted book value per share | $ | 23.40 | $ | 22.29 | $ | 31.17 | |||||
Fully diluted adjusted book value per share | 23.38 | 22.17 | 30.76 | ||||||||
Net Underwriting Income (Loss)
One way that management evaluates the Company’s underwriting performance is through the measurement of net underwriting income (loss). We do not use premiums written as a measure of performance. Net underwriting income (loss) is a performance measure used by management as it measures the underlying fundamentals of the Company’s underwriting operations. Management believes that the use of net underwriting income (loss) enables investors and other users of the Company’s financial information to analyze its performance in a manner similar to how management analyzes performance. Management also believes that this measure follows industry practice and, therefore, allows the users of financial information to compare the Company’s performance with its industry peer group.
Net underwriting income (loss) is considered a non-GAAP financial measure because it excludes items used in the calculation of net income before taxes under U.S. GAAP. The measure includes underwriting expenses which are directly related to underwriting activities as well as an allocation of other general and administrative expenses. Net underwriting income (loss) is
49
calculated as net premiums earned, less net loss and loss adjustment expenses incurred, less, acquisition costs and less underwriting expenses. The measure excludes, on a recurring basis: (1) net investment income; (2) any foreign exchange gains or losses; (3) corporate general and administrative expenses; (4) other income (expense) not related to underwriting, and (5) income taxes and income attributable to non-controlling interest. We exclude net investment income and foreign exchange gains or losses as we believe these are influenced by market conditions and other factors not related to underwriting decisions. We exclude corporate general and administrative expenses because these expenses are generally fixed and not incremental to or directly related to our underwriting operations. We believe all of these amounts are largely independent of our underwriting process and including them distorts the analysis of trends in our underwriting operations. Net underwriting income (loss) should not be viewed as a substitute for U.S. GAAP net income.
The reconciliations of net underwriting income (loss) to income (loss) before income taxes (the most directly comparable U.S. GAAP financial measure) on a consolidated basis is shown below:
Year ended December 31 | |||||||||||
2016 | 2015 | 2014 | |||||||||
($ in thousands) | |||||||||||
Income (loss) before income tax | $ | 47,209 | $ | (333,688 | ) | $ | 112,651 | ||||
Add (subtract): | |||||||||||
Investment (income) loss | (76,183 | ) | 281,924 | (122,575 | ) | ||||||
Other (income) expense | 935 | 3,413 | (2,987 | ) | |||||||
Corporate expenses | 9,225 | 8,782 | 8,003 | ||||||||
Amortization of ILW (1) | — | (2,340 | ) | — | |||||||
Net underwriting income (loss) | $ | (18,814 | ) | $ | (41,909 | ) | $ | (4,908 | ) | ||
(1) For the year ended December 31, 2015, amortization of an ILW, treated as a weather derivative swap under U.S. GAAP, was also included in underwriting income (loss). There was no amortization of ILWs for the year ended December 31, 2016.
Results of Operations
Years ended December 31, 2016, 2015 and 2014
Our primary financial goal is to increase the long-term value in fully diluted adjusted book value per share. For the year ended December 31, 2016, the fully diluted adjusted book value per share increased by $1.21 per share, or 5.5%, to $23.38 per share from $22.17 per share at December 31, 2015. For the year ended December 31, 2016, the basic adjusted book value per share increased by $1.11 per share, or 5.0%, to $23.40 per share from $22.29 per share at December 31, 2015.
For the year ended December 31, 2015, the fully diluted adjusted book value per share decreased by $8.59 per share, or 27.9%, to $22.17 per share from $30.76 per share at December 31, 2014. For the year ended December 31, 2015, the basic adjusted book value per share decreased by $8.88 per share, or 28.5%, to $22.29 per share from $31.17 per share at December 31, 2014.
For the year ended December 31, 2016, we reported net income of $44.9 million, compared to a net loss of $326.4 million reported for the year ended December 31, 2015. Our investment portfolio reported net income of $76.2 million, or a return of 7.2%, for the year ended December 31, 2016, compared to a net investment loss of $281.9 million, or a loss of 20.2%, for the same period in 2015. The underwriting loss (including underwriting related general and administrative expenses) for the year ended December 31, 2016 was $18.8 million, compared to an underwriting loss of $41.9 million reported for the year ended December 31, 2015. The underwriting loss for the 2016 fiscal year was primarily driven by $19.0 million loss from the novation of legacy construction defect liabilities. For the year ended December 31, 2016, our overall composite ratio (sum of losses incurred and acquisition costs, as a percentage of premiums earned) was 100.4% compared to 106.1% for the year ended December 31, 2015. Total general and administrative expenses increased for the year ended December 31, 2016 to $25.8 million from $23.4 million for the year ended December 31, 2015, primarily as a result of higher personnel expenses including severance costs and to a lesser degree higher information technology (“IT”) related expenses. The increase in general and administrative expenses was partially offset by a decrease in professional fees due to non-recurring professional fees incurred during the comparative year ended December 31, 2015.
50
For the year ended December 31, 2015, we reported net loss of $326.4 million, compared to net income of $109.6 million reported for the year ended December 31, 2014. Our investment portfolio reported net loss of $281.9 million, or a loss of 20.2%, for the year ended December 31, 2015, compared to net investment income of $122.6 million, or a return of 8.7%, for the same period in 2014. The underwriting loss (including underwriting related general and administrative expenses) for the year ended December 31, 2015 was $41.9 million compared to underwriting loss of $4.9 million reported for the year ended December 31, 2014. The underwriting loss for the 2015 fiscal year was driven by adverse loss development relating to construction defect losses on legacy general liability contracts written during the 2008 to 2011 underwriting years. For the year ended December 31, 2015, our overall composite ratio was 106.1% compared to 96.7% for the year ended December 31, 2014. General and administrative expenses decreased for the year ended December 31, 2015 to $23.4 million from $24.5 million for the year ended December 31, 2014, primarily as a result of lower quantitative bonuses accrued relating to prior underwriting years, partially offset by non-recurring professional fees incurred during the year ended December 31, 2015.
Gross Premiums Written
Details of gross premiums written are provided in the following table:
Year ended December 31 | |||||||||||||||||||||
2016 | 2015 | 2014 | |||||||||||||||||||
($ in thousands) | |||||||||||||||||||||
Frequency | $ | 494,292 | 92.2 | % | $ | 464,376 | 92.5 | % | $ | 295,861 | 91.3 | % | |||||||||
Severity | 41,780 | 7.8 | 37,748 | 7.5 | 28,162 | 8.7 | |||||||||||||||
Total | $ | 536,072 | 100.0 | % | $ | 502,124 | 100.0 | % | $ | 324,023 | 100.0 | % | |||||||||
As a result of our opportunistic underwriting philosophy, our reported quarterly premiums written may be volatile. Additionally, the composition of premiums written between frequency and severity business may vary from period to period depending on the specific market opportunities that we pursue.
Year ended December 31, 2016
For the year ended December 31, 2016 our gross premiums written increased by $33.9 million, or 6.8%, compared to the same period in 2015. For the year ended December 31, 2016, our frequency gross premiums written increased by $29.9 million, or 6.4%, compared to the same period in 2015. The notable changes in frequency gross premiums for the year ended December 31, 2016 were as follows:
Frequency Gross Premiums Written | ||||
Increase (decrease) for the year ended December 31, 2016 ($ in millions) | Line of business | Explanation | ||
$28.3 | Motor liability and motor physical damage | Increase primarily due to growth in the volume of underlying policies on existing private passenger motor contracts. | ||
$27.3 | Specialty -Financial | Increase primarily relating to in-force unearned premiums assumed at the inception of mortgage insurance contracts bound during 2016. There were no mortgage insurance contracts bound during the comparative period in 2015. | ||
$12.8 | Casualty -Workers’ Compensation | Increase primarily due to new contracts written during 2016 and late 2015. | ||
$(27.7) | Casualty -Professional | Decrease partially due to lawyers’ indemnity contracts that were either terminated during the period or not renewed, and partially due to a casualty professional liability contract renewed at a smaller share than the expiring contract written during 2015. | ||
$(7.8) | Property - Personal | Decrease primarily as a net result of the expiring Florida homeowners’ property quota share contracts that we terminated on a cut-off basis, and the unearned portion of the premiums written which was reversed and returned to the ceding insurer. The decrease in personal lines premiums written was partially offset by a new homeowners’ property contract entered into during 2016 that included in-force unearned premiums assumed at the inception of the contract. | ||
51
For the year ended December 31, 2016, severity premiums written increased by $4.0 million, or 10.7%, compared to the same period in 2015. The notable changes in severity gross premiums for the year ended December 31, 2016 were as follows:
Severity Gross Premiums Written | ||||
Increase (decrease) for the year ended December 31, 2016 ($ in millions) | Line of business | Explanation | ||
$3.7 | Casualty | New quota share severity contract written during the second half of 2015 and renewed in 2016, resulting in a full year’s premiums being recorded during 2016 compared to only half year’s premiums recorded during 2015. | ||
$2.5 | Property | The comparative 2015 severity premiums written included negative premiums of $2.5 million relating to premiums returned on an excess of loss catastrophe contract. No such return premiums were booked during 2016. | ||
$1.4 | Multi-line | The increase due to additional premiums received on a prior excess of loss contract that reported a full limit loss. During 2016, the ceding insurer for this contract reported its final settlement of losses arising from the U.S. sub-prime crisis, which resulted in the loss exceeding the insurer’s retention and triggering additional premiums as per the contract. | ||
$(3.3) | Multi-line | Decrease in premiums relating to catastrophe excess of loss contracts not renewed during 2016. | ||
Year ended December 31, 2015
During 2015, our gross premiums written increased by $178.1 million, or 55.0%, compared to the year ended December 31, 2014. For the year ended December 31, 2015, our frequency gross premiums written increased by $168.5 million, or 57.0%, compared to the same period in 2014. The notable changes in frequency gross premiums for the year ended December 31, 2015 were as follows:
Frequency Gross Premiums Written | ||||
Increase (decrease) for the year ended December 31, 2015 ($ in millions) | Line of business | Explanation | ||
$86.3 | Motor liability and motor physical damage | Increase primarily due to new private passenger motor contracts written during 2015 as well as growth in the volume of underlying policies on existing private passenger motor contracts. | ||
$41.3 | Casualty -Professional | Increase due to new quota share casualty contracts bound during 2015 and during the second half of 2014 | ||
$13.5 | Casualty - General liability | New quota share contracts written during 2015 and in the latter half of 2014. | ||
$12.9 | Specialty - Health | New quota share contracts written during 2015 and in the latter half of 2014. | ||
$11.9 | Casualty -Workers’ Compensation | New quota share contracts written during 2015 and in the latter half of 2014. | ||
$7.5 | Property - Commercial | New quota share contracts written during 2015 and in the latter half of 2014. | ||
$(11.6) | Property - Personal | Decrease primarily a result of a Florida homeowners’ contract which expired during 2015 and was not renewed. | ||
$6.7 | Other | Other insignificant movements. | ||
52
For the year ended December 31, 2015, severity premiums written increased by $9.6 million, or 34.0%, compared to the same period in 2014. The notable changes in severity gross premiums for the year ended December 31, 2015 were as follows:
Severity Gross Premiums Written | ||||
Increase (decrease) for the year ended December 31, 2015 ($ in millions) | Line of business | Explanation | ||
$14.7 | Casualty and Property | New severity quota share contracts written during 2015. | ||
$7.6 | Multi-line | Increase due to a multi-year severity quota share contract written during the second half of 2014. As a result, 2015 severity premiums included a full year’s premiums compared to only half year in the comparable period. | ||
$(10.1) | Property | Decrease in premiums relating to catastrophe excess of loss contracts not renewed during 2015. | ||
$(2.5) | Property | Negative premiums relating to premiums returned on an excess of loss catastrophe contract. This contract was previously expected to incur a loss and we had recorded a loss reserve which had triggered an additional premium. During the year ended December 31, 2015, we were informed that losses incurred by the cedent on this contract would not breach into our layer and as a result the additional premium was reversed along with the loss reserve, and a corresponding profit commission expense was recorded during 2015. | ||
Premiums Ceded
For the years ended December 31, 2016, 2015 and 2014, retrocessional premiums ceded were $10.0 million, $9.0 million and $13.5 million, respectively. For the year ended December 31, 2016, the increase in ceded premiums compared to the same period in 2015 was partially due to an excess of loss retrocession contract purchased during 2016 to reduce our exposure to catastrophe events.
For the year ended December 31, 2015, the decrease in ceded premiums compared to the same period in 2014 was partially due to a retroceded contract for catastrophic risk protection that expired at the end of 2014 and was not renewed. However, in the first quarter of 2015, we purchased an industry loss warranty derivative contract (“ILW”) to reduce our net exposure to natural peril catastrophe events. In accordance with U.S. GAAP, the ILW is recorded as a weather derivative swap and the cost of the ILW is amortized over the risk period and recorded in the consolidated statements of income as “other income (expense), net” and not as part of premiums ceded. For the year ended December 31, 2015, the ILW amortization expense was $2.3 million.
Net Premiums Written
Details of net premiums written are provided in the following table:
Year ended December 31 | |||||||||||||||||||||
2016 | 2015 | 2014 | |||||||||||||||||||
($ in thousands) | |||||||||||||||||||||
Frequency | $ | 485,777 | 92.3 | % | $ | 455,375 | 92.3 | % | $ | 286,121 | 92.1 | % | |||||||||
Severity | 40,280 | 7.7 | 37,748 | 7.7 | 24,409 | 7.9 | |||||||||||||||
Total | $ | 526,057 | 100.0 | % | $ | 493,123 | 100.0 | % | $ | 310,530 | 100.0 | % | |||||||||
The movement in net premiums written is the net result of the increases or decreases in gross premiums written and premiums ceded as explained in the preceding paragraphs.
53
Net Premiums Earned
Net premiums earned reflect the pro-rata inclusion into income of net premiums written over the risk period of the reinsurance contracts. Details of net premiums earned are provided in the following table:
Year ended December 31 | |||||||||||||||||||||
2016 | 2015 | 2014 | |||||||||||||||||||
($ in thousands) | |||||||||||||||||||||
Frequency | $ | 473,702 | 92.3 | % | $ | 380,565 | 93.2 | % | $ | 330,617 | 93.3 | % | |||||||||
Severity | 39,416 | 7.7 | 27,822 | 6.8 | 23,623 | 6.7 | |||||||||||||||
Total | $ | 513,118 | 100.0 | % | $ | 408,387 | 100.0 | % | $ | 354,240 | 100.0 | % | |||||||||
Premiums relating to quota share contracts and excess of loss contracts are earned over the contract period in proportion to the period of protection. Similarly, incoming unearned premiums are earned in proportion to the remaining period of protection.
Year ended December 31, 2016
For the year ended December 31, 2016, the frequency premiums earned increased by $93.1 million, or 24.5%, compared to the same period in 2015. The notable increases and decreases in frequency premiums earned were as follows:
Frequency Premiums Earned | ||||
Increase (decrease) for the year ended December 31, 2016 ($ in millions) | Line of business | Explanation | ||
$55.7 | Motor liability and motor physical damage | Increase primarily due to growth in the volume of underlying policies on existing private passenger motor contracts. | ||
$8.9 | Specialty -Financial | Increase primarily relating to in-force unearned premiums assumed at the inception of mortgage insurance contracts bound during 2016. There were no mortgage insurance contracts bound during the comparative period in 2015. | ||
$15.6 | Casualty -Workers’ Compensation | Increase primarily due to new contracts bound and to a lesser extent due to an increase in the underlying premiums on existing contracts. | ||
$12.7 | Casualty - General Liability | Increase in general liability premiums earned primarily due to an increase in the underlying premiums on a casualty contract and, to a lesser extent, due to new contracts written during the second half of 2015 and renewed in 2016. | ||
$(16.0) | Property - Personal | Decrease primarily as a net result of the expiring Florida homeowners’ property quota share contracts that we terminated on a cut-off basis during 2016. The decrease in personal lines premiums written was partially offset by new homeowners’ property quota share contracts entered into during fourth quarter of 2016. | ||
$16.2 | Other | Other insignificant increases in commercial property, professional liability and specialty health lines. | ||
54
For the year ended December 31, 2016, the severity net premiums earned increased by $11.6 million, or 41.7% compared to the same period in 2015. The notable increases and decreases in severity premiums earned were as follows:
Severity Premiums Earned | ||||
Increase (decrease) for the year ended December 31, 2016 ($ in millions) | Line of business | Explanation | ||
$5.3 | Casualty | Increase related to a new quota share severity contract written during the second half of 2015 and renewed in 2016. | ||
$4.3 | Property | Increase due to premiums earned on existing severity quota share contracts written during 2015 and renewed in 2016. | ||
$2.5 | Property | The comparative 2015 severity premiums written included negative premiums of $2.5 million relating to premiums returned on an excess of loss catastrophe contract. No comparable return premiums were booked during 2016. | ||
$1.4 | Multi-line | Increase due to additional premiums received on a prior excess of loss contract that reported a full limit loss. During 2016, the ceding insurer for this contract reported its final settlement of losses arising from the U.S. sub-prime crisis, which resulted in the loss exceeding the insurer’s retention and triggering additional premiums as per the contract. | ||
$(3.3) | Multi-line | Decrease in premiums relating to catastrophe excess of loss contracts not renewed during 2016. | ||
Year ended December 31, 2015
For the year ended December 31, 2015, the frequency net premiums earned increased by $49.9 million, or 15.1%, compared to the same period in 2014. The notable increases and decreases in frequency premiums earned were as follows:
Frequency Premiums Earned | ||||
Increase (decrease) for the year ended December 31, 2015 ($ in millions) | Line of business | Explanation | ||
$41.0 | Motor liability and motor physical damage | Increase primarily due to growth in the volume of underlying policies on existing private passenger motor contracts. | ||
$29.7 | Casualty -Professional | Increase due to new quota share casualty contracts bound during 2015 and during the second half of 2014. | ||
$11.1 | Casualty - General Liability | Increase in general liability premiums earned primarily due to new contracts written during 2015 and in the second half of 2014. | ||
$7.9 | Specialty - Health | Increase as a result of two new employers’ medical stop-loss contracts bound during 2015 and in the second half of 2014, partially offset by lower volume of premiums on existing employers’ medical stop-loss contracts. | ||
$4.5 | Casualty -Workers’ Compensation | Increase primarily due to new contracts bound and to a lesser extent due to an increase in the underlying premiums on existing contracts. | ||
$(11.3) | Casualty - Professional | Decrease relating to solicitors’ professional indemnity business due to a lower volume of underlying business written by the cedents. | ||
$(40.7) | Property - Personal | Decrease in personal property premiums partly due to a Florida homeowners’ contract not renewed upon expiration during 2015, and partly due to a lower share on other Florida homeowners’ contracts in effect during the current period compared to the same period in 2014. | ||
$7.7 | Other | Increases in commercial property, financial and other specialty lines. | ||
55
For the year ended December 31, 2015, the severity net premiums earned increased by $4.2 million, or 17.8%, compared to the same period in 2014
Severity Premiums Earned | ||||
Increase (decrease) for the year ended December 31, 2015 ($ in millions) | Line of business | Explanation | ||
$12.5 | Multi-line | Increase related to new quota share property and casualty severity contracts written during 2015 and the second half of 2014. | ||
$3.8 | Multi-line | Severity premiums earned for the year ended December 31, 2015 appear higher than the comparable period in 2014 because the 2014 earned premiums were net of $3.8 million expense relating to a retroceded contract for catastrophic risk protection. This retrocession contract was not renewed in 2015, and instead we purchased an ILW contract which, in accordance with U.S. GAAP, was recorded as a weather derivative swap and the cost of the ILW was recorded in the consolidated statements of income as “other income (expense), net”. For the year ended December 31, 2015, the ILW amortization expense was $2.3 million. | ||
$(2.5) | Property | Negative premiums relating to premiums returned on an excess of loss catastrophe contract. See explanation under “Severity Gross Premiums Written” table above. | ||
$(10.2) | Multi-line | Decrease in premiums relating to severity contracts not renewed or renewed with a smaller share during 2015. | ||
$0.6 | Other | Other insignificant movements. | ||
Loss and Loss Adjustment Expenses Incurred, Net
Net losses incurred include losses paid and changes in loss reserves, including reserves for IBNR, net of actual and estimated loss recoverables. Details of net losses incurred are provided in the following table:
Year ended December 31 | |||||||||||||||||||||
2016 | 2015 | 2014 | |||||||||||||||||||
($ in thousands) | |||||||||||||||||||||
Frequency | $ | 358,988 | 94.3 | % | $ | 314,459 | 99.2 | % | $ | 231,185 | 98.4 | % | |||||||||
Severity | 21,827 | 5.7 | 2,638 | 0.8 | 3,801 | 1.6 | |||||||||||||||
Total | $ | 380,815 | 100.0 | % | $ | 317,097 | 100.0 | % | $ | 234,986 | 100.0 | % | |||||||||
We establish reserves for each contract based on estimates of the ultimate cost of all losses, including losses incurred but not reported. These estimated ultimate reserves are based on reports received from ceding companies, industry data and historical experience as well as our own actuarial estimates. Quarterly, we review these estimates on a contract by contract basis and adjust them as we deem appropriate to reflect our best estimates based on updated information and our internal actuarial estimates. We expect losses incurred on our severity business to be volatile depending on the frequency and magnitude of catastrophic events from year to year.
Year ended December 31, 2016
For the year ended December 31, 2016, the total net losses incurred on frequency contracts increased by $44.5 million, or 14.2%, compared to the same period in 2015. The losses incurred for 2016 include $19.0 million relating to the legacy construction defect liabilities that were novated during 2016. By comparison, the losses incurred for 2015, included $51.6 million of losses related to these legacy construction defect liabilities. Effective June 30, 2016, we entered into a retrospective reinsurance agreement to transfer $52.5 million of construction defect liabilities to a third party for a consideration of $71.5 million. Effective September 30, 2016, the loss portfolio transfer was commuted and the contracts containing the construction defect liabilities were novated to a third party reinsurer for no further consideration.
The remainder of the increase in incurred losses on frequency contracts related primarily to the higher earned premiums recorded for the year ended December 31, 2016, compared to the same period in 2015.
56
For the year ended December 31, 2016, the losses incurred on severity contracts increased by $19.2 million, or 727.4% compared to the same period in 2015. The severity losses incurred included $4.4 million of loss reserves relating to the 2016 Canadian wildfires and Hurricane Matthew. These loss reserves were estimated based on information received from the cedents and are subject to change in future periods. In addition, the severity losses for the year ended December 31, 2016 included $4.5 million of losses paid on an excess of loss contract relating to the U.S. sub-prime crisis. The economic loss on this contract was partially offset by $1.4 million of additional premiums received under the terms of the contract which were recorded as earned premium during the period. Additionally. the losses incurred for the comparative year ended December 31, 2015 included the reversal of $5.1 million of loss reserves relating to favorable loss development on an excess of loss contract.
Losses incurred as a percentage of premiums earned (referred to as the loss ratio) fluctuates based on the mix of business, and any favorable or adverse loss development on our larger contracts. The loss ratios for the years ended December 31, 2016, 2015 and 2014, were as follows:
Year ended December 31 | |||||||||
2016 | 2015 | 2014 | |||||||
Frequency | 75.8 | % | 82.6 | % | 69.9 | % | |||
Severity | 55.4 | % | 9.5 | % | 16.1 | % | |||
Total | 74.2 | % | 77.6 | % | 66.3 | % | |||
We expect our severity loss ratio to vary, sometimes significantly, based on the change in mix of business between catastrophe and non-catastrophe business and quota share and excess of loss contracts.
The changes in frequency and severity loss ratios for the year ended December 31, 2016 were primarily due to the following:
Notable Frequency Loss Ratio Changes | ||
December 31, 2016 | ||
Line of business | Explanation | |
General Liability | A decrease in loss ratio as a result of lower adverse loss development on the legacy construction defect liabilities. Excluding the construction defect contracts, the overall loss ratios for our frequency business for the years ended December 31, 2016 and 2015, were 71.5% and 69.1%, respectively. | |
Property Personal | Increase in loss ratio due to adverse loss development on Florida homeowners’ insurance contracts as a result of deterioration of sinkhole claims and an increase in the practice of assignment of benefits by public adjusters and attorneys in Florida. | |
Motor - Property and Liability | Increase in loss ratio relating to private passenger motor contract due to increase in loss adjustment expenses on claims. | |
Specialty Health | Higher loss ratio due to favorable loss development recorded in the comparative period in 2015 on employers’ medical stop-loss contracts. | |
Professional | Decrease in loss ratio due to a higher proportion of professional liability premiums earned during 2016 from casualty contracts which have a lower loss ratio than other professional contracts such as solicitors’ indemnity. | |
Notable Severity Loss Ratio Changes | ||
December 31, 2016 | ||
Line of business | Explanation | |
Property - Commercial | Increase in loss ratio due to $4.4 million of reserves relating to 2016 natural catastrophe events - Canadian wildfires and Hurricane Matthew. | |
Casualty - General liability and Professional | Increase in loss ratio due to a prior year excess of loss contract that reported a full limit loss arising from the U.S. sub-prime crisis. | |
Property - Commercial | Higher loss ratio because the comparative year ended December 31, 2015 included the reversal of $5.1 million of loss reserves relating to favorable loss development on an excess of loss contract. | |
57
Year ended December 31 2015
For the year ended December 31, 2015, the total net losses incurred on frequency contracts increased by $83.3 million, or 36.0%, compared to the same period in 2014. The increase was driven primarily by $51.6 million of additional loss reserves recorded during the year ended December 31, 2015 on two legacy general liability contracts that are currently in run-off. One of the general liability contracts, which was in effect from 2008 to 2011, included general contractors’ liability with the majority of exposure relating to single-family homes. During 2015, we completed an in-depth analysis, with the assistance of a third party expert, of the construction defect claims reported and the potential for claims not yet reported on this contract. Based on this assessment, we revised the actuarial methodology used for reserving these claims, which resulted in an increase in IBNR reserves of $36.9 million recorded in the third quarter of 2015. The other general liability contract, which was written in 2010, included general contractors’ liability with the majority of exposure relating to construction defect claims in the western United States. During the second quarter of 2015, we experienced adverse development on known claims, which caused us to re-evaluate the expected value of known claims as well as the value of claims still to be filed. Additionally, we re-evaluated the claims handling costs associated with this contract and increased our provision for case reserves, IBNR reserves and the cost of claims handling by $14.7 million during the second quarter of 2015. Some of our prior years’ Florida homeowners’ contracts also contributed to the increase in losses incurred due to unfavorable loss development of $9.3 million (see Note 7 of the consolidated financial statements for details). The remainder of the increase in incurred losses related primarily to the higher earned premiums recorded for the year ended December 31, 2015 compared to the same period in 2014.
For the year ended December 31, 2015, the losses incurred on severity contracts decreased by $1.2 million, primarily due to the elimination of $5.1 million of loss reserves resulting from favorable loss development on an excess of loss contract. The decrease in severity losses incurred was partially offset by an increase related to the mix of severity business.
The changes in frequency and severity loss ratios for the year ended December 31, 2015 were primarily due to the following:
Notable Frequency Loss Ratio Changes | ||
December 31, 2015 | ||
Line of business | Explanation | |
General Liability | An increase in loss ratio as a result of adverse loss development on the legacy construction defect liabilities discussed above. | |
Property Personal | Increase in loss ratio due to adverse loss development on Florida homeowners’ insurance contracts as a result of sinkhole losses and higher than anticipated water damage claims from rainstorms during 2014. | |
Motor - Property and Liability | Increase in loss ratio relating to private passenger motor contract due to increase in loss adjustment expenses on claims. | |
Specialty Health | Decrease in loss ratio due to favorable loss development on the employers’ medical stop-loss contracts, compared to adverse losses recorded during the comparable period in 2014. | |
Professional | Decrease in loss ratio due to a shift in the mix of business from predominantly solicitors’ indemnity contracts to a more diversified professional liability book of business. | |
Notable Severity Loss Ratio Changes | ||
December 31, 2015 | ||
Line of business | Explanation | |
Property - Commercial | Lower ratio due to the elimination of $5.1 million of loss reserves on an excess of loss contract entered into in 2008. Excluding this contract, the severity loss ratio for the year ended December 31, 2015 was 25.4% compared to 16.1% for the same period in 2014. | |
Other | Increase in severity loss ratio due to the change in mix of severity business with a higher proportion of quota share severity contracts in effect during the year ended December 31, 2015 compared to the same period in 2014. | |
58
Losses incurred can be further broken down into losses paid and changes in loss and loss adjustment expense reserves as follows:
Year ended December 31 | |||||||||||||||||||||||||||||||||||
2016 | 2015 | 2014 | |||||||||||||||||||||||||||||||||
Gross | Ceded | Net | Gross | Ceded | Net | Gross | Ceded | Net | |||||||||||||||||||||||||||
($ in thousands) | |||||||||||||||||||||||||||||||||||
Losses paid (recovered) | $ | 374,270 | $ | (1,600 | ) | $ | 372,670 | $ | 274,713 | $ | (9,851 | ) | $ | 264,862 | $ | 303,272 | $ | (9,695 | ) | $ | 293,577 | ||||||||||||||
Change in loss and loss adjustment expense reserves | 7,484 | 661 | 8,145 | 44,080 | 8,155 | 52,235 | (63,897 | ) | 5,306 | (58,591 | ) | ||||||||||||||||||||||||
Total | $ | 381,754 | $ | (939 | ) | $ | 380,815 | $ | 318,793 | $ | (1,696 | ) | $ | 317,097 | $ | 239,375 | $ | (4,389 | ) | $ | 234,986 | ||||||||||||||
For the year ended December 31, 2016, the change in loss reserves included losses novated relating to construction defect liabilities. For the year ended December 31, 2016, our net loss reserves on prior period contracts increased by $35.5 million primarily related to the adverse loss development on the construction defect claims. For the year ended December 31, 2015, our net loss reserves on prior period contracts increased by $50.3 million, which primarily related to adverse loss development on the construction defect liabilities. For the year ended December 31, 2014, our net loss reserves on prior period contracts increased by $18.2 million, which primarily related to adverse loss development on general liability, commercial motor, solicitors’ professional liability and employers’ medical stop-loss businesses, partially offset by favorable loss development on private passenger automobile business.
For further details on prior period loss developments, please refer to Note 7 “Loss and loss adjustment expense reserves” of the consolidated financial statements.
Acquisition Costs, Net
Acquisition costs represent the amortization of commission and brokerage expenses incurred on contracts written as well as profit commissions and other underwriting expenses which are expensed when incurred. Deferred acquisition costs are limited to the amount of commission and brokerage expenses that are expected to be recovered from future earned premiums and anticipated investment income. Details of acquisition costs are provided in the following table:
Year ended December 31 | |||||||||||||||||||||
2016 | 2015 | 2014 | |||||||||||||||||||
($ in thousands) | |||||||||||||||||||||
Frequency | $ | 125,388 | 93.2 | % | $ | 106,411 | 91.6 | % | $ | 103,008 | 95.7 | % | |||||||||
Severity | 9,146 | 6.8 | 9,796 | 8.4 | 4,657 | 4.3 | |||||||||||||||
Total | $ | 134,534 | 100.0 | % | $ | 116,207 | 100.0 | % | $ | 107,665 | 100.0 | % | |||||||||
We expect acquisition costs to be higher for frequency business than for severity business. Acquisition cost as a percentage of net premiums earned (referred to as acquisition cost ratio) are generally higher for our frequency business than for our severity business, but fluctuate based on the mix of business. The acquisition cost ratios for the years ended December 31, 2016, 2015 and 2014, were as follows:
Year ended December 31 | |||||||||
2016 | 2015 | 2014 | |||||||
Frequency | 26.5 | % | 28.0 | % | 31.2 | % | |||
Severity | 23.2 | % | 35.2 | % | 19.7 | % | |||
Total | 26.2 | % | 28.5 | % | 30.4 | % | |||
59
Year ended December 31 2016
The changes in the frequency and severity acquisition cost ratios for the year ended December 31, 2016, compared to the same period in 2015, were primarily due to the following:
Notable Frequency Acquisition Cost Ratio Changes | ||
December 31, 2016 | ||
Line of business | Explanation | |
Motor - Property and Liability | A decrease in the sliding scale ceding commissions on our private passenger motor contracts which experienced adverse loss development during 2016. | |
Professional | Increase due to a shift in the mix of professional liability business from predominantly solicitors’ indemnity contracts with lower acquisition cost ratios to casualty professional liability business, which has a higher acquisition cost ratio. | |
Other | A decrease due to the change in mix of business. The Florida homeowners’ contracts terminated during 2016 had a higher acquisition cost ratio. Meanwhile a higher proportion of the earned premiums related to the motor business, which has a lower acquisition cost ratio. | |
Notable Severity Acquisition Cost Ratio Changes | ||
December 31, 2016 | ||
Line of business | Explanation | |
Property - Commercial | Decrease was due to the 2015 comparative ratio being unusually high due to profit commission of $3.4 million recorded on an excess of loss contract. The profit commission was triggered by the elimination of loss reserves on this contract based on updated information received from the insurer. | |
Year ended December 31 2015
The changes in the frequency and severity acquisition cost ratios for the year ended December 31, 2015, compared to the same period in 2014, were primarily due to the following:
Notable Frequency Acquisition Cost Ratio Changes | ||
December 31, 2015 | ||
Line of business | Explanation | |
Motor - Property and Liability | The private passenger motor contracts in force during 2015 reported lower ceding commissions than the prior year, which also contributed to a lower frequency acquisition cost ratio for the year ended December 31, 2015. | |
Property - Personal | Decrease due to Florida homeowners’ insurance contracts that contain sliding scale ceding commissions, which decreased during the year ended December 31, 2015 as a result of adverse loss development on those contracts. | |
Professional | Decrease was partly offset by a change in mix of professional liability contracts that carry higher ceding commission rates than the predominantly solicitors’ professional indemnity contracts in force during the year ended 2014. | |
Notable Severity Acquisition Cost Ratio Changes | ||
December 31, 2015 | ||
Line of business | Explanation | |
Property - Commercial | Increase due to profit commission of $3.4 million recorded on an excess of loss contract during 2015. The profit commission was triggered by the elimination of loss reserves on this contract based on updated information received from the insurer. | |
General and Administrative Expenses
Our total general and administrative expenses for the years ended December 31, 2016, 2015 and 2014, were $25.8 million, $23.4 million, and $24.5 million, respectively. General and administrative expenses for the years ended December 31, 2016, 2015 and 2014 included $4.0 million, $4.3 million and $4.0 million, respectively, for the expensing of the fair value of stock options, RSUs and restricted stock granted to employees and directors, net of forfeitures.
60
Details of general and administrative expenses are provided in the following table:
Year ended December 31 | |||||||||||
2016 | 2015 | 2014 | |||||||||
($ in thousands) | |||||||||||
Underwriting expenses | $ | 16,583 | $ | 14,652 | $ | 16,497 | |||||
Corporate expenses | 9,225 | 8,782 | 8,003 | ||||||||
General and administrative expenses | $ | 25,808 | $ | 23,434 | $ | 24,500 | |||||
Effective from January 1, 2016, we have broken out general and administrative expenses into “Underwriting expenses” and “Corporate expenses”. Underwriting expenses include those expenses directly related to underwriting activities which are not eligible to be capitalized, as well as an allocation of other general and administrative expenses. Corporate expenses include those costs associated with operating as a publicly listed entity as well as an allocation of other general and administrative expenses. As a result of this change in expense allocations, the prior period comparative balances for underwriting expenses and corporate expenses in the above table have been reclassified to conform to the current period presentation.
For the year ended December 31, 2016, underwriting expenses increased primarily due to higher personnel expenses and to a lesser degree higher IT related expenses. The increase in corporate expenses for the year ended December 31, 2016, compared to the same period in 2015, was mainly due to severance costs accrued during 2016, partially offset by a decrease in professional fees due to non-recurring professional fees incurred during 2015.
For the year ended December 31, 2015, underwriting expenses decreased primarily due to a decrease in bonuses relating to prior underwriting years. The increase in corporate expenses for the year ended December 31, 2015, compared to the same period in 2014, was mainly due to non-recurring professional fees incurred during 2015.
Net Investment Income (Loss)
A summary of our net investment income (loss) is as follows:
Year ended December 31 | ||||||||||||
2016 | 2015 | 2014 | ||||||||||
($ in thousands) | ||||||||||||
Realized gains (losses) | $ | (113,836 | ) | $ | 22,227 | $ | 352,133 | |||||
Change in unrealized gains and losses | 209,993 | (265,401 | ) | (187,753 | ) | |||||||
Investment related foreign exchange gains (losses) | 2,988 | (3,725 | ) | 14,797 | ||||||||
Interest and dividend income, net of withholding taxes | 23,915 | 15,313 | 31,423 | |||||||||
Interest, dividend and other expenses | (22,334 | ) | (31,092 | ) | (38,892 | ) | ||||||
Investment advisor compensation | (24,543 | ) | (19,246 | ) | (49,133 | ) | ||||||
Net investment income (loss) | $ | 76,183 | $ | (281,924 | ) | $ | 122,575 | |||||
Investment returns relating to our investment portfolio managed by DME Advisors are calculated monthly and compounded to calculate the quarterly and annual returns. The resulting actual investment income (loss) may vary depending on cash flows into and out of the investment account.
For the year ended December 31, 2016, investment income, net of fees and expenses, resulted in a gain of 7.2% on our investments managed by DME Advisors, compared to a loss of (20.2)% and a gain of 8.7% for the years ended December 31, 2015 and 2014, respectively. The investment gain for the year ended December 31, 2016 was primarily driven by our long portfolio, which reported an investment gain of 18.7%. Additionally, macro positions reported a gain of 2.0% primarily related to gold and natural gas. The short portfolio reported a loss of 11.2% for the year ended December 31, 2016.
The most significant contributors to the investment gains for the year ended December 31, 2016 were long positions in CONSOL Energy (CNX), Chemours (CC), Time Warner (TWX), General Motors (GM), Michael Kors (KORS) and Apple (AAPL), and short positions in Athenahealth (ATHN) and a group of perceived overpriced momentum driven positions which we
61
refer to as the “bubble basket”. The most significant detractors for the year ended December 31, 2016 were short positions in certain oil fracking companies, as well as Amazon (AMZN), Caterpillar (CAT) and Martin Marietta Materials (MLM). The investment loss for the year ended December 31, 2015 was primarily driven by our long portfolio, which reported an investment loss of 17.2%. Three large long investments (CNX, Micron Technology (MU) and SunEdison (SUNE)), resulted in a 14.9% investment loss. Additionally, macro positions and other expenses accounted for 1.9% and 1.5%, respectively, of the investment loss. The short portfolio reported a gain of 0.4% for the year ended December 31, 2015.
For the year ended December 31, 2016, included in “investment advisor compensation” was $16.3 million (2015: $19.2 million, 2014: $20.6 million) relating to management fees paid to DME Advisors. For the year ended December 31, 2016, $8.2 million of performance compensation was recorded on investment returns for this period (2015: $0.0 million, 2014: $28.5 million). Due to the investment loss for the year ended December 31, 2015, based on the advisory agreement, the performance compensation for subsequent years is reduced to 10% of investment income until all the investment losses have been recouped and an additional amount equal to 150% of the investment loss is earned.
We expect our investment income, including realized and unrealized gains (or losses), to fluctuate from period to period. Fluctuations in realized and unrealized gains (or losses) are a function of both the market performance of the securities held in our investment portfolio, and the timing of additions to and dispositions of securities in our investment portfolio. Our investment advisor uses its discretion over when a gain (or loss) is realized on a particular investment. We believe that net investment income, which includes both realized and unrealized gains (or losses), is the best way to assess our investment performance, rather than analyzing the realized gains (or losses) and unrealized gains (or losses) separately.
For the years ended December 31, 2016, 2015 and 2014, the gross investment returns on our investment portfolio managed by DME Advisors (excluding investment performance compensation) were 7.8%, (20.2)% and 10.8%, respectively, and were comprised of the following:
Year ended December 31 | ||||||||
2016 | 2015 | 2014 | ||||||
Long portfolio gains (losses) | 18.7 | % | (17.2 | )% | 17.8 | % | ||
Short portfolio gains (losses) | (11.2 | )% | 0.4 | % | (4.2 | )% | ||
Macro gains (losses) | 2.0 | % | (1.9 | )% | (1.1 | )% | ||
Other income and expenses 1 | (1.7 | )% | (1.5 | )% | (1.7 | )% | ||
Gross investment return | 7.8 | % | (20.2 | )% | 10.8 | % | ||
Net investment return | 7.2 | % | (20.2 | )% | 8.7 | % | ||
1 Excludes performance compensation but includes management fees.
DME Advisors and its affiliates manage and expect to manage other client accounts besides ours, some of which have investment objectives similar to ours. To comply with Regulation FD, our investment returns are posted on our website on a monthly basis. Additionally, our website (www.greenlightre.ky) provides the names of the largest disclosed long positions in our investment portfolio as of the last business day of the month of the relevant posting, as well as information on our long and short exposures. Although DME Advisors discloses all investment positions to us, it may choose not to disclose certain positions to its other clients in order to protect its investment strategy. Therefore, we present on our website the relevant largest long positions and exposure information as disclosed by DME Advisors or its affiliates to their other clients.
Income Taxes
We are not obligated to pay taxes in the Cayman Islands on either income or capital gains. We have been granted an exemption by the Governor-In-Cabinet from any income taxes that may be imposed in the Cayman Islands for a period of 20 years, expiring on February 1, 2025.
GRIL is incorporated in Ireland and, therefore, is subject to the Irish corporation tax. GRIL is expected to be taxed at a rate of 12.5% on its taxable trading income, and 25% on its non-trading income, if any.
Verdant is incorporated in Delaware and, therefore, is subject to taxes in accordance with the U.S. federal rates and regulations prescribed by the Internal Revenue Service. Verdant’s taxable income is expected to be taxed at a rate of 35%.
As of December 31, 2016, a deferred tax asset of $1.3 million (2015: $1.8 million) was included in other assets on the consolidated balance sheets. The decrease in deferred tax asset during the year ended December 31, 2016, primarily resulted from
62
the utilization of operating losses carried forward relating to GRIL due to taxable income for the 2016 year. Based on the timing of the reversal of the temporary differences and likelihood of generating sufficient taxable income to realize the future tax benefit, management believes it is more likely than not that the deferred tax asset will be fully realized in the future and therefore no valuation allowance has been recorded. The Company has not taken any other tax positions that management believes are subject to uncertainty or that are reasonably likely to have a material impact to the Company, GRIL or Verdant.
Ratio Analysis
Due to the opportunistic and customized nature of our underwriting operations, we expect to report different loss and expense ratios in both our frequency and severity businesses from period to period.
The following table provides the ratios:
Year ended December 31 | ||||||||||||||||||||||||||
2016 | 2015 | 2014 | ||||||||||||||||||||||||
Frequency | Severity | Total | Frequency | Severity | Total | Frequency | Severity | Total | ||||||||||||||||||
Loss ratio | 75.8 | % | 55.4 | % | 74.2 | % | 82.6 | % | 9.5 | % | 77.6 | % | 69.9 | % | 16.1 | % | 66.3 | % | ||||||||
Acquisition cost ratio | 26.5 | 23.2 | 26.2 | 28.0 | 35.2 | 28.5 | 31.2 | 19.7 | 30.4 | |||||||||||||||||
Composite ratio | 102.3 | % | 78.6 | % | 100.4 | % | 110.6 | % | 44.7 | % | 106.1 | % | 101.1 | % | 35.8 | % | 96.7 | % | ||||||||
Underwriting expense ratio | 3.2 | 4.2 | 4.7 | |||||||||||||||||||||||
Combined ratio | 103.6 | % | 110.3 | % | 101.4 | % | ||||||||||||||||||||
The loss ratio is calculated by dividing loss and loss adjustment expenses incurred by net premiums earned. We expect that the loss ratio will be volatile for our severity business and may exceed that of our frequency business in certain periods. Given that we opportunistically underwrite a concentrated portfolio across several lines of business that have varying expected loss ratios, we can expect there to be significant annual variations in the loss ratios reported from our frequency business. In addition, the loss ratios for both frequency and severity business can vary depending on the mix of the lines of business written.
The acquisition cost ratio is calculated by dividing acquisition costs by net premiums earned. We expect that this ratio will generally be higher for our frequency business than for our severity business.
The composite ratio is the ratio of underwriting losses incurred, loss adjustment expenses and acquisition costs, excluding underwriting related general and administrative expenses, to net premiums earned. Similar to the loss ratio, we expect that this ratio will be more volatile for our severity business depending on loss activity in any particular period.
The combined ratio is the sum of the composite ratio and the underwriting expense ratio. The combined ratio measures the total profitability of our underwriting operations and does not take into account corporate expenses, net investment income or any foreign exchange gain or loss. Given the nature of our unique underwriting strategy, we expect that our combined ratio may also be volatile from period to period.
Prior to January 1, 2016, the combined ratio included all general and administrative expenses. However, in order to more accurately reflect the underwriting results in the combined ratio, effective from January 1, 2016, we have included only underwriting related expenses in the combined ratio calculation. Underwriting expenses include those expenses directly related to underwriting activities as well as an allocation of other general and administrative expenses. Therefore, the underwriting expense ratio is the ratio of underwriting expenses to net premiums earned. In addition, the underwriting expense ratio includes any gain or loss resulting from deposit accounted contracts as well as any amortized cost of weather derivative swaps entered into as part of our underwriting activities. The underwriting expense ratios and combined ratios for the prior period have been reclassified in the above table for comparability purposes. The revised calculation resulted in the combined ratios decreasing by 1.8%, 2.1% and 2.2% for the years ended December 31, 2016, 2015 and 2014, respectively, compared to the previous calculation method.
63
Financial Condition
Investments; Financial Contracts Receivable; Financial Contracts Payable; Due to Prime Brokers
Our long investments and financial contracts receivable reported in the consolidated balance sheets as of December 31, 2016, were $1,098.9 million, compared to $1,077.4 million as of December 31, 2015, an increase of $21.5 million, or 2.0%. The significant changes in our long investments and financial contracts receivable were as follows:
Increase (decrease) as of December 31, 2016 ($ in millions) | Line of business | Explanation | ||
$39.3 | Commodities - Gold | Increase primarily due to an increase in physical gold holdings and to a lesser extent due to increases in unrealized gains. | ||
$63.2 | Financial contracts receivable | Increase in derivative assets partially due to purchase of additional call options, commodity swaps and total return swaps, and partially due to an increase in unrealized gains relating to the derivatives held as of December 31, 2016. | ||
$(62.2) | Equities - Listed | Decrease primarily due to disposal of equity securities during 2016, partially offset by an increase in unrealized gains due to price appreciation. | ||
$(18.5) | Non U.S. Sovereign debt | Decrease due to non U.S. sovereign debt instruments disposed during 2016. | ||
As of December 31, 2016, our exposure to long investments increased to 99.5%, compared to 89.5% as of December 31, 2015. This exposure analysis is conducted on a delta-adjusted basis and excludes macro positions which consist of CDS, interest rate swaps, sovereign debt, currencies, commodities, volatility indexes and derivatives on any of these instruments.
Financial contracts payable as of December 31, 2016 decreased by $26.0 million, or 92.1%, compared to December 31, 2015, primarily due to the disposal of total return equity swap contracts that were in a payable position at the end of the 2015 year. To a lesser extent, the decrease in financial contracts payable was due to commodity swap contracts that were in a payable position as of December 31, 2015, moving to a receivable position as of December 31, 2016 due to unrealized gains.
From time to time, we incur indebtedness to our prime brokers to implement our investment strategy in accordance with our investment guidelines. Additionally, under term margin agreements we pledge certain investment securities to borrow cash from prime brokers in order to provide collateral for trust accounts and for some of our letters of credit outstanding. The borrowed amount is held in accounts for the benefit of the beneficiaries and is included in the restricted cash and cash equivalents balance on the consolidated balance sheet. As of December 31, 2016, we had borrowed $319.8 million (2015: $396.5 million) from our prime brokers for investing activities and to provide collateral for short positions and trust accounts and some of our letters of credit outstanding. The decrease in the amount due to prime brokers was primarily a result of the lower level of borrowing required for the current composition of the investment portfolio as of December 31, 2016.
In accordance with Greenlight Re’s investment guidelines, DME Advisors may employ up to 15% (GRIL: 5%) net margin leverage for extended periods of time, and up to 30% (GRIL: 20%) net margin leverage for periods of less than 30 days.
Our investment portfolio, including any derivatives, is valued at fair value and any unrealized gains or losses are reflected in net investment income (loss) in the consolidated statements of income. As of December 31, 2016, 88.3% (2015: 90.9%) of our investment portfolio (excluding restricted and unrestricted cash and cash equivalents) was comprised of investments valued based on quoted prices in actively traded markets (Level 1), 10.7% (2015: 8.0%) was comprised of securities valued based on observable inputs other than quoted prices (Level 2) and 0.7% (2015: 0.5%) was comprised of securities valued based on non-observable inputs (Level 3). As of December 31, 2016, 0.3% (2015: 0.6%) of our investment portfolio was comprised of private equity funds valued using the funds’ net asset values as a practical expedient. (Refer to Note 3 “Financial Instruments” in the consolidated financial statements for details of transfers into and out of Level 3 during the year ended December 31, 2016).
In determining whether a market for a financial instrument is active or inactive, we obtain information from DME Advisors, based on feedback it receives from executing brokers, market makers, analysts and traders to assess the level of market activity and available liquidity for any given financial instrument. Where a financial instrument is valued based on broker quotes, DME Advisors requests multiple quotes. The ultimate value is based on an average of the quotes obtained. Broker quoted prices are generally not adjusted in determining the ultimate values and are obtained with the expectation of the quotes being binding. As of December 31, 2016, $140.1 million (2015: $129.8 million) of our investments (longs, shorts and derivatives) were valued based on broker quotes, of which $137.6 million (2015: $128.0 million) were based on broker quotes
64
that utilized observable market information and classified as Level 2 fair value measurements, and $2.4 million (2015: $1.8 million) were based on broker quotes that utilized non-observable inputs and classified as Level 3 fair value measurements.
Non-observable inputs used by our investment advisor include the use of investment manager statements and management estimates based on third party appraisals of underlying assets for valuing private equity investments.
Securities Sold, Not Yet Purchased; Restricted Cash and Cash Equivalents
As of December 31, 2016, our securities sold, not yet purchased were $859.9 million compared to $882.9 million at December 31, 2015. Our short exposure was 72.9% as of December 31, 2016, compared to 74.0% at December 31, 2015. This exposure analysis is conducted on a delta-adjusted basis and excludes macro positions which consist of CDS, interest rate swaps, sovereign debt, currencies, commodities, volatility indexes and derivatives on any of these instruments.
Unlike long investments, short sales theoretically involve unlimited loss potential since there is no limit as to how high the market price of a security may rise. While it is not possible to list all of the reasons why a loss on a short sale may occur, a loss on a short sale may be caused by one or more of the following factors:
• | Fluctuations in the share price due to an overall positive investment market; |
• | Sudden unexpected changes in the underlying business model of the issuer; |
• | Changes in laws and regulations relating to short sales; |
• | Press releases and earnings guidance issued by the issuer; |
• | A merger or acquisition of the issuer at a price in excess of the current share price; |
• | The shares of the issuer becoming difficult to borrow; or |
• | A short squeeze. |
Given the various scenarios under which a loss may occur on a short sale, it is not possible to quantify the risk and uncertainty of loss relating to short sales. However, DME Advisors typically performs a detailed analysis prior to entering into a short sale. Thereafter, the investment is routinely monitored by DME Advisors. As of December 31, 2016, Greenlight Re’s investment guidelines limit any single investment from constituting more than 20% of the portfolio (10% for GRIL’s portfolio) at any given time, which limits the potential adverse impact on our results of operations and financial position from any one position.
As of December 31, 2016, restricted cash included $859.9 million relating to collateral for securities sold, not yet purchased, compared to $882.9 million as of December 31, 2015.
Overall, our restricted cash decreased by $33.9 million, or 2.7%, from $1,236.6 million to $1,202.7 million, partially due to the decrease in short securities which decreased by $23.0 million and a reduction in swap counterparty collateral which decreased by $30.2 million. The decrease in restricted cash was partially offset by an increase in collateral for trusts and letters of credit outstanding as of December 31, 2016.
Reinsurance Balances Receivable; Deferred Acquisition Costs, Net; Unearned Premium Reserves
At December 31, 2016, reinsurance balances receivable were $219.1 million, compared to $187.9 million as of December 31, 2015, an increase of $31.2 million, or 16.6%. The increase in reinsurance balances receivable was primarily attributable to premiums on contracts currently in force including net premiums held by ceding insurers on certain deals that allow for funds to be withheld by the ceding insurer. The reinsurance balances receivable are fully collectible and no allowance for bad debt was considered necessary at December 31, 2016.
At December 31, 2016, the change in deferred acquisition costs (net of retrocession) compared to December 31, 2015 was insignificant. We evaluate the recoverability of deferred acquisition costs by determining if the sum of future earned premiums and anticipated investment income is greater than the expected future claims and expenses. If a loss is probable on the unexpired portion of policies in force, a premium deficiency loss is recognized. As of December 31, 2016, we believe that the deferred acquisition costs were fully recoverable and no premium deficiency loss was recorded.
Notes Receivable
As of December 31, 2016, notes receivable increased by $8.6 million to $33.7 million from $25.1 million as of December 31, 2015. The increase was primarily related to additional funds advanced under an existing note receivable
65
agreement. For further details on notes receivable, refer to Note 2 “Significant Accounting Policies” in the consolidated financial statements.
Loss and Loss Adjustment Expense Reserves; Loss and Loss Adjustment Expenses Recoverable
Reserves for loss and loss adjustment expenses were comprised of the following:
December 31, 2016 | December 31, 2015 | ||||||||||||||||||||||
Case Reserves | IBNR | Total | Case Reserves | IBNR | Total | ||||||||||||||||||
($ in thousands) | |||||||||||||||||||||||
Frequency | $ | 81,676 | $ | 183,134 | $ | 264,810 | $ | 103,347 | $ | 165,740 | $ | 269,087 | |||||||||||
Severity | 17,139 | 24,692 | 41,831 | 8,188 | 28,722 | 36,910 | |||||||||||||||||
Total | $ | 98,815 | $ | 207,826 | $ | 306,641 | $ | 111,535 | $ | 194,462 | $ | 305,997 | |||||||||||
During the year ended December 31, 2016, the frequency loss reserves decreased by $4.3 million, or 1.6%, to $264.8 million from $269.1 million as of December 31, 2015. The decrease was mainly in case reserves which decreased by $21.7 million, primarily related to the novation of the legacy construction defect liabilities and partially offset by an increase in reserves on premiums earned during the period on active frequency contracts.
During the year ended December 31, 2016, the severity loss reserves increased by $4.9 million, or 13.3%. The severity IBNR decreased primarily due to the final settlement of sub-prime crisis losses of $4.5 million paid on an excess of loss contract. The severity case reserves increased by $9.0 million partially due to the 2016 Canadian wildfires and Hurricane Matthew losses and partially due to the movement of reserves from IBNR to case reserves based on reporting received from the cedents. The increase was partially offset by the reduction of previously recorded case reserves due to the final loss payment made on the 2010 Christchurch earthquake.
The following table presents the incurred and paid claims development for each of the underwriting years from 2007 to 2016:
Incurred claims and allocated claim adjustment expenses, net of reinsurance | |||||||||||||||||||||||||||||||
For the years ended December 31, | |||||||||||||||||||||||||||||||
Underwriting Year | 2007 | 2008 | 2009 | 2010 | 2011 | 2012 | 2013 | 2014 | 2015 | 2016 | |||||||||||||||||||||
($ in thousands) | |||||||||||||||||||||||||||||||
2007 | $ | 9,983 | $ | 35,876 | $ | 53,770 | $ | 52,846 | $ | 52,882 | $ | 52,105 | $ | 56,074 | $ | 56,073 | $ | 56,071 | $ | 60,495 | |||||||||||
2008 | 35,728 | 86,544 | 94,775 | 103,100 | 106,686 | 106,858 | 110,078 | 110,636 | 110,212 | ||||||||||||||||||||||
2009 | 57,703 | 161,941 | 196,953 | 213,617 | 210,245 | 212,881 | 218,917 | 218,703 | |||||||||||||||||||||||
2010 | 64,829 | 197,412 | 244,708 | 254,853 | 267,328 | 296,222 | 316,544 | ||||||||||||||||||||||||
2011 | 62,145 | 206,404 | 334,598 | 334,494 | 349,348 | 349,744 | |||||||||||||||||||||||||
2012 | 71,632 | 174,404 | 191,582 | 189,779 | 190,610 | ||||||||||||||||||||||||||
2013 | 174,175 | 290,965 | 292,908 | 293,181 | |||||||||||||||||||||||||||
2014 | 77,812 | 237,136 | 264,888 | ||||||||||||||||||||||||||||
2015 | 102,606 | 347,171 | |||||||||||||||||||||||||||||
2016 | 79,050 | ||||||||||||||||||||||||||||||
Total | $ | 2,230,598 | |||||||||||||||||||||||||||||
66
Cumulative paid claims and allocated claim adjustment expenses, net of reinsurance | |||||||||||||||||||||||||||||||
For the years ended December 31, | |||||||||||||||||||||||||||||||
Underwriting Year | 2007 | 2008 | 2009 | 2010 | 2011 | 2012 | 2013 | 2014 | 2015 | 2016 | |||||||||||||||||||||
($ in thousands) | |||||||||||||||||||||||||||||||
2007 | $ | 573 | $ | 6,007 | $ | 18,917 | $ | 26,680 | $ | 32,033 | $ | 38,097 | $ | 38,279 | $ | 38,284 | $ | 38,285 | $ | 47,285 | |||||||||||
2008 | 8,272 | 37,187 | 72,487 | 84,643 | 91,799 | 95,913 | 99,625 | 101,513 | 108,299 | ||||||||||||||||||||||
2009 | 14,214 | 83,737 | 150,229 | 178,071 | 190,460 | 203,099 | 206,435 | 217,443 | |||||||||||||||||||||||
2010 | 18,866 | 118,558 | 175,577 | 205,265 | 227,634 | 248,179 | 314,203 | ||||||||||||||||||||||||
2011 | 20,430 | 125,933 | 289,323 | 316,399 | 329,336 | 346,893 | |||||||||||||||||||||||||
2012 | 19,220 | 119,703 | 172,623 | 181,825 | 185,221 | ||||||||||||||||||||||||||
2013 | 69,940 | 215,761 | 265,778 | 276,761 | |||||||||||||||||||||||||||
2014 | 26,550 | 151,733 | 200,419 | ||||||||||||||||||||||||||||
2015 | 37,898 | 216,283 | |||||||||||||||||||||||||||||
2016 | 17,463 | ||||||||||||||||||||||||||||||
Total | $ | 1,930,270 | |||||||||||||||||||||||||||||
(See Note 7 of the accompanying consolidated financial statements for loss development tables by accident year and for explanation of significant prior period loss developments.)
For most of our contracts written as of December 31, 2016, our risk exposure is limited by defined limits of liability. Once the loss limit for a contract has been reached, we have no further exposure to additional losses from that contract. However, certain contracts, particularly quota share contracts that relate to first dollar exposure, may not contain aggregate limits. Our severity business, and to a lesser extent our frequency business, include certain contracts that contain or may contain natural peril loss exposure. As of January 1, 2017, our maximum aggregate loss exposure to any series of natural peril events was $229.9 million. For purposes of the preceding sentence, aggregate loss exposure is net of any retrocession (including any ILWs) and is equal to the difference between the aggregate limits available in the contracts that contain natural peril exposure minus reinstatement premiums, if any, for the same contracts. We categorize peak zones as: United States, Canada and the Caribbean; Europe; Japan; and the rest of the world. The following table provides single event loss exposure and aggregate loss exposure information for the peak zones of our natural peril coverage as of January 1, 2017:
January 1, 2017 | ||||||||
Zone | Maximum Single Event Loss | Maximum Aggregate Loss | ||||||
($ in thousands) | ||||||||
United States, Canada and the Caribbean | $ | 196,154 | $ | 229,881 | ||||
Europe | 107,357 | 127,567 | ||||||
Japan | 107,357 | 127,567 | ||||||
Rest of the world | 107,357 | 127,567 | ||||||
Maximum Aggregate | 196,154 | 229,881 | ||||||
Since our maximum loss exposures are theoretical maximums based on contract limits, these limits may be significantly higher than modeled loss estimates which are commonly used in the insurance industry. Therefore, we also estimate catastrophe losses in terms of the probable maximum loss (“PML”). We define PML as the anticipated loss, taking into account contract terms and limits, caused by a catastrophe affecting a broad geographic area, such as that caused by an earthquake or hurricane. We anticipate that the PML will vary depending upon the modeled simulated losses and the composition of the in-force book of business. The projected severity levels are described in terms of a 1-in-250 year return period. The 1-in-250 year return period PML means that there is a 0.4% chance in any given year that an occurrence of a natural catastrophe will lead to losses exceeding the stated estimate. In other words, it corresponds to a 99.6% probability that the loss from an event will fall below the indicated PML.
67
PMLs are estimates and, as a result, we cannot provide any assurance that any actual event will align with the modeled event or that actual losses from events similar to the modeled events will not vary materially from the modeled event PML. The PML estimate includes all significant exposure from our reinsurance operations. This includes coverage for property, motor, marine, energy, aviation and workers’ compensation.
As of January 1, 2017, our estimated net PML exposure (net of retrocession and reinstatement premiums) at a 1-in-250 year return period for a single event and in aggregate was $97.1 million and $112.4 million, respectively. The following table provides the PML for single event loss exposure and aggregate loss exposure to natural peril losses for each of the peak zones as of January 1, 2017:
January 1, 2017 | ||||||||
1-in-250 year return period | ||||||||
Zone | Single Event Loss | Aggregate Loss | ||||||
($ in thousands) | ||||||||
United States, Canada and the Caribbean | $ | 97,124 | $ | 110,376 | ||||
Europe | 28,197 | 35,392 | ||||||
Japan | 7,761 | 7,986 | ||||||
Rest of the world | 7,741 | 7,838 | ||||||
Maximum | 97,124 | 112,401 | ||||||
Shareholders’ Equity
Total equity reported on the consolidated balance sheet, which includes non-controlling interest, increased by $42.9 million to $891.7 million as of December 31, 2016, compared to $848.8 million as of December 31, 2015. Retained earnings increased primarily due to net income of $44.9 million reported for the year ended December 31, 2016. The non-controlling interest decreased by $5.9 million primarily due to a withdrawal of $7.8 million by DME from its share in the joint venture during the year ended December 31, 2016. The increase in additional paid-in capital for the year ended December 31, 2016 of $3.9 million was primarily related to share-based compensation for the year ended December 31, 2016.
Liquidity and Capital Resources
General
Greenlight Capital Re is organized as a holding company with no operations of its own. As a holding company, Greenlight Capital Re has minimal continuing cash needs, most of which are related to the payment of administrative expenses. All of our underwriting operations are conducted through our wholly-owned reinsurance subsidiaries, Greenlight Re and GRIL, which underwrite property and casualty reinsurance. There are restrictions on each of Greenlight Re’s and GRIL’s ability to pay dividends, which are described in more detail below. It is our current policy to retain earnings to support the growth of our business. We currently do not expect to pay dividends on our ordinary shares.
As of December 31, 2016, Greenlight Re and GRIL were each rated “A- (Excellent)” with a stable outlook, by A.M. Best. The ratings reflect A.M. Best’s opinion of our reinsurance subsidiaries’ financial strength, operating performance and ability to meet obligations and it is not an evaluation directed toward the protection of investors or a recommendation to buy, sell or hold our Class A ordinary shares. If A.M. Best downgrades our ratings below “A- (Excellent)” or withdraws our rating, we could be severely limited or prevented from writing any new reinsurance contracts, which would significantly and negatively affect our business. Our A.M. Best ratings may be revised or revoked at the sole discretion of the rating agency.
68
Sources and Uses of Funds
Our sources of funds consist primarily of premium receipts (net of brokerage and ceding commissions), investment income (net of advisory compensation and investment expenses), including realized gains, and other income. We use cash from our operations to pay losses and loss adjustment expenses, profit commissions and general and administrative expenses. Substantially all of our funds, including shareholders’ capital, net of funds required for business operations, are invested by DME Advisors in accordance with our investment guidelines. As of December 31, 2016, approximately 94% (December 31, 2015: 96%) of our long investments were comprised of publicly-traded equity securities and other holdings which can be readily liquidated to meet current and future liabilities. Given our value-oriented long and short investment strategy, if markets are distressed, we would expect the liability of the short portfolio to decline. Any reduction in the liability would cause our need for restricted cash to decrease and thereby free up cash to be used for any purpose. Additionally, since the majority of our invested assets can be readily liquidated, even in distressed markets, we believe sufficient securities can be readily sold or covered in a timely manner to generate cash to pay claims. Since we classify our investments as “trading,” we book all gains and losses (including unrealized gains and losses) on all our investments (including derivatives) as net investment income or loss in our consolidated statements of income for each reporting period.
For the years ended December 31, 2016, 2015 and 2014, the net cash used in operating activities was $35.8 million, $57.4 million and $133.7 million, respectively. During the year ended December 31, 2016, we paid $67.0 million to a third party relating to the construction defect liabilities loss portfolio transfer. In addition, included in the net cash used in operating activities were investment related expenses, such as investment advisor compensation, and net interest and dividend expenses of $23.0 million, $35.0 million and $56.6 million for the years ended December 31, 2016, 2015 and 2014, respectively. Excluding the investment related expenses from the net cash used in operating activities, the net cash primarily used by our underwriting activities was $12.8 million, $22.4 million and $77.1 million for the years ended December 31, 2016, 2015 and 2014, respectively. Generally, in a given period if the premiums collected are sufficient to cover claim payments, we would generate cash from our underwriting activities. Due to the inherent nature of our underwriting portfolio, claims are often paid several months or even years after the premiums are collected. The cash generated from underwriting activities, however, may be volatile from period to period depending on the underwriting opportunities available. For the year ended December 31, 2016, other than the loss portfolio transfer, we generated cash from our underwriting activities of $54.2 million compared to cash used for underwriting activities of $22.4 million during the year ended December 31, 2015.
For the year ended December 31, 2016, our investing activities used cash of $30.4 million (2015 and 2014: provided cash of $177.7 million and $142.0 million, respectively), driven primarily by lower level of borrowing from prime brokers compared to the same period in 2015. Cash used for, or provided by, investing activities is net of any withdrawals from the joint venture by DME ($7.8 million for year ended December 31, 2016, nil for 2015 and $9.5 million for 2014). There were no financing activities during the year ended December 31, 2016.
As of December 31, 2016, we believe we have sufficient cash flow from operating and investing activities to meet our foreseeable liquidity requirements. We expect that our operational needs for liquidity will be met by cash, funds generated from underwriting activities and investment income, including realized gains and the disposition of investment securities. As of December 31, 2016, we had no plans to issue debt and expect to fund our operations for the next twelve months from operating cash flow. However, we cannot provide assurances that in the future we will not incur indebtedness to implement our business strategy, pay claims or make acquisitions.
Although GLRE is not subject to any significant legal prohibitions on the payment of dividends, Greenlight Re and GRIL are each subject to regulatory minimum capital requirements and regulatory constraints that affect their ability to pay dividends to us. In addition, any dividend payment would have to be approved by the relevant regulatory authorities prior to payment. As of December 31, 2016, Greenlight Re and GRIL both exceeded the regulatory minimum capital requirements.
Letters of Credit and Trust Arrangements
As of December 31, 2016, neither Greenlight Re nor GRIL was licensed or admitted as a reinsurer in any jurisdiction other than the Cayman Islands and the European Economic Area, respectively. Because many jurisdictions do not permit domestic insurance companies to take credit on their statutory financial statements for loss recoveries or ceded unearned premiums unless appropriate measures are in place for reinsurance obtained from unlicensed or non-admitted insurers, we anticipate that all of our U.S. clients and some of our non-U.S. clients will require us to provide collateral through funds withheld, trust arrangements, letters of credit or a combination thereof.
As of December 31, 2016, we had three letter of credit facilities available with an aggregate capacity of $600.0 million (2015: $720.0 million) with various financial institutions. The decrease was a result of a notice of cancellation we issued during
69
2016 to terminate one letter of credit facility that had a capacity of $120.0 million. See Note 14 of the accompanying consolidated financial statements for details on each of the available facilities. We provide collateral to cedents in the form of letters of credit and trust arrangements. As of December 31, 2016, the aggregate amount of collateral provided to cedents under such arrangements was $341.7 million (2015: $324.2 million). The letters of credit and trust accounts are secured by equity and debt securities as well as cash and cash equivalents with a total fair value of $397.2 million as of December 31, 2016 (2015: $402.9 million).
Each of the letter of credit facilities contain customary events of default and restrictive covenants, including but not limited to, limitations on liens on collateral, transactions with affiliates, mergers and sales of assets, as well as solvency and maintenance of certain minimum pledged equity requirements, and restricts issuance of any debt without the consent of the letter of credit provider. Additionally, if an event of default exists, as defined in the letter of credit facilities, Greenlight Re would be prohibited from paying dividends to its parent company. The Company was in compliance with all the covenants of each of these facilities as of December 31, 2016.
Capital
Our capital structure currently consists entirely of equity issued in two separate classes of ordinary shares. We expect that the existing capital base and internally generated funds will be sufficient to implement our business strategy for the foreseeable future. Consequently, we do not presently anticipate that we will incur any material indebtedness in the ordinary course of our business other than temporary borrowing directly related to the management of our investment portfolio. However, in order to provide us with flexibility and timely access to public capital markets should we require additional capital for working capital, capital expenditures, acquisitions or other general corporate purposes, we have filed a Form S-3 registration statement, which expires in June 2018 unless renewed. We did not make any significant commitments for capital expenditures during the year ended December 31, 2016.
Our Board of Directors has adopted a share repurchase plan authorizing the Company to repurchase up to 2.0 million Class A ordinary shares or securities convertible into Class A ordinary shares in the open market, through privately negotiated transactions or Rule 10b5-1 stock trading plans. The current share repurchase plan expires on June 30, 2017 unless renewed by the Board of Directors. As of December 31, 2016, 2.0 million Class A ordinary shares remained authorized for repurchase under the repurchase plan. The Company is not required to repurchase any of the Class A ordinary shares and the repurchase plan may be modified, suspended or terminated at the election of our Board of Directors at any time without prior notice. During the year ended December 31, 2016, no Class A ordinary shares were repurchased by the Company.
As of December 31, 2016, there were 424,787 Class A ordinary shares available for future issuance under the Company’s stock incentive plan. The stock incentive plan is administered by the Compensation Committee of the Board of Directors.
Contractual Obligations and Commitments
The following table shows our aggregate contractual obligations as of December 31, 2016 by time period remaining:
Less than 1 year | 1-3 years | 3-5 years | More than 5 years | Total | |||||||||||||||
($ in thousands) | |||||||||||||||||||
Operating lease obligations (1) | $ | 621 | $ | 543 | $ | 213 | $ | — | $ | 1,377 | |||||||||
Private equity and limited partnerships (2) | 9,210 | — | — | — | 9,210 | ||||||||||||||
Loss and loss adjustment expense reserves (3) | 144,542 | 84,148 | 34,216 | 43,735 | 306,641 | ||||||||||||||
$ | 154,373 | $ | 84,691 | $ | 34,429 | $ | 43,735 | $ | 317,228 | ||||||||||
(1) Reflects our minimum contractual obligations pursuant to the lease agreements as described below.
(2) As of December 31, 2016, we had made total commitments of $25.3 million in private investments of which we had invested $16.1 million, and our remaining commitments to these investments total $9.2 million. Given the nature of the private equity investments, we are unable to determine with any degree of accuracy as to when the commitments will be called. As such, for the purposes of the above table, we have assumed that all commitments with no fixed payment schedule will be made within one year. Under our investment guidelines, in effect as of the date hereof, no more than 10% of the assets in the investment portfolio may be held in private equity securities without specific approval from the Board of Directors.
70
(3) Due to the nature of our reinsurance operations, the amount and timing of the cash flows associated with our reinsurance contractual liabilities will fluctuate, perhaps materially, and, therefore, are highly uncertain.
As of December 31, 2016, $859.9 million of securities sold, not yet purchased, were secured by $859.9 million of restricted cash held by prime brokers to cover obligations relating to securities sold, not yet purchased. These amounts are not included in the contractual obligations table above because there is no maturity date for securities sold, not yet purchased, and their maturities are not set by any contract and as such their due dates cannot be estimated.
Greenlight Re has entered into lease agreements for office space in the Cayman Islands. The leases expire on June 30, 2018 and Greenlight Re has the option to renew the leases for a further five year term. Under the terms of the lease agreements, Greenlight Re is committed to annual rent payments ranging from $0.3 million at inception to $0.5 million at expiry. The minimum lease payment obligations are included in the above table under operating lease obligations and in Note 14 to the accompanying consolidated financial statements.
GRIL has entered into a lease agreement for office space in Dublin, Ireland. Under the terms of this lease agreement, GRIL is committed to minimum annual rent payments denominated in Euros approximating €0.1 million until May 2021, and adjusted to the prevailing market rates for each of the two subsequent five-year terms. GRIL has the option to terminate the lease agreement in 2021. The minimum lease payment obligations are included in the above table under operating lease obligations and in Note 14 to the accompanying consolidated financial statements.
The Company and its reinsurance subsidiaries have entered into a joint venture agreement with DME Advisors under which the Company, its reinsurance subsidiaries and DME are participants of a joint venture for the purpose of managing certain jointly held assets (the “venture agreement”). In addition, the Company, its reinsurance subsidiaries and DME have entered into a separate investment advisory agreement with DME Advisors (the “advisory agreement”). The term of each of the venture agreement and the advisory agreement was January 1, 2014 through December 31, 2016, with automatic three-year renewals unless 90 days prior to the end of the then current term, either DME notifies the other participants of its desire to terminate the venture agreement or any other participant notifies DME of its desire to withdraw from the venture agreement. During 2016, the venture agreement and the advisory agreement were renewed for a further three year term from January 1, 2017 through December 31, 2019.
Pursuant to the venture agreement, we pay DME Advisors a monthly management fee of 0.125% on our share of the assets managed by DME Advisors and we provide DME a performance allocation equal to 20% of the net profit, calculated per annum, of the Company’s share of the capital account managed by DME Advisors, subject to a loss carry forward provision. The loss carry forward provision allows DME to earn a reduced performance allocation of 10% of profits in any year subsequent to the year in which the investment account incurs a loss, until all the losses are recouped and an additional amount equal to 150% of the aggregate investment loss is earned. DME is not entitled to earn a performance allocation in a year in which the investment portfolio incurs a loss. For the year ended December 31, 2016, performance allocation of $8.2 million and management fees of $16.3 million were included in net investment income.
We have entered into a service agreement with DME Advisors pursuant to which DME Advisors will provide investor relations services to us for compensation of $5,000 per month plus expenses. The service agreement had an initial term of one year, and continues for sequential one-year periods until terminated by us or DME Advisors. Either party may terminate the service agreement for any reason with 30 days prior written notice to the other party.
Our related party transactions are presented in Note 13 to the accompanying consolidated financial statements.
Off-Balance Sheet Financing Arrangements
We have no obligations, assets or liabilities, other than those derivatives in our investment portfolio that are disclosed in the consolidated financial statements, which would be considered off-balance sheet arrangements. We do not participate in transactions that create relationships with unconsolidated entities or financial partnerships, often referred to as variable interest entities, which would have been established for the purpose of facilitating off-balance sheet arrangements.
71
Effects of Inflation
We consider the effects of inflation in our pricing and when estimating loss and loss adjustment expense reserves. The actual effects of inflation on our results of operations cannot be accurately known until claims are ultimately settled. For the years ended December 31, 2016, 2015 and 2014, inflation had no significant impact on our revenues or net income. We do not believe that inflation has had or will have a material effect on our combined results of operations, except insofar as inflation may affect interest rates and the asset values in our investment portfolio.
ITEM 7A. QUANTITATIVE AND QUALITATIVE DISCLOSURES ABOUT MARKET RISK
We believe we are principally exposed to the following types of market risk:
• | equity price risk; | |
• | commodity price risk; | |
• | foreign currency risk; | |
• | interest rate risk; | |
• | credit risk; and | |
• | political risk. | |
Equity Price Risk
As of December 31, 2016, our investment portfolio consisted of long and short equity securities, along with certain equity-based derivative instruments, the carrying values of which are primarily based on quoted market prices. Generally, market prices of common equity securities are subject to fluctuation, which could cause the amount to be realized upon the closing of the position to differ significantly from their current reported value. This risk is partly mitigated by the presence of both long and short equity securities within our investment portfolio. As of December 31, 2016, a 10% decline in the price of each of these listed equity securities and equity-based derivative instruments would result in a $26.1 million, or 2.3%, decline in the fair value of our total investment portfolio.
Computations of the prospective effects of hypothetical equity price changes are based on numerous assumptions, including the maintenance of the existing level and composition of investment securities and should not be relied on as indicative of future results.
Commodity Price Risk
Generally, market prices of commodities are subject to fluctuation. Our investment portfolio periodically includes long or short investments in commodities or in derivatives directly impacted by fluctuations in the prices of commodities. As of December 31, 2016, our investment portfolio included unhedged exposure to changes in gold prices, through ownership of physical gold and derivative instruments with underlying exposure to changes in gold prices. Additionally, as of December 31, 2016, our investment portfolio included derivative instruments with underlying exposure to changes in oil and natural gas prices.
The following table summarizes the net impact that a 10% increase and decrease in commodity prices would have on the value of our investment portfolio as of December 31, 2016. The below table excludes the indirect effect that changes in commodity prices might have on equity securities in our investment portfolio.
10% increase in commodity prices | 10% decrease in commodity prices | ||||||||||||
Commodity | Change in fair value | Change in fair value as % of investment portfolio | Change in fair value | Change in fair value as % of investment portfolio | |||||||||
($ in thousands) | ($ in thousands) | ||||||||||||
Gold | $ | 13,730 | 1.2 | % | $ | (13,730 | ) | (1.2 | )% | ||||
Natural Gas | 6,731 | 0.6 | (6,731 | ) | (0.6 | ) | |||||||
Oil | 2,820 | 0.2 | (2,820 | ) | (0.2 | ) | |||||||
Total | $ | 23,281 | 2.0 | % | $ | (23,281 | ) | (2.0 | )% | ||||
72
We, along with our investment advisor, periodically monitor our exposure to any other commodity price fluctuations and generally do not expect changes in other commodity prices to have a materially adverse impact on our operations.
Foreign Currency Risk
Certain of our reinsurance contracts provide that ultimate losses may be payable or calculated in foreign currencies depending on the country of original loss. Foreign currency exchange rate risk exists to the extent that our foreign currency loss reserves (case reserves and IBNR) are in excess of the corresponding foreign currency cash balances and there is an increase in the exchange rate of that foreign currency. As of December 31, 2016, we had a net unhedged foreign currency exposure on GBP denominated loss reserves of £0.4 million. As of December 31, 2016, a 10% decrease in the U.S. dollar against the GBP (all else being constant) would result in an estimated decrease in loss reserves of $0.05 million and a corresponding foreign exchange gain. Alternatively, a 10% increase in the U.S dollar against the GBP, would result in an estimated increase of $0.05 million in our recorded loss reserves and a corresponding foreign exchange loss.
While we do not seek to specifically match our liabilities under reinsurance policies that are payable in foreign currencies with investments denominated in such currencies, we continually monitor our exposure to potential foreign currency losses and may use foreign currency cash and cash equivalents or forward foreign currency exchange contracts in an effort to mitigate against adverse foreign currency movements.
We are also exposed to foreign currency risk through cash, forwards, options and investments in securities denominated in foreign currencies. Foreign currency exchange rate risk is the potential for adverse changes in the U.S. dollar value of investments (long and short), speculative foreign currency options and cash positions due to a change in the exchange rate of the foreign currency in which cash and financial instruments are denominated. As of December 31, 2016, some of our currency exposure resulting from foreign denominated securities (longs and shorts) was reduced by offsetting cash balances denominated in the corresponding foreign currencies.
The following table summarizes the net impact that a 10% increase and decrease in the value of the U.S. dollar against select foreign currencies would have on the value of our investment portfolio as of December 31, 2016:
10% increase in U.S. dollar | 10% decrease in U.S. dollar | ||||||||||||
Foreign Currency | Change in fair value | Change in fair value as % of investment portfolio | Change in fair value | Change in fair value as % of investment portfolio | |||||||||
($ in thousands) | |||||||||||||
Australian Dollar | 296 | — | (296 | ) | — | ||||||||
British Pound | (641 | ) | (0.1 | ) | 641 | 0.1 | |||||||
Chinese Yuan | 7,137 | 0.6 | (3,491 | ) | (0.3 | ) | |||||||
Japanese Yen | 2,190 | 0.2 | (2,034 | ) | (0.2 | ) | |||||||
South Korean Won | (613 | ) | (0.1 | ) | 613 | 0.1 | |||||||
Other | (329 | ) | — | 329 | — | ||||||||
Total | $ | 8,040 | 0.6 | % | $ | (4,238 | ) | (0.3 | )% | ||||
Computations of the prospective effects of hypothetical currency price changes are based on numerous assumptions, including the maintenance of the existing level and composition of investment securities denominated in foreign currencies and related foreign currency instruments, and should not be relied on as indicative of future results.
Interest Rate Risk
Our investment portfolio includes interest rate sensitive securities, such as corporate and sovereign debt instruments and interest rate options. The primary market risk exposure for any debt instrument is interest rate risk. As interest rates rise, the market value of our long fixed-income portfolio falls, and the opposite is also true as interest rates fall. Additionally, some of our derivative investments may also be sensitive to interest rates and their value may indirectly fluctuate with changes in interest rates.
73
The following table summarizes the impact that a 100 basis point increase or decrease in interest rates would have on the value of our investment portfolio as of December 31, 2016:
100 basis point increase in interest rates | 100 basis point decrease in interest rates | ||||||||||||
Change in fair value | Change in fair value as % of investment portfolio | Change in fair value | Change in fair value as % of investment portfolio | ||||||||||
($ in thousands) | |||||||||||||
Debt instruments | $ | 15,806 | 1.4 | % | $ | (20,635 | ) | (1.8 | )% | ||||
Interest rate swaps | 4,001 | 0.3 | (4,001 | ) | (0.3 | ) | |||||||
Net exposure to interest rate risk | $ | 19,807 | 1.7 | % | $ | (24,636 | ) | (2.1 | )% | ||||
For the purposes of the above table, the hypothetical impact of changes in interest rates on debt instruments was determined based on the interest rates applicable to each instrument individually. We periodically monitor our net exposure to interest rate risk and generally do not expect changes in interest rates to have a materially adverse impact on our operations.
Credit Risk
We are exposed to credit risk primarily from the possibility that counterparties may default on their obligations to us. The amount of the maximum exposure to credit risk is indicated by the carrying value of our financial assets including notes receivable. We evaluate the financial condition of our notes receivable counterparties and monitor our exposure to them on a regular basis. We are also exposed to credit risk from our business partners and clients relating to balances receivable under the reinsurance contracts, including premiums receivable, losses recoverable and commission adjustments recoverable. We monitor the collectability of these balances on a regular basis.
In addition, the securities, commodities, and cash in our investment portfolio are held with several prime brokers, subjecting us to the related credit risk from the possibility that one or more of them may default on their obligations to us. We closely and regularly monitor our concentration of credit risk with each prime broker and, if necessary, transfer cash or securities between prime brokers to diversify and mitigate our credit risk. Other than our investment in derivative contracts and corporate debt, if any, and the fact that our investments and majority of cash balances are held by prime brokers on our behalf, we have no other significant concentrations of credit risk.
Political Risk
We are exposed to political risk to the extent that we underwrite business from entities located in foreign markets and to the extent that DME Advisors, on our behalf and subject to our investment guidelines, trades securities that are listed on various U.S. and foreign exchanges and markets. The governments in any of these jurisdictions could impose restrictions, regulations or other measures, which may have a material adverse impact on our underwriting operations and investment strategy. We currently do not write political risk coverage on our insurance contracts; however, changes in government laws and regulations may impact our underwriting operations (see “Item 1A. Risk Factors”).
ITEM 8. FINANCIAL STATEMENTS AND SUPPLEMENTARY DATA
Information with respect to this Item is set forth under Part IV Item 15.
ITEM 9. CHANGES IN AND DISAGREEMENTS WITH ACCOUNTANTS ON ACCOUNTING AND FINANCIAL DISCLOSURE
Not applicable.
74
ITEM 9A. CONTROLS AND PROCEDURES
Disclosure Controls and Procedures
As required by Rules 13a-15 and 15d-15 of the Exchange Act, the Company has evaluated, with the participation of management, including the Chief Executive Officer and the Chief Financial Officer, the effectiveness of its disclosure controls and procedures (as defined in such rules) as of the end of the period covered by this report. Based on such evaluation, the Chief Executive Officer and Chief Financial Officer concluded that the Company’s disclosure controls and procedures are effective to ensure that information required to be disclosed by the Company in reports prepared in accordance with the rules and regulations of the SEC is recorded, processed, summarized and reported within the time periods specified by the SEC’s rules and forms. Disclosure controls and procedures include, without limitation, controls and procedures designed to ensure that information required to be disclosed by an issuer in the reports that it files or submits under the Exchange Act is accumulated and communicated to the issuer’s management, including its principal executive officer and principal financial officer, or persons performing similar functions, as appropriate to allow timely decisions regarding required disclosure.
Our management, including our Chief Executive Officer and Chief Financial Officer, does not expect that the Company’s disclosure controls and procedures will prevent all errors and all frauds. A control system, no matter how well conceived and operated, can provide only reasonable, not absolute, assurance that the objectives of the control system are met. Further, the design of a control system must reflect the fact that there are resource constraints, and the benefits of controls must be considered relative to their costs. Because of the inherent limitations in all control systems, no evaluation of controls can provide absolute assurance that all control issues and instances of fraud, if any, within the Company have been detected. These inherent limitations include the realities that judgments in decision-making can be faulty and that breakdowns can occur because of simple error or mistake.
Additionally, controls can be circumvented by the individual acts of some persons, by collusion of two or more people, or by management override of the controls. The design of any system of controls also is based, in part, upon certain assumptions about the likelihood of future events, and there can be no assurance that any design will succeed in achieving its stated goals under all potential future conditions; over time, controls may become inadequate because of changes in conditions, or the degree of compliance with the policies or procedures may deteriorate. Because of the inherent limitations in a cost-effective control system, misstatements due to error or fraud may occur and not be detected.
Changes in Internal Control Over Financial Reporting
There have been no changes in the Company’s internal control over financial reporting during the fiscal quarter ended December 31, 2016 that have materially affected, or are reasonably likely to materially affect, the Company’s internal control over financial reporting. The Company continues to review its disclosure controls and procedures, including its internal controls over financial reporting, and may from time to time make changes aimed at enhancing their effectiveness and to ensure that the Company’s systems evolve with its business.
Management Report on Internal Control Over Financial Reporting
Our management is responsible for establishing and maintaining adequate internal control over financial reporting. Our internal control system is designed to provide reasonable assurance regarding the reliability of financial reporting and the preparation of financial statements for external purposes in accordance with generally accepted accounting principles in the United States of America (“U.S. GAAP”) and includes those policies and procedures that:
● | pertain to the maintenance of records that in reasonable detail accurately and fairly reflect the transactions and dispositions of the assets of the Company; | |
● | provide reasonable assurance that transactions are recorded as necessary to permit preparation of financial statements in accordance with U.S. GAAP, and that receipts and expenditures of the Company are being made only in accordance with authorizations of management and directors of the Company; and | |
● | provide reasonable assurance regarding prevention or timely detection of unauthorized acquisition, use or disposition of the Company’s assets that could have a material effect on its financial statements. | |
Because of its inherent limitations, a system of internal control over financial reporting can provide only reasonable assurance and may not prevent or detect misstatements. Further, because of changes in conditions, effectiveness of internal control over financial reporting may vary over time. Our system contains self-monitoring mechanisms, and actions are taken to correct deficiencies as they are identified.
75
Our management conducted an evaluation of the effectiveness of the system of internal control over financial reporting based on the framework in the Internal Control — Integrated Framework issued by the Committee of Sponsoring Organizations of the Treadway Commission (the 2013 framework). Based on this evaluation, our management concluded that our system of internal control over financial reporting was effective as of December 31, 2016. The effectiveness of our internal control over financial reporting has been audited by BDO USA, LLP, an independent registered public accounting firm, as stated in their report, which is included herein.
ITEM 9B. OTHER INFORMATION
None
PART III
ITEM 10. DIRECTORS, EXECUTIVE OFFICERS AND CORPORATE GOVERNANCE
This item is omitted because a definitive proxy statement that involves the election of directors will be filed with the SEC not later than 120 days after the close of the fiscal year pursuant to Regulation 14A, which information required by this item set forth in the proxy statement is incorporated by reference.
ITEM 11. EXECUTIVE COMPENSATION
This item is omitted because a definitive proxy statement that involves the election of directors will be filed with the SEC not later than 120 days after the close of the fiscal year pursuant to Regulation 14A, which information required by this item set forth in the proxy statement is incorporated by reference.
ITEM 12. SECURITY OWNERSHIP OF CERTAIN BENEFICIAL OWNERS AND MANAGEMENT AND RELATED STOCKHOLDER MATTERS
This item is omitted because a definitive proxy statement that involves the election of directors will be filed with the SEC not later than 120 days after the close of the fiscal year pursuant to Regulation 14A, which information required by this item set forth in the proxy statement is incorporated by reference.
ITEM 13. CERTAIN RELATIONSHIPS AND RELATED TRANSACTIONS, AND DIRECTOR INDEPENDENCE
This item is omitted because a definitive proxy statement that involves the election of directors will be filed with the SEC not later than 120 days after the close of the fiscal year pursuant to Regulation 14A, which information required by this item set forth in the proxy statement is incorporated by reference.
ITEM 14. PRINCIPAL ACCOUNTING FEES AND SERVICES
This item is omitted because a definitive proxy statement that involves the election of directors will be filed with the SEC not later than 120 days after the close of the fiscal year pursuant to Regulation 14A, which information required by this item set forth in the proxy statement is incorporated by reference.
76
PART IV
ITEM 15. EXHIBITS AND FINANCIAL STATEMENT SCHEDULES
Page | ||||
(a)(1) | Financial Statements | |||
Consolidated Balance Sheets as of December 31, 2016 and 2015 | ||||
Consolidated Statements of Income for the years ended December 31, 2016, 2015 and 2014 | ||||
Consolidated Statements of Shareholders' Equity for the years ended December 31, 2016, 2015 and 2014 | ||||
Consolidated Statements of Cash Flows for the years ended December 31, 2016, 2015 and 2014 | ||||
Notes to the Consolidated Financial Statements | ||||
(a)(2) | Financial Statement Schedules | |||
(a)(3) | The exhibits required to be filed by this Item 15. are set forth in the Exhibit Index accompanying this report. | |||
77
SIGNATURES
Pursuant to the requirements of Section 13 or 15(d) of the Securities Exchange Act of 1934, the registrant has duly caused this report to be signed on its behalf by the undersigned, thereunto duly authorized.
GREENLIGHT CAPITAL RE, LTD. | |
By: | /s/ Barton Hedges |
Barton Hedges Chief Executive Officer | |
February 22, 2017 | |
Pursuant to the requirements of the Securities Exchange Act of 1934, this report has been signed below by the following persons on behalf of the Registrant and in the capacities and on the dates indicated.
/s/ DAVID M. EINHORN | /s/ LEONARD GOLDBERG | ||
David M. Einhorn Director | Leonard Goldberg Director | ||
February 22, 2017 | February 22, 2017 | ||
/s/ FRANK D. LACKNER | /s/ ALAN BROOKS | ||
Frank D. Lackner Director | Alan Brooks Director | ||
February 22, 2017 | February 22, 2017 | ||
/s/ IAN ISAACS | /s/ JOSEPH P. PLATT | ||
Ian Isaacs Director | Joseph P. Platt Director | ||
February 22, 2017 | February 22, 2017 | ||
/s/ TIM COURTIS | /s/ BRYAN MURPHY | ||
Tim Courtis Chief Financial Officer (principal financial and accounting officer) | Bryan Murphy Director | ||
February 22, 2017 | February 22, 2017 | ||
/s/ BARTON HEDGES | |||
Barton Hedges Director & Chief Executive Officer (principal executive officer) | |||
February 22, 2017 | |||
78
Report of Independent Registered Public Accounting Firm
The Board of Directors and Shareholders
Greenlight Capital Re, Ltd.
Grand Cayman, Cayman Islands
We have audited Greenlight Capital Re, Ltd.’s internal control over financial reporting as of December 31, 2016, based on criteria established in Internal Control - Integrated Framework (2013) issued by the Committee of Sponsoring Organizations of the Treadway Commission (the COSO criteria). Greenlight Capital Re, Ltd.’s management is responsible for maintaining effective internal control over financial reporting and for its assessment of the effectiveness of internal control over financial reporting, included in the accompanying “Item 9A, Management’s Report on Internal Control Over Financial Reporting”. Our responsibility is to express an opinion on the company’s internal control over financial reporting based on our audit.
We conducted our audit in accordance with the standards of the Public Company Accounting Oversight Board (United States). Those standards require that we plan and perform the audit to obtain reasonable assurance about whether effective internal control over financial reporting was maintained in all material respects. Our audit included obtaining an understanding of internal control over financial reporting, assessing the risk that a material weakness exists, and testing and evaluating the design and operating effectiveness of internal control based on the assessed risk. Our audit also included performing such other procedures as we considered necessary in the circumstances. We believe that our audit provides a reasonable basis for our opinion.
A company’s internal control over financial reporting is a process designed to provide reasonable assurance regarding the reliability of financial reporting and the preparation of financial statements for external purposes in accordance with generally accepted accounting principles. A company’s internal control over financial reporting includes those policies and procedures that (1) pertain to the maintenance of records that, in reasonable detail, accurately and fairly reflect the transactions and dispositions of the assets of the company; (2) provide reasonable assurance that transactions are recorded as necessary to permit preparation of financial statements in accordance with generally accepted accounting principles, and that receipts and expenditures of the company are being made only in accordance with authorizations of management and directors of the company; and (3) provide reasonable assurance regarding prevention or timely detection of unauthorized acquisition, use, or disposition of the company’s assets that could have a material effect on the financial statements.
Because of its inherent limitations, internal control over financial reporting may not prevent or detect misstatements. Also, projections of any evaluation of effectiveness to future periods are subject to the risk that controls may become inadequate because of changes in conditions, or that the degree of compliance with the policies or procedures may deteriorate.
In our opinion, Greenlight Capital Re, Ltd. maintained, in all material respects, effective internal control over financial reporting as of December 31, 2016, based on the COSO criteria.
We also have audited, in accordance with the standards of the Public Company Accounting Oversight Board (United States), the consolidated balance sheets of Greenlight Capital Re, Ltd. as of December 31, 2016 and 2015, and the related consolidated statements of income, shareholders’ equity, and cash flows for each of the three years in the period ended December 31, 2016, and our report dated February 22, 2017 expressed an unqualified opinion thereon.
/s/ BDO USA, LLP
Grand Rapids, Michigan, USA
February 22, 2017
F-1
Report of Independent Registered Public Accounting Firm
The Board of Directors and Shareholders
Greenlight Capital Re, Ltd.
Grand Cayman, Cayman Islands
We have audited the accompanying consolidated balance sheets of Greenlight Capital Re, Ltd. as of December 31, 2016 and 2015 and the related consolidated statements of income, shareholders’ equity, and cash flows for each of the three years in the period ended December 31, 2016. In connection with our audits of the financial statements, we have also audited the financial statement schedules listed in the accompanying index. These financial statements and schedules are the responsibility of the Company’s management. Our responsibility is to express an opinion on these financial statements and schedules based on our audits.
We conducted our audits in accordance with the standards of the Public Company Accounting Oversight Board (United States). Those standards require that we plan and perform the audit to obtain reasonable assurance about whether the financial statements are free of material misstatement. An audit includes examining, on a test basis, evidence supporting the amounts and disclosures in the financial statements, assessing the accounting principles used and significant estimates made by management, as well as evaluating the overall presentation of the financial statements and schedules. We believe that our audits provide a reasonable basis for our opinion.
In our opinion, the consolidated financial statements referred to above present fairly, in all material respects, the financial position of Greenlight Capital Re, Ltd. at December 31, 2016 and 2015, and the results of its operations and its cash flows for each of the three years in the period ended December 31, 2016, in conformity with accounting principles generally accepted in the United States of America.
Also, in our opinion, the financial statement schedules, when considered in relation to the basic consolidated financial statements taken as a whole, present fairly, in all material respects, the information set forth therein.
We also have audited, in accordance with the standards of the Public Company Accounting Oversight Board (United States), Greenlight Capital Re, Ltd.’s internal control over financial reporting as of December 31, 2016, based on criteria established in Internal Control - Integrated Framework (2013) issued by the Committee of Sponsoring Organizations of the Treadway Commission (COSO) and our report dated February 22, 2017 expressed an unqualified opinion thereon.
/s/ BDO USA, LLP
Grand Rapids, Michigan, USA
February 22, 2017
F-2
GREENLIGHT CAPITAL RE, LTD.
CONSOLIDATED BALANCE SHEETS
December 31, 2016 and 2015
(expressed in thousands of U.S. dollars, except per share and share amounts)
2016 | 2015 | ||||||
Assets | |||||||
Investments | |||||||
Debt instruments, trading, at fair value | $ | 22,473 | $ | 39,087 | |||
Equity securities, trading, at fair value | 844,001 | 905,994 | |||||
Other investments, at fair value | 156,063 | 119,083 | |||||
Total investments | 1,022,537 | 1,064,164 | |||||
Cash and cash equivalents | 39,858 | 112,162 | |||||
Restricted cash and cash equivalents | 1,202,651 | 1,236,589 | |||||
Financial contracts receivable, at fair value | 76,381 | 13,215 | |||||
Reinsurance balances receivable | 219,126 | 187,940 | |||||
Loss and loss adjustment expenses recoverable | 2,704 | 3,368 | |||||
Deferred acquisition costs, net | 61,022 | 59,823 | |||||
Unearned premiums ceded | 2,377 | 3,251 | |||||
Notes receivable, net | 33,734 | 25,146 | |||||
Other assets | 4,303 | 6,864 | |||||
Total assets | $ | 2,664,693 | $ | 2,712,522 | |||
Liabilities and equity | |||||||
Liabilities | |||||||
Securities sold, not yet purchased, at fair value | $ | 859,902 | $ | 882,906 | |||
Financial contracts payable, at fair value | 2,237 | 28,245 | |||||
Due to prime brokers | 319,830 | 396,453 | |||||
Loss and loss adjustment expense reserves | 306,641 | 305,997 | |||||
Unearned premium reserves | 222,527 | 211,954 | |||||
Reinsurance balances payable | 41,415 | 18,326 | |||||
Funds withheld | 5,927 | 7,143 | |||||
Other liabilities | 14,527 | 12,725 | |||||
Total liabilities | 1,773,006 | 1,863,749 | |||||
Equity | |||||||
Preferred share capital (par value $0.10; authorized, 50,000,000; none issued) | — | — | |||||
Ordinary share capital (Class A: par value $0.10; authorized, 100,000,000; issued and outstanding, 31,111,432 (2015: 30,772,572): Class B: par value $0.10; authorized, 25,000,000; issued and outstanding, 6,254,895 (2015: 6,254,895)) | 3,737 | 3,703 | |||||
Additional paid-in capital | 500,337 | 496,401 | |||||
Retained earnings | 370,168 | 325,287 | |||||
Shareholders’ equity attributable to shareholders | 874,242 | 825,391 | |||||
Non-controlling interest in joint venture | 17,445 | 23,382 | |||||
Total equity | 891,687 | 848,773 | |||||
Total liabilities and equity | $ | 2,664,693 | $ | 2,712,522 | |||
The accompanying Notes to the Consolidated Financial Statements are an
integral part of the Consolidated Financial Statements.
F-3
GREENLIGHT CAPITAL RE, LTD.
CONSOLIDATED STATEMENTS OF INCOME
Years ended December 31, 2016, 2015 and 2014
(expressed in thousands of U.S. dollars, except per share and share amounts)
2016 | 2015 | 2014 | |||||||||
Revenues | |||||||||||
Gross premiums written | $ | 536,072 | $ | 502,124 | $ | 324,023 | |||||
Gross premiums ceded | (10,015 | ) | (9,001 | ) | (13,493 | ) | |||||
Net premiums written | 526,057 | 493,123 | 310,530 | ||||||||
Change in net unearned premium reserves | (12,939 | ) | (84,736 | ) | 43,710 | ||||||
Net premiums earned | 513,118 | 408,387 | 354,240 | ||||||||
Net investment income (loss) | 76,183 | (281,924 | ) | 122,575 | |||||||
Other income (expense), net | (935 | ) | (3,413 | ) | 2,987 | ||||||
Total revenues | 588,366 | 123,050 | 479,802 | ||||||||
Expenses | |||||||||||
Loss and loss adjustment expenses incurred, net | 380,815 | 317,097 | 234,986 | ||||||||
Acquisition costs, net | 134,534 | 116,207 | 107,665 | ||||||||
General and administrative expenses | 25,808 | 23,434 | 24,500 | ||||||||
Total expenses | 541,157 | 456,738 | 367,151 | ||||||||
Income (loss) before income tax | 47,209 | (333,688 | ) | 112,651 | |||||||
Income tax (expense) benefit | (509 | ) | 1,755 | 624 | |||||||
Net income (loss) including non-controlling interest | 46,700 | (331,933 | ) | 113,275 | |||||||
Loss (income) attributable to non-controlling interest in joint venture | (1,819 | ) | 5,508 | (3,683 | ) | ||||||
Net income (loss) | $ | 44,881 | $ | (326,425 | ) | $ | 109,592 | ||||
Earnings (loss) per share | |||||||||||
Basic | $ | 1.20 | $ | (8.90 | ) | $ | 2.94 | ||||
Diluted | $ | 1.20 | $ | (8.90 | ) | $ | 2.89 | ||||
Weighted average number of ordinary shares used in the determination of earnings and loss per share | |||||||||||
Basic | 37,267,145 | 36,670,466 | 37,242,687 | ||||||||
Diluted | 37,340,018 | 36,670,466 | 37,874,387 | ||||||||
The accompanying Notes to the Consolidated Financial Statements are an
integral part of the Consolidated Financial Statements.
F-4
GREENLIGHT CAPITAL RE, LTD.
CONSOLIDATED STATEMENTS OF SHAREHOLDERS’ EQUITY
Years ended December 31, 2016, 2015 and 2014
(expressed in thousands of U.S. dollars)
Ordinary share capital | Additional paid-in capital | Retained earnings | Shareholders' equity attributable to shareholders | Non-controlling interest in joint venture | Total equity | ||||||||||||||||||
Balance at December 31, 2013 | $ | 3,705 | $ | 496,622 | $ | 551,268 | $ | 1,051,595 | $ | 34,709 | $ | 1,086,304 | |||||||||||
Issue of Class A ordinary shares, net of forfeitures | 33 | — | — | 33 | — | 33 | |||||||||||||||||
Share-based compensation expense, net of forfeitures | — | 3,931 | — | 3,931 | — | 3,931 | |||||||||||||||||
Non-controlling interest contribution into (withdrawal from) joint venture, net | — | — | — | — | (9,502 | ) | (9,502 | ) | |||||||||||||||
Income (loss) attributable to non-controlling interest in joint venture | — | — | — | — | 3,683 | 3,683 | |||||||||||||||||
Net income (loss) | — | — | 109,592 | 109,592 | — | 109,592 | |||||||||||||||||
Balance at December 31, 2014 | $ | 3,738 | $ | 500,553 | $ | 660,860 | $ | 1,165,151 | $ | 28,890 | $ | 1,194,041 | |||||||||||
Issue of Class A ordinary shares, net of forfeitures | 26 | — | — | 26 | — | 26 | |||||||||||||||||
Repurchase of Class A ordinary shares | (61 | ) | (8,483 | ) | (9,148 | ) | (17,692 | ) | — | (17,692 | ) | ||||||||||||
Share-based compensation expense, net of forfeitures | — | 4,248 | — | 4,248 | — | 4,248 | |||||||||||||||||
Short-swing sale profit from shareholder | — | 83 | — | 83 | — | 83 | |||||||||||||||||
Income (loss) attributable to non-controlling interest in joint venture | — | — | — | — | (5,508 | ) | (5,508 | ) | |||||||||||||||
Net income (loss) | — | — | (326,425 | ) | (326,425 | ) | — | (326,425 | ) | ||||||||||||||
Balance at December 31, 2015 | $ | 3,703 | $ | 496,401 | $ | 325,287 | $ | 825,391 | $ | 23,382 | $ | 848,773 | |||||||||||
Issue of Class A ordinary shares, net of forfeitures | 34 | — | — | 34 | — | 34 | |||||||||||||||||
Share-based compensation expense, net of forfeitures | — | 3,936 | — | 3,936 | — | 3,936 | |||||||||||||||||
Non-controlling interest contribution into (withdrawal from) joint venture, net | — | — | — | — | (7,756 | ) | (7,756 | ) | |||||||||||||||
Income (loss) attributable to non-controlling interest in joint venture | — | — | — | — | 1,819 | 1,819 | |||||||||||||||||
Net income (loss) | — | — | 44,881 | 44,881 | — | 44,881 | |||||||||||||||||
Balance at December 31, 2016 | $ | 3,737 | $ | 500,337 | $ | 370,168 | $ | 874,242 | $ | 17,445 | $ | 891,687 | |||||||||||
The accompanying Notes to the Consolidated Financial Statements are an
integral part of the Consolidated Financial Statements.
F-5
GREENLIGHT CAPITAL RE, LTD.
CONSOLIDATED STATEMENTS OF CASH FLOWS
Years ended December 31, 2016, 2015 and 2014
(expressed in thousands of U.S. dollars)
2016 | 2015 | 2014 | |||||||||
Cash provided by (used in) operating activities | |||||||||||
Net income (loss) | $ | 44,881 | $ | (326,425 | ) | $ | 109,592 | ||||
Adjustments to reconcile net income or loss to net cash provided by (used in) operating activities | |||||||||||
Net change in unrealized gains and losses on investments and financial contracts | (209,993 | ) | 265,401 | 187,753 | |||||||
Net realized gains (losses) on investments and financial contracts | 113,836 | (22,227 | ) | (352,133 | ) | ||||||
Foreign exchange (gains) losses on cash and investments | 3,094 | 6,225 | (14,797 | ) | |||||||
Income (loss) attributable to non-controlling interest in joint venture | 1,819 | (5,508 | ) | 3,683 | |||||||
Share-based compensation expense, net of forfeitures | 3,970 | 4,274 | 3,964 | ||||||||
Depreciation expense | 390 | 405 | 436 | ||||||||
Net change in | |||||||||||
Reinsurance balances receivable | (31,186 | ) | (83,113 | ) | 16,155 | ||||||
Loss and loss adjustment expenses recoverable | 664 | (916 | ) | 5,306 | |||||||
Deferred acquisition costs, net | (1,199 | ) | (25,403 | ) | 17,377 | ||||||
Unearned premiums ceded | 874 | 776 | (854 | ) | |||||||
Other assets | 2,171 | (1,791 | ) | (1,349 | ) | ||||||
Loss and loss adjustment expense reserves | 644 | 41,754 | (65,651 | ) | |||||||
Unearned premium reserves | 10,573 | 83,218 | (44,321 | ) | |||||||
Reinsurance balances payable | 23,089 | 7,524 | 1,583 | ||||||||
Funds withheld | (1,216 | ) | 585 | (3,568 | ) | ||||||
Other liabilities | 1,802 | (2,224 | ) | 3,092 | |||||||
Net cash provided by (used in) operating activities | (35,787 | ) | (57,445 | ) | (133,732 | ) | |||||
Investing activities | |||||||||||
Purchases of investments, trading | (1,310,837 | ) | (1,252,969 | ) | (1,603,856 | ) | |||||
Sales of investments, trading | 1,470,118 | 1,388,162 | 1,722,936 | ||||||||
Payments for financial contracts | (60,414 | ) | (25,765 | ) | (13,302 | ) | |||||
Proceeds from financial contracts | 20,426 | 7,002 | 113,011 | ||||||||
Securities sold, not yet purchased | 699,237 | 892,085 | 934,769 | ||||||||
Dispositions of securities sold, not yet purchased | (792,970 | ) | (1,068,891 | ) | (952,843 | ) | |||||
Change in due to prime brokers | (76,623 | ) | 185,383 | (103,632 | ) | ||||||
Change in restricted cash and cash equivalents, net | 36,972 | 50,400 | 35,476 | ||||||||
Change in notes receivable, net | (8,588 | ) | 2,279 | 18,983 | |||||||
Non-controlling interest withdrawal from joint venture, net | (7,756 | ) | — | (9,502 | ) | ||||||
Net cash provided by (used in) investing activities | (30,435 | ) | 177,686 | 142,040 | |||||||
Financing activities | |||||||||||
Short-swing sale profit from shareholder | — | 83 | — | ||||||||
Repurchase of Class A ordinary shares | — | (17,692 | ) | — | |||||||
Net cash provided by (used in) financing activities | — | (17,609 | ) | — | |||||||
Effect of foreign exchange rate changes on cash and cash equivalents | (6,082 | ) | (2,500 | ) | — | ||||||
Net increase (decrease) in cash and cash equivalents | (72,304 | ) | 100,132 | 8,308 | |||||||
Cash and cash equivalents at beginning of the period | 112,162 | 12,030 | 3,722 | ||||||||
Cash and cash equivalents at end of the period | $ | 39,858 | $ | 112,162 | $ | 12,030 | |||||
Supplementary information | |||||||||||
Interest paid in cash | $ | 7,823 | $ | 21,959 | $ | 21,482 | |||||
Income tax paid in cash | — | — | — | ||||||||
Non-cash transfer to notes receivable | — | 25,859 | — | ||||||||
The accompanying Notes to the Consolidated Financial Statements are an
F-6
integral part of the Consolidated Financial Statements.
F-7
GREENLIGHT CAPITAL RE, LTD.
NOTES TO THE CONSOLIDATED FINANCIAL STATEMENTS
Years ended December 31, 2016, 2015 and 2014
1. ORGANIZATION AND BASIS OF PRESENTATION
Greenlight Capital Re, Ltd. (“GLRE”) was incorporated as an exempted company under the Companies Law of the Cayman Islands on July 13, 2004. GLRE’s principal wholly-owned subsidiary, Greenlight Reinsurance, Ltd. (“Greenlight Re”), provides global specialty, property and casualty reinsurance. Greenlight Re has a Class D insurer license issued in accordance with the terms of The Insurance Law, 2010 and underlying regulations thereto (the “Law”) and is subject to regulation by the Cayman Islands Monetary Authority (“CIMA”), in terms of the Law. Greenlight Re commenced underwriting in April 2006. Effective May 30, 2007, GLRE completed an initial public offering of 11,787,500 Class A ordinary shares at $19.00 per share. Concurrently, 2,631,579 Class B ordinary shares of GLRE were sold at $19.00 per share in a private placement offering. During 2008, Verdant Holding Company, Ltd. (“Verdant”), a wholly-owned subsidiary of GLRE, was incorporated in the state of Delaware. During 2010, GLRE established Greenlight Reinsurance Ireland, Designated Activity Company (“GRIL”), a wholly-owned reinsurance subsidiary based in Dublin, Ireland. GRIL is authorized as a non-life reinsurance undertaking in accordance with the provisions of the European Union (Insurance and Reinsurance) Regulations 2015 (“Irish Regulations”). GRIL provides multi-line property and casualty reinsurance capacity to the European broker market and provides GLRE with an additional platform to serve clients located in Europe and North America. As used herein, the “Company” refers collectively to GLRE and its consolidated subsidiaries.
The Class A ordinary shares of GLRE are listed on Nasdaq Global Select Market under the symbol “GLRE”.
These consolidated financial statements are prepared in conformity with accounting principles generally accepted in the United States of America (“U.S. GAAP”). The consolidated financial statements include the accounts of GLRE and the consolidated financial statements of its wholly owned subsidiaries, Greenlight Re, GRIL and Verdant. All significant intercompany transactions and balances have been eliminated on consolidation.
Reclassifications
During the year ended December 31, 2016, the Company revised its classification of the lines of business presented in Note 15 of the consolidated financial statements. As a result the gross written premiums relating to certain lines of business previously reported for the years ended December 31, 2015 and 2014, have been reclassified to conform to the current period presentation. The reclassification resulted in no changes to net income (loss) or retained earnings for any of the periods presented.
2. SIGNIFICANT ACCOUNTING POLICIES
Use of Estimates
The preparation of consolidated financial statements in conformity with U.S. GAAP requires management to make estimates and assumptions that affect the reported amounts of assets and liabilities and disclosure of contingent assets and liabilities at the date of the consolidated financial statements and the reported amounts of income and expenses during the period. Actual results could differ from these estimates.
Cash and Cash Equivalents
Cash and cash equivalents consist of cash and certain short-term, highly liquid investments with original maturity dates of three months or less.
Restricted Cash and Cash Equivalents
The Company is required to maintain certain cash in segregated accounts with prime brokers and derivative counterparties. The amount of restricted cash held by prime brokers is primarily used to support the liability created from securities sold, not yet purchased and derivatives. Additionally, restricted cash and cash equivalent balances are held to collateralize regulatory trusts and letters of credit issued to cedents (see Notes 4 and 6). The amount of cash encumbered varies depending on the market value of the securities sold, not yet purchased, and the collateral required by the cedents in the form of trust accounts and letters of credit. In addition, derivative counterparties require cash collateral to support the current value of any amounts that may be due to the counterparty based on the value of the underlying financial instrument.
F-8
Premium Revenue Recognition
The Company accounts for reinsurance contracts in accordance with U.S. GAAP. In the event that a reinsurance contract does not transfer sufficient risk, deposit accounting is used and the contract is reported as a deposit liability.
The Company writes excess of loss contracts as well as quota share contracts. The Company estimates the ultimate premiums for the entire contract period. These estimates are based on information received from the ceding companies and estimates from actuarial pricing models used by the Company. For excess of loss contracts, the total ultimate estimated premiums are recorded as premiums written at the inception of the contract. For quota share contracts, the premiums are recorded as written based on cession statements from cedents which typically are received monthly or quarterly depending on the terms specified in each contract. For any reporting lag, premiums written are estimated based on the portion of the ultimate estimated premiums relating to the risks underwritten during the lag period.
Premium estimates are reviewed by management at least quarterly. Such review includes a comparison of actual reported premiums to expected ultimate premiums along with a review of the aging and collection of premium estimates. Based on management’s review, the appropriateness of the premium estimates is evaluated, and any adjustments to these estimates are recorded in the period in which they are determined. Changes in premium estimates, including premium receivable on both excess of loss and quota share contracts, are expected and may result in significant adjustments in any period. A significant portion of amounts included in reinsurance balances receivable represent estimated premiums written, net of commissions and brokerage, and are not currently due based on the terms of the underlying contracts.
Certain contracts allow for reinstatement premiums in the event of a full limit loss prior to the expiry of a contract. A reinstatement premium is not due until there is a full limit loss event and therefore, in accordance with U.S. GAAP, the Company records a reinstatement premium as written only in the event that a client incurs a full limit loss on the contract and the contract allows for a reinstatement of coverage upon payment of an additional premium. For catastrophe contracts which contractually require the payment of a reinstatement premium equal to or greater than the original premium upon the occurrence of a full limit loss, the reinstatement premiums are earned over the original contract period. Reinstatement premiums that are contractually calculated on a pro-rata basis of the original premiums, are earned over the remaining coverage period. For additional premiums which are due on a contract that has no remaining coverage period, the additional premiums are earned in full when due.
Certain contracts may provide for a penalty to be paid if the contract is terminated and canceled prior to its expiration term. Cancellation penalties are recognized in the period the notice of cancellation is received and are recorded in the consolidated statements of income under “other income (expense), net”.
Premiums written are generally recognized as earned over the contract period in proportion to the period of risk covered. Unearned premiums consist of the unexpired portion of reinsurance provided.
Reinsurance Premiums Ceded
The Company reduces the risk of future losses on business assumed by reinsuring certain risks and exposures with other reinsurers (retrocessionaires). The Company remains liable to the extent that any retrocessionaire fails to meet its obligations and to the extent the Company does not hold sufficient security for their unpaid obligations.
Ceded premiums are written during the period in which the risks incept and are expensed over the contract period in proportion to the period of protection. Unearned premiums ceded consist of the unexpired portion of reinsurance obtained.
Deferred Acquisition Costs
Policy acquisition costs, such as commission and brokerage costs, relate directly to, and vary with, the writing of reinsurance contracts. Acquisition costs relating solely to bound contracts are deferred subject to ultimate recoverability and are amortized over the related contract term. The Company evaluates the recoverability of deferred acquisition costs by determining if the sum of future earned premiums and anticipated investment income is greater than the expected future claims and expenses. If a loss is probable on the unexpired portion of policies in force, a premium deficiency loss is recognized. At December 31, 2016 and 2015, the deferred acquisition costs were considered fully recoverable and no premium deficiency loss was recorded.
Acquisition costs also include profit commissions which are expensed when incurred. Profit commissions are calculated and accrued based on the expected loss experience for contracts and recorded when the current loss estimate indicates that a
F-9
profit commission is probable under the contract terms. As of December 31, 2016, $15.2 million (2015: $12.2 million) of profit commission reserves were included in reinsurance balances payable on the consolidated balance sheets. For the year ended December 31, 2016, $6.5 million, (2015: $7.5 million, 2014: $2.7 million respectively) of net profit commission expense was included in acquisition costs in the consolidated statements of income.
Funds Withheld
Funds withheld include reinsurance balances retained from retrocessionaires as security for a period of time in accordance with the contract terms. Any interest expense that the Company incurs during the period these funds are withheld, are included under net investment income in the consolidated statements of income.
Loss and Loss Adjustment Expense Reserves and Recoverable
The Company establishes reserves for contracts based on estimates of the ultimate cost of all losses including losses incurred but not reported (“IBNR”). These estimated ultimate reserves are based on the Company’s own actuarial estimates derived from reports received from ceding companies, industry data and historical experience. These estimates are reviewed by the Company periodically on a contract by contract basis and adjusted as necessary. Since reserves are estimates, the final settlement of losses may vary from the reserves established and any adjustments to the estimates, which may be material, are recorded in the period they are determined.
Loss and loss adjustment expenses recoverable include the amounts due from retrocessionaires for unpaid loss and loss adjustment expenses on retrocession agreements. Ceded losses incurred but not reported are estimated based on the Company’s actuarial estimates. These estimates are reviewed periodically and adjusted when deemed necessary. The Company may not be able to ultimately recover the loss and loss adjustment expense recoverable amounts due to the retrocessionaires’ inability to pay. The Company regularly evaluates the financial condition of its retrocessionaires and records provisions for uncollectible reinsurance expenses recoverable when recovery is no longer probable.
Consideration paid by the Company for retroactive reinsurance that meets the conditions for reinsurance accounting (e.g. loss portfolio transfers) are reported as loss and loss adjustment expenses recoverable to the extent those amounts do not exceed the associated liabilities. If the amounts paid for retroactive reinsurance exceed the liabilities, the Company increases the related liabilities, at the time the reinsurance contract is effective, and the excess is charged to net income as losses incurred. If the liabilities exceed the amounts paid, the recoverable balance is increased to reflect the difference, and the resulting gain is deferred and amortized over the estimated loss payout period. Changes in the estimated amount of liabilities relating to the underlying reinsured contracts are recognized in net income in the period of the change.
Notes Receivable
Notes receivable include promissory notes receivable from third party entities. These notes are recorded at cost along with accrued interest, if any, which approximates the fair value. Interest income and realized gains or losses on sale of notes receivable are included under net investment income (loss) in the consolidated statements of income.
The Company regularly reviews all notes receivable individually for impairment and records valuation allowance provisions for uncollectible and non-performing notes. The Company places notes on non-accrual status when the recorded value of the note is not considered impaired but there is uncertainty as to the collection of interest in accordance with the terms of the note. For notes receivable placed on non-accrual status, the notes are recorded excluding any accrued interest amount. The Company resumes accrual of interest on a note when none of the principal or interest remains past due, and the Company expects to collect the remaining contractual principal and interest. Interest collected on notes that are placed on non-accrual status is treated on a cash-basis and recorded as interest income when collected, provided that the recorded value of the note is deemed to be fully collectible. Where doubt exists as to the collectability of the remaining recorded value of the notes placed on non-accrual status, any payments received are applied to reduce the recorded value of the notes.
At December 31, 2016, $18.6 million of notes receivable (net of any valuation allowance) were on non-accrual status
(2015: $23.0 million) and any payments received were applied to reduce the recorded value of the notes.
At December 31, 2016 and 2015, there was no accrued interest included in the notes receivable balance. Based on management’s assessment, the recorded values of the notes receivable, net of valuation allowance, at December 31, 2016 and 2015, were expected to be fully collectible.
F-10
Deposit Assets and Liabilities
In accordance with U.S. GAAP, deposit accounting is used in the event that a reinsurance contract does not transfer sufficient insurance risk, or a contract provides retroactive reinsurance that does not meet the conditions for reinsurance accounting. Any losses on such contracts are charged to earnings immediately. Any gains relating to such contracts are deferred and amortized over the estimated remaining settlement period. All such deferred gains are included in reinsurance balances payable in the consolidated balance sheets. Amortized gains are recorded in the consolidated statements of income as other income. At December 31, 2016 and 2015, there were no material deposit assets or deposit liabilities and no material gains or losses on deposit accounted contracts.
Fixed Assets
Fixed assets are included in other assets on the consolidated balance sheets and are recorded at cost when acquired. Fixed assets are comprised of computer software, furniture and fixtures and leasehold improvements and are depreciated, using the straight-line method, over their estimated useful lives, which are five years for both computer software, and furniture and fixtures. Leasehold improvements are amortized over the lesser of the estimated useful lives of the assets or remaining lease term. The Company periodically reviews fixed assets that have finite lives, and that are not held for sale, for impairment by comparing the carrying value of the assets to their estimated future undiscounted cash flows. For the years ended December 31, 2016, 2015 and 2014, there were no impairments in fixed assets.
At December 31, 2016, the cost, accumulated depreciation and net book values of the fixed assets were as follows:
Cost | Accumulated depreciation | Net book value | |||||||||
($ in thousands) | |||||||||||
Computer software | $ | 556 | $ | (420 | ) | $ | 136 | ||||
Furniture and fixtures | 620 | (569 | ) | 51 | |||||||
Leasehold improvements | 2,002 | (1,491 | ) | 511 | |||||||
Total | $ | 3,178 | $ | (2,480 | ) | $ | 698 | ||||
At December 31, 2015, the cost, accumulated depreciation and net book values of the fixed assets were as follows:
Cost | Accumulated depreciation | Net book value | |||||||||
($ in thousands) | |||||||||||
Computer software | $ | 556 | $ | (348 | ) | $ | 208 | ||||
Furniture and fixtures | 620 | (513 | ) | 107 | |||||||
Leasehold improvements | 2,002 | (1,229 | ) | 773 | |||||||
Total | $ | 3,178 | $ | (2,090 | ) | $ | 1,088 | ||||
Financial Instruments
Investments in Securities and Investments in Securities Sold, Not Yet Purchased
The Company’s investments in debt instruments and equity securities that are classified as “trading securities” are carried at fair value. The fair values of the listed equity investments are derived based on quoted prices (unadjusted) in active markets for identical assets (Level 1 inputs). The fair values of listed equities that have restrictions on sale or transfer which expire within one year, are determined by adjusting the observed market price of the equity using a liquidity discount based on observable market inputs. The fair values of debt instruments are derived based on inputs that are observable, either directly or indirectly, such as market maker or broker quotes reflecting recent transactions (Level 2 inputs), and are generally derived based on the average of multiple market maker or broker quotes which are considered to be binding. Where quotes are not available, debt instruments are valued using cash flow models using assumptions and estimates that may be subjective and non-observable (Level 3 inputs).
The Company’s “other investments” may include investments in private and unlisted equity securities, limited partnerships and commodities, which are all carried at fair value. The fair values of commodities are determined based on quoted prices in active markets for identical assets (Level 1). The Company maximizes the use of observable direct or indirect inputs (Level 2 inputs) when deriving the fair values for “other investments”. For limited partnerships and private and unlisted equity securities, where observable inputs are not available, the fair values are derived based on unobservable inputs (Level 3
F-11
inputs) such as management’s assumptions developed from available information using the services of the investment advisor, including the most recent net asset values obtained from the managers of those underlying investments. For certain private equity fund investments the Company has elected to measure the fair value using the net asset value practical expedient allowed under U.S. GAAP, and accordingly these investments are not classified as Level 1, 2 or 3 in the fair value hierarchy.
For securities classified as “trading securities” and “other investments”, any realized and unrealized gains or losses are determined on the basis of the specific identification method (by reference to cost or amortized cost, as appropriate) and included in net investment income (loss) in the consolidated statements of income.
Dividend income and expense are recorded on the ex-dividend date. The ex-dividend date is the date as of when the underlying security must have been traded to be eligible for the dividend declared. Interest income and interest expense are recorded on an accrual basis.
Derivative Financial Instruments
U.S. GAAP requires that an entity recognize all derivatives in the balance sheet at fair value. It also requires that unrealized gains and losses resulting from changes in fair value be included in income or comprehensive income, depending on whether the instrument qualifies as a hedge transaction, and if so, the type of hedge transaction. The Company’s derivative financial instrument assets are included in financial contracts receivable. Derivative financial instrument liabilities are generally included in financial contracts payable. The Company’s derivatives do not qualify as hedges for financial reporting purposes and are recorded in the consolidated balance sheets on a gross basis and not offset against any collateral pledged or received. Pursuant to the International Swaps and Derivatives Association (“ISDA”) master agreements, securities lending agreements and other agreements, the Company and its counterparties typically have the ability to net certain payments owed to each other in specified circumstances. In addition, in the event a party to one of the ISDA master agreements, securities lending agreements or other agreements defaults, or a transaction is otherwise subject to termination, the non-defaulting party generally has the right to set off outstanding balances due from the defaulting party against payments owed to the defaulting party or collateral held by the non-defaulting party. The Company may from time to time enter into underwriting contracts such as industry loss warranty contracts (“ILW”) that are treated as derivatives for U.S. GAAP purposes.
Financial Contracts
The Company enters into financial contracts with counterparties as part of its investment strategy. Financial contracts, which include total return swaps, credit default swaps (“CDS”), futures, options, currency forwards and other derivative instruments, are recorded at their fair value with any unrealized gains and losses included in net investment income (loss) in the consolidated statements of income. Financial contracts receivable represents derivative contracts whereby, based upon the contract’s current fair value, the Company will be entitled to receive payments upon settlement of the contract. Financial contracts payable represents derivative contracts whereby, based upon each contract’s current fair value, the Company will be obligated to make payments upon settlement of the contract.
Total return swap agreements, included on the consolidated balance sheets as financial contracts receivable and financial contracts payable, are derivative financial instruments whereby the Company is either entitled to receive or obligated to pay the product of a notional amount multiplied by the movement in an underlying security, which the Company may not own, over a specified time frame. In addition, the Company may also be obligated to pay or receive other payments based on interest rates, dividend payments and receipts, or foreign exchange movements during a specified period. The Company measures its rights or obligations to the counterparty based on the fair value movements of the underlying security together with any other payments due. These contracts are carried at fair value, based on observable inputs (Level 2 inputs) with the resultant unrealized gains and losses reflected in net investment income (loss) in the consolidated statements of income. Additionally, any changes in the value of amounts received or paid on swap contracts are reported as a gain or loss in net investment income (loss) in the consolidated statements of income.
Financial contracts may also include exchange traded futures or options contracts that are based on the movement of a particular index, equity security, commodity, currency or interest rate. Where such contracts are traded in an active market, the Company’s obligations or rights on these contracts are recorded at fair value based on the observable quoted prices of the same or similar financial contracts in an active market (Level 1) or on broker quotes which reflect market information based on actual transactions (Level 2). Amounts invested in exchange traded options and over the counter (“OTC”) options are recorded either as an asset or liability at inception. Subsequent to initial recognition, unexpired exchange traded option contracts are recorded at fair value based on quoted prices in active markets (Level 1). For OTC options or exchange traded options where a quoted price in an active market is not available, fair values are derived based upon observable inputs (Level 2) such as multiple quotes from brokers and market makers, which are considered to be binding.
F-12
The Company may purchase and sell CDS for strategic investment purposes. A CDS is a derivative instrument that provides protection against an investment loss due to specified credit or default events of a reference entity. The seller of a CDS guarantees to pay the buyer a specified amount if the reference entity defaults on its obligations or fails to perform. The buyer of a CDS pays a premium over time to the seller in exchange for obtaining this protection. A CDS trading in an active market is valued at fair value based on broker or market maker quotes for identical instruments in an active market (Level 2) or based on the current credit spreads on identical contracts (Level 2).
Share-Based Compensation
The Company has established a stock incentive plan for directors, employees and consultants.
U.S. GAAP requires the Company to recognize share-based compensation transactions using the fair value at the grant date of the award. The Company measures compensation for restricted shares and restricted stock units (“RSUs”) based on the price of the Company’s common shares at the grant date and the expense is recognized on a straight line basis over the vesting period, net of any estimated or expected forfeitures. Effective from the year ended December 31, 2016, the forfeiture rate is estimated based on the Company’s historical actual forfeitures relating to restricted shares and RSUs granted to employees. The forfeiture rate is reviewed annually and adjusted as necessary. No forfeiture rate is used for restricted shares granted to directors which vest over a twelve-month period.
Determining the fair value of share purchase options at the grant date requires significant estimation and judgment. The Company uses an option-pricing model (Black-Scholes option pricing model) to assist in the calculation of fair value for share purchase options. The model requires estimation of various inputs such as estimated term, forfeiture and dividend rates and expected volatility. In determining the grant date fair value, the Company uses the full life of the options, ten years, as the estimated term of the options, and has assumed no forfeitures and no dividends paid during the life of the options. The estimate of expected volatility is based on the daily historical trading data of the Company’s Class A ordinary shares from the date that these shares commenced trading (May 24, 2007) to the grant date.
For share purchase options issued under the employee stock incentive plan, compensation cost is calculated and expensed over the vesting periods on a graded vesting basis (see Note 10).
If actual results differ significantly from these estimates and assumptions, particularly in relation to the Company’s estimation of volatility which requires the most judgment, share-based compensation expense, primarily with respect to future share-based awards, could be materially impacted.
Foreign Exchange
The reporting and functional currency of the Company and all its subsidiaries is the U.S. dollar. Transactions in foreign currencies are recorded in U.S. dollars at the exchange rates in effect on the transaction date. Monetary assets and liabilities in foreign currencies at the balance sheet date are translated at the exchange rate in effect at the balance sheet date and translation exchange gains and losses, if any, are included in “other income (expense), net” in the consolidated statements of income.
Other Assets
Other assets consist primarily of investment income receivable, prepaid expenses, fixed assets and deferred tax assets.
Other Liabilities
Other liabilities consist primarily of dividends payable on securities sold, not yet purchased, and employee bonus accruals. At December 31, 2016, other liabilities included accrued bonus of $9.0 million (2015: $8.2 million). Under the Company’s bonus program, each employee’s target bonus consists of two components: a discretionary component based on a qualitative assessment of each employee’s performance and a quantitative component based on the return on deployed equity (‘‘RODE”) for each underwriting year relating to reinsurance operations. The qualitative portion of an employee’s annual bonus is accrued at each employee’s target amount, which may differ significantly from the actual amount approved and awarded annually by the Compensation Committee. The quantitative portion of each employee’s annual bonus is accrued based on the expected RODE for each underwriting year and adjusted for changes in the expected RODE and actual investment return each quarter until all losses are settled and the underwriting year is declared closed. The quantitative bonus is calculated and paid, with the approval of the Compensation Committee, in annual installments between three to five years from the end of the fiscal year in which the business was underwritten. Any further changes are incorporated into the following open underwriting year. The expected RODE calculation utilizes proprietary models which require significant estimation and judgment. Actual
F-13
RODE may vary significantly from the expected RODE and any adjustments to the quantitative bonus estimates, which may be material, are recorded in the period in which they are determined.
Also included in other liabilities are income taxes payable, dividends payable on investments, and accruals for professional fees and other general expenses.
Non-controlling Interest
Non-controlling interest in joint venture on the consolidated balance sheets represents DME Advisors, LLC’s (‘‘DME”) share of assets in the joint venture whereby DME is a participant in the joint venture as disclosed in Note 13. DME’s share of investment income or loss is included in the consolidated statements of income as income attributable to non-controlling interest in joint venture.
Comprehensive Income (Loss)
The Company has no comprehensive income or loss, other than the net income or loss disclosed in the consolidated statements of income.
Earnings (Loss) Per Share
Basic earnings per share are based on the weighted average number of common shares and participating securities outstanding during the period. Diluted earnings per share includes the dilutive effect of restricted stock units (“RSU”) and additional potential common shares issuable when stock options are exercised and are determined using the treasury stock method. The Company treats its unvested restricted stock as participating securities in accordance with U.S. GAAP, which requires that unvested stock awards which contain non-forfeitable rights to dividends or dividend equivalents, whether paid or unpaid (referred to as “participating securities”), be included in the number of shares outstanding for both basic and diluted earnings per share calculations. In the event of a net loss, all RSUs, stock options outstanding and participating securities are excluded from the calculation of both basic and diluted loss per share since their inclusion would be anti-dilutive.
Year ended December 31 | ||||||||
2016 | 2015 | 2014 | ||||||
Weighted average shares outstanding - basic | 37,267,145 | 36,670,466 | 37,242,687 | |||||
Effect of dilutive service provider share-based awards | — | — | 8,498 | |||||
Effect of dilutive employee and director share-based awards | 72,873 | — | 623,202 | |||||
Weighted average shares outstanding - diluted | 37,340,018 | 36,670,466 | 37,874,387 | |||||
Anti-dilutive stock options outstanding | 435,991 | 211,821 | — | |||||
Participating securities excluded from calculation of loss per share | — | 307,013 | — | |||||
Taxation
Under current Cayman Islands law, no corporate entity, including GLRE and Greenlight Re, is obligated to pay taxes in the Cayman Islands on either income or capital gains. The Company has an undertaking from the Governor-in-Cabinet of the Cayman Islands, pursuant to the provisions of the Tax Concessions Law, as amended, that, in the event that the Cayman Islands enacts any legislation that imposes tax on profits, income, gains or appreciations, or any tax in the nature of estate duty or inheritance tax, such tax will not be applicable to GLRE, Greenlight Re nor their respective operations, or to the Class A or Class B ordinary shares or related obligations, until February 1, 2025.
Verdant is incorporated in Delaware and therefore is subject to taxes in accordance with the U.S. federal rates and regulations prescribed by the U.S. Internal Revenue Service (“IRS”). Verdant’s taxable income is generally expected to be taxed at a rate of 35%.
GRIL is incorporated in Ireland and therefore is subject to the Irish corporation tax rate of 12.5% on its trading income, and 25% on its non-trading income, if any.
Any deferred tax asset is evaluated for recovery and a valuation allowance is recorded when it is more likely than not that the deferred tax asset will not be realized in the future. The Company has not taken any income tax positions that are subject to significant uncertainty or that are reasonably likely to have a material impact on the Company.
F-14
Segment Information
Under U.S. GAAP, operating segments are based on the internal information that management uses for allocating resources and assessing performance as the source of the Company’s reportable segments.
The Company manages its business on the basis of one operating segment, Property and Casualty Reinsurance, in accordance with the qualitative and quantitative criteria established by U.S. GAAP.
Recent Accounting Pronouncements
In May 2015, the FASB issued Accounting Standards Update 2015-07, “Fair Value Measurement (Topic 820): Disclosures for Investments in Certain Entities That Calculate Net Asset Value per Share or Its Equivalent” (“ASU 2015-07”). The amendments apply to reporting entities that elect to measure the fair value of an investment using the net asset value (“NAV”) per share (or its equivalent) as a practical expedient. The amendments remove the requirement to categorize within the fair value hierarchy all investments for which fair value is measured using the NAV per share as a practical expedient. The amendments also remove the requirement to make certain disclosures for all investments that are eligible to be measured at fair value using the NAV per share as a practical expedient. Rather, those disclosures are limited to investments for which the entity has elected to measure the fair value using that practical expedient. The amendments in ASU 2015-07 are effective for reporting periods beginning after December 15, 2015, with early adoption permitted. Entities are required to apply the amendments in this update retrospectively to all periods presented. The Company adopted ASU 2015-07 during the first quarter of 2016. As the Company measures certain investments in private equity funds using the NAV as a practicable expedient, upon adoption of ASU 2015-07, the fair value of these investments was removed from the fair value hierarchy for all periods presented in the Company’s consolidated financial statements. The Company will continue to disclose information on those investments for which fair value is measured at NAV as a practical expedient. Please refer to Note 3 “Financial Instruments” for the updated fair value hierarchy tables.
In May 2015, the FASB issued ASU 2015-09, “Financial Services - Insurance (Topic 944): Disclosures about Short-Duration Contracts” (“ASU 2015-09”). ASU 2015-09 requires additional disclosures for short-duration contracts including incurred and paid claims development information, claims duration information, quantitative claims frequency information (unless impracticable), and an explanation of significant changes in methodologies and assumptions used to calculate the loss and loss adjustment expense reserves. ASU 2015-09 is effective for public entities for annual reporting periods beginning after December 15, 2015, and interim reporting periods within annual reporting periods beginning after December 15, 2016 with early adoption permitted. The Company adopted ASU 2015-09 during 2016 and disclosed the additional information in its consolidated financial statements for the fiscal year ending December 31, 2016 and will begin disclosures of the interim requirements commencing from the first quarter of 2017. Please refer to Note 7 “Loss and Loss Adjustments Expense Reserves” for the disclosures relating to ASU 2015-09.
In January 2016, the FASB issued ASU 2016-01, “Financial Instruments – Overall (Subtopic 825-10): Recognition and Measurement of Financial Assets and Financial Liabilities” (“ASU 2016-01”). The new guidance is intended to improve the recognition and measurement of financial instruments. ASU 2016-01, among other things, requires equity investments to be measured at fair value with changes in fair value recognized in net income or loss, requires public business entities to use the exit price notion when measuring the fair value of financial instruments for disclosure purposes and requires separate presentation of financial assets and financial liabilities by measurement category and form of financial asset. ASU 2016-01 affects public and private companies, not-for-profit organizations, and employee benefit plans that hold financial assets or owe financial liabilities. The new guidance is effective for public companies for fiscal years beginning after December 15, 2017, including interim periods within those fiscal years. The Company is in the process of evaluating the impact of adopting ASU 2016-01 on the Company’s consolidated financial statements. However, the adoption of this guidance is not expected to have a significant impact on the Company’s net income or loss or retained earnings since the Company’s investments are currently classified as “trading” and the unrealized gains and losses are already recognized in net income or loss.
In February 2016, the FASB issued ASU 2016-02, “Leases (Topic 842)” (“ASU 2016-02”). Under the new guidance, lessees will be required to recognize the following for all leases (with the exception of short-term leases) at the commencement date: a lease liability, which is a lessee’s obligation to make lease payments arising from a lease, measured on a discounted basis; and a right-of-use asset, which is an asset that represents the lessee’s right to use, or control the use of, a specified asset for the lease term. ASU 2016-02 is effective for public companies for fiscal years beginning after December 15, 2018, including interim periods within those fiscal years. Early adoption is permitted for any organization in any interim or annual period. The Company currently has two operating leases for its office spaces as disclosed in Note 14 of the consolidated financial statements. The Company is in the process of evaluating the impact of adopting ASU 2016-02 on the Company’s consolidated
F-15
financial statements and anticipates implementing ASU 2016-02 during the first quarter of fiscal year 2019. The Company currently has two operating leases for its office spaces as disclosed in Note 14 of the consolidated financial statements.
In March 2016, the FASB issued ASU 2016-09, “Compensation - Stock Compensation (Topic 718): Improvements to Employee Share-Based Payment Accounting” (“ASU 2016-09”). ASU 2016-09 is intended to improve the accounting for employee share-based payments and affects all organizations that issue share-based payment awards to their employees. Several aspects of the accounting for share-based payment award transactions are simplified, including: (a) income tax consequences; (b) classification of awards as either equity or liabilities; and (c) classification on the statement of cash flows. The amendments are effective for annual periods beginning after December 15, 2016, and interim periods within those annual periods. Early adoption is permitted for any organization in any interim or annual period. The Company anticipates adopting ASU 2016-09 during the first quarter of fiscal year 2017 and does not expect the adoption of ASU 2016-09 to have a material impact on the Company’s consolidated financial statements.
In June 2016, the FASB issued ASU 2016-13, “Financial Instruments - Credit Losses (Topic 326): Measurements of Credit Losses on Financial Instruments” (“ASU 2016-13”). ASU 2016-13 amends the guidance on reporting credits losses and affects loans, debt securities, trade receivables, reinsurance recoverables and other financial assets that have the contractual right to receive cash. The amendments are effective for annual periods beginning after December 15, 2019, and interim periods within those annual periods. Early adoption is permitted for any organization for annual periods beginning after December 15, 2018 and interim periods within those annual periods. The Company is in the process of evaluating the impact of the requirements of ASU 2016-13 on the Company’s consolidated financial statements and anticipates implementing ASU 2016-13 during the first quarter of fiscal year 2020.
In November 2016, the FASB issued ASU 2016-18, “Statements of Cash Flows - Restricted Cash (Topic 230)” (“ASU 2016-18”). ASU 2016-18 requires restricted cash and cash equivalents to be included with cash and cash equivalents in the statement of cash flows and disclose the nature of the restrictions on cash and cash equivalents. ASU 2016-18 is effective for annual periods beginning after December 15, 2017, and interim periods within those fiscal years. Early adoption is permitted. The Company currently separately discloses the restrictions on cash and cash equivalents in Note 6 of the consolidated financial statements and expects to continue these disclosures since ASU 2016-18 does not change the requirement in Regulation S-X (Rule 5-02) to separately disclose cash and cash equivalents that have restrictions on withdrawal or use. The Company currently presents changes in restricted cash and cash equivalents under investing activities in the consolidated statements of cash flows. Upon adoption of ASU 2016-18, the Company will amend the presentation in the statement of cash flows to include the restricted cash and cash equivalents with cash and cash equivalents in the consolidated statements of cash flows and will retrospectively reclassify all periods presented.
3. FINANCIAL INSTRUMENTS
In the normal course of its business, the Company purchases and sells various financial instruments, which include listed and unlisted equities, corporate and sovereign debt, commodities, futures, put and call options, currency forwards, other derivatives and similar instruments sold, not yet purchased.
The Company is exposed to credit risk in relation to counterparties that may default on their obligations to the Company. The amount of counterparty credit risk predominantly relates to the value of financial contracts receivable and assets held at counterparties. The Company mitigates its counterparty credit risk by using several counterparties, which decreases the likelihood of any significant concentration of credit risk with any one counterparty. The Company mitigates its exposure to counterparty risk by obtaining collateral from its counterparties based on the value of the financial contracts receivable. In addition, the Company is exposed to credit risk on corporate and sovereign debt instruments to the extent that the debtors may default on their debt obligations.
The Company is exposed to market risk including interest rate and foreign exchange fluctuations on financial instruments that are valued at market prices. Market movements can be volatile and difficult to predict. This may affect the ultimate gains or losses realized upon the sale of its holdings as well as the amount of net investment income reported in the consolidated statements of income. Management utilizes the services of the Company’s investment advisor to monitor the Company’s positions to reduce the risk of potential loss due to changes in market values. The investment advisor may be limited in its ability to trade certain investments on behalf of the Company.
Purchases and sales of investments are disclosed in the consolidated statements of cash flows. Net realized losses on the sale of investments, financial contracts, and investments sold, not yet purchased during 2016 were $113.8 million (2015: $22.2 million gains, 2014: $352.1 million gains). Gross realized gains were $188.7 million (2015: $350.5 million, 2014: $596.6 million) and gross realized losses were $302.5 million (2015: $328.3 million, 2014: $244.5 million). For the year ended December 31, 2016, included in net investment income in the consolidated statements of income were $210.0 million of net
F-16
gains (2015: $265.4 million of net losses, 2014: $187.8 million of net losses) relating to change in unrealized gains and losses on trading securities still held at the balance sheet date.
As of December 31, 2016, cash and investments with a fair value of $310.9 million (2015: $324.3 million) have been pledged as security against letters of credit issued, and $86.4 million (2015: $78.6 million) have been pledged as security relating to regulatory trusts.
As of December 31, 2016, the Company’s investments in gold and gold derivatives and General Motors (GM) were the only investments in excess of 10% of the Company’s shareholders’ equity, with fair values of $137.3 million, or 15.4%, and $92.9 million, or 10.4%, respectively, of shareholders’ equity.
As of December 31, 2015, the Company’s investment in gold and gold derivatives, was the only investment in excess of 10% of the Company’s shareholders’ equity, with a fair value of $98.0 million, or 11.6%, of shareholders’ equity.
Fair Value Hierarchy
The Company’s financial instruments are carried at fair value, and the net unrealized gains or losses are included in net investment income (loss) in the consolidated statements of income.
The following table presents the Company’s investments, categorized by the level of the fair value hierarchy as of December 31, 2016:
Fair value measurements as of December 31, 2016 | ||||||||||||||||
Description | Quoted prices in active markets (Level 1) | Significant other observable inputs (Level 2) | Significant unobservable inputs (Level 3) | Total | ||||||||||||
($ in thousands) | ||||||||||||||||
Assets: | ||||||||||||||||
Debt instruments | $ | — | $ | 21,819 | $ | 654 | $ | 22,473 | ||||||||
Listed equity securities | 823,421 | 20,580 | — | 844,001 | ||||||||||||
Commodities | 137,296 | — | — | 137,296 | ||||||||||||
Private and unlisted equity securities | — | — | 6,109 | 6,109 | ||||||||||||
$ | 960,717 | $ | 42,399 | $ | 6,763 | $ | 1,009,879 | |||||||||
Private equity funds measured at net asset value (1) | 12,658 | |||||||||||||||
Total investments | $ | 1,022,537 | ||||||||||||||
Financial contracts receivable | $ | 20 | $ | 76,361 | $ | — | $ | 76,381 | ||||||||
Liabilities: | ||||||||||||||||
Listed equity securities, sold not yet purchased | $ | (770,267 | ) | $ | — | — | $ | (770,267 | ) | |||||||
Debt instruments, sold not yet purchased | — | (89,635 | ) | — | (89,635 | ) | ||||||||||
Total securities sold, not yet purchased | $ | (770,267 | ) | $ | (89,635 | ) | — | $ | (859,902 | ) | ||||||
Financial contracts payable | $ | — | $ | (2,237 | ) | — | $ | (2,237 | ) | |||||||
(1) Investments measured at fair value using the net asset value practical expedient have not been classified in the fair value hierarchy. The fair value amounts are presented in the above table to facilitate reconciliation to the consolidated balance sheets.
F-17
The following table presents the Company’s investments, categorized by the level of the fair value hierarchy as of December 31, 2015:
Fair value measurements as of December 31, 2015 | ||||||||||||||||
Description | Quoted prices in active markets (Level 1) | Significant other observable inputs (Level 2) | Significant unobservable inputs (Level 3) | Total | ||||||||||||
($ in thousands) | ||||||||||||||||
Assets: | ||||||||||||||||
Debt instruments | $ | — | $ | 38,582 | $ | 505 | $ | 39,087 | ||||||||
Listed equity securities | 900,369 | 5,625 | — | 905,994 | ||||||||||||
Commodities | 98,046 | — | — | 98,046 | ||||||||||||
Private and unlisted equity securities | — | — | 8,452 | 8,452 | ||||||||||||
$ | 998,415 | $ | 44,207 | $ | 8,957 | $ | 1,051,579 | |||||||||
Private equity funds measured at net asset value (1) | 12,585 | |||||||||||||||
Total investments | $ | 1,064,164 | ||||||||||||||
Financial contracts receivable | $ | 20 | $ | 13,195 | $ | — | $ | 13,215 | ||||||||
Liabilities: | ||||||||||||||||
Listed equity securities, sold not yet purchased | $ | (808,481 | ) | $ | — | $ | — | $ | (808,481 | ) | ||||||
Debt instruments, sold not yet purchased | — | (74,425 | ) | — | (74,425 | ) | ||||||||||
Total securities sold, not yet purchased | $ | (808,481 | ) | $ | (74,425 | ) | $ | — | $ | (882,906 | ) | |||||
Financial contracts payable | $ | (488 | ) | $ | (27,757 | ) | $ | — | $ | (28,245 | ) | |||||
(1) Investments measured at fair value using the net asset value practical expedient have not been classified in the fair value hierarchy. The fair value amounts are presented in the above table to facilitate reconciliation to the consolidated balance sheets.
The following table presents the reconciliation of the balances for all investments measured at fair value using significant unobservable inputs (Level 3) for the year ended December 31, 2016:
Fair Value Measurements Using Significant Unobservable Inputs (Level 3) | ||||||||||||
Year ended December 31, 2016 | ||||||||||||
Assets | ||||||||||||
Debt instruments | Private and unlisted equity securities | Total | ||||||||||
($ in thousands) | ||||||||||||
Beginning balance | $ | 505 | $ | 8,452 | $ | 8,957 | ||||||
Purchases | — | — | — | |||||||||
Sales | — | (2,539 | ) | (2,539 | ) | |||||||
Total realized and unrealized gains (losses) and amortization included in earnings, net | 149 | 196 | 345 | |||||||||
Transfers into Level 3 | — | — | — | |||||||||
Transfers out of Level 3 | — | — | — | |||||||||
Ending balance | $ | 654 | $ | 6,109 | $ | 6,763 | ||||||
There were no transfers between Level 1, Level 2 or Level 3 during the year ended December 31, 2016.
F-18
The following table presents the reconciliation of the balances for all investments measured at fair value using significant unobservable inputs (Level 3) for the year ended December 31, 2015:
Fair Value Measurements Using Significant Unobservable Inputs (Level 3) | ||||||||||||||||||||||||
Year ended December 31, 2015 | ||||||||||||||||||||||||
Assets | Liabilities | |||||||||||||||||||||||
Debt instruments | Private and unlisted equity securities (1) | Financial contracts receivable | Listed equity securities | Total | Financial contracts payable | |||||||||||||||||||
($ in thousands) | ||||||||||||||||||||||||
Beginning balance | $ | 22,259 | $ | 6,449 | $ | — | $ | — | $ | 28,708 | $ | — | ||||||||||||
Purchases | — | 1,769 | 2,340 | — | 4,109 | — | ||||||||||||||||||
Sales | (21,561 | ) | (41 | ) | — | — | (21,602 | ) | — | |||||||||||||||
Total realized and unrealized gains (losses) and amortization included in earnings, net | (193 | ) | 275 | (3,027 | ) | (692 | ) | (3,637 | ) | 314 | ||||||||||||||
Transfers into Level 3 | — | — | 2,536 | 5,189 | 7,725 | 8,835 | ||||||||||||||||||
Transfers out of Level 3 | — | — | (1,849 | ) | (4,497 | ) | (6,346 | ) | (9,149 | ) | ||||||||||||||
Ending balance | $ | 505 | $ | 8,452 | $ | — | $ | — | $ | 8,957 | $ | — | ||||||||||||
(1) Restated to exclude investments measured at fair value using the net asset value practical expedient which are no longer classified in the fair value hierarchy.
During the year ended December 31, 2015, $5.2 million of equity securities that were listed on the Athens Stock Exchange (the “ASE”) were transferred from Level 1 to Level 3 due to trading being halted after June 26, 2015 for all equity securities listed on the ASE. As of June 30, 2015 there was no active market with observable trading prices to determine the fair values of these securities. Therefore, the fair values for these securities, as of June 30, 2015, were based on the last trading price of these securities on the ASE and adjusted for the estimated decline in the fair value of American depository receipts of other comparable securities for the period from June 27, 2015 to June 30, 2015. The ASE resumed trading on August 3, 2015 and the fair values of the ASE listed equity securities were once again based on observable prices in an active market. Therefore, $4.5 million of listed equity securities were transferred from Level 3 to Level 1 securities during the year ended December 31, 2015.
The fair values for derivatives for which the underlying securities traded on the ASE were also transferred to Level 3 securities during 2015 when the ASE halted trading, and were subsequently transferred out of Level 3 securities when the ASE resumed trading. Therefore, for the year ended December 31, 2015, $2.5 million and $8.8 million of financial contracts receivable and financial contracts payable, respectively, were transfered from Level 2 to Level 3 due to the fair values being based on unobservable inputs during the period that the ASE had halted trading. During the year ended December 31, 2015, $1.8 million of financial contracts receivable and $9.1 million of financial contracts payable, respectively, were transfered from Level 3 to Level 2 as fair values were based on observable inputs once the ASE resumed trading.
There were no other transfers between Level 1, Level 2 or Level 3 during the year ended December 31, 2015.
As of December 31, 2016, the Company held investments in private equity funds of $12.7 million (December 31, 2015: $12.6 million) with fair values measured using the unadjusted net asset values as reported by the managers of these funds as a practical expedient. Some of these net asset values were reported from periods prior to December 31, 2016. The private equity funds have varying lock-up periods and, as of December 31, 2016, all of the funds had redemption restrictions. The redemption restrictions have been in place since inception of the investments and are not expected to lapse in the near future. As of December 31, 2016, the Company had $9.2 million (December 31, 2015: $6.1 million) of unfunded commitments relating to private equity funds whose fair values are determined based on unadjusted net asset values reported by the managers of these funds. These commitments are included in the amounts presented in the schedule of commitments and contingencies in Note 14 of these consolidated financial statements.
For the year ended December 31, 2016, included in net investment income in the consolidated statements of income were net realized losses relating to Level 3 securities of $1.4 million (2015: net realized losses of $1.4 million). In addition, for the
F-19
year ended December 31, 2016, amortization expense of nil (2015: $2.3 million) relating to financial contracts receivable, valued using unobservable inputs, was included in the consolidated statements of income as “other income (expense), net”.
For Level 3 securities still held as of the reporting date, the change in net unrealized gain for the year ended December 31, 2016 of $0.3 million (2015: net unrealized gains $0.6 million), were included in net investment income (loss) in the consolidated statements of income.
Investments
Debt instruments, trading
At December 31, 2016, the following investments were included in debt instruments:
Cost/ amortized cost | Unrealized gains | Unrealized losses | Fair value | |||||||||||||
($ in thousands) | ||||||||||||||||
Corporate debt – U.S. | $ | 21,294 | $ | 6,509 | $ | (5,331 | ) | $ | 22,472 | |||||||
Corporate debt – Non U.S. | 2,109 | — | (2,108 | ) | 1 | |||||||||||
Total debt instruments | $ | 23,403 | $ | 6,509 | $ | (7,439 | ) | $ | 22,473 | |||||||
At December 31, 2015, the following investments were included in debt instruments:
Cost/ amortized cost | Unrealized gains | Unrealized losses | Fair value | |||||||||||||
($ in thousands) | ||||||||||||||||
Corporate debt – U.S. | $ | 25,674 | $ | 155 | $ | (5,519 | ) | $ | 20,310 | |||||||
Corporate debt – Non U.S. | 2,109 | — | (1,795 | ) | 314 | |||||||||||
Sovereign debt – Non U.S. | 17,688 | 1,225 | (450 | ) | 18,463 | |||||||||||
Total debt instruments | $ | 45,471 | $ | 1,380 | $ | (7,764 | ) | $ | 39,087 | |||||||
The maturity distribution for debt instruments held at December 31, 2016 and 2015, was as follows:
2016 | 2015 | |||||||||||||||
Cost/ amortized cost | Fair value | Cost/ amortized cost | Fair value | |||||||||||||
($ in thousands) | ||||||||||||||||
Within one year | $ | — | $ | — | $ | — | $ | — | ||||||||
From one to five years | 17,803 | 19,492 | 4,202 | 4,129 | ||||||||||||
From five to ten years | 4,649 | 2,327 | 18,840 | 14,780 | ||||||||||||
More than ten years | 951 | 654 | 22,429 | 20,178 | ||||||||||||
$ | 23,403 | $ | 22,473 | $ | 45,471 | $ | 39,087 | |||||||||
Equity securities, trading
At December 31, 2016, the following long positions were included in equity securities, trading:
Cost | Unrealized gains | Unrealized losses | Fair value | |||||||||||||
($ in thousands) | ||||||||||||||||
Equities – listed | $ | 753,813 | $ | 115,379 | $ | (40,706 | ) | $ | 828,486 | |||||||
Exchange traded funds | 15,056 | 459 | — | 15,515 | ||||||||||||
Total equity securities | $ | 768,869 | $ | 115,838 | $ | (40,706 | ) | $ | 844,001 | |||||||
F-20
At December 31, 2015, the following long positions were included in equity securities, trading:
Cost | Unrealized gains | Unrealized losses | Fair value | |||||||||||||
($ in thousands) | ||||||||||||||||
Equities – listed | $ | 1,011,424 | $ | 67,114 | $ | (187,885 | ) | $ | 890,653 | |||||||
Exchange traded funds | 31,570 | — | (16,229 | ) | 15,341 | |||||||||||
Total equity securities | $ | 1,042,994 | $ | 67,114 | $ | (204,114 | ) | $ | 905,994 | |||||||
Other Investments
“Other investments” include commodities and private and unlisted equity securities. As of December 31, 2016 and 2015, all commodities were comprised of gold bullion.
At December 31, 2016, the following securities were included in other investments:
Cost | Unrealized gains | Unrealized losses | Fair value | |||||||||||||
($ in thousands) | ||||||||||||||||
Commodities | $ | 130,671 | $ | 6,625 | $ | — | $ | 137,296 | ||||||||
Private and unlisted equity securities | 14,418 | 4,375 | (26 | ) | 18,767 | |||||||||||
$ | 145,089 | $ | 11,000 | $ | (26 | ) | $ | 156,063 | ||||||||
At December 31, 2015, the following securities were included in other investments:
Cost | Unrealized gains | Unrealized losses | Fair value | |||||||||||||
($ in thousands) | ||||||||||||||||
Commodities | $ | 102,092 | $ | — | $ | (4,046 | ) | $ | 98,046 | |||||||
Private and unlisted equity securities | 18,720 | 3,491 | (1,174 | ) | 21,037 | |||||||||||
$ | 120,812 | $ | 3,491 | $ | (5,220 | ) | $ | 119,083 | ||||||||
Investments in Securities Sold, Not Yet Purchased
Securities sold, not yet purchased are securities that the Company has sold, but does not own, in anticipation of a decline in the market value of the security. The Company’s risk is that the value of the security will increase rather than decline. Consequently, the settlement amount of the liability for securities sold, not yet purchased may exceed the amount recorded in the consolidated balance sheet as the Company is obligated to purchase the securities sold, not yet purchased in the market at prevailing prices to settle its obligations. To establish a position in a security sold, not yet purchased, the Company needs to borrow the security for delivery to the buyer. On each day the transaction is open, the liability for the obligation to replace the borrowed security is marked-to-market and an unrealized gain or loss is recorded. At the time the transaction is closed, the Company realizes a gain or loss equal to the difference between the price at which the security was sold and the cost of replacing the borrowed security. While the transaction is open, the Company will also incur an expense for any dividends or interest which will be paid to the lender of the securities.
At December 31, 2016, the following securities were included in investments in securities sold, not yet purchased:
Proceeds | Unrealized gains | Unrealized losses | Fair value | |||||||||||||
($ in thousands) | ||||||||||||||||
Equities – listed | $ | (690,270 | ) | $ | 30,768 | $ | (110,765 | ) | $ | (770,267 | ) | |||||
Sovereign debt – Non U.S. | (96,230 | ) | 6,595 | — | (89,635 | ) | ||||||||||
$ | (786,500 | ) | $ | 37,363 | $ | (110,765 | ) | $ | (859,902 | ) | ||||||
F-21
At December 31, 2015, the following securities were included in investments in securities sold, not yet purchased:
Proceeds | Unrealized gains | Unrealized losses | Fair value | |||||||||||||
($ in thousands) | ||||||||||||||||
Equities – listed | $ | (803,842 | ) | $ | 102,469 | $ | (94,681 | ) | $ | (796,054 | ) | |||||
Exchange traded funds | (9,572 | ) | — | (2,855 | ) | (12,427 | ) | |||||||||
Sovereign debt – Non U.S. | (77,443 | ) | 3,018 | — | (74,425 | ) | ||||||||||
$ | (890,857 | ) | $ | 105,487 | $ | (97,536 | ) | $ | (882,906 | ) | ||||||
Financial Contracts
As of December 31, 2016 and 2015, the Company had entered into total return equity swaps, interest rate swaps, commodity swaps, options, warrants, rights, futures and forward contracts with various financial institutions to meet certain investment objectives. Under the terms of each of these financial contracts, the Company is either entitled to receive or is obligated to make payments, which are based on the product of a formula contained within each contract that includes the change in the fair value of the underlying or reference security.
In addition, during the year ended December 31, 2015, the Company had entered into an ILW with certain third-parties in order to purchase protection against worldwide wind and earthquake exposures from January 2015 to December 2015. In return for a fixed payment, the Company is entitled to receive a variable payment in the event of losses incurred by the insurance industry, as a whole, exceeding a specified threshold. During the year ended December 31, 2015, there was no industry loss event occurring that triggered a recovery under the ILW.
At December 31, 2016, the fair values of financial contracts outstanding were as follows:
Financial Contracts | Listing currency (1) | Notional amount of underlying instruments | Fair value of net assets (obligations) on financial contracts | ||||||
($ in thousands) | |||||||||
Financial contracts receivable | |||||||||
Call options | USD | 134,495 | $ | 26,508 | |||||
Commodity Swaps | USD | 82,009 | 13,506 | ||||||
Interest rate swaps | JPY | 20,490 | 218 | ||||||
Put options (2) | USD | 115,481 | 6,703 | ||||||
Total return swaps – equities | EUR/GBP/USD | 100,199 | 29,413 | ||||||
Warrants and rights on listed equities | EUR/USD | 67 | 33 | ||||||
Total financial contracts receivable, at fair value | $ | 76,381 | |||||||
Financial contracts payable | |||||||||
Forwards | KRW | 6,880 | (118 | ) | |||||
Put options | USD | 815 | (172 | ) | |||||
Total return swaps – equities | EUR/GBP/KRW/RON/USD | 31,257 | (1,947 | ) | |||||
Total financial contracts payable, at fair value | $ | (2,237 | ) | ||||||
(1) USD = US Dollar; EUR = Euro; GBP = British Pound; JPY = Japanese Yen; KRW = Korean Won; RON = Romanian New Leu.
(2) Includes options on the Japanese Yen and the Chinese Yuan, denominated in U.S. dollars.
F-22
At December 31, 2015, the fair values of financial contracts outstanding were as follows:
Financial Contracts | Listing currency (1) | Notional amount of underlying instruments | Fair value of net assets (obligations) on financial contracts | ||||||
($ in thousands) | |||||||||
Financial contracts receivable | |||||||||
Call options (2) | USD | 47,259 | $ | 657 | |||||
Put options (3) | USD | 147,326 | 8,790 | ||||||
Total return swaps – equities | EUR/GBP/USD | 50,205 | 3,748 | ||||||
Warrants and rights on listed equities | EUR | 59 | 20 | ||||||
Total financial contracts receivable, at fair value | $ | 13,215 | |||||||
Financial contracts payable | |||||||||
Call options | USD | 2,601 | $ | (64 | ) | ||||
Commodity Swaps | USD | 42,160 | (12,784 | ) | |||||
Forwards | KRW | 2,908 | (22 | ) | |||||
Futures | USD | 21,195 | (488 | ) | |||||
Total return swaps – equities | EUR/GBP/HKD/RON/MXN/USD | 71,874 | (14,887 | ) | |||||
Total financial contracts payable, at fair value | $ | (28,245 | ) | ||||||
(1) USD = US Dollar; EUR = Euro; GBP = British Pound; HKD = Hong Kong Dollar; KRW = Korean Won; MXN = Mexican Peso; RON = Romanian New Leu.
(2) Includes options on interest rate futures relating to U.S. dollar LIBOR interest rates.
(3) Includes options on the Japanese Yen and the Chinese Yuan, denominated in U.S. dollars.
Options are derivative financial instruments that give the buyer, in exchange for a premium payment, the right, but not the obligation, to either purchase from (call option) or sell to (put option) the writer, a specified underlying security at a specified price on or before a specified date. The Company enters into option contracts to meet certain investment objectives. For exchange traded option contracts, the exchange acts as the counterparty to specific transactions and therefore bears the risk of delivery to and from counterparties of specific positions.
As of December 31, 2016, the Company held $6.7 million OTC put options (long) (December 31, 2015: $8.7 million) and $22.4 million OTC call options (long) (December 31, 2015: $0.7 million).
F-23
During the years ended December 31, 2016, 2015 and 2014, the Company reported gains and losses on derivatives as follows:
Derivatives not designated as hedging instruments | Location of gains and losses on derivatives recognized in income | Gain (loss) on derivatives recognized in income | ||||||||||||
Year ended December 31 | ||||||||||||||
2016 | 2015 | 2014 | ||||||||||||
($ in thousands) | ||||||||||||||
Commodity swaps | Net investment income (loss) | $ | 10,474 | $ | (12,061 | ) | $ | — | ||||||
Credit default swaps, purchased – corporate debt | Net investment income (loss) | — | (156 | ) | (345 | ) | ||||||||
Credit default swaps, purchased – sovereign debt | Net investment income (loss) | — | (90 | ) | (298 | ) | ||||||||
Forwards | Net investment income (loss) | (302 | ) | 1,009 | (490 | ) | ||||||||
Futures | Net investment income (loss) | 376 | (952 | ) | 16,721 | |||||||||
Interest rate options | Net investment income (loss) | — | — | (26 | ) | |||||||||
Interest rate swaps | Net investment income (loss) | 218 | (706 | ) | — | |||||||||
Options, warrants, and rights | Net investment income (loss) | 10,261 | (13,955 | ) | 1,020 | |||||||||
Total return swaps – equities | Net investment income (loss) | 28,612 | (12,590 | ) | 13,142 | |||||||||
Weather derivative swap | Other income (expense), net | — | (2,340 | ) | — | |||||||||
Total | $ | 49,639 | $ | (41,841 | ) | $ | 29,724 | |||||||
The Company generally does not enter into derivatives for risk management or hedging purposes. The volume of derivative activities varies from period to period depending on potential investment opportunities.
For the year ended December 31, 2016, the Company’s volume of derivative activities (based on notional amounts) was as follows:
Year ended December 31, 2016 | ||||||||
Derivatives not designated as hedging instruments (notional amounts) | Entered | Exited | ||||||
($ in thousands) | ||||||||
Commodity swaps | $ | 141,534 | $ | 100,045 | ||||
Forwards | 6,880 | 3,128 | ||||||
Futures | 1,966,368 | 1,988,782 | ||||||
Interest rate swaps | 20,490 | — | ||||||
Options, warrants and rights (1) | 462,429 | 366,285 | ||||||
Total return swaps | 86,688 | 59,810 | ||||||
Total | $ | 2,684,389 | $ | 2,518,050 | ||||
(1) Exited amount excludes derivatives which expired or were exercised during the period.
F-24
For the year ended December 31, 2015, the Company’s volume of derivative activities (based on notional amounts) was as follows:
Year ended December 31, 2015 | ||||||||
Derivatives not designated as hedging instruments (notional amounts) | Entered | Exited | ||||||
($ in thousands) | ||||||||
Forwards | $ | — | $ | 13,377 | ||||
Futures | 311,536 | 294,441 | ||||||
Interest rate swaps | 9,139,000 | 7,213,000 | ||||||
Options, warrants and rights (1) | 661,103 | 341,702 | ||||||
Commodity swaps | 103,358 | 43,261 | ||||||
Total return swaps | 67,844 | 185,128 | ||||||
Weather derivative swap | 12,000 | 12,000 | ||||||
Total | $ | 10,294,841 | $ | 8,102,909 | ||||
(1) Exited amount excludes derivatives which expired or were exercised during the period.
The Company does not offset its derivative instruments and presents all amounts in the consolidated balance sheets on a gross basis. The Company has pledged cash collateral to derivative counterparties to support the current value of amounts due to the counterparties on its derivative instruments.
As of December 31, 2016, the gross and net amounts of derivative instruments and the cash collateral applicable to derivative instruments were as follows:
December 31, 2016 | (i) | (ii) | (iii) = (i) - (ii) | (iv) Gross amounts not offset in the balance sheet | (v) = (iii) + (iv) | |||||||||||||||||||
Description | Gross amounts of recognized assets (liabilities) | Gross amounts offset in the balance sheet | Net amounts of assets (liabilities) presented in the balance sheet | Financial instruments available for offset | Cash collateral (received) pledged | Net amount of asset (liability) | ||||||||||||||||||
($ in thousands) | ||||||||||||||||||||||||
Financial contracts receivable | $ | 76,381 | $ | — | $ | 76,381 | $ | (938 | ) | $ | (44,572 | ) | $ | 30,871 | ||||||||||
Financial contracts payable | (2,237 | ) | — | (2,237 | ) | 938 | 1,299 | — | ||||||||||||||||
As of December 31, 2015, the gross and net amounts of derivative instruments and the cash collateral applicable to derivative instruments were as follows:
December 31, 2015 | (i) | (ii) | (iii) = (i) - (ii) | (iv) Gross amounts not offset in the balance sheet | (v) = (iii) + (iv) | |||||||||||||||||||
Description | Gross amounts of recognized assets (liabilities) | Gross amounts offset in the balance sheet | Net amounts of assets (liabilities) presented in the balance sheet | Financial instruments available for offset | Cash collateral (received) pledged | Net amount of asset (liability) | ||||||||||||||||||
($ in thousands) | ||||||||||||||||||||||||
Financial contracts receivable | $ | 13,215 | $ | — | $ | 13,215 | $ | (8,937 | ) | $ | (2,036 | ) | $ | 2,242 | ||||||||||
Financial contracts payable | (28,245 | ) | — | (28,245 | ) | 8,937 | 19,308 | — | ||||||||||||||||
F-25
4. DUE TO PRIME BROKERS
As of December 31, 2016, the amount due to prime brokers is comprised of margin-borrowing from prime brokers relating to investments purchased on margin as well as margin-borrowing for providing collateral to support some of the Company’s outstanding letters of credit and trust accounts (see Notes 6 and 14). Under term margin agreements and certain letter of credit facility agreements, the Company pledges certain investment securities to borrow cash from the prime brokers. The borrowed cash is placed in a custodial account in the name of the Company and this custodial account provides collateral for any letters of credit issued. Similarly for the trust accounts, the Company may borrow cash from prime brokers which is placed in a trust account for the benefit of the cedent. Since there is no legal right of offset, the Company’s liability for the cash borrowed from the prime brokers is included on the consolidated balance sheets as due to prime brokers while the cash held in the custodial account and trust account is included on the consolidated balance sheets as restricted cash and cash equivalents.
Greenlight Re’s investment guidelines, among other stipulations in the guidelines, allow for up to 15% (GRIL: 5%) net margin leverage for extended periods of time and up to 30% (GRIL: 20%) net margin leverage relating to investing activities for periods of less than 30 days.
5. CASH AND CASH EQUIVALENTS
December 31, 2016 | December 31, 2015 | |||||||
($ in thousands) | ||||||||
Cash at banks | $ | 39,368 | $ | 44,133 | ||||
Cash held with brokers | 490 | 68,029 | ||||||
Total cash and cash equivalents | $ | 39,858 | $ | 112,162 | ||||
Due to the short term nature of cash and cash equivalents, management believes the above noted carrying values approximate their fair value. Cash at banks include cash held at non-U.S. financial institutions which are not insured by the FDIC or any other deposit insurance programs.
6. RESTRICTED CASH AND CASH EQUIVALENTS
The Company is required to maintain certain cash in segregated accounts with prime brokers and swap counterparties. The amount of restricted cash held by prime brokers is primarily used to support the liability created from securities sold, not yet purchased and the amount of cash encumbered varies depending on the market value of the securities sold, not yet purchased. Swap counterparties also require cash collateral to support the current value of any amounts that may be due to the counterparty based on the value of the underlying security.
Restricted cash and cash equivalents also include amounts held by the Company to provide collateral required by the cedents in the form of trust accounts and letters of credit (see Notes 4 and 14). As of December 31, 2016 and 2015, the restricted cash and cash equivalents were comprised of the following:
December 31, 2016 | December 31, 2015 | |||||||
($ in thousands) | ||||||||
Cash held by prime brokers relating to securities sold, not yet purchased | $ | 859,901 | $ | 882,906 | ||||
Cash collateral relating to letters of credit issued | 234,348 | 222,852 | ||||||
Cash held as collateral in trust accounts | 86,351 | 78,584 | ||||||
Cash and cash equivalents held by swap counterparties | 22,051 | 52,247 | ||||||
Total restricted cash and cash equivalents | $ | 1,202,651 | $ | 1,236,589 | ||||
F-26
7. LOSS AND LOSS ADJUSTMENT EXPENSE RESERVES
The Company’s loss and loss adjustment expense reserves are comprised of:
● | case reserves resulting from claims notified to the Company by its clients; | |
● | incurred but not reported (“IBNR”) losses; and | |
● | estimated loss adjustment expenses. | |
Case reserves are provided by the clients, and IBNR losses are estimated each reporting period based on a contract by contract review of all data available for each individual contract. Each reinsurance contract is unique and the methods and estimates used vary depending on the facts and circumstances of each contract. The resulting total loss reserves, including IBNR loss reserves, are the sum of each loss reserve estimated on a contract by contract basis.
The Company establishes reserves for contracts based on estimates of the ultimate cost of all losses including IBNR. These estimated ultimate reserves are based on internal actuarial estimates derived from reports received from ceding companies, industry data and historical experience. These estimates are periodically reviewed by the Company on a contract by contract basis and adjusted when necessary. Since reserves are estimates, the setting of appropriate reserves is an inherently uncertain process. The estimates are based upon actuarial and statistical projections and on an assessment of currently available data, predictions of future developments and estimates of future trends and other factors. The final settlement of losses may vary, perhaps materially, from the reserves initially established and periodically adjusted. All adjustments to the estimates are recorded in the period in which they are determined. U.S. GAAP does not permit establishing loss reserves, which include case reserves and IBNR loss reserves, until the occurrence of an event which may give rise to a claim. As a result, only loss reserves applicable to losses incurred up to the reporting date are established, with no allowance for the establishment of loss reserves to account for expected future loss events.
For natural peril exposed business, loss reserves are generally established based on loss payments and case reserves reported by clients when, and if, received. Estimates for IBNR losses are added to the case reserves. To establish IBNR loss estimates, in addition to the loss information and estimates communicated by ceding companies, the Company uses industry information, knowledge of the business written and management’s judgment.
For all non-natural peril business, initial reserves for each individual contract is based on the expected loss and loss expense ratio calculated at the time the business was originally priced. In the pricing analysis, the Company typically utilizes a significant amount of information both from the individual client and from industry data. Where practical, historic reserving data that is received from the client, if any, is compared to publicly available financial statements of the client in an effort to identify, confirm and monitor the accuracy and completeness of the data. The Company requests each client to provide loss information for each reporting period, which, depending on the contract, could be monthly or quarterly. The loss information required depends on the terms and conditions of each contract and may include many years of history. Depending on the type of business underwritten, the Company may receive client and industry information on historical paid losses, incurred losses, number of open claims, number of closed claims, number of total claims, listings of individual large losses, earned premiums, policy count, policy limits underwritten, exposure information and rate change information. The Company may also receive information by class or subclass of business. If the reserving data is not available from a client, reliance may be placed on industry data, as well as the judgment and experience of the Company’s underwriters and actuaries.
The Company places more reliance on client and industry data than its own data to identify unusual trends requiring changes in reserve estimates. Each reinsurance contract is different and the degree to which reliance is placed on client data versus internal data varies greatly from contract to contract. The extent of reliance on client data for reserve setting purposes depends upon the availability of historical loss data from the client and judgment as to the reliability of the client’s historic loss performance as compared to its current book of business. The Company may from, time to time, supplement client data with industry and competitor information where deemed appropriate. Where available, the Company may also receive relevant actuarial reports from the client. This information is supplemented with subjective information on each client, which may include management experience, competitor information, meetings with the client and supplementary industry research and data.
Generally, the Company obtains regular updates of premium and loss related information for the current period and historical periods, which are utilized to update the initial expected loss and loss expense ratio. There may be a time lag from when claims are reported by the underlying insured to the client and subsequently when the client reports the claims to the Company. This time lag may impact the Company’s loss reserve estimates from period to period. Client reports have pre-determined reporting dates of when they are due (for example, fifteen days after month end). As such, the time lag in the client’s reporting depends upon the terms of the specific contract. The timing of the reporting requirements is designed so that the Company receives premium and loss information as soon as practicable once the client has closed its books. Accordingly,
F-27
there should be a short lag in such reporting. Additionally, most of the contracts that have the potential for large single event losses have provisions that such loss notification needs to be received immediately upon the occurrence of an event. Once the updated information is received, the Company uses a variety of standard actuarial methods for its analysis each quarter. Such methods may include:
● | Paid Loss Development Method. Ultimate losses are estimated by calculating past paid loss development factors and applying them to exposure periods with further expected paid loss development. The paid loss development method assumes that losses are paid in a consistent pattern. It provides an objective test of reported loss projections because paid losses contain no reserve estimates. For many coverages, claim payments are made very slowly and it may take years for claims to be fully reported and settled. | |
● | Reported Loss Development Method. Ultimate losses are estimated by calculating past reported loss development factors and applying them to exposure periods with further expected reported loss development. Since reported losses include payments and case reserves, changes in both of these amounts are incorporated in this method. This approach provides a larger volume of data to estimate ultimate losses than paid loss methods. Thus, reported loss patterns may be less varied than paid loss patterns, especially for coverage that have historically been paid out over a long period of time but for which claims are reported relatively early and case loss reserve estimates have been established. | |
● | Expected Loss Ratio Method. Ultimate losses are estimated under the expected loss ratio method, by multiplying earned premiums by an expected loss ratio. Expected loss ratio is selected using industry data, historical company data and actuarial professional judgment. This method is used for lines of business and contracts where there are no historical losses or where past loss experience is not credible. | |
● | Bornhuetter-Ferguson Paid Loss Method. Ultimate losses are estimated by modifying expected loss ratios to the extent paid losses experienced to date differ from what would have been expected to have been paid based upon the selected paid loss development pattern. This method avoids some of the distortions that could result from a large development factor being applied to a small base of paid losses to calculate ultimate losses. Generally this method is used for lines of business and contracts where there are limited historical paid losses. | |
● | Bornhuetter-Ferguson Reported Loss Method. Ultimate losses are estimated by modifying expected loss ratios to the extent reported losses experienced to date differ from what would have been expected to have been reported based upon the selected reported loss development pattern. This method avoids some of the distortions that could result from a large development factor being applied to a small base of reported losses to calculate ultimate losses. Generally this method is used for lines of business and contracts where there are limited historical reported losses. | |
● | Frequency / Severity Method. Ultimate losses are estimated under this method by multiplying the ultimate number of claims (i.e. the frequency), by the estimated ultimate average cost per claim (i.e. the severity). By analyzing claims experience by its frequency and severity components, the Company is able to examine trends and patterns in the rates of claims emergence (i.e. reporting) and settlement (i.e. closure) as well as in the average cost of claims. The approach is valuable because sometimes there is more inherent stability in the frequency and severity data when viewed separately rather than in the total losses. | |
In addition, the Company may supplement its analysis with other reserving methodologies that are deemed to be relevant to specific contracts.
For each contract, the Company utilizes such reserving methodology that the actuaries deem appropriate in order to calculate a best estimate, or point estimate, of reserves. Various actuarial methods are utilized to provide data point estimates to aid in the estimation of reasonable and adequate loss reserves. In setting loss reserves, the Company does not select a range of estimates that may be subject to adjustment. Instead, the Company analyzes reserves on a contract by contract basis and does not reserve based on aggregated product lines. The decision of whether to use a single methodology or a combination of multiple methodologies depends upon the contract and the judgment of the actuaries responsible for the contract. The Company’s reserving methodology does not require a fixed weighting of the various methods used. Certain of the methods are considered more appropriate depending on the type and structure of the contract, the age and maturity of the contract, and the duration of the expected paid losses on the contract. For example, the data estimation for contracts that are relatively new and therefore, have little paid loss development, is more appropriately considered using the Bornhuetter-Ferguson Reported Loss Method than a paid loss development method.
The Company’s gross aggregate reserves are the sum of the point estimate reserves of all contracts. The Company performs a quarterly loss reserve analysis on each contract regardless of the line of business. This analysis may incorporate some or all of the information described above, using some or all of the methodologies described above. Generally, IBNR loss reserves for each contract is calculated by estimating the ultimate incurred losses at any point in time and subtracting cumulative paid claims and case reserves, which incorporate specific exposures, loss payment and reporting patterns and other relevant factors. Each quarter, the reserving committee, which is comprised of the Chief Executive Officer, Chief Financial Officer, Chief Underwriting Officer, Chief Risk Officer and Reserving Actuary, meets to assess the adequacy of our loss reserves based on the reserve analysis and recommendations prepared by the Company’s actuaries. The reserving committee discusses each contract individually and approves or revises the stated reserves.
F-28
Additionally, an independent third-party actuarial firm performs a quarterly reserve review and annually opines on the reasonableness and adequacy of the aggregate loss reserves. The Company provides the third-party actuarial firm with its pricing models, reserving analysis and any other data they may request. Additionally, the actuarial firm may inquire as to the various assumptions and estimates used in the reserving analysis. The external actuarial firm independently creates its own reserving models based on industry loss information, augmented by specific client loss information as well as its own independent assumptions and estimates. Based on various reserving methodologies that the actuarial firm considers appropriate, it creates a loss reserve estimate for each contract in the portfolio and recommends an aggregate loss reserve, including IBNR. If there are material differences between the Company’s aggregate booked reserves and the actuarial firm’s recommended reserves, the differences are reviewed and the booked reserves are adjusted if necessary. To date there have been no material differences resulting from the external actuary’s reviews requiring adjustments to the Company’s booked reserves.
There were no significant changes in the actuarial methodology or assumptions relating to the Company’s loss and loss adjustment expense reserves for the year ended December 31, 2016.
At December 31, 2016 and 2015, loss and loss adjustment expense reserves were comprised of the following:
2016 | 2015 | |||||||
($ in thousands) | ||||||||
Case reserves | $ | 98,815 | $ | 111,535 | ||||
IBNR | 207,826 | 194,462 | ||||||
Total | $ | 306,641 | $ | 305,997 | ||||
A summary of changes in outstanding loss and loss adjustment expense reserves is as follows:
Consolidated | 2016 | 2015 | 2014 | |||||||||
($ in thousands) | ||||||||||||
Gross balance at January 1 | $ | 305,997 | $ | 264,243 | $ | 329,894 | ||||||
Less: Losses recoverable | (3,368 | ) | (11,523 | ) | (16,829 | ) | ||||||
Net balance at January 1 | 302,629 | 252,720 | 313,065 | |||||||||
Incurred losses related to: | ||||||||||||
Current year | 345,303 | 266,796 | 216,757 | |||||||||
Prior years | 35,512 | 50,301 | 18,229 | |||||||||
Total incurred | 380,815 | 317,097 | 234,986 | |||||||||
Paid losses related to: | ||||||||||||
Current year | (156,181 | ) | (132,017 | ) | (163,139 | ) | ||||||
Prior years | (216,489 | ) | (132,846 | ) | (130,438 | ) | ||||||
Total paid | (372,670 | ) | (264,863 | ) | (293,577 | ) | ||||||
Foreign currency revaluation | (6,837 | ) | (2,325 | ) | (1,754 | ) | ||||||
Net balance at December 31 | 303,937 | 302,629 | 252,720 | |||||||||
Add: Losses recoverable | 2,704 | 3,368 | 11,523 | |||||||||
Gross balance at December 31 | $ | 306,641 | $ | 305,997 | $ | 264,243 | ||||||
F-29
The rollforward of outstanding loss and loss adjustment expense reserves for health claims is as follows:
Health | 2016 | 2015 | 2014 | |||||||||
($ in thousands) | ||||||||||||
Gross balance at January 1 | $ | 21,533 | $ | 14,137 | $ | 9,778 | ||||||
Less: Losses recoverable | — | — | — | |||||||||
Net balance at January 1 | 21,533 | 14,137 | 9,778 | |||||||||
Incurred losses related to: | ||||||||||||
Current year | 38,726 | 34,136 | 32,970 | |||||||||
Prior years | (1,477 | ) | (2,680 | ) | 2,873 | |||||||
Total incurred | 37,249 | 31,456 | 35,843 | |||||||||
Paid losses related to: | ||||||||||||
Current year | (22,039 | ) | (14,090 | ) | (19,028 | ) | ||||||
Prior years | (17,750 | ) | (9,970 | ) | (12,456 | ) | ||||||
Total paid | (39,789 | ) | (24,060 | ) | (31,484 | ) | ||||||
Foreign currency revaluation | — | — | — | |||||||||
Net balance at December 31 | 18,993 | 21,533 | 14,137 | |||||||||
Add: Losses recoverable | — | — | — | |||||||||
Gross balance at December 31 | $ | 18,993 | $ | 21,533 | $ | 14,137 | ||||||
For the year ended December 31, 2016, the net losses incurred included $35.5 million related to net adverse loss development on reserves relating to accident years prior to 2016. During the year ended December 31, 2016, the loss development on prior year contracts primarily related to the following:
● | $19.0 million of losses resulting from the loss portfolio transfer and subsequent novation of the legacy construction defect liabilities; |
● | $7.0 million of adverse loss development relating to our Florida homeowners’ insurance contracts as a result of deterioration of sinkhole claims and an increase in the practice of “assignment of benefits” whereby homeowners assign their rights for filing and settling claims to attorneys and public adjusters. However, because some of these contracts included sliding scale ceding commission rates, the increase in loss reserves was partially offset by a $1.4 million decrease in ceding commissions and profit commissions recorded as acquisition costs; |
● | $6.7 million of adverse loss development relating to our private passenger motor contracts. While the loss indications are close to our expectations, the volume and frequency of unmerited suits served to the cedent by attorneys and medical clinics has resulted in an increase in loss adjustment expenses to defend such claims. The increase in loss reserve was partially offset by a $3.9 million decrease in ceding commissions recorded as acquisition costs; and |
● | $4.5 million of adverse loss development on an excess of loss contract relating to losses resulting from the U.S. sub-prime crisis. However, because this contract included a provision for additional premiums, the increase in losses was partially offset by $1.4 million of additional premiums earned. |
There were no other significant developments of prior period loss reserves during the year ended December 31, 2016.
For the year ended December 31, 2015, the net losses incurred included $50.3 million related to net adverse loss development on reserves relating to accident years prior to 2015. During the year ended December 31, 2015, the loss development on prior year contracts primarily related to the following:
● | $36.9 million of adverse loss development relating to a general liability contract originally written from 2008 to 2011. This contract contains underlying construction defect liability coverage predominantly on single family homes. During the third quarter of 2015, we completed an in-depth analysis, with the assistance of a third party expert, of the construction defect claims reported and the potential for claims not yet reported on this contract. Based on this assessment, we revised the actuarial methodology used for reserving the construction defect claims on this contract, which resulted in an increase in incurred but not reported losses; |
F-30
● | $14.7 million of adverse loss development relating to a general liability contract originally written in 2010. This contract contains underlying construction defect liability coverage. Based on updated data received from the insured, we conducted additional actuarial analysis and updated our actuarial input parameters based on consultation with external industry experts. As a result, the average estimated cost per claim was increased; |
● | $9.3 million of adverse loss development relating to our Florida homeowners’ insurance contracts as a result of deterioration of sinkhole losses and higher than anticipated water damage claims from rainstorms and increase in the practice of assignment of benefits. However, because some of these contracts included sliding scale ceding commission rates, the increase in loss reserves was partially offset by a $5.1 million decrease in ceding commissions and profit commissions recorded as acquisition costs; |
● | $2.4 million of net adverse loss development relating to our solicitors’ professional indemnity contracts as a result of multiple large claims reported during the period and an increase in incurred losses; |
● | $5.1 million of favorable loss development relating to an excess of loss property contract resulting in the elimination of loss reserves based on updated loss information received from the insured during the period indicating that no losses will breach into our layer of coverage. The decrease in loss reserves was more than offset by a reversal of $2.5 million of earned premiums and an accrual of $3.4 million of profit commission recorded as acquisition costs; |
● | $4.5 million of favorable loss development relating to private passenger motor contracts during the period. The decrease in loss reserves was partially offset by $3.3 million of additional ceding commissions recorded as acquisition costs; |
● | $2.3 million of favorable loss development relating to the employer medical stop-loss business as a result of better than expected claims frequency reported by the cedent; and |
● | $1.3 million of loss reserves released upon commutation of a private passenger motor contract during the period. The decrease in loss reserves was partially offset by $1.1 million of additional ceding commissions incurred as part of the commutation agreement. |
There were no other significant developments of prior period loss reserves during the year ended December 31, 2015.
For the year ended December 31, 2014, the net losses incurred included $18.2 million related to net adverse loss development on reserves relating to prior years. During the year ended December 31, 2014, the loss development on prior year contracts primarily related to the following:
● | $7.8 million of adverse loss development, relating to a general liability contract currently in run-off. Loss reserves were increased on this contract after a detailed actuarial review of existing claims data received from the client, which reported an increase in the number of open claims. The loss reserves were also increased to take into account the corresponding claims handling fees expected to be incurred to settle the open claims; |
● | $7.1 million of adverse loss development, net of retrocession recoveries, relating to commercial motor claims on a multi-line quota share contract currently in run-off. Loss reserves were increased on this contract after a detailed actuarial review of existing claims data received from the client, which reported significant increases in incurred losses on some claims as well as an increase in the number of open claims; |
● | $4.0 million of adverse loss development relating to a solicitors’ professional indemnity contract as a result of a combination of large claims reported and increases in case reserves on several smaller claims. Loss reserves were increased on this contract after a detailed review of existing claims data received from the client, audits of claim files at the third party claims administrator and actuarial analysis based on all available information. The contract terms included sliding scale ceding commission rates and profit commissions. As a result, the increase in loss reserves was offset by a $0.6 million decrease in ceding commissions and profit commissions which were recorded as decreases to acquisition costs; |
● | $3.0 million of adverse loss development relating to the employer medical stop-loss business. Loss reserves were increased on these contracts after a detailed review of existing claims data received from the clients, audits of claim files at the third party claims administrators and actuarial analysis based on all available information; and |
F-31
● | $3.8 million of favorable loss development relating to private passenger automobile business, primarily as a result of better than expected loss development noted on our private passenger automobile contracts after a detailed review of existing claims data received from the clients, audits of claim files and actuarial analysis based on all available information. Since these contracts included sliding scale ceding commission rates, the decrease in loss reserves was offset by a $2.2 million increase in ceding commissions recorded as acquisition costs. |
There were no other significant developments of prior period loss reserves during the year ended December 31, 2014.
Disclosures about Short Duration Contracts
The Company manages its business on the basis of one operating segment, property & casualty reinsurance. Within the property and casualty reinsurance segment, management analyzes the underwriting operations using two categories: frequency business; and severity business. Frequency business is generally characterized as contracts containing a potentially large number of small losses emanating from multiple events. Severity business is generally characterized as contracts with the potential for significant losses emanating from one event or multiple events.
For each of the frequency and severity categories, the following tables presents the incurred and paid claims development as of December 31, 2016, net of retrocession, as well as the total of incurred but not reported liabilities plus expected development on reported claims included within the net incurred claims amount. As required by U.S. GAAP, health claims have been disaggregated and presented separately.
The information in the tables below about incurred and paid claims development for the years ended December 31, 2007 to 2015, is presented as unaudited supplementary information.
Frequency - Health | |||||||||||||||||||||||||||||||||||||||||||
Incurred claims and allocated claim adjustment expenses, net of reinsurance | As of December 31, 2016 | ||||||||||||||||||||||||||||||||||||||||||
For the years ended December 31, | Total IBNR plus expected development on reported claims | ||||||||||||||||||||||||||||||||||||||||||
Accident year | 2007 | 2008 | 2009 | 2010 | 2011 | 2012 | 2013 | 2014 | 2015 | 2016 | |||||||||||||||||||||||||||||||||
(Unaudited - Supplementary Information) | |||||||||||||||||||||||||||||||||||||||||||
($ in thousands) | |||||||||||||||||||||||||||||||||||||||||||
2007 | $ | 107 | $ | 97 | $ | 107 | $ | 105 | $ | 105 | $ | 103 | $ | 103 | $ | 103 | $ | 103 | $ | 103 | $ | — | |||||||||||||||||||||
2008 | 10,593 | 11,677 | 11,432 | 11,428 | 11,249 | 11,249 | 11,249 | 11,247 | 11,247 | — | |||||||||||||||||||||||||||||||||
2009 | 24,905 | 23,884 | 23,321 | 23,327 | 23,402 | 23,402 | 23,401 | 23,401 | — | ||||||||||||||||||||||||||||||||||
2010 | 36,066 | 35,916 | 36,165 | 36,120 | 36,120 | 36,107 | 36,107 | — | |||||||||||||||||||||||||||||||||||
2011 | 36,088 | 36,205 | 35,755 | 35,737 | 35,533 | 35,533 | — | ||||||||||||||||||||||||||||||||||||
2012 | 10,494 | 9,781 | 9,723 | 9,621 | 9,621 | — | |||||||||||||||||||||||||||||||||||||
2013 | 43,895 | 46,844 | 47,301 | 47,047 | — | ||||||||||||||||||||||||||||||||||||||
2014 | 32,970 | 30,154 | 29,492 | — | |||||||||||||||||||||||||||||||||||||||
2015 | 34,136 | 33,576 | 2,307 | ||||||||||||||||||||||||||||||||||||||||
2016 | 38,726 | 16,687 | |||||||||||||||||||||||||||||||||||||||||
Total | $ | 264,853 | |||||||||||||||||||||||||||||||||||||||||
F-32
Frequency - Health | ||||||||||||||||||||||||||||||||||||||||
Cumulative paid claims and allocated claim adjustment expenses, net of reinsurance | ||||||||||||||||||||||||||||||||||||||||
For the years ended December 31, | ||||||||||||||||||||||||||||||||||||||||
Accident year | 2007 | 2008 | 2009 | 2010 | 2011 | 2012 | 2013 | 2014 | 2015 | 2016 | ||||||||||||||||||||||||||||||
(Unaudited - Supplementary Information) | ||||||||||||||||||||||||||||||||||||||||
($ in thousands) | ||||||||||||||||||||||||||||||||||||||||
2007 | $ | — | $ | 40 | $ | 103 | $ | 103 | $ | 103 | $ | 103 | $ | 103 | $ | 103 | $ | 103 | $ | 103 | ||||||||||||||||||||
2008 | 4,199 | 10,890 | 11,247 | 11,247 | 11,247 | 11,247 | 11,247 | 11,247 | 11,247 | |||||||||||||||||||||||||||||||
2009 | 8,617 | 23,069 | 23,380 | 23,401 | 23,401 | 23,401 | 23,401 | 23,401 | ||||||||||||||||||||||||||||||||
2010 | 17,771 | 35,609 | 36,107 | 36,107 | 36,107 | 36,107 | 36,107 | |||||||||||||||||||||||||||||||||
2011 | 27,104 | 35,531 | 35,533 | 35,533 | 35,533 | 35,533 | ||||||||||||||||||||||||||||||||||
2012 | 9,382 | 9,621 | 9,621 | 9,621 | 9,621 | |||||||||||||||||||||||||||||||||||
2013 | 34,515 | 46,971 | 47,047 | 47,047 | ||||||||||||||||||||||||||||||||||||
2014 | 19,028 | 28,921 | 29,492 | |||||||||||||||||||||||||||||||||||||
2015 | 14,090 | 31,269 | ||||||||||||||||||||||||||||||||||||||
2016 | 22,039 | |||||||||||||||||||||||||||||||||||||||
Total | 245,859 | |||||||||||||||||||||||||||||||||||||||
All outstanding liabilities before 2007, net of reinsurance | 0 | |||||||||||||||||||||||||||||||||||||||
Liabilities for claims and claims adjustment expenses, net of reinsurance (Health) | $ | 18,993 | ||||||||||||||||||||||||||||||||||||||
Frequency - Non-Health | ||||||||||||||||||||||||||||||||||
Incurred claims and allocated claim adjustment expenses, net of reinsurance | As of December 31, 2016 | |||||||||||||||||||||||||||||||||
For the years ended December 31, | Total IBNR plus expected development on reported claims | |||||||||||||||||||||||||||||||||
Accident year | 2007 | 2008 | 2009 | 2010 | 2011 | 2012 | 2013 | 2014 | 2015 | 2016 | ||||||||||||||||||||||||
(Unaudited - Supplementary Information) | ||||||||||||||||||||||||||||||||||
($ in thousands) | ||||||||||||||||||||||||||||||||||
2007 | $ | 36,425 | $ | 22,631 | $ | 16,527 | $ | 16,232 | $ | 16,232 | $ | 16,237 | $ | 16,237 | $ | 16,237 | $ | 16,237 | $ | 16,235 | $ | — | ||||||||||||
2008 | 38,126 | 34,675 | 35,893 | 38,669 | 40,523 | 40,161 | 41,620 | 42,078 | 41,707 | — | ||||||||||||||||||||||||
2009 | 79,796 | 91,523 | 101,259 | 109,736 | 106,040 | 107,323 | 112,312 | 111,741 | — | |||||||||||||||||||||||||
2010 | 130,353 | 144,230 | 162,110 | 161,667 | 165,525 | 173,989 | 177,100 | 95 | ||||||||||||||||||||||||||
2011 | 170,979 | 192,356 | 203,811 | 214,452 | 240,618 | 256,320 | 1,922 | |||||||||||||||||||||||||||
2012 | 200,058 | 201,019 | 201,678 | 214,699 | 216,590 | 2,463 | ||||||||||||||||||||||||||||
2013 | 373,651 | 369,772 | 370,516 | 370,993 | 7,269 | |||||||||||||||||||||||||||||
2014 | 176,397 | 176,570 | 177,499 | 19,557 | ||||||||||||||||||||||||||||||
2015 | 224,100 | 228,027 | 51,763 | |||||||||||||||||||||||||||||||
2016 | 289,367 | 156,083 | ||||||||||||||||||||||||||||||||
Total | $ | 1,885,579 | ||||||||||||||||||||||||||||||||
F-33
Frequency - Non-Health | ||||||||||||||||||||||||||||||||||||||||
Cumulative paid claims and allocated claim adjustment expenses, net of reinsurance | ||||||||||||||||||||||||||||||||||||||||
For the years ended December 31, | ||||||||||||||||||||||||||||||||||||||||
Accident year | 2007 | 2008 | 2009 | 2010 | 2011 | 2012 | 2013 | 2014 | 2015 | 2016 | ||||||||||||||||||||||||||||||
(Unaudited - Supplementary Information) | ||||||||||||||||||||||||||||||||||||||||
($ in thousands) | ||||||||||||||||||||||||||||||||||||||||
2007 | $ | 7,308 | $ | 14,425 | $ | 16,201 | $ | 16,235 | $ | 16,235 | $ | 16,235 | $ | 16,235 | $ | 16,235 | $ | 16,235 | $ | 16,235 | ||||||||||||||||||||
2008 | 10,345 | 25,145 | 31,683 | 36,584 | 39,147 | 40,265 | 41,108 | 41,161 | 41,707 | |||||||||||||||||||||||||||||||
2009 | 26,518 | 62,220 | 81,055 | 94,842 | 99,832 | 103,905 | 105,421 | 111,741 | ||||||||||||||||||||||||||||||||
2010 | 49,616 | 99,903 | 128,188 | 144,517 | 157,036 | 162,497 | 177,006 | |||||||||||||||||||||||||||||||||
2011 | 78,207 | 133,960 | 168,794 | 185,459 | 202,694 | 254,397 | ||||||||||||||||||||||||||||||||||
2012 | 92,505 | 175,010 | 187,570 | 195,655 | 214,126 | |||||||||||||||||||||||||||||||||||
2013 | 205,227 | 329,161 | 355,121 | 363,724 | ||||||||||||||||||||||||||||||||||||
2014 | 82,110 | 149,253 | 157,942 | |||||||||||||||||||||||||||||||||||||
2015 | 109,087 | 176,264 | ||||||||||||||||||||||||||||||||||||||
2016 | 133,285 | |||||||||||||||||||||||||||||||||||||||
Total | 1,646,428 | |||||||||||||||||||||||||||||||||||||||
All outstanding liabilities before 2007, net of reinsurance | 0 | |||||||||||||||||||||||||||||||||||||||
Liabilities for claims and claims adjustment expenses, net of reinsurance (Frequency) | $ | 239,151 | ||||||||||||||||||||||||||||||||||||||
Severity | ||||||||||||||||||||||||||||||||||||||||||||
Incurred claims and allocated claim adjustment expenses, net of reinsurance | As of December 31, 2016 | |||||||||||||||||||||||||||||||||||||||||||
For the years ended December 31, | Total IBNR plus expected development on reported claims | |||||||||||||||||||||||||||||||||||||||||||
Accident year | 2007 | 2008 | 2009 | 2010 | 2011 | 2012 | 2013 | 2014 | 2015 | 2016 | ||||||||||||||||||||||||||||||||||
(Unaudited - Supplementary Information) | ||||||||||||||||||||||||||||||||||||||||||||
($ in thousands) | ||||||||||||||||||||||||||||||||||||||||||||
2007 | $ | 6,142 | $ | 9,141 | $ | 10,266 | $ | 8,792 | $ | 9,039 | $ | 8,634 | $ | 10,513 | $ | 10,512 | $ | 10,513 | $ | 12,643 | $ | 2,579 | ||||||||||||||||||||||
2008 | 16,500 | 19,329 | 18,237 | 18,028 | 17,469 | 19,583 | 19,582 | 17,843 | 20,212 | 4,969 | ||||||||||||||||||||||||||||||||||
2009 | 19,055 | 15,332 | 14,931 | 14,290 | 14,183 | 14,010 | 10,820 | 10,796 | 6,595 | |||||||||||||||||||||||||||||||||||
2010 | 4,492 | 5,147 | 14,079 | 14,042 | 14,291 | 14,194 | 14,332 | 2,752 | ||||||||||||||||||||||||||||||||||||
2011 | 5,071 | 5,069 | 5,068 | 5,079 | 5,074 | 5,081 | 32 | |||||||||||||||||||||||||||||||||||||
2012 | 15,000 | — | — | — | — | — | ||||||||||||||||||||||||||||||||||||||
2013 | 2,878 | 1,865 | 1,494 | 1,489 | 10 | |||||||||||||||||||||||||||||||||||||||
2014 | 4,673 | 4,650 | 4,708 | 1,891 | ||||||||||||||||||||||||||||||||||||||||
2015 | 8,249 | 8,387 | 6,999 | |||||||||||||||||||||||||||||||||||||||||
2016 | 17,210 | 16,353 | ||||||||||||||||||||||||||||||||||||||||||
Total | $ | 94,857 | ||||||||||||||||||||||||||||||||||||||||||
F-34
Severity | ||||||||||||||||||||||||||||||||||||||||
Cumulative paid claims and allocated claim adjustment expenses, net of reinsurance | ||||||||||||||||||||||||||||||||||||||||
For the years ended December 31, | ||||||||||||||||||||||||||||||||||||||||
Accident year | 2007 | 2008 | 2009 | 2010 | 2011 | 2012 | 2013 | 2014 | 2015 | 2016 | ||||||||||||||||||||||||||||||
(Unaudited - Supplementary Information) | ||||||||||||||||||||||||||||||||||||||||
($ in thousands) | ||||||||||||||||||||||||||||||||||||||||
2007 | $ | — | $ | — | $ | — | $ | 1,765 | $ | 3,777 | $ | 5,782 | $ | 5,802 | $ | 5,802 | $ | 5,803 | $ | 10,064 | ||||||||||||||||||||
2008 | — | — | 3,148 | 6,391 | 10,320 | 10,356 | 10,356 | 10,504 | 15,243 | |||||||||||||||||||||||||||||||
2009 | 276 | 2,582 | 3,364 | 3,753 | 3,902 | 3,959 | 4,180 | 4,201 | ||||||||||||||||||||||||||||||||
2010 | 281 | 862 | 1,112 | 1,237 | 5,892 | 6,061 | 11,580 | |||||||||||||||||||||||||||||||||
2011 | 24 | 5,033 | 5,038 | 5,044 | 5,047 | 5,048 | ||||||||||||||||||||||||||||||||||
2012 | — | — | — | — | — | |||||||||||||||||||||||||||||||||||
2013 | 94 | 722 | 1,214 | 1,480 | ||||||||||||||||||||||||||||||||||||
2014 | 1,558 | 2,498 | 2,817 | |||||||||||||||||||||||||||||||||||||
2015 | 418 | 1,388 | ||||||||||||||||||||||||||||||||||||||
2016 | 857 | |||||||||||||||||||||||||||||||||||||||
Total | 52,679 | |||||||||||||||||||||||||||||||||||||||
All outstanding liabilities before 2007, net of reinsurance | 0 | |||||||||||||||||||||||||||||||||||||||
Liabilities for claims and claims adjustment expenses, net of reinsurance (Severity) | $ | 42,178 | ||||||||||||||||||||||||||||||||||||||
For any incurred and paid claims denominated in a currency other than U.S. dollars, the above tables are presented using the foreign exchange rate in effect as of the current year end date. As a result, all prior year information has been restated to reflect the exchange rates as of December 31, 2016. This removes any changes in foreign currency exchange rates from distorting the claims development between the years presented.
For assumed contracts the Company does not receive claims information by accident year from the ceding insurers, but instead receives claims information by the treaty year of the contract. Claims reported by the ceding insurer to the Company may have the covered losses occurring in an accident year other than the treaty year. In addition, each treaty year contract may have exposures to multiple accident years with covered claims occurring beyond the treaty year. For the purpose of the above tables, the incurred and paid claims have been allocated to the accident years based on the proportion of premiums earned for each contract during such accident year.
For example, a one-year treaty incepting on October 1, 2010 (with underlying policies each having a one-year duration), would have a 24-month period over which the premiums would be earned. Therefore claims would be allocated to accident years 2010, 2011 and 2012 based on the proportion of the premiums earned during each accident year. Therefore, for illustration of this contract, any claims reported during 2010 would be allocated to the 2010 accident year. For losses reported during 2011, the claims be would allocated between 2010 and 2011 based on the percentage of premiums earned during 2010 and 2011. Similarly, for losses reported during 2012 and thereafter, the losses would be allocated to the 2010, 2011 and 2012 accident years based the proportion of premiums earned during each of those years. The allocation to accident years results in losses from natural catastrophe events for severity contracts allocated in proportion to the premiums earned in an accident year rather than the year during which the natural catastrophe event occurred.
F-35
The reconciliation of the net incurred and paid claims development tables to the liability for claims and claim adjustment expenses in the consolidated balance sheet is as follows:
December 31, 2016 | ||||
($ in thousands) | ||||
Net outstanding liabilities | ||||
Health | $ | 18,993 | ||
Frequency - non-health | 239,151 | |||
Severity | 42,178 | |||
Liabilities for claims and claims adjustment expenses, net of reinsurance | 300,322 | |||
Add: Reinsurance recoverable on unpaid claims | 2,704 | |||
Add: Unallocated claims adjustment expenses | 3,615 | |||
Total gross liabilities for unpaid claims and claim adjustment expense | $ | 306,641 | ||
The average historical annual percentage payout of net incurred claims (excluding health) as of the year ended December 31, 2016 is as follows:
Years | 1 | 2 | 3 | 4 | 5 | 6 | 7 | 8 | 9 | 10 | ||||||||||||||||||||
(Unaudited - Supplementary Information) | ||||||||||||||||||||||||||||||
Frequency - Non-health | 36.6 | % | 31.5 | % | 11.2 | % | 6.1 | % | 4.8 | % | 5.4 | % | 2.4 | % | 1.5 | % | 0.4 | % | — | % | ||||||||||
Severity | 3.1 | % | 12.4 | % | 4.3 | % | 5.9 | % | 28.5 | % | 6.3 | % | 14.7 | % | 7.5 | % | 8.3 | % | 9.1 | % | ||||||||||
Historical annual percentage payout for health claims are excluded from the above table because most of them have short settlement periods and including them would skew the results presented. In addition, the payout percentages for the severity business are expected to fluctuate, sometimes significantly, due to the volatile nature of the severity contracts.
As a reinsurance entity, the Company does not consistently receive detailed claims frequency information, such as claims counts, from the ceding insurers and third party claim handlers. Due to the nature of the reinsurance contracts, the underlying insured reports claims to the insurer who cedes losses to the Company. The Company is contractually obligated to reimburse the ceding insurer for its share of the losses. While the Company has the right to conduct audits of the insurer’s claims files, the insurer is generally not obligated to provide detailed listing of claims counts or other claims frequency information to the Company. Therefore it is impracticable for the Company to present the cumulative number of reported claims by accident year.
8. RETROCESSION
The Company, from time to time, purchases retrocessional coverage for one or more of the following reasons: to manage its overall exposure, to reduce its net liability on individual risks, to obtain additional underwriting capacity and to balance its underwriting portfolio. Additionally, retrocession can be used as a mechanism to share the risks and rewards of business written and therefore can be used as a tool to align the Company’s interests with those of its counterparties. The Company currently has coverage that provides for recovery of a portion of loss and loss expenses incurred on certain contracts. Loss and loss adjustment expense recoverable from the retrocessionaires are recorded as assets.
For the year ended December 31, 2016, loss and loss adjustment expenses incurred of $380.8 million (2015: $317.1 million and 2014: $235.0 million) reported on the consolidated statements of income are net of loss and loss expenses recovered and recoverable of $0.9 million (2015: $1.7 million and 2014: $4.4 million).
Retrocession contracts do not relieve the Company from its obligations to the insureds. Failure of retrocessionaires to honor their obligations could result in losses to the Company. At December 31, 2016, the Company had losses receivable and loss reserves recoverable of $2.2 million (2015: $3.1 million) from unrated retrocessionaires which were secured by cash collateral held by the Company. At December 31, 2016, $0.5 million (2015: $0.3 million) of losses recoverable were from a retrocessionaire rated A- by A.M. Best.
F-36
The Company regularly evaluates the financial condition of its retrocessionaires to assess the ability of the retrocessionaires to honor their respective obligations. At December 31, 2016 and 2015, no provision for uncollectible losses recoverable was considered necessary.
9. SHARE CAPITAL
The holders of all ordinary shares are entitled to share equally in dividends declared by the Board of Directors. In the event of a winding-up or dissolution of the Company, the ordinary shareholders share equally and ratably in the assets of the Company, after payment of all debts and liabilities of the Company and after liquidation of any issued and outstanding preferred shares. At December 31, 2016, no preferred shares were issued or outstanding. The Board of Directors is authorized to establish the rights and restrictions for preferred shares as they deem appropriate.
The Third Amended and Restated Memorandum and Articles of Association as revised by special resolution on July 10, 2008 (the “Articles”), provide that the holders of Class A ordinary shares generally are entitled to one vote per share. However, except upon unanimous consent of the Board of Directors, no Class A shareholder is permitted to vote an amount of shares which would cause any United States person to own (directly, indirectly or constructively under applicable United States tax attribution and constructive ownership rules) 9.9% or more of the total voting power of all issued and outstanding ordinary shares. The Articles further provide that the holders of Class B ordinary shares generally are entitled to ten votes per share. However, holders of Class B ordinary shares, together with their affiliates, are limited to voting that number of Class B ordinary shares equal to 9.5% of the total voting power of the total issued and outstanding ordinary shares.
Pursuant to the Shareholders’ Agreement, dated August 11, 2004, by and among the Company and certain of its shareholders (the “Shareholders’ Agreement”), the holders of at least 50% of the outstanding Registrable Securities (as defined in the Shareholders’ Agreement), may, subject to certain conditions, request to have all or part of their Registrable Securities to become registered. The Shareholders’ Agreement requires, among other things, that the Company use its commercially reasonable best efforts to have a registration statement covering such Registrable Securities to be declared effective. The registration rights granted pursuant to the Shareholders’ Agreement are not deemed to be liabilities; therefore, there has been no recognition in the consolidated financial statements of the registration rights granted pursuant to the Shareholders’ Agreement.
As of December 31, 2016, the Company has an effective Form S-3 registration statement, on file with the SEC, for an aggregate principal amount of $200.0 million in securities.
Shares authorized for issuance are comprised of 300,000 (2015: 300,000) Class A ordinary shares in relation to share purchase options granted to a service provider and 3,500,000 (2015: 3,500,000) Class A ordinary shares authorized for the Company’s stock incentive plan for eligible employees, directors and consultants. As of December 31, 2016 and 2015, there were no remaining Class A ordinary shares available for future issuance relating to share purchase options granted to the service provider as all options granted to service providers had been exercised. As of December 31, 2016 424,787 (2015: 658,775) Class A ordinary shares remained available for future issuance under the Company’s stock incentive plan. The stock incentive plan is administered by the Compensation Committee of the Board of Directors.
The Board has adopted a share repurchase plan. Under the share repurchase plan, the Board authorized the Company to purchase up to 2.0 million of its Class A ordinary shares from time to time. Class A ordinary shares or securities convertible into Class A ordinary shares, may be purchased in the open market, through privately negotiated transactions or Rule 10b5-1 stock trading plans. The timing of such repurchases and actual number of shares repurchased will depend on a variety of factors including price, market conditions and applicable regulatory and corporate requirements. The share repurchase plan, which expires on June 30, 2017, does not require the Company to repurchase any specific number of shares and may be modified, suspended or terminated at any time without prior notice. During the year ended December 31, 2016, no Class A ordinary shares were repurchased by the Company. As of December 31, 2016, 2.0 million shares remained available for repurchase under the share repurchase plan. Under the Companies Law of the Cayman Islands, the Company cannot hold treasury shares; therefore, all ordinary shares repurchased are canceled immediately upon repurchase.
F-37
The following table is a summary of voting ordinary shares issued and outstanding:
2016 | 2015 | 2014 | ||||||||||||||||
Class A | Class B | Class A | Class B | Class A | Class B | |||||||||||||
Balance – beginning of year | 30,772,572 | 6,254,895 | 31,129,648 | 6,254,895 | 30,791,865 | 6,254,949 | ||||||||||||
Issue of ordinary shares, net of forfeitures | 338,860 | — | 256,464 | — | 337,729 | — | ||||||||||||
Repurchase of ordinary shares | — | — | (613,540 | ) | — | — | — | |||||||||||
Class B shares converted to Class A shares | — | — | — | — | 54 | (54 | ) | |||||||||||
Balance – end of year | 31,111,432 | 6,254,895 | 30,772,572 | 6,254,895 | 31,129,648 | 6,254,895 | ||||||||||||
Greenlight Re is subject to the Cayman Islands’ Insurance (Capital and Solvency) (Classes B, C, and D Insurers) Regulations, 2012 (the “Insurance Regulations”). The Insurance Regulations impose a Minimum Capital Requirement of
US$50.0 million and a Prescribed Capital Requirement of $276.0 million on Greenlight Re as of December 31, 2016 (2015: $466.5 million). As of December 31, 2016, Greenlight Re’s statutory capital and surplus of $833.2 million exceeded the Minimum Capital Requirement as well as the Prescribed Capital Requirement. For the years ended December 31, 2016, 2015 and 2014, Greenlight Re’s net income (loss) was $44.8 million, $(309.5) million, and $113.3 million, respectively.
Greenlight Re is not required to prepare separate statutory financial statements for filing with CIMA and there were no material differences between Greenlight Re’s GAAP capital, surplus and net income, and its statutory capital, surplus and net income as of December 31, 2016 and 2015.
As of December 31, 2016, the Company was not restricted from payment of dividends to the Company’s shareholders. However, since most of the Company’s capital and retained earnings are invested in its subsidiaries, a dividend from one or more of the Company’s subsidiaries would likely be required in order to fund a dividend to the Company’s shareholders. Any dividends declared and paid from Greenlight Re to the Company would require approval of CIMA. During the year ended December 31, 2016, no dividends (2015: $5.0 million, 2014: nil) were declared and paid by Greenlight Re or GRIL to the Company. As of December 31, 2016 and 2015, $557.2 million and $322.4 million, respectively, of Greenlight Re’s capital and surplus was available for distribution as dividends. The amount of dividends that GRIL is permitted to distribute is limited to its retained earnings and the Central Bank of Ireland has powers to intervene if a dividend payment were to lead to a breach of regulatory capital requirements. As of December 31, 2016 and 2015, none of GRIL’s capital and surplus was available for distribution as dividends.
GRIL is obligated to maintain a minimum level of capital. As of December 31, 2016 and 2015, GRIL met such requirements. As of December 31, 2016 and 2015, GRIL’s statutory capital and surplus was $52.4 million and $50.3 million, respectively. As of December 31, 2016, GRIL’s statutory minimum capital required under Solvency II was approximately $9.9 million. Prior to the implementation of Solvency II, GRIL was subject to a required solvency margin of $18.1 million as of December 31, 2015. GRIL’s statutory net income (loss) was $3.2 million, $(12.8) million and $(3.3) million for the years ended December 31, 2016, 2015 and 2014, respectively.
Additional paid-in capital includes the premium per share paid by the subscribing shareholders for Class A and B ordinary shares which have a par value of $0.10 each. It also includes share-based awards earned not yet issued.
10. SHARE-BASED COMPENSATION
The Company has a stock incentive plan for directors, employees and consultants as detailed in Note 9 above.
Employee and Director Restricted Shares
As part of its stock incentive plan, the Company issues restricted shares for which the fair value is equal to the price of the Company’s Class A ordinary shares on the grant date. Compensation based on the grant date fair market value of the shares is expensed on a straight line basis over the applicable vesting period, net of any estimated forfeitures.
For the year ended December 31, 2016, 153,648 (2015: 78,685, 2014: 127,186) restricted Class A ordinary shares were issued to employees pursuant to the Company’s stock incentive plan. These shares contain certain restrictions relating to, among other things, vesting, forfeiture in the event of termination of employment and transferability. Each of these restricted shares cliff vest after three years from the date of issuance, subject to the grantee’s continued service with the Company. During
F-38
the vesting period, the holder of the restricted shares retains voting rights and is entitled to any dividends declared by the Company.
For the year ended December 31, 2016, the Company also issued to non-employee directors an aggregate of 39,288 (2015: 28,215, 2014: 28,060) restricted Class A ordinary shares as part of their remuneration for services to the Company. Each of these restricted shares issued to non-employee directors contains similar restrictions to those issued to employees and will vest on the earlier of the first anniversary of the date of the share issuance or the Company’s next annual general meeting, subject to the grantee’s continued service with the Company.
For the year ended December 31, 2016, 11,897 (2015: 9,621, 2014: 38,706) restricted shares were forfeited by employees who left the Company prior to the expiration of the applicable vesting periods. For the year ended December 31, 2016, in accordance with U.S. GAAP, $0.1 million of stock compensation expense (2015: $0.1 million, 2014: $0.4 million) relating to the forfeited restricted shares was reversed. In addition, $0.4 million of stock compensation expense was reversed for the year ended December 31, 2016, relating to the Company’s Chief Executive Officer’s (the “CEO”) restricted shares that were likely to be forfeited.
The Company recorded $3.1 million of share-based compensation expense, net of the reversal for forfeitures, relating to restricted shares for the year ended December 31, 2016 (2015: $3.6 million, 2014: $3.3 million). As of December 31, 2016, there was $2.9 million (2015: $3.7 million, 2014: $4.2 million) of unrecognized compensation cost relating to non-vested restricted shares which are expected to be recognized over a weighted average period of 1.6 years (2015: 1.6 years, 2014: 1.8 years). For the year ended December 31, 2016, the total fair value of restricted shares vested was $3.1 million (2015: $3.2 million, 2014: $2.9 million).
The following table summarized the activity for unvested outstanding restricted share award during the years ended December 31, 2016 and 2015:
Number of non-vested restricted shares | Weighted average grant date fair value | ||||||
Balance at December 31, 2014 | 330,087 | $ | 27.90 | ||||
Granted | 106,900 | 31.56 | |||||
Vested | (120,353 | ) | 26.26 | ||||
Forfeited | (9,621 | ) | 30.49 | ||||
Balance at December 31, 2015 | 307,013 | 29.74 | |||||
Granted | 192,936 | 21.53 | |||||
Vested | (122,620 | ) | 25.66 | ||||
Forfeited | (11,897 | ) | 29.97 | ||||
Balance at December 31, 2016 | 365,432 | $ | 26.76 | ||||
Employee and Director Stock Options
For the year ended December 31, 2016, 57,386 Class A ordinary share purchase options were granted to the Company’s CEO, pursuant to his employment contract (2015: 40,683). These options vest 25% on the date of the grant, and 25% each on the anniversary thereof in 2017, 2018 and 2019, and expire 10 years after the grant date. The grant date fair value of these options was $8.71 per share (2015: $12.29 per share, 2014: $15.71), based on the Black-Scholes option pricing model. The estimate of expected volatility for options granted during 2016 and 2015 was based on the daily historical trading data of the Company’s Class A ordinary shares from the date that these shares commenced trading on May 24, 2007 to August 5, 2016. For options granted prior to 2014, the Company had determined the expected volatility based primarily on the historical volatility of a peer group of companies in the reinsurance industry while also considering the Company’s own historical volatility.
F-39
The Company uses the Black-Scholes option pricing model to determine the valuation of its options and has applied the assumptions set forth in the following table.
2016 | 2015 | 2014 | |||||||
Risk free rate | 1.54 | % | 2.15 | % | 2.47 | % | |||
Estimated volatility | 32.4 | % | 32.8 | % | 34.3 | % | |||
Expected term (in years) | 10 | 10 | 10 | ||||||
Dividend yield | 0 | % | 0 | % | 0 | % | |||
Forfeiture rate | 0 | % | 0 | % | 0 | % | |||
At the present time, the Board of Directors does not anticipate that any dividends will be declared during the expected term of the options. The Company uses graded vesting for expensing employee stock options. The total compensation cost expensed for the year ended December 31, 2016 was $0.9 million (2015: $0.5 million, 2014: $0.5 million) all related to the options granted to the CEO. At December 31, 2016, there was no remaining compensation cost to be recognized in future periods relating to the CEO’s stock options as the remaining options were deemed to likely vest on March 31, 2017 and the expense was recognized as of December 31, 2016. As of December 31, 2015, the total compensation cost related to non-vested options not yet recognized was $0.4 million (2014: $0.4 million) to be recognized over a weighted average period of 1.5 years (2014: 1.5 years) assuming the employees complete their service period for vesting of the options.
For the year ended December 31, 2016, stock options exercised by directors and employees resulted in 156,022 Class A ordinary shares being issued, net of shares surrendered as a result of the cashless exercise of stock options (2015: 158,925, 2014: 207,328). When stock options are granted, the Company reduces the corresponding number from the shares authorized for issuance as part of the Company’s stock incentive plan.
Employee and director stock option activity during the years ended December 31, 2016, 2015 and 2014 was as follows:
Number of options | Weighted average exercise price | Weighted average grant date fair value | Intrinsic value ($ in millions) | Weighted average remaining contractual term | ||||||||||||
Balance at December 31, 2013 | 1,402,987 | $ | 15.82 | $ | 7.08 | |||||||||||
Granted | 31,821 | 32.37 | 15.71 | |||||||||||||
Exercised | (318,500 | ) | 11.29 | 5.67 | $ | 6.7 | ||||||||||
Balance at December 31, 2014 | 1,116,308 | 17.58 | 7.73 | $ | 16.8 | 3.0 years | ||||||||||
Granted | 40,683 | 26.67 | 12.29 | |||||||||||||
Exercised | (250,000 | ) | 11.10 | 5.57 | $ | 4.8 | ||||||||||
Balance at December 31, 2015 | 906,991 | 19.78 | 8.53 | $ | 2.6 | 2.9 years | ||||||||||
Granted | 57,386 | 19.87 | 8.71 | |||||||||||||
Exercised | (421,000 | ) | 12.53 | 6.44 | $ | 3.1 | ||||||||||
Balance at December 31, 2016 | 543,377 | $ | 25.40 | $ | 10.17 | $ | 0.5 | 4.7 years | ||||||||
The following table summarizes information about options exercisable for the periods indicated:
December 31, 2016 | December 31, 2015 | December 31, 2014 | |||||||||
Number of options exercisable | 472,042 | 851,020 | 1,062,022 | ||||||||
Weighted average exercise price | $ | 25.73 | $ | 19.22 | $ | 17.02 | |||||
Weighted average remaining contractual term | 4.1 | 2.6 | 2.7 | ||||||||
Intrinsic value ($ in millions) | $ | 0.4 | $ | 2.6 | $ | 16.6 | |||||
During the year ended December 31, 2016, 42,022 (2015: 38,998, 2014: 53,828) options vested which had a weighted average grant date fair value of $11.90 (2015: $12.82, 2014: $11.76).
F-40
Employee Restricted Stock Units
The Company issues restricted stock units (“RSUs”) to certain employees as part of the stock incentive plan. The grant date fair value of the RSUs is equal to the price of the Company’s Class A ordinary shares on the grant date. Compensation cost based on the grant date fair market value of the RSUs is expensed on a straight line basis over the vesting period.
For the year ended December 31, 2016, 7,444 (2015: 6,821, 2014: 9,668) RSUs were issued to employees pursuant to the Company’s stock incentive plan. These shares contain certain restrictions relating to, among other things, vesting, forfeiture in the event of termination of employment and transferability. Each of these RSUs cliff vest after three years from the date of issuance, subject to the grantee’s continued service with the Company. On the vesting date, the Company converts each RSU into one Class A ordinary share and issues new Class A ordinary shares from the shares authorized for issuance as part of the Company’s stock incentive plan.
The Company recorded $(0.1) million of share-based compensation expense (recovery), net of forfeitures, relating to RSUs for the year ended December 31, 2016 (2015: $0.2 million, 2014: $0.1 million). The recovery for the year ended December 31, 2016 was due to reversal of share-based compensation expense previously recorded on RSUs that were forfeited during 2016.
Employee RSU activity during the years ended December 31, 2016 and 2015 was as follows:
Number of non-vested RSUs | Weighted average grant date fair value | ||||||
Balance at December 31, 2014 | 15,609 | $ | 29.72 | ||||
Granted | 6,821 | 32.21 | |||||
Vested | (260 | ) | 24.30 | ||||
Forfeited | — | — | |||||
Balance at December 31, 2015 | 22,170 | 30.55 | |||||
Granted | 7,444 | 21.56 | |||||
Vested | (1,799 | ) | 26.48 | ||||
Forfeited | (11,881 | ) | 29.60 | ||||
Balance at December 31, 2016 | 15,934 | $ | 27.88 | ||||
For the years ended December 31, 2016, 2015 and 2014, the general and administrative expenses included stock compensation expense (net of forfeitures) of $4.0 million, $4.3 million and $4.0 million, respectively, for the expensing of the fair value of stock options, restricted stock and RSUs granted to employees and directors, net of forfeitures.
11. NET INVESTMENT INCOME
A summary of net investment income (loss) for the years ended December 31, 2016, 2015 and 2014 is as follows:
2016 | 2015 | 2014 | ||||||||||
($ in thousands) | ||||||||||||
Realized gains (losses) | $ | (113,836 | ) | $ | 22,227 | $ | 352,133 | |||||
Change in unrealized gains and losses | 209,993 | (265,401 | ) | (187,753 | ) | |||||||
Investment related foreign exchange gains (losses) | 2,988 | (3,725 | ) | 14,797 | ||||||||
Interest and dividend income, net of withholding taxes | 23,915 | 15,313 | 31,423 | |||||||||
Interest, dividend and other expenses | (22,334 | ) | (31,092 | ) | (38,892 | ) | ||||||
Investment advisor compensation | (24,543 | ) | (19,246 | ) | (49,133 | ) | ||||||
Net investment income (loss) | $ | 76,183 | $ | (281,924 | ) | $ | 122,575 | |||||
Interest and dividend income in the above table are net of any withholding taxes. Investment returns are calculated monthly and compounded to calculate the annual returns. The resulting actual investment income may vary depending on cash flows into or out of the investment account. For the year ended December 31, 2016, investment income, net of all fees and expenses, resulted in a gain of 7.2% on the investment portfolio. This compares to a loss of 20.2% and a gain of 8.7% reported for the years ended December 31, 2015 and 2014, respectively.
F-41
12. TAXATION
The Company and Greenlight Re are each domiciled in the Cayman Islands and under current Cayman Islands law, no corporate entity, including the Company and Greenlight Re, is obligated to pay taxes in the Cayman Islands on either income or capital gains. The Company and Greenlight Re each intend to conduct all of its operations in a manner that will not cause it to be treated as engaging in a trade or business within the United States and will not cause it to be subject to current U.S. federal income taxation on its net income. However, because there are no definitive standards provided by the Internal Revenue Code, regulations or court decisions as to the specific activities that constitute being engaged in the conduct of a trade or business within the United States, and as any such determination is essentially factual in nature, there can be no assurance that the IRS will not successfully assert that the Company or Greenlight Re is engaged in a trade or business within the U.S.
Verdant is incorporated in Delaware, and therefore is subject to taxes in accordance with the U.S. federal rates and regulations prescribed by the IRS. Verdant’s taxable income is taxed at an effective tax rate of 35%. GRIL is incorporated in Ireland and, therefore, is subject to the Irish corporation tax. GRIL is taxed at a rate of 12.5% on its trading income.
At December 31, 2016, included in the consolidated balance sheet under other assets were taxes recoverable of nil relating to GRIL (2015: $0.5 million relating to Verdant and GRIL), and a deferred tax asset of $1.3 million, primarily relating to GRIL’s net operating losses carried forward (2015: $1.8 million). At December 31, 2016, GRIL had a net operating loss carryforward of $10.1 million which can be carried forward indefinitely. Based on the likelihood of GRIL generating sufficient taxable income to realize the future tax benefit, management believes it is more likely than not that the deferred tax asset and taxes recoverable will be fully realized in the future and therefore no valuation allowance has been recorded.
At December 31, 2016, Verdant had a net operating loss carryforward of $1.7 million which can be carried forward for a period of 20 years from the year the loss occurred and therefore will expire in 2033.
The following table sets forth our current and deferred income tax benefit (expense) on a consolidated basis for the years ended December 31, 2016, 2015 and 2014:
2016 | 2015 | 2014 | ||||||||||
($ in thousands) | ||||||||||||
Current tax (expense) benefit | $ | (492 | ) | $ | 15 | $ | 638 | |||||
Deferred tax (expense) benefit | (17 | ) | 1,740 | (14 | ) | |||||||
Income tax (expense) benefit | $ | (509 | ) | $ | 1,755 | $ | 624 | |||||
The Company has not taken any tax positions that are subject to uncertainty or that are reasonably likely to have a material impact to the Company, Greenlight Re, GRIL or Verdant.
Federal Excise Taxes
The United States also imposes an excise tax on reinsurance premiums paid to non-U.S. insurers or reinsurers with respect to risks located in the United States. The rate of tax, unless exempted or reduced by an applicable U.S. tax treaty, is 1.0% for all reinsurance premiums. The Company incurs federal excise taxes on certain of its reinsurance transactions, including amounts ceded through intercompany transactions. For the years ended 2016, 2015 and 2014, the Company incurred approximately $3.9 million, $3.3 million and $2.2 million, respectively, of federal excise taxes, net of any refunds received. These amounts are reflected as acquisition costs in the Company’s consolidated statements of income.
13. RELATED PARTY TRANSACTIONS
Investment Advisory Agreement
The Company and its reinsurance subsidiaries are party to a joint venture agreement with DME Advisors, LP (“DME Advisors”) under which the Company, its reinsurance subsidiaries and DME Advisors LLC (“DME”) are participants of a joint venture for the purpose of managing certain jointly held assets, as may be amended from time to time (the “venture agreement”). In addition, the Company, its reinsurance subsidiaries and DME have entered into a separate investment advisory agreement with DME Advisors, as may be amended from time to time (the “advisory agreement”). Effective January 1, 2017, the venture agreement and the advisory agreements were amended and restated to replace the previous agreements dated January 1, 2014, and will expire on December 31, 2019 and renew automatically for successive three-year periods. DME and
F-42
DME Advisors are related to the Company and each is an affiliate of David Einhorn, Chairman of the Company’s Board of Directors.
Pursuant to the venture agreement, performance allocation equal to 20% of the net investment income of the Company’s share of the account managed by DME Advisors is allocated, subject to a loss carry forward provision, to DME’s account. The loss carry forward provision requires DME to earn a reduced performance allocation of 10% on net investment income in any year subsequent to the year in which the investment account incurs a loss, until all the losses are recouped and an additional amount equal to 150% of the aggregate investment loss is earned. DME is not entitled to earn a performance allocation in a year in which the investment portfolio incurs a loss. For the year ended December 31, 2016, $8.2 million performance allocation (2015: nil, 2014: $28.5 million) was netted against gross investment income.
Pursuant to the advisory agreement, a monthly management fee, equal to 0.125% (1.5% on an annual basis) of the Company’s investment account managed by DME Advisors, is paid to DME Advisors. Included in the net investment income (loss) for the year ended December 31, 2016 were management fees of $16.3 million (2015: $19.2 million, 2014: $20.6 million). The management fees have been fully paid as of December 31, 2016.
Pursuant to the venture and advisory agreements, the Company has agreed to indemnify DME and DME Advisors for any expense, loss, liability, or damage arising out of any claim asserted or threatened in connection with DME Advisors serving as the Company’s investment advisor. The Company will reimburse DME and DME Advisors for reasonable costs and expenses of investigating and/or defending such claims, provided such claims were not caused due to gross negligence, breach of contract or misrepresentation by DME or DME Advisors. For the year ended December 31, 2016, there were no indemnification payments payable or paid by the Company.
Green Brick Partners, Inc
David Einhorn also serves as the Chairman of the Board of Directors of Green Brick Partners, Inc (“GRBK”), a publicly traded company. During the year ended December 31, 2014, the Company, along with certain affiliates of DME Advisors, provided debt financing to GRBK and acquired equity shares of GRBK. During the year ended December 31, 2016, the Company’s investment income included nil (2015: $1.0 million) of interest relating to this debt. During the third quarter of 2015, GRBK repaid the debt in full along with all accrued interest and prepayment fees, and the Company purchased additional equity shares of GRBK. As of December 31, 2016, $34.8 million (2015: $25.0 million) of GRBK listed equities were included on the balance sheet as “equity securities, trading, at fair value”. The Company along with certain affiliates of DME Advisors, collectively own 49% of the issued and outstanding common shares of GRBK. Under applicable securities laws, DME Advisors may be limited at times in its ability to trade GRBK shares on behalf of the Company.
Service Agreement
The Company has entered into a service agreement with DME Advisors, pursuant to which DME Advisors provides certain investor relations services to the Company for compensation of five thousand dollars per month (plus expenses). The agreement is automatically renewed annually until terminated by either the Company or DME Advisors for any reason with 30 days prior written notice to the other party.
14. COMMITMENTS AND CONTINGENCIES
Letters of Credit and Trusts
At December 31, 2016, the Company had the following letter of credit facilities, which automatically renew each year unless terminated by either party in accordance with the applicable required notice period:
Facility | Termination Date | Notice period required for termination | ||||||
($ in thousands) | ||||||||
Butterfield Bank (Cayman) Limited | 100,000 | June 30, 2017 | 90 days prior to termination date | |||||
Citibank Europe plc | 400,000 | October 11, 2017 | 120 days prior to termination date | |||||
JP Morgan Chase Bank N.A. | 100,000 | January 27, 2018 | 120 days prior to termination date | |||||
$ | 600,000 | |||||||
On April 4, 2016, the Company provided a notice of cancellation to terminate the Bank of America, N.A. letter of credit facility of $120.0 million. As of December 31, 2016, an aggregate amount of $255.4 million (2015: $245.6 million) in letters of
F-43
credit were issued under the above facilities. Under the facilities, the Company provides collateral that may consist of equity securities, restricted cash and cash and cash equivalents. As of December 31, 2016, total equity securities, restricted cash, and cash and cash equivalents with a fair value in the aggregate of $310.9 million (2015: $324.3 million) were pledged as collateral against the letters of credit issued (also see Note 4). Each of the facilities contain customary events of default and restrictive covenants, including but not limited to, limitations on liens on collateral, transactions with affiliates, mergers and sales of assets, as well as solvency and maintenance of certain minimum pledged equity requirements, and restricts issuance of any debt without the consent of the letter of credit provider. Additionally, if an event of default exists, as defined in the letter of credit facilities, Greenlight Re will be prohibited from paying dividends to its parent company. The Company was in compliance with all the covenants of each of these facilities as of December 31, 2016 and 2015.
In addition to the letters of credit, the Company has established regulatory trust arrangements for certain cedents. As of December 31, 2016, collateral of $86.4 million (2015: $78.6 million) was provided to cedents in the form of regulatory trust accounts.
Operating Lease Obligations
Greenlight Re has entered into lease agreements for office space in the Cayman Islands. Under the terms of the lease agreements, Greenlight Re is committed to annual rent payments ranging from $0.3 million at inception to $0.5 million at lease termination. The leases expire on June 30, 2018 and Greenlight Re has the option to renew the leases for a further five year term. Included in the schedule below are the minimum lease payment obligations relating to these leases as of December 31, 2016.
GRIL has entered into a lease agreement for office space in Dublin, Ireland. Under the terms of this lease agreement, GRIL is committed to minimum annual rent payments denominated in Euros approximating €0.1 million until May 2021, and adjusted to the prevailing market rates for each of the two subsequent five-year terms. GRIL has the option to terminate the lease agreement in 2021. Included in the schedule below are the net minimum lease payment obligations relating to this lease as of December 31, 2016.
The total rent expense related to leased office space for the year ended December 31, 2016 was $0.6 million, (2015: $0.5 million, 2014: $0.5 million).
Private Equity and Limited Partnerships
From time to time, the Company makes investments in private equity vehicles. As part of the Company’s participation in such private equity investments, the Company may make funding commitments. As of December 31, 2016, the Company had commitments to invest an additional $9.2 million (2015: $6.1 million) in private equity investments. Included in the schedule below are the minimum payment obligations relating to these investments as of December 31, 2016.
Schedule of Commitments and Contingencies
The following is a schedule of future minimum payments required under the above commitments:
2017 | 2018 | 2019 | 2020 | 2021 | Thereafter | Total | |||||||||||||||||||||
($ in thousands) | |||||||||||||||||||||||||||
Operating lease obligations | $ | 621 | $ | 388 | $ | 155 | $ | 155 | $ | 58 | $ | — | $ | 1,377 | |||||||||||||
Private equity and limited partnerships (1) | 9,210 | — | — | — | — | — | 9,210 | ||||||||||||||||||||
$ | 9,831 | $ | 388 | $ | 155 | $ | 155 | $ | 58 | $ | — | $ | 10,587 | ||||||||||||||
(1) Given the nature of these investments, the Company is unable to determine with any degree of accuracy when these commitments will be called. Therefore, for purposes of the above table, the Company has assumed that all commitments with no fixed payment schedules will be called during the year ending December 31, 2017.
Litigation
From time to time in the normal course of business, the Company may be involved in formal and informal dispute resolution procedures, which may include arbitration or litigation, the outcomes of which determine the rights and obligations under the Company’s reinsurance contracts and other contractual agreements. In some disputes, the Company may seek to enforce its rights under an agreement or to collect funds owing to it. In other matters, the Company may resist attempts by others to collect funds or enforce alleged rights. While the final outcome of legal disputes cannot be predicted with certainty,
F-44
the Company does not believe that any existing dispute, when finally resolved, will have a material adverse effect on the Company’s business, financial condition or operating results.
15. SEGMENT REPORTING
The Company manages its business on the basis of one operating segment, Property & Casualty Reinsurance.
Substantially all of the business is sourced through reinsurance brokers. The following table sets forth the premiums sourced from brokers who each accounted for more than 10% of the Company’s gross written premiums:
Year ended December 31 | |||||||||||||||||||||
2016 | 2015 | 2014 | |||||||||||||||||||
($ in thousands) | |||||||||||||||||||||
Largest broker | $ | 274,816 | 51.3 | % | $ | 278,003 | 55.4 | % | $ | 161,405 | 49.8 | % | |||||||||
2nd largest broker | 104,684 | 19.5 | 110,246 | 22.0 | 61,809 | 19.1 | |||||||||||||||
3rd largest broker | — | — | — | — | 40,773 | 12.6 | |||||||||||||||
$ | 379,500 | 70.8 | % | $ | 388,249 | 77.4 | % | $ | 263,987 | 81.5 | % | ||||||||||
The following tables provide a breakdown of the Company’s gross premiums written by line of business and by geographic area of risks insured for the periods indicated:
Gross Premiums Written by Line of Business *
Year ended December 31 | |||||||||||||||||||||
2016 | 2015 | 2014 | |||||||||||||||||||
($ in thousands) | |||||||||||||||||||||
Property | |||||||||||||||||||||
Commercial | $ | 16,180 | 3.0 | % | $ | 15,633 | 3.1 | % | $ | 11,826 | 3.6 | % | |||||||||
Motor | 39,551 | 7.4 | 34,529 | 6.9 | 24,008 | 7.4 | |||||||||||||||
Personal | 47,893 | 8.9 | 57,495 | 11.5 | 63,997 | 19.8 | |||||||||||||||
Total Property | 103,624 | 19.3 | 107,657 | 21.5 | 99,831 | 30.8 | |||||||||||||||
Casualty | |||||||||||||||||||||
General Liability | 34,450 | 6.4 | 27,620 | 5.5 | 11,234 | 3.5 | |||||||||||||||
Motor | 227,030 | 42.4 | 203,624 | 40.6 | 127,858 | 39.4 | |||||||||||||||
Professional | 37,847 | 7.1 | 65,607 | 13.1 | 26,129 | 8.1 | |||||||||||||||
Workers' Compensation | 25,456 | 4.7 | 12,646 | 2.5 | 730 | 0.2 | |||||||||||||||
Total Casualty | 324,783 | 60.6 | 309,497 | 61.7 | 165,951 | 51.2 | |||||||||||||||
Specialty | |||||||||||||||||||||
Accident & Health | 52,114 | 9.7 | 56,784 | 11.3 | 43,837 | 13.5 | |||||||||||||||
Financial | 34,658 | 6.5 | 6,699 | 1.3 | 5,067 | 1.6 | |||||||||||||||
Marine | 9,127 | 1.7 | 9,283 | 1.8 | 5,120 | 1.6 | |||||||||||||||
Other | 11,766 | 2.2 | 12,204 | 2.4 | 4,217 | 1.3 | |||||||||||||||
Total Specialty | 107,665 | 20.1 | 84,970 | 16.8 | 58,241 | 18.0 | |||||||||||||||
$ | 536,072 | 100.0 | % | $ | 502,124 | 100.0 | % | $ | 324,023 | 100.0 | % | ||||||||||
* | During the year ended December 31, 2016, the Company revised its classification of the lines of business. As a result the gross written premiums in the above table relating to certain lines of business previously reported for the years ended December 31, 2015 and 2014, have been reclassified to confirm to the current period presentation. |
F-45
Gross Premiums Written by Geographic Area of Risks Insured
Year ended December 31 | |||||||||||||||||||||
2016 | 2015 | 2014 | |||||||||||||||||||
($ in thousands) | |||||||||||||||||||||
U.S. and Caribbean | $ | 432,144 | 80.6 | % | $ | 383,236 | 76.3 | % | $ | 275,402 | 85.0 | % | |||||||||
Worldwide (1) | 97,810 | 18.2 | 104,336 | 20.8 | 31,106 | 9.6 | |||||||||||||||
Europe | 6,250 | 1.2 | 14,085 | 2.8 | 17,432 | 5.4 | |||||||||||||||
Asia (2) | (132 | ) | — | 467 | 0.1 | 83 | — | ||||||||||||||
$ | 536,072 | 100.0 | % | $ | 502,124 | 100.0 | % | $ | 324,023 | 100.0 | % | ||||||||||
(1) “Worldwide” is comprised of contracts that reinsure risks in more than one geographic area and do not specifically exclude the U.S.
(2) The negative balance represents reversal of premiums due to premium adjustments, termination of contracts or premium returned upon novation or commutation of contracts.
F-46
16. QUARTERLY FINANCIAL RESULTS (UNAUDITED)
The following table presents the quarterly financial results for each of the quarters ended during 2016:
2016 | ||||||||||||||||
Quarter ended | ||||||||||||||||
March 31 | June 30 | September 30 | December 31 | |||||||||||||
($ in thousands, except per share amounts) | ||||||||||||||||
Revenues | ||||||||||||||||
Gross premiums written | $ | 166,792 | $ | 92,237 | $ | 128,205 | $ | 148,838 | ||||||||
Gross premiums ceded | (2,107 | ) | (3,522 | ) | (2,119 | ) | (2,267 | ) | ||||||||
Net premiums written | 164,685 | 88,715 | 126,086 | 146,571 | ||||||||||||
Change in net unearned premium reserves | (26,573 | ) | 36,867 | (13,294 | ) | (9,939 | ) | |||||||||
Net premiums earned | 138,112 | 125,582 | 112,792 | 136,632 | ||||||||||||
Net investment income (loss) | 28,435 | (38,054 | ) | 32,945 | 52,857 | |||||||||||
Other income (expense), net | (271 | ) | 282 | (192 | ) | (754 | ) | |||||||||
Total revenues | 166,276 | 87,810 | 145,545 | 188,735 | ||||||||||||
Expenses | ||||||||||||||||
Loss and loss adjustment expenses incurred, net | 90,668 | 111,376 | 81,467 | 97,304 | ||||||||||||
Acquisition costs, net | 38,963 | 35,484 | 25,844 | 34,243 | ||||||||||||
General and administrative expenses | 6,999 | 4,994 | 6,937 | 6,878 | ||||||||||||
Total expenses | 136,630 | 151,854 | 114,248 | 138,425 | ||||||||||||
Income (loss) before income tax expense | 29,646 | (64,044 | ) | 31,297 | 50,310 | |||||||||||
Income tax (expense) benefit | (204 | ) | 258 | (305 | ) | (258 | ) | |||||||||
Net income (loss) including non-controlling interest | 29,442 | (63,786 | ) | 30,992 | 50,052 | |||||||||||
Loss (income) attributable to non-controlling interest in joint venture | (773 | ) | 791 | (981 | ) | (856 | ) | |||||||||
Net income (loss) | $ | 28,669 | $ | (62,995 | ) | $ | 30,011 | $ | 49,196 | |||||||
Earnings (loss) per share | ||||||||||||||||
Basic | $ | 0.77 | $ | (1.69 | ) | $ | 0.80 | $ | 1.32 | |||||||
Diluted | $ | 0.77 | $ | (1.69 | ) | $ | 0.80 | $ | 1.31 | |||||||
Weighted average number of ordinary shares used in the determination of earnings and loss per share | ||||||||||||||||
Basic | 37,107,039 | 37,281,392 | 37,323,575 | 37,381,714 | ||||||||||||
Diluted | 37,422,921 | 37,281,392 | 37,385,481 | 37,414,570 | ||||||||||||
F-47
The following table presents the quarterly financial results for each of the quarters ended during 2015:
2015 | ||||||||||||||||
Quarter ended | ||||||||||||||||
March 31 | June 30 | September 30 | December 31 | |||||||||||||
($ in thousands) | ||||||||||||||||
Revenues | ||||||||||||||||
Gross premiums written | $ | 129,682 | $ | 92,990 | $ | 134,568 | $ | 144,884 | ||||||||
Gross premiums ceded | (1,626 | ) | (1,868 | ) | (2,288 | ) | (3,219 | ) | ||||||||
Net premiums written | 128,056 | 91,122 | 132,280 | 141,665 | ||||||||||||
Change in net unearned premium reserves | (33,263 | ) | 563 | (30,286 | ) | (21,750 | ) | |||||||||
Net premiums earned | 94,793 | 91,685 | 101,994 | 119,915 | ||||||||||||
Net investment income (loss) | (24,829 | ) | (20,305 | ) | (191,322 | ) | (45,468 | ) | ||||||||
Other income (expense), net | 1,588 | (3,760 | ) | (542 | ) | (699 | ) | |||||||||
Total revenues | 71,552 | 67,620 | (89,870 | ) | 73,748 | |||||||||||
Expenses | ||||||||||||||||
Loss and loss adjustment expenses incurred, net | 63,207 | 76,653 | 97,421 | 79,816 | ||||||||||||
Acquisition costs, net | 26,841 | 23,939 | 32,146 | 33,281 | ||||||||||||
General and administrative expenses | 6,160 | 6,894 | 5,382 | 4,998 | ||||||||||||
Total expenses | 96,208 | 107,486 | 134,949 | 118,095 | ||||||||||||
Income (loss) before income tax | (24,656 | ) | (39,866 | ) | (224,819 | ) | (44,347 | ) | ||||||||
Income tax (expense) benefit | 215 | (54 | ) | 1,233 | 361 | |||||||||||
Net income (loss) including non-controlling interest | (24,441 | ) | (39,920 | ) | (223,586 | ) | (43,986 | ) | ||||||||
Loss (income) attributable to non-controlling interest in joint venture | 394 | 324 | 3,909 | 881 | ||||||||||||
Net income (loss) | $ | (24,047 | ) | $ | (39,596 | ) | $ | (219,677 | ) | $ | (43,105 | ) | ||||
Earnings (loss) per share | ||||||||||||||||
Basic | $ | (0.65 | ) | $ | (1.06 | ) | $ | (5.98 | ) | $ | (1.17 | ) | ||||
Diluted | $ | (0.65 | ) | $ | (1.06 | ) | $ | (5.98 | ) | $ | (1.17 | ) | ||||
Weighted average number of ordinary shares used in the determination of earnings and loss per share | ||||||||||||||||
Basic | 37,173,008 | 37,303,265 | 36,710,216 | 36,720,454 | ||||||||||||
Diluted | 37,173,008 | 37,303,265 | 36,710,216 | 36,720,454 | ||||||||||||
F-48
SCHEDULE I
GREENLIGHT CAPITAL RE, LTD.
SUMMARY OF INVESTMENTS — OTHER THAN INVESTMENTS IN RELATED PARTIES
AS OF DECEMBER 31, 2016
(expressed in thousands of U.S. dollars)
Type of Investment | Cost | Fair Value | Balance Sheet Value | |||||||||
($ in thousands) | ||||||||||||
Debt instruments, trading, at fair value | $ | 23,403 | $ | 22,473 | $ | 22,473 | ||||||
Equity securities, trading, at fair value | ||||||||||||
Equities – listed | 753,813 | 828,486 | 828,486 | |||||||||
Exchange traded funds | 15,056 | 15,515 | 15,515 | |||||||||
Total equity securities, trading, at fair value | 768,869 | 844,001 | 844,001 | |||||||||
Total investments, trading | $ | 792,272 | $ | 866,474 | $ | 866,474 | ||||||
Other investments, at fair value | ||||||||||||
Commodities | $ | 130,671 | $ | 137,296 | $ | 137,296 | ||||||
Private and unlisted equity securities | 14,418 | 18,767 | 18,767 | |||||||||
Total other investments, at fair value | 145,089 | 156,063 | 156,063 | |||||||||
Total investments | $ | 937,361 | $ | 1,022,537 | $ | 1,022,537 | ||||||
F-49
SCHEDULE II
GREENLIGHT CAPITAL RE, LTD.
CONDENSED FINANCIAL INFORMATION OF REGISTRANT
CONDENSED BALANCE SHEETS — PARENT COMPANY ONLY
(expressed in thousands of U.S. dollars)
December 31, 2016 | December 31, 2015 | |||||||
($ in thousands) | ||||||||
Assets | ||||||||
Cash and cash equivalents | $ | 6 | $ | 6 | ||||
Investment in subsidiaries | 888,095 | 840,196 | ||||||
Notes receivable | 15,164 | 2,175 | ||||||
Total assets | $ | 903,265 | $ | 842,377 | ||||
Liabilities and equity | ||||||||
Liabilities | ||||||||
Due to subsidiaries | $ | 29,023 | $ | 16,986 | ||||
Total liabilities | 29,023 | 16,986 | ||||||
Shareholders’ equity | ||||||||
Share capital | 3,737 | 3,703 | ||||||
Additional paid-in capital | 500,337 | 496,401 | ||||||
Retained earnings | 370,168 | 325,287 | ||||||
Total shareholders’ equity | 874,242 | 825,391 | ||||||
Total liabilities and equity | $ | 903,265 | $ | 842,377 | ||||
GREENLIGHT CAPITAL RE, LTD.
CONDENSED FINANCIAL INFORMATION OF REGISTRANT
CONDENSED STATEMENTS OF INCOME — PARENT COMPANY ONLY
(expressed in thousands of U.S. dollars)
Year ended December 31 | ||||||||||||
2016 | 2015 | 2014 | ||||||||||
($ in thousands) | ||||||||||||
Revenue | ||||||||||||
Investment income | $ | 952 | $ | 5,962 | $ | 671 | ||||||
Total revenues | 952 | 5,962 | 671 | |||||||||
Expenses | ||||||||||||
General and administrative expenses | 4,042 | 4,048 | 3,806 | |||||||||
Net income (loss) before equity in earnings of consolidated subsidiaries | (3,090 | ) | 1,914 | (3,135 | ) | |||||||
Equity in earnings of consolidated subsidiaries | 47,971 | (328,339 | ) | 112,727 | ||||||||
Consolidated net income (loss) | $ | 44,881 | $ | (326,425 | ) | $ | 109,592 | |||||
F-50
SCHEDULE II (continued)
GREENLIGHT CAPITAL RE, LTD.
CONDENSED FINANCIAL INFORMATION OF REGISTRANT
CONDENSED STATEMENTS OF CASH FLOWS — PARENT COMPANY ONLY
(expressed in thousands of U.S. dollars)
Year Ended December 31 | ||||||||||||
2016 | 2015 | 2014 | ||||||||||
($ in thousands) | ||||||||||||
Cash provided by (used in) operating activities | ||||||||||||
Net income (loss) | $ | 44,881 | $ | (326,425 | ) | $ | 109,592 | |||||
Adjustments to reconcile net income (loss) to cash provided by operating activities | ||||||||||||
Equity in earnings of consolidated subsidiaries | (47,971 | ) | 328,339 | (112,727 | ) | |||||||
Share-based compensation expense | 4,042 | 4,048 | 3,806 | |||||||||
Net change in | ||||||||||||
Due from subsidiaries | — | 15,276 | 971 | |||||||||
Due to subsidiaries | 12,037 | 16,986 | (3,808 | ) | ||||||||
Net cash (used in) provided by operating activities | 12,989 | 38,450 | (2,008 | ) | ||||||||
Investing activities | ||||||||||||
Change in note receivable | (12,989 | ) | (609 | ) | 2,162 | |||||||
Contributed surplus to subsidiaries, net | — | (20,000 | ) | — | ||||||||
Net cash (used in) provided by investing activities | (12,989 | ) | (20,836 | ) | 2,004 | |||||||
Financing activities | ||||||||||||
Issue of Class A ordinary shares, net of forfeitures | — | — | — | |||||||||
Net proceeds from exercise of stock options | — | — | — | |||||||||
Short-swing sale profit from shareholder | — | 83 | — | |||||||||
Repurchase of Class A ordinary shares | — | (17,692 | ) | — | ||||||||
Net cash (used in) provided by financing activities | — | (17,609 | ) | — | ||||||||
Net increase (decrease) in cash and cash equivalents | — | 5 | (4 | ) | ||||||||
Cash and cash equivalents at beginning of the year | 6 | 1 | 5 | |||||||||
Cash and cash equivalents at end of the year | $ | 6 | $ | 6 | $ | 1 | ||||||
Supplementary information | ||||||||||||
Non cash consideration from (to) subsidiaries, net | $ | 72 | $ | (227 | ) | $ | (158 | ) | ||||
F-51
SCHEDULE III
GREENLIGHT CAPITAL RE, LTD.
SUPPLEMENTARY INSURANCE INFORMATION
AS OF AND FOR THE YEARS ENDED DECEMBER 31, 2016, 2015 AND 2014
(expressed in thousands of U.S. dollars)
Year | Segment | Deferred acquisition costs, net | Reserves for losses and loss adjustment expenses – gross | Unearned premiums – gross | Net premiums earned | Net investment income (loss) | Net losses, and loss adjustment expenses | Amortization of deferred acquisition costs | Other operating expenses | Gross premiums written | ||||||||||||||||||
2016 | Property & Casualty | $ | 61,022 | $ | 306,641 | $ | 222,527 | $ | 513,118 | $ | 76,183 | $ | 380,815 | $ | 134,534 | $ | 25,808 | $ | 536,072 | |||||||||
2015 | Property & Casualty | $ | 59,823 | $ | 305,997 | $ | 211,954 | $ | 408,387 | $ | (281,924 | ) | $ | 317,097 | $ | 116,207 | $ | 23,434 | $ | 502,124 | ||||||||
2014 | Property & Casualty | $ | 34,420 | $ | 264,243 | $ | 128,736 | $ | 354,240 | $ | 122,575 | $ | 234,986 | $ | 107,665 | $ | 24,500 | $ | 324,023 | |||||||||
SCHEDULE IV
GREENLIGHT CAPITAL RE, LTD.
SUPPLEMENTARY REINSURANCE INFORMATION
AS OF AND FOR THE YEARS ENDED DECEMBER 31, 2016, 2015 AND 2014
(expressed in thousands of U.S. dollars)
Year | Segment | Direct gross premiums | Premiums ceded to other companies | Premiums assumed from other companies | Net written premiums | Percentage of amount assumed to net | ||||||||||||||
2016 | Property & Casualty | $ | — | $ | 10,015 | $ | 536,072 | $ | 526,057 | 102 | % | |||||||||
2015 | Property & Casualty | $ | — | $ | 9,001 | $ | 502,124 | $ | 493,123 | 102 | % | |||||||||
2014 | Property & Casualty | $ | — | $ | 13,493 | $ | 324,023 | $ | 310,530 | 104 | % | |||||||||
F-52
EXHIBIT INDEX
Exhibit Number | Description of Exhibit |
3.1 | Third Amended and Restated Memorandum and Articles of Association as revised by special resolution on July 10, 2008 (incorporated by reference to Exhibit 3.1 of the Company’s Form 10-Q filed on August 7, 2008) | |
4.1 | Form of Specimen Certificate of Class A ordinary shares (incorporated by reference to Exhibit 4.1 of the Company’s Registration Statement No. 333-139993) | |
4.2 | Share Purchase Option, dated August 11, 2004, by and between the Registrant and First International Capital Holdings, Ltd. (incorporated by reference to Exhibit 4.2 of the Company’s Registration Statement No. 333-139993) | |
10.1 | Form of Securities Purchase Agreement for Class A ordinary shares by and between the Registrant and each of the subscribers thereto (incorporated by reference to Exhibit 10.2 of the Company’s Registration Statement No. 333-139993) | |
10.2 (1) | Greenlight Capital Re, Ltd. Third Amended and Restated 2004 Stock Incentive Plan (incorporated by reference to Exhibit 10.19 of the Company’s Registration Statement No. 333-139993) | |
10.3 (1) | Form of Restricted Stock Award Agreement by and between the Registrant and the Grantee (incorporated by reference to Exhibit 10.6 of the Company’s Registration Statement No. 333-139993) | |
10.4 (1) | Form of Stock Option Agreement (incorporated by reference to Exhibit 10.7 of the Company’s Registration Statement No. 333-139993) | |
10.5 (1) | Greenlight Capital Re, Ltd. Form of Directors’ Restricted Stock Award (incorporated by reference to Exhibit 10.20 of the Company’s Registration Statement No. 333-139993) | |
10.6 (1) | Greenlight Capital Re, Ltd. Form of Employees’ Restricted Stock Award (incorporated by reference to Exhibit 10.21 of the Company’s Registration Statement No. 333-139993) | |
10.7 | Form of Shareholders’ Agreement, dated August 11, 2004, by and among the Registrant and each of the subscribers (incorporated by reference to Exhibit 10.8 of the Company’s Registration Statement No. 333-139993) | |
10.8 | Form of Deed of Indemnity between the Registrant and each of its directors and certain of its officers (incorporated by reference to Exhibit 10.11 of the Company’s Registration Statement No. 333-139993) | |
10.9 (1) | Amended and Restated Employment Agreement, dated as of December 30, 2008, by and among Greenlight Capital Re, Ltd., Greenlight Reinsurance, Ltd. and Tim Courtis (incorporated by reference to Exhibit 10.2 of the Company’s Current Report on Form 8-K filed on January 2, 2009) | |
10.10 (1) | Concurrent Private Placement Stock Purchase Agreement for Class B Ordinary Shares, dated January 11, 2007, by and between the Company and David Einhorn (incorporated by reference to Exhibit 10.16 of the Company’s Registration Statement No. 333-139993) | |
10.11 | Service Agreement, dated as of February 21, 2007, between DME Advisors, LP and Greenlight Capital Re, Ltd. (incorporated by reference to Exhibit 10.17 of the Company’s Registration Statement No. 333-139993) | |
10.12 (1) | Amendment No. 1, dated February 18, 2009, to the Amended and Restated Employment Agreement, dated as of December 30, 2008, by and among Greenlight Capital Re, Ltd., Greenlight Reinsurance, Ltd. and Tim Courtis (incorporated by reference to Exhibit 10.26 of the Company’s Form 10-K filed on February 23, 2009) | |
10.14 (1) | Greenlight Capital Re, Ltd. Amended and Restated 2004 Stock Incentive Plan (incorporated by reference to Exhibit 10.1 of the Company’s Form 8-K filed on May 4, 2010) | |
10.15 | Amended and Restated Letter of Credit Agreement, executed June 17, 2010, between Greenlight Reinsurance, Ltd. and Butterfield Bank (Cayman) Limited (incorporated by reference to Exhibit 10.3 of the Company’s Form 10-Q filed on August 2, 2010) | |
10.17 | Letter of Understanding, dated June 10, 2010, between Greenlight Reinsurance, Ltd. and Citibank, N.A (incorporated by reference to Exhibit 10.1 of the Company’s Form 10-Q filed on August 2, 2010) | |
10.18 | Letter of Credit Agreement, dated August 20, 2010, between Greenlight Reinsurance, Ltd. and Citibank Europe plc. (incorporated by reference to Exhibit 10.1 of the Company’s Form 10-Q filed on November 2, 2010) | |
10.19 | Master Reimbursement Agreement, dated August 20, 2010, between Greenlight Reinsurance, Ltd. and Citibank Europe plc (incorporated by reference to Exhibit 10.2 of the Company’s Form 10-Q filed on November 2, 2010) | |
10.20 | Reinsurance Deposit Agreement, dated August 20, 2010, between Greenlight Reinsurance, Ltd. and Citibank Europe plc. (incorporated by reference to Exhibit 10.3 of the Company’s Form 10-Q filed on November 2, 2010) | |
10.22 | Letter of Credit Agreement, effective as of February 3, 2011, between Greenlight Reinsurance, Ltd. and JPMorgan Chase Bank N.A. (incorporated by reference to Exhibit 10.38 of the Company’s Form 10-K filed on February 22, 2011) | |
10.23 (1) | Amended and Restated Employment Agreement, dated July 26, 2012, by and among Greenlight Capital Re, Ltd., Greenlight Reinsurance, Ltd. and Barton Hedges (incorporated by reference to Exhibit 10.1 of the Company’s Form 10-Q filed on July 30, 2012) | |
10.24 (1) | Employment Agreement, dated August 15, 2006, by and among Greenlight Capital Re, Ltd., Greenlight Reinsurance, Ltd. and Brendan Barry (incorporated by reference to Exhibit 10.24 of the Company’s Form 10-K filed on February 21, 2012) | |
10.27 | Amended letter of credit agreement, effective as of December 16, 2011, between Greenlight Reinsurance, Ltd. and JPMorgan Chase Bank N.A. (incorporated by reference to Exhibit 10.27 of the Company’s Form 10-K filed on February 21, 2012) | |
10.30 (1) | Employment Agreement, dated July 31, 2014, by and among Greenlight Reinsurance, Ltd. and James McNichols (incorporated by reference to Exhibit 10.1 of the Company’s Form 10-Q filed on November 3, 2014) | |
10.31 | Amendment Letter Agreement between Greenlight Reinsurance, Ltd. and Butterfield Bank (Cayman) Limited, effective June 1, 2015, amending the Amended and Restated Letter of Credit Agreement dated June 17, 2010 (incorporated by reference to Exhibit 10.1 of the Company’s Form 10-Q filed on August 3, 2015) | |
10.32 | Amended and Restated Letter of Credit Facility Agreement, dated May 7, 2015 between Greenlight Reinsurance, Ltd. and Bank of America, N.A., amending the Amended Letter of Credit Facility Agreement dated December 16, 2011 (incorporated by reference to Exhibit 10.2 of the Company’s Form 10-Q filed on August 3, 2015) | |
10.33 | Letter Agreement between Greenlight Capital Re, Ltd., Greenlight Reinsurance, Ltd., Greenlight Reinsurance Ireland, Ltd., DME Advisors, LLC and DME Advisors, LP., dated June 17, 2015 (incorporated by reference to Exhibit 10.3 of the Company’s Form 10-Q filed on August 3, 2015) | |
10.34 | Third Amended and Restated Agreement by and among Greenlight Reinsurance, Ltd., Greenlight Reinsurance Ireland, a Designated Activity Company, Greenlight Capital Re, Ltd. (for limited purposes), DME Advisors, LLC and DME Advisors, LP (for limited purposes), dated as of September 30, 2016 and effective as of January 1, 2017 (incorporated by reference to Exhibit 10.1 to the Company’s Form 8-K filed on October 6, 2016). | |
10.35 | Amended and Restated Investment Advisory Agreement among DME Advisors, LP, The Venture Among Greenlight Reinsurance, Ltd., Greenlight Reinsurance Ireland, a Designated Activity Company, and DME Advisors, LLC, Greenlight Reinsurance, Ltd., Greenlight Reinsurance Ireland, a Designated Activity Company and DME Advisors, LLC., dated as of September 30, 2016 and effective as of January 1, 2017 (incorporated by reference to Exhibit 10.2 to the Company’s Form 8-K filed on October 6, 2016). | |
10.36 | Deed of Settlement and Release dated December 15, 2016, among Barton Hedges, Greenlight Capital Re, Ltd., and Greenlight Reinsurance, Ltd. (incorporated by reference to Exhibit 99.2 to the Company’s Form 8-K filed on December 19, 2016). | |
10.37 | Consulting agreement dated December 16, 2016, among Greenlight Capital Re, Ltd., Greenlight Reinsurance, Ltd. and Leonard Goldberg (incorporated by reference to Exhibit 99.3 to the Company’s Form 8-K filed on December 19, 2016). | |
12.1 | Ratio of earnings to fixed charges and preferred share dividends. | |
21.1 | Subsidiaries of the registrant (incorporated by reference to Exhibit 21.1 of the Company’s Form 10-K filed on February 22, 2011) | |
23.1 | Consent of BDO USA, LLP | |
31.1 | Certification of the Chief Executive Officer of Greenlight Capital Re, Ltd. filed herewith pursuant to Section 302 of the Sarbanes-Oxley Act of 2002 | |
31.2 | Certification of the Chief Financial Officer of Greenlight Capital Re, Ltd. filed herewith pursuant to Section 302 of the Sarbanes-Oxley Act of 2002 | |
32.1 | Certification of the Chief Executive Officer of Greenlight Capital Re, Ltd. furnished herewith pursuant to Section 906 of the Sarbanes-Oxley Act of 2002 | |
32.2 | Certification of the Chief Financial Officer of Greenlight Capital Re, Ltd. furnished herewith pursuant to Section 906 of the Sarbanes-Oxley Act of 2002 | |
101 | The following materials from the Company’s Annual Report on Form 10-K for the year ended December 31, 2016, formatted in XBRL (eXtensible Business Reporting Language): (i) the Consolidated Balance Sheets; (ii) the Consolidated Statements of Income; (iii) the Consolidated Statements of Shareholders’ Equity; (iv) the Consolidated Statements of Cash Flows; and (v) the Notes to Consolidated Financial Statements. | |
(1 | ) | Management contract or compensatory plan or arrangement. |