Attached files
| file | filename |
|---|---|
| EX-32 - EXHIBIT 32 - Federal-Mogul Holdings LLC | exhibit32201610-k.htm |
| EX-31.3 - EXHIBIT 31.3 - Federal-Mogul Holdings LLC | exhibit313201610-k.htm |
| EX-31.2 - EXHIBIT 31.2 - Federal-Mogul Holdings LLC | exhibit312201610-k.htm |
| EX-31.1 - EXHIBIT 31.1 - Federal-Mogul Holdings LLC | exhibit311201610-k.htm |
| EX-21 - EXHIBIT 21 - Federal-Mogul Holdings LLC | exhibit21201610-k.htm |
UNITED STATES
SECURITIES AND EXCHANGE COMMISSION
Washington, D.C. 20549
FORM 10-K
ANNUAL REPORT PURSUANT TO SECTION 13 OR 15(d) OF
THE SECURITIES EXCHANGE ACT OF 1934
For the fiscal year ended December 31, 2016
Commission File Number: 001-34029
FEDERAL-MOGUL HOLDINGS LLC
(Exact name of Registrant as specified in its charter)
Delaware | 46-5182047 | |
(State or other jurisdiction of incorporation or organization) | (IRS Employer I.D. No.) | |
27300 West 11 Mile Road, Southfield, Michigan | 48034 | |
(Address of principal executive offices) | (Zip code) | |
Registrant’s telephone number including area code: (248) 354-7700 | ||
Securities registered pursuant to Section 12(b) of the Act: | ||
Title of Each Class | Name of Each Exchange on Which Registered | |
Common Stock par value $0.01 per share | The NASDAQ Global Select Market | |
Indicate by check mark if the registrant is a well-known seasoned issuer, as defined in Rule 405 of the Securities Act. Yes ¨ No x
Indicate by check mark if the registrant is not required to file reports pursuant to Section 13 or Section 15(d) of the Act. Yes ¨ No x
Indicate by check mark whether the registrant (1) has filed all reports required to be filed by Section 13 or 15(d) of the Securities Exchange Act of 1934 during the preceding 12 months (or for such shorter period that the registrant was required to file such reports), and (2) has been subject to such filing requirements for the past 90 days. Yes x No ¨
Indicate by check mark whether the registrant has submitted electronically and posted on its corporate Web site, if any, every Interactive Data File required to be submitted and posted pursuant to Rule 405 of Regulation S-T (§232.405 of this chapter) during the preceding 12 months (or for such shorter period that the registrant was required to submit and post such files). Yes x No ¨
Indicate by check mark if disclosure of delinquent filers pursuant to Item 405 of Regulation S-K (§ 229.405) is not contained herein, and will not be contained, to the best of registrant’s knowledge, in definitive proxy or information statements incorporated by reference in Part III of this Form 10-K or any amendment to this Form 10-K. x
Indicate by check mark whether the registrant is a large accelerated filer, an accelerated filer, a non-accelerated filer, or a smaller reporting company. See definition of “large accelerated filer,” “accelerated filer” and “smaller reporting company” in Rule 12b-2 of the Exchange Act (check one):
Large accelerated filer | ¨ | Accelerated filer | x | Non-accelerated filer | ¨ | Smaller Reporting Company | ¨ | |||
Indicate by check mark whether the registrant is a shell company (as defined in Rule 12b-2 of the Act). Yes ¨ No x
The aggregate market value of the common stock held by non-affiliates of the Registrant was approximately $253 million as of June 30, 2016 based on the reported last sale price as reported on the NASDAQ Global Select Market on that date.
Indicate by check mark whether the registrant has filed all documents and reports required to be filed by Section 12, 13 or 15(d) of the Securities Exchange Act of 1934 subsequent to the distribution of securities under a plan confirmed by a court. Yes x No ¨
There were no stockholders of record of Common Stock as of February 22, 2017 since the Company converted to a single member limited liability company on February 14, 2017, as such the Registrant had no shares of common stock outstanding as of February 22, 2017.
DOCUMENTS INCORPORATED BY REFERENCE
Portions of the Registrant’s 2017 Proxy Statement are incorporated by reference into Part III of this Annual Report.
INDEX
Page No. | |
FORWARD-LOOKING STATEMENTS
Certain statements contained or incorporated in this Annual Report on Form 10-K which are not statements of historical fact constitute “Forward-Looking Statements” within the meaning of the Private Securities Litigation Reform Act of 1995 (the “Reform Act”).
Forward-looking statements give current expectations or forecasts of future events. Words such as “anticipate,” “believe,” “estimate,” “expect,” “intend,” “may”, “plan,” “seek” and other words and terms of similar meaning in connection with discussions of future operating or financial performance signify forward-looking statements. We also, from time to time, may provide oral or written forward-looking statements in other materials released to the public. Such statements are made in good faith pursuant to the “Safe Harbor” provisions of the Reform Act.
Any or all forward-looking statements included in this report or in any other public statements may ultimately be incorrect. Forward-looking statements may involve known and unknown risks, uncertainties and other factors, which may cause the actual results, performance, experience or achievements to differ materially from any future results, performance, experience or achievements expressed or implied by such forward-looking statements. We undertake no obligation to update any forward-looking statements, whether as a result of new information, future events, or otherwise.
Listed below are some of the factors that could potentially cause actual results to differ materially from historical and expected future results. Other factors besides these listed here could also materially affect our business.
• | Our substantial indebtedness, which could restrict our business activities and could subject us to significant interest rate risks; |
• | Our restructuring activities and strategic initiatives may affect our short-term liquidity and may not result in the anticipated synergies and cost savings. |
• | Various worldwide economic, political and social factors, changes in economic conditions, currency fluctuations and devaluations, credit risks in emerging markets, or political instability in foreign countries where we have significant manufacturing operations, customers or suppliers. |
• | Changes in tax law or trade agreements and new or changed tariffs. |
• | Risks related to our joint ventures. |
• | Risks relating to acquisitions. |
• | Impairment changes relating to our goodwill and long lived assets. |
• | Variations in current and anticipated future production volumes, financial condition, or operational circumstances of our significant customers, particularly the world’s original equipment manufacturers of commercial and passenger vehicles. |
• | Our ability to generate cost savings or manufacturing efficiencies to offset or exceed contractually or competitively required price reductions or price reductions to obtain new business. |
• | Our ability to obtain cash adequate to fund our needs, including availability of borrowings under our various credit facilities. |
• | Fluctuations in the price and availability of raw materials and other supplies used in the manufacturing and distribution of our products. |
• | Strategic decisions of our parent, Icahn Enterprises, L.P.. |
• | Material shortages, transportation system delays, or other difficulties in markets where we purchase supplies for the manufacturing of our products. |
• | Significant work stoppages, disputes, or any other difficulties in labor markets where we obtain materials necessary for the manufacturing of our products or where our products are manufactured, distributed or sold. |
• | Our ability to expand our development of fuel cell, hybrid-electric or other alternative energy technologies. |
• | Changes in actuarial assumptions, interest costs and discount rates, and fluctuations in the global securities markets which directly affect the valuation of assets and liabilities associated with our pension and other postretirement benefit plans. |
• | Legal actions and claims of undetermined merit and amount involving, among other things, product liability, patent infringement, warranty, recalls of products manufactured or sold by us, and environmental and safety issues involving our products or facilities. |
1
• | Legislative activities of governments, agencies, and similar organizations, both in the U.S. and in other countries that may affect our operations. |
• | Physical damage to, or loss of, significant manufacturing or distribution property, plant, and equipment due to fire, weather or other factors beyond our control. |
• | Our ability to effectively transition our information system infrastructure and functions to newer generation systems. |
• | Other risks set forth under “Item 1A-Risk Factors” in this Form 10-K. |
2
PART I
ITEM 1. BUSINESS
The Company
Federal-Mogul Holdings LLC is a limited liability company formed under the laws of Delaware. On February 14, 2017, Federal-Mogul Holdings Corporation was converted to a single member limited liability corporation in the U.S. and changed its name to Federal-Mogul Holdings LLC. References herein to the “Company,” “Federal-Mogul,” “we,” “us,” or “our” refer to Federal-Mogul Holdings LLC for the period after the effective date of the conversion on February 14, 2017, Federal-Mogul Holdings Corporation for the period after the effective date of the Reorganization (subsequently defined below) on April 15, 2014, and Federal-Mogul Corporation for the period prior to the effective date of the Reorganization on April 15, 2014.
Holding Company Reorganization: On April 15, 2014, Federal-Mogul Corporation completed a holding company reorganization (the “Reorganization”). As a result of the Reorganization, the outstanding shares of Federal-Mogul Corporation common stock were automatically converted on a one-for-one basis into shares of Federal-Mogul Holdings Corporation common stock, and all of the stockholders of Federal-Mogul Corporation immediately prior to the Reorganization automatically became stockholders of Federal-Mogul Holdings Corporation. The rights of stockholders of Federal-Mogul Holdings Corporation are generally governed by Delaware law and Federal-Mogul Holdings Corporation’s certificate of incorporation and bylaws, which are the same in all material respects as those of Federal-Mogul Corporation immediately prior to the Reorganization. In addition, the board of directors of Federal-Mogul Holdings Corporation and its Audit Committee and Compensation Committee were composed of the same members as the board of directors, Audit Committee and Compensation Committee of Federal-Mogul Corporation prior to the Reorganization.
Merger Transaction: On September 6, 2016, the Company, American Entertainment Properties Corp., a Delaware corporation (“AEP”), our parent and a subsidiary of Icahn Enterprises L.P. ("IEP"), and IEH FM Holdings LLC, a Delaware limited liability company (“Merger Sub”) entered into an Agreement and Plan of Merger (the "Merger Agreement"). Pursuant to the Merger Agreement, and upon the terms and subject to the conditions thereof, Merger Sub commenced a cash tender offer (the "Offer) to acquire, subject to the terms and conditions of the Merger Agreement, all of the issued and outstanding shares of the Company’s common stock, par value $0.01 per share, not already owned by IEP affiliates, for a purchase price of $9.25 per share, net to the seller in cash, without interest, less any applicable tax withholding.
On January 3, 2017, the Company announced it had received a revised proposal to purchase shares of the Company’s common stock for $10.00 per share, an increase from the previous offer of $9.25 in cash per share. On January 23, 2017, AEP, and Merger Sub completed the acquisition of the Company as all terms and conditions set forth in the Merger Agreement were satisfied. Shares of the Company's stock are no longer publicly traded as of the close of business January 23, 2017.
Spinoff: On September 3, 2014, we announced a plan to separate our Powertrain and Motorparts divisions into two independent, publicly-traded companies serving the global original equipment and aftermarket industries.
On January 15, 2016, we announced a termination of the previously announced spin-off of our Motorparts division. We will continue to operate with two separate, independent businesses with separate CEOs who will each report directly to our board of directors. The separate businesses more effectively serve their unique markets and allow each operating business to pursue its business strategy and more quickly react to our respective market conditions.
Interests Held by an Entity Controlled by Mr. Carl C. Icahn
As of December 31, 2016, Mr. Carl C. Icahn indirectly controlled approximately 81.99% of the voting power of the Company’s capital stock and, by virtue of such stock ownership, is able to control or exert substantial influence over the Company, including the election of directors, business strategy and policies, mergers or other business combinations, acquisition or disposition of assets, future issuances of common stock or other securities, incurrence of debt or obtaining other sources of financing, and the payment of dividends on the Company’s common stock. Under applicable law and our certificate of incorporation and bylaws, certain actions cannot be taken without the approval of holders of a majority of our voting stock including, without limitation, mergers, the sale of substantially all of our assets, and amendments to our certificate of incorporation and bylaws. So long as Mr. Icahn continues to control a majority of our outstanding capital stock, he will continue to have these governance rights and the ability to control Federal-Mogul Holdings LLC. As a result of the Merger Transaction and subsequent conversion, the entity indirectly owned and controlled by Mr. Icahn became the sole member of the Company.
3
Business Overview
We are a leading global supplier of technology and innovation in vehicle and industrial products for fuel economy, emissions reduction, and safety systems. We serve the world’s foremost original equipment manufacturers (“OEM”) and servicers (“OES”) (collectively “OE”) of automotive, light, medium and heavy-duty commercial vehicles, off-road, agricultural, marine, rail, aerospace, power generation and industrial equipment, as well as the independent aftermarket. We seek to participate in both of these markets by leveraging our original equipment product engineering and development capability, manufacturing know-how, and expertise in managing a broad and deep range of replacement parts to service the aftermarket. We believe that we are uniquely positioned to effectively manage the life cycle of a broad range of products to a diverse customer base. We are a leading technology supplier and a market share leader in several product categories. As of December 31, 2016, we had current OEM products included on more than 400 global vehicle platforms and more than 800 global powertrains used in light, medium, and heavy-duty vehicles. We offer premium brands, OE replacement, and entry/mid-level products for all aftermarket customers. This broad range of vehicle and powertrain applications reinforces our belief in our unique market position.
We operate with two end-customer focused business segments. The Powertrain segment focuses on original equipment powertrain products for automotive, heavy duty, and industrial applications. The Motorparts segment sells and distributes a broad portfolio of products in the global aftermarket and also serves original equipment manufacturers with products including braking, wipers, and a limited range of chassis components. This organizational model allows for a strong product line focus benefitting both original equipment and aftermarket customers and enables us to be responsive to customers’ needs for superior products and to promote greater identification with our premium brands. Additionally, this organizational model enhances management focus to capitalize on opportunities for organic or acquisition growth, profit improvement, capital allocation, and business model optimization in line with the unique requirements of the two different customer bases and business models.
Powertrain offers its customers a diverse array of market-leading products for OE applications, including pistons, piston rings, piston pins, cylinder liners, engine valves, valve seats and guides, ignition products, dynamic seals, bonded piston seals, combustion and exhaust gaskets, static gaskets and seals, rigid heat shields, engine bearings, industrial bearings, bushings and washers, element resistant systems protection sleeving products, acoustic shielding, and flexible heat shields. Motorparts offers powertrain products, typically manufactured by Powertrain, and is also a leading global manufacturer and distributor of brake disc pads, brake linings, brake blocks, brake system components, chassis and driveline products, engine gaskets and seals, filters, wipers, lighting, and other product lines to OE and aftermarket customers.
We have manufacturing facilities, technical centers, distribution centers, and warehouses in 24 countries. Accordingly, our reporting segments derive sales from both domestic and international markets. The attendant risks of our international operations are primarily related to foreign currency fluctuations, changes in local economic and political conditions, extraterritorial effects of U.S. laws such as the Foreign Corrupt Practices Act, and changes in laws and regulations.
4
The following tables set forth net sales and net property, plant and equipment (“PP&E”) by geographic region as a percentage of total net sales and net PP&E:
Net Sales | Net PP&E | |||||||||||||
Year Ended December 31 | December 31 | |||||||||||||
2016 | 2015 | 2014 | 2016 | 2015 | ||||||||||
U.S. | 37 | % | 38 | % | 36 | % | 30 | % | 29 | % | ||||
Mexico | 6 | % | 5 | % | 5 | % | 7 | % | 7 | % | ||||
Canada | 2 | % | 2 | % | 2 | % | — | — | ||||||
Total North America | 45 | % | 45 | % | 43 | % | 37 | % | 36 | % | ||||
Germany | 19 | % | 20 | % | 20 | % | 19 | % | 20 | % | ||||
France | 5 | % | 5 | % | 5 | % | 3 | % | 3 | % | ||||
Italy | 4 | % | 4 | % | 4 | % | 2 | % | 2 | % | ||||
United Kingdom | 3 | % | 3 | % | 3 | % | 3 | % | 3 | % | ||||
Belgium | 3 | % | 3 | % | 4 | % | 1 | % | 1 | % | ||||
Other EMEA | 7 | % | 7 | % | 8 | % | 12 | % | 12 | % | ||||
Total EMEA | 41 | % | 42 | % | 44 | % | 40 | % | 41 | % | ||||
China | 7 | % | 6 | % | 6 | % | 11 | % | 12 | % | ||||
India | 3 | % | 3 | % | 3 | % | 6 | % | 6 | % | ||||
South America | 1 | % | 1 | % | 2 | % | 3 | % | 2 | % | ||||
Other | 3 | % | 3 | % | 2 | % | 3 | % | 3 | % | ||||
Total Rest of World | 14 | % | 13 | % | 13 | % | 23 | % | 23 | % | ||||
100 | % | 100 | % | 100 | % | 100 | % | 100 | % | |||||
The following table sets forth net sales by reporting segment as a percentage of total net sales:
Year Ended December 31 | ||||||||
2016 | 2015 | 2014 | ||||||
Net sales by reporting segment: | ||||||||
Powertrain | 57 | % | 57 | % | 57 | % | ||
Motorparts | 43 | % | 43 | % | 43 | % | ||
100 | % | 100 | % | 100 | % | |||
See Note 21, Operations by Reporting Segment and Geographic Area, to the Consolidated Financial Statements, included in Item 8 of this report.
Strategy
Our strategy is designed to create sustainable global profitable growth by leveraging existing and developing new competitive advantages. This strategy consists of the following primary elements:
• | Provide value-added products to customers in all markets served through leading technology and innovation; |
• | Develop products to enable increased fuel economy and reduce vehicle emissions, plus enable the use of alternative energies; |
• | Utilize our leading technology resources to develop advanced and innovative products, processes and manufacturing capabilities; |
• | Extend our global reach to support our OE and aftermarket customers, furthering relationships with leading Asian OEs and strengthening market share with U.S. and European OEs; |
• | Assess acquisition and investment opportunities that provide product line expansion, technological advancements, geographic positioning, penetration of emerging markets (including India and China), and market share growth; |
5
• | Invest in world-class distribution and online capabilities to meet delivery expectations of our customers by enhancing our distribution footprint to improve our distribution capabilities, strengthen delivery performance, and engage end customers; |
• | Leverage the strength of our global aftermarket leading brand positions, product portfolio and range, marketing and selling expertise, and distribution and logistics capabilities; |
• | Expand our coverage in existing product lines and add new product lines which are critical to maintaining our leadership position, and leveraging our distribution and sales network; |
• | Continue to invest in product innovation to support our premium brands and to enhance our marketing initiatives to more effectively communicate the value proposition of our branded products to end customers; and |
• | Aggressively pursue cost competitiveness in all business segments by continuing to drive productivity in existing operations, consolidating and relocating manufacturing operations to best cost countries, utilizing our strategic alliances, and rationalizing business resources and infrastructure. |
Our strategy is to develop and deliver leading technology, innovation, and service capabilities which results in market share expansion in the OE market and aftermarket. We assess individual opportunities to execute our strategy based upon estimated sales and margin growth, cost reduction potential, internal investment returns, among other criteria, and make investment decisions on a case-by-case basis. Opportunities meeting or exceeding benchmark return criteria may be undertaken through research and development activities, acquisitions, organic growth, strategic alliances, or restructuring activities as further discussed below.
Research and Development. We maintain technical centers throughout the world designed to:
• | Provide solutions for customers and bring new, innovative products to market; |
• | Integrate our leading technologies into advanced products and processes; |
• | Provide engineering support for all of our manufacturing sites; and |
• | Provide technological expertise in engineering and design development. |
Our research and development activities are conducted at our technical centers. Within the U.S., these are located in Skokie, Illinois; Ann Arbor, Michigan; Plymouth, Michigan; St. Louis, Missouri, Exton, Pennsylvania and Smithville, Tennessee. Internationally, our technical centers are located in Araras, Brazil; Aubange, Belgium; Chapel-en-le-Frith, United Kingdom; Coventry, United Kingdom; Burscheid, Germany; Nuremberg, Germany; Wiesbaden, Germany; Bad Camberg, Germany; Glinde, Germany; Kostelec, Czech Republic, Gorzyce, Poland; and Shanghai, China.
Each of our business units engage in engineering, and research and development efforts and work closely with customers to develop custom solutions to meet their needs. Total expenditures for research and development activities, including product engineering and validation costs, were $192 million, $189 million, and $192 million for the years ended December 31, 2016, 2015, and 2014.
Consolidated and Nonconsolidated Affiliates. We form certain affiliations, including joint ventures, to gain share in emerging markets, facilitate the exchange of technical information and development of new products, extend current product offerings, provide best cost manufacturing operations, broaden our customer base, and pursue strategic alternatives. We believe certain of these affiliations have provided, and will continue to provide, opportunities to expand business relationships with Asian and other customers and partners operating in the India and China growth markets. We are currently involved in 38 such affiliations located in 13 different countries throughout the world, including China, India, Korea, Russia, Turkey, Thailand, and the U.S. Of these affiliations, we maintain a controlling interest in 18 entities and, accordingly, the financial results of these entities are included in our Consolidated Financial Statements. We have a noncontrolling interest in 20 of our affiliates, of which 13 are accounted for under the equity method and 7 are accounted for under the cost method. We do not consolidate any entity for which we have a variable interest based solely on power to direct the activities and significant participation in the entity’s expected results that would not otherwise be consolidated based on control through voting interests. Further, our affiliations are businesses established and maintained in connection with our operating strategy.
Net sales for our 18 consolidated affiliates were approximately 5% of consolidated net sales for each of the years ended December 31, 2016, 2015, and 2014. Our investments in nonconsolidated affiliates totaled $270 million and $296 million as of December 31, 2016 and 2015, and the equity in earnings of such affiliates amounted to $59 million, $56 million, and $48 million for the years ended December 31, 2016, 2015, and 2014.
Acquisitions.
On December 1, 2016, we acquired the assets and liabilities of IEH BA LLC ("Beck Arnley"), an entity owned by a subsidiary of IEP. Beck Arnley is a provider of premium OE quality parts and fluids for foreign nameplate vehicles in North America and was acquired for a purchase price of $14 million, which included $7 million paid in cash on the date of acquisition and a $7
6
million non-interest bearing note maturing on May 1, 2018. Beck Arnley’s products complement the foreign nameplate coverage of our current aftermarket offerings, while adding several new product lines, including fluids, engine management, cooling, electrical parts, and electronic components. See Note 5, Acquisitions, and Note 23, Related Party Transactions, to the Consolidated Financial Statements, included in Item 8 of this report.
On May 26, 2016, we completed the acquisition of the assets of a filter manufacturing business in Mexico, which primarily serves the Mexican market, for a purchase price of $25 million, net of cash acquired.
On February 6, 2015, we completed the acquisition of certain assets of the TRW valvetrain business through a combination of asset and stock purchases for a purchase price of approximately $309 million. On July 7, 2015, we completed the purchase of certain additional business assets of the TRW valvetrain business through stock purchases for a base purchase price of approximately $56 million. The purchase included a $25 million noncontrolling interest related to a 66% stake in a majority owned entity that we consolidate in our financial statements. The acquisition of TRW’s valvetrain business adds a completely new product line to our portfolio, strengthens our position as a leading developer and supplier of core components for engines, and enhances our ability to support our customers to improve fuel economy and reduce emissions.
In July 2014, we completed the purchase of certain assets of the Honeywell brake component business, including two recently established manufacturing facilities in China and Romania that substantially strengthened the manufacturing and engineering capabilities of our global braking portfolio. The business was acquired through a combination of asset and stock purchases for a base purchase price of $168 million and other incurred liabilities of $15 million.
In May 2014, we completed the purchase of the Affinia chassis business. This business serves leading U.S. aftermarket customers with chassis products and broadened Motorparts product offering and customer base while also providing operational synergies. The purchase price was $149 million, net of acquired cash.
See Note 5, Acquisitions, to the Consolidated Financial Statements, included in Item 8 of this report.
Divestitures. In connection with our strategic planning process, we assess our operations for market position, product technology and capability, and profitability. Those businesses determined by management not to have a sustainable competitive advantage are considered non-core and may be considered for divestiture or other exit activities.
In December 2016, we entered into an agreement to sell 80.1% of the shares of one of our subsidiaries in Brazil in the Motorparts segment for a sale price of one Brazilian Real. The sale is expected to close in the second half of 2017.
In December 2016, we entered into stock and asset purchase agreement to sell certain assets and liabilities related to our wipers business in the Motorparts segment for a sale price of $8 million. The sale is expected to close in the first half of 2017.
During 2015, we entered into a share agreement to sell 100% of the shares of one of our subsidiaries in the Powertrain segment for a sale price of one euro. Prior to December 31, 2015, we contributed $12 million in cash to the subsidiary. The sale closed on January 1, 2016.
See Note 6, Held for Sale and Discontinued Operations, to the Consolidated Financial Statements, included in Item 8 of this report.
Restructuring Activities. Our restructuring activities are undertaken as necessary to execute management’s strategy and streamline operations, consolidate and take advantage of available capacity and resources, to ultimately achieve net cost reductions and productivity improvements. Restructuring activities include efforts to integrate and rationalize our businesses, and to relocate operations to best cost markets.
During the years ended December 31, 2016, 2015, and 2014, we recorded $27 million, $92 million and $89 million in net restructuring expenses. Our restructuring activities are further discussed in Item 7, Management’s Discussion and Analysis of Financial Condition and Results of Operations and Note 3, Restructuring charges and asset impairments, to the Consolidated Financial Statements, included in Item 8 of this report.
Products
The following provides an overview of products manufactured and distributed by our reporting segments.
Powertrain. The Powertrain segment primarily represents our OE business in powertrain-related components and systems. In 2016, about 95% of Powertrain’s revenue was derived from OE customers, with the remaining 5% of revenue coming directly from the Motorparts segment for eventual distribution, by Motorparts, to customers in the independent aftermarket.
7
Powertrain operates 87 manufacturing sites in 19 countries, serving a large number of major automotive, heavy-duty, marine, and industrial customers worldwide. Powertrain derived 35% of 2016 OE sales in North America, 45% in Europe, the Middle-East and Africa ("EMEA") and 20% in the rest of the world (“Rest of World” or “ROW”). The Company has also invested globally in nonconsolidated affiliates which have multiple manufacturing sites in Turkey and China.
We are one of the world’s leading powertrain component and assembly providers. Comprehensive design capability and an extensive product portfolio enable effective delivery of a broad range of engine and driveline components as well as engineered solutions to improve fuel economy, reduce emissions or enhance vehicle performance, and durability. Powertrain products are used in automotive, motorcycle, light truck, heavy-duty, industrial, commercial equipment (construction, agricultural, power generation, marine and railway), aerospace, and small air-cooled engine applications. The following provides a description of the various products manufactured by Powertrain:
Product | Description |
Pistons | The main task of the piston is to compress the air and fuel mixture in advance of ignition. Following combustion, the piston relays the combustion energy into mechanical energy. In this process, substantial pressures are exerted on the piston, imposing high demands on it in terms of rigidity and temperature resistance. |
Piston Rings | The three main tasks of piston rings in internal combustion engines include: (1) sealing the combustion chamber, (2) supporting heat transfer from the piston to the cylinder wall, and (3) regulating lubrication and oil consumption. |
Piston Pins | Piston pins attach the piston to the end of the connecting rod, allowing the piston to pivot in each cycle of the engine and following the revolution of the crankshaft. |
Cylinder Liners | Cylinder liners, or sleeves, are specially engineered where surfaces formed within the engine block, working in tandem with the piston and ring, as the chamber in which the thermal energy of the combustion process is converted into mechanical energy. |
Valve Seats and Guides | Valve seats and guides are a wide variety of powdered metal inserts used in engines and general industrial applications, which are specially designed to meet customer requirements for extreme hardness. |
Engine Valves | Engine valves are used to control the air and fuel flow into and out of the cylinders, facilitating the combustion process. Valve designs consist of mono, bimetallic, and hollow valves depending on application, which includes automotive and various industrial requirements including marine and power generation. The product line also provides other related valve train components including cotters, rotators, and retainers. |
Engine Bearings | Engine bearings provide an intermediate surface between the connecting rod and crankshaft and between the crankshaft and engine block. Their purpose is to facilitate the conversion of combustion energy into mechanical energy by allowing low-friction movement of the connecting rods and crankshaft when absorbing the power created in the combustion chamber. They operate principally under hydrodynamic lubrication conditions. The bearing product line includes lead-free aluminum engine bearings commonly used in gasoline engines and bronze bearings used in highly-loaded compression engines such as diesel or gasoline turbocharged models. |
8
Industrial Bearings | Industrial bearings are primarily dedicated to applications operating in mixed or low lubrication conditions. Applications are mainly diverse industrial motors or converters and include wind turbines and hydroelectric power generation equipment. |
Bushings and Washers | Bushings and washers are used in engines and transmissions to ensure low friction rotation or oscillation of shafts. They are made of bronze, aluminum or polymer material. |
Ignition | Ignition products include spark plugs, glow plugs, ignition coils, and accessories for automotive, commercial, and industrial applications. |
Dynamic Seals | Dynamic seals are used between a housing or body structure and rotating or moving shafts to contain lubricants, fluids, and pressure inside the housing, while keeping out dust and other contaminates. There are numerous areas of application including engine crankshaft, transmission driveshaft, pinion and axle, and wheel seals. |
Bonded Piston Seals | Bonded piston seals use hydraulic pressure in transmissions to facilitate gearshift. These products are used in automatic, dual clutch transmissions, and continuously variable transmissions. |
Combustion and Exhaust Gaskets | Combustion and exhaust gaskets are used between two surfaces to contain gas and pressure produced from combustion. These gaskets are primarily used on internal combustion engine applications including cylinder head, exhaust manifold, exhaust takedown, exhaust gas recirculation, and turbocharger gaskets. |
Static Gaskets and Seals | Static gaskets and seals create a barrier between two surfaces to contain fluids, pressure, and gases while keeping out dust and other contaminants. There are numerous areas of application including engine covers, oil pans, intake manifolds, transmission covers, and differential covers. |
Rigid Heat Shields | Rigid heat shields are designed to provide a heat and sound barrier to emitting components. These products cover a full range of application on a vehicle from engine to tailpipe. |
Flexible Heat Shields | Flexible heat shields are designed to provide a heat barrier and for thermal management usually in the engine compartment. |
Element Resistant Sleeving | Element resistant sleeving products provide protection for wires, hoses, sensors, and mechanical components and assemblies from heat, electro-magnetic interference, dirt, vibration, and moisture. Element resistant sleeving products include: • Automotive wire harnesses and hoses; • Abrasion protection and wire management of cable assemblies; • Dielectric protection of electrical leads; • Thermal and mechanical protection of hose assemblies; and • Acoustic insulating and sound-dampening materials. |
Lighting | Automotive lighting products include power and lighting systems, and interior and exterior lighting components. |
Motorparts. Motorparts sells and distributes a broad portfolio of products in the global vehicle aftermarket while also serving the OE market with products including braking, wipers, and a limited range of chassis components. In 2016, approximately 72% of Motorparts’ sales were derived from sales to customers in the aftermarket and approximately 28% were attributable to sales to the OE market. Motorparts operates 33 manufacturing sites in 15 countries, 33 distribution centers and warehouses in 12 countries, 13 Technical Service Centers in 2 countries, and 9 third party operated distribution centers in 4 countries. In 2016, Motorparts derived 56% of sales in North America, 36% in EMEA and 8% in Rest of World.
Motorparts’ products are designed to solve a problem, facilitate installation, and improve safety, durability, and vehicle performance. Motorparts’ products are utilized in vehicle braking systems and chassis, as well as in engine and sealing applications, and general service. Through global market insight, supply chain expertise, and brand and product line management, aftermarket and OE customers worldwide benefit from our innovative technology, manufacturing, supply chain, and distribution capabilities.
9
The following table sets forth a description of the principal products manufactured and/or sold by Motorparts:
Product | Description | Brands |
Light Vehicle Disc Pads | A light vehicle disc pad assembly consists of: • friction material, which dissipates forward momentum by converting energy into heat; • underlayer, which is a layer of different friction material placed between the backplate and friction material to improve strength, provide a thermal barrier, corrosion resistance, noise performance or a combination of these characteristics; • backplate, to support and locate the friction material in the caliper; and • shim, which is a rubber/metal laminate developed to suppress noise. | Wagner®, Abex®, Ferodo®, Jurid®, Stop®, QuickStop®, ThermoQuiet®, and OEx® |
Commercial Vehicle Disc Pads | Commercial vehicle disc brake pads are a growing segment of the friction market, superseding drum brakes on trucks, buses, tractor units, and trailers. The basic construction of a commercial vehicle disc pad is the same as a light vehicle disc pad. | Ferodo®, Beral®, Abex® and Stop® |
Light Vehicle Drum Brake Linings | Drum brake linings are friction material affixed to a brake shoe and fitted on the rear service brake, rear parking brake, and/or transmission brake application. | Ferodo® and Wagner® |
Commercial Vehicle Full Length Linings | Full length linings are the commercial vehicle equivalent of light vehicle drum brake linings. | Ferodo®, Beral®, Abex® and Jurid® |
Commercial Vehicle Half Blocks | Half blocks are segments of friction material made to be riveted onto drum brake shoes. They are used on heavier vehicle applications where discs are not used. | Ferodo®, Beral®, Abex® and Jurid® |
Railway Brake Blocks | Railway brake blocks work by acting on the circumference of the wheel. They are lighter and quieter in operation than cast iron blocks. However, friction performance is designed to replicate that of cast iron blocks. | Ferodo® and Jurid® |
Chassis | Chassis parts include ball joints, tie rod ends, sway bar links, idler arms, pitman arms, and control arms. These components affect vehicle steering and vehicle ride quality. | MOOG® and QuickSteer® |
Driveline Universal Joints | Driveline universal joints which provide a linkage between a power unit and output device such as a wheel end or service device. | MOOG® |
Combustion and Exhaust Gaskets | Combustion and exhaust gaskets are used between two surfaces to contain gas and pressure produced from combustion. These gaskets are primarily used on internal combustion engine applications including cylinder head, exhaust manifold, exhaust takedown, exhaust gas recirculation, and turbocharger gaskets. | Fel-Pro®, Payen® and Goetze® |
Static Gaskets and Seals | Static gaskets and seals create a barrier between two surfaces to contain fluids, pressure, and gases while keeping out dust and other contaminants. There are numerous areas of application including engine covers, oil pans, intake manifolds, shaft seals, transmission covers, and differential covers. | Fel-Pro®, Payen®, Goetze® and National® |
Wipers | Windshield wiper parts include conventional and profile style wiper blades, blade refills, and wiper arms. | ANCO® |
Filters | Filtration parts include oil, air, cabin, fuel, and other filters for both light and commercial vehicles. These components prevent harmful contaminants contained in liquids and gases from passing through vehicle components and potentially leading to premature wear or failure. | Champion® Interfil® |
10
Pistons | The main task of the piston is to compress the air and fuel mixture in advance of ignition. Following combustion, the piston relays the combustion energy into mechanical energy. In this process, substantial pressures are exerted on the piston, imposing high demands on it in terms of rigidity and temperature resistance. | Sealed Power®, Speed Pro®, FP Diesel® and Nüral® |
Piston Rings | The three main tasks of piston rings in internal combustion engines include (1) sealing the combustion chamber, (2) supporting heat transfer from the piston to the cylinder wall, and (3) regulating lubrication and oil consumption. | Sealed Power®, Speed Pro®, FP Diesel® and Goetze® |
Cylinder liners | Cylinder liners, or sleeves, are specially engineered where surfaces formed within the engine block, working in tandem with the piston and ring, as the chamber in which the thermal energy of the combustion process is converted into mechanical energy. | FP Diesel® and Goetze® |
Ignition | Ignition products include spark plugs, glow plugs, ignition coils, and accessories for automotive, commercial, and industrial applications. | Champion® and Beru® |
, | ||
Lighting | Replacement vehicle lighting products for automotive and commercial applications | Wagner® |
Industry
The automotive light vehicle market, as well as the medium and heavy-duty commercial market, is comprised of two primary segments: the OE market in which our products are used in the manufacture of new vehicles and OE dealer service parts ("OES"), and the global aftermarket, in which our products are used as replacement parts for all vehicles in operation on the road, including all previous models.
The OE Market. Demand for component parts in the OE market is generally a function of the number of new vehicles produced, which is driven by macro-economic conditions and other factors such as fuel prices, consumer confidence, employment trends, regulatory requirements, and trade agreements. Although OE demand is tied to planned vehicle production, parts suppliers also have the opportunity to grow through increasing their product content per vehicle, by increasing market share and by expanding into new or emerging markets. Companies with a global presence, leading technology and innovation, and advanced product engineering, manufacturing, and customer support capabilities are best positioned to take advantage of these opportunities.
There are currently several significant trends that are affecting the OE market, including the following:
• | Global Production – The global light and commercial vehicle production in developed markets during 2016 and 2015 was as follows: |
Global Light and Commercial Vehicle Production | ||||
2016 | 2015 | |||
(millions of vehicles) | ||||
Americas | 21.1 | 21.3 | ||
EMEA | 24.3 | 23.3 | ||
Asia | 50.2 | 46.5 | ||
While global OE production increased at a moderate pace, the demand for parts, including products produced by us also increased moderately during 2016 due to solid demand in the Americas and Asia.
• | Automotive Supply Consolidation – Consolidation within the automotive supply base is expected to continue as the entire industry evolves and as the industry responds to the need to achieve economies of scale and global capabilities to serve vehicle manufacturers who are increasingly global in their production. Suppliers will seek opportunities to achieve synergies in their operations through consolidation, while striving to acquire complementary businesses to improve global competitiveness or to strategically enhance a product offering to global customers. |
• | Globalization of Automotive Industry – OEs are increasingly designing global platforms where the basic design of the vehicle is performed in one location, but the vehicle is produced and sold in numerous geographic markets to realize significant economies of scale by limiting variations across product designs and geographic regions. While developed markets in North America and Europe continue to remain important to OEs, increased focus is being placed upon expanded design, development, and production within emerging markets for growth opportunities, especially in India |
11
and China. As a result, suppliers must be prepared to provide product and technical resources in support of their customers within these emerging markets. Furthermore, OEs are moving their operations to best cost geographies outside the U.S. and Western European markets and, accordingly, OEs are increasingly requiring suppliers to provide parts on a global basis. Finally, the Asian OEs continue to expand their reach and market share in relation to traditional North American and European manufacturers. As this trend is expected to continue into the foreseeable future, suppliers must be geographically and technically positioned to meet the needs of the Asian OEs.
• | Focus on Fuel Economy, Reduced Emissions and Alternative Energy Sources – Increased fuel economy and decreased vehicle emissions are of great importance to OEs as legislators and customers continue to demand more efficient and cleaner operating vehicles. Increasingly stringent fuel economy standards and environmental regulations are driving OEs to focus on new technologies including downsized, higher output and turbocharged gasoline engines, diesel and turbocharged diesel, bio-mass and hybrid diesel applications, and hybrid electric and alternative energy engines. As a result, the number of powertrain configurations will increase in response to the proliferation of commercially available energy sources. Suppliers offering solutions to OEs related to numerous vehicle fuel and powertrain configurations possess a distinct competitive advantage, which is driving accelerated new product development cycles. |
• | Focus on Vehicle Safety – Vehicle safety continues to receive industry attention by OEs as customers view safety as a fundamental driver in consumer purchasing decisions and legislation looks on improved vehicle safety as a public health issue. Accordingly, OEs are seeking suppliers with new technologies, capabilities, and products that have the ability to advance vehicle safety. Suppliers that are able to enhance vehicle safety through innovative products and technologies have a distinct competitive advantage. |
• | Pricing Pressures – OEs provide extensive pricing incentives and financing alternatives to consumers in order to generate sales of new vehicles and retain or gain market share. These actions, coupled with the increasing content required to meet regulations, have placed pressures on the OEs’ profits and, in turn, the OEs expect certain recovery from their supply base. Suppliers must continually identify and implement product innovation and cost reduction activities to fund customer annual price concession expectations in order to retain current business as well as to be competitively positioned for future new business opportunities. |
• | Raw Material Cost Fluctuations – There have been significant fluctuations in recent periods in global prices of aluminum, copper, lead, nickel, platinum, resins, steel, other base raw materials, and energy. Suppliers must continue to identify leading design and innovative technological solutions and material substitution options in order to retain a competitive advantage to the extent cost increases are not passed on to customers. |
• | Energy, Industrial and Transport Markets – Customers continue to develop alternatives to historic infrastructure in the energy, industrial, and transport markets. This includes power generators and other power conversion devices as well as growth in the aerospace and high speed railway markets, and ocean transport. Suppliers with the capability to utilize automotive expertise to service these and other related markets have a competitive advantage. |
The Aftermarket Business. Products for the global vehicle aftermarket are sold directly to a wide range of distributors, retail parts stores, and mass merchants that distribute these products to professional service providers, “do-it-yourself” consumers, and in some cases, directly to service chains. Demand for aftermarket products historically has been driven by three primary factors: (i) the number of vehicles in operation; (ii) the average age of vehicles in operation; and (iii) vehicle usage trends. These factors, while applicable in all regions, vary depending on the composition of the car parc and other factors, which are discussed in greater detail below:
• | Number of Vehicles in Operation – The global vehicle population is expected to grow to 1.4 billion by 2021 and 2.0 billion by 2040. Growth in certain emerging markets, such as China, is increasing at the highest rate, while more mature markets are expected to continue to remain stable or to grow modestly in size, indicating new car sales are well beyond the replacement rate for scrapped vehicles. |
• | Increase in Average Age of Vehicles – The average age of vehicles on the road in the U.S. has increased since 2002 from 9.6 years to an estimated 11.6 years in 2016. It is expected to increase to 11.8 years by 2019. The average age of vehicles on the road in Europe has also steadily increased over the past decade to 9.7 years with a slight increase projected through 2020. These trends will drive the need for maintenance and repair work, thereby increasing the overall demand for aftermarket replacement parts in both markets. The average age of vehicles on the road in China is just under five years and is expected to increase to over six years by 2020. We believe this will lead to continuing significant growth in the China aftermarket. |
12
• | Channel Consolidation – In the more mature markets of the U.S. and Western Europe, there has been increasing consolidation in aftermarket distribution networks with larger, more sophisticated aftermarket distributors and retailers gaining market share. These distributors generally require larger, more sophisticated suppliers with product expertise, category management capabilities, supply chain services and capabilities, as well as a global manufacturing and sourcing footprint. |
• | Growth of Online Capabilities – Reaching consumers directly through online capabilities, including e-commerce, is expected to have an increasing effect on the global aftermarket industry and how aftermarket products are sold. Establishment of a robust online presence will be critical for suppliers regardless of whether they intend to participate directly in e-commerce. In 2015, Motorparts devoted significant resources to improving its online capabilities, in both customer-facing and internal applications, including a new online order management system, vendor management system, customer relationship management ("CRM"), global brand websites, and data and analytics. Initiatives to improve Motorparts online capabilities continued in 2016. |
• | Increase in Private Label Brands and Low-Cost Country Imports – In the U.S., there has been an increase in private label or store brands sold by retailers and distributors at a lower price point than premium brands of the same products. However, in many cases, retailers or wholesale distributors creating private label brands will still rely on established suppliers, like Motorparts, to manufacture their private label products and, in some cases, utilize co-branding to support their private label offerings. Motorparts will continue to invest in product innovation and marketing to support the differentiation of its branded product lines. |
• | Changes in Consumer Behavior – The aftermarket is affected by changes in economic conditions, volatility in fuel prices, and expanding focus on environmental and energy conservation. For example, the number of consumers with the ability to purchase new vehicles during the 2008-2010 economic downturns led to increased demand for repairs in order to keep older vehicles road-worthy. Increased environmental regulation will lead to additional replacement parts being required on a more frequent basis to meet more exacting standards. |
Customers
We supply OEs with a wide variety of technologically innovative parts, substantially all of which are manufactured by us. Our OE customers consist of automotive, light, medium and heavy-duty commercial vehicle manufacturers as well as agricultural, off-highway, marine, railroad, aerospace, high performance, and power generation and industrial application manufacturers. We have well-established relationships with substantially all major American, European, and Asian automotive OEs.
Our aftermarket customers include independent warehouse distributors who redistribute products to local parts suppliers, distributors of heavy-duty vehicular parts, engine rebuilders, retail parts stores, and mass merchants. The breadth of our product lines, the strength of our leading brand names, marketing expertise, sizable sales force, and distribution and logistics capability are central to the success of our Motorparts operations.
No individual customer accounted for more than 10% of our net sales during 2016.
Competition
The global vehicular parts business is highly competitive. We compete with many independent manufacturers and distributors of component parts globally. In general, competition for sales is based on price, product quality, technology, delivery, customer service, and the breadth of products offered by a given supplier. We are meeting these competitive challenges by developing leading technologies, efficiently integrating and expanding our manufacturing and distribution operations, widening our product coverage within our core businesses, restructuring our operations and transferring production to best cost countries, and utilizing our worldwide technical centers to develop and provide value-added solutions to our customers. A summary of our primary independent competitors by reporting segment is set forth below.
• | Powertrain – Primary competitors include AGM Automotive, Art Metal, Bergmann, BinZou, Bleistahl, Bosch, Daido, Dana, Dana-Reinz, Delfingen, Denso, DongYang, ElringKlinger, FNOK, Freudenberg, Kaco/Sabo, Kolbenschmidt, Mahle, Miba, NGK, NOK, NPR, Relats, Sinteron, SKF, Taiho, and Vitrica. |
• | Motorparts – Primary competitors include Akebono Brake Corporation, Autolite, Brake Parts Inc., Bosch Group, Centric Parts, Crowne Group LLC, Delphi Automotive LLP, Denso Corporation, Dorman Products, Inc., GRI Engineering and Development LLC (MAT Holdings, Inc.), Mahle GmbH, Mevotech Inc., NGK Spark Plug Co., Ltd., NTN Bearing Corporation, Neapco Inc., Old World Industries, LLC, Phillips Industries, Pylon Manufacturing Corporation, Rain-X (ITW Global Brands), SKF Group, Osram Sylvania Ltd., The Timken Company, Valeo Group, Dana Corporation (Victor Reinz brand), and ZF TRW Automotive Holdings Corp. |
13
Backlog
For OE customers, we generally receive purchase orders for specific products supplied for particular vehicles. These supply relationships typically extend over the life of the related vehicle, subject to interim design and technical specification revisions, and do not require the customer to purchase a minimum quantity. In addition to customary commercial terms and conditions, purchase orders generally provide for annual price reductions based upon expected productivity improvements and other factors. Customers typically retain the right to terminate purchase orders, but we generally cannot terminate purchase orders. OE order fulfillment is typically manufactured in response to customer purchase order releases, and we ship directly from a manufacturing location to the customer for use in vehicle production and assembly. Accordingly, our manufacturing locations turn finished goods inventory relatively quickly, producing from on-hand raw materials and work-in-process inventory within relatively short manufacturing cycles. Significant risks to us include a change in engine production, driven by mix changes, for powertrain components (e.g. a change from diesel to gasoline engines), lower than expected vehicle or engine production by one or more of our OE customers, or termination of the business based upon perceived or actual shortfalls in delivery, quality or value.
For our global aftermarket customers, Motorparts generally establishes product line arrangements that encompass substantially all parts offered within a particular product line. In some cases, Motorparts will enter into agreements with terms ranging from one to three years that cover one or more product lines with fixed prices. Pricing is market responsive and subject to adjustment based upon competitive pressures, material costs, and other commercial factors. Global aftermarket order fulfillment is largely performed from finished goods inventory stocked in our worldwide distribution network. Inventory stocking levels in our distribution centers are established based upon historical and anticipated future customer demand.
Although customer programs typically extend to future periods, and although there is an expectation we will supply certain levels of OE production over such periods, we believe outstanding purchase orders and product line arrangements do not constitute firm orders. Firm orders are limited to specific and authorized customer purchase order releases placed with our manufacturing and distribution centers for actual production and order fulfillment. Firm orders are typically fulfilled as promptly as possible after receipt from the conversion of available raw materials and work-in-process inventory for OE orders, and from current on-hand finished goods inventory for aftermarket orders. The dollar amount of such purchase order releases on hand and not processed at any point in time is not believed to be significant based upon the time frame involved.
Raw Materials and Suppliers
We purchase various raw materials and component parts for use in our manufacturing processes, including ferrous and non-ferrous metals, non-metallic raw materials, stampings, castings, and forgings. We also purchase parts manufactured by other manufacturers for sale in the aftermarket. We have not experienced any significant shortages of raw materials, components or finished parts and normally do not carry inventories of raw materials or finished parts in excess of those reasonably required to meet our production and shipping schedules. In 2016, no outside supplier provided products that accounted for more than 5% of our annual purchases.
Insight Portfolio Group LLC - Related Party
Insight Portfolio Group, LLC (“Insight”) is an entity formed and controlled by Mr. Icahn in order to maximize the potential buying power of a group of entities with which Mr. Icahn has a relationship in negotiating with a wide range of suppliers of goods, services, and tangible and intangible property at negotiated rates. The Company acquired a minority equity interest in Insight and agreed to pay a portion of Insight’s operating expenses beginning in 2013. In addition to the minority equity interest held by the Company, certain subsidiaries of IEP and other entities with which Mr. Icahn has a relationship also acquired equity interests in Insight and also agreed to pay certain operating expenses. Our payments to Insight were less than $0.5 million in 2016 and 2015.
Related Parties
On June 1, 2015, a subsidiary of IEP completed an acquisition of substantially all of the assets of Uni-Select USA, Inc. and Beck Arnley Worldparts, Inc., comprising the U.S. automotive parts distribution of Uni-Select Inc. ("Uni-Select"). Subsequent to the acquisition, Uni-Select changed its name to Auto Plus. Auto Plus is operated independently from us and all transactions are approved by independent directors of our company. In connection with the acquisition, Mr. Icahn has resigned from our board of directors and our Co-Chief Executive Officer, Daniel A. Ninivaggi, has resigned from the board of directors of IEP.
We had $54 million of sales for the year ended December 31, 2016 to Auto Plus and $11 million of accounts receivable, net outstanding from Auto Plus as of December 31, 2016.
14
On February 3, 2016, a subsidiary of IEP acquired a majority of the outstanding shares of Pep Boys - Manny, Moe & Jack ("Pep Boys"), a leading aftermarket provider of automotive service, tires, parts, and accessories across the U.S. and Puerto Rico. On February 4, 2016, the acquisition of the remaining outstanding shares of Pep Boys was completed.
We had $39 million of sales from the date of acquisition through December 31, 2016 to Pep Boys and $25 million of accounts receivable, net outstanding from Pep Boys as of December 31, 2016.
PSC Metals, Inc. (“PSC Metals”) is a wholly-owned subsidiary of IEP. We had scrap sales to PSC Metals of $2 million for the year ended December 31, 2016.
On December 1, 2016, we acquired the assets and liabilities of IEH BA LLC ("Beck Arnley"), an entity owned by a subsidiary of IEP. The purchase price was $14 million and included a $7 million note maturing on May 1, 2018.
Seasonality of Our Business
Our business is moderately seasonal because many North American OE customers typically close assembly plants for two weeks in July for model year changeovers, and for an additional week during the December holiday season. OE customers in Europe historically shut down vehicle production during portions of July and August and one week in December. Shut-down periods in the Rest of World generally vary by country. The aftermarket experiences seasonal fluctuations in sales due to demands caused by weather and driving patterns. Historically, our sales and operating profits have been the strongest in the second quarter. For additional information, refer to our quarterly financial results contained in Note 22, Supplementary Quarterly Financial Information (Unaudited), to the Consolidated Financial Statements, included in Item 8 of this report.
Employee Relations
We have approximately 53,000 employees as of December 31, 2016. Various unions represent approximately 31% of our U.S. hourly employees and approximately 83% of our non-U.S. hourly employees. With the exception of two facilities in the U.S., most of our unionized manufacturing facilities have their own contracts with their own expiration dates and, as a result, no contract expiration date affects more than one facility.
Effect of Environmental Regulations
Our operations, consistent with those of the manufacturing sector in general, are subject to numerous existing and proposed laws, and governmental regulations designed to protect the environment, particularly regarding plant wastes and emissions, and solid waste disposal. Capital expenditures for property, plant, and equipment for environmental control activities did not have a material effect on our financial position or cash flows in 2016 and are not expected to have a material effect on our financial position or cash flows in 2017.
Intellectual Property
We hold in excess of 6,300 patents and patent applications on a worldwide basis, of which more than 1,200 have been filed in the U.S. Of the approximately 6,300 patents and patent applications, approximately 30% are in production use and/or are licensed to third parties, and the remaining 70% are being considered for future production use or provide a strategic technological benefit to us.
We do not materially rely on any single patent, nor will the expiration of any single patent materially affect our business. Our current patents expire over various periods into the year 2036. We are actively introducing and patenting new technology to replace formerly patented technology before the expiration of the existing patents. In the aggregate, our worldwide patent portfolio is materially important to our business because it enables us to achieve technological differentiation from our competitors.
We also maintain more than 6,700 active trademark registrations and applications worldwide. More than 90% of these trademark registrations and applications are in commercial use by us or are licensed to third parties.
Segment Reporting Data
Operating segment data and principal geographic area data for the years ended December 31, 2016, 2015, and 2014 are summarized in Note 21, Operations by reporting segment and geographic area, to our Consolidated Financial Statements.
15
Web Site and Access to Filed Reports
We maintain an internet Web site at www.federalmogul.com. The contents of our Web site are not incorporated by reference in this report. We provide access to our annual and periodic reports filed with the SEC free of charge through this Web site. Our Code of Conduct is also available on our Web site. The SEC maintains a Web site at www.SEC.gov where reports, proxy and information statements, and other information about us may be obtained. Paper copies of annual and periodic reports filed with the SEC may be obtained free of charge by contacting our headquarters at the address located within the SEC Filings or under Investor Relations on our Web site.
16
ITEM 1.A. RISK FACTORS
An investment in Federal-Mogul involves various risks. The risks discussed below are not the only ones faced by the Company. Please also read the cautionary note regarding “Forward-Looking Statements” beginning on page 2.
The Company has substantial indebtedness, which could restrict the Company’s business activities and could subject the Company to significant interest rate risk: As of December 31, 2016, the Company had approximately $3.0 billion of outstanding indebtedness. The Company is permitted by the terms of its debt instruments to incur additional indebtedness, subject to the restrictions therein. The Company’s inability to generate sufficient cash flow to satisfy its debt obligations, or to refinance its debt obligations on commercially reasonable terms, including approximately $700 million of term loan indebtedness that matures in 2018, would have a material adverse effect on the Company’s business, financial condition, and results of operations. In addition, covenants in the Company’s debt agreements could limit its ability to engage in certain transactions and pursue its business strategies, which could adversely affect liquidity.
The Company’s indebtedness could:
• | limit the Company’s ability to borrow money for working capital, capital expenditures, debt service requirements or other corporate purposes, guarantee additional debt or issue redeemable, convertible of preferred equity; |
• | limit the Company’s ability to make distributions or prepay its debt, incur liens, enter into agreements that restrict distributions from restricted subsidiaries, sell or otherwise dispose of assets (including capital stock of subsidiaries), enter into transactions with affiliates and merger consolidate or sell substantially all of its assets; |
• | require the Company to dedicate a substantial portion of its cash flow to payments on indebtedness, which would reduce the amount of cash flow available to fund working capital, capital expenditures, product development, and other corporate requirements; |
• | increase the Company’s vulnerability to general adverse economic and industry conditions; and |
• | limit the Company’s ability to respond to business opportunities. |
A significant portion of the Company’s indebtedness accrues interest at variable rates. To the extent market interest rates rise, the cost of the Company’s debt would increase, adversely affecting the Company’s financial condition, results of operations, and cash flows.
The Company’s restructuring activities and strategic initiatives may affect the Company’s short-term liquidity and may not result in the anticipated synergies and cost savings: The Company is pursuing a number of organic and inorganic growth activities, restructuring plans, and strategic initiatives to increase and improve the Company’s business and profitability. Management believes these activities will enhance the Company’s long term shareholder value; however, the investment to effectuate these activities may have an effect on the Company’s short term liquidity and may create the need for additional borrowing which may be at higher interest rates given the Company’s current level of indebtedness. In addition, it is possible the achievement of expected synergies and cost savings associated with the Company’s restructuring activities will require additional costs or charges to earnings in future periods. It is also possible the expected synergies or returns from strategic initiatives may not be achieved. Any costs or charges could adversely affect the business, results of operations, liquidity, and financial condition.
The Company’s operations in foreign countries expose the Company to risks related to economic and political conditions, currency fluctuations, import/export restrictions, regulatory and other risks: As a global business operating in a time of increasing global economic and political instability, we are exposed to global market risks, the consequences of which cannot always be anticipated or quantified. One example is the recent decision of voters in the United Kingdom to withdraw from the European Union (referred to as “Brexit”). While any ultimate effects of Brexit on the Company are difficult to predict (particularly given the potentially lengthy negotiation period to accomplish a formal withdrawal), because we currently conduct business in the United Kingdom and in Europe, the results of the referendum and any eventual withdrawal could cause disruptions and create uncertainty for our businesses, including affecting our relationships with our customers and suppliers, and could also alter the relationship among currencies, including the value of the British Pound relative to the US Dollar. Such disruptions and uncertainties could adversely affect our financial condition, operating results and cash flows. Any ultimate effects of Brexit on the Company will also depend on whether the UK negotiates to retain access to European Union markets either during a transitional period or more permanently. The failed coup attempt in Turkey, a country in which the Company has various ownership and economic interests, is another example of a recent global political development for which any potential consequences for the Company are uncertain. These and other developments may increase volatility in the results our operations and may adversely affect our financial condition.
The Company has manufacturing and distribution facilities in many countries. International operations are subject to certain risks including:
17
• | exposure to local economic conditions; |
• | exposure to local political conditions (including the risk of seizure of assets by foreign governments); |
• | currency exchange rate fluctuations (including, but not limited to, material exchange rate fluctuations, such as devaluations) and currency controls |
• | export and import restrictions; |
• | restrictions on ability to repatriate foreign earnings; |
• | labor unrest; and |
• | compliance with U.S. laws such as the Foreign Corrupt Practices Act, and local laws prohibiting inappropriate payments. |
The likelihood of such occurrences and their potential effect on the Company are unpredictable and vary from country-to-country.
Certain of the Company’s operating entities report their financial condition and results of operations in currencies other than the U.S. dollar (including, but not limited to, Brazilian real, British pound, Chinese yuan renminbi, Czech crown, euro, Indian rupee, Mexican peso, Polish zloty, Russian ruble, South Korean won, and Swedish krona). In reporting its consolidated statements of operations, the Company translates the reported results of these entities into U.S. dollars at the applicable exchange rates. As a result, fluctuations in the dollar against foreign currencies will affect the value at which the results of these entities are included within Federal-Mogul’s consolidated results.
The Company is exposed to a risk of gain or loss from changes in foreign exchange rates whenever the Company, or one of its foreign subsidiaries, enters into a purchase or sales agreement in a currency other than its functional currency. While the Company reduces such exposure by matching most revenues and costs within the same currency, changes in exchange rates could affect the Company’s financial condition or results of operations.
Changes in tax law or trade agreements and new or changed tariffs could have a material adverse effect on us: Changes in U.S. political, regulatory and economic conditions and/or changes in laws and policies governing U.S. tax laws, foreign trade (including trade agreements and tariffs), manufacturing, and development and investment in the territories and countries where the Company or our customers operate could adversely affect our operating results and our business.
The Company conducts operations through joint ventures which may contain various contractual restrictions and require approval for certain actions by our joint venture partners: Certain of the Company’s operations, including emerging markets, are conducted through joint ventures and strategic alliances. With respect to these joint ventures, the Company may share ownership and management responsibilities with one or more partners that may not share the same goals and objectives. Operating a joint venture requires the Company to operate the business pursuant to the terms of the agreement that was entered into with the joint venture partners, as well as to share information and decision making. Additional risks associated with joint ventures include one or more partners failing to satisfy contractual obligations, conflicts arising between the joint venture partners, a change in the ownership of any of the joint venture partners and our limited ability to control compliance with applicable rules and regulations, including the Foreign Corrupt Practices Act and related rules and regulations. Additionally, the Company’s ability to sell its interest in a joint venture may be subject to contractual and other limitations. Accordingly, any such occurrences could adversely affect the Company’s financial condition, operating results and cash flows.
The Company may pursue acquisitions or other affiliations that involve inherent risks, any of which may cause the Company not to realize anticipated benefits, and the Company may have difficulty integrating the operations of any companies that may be acquired, which may adversely affect the Company’s results of operations: In the past, the Company has grown through acquisitions, and may engage in acquisitions in the future as part of the Company’s business strategy. The full benefits of these acquisitions, however, require integration of manufacturing, administrative, financial, sales, and marketing approaches and personnel. If the Company is unable to successfully integrate its acquisitions, it may not realize the benefits of the acquisitions, the financial results may be negatively affected, or additional cash may be required to integrate such operations.
In the future, the Company may not be able to successfully identify suitable acquisition or affiliation opportunities or complete any particular acquisition, combination, affiliation or other transaction on acceptable terms. The Company’s identification of suitable acquisition candidates and affiliation opportunities and the integration of acquired business operations involve risks inherent in assessing the values, strengths, weaknesses, risks, and profitability of these opportunities. This includes the effects on the Company’s business, diversion of management’s attention, and risks associated with unanticipated problems or unforeseen liabilities, and may require significant financial resources that would otherwise be used for the ongoing development of the Company’s business.
18
The difficulties of integration may be increased by the necessity of coordinating geographically dispersed organizations, integrating personnel with disparate business backgrounds and combining different corporate cultures. These difficulties could be further increased to the extent the Company pursues acquisition or affiliation opportunities internationally. The Company may not be effective in retaining key employees or customers of the combined businesses. The Company may face integration issues pertaining to the internal controls and operations functions of the acquired companies and also may not realize cost efficiencies or synergies that were anticipated when selecting the acquisition candidates. The Company may experience managerial or other conflicts with its affiliation partners. Any of these items could adversely affect the Company’s results of operations.
The Company’s failure to identify suitable acquisition or joint venture opportunities may restrict the Company’s ability to grow its business. If the Company is successful in pursuing future acquisitions or other affiliations, the Company may be required to expend significant funds, incur additional debt and/or issue additional securities, which may materially adversely affect its results of operations. If the Company spends significant funds or incurs additional debt, the Company’s ability to obtain financing for working capital or other purposes could decline and the Company may be more vulnerable to economic downturns and competitive pressures.
Impairment charges relating to the Company’s goodwill and long lived assets could adversely affect its financial performance: The Company has been required to recognize impairment charges for its goodwill and other long lived assets. In accordance with generally accepted accounting principles, the Company periodically assesses these assets to determine if they are impaired. Significant negative industry or economic trends, disruptions to our business, inability to effectively integrate acquired businesses, unexpected significant changes or planned changes in use of these assets, changes in the structure of our business, divestitures, market capitalization declines, or increases in associated discount rates may impair our goodwill and other intangible assets. Any charges relating to such impairments may adversely affect our results of operations in the periods recognized.
Adverse conditions in the automotive market adversely affect demand for the Company’s products and exposes the Company to credit risks of its customers: The revenues of the Company’s operations are closely tied to global OE automobile sales, production levels, and independent aftermarket parts replacement activity. The OE market is characterized by short-term volatility, with overall expected long-term growth in global vehicle sales and production. Automotive production in the local markets served by the Company can be affected by macro-economic factors such as interest rates, fuel prices, consumer confidence, employment trends, regulatory and legislative oversight requirements and trade agreements. A variation in the level of automobile production would affect not only sales to OE customers but, depending on the reasons for the change, could affect demand from aftermarket customers. In addition, aftermarket demand is affected by various factors, including the size and composition of the vehicle population and vehicle usage. The Company’s results of operations and financial condition could be adversely affected if the Company fails to respond in a timely and appropriate manner to changes in the demand for its products or if the Company is not able to timely identify or address financial distress of its aftermarket customers.
Accounts receivable potentially subject the Company to concentrations of credit risk. The Company’s customer base includes virtually every significant global automotive manufacturer, numerous Tier 1 automotive suppliers, and a large number of distributors and installers of automotive aftermarket parts. Consolidation in the automotive aftermarket may lead to financial distress for financially weaker customers of the Company which, coupled with payment terms that are typically longer than in the OE market, could have a negative effect on the Company’s financial results.
Consolidation, increased market power, and potential conflicts with the Company’s independent aftermarket customers could negatively affect the Company’s financial performance: The Company’s independent aftermarket customers are continuing to consolidate and gain purchasing power and the ability to demand extended payment terms and other pricing concessions. If these trends continue, the financial results of the Company’s Motorparts business segment could be negatively affected. In addition, certain of the Company’s strategic initiatives, including the Company’s strategy of supporting its branded products, strategy of supporting new distribution channels and enhancing its distribution and category management capabilities, or the Company’s strategic affiliation with certain competitors, may not align with the interest of customers. As a result, aftermarket customers may reduce their business with the Company based on perceived channel conflict.
Cybersecurity risks and other cyber incidents could result in disruption: Threats to information technology systems associated with cybersecurity risks and cyber incidents or attacks continue to grow. The Company depends on information technology systems. In addition, the Company collects, processes and retains certain sensitive and confidential customer information in the normal course of business. Despite the security measures in place and any additional measures that may be implemented in the future, the Company’s facilities and systems, and those of its third-party service providers, could be vulnerable to security breaches, computer viruses, lost or misplaced data, programming errors, human errors, acts of vandalism or other events. Any disruption of our systems or security breach or event resulting in the misappropriation, loss or other
19
unauthorized disclosure of confidential information, whether by the Company directly or its third-party service providers, could damage our reputation, expose us to the risks of litigation and liability, disrupt our business or otherwise affect the Company’s results of operations.
The Company is subject to possible insolvency of financial counterparties: The Company engages in numerous financial transactions and contracts including insurance policies, letters of credit, credit line agreements, financial derivatives, and investment management agreements involving various counterparties. The Company is subject to the risk that one or more of these counterparties may become insolvent and therefore be unable to discharge its obligations under such contracts.
The automotive industry is highly competitive and the Company’s success depends upon its ability to compete effectively in the market: The Company operates in an extremely competitive industry, driven by global vehicle production volumes and part replacement trends. Business is typically awarded to the supplier offering the most favorable combination of cost, quality, technology, and service. In addition, customers continue to require periodic price reductions that require the Company to continually assess, redefine and improve its operations, products, and manufacturing capabilities to maintain and improve profitability. In addition, the Company’s competitors’ efforts to increase their market share could exert additional downward pressure on product pricing and margins. There can be no assurance the Company will be able to compete effectively in the automotive market.
The Company’s pension obligations and other postretirement benefits could adversely affect the Company’s operating margins and cash flows: The automotive industry, like other industries, continues to be affected by the rising cost of providing pension and other postretirement benefits. In addition, the Company sponsors certain defined benefit plans worldwide that are underfunded and will require cash payments. If the performance of the assets in the pension plans does not meet the Company’s expectations, or other actuarial assumptions are modified, the Company’s required contributions may be higher than it expects. See Note 15. Pensions and Other Postretirement Benefits, to the Consolidated Financial Statements, included in Item 8 of this report.
We are a wholly owned subsidiary and therefore could be subject to strategic decisions of Icahn Enterprises, L.P. (“IEP”): We are fundamentally affected by our relationship with IEP. As a wholly owned subsidiary of IEP we could be subject to a wide range of possible decisions which IEP may make from time to time, and circumstances affecting IEP could affect us. Significant changes in IEP’s overall strategy or its relationship with us or material adverse changes in IEP’s performance could have a material adverse effect on us.
If the Company loses any of its executive officers or key employees, the Company’s operations and ability to manage the day-to-day aspects of its business may be materially adversely affected: The Company’s future performance substantially depends on its ability to retain and motivate executive officers and key employees, both individually and as a group. If the Company loses any of its executive officers or key employees, which have many years of experience with the Company and within the automotive industry and other manufacturing industries, or is unable to recruit qualified personnel, the Company’s ability to manage the day-to-day aspects of its business may be materially adversely affected. The loss of the services of one or more executive officers or key employees, who also have strong personal ties with customers and suppliers, could have a material adverse effect on the Company’s business, financial condition, and results of operations.
The Company does not currently maintain “key person” life insurance.
Certain disruptions in supply of and changes in the competitive environment for raw materials could adversely affect the Company’s operating margins and cash flows: The Company purchases a broad range of materials, components, and finished parts. The Company also uses a significant amount of energy, both electricity and natural gas, in the production of its products. A significant disruption in the supply of these materials, supplies, and energy or the failure of a supplier with whom the Company has established a single source supply relationship could decrease production and shipping levels, materially increase operating costs and materially adversely affect profit margins. Shortages of materials or interruptions in transportation systems, labor strikes, work stoppages, or other interruptions to or difficulties in the employment of labor or transportation in the markets where the Company purchases material, components, and supplies for the production of products or where the products are produced, distributed or sold, whether as a result of labor strife, war, further acts of terrorism or otherwise, in each case may adversely affect profitability.
In recent periods there have been significant fluctuations in the prices of aluminum, copper, lead, nickel, platinum, resins, steel, other base metals and energy which have had and may continue to have an unfavorable effect on the Company’s business. Any continued fluctuations in the price or availability of energy and materials may have an adverse effect on the Company’s results of operations or financial condition. To address increased costs associated with these market forces, a number of the Company’s suppliers have implemented surcharges on existing fixed price contracts. Without the surcharge, some suppliers claim they will be unable to provide adequate supply. Competitive and marketing pressures may limit the Company’s ability to pass some of
20
the supply and material cost increases on to the Company’s customers and may prevent the Company from doing so in the future. Furthermore, the Company’s customers are generally not obligated to accept price increases the Company may desire to pass along to them. This inability to pass on price increases to customers when material prices increase rapidly or to significantly higher than historic levels could adversely affect the Company’s operating margins and cash flow, possibly resulting in lower operating income and profitability.
The Company’s hedging activities to address commodity price fluctuations may not be successful in offsetting future increases in those costs or may reduce or eliminate the benefits of any decreases in those costs: In order to mitigate short-term variation in operating results due to the aforementioned commodity price fluctuations, the Company hedges a portion of near-term exposure to certain raw materials used in production processes, primarily copper, nickel, tin, zinc, high-grade aluminum and aluminum alloy. The results of the Company’s hedging practice could be positive, neutral or negative in any period depending on price changes in the hedged exposures.
The Company’s hedging activities are not designed to mitigate long-term commodity price fluctuations and, therefore, will not protect from long-term commodity price increases. The Company’s future hedging positions may not correlate to actual raw materials costs, which would cause acceleration in the recognition of unrealized gains and losses on hedging positions in operating results.
The Company is subject to a variety of environmental, health and safety laws, and regulations, and the cost of complying or the Company’s failure to comply with such requirements may have a material adverse effect on its business, financial condition and results of operations: The Company is subject to a variety of federal, state, and local environmental laws and regulations relating to the release or discharge of materials into the environment, the management, use, processing, handling, storage, transport or disposal of hazardous waste materials, or otherwise relating to the protection of public and employee health, safety, and the environment. These laws and regulations expose the Company to liability for the environmental condition of its current facilities, and also may expose the Company to liability for the conduct of others or for the Company’s actions that were in compliance with all applicable laws at the time these actions were taken. These laws and regulations also may expose the Company to liability for claims of personal injury or property damage related to alleged exposure to hazardous or toxic materials in foreign countries. Despite the Company’s intention to be in compliance with all such laws and regulations, the Company cannot guarantee that it will at all times be in compliance with all such requirements. The cost of complying with these requirements may also increase substantially in future years. If the Company violates or fails to comply with these requirements, the Company could be fined or otherwise sanctioned by regulators. These requirements are complex, change frequently, and may become more stringent over time, which could have a material adverse effect on the Company’s business.
The Company’s failure to maintain and comply with environmental permits the Company is required to maintain could result in fines or penalties or other sanctions and have a material adverse effect on the Company’s operations or results. Future events, such as new environmental regulations or changes in or modified interpretations of existing laws and regulations or enforcement policies, newly discovered information or further investigation or evaluation of the potential health hazards of products or business activities, may give rise to additional compliance and other costs that could have a material adverse effect on the Company’s business, financial conditions, and operations.
New regulations related to “conflict minerals” may force us to incur additional expenses and may make the Company’s supply chain more complex. In August 2012, the SEC adopted annual disclosure and reporting requirements for those companies who use certain minerals known as “conflict minerals” mined from the Democratic Republic of Congo and adjoining countries in their products. These new requirements required due diligence efforts in 2013, with initial disclosure requirements beginning in 2014. There will be significant costs associated with complying with these disclosure requirements, including for diligence to determine the sources of conflict minerals used in the Company’s products and other potential changes to products, processes or sources of supply as a consequence of such verification activities.
A significant labor dispute involving the Company or one or more of its customers or suppliers or that could otherwise affect our operations could adversely affect the Company’s financial performance: A substantial number of the Company’s employees and the employees of the Company’s largest customers and suppliers are members of industrial trade unions and are employed under the terms of various labor agreements. Most of the Company’s unionized manufacturing facilities have their own contracts with their own expiration dates. There can be no assurances that future negotiations with the unions will be resolved favorably or that the Company will not experience a work stoppage or disruption that could adversely affect its financial condition, operating results and cash flows. A labor dispute involving the Company, any of its customers or suppliers or any other suppliers to the Company’s customers or that otherwise affects the Company’s operations, or the inability by the Company, any of its customers or suppliers or any other suppliers to the Company’s customers to negotiate, upon the expiration of a labor agreement, an extension of such agreement or a new agreement on satisfactory terms could adversely affect the Company’s financial condition, operating results and cash flows. In addition, if any of the Company’s significant customers
21
experience a material work stoppage, the customer may halt or limit the purchase of the Company’s products. This could require the Company to shut down or significantly reduce production at facilities relating to such products, which could adversely affect the Company’s business and harm its profitability.
The Company is involved from time to time in legal proceedings and commercial or contractual disputes, which could have an adverse effect on the Company’s profitability and consolidated financial position: The Company is involved in legal proceedings and commercial or contractual disputes that, from time to time, are significant. These are typically claims that arise in the normal course of business including, without limitation, commercial or contractual disputes, including disputes with suppliers, intellectual property matters, personal injury claims, environmental issues, tax matters and employment matters. No assurances can be given that such proceedings and claims will not have a material adverse effect on the Company’s profitability and consolidated financial position.
If the Company is unable to protect its intellectual property and prevent its improper use by third parties, the Company’s ability to compete in the market may be harmed: Various patent, copyright, trade secret, and trademark laws afford only limited protection and may not prevent the Company’s competitors from duplicating the Company’s products or gaining access to its proprietary information and technology. These means also may not permit the Company to gain or maintain a competitive advantage.
Any of the Company’s patents may be challenged, invalidated, circumvented or rendered unenforceable. The Company cannot guarantee it will be successful should one or more of its patents be challenged for any reason and countries outside the U.S. may diminish the protection of the Company’s patents. If the Company’s patent claims are rendered invalid or unenforceable, or narrowed in scope, the patent coverage afforded to the Company’s products could be impaired, which could significantly impede the Company’s ability to market its products, negatively affect its competitive position and materially adversely affect its business and results of operations.
The Company’s pending or future patent applications may not result in an issued patent. Additionally, newly issued patents may not provide meaningful protection against competitors or against competitive technologies. Courts in the U.S. and in other countries may invalidate the Company’s patents or find them unenforceable. Competitors may also be able to design around the Company’s patents. Other parties may develop and obtain patent protection for more effective technologies, designs or methods. If these developments were to occur, it could have an adverse effect on the Company’s sales. If the Company’s intellectual property rights are not adequately protected, the Company may not be able to commercialize its technologies, products or services and the Company’s competitors could commercialize the Company’s technologies, which could result in a decrease in the Company’s sales and market share and could materially adversely affect the Company’s business, financial condition and results of operations.
The Company’s products could infringe the intellectual property rights of others, which may lead to litigation that could itself be costly, could result in the payment of substantial damages or royalties, and could prevent the Company from using technology that is essential to its products: The Company cannot guarantee its products, manufacturing processes or other methods do not infringe the patents or other intellectual property rights of third parties. Infringement and other intellectual property claims and proceedings brought against the Company, whether successful or not, could result in substantial costs and harm the Company’s reputation. Such claims and proceedings can also distract and divert management and key personnel from other tasks important to the success of its business. In addition, intellectual property litigation or claims could force the Company to do one or more of the following:
• | cease selling or using of any products that incorporate the asserted intellectual property, which would adversely affect the Company’s revenue; |
• | pay substantial damages for past use of the asserted intellectual property; |
• | obtain a license from the holder of the asserted intellectual property, which license may not be available on reasonable terms, if at all; and |
• | redesign or rename, in the case of trademark claims, products to avoid infringing the intellectual property rights of third parties, which may not be possible and could be costly and time-consuming if it is possible to do. |
In the event of an adverse determination in an intellectual property suit or proceeding, or the Company’s failure to license essential technology, the Company’s sales could be harmed and its costs could increase, which could materially adversely affect the Company’s business, financial condition, and results of operations.
The Company may be exposed to certain regulatory and financial risks related to climate change: Climate change is continuing to receive ever increasing attention worldwide. Many scientists, legislators and others attribute climate change to increased levels of greenhouse gases, including carbon dioxide, which could lead to additional legislative and regulatory efforts to limit greenhouse gas emissions. The focus on emissions could increase costs associated with the Company’s operations,
22
including costs for raw materials and transportation. Because the scope of future laws in this area is uncertain, the Company cannot predict the potential effect of such laws on its future consolidated financial condition, results of operations, or cash flows.
A material weakness in internal control over financial reporting could affect our ability to timely file reliable financial statements and could have a material adverse effect on our business, results of operations, financial condition and liquidity. If the Company discovers significant deficiencies or material weaknesses in its internal controls over financial reporting or at any recently acquired entity, it may adversely affect its ability to provide timely and reliable financial information and satisfy its reporting obligations under federal securities laws.
ITEM 1.B. UNRESOLVED STAFF COMMENTS
Not applicable.
23
ITEM 2. PROPERTIES
Our world headquarters is located in Southfield, Michigan, which is a leased facility. Our operations include 252 manufacturing facilities, technical centers, distribution and warehouse centers, and sales and administration office facilities worldwide at December 31, 2016 supporting our operations. Approximately 57% of the facilities are leased; the majority of which are distribution centers, and sales and administration offices. We own the remainder of the facilities.
We have entered into agreements with certain Third Party Logistic providers ("TPL"s) to provide distribution services on our behalf. Of the 9 locations listed below, the Company is the lessee for two of the properties. The Company has also invested globally in nonconsolidated affiliates which we have multiple manufacturing sites in Turkey and China, which are not included in the tables below.
A summary of our facilities, by segment, type of facility and geographic region, as of December 31, 2016 are set forth in the following tables:
Powertrain
Type of Facility | North America | EMEA | Rest of World | Total | |||||||
Manufacturing facilities | 24 | 33 | 30 | 87 | |||||||
Technical centers(a) | 5 | 5 | 2 | 12 | |||||||
Distribution and warehouses centers | 5 | 1 | 6 | 12 | |||||||
Sales and administration offices | 6 | 5 | 7 | 18 | |||||||
40 | 44 | 45 | 129 | ||||||||
(a) Consists mainly of research and development activity. | |||||||||||
Motorparts
Type of Facility | North America | EMEA | Rest of World | Total | ||||||||
Manufacturing facilities | 12 | 13 | 8 | 33 | ||||||||
Technical centers(a) | 5 | 5 | — | 10 | ||||||||
Distribution and warehouses centers | 8 | 10 | 15 | 33 | ||||||||
Sales and administration offices | 6 | 13 | 6 | 25 | ||||||||
Technical support centers | 12 | — | 1 | 13 | ||||||||
Third party distribution centers | 2 | — | 7 | 9 | ||||||||
45 | 41 | — | 37 | 123 | ||||||||
(a) Consists mainly of research and development activity. | ||||||||||||
The facilities range in size up to 700 thousand square feet. Management believes substantially all of our facilities are in good condition and have sufficient capacity to meet our current and expected manufacturing and distribution needs.
ITEM 3. LEGAL PROCEEDINGS
The Company is involved in various litigation matters regarding environmental matters and other matters as described below.
Environmental Matters
The Company is a defendant in lawsuits filed, or the recipient of administrative orders issued or demand letters received, in various jurisdictions pursuant to the Federal Comprehensive Environmental Response Compensation and Liability Act of 1980 (“CERCLA”) or other similar national, provincial or state environmental remedial laws. These laws provide that responsible parties may be liable to pay for remediating contamination resulting from hazardous substances that were discharged into the environment by them, by prior owners or occupants of property it currently owns or operates, or by others to whom it sent such substances for treatment or other disposition at third party locations. The Company has been notified by the U.S. Environmental Protection Agency, other national environmental agencies, and various provincial and state agencies that it may be a potentially responsible party (“PRP”) under such laws for the cost of remediating hazardous substances pursuant to
24
CERCLA and other national and state or provincial environmental laws. PRP designation typically requires the funding of site investigations and subsequent remedial activities.
Many of the sites that are likely to be the costliest to remediate are often current or former commercial waste disposal facilities to which numerous companies sent wastes. Despite the potential joint and several liability which might be imposed on the Company under CERCLA and some of the other laws pertaining to these sites, the Company’s share of the total waste sent to these sites has generally been small. Therefore, the Company believes its exposure for liability at these sites is limited.
The Company has also identified certain other present and former properties at which it may be responsible for cleaning up or addressing environmental contamination, in some cases as a result of contractual commitments and/or federal or state environmental laws. The Company is actively seeking to resolve these actual and potential statutory, regulatory, and contractual obligations. Although difficult to quantify based on the complexity of the issues, the Company has accrued amounts corresponding to its best estimate of the costs associated with such regulatory and contractual obligations on the basis of available information from site investigations and the professional judgment of consultants.
Total environmental liabilities were $16 million and $14 million at December 31, 2016 and 2015. Management believes such accruals will be adequate to cover the Company’s estimated liability for its exposure in respect to such matters. In the event such liabilities were to significantly exceed the amounts recorded by the Company, the Company’s results of operations and financial condition could be materially affected. At December 31, 2016, management estimates reasonably possible material additional losses above and beyond management’s best estimate of required remediation costs, as recorded, approximate $41 million.
Other Matters
On September 29, 2016, September 30, 2016, October 12, 2016 and October 19, 2016, respectively, four putative class actions, captioned Skybo v. Ninivaggi et al., C.A. No. 12790, Lemanchek v. Ninivaggi et al., C.A. No. 12791, Raul v. Ninivaggi et al., C.A. No. 12821 and Mercado v. Ninivaggi et al., C.A. No. 12837, were filed in the Court of Chancery of the State of Delaware against the Board, Icahn Enterprises L.P. and certain of its affiliates, including Parent and the Offeror (the “Icahn Defendants”), and, in the case of Raul, the Company. The complaints allege that, among other things, the Board breached its fiduciary duties by approving the proposed Merger Agreement, that the Icahn Defendants breached their fiduciary duties to the minority stockholders and/or aided and abetted the Board’s breaches of its fiduciary duties, as well as alleging certain material misstatements and omissions in the Schedule 14D-9. The complaints allege that, among other things, the then-Offer Price was inadequate and, together with that the Merger Agreement, was the result of a flawed and unfair sales process and conflicts of interest of the Board and the Special Committee, alleging that the Special Committee and the Company’s management lacked independence from the Icahn Defendants. In addition, the complaints allege that the Merger Agreement contains certain allegedly preclusive deal protection provisions, including a no-solicitation provision, an information rights provision and a matching rights provision. Among other things, the complaints sought to enjoin the transactions contemplated by the Merger Agreement, as well as award costs and disbursements, including reasonable attorneys’ and experts’ fees. The Raul and Mercado complaints further seek to rescind the transaction or award rescissory damages, or (in the case of Raul) award a quasi-appraisal remedy in the event that the transaction was consummated, as well as award money damages. On October 28, 2016, all four actions were consolidated under the caption In re Federal-Mogul Holdings, Inc. Stockholder Litigation, C.A. No. 12790-CB (the “Delaware Action”). On February 3, 2017, an order was entered requiring plaintiffs to file their amended complaint by March 6, 2017.
On October 5, 2016, a putative class action captioned Sanders v. Federal-Mogul Holdings Corporation et al., C.A. No. 16-155387 was filed in the Circuit Court for Oakland County of the State of Michigan against the Company, the Board and the Icahn Defendants (the “Michigan Action”). The complaint alleges, among other things, that the Board breached its fiduciary duties and that the Company and the Icahn Defendants aided and abetted the Board’s breaches of its fiduciary duties, as well as alleging certain material misstatements and omissions in the Schedule 14D-9. The complaint alleges that, among other things, the then-Offer Price was unfair and the result of an unfair sales process that included conflicts of interest. In addition, the complaint alleges that the Merger Agreement contains certain allegedly preclusive deal protection provisions, including a no-solicitation provision, an information rights provision and a matching rights provision. Among other things, the complaint sought to enjoin the transactions contemplated by the Merger Agreement, or, in the event that the transactions were consummated, rescind the transactions or award rescissory damages, as well as award money damages and costs, including reasonable attorneys’ and experts’ fees. On February 10, 2017, an order was entered providing that plaintiff shall have through March 6, 2016, to file his First Amended Complaint.
We believe that the claims in the Delaware and Michigan Actions are without merit and intend to defend against them vigorously.
25
In addition, the Company is involved in other legal actions and claims, directly and through its subsidiaries, that arise in the normal course of business. Management does not believe the outcomes of these other actions or claims are likely to have a material adverse effect on the Company’s financial position, operating results, or cash flows. See Note 17, Commitments and Contingencies, to the Consolidated Financial Statements, included in Item 8 of this report.
ITEM 4. MINE SAFETY DISCLOSURES
Not applicable.
26
PART II
ITEM 5. MARKET FOR THE REGISTRANT’S COMMON EQUITY, RELATED STOCKHOLDER MATTERS AND ISSUER PURCHASES OF EQUITY SECURITIES
Our stock was listed on the NASDAQ Global Stock Market as of December 31, 2016.
There were no stockholders of record of Common Stock as of February 22, 2017, since the Company converted to a single member limited liability company on February 14, 2017. High and low sales prices for our common stock for each quarter in 2016 and 2015 are as follows:
2016 | 2015 | |||||||||||||||
Quarter | High | Low | High | Low | ||||||||||||
First | $ | 10.00 | $ | 3.81 | $ | 15.64 | $ | 12.61 | ||||||||
Second | $ | 9.97 | $ | 7.71 | $ | 13.91 | $ | 11.35 | ||||||||
Third | $ | 9.90 | $ | 8.11 | $ | 11.24 | $ | 6.78 | ||||||||
Fourth | $ | 10.68 | $ | 9.12 | $ | 8.68 | $ | 6.53 | ||||||||
We did not pay any dividends in 2016 or 2015. We have certain restrictions under our credit facilities from paying dividends in the future.
The following graph compares the cumulative total stockholder return during the five year period from December 31, 2011 to December 31, 2016. The graph assumes that $100 was invested on December 31, 2011, in each of the Company’s common stock, the stocks comprising the S&P 500 Index, and the stocks comprising the peer group. The peer group is comprised on the following companies: BorgWarner Inc., Dana, Magna International, Meritor, Tenneco, and Timken. This performance graph shall not be deemed to be incorporated by reference by any general statement incorporating by reference this Form 10-K into any filing under the Securities Act or the Exchange Act, except to the extent we specifically incorporate this information by reference, and shall not otherwise be deemed soliciting material or filed under such Acts.
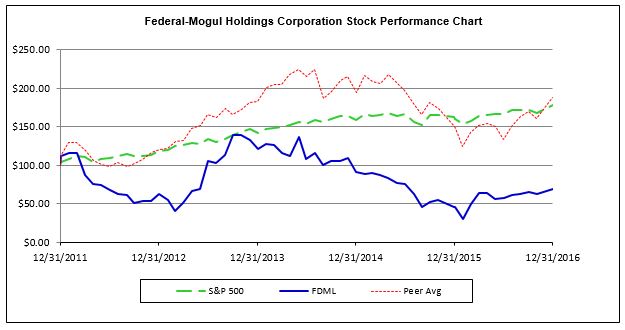
27
ITEM 6. SELECTED FINANCIAL DATA
The following table presents information from the Consolidated Financial Statements as of or for the five years ended December 31, 2016. This information should be read in conjunction with ‘‘Management’s Discussion and Analysis of Financial Condition and Results of Operations’’ and ‘‘Financial Statements and Supplemental Data.’’
Year Ended December 31 | ||||||||||||||||||||
2016 | 2015 | 2014 | 2013 | 2012 | ||||||||||||||||
(in millions, except per share amounts) | ||||||||||||||||||||
Consolidated Statement of Operations Data | ||||||||||||||||||||
Net sales (a) | $ | 7,434 | $ | 7,419 | $ | 7,317 | $ | 6,786 | $ | 6,444 | ||||||||||
Net income (loss) from continuing operations | 90 | (111 | ) | (161 | ) | 101 | (91 | ) | ||||||||||||
Amounts attributable to Federal-Mogul: | ||||||||||||||||||||
Net income (loss) from continuing operations | 82 | (117 | ) | (168 | ) | 93 | (98 | ) | ||||||||||||
Income (loss) from discontinued operations, net of tax | — | 7 | — | (52 | ) | (19 | ) | |||||||||||||
Net income (loss) | $ | 82 | $ | (110 | ) | $ | (168 | ) | $ | 41 | $ | (117 | ) | |||||||
Common Share Summary Attributable to Federal-Mogul | ||||||||||||||||||||
Net (loss) income per common share - basic: | ||||||||||||||||||||
Net (loss) income from continuing operations | $ | 0.49 | $ | (0.71 | ) | $ | (1.12 | ) | $ | 0.75 | $ | (0.99 | ) | |||||||
(Loss) income from discontinued operations, net of tax | — | 0.04 | — | (0.42 | ) | (0.19 | ) | |||||||||||||
Net (loss) income | $ | 0.49 | $ | (0.67 | ) | $ | (1.12 | ) | $ | 0.33 | $ | (1.18 | ) | |||||||
Weighted average shares outstanding – basic (in millions) | 169.0 | 164.7 | 150.0 | 123.4 | 98.9 | |||||||||||||||
Net (loss) income per common share - diluted: | ||||||||||||||||||||
Net (loss) income from continuing operations | $ | 0.49 | $ | (0.71 | ) | $ | (1.12 | ) | $ | 0.75 | $ | (0.99 | ) | |||||||
(Loss) income from discontinued operations, net of tax | — | 0.04 | — | (0.42 | ) | (0.19 | ) | |||||||||||||
Net (loss) income | $ | 0.49 | $ | (0.67 | ) | $ | (1.12 | ) | $ | 0.33 | $ | (1.18 | ) | |||||||
Weighted average shares outstanding – diluted (in millions) | 169.0 | 164.7 | 150.0 | 123.4 | 99.4 | |||||||||||||||
Dividends declared per common share | $ | — | $ | — | $ | — | $ | — | $ | — | ||||||||||
As of December 31 | ||||||||||||||||||||
2016 | 2015 | 2014 | 2013 | 2012 | ||||||||||||||||
(in millions) | ||||||||||||||||||||
Consolidated Balance Sheet Data | ||||||||||||||||||||
Total assets | $ | 7,076 | $ | 7,228 | $ | 7,067 | $ | 7,182 | $ | 6,927 | ||||||||||
Total liabilities | $ | 6,196 | $ | 6,326 | $ | 6,158 | $ | 5,581 | $ | 6,095 | ||||||||||
Total debt (including short-term debt and current portion of long-term debt) | $ | 3,025 | $ | 3,052 | $ | 2,690 | $ | 2,599 | $ | 2,827 | ||||||||||
Federal-Mogul shareholders’ equity | $ | 738 | $ | 770 | $ | 806 | $ | 1,490 | $ | 725 | ||||||||||
(a) Refer to Note 5, Acquisitions, for the effect of acquisitions on net sales and net income (loss). | ||||||||||||||||||||
28
The following table represents items that affect the comparability of the amounts shown above for the years ended December 31, 2016:
Year ended December 31 | ||||||||||||||||||||
2016 | 2015 | 2014 | 2013 | 2012 | ||||||||||||||||
(in millions) | ||||||||||||||||||||
Gain on sale of real estate | $ | 7 | $ | 4 | $ | 1 | $ | (2 | ) | $ | 1 | |||||||||
Loss on sale of equity method investment | $ | — | $ | (11 | ) | $ | — | $ | — | $ | — | |||||||||
Goodwill and intangible impairment expense, net | $ | (6 | ) | $ | (94 | ) | $ | (120 | ) | $ | — | $ | (142 | ) | ||||||
OPEB curtailment gain | $ | — | $ | — | $ | — | $ | 19 | $ | 51 | ||||||||||
Loss on debt extinguishment | $ | — | $ | — | $ | (24 | ) | $ | — | $ | — | |||||||||
Restructuring charges and asset impairments, net | $ | (44 | ) | $ | (121 | ) | $ | (110 | ) | $ | (29 | ) | $ | (78 | ) | |||||
29
ITEM 7. MANAGEMENT’S DISCUSSION AND ANALYSIS OF FINANCIAL CONDITION AND RESULTS OF OPERATIONS
Executive Overview
Our Business: We are a leading global supplier of a broad range of components, accessories, and systems to the automotive, small engine, heavy-duty, marine, railroad, agricultural, off-road, aerospace and energy, industrial, and transport markets, including customers in both the original equipment manufacturers (“OEM”) and servicers (“OES”) (collectively “OE”) market and the replacement market (“aftermarket”). Our customers include the world’s largest automotive OEs, and major distributors and retailers in the independent aftermarket.
Merger Transaction: On September 6, 2016, we, American Entertainment Properties Corp., a Delaware corporation (“AEP”), our parent and a subsidiary of Icahn Enterprises L.P. ("IEP"), and IEH FM Holdings LLC, a Delaware limited liability company (“Merger Sub”) entered into an Agreement and Plan of Merger (the "Merger Agreement"). Pursuant to the Merger Agreement, and upon the terms and subject to the conditions thereof, Merger Sub commenced a cash tender offer (the "Offer) to acquire, subject to the terms and conditions of the Merger Agreement, all of the issued and outstanding shares of our common stock, par value $0.01 per share, not already owned by IEP affiliates, for a purchase price of $9.25 per share, net to the seller in cash, without interest, less any applicable tax withholding.
On January 3, 2017, we announced we had received a revised proposal to purchase our shares of common stock for $10.00 per share, an increase from the previous offer of $9.25 in cash per share. On January 23, 2017, AEP and Merger Sub completed the acquisition of the Company as all terms and conditions as set forth in the Merger Agreement were satisfied. Shares of our stock are no longer publicly traded as of the close of business January 23, 2017.
On February 14, 2017, we converted to a single member limited liability corporation in the U.S. and changed our name to Federal-Mogul Holdings LLC.
Financial Results for the Year Ended December 31, 2016: Consolidated net sales were $7,434 million, an increase of $15 million, or 0.2%. The increase was primarily driven by a 1.9% increase in sales volumes of $143 million (which included a $91 million benefit from acquisitions) and was substantially offset by a $107 million unfavorable effect of foreign currency exchange.
Cost of products sold was $6,301 million for the year ended December 31, 2016, a decrease of $44 million or 0.7%. The decrease was primarily driven by $99 million of savings from net performance and a $92 million favorable effect of foreign currency exchange. This was partially offset by the $147 million in incremental costs related to higher sales volumes attributable to organic growth and acquisitions.
Gross profit increased by $59 million to $1,133 million or 15.2% of sales, for the year ended December 31, 2016 compared to $1,074 million, or 14.5% of sales, for the year ended December 31, 2015. The increase was primarily driven by the favorable effect of performance of $78 million which was offset by the negative effects of foreign currency exchange of $15 million.
For the year-ended December 31, 2016:
• | Net income attributable to Federal-Mogul was $82 million which included restructuring charges and asset impairments, net of $44 million, goodwill and intangible impairment charges of $6 million, and other income of $9 million (net of tax) related to the recognition of a gain on the sale of real estate made in the prior year. |
• | Restructuring charges and asset impairments, net were comprised of $21 million related to the Powertrain segment and $23 million related to the Motorparts segment. This charge includes $27 million of costs related to severance and other charges, net primarily focused on optimizing our cost structure. The charges include severance related costs and other charges of $18 million in EMEA, $8 million in North America, and $1 million in ROW. In addition, there was $12 million in asset impairments in ROW, $4 million in EMEA, and $1 million in North America for the Motorparts segment. |
• | Total debt, including short-term debt and current portion of long-term debt, decreased by $27 million. The decrease was primarily attributable to the payments in excess of borrowings. We had $300 million of cash, $213 million of availability under our U.S. credit facilities, and additional availability of $60 million under foreign lines of credit at December 31, 2016. |
30
Recent Trends and Market Conditions:
There is inherent uncertainty in the continuation of the trends discussed below. In addition, there may be other factors or trends that can have an effect on our business. Our business and operating results are affected by the relative strength of:
General economic conditions: Our OE business is directly related to automotive sales and automotive vehicle production by our customers. Automotive sales depend on a number of factors, including global and regional economic conditions. Demand for aftermarket products is driven by three primary factors including: the number of vehicles in operation; the average age of vehicles; and vehicle usage trends (primarily distance traveled).
Global vehicle production levels: Global light vehicle production increased by 4.8 percent in 2016. European light vehicle production rose 3.9 percent and North American light vehicle production increased 2.3 percent, with positive growth in Canada and the U.S. Light vehicle production in the Asia-Pacific region increased by 7.4 percent, with strong positive growth in China and India. Among the major regions, only South America posted a decline, down 11.9 percent.
Global commercial vehicle production increased by 2.5 percent in 2016. European commercial vehicle production rose 2.9 percent and the Asia-Pacific region rose 11.1 percent, with strong positive growth in China and India. South America posted a decline, down 20.5 percent. There was a 15.9 percent decrease in commercial vehicle production in our primary market of North America.
Global vehicle sales levels: Global light vehicle sales increased by 4.5 percent in 2016. European light vehicle sales rose 3.5 percent and North American vehicles sales increased 1.9 percent, with positive growth in Canada, Mexico, and the U.S. Light vehicle sales in the Asia-Pacific region increased 8.2 percent, with strong positive growth in China and India. Among the major regions, only South America posted a decline, which was down 12.5 percent.
Global commercial vehicle sales were up 4.7 percent in all of 2016. European commercial vehicles sales rose 2.6 percent and the Asia-Pacific region was up 12.9 percent, with strong positive growth in China and India. South America posted a decline, down 24.0 percent. There was an 8.2 percent decrease in our primary market of North America.
Part replacement trends: The strength of our aftermarket business is influenced by several key drivers. These include the vehicle population (or "parc"), average vehicle age, fuel prices, and vehicle distance traveled. The vehicle parc is estimated to have expanded in most major markets, including the U.S., China, and Germany. Average vehicle ages also increased, despite growth in new vehicle sales, in most regions. Vehicle distance traveled varies by region and is sensitive to several factors, including fuel prices and transportation alternatives. Average vehicle distance traveled has declined in China in the recent past, partially offsetting generally favorable trends in the country.
Geopolitical risk: We conduct business globally, which subjects us to numerous risks and uncertainties. For example, we have operations in the UK which may be materially affected by the UK's referendum to leave the European Union, which has created uncertainty in both the UK and Europe. We also have an interest in a Turkish joint venture, which may be affected by recent turmoil in that region. In addition, there could be potential changes in trade agreements and new or changed tariffs in the U.S.
Foreign currencies: Given the global nature of our operations, we are subject to fluctuations in foreign exchanges rates and there has been significant volatility in foreign currency rates.
Strategy:
Our strategy is to develop and deliver leading technology, innovation, and service capabilities which result in market share expansion in the OE market and aftermarket. Our strategy is designed to create sustainable global profitable growth by leveraging existing and developing new economic advantages. This strategy consists of the following:
Extending our global reach to support our OE and aftermarket customers, furthering our relationships with leading Asian OEs and strengthening market share with U.S. and European OEs.
Our company conducts business with the majority of OE/OES providers, as well as leading automotive aftermarket warehouse distributors and retailers, around the world. Within the highly competitive automotive parts industry, we enjoy and seek to extend the significant advantage that comes from our world-class manufacturing and global distribution footprint. This footprint enables the production and delivery of premium parts emphasizing quality, safety, and reliability virtually anywhere in the world and also supports the continual innovation of new products and technologies.
In 2016, we expanded the footprint of our Nanchang, China sealing facility in order to meet growing demand from our OEM customers who must meet more stringent environmental regulations. This facility is one of our most advanced sealing and gasket manufacturing facilities, and supports our business towards greater market share and competitiveness in China. We also
31
continued the integration of the TRW Global Valvetrain business within our Powertrain organization, which also helps to strengthen our position as a leading supplier of core engine components. In late 2015, we opened a new state-of-the-art wiper production facility in southeastern Romania serving both OE and aftermarket customers throughout Europe. We are in the process of expanding our braking production capacity in an existing braking plant in Romania and also investing in our manufacturing footprint in Mexico, Eastern Europe, and Africa.
Assess acquisition and investment opportunities that provide product line expansion, technological advancements, geographic positioning, penetration of emerging markets (including India and China) and market share growth.
We continue to invest in the development of leading powertrain technologies for our customers. During 2016, we began mass production with our market-leading DuroGlide piston ring technology for both passenger cars and commercial trucks and are seeing rapidly growing demand from our customers. We also completed the acquisition of a filter manufacturing business in Mexico, which primarily serves the Mexican market and Beck Arnley, a provider of premium OE quality parts and fluids for foreign nameplate vehicles in North America, within our Motorparts segment during 2016.
In addition to the TRW valvetrain acquisition during 2015, we also made investments in joint ventures in India, as well as entered into two new joint ventures, one in Thailand and one in China focused on automotive aftermarket vehicle repair business. We will be the preferred supplier to the China joint venture and will provide our broad portfolio of premium-branded automotive parts for distribution through a network of repair shops. These investments position the company to capitalize on the development of the independent aftermarket in the Asia Pacific region.
Leverage the strength of our global aftermarket leading brand positions, product portfolio and range, marketing and selling expertise, and distribution and logistics capabilities.
As we expand our distribution and service capabilities globally, we look to optimize the performance of our distribution centers (“DCs”) through enhanced efficiencies and the world-class delivery performance our customers increasingly require. We have made investments into our U.S. distribution network through our East and West coast distribution centers, and through the implementation of automated picking technology and a more efficient replenishment system with the objective of improving inventory availability and lowering costs. Recently, we made investments in our DC network in Belgium, China and announced plans to open a DC in Hungary during 2017.
We are focused on various marketing campaigns and significantly expanding the digital presence of our premium brands. We have launched a series of 'Tech First' initiatives to provide online, on-demand, and onsite technical training and support to vehicle repair technicians who use and install our products. This initiative included the opening of 'Garage Gurus,' a nationwide technical education network consisting of 12 technical support centers and a fleet of mobile training vans in major U.S. markets; a repair shop engagement program in France and Germany; and the opening of the Company’s first technical training and support center in China.
Aggressively pursue cost competitiveness in all business segments by continuing to drive productivity in existing operations, consolidating and relocating manufacturing operations to best cost countries, utilizing our strategic alliances, and rationalizing business resources and infrastructure.
We assess individual opportunities to execute our strategy based upon estimated sales and margin growth, cost reduction potential, internal investment returns, and other criteria, and make investment decisions on a case-by-case basis. Opportunities meeting or exceeding benchmark return criteria may be undertaken through research and development activities, acquisitions, other strategic alliances, or restructuring activities. Restructuring expenses for the year ended December 31, 2016 primarily related to our Powertrain locations and were aimed at reducing production complexities, and reducing inefficiencies in indirect and fixed cost structures.
Critical Accounting Estimates
Our Consolidated Financial Statements and accompanying notes as included in Item 8 “Financial Statements and Supplementary Data” of this Annual Report on From 10-K have been prepared in conformity with accounting principles generally accepted in the United Sates (“U.S GAAP”). Accordingly, our significant accounting policies have been disclosed in Note 2, “Basis of Presentation and Summary of Significant Accounting Policies" of the Consolidated Financial Statements. We provide enhanced information that supplements such disclosures for accounting estimates when the estimate involves matters that are highly uncertain at the time the accounting estimate is made and different estimates or changes to an estimate could have a material effect on the reported financial position, changes in financial condition or results of operations.
When more than one accounting principle, or the method of its application, is generally accepted, management selects the principle or method it considers to be the most appropriate given the specific circumstances. Application of these accounting principles requires us to make estimates about the future resolution of existing uncertainties. Estimates are typically based upon historical experience, current trends, contractual documentation, and other information, as appropriate. Due to the inherent
32
uncertainty involving estimates, actual results reported in the future may differ from those estimates. In preparing these financial statements, we have made our best estimates and judgments of the amounts and disclosures included in the financial statements, giving due regard to materiality. The following summarizes our critical accounting policies.
Pension Plans and Other Postretirement Benefit Plans
We sponsor defined benefit pension plans and postretirement plans for certain employees and retirees around the world. Our defined benefit plans are accounted for on an actuarial basis, which requires the selection of various assumptions, including an expected long-term rate of return, discount rate, mortality rates of participants, and expectation of mortality improvement.
Differences in actual experience or changes in assumptions may materially affect the pension and postretirement plan obligations. Actual results that differ from assumptions are accumulated in net actuarial gains and losses which are subject to amortization and expensed over future periods. The unamortized pre-tax actuarial loss on our pension plans was $544 million and $532 million at December 31, 2016 and 2015. We expect to recognize amortization expense of $17 million in 2017.
Assumptions used to calculate benefit obligations as of the end of a fiscal year directly affect the expense to be recognized in future periods. The primary assumptions affecting our accounting for pension and postretirement benefits as of December 31, 2016 are as follows:
• | Long-term rate of return on plan assets: In December 2016, an investment policy study was completed for the U.S. pension plans. The study resulted in changes to the expected long-term rate of return on assets and is designed to approximate a long-term prospective rate. The long-term rate of return on assets decreased from 5.65% at December 31, 2015 to 5.55% at December 31, 2016. The expected long-term rate of return on plan assets used in determining pension expense for non-U.S. plans is determined in a similar manner to the U.S. plans and the weighted average return on assets decreased from 3.22% at December 31, 2015 to 3.05% at December 31, 2016. |
• | Discount rate: The discount rate assumption is established at the measurement date. In the U.S., we use a cash flow matching approach that uses projected cash flows matched to spot rates along a high quality corporate yield curve to determine the present value of cash flows to calculate a single equivalent discount rate. The benefit obligation for pension plans in Belgium, France, and Germany represents 91% of the non-U.S. pension benefit obligation at December 31, 2016. The discount rates for these plans are determined using a cash flow matching approach similar to the U.S. approach. |
The weighted-average discount rates used to calculate net periodic benefit cost for the 2016 and year-end obligations as of December 31, 2016 were as follows:
Pension Benefits | |||||||||
U.S. | Non-U.S. | Other Postretirement | |||||||
Plans | Plans | Benefits | |||||||
Used to calculate net periodic benefit cost | 4.15 | % | 2.72 | % | 4.18 | % | |||
Used to calculate benefit obligations | 3.90 | % | 2.03 | % | 3.98 | % | |||
• | Mortality Assumptions: We have reviewed the mortality improvement tables published by the Society of Actuaries in the three months ended December 31, 2016 that lowered life expectancies for our U.S. Plans. This change in assumptions decreased the U.S. pension and postretirement plan obligation by $46 million. |
• | Health care cost trend: We review external data and our historical trends for health care costs to determine the health care cost trend rate. The assumed health care cost trend rate used to measure next year’s postretirement health care benefits is 6.69% for health care and drug costs, both declining to an ultimate trend rate of 5.00% in 2022. |
33
The following table illustrates the sensitivity to a change in certain assumptions for the pension and postretirement plans. The changes in these assumptions have no effect on our funding requirements.
Pension Benefits | Other Postretirement Benefits | |||||||||||||||||||||||
U.S. Plans | Non-U.S. Plans | |||||||||||||||||||||||
Change in 2017 Pension Expense | Change in PBO | Change in 2017 Pension Expense | Change in PBO | Change in 2017 Expense | Change in PBO | |||||||||||||||||||
(in millions) | ||||||||||||||||||||||||
25 basis point ("bp") decrease in discount rate | $ | (1 | ) | $ | 29 | $ | 1 | $ | 20 | $ | — | $ | 7 | |||||||||||
25 bp increase in discount rate | 1 | (28 | ) | (1 | ) | (19 | ) | — | (6 | ) | ||||||||||||||
25 bp decrease in return on assets rate | 2 | n/a | — | n/a | n/a | n/a | ||||||||||||||||||
25 bp increase in return on assets rate | (2 | ) | n/a | — | n/a | n/a | n/a | |||||||||||||||||
The assumed health care trend rate has a significant effect on the amounts reported the postretirement plans. The following table illustrates the sensitivity to a change in the assumed health care trend rate:
Total Service and Interest Cost | APBO | |||||||
(in millions) | ||||||||
100 bp increase in health care cost trend rate | $ | 1 | $ | 24 | ||||
100 bp decrease in health care cost trend rate | $ | (1 | ) | $ | (21 | ) | ||
Environmental Matters
Environmental remediation liabilities are recognized when a loss is probable and can be reasonably estimated. Such liabilities generally are not subject to insurance coverage. The cost of each environmental remediation is estimated by engineering, financial, and legal specialists based on current law and considers the estimated cost of investigation and remediation required and the likelihood that, where applicable, other responsible parties will be able to fulfill their legal obligations and commitments. The process of estimating environmental remediation liabilities is complex and dependent primarily on the nature and extent of historical information and physical data relating to a contaminated site, the complexity of the site, the uncertainty as to what remediation and technology will be required, and the outcome of discussions with regulatory agencies and, if applicable, other responsible parties. In future periods, new laws or regulations, advances in remediation technologies and additional information about the ultimate remediation methodology to be used could significantly change our estimates. Refer to Note 17, Commitments and Contingencies, to the Consolidated Financial Statements included herein for additional details. We cannot ensure environmental requirements will not change or become more stringent over time or our eventual environmental costs and liabilities will not exceed the amount of current reserves. In the event such liabilities were to significantly exceed the amounts recorded, our results of operations could be materially affected.
Asset Retirement Obligations
In determining whether the fair value of asset retirement obligations ("ARO") can reasonably be estimated, we must determine if the obligation can be assessed in relation to the acquisition price of the related asset or if an active market exists to transfer the obligation. If the obligation cannot be assessed in connection with an acquisition price and if no market exists for the transfer of the obligation, we must determine if it has sufficient information upon which to estimate the obligation using expected present value techniques. This determination requires us to estimate the range of settlement dates and the potential methods of settlement, and then to assign the probabilities to the various potential settlement dates and methods. The majority of the identified ARO liabilities involve asbestos related cleanup. Refer to Note 17, Commitments and Contingencies, to the Consolidated Financial Statements included herein for additional details. We cannot ensure that ARO requirements will not change or become more stringent over time or that our eventual environmental costs and liabilities will not exceed the amount of current reserves. In the event that such liabilities were to significantly exceed the amounts recorded, our results of operations could be materially affected.
Valuation of Long-Lived Assets, Definite-Lived Intangible Assets, and Expected Useful Lives
We monitor our long-lived and definite-lived assets for impairment indicators on an ongoing basis. If impairment indicators exist, we perform the required impairment analysis by comparing the undiscounted cash flows expected to be generated from the long-lived assets to the related net book values. If the net book value exceeds the undiscounted cash flows, an impairment loss is measured and recognized. Even if an impairment charge is not required, a reassessment of the useful lives over which depreciation or amortization is being recognized may be appropriate based on our assessment of the recoverability of these
34
assets. We estimate cash flows and fair value using internal budgets based on recent sales data, independent automotive production volume estimates and customer commitments, and review of appraisals. The key factors which effect our estimates are (1) future production estimates; (2) customer preferences and decisions; (3) product pricing; (4) manufacturing and material cost estimates; and (5) product life / business retention. Any differences in actual results from the estimates could result in fair values different from the estimated fair values, which could materially affect our future results of operations and financial condition. We believe the projections of anticipated future cash flows and fair value assumptions are reasonable; however, changes in assumptions underlying these estimates could affect our valuations.
Goodwill and Indefinite-lived Intangible Asset Impairment Testing
We review goodwill for impairment annually, or more frequently if events or changes in circumstances indicate goodwill might be impaired. We perform impairment assessments at the reporting unit level. If the fair value of the reporting unit is greater than its carrying amount, goodwill is not considered to be impaired and the second step is not required. However, if the fair value of the reporting unit is less than its carrying amount, the second step is performed to measure the amount of the impairment, if any. The second step requires a reporting unit to compare its implied fair value of goodwill to its carrying amount. If the carrying amount of goodwill exceeds its implied fair value, the reporting unit would recognize an impairment loss for the excess. Assumptions used in the discounted cash flow analysis that have the most significant effect on the estimated fair value of the Company's reporting units are the weighted average cost of capital and revenue growth-rates.
The Company has nine reporting units that have goodwill as of December 31, 2016. The following table categorizes the Company’s goodwill by reporting unit as of October 1, 2016 according to the level of excess between the reporting unit’s fair value and carrying value:
Fair Value Exceeds Carrying Value | Goodwill | |||||
Reporting Units 1-3 | < 10% | $ | 214 | |||
Reporting Units 4-9 | > 10% | 459 | ||||
$ | 673 | |||||
We perform an annual impairment analysis of our trademarks and brand names annually, or more frequently if events or changes in circumstances indicate the assets might be impaired. We perform a quantitative assessment of estimating fair values based upon the prospective stream of hypothetical after-tax royalty cost savings discounted at rates that reflect the rates of return appropriate for these intangible assets. The primary, and most sensitive, input utilized in determining the fair values of trademarks and brand names is branded product sales. The Company performed a sensitivity analysis on its trademarks and brand names and determined a one percentage point decrease in its projected future sales growth rates within each aftermarket product line would not result in additional impairment charges.
Income Taxes
Deferred tax assets and liabilities reflect temporary differences between the amount of assets and liabilities for financial and tax reporting purposes. Such amounts are adjusted, as appropriate, to reflect changes in tax rates expected to be in effect when the temporary differences reverse. A valuation allowance is recorded to reduce our deferred tax assets to the amount that is more likely than not to be realized. Changes in tax laws or accounting standards and methods may affect recorded deferred taxes in future periods.
When establishing a valuation allowance, we consider future sources of taxable income such as “future reversals of existing taxable temporary differences, future taxable income exclusive of reversing temporary differences and carryforwards” and “tax planning strategies.” A tax planning strategy is defined as “an action that: is prudent and feasible; an enterprise ordinarily might not take, but would take to prevent an operating loss or tax credit carryforward from expiring unused; and would result in realization of deferred tax assets.” In the event we determine it is more likely than not the deferred tax assets will not be realized in the future, the valuation adjustment to the deferred tax assets will be charged to earnings in the period in which we make such a determination. The valuation of deferred tax assets requires judgment and accounting for the deferred tax effect of events that have been recorded in the financial statements or in tax returns and our future projected profitability. Changes in our estimates, due to unforeseen events or otherwise, could have a material effect on our financial condition and results of operations.
We calculate our current and deferred tax provision based on estimates and assumptions that could differ from the actual results reflected in income tax returns filed in subsequent years. Adjustments based on filed returns are recorded when identified. The amount of income taxes we pay is subject to ongoing audits by federal, state, and foreign tax authorities. Our estimate of the
35
potential outcome of any uncertain tax issue is subject to management’s assessment of relevant risks, facts, and circumstances existing at that time. We use a more-likely-than-not threshold for financial statement recognition and measurement of tax positions taken or expected to be taken in a tax return. We record a liability for the difference between the benefit recognized and measured and tax position taken or expected to be taken on our tax return. To the extent our assessment of such tax positions changes, the change in estimate is recorded in the period in which the determination is made. We report tax-related interest and penalties as a component of income tax expense. We do not believe there is a reasonable likelihood there will be a material change in the tax related balances or valuation allowance balances. However, due to the complexity of some of these uncertainties, the ultimate resolution may be materially different from the current estimate. Refer to Note 16, Income Taxes, to the Consolidated Financial Statements included herein for additional information.
Non-GAAP Measures:
Management utilizes Operational EBITDA as the key performance measure of segment profitability and uses the measure in its financial and operational decision making processes, for internal reporting, and for planning and forecasting purposes to effectively allocate resources. Operational EBIDTA is defined as EBITDA (earnings before interest, taxes, depreciation, and amortization), as adjusted for additional amounts. Examples of these adjustments include impairment charges related to goodwill, other long-lived assets, and investments; restructuring charges; certain gains or losses on the settlement/extinguishment of obligations; and receivable financing charges. During 2015, we modified our definition of Operational EBITDA to adjust for financing charges related to certain receivable financing programs. Comparable periods have been adjusted to conform to this definition.
Operational EBITDA presents a performance measure exclusive of capital structure and the method by which net assets were acquired, disposed of, or financed. Management believes this measure provides additional transparency into its core operations and is most reflective of the operational profitability or loss of our operating segments and reporting units. The measure also allows management and investors to view operating trends, perform analytical comparisons and benchmark performance between periods and among operating segments.
Operational EBITDA should not be considered a substitute for results prepared in accordance with U.S. GAAP and should not be considered an alternative to net income, which is the most directly comparable financial measure to Operational EBITDA that is in accordance with U.S. GAAP. Operational EBITDA, as determined and measured by us, should not be compared to similarly titled measures reported by other companies.
36
RESULTS OF OPERATIONS
The following discussion of our results of operations should be read in connection with Items 1, 3 and 7A of this Form 10-K, as well as “Forward-Looking Statements” and Item 1.A. “Risk Factors.” These items provide additional relevant information regarding the business, our strategy, and the various industry dynamics in the OE market and the aftermarket which have a direct and significant effect on our results of operations, as well as the risks associated with our business.
Consolidated Results:
Year Ended December 31 | Favorable/(Unfavorable) | |||||||||||||||||||
2016 | 2015 | 2014 | 2016 v 2015 | 2015 v 2014 | ||||||||||||||||
(in millions) | ||||||||||||||||||||
Consolidated Statement of Operations Data | ||||||||||||||||||||
Net sales | $ | 7,434 | $ | 7,419 | $ | 7,317 | $ | 15 | $ | 102 | ||||||||||
Cost of products sold | (6,301 | ) | (6,345 | ) | (6,260 | ) | 44 | (85 | ) | |||||||||||
Gross profit | 1,133 | 1,074 | 1,057 | 59 | 17 | |||||||||||||||
Selling, general and administrative expenses | (815 | ) | (794 | ) | (776 | ) | (21 | ) | (18 | ) | ||||||||||
Goodwill and intangible impairment expense, net | (6 | ) | (94 | ) | (120 | ) | 88 | 26 | ||||||||||||
Restructuring charges and asset impairments, net | (44 | ) | (121 | ) | (110 | ) | 77 | (11 | ) | |||||||||||
Amortization expense | (58 | ) | (59 | ) | (49 | ) | 1 | (10 | ) | |||||||||||
Other income (expense), net | 21 | (5 | ) | (11 | ) | 26 | 6 | |||||||||||||
Interest expense, net | (145 | ) | (138 | ) | (120 | ) | (7 | ) | (18 | ) | ||||||||||
Loss on debt extinguishment | — | — | (24 | ) | — | — | ||||||||||||||
Equity earnings of nonconsolidated affiliates, net of tax | 59 | 56 | 48 | 3 | 8 | |||||||||||||||
Income tax (expense) benefit | (55 | ) | (30 | ) | (56 | ) | (25 | ) | 26 | |||||||||||
Net income (loss) from continuing operations | 90 | (111 | ) | (161 | ) | 201 | 26 | |||||||||||||
Gain (loss) from discontinued operations, net of tax | — | 7 | — | (7 | ) | 7 | ||||||||||||||
Net income (loss) | 90 | (104 | ) | (161 | ) | 194 | 57 | |||||||||||||
Less net income attributable to noncontrolling interests | (8 | ) | (6 | ) | (7 | ) | (2 | ) | 1 | |||||||||||
Net income (loss) attributable to Federal-Mogul | $ | 82 | $ | (110 | ) | $ | (168 | ) | $ | 192 | $ | 58 | ||||||||
Comparison of Year Ended December 31, 2016 to Year Ended December 31, 2015
Sales:
Consolidated net sales increased by $15 million compared to the year ended December 31, 2015. The increase was primarily driven by a 1.9% increase in sales volumes of $143 million (which included a $91 million benefit from acquisitions) and was substantially offset by a $107 million unfavorable effect of foreign currency exchange.
Cost of Products Sold:
Cost of products sold decreased by $44 million compared to the year ended December 31, 2015. The decrease was primarily driven by $99 million of savings from net performance and a $92 million favorable effect of foreign currency exchange. This was partially offset by the $147 million in incremental costs related to higher sales volumes attributable to organic growth and acquisitions.
Gross Profit:
Gross profit as a percentage of sales for the year ended December 31, 2016 was 15.2% compared to 14.5% for the year ended December 31, 2015. Gross profit increased by $59 million compared to the year ended December 31, 2015. The increase was primarily driven by a $78 million favorable effect of performance, offset by a $15 million negative effect of foreign currency exchange.
Selling, General and Administrative Expense:
Selling, general and administrative expenses (“SG&A”) as a percentage of sales, was 11.0% for the year ended December 31, 2016 as compared to 10.7% for the year ended December 31, 2015. This increase of $21 million is primarily attributable to an increase in marketing expenses of $9 million, an additional $4 million from acquisitions, and higher compensation, including pension costs, which were partially offset by favorable effects of prior year bad debt charges of $8 million and foreign
37
exchange of $8 million. SG&A includes R&D costs, including product and validation costs of $192 million and $189 million for the years ended December 31, 2016 and December 31, 2015.
Goodwill and intangible impairment expense, net:
Goodwill impairment charges decreased by $88 million for the year ended December 31, 2016. In 2016, an additional impairment charge of $6 million was recorded as a result of finalizing our 2015 year-end step two goodwill impairment test during the year ended December 31, 2016 for one reporting unit. In 2015, an impairment charge of $56 million was recorded as a result of an analysis of interim impairment indicators in one reporting unit and an impairment charge of $38 million in three reporting units as a result of the annual impairment analysis. These charges were was partially offset by a $6 million reduction to a previously recognized impairment charge as a result of the completion of our 2014 year-end step two goodwill analysis during the year ended December 31, 2015.
Restructuring charges and asset impairments, net:
Restructuring charges and asset impairments, net decreased by $77 million for the year ended December 31, 2016 compared to the year ended December 31, 2015. The decreases are related to higher severance and other charges in the year ended December 31, 2015, primarily related to our restructuring efforts in EMEA and ROW aimed at optimizing our cost structure.
Amortization Expense:
Amortization expense decreased by $1 million for the year ended December 31, 2016 compared to the year ended December 31, 2015.
Other income (expense), net:
Other income (expense), net increased by $26 million for the year ended December 31, 2016 as compared to the year ended December 31, 2015. The primary reason for the net increase is the recognition of an $7 million net gain on the sale of assets, as compared to $4 million for the year ended December 31, 2015. In addition, we recognized a loss on disposition of an equity method investment of $11 million and segmentation costs of $4 million during the year ended December 31, 2015.
Interest expense, net:
Net interest expense increased $7 million for the year ended December 31, 2016. This increase is primarily attributable to higher borrowings and interest rates under our credit facilities.
Equity earnings of nonconsolidated affiliates:
Equity in earnings of nonconsolidated affiliates increased by $3 million for the year ended December 31, 2016 compared to the year ended December 31, 2015. The increase was primarily driven by the full year effect of one of our China joint ventures included in the results for the year ended December 31, 2016.
Income tax (expense) benefit:
For the year ended December 31, 2016, we recorded income tax expense of $55 million on income from continuing operations before income taxes of $145 million, compared to income tax expense of $30 million on a loss from continuing operations before income taxes of $81 million for the year ended December 31, 2015.
Gain (loss) from discontinued operations, net of tax:
Gain (loss) from discontinued operations decreased by $7 million for the year ended December 31, 2016 compared to the year ended December 31, 2015. During 2015, we recognized a $7 million adjustment (no income tax effect) to a prior year divestiture.
38
Comparison of Year Ended December 31, 2015 to Year Ended December 31, 2014
Sales:
Consolidated net sales increased by $102 million compared to the year ended December 31, 2014. The increase was primarily driven by a 10.2% increase in sales volumes of $743 million (which included a $657 million benefit from acquisitions) and was substantially offset by a $642 million unfavorable effect of foreign currency exchange.
Cost of Products Sold:
Cost of products sold increased by $85 million compared to the year ended December 31, 2014. The increase was driven by a $645 million in incremental costs related to higher sales volumes attributable to acquisitions, and partly to volumes related to organic growth. This was substantially offset by the $529 million favorable effect of foreign currency exchange.
Gross Profit:
Gross profit as a percentage of sales for the year ended December 31, 2015 was 14.5% compared to 14.4% for the year ended December 31, 2014. Gross profit increased by $17 million compared to the year ended December 31, 2014. The increase was primarily driven by the favorable effects of higher sales volumes (net of changes in mix) of $98 million and net performance of $32 million offset by the negative effects of foreign currency exchange of $113 million.
Selling, General and Administrative Expense:
Selling, general and administrative expenses (“SG&A”) as a percentage of sales was 10.7% for the year ended December 31, 2015 as compared to 10.6% for the year ended December 31, 2014. This increase of $18 million is primarily attributable to the addition of SG&A expenses associated with acquisitions, partially offset by foreign exchange. Included in SG&A was a $7 million charge related to the bankruptcy of one of our aftermarket customers. Research and development (“R&D”) costs, including product and validation costs, of $189 million and $192 million for the years ended December 31, 2015 and December 31, 2014.
Goodwill and intangible impairment expense, net:
Goodwill impairment charges decreased by $26 million for the year ended December 31, 2015. During 2015, we impaired $50 million and $44 million of goodwill related to our Motorparts and Powertrain segments. During 2014, we impaired $120 million of goodwill related to our Motorparts segment.
Restructuring charges and asset impairments, net:
Net restructuring charges and asset impairments increased by $11 million for the year ended December 31, 2015 compared to the year ended December 31, 2014. This increase is driven by overall higher severance and other charges incurred in the year ended December 31, 2015, primarily related to our overall restructuring efforts in Europe, and an impairment of assets held for sale during 2015.
Amortization expense:
Amortization expense increased by $10 million for the year ended December 31, 2015 compared to the year ended December 31, 2014. During 2015, we completed the acquisition of TRW’s valvetrain business thereby adding $107 million of definite lived intangible assets which contributed to the increase in amortization expense.
Other Income (Expense), Net:
Other income (expense), net decreased by $6 million for the year ended December 31, 2015 compared to the year ended December 31, 2014. The primary reason for the decrease was a $6 million reduction in the amount of segmentation costs recognized during the year ended December 31, 2015.
Interest Expense, Net:
Net interest expense increased by $18 million in the year ended December 31, 2015 compared to the year ended December 31, 2014. This increase is primarily attributable to the realization of higher interest rates for the full year, and increased borrowings under our revolving credit facilities, offset by lower amortization costs.
Loss on Debt extinguishment:
Loss on debt extinguishment decreased by $24 million for the year ended December 31, 2014 as compared to the year ended December 31, 2014. In 2014, we entered into new U.S. credit facilities and repaid our existing outstanding indebtedness under previous facilities, resulting in a loss on the retirement of debt of $24 million, including the write-off of a portion of related debt issuance costs and debt discount.
39
Equity earnings of nonconsolidated affiliates:
Equity in earnings of nonconsolidated affiliates increased by $8 million for the year ended December 31, 2015 compared to the year ended December 31, 2014. The increase was primarily driven by increased earnings at a number of our nonconsolidated affiliates, including an initial investment in two new affiliates and the sale of a nonconsolidated affiliate, which incurred a loss of $1 million during the year ended December 31, 2014.
Income tax (expense) / benefit:
For the year ended December 31, 2015, we recorded an income tax expense of $30 million on a loss from continuing operations before income taxes of $81 million, compared to income tax expense of $56 million on a loss from continuing operations before income taxes of $105 million for the year ended December 31, 2014.
Gain (loss) from discontinued operation, net of tax:
Gain (loss) from discontinued operations increased by $7 million for the year ended December 31, 2015 compared to the year ended December 31, 2014. During 2015, we recognized a $7 million adjustment (no income tax effect) to a prior year divestiture.
40
SEGMENT RESULTS OF OPERATIONS
Comparison of Year Ended December 31, 2016 to Year Ended December 31, 2015
2016 Sales Analysis:
Sales by Region: | Volume Increase (Decrease) by Region: | |||||||||||||||||||||||
Excluding Acquisitions | Including Acquisitions | |||||||||||||||||||||||
Powertrain | % | Motorparts | % | Powertrain | Motorparts | Powertrain | Motorparts | |||||||||||||||||
(in millions) | (in millions) | |||||||||||||||||||||||
North America | $ | 1,584 | 35 | % | $ | 1,787 | 56 | % | 3 | (51 | ) | 47 | (35 | ) | ||||||||||
EMEA | 1,997 | 45 | % | 1,154 | 36 | % | 11 | (11 | ) | 32 | (11 | ) | ||||||||||||
ROW | 882 | 20 | % | 274 | 8 | % | 75 | 25 | 84 | 26 | ||||||||||||||
$ | 4,463 | 100 | % | $ | 3,215 | 100 | % | 89 | (37 | ) | 163 | (20 | ) | |||||||||||
Powertrain | Motorparts | Inter-segment Elimination | Total Reporting Segment | |||||||||||||
(in millions) | ||||||||||||||||
2015 Sales | $ | 4,450 | $ | 3,253 | $ | (284 | ) | $ | 7,419 | |||||||
External sales volumes | 89 | (37 | ) | — | 52 | |||||||||||
Inter-segment sales volumes | (41 | ) | 1 | 40 | — | |||||||||||
Acquisitions | 74 | 17 | — | 91 | ||||||||||||
Other | (52 | ) | 31 | — | (21 | ) | ||||||||||
Foreign currency | (57 | ) | (50 | ) | — | (107 | ) | |||||||||
2016 Sales | $ | 4,463 | $ | 3,215 | $ | (244 | ) | $ | 7,434 | |||||||
Other: Primarily represents commercial actions and customer pricing.
2016 Cost of Products Sold Analysis:
Powertrain | Motorparts | Inter-segment Elimination | Total Reporting Segment | |||||||||||||
(in millions) | ||||||||||||||||
2015 Cost of Products Sold | $ | (3,913 | ) | $ | (2,716 | ) | $ | 284 | $ | (6,345 | ) | |||||
Sales volumes / mix | (115 | ) | 8 | (40 | ) | (147 | ) | |||||||||
Performance | 40 | 59 | — | 99 | ||||||||||||
Foreign currency | 59 | 33 | — | 92 | ||||||||||||
2016 Cost of Products Sold | $ | (3,929 | ) | $ | (2,616 | ) | $ | 244 | $ | (6,301 | ) | |||||
Sales Volumes: The increase is primarily due to the increase in sales in our Powertrain segment.
Performance: Performance includes the benefit of favorable material and service sourcing, and productivity.
41
2016 Gross Profit Analysis:
Powertrain | Motorparts | Inter-segment Elimination | Total Reporting Segment | |||||||||||||
(in millions) | ||||||||||||||||
2015 Gross Profit | $ | 537 | $ | 537 | $ | — | $ | 1,074 | ||||||||
Sales volumes/mix | 7 | (11 | ) | — | (4 | ) | ||||||||||
Performance and other | (12 | ) | 90 | — | 78 | |||||||||||
Foreign currency | 2 | (17 | ) | — | (15 | ) | ||||||||||
2016 Gross Profit | $ | 534 | $ | 599 | $ | — | $ | 1,133 | ||||||||
2016 Operational EBITDA Analysis:
Powertrain | Motorparts | Inter-segment Elimination | Total Reporting Segment | |||||||||||||
(in millions) | ||||||||||||||||
2015 Operational EBITDA(a) | $ | 428 | $ | 216 | $ | — | $ | 644 | ||||||||
Sales volumes / mix | 11 | (13 | ) | — | (2 | ) | ||||||||||
Performance | 18 | 94 | — | 112 | ||||||||||||
Equity earnings in nonconsolidated affiliates | 5 | — | — | 5 | ||||||||||||
Other costs(b) | 13 | (16 | ) | — | (3 | ) | ||||||||||
Foreign currency | (2 | ) | (10 | ) | — | (12 | ) | |||||||||
2016 Operational EBITDA (a) | $ | 473 | $ | 271 | $ | — | $ | 744 | ||||||||
(a) Refer to “Non-GAAP Measures” in the Critical Accounting Estimates section. | ||||||||||||||||
(b) Other costs include pension costs, bad debt expense, gain (loss) on sale of assets, and other compensation related costs. | ||||||||||||||||
42
Comparison of Year Ended December 31, 2015 to Year Ended December 31, 2014
2015 Sales Analysis:
Sales by Region: | Volume Increase (Decrease) by Region: | ||||||||||||||||||||||||
Excluding Acquisitions | Including Acquisitions | ||||||||||||||||||||||||
Powertrain | % | Motorparts | % | Powertrain | Motorparts | Powertrain | Motorparts | ||||||||||||||||||
(in millions) | (in millions) | ||||||||||||||||||||||||
North America | $ | 1,562 | 35 | % | $ | 1,815 | 56 | % | 13 | 30 | 145 | 71 | |||||||||||||
EMEA | 2,059 | 46 | % | 1,195 | 37 | % | 36 | (18 | ) | 279 | 152 | ||||||||||||||
ROW | 829 | 19 | % | 243 | 7 | % | 4 | 21 | 46 | 50 | |||||||||||||||
$ | 4,450 | 100 | % | $ | 3,253 | 100 | % | 53 | 33 | 470 | 273 | ||||||||||||||
Powertrain | Motorparts | Inter-segment Elimination | Total Reporting Segment | |||||||||||||
(in millions) | ||||||||||||||||
2014 Sales | $ | 4,430 | $ | 3,192 | $ | (305 | ) | $ | 7,317 | |||||||
External sales volumes | 53 | 33 | — | 86 | ||||||||||||
Inter-segment sales volumes | (15 | ) | (6 | ) | 21 | — | ||||||||||
Acquisitions | 417 | 240 | — | 657 | ||||||||||||
Other | (28 | ) | 29 | — | 1 | |||||||||||
Foreign currency | (407 | ) | (235 | ) | — | (642 | ) | |||||||||
2015 Sales | $ | 4,450 | $ | 3,253 | $ | (284 | ) | $ | 7,419 | |||||||
Other: Primarily represents commercial actions and customer pricing.
2015 Cost of Products Sold Analysis:
Powertrain | Motorparts | Inter-segment Elimination | Total Reporting Segment | |||||||||||||
(in millions) | ||||||||||||||||
2014 Cost of Products Sold | $ | (3,897 | ) | $ | (2,668 | ) | $ | 305 | $ | (6,260 | ) | |||||
Sales volumes / mix | (407 | ) | (217 | ) | (21 | ) | (645 | ) | ||||||||
Performance | 41 | (10 | ) | — | 31 | |||||||||||
Foreign currency | 350 | 179 | — | 529 | ||||||||||||
2015 Cost of Products Sold | $ | (3,913 | ) | $ | (2,716 | ) | $ | 284 | $ | (6,345 | ) | |||||
Sales Volumes: The increase is primarily due to the increase in sales attributable to acquisitions.
Performance: Performance includes costs to implement strategic initiatives, materials and service sourcing, and productivity. The Motorparts segment includes costs related to the realignment of our North American distribution network.
43
2015 Gross Profit Analysis:
Powertrain | Motorparts | Inter-segment Elimination | Total Reporting Segment | |||||||||||||
(in millions) | ||||||||||||||||
2014 Gross Profit | $ | 533 | $ | 524 | $ | — | $ | 1,057 | ||||||||
Sales volumes / mix | 48 | 50 | — | 98 | ||||||||||||
Performance and other | 13 | 19 | — | 32 | ||||||||||||
Foreign currency | (57 | ) | (56 | ) | — | (113 | ) | |||||||||
2015 Gross Profit | $ | 537 | $ | 537 | $ | — | $ | 1,074 | ||||||||
2015 Operational EBITDA Analysis:
Powertrain | Motorparts | Inter-segment Elimination | Total Reporting Segment | |||||||||||||
(in millions) | ||||||||||||||||
2014 Operational EBITDA(a) | $ | 431 | $ | 199 | $ | — | $ | 630 | ||||||||
Sales volumes / mix | 50 | 32 | — | 82 | ||||||||||||
Performance | (6 | ) | 12 | — | 6 | |||||||||||
Equity earnings of non-consolidated affiliates | 12 | (1 | ) | — | 11 | |||||||||||
Other costs(b) | (1 | ) | — | — | (1 | ) | ||||||||||
Foreign currency | (58 | ) | (26 | ) | — | (84 | ) | |||||||||
2015 Operational EBITDA(a) | $ | 428 | $ | 216 | $ | — | $ | 644 | ||||||||
(a) Refer to “Non-GAAP Measures” in the Critical Accounting Estimates section. | ||||||||||||||||
(b) Other costs include pension costs, bad debt expense, gain (loss) on sale of assets, and other compensation related costs. | ||||||||||||||||
44
Reconciliation of Operational EBITDA to Net Income (loss):
Year ended December 31, | ||||||||
2016 | 2015 | |||||||
(in millions) | ||||||||
Powertrain | $ | 473 | $ | 428 | ||||
Motorparts | 271 | 216 | ||||||
Total Operational EBITDA | $ | 744 | $ | 644 | ||||
Items required to reconcile Operational EBITDA to EBITDA: | ||||||||
Restructuring charges and asset impairments (a) | $ | (44 | ) | $ | (121 | ) | ||
Goodwill and intangible impairment expense, net | (6 | ) | (94 | ) | ||||
Loss on sale of equity method investment | — | (11 | ) | |||||
Financing charges | (12 | ) | (9 | ) | ||||
Discontinued operations | — | 7 | ||||||
Acquisition related costs | (5 | ) | (6 | ) | ||||
Segmentation costs | — | (4 | ) | |||||
Other (b) | (12 | ) | (1 | ) | ||||
EBITDA | $ | 665 | $ | 405 | ||||
Items required to reconcile EBITDA to net income (loss): | ||||||||
Depreciation and amortization | $ | (375 | ) | $ | (341 | ) | ||
Interest expense, net | (145 | ) | (138 | ) | ||||
Income tax (expense) benefit | (55 | ) | (30 | ) | ||||
Net income (loss) | $ | 90 | $ | (104 | ) | |||
Footnotes: | 2016 | 2015 | ||||||
(a) Restructuring charges and asset impairments, net: | (in millions) | |||||||
Restructuring charges related to severance and other charges, net | $ | (27 | ) | $ | (89 | ) | ||
Asset impairments, including impairments related to restructuring activities | (17 | ) | (32 | ) | ||||
Total Restructuring charges | $ | (44 | ) | $ | (121 | ) | ||
(b) Other reconciling items: | ||||||||
Non-service cost components associated with U.S. based funded pension plans | $ | (13 | ) | $ | 1 | |||
Stock appreciation rights | — | 1 | ||||||
Other | 1 | (3 | ) | |||||
$ | (12 | ) | $ | (1 | ) | |||
45
Liquidity and Capital Resources
Operating Activities
As summarized in the table below, net cash provided from (used by) operating activities for the years ended December 31, 2016, 2015 and 2014:
Years Ended December 31 | ||||||||||||
2016 | 2015 | 2014 | ||||||||||
(in millions) | ||||||||||||
Operational cash flow before changes in operating assets and liabilities | $ | 417 | $ | 264 | $ | 296 | ||||||
Changes in operating assets and liabilities: | ||||||||||||
Accounts receivable, net | 111 | (10 | ) | (47 | ) | |||||||
Inventories, net | 5 | (172 | ) | (84 | ) | |||||||
Accounts payable | 7 | 18 | 72 | |||||||||
Other assets and liabilities | 6 | (62 | ) | 41 | ||||||||
Total change in operating assets and liabilities | 129 | (226 | ) | (18 | ) | |||||||
Net cash provided from (used by) operating activities | $ | 546 | $ | 38 | $ | 278 | ||||||
Cash provided by operations for the year ended December 31, 2016 increased by $508 million compared to the year ended December 31, 2015. The increase was primarily the result of:
• | an increase of $84 million in factored receivables activity, qualifying as sales, in the year ended December 31, 2016 versus the year ended December 31, 2015; |
• | an increase in cash dividends from our nonconsolidated affiliates of $66 million; |
• | a reduction of $37 million in cash contributions to our pension plans; |
• | normalized working capital requirements as compared to the prior year when additional working capital was required to support the acquisition of the TRW valvetrain business in the Powertrain segment; and |
• | a reduction in inventory in the year ended December 31, 2016 versus a build of inventory in the year ended December 31, 2015 driven by the integration of acquisitions and the additional investment related to the realignment of our North American distribution network during the prior period in the Motorparts segment. |
Cash provided by operations for the year ended December 31, 2015 decreased by $240 million compared to the year ended December 31, 2014. The decrease was primarily the result of:
• | higher inventory levels required to support the realignment of the aftermarket distribution footprint; |
• | higher cash interest payments of $22 million; |
• | lower cash dividends from nonconsolidated affiliates of $14 million; and |
• | a net increase in payments related to other operating expenses offset by the slight benefit of higher margins and performance improvements. |
46
Investing Activities
As summarized in the table below, net cash provided from (used by) investing activities for the years ended December 31, 2016, 2015, and 2014:
Years Ended December 31 | ||||||||||||
2016 | 2015 | 2014 | ||||||||||
(in millions) | ||||||||||||
Expenditures for property, plant, and equipment | $ | (381 | ) | $ | (440 | ) | $ | (418 | ) | |||
Payments to acquire businesses, net of cash acquired | (31 | ) | (360 | ) | (321 | ) | ||||||
Capital investment in consolidated subsidiary from noncontrolling interest partner | 5 | — | — | |||||||||
Transfer of cash balances upon dispositions of operations held for sale | (12 | ) | — | — | ||||||||
Net proceeds associated with business dispositions | — | 15 | — | |||||||||
Net proceeds from sales of property, plant, and equipment | 18 | 12 | 4 | |||||||||
Net proceeds from sale of shares in consolidated subsidiary | 2 | — | — | |||||||||
Capital investment in nonconsolidated affiliate | (1 | ) | (14 | ) | — | |||||||
Net cash provided from (used by) investing activities | $ | (400 | ) | $ | (787 | ) | $ | (735 | ) | |||
Capital expenditures were $381 million, $440 million, and $418 million for the years ended December 31, 2016, 2015, and 2014. These capital expenditures were primarily related to investing in new facilities, upgrading existing products, continuing new product launches, and infrastructure and equipment at our facilities to support our manufacturing, distribution, and cost reduction efforts. We expect to spend between $400 million and $440 million on capital expenditures during 2017, depending on timing of expenditures, as we continue to invest in our strategic priorities and growth. During the year ended December 31, 2016, we completed three acquisitions resulting in cash outflow of $31 million, primarily attributable to the filters manufacturing business in Mexico and the acquisition of Beck Arnley. In addition, we sold a disposal group that was classified as operations held for sale at December 31, 2015 resulting in a cash outflow of $12 million.
The year ended December 31, 2015 included a payment of $360 million, net of acquired cash, to acquire certain assets of the TRW valvetrain business and proceeds from the sale of an equity method investment of $15 million.
The year ended December 31, 2014 included payments of $321 million to acquire businesses, net of acquired cash, and exclusive of $9 million in contingent consideration included in financing activities.
Financing Activities
Cash flow provided from (used by) financing activities for the years ended December 31, 2016, 2015, and 2014:
Years Ended December 31 | ||||||||||||
2016 | 2015 | 2014 | ||||||||||
(in millions) | ||||||||||||
Proceeds from term loans, net of original issue discount | $ | 86 | $ | — | $ | 2,589 | ||||||
Principal payments on term loans | (115 | ) | (28 | ) | (2,544 | ) | ||||||
Proceeds from draws on revolving lines of credit | 430 | 663 | — | |||||||||
Payments on revolving lines of credit | (419 | ) | (306 | ) | — | |||||||
Debt issuance costs | — | — | (12 | ) | ||||||||
Increase in other long-term debt | — | 51 | 12 | |||||||||
Increase (decrease) in short-term debt | (2 | ) | (3 | ) | — | |||||||
Contingent consideration to acquire business | — | — | (9 | ) | ||||||||
Proceeds from equity rights offering, net of related fees | — | 250 | — | |||||||||
Net proceeds (remittances) on servicing of factoring arrangements | — | — | (1 | ) | ||||||||
Net cash provided from (used by) financing activities | $ | (20 | ) | $ | 627 | $ | 35 | |||||
For the year ended December 31, 2016, cash used by financing activities was $20 million. This included net repayments under the term loans of $29 million and net borrowings under revolving lines of credit of $11 million.
47
For the year ended December 31, 2015, cash flow provided by financing activities was $627 million. This included $357 million of net borrowings on revolving lines of credit primarily for the acquisition of the TRW valvetrain business. In addition, it included a $250 million cash inflow associated with a common stock rights offering in which approximately 19 million shares of our common stock were issued in March 2015.
For the year ended December 31, 2015, cash flow provided by financing activities was $35 million. This included contingent consideration related to acquisitions, and activity related to the refinancing of our debt.
On April 15, 2014, we entered into a new tranche B term loan facility (the “New Tranche B Facility”) and a new tranche C term loan facility (the “New Tranche C Facility,” and together with the New Tranche B Facility, the “New Term Facilities”). Immediately following the closing of the New Term Facilities, we contributed all of the net proceeds from the New Facilities and repaid our existing outstanding indebtedness as a borrower under the tranche B and tranche C term loan facilities.
Liquidity
The following table summarizes our available liquidity:
Years Ended December 31 | ||||||||||||
2016 | 2015 | 2014 | ||||||||||
(in millions) | ||||||||||||
Cash and cash equivalents | $ | 300 | $ | 194 | $ | 332 | ||||||
Available under U.S. credit facilities | $ | 213 | $ | 170 | $ | 516 | ||||||
Our ability to maintain liquidity adequate to fund our needs depends generally on the results of our operations, spending on capital and restructuring initiatives, and the availability of financing. We believe that cash on hand, cash flow from operations, available borrowings under our credit facilities and ability to secure additional borrowings will be sufficient to fund capital expenditures and meet our operating obligations through the end of 2017. In the longer term, we believe that our base operating potential, supplemented by the benefits from our announced restructuring programs, will provide adequate long-term cash flows. However, there can be no assurance that such initiatives are achievable in this regard.
In addition to the amounts detailed in the table above, we have additional availability under foreign lines of credit of $60 million and $59 million as of December 31, 2016 and 2015.
Off Balance Sheet Arrangements
We do not have any material off-balance sheet arrangements, other than those described below.
Contractual Obligations and Commercial Commitments
We have the following contractual obligations and commercial commitments outstanding at December 31, 2016:
2017 | 2018 | 2019 | 2020 | 2021 | Thereafter | Total | ||||||||||||||||||||||
(in millions) | ||||||||||||||||||||||||||||
Debt obligations | $ | 142 | $ | 1,050 | $ | 27 | $ | 25 | $ | 1,788 | $ | 6 | $ | 3,038 | ||||||||||||||
Interest payments | 140 | 135 | 99 | 99 | 99 | 11 | 583 | |||||||||||||||||||||
U.S. letters of credit | — | 37 | — | — | — | — | 37 | |||||||||||||||||||||
Pension and other postretirement benefit plans | 98 | 79 | 78 | 80 | 74 | 298 | 707 | |||||||||||||||||||||
Operating leases | 65 | 55 | 47 | 41 | 36 | 60 | 304 | |||||||||||||||||||||
Total | $ | 445 | $ | 1,356 | $ | 251 | $ | 245 | $ | 1,997 | $ | 375 | $ | 4,669 | ||||||||||||||
Accounts Receivable Factoring
We have subsidiaries in Brazil, Canada, France, Germany, Italy, and the U.S. which are party to accounts receivable factoring and securitization facilities. Amounts factored under these facilities consist of the following:
48
As of December 31 | ||||||||
2016 | 2015 | |||||||
(in millions) | ||||||||
Gross accounts receivable factored | $ | 487 | $ | 408 | ||||
Gross accounts receivable factored, qualifying as sales | $ | 485 | $ | 401 | ||||
Undrawn cash on factored accounts receivable | $ | — | $ | 1 | ||||
Proceeds from the factoring of accounts receivable qualifying as sales and expenses associated with the factoring of accounts receivable are as follows:
Year Ended December 31 | ||||||||||||
2016 | 2015 | 2014 | ||||||||||
(in millions) | ||||||||||||
Proceeds from factoring qualifying as sales | $ | 1,616 | $ | 1,550 | $ | 1,679 | ||||||
Losses on sales of account receivables | $ | (12 | ) | $ | (9 | ) | $ | (6 | ) | |||
Accounts receivables factored but not qualifying as a sale were pledged as collateral and accounted for as secured borrowings and recorded in the consolidated balance sheets within “Accounts receivable, net” and “Short-term debt, including the current portion of long-term debt.”
The financing charges on sales of accounts receivable are recorded in the consolidated statements of operations within "Other income (expense), net". Where we receive a fee to service and monitor these transferred receivables, such fees are sufficient to offset the costs and as such, a servicing asset or liability is not recorded as a result of such activities.
49
ITEM 7A. QUANTITATIVE AND QUALITATIVE DISCLOSURES ABOUT MARKET RISK
We are exposed to certain global market risks, including foreign currency exchange risk, commodity price risk, and interest rate risk associated with our debt.
Direct responsibility for the execution of our market risk management strategies resides with our Treasurer’s Office and is governed by written policies and procedures. In accordance with our corporate risk management policies, we use derivative instruments, when available, such as forward contracts and options that economically hedge certain exposures (foreign currency and commodity). We do not enter into derivative transactions for speculative or trading purposes. A discussion of our accounting policies for derivative instruments is included in Note 2 of the Consolidated Financial Statements.
Foreign Currency Exchange Rate Risk - We have foreign currency exposures related to buying, selling, and financing in currencies other than the local currencies in which we operate. At December 31, 2016, our most significant foreign currency exposures were Brazilian real, British pound, Chinese yuan renminbi, euro, Indian rupee, Mexican peso, and Polish zloty. Historically, we have reduced our exposure through financial instruments (hedges) that provide offsets or limits to our exposures, which are opposite to the underlying transactions. We did not hold any foreign currency price hedge contracts at December 31, 2016 and December 31, 2015.
We are exposed to foreign currency risk due to the translation and remeasurement of the results of certain international operations into U.S. Dollars as part of the consolidation process. Fluctuations in foreign currency exchange rates can therefore create volatility in the results of operations and may adversely affect our financial condition.
The following table summarizes the amounts of foreign currency translation and transaction losses (in millions):
Years Ended December 31, | ||||||||
2016 | 2015 | |||||||
Translation gains (losses) recorded in accumulated other comprehensive income | $ | (145 | ) | $ | (237 | ) | ||
Transaction gains (losses) recorded in earnings | $ | 2 | $ | (3 | ) | |||
Commodity Price Risk - Commodity rate price forward contracts are executed to offset a portion of our exposure to the potential change in prices mainly for various non-ferrous metals used in the manufacturing of automotive components. The net fair value of our contracts was an asset of approximately $4 million and a net liability of approximately $3 million as of December 31, 2016 and 2015. At December 31, 2016, we performed a sensitivity analysis to assess the effects of a ten percent adverse change in commodity prices. Based upon the analysis performed, such changes would not be expected to materially affect our consolidated financial position, results of operations or cash flows.
Interest Rate Risk - Our exposure to market risk associated with changes in interest rates relate primarily to our debt obligations. At December 31, 2016 and 2015, we had approximately $3.0 billion and $3.1 billion of debt which primarily bear variable interest rates. At December 31, 2016 and 2015, we did not have any interest rate swap positions to manage interest rate exposures. Our term loans which represent approximately $2.5 billion of our debt at December 31, 2016, are not sensitive to changes in market interest rate because the market rate is below the interest rate floor within our credit agreement. Therefore, an adverse market change in interest rates of ten percent would have no effect on cash flows. Our revolving lines of credit also have variable market interest rates and the effect on cash flow from a ten percent adverse change in market rates would be de minimis.
Our remaining debt consists of foreign debt with primarily variable interest rates. An adverse market change in interest rates of ten percent would not materially affect our consolidated financial position, results of operations or cash flows.
50
ITEM 8. FINANCIAL STATEMENTS AND SUPPLEMENTARY DATA
REPORT OF INDEPENDENT REGISTERED PUBLIC ACCOUNTING FIRM
Board of Directors
Federal-Mogul Holdings LLC
We have audited the internal control over financial reporting of Federal-Mogul Holdings LLC (a Delaware company, fka Federal-Mogul Holdings Corporation) and subsidiaries (the “Company”) as of December 31, 2016, based on criteria established in the 2013 Internal Control-Integrated Framework issued by the Committee of Sponsoring Organizations of the Treadway Commission (COSO). The Company’s management is responsible for maintaining effective internal control over financial reporting and for its assessment of the effectiveness of internal control over financial reporting, included in the accompanying Management's Report on Internal Control over Financial Reporting. Our responsibility is to express an opinion on the Company’s internal control over financial reporting based on our audit.
We conducted our audit in accordance with the standards of the Public Company Accounting Oversight Board (United States). Those standards require that we plan and perform the audit to obtain reasonable assurance about whether effective internal control over financial reporting was maintained in all material respects. Our audit included obtaining an understanding of internal control over financial reporting, assessing the risk that a material weakness exists, testing and evaluating the design and operating effectiveness of internal control based on the assessed risk, and performing such other procedures as we considered necessary in the circumstances. We believe that our audit provides a reasonable basis for our opinion.
A company’s internal control over financial reporting is a process designed to provide reasonable assurance regarding the reliability of financial reporting and the preparation of financial statements for external purposes in accordance with generally accepted accounting principles. A company’s internal control over financial reporting includes those policies and procedures that (1) pertain to the maintenance of records that, in reasonable detail, accurately and fairly reflect the transactions and dispositions of the assets of the company; (2) provide reasonable assurance that transactions are recorded as necessary to permit preparation of financial statements in accordance with generally accepted accounting principles, and that receipts and expenditures of the company are being made only in accordance with authorizations of management and directors of the company; and (3) provide reasonable assurance regarding prevention or timely detection of unauthorized acquisition, use, or disposition of the company’s assets that could have a material effect on the financial statements.
Because of its inherent limitations, internal control over financial reporting may not prevent or detect misstatements. Also, projections of any evaluation of effectiveness to future periods are subject to the risk that controls may become inadequate because of changes in conditions, or that the degree of compliance with the policies or procedures may deteriorate.
In our opinion, the Company maintained, in all material respects, effective internal control over financial reporting as of December 31, 2016, based on criteria established in the 2013 Internal Control-Integrated Framework issued by COSO.
We also have audited, in accordance with the standards of the Public Company Accounting Oversight Board (United States), the consolidated financial statements of the Company as of and for the year ended December 31, 2016, and our report dated February 22, 2017 expressed an unqualified opinion on those financial statements.
/s/ GRANT THORNTON LLP
Southfield, Michigan
February 22, 2017
51
REPORT OF INDEPENDENT REGISTERED PUBLIC ACCOUNTING FIRM
Board of Directors
Federal-Mogul Holdings LLC
We have audited the accompanying consolidated balance sheets of Federal-Mogul Holdings LLC (a Delaware company, fka Federal-Mogul Holdings Corporation) and subsidiaries (the “Company”) as of December 31, 2016 and 2015, and the related consolidated statements of operations, comprehensive income(loss), changes in shareholders’ equity, and cash flows for each of the three years in the period ended December 31, 2016. Our audits of the basic consolidated financial statements included the financial statement schedule listed in the index appearing under Item 15(a)(2). These financial statements and financial statement schedule are the responsibility of the Company’s management. Our responsibility is to express an opinion on these financial statements and financial statement schedule based on our audits.
We conducted our audits in accordance with the standards of the Public Company Accounting Oversight Board (United States). Those standards require that we plan and perform the audit to obtain reasonable assurance about whether the financial statements are free of material misstatement. An audit includes examining, on a test basis, evidence supporting the amounts and disclosures in the financial statements. An audit also includes assessing the accounting principles used and significant estimates made by management, as well as evaluating the overall financial statement presentation. We believe that our audits provide a reasonable basis for our opinion.
In our opinion, the consolidated financial statements referred to above present fairly, in all material respects, the financial position of Federal-Mogul Holdings LLC and subsidiaries as of December 31, 2016 and 2015, and the results of their operations and their cash flows for each of the three years in the period ended December 31, 2016 in conformity with accounting principles generally accepted in the United States of America. Also in our opinion, the related financial statement schedule, when considered in relation to the basic consolidated financial statements taken as a whole, presents fairly, in all material respects, the information set forth therein.
We also have audited, in accordance with the standards of the Public Company Accounting Oversight Board (United States), the Company’s internal control over financial reporting as of December 31, 2016, based on criteria established in the 2013 Internal Control-Integrated Framework issued by the Committee of Sponsoring Organizations of the Treadway Commission (COSO), and our report dated February 22, 2017 expressed an unqualified opinion.
/s/ GRANT THORNTON LLP
Southfield, Michigan
February 22, 2017
52
FEDERAL-MOGUL HOLDINGS LLC
Consolidated Statements of Operations
(In millions, except per share amounts)
Year Ended December 31 | ||||||||||||
2016 | 2015 | 2014 | ||||||||||
Net sales | $ | 7,434 | $ | 7,419 | $ | 7,317 | ||||||
Cost of products sold | (6,301 | ) | (6,345 | ) | (6,260 | ) | ||||||
Gross profit | 1,133 | 1,074 | 1,057 | |||||||||
Selling, general and administrative expenses | (815 | ) | (794 | ) | (776 | ) | ||||||
Goodwill and intangible impairment expense, net (Note 11) | (6 | ) | (94 | ) | (120 | ) | ||||||
Restructuring charges and asset impairments, net (Note 3) | (44 | ) | (121 | ) | (110 | ) | ||||||
Amortization expense (Note 11) | (58 | ) | (59 | ) | (49 | ) | ||||||
Other income (expense), net (Note 4) | 21 | (5 | ) | (11 | ) | |||||||
Operating income (loss) | 231 | 1 | (9 | ) | ||||||||
Interest expense, net | (145 | ) | (138 | ) | (120 | ) | ||||||
Loss on debt extinguishment | — | — | (24 | ) | ||||||||
Equity earnings of nonconsolidated affiliates, net of tax (Note 12) | 59 | 56 | 48 | |||||||||
Income (loss) from continuing operations before income taxes | 145 | (81 | ) | (105 | ) | |||||||
Income tax (expense) benefit (Note 16) | (55 | ) | (30 | ) | (56 | ) | ||||||
Income (loss) from continuing operations | 90 | (111 | ) | (161 | ) | |||||||
Gain (loss) from discontinued operations, net of tax | — | 7 | — | |||||||||
Net income (loss) | 90 | (104 | ) | (161 | ) | |||||||
Less net income attributable to noncontrolling interests | (8 | ) | (6 | ) | (7 | ) | ||||||
Net income (loss) attributable to Federal-Mogul | $ | 82 | $ | (110 | ) | $ | (168 | ) | ||||
Amounts attributable to Federal-Mogul: | ||||||||||||
Net income (loss) from continuing operations | $ | 82 | $ | (117 | ) | $ | (168 | ) | ||||
Gain (loss) from discontinued operations, net of tax | — | 7 | — | |||||||||
Net income (loss) | $ | 82 | $ | (110 | ) | $ | (168 | ) | ||||
Net income (loss) per common share attributable to Federal-Mogul | ||||||||||||
Basic and diluted (Note 20): | ||||||||||||
Net income (loss) from continuing operations | $ | 0.49 | $ | (0.71 | ) | $ | (1.12 | ) | ||||
Gain (loss) from discontinued operations, net of tax | — | 0.04 | — | |||||||||
Net income (loss) | $ | 0.49 | $ | (0.67 | ) | $ | (1.12 | ) | ||||
See accompanying notes to Consolidated Financial Statements.
53
FEDERAL-MOGUL HOLDINGS LLC
Consolidated Statements of Comprehensive Income (Loss)
(In millions)
Year Ended December 31 | ||||||||||||
2016 | 2015 | 2014 | ||||||||||
Net income (loss) | $ | 90 | $ | (104 | ) | $ | (161 | ) | ||||
Other comprehensive income (loss), net of tax (Note 18) | ||||||||||||
Foreign currency translation adjustments | (145 | ) | (237 | ) | (248 | ) | ||||||
Cash flow hedging income (loss), net | 3 | — | (1 | ) | ||||||||
Pension and postretirement benefits | 30 | 56 | (282 | ) | ||||||||
Other comprehensive loss, net of tax | (112 | ) | (181 | ) | (531 | ) | ||||||
Comprehensive income (loss) | (22 | ) | (285 | ) | (692 | ) | ||||||
Comprehensive income (loss) attributable to noncontrolling interests | 10 | 1 | (8 | ) | ||||||||
Comprehensive income (loss) attributable to Federal-Mogul | $ | (32 | ) | $ | (286 | ) | $ | (684 | ) | |||
See accompanying notes to Consolidated Financial Statements.
54
FEDERAL-MOGUL HOLDINGS LLC
Consolidated Balance Sheets
(In millions, except per share amounts)
December 31 | ||||||||
2016 | 2015 | |||||||
ASSETS | ||||||||
Current assets: | ||||||||
Cash and equivalents | $ | 300 | $ | 194 | ||||
Accounts receivable, net | 1,238 | 1,374 | ||||||
Inventories, net (Note 9) | 1,321 | 1,342 | ||||||
Prepaid expenses and other current assets | 186 | 188 | ||||||
Total current assets | 3,045 | 3,098 | ||||||
Property, plant and equipment, net (Note 10) | 2,334 | 2,353 | ||||||
Goodwill and other indefinite-lived intangible assets (Note 11) | 901 | 903 | ||||||
Definite-lived intangible assets, net (Note 11) | 343 | 404 | ||||||
Investments in nonconsolidated affiliates (Note 12) | 270 | 296 | ||||||
Other noncurrent assets | 183 | 174 | ||||||
TOTAL ASSETS | $ | 7,076 | $ | 7,228 | ||||
LIABILITIES AND SHAREHOLDERS’ EQUITY | ||||||||
Current liabilities: | ||||||||
Short-term debt, including current portion of long-term debt (Note 13) | $ | 142 | $ | 138 | ||||
Accounts payable | 885 | 901 | ||||||
Accrued liabilities (Note 14) | 554 | 582 | ||||||
Current portion of pensions and other postretirement benefits liability (Note 15) | 37 | 40 | ||||||
Other current liabilities | 156 | 159 | ||||||
Total current liabilities | 1,774 | 1,820 | ||||||
Long-term debt (Note 13) | 2,883 | 2,914 | ||||||
Pensions and other postretirement benefits liability (Note 15) | 1,076 | 1,123 | ||||||
Long-term portion of deferred income taxes (Note 16) | 366 | 367 | ||||||
Other accrued liabilities | 97 | 102 | ||||||
Shareholders’ equity: | ||||||||
Preferred stock ($0.01 par value; 90,000,000 authorized shares; none issued) | — | — | ||||||
Common stock ($0.01 par value; 450,100,000 authorized shares; 170,636,151 issued shares and 169,040,651 outstanding shares as of December 31, 2016 and 2015. | 2 | 2 | ||||||
Additional paid-in capital | 2,899 | 2,899 | ||||||
Accumulated deficit | (714 | ) | (796 | ) | ||||
Accumulated other comprehensive loss | (1,432 | ) | (1,318 | ) | ||||
Treasury stock, at cost | (17 | ) | (17 | ) | ||||
Total Federal-Mogul shareholders’ equity | 738 | 770 | ||||||
Noncontrolling interests | 142 | 132 | ||||||
Total shareholders’ equity | 880 | 902 | ||||||
TOTAL LIABILITIES AND SHAREHOLDERS' EQUITY | $ | 7,076 | $ | 7,228 | ||||
See accompanying notes to Consolidated Financial Statements.
55
FEDERAL-MOGUL HOLDINGS LLC
Consolidated Statements of Cash Flows
(In millions)
Year Ended December 31 | ||||||||||||
2016 | 2015 | 2014 | ||||||||||
Cash Provided From (Used By) Operating Activities | ||||||||||||
Net income (loss) | $ | 90 | $ | (104 | ) | $ | (161 | ) | ||||
Adjustments to reconcile net income (loss) to net cash provided from (used by) operating activities: | ||||||||||||
Depreciation and amortization | 375 | 341 | 334 | |||||||||
Goodwill and intangible impairment expense, net | 6 | 94 | 120 | |||||||||
Restructuring charges and asset impairments, net | 44 | 121 | 110 | |||||||||
Payments against restructuring liabilities | (50 | ) | (58 | ) | (53 | ) | ||||||
Change in pension and postretirement benefits, excluding curtailment gains | (31 | ) | (68 | ) | (75 | ) | ||||||
Equity earnings of nonconsolidated affiliates | (59 | ) | (56 | ) | (48 | ) | ||||||
Cash dividends received from nonconsolidated affiliates | 77 | 11 | 25 | |||||||||
Loss on sale of equity method investment | — | 11 | — | |||||||||
Loss on debt extinguishment | — | — | 24 | |||||||||
Deferred tax expense (benefit) | (28 | ) | (17 | ) | 20 | |||||||
Operating cash flows from discontinued operations | — | (7 | ) | — | ||||||||
Gain from sales of property, plant and equipment | (7 | ) | (4 | ) | — | |||||||
Changes in operating assets and liabilities: | ||||||||||||
Accounts receivable, net | 111 | (10 | ) | (47 | ) | |||||||
Inventories, net | 5 | (172 | ) | (84 | ) | |||||||
Accounts payable | 7 | 18 | 72 | |||||||||
Other assets and liabilities | 6 | (62 | ) | 41 | ||||||||
Net cash provided from (used by) Operating Activities | 546 | 38 | 278 | |||||||||
Cash Provided From (Used By) Investing Activities | ||||||||||||
Expenditures for property, plant, and equipment | (381 | ) | (440 | ) | (418 | ) | ||||||
Payments to acquire businesses, net of cash acquired | (31 | ) | (360 | ) | (321 | ) | ||||||
Capital investment in consolidated subsidiary from noncontrolling interest partner | 5 | — | — | |||||||||
Transfer of cash balances upon dispositions of operations held for sale | (12 | ) | — | — | ||||||||
Net proceeds associated with business dispositions | — | 15 | — | |||||||||
Net proceeds from sales of property, plant, and equipment | 18 | 12 | 4 | |||||||||
Net proceeds from sale of shares in consolidated subsidiary | 2 | — | — | |||||||||
Capital investment in nonconsolidated affiliate | (1 | ) | (14 | ) | — | |||||||
Net cash provided from (used by) Investing Activities | (400 | ) | (787 | ) | (735 | ) | ||||||
Cash Provided From (Used By) Financing Activities | ||||||||||||
Proceeds from term loans, net of original issue discount | 86 | — | 2,589 | |||||||||
Principal payments on term loans | (115 | ) | (28 | ) | (2,544 | ) | ||||||
Proceeds from draws on revolving lines of credit | 430 | 663 | — | |||||||||
Payments on revolving lines of credit | (419 | ) | (306 | ) | — | |||||||
Debt issuance costs | — | — | (12 | ) | ||||||||
Increase in other long-term debt | — | 51 | 12 | |||||||||
Increase (decrease) in short-term debt | (2 | ) | (3 | ) | — | |||||||
Contingent consideration to acquire business | — | — | (9 | ) | ||||||||
Proceeds from equity rights offering, net of related fees | — | 250 | — | |||||||||
Net proceeds (remittances) on servicing of factoring arrangements | — | — | (1 | ) | ||||||||
Net cash provided from (used by) Financing Activities | (20 | ) | 627 | 35 | ||||||||
Effect of foreign currency exchange rate fluctuations on cash | (31 | ) | (4 | ) | (7 | ) | ||||||
Increase (decrease) in cash and equivalents | $ | 95 | $ | (126 | ) | $ | (429 | ) | ||||
Cash and equivalents at beginning of year | 194 | 332 | 761 | |||||||||
Plus: Cash and equivalents held for sale at January 1 | 12 | — | — | |||||||||
Increase (decrease) in cash and equivalents | 95 | (126 | ) | (429 | ) | |||||||
Less: Cash and equivalents held for sale at December 31 | (1 | ) | (12 | ) | — | |||||||
Cash and equivalents at end of year | $ | 300 | $ | 194 | $ | 332 | ||||||
Supplementary Disclosures: | ||||||||||||
Non-cash financing and investing activities: | ||||||||||||
Accrued property and equipment additions | $ | 64 | $ | 61 | $ | 60 | ||||||
Other cash flow information: | ||||||||||||
Cash paid for interest | $ | 139 | $ | 133 | $ | 111 | ||||||
Cash paid for income taxes, net of refunds of $7 million in 2016, $11 million in 2015, and $7 million in 2014 | $ | 67 | $ | 44 | $ | 42 | ||||||
See accompanying notes to Consolidated Financial Statements.
56
FEDERAL-MOGUL HOLDINGS LLC
Consolidated Statements of Shareholders’ Equity
(In millions)
Common Stockholders' | ||||||||||||||||||||||||||||
Common Stock | Additional Paid-in Capital | Accumulated Deficit | Accumulated Other Comprehensive Income (Loss) | Treasury Stock, at Cost | Noncontrolling Interests | Total | ||||||||||||||||||||||
Balance at December 31, 2013 | $ | 2 | $ | 2,649 | $ | (518 | ) | $ | (626 | ) | $ | (17 | ) | $ | 111 | $ | 1,601 | |||||||||||
Net income (loss) | — | — | (168 | ) | — | — | 7 | (161 | ) | |||||||||||||||||||
Other comprehensive loss, net of tax | — | — | — | (516 | ) | — | (15 | ) | (531 | ) | ||||||||||||||||||
Balance at December 31, 2014 | 2 | 2,649 | (686 | ) | (1,142 | ) | (17 | ) | 103 | 909 | ||||||||||||||||||
Acquisitions | — | — | — | — | — | 28 | 28 | |||||||||||||||||||||
Net income (loss) | — | — | (110 | ) | — | — | 6 | (104 | ) | |||||||||||||||||||
Other comprehensive loss, net of tax | — | — | — | (176 | ) | — | (5 | ) | (181 | ) | ||||||||||||||||||
Equity rights offering | — | 250 | — | — | — | — | 250 | |||||||||||||||||||||
Balance at December 31, 2015 | 2 | 2,899 | (796 | ) | (1,318 | ) | (17 | ) | 132 | 902 | ||||||||||||||||||
Net income (loss) | — | — | 82 | — | — | 8 | 90 | |||||||||||||||||||||
Other comprehensive loss, net of tax | — | — | — | (114 | ) | — | 2 | (112 | ) | |||||||||||||||||||
Balance at December 31, 2016 | $ | 2 | $ | 2,899 | $ | (714 | ) | $ | (1,432 | ) | $ | (17 | ) | $ | 142 | $ | 880 | |||||||||||
See accompanying notes to Consolidated Financial Statements.
57
FEDERAL-MOGUL HOLDINGS LLC
NOTES TO CONSOLIDATED FINANCIAL STATEMENTS
(Tabular amounts in millions, except per share amounts)
1. DESCRIPTION OF BUSINESS
Federal-Mogul Holdings LLC is a limited liability company formed under the laws of Delaware. On February 14, 2017, Federal-Mogul Holdings Corporation was converted to a single member limited liability company in the U.S. and changed its name to Federal-Mogul Holdings LLC. References herein to the “Company” and “Federal-Mogul” refer to Federal-Mogul Holdings LLC for the period after the effective date of the conversion on February 14, 2017, Federal-Mogul Holdings Corporation for the period after the effective date of the Reorganization (subsequently defined below) on April 15, 2014, and Federal-Mogul Corporation for the period prior to the effective date of the Reorganization on April 15, 2014.
The Company is a leading global supplier of technology and innovation in vehicle and industrial products for fuel economy, emissions reduction, and safety systems. The Company serves the world’s foremost original equipment manufacturers (“OEM”) and servicers (“OES”) (collectively, “OE”) of automotive, light, medium and heavy-duty commercial vehicles, off-road, agricultural, marine, rail, aerospace, power generation and industrial equipment, as well as the worldwide aftermarket.
Holding Company Reorganization: On April 15, 2014, Federal-Mogul Corporation completed a holding company reorganization (the “Reorganization”). As a result of the Reorganization, the outstanding shares of Federal-Mogul Corporation common stock were automatically converted on a one-for-one basis into shares of Federal-Mogul Holdings Corporation common stock, and all of the stockholders of Federal-Mogul Corporation immediately prior to the Reorganization automatically became stockholders of Federal-Mogul Holdings Corporation. The rights of stockholders of Federal-Mogul Holdings Corporation were generally governed by Delaware law and Federal-Mogul Holdings Corporation's certificate of incorporation and bylaws, which were the same in all material respects as those of Federal-Mogul Corporation immediately prior to the Reorganization. In addition, the board of directors of Federal-Mogul Holdings Corporation and its Audit Committee and Compensation Committee were composed of the same members as the board of directors, Audit Committee, and Compensation Committee of Federal-Mogul Corporation prior to the Reorganization.
Merger Transaction: On September 6, 2016, the Company, American Entertainment Properties Corp., a Delaware corporation (“AEP”), the Company's parent and a subsidiary of Icahn Enterprises L.P. ("IEP"), and IEH FM Holdings LLC, a Delaware limited liability company (“Merger Sub”) entered into an Agreement and Plan of Merger (the "Merger Agreement"). Pursuant to the Merger Agreement, and upon the terms and subject to the conditions thereof, Merger Sub commenced a cash tender offer (the "Offer) to acquire, subject to the terms and conditions of the Merger Agreement, all of the issued and outstanding shares of the Company’s common stock, par value $0.01 per share, not already owned by IEP affiliates, for a purchase price of $9.25 per share, net to the seller in cash, without interest, less any applicable tax withholding.
On January 3, 2017, the Company announced it had received a revised proposal to purchase shares of the Company’s common stock for $10.00 per share, an increase from the previous offer of $9.25 in cash per share. On January 23, 2017, AEP and Merger Sub completed the acquisition of the Company as all terms and conditions of the merger as set forth in the Merger Agreement were satisfied. Shares of the Company's stock are no longer publicly traded as of the close of business January 23, 2017.
Spinoff: On January 15, 2016, the Company announced it terminated the previously announced spin-off of its Motorparts division. The Company will continue to operate with two separate, independent businesses with separate CEOs who will each report directly the Company's board of directors. The separate businesses more effectively serve their unique markets and allow each operating business to pursue its business strategy and more quickly react to its respective market conditions.
Controlling Ownership: As of December 31, 2016, Mr. Carl C. Icahn indirectly controlled approximately 81.99% of the voting power of the Company’s capital stock and, by virtue of such stock ownership, is able to control or exert substantial influence over the Company, including the election of directors, business strategy and policies, mergers or other business combinations, acquisition or disposition of assets, future issuances of common stock or other securities, incurrence of debt or obtaining other sources of financing, and the payment of dividends on the Company’s common stock. The existence of a controlling stockholder may have the effect of making it difficult for, or may discourage or delay, a third party from seeking to acquire a majority of the Company’s outstanding common stock, which may adversely affect the market price of the stock.
Mr. Icahn’s interests may not always be consistent with the Company’s interests or with the interests of the Company’s other stockholders. Mr. Icahn and entities controlled by him may also pursue acquisitions or business opportunities that may or may
58
not be complementary to the Company’s business. To the extent that conflicts of interest may arise between the Company and Mr. Icahn and his affiliates, those conflicts may be resolved in a manner adverse to the Company or its other shareholders. As a result of the Merger Transaction and subsequent conversion, the entity indirectly owned and controlled by Mr. Icahn became the sole member of the limited liability company.
Deconsolidations: In 2012, the Company began exiting substantially all its activities in Venezuela with only residual cash and de minimis administrative costs remaining in 2014. In the fourth quarter of 2014, the Company concluded the inability to freely exchange currency between the Venezuelan bolivar currency and the U.S. dollar coupled with the significant government regulations and restrictions then in place severely limited its ability to manage and control its Venezuelan operations. As a result, the Company's Venezuelan subsidiary was deconsolidated as of December 31, 2014. The effect of the deconsolidation was a $2 million charge included in the results of operations for the year ended December 31, 2014. In 2016 and 2015, the Company had no operations in Venezuela.
2. BASIS OF PRESENTATION AND SUMMARY OF SIGNIFICANT ACCOUNTING POLICIES
Basis of Presentation
The audited Consolidated Financial Statements of the Company have been prepared in accordance with accounting principles generally accepted in the United States (“U.S. GAAP”).
Summary of Significant Accounting Policies
Principles of Consolidation: The Company consolidates into its financial statements the accounts of the Company, all wholly-owned subsidiaries, and any partially-owned subsidiary the Company has the ability to control. Control generally equates to ownership percentage, whereby investments that are more than 50% owned are consolidated, investments in affiliates of 50% or less but greater than 20% are accounted for using the equity method, and investments in affiliates of 20% or less are accounted for using the cost method. See Note 12, Investment in Nonconsolidated Affiliates, for discussion regarding the Company's subsidiaries that were subject to regulatory control.
The Company does not consolidate any entity for which it has a variable interest based solely on power to direct the activities and significant participation in the entity’s expected results that would not otherwise be consolidated based on control through voting interests. Further, the Company’s affiliates are businesses established and maintained in connection with the Company’s operating strategy and are not special purpose entities. All intercompany transactions and balances have been eliminated.
Reclassifications: Certain reclassifications from the prior year presentation have been made to conform to the current year presentation.
Use of Estimates: The preparation of financial statements in conformity with U.S. GAAP requires management to make estimates and assumptions that affect the amounts reported therein. Due to the inherent uncertainty involved in making estimates, actual results reported in future periods may be based upon amounts that differ from these estimates.
Cash and Equivalents: The Company considers all highly liquid investments with maturities of 90 days or less from the date of purchase to be cash equivalents.
Concentrations of Credit Risk: Financial instruments, which potentially subject the Company to concentrations of credit risk, consist primarily of accounts receivable, cash investments and derivative instruments. The Company’s customer base includes virtually every significant global light and commercial vehicle manufacturer and a large number of distributors, installers and retailers of automotive aftermarket parts. The Company’s credit evaluation process and the geographical dispersion of sales transactions help to mitigate credit risk concentration. No individual customer accounted for more than 10% of the Company’s net sales for the years ended December 31, 2016, 2015, and 2014 or accounts receivable as of December 31, 2016 and 2015. The Company requires placement of cash in financial institutions evaluated as highly creditworthy. See Note 7, Derivatives and Hedging Activities for further discussion related to derivatives.
Divestitures: In connection with its strategic planning process, the Company assesses its operations for market position, product technology and capability, and profitability. Those businesses determined by management not to have a sustainable competitive advantage are considered non-core and may be considered for divestiture or other exit activities.
Trade Accounts Receivable and Allowance for Doubtful Accounts: Trade accounts receivable is stated at net realizable value, which approximates fair value. The Company does not generally require collateral for its trade accounts receivable. Accounts receivable is reduced by an allowance for amounts that may become uncollectible in the future. This estimated allowance is
59
NOTES TO CONSOLIDATED FINANCIAL STATEMENTS - Continued
based primarily on management’s evaluation of specific balances as the balances become past due, the financial condition of its customers, and the Company’s historical experience of write-offs. The Company’s general policy for uncollectible accounts, if not reserved through specific examination procedures, is to reserve based upon the aging categories of accounts receivable and whether amounts are due from an OE or aftermarket customer. Past due status is based upon the invoice date of the original amounts outstanding. Included in selling, general, and administrative (“SG&A”) expenses are bad debt expenses of $5 million, $13 million, and $5 million for the years ended December 31, 2016, 2015, and 2014. Account balances are charged off against the allowance after all means of collection have been exhausted and the potential for recovery is considered remote. The Company’s allowance for doubtful accounts was $19 million and $27 million as of December 31, 2016 and 2015.
Factoring of Accounts Receivable: The Company has subsidiaries in Brazil, Canada, France, Germany, Italy and the U.S. which are party to accounts receivable factoring and securitization facilities. Amounts factored under these facilities consist of the following:
As of December 31 | ||||||||
2016 | 2015 | |||||||
Gross accounts receivable factored | $ | 487 | $ | 408 | ||||
Gross accounts receivable factored, qualifying as sales | $ | 485 | $ | 401 | ||||
Undrawn cash on factored accounts receivable | $ | — | $ | 1 | ||||
Proceeds from the factoring of accounts receivable qualifying as sales and expenses associated with the factoring of accounts receivable are as follows:
Year Ended December 31 | ||||||||||||
2016 | 2015 | 2014 | ||||||||||
Proceeds from factoring qualifying as sales | $ | 1,616 | $ | 1,550 | $ | 1,679 | ||||||
Financing charges(a) | $ | (12 | ) | $ | (9 | ) | $ | (6 | ) | |||
(a)Recorded in the consolidated statements of operations within "other income (expense), net." | ||||||||||||
Accounts receivables factored but not qualifying as a sale, as defined in Financial Accounting Standards Board ("FASB") Accounting Standards Codification ("ASC") Topic 860, Transfers and Servicing, were pledged as collateral and accounted for as secured borrowings and recorded in the consolidated balance sheets within “Accounts receivable, net” and “Short-term debt, including the current portion of long-term debt.”
Where the Company receives a fee to service and monitor these transferred receivables, such fees are sufficient to offset the costs and as such, a servicing asset or liability is not recorded as a result of such activities.
Inventories: The Company values inventory at the lower of cost or market, with cost determined on a first-in, first-out (“FIFO”) basis. Cost of inventory includes direct materials, labor, and applicable manufacturing overhead costs. The value of inventories are reduced for excess and obsolescence based on management’s review of on-hand inventories compared to historical and estimated future sales and usage. Inventory held at consignment locations is included in finished goods inventory as the Company retains full title and rights to the product.
Long-Lived Assets: Long-lived assets such as property, plant, and equipment are recorded at fair value established at acquisition or cost unless the expected future use of the assets indicate a lower value is appropriate. Definite-lived intangible assets have been stated at fair value established at acquisition or at cost. Long-lived assets are periodically reviewed for impairment indicators. If impairment indicators exist, the Company performs the required analysis and records an impairment charge, if required, in accordance with the subsequent measurement provisions of ASC 360, Property, Plant & Equipment. If the carrying value of a long-lived asset is considered impaired, an impairment charge is recorded for the amount by which the carrying value of the long-lived asset exceeds its fair value. Depreciation and amortization are computed principally by the straight-line method for financial reporting purposes.
Goodwill: Goodwill is determined as the excess of fair value over amounts attributable to specific tangible and intangible assets, including developed technology and customer relationships. Goodwill is reviewed for impairment annually as of October 1, or more frequently, if impairment indicators exist, in accordance with the subsequent measurement provisions of ASC Topic 350, Intangibles – Goodwill and Other. This impairment analysis compares the fair values of the Company’s reporting units to their related carrying values. If a reporting unit’s carrying value exceeds its fair value, the Company must
60
NOTES TO CONSOLIDATED FINANCIAL STATEMENTS - Continued
then calculate the reporting unit’s implied fair value of goodwill and an impairment charge is recorded for any excess of the goodwill carrying value over the implied fair value of goodwill. The reporting units’ fair values are based upon consideration of various valuation methodologies, including projected future cash flows discounted at rates commensurate with the risks involved, guideline transaction multiples, and multiples of current and future earnings.
Trademarks and Brand Names: Trademarks and brand names are stated at fair value established at acquisition or cost. These indefinite-lived intangible assets are reviewed for impairment annually as of October 1, or more frequently, if impairment indicators exist, in accordance with the subsequent measurement provisions of ASC Topic 350, Intangibles – Goodwill and Other. This impairment analysis compares the fair values of these assets to the related carrying values, and impairment charges are recorded for any excess of carrying values over fair values. These fair values are based upon the prospective stream of hypothetical after-tax royalty cost savings discounted at rates that reflect the rates of return appropriate for these intangible assets.
Pension and Other Postretirement Obligations: The cost of benefits provided by defined benefit pension and postretirement plans is recorded in the period employees provide service. Future pension expense for certain significant funded benefit plans is calculated using an expected return on plan asset methodology. The market-related value of plan assets is fair value. Actuarial gains and losses are accumulated and amortized into net income once they exceed a corridor, which is 10% of the projected benefit obligation, over the expected future working lifetime or life expectancy of the plan participants.
The discount rate assumption is established at the measurement date. In the U.S., the Company uses a cash flow matching approach that uses projected cash flows matched to spot rates along a high quality corporate yield curve to determine the present value of cash flows to calculate a single equivalent discount rate. The benefit obligation for pension plans in Belgium, France, and Germany represents 91% of the non-U.S. pension benefit obligation at December 31, 2016. The discount rates for these plans are determined using a cash flow matching approach similar to the U.S. approach.
Investments with registered investment companies, common and preferred stocks, and certain government debt securities are valued at the closing price reported on the active market on which the securities are traded.
Corporate debt securities are valued by third-party pricing sources using the multi-dimensional relational model using instruments with similar characteristics.
Hedge funds and the collective trusts are valued at net asset value (NAV) per share which are provided by the respective investment sponsors or investment advisers.
Revenue Recognition: The Company records sales when products are shipped and the risks and rewards of ownership have transferred to the customer, the sales price is fixed and determinable, and the collectability of revenue is reasonably assured. Accruals for sales returns and other allowances are provided at point of sale based upon past experience. Adjustments to such returns and allowances are made as new information becomes available.
Rebates: The Company accrues for rebates pursuant to specific arrangements with certain customers, primarily in the aftermarket. Rebates generally provide for price reductions based upon the achievement of specified purchase volumes and are recorded as a reduction of sales as earned by such customers.
Sales and Sales Related Taxes: The Company collects and remits taxes assessed by various governmental authorities that are both imposed on and concurrent with revenue-producing transactions with its customers. These taxes may include, but are not limited to, sales, use, value-added, and some excise taxes. The collection of these taxes is reported on a net basis (excluded from revenues).
Shipping and Handling Costs: The Company recognizes shipping and handling costs as incurred as a component of "Cost of products sold" in the consolidated statements of operations.
Engineering and Tooling Costs: Pre-production tooling and engineering costs the Company will not own and will be used in producing products under long-term supply arrangements are expensed as incurred unless the supply arrangement provides the Company with the noncancelable right to use the tools, or the reimbursement of such costs is agreed to by the customer. Pre-production tooling costs owned by the Company are capitalized as part of machinery and equipment, and are depreciated over the shorter of the tool’s expected life or the duration of the related program.
Research and Development: The Company expenses research and development (“R&D”) costs as incurred. R&D expense, including product engineering and validation costs, was $192 million, $189 million, and $192 million for the years ended
61
NOTES TO CONSOLIDATED FINANCIAL STATEMENTS - Continued
December 31, 2016, 2015, and 2014. R&D expense is recorded in the consolidated statements of operations within “Selling, general and administrative expenses.”
Advertising Costs: Advertising and promotion expenses for continuing operations are expensed as incurred and were $57 million, $48 million, and $47 million for the years ended December 31, 2016, 2015, and 2014. Advertising and promotion expenses are recorded in the consolidated statements of operations within “Selling, general and administrative expenses.”
Restructuring: Restructuring is comprised of two types of costs: employee costs (principally termination benefits) and facility closure costs. Termination benefits are accounted for in accordance with ASC Topic 712, Compensation – Nonretirement Postemployment Benefits and are recorded when it is probable employees will be entitled to benefits and the amounts can be reasonably estimated. Estimates of termination benefits are based on the frequency of past termination benefits, the similarity of benefits under the current plan and prior plans, and the existence of statutory required minimum benefits. Termination benefits are also accounted for in accordance with ASC Topic 420, Exit or Disposal Cost Obligations (“ASC 420”), for one-time termination benefits and are recorded dependent upon future service requirements. Facility closure and other costs are accounted for in accordance with ASC 420 and are recorded when the liability is incurred.
Foreign Currency Translation: Exchange adjustments related to foreign currency transactions and translation adjustments for foreign subsidiaries whose functional currency is the U.S. dollar (principally those located in highly inflationary economies) are reflected in the consolidated statements of operations. Translation adjustments of foreign subsidiaries for which the local currency is the functional currency are reflected in the consolidated balance sheets as a component of “Accumulated other comprehensive loss.” Deferred taxes are not provided on translation adjustments as the earnings of the subsidiaries are considered to be permanently reinvested.
Environmental Liabilities: The Company recognizes environmental liabilities in accordance with ASC Topic 410, Asset Retirement and Environmental Obligations ("ASC 410") when a loss is probable and reasonably estimable. Such liabilities are generally not subject to insurance coverage. Engineering and legal specialists within the Company estimate each environmental obligation based on current law and existing technologies. Such estimates are based primarily upon the estimated cost of investigation and remediation required and the likelihood that other potentially responsible parties will be able to fulfill their commitments at the sites where the Company may be jointly and severally liable with such parties. The Company regularly evaluates and revises its estimates for environmental obligations based on expenditures against established accruals and the availability of additional information.
Asset Retirement Obligations: The Company records asset retirement obligations (“ARO”) in accordance with ASC 410. The Company’s primary ARO activities relate to the removal of hazardous building materials at its facilities. The Company records AROs when liabilities are probable and amounts can be reasonably estimated.
Derivative Financial Instruments: The Company uses commodity forward contracts to manage volatility of underlying exposures. The Company recognizes all of its derivative instruments as either assets or liabilities at fair value. The accounting for changes in the fair value (i.e., gains or losses) of a derivative instrument depends on whether it has been designated, and is effective, as a hedge and further, on the type of hedging relationship. For those derivative instruments that are designated and qualify as hedging instruments, the Company must designate the hedging instrument, based upon the exposure being hedged, as a fair value hedge, cash flow hedge or a hedge of a net investment in a foreign operation. Gains and losses related to a hedge are either recognized in income immediately to offset the gain or loss on the hedged item or are deferred and reported as a component of accumulated other comprehensive loss and subsequently recognized in earnings when the hedged item affects earnings. The change in fair value of the ineffective portion of a financial instrument, determined using the hypothetical derivative method, is recognized in earnings immediately. The gain or loss related to financial instruments not designated as hedges are recognized immediately in earnings. Cash flows related to hedging activities are included in the operating section of the consolidated statements of cash flows. The Company does not hold or issue derivative financial instruments for trading or speculative purposes. The Company’s objectives for holding derivatives are to minimize risks using the most effective and cost-efficient methods available.
Changes in Accounting Principle
In April 2015, the Financial Accounting Standards Board ("FASB") issued Accounting Standards Update ("ASU") No. 2015-03, Simplifying the Presentation of Debt Issuance Costs. The accounting guidance requires debt issuance costs related to a recognized debt liability be reported in the consolidated balance sheets as a direct deduction from the carrying amount of that debt liability. The guidance is effective retrospectively and the Company has adopted this guidance in the first quarter of 2016. The adoption of this accounting guidance to the Consolidated Financial Statements is summarized below:
62
NOTES TO CONSOLIDATED FINANCIAL STATEMENTS - Continued
December 31, 2016 | ||||||||||
Consolidated Balance Sheet | Prior Accounting Principles | Effect of Accounting Change | As Reported | |||||||
Other noncurrent assets | $ | 190 | (7 | ) | $ | 183 | ||||
Long-term debt | $ | 2,890 | (7 | ) | $ | 2,883 | ||||
December 31, 2015 | ||||||||||
Consolidated Balance Sheet | Previously Reported | Effect of Accounting Change | Recast | |||||||
Other noncurrent assets | $ | 184 | (10 | ) | $ | 174 | ||||
Long-term debt | $ | 2,924 | (10 | ) | $ | 2,914 | ||||
Adoption of New Accounting Standards
In 2015, the FASB issued ASU 2015-17, Balance Sheet Classification of Deferred Taxes, which requires all deferred tax assets and liabilities, as well as related valuation allowances, to be classified as non-current rather than as current and non-current based on the classification of the related assets and liabilities. The Company adopted the provisions of this update in 2015. Accordingly, $45 million and $16 million of deferred taxes were reclassified from other current assets and other current liabilities, respectively to other long-term assets and other accrued liabilities in the accompanying consolidated balance sheet as of December 31, 2015.
Recently Issued Accounting Pronouncements
In May 2014, the FASB issued Accounting Standards Update ("ASU") No. 2014-9, Revenue from Contracts with Customers, which supersedes the revenue recognition requirements in ASC 605, Revenue Recognition. This ASU clarifies the principles for recognizing revenue and provides a common revenue standard for U.S. GAAP and International Financial Reporting Standards and will require revenue to be recognized when promised goods or services are transferred to customers in an amount that reflects the consideration to which the company expects to be entitled in exchange for those goods or services. Adoption of the new rules could affect the timing of revenue recognition for certain transactions. The FASB, through the issuance of ASU No. 2015-14, approved a one year delay of the effective date and the new standard is effective for reporting periods beginning after December 15, 2017 and can be applied retrospectively to each prior reporting period presented (full retrospective method) or retrospectively with a cumulative effect adjustment to retained earnings for initial application of the guidance at the date of initial adoption (modified retrospective method). The Company continues to evaluate the effect of these accounting pronouncements on its financial statements and will adopt this new guidance on January 1, 2018 using the modified retrospective application method.
In July 2015, the FASB issued ASU No. 2015-11, Inventory (Topic 330): Simplifying the Measurement of Inventory. This ASU requires entities to measure most inventory “at the lower of cost and net realizable value,” thereby simplifying the current guidance under which an entity must measure inventory at the lower of cost or market. ASU No. 2015-11 is effective prospectively for annual periods beginning after December 15, 2016, and interim periods therein, with early adoption permitted. The Company's adoption of this guidance will not have a material effect on its financial statements.
In September 2015, the FASB issued ASU No. 2015-16, Business Combinations (Topic 805): Simplifying the Accounting for Measurement-Period Adjustments. Under this ASU, an acquirer must recognize adjustments to provisional amounts that are identified during the measurement period in the reporting period in which the adjustment amounts are determined. The effect on earnings of changes in depreciation or amortization, or other income effects, if any, as a result of the change to the provisional amounts, calculated as if the accounting had been completed as of the acquisition date, must be recorded in the reporting period in which the adjustment amounts are determined rather than retrospectively. This standard is effective for annual reporting periods, including interim reporting periods within those periods, beginning after December 15, 2016. Early adoption is permitted as of annual reporting periods beginning after December 15, 2015, including interim reporting periods within those annual periods. The Company expects the adoption of this guidance will not have a material effect on its financial statements.
63
NOTES TO CONSOLIDATED FINANCIAL STATEMENTS - Continued
In January 2016, the FASB issued ASU No. 2016-01, Financial Instruments - Overall (Subtopic 825-10): Recognition and Measurement of Financial Assets and Financial Liabilities. The updated guidance enhances the reporting model for financial instruments, which includes amendments to address aspects of recognition, measurement, presentation and disclosure. The amendments in the ASU are effective prospectively for fiscal years beginning after December 15, 2017, and interim periods therein, with early adoption not permitted. The Company is currently evaluating the potential effects of this pronouncement.
In February 2016, the FASB issued ASU No. 2016-02, Leases (Topic 842), that replaces existing lease guidance. The new standard is intended to provide enhanced transparency and comparability by requiring lessees to record right-of-use assets and corresponding lease liabilities on the balance sheet. The new guidance will continue to classify leases as either finance or operating, with classification affecting the pattern of expense recognition in the statement of income. The standard is effective for the Company beginning January 1, 2019, with early application permitted. The new standard is required to be applied with a modified retrospective approach to each prior reporting period presented with various optional practical expedients. The Company is currently evaluating the potential effects of this pronouncement.
In January 2017, the FASB issued ASU No. 2017-04, Intangibles - Goodwill and Other (Topic 350): Simplifying the Test for Goodwill Impairment. This ASU removes the requirement to perform a hypothetical purchase price allocation to measure goodwill impairment. A goodwill impairment will now be the amount by which a reporting unit’s carrying value exceeds its fair value, not to exceed the carrying amount of goodwill. This standard is effective for annual or interim goodwill impairment tests in fiscal years beginning after December 15, 2019, with early adoption permitted for interim or annual goodwill impairments tests performed on testing dates after January 1, 2017. The Company anticipates early adoption of this ASU for goodwill impairment tests performed after January 1, 2017 and will adjust its goodwill testing procedures accordingly upon adoption.
3. RESTRUCTURING CHARGES AND ASSET IMPAIRMENTS
The Company’s restructuring activities are undertaken as necessary to execute management’s strategy and streamline operations, consolidate and take advantage of available capacity and resources, and ultimately achieve productivity improvements and net cost reductions. Restructuring activities include efforts to integrate and rationalize the Company’s businesses and to relocate operations to best cost locations.
The Company's restructuring charges consist primarily of employee costs (principally severance and/or termination benefits), facility closure and other costs, curtailment losses (gains) related to reductions of pension and postretirement medical benefit obligations as a result of headcount reductions, and asset impairments related to restructuring activities.
For the years ended December 31, 2016, 2015, and 2014, restructuring charges and asset impairments,net include the following:
Year Ended December 31, | |||||||||||||||||||||||||||||||||
2016 | 2015 | 2014 | |||||||||||||||||||||||||||||||
Powertrain | Motorparts | Total | Powertrain | Motorparts | Total | Powertrain | Motorparts | Corporate | Total | ||||||||||||||||||||||||
Severance and other charges, net | $ | (21 | ) | $ | (6 | ) | $ | (27 | ) | $ | (33 | ) | $ | (56 | ) | $ | (89 | ) | $ | (59 | ) | $ | (26 | ) | $ | (1 | ) | $ | (86 | ) | |||
Asset impairments related to restructuring activities | — | — | — | (1 | ) | (2 | ) | (3 | ) | (2 | ) | (1 | ) | — | (3 | ) | |||||||||||||||||
Total Restructuring charges | (21 | ) | (6 | ) | (27 | ) | (34 | ) | (58 | ) | (92 | ) | (61 | ) | (27 | ) | (1 | ) | (89 | ) | |||||||||||||
Other asset impairments | — | — | — | (16 | ) | (1 | ) | (17 | ) | (5 | ) | (11 | ) | — | (16 | ) | |||||||||||||||||
Impairment of assets held for sale | — | (17 | ) | (17 | ) | (12 | ) | — | (12 | ) | — | — | — | — | |||||||||||||||||||
Impairment of nonconsolidated affiliate | — | — | — | — | — | — | — | (5 | ) | — | (5 | ) | |||||||||||||||||||||
Total asset impairment charges | — | (17 | ) | (17 | ) | (28 | ) | (1 | ) | (29 | ) | (5 | ) | (16 | ) | — | (21 | ) | |||||||||||||||
Total restructuring charges and asset impairments | $ | (21 | ) | $ | (23 | ) | $ | (44 | ) | $ | (62 | ) | $ | (59 | ) | $ | (121 | ) | $ | (66 | ) | $ | (43 | ) | $ | (1 | ) | $ | (110 | ) | |||
Restructuring
Estimates of restructuring charges are based on information available at the time such charges are recorded. In certain countries where the Company operates, statutory requirements include involuntary termination benefits that extend several years into the future. Accordingly, severance payments continue well past the date of termination at many international locations. Thus, restructuring programs appear to be ongoing when terminations and other activities have been substantially completed.
64
NOTES TO CONSOLIDATED FINANCIAL STATEMENTS - Continued
Restructuring opportunities include potential plant closures and employee headcount reductions in various countries and require consultation with various parties including, but not limited to, unions/works councils, local governments, and/or customers. The consultation process can take a significant amount of time and affect the final outcome and timing. The Company's policy is to record a provision for qualifying restructuring costs in accordance with the applicable accounting guidance when the outcome of such consultations becomes probable.
Management expects to finance its restructuring programs through cash generated from its ongoing operations or through cash available under its existing credit facilities, subject to the terms of applicable covenants. Management does not expect the execution of these programs will have an adverse effect on its liquidity position.
The following table is a summary of the Company’s consolidated restructuring liabilities and related activity as of and for the years ended December 31, 2016, 2015, and 2014 by reporting segment.
Powertrain | Motorparts | Total Reporting Segment | Corporate | Total Company | ||||||||||||||||
Balance at December 31, 2013 | $ | 8 | $ | 14 | $ | 22 | $ | 2 | $ | 24 | ||||||||||
Provisions | 59 | 27 | 86 | 1 | 87 | |||||||||||||||
Reversals | — | (1 | ) | (1 | ) | — | (1 | ) | ||||||||||||
Payments | (27 | ) | (24 | ) | (51 | ) | (2 | ) | (53 | ) | ||||||||||
Foreign currency | (4 | ) | — | (4 | ) | — | (4 | ) | ||||||||||||
Balance at December 31, 2014 | 36 | 16 | 52 | 1 | 53 | |||||||||||||||
Provisions | 38 | 55 | 93 | — | 93 | |||||||||||||||
Reversals | (4 | ) | — | (4 | ) | — | (4 | ) | ||||||||||||
Payments | (35 | ) | (22 | ) | (57 | ) | (1 | ) | (58 | ) | ||||||||||
Acquisition | 2 | — | 2 | — | 2 | |||||||||||||||
Foreign currency | (4 | ) | (2 | ) | (6 | ) | — | (6 | ) | |||||||||||
Balance at December 31, 2015 | 33 | 47 | 80 | — | 80 | |||||||||||||||
Provisions | 21 | 13 | 34 | — | 34 | |||||||||||||||
Reversals | — | (7 | ) | (7 | ) | — | (7 | ) | ||||||||||||
Payments | (26 | ) | (24 | ) | (50 | ) | (50 | ) | ||||||||||||
Foreign currency | — | (2 | ) | (2 | ) | — | (2 | ) | ||||||||||||
Balance at December 31, 2016 | $ | 28 | $ | 27 | $ | 55 | $ | — | $ | 55 | ||||||||||
65
NOTES TO CONSOLIDATED FINANCIAL STATEMENTS - Continued
The following table provides a summary of the Company’s consolidated restructuring liabilities and related activity for each type of exit cost as of and for the years ended December 31, 2016, 2015, and 2014. As the table indicates, facility closure costs are typically paid within the year of incurrence.
Employee Costs | Facility Closure and Other Costs | Total | ||||||||||
Balance at December 31, 2013 | $ | 24 | $ | — | $ | 24 | ||||||
Provisions | 77 | 10 | 87 | |||||||||
Reversals | (1 | ) | — | (1 | ) | |||||||
Payments | (45 | ) | (8 | ) | (53 | ) | ||||||
Foreign Currency | (4 | ) | — | (4 | ) | |||||||
Balance at December 31, 2014 | 51 | 2 | 53 | |||||||||
Provisions | 85 | 8 | 93 | |||||||||
Reversals | (4 | ) | — | (4 | ) | |||||||
Payments | (49 | ) | (9 | ) | (58 | ) | ||||||
Acquisitions | 2 | — | 2 | |||||||||
Foreign Currency | (6 | ) | — | (6 | ) | |||||||
Balance at December 31, 2015 | 79 | 1 | 80 | |||||||||
Provisions | 30 | 4 | 34 | |||||||||
Reversals | (7 | ) | — | (7 | ) | |||||||
Payments | (46 | ) | (4 | ) | (50 | ) | ||||||
Acquisitions | — | — | — | |||||||||
Foreign Currency | (2 | ) | — | (2 | ) | |||||||
Balance at December 31, 2016 | $ | 54 | $ | 1 | $ | 55 | ||||||
Restructuring charges and asset impairments for the year ended December 31, 2016 were comprised of $21 million related to the Powertrain segment and $23 million related to the Motorparts segment. The specific components of the restructuring and asset impairment charges by region are as follows:
December 31, 2016 | |||||||||||||||||||||||||||
Severance Related Charges | Exit and Other Charges | Impairment Charges | Total Restructuring Charges | ||||||||||||||||||||||||
Motorparts(a) | Powertrain | Motorparts | Powertrain | Motorparts | Powertrain | ||||||||||||||||||||||
EMEA | $ | 1 | $ | (16 | ) | $ | (1 | ) | $ | (2 | ) | $ | (4 | ) | $ | — | $ | (22 | ) | ||||||||
North America | (3 | ) | (2 | ) | (3 | ) | — | (1 | ) | — | (9 | ) | |||||||||||||||
ROW | — | (1 | ) | — | — | (12 | ) | — | (13 | ) | |||||||||||||||||
$ | (2 | ) | $ | (19 | ) | $ | (4 | ) | $ | (2 | ) | $ | (17 | ) | $ | — | $ | (44 | ) | ||||||||
(a) The EMEA region in the Motorparts segment recognized $6 million in severance related charges offset by a reduction in previously recorded estimates of $7 million during the year ended December 31, 2016. | |||||||||||||||||||||||||||
Restructuring expenses for the year ended December 31, 2016 are aimed at optimizing the Company's cost structure. The Company expects to complete these programs in 2017 and does not expect to incur additional restructuring charges for these programs. For programs previously initiated in prior years, the Company expects to complete the majority of these programs in 2018 and does not expect to incur additional restructuring charges for these programs
66
NOTES TO CONSOLIDATED FINANCIAL STATEMENTS - Continued
Restructuring charges and asset impairments for the year ended December 31, 2015 were comprised of $62 million related to the Powertrain segment and $59 million related to the Motorparts segment. The specific components of the restructuring and asset impairment charges by region are as follows:
December 31, 2015 | |||||||||||||||||||||||||||
Severance Related Charges | Exit and Other Charges | Impairment Charges | Total Restructuring Charges | ||||||||||||||||||||||||
Motorparts | Powertrain | Motorparts | Powertrain | Motorparts | Powertrain | ||||||||||||||||||||||
EMEA | $ | (45 | ) | $ | (27 | ) | $ | (1 | ) | $ | (3 | ) | $ | (2 | ) | $ | (20 | ) | $ | (98 | ) | ||||||
North America | (5 | ) | — | (3 | ) | — | — | (1 | ) | (9 | ) | ||||||||||||||||
ROW | (2 | ) | (2 | ) | — | (1 | ) | (1 | ) | (8 | ) | (14 | ) | ||||||||||||||
$ | (52 | ) | $ | (29 | ) | $ | (4 | ) | $ | (4 | ) | $ | (3 | ) | $ | (29 | ) | $ | (121 | ) | |||||||
Restructuring charges and asset impairments for the year ended December 31, 2014 were comprised of $66 million related to the Powertrain segment $43 million related to the Motorparts segment and $1 million in corporate charges. The specific components of the restructuring and asset impairment charges by region are as follows:
December 31, 2014 | |||||||||||||||||||||||||||
Severance Related Charges | Exit and Other Charges | Impairment Charges | Total Restructuring Charges (a) | ||||||||||||||||||||||||
Motorparts | Powertrain | Motorparts | Powertrain | Motorparts | Powertrain | ||||||||||||||||||||||
EMEA | $ | (15 | ) | $ | (44 | ) | $ | (2 | ) | $ | (5 | ) | $ | (14 | ) | $ | (7 | ) | $ | (87 | ) | ||||||
North America | (7 | ) | (3 | ) | (2 | ) | (1 | ) | (1 | ) | — | (14 | ) | ||||||||||||||
ROW | — | (6 | ) | — | — | (2 | ) | — | (8 | ) | |||||||||||||||||
$ | (22 | ) | $ | (53 | ) | $ | (4 | ) | $ | (6 | ) | $ | (17 | ) | $ | (7 | ) | $ | (109 | ) | |||||||
(a) Corporate charges of $1 million are excluded from total restructuring charges in above table. | |||||||||||||||||||||||||||
Due to the inherent uncertainty involved in estimating restructuring expenses, actual amounts paid for such activities may differ from amounts initially estimated. Accordingly, the Company reduced its liability previously recorded in 2016, 2015, and 2014 by $7 million, $4 million, and $1 million.
See Note 6, Held for Sale and Discontinued Operations, for further details related to the $17 million impairment loss on assets held for sale.
See Note 8, Fair Value Measurements and Financial Instruments, for further details related to property, plant, and equipment fair value measurements.
4. OTHER INCOME (EXPENSE), NET
The specific components of “Other income (expense), net” are as follows:
Year Ended December 31 | ||||||||||||
2016 | 2015 | 2014 | ||||||||||
Loss on sale of equity method investment(a) | $ | — | $ | (11 | ) | $ | — | |||||
Segmentation costs | — | (4 | ) | (10 | ) | |||||||
Gain (loss) on sale of assets | 7 | 4 | 1 | |||||||||
Foreign currency transaction gain (loss) | 2 | (3 | ) | (7 | ) | |||||||
Financing charges | (12 | ) | (9 | ) | (6 | ) | ||||||
Third party royalty income | 7 | 6 | 7 | |||||||||
Unrealized gain on hedge instruments | — | — | 1 | |||||||||
Other | 17 | 12 | 3 | |||||||||
$ | 21 | $ | (5 | ) | $ | (11 | ) | |||||
(a) See Note 12, Investment in Nonconsolidated Affiliates, for further details. | ||||||||||||
67
NOTES TO CONSOLIDATED FINANCIAL STATEMENTS - Continued
In the year ended December 31, 2016, the other income (expense), net included the recognition of a $9 million gain related to the sale of real estate made in a prior year. The gain and receipt of the proceeds was contingent upon the property's redevelopment by the buyer.
In the year ended December 31, 2015, the Company recognized an $11 million loss on the disposition of an equity method investment.
5. ACQUISITIONS
Beck Arnley Acquisition
On December 1, 2016, the Company acquired the assets and liabilities of IEH BA LLC ("Beck Arnley"), an entity owned by a subsidiary of IEP. Beck Arnley is a provider of premium OE quality parts and fluids for foreign nameplate vehicles in North America and was acquired for a purchase price of $14 million, which included $7 million paid in cash on the date of acquisition and a $7 million non-interest bearing note maturing on May 1, 2018. This related party note payable is included in "Other accrued liabilities" on the balance sheet. Beck Arnley’s products complement the foreign nameplate coverage of the Company's current aftermarket offerings, while adding several new product lines, including fluids, engine management, cooling, electrical parts, and electronic components. As this is a transaction of entities under common control, the net book value of assets acquired and liabilities assumed at the acquisition date was $14 million. See Note 23, Related Party Transactions.
Filters Business Acquisition
On May 26, 2016, the Company completed the acquisition of the assets of a filter manufacturing business in Mexico, which primarily serves the Mexican market, for a purchase price of $25 million, net of cash acquired. The estimated fair value of assets acquired and liabilities assumed at the acquisition date was approximately $25 million. The Company is in the process of finalizing certain post-closing adjustments which could affect the estimated fair value of assets acquired and liabilities assumed.
TRW’s Engine Components Acquisition
On February 6, 2015, the Company completed the acquisition of TRW’s valvetrain business. The business was acquired through a combination of asset and stock purchases for a purchase price of approximately $309 million. On July 7, 2015, the Company completed the purchase of certain additional business assets of the TRW’s valvetrain business. The business was acquired through stock purchases for a base purchase price of approximately $56 million. The purchase included a $25 million noncontrolling interest related to a 66% stake in a majority owned entity that the Company consolidates in its financial statements. The acquisition was funded primarily from the Company's available revolving line of credit and was subject to certain customary closing and post-closing adjustments. The acquisition of TRW’s valvetrain business adds a completely new product line to the Company's portfolio, strengthens the Company's position as a leading developer and supplier of core components for engines, and enhances the Company's ability to support its customers to improve fuel economy and reduce emissions.
The following table summarizes the estimated fair values of the assets acquired and liabilities assumed at the acquisition date:
Estimated Fair Value as of December 31, 2015 | ||||
Cash | $ | 14 | ||
Accounts receivable, net | 31 | |||
Inventory, net | 36 | |||
Property, plant and equipment, net | 234 | |||
Goodwill | 74 | |||
Other identified intangible assets | 107 | |||
Accounts payable | (22 | ) | ||
Accrued liabilities | (39 | ) | ||
Acquired postretirement benefits | (46 | ) | ||
Other net assets | 1 | |||
Total identifiable net assets | $ | 390 | ||
68
NOTES TO CONSOLIDATED FINANCIAL STATEMENTS - Continued
In addition to the benefits noted above, goodwill is created from the expected synergies through the integration of the engine components business into the existing Powertrain segment which will allow for improved profitability.
As part of the acquisition, the Company recorded $107 million of definite-lived intangible assets, comprising of $22 million of developed technology and $85 million of customer relationships.
Proforma Results
The following proforma results for the year ended December 31, 2015 assumes the purchase of the TRW valvetrain business occurred as of the beginning of 2015 and are inclusive of provisional purchase price adjustments. The proforma results are not necessarily indicative of the results that actually would have been obtained.
Year Ended December 31, | ||||
2015 | ||||
(unaudited) | ||||
Net sales | $ | 7,463 | ||
Net income (loss) attributable to Federal-Mogul | $ | (110 | ) | |
Income (loss) per share attributable to Federal-Mogul - basic and diluted | $ | (0.67 | ) | |
During the year ended December 31, 2016, the Company recorded $1 million of acquisition related expenses, primarily legal and other professional fees, associated with the acquisition of the filters manufacturing business in Mexico.
During the year ended December 31, 2015, the Company recorded $4 million in acquisition related expenses, primarily legal and other professional fees, associated with the acquisition of TRW’s valvetrain business.
During the year ended December 31, 2014, the Company recorded $7 million in transaction related expenses associated with business acquisitions. All of these transaction related expenses are recorded in "Selling, general, and administrative expenses" within the consolidated statement of operations.
6. HELD FOR SALE AND DISCONTINUED OPERATIONS
Held for Sale Operations
The Company classifies assets and liabilities as held for sale ("disposal group") when management, having the authority to approve the action, commits to a plan to sell the disposal group, the sale is probable within one year, and the disposal group is available for immediate sale in its present condition. The Company also considers whether an active program to locate a buyer has been initiated, whether the disposal group is marketed actively for sale at a price that is reasonable in relation to its current fair value, and whether actions required to complete the plan indicate it is unlikely significant changes to the plan will be made or the plan will be withdrawn.
The Company aggregates the assets and aggregate liabilities of all held for sale disposal groups on the balance sheet for the period in which the disposal group is held for sale.
The company has classified assets of $13 million and liabilities of $6 million as held for sale, which have been included in "Prepaid expenses and other current assets" and "Other current liabilities" as of December 31, 2016. As part of the held for sale assessment, the Company determined these assets were in excess of fair market value and a $14 million impairment charge was recorded. In addition, the Company has record and additional $3 million of impairment charges for assets both held for sale and sold during the year ended December 31, 2016. Impairment charges related to held for sale assets have been included in "Restructuring charges and asset impairments, net" as of December 31, 2016.
In December 2016, the Company entered into an agreement to sell 80.1% of the shares of one of its subsidiaries in Brazil in the Motorparts segment for a sale price of one Brazilian Real. The related assets and liabilities have been classified as held for sale as of December 31, 2016. The sale is expected to close in the second half of 2017.
69
NOTES TO CONSOLIDATED FINANCIAL STATEMENTS - Continued
In December 2016, the Company entered into stock and asset purchase agreement to sell certain assets and liabilities related to its wipers business in the Motorparts segment for a sale price of $8 million. The related assets and liabilities have been classified as held for sale as of December 31, 2016. The sale is expected to close in the first half of 2017.
During 2015, the Company entered into a share agreement to sell 100% of the shares of one of its subsidiaries in the Powertrain segment and classified the assets and liabilities as held for sale. The sale price for the shares was one euro. Prior to December 31, 2015, the Company contributed $12 million in cash to the subsidiary. The sale closed on January 1, 2016.
The assets and liabilities that were classified as held for sale as of December 31, 2016 and 2015 were as follows:
December 31, | ||||||||
2016 | 2015 | |||||||
Assets | ||||||||
Cash and cash equivalents | $ | 1 | $ | 12 | ||||
Receivables | 4 | 1 | ||||||
Inventories | 5 | 3 | ||||||
Other current assets | 9 | — | ||||||
Long-lived assets | 8 | — | ||||||
Impairment on carrying value | (14 | ) | (12 | ) | ||||
Total assets held for sale | $ | 13 | $ | 4 | ||||
Liabilities | ||||||||
Trade payables | $ | 3 | $ | 1 | ||||
Accrued liabilities | 1 | 1 | ||||||
Other liabilities | 2 | 3 | ||||||
Total liabilities held for sale | $ | 6 | $ | 5 | ||||
During the year ended December 31, 2016, the Company recorded $1 million of transaction related expenses, primarily legal and other professional fees, associated with these assets held for sale.
Discontinued Operations
In connection with its strategic planning process, the Company assesses its operations for market position, product technology and capability, and profitability. Those businesses not core to the Company’s long-term portfolio may be considered for divestiture or other exit activities.
During the year ended December 31, 2015, the Company's Motorparts segment recognized a $7 million adjustment (no income tax effect) which is included in “Gain (loss) from discontinued operations, net of tax” within the consolidated statement of operations.
7. DERIVATIVES AND HEDGING ACTIVITIES
The Company is exposed to market risk, such as fluctuations in foreign currency exchange rates, commodity prices, and changes in interest rates, which may result in cash flow risks. To manage the volatility relating to these exposures, the Company aggregates the exposures on a consolidated basis to take advantage of natural offsets. For exposures not offset within its operations, the Company enters into various derivative transactions pursuant to its risk management policies, which prohibit holding or issuing derivative financial instruments for speculative purposes, and designation of derivative instruments is performed on a transaction basis to support hedge accounting. The changes in fair value of these hedging instruments are offset in part or in whole by corresponding changes in the fair value or cash flows of the underlying exposures being hedged. The Company assesses the initial and ongoing effectiveness of its hedging relationships in accordance with its documented policy.
70
NOTES TO CONSOLIDATED FINANCIAL STATEMENTS - Continued
Commodity Price Risk
The Company’s production processes are dependent upon the supply of certain raw materials exposed to price fluctuations on the open market. The primary purpose of the Company’s commodity price forward contract activity is to manage the volatility associated with forecasted purchases. The Company monitors its commodity price risk exposures regularly to maximize the overall effectiveness of its commodity forward contracts. Principal raw materials hedged include, copper, nickel, zinc, tin, high-grade aluminum, and aluminum alloy. Forward contracts are used to mitigate commodity price risk associated with raw materials, generally related to purchases forecasts for up to eighteen months in the future.
Information regarding the Company’s outstanding commodity price hedge contracts are as follows:
December 31, | ||||||||
2016 | 2015 | |||||||
Combined notional value | $ | 16 | $ | 28 | ||||
Combined notional value designated as hedging instruments | $ | 16 | $ | 28 | ||||
Unrealized net gain (loss) recorded in “Accumulated other comprehensive loss” | $ | 2 | $ | (2 | ) | |||
Net asset (liability) position | $ | 4 | $ | (3 | ) | |||
The Company has designated these contracts as cash flow hedging instruments. The Company records unrecognized gains and losses in other comprehensive income and makes regular reclassifying adjustments into "Cost of products sold" within the condensed consolidated statement of operations when amounts are recognized. For amounts recognized in other comprehensive income (loss) and amounts reclassified out of other comprehensive income (loss) at December 31, 2016 and 2015 for these hedging instruments, see Note 18, Changes in Accumulated Other Comprehensive Loss by Component (Net of Tax). Substantially all of the commodity price hedge contracts mature within one year.
Foreign Currency Risk
The Company manufactures and sells its products in North America, South America, Asia, Europe, Australia, and Africa. As a result, the Company’s financial results could be significantly affected by factors such as changes in foreign currency exchange rates or weak economic conditions in foreign markets in which the Company manufactures and sells its products. The Company generally tries to use natural hedges within its foreign currency activities, including the matching of revenues and costs, to minimize foreign currency risk. Where natural hedges are not in place, the Company considers managing certain aspects of its foreign currency activities and larger transactions through the use of foreign currency options or forward contracts. Principal currencies hedged have historically included the euro, British pound and Polish zloty. Foreign currency forwards are also used in conjunction with the Company's commodity hedging program. In order to obtain critical terms match for commodity exposure, the Company engages in the use of foreign exchange contracts. The Company did not hold any foreign currency price hedge contracts at December 31, 2016 or December 31, 2015.
Concentrations of Credit Risk
Financial instruments including cash equivalents, derivative contracts, and accounts receivable, expose the Company to counterparty credit risk for non-performance. The Company’s counterparties for cash equivalents and derivative contracts are banks and financial institutions that meet the Company’s requirement of high credit standing. The Company’s counterparties for derivative contracts are substantial investment and commercial banks with significant experience using such derivatives. The Company manages its credit risk through policies requiring minimum credit standing and limiting credit exposure to any one counterparty and through monitoring counterparty credit risks. The Company’s concentration of credit risk related to derivative contracts at December 31, 2016 and 2015 is not material.
Other
The Company presents its derivative positions and any related material collateral under master netting agreements on a net basis. For derivatives designated as cash flow hedges, changes in the time value are excluded from the assessment of hedge effectiveness. Unrealized gains and losses associated with ineffective hedges, determined using the hypothetical derivative method, are recognized in “Other income (expense), net.” Derivative gains and losses included in accumulated other comprehensive loss for effective hedges are reclassified into operations upon recognition of the hedged transaction. Derivative gains and losses associated with undesignated hedges are recognized in “Other income (expense), net” for outstanding hedges and “Cost of products sold” or "Other income (expense), net” upon hedge maturity.
71
NOTES TO CONSOLIDATED FINANCIAL STATEMENTS - Continued
8. FAIR VALUE MEASUREMENTS AND FINANCIAL INSTRUMENTS
ASC Topic 820, Fair Value Measurements and Disclosures (“ASC 820”), clarifies fair value is an exit price, representing the amount to be received to sell an asset or paid to transfer a liability in an orderly transaction between market participants. As such, fair value is a market-based measurement that should be determined based upon assumptions market participants would use in pricing an asset or liability. As a basis for considering such assumptions, ASC 820 establishes a three-tier fair value hierarchy, which prioritizes the inputs used in measuring fair value as follows:
Level | 1: Observable inputs such as quoted prices in active markets; | |
Level | 2: Inputs, other than quoted prices in active markets, that are observable either directly or indirectly; and | |
Level | 3: Unobservable inputs in which there is little or no market data, which require the reporting entity to develop its own assumptions. | |
An asset’s or liability’s fair value measurement level within the fair value hierarchy is based on the lowest level of any input that is significant to the fair value measurement. Valuation techniques used need to maximize the use of observable inputs and minimize the use of unobservable inputs. The Company estimates the fair value of its derivative contracts using an income approach based on valuation techniques to convert future amounts to a single, discounted amount. Estimates of the fair value of foreign currency and commodity derivative instruments are determined using exchange traded prices and rates.
Items Measured at Fair Value on a Recurring Basis
Assets and liabilities measured and disclosed at fair value on a recurring basis at December 31, 2016 and 2015 are set forth in the table below:
Asset (Liability) | Level 2 | |||||||
December 31, 2016: | ||||||||
Commodity contracts | $ | 4 | $ | 4 | ||||
December 31, 2015: | ||||||||
Commodity contracts | $ | (3 | ) | $ | (3 | ) | ||
The Company calculates the fair value of its commodity contracts and foreign currency contracts using quoted commodity forward rates and quoted currency forward rates, to calculate forward values, and then discounts the forward values. The discount rates for all derivative contracts are based on quoted bank deposit rates.
Items Measured at Fair Value on a Nonrecurring Basis
In addition to items measured at fair value on a recurring basis, we also have assets that may be measured at fair value on a nonrecurring basis. These assets include, long-lived assets, intangible assets, and investments in affiliates which may be written down to fair value as a result of impairment.
The Company has determined the fair value measurements related to each of these assets rely primarily on Company-specific inputs and the Company's assumptions about the use of the assets, as observable inputs are not available. As such, the Company has determined that each of these fair value measurements reside within Level 3 of the fair value hierarchy. To determine the fair value of long-lived assets, the Company utilizes the projected cash flows expected to be generated by the long-lived assets, then discounts the future cash flows over the useful life of the long-lived assets by using a risk-adjusted rate for the Company.
During the year ended December 31, 2016 the Company did not record an impairment charge related to property, plant, and equipment. During the years ended December 31, 2015 and 2014, the Company recorded impairment charges of $20 million and $19 million related to property, plant, and equipment, which have been recorded within "Restructuring charges and asset impairments, net" in the consolidated statement of operations. The Company's impairments related to Goodwill are discussed further in Note 11, Goodwill and Other Intangible Assets.
72
NOTES TO CONSOLIDATED FINANCIAL STATEMENTS - Continued
The Company's investment in nonconsolidated affiliates is discussed further in Note 12, Investment in Nonconsolidated Affiliates.
Financial Instruments not Carried at Fair Value
Estimated fair values of the Company’s term loans under the Credit Agreement were:
As of December 31, | |||||||||||||||||
2016 | 2015 | ||||||||||||||||
Carrying Value | Fair Value | Carrying Value | Fair Value | Measurement Approach | |||||||||||||
Term Loans (Tranche B and C) | $ | 2,529 | $ | 2,512 | $ | 2,551 | $ | 2,273 | Level 2 | ||||||||
Fair value approximates carrying value for foreign debt as well as the U.S. revolver.
Fair market values are developed by the use of estimates obtained from brokers and other appropriate valuation techniques based on information available as of December 31, 2016 and 2015. The fair value estimates do not necessarily reflect the values the Company could realize in the current markets.
9. INVENTORIES
Net inventories consist of the following:
December 31 | December 31 | |||||||
2016 | 2015 | |||||||
Raw materials | $ | 239 | $ | 243 | ||||
Work-in-process | 170 | 170 | ||||||
Finished products | 912 | 929 | ||||||
1,321 | 1,342 | |||||||
10. PROPERTY, PLANT AND EQUIPMENT
The following table summarizes the components of Property, plant, and equipment, net:
December 31 | December 31 | ||||||||||
Useful Life | 2016 | 2015 | |||||||||
Land | — | $ | 237 | $ | 252 | ||||||
Buildings and building improvements | 10 - 39 years | 563 | 536 | ||||||||
Machinery and equipment | 3 - 12 years | 3,200 | 3,054 | ||||||||
4,000 | 3,842 | ||||||||||
Accumulated depreciation | (1,666 | ) | (1,489 | ) | |||||||
$ | 2,334 | $ | 2,353 | ||||||||
Depreciation expense for the years ended December 31, 2016, 2015, and 2014 was $316 million, $280 million, and $285 million.
73
The Company leases property, plant, and equipment used in its operations. Future minimum payments under non-cancelable operating leases with initial or remaining terms of more than one year are as follows:
2017 | $ | 65 | ||
2018 | 55 | |||
2019 | 47 | |||
2020 | 41 | |||
2021 | 36 | |||
Thereafter | 60 | |||
$ | 304 | |||
Total rental expense under operating leases for the years ended December 31, 2016, 2015, and 2014 was $84 million, $84 million, and $70 million, exclusive of property taxes, insurance and other occupancy costs generally payable by the Company.
11. GOODWILL AND OTHER INTANGIBLE ASSETS
At December 31, 2016 and 2015, goodwill consists of the following:
December 31, 2016 | |||||||||||
Powertrain | Motorparts | Total | |||||||||
Gross carrying amount, January 1 | $ | 648 | $ | 809 | $ | 1,457 | |||||
Acquisitions and purchase accounting adjustments | 6 | — | 6 | ||||||||
Foreign exchange | — | — | — | ||||||||
Gross carrying amount, December 31 | $ | 654 | $ | 809 | $ | 1,463 | |||||
Accumulated impairment, January 1 | $ | (136 | ) | $ | (648 | ) | (784 | ) | |||
Impairment | (6 | ) | — | (6 | ) | ||||||
Accumulated impairment, December 31 | $ | (142 | ) | $ | (648 | ) | $ | (790 | ) | ||
Net carrying value, December 31 | $ | 512 | $ | 161 | $ | 673 | |||||
December 31, 2015 | |||||||||||
Powertrain | Motorparts | Total | |||||||||
Gross carrying amount, January 1 | $ | 582 | $ | 809 | $ | 1,391 | |||||
Acquisitions and purchase accounting adjustments | 74 | — | 74 | ||||||||
Foreign exchange | (8 | ) | — | (8 | ) | ||||||
Gross carrying amount, December 31 | $ | 648 | $ | 809 | $ | 1,457 | |||||
Accumulated impairment, January 1 | $ | (92 | ) | $ | (598 | ) | $ | (690 | ) | ||
Impairment | (44 | ) | (50 | ) | (94 | ) | |||||
Accumulated impairment, December 31 | $ | (136 | ) | $ | (648 | ) | $ | (784 | ) | ||
Net carrying value, December 31 | $ | 512 | $ | 161 | $ | 673 | |||||
74
NOTES TO CONSOLIDATED FINANCIAL STATEMENTS - Continued
At December 31, 2016 and 2015, intangible assets consist of the following:
December 31, 2016 | December 31, 2015 | |||||||||||||||||||||||
Gross Carrying Amount | Accumulated Amortization | Net Carrying Amount | Gross Carrying Amount | Accumulated Amortization | Net Carrying Amount | |||||||||||||||||||
Definite-lived intangible assets: | ||||||||||||||||||||||||
Developed technology | $ | 138 | $ | (100 | ) | $ | 38 | $ | 140 | $ | (86 | ) | $ | 54 | ||||||||||
Customer relationships | 682 | (377 | ) | 305 | 683 | (333 | ) | 350 | ||||||||||||||||
$ | 820 | $ | (477 | ) | $ | 343 | $ | 823 | $ | (419 | ) | $ | 404 | |||||||||||
Indefinite-lived intangible assets: | ||||||||||||||||||||||||
Trademarks and brand names | $ | 228 | $ | 230 | ||||||||||||||||||||
The Company's recorded amortization expense associated with definite-lived intangible assets was:
Year Ended | |||||||||||
December 31, | |||||||||||
2016 | 2015 | 2014 | |||||||||
Amortization expense | $ | 58 | $ | 59 | $ | 49 | |||||
The Company utilizes the straight line method of amortization, recognized over the estimated useful lives of the assets. The Company’s developed technology intangible assets have useful lives of between 9 and 15 years. The Company’s customer relationships intangible assets have useful lives of between 2 and 24 years.
The Company’s estimated future amortization expense for its definite-lived intangible assets is as follows:
2017 | 2018 | 2019 | 2020 | 2021 | Thereafter | Total | |||||||||||||||||
Expected amortization expense | $ | 58 | 49 | 49 | 49 | 49 | 89 | $ | 343 | ||||||||||||||
Goodwill
The Company conducts its assessment for goodwill impairments on October 1 of each year for all reporting units.
Powertrain
Based on completion of a preliminary 2015 annual goodwill impairment test, the Company determined goodwill was impaired for three reporting units within the Powertrain segment, as the fair values decreased below their carrying values. The decreases in fair values during 2015 were driven by decreases in operating results for these reporting units. Based on the results of the preliminary annual goodwill impairment test, an estimate of goodwill impairment charges of $44 million was recorded in the year ended December 31, 2015 in the Powertrain segment. Due to the complexity of the second step goodwill impairment test, the Company did not finalize its assessment prior to filing its 2015 annual report.
As a result of finalizing its 2015 annual impairment assessment during the six-months ended June 30, 2016, the Company recorded an additional impairment charges of $6 million in the year ended December 31, 2016. Based on the results of the 2016 annual impairment assessment, there were no goodwill impairment charges in the year ended December 31, 2016 in the Powertrain segment.
Motorparts
Based on the results of the annual goodwill impairment tests, there were no goodwill impairment charges recorded in the year ended December 31, 2016 in the Motorparts segment.
As part of an interim goodwill impairment test as of September 30, 2015, the Company determined there were impairment indicators for one of its reporting units and conducted an impairment analysis. Decreases in operating results for certain reporting units as a result of the negative effect of exchange rates and negative economic conditions resulted in impairment indicators prior to the annual impairment assessment. Based on the results of the interim goodwill impairment tests, a goodwill impairment charge of $56 million was recorded in the year ended December 31, 2015 in the Motorparts segment.
75
NOTES TO CONSOLIDATED FINANCIAL STATEMENTS - Continued
For the year ended December 31, 2014, the Company noted impairment indicators existed in one reporting unit within the Motorparts segment. Among other factors, this reporting unit experienced lower than expected profits and cash flows resulting from decreases in volumes and pricing pressure from customers towards the end of 2014. As a result of these impairment indicators, the Company concluded there was also a potential impairment of its long-lived assets and definite-lived intangible assets. These impairment tests were performed before the goodwill impairment test, and an impairment loss related to long-lived assets of $7 million was recognized prior to goodwill being tested for impairment.
The Company then tested goodwill for impairment and determined the carrying value of one reporting unit, within the Motorparts segment, exceeded its fair value. Accordingly, as part of a step two goodwill impairment test, the Company made a preliminary conclusion the carrying amount of the reporting unit's goodwill exceeded the implied fair value of goodwill and an impairment loss of $120 million was recognized for the year ended December 31, 2014.
Due to the complexity of the 2014 second step goodwill impairment test, the Company did not finalize its assessment until the first quarter of 2015. During the three months ended March 31, 2015, the Company concluded its assessment of the step two goodwill impairment analysis as of October 1, 2014 and recorded a reduction of $6 million to its initial estimate of the goodwill impairment charge for the year ended December 31, 2014.
Fair Value Measurements
The fair values of the Company's reporting units were determined based on valuation techniques using the best available information, primarily discounted cash flow projections. These fair values require the Company to make significant assumptions and estimates about the extent and timing of future cash flows, growth rates, market share, and discount rates that represent unobservable inputs into our valuation methodologies. The cash flows are estimated over a significant future period of time, which makes those estimates and assumptions subject to a high degree of uncertainty. Where available and as appropriate, comparative market multiples and the quoted market price of our common stock are used to corroborate the results of the discounted cash flow method. Assumptions used in the discounted cash flow analysis that have the most significant effect on the estimated fair value of the Company's reporting units are the weighted average cost of capital and revenue growth-rates.
Other Intangible Assets
The Company performs its annual trademarks and brand names impairment analysis as of October 1, or more frequently, if impairment indicators exist. This impairment analysis compares the fair values of these assets to the related carrying values, and impairment charges are recorded for any excess of carrying values over fair values. The fair values are based upon the prospective stream of hypothetical after-tax royalty cost savings discounted at rates that reflect the rates of return appropriate for these intangible assets.
The Company had no trademark and brand name impairments from the October 1, 2016, 2015, and 2014 impairment analyses.
12. INVESTMENT IN NONCONSOLIDATED AFFILIATES
The Company maintains investments in several nonconsolidated affiliates, which are primarily located in China, Korea, Turkey, India, and the U.S. With the exception of the deconsolidated business discussed below, the Company generally equates control to ownership percentage whereby investments more than 50% owned are consolidated.
As of December 31, 2016 and 2015, the Company's investment in affiliates was $270 million and $296 million, respectively.
76
NOTES TO CONSOLIDATED FINANCIAL STATEMENTS - Continued
The Company's beneficial ownership in affiliates accounted for under the equity method is as follows:
As of December 31, | |||||||||
2016 | 2015 | 2014 | |||||||
Anqing TP Goetze Piston Ring Company Limited (China) | 35.7 | % | 35.7 | % | 35.7 | % | |||
Dongsuh Federal-Mogul Limited (Korea) | 50.0 | % | 50.0 | % | 50.0 | % | |||
Federal-Mogul Piston Segman ve Gomlek Uretim Tesisleri AS. (Turkey) | — | % | — | % | 50.0 | % | |||
Federal-Mogul Motorparts Otomotiv A.S (Turkey) | — | % | 50.0 | % | — | % | |||
Federal-Mogul Powertrain Otomotiv A.S (Turkey) | 50.0 | % | 50.0 | % | — | % | |||
Federal-Mogul Dis Ticaret A.S. (Turkey) | 50.0 | % | 50.0 | % | 50.0 | % | |||
Federal-Mogul Izmit Piston ve Pim Uretim Tesisleri A.S. (Turkey) | 43.0 | % | 43.0 | % | 43.0 | % | |||
Federal-Mogul TP Liners Inc. (U.S.) | 46.0 | % | 46.0 | % | 46.0 | % | |||
KB Autosys Co, Ltd. (Korea) | 33.6 | % | 33.6 | % | 33.6 | % | |||
Federal-Mogul TP Liner Europe Otomotiv Limited Sirketi (Turkey) | 25.0 | % | 25.0 | % | 25.0 | % | |||
Farloc Argentina S.A.I.C. Y F. (Argentina) | 23.9 | % | 23.9 | % | 23.9 | % | |||
Frenos Hidraulicos Automotrices S.A. de C.V. (Mexico) | 49.0 | % | 49.0 | % | 49.0 | % | |||
VTD Vakuum Technik Dresden (Germany) (a) | 100.0 | % | 30.0 | % | — | % | |||
Anqing TP Powder Metallurgy Co., Ltd (China) | 20.0 | % | 20.0 | % | — | % | |||
Federal-Mogul CAIEC Automotive Technology (China) | 45.0 | % | — | % | — | % | |||
(a)On April 1, 2016 the Company acquired the remaining 70% interest in VTD Vakuum Technik Dresden (Germany) for a purchase price of $2 million. The prior affiliate has been accounted for as a consolidated subsidiary since its acquisition. | |||||||||
In January 2015, Federal-Mogul Piston Segman ve Gomlek Uretim Tesisleri A.S was dissolved to form two separate joint ventures, Federal-Mogul Motorparts Otomotiv A.S and Federal-Mogul Powertrain Otomotiv A.S. The Company retained a 50% noncontrolling interest in the new joint ventures. In July of 2016, Federal-Mogul Motorparts Otomotiv A.S merged with Federal-Mogul Powertrain Otomotiv A.S with the surviving entity being Federal-Mogul Powertrain Otomotiv A.S. This entity, along with Federal-Mogul Izmit Piston ve Pim Uretim Tesisleri A.S. and Federal-Mogul Dis Ticaret A.S., are collectively referred to herein as the Turkey JVs.
As part of the regulatory approval related to the 2014 acquisition of the Honeywell brake component business, the Company committed to divest, or procure the divestiture of the commercial and light vehicle brake pads business relating to the OEM market in the European Economic Area. As such, the Company deconsolidated these subsidiaries and accounted for them as equity method investments until disposition, which have not been included in the table above. The disposition was completed in the first quarter of 2015. As a result, the Company recognized an $11 million loss on disposal recorded in the line item "Other income (expense), net" in the consolidated statements of operations.
The following table represents amounts reflected in the Company’s financial statements related to nonconsolidated affiliates:
Year Ended December 31 | ||||||||||||
2016 | 2015 | 2014 | ||||||||||
Equity earnings of nonconsolidated affiliates, net of tax | $ | 59 | $ | 56 | $ | 48 | ||||||
Cash dividends received from nonconsolidated affiliates | $ | 77 | $ | 11 | $ | 25 | ||||||
At December 31, 2016 and 2015, the carrying amount of our investments in the Turkey JVs exceeded our share of the underlying net assets by $35 million and $37 million. These differences primarily relate to goodwill and other intangible assets.
77
NOTES TO CONSOLIDATED FINANCIAL STATEMENTS - Continued
The following tables present summarized aggregated financial information of the Company’s nonconsolidated affiliates as of and for the year ended December 31, 2016:
Turkey JVs | Anqing TP Goetze | Other | Total | |||||||||||||
Statements of Operations | ||||||||||||||||
Sales | $ | 354 | $ | 156 | $ | 459 | $ | 969 | ||||||||
Gross profit | $ | 79 | $ | 49 | $ | 98 | $ | 226 | ||||||||
Income from continuing operations | $ | 64 | $ | 48 | $ | 60 | $ | 172 | ||||||||
Net income | $ | 55 | $ | 48 | $ | 55 | $ | 158 | ||||||||
Turkey JVs | Anqing TP Goetze | Other | Total | |||||||||||||
Balance Sheets | ||||||||||||||||
Current assets | $ | 216 | $ | 107 | $ | 213 | $ | 536 | ||||||||
Noncurrent assets | $ | 220 | $ | 128 | $ | 173 | $ | 521 | ||||||||
Current liabilities | $ | 114 | $ | 47 | $ | 101 | $ | 262 | ||||||||
Noncurrent liabilities | $ | 80 | $ | — | $ | 38 | $ | 118 | ||||||||
The following tables present summarized aggregated financial information of the Company’s nonconsolidated affiliates as of and for the year ended December 31, 2015:
Turkey JVs | Anqing TP Goetze | Other | Total | |||||||||||||
Statements of Operations | ||||||||||||||||
Sales | $ | 327 | $ | 164 | $ | 396 | $ | 887 | ||||||||
Gross profit | $ | 74 | $ | 51 | $ | 53 | $ | 178 | ||||||||
Income from continuing operations | $ | 63 | $ | 52 | $ | 29 | $ | 144 | ||||||||
Net income | $ | 52 | $ | 52 | $ | 29 | $ | 133 | ||||||||
Turkey JVs | Anqing TP Goetze | Other | Total | |||||||||||||
Balance Sheets | ||||||||||||||||
Current assets | $ | 167 | $ | 123 | $ | 167 | $ | 457 | ||||||||
Noncurrent assets | $ | 199 | $ | 122 | $ | 174 | $ | 495 | ||||||||
Current liabilities | $ | 43 | $ | 44 | $ | 84 | $ | 171 | ||||||||
Noncurrent liabilities | $ | 44 | $ | — | $ | 41 | $ | 85 | ||||||||
78
NOTES TO CONSOLIDATED FINANCIAL STATEMENTS - Continued
The following table presents summarized aggregated financial information of the Company’s nonconsolidated affiliates as of and for the year ended December 31, 2014:
Turkey JVs | Anqing TP Goetze | Other | Total | |||||||||||||
Statements of Operations | ||||||||||||||||
Sales | $ | 357 | $ | 167 | $ | 382 | $ | 906 | ||||||||
Gross profit | $ | 90 | $ | 54 | $ | 48 | $ | 192 | ||||||||
Income from continuing operations | $ | 70 | $ | 47 | $ | 11 | $ | 128 | ||||||||
Net income | $ | 56 | $ | 47 | $ | 9 | $ | 112 | ||||||||
Turkey JVs | Anqing TP Goetze | Other | Total | |||||||||||||
Balance Sheets | ||||||||||||||||
Current assets | $ | 155 | $ | 107 | $ | 135 | $ | 397 | ||||||||
Noncurrent assets | $ | 151 | $ | 115 | $ | 177 | $ | 443 | ||||||||
Current liabilities | $ | 43 | $ | 42 | $ | 96 | $ | 181 | ||||||||
Noncurrent liabilities | $ | 3 | $ | — | $ | 44 | $ | 47 | ||||||||
The Company does not hold a controlling interest in the Turkey JVs. The Turkey JVs were established for the purpose of manufacturing and marketing automotive parts, including pistons, piston rings, piston pins, and cylinder liners to OE and aftermarket customers. Purchases from the Turkey JVs for the years ended December 31, 2016, 2015, and 2014 were $173 million, $144 million, and $180 million. Sales to the Turkey JVs for the years ended December 31, 2016, 2015, and 2014 were $65 million, $56 million, and $45 million. The Company had net accounts receivable balances with the Turkey JVs of $3 million as of December 31, 2016 and 2015.
13. DEBT
The Company has a revolving line of credit in the U.S. ("Revolver"), which provides for (i) aggregate commitments available of $600 million (ii) a maturity date of December 6, 2018, subject to certain limited exceptions, and (iii) additional liquidity of the Company's borrowing base. Advances under the Revolver generally bear interest at a variable rate per annum equal to (i) the Alternate Base Rate (as defined in the agreement) plus an adjustable margin of 0.50% to 1.00% based on the average monthly availability or (ii) Adjusted LIBOR Rate (as defined in the agreement) plus a margin of 1.50% to 2.00% based on the average monthly availability. An unused commitment fee of 0.375% is also payable under the terms of the Revolver. As of December 31, 2015, the borrowing capacity under the Revolver was $550 million.
On April 15, 2014, the Company entered into a new tranche B term loan facility (the “New Tranche B Facility”) and a new tranche C term loan facility (the “New Tranche C Facility,” and together with the New Tranche B Facility, the “New Term Facilities”). In connection with the New Term Facilities and Revolver, the Company incurred original issue discount of $11 million and debt issuance costs of $12 million. The discount and debt issuance costs are being amortized to interest expense over 48 to 84 months.
Immediately following the closing of the New Term Facilities, the Company contributed the net proceeds from the New Term Facilities and repaid its existing outstanding indebtedness as a borrower under the tranche B and tranche C term loan facilities. As a result, a $24 million non-cash loss on the extinguishment of debt attributable to the write-off of the unamortized fair value adjustment and unamortized debt issuance costs was recognized as a “Loss on debt extinguishment” in the year ended December 31, 2014.
The New Term Facilities, among other things, (i) provides for aggregate commitments under the New Tranche B Facility of $700 million with a maturity date of April 15, 2018, (ii) provides for aggregate commitments under the New Tranche C Facility of $1.9 billion with a maturity date of April 15, 2021, (iii) increases the interest rates applicable to the New Facilities as described below, (iv) provides that for all outstanding letters of credit there is a corresponding decrease in borrowings available under the Revolver, (v) provides that in the event that as of a particular determination date more than $700 million aggregate principal amount of existing term loans and certain related refinancing indebtedness will become due within 91 days of such
79
NOTES TO CONSOLIDATED FINANCIAL STATEMENTS - Continued
determination date, the Revolver will mature on such determination date, (vi) provides for additional incremental indebtedness, secured on a pari passu basis, of an unlimited amount of additional indebtedness if the Company meets a financial covenant incurrence test, and (vii) amends certain other restrictive covenants.
Borrowings under the New Tranche B Facility generally bear interest at a variable rate per annum equal to (i) the Alternate Base Rate plus a margin of 2.00% or (ii) the Adjusted LIBOR Rate plus a margin of 3.00%, subject, in each case, to a floor of 1.00%. Borrowings under the New Tranche C Facility generally bear interest at a variable rate per annum equal to (i) the Alternate Base Rate plus a margin of 2.75% or (ii) the Adjusted LIBOR Rate plus a margin of 3.75%, subject, in each case, to a minimum rate of 1.00% plus the applicable margin.
The obligations of the Company under the Revolver and New Term Facilities credit agreement are guaranteed by substantially all of the domestic subsidiaries and certain foreign subsidiaries of the Company, and are secured by substantially all personal property and certain real property of the Company and such guarantors, subject to certain limitations. The liens granted to secure these obligations and certain cash management and hedging obligations have first priority. As such, the Company's availability is limited by borrowing base conditions.
The Revolver and New Term Facilities credit agreement also contains certain affirmative and negative covenants and events of default, including, subject to certain exceptions, restrictions on incurring additional indebtedness, mandatory prepayment provisions associated with specified asset sales and dispositions, and limitations on: i) investments; ii) certain acquisitions, mergers or consolidations; iii) sale and leaseback transactions; iv) certain transactions with affiliates; and v) dividends and other payments in respect of capital stock. The Company was in compliance with all debt covenants as of December 31, 2016 and 2015.
The following is a summary of debt outstanding as of December 31, 2016 and 2015:
December 31 | ||||||||
2016 | 2015 | |||||||
Term loans under credit agreement: | ||||||||
Revolver | $ | 345 | $ | 340 | ||||
Tranche B term loan | 684 | 691 | ||||||
Tranche C term loan | 1,857 | 1,876 | ||||||
Debt discount | (6 | ) | (8 | ) | ||||
Unamortized debt issuance fees | (7 | ) | (10 | ) | ||||
Other debt, primarily foreign instruments | 152 | 163 | ||||||
3,025 | 3,052 | |||||||
Less: | ||||||||
Short-term debt, including current maturities of long-term debt | (142 | ) | (138 | ) | ||||
Total long-term debt | $ | 2,883 | $ | 2,914 | ||||
The total availability under U.S. credit facilities was $213 million and $170 million as of December 31, 2016 and 2015. The Company had $37 million and $40 million of letters of credit outstanding as of December 31, 2016 and 2015. To the extent letters of credit associated with the Revolver are issued, there is a corresponding decrease in borrowings available under this facility. Availability under the Company's Revolver was limited by borrowing base conditions as of December 31, 2016.
In addition, the Company had additional availability under foreign lines of credit of $60 million and $59 million as of December 31, 2016 and 2015. The Company had $8 million and $3 million of foreign letters of credit outstanding as of December 31, 2016 and 2015. To the extent foreign letters of credit associated with the foreign credit facilities are issued, there is a corresponding decrease in borrowings available under these facilities.
80
NOTES TO CONSOLIDATED FINANCIAL STATEMENTS - Continued
Interest expense associated with the amortization of the debt issuance costs recognized in the Company’s condensed consolidated statements of operations, consists of the following:
Year Ended December 31 | ||||||||||||
2016 | 2015 | 2014 | ||||||||||
Amortization of debt discount | $ | — | $ | — | $ | 7 | ||||||
Amortization of debt issuance fees | 3 | 3 | 3 | |||||||||
Amortization of original issue discount | 2 | 2 | 1 | |||||||||
$ | 5 | $ | 5 | $ | 11 | |||||||
The Company has the following contractual debt obligations outstanding at December 31, 2016:
2017 | $ | 142 | ||
2018 | 1,050 | |||
2019 | 27 | |||
2020 | 25 | |||
2021 | 1,788 | |||
Thereafter | 6 | |||
Total | $ | 3,038 | ||
The weighted average cash interest rates for debt were approximately 4.3% and 4.4% as of December 31, 2016 and 2015. Interest paid on debt for the years ended December 31, 2016, 2015, and 2014 was $139 million, $133 million, and $111 million.
14. ACCRUED LIABILITIES
Accrued liabilities consist of the following:
December 31 | ||||||||
2016 | 2015 | |||||||
Accrued compensation | $ | 179 | $ | 169 | ||||
Accrued rebates | 159 | 170 | ||||||
Restructuring liabilities | 55 | 71 | ||||||
Non-income tax payable | 42 | 53 | ||||||
Alleged defective products | 18 | 32 | ||||||
Accrued professional services | 27 | 29 | ||||||
Accrued income taxes | 32 | 27 | ||||||
Accrued product returns | 25 | 20 | ||||||
Accrued warranty | 17 | 11 | ||||||
$ | 554 | $ | 582 | |||||
15. PENSIONS AND OTHER POSTRETIREMENT BENEFITS
Defined Contribution Pension Plans
The Company maintains certain defined contribution pension plans for eligible employees. Effective January 1, 2013, the Company amended its U.S. defined contribution plan to allow for an enhanced company match and company provided age-based contributions for eligible U.S. salaried and non-union hourly employees. The total expenses attributable to the Company’s defined contribution savings plan were $43 million, $45 million, and $45 million for the years ended December 31, 2016, 2015, and 2014.
The amounts contributed to defined contribution pension plans include contributions to multi-employer plans in France, Italy, and the U.S. of $1 million during each of the years ended December 31, 2016, 2015, and 2014. None of the multiemployer plans in which the Company participates are individually significant.
81
NOTES TO CONSOLIDATED FINANCIAL STATEMENTS - Continued
Defined Benefit Plans
The Company sponsors defined benefit pension plans, and health care and life insurance benefits for certain employees and retirees around the world. The Company’s defined benefit pension and postretirement benefit plans other than pensions are accounted for in accordance with ASC Topic 715, Compensation – Retirement Benefits. There is also an unfunded nonqualified pension plan primarily covering U.S. executives.
The funding policy for qualified defined benefit pension plans is to contribute the minimum required by applicable laws and regulations or to directly pay benefit payments where appropriate. At December 31, 2016, all legal funding requirements had been met. The Company expects to contribute $45 million to its U.S. qualified plans, $1 million to its U.S. non-qualified plans, $29 million to its non-U.S. pension plans, and $23 million to its other postretirement plans in 2017.
Other Benefits
The Company accounts for benefits to former or inactive employees paid after employment but before retirement pursuant to ASC Topic 712, Compensation – Nonretirement Postemployment Benefits. The liabilities for such U.S. and European postemployment benefits were $60 million and $59 million at December 31, 2016 and 2015.
82
NOTES TO CONSOLIDATED FINANCIAL STATEMENTS - Continued
The measurement date for all defined benefit plans is December 31. The following provides a reconciliation of the plans’ benefit obligations, plan assets, funded status and recognition in the consolidated balance sheets:
Pension Benefits | Other Postretirement | |||||||||||||||||||||||
U.S. Plans | Non-U.S. Plans | Benefits | ||||||||||||||||||||||
2016 | 2015 | 2016 | 2015 | 2016 | 2015 | |||||||||||||||||||
Change in benefit obligation: | ||||||||||||||||||||||||
Benefit obligation, beginning of year | $ | 1,221 | $ | 1,291 | $ | 487 | $ | 575 | $ | 323 | $ | 368 | ||||||||||||
Service cost | 3 | 3 | 14 | 16 | — | — | ||||||||||||||||||
Interest cost | 49 | 48 | 13 | 10 | 14 | 13 | ||||||||||||||||||
Employee contributions | — | — | — | — | — | — | ||||||||||||||||||
Benefits paid | (98 | ) | (89 | ) | (21 | ) | (24 | ) | (24 | ) | (23 | ) | ||||||||||||
Medicare subsidies received | — | — | — | — | 2 | 3 | ||||||||||||||||||
Plan amendments | — | — | — | — | — | — | ||||||||||||||||||
Curtailments | — | — | (1 | ) | (3 | ) | — | — | ||||||||||||||||
Settlements | — | — | (4 | ) | — | — | — | |||||||||||||||||
Contractual termination benefit | — | — | — | — | — | — | ||||||||||||||||||
Actuarial losses (gains) and changes in actuarial assumptions | (8 | ) | (32 | ) | 39 | (75 | ) | (21 | ) | (35 | ) | |||||||||||||
Net transfers (out) in | — | — | — | 45 | — | |||||||||||||||||||
Other | — | — | — | — | — | — | ||||||||||||||||||
Currency translation | — | — | (17 | ) | (57 | ) | 1 | (3 | ) | |||||||||||||||
Benefit obligation, end of year | $ | 1,167 | $ | 1,221 | $ | 510 | $ | 487 | $ | 295 | $ | 323 | ||||||||||||
Change in plan assets: | ||||||||||||||||||||||||
Fair value of plan assets, beginning of year | $ | 870 | $ | 912 | $ | 57 | $ | 54 | $ | — | $ | — | ||||||||||||
Actual return on plan assets | 45 | (27 | ) | 3 | 2 | — | — | |||||||||||||||||
Employee contributions | — | — | — | — | — | — | ||||||||||||||||||
Settlements | — | — | (4 | ) | — | — | — | |||||||||||||||||
Company contributions | 39 | 74 | 30 | 30 | 22 | 20 | ||||||||||||||||||
Benefits paid | (98 | ) | (89 | ) | (21 | ) | (24 | ) | (24 | ) | (23 | ) | ||||||||||||
Expenses | — | — | — | — | — | — | ||||||||||||||||||
Acquisitions / divestitures | — | — | 1 | — | — | — | ||||||||||||||||||
Medicare subsidies received | — | — | — | — | 2 | 3 | ||||||||||||||||||
Currency translation | — | — | (3 | ) | (5 | ) | — | — | ||||||||||||||||
Fair value of plan assets, end of year | $ | 856 | $ | 870 | $ | 63 | $ | 57 | $ | — | $ | — | ||||||||||||
Funded status of the plan | $ | (311 | ) | $ | (351 | ) | $ | (447 | ) | $ | (430 | ) | $ | (295 | ) | $ | (323 | ) | ||||||
Amounts recognized in the consolidated balance sheets: | ||||||||||||||||||||||||
Current liabilities | $ | (1 | ) | $ | (2 | ) | $ | (13 | ) | $ | (14 | ) | $ | (23 | ) | $ | (24 | ) | ||||||
Noncurrent liabilities(a) | (310 | ) | (349 | ) | (434 | ) | (416 | ) | (272 | ) | (299 | ) | ||||||||||||
Net amount recognized | $ | (311 | ) | $ | (351 | ) | $ | (447 | ) | $ | (430 | ) | $ | (295 | ) | $ | (323 | ) | ||||||
Amounts recognized in accumulated other comprehensive loss, inclusive of tax effects: | ||||||||||||||||||||||||
Net actuarial loss (gain) | $ | 435 | $ | 452 | $ | 93 | $ | 72 | $ | 34 | $ | 56 | ||||||||||||
Prior service cost (credit) | — | — | 1 | 1 | (6 | ) | (10 | ) | ||||||||||||||||
Total | $ | 435 | $ | 452 | $ | 94 | $ | 73 | $ | 28 | $ | 46 | ||||||||||||
(a) The "Pension and Other Postretirement Benefits" line in the consolidated balance sheet includes $60 million and $59 million of postemployment benefits which are not included in the table above. | ||||||||||||||||||||||||
83
NOTES TO CONSOLIDATED FINANCIAL STATEMENTS - Continued
Information for defined benefit plans with projected benefit obligations in excess of plan assets:
Pension Benefits | Other Postretirement | |||||||||||||||||||||||
U.S. Plans | Non-U.S. Plans | Benefits | ||||||||||||||||||||||
2016 | 2015 | 2016 | 2015 | 2016 | 2015 | |||||||||||||||||||
Projected benefit obligation | $ | 1,167 | $ | 1,221 | $ | 509 | $ | 486 | $ | 295 | $ | 323 | ||||||||||||
Fair value of plan assets | $ | 856 | $ | 870 | $ | 62 | $ | 56 | $ | — | $ | — | ||||||||||||
Information for pension plans with accumulated benefit obligations in excess of plan assets:
Pension Benefits | ||||||||||||||||
U.S. Plans | Non-U.S. Plans | |||||||||||||||
2016 | 2015 | 2016 | 2015 | |||||||||||||
Projected benefit obligation | $ | 1,167 | $ | 1,221 | $ | 494 | $ | 482 | ||||||||
Accumulated benefit obligation | $ | 1,167 | $ | 1,221 | $ | 459 | $ | 445 | ||||||||
Fair value of plan assets | $ | 856 | $ | 870 | $ | 50 | $ | 53 | ||||||||
The accumulated benefit obligation for all pension plans is $1,636 million and $1,669 million as of December 31, 2016 and 2015.
The following table summarizes the components of net periodic benefit cost (credit) along with the assumptions used to determine the benefit obligations for the years ended December 31:
Pension Benefits | Other Postretirement | |||||||||||||||||||||||||||||||||||
U.S. Plans | Non-U.S. Plans | Benefits | ||||||||||||||||||||||||||||||||||
2016 | 2015 | 2014 | 2016 | 2015 | 2014 | 2016 | 2015 | 2014 | ||||||||||||||||||||||||||||
Components of expense | ||||||||||||||||||||||||||||||||||||
Service cost | $ | 3 | $ | 3 | $ | 3 | $ | 14 | $ | 16 | $ | 12 | $ | — | $ | — | $ | — | ||||||||||||||||||
Interest cost | 49 | 48 | 52 | 13 | 10 | 16 | 14 | 13 | 15 | |||||||||||||||||||||||||||
Expected return on plan assets | (48 | ) | (59 | ) | (62 | ) | (2 | ) | (2 | ) | (2 | ) | — | — | — | |||||||||||||||||||||
Amortization of actuarial losses | 12 | 10 | 4 | 5 | 11 | 5 | 2 | 5 | 3 | |||||||||||||||||||||||||||
Amortization of prior service credit | — | — | — | — | — | — | (4 | ) | (4 | ) | (5 | ) | ||||||||||||||||||||||||
Settlement loss (gain) | — | — | (3 | ) | 1 | — | 1 | — | — | — | ||||||||||||||||||||||||||
Curtailment gain | — | — | — | (1 | ) | (2 | ) | — | — | — | — | |||||||||||||||||||||||||
Net periodic cost (credit) | $ | 16 | $ | 2 | $ | (6 | ) | $ | 30 | $ | 33 | $ | 32 | $ | 12 | $ | 14 | $ | 13 | |||||||||||||||||
Weighted-average assumptions used to determine benefit obligations | ||||||||||||||||||||||||||||||||||||
Discount rate | 3.90 | % | 4.15 | % | 3.85 | % | 2.03 | % | 2.72 | % | 1.77 | % | 3.98 | % | 4.18 | % | 3.84 | % | ||||||||||||||||||
Rate of compensation increase | n/a | n/a | n/a | 2.96 | % | 3.19 | % | 3.16 | % | n/a | n/a | n/a | ||||||||||||||||||||||||
Weighted-average assumptions used to determine net expense | ||||||||||||||||||||||||||||||||||||
Discount rate | 4.15 | % | 3.85 | % | 4.55 | % | 2.72 | % | 1.77 | % | 3.49 | % | 4.18 | % | 3.84 | % | 4.45 | % | ||||||||||||||||||
Expected rate of return on plan assets | 5.65 | % | 6.55 | % | 6.95 | % | 3.22 | % | 3.52 | % | 4.18 | % | n/a | n/a | n/a | |||||||||||||||||||||
Rate of compensation increase | n/a | n/a | n/a | 3.19 | % | 3.16 | % | 3.17 | % | n/a | n/a | n/a | ||||||||||||||||||||||||
Estimated amounts to be amortized from accumulated other comprehensive loss into net periodic benefit cost in the year ending December 31, 2017 based on December 31, 2016 plan measurements are $9 million, consisting primarily of amortization of the net actuarial loss in the U.S. pension plans.
Long-term Rate of Return
The Company’s expected return on assets is established annually through analysis of anticipated future long-term investment performance for the plan based upon the asset allocation strategy and is primarily a long-term prospective rate.
84
NOTES TO CONSOLIDATED FINANCIAL STATEMENTS - Continued
The study was performed in December 2016 resulting in changes to the expected long-term rate of return on assets. The weighted-average long-term rate of return on assets for the U.S. pension plans decreased from 5.65% at December 31, 2015 to 5.55% at December 31, 2016. The expected long-term rate of return on plan assets used in determining pension expense for non-U.S. plans is determined in a similar manner to the U.S. plans and decreased from 3.22% at December 31, 2015 to 3.05% at December 31, 2016.
Health Care Trend
The assumed health care and drug cost trend rates used to measure next year’s postretirement healthcare benefits are as follows:
Other Postretirement Benefits | ||||||
2016 | 2015 | |||||
Initial health care cost trend rate | 6.69 | % | 6.97 | % | ||
Ultimate health care cost trend rate | 5.00 | % | 5.00 | % | ||
Year ultimate health care cost trend rate reached | 2022 | 2022 | ||||
The assumed health care cost trend rate has a significant effect on the amounts reported for Other Postretirement Benefits plans. The following table illustrates the sensitivity to a change in the assumed health care cost trend rate:
Total Service and Interest Cost | APBO | |||||||
100 basis point (“bp”) increase in health care cost trend rate | $ | 1 | $ | 24 | ||||
100 bp decrease in health care cost trend rate | (1 | ) | (21 | ) | ||||
Projected benefit payments from the plans are estimated as follows:
Pension Benefits | Other Postretirement Benefits | |||||||||||
U.S. | Non-U.S. Plans | |||||||||||
2017 | $ | 84 | $ | 22 | $ | 23 | ||||||
2018 | 84 | 22 | 23 | |||||||||
2019 | 86 | 24 | 23 | |||||||||
2020 | 87 | 24 | 23 | |||||||||
2021 | 86 | 24 | 22 | |||||||||
Years 2022-2026 | 387 | 131 | 101 | |||||||||
Plan Assets
Certain pension plans sponsored by the Company invest in a diversified portfolio consisting of an array of asset classes that attempts to maximize returns while minimizing volatility. These asset classes include developed market equities, emerging market equities, private equity, global high quality and high yield fixed income, real estate, and absolute return strategies.
U.S. Plan
As of December 31, 2016, plan assets were comprised of 64% equity investments, 24% fixed income investments, and 12% in other investments which include hedge funds. Approximately 63% of the U.S. plan assets were invested in actively managed investment funds. The Company’s investment strategy includes a target asset allocation of 50% equity investments, 25% fixed income investments and 25% in other investment types including hedge funds.
The U.S. investment strategy mitigates risk by incorporating diversification across appropriate asset classes to meet the plan’s objectives. It is intended to reduce risk, provide long-term financial stability for the plan, and maintain funded levels that meet long-term plan obligations while preserving sufficient liquidity for near-term benefit payments. Risk assumed is considered appropriate for the return anticipated and consistent with the diversification of plan assets.
Non-U.S. Plans
The insurance contracts guarantee a minimum rate of return. The Company has no input into the investment strategy of the assets underlying the contracts, but they are typically heavily invested in active bond markets and are highly regulated by local law.
85
NOTES TO CONSOLIDATED FINANCIAL STATEMENTS - Continued
The majority of the assets of the non-U.S. plans are invested through insurance contracts. The target asset allocation for the non-U.S. pension plans is 65% insurance contracts, 30% debt investments and 5% equity investments.
The following table presents the Company’s defined benefit plan assets measured at fair value by asset class:
December 31, 2016 | December 31, 2015 | |||||||||||||||||||||||||||||||
Total | Level 1 | Level 2 | Level 3 | Total | Level 1 | Level 2 | Level 3 | |||||||||||||||||||||||||
U.S. Plans: | ||||||||||||||||||||||||||||||||
Cash | $ | 30 | $ | 30 | $ | — | $ | — | $ | 26 | $ | 26 | $ | — | $ | — | ||||||||||||||||
Investments with registered investment companies: | ||||||||||||||||||||||||||||||||
Equity securities | 346 | 346 | — | — | 310 | 310 | — | — | ||||||||||||||||||||||||
Fixed income securities | 154 | 154 | — | — | 149 | 149 | — | — | ||||||||||||||||||||||||
Real estate and other | 41 | 41 | — | — | 27 | 27 | — | — | ||||||||||||||||||||||||
Equity securities | 204 | 204 | — | — | 220 | 220 | — | — | ||||||||||||||||||||||||
Debt securities: | ||||||||||||||||||||||||||||||||
Corporate and other | 21 | — | 21 | — | 22 | — | 22 | — | ||||||||||||||||||||||||
Government | 28 | 11 | 17 | — | 30 | 17 | 13 | — | ||||||||||||||||||||||||
Hedge funds | 32 | — | — | 32 | 86 | — | — | 86 | ||||||||||||||||||||||||
$ | 856 | $ | 786 | $ | 38 | $ | 32 | $ | 870 | $ | 749 | $ | 35 | $ | 86 | |||||||||||||||||
Non-U.S. Plans: | ||||||||||||||||||||||||||||||||
Insurance contracts | $ | 42 | $ | — | $ | — | $ | 42 | $ | 40 | $ | — | $ | — | $ | 40 | ||||||||||||||||
Investments with registered investment companies: | ||||||||||||||||||||||||||||||||
Fixed income securities | 19 | 19 | — | — | 13 | 13 | — | — | ||||||||||||||||||||||||
Equity securities | 2 | 2 | — | — | 2 | 2 | — | — | ||||||||||||||||||||||||
Corporate bonds | — | — | — | — | 2 | — | 2 | — | ||||||||||||||||||||||||
$ | 63 | $ | 21 | $ | — | $ | 42 | $ | 57 | $ | 15 | $ | 2 | $ | 40 | |||||||||||||||||
The following tables summarize the activity for the U.S. plan assets classified in level 3:
Balance at December 31, 2015 | Net Realized/ Unrealized Gains (Loss) | Purchases, and Settlements, Net | Sales, Net | Transfers Into (Out) of Level 3 | Foreign Currency Exchange Rate Movements | Balance at December 31, 2016 | ||||||||||||||||||||||
Assets | ||||||||||||||||||||||||||||
Hedge funds and other | $ | 86 | $ | — | $ | 48 | $ | (102 | ) | $ | — | $ | — | $ | 32 | |||||||||||||
Balance at December 31, 2014 | Net Realized/ Unrealized Gains (Loss) | Purchases, and Settlements, Net | Sales, Net | Transfers Into (Out) of Level 3 | Foreign Currency Exchange Rate Movements | Balance at December 31, 2015 | ||||||||||||||||||||||
Assets | ||||||||||||||||||||||||||||
Hedge funds and other | $ | 91 | $ | (5 | ) | $ | — | $ | — | $ | — | $ | — | $ | 86 | |||||||||||||
86
NOTES TO CONSOLIDATED FINANCIAL STATEMENTS - Continued
The following tables summarize the activity for the non-U.S. plan assets classified in level 3:
Balance at December 31, 2015 | Net Realized/ Unrealized Gains (Loss) | Purchases, and Settlements, Net | Sales, Net | Transfers Into (Out) of Level 3 | Foreign Currency Exchange Rate Movements | Balance at December 31, 2016 | ||||||||||||||||||||||
Assets | ||||||||||||||||||||||||||||
Insurance contracts | $ | 40 | $ | 2 | $ | 3 | $ | (2 | ) | $ | — | $ | (1 | ) | $ | 42 | ||||||||||||
Balance at December 31, 2014 | Net Realized/ Unrealized Gains (Loss) | Purchases, and Settlements, Net | Sales, Net | Transfers Into (Out) of Level 3 | Foreign Currency Exchange Rate Movements | Balance at December 31, 2015 | ||||||||||||||||||||||
Assets | ||||||||||||||||||||||||||||
Insurance contracts | $ | 41 | $ | 1 | $ | 6 | $ | (4 | ) | $ | — | $ | (4 | ) | $ | 40 | ||||||||||||
16. INCOME TAXES
Under the liability method, deferred tax assets and liabilities are determined based on differences between financial reporting and tax bases of assets and liabilities and are measured using the enacted tax rates and laws that will be in effect when the differences are expected to reverse.
The components of (loss) income from continuing operations before income taxes consist of the following:
Year Ended December 31 | ||||||||||||
2016 | 2015 | 2014 | ||||||||||
Domestic | $ | (51 | ) | $ | (89 | ) | $ | (64 | ) | |||
International | 196 | 8 | (41 | ) | ||||||||
Total | $ | 145 | $ | (81 | ) | $ | (105 | ) | ||||
Significant components of the (expense) benefit for income taxes are as follows:
Year Ended December 31 | ||||||||||||
2016 | 2015 | 2014 | ||||||||||
Current: | ||||||||||||
Federal, state and local | $ | — | $ | — | $ | (4 | ) | |||||
International | (83 | ) | (47 | ) | (32 | ) | ||||||
Total current | (83 | ) | (47 | ) | (36 | ) | ||||||
Deferred: | ||||||||||||
Federal, state and local | (1 | ) | — | — | ||||||||
International | 29 | 17 | (20 | ) | ||||||||
Total deferred | 28 | 17 | (20 | ) | ||||||||
$ | (55 | ) | $ | (30 | ) | $ | (56 | ) | ||||
87
NOTES TO CONSOLIDATED FINANCIAL STATEMENTS - Continued
The reconciliation of income taxes computed at the U.S. federal statutory tax rate to income tax (expense) benefit is:
Year Ended December 31 | ||||||||||||
2016 | 2015 | 2014 | ||||||||||
Income tax (expense) benefit at U.S. statutory rate | $ | (51 | ) | $ | 28 | $ | 37 | |||||
Tax effect from: | ||||||||||||
Goodwill impairment | (1 | ) | (31 | ) | (42 | ) | ||||||
U.S. income inclusions from foreign subsidiaries | (14 | ) | (6 | ) | (7 | ) | ||||||
Nonconsolidated foreign affiliates | 19 | 17 | 15 | |||||||||
Foreign exchange (gain) loss on nontaxable dividends | 15 | — | — | |||||||||
Other permanent differences | (8 | ) | (4 | ) | — | |||||||
Tax holidays, incentives and minimum tax | 8 | 10 | 2 | |||||||||
Foreign rate variance and enacted rate change | 21 | 9 | 24 | |||||||||
State income taxes | — | — | (4 | ) | ||||||||
Uncertain tax positions and assessments | (8 | ) | 5 | 31 | ||||||||
Valuation allowances | (9 | ) | (46 | ) | (105 | ) | ||||||
Withholding taxes | (11 | ) | (7 | ) | — | |||||||
Other | (16 | ) | (5 | ) | (7 | ) | ||||||
Income tax (expense) benefit | $ | (55 | ) | $ | (30 | ) | $ | (56 | ) | |||
The following table summarizes the Company’s total (provision) benefit for income taxes by component:
Year Ended December 31 | ||||||||||||
2016 | 2015 | 2014 | ||||||||||
Income tax (expense) benefit | $ | (55 | ) | $ | (30 | ) | $ | (56 | ) | |||
Allocated to equity: | ||||||||||||
Pension and postretirement benefits | 3 | (27 | ) | 108 | ||||||||
Derivatives | (1 | ) | — | — | ||||||||
Foreign currency translation | (5 | ) | (11 | ) | (12 | ) | ||||||
Valuation allowances | (8 | ) | 7 | (84 | ) | |||||||
88
NOTES TO CONSOLIDATED FINANCIAL STATEMENTS - Continued
Significant components of the Company’s deferred tax assets and liabilities are as follows:
December 31 | ||||||||
2016 | 2015 | |||||||
Deferred tax assets | ||||||||
Net operating loss carryforwards | $ | 1,002 | $ | 944 | ||||
Postretirement benefits, including pensions | 312 | 327 | ||||||
Reorganization costs | 7 | 5 | ||||||
Inventory | 62 | 67 | ||||||
Other temporary differences | 107 | 117 | ||||||
Tax credits | 94 | 115 | ||||||
Total deferred tax assets | 1,584 | 1,575 | ||||||
Valuation allowances for deferred tax assets | (1,286 | ) | (1,307 | ) | ||||
Net deferred tax assets | 298 | 268 | ||||||
Deferred tax liabilities | ||||||||
Investment in U.S. subsidiaries | (307 | ) | (307 | ) | ||||
Intangible assets | (138 | ) | (142 | ) | ||||
Fixed assets | (98 | ) | (92 | ) | ||||
Total deferred tax liabilities | (543 | ) | (541 | ) | ||||
$ | (245 | ) | $ | (273 | ) | |||
Deferred tax assets and liabilities are recorded in the consolidated balance sheets as follows:
December 31 | ||||||||
2016 | 2015 | |||||||
Assets: | ||||||||
Other noncurrent assets | $ | 121 | $ | 94 | ||||
Liabilities: | ||||||||
Deferred income taxes | (366 | ) | (367 | ) | ||||
$ | (245 | ) | $ | (273 | ) | |||
The Company continues to maintain a valuation allowance related to its net deferred tax assets in multiple jurisdictions. As of December 31, 2016, the Company had valuation allowances of $994 million related to tax loss and credit carryforwards. The current and future provision for income taxes may be significantly affected by changes to valuation allowances in certain countries. These allowances will be maintained until it is more likely than not the deferred tax assets will be realized. The future provision for income taxes will include no tax benefit with respect to losses incurred and no tax expense with respect to income generated in these countries until the respective valuation allowance is eliminated.
At December 31, 2016, the Company had a deferred tax asset before valuation allowance of $1,096 million for tax loss carryforwards and tax credits, including: $686 million in the U.S. with expiration dates from 2017 through 2035; $124 million in the United Kingdom with no expiration date; and $286 million in other jurisdictions with various expiration dates.
The Company has also concluded there is a more than remote possibility the existing valuation allowances of up to $60 million as of December 31, 2016 could be released within the next 12 months. If releases of such valuation allowances occur, they may have a significant effect on results of operations in the quarter in which it is deemed appropriate to release the reserve. Income taxes paid, net of income tax refunds received, were $67 million, $44 million and $42 million for the years ended December 31, 2016, 2015 and 2014.
The Company did not record taxes on its undistributed earnings of $778 million at December 31, 2016 since these earnings are considered by the Company to be permanently reinvested. If at some future date these earnings cease to be permanently reinvested, the Company may be subject to U.S. income taxes and foreign withholding taxes on such amounts. Determining the
89
NOTES TO CONSOLIDATED FINANCIAL STATEMENTS - Continued
unrecognized deferred tax liability on the potential distribution of these earnings is not practicable as such liability, if any, is dependent on circumstances existing when remittance occurs.
As of December 31, 2016, the Company had $300 million of cash and cash equivalents, of which $166 million was held by foreign subsidiaries. The Company asserts these funds are indefinitely reinvested due to operational and investing needs of the foreign locations. Furthermore, the Company will accrue any applicable taxes in the period when the Company no longer intends to indefinitely reinvest these funds. The Company would expect the effect on cash taxes would be immaterial due to: the availability of net operating loss carryforwards and related valuation allowances; earnings considered previously taxed; and applicable tax treaties.
At December 31, 2016, 2015 and 2014, the Company had total unrecognized tax benefits of $42 million, $37 million and $50 million. Of these totals, $33 million, $29 million and $44 million, represent the amounts of unrecognized tax benefits that, if recognized, would affect the effective income tax rates. The total unrecognized tax benefits differ from the amounts which would affect the effective tax rates primarily due to the effect of valuation allowances.
A summary of the changes in the gross amount of unrecognized tax benefits for the years ended December 31, 2016, 2015 and 2014 are shown below:
Year Ended December 31 | ||||||||||||
2016 | 2015 | 2014 | ||||||||||
Change in unrecognized tax benefits | ||||||||||||
Balance at January 1 | $ | 37 | $ | 50 | $ | 78 | ||||||
Additions based on tax positions related to the current year | 2 | 6 | 7 | |||||||||
Additions for tax positions of prior years | 6 | 6 | 10 | |||||||||
Decreases for tax positions of prior years | (1 | ) | (10 | ) | (14 | ) | ||||||
Decreases for statute of limitations expiration | (1 | ) | (4 | ) | (1 | ) | ||||||
Settlements | — | (6 | ) | (25 | ) | |||||||
Effect of currency translation | (1 | ) | (5 | ) | (5 | ) | ||||||
Balance at December 31 | $ | 42 | $ | 37 | $ | 50 | ||||||
The Company classifies tax-related penalties and net interest as income tax expense. As of December 31, 2016, 2015 and 2014, the Company recorded $7 million, $7 million and $12 million in liabilities for tax-related net interest and penalties on its consolidated balance sheet. The Company recorded no income tax (expense) benefit related to a net change in its liability for interest and penalties for the year ended December 31, 2016 and $(5) million and $11 million for the years ended December 31, 2015 and 2014.
The Company operates in multiple jurisdictions throughout the world. The Company is no longer subject to U.S. federal tax examinations for years before 2011 or state and local for years before 2008, with limited exceptions. Furthermore, the Company is no longer subject to income tax examinations in major foreign tax jurisdictions for years prior to 2005. The income tax returns of foreign subsidiaries in various tax jurisdictions are currently under examination.
The Company believes that it is reasonably possible that its unrecognized tax benefits in multiple jurisdictions, which primarily relate to transfer pricing, corporate reorganization and various other matters, may decrease by approximately $3 million in the next 12 months due to audit settlements or statute expirations, which approximately $3 million, if recognized, could affect the effective tax rate.
On July 11, 2013, Federal-Mogul Corporation became part of the IEP affiliated group of corporations as defined in Section 1504 of the Internal Revenue Code of 1986 ("the Code"), as amended, of which AEP is the common parent. The Company subsequently entered into a Tax Allocation Agreement (the “Tax Allocation Agreement”) with AEP. Pursuant to the Tax Allocation Agreement, AEP and the Company have agreed to the allocation of certain income tax items. The Company will join AEP in the filing of AEP’s federal consolidated return and certain state consolidated returns. In those jurisdictions where the Company is filing consolidated returns with AEP, the Company will pay to AEP any tax it would have owed had it continued to file separately. Effective January 23, 2017, AEP will no longer be obligated to the Company for reductions to the consolidated group's tax liability as a result of including the Company in its consolidated group.
On February 14, 2017, the Company was converted into a limited liability company in the U.S. and changed its name to Federal-Mogul Holdings LLC. As a result of the conversion, the Company is treated as a disregarded entity for U.S. income tax purposes and no U.S. income tax will be allocated to the Company. IEP will succeed to the Company’s U.S. deferred tax assets
90
NOTES TO CONSOLIDATED FINANCIAL STATEMENTS - Continued
and liabilities as the sole member of the Company. However, for purposes of preparing its financial statements, the Company will continue to use a separate return methodology in determining income taxes prospectively.
17. COMMITMENTS AND CONTINGENCIES
Environmental Matters
The Company is a defendant in lawsuits filed, or the recipient of administrative orders issued or demand letters received, in various jurisdictions pursuant to the Federal Comprehensive Environmental Response Compensation and Liability Act of 1980 (“CERCLA”) or other similar national, provincial or state environmental remedial laws. These laws provide that responsible parties may be liable to pay for remediating contamination resulting from hazardous substances that were discharged into the environment by them, by prior owners or occupants of property they currently own or operate, or by others to whom they sent such substances for treatment or other disposition at third party locations. The Company has been notified by the U.S. Environmental Protection Agency, other national environmental agencies, and various provincial and state agencies that it may be a potentially responsible party (“PRP”) under such laws for the cost of remediating hazardous substances pursuant to CERCLA and other national and state or provincial environmental laws. PRP designation typically requires the funding of site investigations and subsequent remedial activities.
Many of the sites that are likely to be the costliest to remediate are often current or former commercial waste disposal facilities to which numerous companies sent wastes. Despite the potential joint and several liability which might be imposed on the Company under CERCLA and some of the other laws pertaining to these sites, the Company’s share of the total waste sent to these sites has generally been small. The Company believes its exposure for liability at these sites is limited.
On a global basis, the Company has also identified certain other present and former properties at which it may be responsible for cleaning up or addressing environmental contamination, in some cases as a result of contractual commitments and/or federal or state environmental laws. The Company is actively seeking to resolve these actual and potential statutory, regulatory, and contractual obligations. Although difficult to quantify based on the complexity of the issues, the Company has accrued amounts corresponding to its best estimate of the costs associated with such regulatory and contractual obligations on the basis of available information from site investigations and the professional judgment of consultants.
Total environmental liabilities, determined on an undiscounted basis are included in the consolidated balance sheets as follows:
December 31, | December 31, | |||||||
2016 | 2015 | |||||||
Other current liabilities | $ | 6 | $ | 4 | ||||
Other accrued liabilities (noncurrent) | 10 | 10 | ||||||
$ | 16 | $ | 14 | |||||
Management believes recorded environmental liabilities will be adequate to cover the Company’s estimated liability for its exposure in respect to such matters. In the event such liabilities were to significantly exceed the amounts recorded by the Company, the Company’s results of operations and financial condition could be materially affected. At December 31, 2016, management estimates that reasonably possible material additional losses above and beyond management’s best estimate of required remediation costs as recorded approximate $41 million.
Asset Retirement Obligations
The Company’s primary ARO activities relate to the removal of hazardous building materials at its facilities. The Company records an ARO at fair value upon initial recognition when the amount is probable and can be reasonably estimated. ARO fair values are determined based on the Company’s determination of what a third party would charge to perform the remediation activities, generally using a present value technique.
91
NOTES TO CONSOLIDATED FINANCIAL STATEMENTS - Continued
The Company has identified sites with contractual obligations and several sites that are closed or expected to be closed and sold. In connection with these sites, the Company maintains ARO liabilities in the consolidated balance sheets as follows:
December 31, | December 31, | |||||||
2016 | 2015 | |||||||
Other current liabilities | $ | 1 | $ | 2 | ||||
Other accrued liabilities (noncurrent) | 14 | 14 | ||||||
$ | 15 | $ | 16 | |||||
The following is a rollforward of the Company’s ARO liability for the years ended December 31, 2016 and 2015:
Balance at December 31, 2014 | $ | 24 | ||
Liabilities incurred | — | |||
Liabilities settled/adjustments | (6 | ) | ||
Foreign Currency | (2 | ) | ||
Balance at December 31, 2015 | 16 | |||
Liabilities incurred | (2 | ) | ||
Liabilities settled/adjustments | 1 | |||
Foreign Currency | — | |||
Balance at December 31, 2016 | $ | 15 | ||
Affiliate Pension Obligations
As a result of the more than 80% ownership interest in the Company by Mr. Icahn’s affiliates, the Company is subject to the pension liabilities of all entities in which Mr. Icahn has a direct or indirect ownership interest of at least 80%. One such entity, ACF Industries LLC ("ACF"), is the sponsor of several pension plans. All the minimum funding requirements of the Code and the Employee Retirement Income Security Act of 1974 for these plans have been met as of December 31, 2016. If the ACF plans were voluntarily terminated, they would be underfunded by approximately $111 million as of December 31, 2016. These results are based on the most recent information provided by the plans’ actuaries. These liabilities could increase or decrease, depending on a number of factors, including future changes in benefits, investment returns, and the assumptions used to calculate the liability. As members of the controlled group, the Company would be liable for any failure of ACF to make ongoing pension contributions or to pay the unfunded liabilities upon a termination of the pension plans of ACF. In addition, other entities now or in the future within the controlled group in which the Company is included may have pension plan obligations that are, or may become, underfunded and the Company would be liable for any failure of such entities to make ongoing pension contributions or to pay the unfunded liabilities upon termination of such plans. Further, the failure to pay these pension obligations when due may result in the creation of liens in favor of the pension plan or the Pension Benefit Guaranty Corporation (“PBGC”) against the assets of each member of the controlled group.
The current underfunded status of the pension plans of ACF requires it to notify the PBGC of certain “reportable events,” such as if the Company ceases to be a member of the ACF controlled group, or the Company makes certain extraordinary dividends or stock redemptions. The obligation to report could cause the Company to seek to delay or reconsider the occurrence of such reportable events.
Icahn Enterprises Holdings L.P. and IEH FM Holdings LLC have undertaken to indemnify the Company for any and all liability imposed upon the Company pursuant to the Employee Retirement Income Security Act of 1974, as amended, or any regulation thereunder (“ERISA”) resulting from the Company being considered a member of a controlled group within the meaning of ERISA § 4001(a)(14) of which American Entertainment Properties Corporation is a member, except with respect to liability in respect to any employee benefit plan, as defined by ERISA § 3(3), maintained by the Company. Icahn Enterprises Holdings L.P. and IEH FM Holdings LLC are not required to maintain any specific net worth and there can be no guarantee Icahn Enterprises Holdings L.P. and IEH FM Holdings LLC will be able to fund its indemnification obligations to the Company.
92
NOTES TO CONSOLIDATED FINANCIAL STATEMENTS - Continued
Other Matters
On April 25, 2014, a group of plaintiffs brought an action against Federal-Mogul Products, Inc. (“F-M Products”), a wholly-owned subsidiary of the Company, alleging injuries and damages associated with the discharge of chlorinated hydrocarbons by the former owner of a facility located in Kentucky. Since 1998, when F-M Products acquired the facility, it has been cooperating with the applicable regulatory agencies on remediating the prior discharges pursuant to an order entered into by the facility’s former owner. The Company does not currently believe the outcome of this litigation will have a material effect on its condensed consolidated financial position, results of operations or cash flows.
On September 29, 2016, September 30, 2016, October 12, 2016 and October 19, 2016, respectively, four putative class actions were filed in the Court of Chancery of the State of Delaware against the Board, IEP, and certain of its affiliates, including Parent and the Offeror (the “Icahn Defendants”). The complaints allege that, among other things, the Board breached its fiduciary duties by approving the proposed Merger Agreement, that the Icahn Defendants breached their fiduciary duties to the minority stockholders and/or aided and abetted the Board’s breaches of its fiduciary duties, as well as alleging certain material misstatements and omissions in the Schedule 14D-9. The complaints allege that, among other things, the then-Offer Price was inadequate and, together with that the Merger Agreement, was the result of a flawed and unfair sales process and conflicts of interest of the Board and the Special Committee, alleging that the Special Committee and the Company’s management lacked independence from the Icahn Defendants. In addition, the complaints allege that the Merger Agreement contains certain allegedly preclusive deal protection provisions, including a no-solicitation provision, an information rights provision and a matching rights provision. Among other things, the complaints sought to enjoin the transactions contemplated by the Merger Agreement, as well as award costs and disbursements, including reasonable attorneys’ and experts’ fees. On October 28, 2016, all four actions were consolidated (the “Delaware Action”). On February 3, 2017, an order was entered requiring plaintiffs to file their amended complaint by March 6, 2017.
On October 5, 2016, a putative class action was filed in the Circuit Court for Oakland County of the State of Michigan against the Company, the Board and the Icahn Defendants (the “Michigan Action”). The complaint alleges, among other things, that the Board breached its fiduciary duties and that the Company and the Icahn Defendants aided and abetted the Board’s breaches of its fiduciary duties, as well as alleging certain material misstatements and omissions in the Schedule 14D-9. The complaint alleges that, among other things, the then-Offer Price was unfair and the result of an unfair sales process that included conflicts of interest. In addition, the complaint alleges that the Merger Agreement contains certain allegedly preclusive deal protection provisions, including a no-solicitation provision, an information rights provision and a matching rights provision. Among other things, the complaint sought to enjoin the transactions contemplated by the Merger Agreement, or, in the event that the transactions were consummated, rescind the transactions or award rescissory damages, as well as award money damages and costs, including reasonable attorneys’ and experts’ fees. On February 10, 2017, an order was entered providing that plaintiff shall have through March 6, 2016, to file his First Amended Complaint.
The Company believes the claims in the Delaware and Michigan Actions are without merit and intends to defend against them vigorously.
In addition, the Company is involved in other legal actions and claims, directly, and through its subsidiaries. Management does not believe the outcomes of these other actions or claims are likely to have a material adverse effect on the Company’s condensed consolidated financial position, results of operations or cash flows.
93
18. CHANGES IN ACCUMULATED OTHER COMPREHENSIVE LOSS BY COMPONENT (NET OF TAX)
The following represents the Company’s changes in accumulated other comprehensive loss ("AOCL") by component:
Year Ended December 31 | ||||||||||||
2016 | 2015 | 2014 | ||||||||||
Foreign currency translation adjustments | ||||||||||||
Balance at beginning of period | $ | (714 | ) | $ | (482 | ) | $ | (249 | ) | |||
Other comprehensive income (loss) before reclassification adjustment, net of tax | (146 | ) | (232 | ) | (233 | ) | ||||||
Reclassification from other comprehensive income (loss) | (1 | ) | — | — | ||||||||
Other comprehensive loss, net of tax | (147 | ) | (232 | ) | (233 | ) | ||||||
Balance at end of period | $ | (861 | ) | $ | (714 | ) | $ | (482 | ) | |||
Pensions and postretirement benefits | ||||||||||||
Balance at beginning of period | $ | (587 | ) | $ | (643 | ) | $ | (361 | ) | |||
Other comprehensive income (loss) before reclassifications | 15 | 34 | (314 | ) | ||||||||
Reclassification from other comprehensive income (loss)(a) | 15 | 22 | 10 | |||||||||
Income taxes | — | — | 22 | |||||||||
Other comprehensive income (loss), net of tax | 30 | 56 | (282 | ) | ||||||||
Balance at end of period | $ | (557 | ) | $ | (587 | ) | $ | (643 | ) | |||
Hedge instruments | ||||||||||||
Balance at beginning of period | $ | (17 | ) | $ | (17 | ) | $ | (16 | ) | |||
Other comprehensive income (loss) before reclassifications | 2 | (4 | ) | — | ||||||||
Reclassification from other comprehensive income (loss)(b) | 1 | 4 | — | |||||||||
Income taxes | — | — | (1 | ) | ||||||||
Other comprehensive income (loss), net of tax | 3 | — | (1 | ) | ||||||||
Balance at end of period | $ | (14 | ) | $ | (17 | ) | $ | (17 | ) | |||
Other comprehensive income (loss) attributable to noncontrolling interests, net of tax(c) | $ | 2 | $ | (5 | ) | $ | (15 | ) | ||||
(a) Includes amortization of prior service costs/credits and actuarial gains/losses which are included in cost of products sold, and selling, general, and administrative. | ||||||||||||
(b) Includes commodity contacts and foreign currency contracts which are included in cost of products sold. | ||||||||||||
(c) Consists of foreign currency translation adjustments. | ||||||||||||
19. STOCK-BASED COMPENSATION
In February 2012, 2011, and 2010, the Company granted approximately 809,000, 1,043,000, and 437,000 stock appreciation rights ("SARs"), to certain employees. The SARs granted in February 2012 (“2012 SARs”) and in February 2011 (“2011 SARs”) vested 25.0% on grant date and 25.0% on each of the next three anniversaries of the grant date. The SARs granted in February 2010 (“2010 SARs”) vest 33.3% on each of the three anniversaries of the grant date. All SARs have a term of five years from date of grant. The SARs are payable in cash or, at the election of the Company, in stock. As the Company anticipates paying out SARs exercises in the form of cash, the SARs were treated as liability awards for accounting purposes.
The Company has total outstanding awards of approximately 200,331, 603,000 and 796,000 as of December 31, 2016, 2015, and 2014.
The Company recognized $0 million, $1 million, and $4 million of SARS income for the years ended December 31 2016, 2015, and 2014.
94
20. INCOME (LOSS) PER COMMON SHARE
The following is a reconciliation of the numerators and the denominators of the basic and diluted income (loss) per common share:
Year Ended December 31 | ||||||||||||
2016 | 2015 | 2014 | ||||||||||
Amounts attributable to Federal-Mogul: | ||||||||||||
Net income (loss) from continuing operations | $ | 82 | $ | (117 | ) | $ | (168 | ) | ||||
Gain (loss) from discontinued operations, net of tax | — | 7 | — | |||||||||
Net income (loss) | $ | 82 | $ | (110 | ) | $ | (168 | ) | ||||
Weighted average shares outstanding, basic and diluted (in millions) | 169.0 | 164.7 | 150.0 | |||||||||
Net (loss) income per share attributable to Federal-Mogul - basic and diluted: | ||||||||||||
Net (loss) income from continuing operations | $ | 0.49 | $ | (0.71 | ) | $ | (1.12 | ) | ||||
Loss from discontinued operations, net of tax | — | 0.04 | — | |||||||||
Net (loss) income | $ | 0.49 | $ | (0.67 | ) | $ | (1.12 | ) | ||||
The Company had losses for the year ended December 31, 2015 and 2014. As a result, diluted loss per share is the same as basic in those periods, as any potentially dilutive securities would reduce the loss per share.
Warrants to purchase 6,951,871 common shares, which expired December 27, 2014, were not included in the computation of diluted earnings per share because the exercise price was greater than the average market price of the Company’s common shares during the year ended December 31, 2014. In addition, there are 500,000 common shares issued in connection with a deferred compensation agreement excluded from the basic earnings per share calculation for the year ended December 31, 2014.
21. OPERATIONS BY REPORTING SEGMENT AND GEOGRAPHIC AREA
The Company operates with two end-customer focused business segments. The Powertrain segment focuses on original equipment powertrain products for automotive, heavy duty, and industrial applications. The Motorparts segment sells and distributes a broad portfolio of products in the global aftermarket, while also serving OEMs with products including braking, wipers, and a limited range of chassis components. This organizational model allows for a strong product line focus benefitting both OE and aftermarket customers and enables the Company to be responsive to customers’ needs for superior products and to promote greater identification with its premium brands. Additionally, this organizational model enhances management focus to capitalize on opportunities for organic or acquisition growth, profit improvement, resource utilization, and business model optimization in line with the unique requirements of the two different customer bases. Reporting units are components of the Company’s reporting segments (which are also its operating segments) and generally align with specific product groups for Powertrain and regions for Motorparts for which segment managers regularly review operating results.
Management utilizes Operational EBITDA as the key performance measure of segment profitability and uses the measure in its financial and operational decision making processes, for internal reporting, and for planning and forecasting purposes to effectively allocate resources. Operational EBITDA is defined as EBITDA (earnings before interest, taxes, depreciation, and amortization), as adjusted for additional amounts. Examples of these adjustments include impairment charges related to goodwill, other long-lived assets, and investments; restructuring charges; certain gains or losses on the settlement/extinguishment of obligations; and receivable financing charges. During 2015, the Company modified its definition of Operational EBITDA to adjust for financing charges related to certain receivable financing programs. Comparable periods have been adjusted to conform to this definition.
Operational EBITDA presents a performance measure exclusive of capital structure and the method by which net assets were acquired, disposed of, or financed. Management believes this measure provides additional transparency into its core operations and is most reflective of the operational profitability or loss of the Company’s operating segments and reporting units. The measure also allows management and investors to view operating trends, perform analytical comparisons, and benchmark performance between periods and among operating segments.
95
NOTES TO CONSOLIDATED FINANCIAL STATEMENTS - Continued
Operational EBITDA should not be considered a substitute for results prepared in accordance with U.S. GAAP and should not be considered an alternative to net income, which is the most directly comparable financial measure to Operational EBITDA that is in accordance with U.S. GAAP. Operational EBITDA, as determined and measured by the Company, should not be compared to similarly titled measures reported by other companies.
Net sales:
Year Ended December 31 | ||||||||||||
2016 | 2015 | 2014 | ||||||||||
Powertrain | $ | 4,463 | $ | 4,450 | $ | 4,430 | ||||||
Motorparts | 3,215 | 3,253 | 3,192 | |||||||||
Inter-segment eliminations | (244 | ) | (284 | ) | (305 | ) | ||||||
Total | $ | 7,434 | $ | 7,419 | $ | 7,317 | ||||||
Inter-segment eliminations attributable to sales from Powertrain to Motorparts | $ | 211 | $ | 252 | $ | 267 | ||||||
Inter-segment eliminations attributable to sales from Motorparts to Powertrain | $ | 33 | $ | 32 | $ | 38 | ||||||
Cost of products sold:
Year Ended December 31 | ||||||||||||
2016 | 2015 | 2014 | ||||||||||
Powertrain | $ | (3,929 | ) | $ | (3,913 | ) | $ | (3,897 | ) | |||
Motorparts | (2,616 | ) | (2,716 | ) | (2,668 | ) | ||||||
Inter-segment eliminations | 244 | 284 | 305 | |||||||||
Total | $ | (6,301 | ) | $ | (6,345 | ) | $ | (6,260 | ) | |||
Gross profit:
Year Ended December 31 | ||||||||||||
2016 | 2015 | 2014 | ||||||||||
Powertrain | $ | 534 | $ | 537 | $ | 533 | ||||||
Motorparts | 599 | 537 | 524 | |||||||||
Total | $ | 1,133 | $ | 1,074 | $ | 1,057 | ||||||
96
NOTES TO CONSOLIDATED FINANCIAL STATEMENTS - Continued
Operational EBITDA and the reconciliation to net income (loss) is as follows:
Year Ended December 31 | ||||||||||||
2016 | 2015 | 2014 | ||||||||||
Powertrain | $ | 473 | $ | 428 | $ | 431 | ||||||
Motorparts | 271 | 216 | 199 | |||||||||
Total Operational EBITDA | $ | 744 | $ | 644 | $ | 630 | ||||||
Items required to reconcile Operational EBITDA to EBITDA: | ||||||||||||
Restructuring charges and asset impairments (a) | $ | (44 | ) | $ | (121 | ) | $ | (110 | ) | |||
Goodwill and intangible impairment expense, net | (6 | ) | (94 | ) | (120 | ) | ||||||
Loss on debt extinguishment | — | — | (24 | ) | ||||||||
Loss on sale of equity method investment | — | (11 | ) | — | ||||||||
Financing charges | (12 | ) | (9 | ) | (6 | ) | ||||||
Discontinued operations | — | 7 | — | |||||||||
Acquisition related costs | (5 | ) | (6 | ) | (16 | ) | ||||||
Segmentation costs | — | (4 | ) | (10 | ) | |||||||
Other (b) | (12 | ) | (1 | ) | 5 | |||||||
EBITDA | $ | 665 | $ | 405 | $ | 349 | ||||||
Items required to reconcile EBITDA to net income (loss): | ||||||||||||
Depreciation and amortization | $ | (375 | ) | $ | (341 | ) | $ | (334 | ) | |||
Interest expense, net | (145 | ) | (138 | ) | (120 | ) | ||||||
Income tax (expense) benefit | (55 | ) | (30 | ) | (56 | ) | ||||||
Net income (loss) | $ | 90 | $ | (104 | ) | $ | (161 | ) | ||||
Footnotes: | Year Ended December 31 | |||||||||||
(a) Restructuring charges and asset impairments, net: | 2016 | 2015 | 2014 | |||||||||
Restructuring charges related to severance and other charges, net | $ | (27 | ) | $ | (89 | ) | $ | (86 | ) | |||
Asset impairments, including impairments related to restructuring activities | (17 | ) | (32 | ) | (24 | ) | ||||||
Total Restructuring charges | $ | (44 | ) | $ | (121 | ) | $ | (110 | ) | |||
(b) Other reconciling items: | ||||||||||||
Headquarters relocation costs | $ | — | $ | — | $ | (6 | ) | |||||
Non-service cost components associated with U.S. based funded pension plans | (13 | ) | 1 | 6 | ||||||||
Stock appreciation rights | — | 1 | 4 | |||||||||
Other | 1 | (3 | ) | 1 | ||||||||
$ | (12 | ) | $ | (1 | ) | $ | 5 | |||||
Total assets, capital expenditures, and depreciation and amortization information by reporting segment is as set forth in the table below. Goodwill was assigned to reporting segments and reporting units based on individual reporting unit fair values over values attributed to specific intangible and tangible assets.
Total Assets | Capital Expenditures | Depreciation and Amortization | ||||||||||||||||||||||||||||||
December 31 | Year Ended December 31 | Year Ended December 31 | ||||||||||||||||||||||||||||||
2016 | 2015 | 2016 | 2015 | 2014 | 2016 | 2015 | 2014 | |||||||||||||||||||||||||
Powertrain | $ | 3,956 | $ | 3,997 | $ | 262 | $ | 301 | $ | 268 | $ | 233 | $ | 208 | $ | 196 | ||||||||||||||||
Motorparts | 2,919 | 3,141 | 116 | 131 | 130 | 133 | 119 | 114 | ||||||||||||||||||||||||
Total Reporting Segment | 6,875 | 7,138 | 378 | 432 | 398 | 366 | 327 | 310 | ||||||||||||||||||||||||
Corporate | 201 | 90 | 3 | 8 | 20 | 9 | 14 | 24 | ||||||||||||||||||||||||
Total Company | $ | 7,076 | $ | 7,228 | $ | 381 | $ | 440 | $ | 418 | $ | 375 | $ | 341 | $ | 334 | ||||||||||||||||
97
NOTES TO CONSOLIDATED FINANCIAL STATEMENTS - Continued
The following table shows geographic information:
Net Sales | Net PPE | |||||||||||||||||||
Year Ended December 31 | December 31 | |||||||||||||||||||
2016 | 2015 | 2014 | 2016 | 2015 | ||||||||||||||||
U.S. | $ | 2,757 | $ | 2,803 | $ | 2,667 | $ | 693 | $ | 683 | ||||||||||
Germany | 1,444 | 1,469 | 1,494 | 458 | 464 | |||||||||||||||
China | 530 | 467 | 446 | 263 | 277 | |||||||||||||||
Mexico | 456 | 422 | 375 | 158 | 155 | |||||||||||||||
France | 378 | 399 | 398 | 62 | 67 | |||||||||||||||
Italy | 275 | 262 | 290 | 57 | 62 | |||||||||||||||
Belgium | 254 | 257 | 272 | 22 | 14 | |||||||||||||||
United Kingdom | 201 | 218 | 242 | 63 | 72 | |||||||||||||||
India | 219 | 210 | 203 | 138 | 141 | |||||||||||||||
Other | 920 | 912 | 930 | 420 | 418 | |||||||||||||||
$ | 7,434 | $ | 7,419 | $ | 7,317 | $ | 2,334 | $ | 2,353 | |||||||||||
The following table shows nonconsolidated affiliates information:
Equity Earnings of Nonconsolidated Affiliates, Net of Tax | Investments In Nonconsolidated Affiliates | |||||||||||||||||||
Year Ended December 31 | Year Ended December 31 | |||||||||||||||||||
2016 | 2015 | 2014 | 2016 | 2015 | ||||||||||||||||
Powertrain | $ | 47 | $ | 43 | $ | 35 | $ | 232 | $ | 248 | ||||||||||
Motorparts | 12 | 13 | 13 | 38 | 48 | |||||||||||||||
Total Company | $ | 59 | $ | 56 | $ | 48 | $ | 270 | $ | 296 | ||||||||||
22. SUPPLEMENTARY QUARTERLY FINANCIAL INFORMATION (UNAUDITED)
The following table presents supplementary quarterly financial information for the year ended December 31, 2016:
2016 | ||||||||||||||||
First Quarter | Second Quarter | Third Quarter | Fourth Quarter | |||||||||||||
Net sales | $ | 1,897 | $ | 1,924 | $ | 1,825 | $ | 1,788 | ||||||||
Gross profit | $ | 288 | $ | 304 | $ | 275 | $ | 266 | ||||||||
Net income (loss) | $ | 36 | $ | 33 | $ | 16 | $ | 5 | ||||||||
Net income (loss) attributable to Federal-Mogul | $ | 35 | $ | 31 | $ | 15 | $ | 1 | ||||||||
Basic and diluted net income (loss) per common share attributable to Federal-Mogul: | ||||||||||||||||
Net income (loss) | $ | 0.21 | $ | 0.18 | $ | 0.09 | $ | 0.01 | ||||||||
The following table represents items that affect the comparability of the amounts shown above for the interim periods in 2016:
2016 | ||||||||||||||||
First Quarter | Second Quarter | Third Quarter | Fourth Quarter | |||||||||||||
Restructuring charges and asset impairments, net | $ | (18 | ) | $ | (6 | ) | $ | (8 | ) | $ | (12 | ) | ||||
Goodwill and intangible impairment expense, net | $ | — | $ | (6 | ) | $ | — | $ | — | |||||||
Gain (loss) on sale of assets | $ | 9 | $ | — | $ | (1 | ) | $ | — | |||||||
98
NOTES TO CONSOLIDATED FINANCIAL STATEMENTS - Continued
The following table presents supplementary quarterly financial information for the year ended December 31, 2015:
2015 | ||||||||||||||||
First Quarter | Second Quarter | Third Quarter | Fourth Quarter | |||||||||||||
Net sales | $ | 1,835 | $ | 1,962 | $ | 1,824 | $ | 1,798 | ||||||||
Gross profit | $ | 251 | $ | 290 | $ | 263 | $ | 270 | ||||||||
Net income (loss) from continuing operations | $ | (10 | ) | $ | 17 | $ | (62 | ) | (56 | ) | ||||||
Discontinued operations | $ | — | $ | 7 | $ | — | — | |||||||||
Net income (loss) | $ | (10 | ) | $ | 24 | $ | (62 | ) | (56 | ) | ||||||
Net income (loss) attributable to Federal-Mogul | $ | (11 | ) | $ | 22 | $ | (63 | ) | (58 | ) | ||||||
Basic and diluted net income (loss) per common share attributable to Federal-Mogul: | ||||||||||||||||
Continuing operations | $ | (0.07 | ) | $ | 0.09 | $ | (0.37 | ) | $ | (0.36 | ) | |||||
Discontinued operations | $ | — | $ | 0.04 | $ | — | $ | — | ||||||||
Net income (loss) | $ | (0.07 | ) | $ | 0.13 | $ | (0.37 | ) | $ | (0.36 | ) | |||||
The following table represents items that affect the comparability of the amounts shown above for the interim periods in 2015:
2015 | ||||||||||||||||
First Quarter | Second Quarter | Third Quarter | Fourth Quarter | |||||||||||||
Loss on equity method investment | $ | (11 | ) | $ | — | $ | — | $ | — | |||||||
Restructuring charges and asset impairments, net | $ | (13 | ) | $ | (30 | ) | $ | (23 | ) | $ | (54 | ) | ||||
Goodwill and intangible impairment expense, net | $ | 6 | $ | — | $ | (56 | ) | $ | (44 | ) | ||||||
23. RELATED PARTY TRANSACTIONS
Insight Portfolio Group, LLC (“Insight”) is an entity formed and controlled by Mr. Icahn in order to maximize the potential buying power of a group of entities with which Mr. Icahn has a relationship in negotiating with a wide range of suppliers of goods, services, and tangible and intangible property at negotiated rates. The Company acquired a minority equity interest in Insight and agreed to pay a portion of Insight’s operating expenses beginning in 2013. In addition to the minority equity interest held by the Company, certain subsidiaries of IEP and other entities with which Mr. Icahn has a relationship also acquired equity interests in Insight and also agreed to pay certain operating expenses.
The Company’s payments to Insight were less than $0.5 million for the years ended December 31, 2016, 2015, and 2014.
On June 1, 2015, a subsidiary of IEP completed an acquisition of substantially all of the assets of Uni-Select USA, Inc. and Beck Arnley Worldparts, Inc. comprising the U.S. automotive parts distribution of Uni-Select Inc ("Uni-Select"). Subsequent to the acquisition, Uni-Select changed its name to Auto Plus. Auto Plus is operated independently from the Company and all transactions are approved by the independent directors of the Company. In connection with the acquisition, Mr. Icahn has resigned from the Company's board of directors and Daniel A. Ninivaggi, Co-Chief Executive Officer of the Company has resigned from the board of directors of IEP.
The Company had $54 million of sales for the year ended December 31, 2016 and $27 million of sales from the date of acquisition through December 31, 2015 to Auto Plus. The Company had $11 million and $12 million of accounts receivable, net outstanding from Auto Plus as of December 31, 2016 and December 31, 2015.
On February 3, 2016, a subsidiary of IEP acquired a majority of the outstanding shares of Pep Boys - Manny, Moe & Jack ("Pep Boys"), a leading aftermarket provider of automotive service, tires, parts and accessories across the U.S. and Puerto Rico. On February 4, 2016, the acquisition of the remaining outstanding shares of Pep Boys was completed.
The Company had $39 million of sales from the date of acquisition for the year ended December 31, 2016 to Pep Boys and $25 million of accounts receivable, net outstanding from Pep Boys as of December 31, 2016.
99
On December 1, 2016, the Company acquired the assets and liabilities of Beck Arnley, an entity owned by a subsidiary of IEP. The purchase price was $14 million and included a $7 million non-interest bearing note maturing on May 1, 2018.
PSC Metals, Inc. (“PSC Metals”) is a wholly-owned subsidiary of IEP. The Company had scrap sales to PSC Metals of $2 million and less than $1 million for the years ended December 31, 2016 and 2015.
100
ITEM 9. CHANGES IN AND DISAGREEMENTS WITH ACCOUNTANTS ON ACCOUNTING AND FINANCIAL DISCLOSURE
None.
ITEM 9A. CONTROLS AND PROCEDURES
Evaluation of Disclosure Controls and Procedures
Our Co-Chief Executive Officers and Chief Financial Officer, based on their evaluation of the effectiveness of the Company's disclosure controls and procedures, as defined in Rule 13a-15(e) of the Securities Exchange Act of 1934, as amended (“Exchange Act”), as of December 31, 2016, have concluded the Company's disclosure controls and procedures are effective to ensure information required to be disclosed in our periodic reports filed under the Exchange Act is recorded, processed, summarized and reported within the specified time periods and is accumulated and communicated to the Company's management to allow timely decisions regarding required disclosure.
Management's Report on Internal Control Over Financial Reporting
The Company's management is responsible for establishing and maintaining adequate internal control over financial reporting, as defined in Exchange Act Rule 13a-15(f). The Company’s internal control over financial reporting is a process designed to provide reasonable assurance regarding the reliability of financial reporting and the preparation of financial statements for external purposes in accordance with generally accepted accounting principles in the United States of America.
Because of its inherent limitations, internal control over financial reporting may not prevent or detect misstatements. Also, projections of any evaluation of effectiveness to future periods are subject to the risk controls may become inadequate because of changes in conditions or because the degree of compliance with policies or procedures may deteriorate.
Under the supervision and with the participation of the principal executive and financial officers of the Company, an evaluation of the effectiveness of internal controls over financial reporting was conducted based upon the framework in Internal Control - Integrated Framework (2013) issued by the Committee of Sponsoring Organizations (the “COSO 2013 Framework”) of the Treadway Commission. Based on the evaluation performed under the COSO 2013 Framework as of December 31, 2016, management has concluded the Company’s internal control over financial reporting was effective.
Grant Thornton LLP, an independent registered public accounting firm, has audited the Company’s internal control over financial reporting as of December 31, 2016, as stated in their report which is included in Item 8 of this Form 10-K.
Changes in Internal Control over Financial Reporting
There were no changes in internal control over financial reporting during the quarter ended December 31, 2016 that have materially affected, or are reasonably likely to materially affect, our internal control over financial reporting.
ITEM 9B. OTHER INFORMATION
On February 16, 2016, Federal-Mogul announced the appointment of Bradley S. Norton as co-chief executive officer of the Company and chief executive officer of our Motorparts division, effective March 8, 2017. Mr. Norton will succeed Daniel A. Ninivaggi, who will serve as co-chief executive officer of the Company and chief executive officer of our Motorparts division through March 7, 2017. Rainer Jueckstock will remain as co-chief executive officer of the Company and chief executive officer of our Powertrain division.
Mr. Norton, 53, currently serves as Senior Vice President and General Manager, Chassis and Service, Motorparts Segment for the Company and has held that position since July 2014 Prior to joining the Company, Mr. Norton held various positions at Freudenberg-NOK, most recently as President until July 2014. Mr. Norton does not have an employment agreement with the Company and his base salary is set by the Compensation Committee of the Board of Directors (the “Compensation Committee”) based upon job scope and skill review. Mr. Norton’s base salary is currently $425,000. The Compensation Committee has not yet determined Mr. Norton’s compensation arrangements with respect to his new role with the Company. There are no family relationships between Mr. Norton and any of the directors and executive officers of the Company, and there are no transactions in which Mr. Norton has an interest requiring disclosure under Item 404(a) of Regulation S-K.
101
PART III
ITEM 10. DIRECTORS, EXECUTIVE OFFICERS AND CORPORATE GOVERANCE
The information required by Item 10 regarding our directors and other corporate governance matters is incorporated by reference to the Company’s proxy statement for the 2016 annual meeting of stockholders under the captions “Election of Directors”, “Corporate Governance”, “Executive Officers”, and “Security Ownership of Certain Beneficial Owners and Management.” The information required by Item 10 regarding compliance with section 16(a) of the Securities and Exchange Act of 1934, as amended, is incorporated by reference to the Company’s proxy statement for the 2015 annual meeting of stockholders under the caption “Section 16(a) Beneficial Ownership Reporting Compliance."
ITEM 11. EXECUTIVE COMPENSATION
Information with respect to compensation of executive officers and directors of the Company under the captions “Director Compensation”, “Compensation Committee Interlocks and Insider Participation,” and “Compensation Discussion and Analysis” in the Company’s 2017 proxy statement is incorporated herein by reference and made a part of this Annual Report.
ITEM 12. SECURITY OWNERSHIP OF CERTAIN BENEFICIAL OWNERS AND MANAGEMENT AND RELATED STOCKHOLDER MATTERS
Information under the captions “Security Ownership of Certain Beneficial Owners and Management” in the Company’s for the 2017 proxy statement is incorporated herein by reference and made a part of this Annual Report.
ITEM 13. CERTAIN RELATIONSHIPS AND RELATED TRANSACTIONS, AND DIRECTORS INDEPENDENCE
Related Party Transaction Policy
The Company has a written policy that requires the Audit Committee or a majority of the disinterested directors of the Company to approve or ratify certain transactions involving the Company in which any director, nominee for director, executive officer, 5% beneficial stockholder, or any of their immediate family members has a direct or indirect material interest, as determined by the Audit Committee and the aggregate amount involved is or is expected to exceed $120,000. This policy covers transactions including financial transactions, arrangements or relationships, indebtedness and guarantees of indebtedness, or series of similar transactions, arrangements or relationships, or any material amendment to any such transaction.
Tax Allocation Agreement
On July 11, 2013, Federal-Mogul Corporation became part of the Icahn Enterprises L.P ("IEP") affiliated group of corporations as defined in Section 1504 of the Internal Revenue Code of 1986 ("the Code"), as amended, of which AEP is the common parent. The Company subsequently entered into a Tax Allocation Agreement (the “Tax Allocation Agreement”) with AEP. Pursuant to the Tax Allocation Agreement, AEP and the Company have agreed to the allocation of certain income tax items. The Company will join AEP in the filing of AEP’s federal consolidated return and certain state consolidated returns. In those jurisdictions where the Company is filing consolidated returns with AEP, the Company will pay to AEP any tax it would have owed had it continued to file separately. Effective January 23, 2017, AEP will no longer be obligated to the Company for reductions to the consolidated group's tax liability as a result of including the Company in its consolidated group.
On February 14, 2017, the Company was converted into a limited liability company in the U.S. and changed its name to Federal-Mogul Holdings LLC. As a result of the conversion, the Company is treated as a disregarded entity for U.S. income tax purposes and no U.S. income tax will be allocated to the Company. IEP will succeed to the Company’s U.S. deferred tax assets and liabilities as the sole member of the Company. However, for purposes of preparing its financial statements, the Company will continue to use a separate return methodology in determining income taxes prospectively.
Certain Relationships and Related Party Transactions
Based on a review of the questionnaires the Company's directors and executive officers completed, and a review of the Company's internal records on any related person that was identified in such questionnaires, it has determined there are no related party transactions in excess of $120,000, since the beginning of 2016 or currently proposed, involving the Company, other than as follows:
102
• | Insight Portfolio Group, LLC (“Insight”) is an entity formed and controlled by Mr. Icahn in order to maximize the potential buying power of a group of entities with which Mr. Icahn has a relationship in negotiating with a wide range of suppliers of goods, services, and tangible and intangible property at negotiated rates. The Company acquired a minority equity interest in Insight and agreed to pay a portion of Insight’s operating expenses beginning in 2013. In addition to the minority equity interest held by the Company, certain subsidiaries of IEP and other entities with which Mr. Icahn has a relationship also acquired equity interests in Insight and also agreed to pay certain operating expenses. |
The Company’s payments to Insight were less than $0.5 million for the year ended December 31, 2016. The Company anticipates its 2017 payments to Insight Portfolio Group to be similar to the amounts paid in 2016.
• | On June 1, 2015, a subsidiary of IEP, completed an acquisition of substantially all of the assets of Uni-Select USA, Inc. and Beck Arnley Worldparts, Inc. comprising the U.S. automotive parts distribution of Uni-Select Inc ("Uni-Select"). Subsequent to the acquisition, Uni-Select changed its name to Auto Plus. Auto Plus is operated independently from the Company and all transactions are approved by the independent directors of the Company. In connection with the acquisition, Mr. Icahn has resigned from the Company's board of directors and Daniel A. Ninivaggi, Co-Chief Executive Officer of the Company has resigned from the board of directors of IEP. |
The Company had $54 million of sales for the year ended December 31, 2016 to Auto Plus. The Company had $11 million of accounts receivable, net outstanding from Auto Plus as of December 31, 2016.
• | On February 3, 2016, a subsidiary of IEP acquired a majority of the outstanding shares of Pep Boys - Manny, Moe & Jack ("Pep Boys"), a leading aftermarket provider of automotive service, tires, parts and accessories across the U.S. and Puerto Rico. On February 4, 2016, the acquisition of the remaining outstanding shares of Pep Boys was completed. The Company had $39 million of sales from the date of acquisition for the year ended December 31, 2016 to Pep Boys and $25 million of accounts receivable, net outstanding from Pep Boys as of December 31, 2016. |
• | On December 1, 2016, the Company acquired substantially all of the assets and liabilities of Beck Arnley, an entity owned by a subsidiary of IEP. The purchase price was $14 million and included a $7 million non-interest bearing note maturing on May 1, 2018. |
• | PSC Metals, Inc. (“PSC Metals”) is a wholly-owned subsidiary of IEP. The Company had scrap sales to PSC Metals of $2 million for the year ended December 31, 2016. |
• | IEP has a noncontrolling ownership interest in Navistar, Inc. (“Navistar”), Hertz Global Holdings Inc. (“Hertz”), and Xerox Corporation ("Xerox"), and a controlling interest in XO Holdings, Inc. (“XO”). The Company’s purchases from Hertz, XO, and Xerox were $2 million, $1 million, and $5 million for the year ended December 31, 2016. The Company’s sales to Navistar for the year ended December 31, 2016 were $15 million. |
• | Janis N. Acosta, the wife of Mr. Ninivaggi, the Company’s Co-Chief Executive Officer and Chief Executive Officer of the Motorparts Segment and director, serves as the Executive Vice President, General Counsel and Corporate Secretary of International Automotive Components Group (“IAC Group”). In the year ended December 31, 2016, the Company sold $6 million in products to IAC Group. These transactions with IAC Group were made in the ordinary course of the Company’s business and in accordance with its normal procedures for sales of its products to customers on an arms-length basis. |
Affiliate Pension Obligations
As a result of the more than 80% ownership interest in the Company by Mr. Icahn’s affiliates, the Company is subject to the pension liabilities of all entities in which Mr. Icahn has a direct or indirect ownership interest of at least 80%. One such entity, ACF Industries LLC ("ACF"), is the sponsor of several pension plans. All the minimum funding requirements of the Code and the Employee Retirement Income Security Act of 1974 for these plans have been met as of December 31, 2016. If the ACF plans were voluntarily terminated, they would be underfunded by approximately $111 million as of December 31, 2016. These results are based on the most recent information provided by the plans’ actuaries. These liabilities could increase or decrease, depending on a number of factors, including future changes in benefits, investment returns, and the assumptions used to calculate the liability. As members of the controlled group, the Company would be liable for any failure of ACF to make ongoing pension contributions or to pay the unfunded liabilities upon a termination of the pension plans of ACF. In addition, other entities now or in the future within the controlled group in which the Company is included may have pension plan obligations that are, or may become, underfunded and the Company would be liable for any failure of such entities to make ongoing pension contributions or to pay the unfunded liabilities upon termination of such plans. Further, the failure to pay these
103
pension obligations when due may result in the creation of liens in favor of the pension plan or the Pension Benefit Guaranty Corporation (“PBGC”) against the assets of each member of the controlled group.
The current underfunded status of the pension plans of ACF requires it to notify the PBGC of certain “reportable events,” such as if the Company ceases to be a member of the ACF controlled group, or the Company makes certain extraordinary dividends or stock redemptions. The obligation to report could cause the Company to seek to delay or reconsider the occurrence of such reportable events.
Icahn Enterprises Holdings L.P. and IEH FM Holdings LLC have undertaken to indemnify Federal-Mogul for any and all liability imposed upon the Company pursuant to the Employee Retirement Income Security Act of 1974, as amended, or any regulation there under (“ERISA”) resulting from the Company being considered a member of a controlled group within the meaning of ERISA § 4001(a)(14) of which American Entertainment Properties Corporation is a member, except with respect to liability in respect to any employee benefit plan, as defined by ERISA § 3(3), maintained by the Company. Icahn Enterprises Holdings L.P. and IEH FM Holdings LLC are not required to maintain any specific net worth and there can be no guarantee Icahn Enterprises Holdings L.P. and IEH FM Holdings LLC will be able to fund its indemnification obligations to the Company.
Additional Information
Additional information required by Item 13 is incorporated herein by reference to the Company’s 2017 proxy statement under the captions “Director Independence and Controlled Company Status” and “Certain Relationships and Related-Party Transactions.”
ITEM 14. PRINCIPAL ACCOUNTANT FEES AND SERVICES
Information with respect to the fees and services of the Company’s principal accountant under the caption “Fees of Independent Registered Public Accounting Firm” in the Company’s proxy statement for the 2017 annual meeting of stockholders is incorporated herein by reference and made a part of this Annual Report.
104
PART IV
ITEM 15. EXHIBITS AND FINANCIAL STATEMENT SCHEDULES
(a)The following documents are filed as part of this report:
1. | Financial Statements |
Financial statements filed as part of this Annual Report on Form 10-K are listed under Part II, Item 8 hereof.
2. | Financial Statement Schedules |
Schedule II — Valuation and Qualifying Accounts
Financial Statements and Schedules Omitted
Schedules other than the schedule listed above are omitted because they are not required or applicable under instructions contained in Regulation S-X or because the information called for is shown in the financial statements and notes thereto.
105
SCHEDULE II — VALUATION AND QUALIFYING ACCOUNTS
FEDERAL-MOGUL CORPORATION AND SUBSIDIARIES
Additions | ||||||||||||||||||
Description | Balance at Beginning of Period | Charged to Costs and Expenses | Charged to Other Accounts | Deductions | Balance at End of Period | |||||||||||||
(in millions) | ||||||||||||||||||
Year ended December 31, 2016: | ||||||||||||||||||
Valuation allowance for trade receivables | $ | 27 | 5 | — | (13 | ) | (1) | $ | 19 | |||||||||
Valuation allowance for excess and obsolete inventory | $ | 110 | 22 | (2 | ) | (2) | (15 | ) | $ | 115 | ||||||||
Year ended December 31, 2015: | ||||||||||||||||||
Valuation allowance for trade receivables | $ | 18 | 13 | — | (4 | ) | (1) | $ | 27 | |||||||||
Valuation allowance for excess and obsolete inventory | $ | 115 | 15 | (7 | ) | (2) | (13 | ) | $ | 110 | ||||||||
Year ended December 31, 2014: | ||||||||||||||||||
Valuation allowance for trade receivables | $ | 11 | 5 | 7 | (5 | ) | (1) | $ | 18 | |||||||||
Valuation allowance for excess and obsolete inventory | $ | 98 | 42 | (7 | ) | (2) | (18 | ) | $ | 115 | ||||||||
(1) | Uncollectible accounts charged off net of recoveries. |
(2) | Exchange rate impact. |
106
15(b). Exhibits
The Company will furnish upon request any of the following exhibits upon payment of the Company’s reasonable expenses for furnishing such exhibit.
2.1 | Agreement and Plan of Merger, dated April 14, 2014, by and among Federal-Mogul Corporation, Federal-Mogul Holdings LLC, Federal-Mogul MergerCo Inc. and Federal-Mogul Holding Sweden AB. (Incorporated by Reference to Exhibit 2.1 to the Company's Current Report on Form 8-K dated April 14, 2014 and filed with the Securities and Exchange Commission on April 16, 2014). | ||
2.2 | Asset Purchase Agreement, dated as of January 21, 2014, between Affinia Group Inc. and VCS Quest Acquisition LLC (Incorporated by reference to Exhibit 2.1 to the Company’s Current Report on Form 8-K dated January 21, 2014 and filed with the Securities and Exchange Commission on January 22, 2014). | ||
2.3 | Letter Agreement, dated April 29, 2014, by and between Federal-Mogul Chassis LLC and Affinia Group Inc. (Incorporated by reference to Exhibit 2.1 to the Company’s Current Report on Form 8-K dated April 29, 2014 and filed with the Securities and Exchange Commission on May 2, 2014). | ||
2.4 | Amended and Restated Stock and Asset Purchase Agreement dated as of January 7, 2014 by and among Honeywell International Inc., Platin 966. GmbH and Saxid SAS (Incorporated by reference to Exhibit 2.1 to the Company’s Current Report on Form 8-K dated July 9, 2014 and filed with the Securities and Exchange Commission on July 15, 2014). | ||
2.5 | Agreement and Plan of Merger, dated as of September 6, 2016, by and among Federal-Mogul Holdings Corporation, American Entertainment Properties Corp. and IEH FM Holdings LLC (Incorporated by reference to Exhibit 2.1 to the Company’s Current Report on Form 8-K dated September 6, 2016 and filed with the Securities and Exchange Commission on September 7, 2016). | ||
3.1 | Amended and Restated Certificate of Incorporation of Federal-Mogul Holdings LLC (Incorporated by reference to Exhibit 3.1 to the Company’s Current Report on Form 8-K dated January 23, 2017 and filed with the Securities and Exchange Commission on January 23, 2017). | ||
3.2 | Amended and Restated Bylaws of Federal-Mogul Holdings LLC (Incorporated by reference to Exhibit 3.2 to the Company’s Current Report on Form 8-K dated January 23, 2017 and filed with the Securities and Exchange Commission on January 23, 2017). | ||
4.1 | Federal-Mogul U.S. Asbestos Personal Injury Trust Agreement by and among the Company, the Future Claimants Representative, the Official Committee of Asbestos Claimants, the Trustees, Wilmington Trust Company, and the members of the Trust Advisory Committee, dated as of December 27, 2007 (Incorporated by reference to Exhibit 4.1 to the Company’s Current Report on Form 8-K dated December 27, 2007 and filed with the Securities and Exchange Commission on January 3, 2008). | ||
4.2 | Registration Rights Agreement dated as of December 27, 2007 by and among the company, Thornwood Associates Limited Partnership and the Federal-Mogul Asbestos Personal Injury Trust (Incorporated by reference to Exhibit 4.5 to the Company’s Current Report on Form 8-K dated December 27, 2007 and filed with the Securities and Exchange Commission on January 3, 2008.) | ||
4.3 | Amendment and Joinder to Federal-Mogul Corporation Registration Rights Agreement among Federal-Mogul Corporation and IEH FM Holdings LLC (Incorporated by reference to Exhibit 4.1 to the Company’s Current Report on Form 8-K dated July 9, 2013 and filed with the Securities and Exchange Commission on July 11, 2013.) | ||
10.1 | Federal-Mogul Corporation 2010 Stock Incentive Plan (Incorporated by Reference to Exhibit 10.1 to the Company’s Current Report on Form 8-K dated May 26, 2010 and filed with the Securities and Exchange Commission on June 2, 2010). † | ||
10.2 | Form of Stock Appreciation Rights Agreement (Incorporated by Reference to Exhibit 10.2 to the Company’s Current Report on Form 8-K dated May 26, 2010 and filed with the Securities and Exchange Commission on June 2, 2010). † | ||
10.3 | Employment Agreement by and between the Company and Rainer Jueckstock dated as of April 1, 2012. (Incorporated by Reference to Exhibit 10.2 to the Company’s Current Report on Form 8-K dated March 20, 2012 and filed with the Securities and Exchange Commission on March 14, 2012). † | ||
10.4 | Federal-Mogul 2016 Powertrain Management Incentive Plan (MIP) (Incorporated by Reference to Exhibit 10.3 to the Company’s Quarterly Report filed on Form 10-Q for the quarter ended March 31, 2016 and filed with the Securities and Exchange Commission on April 27, 2016). † | ||
10.5 | Federal-Mogul 2016 Motorparts Management Incentive Plan (MIP) (Incorporated by Reference to Exhibit 10.4 to the Company’s Quarterly Report filed on Form 10-Q for the quarter ended March 31, 2016 and filed with the Securities and Exchange Commission on April 27, 2016). † | ||
107
10.6 | First Amendment to Employment Agreement, effective April 1, 2016, by and between Federal-Mogul Corporation and Rainer Jueckstock (Incorporated by reference to Exhibit 10.1 to the Company's Current Report on Form 8-K dated April 1, 2016 and files with the Securities and Exchange Commission on April 4, 2016.) † | ||
10.7 | Federal-Mogul Corporation 2010 Stock Incentive Plan Form of Performance Award Agreement-Motorparts Segment (Incorporated by Reference to Exhibit 10.2 to the Company’s Quarterly Report filed on Form 10-Q for the quarter ended March 31, 2016 and filed with the Securities and Exchange Commission on April 27, 2016). † | ||
10.8 | Replacement Revolving Facility dated December 6, 2013, which is an amendment of the Term Loan and Revolving Credit Agreement, dated as of December 27, 2007, among the Company, the lenders party thereto, Citicorp USA, Inc., as Administrative Agent, JPMorgan Chase Bank, N.A., as Syndication Agent, and Wachovia Capital Finance Corporation and Wells Fargo Foothill, LLC, as Co-Documentation Agents, to amend its existing revolving credit facility to provide for a replacement revolving credit facility (Incorporated by Reference to Exhibit 10.1 to the Company’s Current Report on Form 8-K dated December 6, 2013 and filed with the Securities and Exchange Commission on December 9, 2013). | ||
10.9 | Letter Agreement, dated January 28, 2016, between Jerome Rouquet and Federal-Mogul Motorparts Corporation (Incorporated by Reference to Exhibit 10.2 to the Company's Quarterly Report filed on FOrm 10-Q for the quarter ended March 31, 2016 and filed with the Securities and Exchange Commission on April 27, 2016). † | ||
10.10 | Amendment Agreement dated as of April 15, 2014 to the Term Loan and Revolving Credit Agreement dated as of December 27, 2007 among Federal-Mogul Corporation, Citicorp USA, Inc. and each of the lenders party thereto (Incorporated by reference to Exhibit 10.1 to the Company’s Current Report on Form 8-K dated April 14, 2014 and filed with the Securities and Exchange Commission on April 16, 2014). | ||
10.11 | Employment Agreement by and between the Company and Daniel A. Ninivaggi dated as of February 5, 2014. (Incorporated by Reference to Exhibit 10.2 to the Company’s Current Report on Form 8-K dated February 4, 2104 and filed with the Securities and Exchange Commission on February 10, 2014). † | ||
10.12 | Amended and Restated Share and Asset Purchase Agreement dated as of January 23, 2015 by and between TRW Automotive Inc. and Federal-Mogul Valvetrain Gmbh (Incorporated by reference to Exhibit 2.1 to the Company’s Current Report on Form 8-K filed dated January 23, 2015 and filed with the Securities and Exchange Commission on January 29, 2015). | ||
10.13 | Tax Allocation Agreement by and among American Entertainment Properties Corp. and Federal Mogul Corporation dated as of July 11, 2013 (Incorporated by reference to Exhibit 10.1 to the Company’s Current Report on Form 8-K dated July 9, 2013 and filed with the Securities and Exchange Commission on July 11, 2013.) | ||
* | 21 | Subsidiaries of the Registrant. | |
* | 31.1 | Certification by the Company’s Co-Chief Executive Officer pursuant to Rule 13a-14 | |
* | 31.2 | Certification by the Company’s Co-Chief Executive Officer pursuant to Rule 13a-14 | |
* | 31.3 | Certification by the Company’s Chief Financial Officer pursuant to Rule 13a-14 | |
* | 32 | Certification by the Company’s Co-Chief Executive Officers and Chief Financial Officer pursuant to 18 U.S.C. Section 1350 and Rule 13a-14(b) | |
* | 101.INS | XBRL Instance Document | |
* | 101.SCH | XBRL Taxonomy Extension Schema Document | |
* | 101.CAL | XBRL Taxonomy Extension Calculation Linkbase Document | |
* | 101.LAB | XBRL Taxonomy Extension Label Linkbase Document | |
* | 101.PRE | XBRL Taxonomy Extension Presentation Linkbase Document | |
* | 101.DEF | XBRL Taxonomy Extension Definition Linkbase Document | |
* | Filed Herewith |
† | Management contracts and compensatory plans or arrangements. |
15(c). Separate financial statements of affiliates whose securities are pledged as collateral.
None
108
SIGNATURES
Pursuant to the requirements of Section 13 or 15(d) of the Securities Exchange Act of 1934, the registrant has duly caused this report to be signed on its behalf by the undersigned, thereunto duly authorized.
Federal-Mogul Holdings LLC
By: | /s/ Jérôme Rouquet |
Jérôme Rouquet | |
Senior Vice President and | |
Chief Financial Officer | |
Dated: February 22, 2017
109
Pursuant to the requirements of the Securities Exchange Act of 1934, this report has been signed below by the following persons on behalf of the registrant and in the capacities and on the dates indicated.
/s/ Daniel A. Ninivaggi | Co-Chairman and Co-Chief Executive Officer, Federal-Mogul Holdings LLC, Chief Executive Officer, Motorparts Division, Director | February 22, 2017 | ||
Daniel A. Ninivaggi | ||||
/s/ Rainer Jueckstock | Co-Chairman and Co-Chief Executive Officer, Federal-Mogul Holdings LLC, Chief Executive Officer, Powertrain Division, Director | February 22, 2017 | ||
Rainer Jueckstock | ||||
/s/ Jérôme Rouquet | Senior Vice President and Chief Financial Officer (Principal Financial Officer) | February 22, 2017 | ||
Jérôme Rouquet | ||||
/s/ John S. Patouhas | Vice President and Chief Accounting Officer (Principal Accounting Officer) | February 22, 2017 | ||
John S. Patouhas | ||||
/s/ SungHwan Cho | Director | February 22, 2017 | ||
SungHwan Cho | ||||
/s/ Keith Cozza | Director | February 22, 2017 | ||
Keith Cozza | ||||
/s/ Cheryl Krongard | Director | February 22, 2017 | ||
Cheryl Krongard | ||||
/s/ Stephen Mongillo | Director | February 22, 2017 | ||
Stephen Mongillo | ||||
/s/ Michael Nevin | Director | February 22, 2017 | ||
Michael Nevin | ||||
110