Attached files
| file | filename |
|---|---|
| EX-10.31 - EXHIBIT 10.31 - ELLIE MAE INC | ex1031-liminhuexecutivetra.htm |
| EX-32.2 - EXHIBIT 32.2 - ELLIE MAE INC | elli-20161231xex322.htm |
| EX-32.1 - EXHIBIT 32.1 - ELLIE MAE INC | elli-20161231xex321.htm |
| EX-31.2 - EXHIBIT 31.2 - ELLIE MAE INC | elli-20161231xex312.htm |
| EX-31.1 - EXHIBIT 31.1 - ELLIE MAE INC | elli-20161231xex311.htm |
| EX-23.1 - EXHIBIT 23.1 - ELLIE MAE INC | elli-20161231xex231.htm |
| EX-10.30 - EXHIBIT 10.30 - ELLIE MAE INC | ex1030-brianbrownpromotion.htm |
UNITED STATES SECURITIES AND EXCHANGE COMMISSION
Washington, D.C. 20549
_____________________________
FORM 10-K
_____________________________
(Mark One)
x | ANNUAL REPORT PURSUANT TO SECTION 13 OR 15(d) OF THE SECURITIES EXCHANGE ACT OF 1934 |
For the fiscal year ended December 31, 2016
OR
¨ | TRANSITION REPORT PURSUANT TO SECTION 13 OR 15(d) OF THE SECURITIES EXCHANGE ACT OF 1934 |
For the transition period from to
Commission File Number: 001-35140
_____________________________
ELLIE MAE, INC.
(Exact name of registrant as specified in its charter)
_____________________________
Delaware | 94-3288780 | |
(State or other jurisdiction of incorporation or organization) | (I.R.S. Employer Identification No.) | |
4420 Rosewood Drive, Suite 500 Pleasanton, California | 94588 | |
(Address of principal executive offices) | (Zip Code) | |
(925) 227-7000
(Registrant’s telephone number, including area code)
_____________________________
Securities Registered pursuant to Section 12(b) of the Act:
Title of Each Class | Name of Each Exchange on Which Registered | |
Common Stock, par value $0.0001 per share | New York Stock Exchange | |
Securities Registered pursuant to Section 12(g) of the Act: None
_____________________________
Indicate by check mark if the registrant is a well-known seasoned issuer, as defined in Rule 405 of the Securities Act. Yes x No o
Indicate by check mark if the registrant is not required to file reports pursuant to Section 13 of Section 15(d) of the Act. Yes o No x
Indicate by check mark whether the registrant (1) has filed all reports required to be filed by Section 13 or 15(d) of the Securities Exchange Act of 1934 during the preceding 12 months (or for such shorter period that the registrant was required to file such reports), and (2) has been subject to such filing requirements for the past 90 days. Yes x No o
Indicate by check mark whether the registrant has submitted electronically and posted on its corporate Website, if any, every Interactive Data File required to be submitted and posted pursuant to Rule 405 of Regulation S-T during the preceding 12 months (or for such shorter period that the registrant was required to submit and post such files). Yes x No o
Indicate by check mark if disclosure of delinquent filers pursuant to Item 405 of Regulation S-K is not contained herein, and will not be contained, to the best of the registrant’s knowledge, in definitive proxy or information statements incorporated by reference in Part III of this Form 10-K or any amendment to this Form 10-K. o
Indicate by check mark whether the registrant is a large accelerated filer, an accelerated filer, or a non-accelerated filer, or a smaller reporting company. See definitions of “large accelerated filer,” “accelerated filer” and “smaller reporting company” in Rule 12b-2 of the Exchange Act.
Large accelerated filer | x | Accelerated filer | o | Non-accelerated filer | o | Smaller reporting company | o |
(Do not check if a smaller reporting company) | |||||||
Indicate by check mark whether the registrant is a shell company (as defined in Rule 12b-2 of the Exchange Act). Yes o No x
The aggregate market value of the voting and non-voting common equity held by non-affiliates of the registrant as of June 30, 2016, the last business day of the registrant’s most recently completed second fiscal quarter, was approximately $2,332,871,000 (based on the last reported sale price of $91.65 on June 30, 2016).
33,770,632 shares of the registrant’s common stock, par value $0.0001 per share, were outstanding as of February 16, 2017.
Documents Incorporated by Reference
Portions of the registrant’s Proxy Statement for the registrant’s 2017 Annual Meeting of Stockholders are incorporated by reference into Part III of this Form 10-K to the extent stated herein. The registrant intends to file the Proxy Statement within 120 days of the registrant’s fiscal year ended December 31, 2016.
Ellie Mae, Inc.
Form 10-K
For the Year Ended December 31, 2016
TABLE OF CONTENTS
Page | ||
Part I. | ||
Item 1. | ||
Item 1A. | ||
Item 1B. | ||
Item 2. | ||
Item 3. | ||
Item 4. | ||
Part II. | ||
Item 5. | ||
Item 6. | ||
Item 7. | ||
Item 7A. | ||
Item 8. | ||
Item 9. | ||
Item 9A. | ||
Item 9B. | ||
Part III. | ||
Item 10. | ||
Item 11. | ||
Item 12. | ||
Item 13. | ||
Item 14. | ||
Part IV. | ||
Item 15. | ||
Signatures | ||
NOTE REGARDING FORWARD-LOOKING STATEMENTS
This Annual Report on Form 10-K and the documents incorporated herein by reference contain forward-looking statements within the meaning of Section 27A of the Securities Act of 1933, as amended, and Section 21E of the Securities Exchange Act of 1934, as amended, which are subject to the “safe harbor” created by those sections. These forward-looking statements include, but are not limited to, statements concerning our strategy, future operations, future financial performance, future revenues, future profitability, future products and services, projected costs, expectations regarding demand and acceptance of our products and services, growth opportunities, our reputation, future economic conditions, trends in the market in which we operate, the plans and objectives of management and the statements set forth in the section captioned “Management’s Discussion and Analysis of Financial Condition and Results of Operations” in this report.
Forward-looking statements may include words such as “may,” “will,” “should,” “expect,” “plan,” “intend,” “anticipate,” “believe,” “estimate,” “predict,” “potential,” “continue” or other wording indicating future results or expectations. Forward-looking statements are subject to risks and uncertainties, and actual events or results may differ materially. These forward-looking statements involve risks and uncertainties that could cause our actual results to differ materially from those in the forward-looking statements, including, without limitation:
• | outages and other system interruptions in our Encompass software, the Ellie Mae Network service or our other services and any related impact on our reputation; |
• | fluctuations in mortgage lending volume; |
• | the volume of mortgages originated by our Encompass users; |
• | the impact of changes in mortgage interest rates; |
• | changes in mortgage originator, lender, investor or service provider behavior and any related impact on the residential mortgage industry; |
• | our ability to accurately forecast revenues and appropriately plan our expenses; |
• | the number of Encompass users, including contracted Encompass users; |
• | the effectiveness of our marketing and sales efforts to attract new and retain existing Encompass users and Ellie Mae Network participants; |
• | transaction volume on the Ellie Mae Network; |
• | the level of demand for our Encompass Docs Solution, our Encompass Product & Pricing Service, our Encompass Compliance Service, our Encompass CRM service and the other services we offer; |
• | our ability to secure the confidential information of the customers of the users of our software and services; |
• | our ability to enhance the features and functionality of our software and services, including the development and successful deployment of our next generation Encompass platform; |
• | the timing of the introduction and acceptance of new software and services; |
• | changes in government regulation affecting mortgage lenders and Ellie Mae Network participants or our business, and potential structural changes in the U.S. residential mortgage industry; |
• | customer retention, renewal and upgrade rates; |
• | the increased time, cost and complexity that may be required to successfully target larger customers; |
• | our ability to scale our operations and increase productivity to support our existing and growing customer base; |
• | our ability to successfully manage our growth and any future acquisitions of businesses, solutions or technologies; |
• | the risk that the anticipated benefits and growth prospects expected from our recent acquisitions may not be fully realized or may take longer to realize than expected; |
• | the timing of future acquisitions of businesses, solutions or technologies and new product launches; |
• | the impact of uncertain domestic and worldwide economic conditions, including the resulting effect on residential mortgage volumes; |
• | the attraction and retention of qualified employees and key personnel; |
• | our ability to compete effectively in a highly competitive market and adapt to technological changes; |
• | our ability to protect our intellectual property, including our proprietary Encompass software; |
• | costs associated with defending intellectual property infringement and other claims; our ability to maintain effective |
1
internal controls;
• | the risk of natural and man-made catastrophic interruptions to our business; and |
• | the risks set forth in the section captioned “Risk Factors” in this report. |
We do not assume any obligation to update any forward-looking statements, except as required by law.
In this report, references to “Ellie Mae,” “the Company,” “we,” “our” or “us” refer to Ellie Mae, Inc. together with its subsidiaries, unless the context requires otherwise.
PART I
ITEM 1. | BUSINESS |
Our Company
We are a leading provider of innovative on-demand software solutions and services for the residential mortgage industry in the United States. Banks, credit unions, mortgage lenders and mortgage brokers use our Encompass® all-in-one mortgage management solution to originate and fund mortgages and improve compliance, loan quality, and efficiency. At December 31, 2016, approximately 165,000 mortgage professionals used Encompass for their mortgage management solution.
Our Encompass software is a comprehensive, end-to-end enterprise solution that handles most of the functions involved in running the business of originating mortgages including: customer relationship management; loan processing; underwriting; preparation of mortgage applications, disclosure agreements, and closing documents; funding and closing the loan for the borrower; compliance with regulatory and investor requirements and overall enterprise management that provides one system of record for loans. Delivery of our Encompass software in an on-demand Software-as-a-Service, or SaaS, environment provides customers with the added benefits of lower up front implementation costs and reduced need for an infrastructure of servers, storage and network devices as well as the staff needed to support the infrastructure. SaaS delivery of Encompass enables access to the most current version of our software, including periodic upgrades and regulatory updates. We also host the Ellie Mae Network, a proprietary electronic platform that allows Encompass users to conduct electronic business transactions with mortgage investors (also referred to as “investors”) and service providers they work with in order to process and fund loans.
For mortgage originators, Encompass is a comprehensive mortgage management system that handles key business and management functions involved in running a residential mortgage origination business. Mortgage originators use Encompass as a single tool for loan processing, marketing, and customer communication and to interact electronically with lenders, investors, and service providers over the Ellie Mae Network. For the lenders, investors and service providers on the Ellie Mae Network, we provide electronic connectivity that allows them to do business with mortgage origination professionals using Encompass. We also offer Encompass users a variety of other on-demand software services delivered within Encompass which are discussed below in our Product and Services overview.
Mortgage originators pay for Encompass in one of two models: recurring monthly subscription fees or monthly subscription fees based on the number of licensed users combined with transaction fees based mortgages funded, which we refer to as Success Based Pricing. Our additional services are paid on either a subscription or transaction basis. Lenders, investors and service providers participating in the Ellie Mae Network also pay us fees, generally on a per transaction basis, for transactions processed through the Ellie Mae Network from Encompass users.
Under the AllRegs brand, our research and reference products include single and multifamily underwriting & insuring guidelines as well as libraries of federal and state laws and regulations, and we are the exclusive electronic publisher of certain mortgage lending guidelines for Fannie Mae and Freddie Mac and The Federal Home Loan Bank. Our educational division, AllRegs Academy, offers courses related to the mortgage industry, including self-paced training, instructor-led online courses, webinars or live classroom training and certified continuing education classes for state licensed mortgage originators. In addition, through the AllRegs brand, we offer documentation and learning management solutions to facilitate our customers’ mortgage lending compliance, as well as data and analytics services relating to investor loan products.
Corporate Information
Founded in 1997 as a California corporation, we were reincorporated as a Delaware corporation in November 2009. We completed our initial public offering of our common stock in April 2011, and our common stock is listed on the New York Stock Exchange under the symbol “ELLI”. Our mailing address and executive offices are located at 4420 Rosewood Drive, Suite 500, Pleasanton, California 94588 and our telephone number at that address is (925) 227-7000. Our website address is www. elliemae.com. Information found on or accessible through our website is not part of and is not incorporated into this report.
2
We are subject to the information and periodic reporting requirements of the Securities Exchange Act of 1934, or Exchange Act, and, in accordance therewith, file periodic reports, proxy statements, and other information with the Securities and Exchange Commission, or SEC. Such periodic reports, proxy statements, and other information are available for inspection and copying at the SEC’s Public Reference Room at 100 F Street, NE., Washington, DC 20549 or may be obtained by calling the SEC at 1-800-SEC-0330. In addition, the SEC maintains a website at http://www.sec.gov that contains reports, proxy statements, and other information regarding issuers that file electronically with the SEC. We also post on the Investor Relations page of our website, www.elliemae.com, a link to our filings with the SEC, our Corporate Governance Guidelines, and Code of Business Conduct and Ethics, which applies to all directors and all our employees, and the charters of our Audit Committee, Compensation Committee, and Nominating and Corporate Governance Committee of our board of directors. Our filings with the SEC are posted on our website and are available free of charge as soon as reasonably practical after they are filed electronically with the SEC. You can also obtain copies of these documents free of charge by writing to us at: Corporate Secretary, Ellie Mae, Inc., 4420 Rosewood Drive, Suite 500, Pleasanton, CA 94588, or emailing us at: ir@elliemae.com.
The “Ellie Mae,” “Encompass,” “AllRegs”, and other trademarks or service marks of Ellie Mae appearing in this report are the property of Ellie Mae.
Mortgage Industry Overview
Overview of Mortgage Origination Market
Mortgage originators typically advise borrowers, process loan files, collect, and verify the property and borrower data upon which lending decisions are based and, in the majority of cases, fund and close mortgage loans. According to data available pursuant to the Home Mortgage Disclosure Act (HMDA), there were more than 6,0001 mortgage lenders in 2016 in the United States, including national banks, regional banks, non-bank lenders and credit unions.
Based on estimates provided by the Mortgage Bankers Association, there were $1.9 trillion, $1.7 trillion, $1.3 trillion, $1.8 trillion, and $2.0 trillion2 in loans originated for 1- to 4-family homes during the years ended December 31, 2016, 2015, 2014, 2013, and 2012, respectively.
The Mortgage Origination Process
Originating a residential mortgage involves multiple parties and requires a complex series of data-laden transactions that must be handled accurately under tight time constraints. By the time a mortgage has been funded, the typical loan package contains over one thousand pages of documents that come from over a dozen different entities, usually operating on disparate technology systems and databases. Traditionally, much of the data used to prepare these documents has been gathered manually, rather than electronically, with documents exchanged among the many participants by facsimile, courier or mail. The entire process results in significant duplicative efforts, time delays, errors, costs, and redundant paper documentation, and often exposes borrower data to potential privacy and security breaches.
________________
1 | Federal Financial Institutions Examination Council, Federal Financial Institutions Examination Council Announces Availability of 2015 Data on Mortgage Lending, September 29, 2016. | |
2 | Mortgage Bankers Association, MBA Quarterly Origination Estimates as of November 17, 2016. Copyright 2016. | |
3
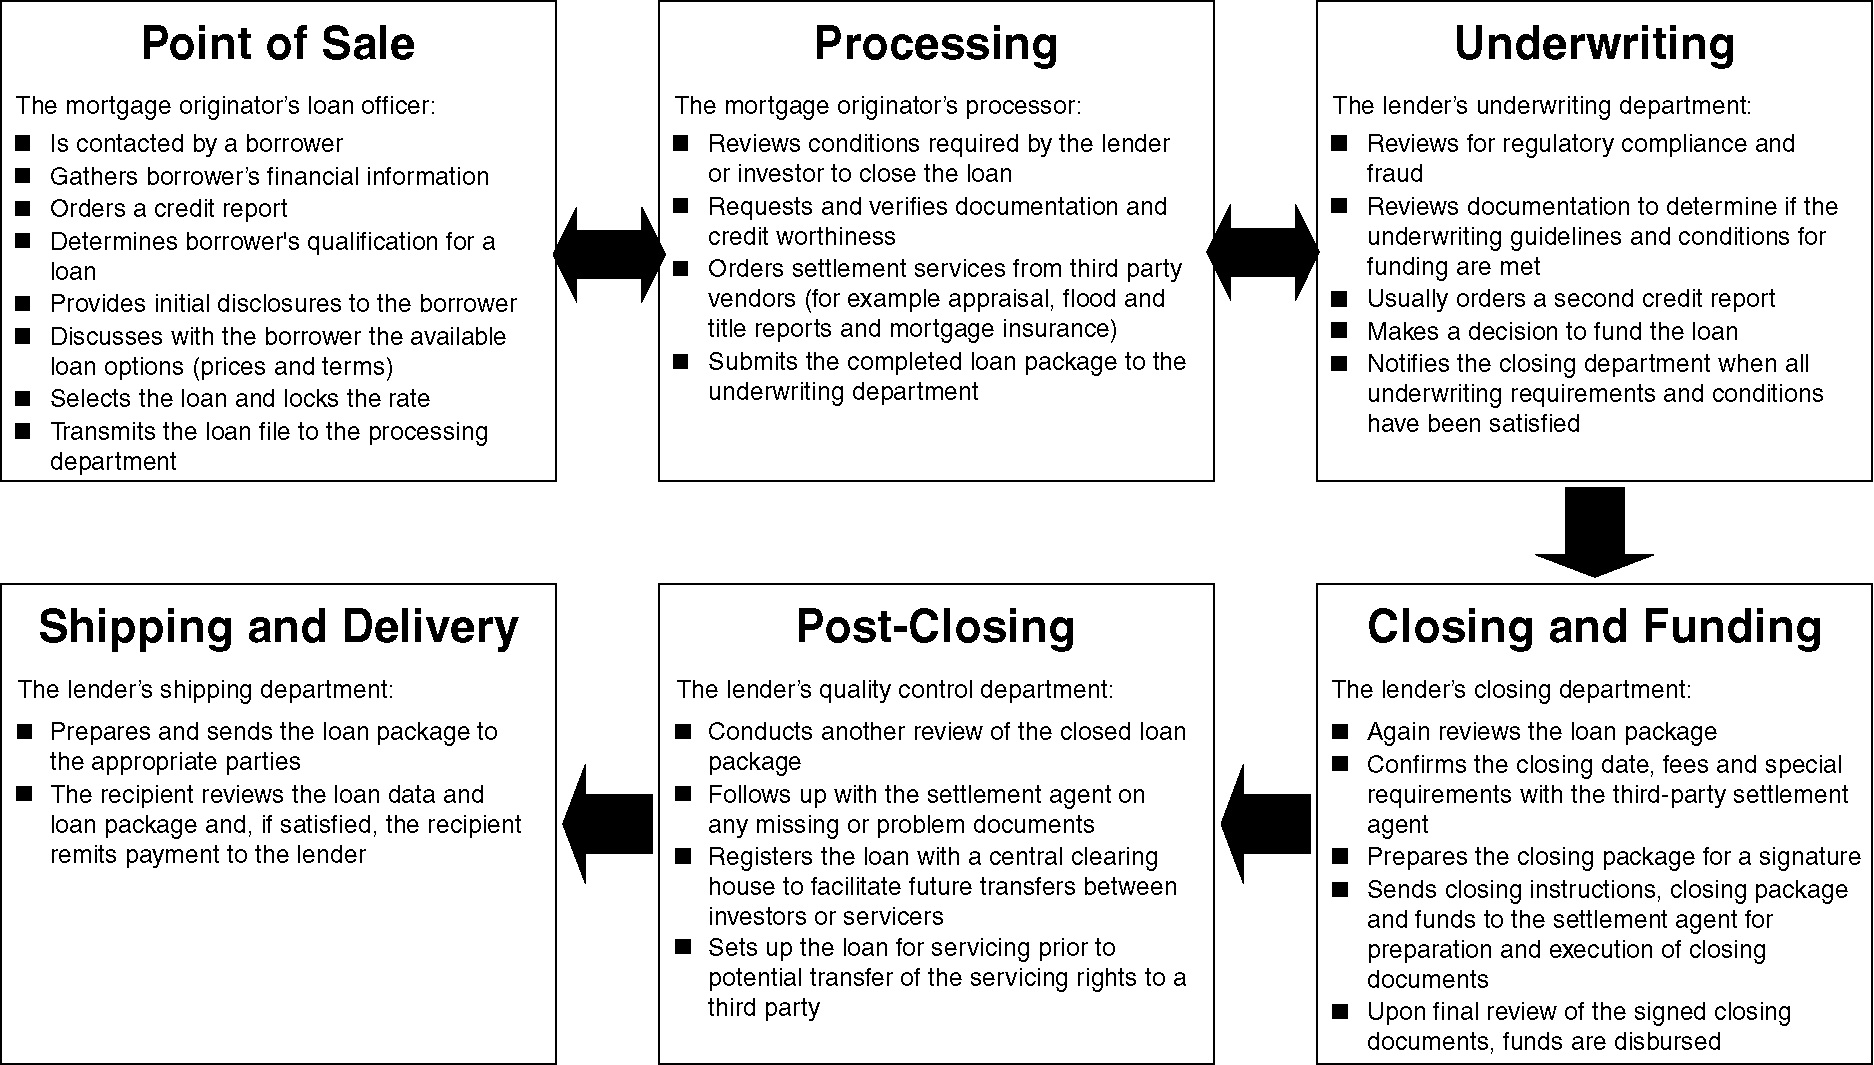
The following diagram of the mortgage origination process provides a framework for understanding the complexity and inefficiency of the process and the need for automated solutions.
In addition to the challenges involved in processing loans, mortgage originators must satisfy a multitude of federal, state and local regulations, and address basic business needs, including marketing, sales, product fulfillment, customer support, reporting, and general management functions. Historically, most mortgage originators have operated their businesses using separate task-specific software applications that were interconnected, if at all, through customized integrations. This often resulted in constraints on effective collaboration among operating departments, limited ability to monitor the business comprehensively, increased risk of error due to inconsistent data, failure to incorporate current regulations into work flows, inadequate security and control over the process, and expensive technical integration and maintenance costs.
Recent Mortgage Industry Trends and Developments
The residential mortgage industry continues to evolve and undergo significant changes. There are five major trends that are currently impacting the residential mortgage industry.
Greater Focus on Operational Efficiencies
The average total production cost per loan was $6,969 in the third quarter of 2016.3 We expect operational costs to continue to be a significant consideration for mortgage originators due to the continuously changing regulatory environment and heightened quality standards. As a result, mortgage originators have sought to increase their efficiency and reduce fixed expenses, leading them to explore technology solutions to automate their business processes as well as methods to avoid or reduce expenses that are not tied to revenue generating activities.
Customers Adopting Multi-Channel Strategies
Customers are developing multi-channel strategies beyond a single retail, correspondent or wholesale mortgage lending channel in order to grow their businesses. The requirements of these different channels vary and in order to maintain a single operating system, customers must use a robust system with customizable functionality.
________________
3 | Mortgage Bankers Association, Independent Mortgage Bank Volumes Up, Production Profits Stable in 3rd Quarter 2016, December 7, 2016. | |
4
Changes in Regulation Affecting Lenders and Investors
Mortgage lending regulations continue to change and many regulatory reforms have been introduced or proposed in recent years to promote increased underwriting standards and accountability by lenders and mortgage originators, ensure meaningful disclosures by lenders to borrowers, increase the transparency and objectivity of settlement services, and protect consumers in the mortgage market from unfair or abuse lending practices. Many of the significant changes in regulations were issued in 2014 and 2015 including legal changes resulting from the Dodd-Frank Wall Street Reform and Consumer Protection Act, or the Dodd-Frank Act, and associated regulations issued by the Consumer Financial Protection Bureau, or CFPB. These regulatory changes have complicated the mortgage origination process and increased the amount of documentation required to originate and fund residential mortgages. We have made and expect to continue to make significant investments in our products and services to address changing regulations
Increased Quality Standards Imposed by Regulators, Lenders and Investors
Lenders have eliminated many high-risk loan product offerings and significantly tightened underwriting and processing requirements. Similarly, investors seek higher-quality, lower-risk loans in which to invest. Consistent with these tightened standards and expectations, lenders and investors are demanding increased levels of documentation of the data upon which a lending decision will be based, increased use of third-party services to obtain unbiased and independent verification of borrowers’ creditworthiness, greater proof of the adequacy of the collateral securing mortgages and strict compliance with regulatory requirements. This trend further increases the amount of documentation and number of services required to originate and fund residential mortgages. Increased enforcement by federal and state regulators continues to encourage mortgage originators to explore technology solutions that provide adequate controls and policy enforcement to facilitate originating compliant loans.
Greater focus by customers and regulators on data security and consumer privacy
Recent high-profile data security incidents affecting banking institutions and their third party service providers have resulted in an increased focus on data security by our customers and our customers’ regulators. We expect the industry focus on data security to continue to increase as companies generate greater amounts of data and as future data security incidents occur.
Our Strategy
Our mission is to be the industry standard platform for residential mortgage origination in the United States. Key elements of our strategy include:
Increase the number of Encompass users. We continue to focus our marketing, sales and product development efforts to increase the number of mortgage lenders, commercial banks, thrifts, and credit unions using Encompass and our additional services. Mortgage lenders typically require software with comprehensive functionality to meet their various needs and generally order most of the settlement and other services available on the Ellie Mae Network in the process of funding loans. We continue to grow our sales department as we expect many non-Encompass mortgage lenders to assess new platform options and replace their legacy systems in response to the increased quality standards and compliance mandates affecting the industry. We intend to continue to focus our efforts on all segments, including the largest, or enterprise segment, of the lending industry.
Expand our product and service offerings to Encompass users. By utilizing our comprehensive suite of bundled products and services, customers avoid the risk and effort of cobbling together two or more solutions from our competing vendors. To the extent users do not subscribe to our bundled offering, we intend to encourage use of more of the Encompass services we currently offer, such as document preparation, electronic document management (“EDM”), compliance services, product and pricing services, fraud services, income tax verification services, flood services, appraisal services, website hosting and customer relationship management. As our customers opt for supplemental on-demand software and services, we generate additional revenues. These are services the lender uses to originate loans and by encouraging our customers to use these through the Encompass platform we can help offer the lender greater efficiency and cost savings and continue to drive additional revenue per user. We also intend to develop additional products and services to sell to our Encompass users.
Invest in new product & platform development. We are investing in the development of the next generation Encompass platform, known as Encompass NG, as well as the recently announced Encompass Connect solutions, each of which is built on the new Encompass Lending Platform and utilize Application Program Interfaces (“APIs”) to offer unique capabilities that help improve visibility and collaboration between loan officers, third-party originators, developers and homebuyers.
Expand the use of the Ellie Mae Network. The Ellie Mae Network provides mortgage originators electronic access to many of the investors and most of the service providers, that they need to interact with in order to process and fund loans. These transactions include electronic ordering of credit reports, appraisal services, title and flood reports and accessing the automatic underwriting systems of Fannie Mae and Freddie Mac. We will continue to encourage providers of settlement services to deliver these services electronically through the Ellie Mae Network, and we will continue to encourage adoption of these services by our
5
customers. By integrating and expanding our current and new services, we aim to provide our customers a more comprehensive solution.
Sell enhanced Ellie Mae Network offerings to investors, lenders, and service providers. We intend to continue to add functionality and services to the Ellie Mae Network so investors, lenders, and service providers can more effectively do business with mortgage originators using Encompass. Investors and lenders can populate mortgage originators’ Encompass software with specific compliance, underwriting, and documentation requirements for loans prior to delivery in order to screen loans for quality and regulatory compliance.
Investment in our Business. We are investing aggressively in initiatives that we believe will help us continue to grow our business, improve our products and services, and strengthen our competitive advantage while bringing sustainable, long-term value to our customers. During 2016, we increased our investments in our sales and client services capabilities, research and development, data security, and technology infrastructure to support our user additions and overall business growth. These investments include expanding our talent across the organization by hiring additional personnel. In order to continue supporting our customers and to further differentiate ourselves, we currently anticipate that throughout 2017 we will continue to invest in key areas such as research and development, enterprise sales, services, technical support, data security, and data center infrastructure. This investment will include the development of current infrastructure to accommodate new users and our next generation Encompass platform, which we expect to incrementally introduce during 2017 and 2018.
Acquisitions. Our industry is highly fragmented, and we believe there are strategic opportunities available to acquire technology-based companies that will complement and increase the attractiveness of our solutions. For example, in October 2015, we acquired substantially all of the assets of Mortgage Returns, LLC, or Mortgage Returns, a provider of on-demand customer relationship management and marketing automation solutions for mortgage lenders. With the acquisition of Mortgage Returns, we are responding to the needs of our customers by adding a robust CRM solution for lenders of all sizes. We expect to continue to evaluate and explore strategic opportunities that will enhance the breadth and depth of our solutions, and furthers our mission of automating the entire end-to-end mortgage process for our customers.
Products and Services
Encompass
Encompass is our proprietary, comprehensive mortgage management software solution built on the Encompass Lending Platform that combines loan origination and enterprise management software for mortgage originators into an all-in-one system, and also provides seamless access to the investors, lenders, and service providers on the Ellie Mae Network. The Encompass Lending Platform gives customers, partners and independent software vendors a secure, scalable platform plus a suite of APIs to enable them to extend Encompass with new functionality, easily integrate Encompass with external systems and data, and build custom applications that integrate with Encompass in the cloud. Encompass helps users structure and streamline their mortgage origination process and facilitates collaboration among internal departments of a mortgage origination company. It supports efficiency in gathering, reviewing, and verifying mortgage related data and in producing accurate documentation. It also enables enforcement of rules and business practices designed to ensure loan quality, adherence to processing standards, and regulatory compliance.
Encompass provides the following features and benefits:
Feature | Benefits | ||
Customer Acquisition and Relationship Management | • | Sales and marketing tools to help acquire and grow new business and pre-qualify prospective borrowers, while also allowing users to manage contacts, leads, and marketing campaigns. | |
• | Integration to custom branded websites to help attract new borrowers and create new loans through an online application that flows directly into the Encompass loan pipeline. | ||
• | Integration to a self-service portal where borrowers can research and apply for a loan online. Automatic lead follow-up and customer retention through campaign management capabilities that allow design and execution of multi-step marketing campaigns. | ||
• | Pre-qualification tools to start loan applications, access integrated pricing engines and easily find appropriate loan products and prices for a borrower. | ||
• | Automatic status updates posted to a branded website to keep customers and their real estate and other designated agents informed throughout the loan process. | ||
• | Tools used to track the effectiveness of marketing and relationship building activities. | ||
6
Feature | Benefits | ||
Processing | • | Configurable pipeline, forms and workflow enable faster loan processing, reduced errors and more efficient business operations. | |
• | Support for multiple business channels using configurable workflows. | ||
• | “Alert” management allows focus on urgent and relevant issues. | ||
• | Collaboration tools keep stakeholders informed and reduce the need to manually notify other employees, partners and borrowers. | ||
• | Seamless access to electronic document management simplifies document handling and increases data security. | ||
Risk Management and Business Reporting | • | Centralization of all business data and electronic images. | |
• | Built-in rules and safeguards to set and enforce business practices. | ||
• | Management dashboards highlighting key performance indicators. | ||
• | Predefined reports provide out-of-the-box intelligence and can be modified with a custom report writer. | ||
Connectivity, Personalization and Integration | • | Seamless and secure connections to thousands of service providers and investors on the Ellie Mae Network. | |
• | Workflow management to define customer-specific business processes. | ||
• | User-defined experience through a personalized homepage. | ||
• | Integration with third-party applications through a software development kit to leverage existing technology investments. | ||
Underwriting | • | Ability to collaborate with all origination team members and respond effectively to underwriting requests and track underwriting conditions. | |
• | Ability to communicate loan conditions, request and receive mortgage documents and track conditions and documents in a single system. | ||
• | Access to electronic copies of borrower documents within the loan file and compare them with actual loan data to reduce risk of data inconsistencies. | ||
Secondary Marketing and Trade Management | • | Ability to manage lock requests and accurately track buy-side and sell-side pricing. | |
• | Ability to allocate loans that qualify for trades, track progress and capture key trade details. | ||
• | Ability to receive deadline-notification alerts to help avoid late-delivery fees. | ||
Closing and Funding | • | Ability to enter closing data, perform audits and order closing documents all within a single loan file. | |
• | Automatic population of closing data on funding worksheets, helping to reduce errors and enable faster funding. | ||
Post-Closing, Shipping and Delivery | • | Comprehensive tracking, fulfillment and shipping of loan package. | |
• | Tools to manage interim servicing before selling loans to investors. | ||
Advanced Configuration and Business Rule Management | • | Enterprise-level functionality for higher level security, more granular control of processes and flexible customization of the software. | |
• | Comprehensive control over workflow, business rules, processes and user groups. | ||
Mortgage originators using Encompass pay monthly per-user subscription fees or fees based on their monthly loan volume, either separately or as a bundled package, subject to monthly base fees. This Success Based Pricing model also includes our Encompass Docs Solution and Encompass Compliance Service. Historically, we offered an on-premise version of Encompass. As
7
of June 30, 2016, we completed the migration of customers to our on-demand Encompass offering, and we do not expect on-premise revenues in the future.
Encompass Solutions and Services
Additional solutions offered within our on-demand platform include the following:
Encompass Lending Platform and Encompass Developer Connect
The Encompass Lending Platform and Encompass Developer Connect gives customers, partners and independent software vendors a secure suite of APIs and developer resources to enable them to extend Encompass with new functionality, easily integrate Encompass with external systems and data, and build custom applications that integrate with Encompass in the cloud.
Sales and Marketing Solutions
Encompass CRM: Encompass CRM, includes a suite of sales and marketing tools that allows users to manage contacts, leads and marketing campaigns. It provides one-to-one marketing campaign capabilities for lender’s customers, prospects and referral partners, and robust business intelligence reporting and compliance controls for marketing and sales efforts.
Encompass WebCenter: Encompass WebCenter, which is being replaced by Encompass Consumer Connect, provides the ability to create and customize professional websites for lenders, allowing prospective borrowers to initiate loan applications online.
Encompass Consumer Connect: Beginning in 2017, Encompass WebCenter customers will be upgrading to Encompass Consumer Connect. Built on the Encompass Lending Platform, Encompass Consumer Connect enables lenders to deliver a branded and unique self-service online loan origination experience for borrowers. Consumers will have the power to easily walk through and complete a simple, guided mortgage application online, stay informed at every step of the loan process, conduct research and access rates and information 24/7, securely send and receive documents and accelerate the application process by running credit reports and online asset verifications.
Encompass TPO WebCenter: Encompass TPO WebCenter, which is being replaced by Encompass TPO Connect, is a web-based extension of Encompass that enables loan level interaction between a TPO, and a lender.
Encompass TPO Connect: Beginning in 2017, Encompass TPO WebCenter customers will be upgrading to Encompass TPO Connect. Built on the Encompass Lending Platform, Encompass TPO Connect provides a customizable and interactive web experience for wholesale and correspondent lending channels. It gives lenders and investors a modern and collaborative web experience for their third-party origination, or TPO, partners that promotes compliance, data integrity, and easy bi-directional communication throughout the entire loan process.
Encompass Loan Officer Connect: Built on the Encompass Lending Platform, Encompass Loan Officer Connect is a mobile extension of Encompass designed to make loan officers more effective and efficient when serving their borrowers.
Loan Quality and Compliance Solutions
Ellie Mae Total Quality Loan Program: The Ellie Mae Total Quality Loan Program, or TQL, is a centralized platform of services within Encompass that facilitates improved consistency, efficiency, and loan quality. TQL enables the ordering of multiple necessary services, such as compliance, income verification, fraud checks, collateral risk, and flood certification, from one tool. Through the creation of reports and dashboards, TQL also enables lenders to monitor and optimize efficiency and loan quality, thus optimizing profitability. If selling mortgages to investors, TQL also aligns the ordered services with those required by the specific investor to help expedite the sales process for both lender and investor.
Encompass Compliance Service: Encompass Compliance Service analyzes mortgage loan data for compliance with a comprehensive set of federal and state laws and regulations as well as institutionally mandated compliance policies. Encompass Compliance Service is integrated with Encompass but can be used with other loan origination software as well.
Encompass 4506-T Service: Encompass 4506-T Service, which we license from a third party, is an integrated income verification solution that allows users to electronically order tax return data from the Internal Revenue Service, quickly receive reports back, and compare and validate the income stated on the loan application with the borrower’s actual tax returns.
Encompass Flood Service: Encompass Flood Service, which we license from a third party, allows Encompass users to order and transfer basic and life-of-loan flood zone determination electronically. Documentation and data are stored automatically for review and investor delivery.
8
Encompass Fraud Service: Encompass Fraud Service, which we license from a third party, allows Encompass users to order collateral and non-collateral based fraud risk reports from within Encompass. Documentation received back is automatically stored for review with alerts that highlight specific areas of concern as well as recommended next steps for investigating and curing.
Efficient Processing and Closing Solutions
Encompass Electronic Document Management: Encompass EDM gives Encompass users the ability to go paperless and receive, store and manage documents, as well as deliver any documents electronically and securely to borrowers, real estate agents, lenders, and settlement service providers.
Encompass Docs Solution: Encompass Docs Solution is an integrated, comprehensive initial disclosure, and closing document preparation solution that electronically generates the dozens of documents a borrower must receive and sign prior to the funding of a loan. Because mortgage originators using Encompass Docs Solution do not have to move loan data from their loan origination system to a separate closing system, the Encompass Docs Solution increases the accuracy and efficiency of the document preparation to closing process.
Encompass Appraisal Center: Encompass Appraisal Center enables Encompass users to seamlessly order, track, and retrieve appraisal reports from within Encompass. Users can manage their own panel of independent appraisers or work with one of our integrated appraisal management companies.
Encompass Title & Closing Center: Encompass Title & Closing Center™ streamlines the closing process by enabling lenders to order title through workflow in Encompass and seamlessly connect with settlement agents through a secure browser-based portal.
Integrated Pricing and Secondary Marketing
Encompass Product and Pricing Service: Encompass Product and Pricing Service allows Encompass users to automatically compare qualified loan products with current pricing and easily pinpoint the best program for a borrower. Seamless two-way workflow sends information directly from the loan file to the product and pricing engine and adjustment information directly back into Encompass.
Secondary Marketing: Encompass Secondary Marketing provides lock request management, post-closing condition tracking and tools for fulfillment and trades, such as purchase advice reconciliation, interim servicing and trade management. Trade Management allows lenders to track both Mortgage Backed Securities trades with broker/dealers as well as trades with aggregators.
The Ellie Mae Network
A key component of the Encompass platform is the Ellie Mae Network, which enables mortgage originators to choose from, and connect to, a broad array of investors and third-party service providers essential to the processing and funding of loans. Key functions of the Ellie Mae Network include the following:
• | Mortgage originators can electronically and securely submit loan files to the investors to whom they intend to sell them, in order to have the loans underwritten and priced and to have loan rates locked. |
• | Mortgage originators can electronically order settlement services, including credit, title, appraisal, flood, compliance, mortgage insurance, fraud detection, and other reports. |
• | Investors and settlement service providers can gain instant electronic access to a large number of mortgage originators, potentially increasing their revenue opportunities and lowering their marketing, loan processing, and customer support costs. |
• | Investors and service providers can access electronic and real-time marketing and quality enforcement services that facilitate business interactions with mortgage originators. |
9
Investors and service providers enter into contracts with us that allow their proprietary operating systems to inter-operate with the Ellie Mae Network. Investors and service providers generally pay us fees on a per transaction basis when the mortgage originator orders these services through the Ellie Mae Network. The table below describes some of the services that mortgage originators may order during the mortgage origination process.
Type | Description | |
Credit Report | A report verifying a loan applicant’s credit standing to statistically predict the likelihood of the applicant repaying future debts. | |
Product Eligibility and Pricing Engine | A service that allows a mortgage originator to compare loans offered by different lenders and investors to determine the best product and price available to a particular borrower. | |
Automated Underwriting | A service provided by Fannie Mae and Freddie Mac that analyzes and determines whether a loan meets their acquisition requirements. | |
Data Transmission to and from Lenders and Investors | Mortgage originators transmit data for loan underwriting, pricing, and registration prior to delivery of the loan package to the lender. | |
Appraisal Report | An estimate of the value of the property securing the mortgage conducted by a licensed appraiser and used by the lender to determine whether the loan is adequately collateralized. | |
Title Report; Insurance | A report ordered on the property to examine public records to ensure that no one except the seller or borrower has a valid claim on the property and to disclose past and current facts regarding ownership of and liens on the property; title insurance protects the insured against any loss caused by defect of title to the property. | |
Flood Certification | A report that determines whether the property is located in a flood hazard area based on federal flood regulations and whether the lender or investor will require flood insurance on the property. | |
Compliance Review | A service that reviews a loan file to confirm whether a loan complies with federal, state, and local regulations. | |
Fraud Detection | A service that searches through a number of data fields on a loan application, identifies inaccurate or inconsistent data or suspicious circumstances, and delivers a fraud filter score report. | |
Document Preparation | A service that automates the process of preparing the legal documents required for closing a loan. | |
Mortgage Insurance | Insurance that protects mortgage lenders against loss in the event of default by the borrower, which can allow lenders to originate loans with lower down payments. | |
Income, Identity and Employment Verifications | Services that automate the verification of each of a borrower’s income, identity, and employment through a variety of sources, including the Internal Revenue Service, Social Security Administration, and other third parties. | |
AllRegs
Compliance Management System: Our Compliance Management System leverages components from the AllRegs product line to serve as a comprehensive compliance management system for lenders. This includes the AllRegs Policy and Education Manager and AllRegs Online.
The AllRegs Policy and Education Manager includes:
• | AllRegs Education: Through AllRegs Education, we offer courses related to the mortgage industry. Customers can choose from a variety of delivery options, including self-paced training, instructor-led online courses, webinars, or live classroom training. Our courses allow our customers to meet continuing education requirements for state-licensed mortgage loan originators, as well as certification programs for mortgage industry professionals. |
• | AllRegs Policy and Procedure Manuals: We help organizations of all sizes author, publish, and maintain policy manuals, procedure templates, and lending handbooks. |
AllRegs Online: We offer access to a comprehensive online database consisting of thousands of government and conventional lending guidelines and forms, as well as federal and state laws and regulations. We also provide access to federal disclosures and forms and state compliance resources including pending legislation and email updates, and we are the exclusive electronic publisher of certain mortgage lending guidelines for Fannie Mae and Freddie Mac and the Federal Home Loan Bank.
10
AllRegs Professional Services: We offer documentation services that allow our customers to manage internal mortgage lending compliance. We also offer management of our customers’ document and guideline publishing with private label branding. Additionally, we provide custom training solutions as well as a robust learning and content management tool.
Data & Analytics: We track and make available information regarding investor loan products from many different mortgage investors. Our product AllRegs Market Clarity® service enables mortgage originators to search across these numerous loan products, allowing them to select appropriate loan programs for their borrowers.
Sales and Marketing
Our sales force consists of four distinct teams who are deployed across the country in Sales Development, New Account Acquisition, Solution Engineering, and Account Management. These teams manage and grow our customer accounts and focus on continuing to expand our customer base. They also encourage adoption of the Ellie Mae Network and our professional services, manage new product introductions, and cross sell solutions added to our portfolio as a result of acquisitions.
To build brand awareness and generate sales leads, we conduct digital marketing campaigns, webinars, public relations campaigns, and advertising. We attend and sponsor many mortgage and banking industry conferences and promote Ellie Mae’s annual user conference.
Professional Services, Technical Support, and Education
Professional Services
Our professional services organization promotes best practice implementations and ongoing software upkeep to support our customers’ preferred workflows and integrate with other critical systems while improving productivity and supporting compliance. Our professional services implementation team is typically comprised of implementation consultants, project managers, business analysts, product specialists, and custom development resources. Our implementation team assists customers with configuration of our products for successful transition and adoption. Once implemented, our advisory team offers assistance with ongoing performance tuning and continual best practice configuration adjustments.
Technical Support & Services
Our technical support and services organization applies expertise in compliance, business workflows, and product knowledge to enable our customers to achieve better levels of productivity and more effective use of Ellie Mae technologies which result in maximization of return on investment. This is achieved through direct interactions with a dedicated support team and experienced support engineers utilizing systems, processes, and knowledge developed to facilitate customer success.
Education Services
Our education organization develops and delivers training curriculum which facilitates the foundation of knowledge across our user base. Education is delivered live in classroom settings at our facilities, and on-location, as well as virtually through online on-demand formats. Our curriculum includes foundational training in the use and workflows of our various products and services, as well as advanced certification programs oriented toward the advanced customer who wishes to gain the most out of their solution.
Technology
Our technology infrastructure supports all of our SaaS products and services.
Data Centers and Network Access
Our primary data centers are hosted by a leading SOC 1/SSAE-16 Type II certified provider of hosting services in Santa Clara, California and Chicago, Illinois. Applications we provide will run actively in either of these two sites at any time. In 2016, we started moving towards a hybrid cloud architecture that leverages our own data centers as well as an infrastructure as a service platform, commonly referred to as a “public cloud.” Moving towards a hybrid cloud architecture provides us with the scalability to expand our platform and application services, as well as increase availability and cost efficiencies to deliver on our product roadmap and service quality.
The hybrid cloud architecture hosts Encompass, the Ellie Mae Network and the other Encompass solutions and services. In the event of a complete site failure, such as may occur during a regional natural disaster, all of the services in a site can be recovered to the other data center or public cloud platform as part of our disaster recovery plan.
11
In 2015, we acquired substantially all of the assets of Mortgage Returns, which operates a data center hosted by a leading SOC 1 certified provider in St. Louis, Missouri. Currently, our Encompass CRM application runs out of this site. During 2015 and 2016, a substantial investment was made to upgrade the data center infrastructure utilized by Mortgage Returns. This effort significantly increased overall capacity and performance to meet growing demand for Mortgage Returns’ services. In 2017, we plan to continue to invest in the data center infrastructure supporting our Encompass CRM application and also expand this into a hybrid cloud infrastructure.
Network Security
All sensitive data transmitted over public networks is encrypted using industry standard encryption protocols in order to protect sensitive data against third-party disclosure in transit. Servers and network components are secured with access control mechanisms and protected by hardened firewalls, virus protection, and intrusion prevention/detection systems. Security services and tools are monitored and updated in order to address emerging vulnerabilities. Even with our current security monitoring and detection systems, we cannot guarantee that our security measures will prevent security breaches. We are committing significant resources to protect against and remedy any potential security breaches and their consequences and intend to keep doing so in the future. New threats and vulnerabilities are identified frequently and there are often time lags before our vendors deploy mitigations. In 2016, we made substantial investment in our network security infrastructure, including headcount and third party tools and systems. In 2017 and beyond, we will continue to make substantial investments in our network security infrastructure to protect the confidentiality and integrity of our customer data.
Research and Development
We devote substantial resources to enhance the features and functionality of our offerings as well as developing new products and services. We are developing the next generation Encompass platform, known as Encompass NG, as well as the recently announced Encompass Connect solutions that leverage our new APIs and platform capabilities. These new products include our Encompass Consumer Connect solution to better equip our customers to deploy customized borrower-facing websites, Encompass TPO Connect which helps our customers better manage third-party originations with their partners, Encompass Loan Officer Connect which exposes a rich set of loan officer-facing functionality on mobile devices and Encompass Developer Connect which provides developers with APIs, tools and developer portal.
Intellectual Property
Our success depends in large part on our proprietary products and technology for which we seek protection from a combination of patent, copyright, trademark, and trade secret laws and other agreements with employees and third parties. We require our officers, employees, and consultants to enter into standard agreements containing provisions requiring the confidentiality of proprietary information and assignment to us of all inventions made during the course of their employment or consulting relationship. We also enter into nondisclosure agreements with our commercial counterparties and limit access to, and distribution of, our confidential information.
We are committed to developing and protecting our intellectual property and, where appropriate, file patent applications to protect our technology. Our existing patents expire between 2020 and 2035. Our present and future patents may provide only limited protection for our technology and may not be sufficient to provide competitive advantages to us. Third parties may infringe or misappropriate our proprietary rights. Competitors may also independently develop technologies that are substantially equivalent or superior to the technology we offer in our products and services.
We hold a number of registered and unregistered trademarks, service names and domain names that are used in our business in the United States.
Competition
The mortgage origination software market is highly competitive. There are many software providers catering to mortgage brokerages and mortgage lenders. Our current principal software competitors include: Byte Software Inc., a subsidiary of CBCInnovis; Calyx Technology, Inc.; DH Corporation; LendingQB, Mortgage Builder Software, Inc., a subsidiary of Altisource Portfolio Solutions SA; Mortgage Cadence, which is owned by Accenture PLC; Wipro Gallagher Solutions, which is owned by Wipro, Ltd. and LoanSphere Empower and LoanSphere LendingSpace, which are owned by Black Knight Financial Services, Inc. Some of these software providers, including Calyx Technology, Inc. and Black Knight Financial Services, Inc., also provide connectivity between their software users and lenders and service providers.
12
Competition with Software Providers
We compete against software providers based on our ability to provide:
• | a comprehensive, integrated software solution that provides all business-critical functions including customer acquisition, loan processing, task management, communication with borrowers and other mortgage origination participants, reporting, regulatory compliance, and general enterprise management; |
• | solutions that create efficiencies in gathering, reviewing, and verifying mortgage-related data and producing accurate documentation; |
• | on-demand solutions that reduce the need for IT infrastructure and overhead while providing the ability to update capabilities and adopt new regulations in a timely manner; |
• | customizable business rules to automate processes, promote accountability, and enforce business practices that help assure loan quality and regulatory compliance; |
• | a database architecture designed to reduce data errors and facilitate collaboration among departments within a mortgage origination company and comprehensive monitoring of the business of the entire enterprise; |
• | attractive pricing options, such as our Success Based Pricing model, allowing customers to time payments to cash flow; |
• | an integrated network to submit loan files electronically and securely to lenders and electronically order all of the services necessary to originate a loan; |
• | a solution that is secure and maintains the confidentiality of our customers’ data; and |
• | a solution that is reliable with minimal planned and unplanned downtime. |
Competition with Service Providers
With the exception of our Encompass Compliance Service, Encompass CRM, and AllRegs, we only offer our other Encompass software services to Encompass users. There are many other service providers that also offer our Encompass users competing software services, including:
Borrower-facing Websites. We compete against providers of borrower-facing websites for mortgage originators, including: D+H Corporation; Blue Igloo, Inc. (dba Roostify), and new entrants to our space.
Document Preparation Services. We compete against document preparation service providers, including: DigitalDocs, Inc.; DocMagic Inc.; LenderLive Network, Inc.; MRG Document Technologies; Mortgage Banking Systems, Inc. (dba ProClose), owned by LogicEase Solutions Inc.; and Wolters Kluwer Financial Services, Inc.
Compliance Services. We compete against compliance software service providers, including: Interthinx, Inc., a subsidiary of First American Financial Corporation; ComplianceEase, owned by LogicEase Solutions Inc.; and Wolters Kluwer Financial Services, Inc.
Product and Pricing Services. We compete against product and pricing service providers, including: Insight Lending Solutions, Inc.; Mortech, Inc., a Zillow business; LoanLogics formerly NYLX, Inc.; and Optimal Blue, LLC.
Electronic Document Management. We compete against electronic document management providers, including: Encomia LP; SigniaDocs, Inc.; VirPack Corporation; and Xerox Mortgage Services, Inc.
We compete against these providers not only based on the quality of the service we offer, but also on the integration of each specific service provided within Encompass’s overall workflow. We believe that the integration of the services with Encompass enhances mortgage originators’ control over the mortgage origination process and reduces errors and costs through the seamless exchange of data across applications and services.
Competition Regarding the Ellie Mae Network
The Ellie Mae Network is only available to mortgage originators using Encompass. The principal competition to the use of the Ellie Mae Network remains traditional methods of exchanging data and documents among mortgage industry participants by email, facsimile, phone, courier, and mail. In addition, mortgage originators may use a standalone web browser to go individually to each investor, lender, or service provider’s website and then manually upload loan data or enter information into the website. Mortgage originators may continue to use these methods due to habit, personal business relationships or for other reasons, despite the disadvantages of duplicative efforts, time delays, errors and costs, redundant paper documentation, and potential privacy and security breaches.
13
Lenders and service providers, including those who participate on the Ellie Mae Network, can and do connect with mortgage originators that are not Encompass users in a variety of ways, including through other networks between mortgage originators and lenders and service providers such as Black Knight Financial Services, Inc.
We compete with respect to the Ellie Mae Network based on offering mortgage originators accessibility to a critical mass of investors, lenders, and service providers, and enabling mortgage originators to transact all aspects of the mortgage origination process over the network. In addition, we compete with respect to the Ellie Mae Network by providing investors, lenders, and service providers with superior technological connectivity with mortgage originators, which enables them to lower costs, reduce errors and increase speed.
We believe we generally compete favorably with our competitors; however, some of our actual and potential competitors enjoy substantial competitive advantages over us, such as longer operating histories and significantly greater financial, technical, marketing, and other resources.
Government Regulation
The U.S. mortgage industry is heavily regulated. Mortgage originators, lenders, investors, and service providers with which we do business are subject to federal, state, and local laws that regulate and restrict the manner in which they operate in the residential mortgage industry, including Regulation X of RESPA, Regulation Z of TILA, the Mortgage Disclosure Improvement Act, and the Secure and Fair Enforcement for Mortgage Licensing Act of 2008, as amended. In addition, the Dodd-Frank Act increased regulation of the mortgage industry, including: generally prohibiting lenders from making residential mortgage loans unless a good faith determination is made of a borrower’s creditworthiness based on verified and documented information; requiring the CFPB to enact regulations to help assure that consumers are provided with timely and understandable information about residential mortgage loans that protect them against unfair, deceptive, and abusive practices; and requiring federal regulators to establish minimum national underwriting guidelines for residential mortgages that lenders will be allowed to securitize and sell to third-party investors without retaining any of the loans’ default risk. Although we are not directly subject to these laws and regulations, changes to these laws and regulations could broaden the scope of parties or activities subject to regulation and require us to comply with their restrictions, and new products and services developed by us may be subject to, or have to reflect, these laws or regulations.
In addition, we are subject to general business laws and regulations, regulations governing federal contractors, and laws and regulations specifically governing the Internet, such as those covering taxation, tariffs, user privacy, data protection, pricing, content, copyrights, distribution, electronic contracts and other communications, consumer protection, broadband residential Internet access, and the characteristics and quality of services.
Employees
At December 31, 2016, we had 1,069 full-time employees, including 171 in sales and marketing, 767 in research and development and technology, and 131 in general and administrative functions. None of our employees are covered by a collective bargaining agreement.
Facilities
Our corporate headquarters are located in Pleasanton, California, totaling approximately 280,680 square feet, under a lease expiring in December 2025. We also have staff operating in branch offices in Calabasas, California; Irvine, California; San Diego, California; Eagan, Minnesota; St. Louis, Missouri; Omaha, Nebraska; and Parsippany, New Jersey.
14
ITEM 1A. | RISK FACTORS |
You should carefully consider the risks described below and the other information in this report. If any of the following risks materialize, our business could be materially harmed, and our financial condition and results of operations could be materially and adversely affected. The risks described below are not the only ones facing us. Additional risks not currently known to us or that we currently believe are immaterial may also impair our business, results of operations, financial condition, and liquidity.
The following discussion of risk factors contains forward-looking statements. These risk factors may be important to understanding other statements in this Annual Report on Form 10-K. The following information should be read in conjunction with the consolidated financial statements and related notes in Part II, Item 7, “Management’s Discussion and Analysis of Financial Condition and Results of Operations” and Part II, Item 8, “Financial Statements and Supplementary Data” of this Annual Report on Form 10-K.
Because of the following risks, as well as other factors affecting our financial condition and operating results, past financial performance should not be considered to be a reliable indicator of future performance, and investors should not use historical trends to anticipate results or trends in future periods.
Any future outages or system interruptions that impair access to Encompass, the Ellie Mae Network or our other services could damage our reputation and brand and may substantially harm our business and operating results.
The satisfactory performance, reliability, and availability of Encompass, the Ellie Mae Network and our other services are critical to our reputation and our ability to attract and retain Encompass users and Ellie Mae Network participants. Because our services are complex and incorporate a variety of hardware and proprietary and third-party software, our services may have errors or defects that could result in unanticipated downtime for our customers. Internet-based services frequently contain undetected errors when first introduced or when new versions or enhancements are released, and we have from time to time found errors and defects in our services and new errors and defects in our services may be detected in the future.
Moreover, we have experienced and may in the future continue to experience temporary system interruptions to Encompass, the Ellie Mae Network, or our other services for a variety of other reasons, including network failures, power failures, problems with Encompass and other third-party firmware updates, as well as an overwhelming number of users or Ellie Mae Network participants trying to access our services during periods of strong demand. In addition, our services may be subject to security or denial of services attacks which result in service interruptions or our customers may use our services in unanticipated ways that may cause a disruption in services for other customers. Since our customers use our service for important aspects of their business, any errors, defects, disruptions in service or other performance problems could result in negative publicity, damage to our reputation and brand, reduce our revenue, increase our operating expenses, negatively impact our ability to run our business, hinder our ability to enroll new customers, cause us to incur legal liability or issue refunds or service credits to our customers and cause us to lose current customers, all of which could substantially harm our business and operating results.
We utilize a hybrid cloud approach to our third-party data centers consisting of (i) two primary production data centers, located in Santa Clara, California, and Chicago, Illinois, which are each hosted by a third-party service provider and (ii) a network of Amazon Web Services (“AWS”) data centers which provides a distributed computing infrastructure platform for business operations. We maintain regular oversight but have little direct control over our two primary data centers. In the case of AWS, we do not control any aspects of the AWS data center operations and do not own any of the underlying computing hardware. We rely on these third-party service providers to provide continuous and uninterrupted access to our products and services, including Encompass and the Ellie Mae Network. If for any reason our relationship with any of these third parties were to end unexpectedly, it could require a significant amount of time to transition the hosting of our computing infrastructure to new third-party service providers.
We are also subject to interruptions beyond our and our third-party service providers’ control, such as disruptions or congestion in the portions of the Internet linking us to our customers. We are dependent on third parties for the implementation and maintenance of certain aspects of our systems and because some of the causes of system interruptions may be outside of our control, we may not be able to remedy such interruptions in a timely manner. These interruptions may affect our customers’ experience or cause us to lose customers, and may materially harm our reputation and operating results.
Our failure to secure the confidential information of the customers of the users of our software and services could damage our reputation and brand and substantially harm our business and operating results.
We collect, process, transmit, and maintain certain confidential information relating to the customers (borrowers and loan applicants) of the users of our software and services, including personally identifiable information. This information resides on data center servers hosted by third-party providers, and is transmitted to, across, and from our networks. While we have security measures in place to protect this information and prevent security breaches, these security measures may be compromised as a result of third-party action, including intentional misconduct by computer hackers, advanced persistent cyber-attacks (by hacktivists or cybercriminal organizations), employee error or malfeasance, service provider or vendor error, malfeasance or other intentional
15
or unintentional acts by third parties. Furthermore, our customers’ data, including personally identifiable information, may be lost, exposed, or subject to unauthorized access and/or use as a result of accidents, errors, or malfeasance by our employees, independent contractors, or others working with us or on our behalf. Our servers and systems, and those of our service providers, may also be vulnerable to computer malware, break-ins, denial-of service attacks, and similar disruptions from unauthorized tampering with our computer systems, which could result in someone obtaining unauthorized access to our customers’ data or our data, including our intellectual property and other confidential business information. Because the techniques used to obtain unauthorized access to, or to sabotage, systems change frequently and often are not recognized until launched against a target, we may be unable to anticipate these techniques or implement adequate preventative measures. We may also experience security breaches that may remain undetected for an extended period. The possession and use of personal information in conducting our business subjects us to legislative and regulatory burdens that may require notification to customers in the event of a security breach, restrict our use of personal information, and hinder our ability to acquire new customers or market to existing customers.
We cannot guarantee that our security measures will prevent security breaches or the loss or exposure of confidential information or other information we maintain or process. Any actual or perceived compromise of our security could result in the loss of customer data, intellectual property or trade secrets, and could damage our reputation and brand, negatively affect our ability to attract new customers and retain existing customers, adversely affect investor confidence, and expose us to a risk of litigation or regulatory actions and orders, penalties for violation of applicable laws, regulations, or contractual obligations and/or other liabilities, which would substantially harm our business and operating results. We will need to expend significant resources to protect against and remedy any potential security breaches and their consequences, including costs to deploy additional personnel and protection technologies, train employees, and engage third-party experts and consultants.
Our future performance will be highly dependent on our ability to continue to attract new Encompass customers and users of our other service offerings.
To maintain or increase our revenues, we may need to increase the number of users of our Encompass software and other service offerings, and the failure to do so may have a materially adverse impact on our business. If we are unable to increase the number of Encompass customers or users of our other services, our business may be materially adversely affected. Our success will depend on both (i) the willingness of mortgage lenders to continue to accept the SaaS model for delivering software applications that they view as critical to the success of their business and (ii) our ability to successfully deliver new SaaS service offerings.
It is difficult to predict customer adoption rates and demand for our services, the future growth rate and size of the mortgage technology market or the entry of competitive applications. The growth of the mortgage technology market depends on a number of factors, including the cost, performance, and perceived value associated with product offerings, most notably SaaS offerings such as our own, including the extent to which SaaS companies are successful in continuing to address security and reliability concerns. If other SaaS providers experience security incidents, loss of customer data, disruptions in delivery or other problems, the market for SaaS applications as a whole, including our own products and services, may be negatively affected. If there is a reduction in demand for mortgage technology caused by technological challenges, weakening economic conditions, security or privacy concerns, competing technologies, and products, decreases in spending by mortgage lenders, it could result in decreased revenues and our business could be adversely affected. In addition, we will need to continue to expand and optimize our sales infrastructure in order to grow our customer base and our business. Identifying and recruiting qualified personnel and training them in the use of our software requires significant time, expense, and attention.
If we are not able to provide successful enhancements, new features and modifications to our services, our business could be adversely affected. Further, impairment of software-related assets and other assets may materially adversely affect our operating results.
If we are unable to provide enhancements, new features, and modifications of our existing services, including the successful completion and deployment of our next generation Encompass software and the Encompass Lending Platform and changes to our services to reflect changes in laws and regulations relating to residential mortgage lending, our business and operating results could be adversely affected. In addition, if we do not successfully manage the migration of our customers to our next generation Encompass software or if the transition takes longer than expected, customers may not experience the benefits of new enhancements and features and our business and operating results could be adversely affected. In addition, we will need to continuously modify and enhance our services to keep pace with changes in software, communication, browser, database and SaaS infrastructure technologies. We may not be successful in either developing these modifications and enhancements or in bringing them to market in a timely fashion which could increase our costs and adversely affect our business. The failure of our services to operate effectively with future technologies could reduce the demand for our services, result in customer dissatisfaction and adversely affect our business.
We have invested and continue to invest significant resources to develop and acquire technology related to our services that is capitalized to property and equipment or intangible assets and treated as an asset on our balance sheet. We may not launch this new technology, the launch of such technology may result in disruptions to our business operations or such technology might not meet our and our customers’ expectations. Also, changes to any of our implementation strategies or the failure of this technology to meet our and our customers’ expectations could result in the impairment of software-related assets, and our future operating
16
results could be materially adversely affected if we are required to write down the carrying value of capitalized software development or other intangible assets.
Mortgage lending volume may decrease materially in 2017 and future years, which could materially adversely affect our business.
Mortgage lending volume may decrease materially in 2017 and future years, which could materially adversely affect our business. Factors that adversely impact mortgage lending volumes include increasing mortgage interest rates, reduced consumer and investor demand for mortgages, more stringent underwriting guidelines, decreased liquidity in the secondary mortgage market, high levels of unemployment, high levels of consumer debt, lower consumer confidence, changes in tax and other regulatory policies, the number of existing mortgages eligible for refinancing, and other macroeconomic factors.
Mortgage interest rates are influenced by a number of factors, including monetary policy. In December 2016, the Federal Reserve Bank raised the target federal funds rate from between 0.25% and 0.50% to between 0.50% and 0.75%, and signaled that the federal funds rate could be increased further over the next several years. This increase in the federal funds rate contributed to an increase in mortgage rates in the fourth quarter of 2016 and first quarter of 2017 and may result in future mortgage interest rate increases. Increases in mortgage interest rates could reduce the volume of new mortgages originated materially, in particular the volume of mortgage refinancings. In addition, our on-demand revenues typically, but not always, track the seasonality of the residential mortgage industry, with increased activity in the second and third quarter and reduced activity in the first and fourth quarters as home buyers tend to purchase their homes during the spring and summer in order to move to a new home before the start of the school year. As a result, a higher percentage of our on-demand revenues have historically been recognized during those quarters.
We currently estimate that approximately 35% to 45% of our revenues have some direct sensitivity to volume. A decrease in residential mortgage volumes could materially adversely affect our business and operating results. Furthermore, a significant decrease in mortgage volume could negatively impact our customers, resulting in a reduction of their Encompass users, consolidation with other lenders or cessation of operations. If any of these occurs, it could materially adversely affect our business and operating results.
We cannot accurately predict subscription renewal or upgrade rates and the impact these rates may have on our future revenues and operating results.
Our customers have no obligation to renew their subscriptions for our service after the expiration of their initial subscription period, which ranges from one to five years. They may also choose to renew their subscriptions at lower levels. In addition, in the first year of a subscription, customers often purchase a higher level of professional services than they do in renewal years. As a result, our ability to grow is dependent in part on customers purchasing additional subscriptions and services after the initial subscription term. We cannot accurately predict renewal rates given our varied customer base and the number of multi-year subscription contracts. Our customers’ renewal rates may decline or fluctuate because of several factors, including their satisfaction or dissatisfaction with our services, the prices of our services, changes to the standard prices of our services, the prices of services offered by our competitors or reductions in our customers’ spending levels due to the macroeconomic environment or other factors. If our customers do not renew their subscriptions for our services, renew on less favorable terms or do not purchase additional subscriptions or services, our revenues may grow more slowly than expected or decline and our profitability and gross margin percentage may be harmed.
Our future performance will be highly dependent on our ability to expand the use of settlement services on, and increase the number of transactions effected through, the Ellie Mae Network.
To grow our base of Ellie Mae Network participants, we and settlement service providers must continue to enhance the features and functionality of offerings to them. In addition, increasing the number of settlement service transactions effected through the Ellie Mae Network will depend, in part, on settlement service providers enhancing their technical capabilities, which is largely beyond our control.
We must also convince a variety of potential Ellie Mae Network participants, including mortgage lenders, originators, settlement service providers, and mega lenders, of the benefits of electronic origination and network participation as compared to traditional mortgage origination methods including paper, facsimile, courier, mail, and email.
We cannot guarantee that our Ellie Mae Network and other service offerings will achieve market acceptance. In the event these efforts are not successful, our business and growth prospects would be adversely affected.
17
We expect a number of factors to cause our operating results to fluctuate on a quarterly and annual basis, which may make it difficult to predict our future performance.
Our revenues and operating results have in the past varied and could in the future vary significantly from quarter-to-quarter and year-to-year because of a variety of factors, many of which are outside of our control. As a result, comparing our operating results on a period-to-period basis may not be indicative of future operating results. In addition to other risk factors discussed in this section, factors that may contribute to the variability of our quarterly and annual results include:
• | the number of Encompass users; |
• | the volume of mortgages originated by Encompass users, especially users on our Success Based Pricing model; |
• | transaction volume on the Ellie Mae Network; |
• | fluctuations in mortgage lending volume; |
• | the relative mix of purchase and refinance volume handled by Encompass users; |
• | the level of demand for our services; |
• | the timing of the introduction and acceptance of new services and Ellie Mae Network service providers; |
• | any write-downs in the value of our property and equipment, goodwill or intangible assets as a result of our investment or acquisition activities; |
• | costs associated with defending intellectual property infringement and other litigation claims; |
• | changes in accounting rules applicable to our business; and |
• | changes in government regulation affecting mortgage lenders and Ellie Mae Network participants or our business, and potential structural changes in the U.S. residential mortgage industry. |
Due to these and other factors, our future results may not reach our financial projections. In addition, our operating results in future periods may not meet the expectations of investors or public market analysts who follow our company, which could cause our stock price to decline rapidly and significantly. The results of any prior quarterly or annual periods should not be relied upon as indications of our future operating performance.
Since part of our sales efforts are targeted at larger customers, our sales cycle may become longer and more expensive, we may encounter pricing pressure and implementation challenges, and we may have to delay revenue recognition for some complex transactions, all of which could harm our business and operating results.
Part of our business strategy is to target larger mortgage lenders that handle greater volumes of loans. As we target more of our sales efforts at larger customers, we could face greater costs, longer sales cycles, and less predictability in completing some of our sales. In this market, the customer’s decision to use our products and services may be an enterprise-wide decision and, if so, this type of sale could require us to provide greater levels of education regarding the use and benefits of our products and services. In addition, larger customers may demand more complex integration, implementation services, and features. As a result of these factors, these sales opportunities may require us to devote greater sales support and professional services resources to individual customers, driving up costs and time required to complete sales and diverting our own sales and professional services resources to a smaller number of larger transactions, while potentially requiring us to delay revenue recognition on some of these transactions until the technical or implementation requirements have been met.
If we are unable to scale our operations and increase productivity, we may not be able to successfully implement our business plan.
We continue to experience significant growth in our customer base, which has placed a strain on our management and administrative, operational, and financial infrastructure. Additional investments in our implementation capabilities, technical support, technical operations, research and development, and general and administrative functions will be required to scale our operations and increase productivity, address the needs of our customers, further develop and enhance our products and services, and scale with the overall growth of our company.
In addition, professional services, such as implementation services, are a key aspect of on-boarding new customers. The implementation process is complicated and we will need to scale our capabilities in this area to meet future revenue targets. If a customer is not satisfied with the quality of work performed by us or with the type of services or solutions delivered, then we could incur additional costs to address the situation, the profitability of that work might be impaired, and the customer’s dissatisfaction with our products and services could damage our ability to obtain additional work from that customer. In addition, negative publicity related to our customer relationships, regardless of its accuracy, may further damage our business by affecting our ability to compete for new business with current and prospective customers.
18
Our growth strategy will require significant expenditures and resources to improve our technology, systems, and operational infrastructure in order to support a growing number of customers. We will need to make such expenditures with no assurance that the volume of our business or revenues will actually increase.
Our strategy of growing our business and increasing the number of Encompass users has placed and may continue to place significant demands on our technology systems and operational infrastructure. As our operations grow in size, scope, and complexity, we will need to expand, improve, and upgrade our technology systems and, operational infrastructure, including the capabilities of the third-party data centers we utilize to offer an increasing number of customers enhanced solutions, features and functionality, and to ensure that our services are reliable.
Our growth and the improvement of our technology systems and operational infrastructure will require significant lead time and substantial financial, operational and technical resources in advance of the anticipated increase in the volume of business, with no assurance that the volume of business or our revenues will actually increase.
We have experienced rapid growth. If we fail to manage our growth effectively, we may be unable to execute our business plan, maintain high levels of service and operational controls or adequately address competitive challenges.
We have experienced, and are continuing to experience, a period of rapid growth in our customers, headcount, and operations. In particular, we grew from approximately 270 employees as of December 31, 2011 to approximately 1,069 employees as of December 31, 2016, and have also significantly increased the number of customers and active users of Encompass. We anticipate that we will significantly expand our operations and headcount in the near term, and will continue to expand our customer base. This growth has placed, and future growth will place, a significant strain on our management, general and administrative resources, and operational infrastructure.
Our success will depend in part on our ability to manage this growth effectively and to scale our operations. To manage the expected growth of our operations and personnel, we will need to continue to improve our operational, financial and management controls, and our reporting systems and procedures. As we continue to grow, we also need to ensure that our policies and procedures evolve to reflect our current operations and are appropriately communicated to and observed by employees, and that we appropriately manage our corporate information assets, including confidential and proprietary information. Failure to effectively manage growth could result in difficulty or delays in deploying customers, declines in quality or customer satisfaction, increases in costs, difficulties in introducing new features or other operational difficulties, and any of these difficulties could adversely impact our business performance and results of operations.
Completing and integrating future acquisitions could disrupt our business, harm our financial condition, and operating results or dilute or adversely affect the price of our common stock.
Our success will depend in part on our ability to expand our solutions and services and to grow our business in response to changing technologies, customer demands and competitive pressures. In some circumstances, we may pursue growth through the acquisition of complementary businesses, solutions or technologies rather than through internal development.
The identification of suitable acquisition candidates can be difficult, time-consuming, and costly, and we may not be able to complete acquisitions successfully. Moreover, if such acquisitions require us to seek additional debt or equity financing, we may not be able to obtain such financing on terms favorable to us or at all. Acquisitions and investments involve numerous risks which may have a negative impact on our results of operations, including:
• | write-offs of acquired assets or investments; |
• | potential financial and credit risks associated with acquired customers; |
• | unknown liabilities associated with the acquired businesses; |
• | unanticipated expenses related to acquired technology and its integration into existing technology; |
• | limitations to our ability to recognize revenue from acquired deferred revenue; |
• | depreciation and amortization of amounts related to acquired intangible assets, fixed assets, and deferred compensation; and |
• | adverse tax consequences of any such acquisitions. |
Even if we successfully complete an acquisition, we may not be able to assimilate and integrate effectively the acquired business, technologies, solutions, assets, personnel or operations, particularly if key personnel of an acquired company decide not to work for us. We may encounter difficulty in incorporating acquired technologies into our service and maintaining the quality standards that are consistent with our brand and reputation. In addition, we may issue debt or equity securities to complete an acquisition, which could dilute our stockholders’ ownership and adversely affect the price of our common stock.
19
The residential mortgage industry is heavily regulated and changes in current legislation or new legislation could adversely affect our business.
The U.S. mortgage industry is heavily regulated. Federal and state governments and agencies could enact legislation or other policies that could negatively impact the business of our Encompass users and other Ellie Mae Network participants. In particular, the recent U.S. presidential transition and transformation in the makeup of the U.S. Congress may impact the substance and timing of legislation relating to the U.S. mortgage industry. Any changes to existing laws or regulations or adoption of new laws or regulations that increase restrictions on the residential mortgage industry may decrease residential mortgage volume or otherwise limit the ability of our Encompass users and Ellie Mae Network participants to operate their businesses, resulting in decreased usage of our solutions. In addition, reduced regulatory requirements may reduce the demand for certain of our products and services, including the Encompass Compliance service.
Changes in current legislation or new legislation may increase our costs by requiring us to update our products and services and if our products and services fail to address relevant mortgage lending laws and regulations our business could be adversely affected.
Changes to existing laws or regulations or adoption of new laws or regulations relating to the residential mortgage industry may require us to incur significant costs to update our products and services so that our customers remain compliant with such laws and regulation. Our Encompass Compliance Service analyzes mortgage loan data for compliance with consumer protection laws and institutionally mandated compliance policies and must continually be updated to incorporate changes to such laws and policies. The Dodd-Frank Act has caused and will continue to cause us to make similar updates to Encompass, Encompass Compliance Service, Encompass Product and Pricing Service, Encompass Docs Solution, TQL, and the Ellie Mae Network to address, among other things, regulations that protect consumers against unfair, deceptive, and abusive practices by lenders. For example, additional tools and product updates were required to address the Ability-to-Repay/Qualified Mortgage and Federal and State High Cost rules that became effective in January 2014. In addition, we have updated certain products to comply with the TILA-RESPA Integrated Disclosure rule changes and the 2013 Loan Originator Rule under the Truth in Lending Act (Regulation Z) (TILA-RESPA Amendments) that became effective October 3, 2015. The final rule amending Regulation C to implement amendments to the Home Mortgage Disclosure Act (HMDA) made by section 1094 of the Dodd-Frank Act was published on October 15, 2015. It includes various effective compliance dates, starting with January 1, 2017 through May 30, 2020. The final "Qualified Residential Mortgage" rule which implements the risk retention requirements in the Dodd-Frank Act became effective on December 24, 2015. On August 23, 2016 Fannie Mae and Fannie Mac published the first material updates to the Uniform Residential Loan Application (URLA) in more than 20 years which will become effective in 2018. These additions and updates have caused us to incur significant expense, and future updates will likely similarly cause us to incur significant expense. For example, if the new U.S. presidential administration and U.S. Congress significantly change or repeal the mortgage lending portions of the Dodd-Frank Act or the CFBP announces new rules or repeals previously announced rules, we may need to incur significant expense to make updates to our products and services. In addition, if our products and services fail to address relevant laws and regulations, we could be subject to claims by our customers that we have breached our customer contracts as well as potential claims by borrowers or government agencies. Such claims could result in substantial costs and we could incur judgments or enter into settlements of claims that could have a material adverse effect on our business and operating results. Furthermore, if our products and services fail to address relevant laws and regulations this could result in negative publicity, damage to our reputation and brand, hinder our ability to enroll new customers and cause us to lose current customers, all of which could substantially harm our business and operating results.
Potential structural changes in the U.S. residential mortgage industry, in particular plans to diminish the role of Fannie Mae and Freddie Mac, could disrupt the residential mortgage market and have a material adverse effect on our business.
Fannie Mae and Freddie Mac play a very important role in providing liquidity, stability, and affordability in the current U.S. residential mortgage market. In particular, they participate in the secondary mortgage market by purchasing mortgage loans and mortgage-related securities for investment and by issuing guaranteed mortgage-related securities. There have been numerous executive branch proposals as well as proposed federal legislation which may wind down or recapitalize Fannie Mae and Freddie Mac and/or eliminate or reduce the government’s role in the housing market. Any significant structural change to the role of Fannie Mae and Freddie Mac or to the U.S. residential mortgage industry may cause significant disruption to the residential mortgage market. If we are unable to react effectively and quickly to changes in the residential mortgage industry or if such changes reduce the volume of mortgage lending, our business could be harmed.
20
We may be limited in the way in which we market our business or generate revenue by U.S. federal law prohibiting referral fees in real estate transactions, and if we are found to be in violation of such laws we would be subject to significant liability.
RESPA generally prohibits the payment or receipt of fees or any other thing of value for the referral of business related to a residential real estate settlement service and prohibits fee shares or splits or unearned fees in connection with the provision of such services. Encompass software and services and the Ellie Mae Network were designed with payment methods that are intended to comply with the restrictions under RESPA. Nonetheless, RESPA may restrict our ability to enter into marketing and distribution arrangements with third parties for existing or newly developed products and services, particularly to the extent that such arrangements may be characterized as involving payments for the referral of residential real estate settlement service business. Additionally, any amendments to RESPA, court opinions interpreting the provisions of RESPA, or changes in the manner that RESPA is interpreted by the regulatory agencies responsible for enforcing RESPA, that result in restrictions on our current payment methods, or any determination that our payment methods have been and currently are subject to the restrictions under RESPA, could have a material adverse effect on our business. If we were found to be in violation of RESPA rules, we would be exposed to significant potential liability that could have a material adverse effect on our reputation and business.
We depend on key and highly skilled personnel to operate our business, and if we are unable to retain our current or hire additional personnel, our ability to develop and successfully market our business could be harmed.
We believe our future success will depend in large part upon our ability to attract and retain highly skilled managerial, technical, finance, creative, and sales and marketing personnel. Moreover, we believe that our future success is highly dependent on the contributions of our named executive officers. All of our officers and other employees are at-will employees, which means they may terminate their employment relationship with us at any time, and their knowledge of our business and industry would be extremely difficult to replace. In addition, the loss of any key employees or the inability to attract or retain qualified personnel could delay the development and introduction of, and harm our ability to sell, our solutions and harm the market’s perception of us. Competition for qualified personnel is particularly intense in the San Francisco Bay Area, where our headquarters are located. Qualified individuals are in high demand, and we may incur significant costs to attract them. We may be unable to attract and retain suitably qualified individuals who are capable of meeting our growing sales, operational and managerial requirements, or may be required to pay increased compensation in order to do so. If we are unable to attract and retain the qualified personnel we need to succeed, our business will suffer.
Volatility or lack of performance in our stock price may also affect our ability to attract and retain our key employees. Most of our named executive officers are vested in a substantial amount of stock options and Performance Awards. Employees may be more likely to leave us if the shares they own or the shares underlying their vested options have significantly appreciated in value relative to the original purchase prices of the shares or the exercise prices of the vested options, or if the exercise prices of the options that they hold are significantly above the market price of our common stock. If we are unable to retain our named executive officers or other key employees, our business will be harmed.
We operate in a highly competitive market, which could make it difficult for us to attract and retain Encompass users and Ellie Mae Network participants.
The mortgage origination software market is highly competitive. There are many software providers that compete with us by offering loan origination software to mortgage originators, such as: Byte Software Inc., a subsidiary of CBCInnovis; Calyx Technology, Inc.; DH Corporation; Lending QB, Mortgage Builder Software, Inc., a subsidiary of Altisource Portfolio Solutions SA; Mortgage Cadence, which is owned by Accenture PLC; Wipro Gallagher Solutions, which is owned by Wipro, Ltd.; and LoanSphere Empower and LoanSphere LendingSpace, which are owned by Black Knight Financial Services, Inc. Some software providers, including Calyx Technology, Inc. and Black Knight Financial Services, Inc., also provide connectivity between their software users and lenders and service providers to make such services available to mortgage lenders. We also compete with compliance, document preparation service, and product eligibility and pricing service providers that are more established than us. There is vigorous competition among providers of these services and we may not succeed in convincing potential customers using other services to switch to ours. In addition, some of our competitors are consolidating which facilitates greater cross-selling of services, which could weaken our ability to differentiate our offering in the market. Some of our competitors also offer services on a per closed loan basis, which could adversely impact the effectiveness of our Success Based Pricing strategy for increasing the number of Encompass customers. If we are unsuccessful in competing effectively by providing attractive functionality, customer service or value, we could lose existing Encompass users to our competitors and our ability to attract new Encompass users could be harmed.
There are many service providers that offer our Encompass users competing services, including borrower-facing websites, customer relationship management solutions, document preparation services, compliance services, product eligibility and pricing services, and electronic document management services. We may be unsuccessful in continuing to differentiate our Encompass service offerings to the extent necessary to effectively compete in some or all of these markets.
21
The Ellie Mae Network is only available to mortgage originators using Encompass. The principal alternative to the use of the Ellie Mae Network by Encompass users remains traditional methods of exchanging data and documents among mortgage industry participants by email, facsimile, phone, courier, and mail. In addition, mortgage originators may use standalone web browsers to go individually to each investor, lender or service provider’s website, and then manually upload loan data or enter information into the website. Mortgage originators may continue to use these methods due to habit, personal business relationships or otherwise. The success of the Ellie Mae Network depends on our ability to achieve and offer access to both the critical mass of investors, lenders, and service providers necessary to attract and retain mortgage originators using Encompass on the Ellie Mae Network and the critical mass of active mortgage originators necessary to attract and retain investors, lenders, and service providers on our network.
Some of our actual and potential competitors have longer operating histories and significantly greater financial, technical, marketing, and other resources than we do and, as a result, these companies may be able to respond more quickly to changes in regulations, new technologies or customer demands, or devote greater resources to the development, promotion, and sale of their software and services than we can. In addition, we may face increased competition as a result of continuing industry consolidation. We expect the mortgage origination market to continue to attract new competitors and there can be no assurance that we will be able to compete successfully against current or future competitors or that competitive pressures we face will not materially adversely affect our business.
Failure to adapt to technological changes may render our technology obsolete or decrease the attractiveness of our solutions to our customers.
If new industry standards and practices emerge, or if competitors introduce new solutions embodying new services or technologies, Encompass and the Ellie Mae Network technology may become obsolete. Our future success will depend on our ability to:
• | enhance our existing solutions; |
• | develop and potentially license new solutions and technologies that address the needs of our prospective customers; and |
• | respond to changes in industry standards and practices on a cost-effective and timely basis. |
We must continue to enhance the features and functionality of Encompass, our other services, and the Ellie Mae Network. The effective performance, reliability, and availability of Encompass, our other services, and the Ellie Mae Network infrastructure are critical to our reputation and our ability to attract and retain Encompass users, users of our other services and Ellie Mae Network participants. If we do not continue to make investments in product development and, as a result, or due to other reasons, fail to attract new and retain existing mortgage originators, lenders, investors, and service providers, we may lose existing Ellie Mae Network participants, which could significantly decrease the value of the Ellie Mae Network to all participants and materially adversely affect our business.
We are subject to the risks of current and future legal proceedings, which could have a material adverse effect on our business, financial condition, results of operations, and future prospects.
At any given time, we are a defendant in various legal proceedings and litigation matters arising in the ordinary course of business including commercial and employment disputes. We can give no assurance that the outcome of any such matter would not have a material adverse effect on our consolidated financial condition, results of operations or cash flows. We are unable to predict the ultimate outcome of these disputes or the actual impact of these matters on our profitability at this time, and any views we form as to the viability of these claims or the financial exposure in which they could result, could change from time to time as the matters proceed through their course, as facts are established, and various judicial determinations are made.
If we agree to settle these matters or judgments are secured against us, we may incur charges which may have a material and adverse impact on our business, financial conditions, results of operations, and future prospects.
Failure to adequately protect our intellectual property could harm our business.
The protection of our intellectual property rights, including our proprietary Encompass software and Ellie Mae Network technology, is crucial to the success of our business. We rely on a combination of patent, copyright, trademark and trade secret law, and contractual restrictions to protect our intellectual property. Our present and future patents may provide only limited protection for our technology and may not be sufficient to provide competitive advantage to us. Furthermore, we cannot guarantee any patents will be issued to us as a result of our patent applications. We also rely in part on confidentiality and invention assignment agreements with our employees, independent contractors, and consultants. Despite our efforts to protect our proprietary rights, unauthorized parties may attempt to copy aspects of our Ellie Mae Network and Encompass features and functionality or obtain and use information that we consider proprietary. Enforcing our proprietary rights is difficult and may not always be effective.
22
We have registered “Ellie Mae,” “Encompass,” and “AllRegs” and certain of our other trademarks as trademarks in the United States. Competitors may adopt service names similar to ours, thereby impeding our ability to build brand identity and possibly leading to customer confusion. In addition, there could be potential trade name or trademark infringement claims brought by owners of other registered trademarks or trademarks that incorporate variations of the terms Ellie Mae, Encompass or our other trademarks.
Litigation or proceedings before the U.S. Patent and Trademark Office or other governmental authorities and administrative bodies in the United States and abroad may be necessary in the future to enforce our intellectual property rights, protect our patent and copyright rights, trade secrets and domain names, and determine the validity and scope of the proprietary rights of others. Our efforts to enforce or protect our proprietary rights may be ineffective and could result in substantial costs and diversion of resources and could harm our business.
Assertions that we infringe third-party intellectual property rights could result in significant costs and substantially harm our business.
Other parties have asserted, and may in the future assert, that we have infringed their intellectual property rights. In addition, we generally agree to indemnify our customers against legal claims that our software products infringe intellectual property rights of third parties and, in the event of an infringement, to modify or replace the infringing product or, if those options are not reasonably possible, to refund the cost of the software, as pro-rated over a period of years. We cannot predict whether assertions of third-party intellectual property rights or claims arising from such assertions will substantially harm our business and operating results. If we are forced to defend against any infringement claims, whether they are with or without merit or are determined in our favor, we may face costly litigation and diversion of technical and management personnel. Furthermore, an adverse outcome of a dispute may require us to: pay damages, potentially including treble damages and attorneys’ fees if the infringement were found to be willful; cease providing solutions that allegedly incorporate the intellectual property of others; expend additional development resources to redesign or re-engineer our solutions and products, if feasible; and enter into potentially unfavorable royalty or license agreements in order to obtain the right to use necessary technologies. We cannot be certain of the outcome of any litigation. Any royalty or licensing agreement, if required, may not be available to us on acceptable terms or at all. Our failure to obtain the necessary licenses or other rights could prevent the sale or distribution of some of our products and services and, therefore, could have a material adverse effect on our business.
Our internal information technology systems are critical to our business. System integration and implementation issues could disrupt our operations, which could have a material adverse impact on our business or results in significant deficiencies or material weaknesses in our internal controls.
We rely on the efficient and uninterrupted operation of complex information technology systems, including systems for customer billing, human resources, enterprise resource planning and customer relationship management. As our business has grown in size and complexity, the growth has placed, and will continue to place, significant demands on our internal information technology systems. To effectively manage this growth, we must commit significant financial resources and personnel to maintain and enhance existing systems and develop or acquire new systems to keep pace with continuing changes in our business and information processing technology as well as evolving industry, regulatory and accounting standards. If the information we rely upon to run our businesses is determined to be inaccurate or unreliable, if we fail to properly maintain or enhance our internal information technology systems, we could have operational disruptions, customer disputes, significant deficiencies or material weaknesses in our internal controls, have increases in operating and administrative expenses, lose our ability to produce timely and accurate financial reports, or suffer other adverse consequences.
If we fail to maintain proper and effective internal controls, our ability to produce accurate financial statements could be impaired, which could result in a loss of investor confidence in our financial reports, significant expenses to remediate any internal control deficiencies, and ultimately have an adverse effect on the market price of our common stock.
As a publicly-traded company, we are subject to compliance with, among other regulations, Section 404 of the Sarbanes-Oxley Act of 2002, or SOX, which requires that we test our internal control over financial reporting and disclosure controls and procedures. Ensuring that we have adequate internal financial and accounting controls and procedures in place so that we can produce accurate financial statements on a timely basis is a costly and time-consuming effort that needs to be re-evaluated frequently. Our compliance with SOX requires that we incur substantial expense and expend significant management time on compliance-related issues. If we fail to achieve and maintain an effective internal control environment, we could suffer material misstatements in our financial statements and fail to meet our reporting obligations, which would likely cause investors to lose confidence in our reported financial information. This could harm our operating results and lead to a decline in our stock price. Additionally, ineffective internal control over financial reporting could expose us to increased risk of fraud or misuse of corporate assets and subject us to potential delisting from the New York Stock Exchange, regulatory investigations, civil or criminal sanctions, and class action litigation.
23
As a third-party technology service provider of mission-critical products and services to many financial institutions that are regulated by one or more member agencies of the Federal Financial Institutions Examination Council, or FFIEC, we are subject to an IT examination by the member agencies of the FFIEC. As a result, the FFIEC conducts recurring IT Examinations in order to identify existing or potential risks associated with our operations that could adversely affect the financial institutions to whom we provide products and services, evaluate our risk management systems, and controls and determine our compliance with applicable laws that affect the products and services we provide to financial institutions. In addition to examining areas such as our management of technology, data integrity, information confidentiality, and service availability, the reviews also assess our financial stability. In June 2014, the FDIC, a member agency of the FFIEC, completed its IT examination, and found that, while the services we provide to our client banks are satisfactory, several matters required further attention, some of which were repeat findings and recommendations from the FDIC’s 2012 examination. Although management has developed a plan for addressing these matters, we cannot be assured that the plan will satisfy the FDIC or applicable law. A sufficiently unfavorable review from the FFIEC in the future could have a material adverse effect on our business and financial condition.
If one or more U.S. states or local jurisdictions successfully assert that we should have collected or in the future should collect additional sales or use taxes on our fees, we could be subject to additional liability with respect to past or future sales, and the results of our operations could be adversely affected.
We do not collect state and local sales and use taxes on all sales in all jurisdictions in which our customers are located, based on our belief that such taxes are not applicable. Sales and use tax laws and rates vary by jurisdiction and such laws are subject to interpretation. Jurisdictions in which we do not collect sales and use taxes may assert that such taxes are applicable, which could result in the assessment of such taxes, interest, and penalties, and we could be required to collect such taxes in the future. This additional sales and use tax liability could adversely affect the results of our operations.
Our business is subject to the risks of earthquakes, fires, floods, and other natural catastrophic events and to interruption by man-made problems such as terrorism.
Our systems and operations are vulnerable to damage or interruption from earthquakes, fires, floods, power losses, telecommunications failures, terrorist attacks, acts of war, and similar events. For example, a significant natural disaster, such as an earthquake, fire or flood, could have a material adverse impact on our business, operating results and financial condition, and our insurance coverage may be insufficient to compensate us for losses that may occur. Our corporate offices and one of the facilities we lease to house our computer and telecommunications equipment are located in the San Francisco Bay Area, a region known for seismic activity. In addition, acts of terrorism, which may be targeted at metropolitan areas with higher population density than rural areas, could cause disruptions in our or our customers’ businesses or the economy as a whole. We may not have sufficient protection or recovery plans in certain circumstances, such as natural disasters affecting the San Francisco Bay Area, and our business interruption insurance may be insufficient to compensate us for losses that may occur.
Our stock price is volatile and purchasers of our common stock could incur substantial losses.
The trading price of our common stock may be subject to wide fluctuations in response to various factors, some of which are beyond our control. In addition to the factors discussed in this “Risk Factors” section and elsewhere in our filings with the SEC, these factors include:
• | our operating performance and the operating performance of similar companies; |
• | the overall performance of the equity markets; |
• | the number of shares our common stock publicly owned and available for trading; |
• | threatened or actual litigation; |
• | changes in laws or regulations relating to our solutions; |
• | any major change in our board of directors or management; |
• | publication of research reports about us or our industry or positive or negative recommendations or withdrawal of research coverage by securities analysts; |
• | large volumes of sales of our shares of common stock by existing stockholders; and |
• | general political and economic conditions. |
In addition, the stock market in general has experienced extreme price and volume fluctuations. Securities class action litigation has often been instituted against companies following periods of volatility in the overall market and in the market price of a company’s securities. This litigation, if instituted against us, could result in very substantial costs, divert our management’s attention and resources and harm our business.
24
Our reported financial results may be adversely affected by changes in accounting principles generally accepted in the United States.
Generally accepted accounting principles in the United States are subject to interpretation by the Financial Accounting Standards Board (FASB), the SEC, and various bodies formed to promulgate and interpret appropriate accounting principles. A change in these principles or interpretations could have a significant effect on our reported financial results, and could affect the reporting of transactions completed before the announcement of a change. For example, the adoption of ASC 606, a new revenue recognition standard which becomes effective in fiscal 2018, could impact the timing of recognition of certain revenue streams, as well as how we account for certain commissions. Further, the evaluation and implementation of new standards, including ASC 606, may require additional resources and system configurations that could increase our operating costs.
Our stock repurchase program may be suspended or terminated at any time, which may result in a decrease in the trading price of our common stock.
Our board of directors previously approved a stock repurchase program under which we are authorized to repurchase up to $75.0 million of our common stock over a 36-month period ending in May 2017, $42.8 million of which remains available as of December 31, 2016. Such stock repurchases may be limited, suspended, or terminated at any time without prior notice. There can be no assurance that we will repurchase additional shares of our common stock under our stock repurchase program or that any future repurchases will have a positive impact on the trading price of our common stock or earnings per share. Important factors that could cause us to limit, suspend or terminate our stock repurchase program include, among others, unfavorable market conditions, the trading price of our common stock, the nature of other investment or strategic opportunities presented to us from time to time, the rate of dilution of our equity compensation programs, the availability of adequate funds, and our ability to make appropriate, timely, and beneficial decisions as to when, how, and whether to purchase shares under the stock repurchase program. If we limit, suspend or terminate our stock repurchase program, our stock price may be negatively affected.
If securities or industry analysts discontinue publishing research or publish inaccurate or unfavorable research about our business, our stock price could decline.
The trading market for our common stock depends in part on the research and reports that securities or industry analysts publish about us or our business. If one or more of the analysts who cover us downgrade our stock or publish inaccurate or unfavorable research about our business, our stock price would likely decline. If one or more of these analysts cease coverage of our company or fail to publish reports on us regularly, demand for our stock could decrease, which might cause our stock price to decline.
Certain provisions in our charter documents and Delaware law could discourage takeover attempts and lead to management entrenchment.
Our amended and restated certificate of incorporation and amended and restated bylaws contain provisions that could have the effect of delaying or preventing changes in control or changes in our board of directors. These provisions include:
• | a classified board of directors with three-year staggered terms, which may delay the ability of stockholders to change the membership of a majority of our board of directors; |
• | no cumulative voting in the election of directors, which limits the ability of minority stockholders to elect director candidates; |
• | the exclusive right of our board of directors to elect a director to fill a vacancy created by the expansion of the board of directors or the resignation, death or removal of a director, which prevents stockholders from being able to fill vacancies on our board of directors; |
• | the ability of our board of directors to determine to issue shares of preferred stock and to determine the price and other terms of those shares, including preferences and voting rights, without stockholder approval, which could be used to significantly dilute the ownership of a hostile acquirer; |
• | a prohibition on stockholder action by written consent, which forces stockholder action to be taken at an annual or special meeting of our stockholders; |
• | the requirement that a special meeting of stockholders may be called only by the chairman of the board of directors, the chief executive officer, the president or the board of directors, which may delay the ability of our stockholders to force consideration of a proposal or to take action, including the removal of directors; and |
• | advance notice procedures that stockholders must comply with in order to nominate candidates to our board of directors or to propose matters to be acted upon at a stockholders’ meeting, which may discourage or deter a potential acquirer from conducting a solicitation of proxies to elect the acquirer’s own slate of directors or otherwise attempting to obtain control of us. |
25
We are also subject to certain anti-takeover provisions under Delaware law. Under Delaware law, a corporation may not, in general, engage in a business combination with any holder of 15% or more of its capital stock unless the holder has held the stock for three years or, among other things, the board of directors has approved the transaction.
ITEM 1B. | UNRESOLVED STAFF COMMENTS |
Not applicable.
ITEM 2. | PROPERTIES |
The following table sets forth the location and approximate square footage of each of our principal properties. All properties are leased under operating leases that expire at various times through 2025.
Location | Primary Use | Approximate Square Footage | |||
Pleasanton, CA | Headquarters | 280,680 | |||
Calabasas, CA | Branch office | 3,400 | |||
Irvine, CA | Branch office | 4,600 | |||
San Diego, CA | Branch office | 4,880 | |||
Eagan, MN | Branch office | 4,800 | |||
St. Louis, MO | Branch office | 10,000 | |||
Omaha, NE | Branch office | 20,100 | |||
Parsippany, NJ | Branch office | 2,200 | |||
In addition, we believe that our branch offices are adequate for our current needs and that suitable additional or substitute space will be available as needed to accommodate foreseeable expansion of our operations.
ITEM 3. | LEGAL PROCEEDINGS |
Information pertaining to our legal proceedings is incorporated by reference from Note 8 of the Notes to Consolidated Financial Statements.
ITEM 4. | MINE SAFETY DISCLOSURES |
Not applicable.
PART II
ITEM 5. | MARKET FOR REGISTRANT’S COMMON EQUITY, RELATED STOCKHOLDER MATTERS AND ISSUER PURCHASES OF EQUITY SECURITIES |
Market Information for Common Stock
Our common stock has been traded on the New York Stock Exchange, or NYSE, under the symbol “ELLI” since April 15, 2011. The following table sets forth the high and low sales prices of our common stock as reported on the NYSE for the periods indicated.
26
Low | High | ||||||
Year ended December 31, 2015 | |||||||
First Quarter | $ | 39.29 | $ | 57.36 | |||
Second Quarter | $ | 54.60 | $ | 71.52 | |||
Third Quarter | $ | 64.83 | $ | 82.92 | |||
Fourth Quarter | $ | 58.35 | $ | 78.71 | |||
Year ended December 31, 2016 | |||||||
First Quarter | $ | 57.88 | $ | 91.16 | |||
Second Quarter | $ | 74.11 | $ | 94.20 | |||
Third Quarter | $ | 90.25 | $ | 105.98 | |||
Fourth Quarter | $ | 77.60 | $ | 109.99 | |||
Holders of Our Common Shares
As of February 16, 2017, there were approximately 49 holders of record of our common stock. Because many of our shares are held by brokers and other institutions on behalf of stockholders, we are unable to estimate the total number of stockholders represented by these record holders.
Dividend Policy
We have never declared or paid, and do not anticipate declaring or paying, any cash dividends on our common stock. Any future determination as to the declaration and payment of dividends, if any, will be at the discretion of our board of directors and will depend on then existing conditions, including our financial condition, operating results, contractual restrictions, capital requirements, business prospects, and other factors our board of directors may deem relevant.
27
Performance Graph
The following graph compares the total cumulative shareholder return on our common stock with the total cumulative return of the NYSE Composite Index, and the S&P 500 North American Technology-Software Index for each of the last five fiscal years ended December 31, 2016.
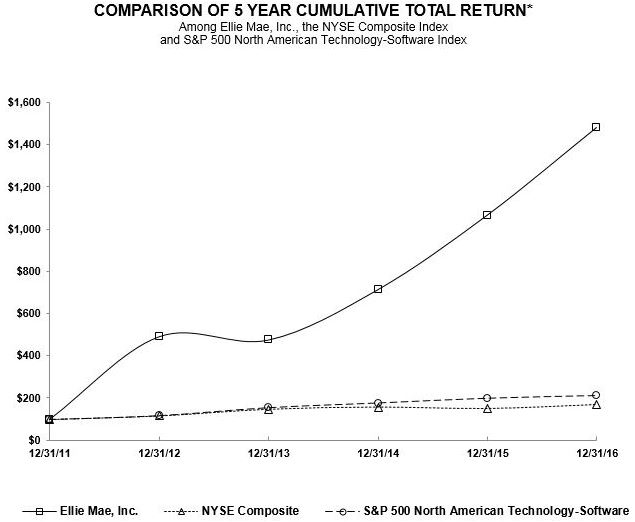
12/31/2011 | 12/31/2012 | 12/31/2013 | 12/31/2014 | 12/31/2015 | 12/31/2016 | ||||||||||||
Ellie Mae, Inc. | 100.00 | 491.15 | 475.58 | 713.63 | 1,066.02 | 1,481.06 | |||||||||||
NYSE Composite | 100.00 | 115.99 | 146.47 | 156.36 | 149.97 | 167.87 | |||||||||||
S&P 500 North American Technology-Software | 100.00 | 117.43 | 153.95 | 175.32 | 197.22 | 209.46 | |||||||||||
* | Assumes that $100.00 was invested in our common stock and in each index at market closing prices on December 31, 2011, and that all dividends were reinvested. No cash dividends have been declared on our common stock since our initial public offering. Stockholder returns over the indicated period should not be considered indicative of future share prices or stockholder returns. |
This performance graph shall not be deemed “filed” for purposes of Section 18 of the Exchange Act of 1934, or incorporated by reference into any filing of Ellie Mae, Inc. under the Securities Act of 1933, as amended except as shall be expressly set forth by specific reference in such filing.
Recent Sales of Unregistered Securities
None.
28
Purchases of Equity Securities by the Issuer and Affiliated Purchasers
The table below sets forth the information with respect to purchases made by or on behalf of the Company or any “affiliated purchaser” (as the term is defined in Rule 10b-18(a)(3) under the Securities Exchange Act of 1934, as amended) of our common stock during the year ended December 31, 2016:
ISSUER PURCHASES OF EQUITY SECURITIES
Total Number | Approximate | ||||||||||||
of Shares | Dollar Value or | ||||||||||||
Total | Purchased as | Shares that May | |||||||||||
Number of | Average | Part of Publicly | Yet be Purchased | ||||||||||
Shares | Price Paid | Announced Plans | Under the Plans | ||||||||||
Period | Purchased | per Share | or Programs | or Programs (1) | |||||||||
January 1, 2016 to January 31, 2016 | — | $ | — | — | $ | 43,469,986 | |||||||
February 1, 2016 to February 28, 2016 | — | $ | — | — | $ | 43,469,986 | |||||||
March 1, 2016 to March 31, 2016 | — | $ | — | — | $ | 43,469,986 | |||||||
April 1, 2016 to April 30, 2016 | — | $ | — | — | $ | 43,469,986 | |||||||
May 1, 2016 to May 31, 2016 | — | $ | — | — | $ | 43,469,986 | |||||||
June 1, 2016 to June 30, 2016 | — | $ | — | — | $ | 43,469,986 | |||||||
July 1, 2016 to July 31, 2016 | — | $ | — | — | $ | 43,469,986 | |||||||
August 1, 2016 to August 31, 2016 | — | $ | — | — | $ | 43,469,986 | |||||||
September 1, 2016 to September 30, 2016 | — | $ | — | — | $ | 43,469,986 | |||||||
October 1, 2016 to October 31, 2016 | — | $ | — | — | $ | 43,469,986 | |||||||
November 1, 2016 to November 30, 2016 | — | $ | — | — | $ | 43,469,986 | |||||||
December 1, 2016 to December 31, 2016 | 8,333 | $ | 79.62 | 8,333 | $ | 42,806,483 | |||||||
________________
(1) On May 21, 2014, our board of directors approved a stock repurchase program under which we are authorized to repurchase up to $75.0 million of our common stock, which expires in May 2017. Shares under the program are retired upon the repurchase. Amount remaining to be purchased are exclusive of commissions.
29
ITEM 6. | SELECTED CONSOLIDATED FINANCIAL DATA |
The consolidated statements of operations data for the years ended December 31, 2016, 2015, and 2014 and the consolidated balance sheets data as of December 31, 2016 and 2015 are derived from our audited consolidated financial statements included elsewhere in this report. The consolidated statements of operations data for the years ended December 31, 2013 and 2012 and the consolidated balance sheets data as of December 31, 2014, 2013, and 2012 are derived from our audited consolidated financial statements not included elsewhere in this report. Our historical results are not necessarily indicative of future performance. You should read the following selected consolidated financial data below in conjunction with “Management’s Discussion and Analysis of Financial Condition and Results of Operations” and the consolidated financial statements, related notes and other financial information included elsewhere in this report. The selected consolidated financial data in this section are not intended to replace the consolidated financial statements and are qualified in their entirety by the consolidated financial statements and related notes included elsewhere in this report.
Year ended December 31, | |||||||||||||||||||
2016 | 2015 | 2014 | 2013 | 2012 | |||||||||||||||
(in thousands, except share and per share data) | |||||||||||||||||||
Consolidated Statements of Operations Data: | |||||||||||||||||||
Revenues | $ | 360,285 | $ | 253,937 | $ | 161,537 | $ | 128,481 | $ | 101,845 | |||||||||
Cost of revenues(1) | 120,145 | 84,208 | 46,283 | 32,630 | 23,114 | ||||||||||||||
Gross profit | 240,140 | 169,729 | 115,254 | 95,851 | 78,731 | ||||||||||||||
Operating expenses: | |||||||||||||||||||
Sales and marketing(1) | 54,704 | 38,208 | 26,544 | 21,331 | 17,887 | ||||||||||||||
Research and development(1) | 58,501 | 40,451 | 28,228 | 24,695 | 18,053 | ||||||||||||||
General and administrative(1) | 71,318 | 57,212 | 39,361 | 30,853 | 21,601 | ||||||||||||||
Total operating expenses | 184,523 | 135,871 | 94,133 | 76,879 | 57,541 | ||||||||||||||
Income from operations | 55,617 | 33,858 | 21,121 | 18,972 | 21,190 | ||||||||||||||
Other income (expense), net | 989 | 619 | 488 | 460 | (43 | ) | |||||||||||||
Income before income taxes | 56,606 | 34,477 | 21,609 | 19,432 | 21,147 | ||||||||||||||
Income tax provision | 18,830 | 12,219 | 6,786 | 6,114 | 1,683 | ||||||||||||||
Net income | $ | 37,776 | $ | 22,258 | $ | 14,823 | $ | 13,318 | $ | 19,464 | |||||||||
Net income per share of common stock: | |||||||||||||||||||
Basic | $ | 1.21 | $ | 0.76 | $ | 0.53 | $ | 0.50 | $ | 0.83 | |||||||||
Diluted | $ | 1.15 | $ | 0.72 | $ | 0.50 | $ | 0.47 | $ | 0.76 | |||||||||
Weighted average shares outstanding: | |||||||||||||||||||
Basic | 31,179,857 | 29,179,352 | 27,858,828 | 26,581,962 | 23,523,222 | ||||||||||||||
Diluted | 32,799,785 | 30,842,584 | 29,593,873 | 28,502,403 | 25,537,192 | ||||||||||||||
December 31, | |||||||||||||||||||
2016 | 2015 | 2014 | 2013 | 2012 | |||||||||||||||
(in thousands) | |||||||||||||||||||
Consolidated Balance Sheet Data: | |||||||||||||||||||
Cash and cash equivalents | $ | 380,907 | $ | 34,396 | $ | 26,756 | $ | 33,462 | $ | 44,114 | |||||||||
Short-term investments | $ | 41,841 | $ | 48,975 | $ | 49,352 | $ | 46,325 | $ | 16,243 | |||||||||
Long-term investments | $ | 45,931 | $ | 55,473 | $ | 58,679 | $ | 56,285 | $ | 43,728 | |||||||||
Property and equipment, net | $ | 126,297 | $ | 81,360 | $ | 28,694 | $ | 12,869 | $ | 9,494 | |||||||||
Working capital | $ | 398,438 | $ | 58,731 | $ | 78,733 | $ | 78,161 | $ | 58,784 | |||||||||
Total assets | $ | 751,517 | $ | 364,891 | $ | 290,120 | $ | 229,603 | $ | 185,615 | |||||||||
Total stockholders’ equity | $ | 654,908 | $ | 290,851 | $ | 252,884 | $ | 207,927 | $ | 166,862 | |||||||||
30
(1) | Stock-based compensation included in the above line items: | |||||||||||||||||||
Year ended December 31, | ||||||||||||||||||||
2016 | 2015 | 2014 | 2013 | 2012 | ||||||||||||||||
(in thousands) | ||||||||||||||||||||
Cost of revenues | $ | 4,835 | $ | 3,218 | $ | 1,579 | $ | 745 | $ | 271 | ||||||||||
Sales and marketing | 4,429 | 2,752 | 1,562 | 1,041 | 467 | |||||||||||||||
Research and development | 7,296 | 5,431 | 3,672 | 3,469 | 1,552 | |||||||||||||||
General and administrative | 14,911 | 12,840 | 7,735 | 9,004 | 4,559 | |||||||||||||||
Total | $ | 31,471 | $ | 24,241 | $ | 14,548 | $ | 14,259 | $ | 6,849 | ||||||||||
ITEM 7. | MANAGEMENT’S DISCUSSION AND ANALYSIS OF FINANCIAL CONDITION AND RESULTS OF OPERATIONS |
You should read the following discussion of our financial condition and results of operations in conjunction with the financial statements and the notes thereto included elsewhere in this Annual Report on Form 10-K. The following discussion contains forward-looking statements that reflect our plans, estimates and beliefs. Our actual results could differ materially from those discussed in the forward-looking statements. Factors that could cause or contribute to these differences include those discussed below and elsewhere in this Annual Report on Form 10-K, particularly in “Risk Factors” and “Note Regarding Forward-Looking Statements.”
Overview
We are a leading provider of innovative on-demand software solutions and services for the residential mortgage industry in the United States. Banks, credit unions and mortgage lenders use our Encompass® all-in-one mortgage management solution to originate and fund mortgages and improve compliance, loan quality, and efficiency.
Mortgage originators use our Encompass software, a comprehensive mortgage management system that handles key business and management functions involved in running a residential mortgage origination business. Mortgage originators use Encompass as a single tool for loan processing, marketing, and customer communication and to interact electronically with lenders, investors, and service providers over the Ellie Mae Network. Our software also enables enforcement of rules and business practices designed to ensure loan quality, adherence to processing standards and regulatory compliance.
The Ellie Mae Network electronically connects approximately 165,000 mortgage professionals using Encompass to the broad array of mortgage lenders, investors, and third-party service providers integral to the origination and funding of residential mortgages. During the mortgage origination process, mortgage originators may order various services through the Ellie Mae Network, including credit reports; product eligibility and pricing services; automated underwriting services; appraisals; title reports; insurance; flood certifications and flood insurance; compliance reviews; fraud detection; document preparation; and verification of income, identity, and employment. Mortgage originators can also initiate secure data transmission to and from lenders and investors.
On-demand revenues are generated primarily from subscriptions to software we host that customers access through the Internet, including customers who pay fees based on the number of loans they close, or success basis, subject to monthly base fees, which we refer to as Success Based Pricing, and related professional services such as consulting, implementation, and training services. On-demand revenues also include software related services that are sold on a transactional basis; Ellie Mae Network transaction fees paid by service providers, lenders, investors, and certain government-sponsored entities participating on the Ellie Mae Network; education and training; and loan product and guideline data and analytics services that are provided under the AllRegs brand. On-premise revenues are generated from customer-hosted software licenses and related professional services and maintenance services. As of June 30, 2016, we completed the migration of customers to our on-demand Encompass offering, and we do not expect on-premise revenues in the future.
Our on-demand revenues typically, but not always, track the seasonality of the residential mortgage industry, with increased activity in the second and third quarters and reduced activity in the first and fourth quarters as home buyers tend to purchase their homes during the spring and summer in order to move to a new home before the start of the school year. Mortgage volumes are also impacted by other factors such as interest rate fluctuations, home sale activity, regulatory changes such as the TILA-RESPA Integrated Disclosure rule which became effective in October 2015, and general economic conditions, which can lead to departures from the typical seasonal pattern. For example, increases in mortgage interest rates could reduce the volume of new mortgages originated and, in particular, the volume of mortgage refinancings. Specifically, recent increases in interest rates may decrease the volume of mortgage refinancings in 2017. We currently estimate that approximately 35% to 45% of our revenues have some direct
31
sensitivity to volume. The base fee portion of success based revenues, subscription revenues, and professional services revenues, are not affected by fluctuations in mortgage origination volume.
We are investing aggressively in initiatives that we believe will help us continue to grow our business, improve our products and services, and strengthen our competitive advantage while bringing sustainable long-term value to our customers. During 2015 and 2016, we increased our investment in our research and development, technology infrastructure, and data security to support our user additions, increased volumes of customer data and to maintain the confidentiality of our customers’ data. We have also invested in our sales and client services capabilities to continue to increase sales of our products and to assist our customers in implementing our solutions. These investments include expanding our talent across the organization by hiring additional personnel. To support customers and further differentiate ourselves, we intend to continue to invest in key areas such as research and development, enterprise sales, services, technical support, data security, and data center infrastructure. This includes development of our hybrid cloud infrastructure to accommodate new users and our next generation Encompass platform, which we expect to incrementally introduce during 2017 and 2018. The costs associated with these investments resulted in a flat gross margin percentage and increased operating expenses in 2016 as compared to the same period in 2015. We expect that our cost of revenues will continue to increase in absolute dollars as our revenues increase, as we make additional and accelerated investments to bolster our infrastructure and enhance our system capacity, reliability, and data security, as we place new internal-use software into service, as we pursue additional strategic acquisitions, and as we continue to hire personnel in our implementation and customer support departments to support new customers and provide new services. As we continue to invest in these areas, such expenditures may affect our ability to improve our margins as we grow revenue.
In addition to our internal initiatives, our business strategy has evolved to address recent industry trends, including:
• | greater focus on operational efficiencies; |
• | customers adopting multi-channel strategies; |
• | changes in regulation affecting lenders and investors; |
• | increased quality standards imposed by regulators, lenders, and investors; and |
• | greater focus by customers and regulators on data security and consumer privacy |
We are responding to these trends as follows:
Greater focus on operational efficiencies. The average total production cost per loan was $6,969 in the third quarter of 2016.1 We expect operational costs to continue to be a significant consideration for mortgage originators due to the continuously changing regulatory environment and heightened quality standards. By automating many of the functions of mortgage origination, we enable our users to comply with regulations and process quality loans more efficiently and effectively. This reduces the cost of originating a loan and lowers the risk of buy-back demands from investors resulting from poorly originated or documented loans or loans that fail to comply with applicable regulations. We continually address the changing needs of our customers by developing and enhancing tools to allow for simplified regulatory compliance, increased availability of information, and enhanced system functionality and performance.
With an eye towards providing customers with ever-improving tools to enhance efficiency, we currently anticipate that we will continue to develop new service offerings through the Ellie Mae Network and pursue adoption of our services through initiatives such as our Encompass Connect Solutions. By integrating and expanding our current and new services, we aim to provide a more comprehensive solution to our users.
Customers adopting multi-channel strategies. Customers are developing multi-channel strategies beyond a single retail, correspondent or wholesale mortgage lending channel in order to grow their businesses. The requirements of these different channels vary and in order to maintain a single operating system, customers must use a robust system with customizable functionality. Encompass includes support for multi-channel workflows, allowing our customers to drive efficiencies and boost productivity by creating distinct workflows for each channel that map to our customers’ business needs. Encompass users can customize workflows based on channel, loan purpose or specific loan criteria - all of which can vary between lending channels. Additionally, Encompass Consumer Connect enables our customers to originate loans directly from borrowers by offering an online loan application that can be accessed by anyone with a web browser.
________________
1 | Mortgage Bankers Association, Independent Mortgage Bank Volumes Up, Production Profits Stable in 3rd Quarter 2016, December 7, 2016. | |
32
Changes in regulation affecting lenders and investors. Regulations continue to be subject to change and many regulatory reforms have significantly increased the complexity and importance of regulatory compliance. We devote considerable resources to continually upgrade our software to help our customers address regulatory changes. We offer Encompass Compliance Service, which analyzes mortgage loan data for compliance with consumer protection laws and institutionally mandated compliance policies and also alerts users to possible violations of these laws and policies. In addition, we have a staff of attorneys that work with compliance experts who help ensure that documents prepared using our software and the processes recommended by the Encompass workflow comply with applicable rules and regulations. For example, additional tools and product updates were required to address the Ability-to-Repay/Qualified Mortgage and Federal and State High Cost rules that became effective in January 2014. In addition, we updated certain of our products to comply with the TILA-RESPA Integrated Disclosure rule changes that took effect in October 2015. We believe we are also well-positioned to help our customers comply with changing regulatory requirements as they are published and become effective. However, changes to existing laws or regulations or adoption of new laws or regulations relating to the residential mortgage industry could require us to incur significant costs to update our products and services so that our customers remain compliant with such laws and regulations.
Increased quality standards imposed by regulators, lenders and investors. Encompass is designed to automate and streamline the process of originating mortgages to, among other things, satisfy increased quality requirements of investors. Relevant features of Encompass include enabling customers’ management to impose processing rules and formats, and providing milestone and process reminders, automated population of forms with accurate data, and accurate and automated transmission of loan files and data from originators to investors and lenders. Our TQL program is designed to further enhance the quality, compliance, and salability of loans that are originated through Encompass. Additionally, TQL is intended to reduce the possibility of errors in the process of transferring information from originator to investor and to give investors confidence in the accuracy and regulatory compliance of the information that is underlying loan files.
In response to the increased quality standards and compliance mandates affecting the industry, we expect many non-Encompass mortgage lenders to assess new platform options and replace their legacy systems. We have increased the size of our customer acquisition, implementation, and support teams by approximately 33% from 324 employees at December 31, 2014 to 430 employees at December 31, 2016 in order to address anticipated demand for our software solutions.
Greater focus by customers and regulators on data security and consumer privacy. Recent high-profile data security incidents affecting banking institutions and cloud-service software providers have resulted in an increased focus on data security by our customers and our customers’ regulators. We are making significant investments in the security of the Encompass service, as well as our internal systems, processes and monitoring capabilities to protect our customers’ data and help minimize the risk of data security loss. We expect the industry focus on data security to continue to increase, and we anticipate that our investments in data security will increase substantially over time.
Acquisition Strategy
Our industry is highly fragmented, and we believe there are strategic opportunities available to acquire technology-based companies that will complement and increase the attractiveness of our solutions. In October 2015, we acquired substantially all of the assets of Mortgage Returns, LLC, a company that provides on-demand CRM, and marketing automation solutions for the residential mortgage industry. With the acquisition of Mortgage Returns, we are responding to the needs of our customers by adding a robust CRM solution for lenders of all sizes. We believe such acquisitions enhance our product and service offerings and furthers our mission of automating the entire end-to-end mortgage process for our customers.
Operating Metrics
We use certain operational metrics to evaluate our business, determine allocation of our resources, and make decisions regarding corporate strategy. We focus on these metrics to determine our success in leveraging our user base to increase our revenues and to gauge the degree of our market penetration.
These metrics are defined below.
Contracted revenues. Contracted revenues are those revenues that are fixed by the terms of a contract and are not affected by fluctuations in mortgage origination volume. These revenues consist of the base fee portion of success based revenues, monthly per-user subscription revenues, professional services revenues, and subscription revenues paid for products other than Encompass.
Active users. An active user is a mortgage origination professional who has used Encompass at least once within a 90-day period preceding the measurement date. A user is a mortgage origination professional working at an Encompass mortgage lender, such as a mortgage bank, commercial bank, thrift or credit union, which sources and funds loans and generally sells these funded loans to investors; or a mortgage brokerage, which typically processes and submits loan files to a mortgage lender or mega lender that funds the loan.
33
Contracted users. A contracted user is a mortgage origination professional who has a license to use Encompass and has an obligation to pay for this license, but who is not necessarily an active user.
Average active users. Average active users during a period is calculated by averaging the monthly active users during a reporting period.
Revenue per average active Encompass user. Revenue per average active Encompass user is calculated by dividing total revenues by average active Encompass users.
The following table shows these operating metrics as of and for the years ended December 31, 2016, 2015, and 2014:
Year ended December 31, | |||||||||||
2016 | 2015 | 2014 | |||||||||
Revenues (in thousands): | |||||||||||
Total revenues | $ | 360,285 | $ | 253,937 | $ | 161,537 | |||||
Total contracted revenues | $ | 208,005 | $ | 150,773 | $ | 102,477 | |||||
Users at end of period: | |||||||||||
Contracted users | 215,769 | 166,057 | 126,346 | ||||||||
Active users | 164,648 | 136,167 | 108,933 | ||||||||
Active users as a percentage of contracted users | 76 | % | 82 | % | 86 | % | |||||
Average active users: | |||||||||||
Average active users during the period | 152,902 | 127,226 | 100,238 | ||||||||
Revenue per average active user during the period | $ | 2,356 | $ | 1,996 | $ | 1,612 | |||||
Basis of Presentation
General
Our consolidated financial statements include the accounts of Ellie Mae, Inc. and its wholly owned subsidiaries. All significant intercompany accounts and transactions have been eliminated upon consolidation.
Revenue Recognition
We generate revenues primarily from subscription services and usage-based fees, transaction-based fees, and fees from professional services. We categorize our revenue as either on-demand or on-premise. Sales taxes assessed by governmental authorities are excluded from revenue.
On-demand Revenue
On-demand revenue is generated from company-hosted software subscriptions that customers access through the Internet. On-demand revenue is comprised of fees for software services sold both as a subscription and transactionally, including fees based on a per closed loan, or success basis, subject to monthly base fees, which we refer to as Success Based Pricing; Ellie Mae Network fees; education and training, loan product, policy and guideline data and analytics services under the AllRegs brand; and professional services which include consulting, implementation, and training services.
On-premise Revenue
On-premise revenue is generated from maintenance services, sales of customer-hosted Encompass software licenses, and related professional services. As of June 30, 2016, we completed the migration of customers to our on-demand Encompass offering, and we do not expect on-premise revenues in the future.
Cost of Revenues and Operating Expenses
Cost of Revenues
Our cost of revenues consists primarily of: salaries and benefits, including stock-based compensation expense; data center operating costs; depreciation on data center computer equipment; amortization of internal-use software and acquired intangible assets such as developed technology and trade names; customer support; professional services associated with implementation of our software; third-party royalty expenses; and allocated facilities costs. We expect that our cost of revenues will continue to
34
increase in absolute dollars as our revenues increase, as we make additional and accelerated investments to bolster our infrastructure and enhance our system capacity, reliability, and data security, as we place new internal-use software into service, as we pursue additional strategic acquisitions, and as we continue to hire personnel in our implementation and customer support departments to support new customers and provide new services. We anticipate that we will continue to invest in key areas such as research and development, enterprise sales, services, technical support, data security, and data center infrastructure to better support our customers and further differentiate ourselves. This will include development of our next generation Encompass platform, which we expect to incrementally introduce during 2017 and 2018.
Sales and Marketing
Our sales and marketing expenses consist primarily of: salaries, benefits and incentive compensation, including stock-based compensation expense and commissions; allocated facilities costs; expenses for trade shows, public relations, our annual user conference, and other promotional and marketing activities; expenses for travel and entertainment; and amortization of acquired intangible assets such as customer relationships. We expect that our sales and marketing expense will continue to increase as we hire additional sales personnel in order to address anticipated demand for our software solutions and as we pursue additional strategic acquisitions. We also intend to increase marketing activities focused on Encompass, our Ellie Mae Network offerings and our other Encompass services.
Research and Development
Our research and development expenses consist primarily of: salaries and benefits, including bonuses and stock-based compensation expense; fees to contractors engaged in the development of the Encompass software, Ellie Mae Network, and other products; and allocated facilities costs. We expect that our research and development expenses will continue to increase in absolute dollars as we continue to invest in our products and services and related next-generation enhancements, including hiring additional engineering and product development personnel and as we pursue additional strategic acquisitions.
General and Administrative
Our general and administrative expenses consist primarily of: salaries and benefits, including bonuses and stock-based compensation expense for employees involved in finance, accounting, human resources, administration, information technology, and legal; third-party provider expenses such as general consulting, legal, accounting, and other professional services; and allocated facilities costs. We expect general and administrative expenses to continue to increase in absolute dollars as we hire additional personnel and grant stock-based awards to attract and retain the employees needed to continue to grow our business and as we pursue additional strategic acquisitions.
Other Income, Net
Other income, net consists of interest income earned on investments and cash accounts, offset by investment discount amortization and imputed interest expense related to our acquisition holdback payments, and interest expense paid on equipment and software leases.
Income Taxes
On a quarterly basis, we evaluate our expected income tax expense or benefit based on our year-to-date operations, and we record an adjustment in the current quarter. The net tax provision is the result of the mix of profits earned by us and our subsidiaries in tax jurisdictions with a broad range of income tax rates. We are required to estimate deferred tax assets and liabilities based on the differences between the financial reporting and tax bases of assets and liabilities measured using the enacted tax rates that will be in effect when the differences are expected to reverse. In general, deferred tax assets represent future tax benefits to be received when certain expenses previously recognized in our consolidated statements of operations become deductible expenses under applicable income tax laws or loss or credit carry forwards are utilized. Accordingly, realization of our deferred tax assets is dependent on future taxable income against which these deductions, losses, and credits can be utilized. We use management judgment to assess the likelihood that our deferred tax assets will be recovered from future taxable income and to the extent we believe that recovery is not more likely than not, we must establish a valuation allowance to reduce the deferred tax assets to the amount that is more likely than not to be realized. We are planning to adopt ASU 2016-09 as of January 1, 2017. As a result of the adoption, we expect excess tax benefits to be recognized prospectively as income tax benefit or expense when stock awards vest or are settled. Given the inherent uncertainty in predicting future share-based transactions, actual benefits realized may vary, and may result in volatility to our income tax expense or benefit.
35
Critical Accounting Policies and Estimates
Our discussion and analysis of our financial condition and results of operations are based on our consolidated financial statements which are prepared in accordance with U.S. GAAP. The preparation of these consolidated financial statements requires us to make estimates and assumptions that affect the reported amounts of assets, liabilities, revenues, expenses, and related disclosures. We evaluate our estimates and assumptions on an ongoing basis. Our estimates are based on historical experience and various other assumptions that we believe to be reasonable under the circumstances. Our actual results could differ from these estimates.
We believe that the assumptions and estimates associated with revenue recognition, income taxes, stock-based compensation, goodwill and intangible assets, fair value of investments, deferred commissions, and software and website development costs have the greatest potential impact on our consolidated financial statements. Therefore, we consider these to be our critical accounting policies and estimates. For further information on all of our significant accounting policies, please see Note 2 of the Notes to Consolidated Financial Statements.
Revenue Recognition
We generate revenues from sales of services including subscription services and usage-based fees, transactional services, and professional services. We categorize our revenues as either on-demand or on-premise revenue.
On-Demand Revenue
Subscription Services and Usage-Based Fee Arrangements. Subscription services and usage-based fee arrangements generally include a combination of our products delivered as SaaS and support services. These arrangements are generally non-cancelable and do not contain refund-type provisions. This revenue typically includes the following:
Encompass Revenue. We offer web-based, on-demand access to our Encompass software for a monthly recurring fee. We provide the right to access our loan origination software and handle the responsibility of managing the servers, providing security, backing up the data and applying updates. Customers under this arrangement may not take possession of the software at any time during the term of the agreement. Subscription revenue is recognized ratably over the contract terms as subscription services are provided, beginning on the commencement date of each contract, which is the date our service is made available to customers. Contracts generally range from one to five years. Alternatively, customers can elect to pay on a success basis. Success basis contracts generally have a term of one to five years and are subject to monthly base fees, which enable customers to close loans up to a contractually agreed-to minimum number of transactions, and additional closed loan fees, which are assessed for loans closed in excess of the minimum. Revenue is earned from both base fees and additional closed loan fees as the result of the customer’s usage of Encompass. Monthly base fees are recognized over the respective monthly service period as the subscription services are provided. Additional closed loans fees are recognized when the loans are reported as closed. This offering also includes Encompass CenterWise, Encompass Compliance Service, and Encompass Docs Solution as integrated components, which are combined elements of the arrangement that are delivered in conjunction with the Encompass offering and therefore are not accounted for separately.
Services Revenue. We provide a variety of mortgage-related and other business services, including automated documentation; fraud detection, valuation, validation, and risk analysis; income verification; marketing and customer relationship management; product and pricing; flood zone certifications; website and electronic document management; and compliance reports. Services revenue is recognized upon completion of the services.
Transactional and Other Revenue. We have entered into agreements with various lenders, service providers and certain government-sponsored entities participating in the mortgage origination process that provide them access to, and ability to interoperate with, mortgage originators on the Ellie Mae Network. Under these agreements, we earn transaction fees when transactions are processed through the Ellie Mae Network. Transactional revenue is recognized upon completion of the services.
Professional Services Revenue. Professional services revenue is generally recognized upon delivery or completion of performance milestones for fixed price contracts or as the services are rendered for time and material contracts. The majority of the Company’s professional services contracts are on a fixed price basis. Training revenue is recognized as the services are rendered.
Subscriptions to Online Research and Data Resources. We provide mortgage originators and underwriters with access to online databases of various federal and state laws and regulations and forms as well as mortgage investor product guidelines. Subscription fees are recognized ratably over the subscription term as subscription services are provided, which is typically one year.
36
On-Premise Revenue
Revenue from the sale of software licenses is recognized in the month in which the required revenue recognition criteria are met, generally in the month in which the software is delivered. Revenue from the sale of maintenance services and professional services is recognized over the period in which the services are provided. As of June 30, 2016, we completed the migration of customers to our on-demand Encompass offering, and we do not expect on-premise revenues in the future.
Multiple Element Arrangements
We enter into arrangements with multiple elements that generally include multiple subscriptions and professional services. For arrangements with multiple deliverables, we evaluate whether the individual deliverables qualify as separate units of accounting. In order to treat deliverables in a multiple-deliverable arrangement as separate units of accounting, the deliverables must have standalone value upon delivery.
Subscription services have standalone value as such services are often sold separately. Additionally, we concluded that professional services included in multiple element arrangements also have standalone value. In establishing standalone value, we considered the following factors for each professional services agreement: availability of the services from other vendors, the nature of the professional services, and the timing of when the professional services contract was signed in comparison to the subscription service start date.
When subscription services agreements involve multiple elements that qualify as separate units of accounting, we allocate arrangement consideration to all deliverables at the inception of an arrangement based on the relative selling price method in accordance with the selling price hierarchy, which includes: (i) vendor specific objective evidence, or VSOE, if it is available; (ii) third-party evidence, or TPE, if VSOE is not available; and (iii) the best estimate of selling price, or BESP, if neither VSOE nor TPE is available. We have determined that TPE is not a practical alternative as our go-to-market strategy and offerings contain a significant level of differentiation such that the comparable pricing of services with similar functionality cannot be obtained. Furthermore, we are unable to reliably determine what similar competitor services’ selling prices are on a standalone basis. The amount of revenue allocated to delivered items is limited by contingent revenue, if any.
We have not historically priced our services within a narrow range. As a result, we have not been able to establish VSOE for our services. Accordingly, we use BESP to determine the relative selling price for our services.
The objective of BESP is to determine the price at which we would transact a sale if the service was sold on a standalone basis. When establishing BESP, we review company specific factors used to determine list price and make adjustments as appropriate to reflect current market conditions and pricing behavior. Our process for establishing list price includes assessing the cost to provide a particular product or service, surveying customers to determine market expectations, analyzing customer demographics, and taking into account similar products and services historically sold by us. We continue to review the factors used to establish list price and adjust BESP as necessary.
Income Taxes
We account for income taxes under the asset and liability method, which requires the recognition of taxes payable or refundable for the current year, and deferred tax liabilities and assets for the future tax consequences of events that have been recognized in our financial statements or tax returns. The measurement of current and deferred tax liabilities and assets is based on provisions of the enacted tax law; the effects of future changes in tax laws or rates are not anticipated. Valuation allowances are established when necessary to reduce deferred tax assets to the amount that we believe is more likely than not to be realized.
We operate in various tax jurisdictions and are subject to audit by various tax authorities. We provide for tax positions whenever it is deemed likely that a tax asset has been impaired or a tax liability has been incurred for events such as tax claims or changes in tax laws. A tax position is only recognized in the financial statements if it is “more likely than not” to be sustained based solely on its technical merits as of the reporting date.
We consider many factors when evaluating and estimating our tax positions and tax benefits, which may require periodic adjustments and which may not accurately anticipate actual outcomes. Our judgments, assumptions and estimates relative to the current provision for income tax take into account current tax laws, our interpretation of current tax laws and possible outcomes of current and future audits conducted by domestic tax authorities. Changes in tax laws or our interpretation of tax laws and the resolution of current and future tax audits could significantly impact the amounts provided for income taxes in our consolidated balance sheets and consolidated statements of comprehensive income. We must also assess the likelihood that deferred tax assets will be realized from future taxable income and, based on this assessment, establish a valuation allowance, if required.
Our determination of our valuation allowance is based upon a number of assumptions, judgments, and estimates, including forecasted earnings, future taxable income, and the relative proportions of revenue and income before taxes in the various jurisdictions in which we operate. To the extent we establish a valuation allowance or change the valuation allowance in a period,
37
we reflect the change with a corresponding increase or decrease to our tax provision in our consolidated statements of comprehensive income.
Stock-based Compensation
We recognize compensation expense related to Restricted Stock Units (“RSUs”), Performance-Vesting Restricted Stock Units and Performance Awards (“Performance Awards”), based on the fair market value of the underlying shares of common stock as of the date of grant. Expense related to the RSUs is recognized on a straight-line basis over the requisite service period of the award, which generally equals the vesting period. Expense related to the Performance Awards and performance-vesting RSUs is recognized under the graded vesting method over the requisite service period of the award, which results in the recognition of a larger portion of the expense during the beginning of the vesting period than in the end of the vesting period. We evaluate the probability of performance attainment and estimate the probable number of shares of common stock that will be granted and records the expense accordingly, if probable.
We recognize compensation expense related to stock option grants that are ultimately expected to vest based on estimated fair values on the date of grant using the Black-Scholes option-pricing model. Such expense is recognized on a straight-line basis over the requisite service period of the award, which generally equals the vesting period.
The date of grant is the date at which we and the employee reach a mutual understanding of the key terms and conditions of the award, appropriate approvals are received by the equity incentive committee of the board of directors and we become contingently obligated to issue equity instruments to the employee who renders the requisite service.
We are required to estimate potential forfeitures of stock grants and adjust recorded compensation cost accordingly. The estimate of forfeitures is based on historical experience and is adjusted over the requisite service period to the extent that actual forfeitures differ, or are expected to differ, from the prior estimates. Changes in estimated forfeitures will be recognized in the period of change and will impact the amount of stock-based compensation expense to be recognized in future periods, which could be material if actual results differ significantly from our estimates.
Please refer to Note 10 in the Notes to Consolidated Financial Statements for the assumptions used in the Black-Scholes option-pricing model relating to stock options in the years ended December 31, 2016, 2015, and 2014.
Goodwill and Intangible Assets
Goodwill and intangible assets are stated at cost less accumulated amortization, as appropriate. Intangible assets include developed technology, trade names, and customer lists and contracts. Intangible assets with finite lives are amortized on a straight-line basis over the estimated periods of benefit, generally two to nine years. Goodwill and intangible assets with indefinite lives are not amortized, but tested for impairment at least annually, or whenever changes in circumstances indicate that the carrying amount of the goodwill or indefinite-lived intangible assets may not be recoverable. Intangible assets with finite lives are tested for impairment whenever changes in circumstances indicate that the carrying amount of the finite-lived intangible assets may not be recoverable. Goodwill impairment tests are performed at the reporting unit level, which is the company as a whole, using a two-step, fair-value approach.
An impairment loss on finite lived intangible assets would be recognized when the sum of the undiscounted estimated future cash flows expected to result from the use of the asset and its eventual disposition is less than its carrying amount. Such impairment loss would be measured as the difference between the carrying amount of the asset and its fair value. Cash flow assumptions are based on historical and forecasted revenue, operating costs, and other relevant factors. Intangible asset impairment tests consist of a comparison of the fair value of an intangible asset with its carrying amount.
There was no impairment of goodwill and intangible assets in 2016.
In October 2015, we acquired substantially all of the assets of Mortgage Returns, LLC (“Mortgage Returns”), and as a result of the acquisition we no longer utilized the technology acquired from ARG Interactive, LLC (dba MortgageCEO) (“MortgageCEO”), and we migrated the existing customers using the technology acquired from MortgageCEO technology to the Mortgage Returns CRM platform in 2016. As a result, we recorded a non-cash impairment charge of $0.6 million to developed technology, which was included in research and development expenses, respectively, in the consolidated statements of comprehensive income for the year ended December 31, 2015.
During the fourth quarter of 2014, we identified certain indicators of impairment for both the customer relationships and developed technology acquired in the MortgageCEO acquisition. Specifically, we determined we would need to make additional investments in the Encompass CRM product in order to attract new customers (which were not expected and therefore not contemplated in the valuation of customer relationships and developed technology in the purchase price allocation at the acquisition date), which resulted in a significant delay in our ability to release an integrated Encompass CRM product to our customers. As a result, we incurred a non-cash impairment charge of $0.3 million to customer relationships and a non-cash impairment charge of
38
$1.7 million to developed technology, which were included in sales and marketing expenses and research and development expenses, respectively, in the consolidated statements of comprehensive income for the year ended December 31, 2014.
Investments and Fair Value Measurement of Financial Instruments
All of our investments that have maturities of greater than 90 days are classified as available-for-sale and are carried at fair value. We invest excess cash primarily in investment-grade interest-bearing securities, such as money market accounts, certificates of deposit, commercial paper, corporate bonds, municipal and government agency obligations, and guaranteed obligations of the U.S. government. Fair value is determined based on quoted market rates when observable or utilizing data points that are observable, such as quoted prices, interest rates, and yield curves. The cost of available-for-sale marketable securities sold is based on the specific identification method. Unrealized gains and losses are reported in stockholders’ equity as accumulated other comprehensive income (loss). Realized gains and losses are included in other income (expense), net. Interest and dividends are included in other income (expense), net when they are earned.
At December 31, 2016, our assets measured and recorded at fair value on a recurring basis included $2.7 million of money market funds, $301.6 million U.S. government obligations that are classified as cash and cash equivalents, and $87.8 million of marketable debt instruments. Of these U.S. government obligations that are classified as cash and cash equivalents, $151.7 million was classified as Level 1 and $150.0 million as Level 2. Of these marketable debt instruments, $4.6 million was classified as Level 1 and $83.2 million as Level 2. We only invest in government-backed money market funds, which are not based on a floating net asset per share value, and are classified as Level 1. When determining fair value, we consider the principal or most advantageous market in which we would transact, and we consider assumptions that market participants would use when pricing the asset or liability. For further information, see “Fair Value of Financial Instruments” in Notes 2 and 4 of the Notes to Consolidated Financial Statements.
Our money market funds and marketable debt instruments that are measured and recorded at fair value on a recurring basis and classified as Level 1 were classified as such due to the use of observable market prices for identical securities that are traded in active markets. Management judgment was required to determine the levels for the frequency of transactions that should be met for a market to be considered active. Our assessment of an active market for our marketable debt instruments generally takes into consideration the number of days each individual instrument trades over a specified period.
When we use observable market prices for identical securities that are traded in less active markets, we classify our marketable financial instruments as Level 2. When observable market prices for identical securities are not available, we price our marketable financial instruments using non-binding market consensus prices that are corroborated with observable market data; quoted market prices for similar instruments; or pricing models with all significant inputs derived from or corroborated with observable market data. Non-binding market consensus prices are based on the proprietary valuation models of pricing providers. These valuation models incorporate a number of inputs, including non-binding and binding broker quotes; observable market prices for identical or similar securities; and the internal assumptions of pricing providers or brokers that use observable market inputs and, to a lesser degree, unobservable market inputs. We corroborate non-binding market consensus prices with observable market data as such data exists.
We had no investments classified as Level 3 as of December 31, 2016 and 2015.
Deferred Commissions
Deferred commission expenses are the incremental costs that are directly associated with non-cancelable subscription contracts with customers and consist of sales commissions paid to our direct sales force. Commissions are calculated based on a percentage of the revenues for the non-cancelable term of subscription contracts, which are typically 1 to 5 years.
The deferred commission expense amounts are recoverable through the future revenue streams under the non-cancelable customer contracts.
Software and Website Development Costs
We capitalize internal and external costs incurred to develop internal-use software and website applications. Capitalized internal costs include salaries, benefits, and stock-based compensation charges for employees that are directly involved in developing the software or website application, and depreciation of assets used in the development process. Capitalized external costs include third-party consultants involved in the development process, as well as other direct costs incurred as part of the development process.
Capitalization of costs begins when the preliminary project stage has been completed, management authorizes and commits to funding a project and it is probable that the project will be completed and the software or website application will be used to perform the function intended. Internal and external costs incurred as part of the preliminary project stage are expensed as incurred.
39
Capitalization ceases at the point at which the project is substantially complete and ready for its intended use. Internal and external training costs and maintenance costs during the post-implementation operation stage are expensed as incurred.
Internal-developed core software is amortized on a straight-line basis over its estimated useful life, generally three to five years. Amortization of product related internal-use software and website applications is typically recorded to cost of revenues, and amortization of other internal-use software and website applications is typically recorded to the operating expense line to which it most closely relates. Our management evaluates the useful lives of these assets on an annual basis and tests for impairment whenever events or changes in circumstances occur that could impact the recoverability of these assets. The capitalized costs are included in the property and equipment, net line in the accompanying consolidated balance sheets. For the years ended December 31, 2016, 2015 and 2014, we capitalized software and website application development costs of $38.5 million, $29.4 million, and $15.9 million, respectively.
During the year ended December 31, 2014, we recorded a $0.7 million impairment loss on the write-off of internal-use software. There were no such write-offs during the years ended December 31, 2016 and 2015.
Results of Operations
The following tables set forth our results of operations for the periods presented and as a percentage of our revenues for those periods. The period-to-period comparison of financial results is not necessarily indicative of future results.
Year ended December 31, | |||||||||||
2016 | 2015 | 2014 | |||||||||
(in thousands) | |||||||||||
Revenues | $ | 360,285 | $ | 253,937 | $ | 161,537 | |||||
Cost of revenues(1) | 120,145 | 84,208 | 46,283 | ||||||||
Gross profit | 240,140 | 169,729 | 115,254 | ||||||||
Operating expenses: | |||||||||||
Sales and marketing(1) | 54,704 | 38,208 | 26,544 | ||||||||
Research and development(1) | 58,501 | 40,451 | 28,228 | ||||||||
General and administrative(1) | 71,318 | 57,212 | 39,361 | ||||||||
Total operating expenses | 184,523 | 135,871 | 94,133 | ||||||||
Income from operations | 55,617 | 33,858 | 21,121 | ||||||||
Other income, net | 989 | 619 | 488 | ||||||||
Income before income taxes | 56,606 | 34,477 | 21,609 | ||||||||
Income tax provision | 18,830 | 12,219 | 6,786 | ||||||||
Net income | $ | 37,776 | $ | 22,258 | $ | 14,823 | |||||
(1) | Stock-based compensation included in the above line items: | |||||||||||
Year ended December 31, | ||||||||||||
2016 | 2015 | 2014 | ||||||||||
(in thousands) | ||||||||||||
Cost of revenues | $ | 4,835 | $ | 3,218 | $ | 1,579 | ||||||
Sales and marketing | 4,429 | 2,752 | 1,562 | |||||||||
Research and development | 7,296 | 5,431 | 3,672 | |||||||||
General and administrative | 14,911 | 12,840 | 7,735 | |||||||||
$ | 31,471 | $ | 24,241 | $ | 14,548 | |||||||
40
Year ended December 31, | |||||||||
2016 | 2015 | 2014 | |||||||
(as a percentage of revenues) | |||||||||
Revenues | 100.0 | % | 100.0 | % | 100.0 | % | |||
Cost of revenues | 33.3 | 33.2 | 28.7 | ||||||
Gross profit | 66.7 | 66.8 | 71.3 | ||||||
Operating expenses: | |||||||||
Sales and marketing | 15.2 | 15.0 | 16.4 | ||||||
Research and development | 16.2 | 15.9 | 17.5 | ||||||
General and administrative | 19.8 | 22.5 | 24.4 | ||||||
51.2 | 53.4 | 58.3 | |||||||
Income from operations | 15.5 | 13.4 | 13.0 | ||||||
Other income, net | 0.3 | 0.2 | 0.3 | ||||||
Income before income taxes | 15.8 | 13.6 | 13.3 | ||||||
Income tax provision | 5.3 | 4.8 | 4.2 | ||||||
Net income | 10.5 | % | 8.8 | % | 9.1 | % | |||
Revenues
The following table sets forth our revenues by type for the periods presented:
Year ended December 31, | |||||||||||
2016 | 2015 | 2014 | |||||||||
(in thousands) | |||||||||||
Revenue by type: | |||||||||||
On-demand(1) | $ | 359,567 | $ | 249,871 | $ | 154,315 | |||||
On-premise(1) | 718 | 4,066 | 7,222 | ||||||||
Total | $ | 360,285 | $ | 253,937 | $ | 161,537 | |||||
Year ended December 31, | |||||||||||
2016 | 2015 | 2014 | |||||||||
(as a percentage of revenues) | |||||||||||
Revenue by type: | |||||||||||
On-demand | 100 | % | 98 | % | 96 | % | |||||
On-premise | — | % | 2 | % | 4 | % | |||||
Total | 100 | % | 100 | % | 100 | % | |||||
(1) Certain reclassifications of prior period amounts have been made to conform to the current period presentation, such reclassification did not materially change previously reported consolidated financial statements.
Year Ended December 31, 2016 Compared to Year Ended December 31, 2015. Total revenues increased $106.3 million, or 41.9%, for the year ended December 31, 2016 as compared to the same period of 2015.
On-demand revenues increased by $109.7 million, or 43.9%, during the year ended December 31, 2016, primarily driven by a $70.8 million increase in Encompass revenue. The increase in Encompass revenue was partially attributable to a $44.3 million, or 42.3%, increase in base fees due to a 29.9% increase in contracted users as of December 31, 2016 compared to the same period in 2015, and an increase of $26.5 million in closed loan fees, which are assessed for loans closed in excess of base fees under our Success Based Pricing model. The closed loan fee increase was primarily driven by an increase in contracted users and by higher mortgage origination volumes.
Similarly, the increase in mortgage origination volumes, contracted users and new customers also contributed to a $14.5 million increase in revenues from network transactions due to increased network usage of third party Credit, Flood, Appraisal, and Title services to process loans, a $10.5 million increase in revenues from professional services, driven primarily by
41
implementation and training services provided to new customers, a $15.1 million increase in revenues from other software and services due to increased usage by Encompass users and prior period acquisitions.
On-premise revenues decreased by $3.3 million for the year ended December 31, 2016 compared to the same period of 2015, primarily due to the completion of all on-premise customers’ migration to our on-demand Encompass offering, and we do not expect on-premise revenues in the future.
Year Ended December 31, 2015 Compared to Year Ended December 31, 2014. Total revenues increased $92.4 million, or 57.2%, for the year ended December 31, 2015 as compared to the same period of 2014.
On-demand revenues increased by $95.6 million, or 61.9%, during the year ended December 31, 2015, consisting primarily of a $54.3 million increase in Encompass revenue. The increase in Encompass revenue resulted partially from a $26.6 million, or 34.0% increase in base fees due to a 31.4% increase in contracted users as of December 31, 2015 compared to the same period in 2014. In addition, Encompass revenue increased by $27.7 million due to additional closed loan fees, which are assessed for loans closed in excess of base fees under our Success Based Pricing model. The closed loan fee increases were driven by higher mortgage origination volumes.
Additional contributors to the growth in on-demand revenues were a $12.7 million increase in revenues from AllRegs products and services primarily due to the fact that AllRegs was included in revenues for three months compared to a full year in 2015, a $12.1 million increase in revenues from network transactions due to increased network usage of third party Credit, Flood, Appraisal, and Title services to process loans, a $7.2 million increase in revenues from professional services driven primarily by training and implementation services provided to new customers and to customers that upgraded from on-premise users to SaaS users as well as training revenue related to our annual user conference, a $5.8 million increase in revenues from other software and services mainly due to an increase in TQL adoption and usage by Encompass users, a $1.9 million increase in revenues from stand-alone CenterWise, and a $1.4 million increase due to revenues from our Mortgage Returns acquisition.
On-premise revenues decreased by $3.2 million for the year ended December 31, 2015 compared to the same period of 2014, primarily due to a $3.1 million decrease in software license and maintenance fees as our on-premise customers converted to SaaS Encompass Success Based Pricing users and a $0.1 million decrease in training revenues.
Gross Profit
Year ended December 31, | |||||||||||
2016 | 2015 | 2014 | |||||||||
(in thousands except percentages) | |||||||||||
Gross profit | $ | 240,140 | $ | 169,729 | $ | 115,254 | |||||
Gross margin | 66.7 | % | 66.8 | % | 71.3 | % | |||||
Year Ended December 31, 2016 Compared to Year Ended December 31, 2015. Gross profit increased by $70.4 million and gross margin percentage decreased by 0.1 percentage points during the year ended December 31, 2016 as compared to the same period in 2015. Revenues increased by $106.3 million and cost of revenues increased by $35.9 million. The flat gross margin percentage was a result of an increase in revenue offset by an increase in fixed costs associated with headcount added to our operations and professional services organizations and investments we have made in expanding our data centers, and enhancing data security for our customers. The increase in costs primarily include a $14.5 million increase in salaries, employee benefits, and stock-based compensation expenses associated with additional headcount for our professional services, and customer support organizations in anticipation of continued increasing demand for our software solutions, a $9.0 million increase in third-party royalty expenses arising from the increased revenues, a $7.5 million increase in amortization related to internal-use software and depreciation related to infrastructure hardware, a $4.3 million increase in expenses related to upgrades and services to our data centers hardware and technology as we increase capacity relating to new customers, and a $1.0 million increase third-party services to assist in data security and infrastructure upgrades.
Year Ended December 31, 2015 Compared to Year Ended December 31, 2014. Gross profit increased by $54.5 million and gross margin percentage decreased by 4.5 percentage points during the year ended December 31, 2015 as compared to the same period in 2014. Revenues increased by $92.4 million and cost of revenues increased by $37.9 million. The decrease in the gross margin percentage for 2015 was primarily the result of an increase in fixed costs associated with headcount added to our implementation, professional services, and customer support organizations, investments we have made in expanding our data centers, substantial investment in our network security infrastructure, amortization of internal-use software, and amortization of intangible assets acquired in business combinations. The increase in cost of revenues was primarily due to a $16.4 million increase in salaries, employee benefits, and stock-based compensation expenses associated with additional headcount for our professional services and customer support organizations in anticipation of continued increasing demand for our software solutions and additions
42
to headcount from the AllRegs and Mortgage Returns acquisitions, a $5.9 million increase in third-party royalty expenses arising from the increased revenues, a $4.1 million increase in expenses related to our data centers and technology, a $3.6 million increase in amortization related to internal-use software, a $3.1 million increase in temporary staff and consulting costs, a $3.0 million increase in amortization expenses related to the intangible assets acquired from AllRegs in October 2014 and Mortgage Returns in October 2015, which includes the non-cash impairment charge of $0.6 million related to MortgageCEO’s developed technology, and a $1.8 million increase in rent, utilities, travel, and entertainment expenses.
Sales and Marketing
Year ended December 31, | |||||||||||
2016 | 2015 | 2014 | |||||||||
(in thousands except percentages) | |||||||||||
Sales and marketing | $ | 54,704 | $ | 38,208 | $ | 26,544 | |||||
Sales and marketing as a % of revenues | 15.2 | % | 15.0 | % | 16.4 | % | |||||
Year Ended December 31, 2016 Compared to Year Ended December 31, 2015. Sales and marketing expenses increased by $16.5 million, or 43.2%, for the year ended December 31, 2016 as compared to the same period in 2015. Sales and marketing expenses as a percentage of revenues increased by 0.2% of revenues. The increase in the sales and marketing expenses were primarily due to a $7.9 million increase in salaries, employee benefits, and stock-based compensation expenses related to increased headcount as we continue to grow our sales and marketing departments in an effort to increase our market share and address anticipated demand for our software solutions, a $3.6 million increase in other marketing and promotion expenses, a $2.5 million increase in commissions paid to our sales representatives arising from increased bookings, and a $1.4 million increase in technology, telecom, and travel related expenses.
Year Ended December 31, 2015 Compared to Year Ended December 31, 2014. Sales and marketing expenses increased by $11.7 million, or 43.9%, for the year ended December 31, 2015 as compared to the same period in 2014. Sales and marketing expenses as a percentage of revenues decreased by 1.4% of revenues. The increase in the sales and marketing expenses were primarily due to a $6.1 million increase in salaries, employee benefits, and stock-based compensation expenses related to increased headcount as we continue to grow our sales and marketing departments in an effort to increase our market share and address anticipated demand for our software solutions and additions to headcount from the AllRegs and Mortgage Returns acquisitions, a $2.7 million increase in commissions paid to our sales representatives arising from increased revenues, a $1.2 million increase in marketing expenses as a result of our continued efforts to grow our brand and generate demand for our products, and a $1.2 million increase in technology, telecom expenses, and travel related expenses.
Research and Development
Year ended December 31, | |||||||||||
2016 | 2015 | 2014 | |||||||||
(in thousands except percentages) | |||||||||||
Research and development | $ | 58,501 | $ | 40,451 | $ | 28,228 | |||||
Research and development as a % of revenues | 16.2 | % | 15.9 | % | 17.5 | % | |||||
Year Ended December 31, 2016 Compared to Year Ended December 31, 2015. Research and development expenses increased by $18.1 million, or 44.6%, for the year ended December 31, 2016 compared to the same period in 2015. Research and development expenses as a percentage of revenues increased by 0.3% of revenues. The increase in the research and development expenses were primarily driven by salaries, employee benefits, and stock-based compensation expenses related to increased headcount and fees to contractors as we continue to invest in our products and services.
Year Ended December 31, 2015 Compared to Year Ended December 31, 2014. Research and development expenses increased by $12.2 million, or 43.3%, for the year ended December 31, 2015 as compared to the same period in 2014. Research and development expenses as a percentage of revenues decreased by 1.6% of revenues. The increase in the research and development expenses were primarily driven by salaries, employee benefits, and stock-based compensation expenses related to increased headcount as we continue to invest in our products and services and additions to headcount from the AllRegs and Mortgage Returns acquisitions.
43
General and Administrative
Year ended December 31, | |||||||||||
2016 | 2015 | 2014 | |||||||||
(in thousands except percentages) | |||||||||||
General and administrative | $ | 71,318 | $ | 57,212 | $ | 39,361 | |||||
General and administrative as a % of revenues | 19.8 | % | 22.5 | % | 24.4 | % | |||||
Year Ended December 31, 2016 Compared to Year Ended December 31, 2015. General and administrative expenses increased by $14.1 million, or 24.7%, for the year ended December 31, 2016 as compared to the same period in 2015. General and administrative expenses as a percentage of revenues decreased by 2.7% of revenues. The increase in the general and administrative expenses was primarily due to a $8.5 million increase in salaries, stock-based compensation, and employee benefits related to increased headcount, a $1.9 million increase in third-party services related to system upgrades, a $1.7 million increase related to technology expenses due to increased headcount, and a $1.6 million increase in depreciation and amortization expense related to the release of new systems and depreciation related to internal-use software placed into service.
Year Ended December 31, 2015 Compared to Year Ended December 31, 2014. General and administrative expenses increased by $17.9 million, or 45.4%, for the year ended December 31, 2015 as compared to the same period in 2014. General and administrative expenses as a percentage of revenues decreased by 1.9% of revenues. The increase in the general and administrative expenses was primarily due to a $9.0 million increase in salaries and employee benefits related to increased headcount from hiring and from the Mortgage Returns acquisition, a $5.1 million increase in stock-based compensation expense related to increased headcount and Performance Awards for which expense is recognized on an accelerated basis over the vesting period, as well as changes to the estimated shares of stock-based awards that are expected to vest, a $2.0 million increase in rent and utilities, bank fees, and other charges, a $1.3 million increase related to technology expenses due to increased headcount, and a $1.0 million increase in depreciation expense related mainly to our new office headquarters’ fixed assets, offset by a $0.6 million decrease in professional fees and legal expenses primarily as a result of the amount received from the legal settlement of the arbitration proceeding with the founder of Mortgage CEO.
Other Income, Net
Other income, net includes imputed interest expense related to capital lease obligations and acquisition holdback liabilities, interest income from notes receivable and investments, and realized gains and losses on sales of investments. The amounts were not significant in the years ended December 31, 2016, 2015, and 2014.
Income Taxes
Income tax provision of $18.8 million in 2016 was primarily due to statutory taxes on pretax income of $56.6 million. Income tax provision of $12.2 million in 2015 was primarily due to statutory taxes on pretax income of $34.5 million. Income tax provision of $6.8 million in 2014 was primarily due to statutory taxes on pretax income of $21.6 million.
Our effective tax rate did not significantly differ from the statutory federal rate during the years ended December 31, 2016, 2015, and 2014, although there were offsetting differences between the effective tax rate and statutory federal rate due to non-deductible items and state taxes, offset by benefits related to federal research and development credits.
The valuation allowance increased by $1.2 million in 2016, increased by $1.0 million in 2015, increased by $0.8 million in 2014. We continue to maintain a valuation allowance against the deferred tax assets related to certain state research and development tax credits, the realization of which is uncertain as we expect to generate additional such credits at a faster rate than we are able to utilize them. We will continue to assess the need for a valuation allowance on deferred tax assets by evaluating both positive and negative evidence that may exist. Any adjustment to the deferred tax asset valuation allowance will be recorded in the income statement for the periods that the adjustment is determined to be required.
Liquidity and Capital Resources
As of December 31, 2016, we had cash, cash equivalents, and short-term investments of $422.7 million and long-term investments of $45.9 million. This balance reflects cash proceeds of approximately $271.4 million from the public offering completed in August 2016 of 3,162,500 shares of common stock, net of underwriting discounts, and offering costs and expenses. Cash and cash equivalents consist of cash, money market accounts, and highly liquid investments purchased with an original maturity of three months or less. Both short and long-term investments consist of U.S. government notes, and U.S. government agency securities, corporate bonds and obligations, certificates of deposit and municipal obligations.
44
We believe that our existing cash, cash equivalents, and short-term investments will be sufficient to fund capital expenditures, operating expenses and other cash requirements for at least the next 12 months. We may enter into acquisitions in the future, which could require us to seek additional equity or debt financing. Additional funds may not be available on terms favorable to us or at all.
The following table sets forth our statement of cash flows data for the periods presented:
Year ended December 31, | |||||||||||
2016 | 2015 | 2014 | |||||||||
(in thousands) | |||||||||||
Net cash provided by operating activities | $ | 102,653 | $ | 87,230 | $ | 40,598 | |||||
Net cash used in investing activities | $ | (44,598 | ) | $ | (66,349 | ) | $ | (61,237 | ) | ||
Net cash provided by (used in) financing activities | $ | 288,456 | $ | (13,241 | ) | $ | 13,933 | ||||
Net increase (decrease) in cash and cash equivalents | $ | 346,511 | $ | 7,640 | $ | (6,706 | ) | ||||
Operating Activities
Year Ended December 31, 2016 Compared to Year Ended December 31, 2015. Cash provided by operating activities increased by $15.4 million from $87.2 million in 2015 to $102.7 million in 2016. In the consolidated statements of cash flows, cash provided by operating activities is presented as net income adjusted for non-cash items and changes in operating assets and liabilities. Net income increased by $15.5 million for the year ended December 31, 2016 as compared to the same period in 2015. The net contribution of non-cash items to cash provided by operating activities increased by $23.7 million for the year ended December 31, 2016 as compared to the same period in 2015. The net contribution of changes in operating assets and liabilities to cash provided by operating activities decreased by $23.8 million for the year ended December 31, 2016 as compared to the same period in 2015.
The $23.7 million increase in the net contribution of non-cash items to cash provided by operating activities was primarily due to a $9.6 million increase in amortization from internal-use software placed into service, and depreciation from data center equipment, leasehold improvements, and furniture and fixtures placed into service, a $7.2 million increase in stock-based compensation expense due to increased headcount, a $5.5 million increase in deferred income taxes, a $1.1 million increase in excess tax benefits from stock-based compensation, offset by a $0.6 million change in non-cash impairment loss on intangible assets acquired from MortgageCEO incurred in 2015.
Changes in operating assets and liabilities resulted in a net decrease of $23.8 million to cash provided by operating activities in the year ended December 31, 2016 as compared to the same period in 2015. Our net accounts receivable balance fluctuates from period to period, depending on the amount and timing of sales and billing activity, our customers’ payment method, and cash collections. Additionally, we experienced overall growth in our accounts receivable balance due to increased revenue for the year ended December 31, 2016 as compared to the same period in 2015. The change in prepaid expenses and other current assets was primarily due to the timing of payments for software services and other maintenance. The change in deposits and other assets was due to increased deferred commission expenses associated with continuing sales of our products. The change in accounts payable and accrued and other liabilities was due to an increase in compensation costs associated with increased headcount as well as the timing of additional liabilities and payments in general, and does not reflect any significant change in the nature of accrued liabilities. The increase in deferred revenue is primarily the result of an increase in sales of professional services and timing of customer payments.
Year Ended December 31, 2015 Compared to Year Ended December 31, 2014. Cash provided by operating activities increased by $46.6 million from $40.6 million in 2014 to $87.2 million in 2015. In the consolidated statements of cash flows, cash provided by operating activities is presented as net income adjusted for non-cash items and changes in operating assets and liabilities. Net income increased by $7.4 million for the year ended December 31, 2015 as compared to the same period in 2014. The net contribution of non-cash items to cash provided by operating activities increased by $10.8 million for the year ended December 31, 2015 as compared to the same period in 2014. The net contribution of changes in operating assets and liabilities to cash provided by operating activities increased by $28.3 million for the year ended December 31, 2015 as compared to the same period in 2014.
The $10.8 million increase in the net contribution of non-cash items to cash provided by operating activities was primarily due to a $9.7 million increase in stock-based compensation expense due to increased headcount, a $5.2 million increase in depreciation from data center equipment, internal-use software, leasehold improvements, and furniture and fixtures placed into service, a $2.4 million increase in amortization of intangible assets as a result of the acquisition of AllRegs and Mortgage Returns,
45
a $1.9 million increase in deferred income taxes, offset by a $5.5 million decrease in excess tax benefits stock-based compensation, and a $1.4 million change in non-cash impairment loss on intangible assets acquired from MortgageCEO.
Changes in operating assets and liabilities resulted in a net increase of $28.3 million to cash provided by operating activities in the year ended December 31, 2015 as compared to the same period in 2014. Our net accounts receivable balance fluctuates from period to period, depending on the amount and timing of sales and billing activity, our customers’ payment method, and cash collections. The change in prepaid expenses and other current assets was primarily due to the timing of payments for internal-use software. The change in deposits and other assets was due to deferred commission expenses and timing of the payment for internal-use software. The change in accounts payable and accrued and other liabilities was due to an increase in compensation costs associated with increased headcount as well as the timing of additional liabilities and payments in general, and does not reflect any significant change in the nature of accrued liabilities. The increase in deferred revenue is primarily the result of continued sales of subscriptions following the acquisition of Mortgage Returns and AllRegs and increase in sales of professional services, offset by a decrease in undelivered software maintenance as more customers adopt our SaaS platform which does not include the sale of stand-alone maintenance.
Investing Activities
Our primary investing activities have consisted of purchases and maturities of investments, purchases of property and equipment (including costs incurred to develop internal-use software). Purchases of property and equipment may vary from period to period due to the timing of the expansion of our operations and the timing of our internal-use software projects subject to capitalization. We plan to continue to increase investments in the expansion of our operations and facilities as well as the next generation Encompass platform, and we intend to continue pursuing strategic acquisitions.
Cash used in investing activities of $44.6 million for the year ended December 31, 2016 was primarily the result of $25.2 million in expenditures for purchases of property, including capital improvements to our new corporate headquarters, investments to bolster our infrastructure and enhance our system capacity, reliability, and security, and $35.1 million in expenditures incurred to develop internal-use software and website applications, including the development of our next generation Encompass platform. Additionally, we sold net $15.7 million of investments to fund these expenditures.
Cash used in investing activities of $66.3 million for the year ended December 31, 2015 was primarily the result of $52.3 million for purchases of property and equipment and costs incurred to develop internal-use software and website applications, cash payments of $16.4 million for the Mortgage Returns acquisition, offset in part by $2.4 million net proceeds from maturities of investments.
Cash used in investing activities of $61.2 million for the year ended December 31, 2014 was the result of $19.8 million for purchases of property and equipment and costs incurred to develop internal-use software and website applications, $6.8 million in net purchases of investments, cash payments of $28.1 million and $4.5 million for the AllRegs and MortgageCEO acquisitions, respectively, and the final $2.0 million payment of the holdback from the acquisition of Del Mar Datatrac, Inc.
Financing Activities
Financing activities have consisted primarily of cash provided from the exercise of stock options and purchases under the employee stock purchase plan and excess tax benefits from stock-based compensation, reduced by the payments related to capital lease obligations, repurchases of common stock and tax payments related to shares withheld for vested restricted stock units, or RSUs. In August 2016, we completed a public offering of common stock and sold a total of 3,162,500 shares of our common stock for total cash proceeds of approximately $271.4 million, net of underwriting discounts, and offering costs and expenses of approximately $13.2 million, which will be used for general corporate purposes, including working capital, sales and marketing activities, general and administrative matters and capital expenditures and may also use a portion of the net proceeds for the acquisition of, or investment in, technologies, solutions or businesses that complement our business. In May 2014, our board of directors approved a stock repurchase program under which we are authorized to repurchase up to $75.0 million of our common stock over a 36-month period ending in May 2017, $42.8 million of which remains available as of December 31, 2016. Under the program, purchases may be made from time to time on the open market, and will be funded from available working capital.
Cash provided by financing activities of $288.5 million for the year ended December 31, 2016 consisted primarily of $271.4 million in net proceeds from our August 2016 public offering of 3,162,500 shares of common stock, $17.3 million in proceeds from employee stock purchases and the exercise of stock options, $10.2 million in excess tax benefits from stock-based compensation, partially offset by tax payments of $6.0 million related to shares withheld for vested RSUs, payments on capital leases of $3.8 million and $0.7 million in common stock repurchases.
46
Cash used in financing activities of $13.2 million for the year ended December 31, 2015 consisted primarily of $31.5 million in common stock repurchases, payments on capital leases of $3.7 million, and tax payments of $3.6 million related to shares withheld for vested RSUs, offset in part by $14.2 million in proceeds from the exercise of stock options and $11.4 million in excess tax benefits from stock-based compensation.
Cash provided by financing activities of $13.9 million for the year ended December 31, 2014 consisted primarily of $10.2 million in proceeds from the exercise of stock options and $5.9 million in excess tax benefits from employee exercises of stock options, offset in part by tax payments of $0.9 million related to shares withheld for vested restricted stock units and payments on capital leases of $1.2 million.
Off Balance Sheet Arrangements
As of December 31, 2016, we had no off-balance sheet arrangements and operating leases were the only financing arrangements not reported on our consolidated financial statements.
Contractual Obligations
At December 31, 2016, our contractual payment obligations are as follows:
Payment due by period (as of December 31, 2016) | |||||||||||||||||||
Total | Less than 1 year | 1-3 years | 3-5 years | More than 5 years | |||||||||||||||
(in thousands) | |||||||||||||||||||
Capital lease obligations | $ | 720 | $ | 633 | $ | 87 | $ | — | $ | — | |||||||||
Operating lease obligations | 94,268 | 6,167 | 20,804 | 21,814 | 45,483 | ||||||||||||||
Purchase obligations | 11,405 | 6,244 | 5,161 | — | — | ||||||||||||||
Total | $ | 106,393 | $ | 13,044 | $ | 26,052 | $ | 21,814 | $ | 45,483 | |||||||||
Purchase obligations are associated with agreements that are enforceable and legally binding and that specify all significant terms, including: fixed or minimum services to be used; fixed, minimum or variable price provisions; and the approximate timing of the transaction. Purchase obligations include non-cancelable contractual obligations for the purchase of goods and services, licenses of third-party software, sponsorships, and construction commitments. Obligations under contracts that we can cancel without a significant penalty are not included in the table above. See Note 8 of the Notes to Consolidated Financial Statements.
Recent Accounting Pronouncements
See Note 2 of the Notes to Consolidated Financial Statements for a full description of recent accounting pronouncements, including the expected dates of adoption and estimated effects on results of operations and financial condition, which is incorporated herein by reference.
ITEM 7A. | QUANTITATIVE AND QUALITATIVE DISCLOSURES ABOUT MARKET RISK |
We are exposed to market risks in the ordinary course of our business. These risks primarily include interest rate risks and inflation.
Interest Rate Fluctuation Risk
We do not have any long-term borrowings.
Our investments include cash, cash equivalents, and both short-term and long-term investments including investment-grade interest-bearing securities, such as money market accounts, certificates of deposit, commercial paper, corporate bonds, municipal and government agency obligations, and guaranteed obligations of the U.S. government. The primary objective of our investment activities is to preserve principal while maximizing income without significantly increasing risk. We do not enter into investments for trading or speculative purposes. Our investments are exposed to market risk due to a fluctuation in interest rates, which may affect our interest income and the fair market value of our investments.
A hypothetical increase in interest rates of 1.0% would have resulted in a decrease in the fair value of our investment portfolio of $1.1 million as of December 31, 2016. The fluctuations in fair value of our investment portfolio reflect only the direct impact of the change in interest rates. Other economic variables, such as equity market fluctuations and changes in relative credit risk,
47
could result in a significantly higher decline in the fair value of our net investment position. For further information on how credit risk is factored into the valuation of our investment portfolio see Note 4 of the Notes to Consolidated Financial Statements.
Inflation Risk
We do not believe that inflation has had a material effect on our business, financial condition or results of operations. If our costs were to become subject to significant inflationary pressures, we may not be able to fully offset such higher costs through price increases. Our inability or failure to do so could harm our business, financial condition and results of operations.
48
ITEM 8. | FINANCIAL STATEMENTS AND SUPPLEMENTARY DATA |
Index to Consolidated Financial Statements | |
Page | |
All other schedules are omitted because they are not applicable or the required information is shown in the consolidated financial statements or notes thereto.
49
Report of Independent Registered Public Accounting Firm
Board of Directors and Shareholders
Ellie Mae, Inc.
We have audited the accompanying consolidated balance sheets of Ellie Mae, Inc. (a Delaware corporation) and subsidiaries (the “Company”) as of December 31, 2016 and 2015, and the related consolidated statements of comprehensive income, stockholders’ equity, and cash flows for each of the three years in the period ended December 31, 2016. Our audits of the basic consolidated financial statements included the financial statement schedule listed in the index appearing under Item 15(a)(2). These financial statements and financial statement schedule are the responsibility of the Company’s management. Our responsibility is to express an opinion on these financial statements and financial statement schedule based on our audits.
We conducted our audits in accordance with the standards of the Public Company Accounting Oversight Board (United States). Those standards require that we plan and perform the audit to obtain reasonable assurance about whether the financial statements are free of material misstatement. An audit includes examining, on a test basis, evidence supporting the amounts and disclosures in the financial statements. An audit also includes assessing the accounting principles used and significant estimates made by management, as well as evaluating the overall financial statement presentation. We believe that our audits provide a reasonable basis for our opinion.
In our opinion, the consolidated financial statements referred to above present fairly, in all material respects, the financial position of Ellie Mae, Inc. and subsidiaries as of December 31, 2016 and 2015, and the results of their operations and their cash flows for each of the three years in the period ended December 31, 2016, in conformity with accounting principles generally accepted in the United States of America. Also in our opinion, the related financial statement schedule, when considered in relation to the basic consolidated financial statements taken as a whole, presents fairly, in all material respects, the information set forth therein.
We also have audited, in accordance with the standards of the Public Company Accounting Oversight Board (United States), the Company’s internal control over financial reporting as of December 31, 2016, based on criteria established in the 2013 Internal Control - Integrated Framework issued by the Committee of Sponsoring Organizations of the Treadway Commission (COSO), and our report dated February 21, 2017 expressed an unqualified opinion.
/s/ GRANT THORNTON LLP
San Francisco, CA
February 21, 2017
50
Report of Independent Registered Public Accounting Firm
Board of Directors and Shareholders
Ellie Mae, Inc.
We have audited the internal control over financial reporting of Ellie Mae, Inc. (a Delaware corporation) and subsidiaries (the “Company”) as of December 31, 2016, based on criteria established in the 2013 Internal Control - Integrated Framework issued by the Committee of Sponsoring Organizations of the Treadway Commission (COSO). The Company’s management is responsible for maintaining effective internal control over financial reporting and for its assessment of the effectiveness of internal control over financial reporting, included in the accompanying Management Report on Internal Control over Financial Reporting (“Management’s Report”). Our responsibility is to express an opinion on the Company’s internal control over financial reporting based on our audit.
We conducted our audit in accordance with the standards of the Public Company Accounting Oversight Board (United States). Those standards require that we plan and perform the audit to obtain reasonable assurance about whether effective internal control over financial reporting was maintained in all material respects. Our audit included obtaining an understanding of internal control over financial reporting, assessing the risk that a material weakness exists, testing and evaluating the design and operating effectiveness of internal control based on the assessed risk, and performing such other procedures as we considered necessary in the circumstances. We believe that our audit provides a reasonable basis for our opinion.
A company’s internal control over financial reporting is a process designed to provide reasonable assurance regarding the reliability of financial reporting and the preparation of financial statements for external purposes in accordance with generally accepted accounting principles. A company’s internal control over financial reporting includes those policies and procedures that (1) pertain to the maintenance of records that, in reasonable detail, accurately and fairly reflect the transactions and dispositions of the assets of the company; (2) provide reasonable assurance that transactions are recorded as necessary to permit preparation of financial statements in accordance with generally accepted accounting principles, and that receipts and expenditures of the company are being made only in accordance with authorizations of management and directors of the company; and (3) provide reasonable assurance regarding prevention or timely detection of unauthorized acquisition, use, or disposition of the company’s assets that could have a material effect on the financial statements.
Because of its inherent limitations, internal control over financial reporting may not prevent or detect misstatements. Also, projections of any evaluation of effectiveness to future periods are subject to the risk that controls may become inadequate because of changes in conditions, or that the degree of compliance with the policies or procedures may deteriorate.
In our opinion, the Company maintained, in all material respects, effective internal control over financial reporting as of December 31, 2016, based on criteria established in the 2013 Internal Control - Integrated Framework issued by COSO.
We also have audited, in accordance with the standards of the Public Company Accounting Oversight Board (United States), the consolidated financial statements of the Company as of and for the year ended December 31, 2016, and our report dated February 21, 2017 expressed an unqualified opinion on those financial statements.
/s/ GRANT THORNTON LLP
San Francisco, CA
February 21, 2017
51
Ellie Mae, Inc. | |||||||
CONSOLIDATED BALANCE SHEETS | |||||||
(in thousands, except share and per share amounts) | |||||||
December 31, | |||||||
2016 | 2015 | ||||||
Assets | |||||||
Current assets: | |||||||
Cash and cash equivalents | $ | 380,907 | $ | 34,396 | |||
Short-term investments | 41,841 | 48,975 | |||||
Accounts receivable, net of allowance for doubtful accounts of $45 and $124 as of December 31, 2016 and December 31, 2015, respectively | 39,358 | 28,568 | |||||
Prepaid expenses and other current assets | 15,209 | 9,874 | |||||
Total current assets | 477,315 | 121,813 | |||||
Property and equipment, net | 126,297 | 81,360 | |||||
Long-term investments | 45,931 | 55,473 | |||||
Intangible assets, net | 17,289 | 22,810 | |||||
Deposits and other assets | 10,138 | 8,888 | |||||
Goodwill | 74,547 | 74,547 | |||||
Total assets | $ | 751,517 | $ | 364,891 | |||
Liabilities and Stockholders’ Equity | |||||||
Current liabilities: | |||||||
Accounts payable | $ | 15,942 | $ | 9,911 | |||
Accrued and other current liabilities | 39,809 | 37,307 | |||||
Deferred revenue | 23,126 | 15,864 | |||||
Total current liabilities | 78,877 | 63,082 | |||||
Leases payable, net of current portion | 85 | 685 | |||||
Other long-term liabilities | 17,647 | 10,273 | |||||
Total liabilities | 96,609 | 74,040 | |||||
Commitments and contingencies (Note 8) | |||||||
Stockholders’ equity: | |||||||
Common stock, $0.0001 par value per share; 140,000,000 authorized shares, 33,685,649 and 29,566,511 shares issued and outstanding as of December 31, 2016 and December 31, 2015, respectively | 3 | 3 | |||||
Additional paid-in capital | 612,098 | 285,342 | |||||
Accumulated other comprehensive loss | (219 | ) | (257 | ) | |||
Retained earnings | 43,026 | 5,763 | |||||
Total stockholders’ equity | 654,908 | 290,851 | |||||
Total liabilities and stockholders’ equity | $ | 751,517 | $ | 364,891 | |||
See accompanying notes to these consolidated financial statements.
52
Ellie Mae, Inc. | |||||||||||
CONSOLIDATED STATEMENTS OF COMPREHENSIVE INCOME | |||||||||||
(in thousands, except share and per share amounts) | |||||||||||
Year ended December 31, | |||||||||||
2016 | 2015 | 2014 | |||||||||
Revenues | $ | 360,285 | $ | 253,937 | $ | 161,537 | |||||
Cost of revenues | 120,145 | 84,208 | 46,283 | ||||||||
Gross profit | 240,140 | 169,729 | 115,254 | ||||||||
Operating expenses: | |||||||||||
Sales and marketing | 54,704 | 38,208 | 26,544 | ||||||||
Research and development | 58,501 | 40,451 | 28,228 | ||||||||
General and administrative | 71,318 | 57,212 | 39,361 | ||||||||
Total operating expenses | 184,523 | 135,871 | 94,133 | ||||||||
Income from operations | 55,617 | 33,858 | 21,121 | ||||||||
Other income, net | 989 | 619 | 488 | ||||||||
Income before income taxes | 56,606 | 34,477 | 21,609 | ||||||||
Income tax provision | 18,830 | 12,219 | 6,786 | ||||||||
Net income | $ | 37,776 | $ | 22,258 | $ | 14,823 | |||||
Net income per share of common stock: | |||||||||||
Basic | $ | 1.21 | $ | 0.76 | $ | 0.53 | |||||
Diluted | $ | 1.15 | $ | 0.72 | $ | 0.50 | |||||
Weighted average common shares used in computing net income per share of common stock: | |||||||||||
Basic | 31,179,857 | 29,179,352 | 27,858,828 | ||||||||
Diluted | 32,799,785 | 30,842,584 | 29,593,873 | ||||||||
Net income | $ | 37,776 | $ | 22,258 | $ | 14,823 | |||||
Other comprehensive income (loss), net of taxes: | |||||||||||
Unrealized gain (loss) on investments | 38 | (162 | ) | (61 | ) | ||||||
Comprehensive income | $ | 37,814 | $ | 22,096 | $ | 14,762 | |||||
See accompanying notes to these consolidated financial statements.
53
Ellie Mae, Inc.
CONSOLIDATED STATEMENTS OF STOCKHOLDERS’ EQUITY
(in thousands, except share amounts)
Accumulated | ||||||||||||||||||||||
Additional | Other | Total | ||||||||||||||||||||
Common Stock | Paid-in | Comprehensive | Retained | Stockholders' | ||||||||||||||||||
Shares | Amount | Capital | Income (Loss) | Earnings (Accumulated Deficit) | Equity | |||||||||||||||||
Balances, December 31, 2013 | 27,624,025 | $ | 3 | $ | 212,332 | $ | (34 | ) | $ | (4,374 | ) | $ | 207,927 | |||||||||
Issuance of common stock under stock incentive plans | 1,210,435 | — | 7,537 | — | — | 7,537 | ||||||||||||||||
Shares withheld for employee taxes related to vested restricted stock units | (29,424 | ) | — | (902 | ) | — | — | (902 | ) | |||||||||||||
Issuance of common stock under employee stock purchase plan | 102,111 | — | 2,624 | — | — | 2,624 | ||||||||||||||||
Stock-based compensation | — | — | 15,084 | — | — | 15,084 | ||||||||||||||||
Excess tax benefit from stock-based compensation | — | — | 5,852 | — | — | 5,852 | ||||||||||||||||
Unrealized losses on investments | — | — | — | (61 | ) | — | (61 | ) | ||||||||||||||
Net income | — | — | — | — | 14,823 | 14,823 | ||||||||||||||||
Balances, December 31, 2014 | 28,907,147 | 3 | 242,527 | (95 | ) | 10,449 | 252,884 | |||||||||||||||
Issuance of common stock under stock incentive plans | 1,109,013 | — | 10,094 | — | — | 10,094 | ||||||||||||||||
Shares withheld for employee taxes related to vested restricted stock units | (56,797 | ) | — | (3,552 | ) | — | — | (3,552 | ) | |||||||||||||
Issuance of common stock under employee stock purchase plan | 110,598 | — | 4,105 | — | — | 4,105 | ||||||||||||||||
Stock-based compensation | — | — | 25,367 | — | — | 25,367 | ||||||||||||||||
Excess tax benefit from stock-based compensation | — | — | 11,387 | — | — | 11,387 | ||||||||||||||||
Stock repurchase | (503,450 | ) | — | (4,586 | ) | — | (26,944 | ) | (31,530 | ) | ||||||||||||
Unrealized losses on investments | — | — | — | (162 | ) | — | (162 | ) | ||||||||||||||
Net income | — | — | — | — | 22,258 | 22,258 | ||||||||||||||||
Balances, December 31, 2015 | 29,566,511 | 3 | 285,342 | (257 | ) | 5,763 | 290,851 | |||||||||||||||
Issuance of common stock under stock incentive plans | 934,234 | — | 10,573 | — | — | 10,573 | ||||||||||||||||
Issuance of common stock in public offering, net of issuance costs | 3,162,500 | — | 271,309 | — | — | 271,309 | ||||||||||||||||
Shares withheld for employee taxes related to vested restricted stock units | (71,079 | ) | — | (5,976 | ) | — | — | (5,976 | ) | |||||||||||||
Issuance of common stock under employee stock purchase plan | 101,816 | — | 6,724 | — | — | 6,724 | ||||||||||||||||
Stock-based compensation | — | — | 34,302 | — | — | 34,302 | ||||||||||||||||
Excess tax benefit from stock-based compensation | — | — | 9,974 | — | — | 9,974 | ||||||||||||||||
Stock repurchase | (8,333 | ) | — | (150 | ) | — | (513 | ) | (663 | ) | ||||||||||||
Unrealized gains on investments | — | — | — | 38 | — | 38 | ||||||||||||||||
Net income | — | — | — | — | 37,776 | 37,776 | ||||||||||||||||
Balances, December 31, 2016 | 33,685,649 | $ | 3 | $ | 612,098 | $ | (219 | ) | $ | 43,026 | $ | 654,908 | ||||||||||
See accompanying notes to these consolidated financial statements.
54
Ellie Mae, Inc.
CONSOLIDATED STATEMENTS OF CASH FLOWS
(in thousands)
Year ended December 31, | |||||||||||
2016 | 2015 | 2014 | |||||||||
CASH FLOWS FROM OPERATING ACTIVITIES: | |||||||||||
Net income | $ | 37,776 | $ | 22,258 | $ | 14,823 | |||||
Adjustments to reconcile net income to net cash provided by operating activities: | |||||||||||
Depreciation and amortization | 20,460 | 10,842 | 5,605 | ||||||||
Amortization of intangible assets | 5,521 | 5,180 | 2,779 | ||||||||
Impairment loss on intangible assets | — | 562 | 1,968 | ||||||||
Amortization of discount related to acquisition holdback | — | — | 36 | ||||||||
Legal settlement | — | (522 | ) | — | |||||||
Stock-based compensation expense | 31,471 | 24,241 | 14,548 | ||||||||
Excess tax benefit from stock-based compensation | (10,246 | ) | (11,387 | ) | (5,852 | ) | |||||
Impairment and loss on sale of property and equipment | 5 | 97 | 693 | ||||||||
Deferred income taxes | 7,784 | 2,255 | 395 | ||||||||
Amortization of investment premium | 1,024 | 1,033 | 1,280 | ||||||||
Changes in operating assets and liabilities: | |||||||||||
Accounts receivable, net | (10,791 | ) | (7,943 | ) | (8,379 | ) | |||||
Prepaid expenses and other current assets | (5,334 | ) | 1,381 | (4,867 | ) | ||||||
Deposits and other assets | (3,464 | ) | (1,985 | ) | (1,146 | ) | |||||
Accounts payable | 3,678 | 290 | 2,675 | ||||||||
Accrued, other current and other liabilities | 17,585 | 35,079 | 13,436 | ||||||||
Deferred revenue | 7,184 | 5,849 | 2,604 | ||||||||
Net cash provided by operating activities | 102,653 | 87,230 | 40,598 | ||||||||
CASH FLOWS FROM INVESTING ACTIVITIES: | |||||||||||
Acquisition of property and equipment | (25,191 | ) | (24,768 | ) | (6,813 | ) | |||||
Acquisition of internal-use software | (35,097 | ) | (27,608 | ) | (13,021 | ) | |||||
Proceeds from sale of property and equipment | — | 58 | — | ||||||||
Purchases of investments | (62,533 | ) | (60,816 | ) | (64,748 | ) | |||||
Maturities of investments | 58,223 | 63,204 | 57,986 | ||||||||
Sale of investments | 20,000 | — | — | ||||||||
Cash paid for acquisitions, net of cash acquired | — | (16,419 | ) | (34,641 | ) | ||||||
Net cash used in investing activities | (44,598 | ) | (66,349 | ) | (61,237 | ) | |||||
CASH FLOWS FROM FINANCING ACTIVITIES: | |||||||||||
Payment of capital lease obligations | (3,827 | ) | (3,745 | ) | (1,178 | ) | |||||
Proceeds from issuance of common stock under employee stock plans | 17,297 | 14,199 | 10,161 | ||||||||
Proceeds from issuance of common stock in public offering, net of issuance costs | 271,379 | — | — | ||||||||
Payments for repurchase of common stock | (663 | ) | (31,530 | ) | — | ||||||
Tax payments related to shares withheld for vested restricted stock units | (5,976 | ) | (3,552 | ) | (902 | ) | |||||
Excess tax benefit from stock-based compensation | 10,246 | 11,387 | 5,852 | ||||||||
Net cash provided by (used in) financing activities | 288,456 | (13,241 | ) | 13,933 | |||||||
NET INCREASE (DECREASE) IN CASH AND CASH EQUIVALENTS | 346,511 | 7,640 | (6,706 | ) | |||||||
CASH AND CASH EQUIVALENTS, Beginning of period | 34,396 | 26,756 | 33,462 | ||||||||
CASH AND CASH EQUIVALENTS, End of period | $ | 380,907 | $ | 34,396 | $ | 26,756 | |||||
55
Ellie Mae, Inc.
CONSOLIDATED STATEMENTS OF CASH FLOWS - (continued)
(in thousands)
Year ended December 31, | |||||||||||
2016 | 2015 | 2014 | |||||||||
Supplemental disclosure of cash flow information: | |||||||||||
Cash paid for interest | $ | 294 | $ | 133 | $ | 40 | |||||
Cash paid for income taxes | $ | 267 | $ | 104 | $ | 126 | |||||
Supplemental disclosure of non-cash investing and financing activities: | |||||||||||
Fixed asset purchases not yet paid | $ | 5,945 | $ | 3,662 | $ | 921 | |||||
Stock-based compensation capitalized to property and equipment | $ | 2,831 | $ | 1,126 | $ | 534 | |||||
Acquisition of property and equipment under capital leases | $ | — | $ | 6,998 | $ | 1,269 | |||||
See accompanying notes to these consolidated financial statements.
56
Ellie Mae, Inc.
NOTES TO CONSOLIDATED FINANCIAL STATEMENTS
NOTE 1—Description of Business
Ellie Mae, Inc. (“Ellie Mae,” “the Company,” “we,” “our” or “us”) is a leading provider of innovative on-demand software solutions and services for the residential mortgage industry in the United States. Banks, credit unions and mortgage lenders use the Company’s Encompass® all-in-one mortgage management solution to originate and fund mortgages and improve compliance, loan quality, and efficiency.
NOTE 2—Basis of Presentation and Significant Accounting Policies
Principles of Consolidation
The consolidated financial statements include the accounts of the Company and its wholly-owned subsidiaries. All intercompany balances and transactions have been eliminated.
Applicable Accounting Guidance
Any reference in these notes to applicable accounting guidance is meant to refer to the authoritative generally accepted accounting principles in the United States (“U.S. GAAP”), as found in the Financial Accounting Standards Board’s (“FASB”) Accounting Standards Codification (“ASC”).
Use of Estimates
The preparation of consolidated financial statements in conformity with U.S. GAAP requires management to make estimates and assumptions that affect the reported amounts of assets and liabilities and disclosure of contingent assets and liabilities at the date of the financial statements and the reported amounts of revenues and expenses during the reporting period. Management evaluates estimates on a regular basis including those relating to revenue recognition, allowance for doubtful accounts, goodwill, intangible assets, valuation of deferred income taxes, stock-based compensation, and unrecognized tax benefits, among others. Actual results could differ from those estimates and such differences may have a material impact on the Company’s consolidated financial statements and footnotes.
Cash and Cash Equivalents
All highly liquid investments with original maturities of 90 days or less are considered to be cash equivalents. Cash equivalents are recorded at cost, which approximates fair value.
Investments and Fair Value Measurement of Financial Instruments
The fair values of the Company’s cash equivalents, accounts receivable, and accounts payable approximate their carrying values due to the short maturities of the instruments. The fair value of the Company’s capital lease obligations approximates the carrying value due to the terms continuing to approximate prevailing market terms.
All of the Company’s investments that have maturities of greater than 90 days are classified as available-for-sale and are carried at fair value. The Company invests excess cash primarily in investment-grade interest-bearing securities, such as money market accounts, certificates of deposit, commercial paper, corporate bonds, municipal and government agency obligations, and guaranteed obligations of the U.S. government. Fair value is determined based on quoted market rates when observable or utilizing data points that are observable, such as quoted prices, interest rates, and yield curves. The cost of available-for-sale marketable securities sold is based on the specific identification method. Unrealized gains and losses are reported in stockholders’ equity as accumulated other comprehensive income (loss). Realized gains and losses are included in other income (expense), net. Interest and dividends are included in other income (expense), net when they are earned.
Accounts Receivable and Allowance for Doubtful Accounts
Trade accounts receivable consist of amounts billed to customers in connection with sale of services. The Company analyzes individual trade accounts receivable by considering historical bad debts, customer creditworthiness, current economic trends, changes in customer payment terms, and collection trends when evaluating the adequacy of the allowance for doubtful accounts. Allowances for doubtful accounts are recognized in the period in which the associated receivable balance is not considered recoverable. Any change in the assumptions used in analyzing accounts receivable may result in changes to the allowance for doubtful accounts and is recognized in the period in which the change occurs. The Company writes off a receivable when all rights,
57
remedies, and recourse against the account and its principals are exhausted and records a benefit when previously reserved accounts are collected.
Concentration of Credit Risk
The financial instruments that potentially expose the Company to concentrations of credit risk consist primarily of cash and cash equivalents, investments, and accounts receivable. The Company’s cash and cash equivalents are deposited with major financial institutions in the United States. At times, such deposits may be in excess of federally insured limits. Management believes that the Company’s investments in cash equivalents and available-for-sale investments are financially sound. The Company’s accounts receivable are derived from revenue earned from customers located in the United States. The Company had no customers that represented 10% or more of revenues for the years ended December 31, 2016, 2015, and 2014. No customer represented more than 10% of accounts receivable as of December 31, 2016 and 2015.
Software and Website Development Costs
The Company capitalizes internal and external costs incurred to develop internal-use software and website applications. Capitalized internal costs include salaries, benefits, and stock-based compensation charges for employees that are directly involved in developing the software or website application, and depreciation of assets used in the development process. Capitalized external costs include third-party consultants involved in the development process, as well as other direct costs incurred therein.
Capitalization of costs begins when the preliminary project stage has been completed, management authorizes and commits to funding a project and it is probable that the project will be completed and the software or website application will be used to perform the function intended. Internal and external costs incurred as part of the preliminary project stage are expensed as incurred.
Capitalization ceases at the point at which the project is substantially complete and ready for its intended use. Internal and external training costs and maintenance costs during the post-implementation operation stage are expensed as incurred.
Internal-developed core software is amortized on a straight-line basis over its estimated useful life, generally three to five years. Amortization of product related internal-use software and website applications is typically recorded to cost of revenues, and amortization of other internal-use software and website applications is typically recorded to the operating expense line to which it most closely relates. Management evaluates the useful lives of these assets on an annual basis and tests for impairment whenever events or changes in circumstances occur that could impact the recoverability of these assets. The capitalized costs are included in property and equipment, net in the accompanying consolidated balance sheets. For the years ended December 31, 2016, 2015 and 2014, the Company capitalized software and website application development costs of $38.5 million, $29.4 million, and $15.9 million, respectively.
During the year ended December 31, 2014, the Company recorded a $0.7 million impairment loss on the write-off of internal-use software. There were no such write-offs during the years ended December 31, 2016 and 2015.
Property and Equipment
Property and equipment are stated at cost less accumulated depreciation and are depreciated on a straight-line basis over their estimated useful lives, which is generally three to seven years. Leasehold improvements are amortized on a straight-line basis over their estimated useful lives or over the term of the lease, whichever is shorter.
Business Combinations
The Company recognizes and measures the identifiable assets acquired in a business combination, the liabilities assumed and any non-controlling interest in the acquiree, at their fair values as of the acquisition date. The Company recognizes contingent consideration arrangements at their acquisition-date fair values with subsequent changes in fair value reflected in earnings, recognizes pre-acquisition loss and gain contingencies at their acquisition-date fair values, capitalizes in-process research and development assets and expenses acquisition-related transaction costs as incurred. Due to the inherent uncertainty in the estimates and assumptions used by the Company in its fair value measurements, recorded amounts may be subject to refinement. During the measurement period, which may be up to one year from the acquisition date, the Company may record adjustments to the fair value of assets acquired and liabilities assumed, with the corresponding offset to goodwill. Any subsequent adjustments, including changes in accounting for deferred tax asset valuation allowances and acquired income tax uncertainties after the measurement period, are recognized in current period earnings.
Goodwill
The Company records goodwill in a business combination when the consideration paid exceeds the fair value of the identifiable net assets acquired. Goodwill is not amortized, but is tested for impairment at least annually, or whenever changes in circumstances indicate that the fair value of a reporting unit is less than its carrying amount, including goodwill. The annual test is performed at
58
the reporting unit level using a fair-value based approach. The Company’s operations are organized as one reporting unit. In testing for a potential impairment of goodwill, the Company first compares the net aggregate carrying value of assets and liabilities to the aggregate estimated fair value of the Company. If estimated fair value is less than carrying value, then potential impairment exists. The amount of any impairment is then calculated by determining the implied fair value of goodwill using a hypothetical purchase price allocation. Impairment is equivalent to any excess of goodwill carrying value over its implied fair value. There were no impairment charges related to goodwill during the years ended December 31, 2016, 2015, and 2014.
The process of evaluating the potential impairment of goodwill requires significant judgment at many points during the analysis, including calculating fair value of the reporting unit based on estimated future cash flows and discount rates to be applied.
Intangible Assets
Intangible assets are stated at cost less accumulated amortization. Intangible assets include developed technology, trade names, and customer lists and contracts. Intangible assets with finite lives are amortized on a straight-line basis over the estimated periods of benefit, as follows:
Developed technology | 2-5 years |
Trade names with finite lives | 2-3 years |
Customer lists and contracts | 4-9 years |
The AllRegs tradename is the only intangible asset with an indefinite useful life. The Company evaluates the remaining useful life of indefinite-lived intangible assets each reporting period to determine whether events and circumstances continue to support an indefinite useful life. The Company test intangible assets with indefinite lives at least annually or if events or circumstances indicate that such assets might be impaired. If potential impairment exists, the amount of any impairment is calculated by using a discounted cash flow model, which is based on the assumptions the Company believe hypothetical marketplace participants would use. For indefinite-lived intangible assets, other than goodwill, if the carrying amount exceeds the fair value, an impairment charge is recognized in an amount equal to that excess.
The Company evaluates its finite-lived intangible assets for impairment whenever events or changes in circumstances indicate that the carrying amount of such assets may not be recoverable. Recoverability of assets to be held and used is measured by a comparison of the carrying amount of an asset or asset group to future undiscounted net cash flows expected to be generated by the asset or asset group. If such assets or asset groups are considered to be impaired, the impairment loss to be recognized is measured by the amount by which the carrying amounts of the assets or asset groups exceed the fair value of the assets or asset groups. Assets to be disposed of are reported at the lower of the carrying amount and fair value less costs to sell. Except as described in Note 6, there has been no loss on impairment or disposal of intangible assets.
Impairment of Long-Lived Assets
The Company evaluates its long-lived assets for indications of possible impairment whenever events or changes in circumstances indicate that the carrying amount of an asset may not be recoverable. Except for the impairment losses recorded on internal-use software and intangible assets described elsewhere in this note, there has been no loss on impairment or disposal of long-lived assets.
Revenue Recognition
The Company generates revenue primarily from transaction-based fees and fees for software and related services, including its annual user conference and fees from professional services. On-demand revenue is generated from company-hosted software subscriptions that customers access through the Internet. On-demand revenue is comprised of fees for software services sold both as a subscription and transactionally, including fees based on a per closed loan, or success basis, subject to monthly base fees, which the Company refers to as Success Based Pricing; Ellie Mae Network fees; education and training, loan product, policy and guideline data and analytics services under the AllRegs brand; and professional services which include consulting, implementation, and training services. On-premise revenue is generated from maintenance services, sales of customer-hosted Encompass software licenses, and related professional services. As of June 30, 2016, the Company completed the migration of customers to its on-demand Encompass offering, and the Company does not expect on-premise revenues in the future. Sales taxes assessed by governmental authorities are excluded from revenue.
The Company commences revenue recognition when all of the following conditions are satisfied:
•There is persuasive evidence of an arrangement;
•The service has been or is being provided to the customer;
59
•The collection of the fees is reasonably assured; and
•The amount of fees to be paid by the customer is fixed or determinable.
On-Demand Revenues
Subscription Services and Usage-Based Fee Arrangements. Subscription services and usage-based fee arrangements generally include a combination of the Company’s products delivered as software-as-a-service (“SaaS”) and support services. These arrangements are generally non-cancelable and do not contain refund-type provisions. This revenue typically includes the following:
Encompass Revenue. The Company offers web-based, on-demand access to Encompass software for a monthly recurring fee. The Company provides the right to access its loan origination software and handles the responsibility of managing the servers, providing security, backing up the data and applying updates. Customers under SaaS arrangements do not take possession of the software at any time during the term of the agreement. Subscription revenue is recognized ratably over the contract terms as subscription services are provided, beginning on the commencement date of each contract, which is the date the Company’s service is made available to customers. Contracts generally range from one year to five years.
Alternatively, customers can elect to pay on a success basis. Success basis contracts generally have a term of one to five years and are subject to monthly base fees, which enable customers to close loans up to a contractually agreed-to minimum number of transactions, and additional closed loan fees, which are assessed for loans closed in excess of the minimum. Revenue is earned from both base fees and additional closed loan fees as the result of the customer’s usage of Encompass. Monthly base fees are recognized over the respective monthly service period as the subscription services are provided. Additional closed loans fees are recognized when the loans are reported as closed. This offering also includes Encompass CenterWise, Encompass Compliance Service, and Encompass Docs Solution as integrated components, which are combined elements of the arrangement that are delivered in conjunction with the Encompass offering and therefore are not accounted for separately.
Services Revenue. The Company provides a variety of mortgage-related and other business services, including automated documentation; fraud detection, valuation, validation, and risk analysis; income verification; marketing and customer relationship management; product and pricing; flood zone certifications; website and electronic document management; and compliance reports. Services revenue is recognized upon completion of the services.
Transactional and Other Revenue. The Company has entered into agreements with various lenders, service providers and certain government-sponsored entities participating in the mortgage origination process that provide them access to, and ability to interoperate with, mortgage originators on the Ellie Mae Network. Under these agreements, the Company earns transaction fees when transactions are processed through the Ellie Mae Network. Transactional revenue is recognized upon completion of the services.
Professional Services Revenue. Professional services revenue is generally recognized upon delivery or completion of performance milestones for fixed price contracts or as the services are rendered for time and material contracts. The majority of the Company’s professional services contracts are on a fixed price basis. Training revenue is recognized as the services are rendered.
Subscriptions to Online Research and Data Resources. The Company provides mortgage originators and underwriters with access to online databases of various federal and state laws and regulations and forms as well as mortgage investor product guidelines. Subscription fees are recognized ratably over the subscription term as subscription services are provided, which is typically one year.
On-Premise Revenue
Revenue from the sale of software licenses is recognized in the month in which the required revenue recognition criteria are met, generally in the month in which the software is delivered. Revenue from the sale of maintenance services and professional services is recognized over the period in which the services are provided. As of June 30, 2016, the Company completed the migration of customers to its on-demand Encompass offering, and the Company does not expect on-premise revenues in the future.
Multiple Element Arrangements
The Company enters into arrangements with multiple elements that generally include multiple subscriptions and professional services. For arrangements with multiple deliverables, the Company evaluates whether the individual deliverables qualify as separate units of accounting. In order to treat deliverables in a multiple-deliverable arrangement as separate units of accounting, the deliverables must have standalone value upon delivery.
60
Subscription services have standalone value as such services are often sold separately. Additionally, the Company concluded that professional services included in multiple element arrangements also have standalone value. In establishing standalone value, the Company considered the following factors for each professional services agreement: availability of the services from other vendors, the nature of the professional services, and the timing of when the professional services contract was signed in comparison to the subscription service start date.
When subscription services agreements involve multiple elements that qualify as separate units of accounting, the Company allocates arrangement consideration to all deliverables at the inception of an arrangement based on the relative selling price method in accordance with the selling price hierarchy, which includes: (i) vendor specific objective evidence (“VSOE”) if it is available; (ii) third-party evidence (“TPE”) if VSOE is not available; and (iii) the best estimate of selling price (“BESP”) if neither VSOE nor TPE is available. The Company has determined that TPE is not a practical alternative as the Company’s go-to-market strategy and offerings contain a significant level of differentiation such that the comparable pricing of services with similar functionality cannot be obtained. Furthermore, the Company is unable to reliably determine what similar competitor services’ selling prices are on a standalone basis. The amount of revenue allocated to delivered items is limited by contingent revenue, if any.
The Company has not historically priced its services within a narrow range. As a result, the Company has not been able to establish VSOE for its services. Accordingly, the Company uses its BESP to determine the relative selling price for its services.
The objective of BESP is to determine the price at which the Company would transact a sale if the service was sold on a standalone basis. When establishing BESP, the Company reviews company specific factors used to determine list price and makes adjustments as appropriate to reflect current market conditions and pricing behavior. The Company’s process for establishing list price includes assessing the cost to provide a particular product or service, surveying customers to determine market expectations, analyzing customer demographics, and taking into account similar products and services historically sold by the Company. The Company continues to review the factors used to establish list price and adjusts BESP as necessary.
For software arrangements with multiple elements (e.g., maintenance and support contracts bundled with licenses), revenue is allocated to the delivered elements of the arrangement when VSOE is determinable, using the residual value method based on objective evidence of the fair value of the undelivered elements, which is specific to us. When VSOE is not determinable, the entire arrangement is recognized ratably over the term of the contract. Revenue is recognized under this model upon receipt of cash payment from the customer if collectability is not reasonably assured and when other revenue recognition criteria have been met. The VSOE of fair value for maintenance and support obligations related to licenses is based upon the prices paid for the separate renewal of these services by customers. Maintenance revenues are recognized ratably over the period of the maintenance contract.
Deferred Revenue
Deferred revenue represents billings or payments received in advance of revenue recognition and is recognized as the revenue recognition criteria are met. Balances consist primarily of prepaid subscription services and professional and training services not yet provided as of the balance sheet date. Deferred revenue that will be recognized during the succeeding 12 month period is recorded as current deferred revenue, and the remaining portion is recorded as other long-term liabilities. Long-term deferred revenue at December 31, 2016 and 2015 was not material.
Deferred Commission Expense
Deferred commission expenses are the incremental costs that are directly associated with non-cancelable subscription contracts with customers and consist of sales commissions paid to the Company’s direct sales force. Commissions are calculated based on a percentage of the revenues for the non-cancelable term of subscription contracts, which are typically one to five years.
The deferred commission expense amounts are recoverable through the future revenue streams under the non-cancelable customer contracts.
During the years ended December 31, 2016, 2015, and 2014, the Company deferred $4.9 million, $3.6 million, and $2.5 million of commission expense, respectively.
At December 31, 2016 and 2015, $7.8 million and $5.3 million of deferred commission remained on the Company’s consolidated balance sheets, respectively.
Warranties and Indemnification
The Company provides a warranty for its software products and services to its customers and accounts for its warranties as a contingent liability. The Company’s software is generally warranted to perform substantially as described in the associated product documentation and to satisfy defined levels of uptime reliability. The Company’s services are generally warranted to be performed consistent with industry standards. The Company has not provided for a warranty accrual as of December 31, 2016 or 2015. To date, the Company’s product warranty expense has not been significant.
61
The Company generally agrees to indemnify its customers against legal claims that the Company’s software products infringe certain third-party intellectual property rights and accounts for its indemnification obligations as a contingent liability. In addition, the Company may also incur liability under its contracts if it breaches its warranties as well as certain data security and/or confidentiality obligations. To date, the Company has not been required to make any payment resulting from either infringement claims asserted against its customers or from claims in connection with a breach of the data security and/or confidentiality obligations in the Company’s contracts. The Company has not recorded a liability for related costs as of December 31, 2016 or 2015.
The Company has obligations under certain circumstances to indemnify each executive officer and member of the Company’s board of directors against judgments, fines, settlements, and expenses related to claims against such executive officer or director and otherwise to the fullest extent permitted under Delaware law and the Company’s bylaws and certificate of incorporation.
Cost of Revenues
The Company’s cost of revenues consists primarily of: salaries and benefits, including stock-based compensation expense; data center operating costs; depreciation on data center computer equipment; amortization of internal-use software and acquired intangible assets such as developed technology and trade names; customer support; professional services associated with implementation of the Company’s software; third-party royalty expenses; and allocated facilities costs.
Research and Development Costs
The Company’s research and development expenses consist primarily of: salaries and benefits, including bonuses and stock-based compensation expense; fees to contractors engaged in the development and support of the Ellie Mae Network, Encompass software and other products; and allocated facilities costs. Research and development costs that are not capitalized as internal-use software are expensed as they are incurred.
Advertising Expenses
The Company expenses advertising costs as incurred. Advertising expenses for the years ended December 31, 2016, 2015, and 2014 were $1.0 million, $0.7 million, and $0.4 million, respectively.
Stock-Based Compensation
The Company recognizes stock-based compensation related to awards granted under its 2009 Stock Option and Incentive Plan (the “2009 Plan”), 2011 Equity Incentive Award Plan (the “2011 Plan”), and Employee Stock Purchase Plan (“ESPP”).
The Company recognizes compensation expense related to Restricted Stock Units (“RSUs”), Performance-Vesting Restricted Stock Units and Performance Awards (“Performance Awards”) based on the fair market value of the underlying shares of common stock as of the date of grant. Expense related to the RSUs is recognized on a straight-line basis over the requisite service period of the award, which generally equals the vesting period. Expense related to the Performance Awards and performance-vesting RSUs is recognized under the graded vesting method over the requisite service period of the award, which results in the recognition of a larger portion of the expense during the beginning of the vesting period than in the end of the vesting period. Management evaluates the probability of performance attainment and estimates the probable number of shares of common stock that will be granted and records the expense accordingly, if probable.
The Company recognizes compensation expense related to stock option grants that are ultimately expected to vest based on estimated fair values on the date of grant using the Black-Scholes option-pricing model. Such expense is recognized on a straight-line basis over the requisite service period of the award, which generally equals the vesting period.
The date of grant is the date at which the Company and the employee reach a mutual understanding of the key terms and conditions of the award, appropriate approvals are received by the equity incentive committee of the board of directors and the Company becomes contingently obligated to issue equity instruments to the employee who renders the requisite service.
The Company is required to estimate potential forfeitures of stock grants and adjust recorded compensation cost accordingly. The estimate of forfeitures is based on historical experience and is adjusted over the requisite service period to the extent that actual forfeitures differ, or are expected to differ, from the prior estimates. Changes in estimated forfeitures will be recognized in the period of change and will impact the amount of stock-based compensation expense to be recognized in future periods.
62
Income Taxes
The Company accounts for income taxes under the asset and liability method, which requires the recognition of taxes payable or refundable for the current year, and deferred tax liabilities and assets for the future tax consequences of events that have been recognized in the Company’s financial statements or tax returns. The measurement of current and deferred tax liabilities and assets is based on provisions of the enacted tax law; the effects of future changes in tax laws or rates are not anticipated. Valuation allowances are established when necessary to reduce deferred tax assets to the amount that the Company believes is more likely than not to be realized. The Company’s determination of its valuation allowance is based upon a number of assumptions, judgments, and estimates, including forecasted earnings, future taxable income, and the relative proportions of revenue and income before taxes in the various jurisdictions in which it operates.
The Company operates in various tax jurisdictions and is subject to audit by various tax authorities. Tax positions are based upon their technical merits, relevant tax law, and the specific facts and circumstances as of each reporting period. Changes in facts and circumstances could result in material changes to the amounts recorded for such tax positions. A tax position is only recognized in the financial statements if it is “more likely than not” to be sustained based solely on its technical merits as of the reporting date. The Company considers many factors when evaluating and estimating its tax positions and tax benefits, which may require periodic adjustments that could result in recognition of additional tax benefits or additional charges to the tax provision and may not accurately reflect actual outcomes. The Company has a policy to classify accrued interest and penalties associated with uncertain tax positions together with the related liability, and the expenses incurred related to such accruals are included in the provision for income taxes.
Comprehensive Income
Comprehensive income consists of net income and other comprehensive income. Other comprehensive income includes certain changes in equity that are excluded from net income, specifically unrealized gains (losses) on marketable securities. Except for net realized gain (loss) on investments which was not significant, there were no reclassifications out of accumulated other comprehensive income that affected net income during the years ended December 31, 2016, 2015, and 2014.
Geographical Information
The Company is domiciled in the United States and had no international operations or sales to customers outside of the United States for the years ended December 31, 2016, 2015, and 2014.
Recent Accounting Pronouncements
In May 2014, the Financial Accounting Standards Board (“FASB”) issued Accounting Standards Update (“ASU”) No. 2014-09, Revenue from Contracts with Customers (“ASU 2014-09”), which outlines a single comprehensive model for entities to use in accounting for revenue arising from contracts with customers and supersedes most current revenue recognition guidance, including industry-specific guidance. This standard also requires significantly expanded disclosures about revenue recognition. In August 2015, the FASB deferred the effective date of this standard by one year. The effective date for public entities is for fiscal years beginning after December 15, 2017 and early adoption is allowed. The Company will adopt the new standard as of January 1, 2018. The guidance permits two methods of adoption: retrospectively to each prior reporting period presented (full retrospective method), or retrospectively with the cumulative effect of initially applying the guidance recognized at the date of initial application (the modified retrospective method).
The Company is evaluating the impact of the new standard on its accounting policies, processes, and systems including impacts from guidance issued by the FASB Transition Resource Group as part of their November 2016 meeting. The Company has assigned internal resources, engaged a third party service provider, and has a preliminary project plan to finalize the evaluation and complete the implementation.
The Company has preliminarily identified potential impacts to the timing of revenue recognition and the amortization period of costs to obtain contracts. The Company’s decision on the adoption method will be based on various factors including the significance of the impact of the new standard on the Company’s financial results and system capabilities. The Company has not yet completed the evaluation of these impacts and the adoption method has not been determined.
In April 2015, the FASB issued ASU No. 2015-05, Intangibles—Goodwill and Other—Internal-Use Software: Customer’s Accounting for Fees Paid in a Cloud Computing Arrangement (“ASU 2015-05”), which clarifies the circumstances under which a cloud computing customer would account for the arrangement as a license of internal-use software. On January 1, 2016, the Company adopted ASU 2015-05 on a prospective basis. The adoption did not impact the Company’s consolidated financial statements.
63
In January 2016, the FASB issued ASU No. 2016-01, Financial Instruments-Overall: Recognition and Measurement of Financial Assets and Financial Liabilities (“ASU 2016-01”), which updates certain aspects of recognition, measurement, presentation and disclosure of financial instruments. ASU 2016-01 is effective for fiscal years, and interim periods within those years, beginning after December 15, 2017, and early adoption is not permitted. The Company is currently evaluating the impact of this accounting standard updated on its consolidated financial statements.
In February 2016, the FASB issued ASU No. 2016-02, Leases (Topic 842) (“ASU 2016-02”), which requires lessees to put most leases on their balance sheets but recognize the expenses on their income statements in a manner similar to current practice. ASU 2016-02 states that a lessee would recognize a lease liability for the obligation to make lease payments and a right-to-use asset for the right to use the underlying asset for the lease term. The standard is effective for interim and annual periods beginning after December 15, 2018, and early adoption is permitted. The Company currently does not intend to early adopt and is evaluating the impact of this accounting standard update on its consolidated financial statements.
In March 2016, the FASB issued ASU No. 2016-09, Compensation-Stock Compensation (Topic 718): Improvements to Employee Shared-Based Payment Accounting (“ASU 2016-09”), which simplifies and makes several modifications to Topic 718 related to the accounting of share-based payment transactions. The standard requires companies to record excess tax benefits and tax deficiencies as income tax benefit or expense in the income statement when stock awards vest or are settled. This change is required to be applied prospectively. The standard also allows the employer tax withholding on share-based compensation to increase (up to the employee’s maximum statutory rates) without triggering liability accounting and provides an accounting policy election to allow the recognition of forfeitures when they are incurred. The standard is effective for interim and annual reporting periods beginning after December 15, 2016, and early adoption is permitted. The Company will adopt the standard as of January 1, 2017. The Company has elected to continue estimating forfeitures, and is expected to record previously unrecognized tax benefits to retained earnings upon adoption. The Company will adopt the above on a modified retrospective basis. The standard also eliminates the requirement to separately classify excess tax benefits as a financing activity in the statement of cash flows and the Company will adopt on a retrospective basis.
In January 2017, the FASB issued ASU No. 2017-01, Business Combinations (Topic 805): Clarifying the Definition of a Business (“ASU 2017-01”). This standard clarifies the definition of a business and is intended to help companies evaluate whether transactions should be accounted for as acquisitions (or disposals) of assets or businesses. The standard is effective for interim and annual periods beginning after December 15, 2017 and early adoption is permitted under certain circumstances. The standard should be applied prospectively as of the beginning of the period of adoption. The Company currently does not intend to early adopt and is evaluating the impact of this accounting standard update on its consolidated financial statements.
In January 2017, the FASB issued ASU No. 2017-04, Intangibles - Goodwill and Other (Topic 350): Simplifying the Test for Goodwill Impairment (“ASU 2017-04”). The standard eliminates Step 2 from the goodwill impairment test, which requires a hypothetical purchase price allocation. The Company will continue to have the option to perform the qualitative assessment for a reporting unit to determine if the quantitative impairment test is necessary. The standard is effective for interim and annual periods beginning after December 15, 2019 and early adoption is permitted for interim or annual goodwill impairment tests performed on testing dates after January 1, 2017. The standard should be applied on a prospective basis. The Company is currently evaluating the impact of this accounting standard update on its consolidated financial statements.
NOTE 3—Net Income Per Share of Common Stock
Net income per share of common stock is calculated by dividing net income by the weighted average shares of common stock outstanding during the period. Diluted net income per share of common stock is calculated by dividing net income by the weighted average shares of common stock outstanding and potential shares of common stock during the period. Potential shares of common stock include dilutive shares attributable to the assumed exercise of stock options, RSUs, performance-vesting RSUs, Performance Awards, and ESPP shares using the treasury stock method, if dilutive.
64
The components of net income per share of common stock were as follows:
Year ended December 31, | |||||||||||
2016 | 2015 | 2014 | |||||||||
(in thousands, except share and per share amounts) | |||||||||||
Net income | $ | 37,776 | $ | 22,258 | $ | 14,823 | |||||
Basic shares: | |||||||||||
Weighted average common shares outstanding | 31,179,857 | 29,179,352 | 27,858,828 | ||||||||
Diluted shares: | |||||||||||
Weighted average shares used to compute basic net income per share | 31,179,857 | 29,179,352 | 27,858,828 | ||||||||
Effect of potentially dilutive securities: | |||||||||||
Employee stock options, RSUs, performance-vesting RSUs, Performance Awards and ESPP shares | 1,619,928 | 1,663,232 | 1,735,045 | ||||||||
Weighted average shares used to compute diluted net income per share | 32,799,785 | 30,842,584 | 29,593,873 | ||||||||
Net income per share: | |||||||||||
Basic | $ | 1.21 | $ | 0.76 | $ | 0.53 | |||||
Diluted | $ | 1.15 | $ | 0.72 | $ | 0.50 | |||||
The following potential weighted average common shares were excluded from the computation of diluted net income per share, as their effect would have been anti-dilutive:
Year ended December 31, | ||||||||
2016 | 2015 | 2014 | ||||||
Employee stock options and awards | 48,374 | 225,122 | 624,277 | |||||
Performance-vesting RSUs and Performance Awards are included in the diluted shares outstanding for each period if the established performance criteria have been met at the end of the respective periods. However, if none of the required performance criteria have been met for such awards, the Company includes the number of shares that would be issuable if the end of the reporting period were the end of the contingency period. Accordingly, in addition to the employee stock options and awards noted above, 20,304 shares underlying performance-vesting RSUs and Performance Awards were excluded from the dilutive shares outstanding for the year ended December 31, 2016. No shares were excluded from the dilutive shares outstanding for the years ended December 31, 2015 or 2014.
NOTE 4—Financial Instruments and Fair Value Measurements
Fair value is defined as the price that would be received from selling an asset or paid to transfer a liability in an orderly transaction between market participants at the measurement date. Fair value measurements are classified and disclosed in one of the following three categories:
Level 1 — Valuations based on quoted prices in active markets for identical assets or liabilities.
Level 2 — Valuations based on other than quoted prices in active markets for identical assets and liabilities, quoted prices for identical or similar assets or liabilities in inactive markets, or other inputs that are observable or can be corroborated by observable market data for substantially the full term of the assets or liabilities.
Level 3 — Valuations based on inputs that are generally unobservable and typically reflect management’s estimates of assumptions that market participants would use in pricing the assets or liabilities.
65
The following tables set forth by level within the fair value hierarchy the Company’s financial assets that were accounted for at fair value on a recurring basis:
December 31, 2016 | December 31, 2015 | ||||||||||||||||||||||
Level 1 | Level 2 | Total | Level 1 | Level 2 | Total | ||||||||||||||||||
(in thousands) | (in thousands) | ||||||||||||||||||||||
Cash equivalents: | |||||||||||||||||||||||
Money market funds | $ | 2,733 | $ | — | $ | 2,733 | $ | 6,788 | $ | — | $ | 6,788 | |||||||||||
U.S. government and government agency obligations | 151,660 | 149,976 | 301,636 | — | — | — | |||||||||||||||||
Investments: | |||||||||||||||||||||||
Certificates of deposit | — | 12,088 | 12,088 | — | 12,928 | 12,928 | |||||||||||||||||
Corporate notes and obligations | — | 28,892 | 28,892 | — | 28,205 | 28,205 | |||||||||||||||||
Municipal obligations | — | 11,361 | 11,361 | — | 2,648 | 2,648 | |||||||||||||||||
U.S. government and government agency obligations | 4,579 | 30,852 | 35,431 | 19,429 | 41,238 | 60,667 | |||||||||||||||||
$ | 158,972 | $ | 233,169 | $ | 392,141 | $ | 26,217 | $ | 85,019 | $ | 111,236 | ||||||||||||
Financial instruments include cash, cash equivalents, and investments, including investment-grade interest-bearing securities, such as money market accounts, certificates of deposit, commercial paper, corporate bonds, municipal and government agency obligations, and guaranteed obligations of the U.S. government. The Company classifies its money market funds that are specifically backed by debt securities and U.S. government obligations as Level 1 instruments, due to the use of observable market prices for identical securities that are traded in active markets.
When the Company uses observable market prices for identical securities that are traded in less active markets, the Company classifies its marketable financial instruments as Level 2. When observable market prices for identical securities are not available, the Company prices its marketable financial instruments using non-binding market consensus prices that are corroborated with observable market data; quoted market prices for similar instruments; or pricing models with all significant inputs derived from or corroborated with observable market data. Non-binding market consensus prices are based on the proprietary valuation models of pricing providers. These valuation models incorporate a number of inputs, including non-binding and binding broker quotes; observable market prices for identical or similar securities; and the internal assumptions of pricing providers or brokers that use observable market inputs and, to a lesser degree, unobservable market inputs. The Company corroborates non-binding market consensus prices with observable market data as such data exists.
At December 31, 2016 and December 31, 2015, the Company did not have any assets or liabilities that were valued using Level 3 inputs. For the years ended December 31, 2016, 2015, and 2014, there were no transfers of financial instruments between the levels.
For the years ended December 31, 2016, 2015, and 2014, the Company recognized interest income from financial instruments of $1.1 million, $0.7 million, and $0.6 million, respectively. Gross realized gains and gross realized losses from the sale of investments were not significant during the years ended December 31, 2016, 2015, and 2014.
66
The carrying amounts, gross unrealized gains and losses and estimated fair value of cash and cash equivalents and both short-term and long-term investments consisted of the following:
December 31, 2016 | December 31, 2015 | ||||||||||||||||||||||||||||||
Amortized Cost | Unrealized Gains | Unrealized Losses | Carrying or Fair Value | Amortized Cost | Unrealized Gains | Unrealized Losses | Carrying or Fair Value | ||||||||||||||||||||||||
(in thousands) | (in thousands) | ||||||||||||||||||||||||||||||
Cash and cash equivalents: | |||||||||||||||||||||||||||||||
Cash | $ | 76,538 | $ | — | $ | — | $ | 76,538 | $ | 27,608 | $ | — | $ | — | $ | 27,608 | |||||||||||||||
Money market funds | 2,733 | — | — | 2,733 | 6,788 | — | — | 6,788 | |||||||||||||||||||||||
U.S. government and government agency obligations | 301,631 | 8 | (3 | ) | 301,636 | — | — | — | — | ||||||||||||||||||||||
$ | 380,902 | $ | 8 | $ | (3 | ) | $ | 380,907 | $ | 34,396 | $ | — | $ | — | $ | 34,396 | |||||||||||||||
Investments: | |||||||||||||||||||||||||||||||
Corporate notes and obligations | $ | 28,978 | $ | 1 | $ | (87 | ) | $ | 28,892 | $ | 28,314 | $ | 1 | $ | (110 | ) | $ | 28,205 | |||||||||||||
Certificates of deposit | 12,094 | 13 | (19 | ) | 12,088 | 12,945 | 5 | (22 | ) | 12,928 | |||||||||||||||||||||
Municipal obligations | 11,422 | 1 | (62 | ) | 11,361 | 2,647 | 1 | — | 2,648 | ||||||||||||||||||||||
U.S. government and government agency obligations | 35,502 | 8 | (79 | ) | 35,431 | 60,799 | 10 | (142 | ) | 60,667 | |||||||||||||||||||||
$ | 87,996 | $ | 23 | $ | (247 | ) | $ | 87,772 | $ | 104,705 | $ | 17 | $ | (274 | ) | $ | 104,448 | ||||||||||||||
The following table shows the gross unrealized losses and the related fair values of the Company’s investments that have been in a continuous unrealized loss position. The Company did not identify any investments as other-than-temporarily impaired at December 31, 2016 or December 31, 2015.
December 31, 2016 | |||||||||||||||||||||||
Less than 12 Months | 12 Months or Greater | Total | |||||||||||||||||||||
Fair Value | Unrealized Losses | Fair Value | Unrealized Losses | Fair Value | Unrealized Losses | ||||||||||||||||||
(in thousands) | |||||||||||||||||||||||
Corporate notes and obligations | $ | 26,076 | $ | (87 | ) | $ | — | $ | — | $ | 26,076 | $ | (87 | ) | |||||||||
Certificates of deposit | 5,651 | (19 | ) | — | — | 5,651 | (19 | ) | |||||||||||||||
U.S. government, government agency, and municipal obligations | 180,138 | (144 | ) | 385 | — | 180,523 | (144 | ) | |||||||||||||||
$ | 211,865 | $ | (250 | ) | $ | 385 | $ | — | $ | 212,250 | $ | (250 | ) | ||||||||||
December 31, 2015 | |||||||||||||||||||||||
Less than 12 Months | 12 Months or Greater | Total | |||||||||||||||||||||
Fair Value | Unrealized Losses | Fair Value | Unrealized Losses | Fair Value | Unrealized Losses | ||||||||||||||||||
(in thousands) | |||||||||||||||||||||||
Corporate notes and obligations | $ | 23,969 | $ | (99 | ) | $ | 2,514 | $ | (11 | ) | $ | 26,483 | $ | (110 | ) | ||||||||
Certificates of deposit | 9,284 | (22 | ) | — | — | 9,284 | (22 | ) | |||||||||||||||
U.S. government, government agency, and municipal obligations | 48,394 | (139 | ) | 1,793 | (3 | ) | 50,187 | (142 | ) | ||||||||||||||
$ | 81,647 | $ | (260 | ) | $ | 4,307 | $ | (14 | ) | $ | 85,954 | $ | (274 | ) | |||||||||
67
The following table summarizes the maturities of the Company’s investments at December 31, 2016:
Carrying or Fair Value | |||
(in thousands) | |||
2017 | $ | 41,841 | |
2018 | 30,615 | ||
2019 | 15,316 | ||
Total | $ | 87,772 | |
Actual maturities may differ from the contractual maturities because borrowers may have the right to call or prepay certain obligations.
NOTE 5—Acquisitions
Mortgage Returns
On October 23, 2015, the Company acquired substantially all the assets of Mortgage Returns, LLC (“Mortgage Returns”), a provider of on-demand customer relationship management, and marketing automation solutions for the mortgage industry. The Company acquired the Mortgage Returns business in order to add functionality to its product offerings. The transaction was accounted for as a business combination and, accordingly, the total purchase price was allocated to the assets acquired and liabilities assumed based on their respective fair values. The Company expensed all transaction costs, which were insignificant, in the period in which they were incurred.
The total purchase consideration was $16.3 million in cash, of which $2.4 million was placed in escrow to cover closing capital settlement adjustments and any indemnity claims. In October 2016, $0.8 million was paid to the seller, in accordance with the agreement. Any amount remaining in escrow 18 months after the date of acquisition will be paid to the seller.
The allocation of the consideration of $16.3 million to the identifiable tangible and intangible assets acquired and liabilities assumed under the purchase method of accounting, based on their estimated fair values as of the acquisition date, is summarized in the following table (in thousands):
Current assets | $ | 503 | |
Other assets | 17 | ||
Property, plant, and equipment | 423 | ||
Intangible assets: | |||
Developed technology | 4,500 | ||
Order backlog | 370 | ||
Customer relationships | 2,200 | ||
Trade name | 30 | ||
Current liabilities | (324 | ) | |
Long-term liabilities | (244 | ) | |
Deferred revenue | (350 | ) | |
Goodwill | 9,209 | ||
Total purchase consideration | $ | 16,334 | |
Developed technology consists of the technology underlying Mortgage Returns’ existing products and has an estimated useful life of four years. The value of the developed technology was determined by discounting the estimated net future cash flows of these products.
Customer relationships relate to the Company’s ability to sell existing and future versions of the Company’s products and services to existing Mortgage Returns customers and have an estimated useful life of seven years. The fair value of the customer relationships was determined by using an income approach, in which fair value was determined using discounted cash flows associated with lost revenue and lost profits over the life of the customer relationships.
68
Trade name represents the right to use the Mortgage Returns’ name and has a useful life of one year. The fair value of the trade name was determined by estimating the benefit from owning the asset rather than paying a royalty to a third party for the use of the asset.
Order backlog represents estimated net discounted future cash flows associated with service contracts that were outstanding as of the acquisition date and expected to be executed within four years.
Goodwill, which is deductible for tax purposes, represents the excess of the purchase price over the fair value of the identifiable assets acquired. Among the factors that contributed to a purchase price in excess of the fair value of the identifiable assets was the acquisition of an assembled workforce and synergies between the Company’s products and Mortgage Return’s products.
Mortgage Returns’ results of operations since the closing date of October 23, 2015, have been included in the Company’s consolidated statements of comprehensive income. If the acquisition had occurred as of January 1, 2014, the impact on reported revenues and earnings of the Company for the years ended December 31, 2015 and 2014 would not have been significant.
AllRegs
On October 1, 2014, the Company acquired substantially all the assets of Mortgage Resource Center, Inc. (dba AllRegs) (“AllRegs”), a provider of research and reference, education, documentation, and data analytics products relating to the mortgage industry. The Company acquired the AllRegs business in order to strengthen the Company’s products through product integration and to introduce new products related to training, compliance management systems and product eligibility. The transaction was accounted for as a business combination and, accordingly, the total purchase price was allocated to the assets acquired based on their respective fair values. The Company expensed all transactions costs, which were insignificant, in the period in which they were incurred.
The total purchase consideration was $28.1 million in cash, of which $3.0 million was placed in escrow to cover closing capital settlement adjustments and any indemnity claims. Any amount remaining in escrow 18 months after the date of acquisition was paid to the seller.
AllReg’s results of operations since the closing date of October 1, 2014, have been included in the Company’s consolidated statements of comprehensive income.
The following unaudited pro forma combined results of operations give effect to the acquisition of AllRegs as if it had occurred on January 1, 2014. The unaudited pro forma combined results of operations are provided for informational purposes only and do not purport to represent the Company’s actual consolidated results of operations or consolidated financial position had the acquisition occurred on the dates assumed, nor are these financial statements necessarily indicative of the Company’s future consolidated results of operations or consolidated financial position. The Company expects to incur costs and realize benefits associated with integrating the operations of the Company and AllRegs. The unaudited pro forma combined results of operations do not reflect the costs of any integration activities or any benefits that may result from operating efficiencies or revenue synergies. The pro forma combined results of operations for the year ended December 31, 2014 include non-recurring adjustments relating to the reduction of AllRegs deferred revenue to its estimated fair value as of the acquisition date and the corresponding impact on subsequently recognized revenue, direct acquisition costs and changes to AllRegs employee compensation subsequent to the date of acquisition.
Year ended December 31, | |||
2014 | |||
(unaudited, in thousands, except per share amounts) | |||
Revenues | $ | 174,483 | |
Net income | $ | 15,982 | |
Net income per share: | |||
Basic | $ | 0.57 | |
Diluted | $ | 0.54 | |
MortgageCEO
On January 15, 2014, the Company acquired substantially all the assets of ARG Interactive, LLC (dba MortgageCEO) (“MortgageCEO”), a SaaS company specializing in customer relationship management and marketing solutions for the residential mortgage industry. The Company acquired the MortgageCEO business in order to add functionality to its product offerings. The transaction was accounted for as a business combination and, accordingly, the total purchase price was allocated to the assets
69
acquired based on their respective fair values. The Company expensed all transaction costs, which were insignificant, in the period in which they were incurred.
The total purchase consideration was $5.0 million in cash, of which $4.5 million was paid at the time of closing. The remaining $0.5 million (the “holdback funds”) was retained from the purchase consideration to cover working capital adjustments and any indemnity claims. The holdback amount was applied to an arbitration settlement reached with the founder of MortgageCEO resulting in a credit to general and administrative expenses in the consolidated statements of comprehensive income for the year ended December 31, 2015.
MortgageCEO’s results of operations since the closing date of January 15, 2014 have been included in the Company’s consolidated statements of comprehensive income for the year ended December 31, 2014 and were not significant. If the acquisition had occurred as of January 1, 2014, the revenue and earnings of the combined entity for the current reporting period would have been approximately the same.
As described in Note 6, the Company recorded a non-cash impairment charge of $0.3 million to customer relationships and $1.7 million to developed technology for the year ended December 31, 2014 and a non-cash impairment charge of $0.6 million to developed technology for the year ended December 31, 2015.
NOTE 6—Balance Sheet Components
Prepaid Expenses and Other Current Assets
Prepaid expenses and other current assets consisted of the following:
December 31, | |||||||
2016 | 2015 | ||||||
(in thousands) | |||||||
Prepaid expenses(1) | $ | 11,568 | $ | 6,704 | |||
Deferred commissions, current portion(1) | 2,761 | 1,814 | |||||
Other current assets(1) | 880 | 1,356 | |||||
$ | 15,209 | $ | 9,874 | ||||
________________
(1) Certain reclassifications of prior period amounts have been made to conform to the current period presentation, such reclassification did not materially change previously reported consolidated financial statements.
Property and Equipment
Property and equipment, net, consisted of the following:
December 31, | |||||||
2016 | 2015 | ||||||
(in thousands) | |||||||
Computer equipment and software(1) | $ | 116,602 | $ | 55,928 | |||
Furniture and fixtures | 6,838 | 5,292 | |||||
Leasehold improvements | 18,532 | 14,405 | |||||
Property and equipment | 141,972 | 75,625 | |||||
Accumulated depreciation and amortization(1) | (48,991 | ) | (28,552 | ) | |||
Net property and equipment | 92,981 | 47,073 | |||||
Internal-use software and other assets not placed in service | 33,316 | 34,287 | |||||
$ | 126,297 | $ | 81,360 | ||||
________________
(1) Includes computer equipment and software under capital leases
70
Computer equipment and software under capital leases, net, consisted of the following:
December 31, | |||||||
2016 | 2015 | ||||||
(in thousands) | |||||||
Computer equipment | $ | 8,715 | $ | 8,715 | |||
Software | 1,517 | 1,517 | |||||
Accumulated amortization | (6,522 | ) | (3,371 | ) | |||
Net computer equipment and software under capital leases | $ | 3,710 | $ | 6,861 | |||
At December 31, 2016 and 2015, the Company had unamortized internal-use software costs of $77.2 million and $47.0 million, respectively. Amortization of internal-use software for the years ended December 31, 2016, 2015, and 2014 was $8.3 million, $2.4 million, and $0.7 million, respectively.
Depreciation expense for the years ended December 31, 2016, 2015, and 2014 was $20.5 million, $10.8 million, and $5.6 million, respectively. Amortization of assets under capital leases, which is included in depreciation expense, was $3.2 million, $2.5 million, and $0.7 million for the years ended December 31, 2016, 2015, and 2014.
During the year ended December 31, 2014, the Company recorded a $0.7 million impairment loss to general and administrative expenses on the write-off of internal-use software. There were no impairment loss for the years ended December 31, 2015 and 2016.
Intangible Assets
Intangible assets, net, consisted of the following:
December 31, 2016 | |||||||||||||
Gross carrying amount | Accumulated amortization | Net intangibles | Weighted Average Remaining Useful Life | ||||||||||
(in thousands) | (in years) | ||||||||||||
Assets subject to amortization: | |||||||||||||
Developed technology | $ | 11,535 | $ | (8,183 | ) | $ | 3,352 | 2.7 | |||||
Trade names | 331 | (331 | ) | — | 0.0 | ||||||||
Customer relationships | 19,400 | (9,762 | ) | 9,638 | 4.0 | ||||||||
Order backlog | 370 | (110 | ) | 260 | 2.8 | ||||||||
Total assets subject to amortization | 31,636 | (18,386 | ) | 13,250 | 3.6 | ||||||||
Assets not subject to amortization: | |||||||||||||
Trade name | 4,039 | — | 4,039 | ||||||||||
$ | 35,675 | $ | (18,386 | ) | $ | 17,289 | |||||||
December 31, 2015 | |||||||||||||
Gross carrying amount | Accumulated amortization | Net intangibles | Weighted Average Remaining Useful Life | ||||||||||
(in thousands) | (in years) | ||||||||||||
Assets subject to amortization: | |||||||||||||
Developed technology | $ | 11,535 | $ | (5,668 | ) | $ | 5,867 | 3.1 | |||||
Trade names | 331 | (307 | ) | 24 | 0.8 | ||||||||
Customer relationships | 19,400 | (6,875 | ) | 12,525 | 4.8 | ||||||||
Order backlog | 370 | (15 | ) | 355 | 3.8 | ||||||||
Total assets subject to amortization | $ | 31,636 | $ | (12,865 | ) | $ | 18,771 | 4.2 | |||||
Assets not subject to amortization: | |||||||||||||
Trade name | 4,039 | — | 4,039 | ||||||||||
$ | 35,675 | $ | (12,865 | ) | $ | 22,810 | |||||||
71
During the fourth quarter of 2014, the Company identified certain indicators of impairment for both the customer relationships and developed technology acquired in the MortgageCEO acquisition. Specifically, the Company determined it would need to make additional investments in the Encompass CRM product in order to attract new customers (which were not expected and therefore not contemplated in the valuation of customer relationships and developed technology in the purchase price allocation at the acquisition date), which resulted in a significant delay in the Company’s ability to release an integrated Encompass CRM product to its customers. As a result, the Company determined it was necessary to assess the recoverability of the customer relationships and developed technology associated with generating Encompass CRM cash flows. The Company used an income approach to determine if the sum of the undiscounted cash flows expected to result from the use and eventual disposition of each asset exceeded the carrying amount of that asset. As a result of this assessment, it was determined that the sum of undiscounted cash flows was less than the carrying amount for each of the two assets. In order to determine the amount of impairment to each asset, the Company performed an analysis to determine the fair value of each asset, which was determined using the present value of expected future cash flows which were based on estimates, assumptions and judgments. These include the forecast of future cash flows related to each asset, the discount rate used in discounting those cash flows, and the expected remaining useful life of each asset. This analysis resulted in a non-cash impairment charge of $0.3 million to customer relationships and a non-cash impairment charge of $1.7 million to developed technology, which were included in sales and marketing expenses and research and development expenses, respectively, in the consolidated statements of comprehensive income for the year ended December 31, 2014.
In October 2015, the Company acquired Mortgage Returns. As a result of the acquisition, the Company discontinued the use of the acquired MortgageCEO technology and migrated substantially all of the existing customers to the Mortgage Returns CRM platform in 2016. The Company recorded a non-cash impairment charge of $0.6 million to developed technology, which were included in cost of revenues, in the consolidated statements of comprehensive income for the year ended December 31, 2015.
Amortization expense associated with intangible assets was $5.5 million, $5.2 million, and $2.8 million for the years ended December 31, 2016, 2015, and 2014, respectively.
Minimum future amortization expense for intangible assets at December 31, 2016 was as follows:
(in thousands) | |||
2017 | $ | 4,294 | |
2018 | 3,443 | ||
2019 | 3,166 | ||
2020 | 1,778 | ||
2021 | 314 | ||
Thereafter | 255 | ||
$ | 13,250 | ||
Goodwill
The Company completed its annual impairment tests during the fourth quarters of 2016, 2015, and 2014 and determined that goodwill was not impaired.
There was no change to goodwill for the year ended December 31, 2016.
The changes in the carrying value of goodwill during the year ended December 31, 2015 were as follows (in thousands):
Balance at January 1, 2015 | $ | 65,338 | |
Addition: Mortgage Returns acquisition | 9,209 | ||
Balance at December 31, 2015 | $ | 74,547 | |
72
Accrued and Other Current Liabilities
Accrued and other current liabilities consisted of the following:
December 31, | |||||||
2016 | 2015 | ||||||
(in thousands) | |||||||
Accrued payroll and related expenses | $ | 31,848 | $ | 23,938 | |||
Accrued commissions | 1,832 | 1,993 | |||||
Accrued royalties | 1,395 | 1,546 | |||||
Sales and other taxes | 2,327 | 1,536 | |||||
Current portion of leases payable | 619 | 3,845 | |||||
Other accrued expenses(1) | 1,788 | 4,449 | |||||
$ | 39,809 | $ | 37,307 | ||||
________________
(1) Certain reclassifications of prior period amounts have been made to conform to the current period presentation, such reclassification did not materially change previously reported consolidated financial statements.
Deferred Revenue
Deferred revenues consisted of the following:
December 31, | |||||||
2016 | 2015 | ||||||
(in thousands) | |||||||
Professional services and training | 10,729 | 6,430 | |||||
Subscriptions | 8,419 | 9,225 | |||||
Software maintenance | $ | — | $ | 386 | |||
Other | 4,140 | 63 | |||||
Total | 23,288 | 16,104 | |||||
Less portion included in other long-term liabilities | (162 | ) | (240 | ) | |||
$ | 23,126 | $ | 15,864 | ||||
Other Long-Term Liabilities
Other long-term liabilities consisted of the following:
December 31, | |||||||
2016 | 2015 | ||||||
(in thousands) | |||||||
Deferred revenue | $ | 162 | $ | 240 | |||
Deferred rent | 9,512 | 8,256 | |||||
Deferred tax liability(1) | 5,564 | — | |||||
Other long-term liabilities(1) | 2,409 | 1,777 | |||||
$ | 17,647 | $ | 10,273 | ||||
________________
(1) Certain reclassifications of prior period amounts have been made to conform to the current period presentation, such reclassification did not materially change previously reported consolidated financial statements.
73
NOTE 7—Income Taxes
The components of the provision for income taxes were as follows:
Year ended December 31, | |||||||||||
2016 | 2015 | 2014 | |||||||||
(in thousands) | |||||||||||
Current | |||||||||||
Federal | $ | 9,428 | $ | 8,070 | $ | 5,761 | |||||
State | 1,664 | 1,894 | 630 | ||||||||
11,092 | 9,964 | 6,391 | |||||||||
Deferred | |||||||||||
Federal | 7,124 | 1,899 | 336 | ||||||||
State | 614 | 356 | 59 | ||||||||
7,738 | 2,255 | 395 | |||||||||
Income tax provision | $ | 18,830 | $ | 12,219 | $ | 6,786 | |||||
The provision for income taxes differed from the amount of income taxes determined by applying the U.S. statutory federal income tax rate as follows:
Year ended December 31, | ||||||||
2016 | 2015 | 2014 | ||||||
Tax at federal statutory rate | 35 | % | 35 | % | 35 | % | ||
State taxes, net of federal benefit | 4 | 5 | 3 | |||||
Stock-based compensation | 1 | 1 | 1 | |||||
Tax credits | (6 | ) | (7 | ) | (8 | ) | ||
Other | (1 | ) | 1 | — | ||||
Income tax provision | 33 | % | 35 | % | 31 | % | ||
Excess tax benefits associated with stock option exercises and other equity awards were credited to stockholders’ equity. The income tax benefits resulting from stock awards that were credited to stockholders’ equity were $10.0 million, $11.4 million, and $5.9 million for the years ended December 31, 2016, 2015, and 2014.
The components of net deferred tax assets (liabilities) were as follows:
December 31, | |||||||
2016 | 2015 | ||||||
(in thousands) | |||||||
Deferred tax assets | |||||||
Research and development credits | $ | 5,089 | $ | 3,901 | |||
Stock-based compensation | 12,551 | 10,309 | |||||
Reserves and accruals | 11,896 | 8,779 | |||||
Total deferred tax assets | 29,536 | 22,989 | |||||
Valuation allowance | (5,089 | ) | (3,901 | ) | |||
Total deferred tax assets, net of valuation allowance | 24,447 | 19,088 | |||||
Deferred tax liabilities | |||||||
Depreciation and amortization | (28,749 | ) | (16,171 | ) | |||
Book/tax basis in acquired assets | (1,262 | ) | (697 | ) | |||
Total deferred tax liabilities | (30,011 | ) | (16,868 | ) | |||
Net deferred tax assets (liabilities) | $ | (5,564 | ) | $ | 2,220 | ||
74
At December 31, 2016, the Company had recorded $5.6 million of net long-term deferred tax liabilities in other long-term liabilities on the consolidated balance sheet. At December 31, 2015, the Company had recorded $2.2 million of net long-term deferred tax assets in deposits and other assets on the consolidated balance sheet.
The Company continues to maintain a valuation allowance against the deferred tax assets related to certain state research and development tax credits, the realization of which is uncertain as the Company expects to generate additional such credits at a faster rate than it is able to utilize them. The valuation allowance increased by $1.2 million, $1.0 million, $0.8 million in 2016, 2015 and 2014, respectively.
As of December 31, 2016, the Company had federal net operating loss (“NOL”) carryforwards of $15.0 million, available to reduce future taxable income and $7.2 million of state NOL carryforwards. These federal and state NOL carryforwards will begin to expire commencing 2035 and 2017, respectively. As of December 31, 2016, the Company also had federal and state research and development tax credit carryforwards of $8.9 million and $6.2 million, respectively. If it were to be utilized, the related federal tax benefit of $8.9 million would be credited to additional paid-in capital. The federal tax credit carryforwards begin to expire commencing in 2035. The state tax credit carryforwards may be carried forward indefinitely.
Internal Revenue Code Section 382 places a limitation (the “Section 382 Limitation”) on the amount of taxable income that can be offset by NOL carryforwards after a change in control (generally greater than 50% change in ownership) of a loss corporation. California has similar rules. The Company’s capitalization as described herein may have created such a change. Generally, after a control change, a loss corporation cannot deduct NOL carryforwards in excess of the Section 382 Limitation. Due to these “change in ownership” provisions, utilization of the NOL carryforwards may be subject to an annual limitation regarding their utilization against taxable income in future periods. The Company has prepared a Section 382 Limitation analysis and does not believe that any of its NOL carryforwards are subject to expiration prior to utilization. Limitations have been imposed on the Company’s acquired subsidiaries.
At December 31, 2016, the Company had $4.6 million of cumulative unrecognized tax benefits. If the benefits were to be recognized, $2.4 million would affect the effective tax rate and $2.2 million would reverse the valuation allowance against the deferred tax assets. The Company does not expect a significant change to its unrecognized tax benefits over the next twelve months. The unrecognized tax benefits may increase or change during the year for items that arise in the ordinary course of business.
A reconciliation of the beginning and ending balance of unrecognized tax benefits is as follows:
Year ended December 31, | |||||||||||
2016 | 2015 | 2014 | |||||||||
(in thousands) | |||||||||||
Beginning balance | $ | 3,440 | $ | 2,408 | $ | 1,806 | |||||
Additions based on tax positions related to the current year | 1,334 | 1,023 | 594 | ||||||||
Additions (reductions) based on tax positions related to prior years including acquisitions | (140 | ) | 9 | 8 | |||||||
Ending balance | $ | 4,634 | $ | 3,440 | $ | 2,408 | |||||
The Company files income tax returns in the U.S. federal jurisdiction and various state jurisdictions. The Company’s tax years for 2007 and forward are subject to examination by the U.S. tax authorities and for 2000 and forward are subject to examination by the California tax authorities due to the carryforward of unutilized net operating losses and research and development credits.
The Company believes that it has provided adequate reserves for its income tax uncertainties in all open tax years, and that it does not have any tax positions that it is reasonably possible would materially increase or decrease the gross unrecognized tax benefits within the next twelve months.
The Company has a policy to classify accrued interest and penalties associated with uncertain tax positions together with the related liability, and the expenses incurred related to such accruals are included in the provision for income taxes. The Company did not incur any interest expense or penalties associated with unrecognized tax benefits during the years ended December 31, 2016, 2015, and 2014.
The Company is currently under examination by the U.S. Internal Revenue Service for the 2013 tax year. At this time, the Company is not able to estimate the potential impact that the examination may have on income tax expense. If the examination is resolved unfavorably, it may have a negative impact on the Company’s results of operations.
75
NOTE 8—Commitments and Contingencies
Leases
As of December 31, 2016, the Company leased eight facilities under operating lease arrangements. The lease expiration dates range from August 2017 to December 2025. Certain leases contain escalation clauses calling for increased rents. The Company recognizes rent expense on a straight-line basis over the lease period and has recorded deferred rent for the difference between rent payments and rent expense recognized. Rent expense was $5.4 million, $4.2 million, and $2.1 million for the years ended December 31, 2016, 2015, and 2014, respectively.
Pursuant to the expiration of the Company’s Irvine office lease, in February 2016, the Company entered into a new lease agreement for approximately 4,600 square feet of office space in Irvine, California. The term of the lease commenced on June 1, 2016 with an initial term of 60 months, with payments ranging from $12,800 per month to $15,000 per month.
In July 2016, the Company entered into an amendment to its existing office lease in Pleasanton, California to expand office space by four floors, approximately 143,500 square feet and extend the term of the lease of the existing premises by one year to December 31, 2025. The term of the lease for two of the four floors will commence on April 1, 2017 and for the remaining two floors, will commence on February 1, 2018. The term of the lease for the aggregate leased space ends on December 31, 2025 with payments ranging from approximately $201,600 per month to $527,300 per month during the lease period.
Pursuant to the expiration of the Company’s Omaha office lease, in August 2016, the Company entered into a new lease agreement for approximately 20,100 square feet of office space in Omaha, Nebraska. The term of the lease commenced on February 28, 2017 with an initial term of 68 months, with payments ranging from $25,600 per month to $37,900 per month.
Future minimum lease payments under non-cancelable operating and capital leases at December 31, 2016 consisted of the following:
Capital Leases | Operating Leases | ||||||
(in thousands) | |||||||
2017 | $ | 633 | $ | 6,167 | |||
2018 | 87 | 10,122 | |||||
2019 | — | 10,682 | |||||
2020 | — | 10,839 | |||||
2021 | — | 10,975 | |||||
Thereafter | — | 45,483 | |||||
Total minimum lease payments | 720 | $ | 94,268 | ||||
Less amount representing interest | (16 | ) | |||||
Present value of minimum lease payments | 704 | ||||||
Less current portion | (619 | ) | |||||
Long-term portion of lease obligations | $ | 85 | |||||
Purchase Commitments
Commitments for the purchase of services, licenses of third-party software, and construction commitments totaled $11.4 million at December 31, 2016 and are to be paid as follows: $6.2 million in 2017, $4.8 million in 2018 and $0.4 million in 2019.
Legal Proceedings
From time to time, the Company is involved in litigation that it believes is of the type common to companies engaged in the Company’s line of business, including commercial and employment disputes. As of the date of this Annual Report on Form 10-K, the Company is not involved in any pending legal proceedings whose outcome the Company expects to have a material adverse effect on its financial position, results of operations or cash flows. However, litigation is unpredictable and excessive verdicts, both in the form of monetary damages and injunctions, could occur. In the future, litigation could result in substantial costs and diversion of resources and the Company could incur judgments or enter into settlements of claims that could have a material adverse effect on its business.
76
NOTE 9—Stockholders' Equity
Common Stock
The amended and restated certificate of incorporation of the Company authorizes 140,000,000 shares of common stock, $0.0001 par value per share and 10,000,000 shares of undesignated preferred stock, $0.0001 par value per share.
The following number of shares of common stock were reserved and available for future issuance at December 31, 2016:
Reserved Shares | ||||
Options and awards granted and outstanding under stock incentive plans | 3,318,097 | |||
Shares available for future grant under the stock incentive plans | 3,828,349 | |||
Shares available under the employee stock purchase plan | 1,398,843 | |||
Total | 8,545,289 | |||
Stock Offering
In August 2016, the Company completed a public offering of common stock and sold a total of 3,162,500 shares of its common stock for total cash proceeds of approximately $271.4 million, net of underwriting discounts, and offering costs and expenses of approximately $13.2 million.
Stock Repurchase Program
In May 2014, the board of directors approved a repurchase program authorizing to repurchase up to $75.0 million of the Company’s common stock over a 36-month period. As of December 31, 2016, $42.8 million remained available for future stock repurchases under this repurchase program.
The Company repurchased the following shares of common stock under the repurchase program:
Shares Repurchased | Weighted Average Purchase Price per Share | Total Amount | ||||||||
(in thousands) | ||||||||||
Year Ended 2016 | 8,333 | $ | 79.62 | $ | 663 | |||||
Year Ended 2015 | 503,450 | $ | 62.63 | $ | 31,530 | |||||
For the year ended 2014, there were no shares repurchased under the repurchase program.
NOTE 10—Equity and Stock Incentive Plans
The Company recognized stock-based compensation expense related to awards granted under the 2009 Plan, the 2011 Plan, and ESPP.
2009 Stock Option and Incentive Plan and 2011 Equity Incentive Award Plan
Stock Options
In March 2011, the Company adopted the 2011 Plan, which was approved by the Company’s stockholders on March 24, 2011. Under the 2011 Plan, 2,666,666 shares of the Company’s common stock were initially reserved. Any shares of common stock that were available for issuance under prior plans, including the 2009 Plan, were transferred to the 2011 Plan. As of December 31, 2016, 987,657 shares of the Company’s common stock previously available for issuance under the 2009 Plan were available for issuance under the 2011 Plan. The majority of stock options issued under the plan have a maximum contractual term of ten years, the options generally vest over a four-year period.
The number of common shares reserved for issuance under the 2011 Plan increase automatically in January of each year by the least of (a) 1,666,666 shares, (b) five percent (5%) of the shares of common stock outstanding on the last day of the immediately preceding fiscal year and (c) such smaller number of shares of common stock as determined by the Company’s board of directors; provided, however that no more than 23,333,333 shares of common stock may be issued upon the exercise of incentive stock options.
The following table summarizes the Company’s stock option activity under the 2009 Plan and 2011 Plan:
Number of Shares | Weighted Average Exercise Price | Weighted Average Remaining Contractual Term | Aggregate Intrinsic Value | |||||||||
(in years) | (in thousands) | |||||||||||
Outstanding at December 31, 2013 | 3,284,672 | $ | 11.17 | |||||||||
Granted | 904,602 | $ | 28.76 | |||||||||
Exercised | (1,048,053 | ) | $ | 7.19 | ||||||||
Forfeited or expired | (90,920 | ) | $ | 22.46 | ||||||||
Outstanding at December 31, 2014 | 3,050,301 | $ | 17.41 | |||||||||
Granted | 385,776 | $ | 55.30 | |||||||||
Exercised | (822,133 | ) | $ | 12.28 | ||||||||
Forfeited or expired | (98,615 | ) | $ | 30.12 | ||||||||
Outstanding at December 31, 2015 | 2,515,329 | $ | 24.40 | |||||||||
Granted | 14,506 | $ | 59.78 | |||||||||
Exercised | (584,807 | ) | $ | 18.08 | ||||||||
Forfeited or expired | (59,696 | ) | $ | 37.94 | ||||||||
Outstanding at December 31, 2016 | 1,885,332 | $ | 26.21 | 6.34 | $ | 108,356 | ||||||
Ending vested and expected to vest at December 31, 2016 | 1,865,630 | $ | 26.21 | 6.32 | $ | 107,565 | ||||||
Exercisable at December 31, 2016 | 1,401,407 | $ | 21.59 | 5.86 | $ | 87,007 | ||||||
The aggregate intrinsic value of the stock options outstanding at December 31, 2016 based on the Company’s closing stock price of $83.68 is presented above. Intrinsic value of an option is the difference between the fair value of the Company’s common stock at the time of exercise and the exercise price to be paid. Options outstanding that are expected to vest are net of estimated future forfeitures. For the majority of stock options outstanding, the options vest over a four-year period and have a maximum contractual term of ten years.
Following is additional information pertaining to the Company’s stock option activity:
Year ended December 31, | |||||||||||
2016 | 2015 | 2014 | |||||||||
(in thousands except for per option data) | |||||||||||
Weighted average fair value per option granted | $ | 27.57 | $ | 26.13 | $ | 14.43 | |||||
Grant-date fair value of options vested | $ | 8,577 | $ | 8,285 | $ | 6,126 | |||||
Intrinsic value of options exercised | $ | 39,040 | $ | 38,971 | $ | 26,277 | |||||
Proceeds received from options exercised | $ | 10,573 | $ | 10,094 | $ | 7,537 | |||||
As of December 31, 2016, total unrecognized stock-based compensation expense related to unvested stock options, adjusted for estimated forfeitures, was $8.5 million and is expected to be recognized over a weighted average period of 1.72 years.
Restricted Stock Units, Performance-Vesting Restricted Stock Units, and Performance Awards
The fair value of the Company’s RSUs and Performance Awards is measured based upon the closing price of its underlying common stock as of the grant date and is recognized over the vesting term. Upon vesting, RSUs convert into an equivalent number of shares of common stock. Restricted shares vest in full after four years. The estimated fair value of restricted shares under the Company's stock plans is determined by the product of the number of shares granted and the grant date market price of the Company's common stock. The estimated fair value of restricted shares is expensed on a straight-line basis over the requisite service period.
Performance Awards and performance-vesting RSUs are granted to certain executives under the 2011 Plan, which represent common stock potentially issuable in the future. Performance stock awards and units vest over a four-year period and the number of shares to be awarded is determined based on the achievement of specific performance goals. Based on the extent to which the targets are achieved at the end of the performance period, vested shares may range from 0 percent to 200 percent of the target award amount. The fair value of performance stock awards and units is determined by the grant date market price of the Company's
78
common stock, and the compensation expense associated with nonvested performance stock awards and units is recognized over the requisite service period and is dependent on the Company's periodic assessment of the probability of the targets being achieved and its estimate of the number of shares that will ultimately be issued. During the fiscal years ended December 31, 2016, 2015 and 2014, the Company recognized $8.3 million, $7.4 million, and $4.5 million of compensation expense, respectively, related to these performance stock awards and units.
In October 2015, in connection with the acquisition of Mortgage Returns, the Company agreed to grant up to 29,006 of performance-vesting RSUs for a total value of $2.0 million to the former Chief Executive Officer of Mortgage Returns. The performance-vesting RSUs granted represent the right to receive shares of the Company’s common stock upon achievement of certain performance criteria and a service requirement during the performance period of October 23, 2015 through October 23, 2019. The performance-vesting RSUs will vest annually based on the achievement of the performance criteria and the service requirement. In December 2016, a modification was made to a performance criteria of the award to align certain performance metrics to the Company’s targets. The modification resulted in an incremental value of approximately $0.2 million that will be recognized over the remaining requisite period; dependent on the Company’s periodic assessment of the probability of achievement.
The following table summarizes the Company’s RSU, Performance Award and performance-vesting RSU activity:
RSUs | Performance Awards and performance-vesting RSUs | ||||||||||||
Number of Shares | Weighted Average Grant Date Fair Value Per Share | Number of Shares | Weighted Average Grant Date Fair Value Per Share | ||||||||||
Outstanding at December 31, 2013 | 257,378 | 23.10 | 565,300 | 24.43 | |||||||||
Granted | 525,063 | 28.85 | 155,953 | 24.93 | |||||||||
Released | (84,682 | ) | 22.56 | (178,076 | ) | 24.71 | |||||||
Forfeited or expired | (111,901 | ) | 29.02 | (58,000 | ) | 24.91 | |||||||
Outstanding at December 31, 2014 | 585,858 | 27.20 | 485,177 | 25.61 | |||||||||
Granted | 401,158 | 62.62 | 205,816 | 47.18 | |||||||||
Released | (179,530 | ) | 25.97 | (182,711 | ) | 24.69 | |||||||
Forfeited or expired | (58,798 | ) | 39.40 | — | — | ||||||||
Outstanding at December 31, 2015 | 748,688 | 45.52 | 508,282 | 34.68 | |||||||||
Granted | 598,390 | 78.39 | 151,540 | 61.69 | |||||||||
Released | (240,386 | ) | 42.48 | (239,120 | ) | 29.34 | |||||||
Forfeited or expired | (81,577 | ) | 57.50 | (13,052 | ) | 68.19 | |||||||
Outstanding at December 31, 2016 | 1,025,115 | $ | 64.47 | 407,650 | $ | 46.77 | |||||||
Ending vested and expected to vest at December 31, 2016 | 912,733 | 407,650 | |||||||||||
RSUs, performance-vesting RSUs and Performance Awards that are expected to vest are presented net of estimated future forfeitures. RSUs released during the years ended December 31, 2016 and 2015 had an aggregate intrinsic value of $20.1 million and $11.1 million, respectively, and an aggregate grant-date fair value of $10.2 million and $4.7 million, respectively. Performance-vesting RSUs and Performance Awards released during the years ended December 31, 2016 and 2015 had an aggregate intrinsic value of $21.8 million and $13.2 million, respectively, and an aggregate grant-date fair value of $7.0 million and $4.5 million, respectively. The number of RSUs released includes shares that the Company withheld on behalf of employees to satisfy the minimum statutory tax withholding requirements.
As of December 31, 2016, total unrecognized compensation expense related to unvested RSUs, performance-vesting RSUs and Performance Awards was $54.4 million and is expected to be recognized over a weighted average period of 2.4 years.
Executive Incentive Plan
On March 14, 2016, the Compensation Committee adopted the Ellie Mae, Inc. Executive Incentive Plan (the “Executive Incentive Plan”). The Executive Incentive Plan was approved by the Company’s stockholders on May 25, 2016. The Executive Incentive Plan has a term of five years from the date of approval by the stockholders, expiring May 25, 2021, and may be terminated, amended or suspended by the Compensation Committee at any prior time, and may also be reinstated. The Company currently expects to issue cash bonus and performance-based equity awards under the Executive Incentive Plan to the Company’s executive officers commencing in 2017. Shares underlying equity awards from the Executive Incentive Plan will be issued from the Company’s 2011 Plan. The equity awards have the following limitations:
79
Stock Option Limitations. The maximum number of shares that may be granted as an incentive stock option under the Executive Incentive Plan is 70,000,000. No participant will be eligible to receive a stock option covering more than 1,000,000 shares in any calendar year.
Performance Units/Performance Share Limitations. No participant will be eligible to receive performance units or performance shares having a grant date value (assuming maximum payout) greater than $10,000,000 or covering more than 1,000,000 shares, whichever is greater, in any calendar year. There have been no shares issued under this plan as of December 31, 2016.
Employee Stock Purchase Plan
Under the ESPP, qualified employees are permitted to purchase the Company’s common stock at 85% of the fair market value of the common stock as of the commencement date of the offering period or as of the specified purchase date, whichever is lower. The ESPP is deemed compensatory and stock-based compensation is recognized in accordance with ASC 718, Stock Compensation. The ESPP is designed to allow eligible employees and the eligible employees of the Company’s participating subsidiaries to purchase shares of common stock, at semi-annual intervals, with their accumulated payroll deductions.
The weighted-average grant-date fair value of awards issued pursuant to the ESPP during the years ended December 31, 2016, 2015, and 2014 were $24.11, $16.12, and $8.38 per share, respectively.
For the years ended December 31, 2016, 2015 and 2014, employees purchased 101,816, 110,598, and 102,111 shares under the ESPP for a total of $6.7 million, $4.1 million, and $2.6 million, respectively. As of December 31, 2016, unrecognized compensation cost related to the current ESPP period which ends on February 27, 2017 was approximately $0.4 million and is expected to be recognized over the next 2 months.
Stock-Based Compensation Expense
Total stock-based compensation expense recognized by the Company consisted of:
Year ended December 31, | |||||||||||
2016 | 2015 | 2014 | |||||||||
(in thousands) | |||||||||||
Stock-based compensation by category of expense: | |||||||||||
Cost of revenues | $ | 4,835 | $ | 3,218 | $ | 1,579 | |||||
Sales and marketing | 4,429 | 2,752 | 1,562 | ||||||||
Research and development | 7,296 | 5,431 | 3,672 | ||||||||
General and administrative | 14,911 | 12,840 | 7,735 | ||||||||
$ | 31,471 | $ | 24,241 | $ | 14,548 | ||||||
The Company capitalized $2.8 million, $1.1 million, and $0.5 million of stock compensation costs as software and website application development costs for the years ended December 31, 2016, 2015, and 2014, respectively.
80
Valuation Information
The fair value of stock options and stock purchase rights granted under the 2009 Plan, the 2011 Plan and the ESPP were estimated at the date of grant using the Black-Scholes option valuation model with the following weighted average assumptions:
Year ended December 31, | ||||||||||
2016 | 2015 | 2014 | ||||||||
Stock option plans: | ||||||||||
Risk-free interest rate | 1.38 | % | 1.50-1.96 | % | 1.55-2.02 | % | ||||
Expected life of options (in years) | 6.08 | 5.00-6.08 | 5.27-6.08 | |||||||
Expected dividend yield | — | % | — | % | — | % | ||||
Volatility | 47 | % | % | 48-49 | % | 49-53 | % | |||
Employee Stock Purchase Plan: | ||||||||||
Risk-free interest rate | 0.46-0.48 | % | 0.13-0.24 | % | 0.05-0.08 | % | ||||
Expected life of options (in years) | 0.5 | 0.5 | 0.5 | |||||||
Expected dividend yield | — | % | — | % | — | % | ||||
Volatility | 33-49 | % | 35-44 | % | 38-39 | % | ||||
Due to the Company’s limited trading history as a publicly held company, the simplified method was used to estimate the expected term of options granted by taking the average of the vesting term and the contractual term of the option. To estimate volatility, management identified a group of publicly traded peer companies that operate in a similar industry. An estimate was determined based on a weighted average of the historical volatilities of these peer companies and the Company’s common stock during the period of time since the Company’s initial public offering. The risk-free interest rate used was the Federal Reserve Bank’s constant maturities interest rate commensurate with the expected life of the options. The expected dividend yield was zero, as the Company does not anticipate paying a dividend within the relevant time frame.
NOTE 11—Employee Benefit Plan
The Company offers a qualified 401(k) defined contribution plan to substantially all of the Company’s employees. Eligible employees may contribute up to the annual amount allowed pursuant to the Internal Revenue Code. In the years ended December 31, 2016, 2015, and 2014, the Company matched 50% of each dollar of employee contribution, up to a maximum match of three percent of the employee’s compensation. The Company’s contributions to the 401(k) plan for the years ended December 31, 2016, 2015, and 2014 were $2.8 million, $2.0 million, and $1.3 million, respectively, which were recognized as expense in the consolidated statements of comprehensive income.
NOTE 12—Segment Information
The Company operates in one industry—mortgage-related software and services. The Company’s chief operating decision maker is its chief executive officer, who makes decisions about resource allocation and reviews financial information presented on a consolidated basis. Accordingly, the Company has determined that it has a single reporting segment and operating unit structure, specifically technology-enabled solutions to help streamline and automate the residential mortgage origination process for its network participants.
The Company is organized primarily on the basis of service lines. Supplemental disclosure of revenues by type is as follows:
Year ended December 31, | |||||||||||
2016 | 2015 | 2014 | |||||||||
(in thousands) | |||||||||||
On-demand revenues(1) | $ | 359,567 | $ | 249,871 | $ | 154,315 | |||||
On-premise revenues(1) | 718 | 4,066 | 7,222 | ||||||||
$ | 360,285 | $ | 253,937 | $ | 161,537 | ||||||
________________
(1) Certain reclassifications of prior period amounts have been made to conform to the current period presentation, such reclassification did not materially change previously reported consolidated financial statements.
81
NOTE 13—Quarterly Results of Operations Data (Unaudited)
Three months ended | |||||||||||||||||||||||||||||||
Dec 31, 2016 | Sep 30, 2016 | Jun 30, 2016 | Mar 31, 2016 | Dec 31, 2015 | Sep 30, 2015 | Jun 30, 2015 | Mar 31, 2015 | ||||||||||||||||||||||||
(unaudited, in thousands, except per share amounts) | |||||||||||||||||||||||||||||||
Revenues | $ | 96,181 | $ | 100,381 | $ | 90,098 | $ | 73,625 | $ | 64,867 | $ | 68,939 | $ | 65,942 | $ | 54,189 | |||||||||||||||
Cost of revenues (1) | 32,843 | 32,218 | 28,453 | 26,631 | 23,555 | 22,441 | 20,862 | 17,350 | |||||||||||||||||||||||
Gross profit | 63,338 | 68,163 | 61,645 | 46,994 | 41,312 | 46,498 | 45,080 | 36,839 | |||||||||||||||||||||||
Operating expenses | |||||||||||||||||||||||||||||||
Sales and marketing (1) | 14,257 | 12,654 | 12,506 | 15,287 | 10,562 | 9,082 | 8,804 | 9,760 | |||||||||||||||||||||||
Research and development (1) | 16,305 | 15,081 | 14,662 | 12,453 | 11,734 | 11,138 | 9,282 | 8,297 | |||||||||||||||||||||||
General and administrative (1) | 18,434 | 19,360 | 17,793 | 15,731 | 14,103 | 16,658 | 14,149 | 12,302 | |||||||||||||||||||||||
Total operating expenses | 48,996 | 47,095 | 44,961 | 43,471 | 36,399 | 36,878 | 32,235 | 30,359 | |||||||||||||||||||||||
Income from operations | 14,342 | 21,068 | 16,684 | 3,523 | 4,913 | 9,620 | 12,845 | 6,480 | |||||||||||||||||||||||
Other income, net | 424 | 204 | 162 | 199 | 180 | 154 | 153 | 132 | |||||||||||||||||||||||
Income before income taxes | 14,766 | 21,272 | 16,846 | 3,722 | 5,093 | 9,774 | 12,998 | 6,612 | |||||||||||||||||||||||
Income tax provision (benefit) | 3,864 | 7,492 | 6,258 | 1,216 | 271 | 3,552 | 5,368 | 3,028 | |||||||||||||||||||||||
Net income | $ | 10,902 | $ | 13,780 | $ | 10,588 | $ | 2,506 | $ | 4,822 | $ | 6,222 | $ | 7,630 | $ | 3,584 | |||||||||||||||
Net income per share | |||||||||||||||||||||||||||||||
Basic | $ | 0.33 | $ | 0.43 | $ | 0.36 | $ | 0.09 | $ | 0.16 | $ | 0.21 | $ | 0.26 | $ | 0.12 | |||||||||||||||
Diluted | $ | 0.31 | $ | 0.41 | $ | 0.34 | $ | 0.08 | $ | 0.16 | $ | 0.20 | $ | 0.25 | $ | 0.12 | |||||||||||||||
Weighted average common shares used in computing net income per share of common stock: | |||||||||||||||||||||||||||||||
Basic | 33,482 | 31,917 | 29,579 | 29,471 | 29,484 | 29,364 | 29,092 | 28,768 | |||||||||||||||||||||||
Diluted | 35,011 | 33,483 | 31,189 | 31,080 | 30,959 | 31,006 | 30,807 | 30,442 | |||||||||||||||||||||||
Net income | $ | 10,902 | $ | 13,780 | $ | 10,588 | $ | 2,506 | $ | 4,822 | $ | 6,222 | $ | 7,630 | $ | 3,584 | |||||||||||||||
Other comprehensive income, net of taxes | |||||||||||||||||||||||||||||||
Unrealized gain (loss) on investments | (284 | ) | (107 | ) | 101 | 328 | (319 | ) | 27 | (41 | ) | 171 | |||||||||||||||||||
Comprehensive income | $ | 10,618 | $ | 13,673 | $ | 10,689 | $ | 2,834 | $ | 4,503 | $ | 6,249 | $ | 7,589 | $ | 3,755 | |||||||||||||||
(1) Stock-based compensation included in the above line items: | |||||||||||||||||||||||||||||||
Three months ended | |||||||||||||||||||||||||||||||
Dec 31, 2016 | Sep 30, 2016 | Jun 30, 2016 | Mar 31, 2016 | Dec 31, 2015 | Sep 30, 2015 | Jun 30, 2015 | Mar 31, 2015 | ||||||||||||||||||||||||
(unaudited, in thousands) | |||||||||||||||||||||||||||||||
Cost of revenues | $ | 1,352 | $ | 1,381 | $ | 1,132 | $ | 970 | $ | 1,029 | $ | 761 | $ | 813 | $ | 615 | |||||||||||||||
Sales and marketing | 1,249 | 1,243 | 1,059 | 878 | 779 | 783 | 673 | 517 | |||||||||||||||||||||||
Research and development | 1,879 | 1,969 | 1,944 | 1,504 | 1,470 | 1,438 | 1,376 | 1,147 | |||||||||||||||||||||||
General and administrative | 3,535 | 4,155 | 3,883 | 3,338 | 3,359 | 3,538 | 3,215 | 2,728 | |||||||||||||||||||||||
Total | $ | 8,015 | $ | 8,748 | $ | 8,018 | $ | 6,690 | $ | 6,637 | $ | 6,520 | $ | 6,077 | $ | 5,007 | |||||||||||||||
82
SCHEDULE II
VALUATION AND QUALIFYING ACCOUNTS
FOR THE YEARS ENDED DECEMBER 31, 2016, 2015 and 2014
(in thousands)
Balance at Beginning of Period | Charged (Credited) to Income | Deductions and Other | Balance at End of Period | ||||||||||||
Allowance for Doubtful Accounts | |||||||||||||||
Year ended December 31, 2016 | $ | 124 | $ | 121 | $ | (200 | ) | (a) | $ | 45 | |||||
Year ended December 31, 2015 | $ | 66 | $ | 62 | $ | (4 | ) | (a) | $ | 124 | |||||
Year ended December 31, 2014 | $ | 81 | $ | (1 | ) | $ | (14 | ) | (a) | $ | 66 | ||||
Income Tax Valuation Allowance | |||||||||||||||
Year ended December 31, 2016 | $ | 3,901 | $ | — | $ | 1,188 | (b) | $ | 5,089 | ||||||
Year ended December 31, 2015 | $ | 2,897 | $ | — | $ | 1,004 | (b) | $ | 3,901 | ||||||
Year ended December 31, 2014 | $ | 2,056 | $ | — | $ | 841 | (b) | $ | 2,897 | ||||||
(a) | Accounts written off, net of recoveries. | ||||||||||||||
(b) | Adjustments to offset changes in deferred tax assets. | ||||||||||||||
ITEM 9. | CHANGES IN AND DISAGREEMENTS WITH ACCOUNTANTS ON ACCOUNTING AND FINANCIAL DISCLOSURE |
Not applicable.
ITEM 9A. | CONTROLS AND PROCEDURES |
Evaluation of Disclosure Controls and Procedures
Our management, with the participation of our Chief Executive Officer and Chief Financial Officer, evaluated the effectiveness of our disclosure controls and procedures as of December 31, 2016. The term “disclosure controls and procedures,” as defined in Rules 13a-15(e) and 15d-15(e) under the Exchange Act, means controls and other procedures of a company that are designed to ensure that information required to be disclosed by a company in the reports that it files or submits under the Exchange Act is recorded, processed, summarized and reported, within the time periods specified in the SEC’s rules and forms. Disclosure controls and procedures include, without limitation, controls and procedures designed to ensure that information required to be disclosed by a company in the reports that it files or submits under the Exchange Act is accumulated and communicated to the company’s management, including its principal executive and principal financial officers, as appropriate to allow timely decisions regarding required disclosure. Management recognizes that any controls and procedures, no matter how well designed and operated, can provide only reasonable assurance of achieving their objectives and management necessarily applies its judgment in evaluating the cost-benefit relationship of possible controls and procedures. Based on the evaluation of our disclosure controls and procedures as of December 31, 2016, our Chief Executive Officer and Chief Financial Officer concluded that, as of such date, our disclosure controls and procedures were effective at the reasonable assurance level.
Management Report on Internal Control Over Financial Reporting
Our management is responsible for establishing and maintaining adequate internal control over financial reporting as defined in Rules 13a-15(f) and 15d-15(f) under the Exchange Act.
Management assessed our internal control over financial reporting as of December 31, 2016, the end of our fiscal year. Management based its assessment on criteria established in Internal Control-Integrated Framework (2013) issued by the Committee of Sponsoring Organizations of the Treadway Commission. Management’s assessment included evaluation of elements such as the design and operating effectiveness of key financial reporting controls, process documentation, accounting policies and our overall control environment.
83
Based on management’s assessment, they have concluded that our internal control over financial reporting was effective as of the end of the fiscal year to provide reasonable assurance regarding the reliability of financial reporting and the preparation of consolidated financial statements for external reporting purposes in accordance with U.S. GAAP. We reviewed the results of management’s assessment with the Audit Committee of our Board of Directors.
Our independent registered public accounting firm, Grant Thornton LLP, independently assessed the effectiveness of the company’s internal control over financial reporting, as stated in their attestation report, which is included in Part II, Item 8 of this Form 10-K.
Changes in Internal Control over Financial Reporting
There was no change in our internal control over financial reporting identified in connection with the evaluation required by Rule 13a-15(d) and 15d-15(d) of the Exchange Act that occurred during the period covered by this report that has materially affected, or is reasonably likely to materially affect, our internal control over financial reporting.
ITEM 9B. | OTHER INFORMATION |
None.
84
PART III
ITEM 10. | DIRECTORS, EXECUTIVE OFFICERS AND CORPORATE GOVERNANCE |
The information under the captions “Election of Directors” and “Section 16(a) Beneficial Ownership Reporting Compliance” in our 2017 Proxy Statement is incorporated herein by reference.
ITEM 11. | EXECUTIVE COMPENSATION |
The information under the captions “Election of Directors,” “Director Compensation,” “Compensation Discussion and Analysis” and “Report of the Compensation Committee of the Board of Directors on Executive Compensation” in our 2017 Proxy Statement is incorporated herein by reference.
ITEM 12. | SECURITY OWNERSHIP OF CERTAIN BENEFICIAL OWNERS AND MANAGEMENT AND RELATED STOCKHOLDER MATTERS |
The information under the captions “Security Ownership of Certain Beneficial Owners and Management” and “Equity Compensation Plan Information” in our 2017 Proxy Statement is incorporated herein by reference.
ITEM 13. | CERTAIN RELATIONSHIPS AND RELATED TRANSACTIONS, AND DIRECTOR INDEPENDENCE |
The information under the captions “Election of Directors” and “Certain Relationships and Related Transactions” in our 2017 Proxy Statement is incorporated herein by reference.
ITEM 14. | PRINCIPAL ACCOUNTING FEES AND SERVICES |
The information under the caption “Ratification of Selection of Independent Registered Public Accounting Firm” in our 2017 Proxy Statement is incorporated herein by reference.
With the exception of the information specifically incorporated by reference in Part III to this Annual Report on Form 10-K from our 2017 Proxy Statement, our 2017 Proxy Statement shall not be deemed to be filed as part of this report.
85
PART IV
ITEM 15. | EXHIBITS AND FINANCIAL STATEMENT SCHEDULES |
(a) | (1 | ) | Financial Statements—The financial statements filed as part of this report are listed on the Index to Consolidated Financial Statements in Item 8. |
(2 | ) | Financial Statement Schedules—The financial statement schedules filed as part of this report are listed on the Index to Consolidated Financial Statements in Item 8. | |
(b) Exhibits. | |||
Reference is made to the Exhibit Index attached hereto.
SIGNATURES
Pursuant to the requirements of Section 13 or Section 15(d) of the Securities Exchange Act of 1934, the registrant has duly caused this report to be signed on its behalf by the undersigned, thereunto duly authorized.
ELLIE MAE, INC. | ||||
Date: | February 21, 2017 | By: | /s/ Edgar A. Luce | |
Edgar A. Luce | ||||
Executive Vice President, Finance and Administration and Chief Financial Officer (Principal Financial and Accounting Officer and duly authorized signatory) | ||||
POWER OF ATTORNEY
KNOW ALL PERSONS BY THESE PRESENTS, that each person whose individual signature appears below hereby authorizes and appoints Jonathan Corr, Edgar A. Luce and Matthew LaVay, and each of them, with full power of substitution and resubstitution and full power to act without the other, as his or her true and lawful attorney-in-fact and agent to act in his or her name, place and stead and to execute in the name and on behalf of each person, individually and in each capacity stated below, and to file any and all amendments to this Annual Report on Form 10-K, and to file the same, with all exhibits thereto, and other documents in connection therewith, with the Securities and Exchange Commission, granting unto said attorneys-in-fact and agents, and each of them, full power and authority to do and perform each and every act and thing, ratifying and confirming all that said attorneys-in-fact and agents or any of them or their or his substitute or substitutes may lawfully do or cause to be done by virtue thereof.
Pursuant to the requirements of the Securities Exchange Act of 1934, this report has been signed below by the following persons on behalf of the registrant and in the capacities and on the dates indicated.
86
Signature | Title | Date | ||
/s/ Jonathan Corr | Chief Executive Officer and Director | February 21, 2017 | ||
Jonathan Corr | (Principal Executive Officer) | |||
/s/ Edgar A. Luce | Executive Vice President, Finance and Administration and | February 21, 2017 | ||
Edgar A. Luce | Chief Financial Officer (principal financial and accounting officer) | |||
/s/ Sigmund Anderman | Executive Chairman and Director | February 21, 2017 | ||
Sigmund Anderman | ||||
/s/ Karen Blasing | Director | February 21, 2017 | ||
Karen Blasing | ||||
/s/ Carl Buccellato | Director | February 21, 2017 | ||
Carl Buccellato | ||||
/s/ Craig Davis | Director | February 21, 2017 | ||
Craig Davis | ||||
/s/ A. Barr Dolan | Director | February 21, 2017 | ||
A. Barr Dolan | ||||
/s/ Robert J. Levin | Director | February 21, 2017 | ||
Robert J. Levin | ||||
/s/ Marina Levinson | Director | February 21, 2017 | ||
Marina Levinson | ||||
/s/ Frank Schultz | Director | February 21, 2017 | ||
Frank Schultz | ||||
/s/ Jeb Spencer | Director | February 21, 2017 | ||
Jeb Spencer | ||||
/s/ Rajat Taneja | Director | February 21, 2017 | ||
Rajat Taneja | ||||
87
INDEX TO EXHIBITS
Exhibit | Incorporated by Reference | Filed | |||||||||
Number | Description of Document | Form | Date | Number | Herewith | ||||||
1.1 | Underwriting Agreement, dated as of August 3, 2016, by and among Ellie Mae, Inc. and J.P. Morgan Securities LLC, Morgan Stanley & Co. LLC and Barclays Capital Inc., as representatives of the several underwriters named in Schedule 1 thereto. | 8-K | 8/9/2016 | 1.1 | |||||||
3.1 | Amended and Restated Certificate of Incorporation of Ellie Mae, Inc. | 10-Q | 8/5/2015 | 3.1 | |||||||
3.2 | Amended and Restated Bylaws of Ellie Mae, Inc. | 8-K | 11/21/2016 | 3.1 | |||||||
4.1 | Form of Ellie Mae, Inc.’s Common Stock Certificate. | S-1/A | 2/17/2011 | 4.1 | |||||||
4.2 | Form of Indenture. | S-3ASR | 8/1/2016 | 4.2 | |||||||
10.1 | Lease, dated as of July 17, 2014, by and between Ellie Mae, Inc. and SFI PLEASANTON, LLC. | 10-Q | 11/6/2014 | 10.2 | |||||||
10.2± | Form of Indemnification Agreement by and between Ellie Mae, Inc. and each of its directors and executive officers. | S-1/A | 8/5/2010 | 10.3 | |||||||
10.3± | Form of Change of Control Severance Agreement between Ellie Mae, Inc. and each of its executive officers. | 10-K | 3/2/2015 | 10.5 | |||||||
10.4± | Fourth Amended and Restated Employment Agreement, dated as of January 5, 2015, by and between Ellie Mae, Inc. and Sigmund Anderman. | 8-K | 1/5/2015 | 10.1 | |||||||
10.5± | Employment Agreement, dated as of January 5, 2015, by and between Ellie Mae, Inc. and Jonathan H. Corr. | 8-K | 1/5/2015 | 10.2 | |||||||
10.6± | Offer Letter, dated as of July 14, 2005, by and between Ellie Mae, Inc. and Edgar Luce. | S-1 | 4/30/2010 | 10.7 | |||||||
10.7± | Board of Directors Offer Letter with Marina Levinson, dated as of August 22, 2014. | 10-Q | 11/6/2014 | 10.5 | |||||||
10.8± | Ellie Mae, Inc. 2009 Stock Option and Incentive Plan, including the form of stock option agreement. | S-1 | 4/30/2010 | 10.2 | |||||||
10.9± | Amendment to the Ellie Mae, Inc. 2009 Stock Option and Incentive Plan, effective April 15, 2010. | S-1/A | 2/17/2011 | 10.24 | |||||||
10.10± | Amendment to the Ellie Mae, Inc. 2009 Stock Option and Incentive Plan, effective September 16, 2010. | S-1/A | 2/17/2011 | 10.25 | |||||||
10.11± | Ellie Mae, Inc. 2011 Equity Incentive Award Plan. | S-8 | 5/25/2011 | 10.5 | |||||||
10.12(a)± | Form of Stock Option Grant Notice and Stock Option Agreement for Awards under the Ellie Mae, Inc. 2011 Equity Incentive Award Plan (used until January 1, 2015). | S-8 | 5/25/2011 | 10.6 | |||||||
Exhibit | Incorporated by Reference | Filed | |||||||||
Number | Description of Document | Form | Date | Number | Herewith | ||||||
10.12(b)± | Form of Stock Option Grant Notice and Stock Option Agreement for Awards under the Ellie Mae, Inc. 2011 Equity Incentive Award Plan (used for employees who are not executive officers beginning January 1, 2015). | S-8 | 2/10/2015 | 10.2(b) | |||||||
10.12(c)± | Form of Stock Option Grant Notice and Stock Option Agreement for Awards under the Ellie Mae, Inc. 2011 Equity Incentive Award Plan (used for executive officers and directors beginning January 1, 2015). | S-8 | 2/10/2015 | 10.2(c) | |||||||
10.12(d)± | Form of Restricted Stock Unit Award Grant Notice and Restricted Stock Unit Award Agreement for Awards under the Ellie Mae, Inc. 2011 Equity Incentive Award Plan (used until January 1, 2015). | S-8 | 5/25/2011 | 10.7 | |||||||
10.12(e)± | Form of Restricted Stock Unit Award Grant Notice and Restricted Stock Unit Award Agreement for Awards under the Ellie Mae, Inc. 2011 Equity Incentive Plan (used for employees who are not executive officers beginning January 1, 2015). | S-8 | 2/10/2015 | 10.3(b) | |||||||
10.13(f)± | Form of Restricted Stock Unit Award Grant Notice and Restricted Stock Unit Award Agreement for Awards under the Ellie Mae, Inc. 2011 Equity Incentive Plan (used for executive officers and directors beginning January 1, 2015). | S-8 | 2/10/2015 | 10.3(c) | |||||||
10.14± | Ellie Mae, Inc. Employee Stock Purchase Plan. | S-8 | 5/25/2011 | 10.8 | |||||||
10.15(a)± | Ellie Mae, Inc. 2012 Senior Executive Performance Share Program. | 10-Q | 11/8/2012 | 10.1 | |||||||
10.15(b)± | Form of Notice of Grant and Agreement for Performance Shares for Senior Executives under the Ellie Mae, Inc. 2012 Senior Executive Performance Share Program and Ellie Mae, Inc. 2011 Equity Incentive Award Plan. | 10-Q | 11/8/2012 | 10.2 | |||||||
10.16(a)± | Ellie Mae, Inc. 2013 Senior Executive Performance Share Program. | 10-Q | 5/7/2013 | 10.1 | |||||||
10.16(b)± | Form of Notice of Grant of and Grant Agreement for Performance Shares for Senior Executives under the Ellie Mae, Inc. 2013 Senior Executive Performance Share Program and Ellie Mae, Inc. 2011 Equity Incentive Award Plan. | 10-Q | 5/7/2013 | 10.2 | |||||||
10.17(a)± | Ellie Mae, Inc. 2014 Senior Executive Performance Share Program. | 10-K | 3/14/2014 | 10.20 | |||||||
10.17(b)± | Form of Notice of Grant of and Grant Agreement for Performance Shares for Senior Executives under the Ellie Mae, Inc. 2014 Senior Executive Performance Share Program and Ellie Mae, Inc. 2011 Equity Incentive Award Plan. | 10-K | 3/14/2014 | 10.21 | |||||||
10.18± | Non-Employee Director Equity Compensation Policy. | 8-K | 6/6/2016 | 10.1 | |||||||
Exhibit | Incorporated by Reference | Filed | |||||||||
Number | Description of Document | Form | Date | Number | Herewith | ||||||
10.19± | Amended and Restated 2015 Senior Executive Performance Share Program, dated as of March 23, 2015. | 10-Q | 5/7/2015 | 10.3 | |||||||
10.20± | Promotion Letter with Cathleen Schreiner Gates, dated as of March 23, 2015. | 10-Q | 5/7/2015 | 10.4 | |||||||
10.21± | Promotion Letter with Joseph Tyrell, dated as of March 23, 2015. | 10-Q | 5/7/2015 | 10.5 | |||||||
10.22± | Board of Directors Offer Letter with Rajat Taneja, dated May 15, 2015. | 10-Q | 8/5/2015 | 10.1 | |||||||
10.23± | Board of Directors Offer Letter with Karen Blasing, dated May 15, 2015. | 10-Q | 8/5/2015 | 10.2 | |||||||
10.24± | Offer Letter, dated as of June 2, 2015, by and between Ellie Mae, Inc. and Pete Hirsch. | 10-Q | 8/5/2015 | 10.4 | |||||||
10.25± | First Amendment to Lease, dated as of July 9, 2015, by and between Ellie Mae, Inc. and SFI Pleasanton, LLC. | 10-Q | 8/5/2015 | 10.5 | |||||||
10.26(a)± | 2016 Senior Executive Performance Share Program. | 10-Q | 5/5/2016 | 10.1 | |||||||
10.26(b)± | Form of Notice of Grant of and Grant Agreement for Performance Shares for Senior Executives under the Ellie Mae, Inc. 2016 Senior Executive Performance Share Program and Ellie Mae, Inc. 2011 Equity Incentive Award Plan. | 10-Q | 5/5/2016 | 10.2 | |||||||
10.27± | Executive Incentive Plan | DEF14A | 4/7/2016 | App. A | |||||||
10.28± | Offer Letter, dated as of May 18, 2016, by and between Ellie Mae, Inc. and Melanie Scott (Simpson). | 10-Q | 11/1/2016 | 10.1 | |||||||
10.29± | Second Amendment to Lease, dated as of July 21, 2016, by and between Ellie Mae, Inc. and SFI Pleasanton, LLC. | 10-Q | 11/1/2016 | 10.2 | |||||||
10.30± | Promotion Letter with Brian Brown, dated as of February 10, 2016. | X | |||||||||
10.31± | Executive Transition Agreement, by and between Ellie Mae, Inc. and Limin Hu, effective as of December 1, 2016. | X | |||||||||
21.1 | List of subsidiaries. | 10-K | 2/25/2016 | 21.1 | |||||||
23.1 | Consent of Grant Thornton LLP, Independent Registered Public Accounting Firm. | X | |||||||||
24.1 | Power of Attorney (included on signature page to this Annual Report on Form 10-K). | X | |||||||||
Exhibit | Incorporated by Reference | Filed | |||||||||
Number | Description of Document | Form | Date | Number | Herewith | ||||||
31.1 | Certification of Chief Executive Officer Pursuant to Rule 13a-14(a) of the Securities Exchange Act of 1934 as Adopted Pursuant to Section 302 of the Sarbanes-Oxley Act of 2002. | X | |||||||||
31.2 | Certification of Chief Financial Officer Pursuant to Rule 13a-14(a) of the Securities Exchange Act of 1934 as Adopted Pursuant to Section 302 of the Sarbanes-Oxley Act of 2002. | X | |||||||||
32.1* | Certification of Chief Financial Officer Pursuant to 18 U.S.C. Section 1350, as Adopted Pursuant to Section 906 of the Sarbanes-Oxley Act of 2002. | X | |||||||||
32.2* | Certification of Chief Executive Officer Pursuant to 18 U.S.C. Section 1350, as Adopted Pursuant to Section 906 of the Sarbanes-Oxley Act of 2002. | X | |||||||||
101.INS | XBRL Instance Document | X | |||||||||
101.SCH | XBRL Taxonomy Extension Schema Document | X | |||||||||
101.CAL | XBRL Taxonomy Extension Calculation Linkbase Document | X | |||||||||
101.DEF | XBRL Taxonomy Extension Definition Linkbase Document | X | |||||||||
101.LAB | XBRL Taxonomy Extension Label Linkbase Document | X | |||||||||
101.PRE | XBRL Taxonomy Extension Presentation Linkbase Document | X | |||||||||
* | Exhibits 32.1 and 32.2 are being furnished and shall not be deemed to be “filed” for purposes of Section 18 of the Securities Exchange Act of 1934, as amended (the “Exchange Act”), or otherwise subject to the liability of that section, nor shall such exhibits be deemed to be incorporated by reference in any registration statement or other document filed under the Securities Act of 1933, as amended, or the Exchange Act, except as otherwise specifically stated in such filing. | ||||||||||
± | Indicates management contract or compensatory plan, contract or arrangement. | ||||||||||