Attached files
Exhibit 13

2016 Annual Report
SEABOARD CORPORATION
Description of Business
Seaboard Corporation and its subsidiaries (“Seaboard”) are a diverse global agribusiness and transportation company. In the United States (“U.S.”), Seaboard is primarily engaged in pork production and processing and ocean transportation. Overseas, Seaboard is primarily engaged in commodity merchandising, grain processing, sugar production and electric power generation. Seaboard also has an interest in a turkey operation in the U.S.
This report, including information included or incorporated by reference in this report, contains certain forward-looking statements with respect to the financial condition, results of operations, plans, objectives, future performance and business of Seaboard. Forward-looking statements generally may be identified as statements that are not historical in nature and statements preceded by, followed by or that include the words: “believes,” “expects,” “may,” “will,” “should,” “could,” “anticipates,” “estimates,” “intends,” or similar expressions. In more specific terms, forward-looking statements, include, without limitation: statements concerning the projection of revenues, income or loss, capital expenditures, capital structure or other financial items, including the impact of mark-to-market accounting on operating income; statements regarding the plans and objectives of management for future operations; statements of future economic performance; statements regarding the intent, belief or current expectations of Seaboard and its management with respect to: (i) Seaboard’s ability to obtain adequate financing and liquidity; (ii) the price of feed stocks and other materials used by Seaboard; (iii) the sales price or market conditions for pork, grains, sugar, turkey and other products and services; (iv) the recorded tax effects under certain circumstances and changes in tax laws; (v) the volume of business and working capital requirements associated with the competitive trading environment for the Commodity Trading and Milling (“CT&M”) segment; (vi) the charter hire rates and fuel prices for vessels; (vii) the fuel costs and spot market prices for electricity in the Dominican Republic; (viii) the effect of the fluctuation in foreign currency exchange rates; (ix) the profitability or sales volume of any of Seaboard’s segments; (x) the anticipated costs and completion timetables for Seaboard’s scheduled capital improvements, acquisitions and dispositions; (xi) the productive capacity of facilities that are planned or under construction, and the timing of the commencement of operations at such facilities; (xii) the increase in Seaboard's hog and other production capacity attributable to acquisitions; or (xiii) other trends affecting Seaboard’s financial condition or results of operations, and statements of the assumptions underlying or relating to any of the foregoing statements.
This list of forward-looking statements is not exclusive. Seaboard undertakes no obligation to publicly update or revise any forward-looking statement, whether as a result of new information, future events, changes in assumptions or otherwise. Forward-looking statements are not guarantees of future performance or results. They involve risks, uncertainties and assumptions. Actual results may differ materially from those contemplated by the forward-looking statements due to a variety of factors. The information contained in this report, including, without limitation, the information under the captions “Management’s Discussion and Analysis of Financial Condition and Results of Operations” and “Letter to Stockholders” identifies important factors which could cause such differences.
2016 Annual Report 1
Letter to Stockholders is intentionally omitted from Exhibit 13 and will be included in the printed Annual Report.
2 2016 Annual Report
SEABOARD CORPORATION
Letter to Stockholders
Letter to Stockholders is intentionally omitted from Exhibit 13 and will be included in the printed Annual Report.
2016 Annual Report 3
SEABOARD CORPORATION
|
|
|
|
|
|
|
Corporate Office Seaboard Corporation Merriam, Kansas Pork Seaboard Foods LLC Pork Division Office Merriam, Kansas Processing Plant Guymon, Oklahoma High Plains Bioenergy, LLC Guymon, Oklahoma HPB – St. Joe Biodiesel LLC St. Joseph, Missouri Seaboard de Mexico USA LLC Mexico Daily’s Premium Meats, LLC* Missoula, Montana Salt Lake City, Utah St. Joseph, Missouri Commodity Trading and Milling Commodity Trading Operations Atlanta, Georgia* Australia* Canada Chapel Hill, North Carolina Colombia Ecuador Greece Isle of Man Kenya Peru* Singapore South Africa Uruguay* Africa Poultry Development Limited* Kenya and Zambia Bag Yaglari Sanayi ve Ticaret T.A.S.* Turkey Beira Grain Terminal, S.A. Mozambique Belarina Alimentos S.A. Brazil Bolux Group Proprietary Limited* Botswana Compania Industrial de Productos Agropecuarios S.A.* Colombia Congo Poultry Limited* Democratic Republic of Congo Flour Mills of Ghana Limited Ghana Gambia Milling Corporation* Gambia |
National Milling Company of Guyana, Inc. Guyana Les Moulins d’Haiti S.E.M.* Haiti Lesotho Flour Mills Limited* Lesotho Life Flour Mill Ltd.* Nigeria LMM Farine, S.A. Madagascar Minoterie de Matadi, S.A.* Democratic Republic of Congo Minoterie du Congo, S.A. Republic of Congo Moderna Alimentos, S.A.* Molinos Champion, S.A.* Ecuador National Milling Corporation Limited Zambia Paramount Mills (Pty) Ltd.* South Africa Rafael del Castillo & Cia. S.A.* Colombia Societe Africaine de Developpement Industriel Alimentaire, S.P.R.L.* Democratic Republic of Congo Unga Holdings Limited* Kenya and Uganda Marine Seaboard Marine Ltd. Marine Division Office Miami, Florida Port Operations Brooklyn, New York Houston, Texas Miami, Florida New Orleans, Louisiana Philadelphia, Pennsylvania Agencia Maritima del Istmo, S.A. Costa Rica Cayman Freight Shipping Services, Ltd. Cayman Islands JacintoPort International LLC Houston, Texas Kingston Wharves Limited* Jamaica Lafito Logistics Holdings, Ltd.* Bahamas Representaciones Maritimas y Aereas, S.A. Guatemala Sea Cargo, S.A. Panama Seaboard de Colombia, S.A. Colombia |
Seaboard de Nicaragua, S.A. Nicaragua Seaboard del Peru, S.A. Peru Seaboard Freight & Shipping Jamaica Limited Jamaica Seaboard Honduras, S. de R.L. de C.V. Honduras Seaboard Marine (Trinidad) Ltd. Trinidad Seaboard Marine of Haiti, S.A. Haiti SEADOM, S.A. Dominican Republic SeaMaritima S.A. de C.V. Mexico Sugar Alconoa S.R.L. Ingenio y Refineria San Martin del Tabacal S.R.L. Argentina Power Transcontinental Capital Corp. (Bermuda) Ltd. La Compania de Electricidad de San Pedro de Macoris* Dominican Republic Turkey Butterball, LLC* Division Office Garner, North Carolina Processing Plants Carthage, Missouri Huntsville, Arkansas Mt. Olive, North Carolina Ozark, Arkansas Further Processing Plants Jonesboro, Arkansas Montgomery, Illinois Raeford, North Carolina Other Mount Dora Farms de Honduras, S.R.L. Honduras Mount Dora Farms Inc. Houston, Texas |
*Represents a non-controlled, non-consolidated affiliate
4 2016 Annual Report
SEABOARD CORPORATION
Division Summaries
Seaboard’s Pork Division is a vertically integrated pork producer and one of the largest producers and processors in the U.S. Seaboard is able to efficiently control pork production across the entire life cycle of a hog, beginning with research and development in nutrition and genetics and extending to the production of high quality meat products at our processing and further processing facilities.
Seaboard’s hog processing facility is located in Guymon, Oklahoma. The facility is a double shift operation that processes approximately 20,500 hogs per day and generally operates at capacity. Weekend shifts are added as market conditions dictate. Hogs processed at the plant are primarily Seaboard-raised hogs. The remaining hogs processed are raised by third parties and purchased under contract or occasionally in the open market. Seaboard produces and sells fresh and frozen pork products to further processors, food service operators, grocery stores, distributors and retail outlets throughout the U.S. Seaboard also sells to distributors, trading companies and further processors in Japan, Mexico, China and numerous other foreign markets.
Seaboard’s hog production facilities consist of genetic and commercial breeding, farrowing, nursery and finishing buildings located in the Central U.S. These facilities have a capacity to produce over five million hogs annually. Seaboard owns and operates seven centrally located feed mills to provide formulated feed to these hogs.
Seaboard produces biodiesel at facilities in Guymon, Oklahoma, and St. Joseph, Missouri. The biodiesel is produced from pork fat supplied by Seaboard’s Guymon pork processing plant and from other animal fat or vegetable oil supplied by non-Seaboard facilities. The biodiesel is sold to fuel blenders for distribution and in the retail markets.
Seaboard’s Pork Division has an agreement with a similarly-sized pork processor, Triumph Foods, LLC (“Triumph”), to market substantially all of the pork products produced at Triumph’s plant in St. Joseph, Missouri. The agreement enhances the efficiency of Seaboard’s sales and marketing efforts and expands Seaboard’s geographic footprint. Seaboard receives a fee on a per head basis on all Triumph products. According to the trade publications Successful Farming and Informa Economics Seaboard was ranked number three in pork production (based on sows in production) and number four (based on daily processing capacity, including Triumph’s capacity) in processing in the U.S. in 2016.
Seaboard’s Pork Division has a 50% noncontrolling interest in Daily’s Premium Meats, LLC (“Daily’s”). Daily’s produces and markets raw and pre-cooked bacon, ham and sausage primarily for the food service industry and, to a lesser extent, retail markets. Daily’s has three further processing plants located in Salt Lake City, Utah, Missoula, Montana, and St. Joseph, Missouri. Seaboard and Triumph each supply raw product to Daily’s.
In May 2015, Seaboard’s Pork Division and Triumph entered into a new joint venture, Seaboard Triumph Foods, LLC, which is constructing a new pork processing facility in Sioux City, Iowa. Construction is expected to be completed in mid-2017. The plant is designed to process about three million market hogs annually operating a single shift. As part of the operations, Seaboard’s Pork Division agreed to provide a portion of the hogs to be processed at the facility. During 2016, the Pork Division acquired hog inventory and related assets that increased Seaboard’s hog production capacity to meet the majority of such hog supply commitment for single shift processing at the new plant.
Commodity Trading and Milling Division
Seaboard’s Commodity Trading and Milling (“CT&M”) Division is an integrated agricultural commodity trading, processing and logistics operation. This Division sources, transports and markets approximately ten million metric tons per year of wheat, corn, soybeans, soybean meal and other commodities primarily to third-party customers and affiliated companies. These commodities are purchased worldwide, with primary destinations in Africa, South America, the Caribbean and Asia. Seaboard integrates the delivery of commodities to its customers through the use of owned or chartered bulk vessels.
2016 Annual Report 5
SEABOARD CORPORATION
Division Summaries
Seaboard’s CT&M Division operates facilities in 29 countries. The commodity trading business has 11 offices in 10 countries, in addition to four non-consolidated affiliates in three other countries. The grain processing businesses operate facilities at 41 locations in 22 countries, and include 7 consolidated and 18 non-consolidated affiliates primarily in Africa, South America, the Caribbean and Asia. Seaboard and its affiliates produce approximately five million metric tons of wheat flour, maize meal, manufactured feed and oilseed crush commodities per year in addition to other related grain-based products.
Marine Division
Seaboard’s Marine Division provides cargo shipping services between the U.S., the Caribbean and Central and South America. Seaboard’s primary operations, located in Miami, include an off-port warehouse for cargo consolidation and temporary storage and a terminal at PortMiami. At the Port of Houston, Seaboard operates a cargo terminal facility that includes on-dock warehouse space for temporary storage of bagged grains, resins and other cargoes. Seaboard also makes scheduled vessel calls to Brooklyn, New York, New Orleans, Louisiana, Philadelphia, Pennsylvania, and various foreign ports in the Caribbean and Central and South America.
This Division’s fleet consists of chartered and, to a lesser extent, owned vessels, and includes dry, refrigerated and specialized containers and other cargo related equipment. Seaboard is the largest shipper in terms of cargo volume in PortMiami. Seaboard provides extensive service between our domestic ports of call and multiple foreign destinations.
To maximize fleet utilization, Seaboard uses a network of offices and agents throughout the U.S., Canada, Latin America and the Caribbean to sell freight at multiple points. Seaboard’s full service capabilities allow transport by truck or rail of import and export cargo to and from various U.S. ports. Seaboard’s frequent sailings and fixed-day schedules allow customers to coordinate manufacturing schedules and maintain inventories at cost-efficient levels.
Sugar Division
In Argentina, Seaboard grows sugarcane, which it uses to produce refined sugar and alcohol. The sugar is primarily marketed locally, with some exports to the U.S. and other South American countries. Seaboard’s sugar processing plant, one of the largest in Argentina, has an annual capacity to produce approximately 250,000 metric tons of sugar and approximately 20 million gallons of alcohol per year. The mill is located in the Salta Province of Argentina, with administrative offices in Buenos Aires. Land owned by Seaboard in Argentina is planted primarily with sugarcane, which supplies the majority of the raw material processed. Depending on local market conditions, sugar may also be purchased from third parties for resale. In addition, this Division sells dehydrated alcohol to certain oil companies under the Argentine governmental bio-ethanol program, which requires alcohol to be blended with gasoline. This Division also owns a 51 megawatt cogeneration power plant, which is fueled by the burning of sugarcane by-products, natural gas and other biomass when available.
Power Division
In the Dominican Republic, Seaboard is an unregulated independent power producer generating electricity for the local power grid from an owned floating power generating facility with a capacity to generate 108 megawatts. Seaboard primarily sells power on the spot market and is not directly involved in the transmission or distribution of electricity. Principal buyers are government-owned distribution companies and partially government-owned generation companies.
Other Divisions
Seaboard has a 50% noncontrolling voting interest in Butterball, LLC (“Butterball”). Butterball is the largest vertically integrated producer, processor and marketer of branded and non-branded turkey and other products in the U.S. Butterball has four processing plants, three further processing plants and numerous live production and feed milling operations located in North Carolina, Arkansas, Missouri, Illinois and Kansas. Butterball produces over one billion pounds of turkey each year. Butterball is a national supplier to retail stores, foodservice outlets, and industrial entities but also exports products to Mexico and numerous other foreign markets.
Seaboard processes jalapeño peppers at its plant in Honduras, which are primarily shipped to and sold in the U.S.
6 2016 Annual Report
SEABOARD CORPORATION
Summary of Selected Financial Data
|
|
|
|
|
|
|
|
|
|
|
|
|
|
|
|
|
|
|
|
|
Years ended December 31, |
|
|||||||||||||
|
(Millions of dollars except per share amounts) |
|
2016 |
|
2015 |
|
2014 |
|
2013 |
|
2012 |
|
|||||
|
Net sales |
|
$ |
5,379 |
|
$ |
5,594 |
|
$ |
6,473 |
|
$ |
6,670 |
|
$ |
6,189 |
|
|
Operating income |
|
$ |
222 |
|
$ |
126 |
|
$ |
424 |
|
$ |
204 |
|
$ |
310 |
|
|
Net earnings attributable to Seaboard |
|
$ |
312 |
|
$ |
171 |
|
$ |
367 |
|
$ |
212 |
|
$ |
287 |
|
|
Basic earnings per common share |
|
$ |
266.50 |
|
$ |
146.44 |
|
$ |
311.44 |
|
$ |
177.53 |
|
$ |
238.24 |
|
|
Total assets |
|
$ |
4,755 |
|
$ |
4,431 |
|
$ |
3,692 |
|
$ |
3,431 |
|
$ |
3,354 |
|
|
Long-term debt, less current maturities |
|
$ |
499 |
|
$ |
518 |
|
$ |
— |
|
$ |
80 |
|
$ |
121 |
|
|
Stockholders’ equity |
|
$ |
3,175 |
|
$ |
2,882 |
|
$ |
2,735 |
|
$ |
2,493 |
|
$ |
2,314 |
|
|
Dividends per common share |
|
$ |
— |
|
$ |
— |
|
$ |
— |
|
$ |
— |
|
$ |
12.00 |
|
In the fourth quarter of 2015, Seaboard recorded interest income of $23 million, net of taxes ($31 million before taxes), or $19.49 per common share, for interest recognized on certain outstanding customer receivable balances in its Power segment. This interest income related to amounts determined to be collectible as of December 31, 2015, but previously had been considered uncollectable in prior years. This amount was fully collected by Seaboard in January 2016.
As of September 27, 2014, Seaboard’s Pork segment sold to Triumph Foods, LLC a 50% interest in Daily’s. Included in net earnings attributable to Seaboard for 2014 is a gain on sale of controlling interest in subsidiary of $40 million, net of taxes ($66 million gain before taxes), or $34.14 per common share.
On January 2, 2013, the American Taxpayer Relief Act of 2012 (the “Tax Act”) was signed into law. As the Tax Act was signed into law in 2013, the effects of the retroactive provisions in this law on current and deferred tax assets and liabilities for Seaboard were recorded in the first quarter of 2013. The total impact was a tax benefit of $8 million or $6.66 per common share, recorded in the first quarter of 2013 related to certain 2012 income tax credits. In addition to this amount was a credit of approximately $11 million, or $9.43 per common share, for 2012 Federal blender’s credits that was recognized as revenues in the first quarter of 2013. There was no tax expense on these transactions.
In December 2012, Seaboard declared and paid a dividend of $12.00 per common share. The increased amount of the dividend (which has historically been $0.75 per common share on a quarterly basis or $3.00 per common share on an annual basis) represented a prepayment of the annual 2013, 2014, 2015 and 2016 dividends ($3.00 per common share per year). Seaboard did not declare a dividend in 2016, 2015, 2014 or 2013. In 2010, Seaboard declared and paid dividends of $9.00 per common share, which included a prepayment of the annual 2011 and 2012 dividends ($3.00 per common share per year). See the Liquidity and Capital Resources section of Management’s Discussion and Analysis for 2017 dividend plans. Basic and diluted earnings per common share are the same for all periods presented.
2016 Annual Report 7
SEABOARD CORPORATION
Company Performance Graph
The Securities and Exchange Commission requires a five-year comparison of stock performance for Seaboard with that of an appropriate broad equity market index and similar industry index. Seaboard’s common stock is traded on the NYSE MKT and provides an appropriate comparison for Seaboard’s stock performance. Because there is no single industry index to compare stock performance, the companies comprising the Dow Jones Food and Marine Transportation Industry indices (the “Peer Group”) were chosen as the second comparison.
The following graph shows a five-year comparison of cumulative total return for Seaboard Corporation, the NYSE MKT Index and the companies comprising the Dow Jones U.S. Food Products and the Dow Jones U.S. Marine Transportation indices, weighted by market capitalization for the five fiscal years commencing December 31, 2011 and ending December 31, 2016. The information presented in the performance graph is historical in nature and is not intended to represent or guarantee future returns.
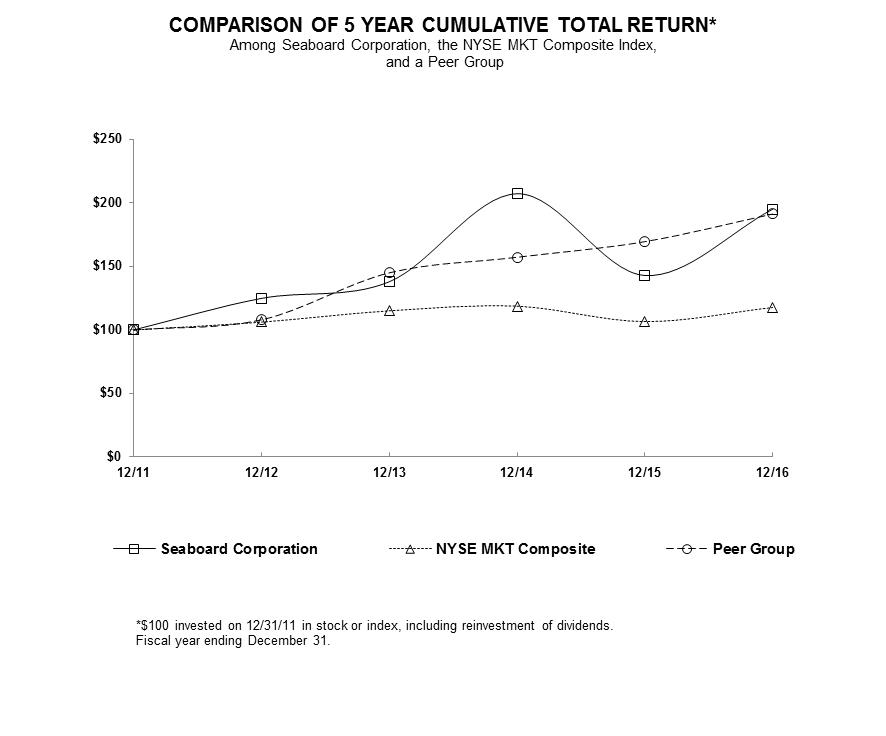
The comparison of cumulative total returns presented in the above graph was plotted using the following index values and common stock price values:
|
|
|
12/31/11 |
|
12/31/12 |
|
12/31/13 |
|
12/31/14 |
|
12/31/15 |
|
12/31/16 |
|
||||||
|
|
|
|
|
|
|
|
|
|
|
|
|
|
|
|
|
|
|
|
|
|
Seaboard Corporation |
|
$ |
100.00 |
|
$ |
124.88 |
|
$ |
137.96 |
|
$ |
207.21 |
|
$ |
142.89 |
|
$ |
195.07 |
|
|
NYSE MKT Composite |
|
$ |
100.00 |
|
$ |
106.15 |
|
$ |
115.07 |
|
$ |
118.71 |
|
$ |
106.60 |
|
$ |
117.67 |
|
|
Peer Group |
|
$ |
100.00 |
|
$ |
107.99 |
|
$ |
144.96 |
|
$ |
157.25 |
|
$ |
169.52 |
|
$ |
191.29 |
|
8 2016 Annual Report
SEABOARD CORPORATION
Quarterly Financial Data (unaudited)
|
|
|
|
|
|
|
|
|
|
|
|
|
|
|
|
|
|
|
(UNAUDITED) |
|
1st |
|
2nd |
|
3rd |
|
4th |
|
Total for |
|
|||||
|
(Millions of dollars except per share amounts) |
|
Quarter |
|
Quarter |
|
Quarter |
|
Quarter |
|
the Year |
|
|||||
|
2016 |
|
|
|
|
|
|
|
|
|
|
|
|
|
|
|
|
|
Net sales |
|
$ |
1,319 |
|
$ |
1,357 |
|
$ |
1,330 |
|
$ |
1,373 |
|
$ |
5,379 |
|
|
|
$ |
36 |
|
$ |
76 |
|
$ |
42 |
|
$ |
68 |
|
$ |
222 |
|
|
|
Net earnings attributable to Seaboard |
|
$ |
54 |
|
$ |
80 |
|
$ |
75 |
|
$ |
103 |
|
$ |
312 |
|
|
Earnings per common share |
|
$ |
45.91 |
|
$ |
68.34 |
|
$ |
64.42 |
|
$ |
87.83 |
|
$ |
266.50 |
|
|
Dividends per common share |
|
$ |
— |
|
$ |
— |
|
$ |
— |
|
$ |
— |
|
$ |
— |
|
|
Closing market price range per common share: |
|
|
|
|
|
|
|
|
|
|
|
|
|
|
|
|
|
High |
|
$ |
3,054.00 |
|
$ |
3,125.00 |
|
$ |
3,440.00 |
|
$ |
4,444.14 |
|
|
|
|
|
Low |
|
$ |
2,483.00 |
|
$ |
2,726.50 |
|
$ |
2,782.92 |
|
$ |
3,201.95 |
|
|
|
|
|
2015 |
|
|
|
|
|
|
|
|
|
|
|
|
|
|
|
|
|
Net sales |
|
$ |
1,452 |
|
$ |
1,428 |
|
$ |
1,411 |
|
$ |
1,303 |
|
$ |
5,594 |
|
|
Operating income |
|
$ |
28 |
|
$ |
32 |
|
$ |
23 |
|
$ |
43 |
|
$ |
126 |
|
|
Net earnings attributable to Seaboard |
|
$ |
33 |
|
$ |
32 |
|
$ |
3 |
|
$ |
103 |
|
$ |
171 |
|
|
Earnings per common share |
|
$ |
28.11 |
|
$ |
27.04 |
|
$ |
2.59 |
|
$ |
88.70 |
|
$ |
146.44 |
|
|
Dividends per common share |
|
$ |
— |
|
$ |
— |
|
$ |
— |
|
$ |
— |
|
$ |
— |
|
|
Closing market price range per common share: |
|
|
|
|
|
|
|
|
|
|
|
|
|
|
|
|
|
High |
|
$ |
4,640.00 |
|
$ |
4,005.00 |
|
$ |
3,675.00 |
|
$ |
3,441.00 |
|
|
|
|
|
Low |
|
$ |
3,705.00 |
|
$ |
3,253.00 |
|
$ |
2,971.95 |
|
$ |
2,892.00 |
|
|
|
|
On December 18, 2015, the Protecting Americans from Tax Hikes Act of 2015 (the “2015 Tax Act”) was signed into law. The 2015 Tax Act reinstated and made permanent certain expired corporate income tax provisions that impact current and deferred taxes for financial reporting purposes. The annual effects of the provisions in this law on current and deferred tax assets and liabilities for Seaboard were recorded in the fourth quarter of 2015. The impact was a tax benefit of $13 million, or $10.92 per common share, primarily related to certain income tax credits. In addition to this amount was a credit of $17 million, or $14.88 per common share, for the 2015 Federal blender’s credits (extended by the 2015 Tax Act through December 31, 2016) that was recognized as revenues in the fourth quarter of 2015. There was no tax expense on these transactions. Since the 2015 Tax Act extended the provisions through December 31, 2016, revenue was recognized ratably throughout 2016. The Federal blender’s credits have not been renewed for 2017.
In the fourth quarter of 2015, Seaboard recorded interest income of $23 million, net of taxes ($31 million before taxes), or $19.49 per common share, for interest recognized on certain outstanding customer receivable balances in its Power segment. This interest income related to amounts determined to be collectible as of December 31, 2015, but previously had been considered uncollectable in prior years. This amount was fully collected by Seaboard in January 2016.
No dividends were paid during 2016 and 2015 as they were declared and prepaid in December 2012. During 2016 and 2015, Seaboard did not repurchase any common shares. See the Liquidity and Capital Resources section of Management’s Discussion and Analysis for 2017 dividend plans.
2016 Annual Report 9
SEABOARD CORPORATION
Management’s Discussion & Analysis
MANAGEMENT’S DISCUSSION AND ANALYSIS OF FINANCIAL CONDITION AND RESULTS OF OPERATIONS
OVERVIEW
Seaboard is a diverse global agribusiness and transportation company, with operations in several industries. Most of the sales and costs of Seaboard’s segments are significantly influenced by worldwide fluctuations in commodity prices and changes in foreign political and economic conditions. Accordingly, sales, operating income and cash flows can fluctuate significantly from year to year. As each segment operates in distinct industries and different geographical locations, management evaluates their operations separately. Seaboard’s reporting segments are based on information used by Seaboard’s Chief Executive Officer in his capacity as chief operating decision maker to determine allocation of resources and assess performance.
Pork Segment
The Pork segment is primarily a U.S. business with some export sales to Japan, Mexico, China and numerous other foreign markets. Revenues from the sale of pork products are primarily generated from a single hog processing plant in Guymon, Oklahoma, which generally operates at daily double shift processing capacity of approximately 20,500 hogs, and a ham boning and processing plant in Mexico. In 2016, Seaboard raised approximately 81% of the hogs processed at the Guymon plant, with the remaining hog requirements purchased primarily under contracts from independent producers. This segment is Seaboard’s most capital intensive segment, representing approximately 57% of Seaboard’s total fixed assets, in addition to 40% of total inventories.
Within the portfolio of Seaboard’s businesses, management believes profitability of the Pork segment is most susceptible to commodity price fluctuations. As a result, this segment’s operating income and cash flows can materially fluctuate from year to year, significantly affecting Seaboard’s consolidated operating income and cash flows. Sales prices are directly affected by both domestic and worldwide supply and demand for pork products and other proteins. Feed accounts for the largest input cost in raising hogs and is materially affected by price changes for corn and soybean meal. Market prices for hogs purchased from third parties for processing at the plant also represent a major cost factor. With the Guymon plant generally operating at capacity, Seaboard is constantly looking for ways to enhance the facility’s operational efficiency, while also looking to increase margins by introducing new, higher value products.
The Pork segment also produces biodiesel, which is sold to third parties. Biodiesel is produced from pork fat from Seaboard’s pork processing plant and from other animal fat or vegetable oil purchased from third parties.
The Pork segment has an agreement with Triumph Foods, LLC (“Triumph”) to market substantially all of the pork products produced at Triumph’s plant in St. Joseph, Missouri. The Pork segment markets the pork products for a fee primarily based on the number of head processed by Triumph. Triumph has processing capacity similar to that of Seaboard’s Guymon plant and operates with an integrated model similar to Seaboard’s model. Seaboard’s sales prices for its pork products are primarily based on a margin sharing arrangement that considers the average sales price and mix of products sold from both Seaboard’s and Triumph’s hog processing plants.
The Pork segment has a 50% noncontrolling interest in Daily’s Premium Meats, LLC (“Daily’s”). Daily’s produces and markets raw and pre-cooked bacon, ham and sausage primarily for the food service industry and, to a lesser extent, retail markets. Daily’s has three further processing plants located in Salt Lake City, Utah, Missoula, Montana, and St. Joseph, Missouri.
In May 2015, Seaboard’s Pork segment and Triumph entered into a new joint venture, Seaboard Triumph Foods, LLC (“STF”), which is constructing a new pork processing facility in Sioux City, Iowa. Construction is expected to be completed in mid-2017. The plant is designed to process about three million market hogs annually operating a single shift. As part of the operations, Seaboard’s Pork segment agreed to provide a portion of the hogs to be processed at the facility. During 2016, the Pork segment acquired hog inventory and related assets in the Central U.S. that increased Seaboard’s hog production capacity to meet the majority of such hog supply commitment for single shift processing at the new plant.
Commodity Trading and Milling Segment
The Commodity Trading and Milling (“CT&M”) segment, which is managed under the name of Seaboard Overseas and Trading Group, primarily operates overseas and is an integrated agricultural commodity trading, processing and logistics operation with locations in Africa, South America, the Caribbean, Europe and Asia. These foreign operations can be significantly impacted by changes in local crop production, political instability and local government policies, as well as
10 2016 Annual Report
SEABOARD CORPORATION
Management’s Discussion & Analysis
fluctuations in economic and industry conditions and foreign currency exchange rates. This segment’s sales are also significantly affected by fluctuating prices of various commodities, such as wheat, corn, soybeans and soybean meal. Although this segment owns three vessels, the majority of the trading business is transacted with chartered ships. Freight rates, influenced by available charter capacity for worldwide trade in bulk cargoes, and related fuel costs affect business volumes and margins. Consolidated and non-consolidated affiliates operate the grain processing businesses in foreign countries that are in most cases lesser developed. Flour exports of various countries can exacerbate volatile market conditions that may have a significant impact on both the trading and milling businesses’ sales and operating income. This segment represents approximately 51% of Seaboard’s total inventories at December 31, 2016.
The majority of CT&M segment’s sales are derived from its commodity trading business in which agricultural commodities are sourced from multiple origins and delivered to third-party and affiliate customers in various international locations. The execution of these purchase and delivery transactions have long cycles of completion, which may extend for several months with a high degree of price volatility. As a result, these factors can significantly affect sales volumes, operating income, working capital and related cash flows from quarter to quarter. Profit margins are sometimes protected by using commodity derivatives and other risk management practices. Seaboard invested in several entities in recent years and continues to seek opportunities to expand its trading, milling and agro-processing business.
Marine Segment
The Marine segment provides cargo shipping services primarily between the U.S. and 26 countries in the Caribbean and Central and South America. Fluctuations in economic conditions and political instability in the regions or countries in which Seaboard operates may affect trade volumes and operating profits. In addition, cargo rates can fluctuate depending on local supply and demand for shipping services. This segment time-charters the majority of its ocean cargo vessels and is therefore affected by fluctuations in charter hire rates, as well as fuel costs. Seaboard continues to explore ways to increase volumes on existing routes, while seeking opportunities to broaden its route structure in the regions it serves.
Sugar Segment
The Sugar segment operates a vertically integrated sugar and alcohol production facility in Argentina. This segment’s sales and operating income are significantly affected by local and worldwide sugar prices. Domestic sugar production levels in Argentina affect the local price. Global sugar price fluctuations, to a lesser extent, have an impact in Argentina as well. Depending on local market conditions, this business purchases sugar from third parties for resale. This segment sells dehydrated alcohol to certain oil companies under an Argentine government bio-ethanol program, which mandates that alcohol be blended with gasoline. This segment also owns a 51 megawatt cogeneration power plant, which is fueled by the burning of sugarcane by-products, natural gas and other biomass when available. The functional currency of the Sugar segment is the Argentine peso. The currency exchange rate can have an impact on reported U.S. dollar sales, operating income and cash flows. Seaboard continues to explore various ways to improve and expand this segment, investing in efficiency improvements and production capacity increases.
Power Segment
The Power segment is an unregulated independent power producer in the Dominican Republic generating electricity from a system of diesel engines mounted on a floating power generating facility for the local power grid. Seaboard sells power on the spot market primarily to government-owned distribution companies and partially government-owned generation companies. This segment is subject to delays in obtaining timely collections from sales to these government-related entities. Supply of power in the Dominican Republic is determined by a government body and is subject to fluctuations based on governmental budgetary constraints. While fuel is this segment’s largest cost component and is subject to price swings, higher fuel costs generally have been passed on to customers. In 2015, Seaboard invested an additional $10 million in a business operating a 300 megawatt electricity generating facility in the Dominican Republic, increasing Seaboard’s ownership interest to 29.9%. See Note 4 to the consolidated financial statements for further discussion. Seaboard may pursue further power industry investments in the future.
Turkey Segment
Seaboard has a 50% noncontrolling voting interest in Butterball, LLC (“Butterball”). Butterball is a vertically integrated producer, processor and marketer of branded and non-branded turkey and other products. Butterball has four processing plants, three further processing plants and numerous live production and feed milling operations located in North Carolina, Arkansas, Missouri, Illinois and Kansas. Sales prices are directly affected by both domestic and worldwide supply and demand for turkey products and other proteins. Feed accounts for the largest input cost in raising turkeys and is materially affected by price changes for corn and soybean meal. As a result, commodity price fluctuations can
2016 Annual Report 11
SEABOARD CORPORATION
Management’s Discussion & Analysis
significantly affect the profitability and cash flows of Butterball. The turkey business is seasonal only on the whole bird side, with the Thanksgiving and Christmas holidays driving the majority of those sales.
LIQUIDITY AND CAPITAL RESOURCES
Summary of Sources and Uses of Cash
Cash and short-term investments as of December 31, 2016 increased $50 million from December 31, 2015. The increase was primarily the result of net cash from operating activities of $427 million, net proceeds from short-term investments of $53 million and proceeds from sale of fixed assets of $47 million. Partially offsetting the increase was cash used for acquisition of businesses of $219 million, capital expenditures of $158 million, investments in affiliates of $71 million and purchase of long-term investments of $31 million. Cash from operating activities increased $11 million for 2016 primarily as a result of higher net earnings, partially offset by working capital changes.
Cash and short-term investments as of December 31, 2015 increased $777 million from December 31, 2014. The increase was primarily the result of net cash from proceeds related to issuance of long-term debt of $522 million, operating activities of $416 million, notes payable borrowings of $83 million and proceeds from sale of fixed assets of $48 million. Partially offsetting the increase was cash used for capital expenditures of $139 million, investments in affiliates of $119 million and purchase of long-term investments of $28 million. Cash from operating activities increased $42 million for 2015 primarily as a result of decreases in accounts receivable and increases in current liabilities, principally in the CT&M segment, partially offset by lower net earnings.
Capital Expenditures, Acquisitions and Other Investing Activities
During 2016, Seaboard invested $158 million in property, plant and equipment, of which $69 million was in the Pork segment, $35 million in the CT&M segment, $19 million in the Marine segment and $34 million in the Sugar Segment. The Pork segment expenditures were primarily for improvements to existing facilities and related equipment, additional hog finishing barns and the June 2016 purchase and improvement of a biodiesel plant in St. Joseph, Missouri, for $6 million that became operational in the third quarter. Of the CT&M segment expenditures, $29 million was for the construction of two dry bulk vessels, which were delivered and then sold and leased back by Seaboard at book value of $44 million during the first quarter of 2016. The Marine segment expenditures were primarily for purchases of cargo carrying and handling equipment. The Sugar segment expenditures were primarily for milling capacity increase and fermentation and distillery equipment upgrades. All other capital expenditures were primarily of a normal recurring nature and included replacements of machinery and equipment, and general facility modernizations and upgrades.
The total 2017 capital expenditures budget is $231 million. The Pork segment plans to spend $75 million primarily for improvements to existing facilities and related equipment and additional hog finishing barns. The CT&M segment plans to spend $72 million primarily for milling assets, a pulse and grain elevator, and other improvements to existing facilities and related equipment. The Marine segment has budgeted $59 million primarily for additional cargo carrying and handling equipment and port improvements. The Sugar segment plans to spend $24 million primarily for increasing the milling capacity, enhancing energy production installations, and improving logistics infrastructure. The balance of $1 million is planned to be spent in all other businesses primarily for normal upgrades to existing operations. Management anticipates paying for these capital expenditures from a combination of available cash, the use of available short-term investments and Seaboard’s available borrowing capacity.
During 2015, Seaboard invested $139 million in property, plant and equipment, of which $40 million was in the Pork segment, $40 million in the CT&M segment and $43 million in the Marine segment. The Pork segment expenditures were primarily for improvements to existing facilities and related equipment and additional hog finishing barns. Of the CT&M segment expenditures, $30 million was for the construction of dry bulk vessels, two of which were delivered and then sold and leased back by Seaboard at book value of $44 million in 2015. The Marine segment expenditures were primarily for purchases of cargo carrying and handling equipment and $8 million for the purchase of a containerized cargo vessel. All other capital expenditures were of a normal recurring nature and primarily included replacements of machinery and equipment, and general facility modernizations and upgrades.
During 2014, Seaboard invested $121 million in property, plant and equipment, of which $54 million was in the Pork segment, $21 million in the CT&M segment and $29 million in the Marine segment. The Pork segment expenditures were primarily for improvements to existing facilities and related equipment, additional finishing barns and compressed natural gas semi-tractors and related refueling stations. The CT&M segment expenditures were primarily for payments related to building four vessels. The Marine segment expenditures were primarily for purchases of cargo carrying and
12 2016 Annual Report
SEABOARD CORPORATION
Management’s Discussion & Analysis
handling equipment. All other capital expenditures were of a normal recurring nature and primarily included replacements of machinery and equipment, and general facility modernizations.
During 2016 and 2015, Seaboard contributed $51 million and $26 million, respectively, to STF, its newly formed 50% joint venture, for construction of a pork processing facility in Sioux City, Iowa. As the joint venture obtained third-party financing in March 2016, the original subscription agreement was amended to modify the total contribution amount and timing of payments. Seaboard’s remaining commitment of approximately $73 million is expected to be contributed in 2017. In addition to capital contributions, Seaboard also agreed to provide a portion of the hogs to be processed at the facility. During 2016, Seaboard acquired hog inventory and related assets through acquisitions of existing farm operations for a total investment of $219 million. These assets increased Seaboard’s hog production capacity to meet the majority of such hog supply commitment for single shift processing at the new plant. Seaboard anticipates buying additional hog inventory and related assets during 2017 to further increase its hog supply capacity. See Note 12 to the consolidated financial statements for further discussion of the significant acquisitions. The new pork processing facility is expected to begin operations in mid-2017. During the first quarter of 2017, STF announced plans to expand the pork processing plant to be capable of processing an additional three million market hogs annually by operating a second shift. The expansion is estimated to cost approximately $47 million, of which Seaboard could be required to commit up to 50% of the amount.
Also during 2016, Seaboard invested $7 million of cash and converted its $8 million note receivable to equity for a 36% noncontrolling interest in a holding company that owns a controlling interest in two Haitian start-up projects consisting of a marine terminal operation and a free trade zone development, which includes a planned power plant. The investment is accounted for in the Marine segment using the equity method and reported on a three-month lag. Seaboard’s first proportionate share of income (loss) from affiliates was recognized in the second quarter of 2016. The note receivable, which included $4 million loaned in 2014 and $4 million loaned in 2015, was converted into equity by Seaboard once certain business operating conditions were met in Haiti.
Seaboard continued to invest in a flour production business in Brazil, of which Seaboard now holds a 98% noncontrolling interest. During 2016, 2015 and 2014, Seaboard invested an additional $14 million, $28 million and $4 million, respectively, in equity and long-term advances. See Note 4 to the consolidated financial statements for further discussion of this investment.
Seaboard invested in two limited liability companies that operate refined coal processing plants, one in Oklahoma during 2015 and one in Nebraska during 2016. Production of refined coal generates federal income tax credits. Seaboard’s funding commitment for these companies varies depending on production and, based on current production estimates, is anticipated to each be between $7 million and $9 million per year until 2021, for a total estimate of approximately $73 million as of December 31, 2016. Seaboard invested $14 million and $9 million during 2016 and 2015, respectively.
During 2015, the CT&M and Power segments invested in several businesses. Seaboard contributed $13 million in cash, a small amount of other assets, certain employees and rights to sell certain agricultural commodities that Seaboard had previously sold through its subsidiary, PS International, LLC, for a 40% noncontrolling interest in a commodity trading business in Atlanta, Georgia. Also, Seaboard invested $8 million in a flour milling business in Botswana for a 49% noncontrolling interest, $10 million for a 45% noncontrolling interest in a commodity trading and flour milling business in Uruguay, $10 million in an oilseed crushing business in the Republic of Turkey for a 25% noncontrolling interest, and $18 million for a 12% noncontrolling interest in a grain trading and poultry business in Morocco, which is accounted for using the cost method. During 2015, the Power segment invested $10 million in a business operating a 300 megawatt electricity generating facility in the Dominican Republic, increasing Seaboard’s ownership interest to 29.9%. See Note 4 to the consolidated financial statements for further discussion.
During 2014, the Pork segment sold a business, and the Marine segment invested in a business. In September 2014, the Pork segment sold to Triumph Foods, LLC a 50% interest in its Daily’s Premium Meats division for $74 million. Also in that month, Seaboard’s Marine segment invested $17 million in a cargo terminal business in Jamaica for a 21% noncontrolling interest. See Note 4 to the consolidated financial statements for further discussion.
2016 Annual Report 13
SEABOARD CORPORATION
Management’s Discussion & Analysis
Financing Activities, Debt and Related Covenants
The following table presents a summary of Seaboard’s available borrowing capacity as of December 31, 2016. At December 31, 2016, borrowings under the uncommitted lines of credit totaled $121 million, with all such borrowings related to foreign subsidiaries. See Note 7 to the consolidated financial statements for further discussion.
|
|
|
|
|
|
|
|
|
Total amount |
|
|
|
(Millions of dollars) |
|
available |
|
|
|
Short-term uncommitted and committed lines |
|
$ |
480 |
|
|
Amounts drawn against lines |
|
|
(121) |
|
|
Letters of credit reducing borrowing availability |
|
|
(4) |
|
|
Available borrowing capacity at December 31, 2016 |
|
$ |
355 |
|
On September 30, 2016, Seaboard entered into a $100 million committed line of credit with Wells Fargo Bank, National Association (“Wells Fargo”) that matures on September 29, 2017. Interest is computed at LIBOR plus 0.50%, and Seaboard incurs an unused commitment fee of 0.09% per annum. This line of credit is secured by certain short-term investments. The line of credit is subject to standard representations and covenants. There was no outstanding balance as of December 31, 2016.
At December 31, 2016, Seaboard had an unsecured term loan, which matures in 2022, with a balance of $497 million and $20 million of foreign subsidiary debt, primarily denominated in Argentine pesos. Seaboard was in compliance with all restrictive covenants related to these loans and facilities as of December 31, 2016. Seaboard has capacity under existing loan covenants to undertake additional debt financings of approximately $1,605 million at December 31, 2016. See Note 7 to the consolidated financial statements for further discussion of notes payable and long-term debt.
As of December 31, 2016, Seaboard had cash and short-term investments of $1,354 million and additional total working capital of $709 million. Accordingly, management believes Seaboard’s combination of internally generated cash, liquidity, capital resources and borrowing capabilities will be adequate for its existing operations and any currently known potential plans for expansion of existing operations or business segments for 2017. Management intends to continue seeking opportunities for expansion in the industries in which Seaboard operates, utilizing existing liquidity, available borrowing capacity and other financing alternatives.
As of December 31, 2016, $441 million of the $1,354 million of cash and short-term investments were held by Seaboard’s foreign subsidiaries, and Seaboard could be required to accrue and pay taxes to repatriate these funds if needed for Seaboard’s operations in the U.S. However, Seaboard’s intent is to permanently reinvest these funds outside the U.S., and current plans do not demonstrate a need to repatriate them to fund Seaboard’s U.S. operations.
Seaboard used cash to repurchase 18,405 shares of common stock at a total price of $53 million in 2014. No common stock was repurchased in 2016 or 2015. There were no dividends paid in 2016, 2015 or 2014. On February 2, 2017, Seaboard declared a quarterly dividend of $1.50 per share of common stock payable on February 23, 2017. Seaboard’s Board of Directors intends that Seaboard will continue to pay quarterly dividends for the reasonably foreseeable future, with the amount of any dividends being dependent upon such factors as Seaboard’s financial condition, results of operations and current and anticipated cash needs, including capital requirements. See Note 11 to the consolidated financial statements for further discussion on stockholders’ equity.
14 2016 Annual Report
SEABOARD CORPORATION
Management’s Discussion & Analysis
Contractual Obligations and Off-Balance Sheet Arrangements
The following table provides a summary of Seaboard’s contractual obligations as of December 31, 2016.
|
|
|
|
|
|
|
|
|
|
|
|
|
|
|
|
|
|
|
|
|
Payments due by period |
|
|||||||||||||
|
|
|
|
|
|
Less than |
|
1-3 |
|
3-5 |
|
More than |
|
||||
|
(Millions of dollars) |
|
Total |
1 year |
|
years |
|
years |
|
5 years |
|
||||||
|
Vessel, time and voyage-charter commitments |
|
$ |
198 |
|
$ |
47 |
|
$ |
53 |
|
$ |
52 |
|
$ |
46 |
|
|
Contract grower agreements |
|
|
100 |
|
|
29 |
|
|
40 |
|
|
22 |
|
|
9 |
|
|
Other operating lease payments |
|
|
307 |
|
|
31 |
|
|
54 |
|
|
46 |
|
|
176 |
|
|
Total lease obligations |
|
|
605 |
|
|
107 |
|
|
147 |
|
|
120 |
|
|
231 |
|
|
Short-term notes payable |
|
|
121 |
|
|
121 |
|
|
— |
|
|
— |
|
|
— |
|
|
Long-term debt |
|
|
517 |
|
|
17 |
|
|
54 |
|
|
80 |
|
|
366 |
|
|
Interest payments (1) |
|
|
77 |
|
|
17 |
|
|
30 |
|
|
21 |
|
|
9 |
|
|
Retirement benefit payments (2) |
|
|
96 |
|
|
8 |
|
|
18 |
|
|
16 |
|
|
54 |
|
|
Investment in affiliates (3) |
|
|
150 |
|
|
91 |
|
|
31 |
|
|
28 |
|
|
— |
|
|
Other purchase commitments |
|
|
947 |
|
|
638 |
|
|
105 |
|
|
86 |
|
|
118 |
|
|
Total contractual cash obligations and commitments |
|
$ |
2,513 |
|
$ |
999 |
|
$ |
385 |
|
$ |
351 |
|
$ |
778 |
|
(1) Interest payments in the table above include cash payments for interest on variable rate long-term debt based on interest rates as of December 31, 2016. Interest payments also include the net payments for interest rate exchange agreements based on the fixed amounts paid and the variable amount received, which is estimated using the projected yield as of December 31, 2016.
(2) Retirement benefit payments in the table above represent expected benefit payments for various non-qualified pension plans and supplemental retirement arrangements as discussed in Note 9 to the consolidated financial statements, which are unfunded obligations that are deemed to be employer contributions. No contributions are planned at this time to the two qualified pension plans. Effective January 1, 2017, the assets and liabilities of the two plans were merged, so that only one qualified defined benefit pension plan remains.
(3) Investment in affiliates represents obligations made to equity method investments of Seaboard, primarily $73 million committed to STF for construction of its Sioux City pork processing facility and $73 million of expected funding commitments based on production levels for two limited liability companies that operate refined coal processing plants.
Several of Seaboard’s segments have long-term contractual obligations, including non-cancelable operating lease agreements for facilities and equipment. The Marine and CT&M segments enter into contracts to time-charter vessels for use in operations. The Pork segment has contract grower agreements in place with farmers to raise a portion of Seaboard’s hogs to support its operations. The Pork segment has also entered into grain and feed ingredient purchase contracts to support the segment’s live hog operations, and has contracted for the purchase of additional hogs from third parties. The CT&M segment enters into commodity purchase contracts, primarily to support sales commitments. See Note 10 to the consolidated financial statements for further discussion on Seaboard’s contractual obligations and for a more detailed listing of other purchase commitments.
Non-current deferred income taxes and certain other long-term liabilities on the consolidated balance sheets are not included in the table above as management is unable to reliably estimate the timing of the payments for these items. In addition, deferred revenues and other deferred credits included in other long-term liabilities on the consolidated balance sheets have been excluded from the table above because they do not represent contractual obligations.
RESULTS OF OPERATIONS
Net sales for the years ended December 31, 2016, 2015 and 2014 were $5,379 million, $5,594 million and $6,473 million, respectively. The decrease for 2016 compared to 2015 primarily reflected lower commodity prices and the mix of products sold for the CT&M segment, lower volumes of sugar sold in the Sugar segment, and lower cargo rates in the Marine segment, partially offset by higher sales volume of market hogs from 2016 acquisitions of live operations and higher biodiesel volumes from the acquisition of a second biodiesel plant in the Pork segment. The decrease for 2015 compared to 2014 primarily reflected lower prices for pork products sold and the deconsolidation of Daily’s in the Pork
2016 Annual Report 15
SEABOARD CORPORATION
Management’s Discussion & Analysis
segment, lower sales prices for almost all commodities sold and lower sales volume of corn for the CT&M segment, and lower spot market rates and sales volume for the Power segment. The decreases were partially offset by higher cargo volumes for the Marine segment.
Operating income for the years ended December 31, 2016, 2015 and 2014 were $222 million, $126 million and $424 million, respectively. The increase for 2016 compared to 2015 primarily reflected lower feed costs for hogs internally grown in the Pork segment and higher margins on commodity trades to third parties in the CT&M segment, partially offset by higher production costs for sugar in the Sugar segment. The decrease for 2015 compared to 2014 primarily reflected lower prices for pork products sold, lower margins on commodity trades to third parties, and higher production costs for sugar and alcohol.
Pork Segment
|
|
|
|
|
|
|
|
|
|
|
|
|
|
|
(Millions of dollars) |
|
|
|
2016 |
|
2015 |
|
2014 |
|
|||
|
Net sales |
|
|
|
$ |
1,443 |
|
$ |
1,332 |
|
$ |
1,717 |
|
|
Operating income |
|
|
|
$ |
175 |
|
$ |
116 |
|
$ |
349 |
|
|
Income from affiliates |
|
|
|
$ |
11 |
|
$ |
11 |
|
$ |
4 |
|
Net sales for the Pork segment increased $111 million for the year ended December 31, 2016 compared to 2015. The increase was primarily the result of higher sales volume of market hogs related to acquisitions as discussed in Note 9 to the consolidated financial statements, higher prices for pork products sold and increased volume and sales prices for biodiesel resulting from increased output from the Guymon plant and the acquisition of a second biodiesel plant in St. Joseph, Missouri. The increase was partially offset by lower volume of pork products sold.
Operating income for the Pork segment increased $59 million for the year ended December 31, 2016 compared to 2015. The increase was primarily the result of lower feed costs for hogs internally grown and improved overall margins from higher meat prices. Management is unable to predict future market prices for pork products, the cost of feed or cost of third-party hogs; however, management anticipates positive operating income for this segment in 2017. The Federal blender’s credits have not been renewed for 2017.
Net sales for the Pork segment decreased $385 million for the year ended December 31, 2015 compared to 2014. The decrease was primarily the result of lower prices for pork products sold and the deconsolidation of Daily’s. The decrease was partially offset by an increase in related sales volume.
Operating income for the Pork segment decreased $233 million for the year ended December 31, 2015 compared to 2014. The decrease was primarily the result of lower prices for pork products and, to a lesser degree, the deconsolidation of Daily’s. Partially offsetting the decrease was lower costs for third-party hogs and lower feed costs for hogs internally grown. In December 2015, the Federal blender’s credit that Seaboard is entitled to receive for biodiesel it blends was reinstated for 2015 and 2016, retroactive to January 1, 2015. As a result, the 2015 Federal blender’s credit of $17 million was recorded as revenues in the fourth quarter of 2015. See Note 13 to the consolidated financial statements for further discussion of the Federal blender’s credit.
Income from affiliates for the Pork segment was primarily from Seaboard’s 50% ownership interest in Daily’s, accounted for using the equity method. Seaboard’s first proportionate share of earnings for Daily’s was recognized in the fourth quarter of 2014.
Commodity Trading and Milling Segment
|
|
|
|
|
|
|
|
|
|
|
|
|
|
(Millions of dollars) |
|
|
2016 |
|
2015 |
|
2014 |
|
|||
|
Net sales |
|
|
$ |
2,778 |
|
$ |
3,022 |
|
$ |
3,499 |
|
|
Operating income as reported |
|
|
$ |
38 |
|
$ |
2 |
|
$ |
54 |
|
|
Mark-to-market adjustments |
|
|
|
— |
|
|
(5) |
|
|
(13) |
|
|
Operating income (loss) excluding mark-to-market adjustments |
|
|
$ |
38 |
|
$ |
(3) |
|
$ |
41 |
|
|
Loss from affiliates |
|
|
$ |
(10) |
|
$ |
(50) |
|
$ |
(24) |
|
Net sales for the CT&M segment decreased $244 million for the year ended December 31, 2016 compared to 2015. The decrease primarily reflected lower sales prices, resulting from lower commodity prices and the mix of products sold, partially offset by higher volumes in corn and soybeans.
16 2016 Annual Report
SEABOARD CORPORATION
Management’s Discussion & Analysis
Operating income for the CT&M segment increased $36 million for the year ended December 31, 2016, compared to 2015. The increase primarily reflected higher margins on commodity trades to third parties and affiliates and fluctuations of $5 million of mark-to-market derivative contracts as discussed below. Excluding the effects of the mark-to-market adjustments for derivatives contracts, operating income increased $41 million.
Due to worldwide commodity price fluctuations, the uncertain political and economic conditions in the countries in which Seaboard operates, and the current volatility in the commodity markets, management is unable to predict future sales and operating results for this segment. However, management anticipates positive operating income for this segment in 2017, excluding the effects of marking to market derivative contracts.
Had Seaboard not applied mark-to-market accounting to its derivative instruments, operating income for this segment would have remained the same in 2016 and been lower by $5 million and $13 million in 2015 and 2014, respectively. While management believes its commodity futures, options and foreign exchange contracts are primarily economic hedges of its firm purchase and sales contracts or anticipated sales contracts, Seaboard does not perform the extensive record-keeping required to account for these transactions as hedges for accounting purposes. Accordingly, while the changes in value of the derivative instruments were marked to market, the changes in value of the firm purchase or sales contracts were not. As products are delivered to customers, these existing mark-to-market adjustments should be primarily offset by realized margins or losses as revenue is recognized over time and therefore, these mark-to-market adjustments could reverse in fiscal 2017. Management believes eliminating these mark-to-market adjustments provides a more reasonable presentation to compare and evaluate period-to-period financial results for this segment.
Loss from affiliates for the CT&M segment decreased by $40 million for the year ended December 31, 2016 compared to 2015. The decrease primarily reflected lower operating and currency losses recorded against the investment and lower reserves for notes receivable and advances from an affiliate in Brazil. Seaboard’s loss from this Brazilian affiliate totaled $60 million in 2015 compared to $10 million in 2016. This Brazilian affiliate was consolidated in the fourth quarter of 2016. See Note 4 to the consolidated financial statements for further discussion of this affiliate. Based on the uncertainty of local political and economic environments in the countries in which Seaboard’s affiliates operate, management cannot predict future results.
Net sales for the CT&M segment decreased $477 million for the year ended December 31, 2015 compared to 2014. The decrease primarily reflected lower sales prices for almost all commodities sold and, to a lesser extent, lower sales volume primarily for corn.
Operating income for the CT&M segment decreased $52 million for the year ended December 31, 2015 compared to 2014. The decrease primarily reflected certain unfavorable market conditions, which resulted in lower margins on commodity trades to third parties. The decrease also reflected an increase in bad debt expense primarily attributable to trade receivables with an affiliate in Brazil (see Note 4 to the consolidated financial statements for further discussion) and fluctuations of $8 million of mark-to-market derivative contracts. Excluding the effects of mark-to-market adjustments for derivatives contracts, operating income decreased $44 million.
Loss from affiliates for the CT&M segment increased by $26 million for the year ended December 31, 2015 compared to 2014. The increase primarily reflected operating and currency losses recorded against the investment and reserves for notes receivable and advances from an affiliate in Brazil totaling $60 million. Partially offsetting the increase was an $11 million write down in a Democratic Republic of Congo (“DRC”) bakery business investment recorded in 2014 as further discussed in Note 4 to the consolidated financial statements and a decrease in losses in 2015 compared to 2014 in this same business.
Marine Segment
|
|
|
|
|
|
|
|
|
|
|
|
|
|
(Millions of dollars) |
|
|
2016 |
|
2015 |
|
2014 |
|
|||
|
Net sales |
|
|
$ |
916 |
|
$ |
940 |
|
$ |
853 |
|
|
Operating income (loss) |
|
|
$ |
33 |
|
$ |
19 |
|
$ |
(3) |
|
|
Income from affiliate |
|
|
$ |
1 |
|
$ |
2 |
|
$ |
— |
|
Net sales for the Marine segment decreased $24 million for the year ended December 31, 2016 compared to 2015. The decrease was primarily the result of lower cargo rates in certain markets during 2016 compared to 2015, partially offset by higher volumes.
2016 Annual Report 17
SEABOARD CORPORATION
Management’s Discussion & Analysis
Operating income for the Marine segment increased $14 million for the year ended December 31, 2016 compared to 2015. The increase was primarily the result of lower voyage costs, principally fuel costs, on a per unit shipped basis, partially offset by lower cargo rates. Management cannot predict changes in future cargo volumes, cargo rates and fuel costs, or to what extent changes in economic conditions in markets served will affect net sales or operating income during 2017. However, management anticipates this segment will have positive operating income for 2017.
Net sales for the Marine segment increased $87 million for the year ended December 31, 2015 compared to 2014. The increase was primarily the result of higher cargo volumes, partially offset by lower cargo rates in certain markets during 2015 compared to 2014.
Operating income for the Marine segment increased $22 million for the year ended December 31, 2015 compared to 2014. The increase was primarily the result of lower voyage costs, principally fuel costs, on a per unit shipped basis, partially offset by lower cargo rates.
Sugar Segment
|
|
|
|
|
|
|
|
|
|
|
|
|
|
(Millions of dollars) |
|
|
2016 |
|
2015 |
|
2014 |
|
|||
|
Net sales |
|
|
$ |
147 |
|
$ |
188 |
|
$ |
200 |
|
|
Operating income (loss) |
|
|
$ |
(12) |
|
$ |
2 |
|
$ |
27 |
|
|
Income from affiliates |
|
|
$ |
2 |
|
$ |
1 |
|
$ |
1 |
|
Net sales for the Sugar segment decreased $41 million for the year ended December 31, 2016 compared to 2015. The decrease primarily reflected lower volumes and lower selling prices of sugar sold. During the third and fourth quarters of 2016, labor strikes and inclement weather negatively impacted volumes and resulted in a $12 million inventory charge to cost of sales for fixed manufacturing costs associated with the revised production forecasts. Sugar and alcohol sales are denominated in Argentine pesos, and an increase in local sales prices in terms of U.S. dollars was principally offset by exchange rate changes as the Argentine peso continued to weaken against the U.S. dollar in 2016. Management cannot predict local sugar and alcohol prices for 2017, but management anticipates that the Argentine peso will continue to be weaker against the U.S. dollar, which should result in lower sale prices in terms of U.S. dollars in 2017.
Operating income for the Sugar segment decreased $14 million for the year ended December 31, 2016 compared to 2015. The decrease primarily reflected lower sales prices, lower volumes and the $12 million inventory charge. The decrease in operating income was partially offset by reduced selling, general and administrative expenses from decreased personnel-related costs. Based on recent market conditions, management currently cannot predict if this segment will be profitable in 2017.
Net sales for the Sugar segment decreased $12 million for the year ended December 31, 2015 compared to 2014. The decrease primarily reflected lower volumes for sugar sold. Sugar and alcohol sales are denominated in Argentine pesos, and an increase in local sales prices in terms of U.S. dollars was principally offset by exchange rate changes as the Argentine peso weakened against the U.S. dollar in 2015.
Operating income for the Sugar segment decreased $25 million for the year ended December 31, 2015 compared to 2014. The decrease primarily reflected higher production costs for sugar and alcohol. To a lesser extent, the decrease in operating income was also the result of higher selling, general and administrative expenses principally from increased personnel-related costs and lower volume of sugar sold. Also, operating income in 2014 included a $4 million gain related to a final insurance settlement for property damage and business interruption claims related to prior years.
Power Segment
|
|
|
|
|
|
|
|
|
|
|
|
|
|
(Millions of dollars) |
|
|
2016 |
|
2015 |
|
2014 |
|
|||
|
Net sales |
|
|
$ |
79 |
|
$ |
97 |
|
$ |
189 |
|
|
Operating income |
|
|
$ |
7 |
|
$ |
7 |
|
$ |
19 |
|
|
Income from affiliate |
|
|
$ |
4 |
|
$ |
3 |
|
$ |
2 |
|
Net sales for the Power segment decreased $18 million for the year ended December 31, 2016 compared to 2015. The decrease primarily reflected lower spot market rates, which were attributable primarily to lower fuel costs, a component of pricing.
18 2016 Annual Report
SEABOARD CORPORATION
Management’s Discussion & Analysis
Operating income for the Power segment remained flat for the year ended December 31, 2016 compared to 2015 primarily due to the lower spot market rates being offset by lower fuel costs per kilowatt hour generated and other lower production costs. Management cannot predict future fuel costs or the extent that spot market rates will fluctuate compared to fuel costs; however, management anticipates positive operating income for this segment in 2017.
Net sales for the Power segment decreased $92 million for the year ended December 31, 2015 compared to 2014. The decrease primarily reflected lower spot market rates and lower volumes. The lower spot market rates were attributable primarily to lower fuel costs, a component of pricing. The lower volumes were a result of cancelling the short-term leasing of a power generating facility on September 3, 2014 as discussed in Note 13 to the consolidated financial statements.
Operating income for the Power segment decreased $12 million for the year ended December 31, 2015 compared to 2014. The decrease primarily reflected lower spot market rates and lower volumes, partially offset by lower fuel costs per kilowatt hour generated and other lower production costs. Also, operating income in 2014 included a gain on sale of assets of $5 million as discussed in Note 13 to the consolidated financial statements.
Turkey Segment
|
|
|
|
|
|
|
|
|
|
|
|
|
|
(Millions of dollars) |
|
|
2016 |
|
2015 |
|
2014 |
|
|||
|
Income from affiliate |
|
|
$ |
73 |
|
$ |
103 |
|
$ |
54 |
|
The Turkey segment, accounted for using the equity method, represents Seaboard’s investment in Butterball. The decrease in income from affiliate for 2016 compared to 2015 was primarily the result of lower volume and prices for turkey products sold. Management is unable to predict future market prices for turkey products, the cost of feed or the impact from avian influenza; however, management anticipates positive income for this segment in 2017.
The increase in income from affiliate for 2015 compared to 2014 was primarily the result of lower feed costs and higher prices of turkey products sold.
Selling, General and Administrative Expenses
Selling, general and administrative (“SG&A”) expenses for the year ended December 31, 2016 increased by $5 million over 2015 to $275 million. The increase was primarily the result of increased costs related to Seaboard’s deferred compensation program, which were offset by the effect of the mark-to-market on investments recorded in other investment income. As a percentage of revenues, SG&A was 5% for 2016 and 2015.
SG&A expenses for the year ended December 31, 2015 increased by $16 million over 2014 to $270 million. The increase was primarily the result of bad debt expense in the CT&M segment and increased personnel-related costs in most segments. As a percentage of revenues, SG&A was 5% for 2015 compared to 4% for 2014.
Interest Expense
Interest expense totaled $29 million, $18 million and $20 million for the years ended December 31, 2016, 2015 and 2014, respectively. The increase in 2016 compared to 2015 primarily related to long-term debt issued in December 2015. The decrease in 2015 compared to 2014 primarily related to a $4 million charge in 2014 for early payment of debt as discussed in Note 7 to the consolidated financial statements.
Interest Income
Interest income totaled $15 million, $40 million and $14 million for the years ended December 31, 2016, 2015 and 2014, respectively. The decrease for 2016 compared to 2015 primarily reflected lower interest recognized on outstanding customer receivable balances in the Power segment. In December 2015, the Power segment recognized $31 million of interest income related to aged receivable balances. See Note 13 to the consolidated financial statements for further discussion. The increase for 2015 compared to 2014 primarily reflected an increase in interest recognized on outstanding customer receivable balances in the Power segment as discussed above.
Interest Income from Affiliates
Interest income from affiliates totaled $24 million, $29 million and $27 million for the years ended December 31, 2016, 2015 and 2014, respectively. The decrease for 2016 compared to 2015 primarily reflected the modification of the Butterball note receivable. See Note 4 to consolidated financial statements for further discussion of the modification. The increase for 2015 compared to 2014 primarily represented additional interest income from the Butterball note receivable related to the pay-in-kind interest component.
2016 Annual Report 19
SEABOARD CORPORATION
Management’s Discussion & Analysis
Other Investment Income (Loss), Net
Other investment income (loss), net totaled $69 million, $(5) million and $2 million for the years ended December 31, 2016, 2015 and 2014, respectively. The increase for 2016 compared to 2015 primarily reflects higher income on short-term investments related to mark-to-market fluctuation and dividends, partially offset by higher losses associated with its investments in refined coal processing plants, of which a portion is offset by tax credits in income tax expense. The fluctuation from 2015 to 2014 primarily reflects Seaboard’s losses associated with its investment in a refined coal processing plant, of which a portion is offset by tax credits in income tax expense.
Foreign Currency Gains (Losses), Net
Foreign currency gains (losses), net totaled $2 million, $1 million and $(9) million for the years ended December 31, 2016, 2015 and 2014, respectively. The increase in foreign currency gains, net in 2016 compared to 2015 primarily reflected gains in the South African rand, partially offset by losses in the Zambian kwacha, among fluctuations of other currency exchange rates in several foreign countries. The decrease in foreign currency losses, net in 2015 compared to 2014 primarily reflected gains in the South African rand, partially offset during the year by fluctuations of other currency exchange rates in several foreign countries. The political and economic conditions of the countries in which Seaboard operates and does business, along with fluctuations in the value of the U.S. dollar cause volatility in currency exchange rates, which exposes Seaboard to fluctuating foreign currency gains and losses that cannot be predicted by Seaboard. Although Seaboard does not utilize hedge accounting, Seaboard does utilize foreign currency exchange contracts to manage its risks and exposure to foreign currency fluctuations primarily related to the South African rand. Management believes gains and losses on commodity transactions, including the mark-to-market effects, of such foreign currency exchange contracts relate to the underlying commodity transactions and classifies such gains and losses in cost of sales. All other gains and losses on foreign currency exchange contracts are included in foreign currency gains (losses), net.
Gain on Sale of Controlling Interest in Subsidiary
During 2014, Seaboard’s Pork segment sold to Triumph a 50% interest in Daily’s resulting in a pre-tax gain of $66 million. See Note 4 to the consolidated financial statements for further discussion.
Miscellaneous, Net
Miscellaneous, net totaled $0 million, $(2) million and $(5) million for the years ended December 31, 2016, 2015 and 2014, respectively. Miscellaneous, net primarily reflected mark-to-market fluctuations on interest rate exchange agreements.
Income Tax Expense
On December 18, 2015, the Protecting Americans from Tax Hikes Act of 2015 (the “2015 Tax Act”) was signed into law. The 2015 Tax Act reinstated and made permanent certain expired corporate income tax provisions that impact current and deferred taxes for financial reporting purposes. Certain reinstated provisions were extended for 2015 and 2016, while certain other provisions were extended beyond 2016. The effective tax rate for 2016 was lower than 2015 primarily due to a change in the mix of domestic and foreign earnings from the prior year. The effective tax rate for 2015 was lower than 2014 primarily due to a change in the mix of domestic and foreign earnings from the prior year.
OTHER FINANCIAL INFORMATION
Management does not believe its businesses have been materially adversely affected by inflation. See Note 1 to the consolidated financial statements for a discussion of recently issued accounting standards.
CRITICAL ACCOUNTING ESTIMATES
The preparation of the consolidated financial statements in conformity with accounting principles generally accepted in the U.S. (“GAAP”) requires management to make estimates and assumptions that affect the reported amounts of assets and liabilities and the disclosure of contingent assets and liabilities at the date of the consolidated financial statements and the reported amounts of revenue and expenses during the reporting period. Actual results could differ from those estimates. Management has identified the accounting estimates believed to be the most important to the portrayal of Seaboard’s financial condition and results, and that require management’s most difficult, subjective or complex judgments, often as a result of the need to make estimates about the effect of matters that are inherently uncertain. Management has reviewed these critical accounting estimates with the Audit Committee of the Board of Directors.
Allowance for Doubtful Accounts – Seaboard primarily uses a specific identification approach to evaluate the adequacy of this reserve for estimated uncollectible receivables at the consolidated balance sheet date. Changes in estimates, developing trends and other new information can have a material affect on future evaluations. Furthermore, Seaboard’s
20 2016 Annual Report
SEABOARD CORPORATION
Management’s Discussion & Analysis
total current receivables are heavily weighted toward foreign receivables ($312 million or 73% at December 31, 2016), including foreign receivables due from affiliates ($98 million at December 31, 2016), which generally represent more of a collection risk than its domestic receivables. Receivables due from affiliates are generally associated with entities located in foreign countries considered less developed than the U.S. that can experience conditions causing sudden changes to their ability to pay such receivables on a timely basis or in full. Based on various historical experiences, future collections of receivables or lack thereof could result in a material charge or credit to earnings depending on the ultimate resolution of each individual customer past due receivable. For example, the CT&M segment reserved $16 million in 2016 on an affiliate note receivable with its bakery in the DRC. Also, the CT&M segment reserved $9 million in 2015 on trade receivables with its affiliate in Brazil. See Note 4 to the consolidated financial statements for further discussion of both examples. Bad debt expense for the years ended December 31, 2016, 2015 and 2014 was $15 million, $13 million and $0 million, respectively.
Valuation of Inventories – Inventories are generally valued at the lower of cost or market. In determining market, management makes assumptions regarding replacement costs, estimated sales prices, estimated costs to complete, estimated disposal costs and normal profit margins. For commodity trading inventories, when contract performance by a customer becomes a concern, management must also evaluate available options to dispose of the inventory, including assumptions about potential negotiated changes to sales contracts, sales prices in alternative markets in various foreign countries and potentially additional transportation costs. At times, management must consider probability, weighting various viable alternatives, in its determination of the net realizable value of the inventories. These assumptions and probabilities are subjective in nature, and are based on management’s best estimates and judgments existing at the time of preparation. Changes in future market prices or facts and circumstances could result in a material write down in value of inventory or decreased future margins on the sale of inventory.
Impairment of Long-Lived Assets – At each balance sheet date, long-lived assets, primarily property, plant and equipment, are reviewed for impairment when events or changes in circumstances indicate that the carrying amount may not be recoverable. Recoverability of assets to be held and used is measured by a comparison of the carrying amount of the asset to future undiscounted net cash flows expected to be generated by the asset group. If such assets are considered to be impaired, the impairment to be recognized is measured by the amount by which the carrying amount of the assets exceeds the fair value of the assets. Some of the key assumptions utilized in determining future projected cash flows include estimated growth rates, expected future sales prices and estimated costs. In some cases, judgment is also required in assigning probability weighting to the various future cash flow scenarios. The probability weighting percentages used and the various future projected cash flow models prepared by management are based on facts and circumstances existing at the time of preparation and management’s best estimates and judgment of future operating results. Seaboard cannot predict the occurrence of certain future events that might adversely affect the reported value of long-lived assets, which include, but are not limited to, a change in the business climate, government incentives, a negative change in relationships with significant customers, and changes to strategic decisions made in response to economic and competitive conditions. Changes in these facts, circumstances and management’s estimates and judgment could result in an impairment of property, plant and equipment, resulting in a material charge to earnings.
Investments in and Advances to Affiliates and Notes Receivable From Affiliates – Seaboard has numerous investments in and advances to various businesses that it owns 50% or less for a noncontrolling interest and are accounted for using the equity method. In addition, for some of these investments, Seaboard also has notes receivable for loans it provided to these businesses. For the CT&M segment, these investments are primarily in foreign countries, which are less developed than the U.S., and therefore, expose Seaboard to greater financial risks. At certain times when there are ongoing operating losses, local economies are depressed, commodity-based markets are less stable, or foreign governments cause challenging business conditions, the fair value of the equity method investment is evaluated by management. The fair value of these investments is not readily determinable as almost all of these investments are not publicly traded. Management will use other methods to determine fair value such as estimated future cash flows, including assumptions on growth rates, for the business and consideration of other local business conditions as applicable. If the fair value of the investment is determined to be less than the carrying value and the decline in value is considered to be other than temporary, an appropriate write down is recorded to income (loss) from affiliates based on the excess of the carrying value over the best estimate of fair value of the investment. In addition, if based on current information and events it is probable that Seaboard will be unable to collect all amounts due according to the contractual terms of the notes receivable from affiliates and an amount can be reasonably estimated, Seaboard will write down the amounts to estimated realizable value. Information and events creating uncertainty about the realization of recorded amounts for notes from affiliates include, but are not limited to, the estimated cash flows generated by the affiliate’s business, the
2016 Annual Report 21
SEABOARD CORPORATION
Management’s Discussion & Analysis
sufficiency of collateral securing the amounts, the creditworthiness of the counterparties involved, and consideration of other local business conditions as applicable. Changes in facts, circumstances and management’s estimates and judgment could result in a material charge to earnings. As discussed above, in 2016 Seaboard recorded a $16 million reserve on an affiliate note receivable. In 2015, Seaboard recorded a $22 million reserve in loss from affiliates related to its investment in a flour production business in Brazil that was consolidated in 2016, and in 2014 recorded an $11 million write down in loss from affiliates related to its investment in a bakery located in the DRC. See Note 4 to the consolidated financial statements for further discussion on the CT&M segment and its affiliates.
Income Taxes – Income taxes are determined by management based on current tax regulations in the various worldwide taxing jurisdictions in which Seaboard conducts its business. In various situations, accruals have been made for estimates of the tax effects for certain transactions, business structures, the estimated reversal of timing differences and future projected profitability of Seaboard’s various business units based on management’s interpretation of existing facts, circumstances and tax regulations. Should new evidence come to management’s attention that could alter previous conclusions or if taxing authorities disagree with the positions taken by Seaboard, the change in estimate could result in a material adverse or favorable impact on the financial statements. As of December 31, 2016, Seaboard had deferred tax assets of $141 million, net of the valuation allowance of $58 million, and deferred tax liabilities of $218 million. For the years ended December 31, 2016, 2015 and 2014, income tax expense included $43 million, $(9) million and $25 million, respectively, for deferred taxes to federal, foreign, state and local taxing jurisdictions.
Accrued Pension Liability – The measurement of Seaboard’s pension liability and related expense is dependent on a variety of assumptions and estimates regarding future events. These assumptions include discount rates, assumed rate of return on plan assets, compensation increases, turnover rates, mortality rates and retirement rates. The discount rate and return on plan assets are important elements of liability and expense measurement, and are reviewed on an annual basis. The effect of decreasing both the discount rate and assumed rate of return on plan assets by 50 basis points would be an increase in pension expense of approximately $3 million per year. The effects of actual results differing from the assumptions (i.e. gains or losses) are primarily accumulated in accrued pension liability and amortized over future periods if it exceeds the 10% corridor and, therefore, could affect Seaboard’s recognized pension expense in such future periods, as permitted under GAAP. Accordingly, accumulated gains or losses in excess of the 10% corridor are amortized over the average future service of active participants. See Note 9 to the consolidated financial statements for further discussion.
DERIVATIVE INFORMATION
Seaboard is exposed to various types of market risks in its day-to-day operations. Primary market risk exposures result from changing commodity prices, foreign currency exchange rates and interest rates. Derivatives are used to manage these overall market risks; however, Seaboard does not perform the extensive record-keeping required to account for derivative transactions as hedges. Management believes it uses derivatives primarily as economic hedges, although they do not qualify as hedges for accounting purposes. Because these derivatives are not accounted for as hedges, fluctuations in the related prices could have a material impact on earnings in any given year. Seaboard also enters into speculative derivative transactions related to its market risks.
Changes in commodity prices affect the cost of necessary raw materials and other inventories, finished product sales and firm sales commitments. Seaboard uses various grain, oilseed and other commodity futures and options purchase contracts to manage certain risks of increasing prices of raw materials and firm sales commitments or anticipated sales contracts. Short sales contracts are then used to offset the open purchase derivatives when the related commodity inventory is purchased in advance of the derivative maturity, effectively offsetting the initial futures or option purchase contract. From time to time, hog futures are used to manage risks of increasing prices of live hogs acquired for processing, and hog futures are used to manage risks of fluctuating prices of pork product inventories and related future sales. From time to time, Seaboard may enter into short positions in energy-related resources (e.g., heating oil, crude oil, etc.) to manage certain exposures related to bio-energy margins. Inventories that are sensitive to changes in commodity prices, including carrying amounts at December 31, 2016 and 2015, are presented in Note 3 to the consolidated financial statements. Raw material requirements, finished product sales and firm sales commitments are also sensitive to changes in commodity prices.
Because changes in foreign currency exchange rates affect the cash paid or received on foreign currency denominated receivables and payables, Seaboard manages certain of these risks through the use of foreign currency exchange agreements. Because changes in interest rates affect the cash required to service variable-rate debt, Seaboard uses interest rate exchange agreements to manage risks of increasing interest rates.
22 2016 Annual Report
SEABOARD CORPORATION
Management’s Discussion & Analysis
During 2010, Seaboard entered into three ten-year interest rate exchange agreements, which involve the exchange of fixed-rate and variable-rate interest payments over the life of the agreements without the exchange of the underlying notional amounts to mitigate the effects of fluctuations in interest rates on variable-rate debt. Seaboard pays a fixed rate and receives a variable rate of interest on three notional amounts of $25 million each. All three of these interest rate exchange agreements are outstanding as of December 31, 2016, and do not qualify as hedges for accounting purposes. Accordingly, the changes in fair value of these agreements are recorded in miscellaneous, net in the consolidated statements of comprehensive income.
The following table presents the sensitivity of the fair value of Seaboard’s open net commodity future and option contracts, foreign currency exchange agreements and interest rate exchange agreements to a hypothetical 10% change in market prices, foreign exchange rates and interest rates as of December 31, 2016 and December 31, 2015. For all open derivatives, the fair value of such positions is a summation of the fair values calculated for each item by valuing each net position at quoted market prices as of the applicable date.
|
|
|
|
|
|
|
|
|
|
(Millions of dollars) |
|
December 31, 2016 |
|
December 31, 2015 |
|
||
|
Grains and oilseeds |
|
$ |
8 |
|
$ |
12 |
|
|
Hogs |
|
|
1 |
|
|
2 |
|
|
Energy related resources |
|
|
1 |
|
|
— |
|
|
Vegetable oils |
|
|
1 |
|
|
— |
|
|
Foreign currencies |
|
|
17 |
|
|
13 |
|
|
Interest rates |
|
|
— |
|
|
1 |
|
The table below provides information about Seaboard’s non-trading financial instruments sensitive to changes in interest rates at December 31, 2016. For debt obligations, the table presents principal cash flows and related weighted average interest rates by expected maturity dates. Long-term debt included foreign subsidiary obligations payable in Argentine pesos of $16 million and $23 million at December 31, 2016 and 2015, respectively. Short-term instruments, including short-term investments, non-trade receivables and current notes payable have carrying values that approximate market value and are not included in this table due to their short-term nature.
|
|
|
|
|
|
|
|
|
|
|
|
|
|
|
|
|
|
|
|
|
|
|
|
|
(Millions of dollars) |
|
|
2017 |
|
|
2018 |
|
|
2019 |
|
|
2020 |
|
|
2021 |
|
|
Thereafter |
|
|
Total |
|
|
Long-term debt: |
|
|
|
|
|
|
|
|
|
|
|
|
|
|
|
|
|
|
|
|
|
|
|
Variable rate |
|
$ |
17 |
|
$ |
21 |
|
$ |
33 |
|
$ |
42 |
|
$ |
38 |
|
$ |
366 |
|
$ |
517 |
|
|
Average interest rate |
|
|
7.07% |
|
|
6.69% |
|
|
5.35% |
|
|
4.93% |
|
|
2.53% |
|
|
2.35% |
|
|
3.09% |
|
Non-trading financial instruments sensitive to changes in interest rates at December 31, 2015 consisted of variable rate long-term debt totaling $523 million with an average interest rate of 3.16%.
2016 Annual Report 23
SEABOARD CORPORATION
Management’s Reports
Management’s Responsibility for Consolidated Financial Statements
The management of Seaboard Corporation and its consolidated subsidiaries (“Seaboard”) is responsible for the preparation of its consolidated financial statements and related information appearing in this report. Management believes that the consolidated financial statements fairly present Seaboard’s financial position and results of operations in conformity with U.S. generally accepted accounting principles, and necessarily includes amounts that are based on estimates and judgments which it believes are reasonable based on current circumstances with due consideration given to materiality.
Management relies on a system of internal controls over financial reporting that is designed to provide reasonable assurance that assets are safeguarded, transactions are executed in accordance with company policy and U.S. generally accepted accounting principles and are properly recorded, and accounting records are adequate for preparation of financial statements and other information and disclosures. The concept of reasonable assurance is based on recognition that the cost of a control system should not exceed the benefits expected to be derived, and such evaluations require estimates and judgments. The design and effectiveness of the system are monitored by a professional staff of internal auditors.
All internal control systems, no matter how well designed, have inherent limitations. Internal control over financial reporting is a process that involves human diligence and compliance, and is subject to lapses in judgment and breakdowns resulting from human failures. Therefore, even those systems determined to be effective can provide only reasonable assurance with respect to financial statement preparation and presentation.
The Board of Directors pursues its review of auditing internal controls and financial statements through its audit committee, composed entirely of independent directors. In the exercise of its responsibilities, the audit committee meets periodically with management, with the internal auditors and with the independent registered public accounting firm to review the scope and results of audits. Both the internal auditors and the independent registered public accounting firm have unrestricted access to the audit committee, with or without the presence of management.
Management’s Report on Internal Control Over Financial Reporting
The management of Seaboard Corporation and its consolidated subsidiaries (“Seaboard”) is responsible for establishing and maintaining adequate internal control over financial reporting, as such term is defined in the Securities Exchange Act of 1934 Rule 13a-15(f). Under the supervision, and with the participation of management and its Internal Audit Department, Seaboard conducted an evaluation of the effectiveness of its internal control over financial reporting based on the framework in Internal Control - Integrated Framework (2013) issued by the Committee of Sponsoring Organizations of the Treadway Commission (“COSO”). Management’s assessment of the effectiveness of Seaboard’s internal control over financial reporting as of December 31, 2016, excluded Belarina Alimentos S.A. (“Belarina”), which was consolidated on October 28, 2016. Belarina’s total assets constituted approximately $44 million, or less than 1%, of Seaboard’s consolidated assets at December 31, 2016. Due to financial information for this foreign affiliate being reported on a three-month lag, no sales were included in Seaboard’s consolidated financial statements. Based on its evaluation under the framework in Internal Control - Integrated Framework (2013), management concluded that Seaboard’s internal control over financial reporting was effective as of December 31, 2016.
Seaboard’s independent registered public accounting firm, that audited the consolidated financial statements included in the annual report, has issued an audit report on the effectiveness of Seaboard’s internal control over financial reporting. Their report is included herein.
24 2016 Annual Report
SEABOARD CORPORATION
Report of Independent Registered Public Accounting Firm
Report of Independent Registered Public Accounting Firm
The Board of Directors and Stockholders
Seaboard Corporation:
We have audited the accompanying consolidated balance sheets of Seaboard Corporation and subsidiaries (the “Company”) as of December 31, 2016 and 2015 and the related consolidated statements of comprehensive income, changes in equity, and cash flows for each of the years in the three-year period ended December 31, 2016. These consolidated financial statements are the responsibility of the Company’s management. Our responsibility is to express an opinion on these consolidated financial statements based on our audits.
We conducted our audits in accordance with the standards of the Public Company Accounting Oversight Board (United States). Those standards require that we plan and perform the audit to obtain reasonable assurance about whether the financial statements are free of material misstatement. An audit includes examining, on a test basis, evidence supporting the amounts and disclosures in the financial statements. An audit also includes assessing the accounting principles used and significant estimates made by management, as well as evaluating the overall financial statement presentation. We believe that our audits provide a reasonable basis for our opinion.
In our opinion, the consolidated financial statements referred to above present fairly, in all material respects, the financial position of Seaboard Corporation and subsidiaries as of December 31, 2016 and 2015, and the results of their operations and their cash flows for each of the years in the three-year period ended December 31, 2016, in conformity with U.S. generally accepted accounting principles.
We also have audited, in accordance with the standards of the Public Company Accounting Oversight Board (United States), Seaboard Corporation’s internal control over financial reporting as of December 31, 2016, based on criteria established in Internal Control - Integrated Framework (2013) issued by the Committee of Sponsoring Organizations of the Treadway Commission (“COSO”), and our report dated February 21, 2017 expressed an unqualified opinion on the effectiveness of the Company’s internal control over financial reporting.
|
|
|

Kansas City, Missouri
February 21, 2017
2016 Annual Report 25
SEABOARD CORPORATION
Report of Independent Registered Public Accounting Firm
Report of Independent Registered Public Accounting Firm
The Board of Directors and Stockholders
Seaboard Corporation:
We have audited Seaboard Corporation’s internal control over financial reporting as of December 31, 2016, based on criteria established in Internal Control - Integrated Framework (2013) issued by the Committee of Sponsoring Organizations of the Treadway Commission (“COSO”). Seaboard Corporation’s management is responsible for maintaining effective internal control over financial reporting and for its assessment of the effectiveness of internal control over financial reporting, included in the accompanying “Management’s Report on Internal Control over Financial Reporting.” Our responsibility is to express an opinion on the Company’s internal control over financial reporting based on our audit.
We conducted our audit in accordance with the standards of the Public Company Accounting Oversight Board (United States). Those standards require that we plan and perform the audit to obtain reasonable assurance about whether effective internal control over financial reporting was maintained in all material respects. Our audit included obtaining an understanding of internal control over financial reporting, assessing the risk that a material weakness exists, and testing and evaluating the design and operating effectiveness of internal control based on the assessed risk. Our audit also included performing such other procedures as we considered necessary in the circumstances. We believe that our audit provides a reasonable basis for our opinion.
A company’s internal control over financial reporting is a process designed to provide reasonable assurance regarding the reliability of financial reporting and the preparation of financial statements for external purposes in accordance with generally accepted accounting principles. A company’s internal control over financial reporting includes those policies and procedures that (i) pertain to the maintenance of records that, in reasonable detail, accurately and fairly reflect the transactions and dispositions of the assets of the company; (ii) provide reasonable assurance that transactions are recorded as necessary to permit preparation of financial statements in accordance with generally accepted accounting principles, and that receipts and expenditures of the company are being made only in accordance with authorizations of management and directors of the company; and (iii) provide reasonable assurance regarding prevention or timely detection of unauthorized acquisition, use, or disposition of the company’s assets that could have a material effect on the financial statements.
Because of its inherent limitations, internal control over financial reporting may not prevent or detect misstatements. Also, projections of any evaluation of effectiveness to future periods are subject to the risk that controls may become inadequate because of changes in conditions, or that the degree of compliance with the policies or procedures may deteriorate.
In our opinion, Seaboard Corporation maintained, in all material respects, effective internal control over financial reporting as of December 31, 2016, based on criteria established in Internal Control - Integrated Framework (2013) issued by the Committee of Sponsoring Organizations of the Treadway Commission.
Management’s assessment of the effectiveness of the Company’s internal control over financial reporting as of December 31, 2016 excluded Belarina Alimentos S.A. (“Belarina”), which was consolidated on October 28, 2016. Belarina’s total assets constituted approximately $44 million, or less than 1%, of Seaboard’s consolidated assets at December 31, 2016. Due to financial information for this foreign affiliate being reported on a three-month lag, no sales were included in Seaboard’s consolidated financial statements. Our audit of internal control over financial reporting of the Company also excluded an evaluation of the internal control over financial reporting of Belarina.
We also have audited, in accordance with the standards of the Public Company Accounting Oversight Board (United States), the consolidated balance sheets of Seaboard Corporation and subsidiaries as of December 31, 2016 and 2015, and the related consolidated statements of comprehensive income, changes in equity and cash flows for each of the years in the three-year period ended December 31, 2016, and our report dated February 21, 2017 expressed an unqualified opinion on those consolidated financial statements.
|
|
|
|
Kansas City, Missouri |
|
February 21, 2017 |
26 2016 Annual Report
SEABOARD CORPORATION
Consolidated Statements of Comprehensive Income
|
|
|
Years ended December 31, |
|
|||||||
|
(Millions of dollars except share and per share amounts) |
|
2016 |
|
2015 |
|
2014 |
|
|||
|
Net sales: |
|
|
|
|
|
|
|
|
|
|
|
Products (includes sales to affiliates of $993, $831 and $842) |
|
$ |
4,334 |
|
$ |
4,515 |
|
$ |
5,373 |
|
|
Services revenues (includes sales to affiliates of $8, $4 and $4) |
|
|
961 |
|
|
973 |
|
|
906 |
|
|
Other |
|
|
84 |
|
|
106 |
|
|
194 |
|
|
Total net sales |
|
|
5,379 |
|
|
5,594 |
|
|
6,473 |
|
|
Cost of sales and operating expenses: |
|
|
|
|
|
|
|
|
|
|
|
Products |
|
|
3,992 |
|
|
4,244 |
|
|
4,818 |
|
|
Services |
|
|
822 |
|
|
866 |
|
|
813 |
|
|
Other |
|
|
68 |
|
|
88 |
|
|
164 |
|
|
Total cost of sales and operating expenses |
|
|
4,882 |
|
|
5,198 |
|
|
5,795 |
|
|
Gross income |
|
|
497 |
|
|
396 |
|
|
678 |
|
|
Selling, general and administrative expenses |
|
|
275 |
|
|
270 |
|
|
254 |
|
|
Operating income |
|
|
222 |
|
|
126 |
|
|
424 |
|
|
Other income (expense): |
|
|
|
|
|
|
|
|
|
|
|
Interest expense |
|
|
(29) |
|
|
(18) |
|
|
(20) |
|
|
Interest income |
|
|
15 |
|
|
40 |
|
|
14 |
|
|
Interest income from affiliates |
|
|
24 |
|
|
29 |
|
|
27 |
|
|
Income from affiliates |
|
|
81 |
|
|
70 |
|
|
37 |
|
|
Other investment income (loss), net |
|
|
69 |
|
|
(5) |
|
|
2 |
|
|
Foreign currency gains (losses), net |
|
|
2 |
|
|
1 |
|
|
(9) |
|
|
Gain on sale of controlling interest in subsidiary |
|
|
— |
|
|
— |
|
|
66 |
|
|
Miscellaneous, net |
|
|
— |
|
|
(2) |
|
|
(5) |
|
|
Total other income, net |
|
|
162 |
|
|
115 |
|
|
112 |
|
|
Earnings before income taxes |
|
|
384 |
|
|
241 |
|
|
536 |
|
|
Income tax expense |
|
|
(70) |
|
|
(69) |
|
|
(168) |
|
|
Net earnings |
|
$ |
314 |
|
$ |
172 |
|
$ |
368 |
|
|
Less: Net income attributable to noncontrolling interests |
|
|
(2) |
|
|
(1) |
|
|
(1) |
|
|
Net earnings attributable to Seaboard |
|
$ |
312 |
|
$ |
171 |
|
$ |
367 |
|
|
|
|
|
|
|
|
|
|
|
|
|
|
Earnings per common share |
|
$ |
266.50 |
|
$ |
146.44 |
|
$ |
311.44 |
|
|
|
|
|
|
|
|
|
|
|
|
|
|
Other comprehensive income (loss), net of income tax benefit of $12, $0 and $27: |
|
|
|
|
|
|
|
|
|
|
|
Foreign currency translation adjustment |
|
|
(26) |
|
|
(34) |
|
|
(39) |
|
|
Unrealized gain on investments |
|
|
1 |
|
|
— |
|
|
1 |
|
|
Unrecognized pension cost |
|
|
(1) |
|
|
9 |
|
|
(33) |
|
|
Other comprehensive loss, net of tax |
|
$ |
(26) |
|
$ |
(25) |
|
$ |
(71) |
|
|
Comprehensive income |
|
|
288 |
|
|
147 |
|
|
297 |
|
|
Less: Comprehensive income attributable to noncontrolling interests |
|
|
(2) |
|
|
(1) |
|
|
(1) |
|
|
Comprehensive income attributable to Seaboard |
|
$ |
286 |
|
$ |
146 |
|
$ |
296 |
|
|
|
|
|
|
|
|
|
|
|
|
|
|
Average number of shares outstanding |
|
|
1,170,550 |
|
|
1,170,550 |
|
|
1,178,441 |
|
See accompanying notes to consolidated financial statements.
2016 Annual Report 27
SEABOARD CORPORATION
|
|
|
December 31, |
|
||||
|
(Millions of dollars except share and per share amounts) |
|
2016 |
|
2015 |
|
||
|
Assets |
|
|
|
|
|
|
|
|
Current assets: |
|
|
|
|
|
|
|
|
Cash and cash equivalents |
|
$ |
77 |
|
$ |
50 |
|
|
Short-term investments |
|
|
1,277 |
|
|
1,254 |
|
|
Receivables: |
|
|
|
|
|
|
|
|
Trade |
|
|
269 |
|
|
330 |
|
|
Due from affiliates |
|
|
110 |
|
|
86 |
|
|
Notes receivable from affiliates |
|
|
163 |
|
|
— |
|
|
Other |
|
|
99 |
|
|
115 |
|
|
Total receivables |
|
|
641 |
|
|
531 |
|
|
Allowance for doubtful accounts |
|
|
(14) |
|
|
(21) |
|
|
Net receivables |
|
|
627 |
|
|
510 |
|
|
Inventories |
|
|
762 |
|
|
739 |
|
|
Other current assets |
|
|
105 |
|
|
111 |
|
|
Total current assets |
|
|
2,848 |
|
|
2,664 |
|
|
Net property, plant and equipment |
|
|
1,006 |
|
|
831 |
|
|
Investments in and advances to affiliates |
|
|
773 |
|
|
671 |
|
|
Notes receivable from affiliates |
|
|
26 |
|
|
200 |
|
|
Goodwill |
|
|
19 |
|
|
12 |
|
|
Other intangible assets, net |
|
|
3 |
|
|
3 |
|
|
Other non-current assets |
|
|
80 |
|
|
50 |
|
|
Total assets |
|
$ |
4,755 |
|
$ |
4,431 |
|
|
Liabilities and Stockholders’ Equity |
|
|
|
|
|
|
|
|
Current liabilities: |
|
|
|
|
|
|
|
|
Notes payable to banks |
|
$ |
121 |
|
$ |
141 |
|
|
Current maturities of long-term debt |
|
|
17 |
|
|
4 |
|
|
Accounts payable |
|
|
194 |
|
|
200 |
|
|
Payables due to affiliates |
|
|
22 |
|
|
39 |
|
|
Accrued compensation and benefits |
|
|
118 |
|
|
121 |
|
|
Deferred revenue |
|
|
66 |
|
|
47 |
|
|
Deferred revenue from affiliates |
|
|
48 |
|
|
46 |
|
|
Accrued voyage costs |
|
|
52 |
|
|
44 |
|
|
Accrued commodity inventory |
|
|
35 |
|
|
26 |
|
|
Other current liabilities |
|
|
112 |
|
|
98 |
|
|
Total current liabilities |
|
|
785 |
|
|
766 |
|
|
Long-term debt, less current maturities |
|
|
499 |
|
|
518 |
|
|
Accrued pension liability |
|
|
121 |
|
|
132 |
|
|
Deferred income taxes |
|
|
77 |
|
|
41 |
|
|
Other liabilities and deferred credits |
|
|
98 |
|
|
92 |
|
|
Total non-current liabilities |
|
|
795 |
|
|
783 |
|
|
Commitments and contingent liabilities |
|
|
|
|
|
|
|
|
Stockholders’ equity: |
|
|
|
|
|
|
|
|
Common stock of $1 par value. Authorized 1,250,000 shares; issued and outstanding 1,170,550 shares |
|
|
1 |
|
|
1 |
|
|
Accumulated other comprehensive loss |
|
|
(304) |
|
|
(278) |
|
|
Retained earnings |
|
|
3,465 |
|
|
3,153 |
|
|
Total Seaboard stockholders’ equity |
|
|
3,162 |
|
|
2,876 |
|
|
Noncontrolling interests |
|
|
13 |
|
|
6 |
|
|
Total equity |
|
|
3,175 |
|
|
2,882 |
|
|
Total liabilities and stockholders’ equity |
|
$ |
4,755 |
|
$ |
4,431 |
|
See accompanying notes to consolidated financial statements.
28 2016 Annual Report
SEABOARD CORPORATION
Consolidated Statements of Cash Flows
|
|
|
Years ended December 31, |
|
|||||||
|
(Millions of dollars) |
|
2016 |
|
2015 |
|
2014 |
|
|||
|
Cash flows from operating activities: |
|
|
|
|
|
|
|
|
|
|
|
Net earnings |
|
$ |
314 |
|
$ |
172 |
|
$ |
368 |
|
|
Adjustments to reconcile net earnings to cash from operating activities: |
|
|
|
|
|
|
|
|
|
|
|
Depreciation and amortization |
|
|
102 |
|
|
91 |
|
|
92 |
|
|
Gain from sale of power generating facility assets |
|
|
— |
|
|
— |
|
|
(5) |
|
|
Deferred income taxes |
|
|
47 |
|
|
(10) |
|
|
26 |
|
|
Pay-in-kind interest and accretion on notes receivable from affiliates |
|
|
(3) |
|
|
(17) |
|
|
(16) |
|
|
Reserve on notes receivable from affiliate |
|
|
16 |
|
|
— |
|
|
— |
|
|
Loss (income) from affiliates |
|
|
(81) |
|
|
(70) |
|
|
(37) |
|
|
Dividends received from affiliates |
|
|
53 |
|
|
69 |
|
|
14 |
|
|
Other investment loss (income), net |
|
|
(69) |
|
|
5 |
|
|
(2) |
|
|
Gain on sale of controlling interest in a subsidiary |
|
|
— |
|
|
— |
|
|
(66) |
|
|
Other, net |
|
|
12 |
|
|
5 |
|
|
(3) |
|
|
Changes in assets and liabilities, net of acquisitions: |
|
|
|
|
|
|
|
|
|
|
|
Receivables, net of allowance |
|
|
18 |
|
|
119 |
|
|
(7) |
|
|
Inventories |
|
|
6 |
|
|
(35) |
|
|
(81) |
|
|
Other current assets |
|
|
8 |
|
|
(3) |
|
|
24 |
|
|
Current liabilities, exclusive of debt |
|
|
23 |
|
|
75 |
|
|
44 |
|
|
Other, net |
|
|
(19) |
|
|
15 |
|
|
23 |
|
|
Net cash from operating activities |
|
|
427 |
|
|
416 |
|
|
374 |
|
|
Cash flows from investing activities: |
|
|
|
|
|
|
|
|
|
|
|
Purchase of short-term investments |
|
|
(691) |
|
|
(1,320) |
|
|
(1,097) |
|
|
Proceeds from sale of short-term investments |
|
|
710 |
|
|
526 |
|
|
876 |
|
|
Proceeds from maturity of short-term investments |
|
|
34 |
|
|
29 |
|
|
18 |
|
|
Capital expenditures |
|
|
(158) |
|
|
(139) |
|
|
(121) |
|
|
Proceeds from sale of fixed assets |
|
|
47 |
|
|
48 |
|
|
8 |
|
|
Proceeds from sale of power generating facility assets |
|
|
— |
|
|
— |
|
|
8 |
|
|
Acquisition of businesses |
|
|
(219) |
|
|
— |
|
|
— |
|
|
Investments in and advances to affiliates, net |
|
|
(71) |
|
|
(119) |
|
|
(31) |
|
|
Notes receivable issued to affiliates |
|
|
(13) |
|
|
— |
|
|
(1) |
|
|
Principal payments received on notes receivable from affiliates |
|
|
12 |
|
|
— |
|
|
1 |
|
|
Purchase of long-term investments |
|
|
(31) |
|
|
(28) |
|
|
(3) |
|
|
Proceeds from the sale of controlling interest in a subsidiary |
|
|
— |
|
|
— |
|
|
74 |
|
|
Other, net |
|
|
6 |
|
|
(1) |
|
|
3 |
|
|
Net cash from investing activities |
|
|
(374) |
|
|
(1,004) |
|
|
(265) |
|
|
Cash flows from financing activities: |
|
|
|
|
|
|
|
|
|
|
|
Notes payable to banks, net |
|
|
(25) |
|
|
83 |
|
|
17 |
|
|
Proceeds from long-term debt |
|
|
3 |
|
|
522 |
|
|
— |
|
|
Principal payments of long-term debt |
|
|
(5) |
|
|
— |
|
|
(91) |
|
|
Repurchase of common stock |
|
|
— |
|
|
— |
|
|
(53) |
|
|
Other, net |
|
|
— |
|
|
— |
|
|
(2) |
|
|
Net cash from financing activities |
|
|
(27) |
|
|
605 |
|
|
(129) |
|
|
Effect of exchange rate changes on cash and cash equivalents |
|
|
1 |
|
|
(3) |
|
|
1 |
|
|
Net change in cash and cash equivalents |
|
|
27 |
|
|
14 |
|
|
(19) |
|
|
Cash and cash equivalents at beginning of year |
|
|
50 |
|
|
36 |
|
|
55 |
|
|
Cash and cash equivalents at end of year |
|
$ |
77 |
|
$ |
50 |
|
$ |
36 |
|
See accompanying notes to consolidated financial statements.
2016 Annual Report 29
SEABOARD CORPORATION
Consolidated Statements of Changes in Equity
|
|
|
|
|
|
Accumulated |
|
|
|
|
|
|
|
|
|
|
|
|
|
|
|
|
|
Other |
|
|
|
|
|
|
|
|
|
|
|
|
|
|
Common |
|
Comprehensive |
|
Retained |
|
Noncontrolling |
|
|
|
|
||||
|
(Millions of dollars) |
|
Stock |
|
Loss |
|
Earnings |
|
Interests |
|
Total |
|
|||||
|
Balances, January 1, 2014 |
|
$ |
1 |
|
$ |
(182) |
|
$ |
2,668 |
|
$ |
6 |
|
$ |
2,493 |
|
|
Comprehensive income: |
|
|
|
|
|
|
|
|
|
|
|
|
|
|
|
|
|
Net earnings |
|
|
|
|
|
|
|
|
367 |
|
|
1 |
|
|
368 |
|
|
Other comprehensive loss, net of tax |
|
|
|
|
|
(71) |
|
|
|
|
|
|
|
|
(71) |
|
|
Repurchase of common stock |
|
|
|
|
|
|
|
|
(53) |
|
|
|
|
|
(53) |
|
|
Reduction to noncontrolling interests |
|
|
|
|
|
|
|
|
|
|
|
(2) |
|
|
(2) |
|
|
Balances, December 31, 2014 |
|
|
1 |
|
|
(253) |
|
|
2,982 |
|
|
5 |
|
|
2,735 |
|
|
Comprehensive income: |
|
|
|
|
|
|
|
|
|
|
|
|
|
|
|
|
|
Net earnings |
|
|
|
|
|
|
|
|
171 |
|
|
1 |
|
|
172 |
|
|
Other comprehensive loss, net of tax |
|
|
|
|
|
(25) |
|
|
|
|
|
|
|
|
(25) |
|
|
Balances, December 31, 2015 |
|
|
1 |
|
|
(278) |
|
|
3,153 |
|
|
6 |
|
|
2,882 |
|
|
Comprehensive income: |
|
|
|
|
|
|
|
|
|
|
|
|
|
|
|
|
|
Net earnings |
|
|
|
|
|
|
|
|
312 |
|
|
2 |
|
|
314 |
|
|
Other comprehensive loss, net of tax |
|
|
|
|
|
(26) |
|
|
|
|
|
|
|
|
(26) |
|
|
Additions to noncontrolling interests |
|
|
|
|
|
|
|
|
|
|
|
5 |
|
|
5 |
|
|
Balances, December 31, 2016 |
|
$ |
1 |
|
$ |
(304) |
|
$ |
3,465 |
|
$ |
13 |
|
$ |
3,175 |
|
See accompanying notes to consolidated financial statements.
30 2016 Annual Report
SEABOARD CORPORATION
Notes to Consolidated Financial Statements
Summary of Significant Accounting Policies
Operations of Seaboard Corporation and its Subsidiaries
Seaboard Corporation and its subsidiaries (“Seaboard”) are a diverse global agribusiness and transportation company. In the United States (“U.S.”), Seaboard is primarily engaged in pork production and processing and ocean transportation. Overseas, Seaboard is primarily engaged in commodity merchandising, grain processing, sugar production and electric power generation. Seaboard also has an interest in a turkey operation in the U.S. Seaboard Flour LLC and SFC Preferred LLC, entities owned by the chief executive officer and his family, hold approximately 76% of Seaboard’s outstanding common stock.
Principles of Consolidation and Investments in Affiliates
The consolidated financial statements include the accounts of Seaboard Corporation and its domestic and foreign subsidiaries. All significant intercompany balances and transactions have been eliminated in consolidation. Investments in non-controlled affiliates where we have significant influence are accounted for by the equity method. Financial information from certain foreign subsidiaries and affiliates is reported on a one- to three-month lag, depending on the specific entity.
Short-Term Investments
Short-term investments are retained for future use in the business. Investments held by Seaboard that are categorized as trading securities are reported at their estimated fair value with any unrealized gains and losses included in other investment income (loss), net on the consolidated statements of comprehensive income. Investments held by Seaboard that are categorized as available-for-sale are reported at their estimated fair value with any related unrealized gains and losses reported net of tax, as a component of accumulated other comprehensive loss. Gains and losses on sale of investments are generally based on the specific identification method.
Accounts Receivable
Accounts receivable are recorded at the invoiced amount and generally do not bear interest. The Power segment, however, collects interest on certain past due accounts, and the Commodity Trading and Milling (“CT&M”) segment provides extended payment terms for certain customers in certain countries due to local market conditions. The allowance for doubtful accounts is Seaboard’s best estimate of the amount of probable credit losses. For most operating segments, Seaboard uses a specific identification approach to determine, in management’s judgment, the collection value of certain past due accounts based on contractual terms. For the Marine segment, the allowance for doubtful accounts is based on an aging percentage methodology primarily based on historical write-off experience. Seaboard reviews its allowance for doubtful accounts monthly. Account balances are charged off against the allowance after all means of collection have been exhausted and the potential for recovery is considered remote.
Inventories
Seaboard uses the lower of last-in, first-out (“LIFO”) cost or market for determining inventory cost of live hogs, fresh pork product and related materials. Grain, flour and feed inventories at foreign milling operations are valued at the lower of weighted average cost or market. All other inventories are valued at the lower of first-in, first-out (“FIFO”) cost or market.
Property, Plant and Equipment
Property, plant and equipment are carried at cost and are being depreciated on the straight-line method over useful lives, ranging from 3 to 30 years. Property, plant and equipment leases that are deemed to be installment purchase obligations have been capitalized and included in the property, plant and equipment accounts. Routine and planned major maintenance, repairs and minor renewals are expensed as incurred, while major renewals and improvements are capitalized.
Impairment of Long-Lived Assets
Long-lived assets, primarily property, plant and equipment, are reviewed for impairment when events or changes in circumstances indicate that the carrying amount may not be recoverable. Recoverability of assets to be held and used is measured by a comparison of the carrying amount of the asset to future undiscounted net cash flows expected to be generated by the asset. If such assets are determined to be impaired, the impairment to be recognized is measured by the amount by which the carrying amount of the assets exceeds the estimated fair value of the assets. Assets to be disposed of are reported at the lower of the carrying amount or fair value less costs to sell.
2016 Annual Report 31
SEABOARD CORPORATION
Notes to Consolidated Financial Statements
Notes Receivable from Affiliates
Seaboard monitors the credit quality of notes receivable from its affiliates by obtaining and reviewing financial information for these affiliates on a monthly basis and by having Seaboard representatives serve on the Board of Directors of these affiliates. If based on current information and events it is probable that Seaboard will be unable to collect all amounts due according to the contractual terms of the notes receivable from affiliates and an amount can be reasonably estimated, Seaboard will write down the notes receivable to estimated realizable value.
Goodwill and Other Intangible Assets
Goodwill is assessed annually for impairment by each reporting unit at the quarter end closest to the anniversary date of the acquisition, or more frequently if circumstances indicate that impairment is likely. Separable intangible assets with finite lives are amortized over their estimated useful lives. Any one event or a combination of events such as change in the business climate, a negative change in relationships with significant customers and changes to strategic decisions, including decisions to expand made in response to economic or competitive conditions, could require an interim assessment prior to the next required annual assessment. Goodwill is primarily related to the repurchase in 2007 of a noncontrolling interest of Seaboard Foods LLC (“Seaboard Foods”) in the Pork segment for a total of $12 million. Due to acquisitions during 2016 in the Pork segment and CT&M segment, goodwill increased $6 million and $1 million, respectively. Based on the annual assessment conducted by these reporting units during 2016, there were no impairment charges recorded for the year ended December 31, 2016.
Accrued Self-Insurance
Seaboard is self-insured for certain levels of workers’ compensation, health care coverage, property damage and general, vehicle and product recall liability. The cost of these self-insurance programs is accrued based upon estimated settlements for known and anticipated claims. Changes in estimates to previously recorded reserves are reflected in current operating results.
Asset Retirement Obligation
Seaboard has recorded long-lived assets and a related liability for the asset retirement obligation costs associated with the closure of the hog lagoons it is legally obligated to close in the future should Seaboard cease operations or plan to close such lagoons voluntarily in accordance with a changed operating plan. Based on detailed assessments and appraisals obtained to estimate the future asset retirement obligation costs, Seaboard recorded the present value of the projected costs in non-current other liabilities on the consolidated balance sheets with the retirement asset depreciated over the economic life of the related asset. The following table shows the changes in the asset retirement obligation during 2016 and 2015:
|
|
|
|
|
|
|
|
|
|
|
|
Years ended December 31, |
|
||||
|
(Millions of dollars) |
|
2016 |
|
2015 |
|
||
|
Beginning balance |
|
$ |
18 |
|
$ |
17 |
|
|
Accretion expense |
|
|
1 |
|
|
1 |
|
|
Ending balance |
|
$ |
19 |
|
$ |
18 |
|
Income Taxes
Deferred income taxes are recognized for the tax consequences of temporary differences by applying enacted statutory tax rates applicable to future years to differences between the financial statement carrying amounts and the tax bases of existing assets and liabilities. However, in the future, as these timing differences reverse, a lower statutory tax rate may apply pursuant to the provisions for domestic manufacturers of the American Jobs Creation Act of 2004. In accordance with U.S. generally accepted accounting principles (“GAAP”), Seaboard will recognize the benefit or cost of this change in the future.
Revenue Recognition
As a result of a marketing agreement with Triumph Foods, LLC (“Triumph”), Seaboard’s sales prices for its pork products included in product revenues are primarily based on a margin sharing arrangement that considers the average sales price and mix of products sold from both Seaboard’s and Triumph’s hog processing plants. Seaboard earns a fee for marketing the pork products of Triumph, and recognizes this fee as service revenue primarily based on the number of head processed by Triumph. Revenues for the CT&M segment are recognized when the commodity is delivered to the customer, collection is reasonably assured and the sales price is fixed or determinable. Revenues for cargo services in the Marine segment are recognized ratably over the transit time for each voyage, with expenses associated with cargo services recognized as incurred. Revenues for all other commercial exchanges are recognized at the time products are
32 2016 Annual Report
SEABOARD CORPORATION
Notes to Consolidated Financial Statements
shipped or delivered in accordance with shipping terms or services rendered, the customer takes ownership and assumes risk of loss, collection is reasonably assured and the sales price is fixed or determinable.
Use of Estimates
The preparation of the consolidated financial statements in conformity with GAAP requires management to make estimates and assumptions that affect the reported amounts of assets and liabilities, the disclosure of contingent assets and liabilities at the date of the consolidated financial statements and the reported amounts of revenues and expenses during the reporting period. Significant items subject to such estimates and assumptions include those related to allowance for doubtful accounts, valuation of inventories, impairment of long-lived assets, potential write down related to investments in and advances to affiliates and notes receivable from affiliates, income taxes and accrued pension liability. Actual results could differ from those estimates.
Earnings Per Common Share
Earnings per common share are based upon the weighted average shares outstanding during the period. Basic and diluted earnings per share are the same for all periods presented.
Cash and Cash Equivalents
For purposes of the consolidated statements of cash flows, management considers all demand deposits and overnight investments as cash equivalents. The following table shows the cash paid for interest and income taxes:
|
|
|
|
|
|
|
|
|
|
|
|
|
|
|
Years ended December 31, |
|
|||||||
|
(Millions of dollars) |
|
2016 |
|
2015 |
|
2014 |
|
|||
|
Interest, net of interest capitalized |
|
$ |
29 |
|
$ |
17 |
|
$ |
20 |
|
|
Income taxes, net of refunds |
|
|
31 |
|
|
60 |
|
|
135 |
|
Supplemental Non-Cash Transactions
On October 28, 2016, Seaboard obtained control of Belarina Alimentos S.A., a flour production business in Brazil (“Belarina”). No cash or other consideration was transferred to the other shareholder whose ownership was diluted through revision of the shareholders agreement to restructure the affiliate debt and equity of Belarina. See Note 13 for the purchase price allocation table and other details.
As more fully described in Note 4, on September 27, 2014, Seaboard’s Pork segment sold to Triumph a 50% interest in its processed meats division, Daily’s Premium Meats, LLC (“Daily’s”). As a result, Seaboard deconsolidated Daily’s from its consolidated balance sheet as of September 27, 2014. The following table summarizes the non-cash transactions resulting from this deconsolidation:
|
|
|
|
|
|
|
(Millions of dollars) |
|
|
||
|
Decrease in net working capital |
|
$ |
21 |
|
|
Increase in investment in and advances to affiliates |
|
|
(74) |
|
|
Decrease in property, plant and equipment |
|
|
16 |
|
|
Decrease in goodwill |
|
|
28 |
|
|
Decrease in other intangible assets, net (not subject to amortization) |
|
|
17 |
|
|
Gain on sale of controlling interest in subsidiary |
|
|
66 |
|
|
Net proceeds from sale of controlling interest in subsidiary |
|
$ |
74 |
|
Seaboard had notes receivable from affiliates that accrued pay-in-kind interest income, primarily from one affiliate. On January 4, 2016, the interest on this note receivable was modified to eliminate future pay-in-kind interest as discussed in Note 4 to the consolidated financial statements. Non-cash, pay-in-kind interest income and accretion of discount recognized on these notes receivable for the years ended December 31, 2016, 2015 and 2014 was $3 million, $17 million and $16 million, respectively.
Foreign Currency Transactions and Translation
Seaboard has operations in several foreign countries, and the currencies of the countries fluctuate in relation to the U.S. dollar. Certain of the major contracts and transactions, however, are denominated in U.S. dollars. In addition, the value of the U.S. dollar fluctuates in relation to the currencies of countries where certain of Seaboard’s foreign subsidiaries and affiliates primarily conduct business. These fluctuations result in exchange gains and losses. The activities of these foreign subsidiaries and affiliates are primarily conducted with U.S. subsidiaries or operate in hyper-inflationary
2016 Annual Report 33
SEABOARD CORPORATION
Notes to Consolidated Financial Statements
environments. As a result, the financial statements of certain foreign subsidiaries and affiliates are re-measured using the U.S. dollar as the functional currency.
Seaboard’s Sugar segment, four consolidated subsidiaries (CT&M segment businesses in Brazil, Canada, Guyana and Zambia) and eight non-controlled, non-consolidated affiliates (a Marine segment business in Jamaica and CT&M segment businesses in Australia, Colombia, Kenya, Lesotho, South Africa, Turkey and Zambia) use local currency as their functional currency. Assets and liabilities of these subsidiaries are translated to U.S. dollars at year-end exchange rates, and income and expenses are translated at average rates. Translation gains and losses are recorded as components of other comprehensive income (loss). For the consolidated subsidiaries and non-consolidated affiliates, U.S. dollar denominated net asset or liability conversions to the local currency are recorded through income.
Derivative Instruments and Hedging Activities
Seaboard recognizes all derivatives as either assets or liabilities at their fair values. Accounting for changes in the fair value of a derivative depends on its designation and effectiveness. Derivatives qualify for treatment as hedges for accounting purposes when there is a high correlation between the change in fair value of the instrument and the related change in value of the underlying commitment. Additionally, in order to designate a derivative financial instrument as a hedge for accounting purposes, extensive record keeping is required. For derivatives that qualify as hedges for accounting purposes, the change in fair value has no net impact on earnings, to the extent the derivative is considered effective, until the hedged transaction affects earnings. For derivatives that are not designated as hedging instruments for accounting purposes, or for the ineffective portion of a hedging instrument, the change in fair value affects current period net earnings.
Seaboard uses various derivative instruments to manage various types of market risks from its day-to-day operations, primarily including commodity futures and option contracts, foreign currency exchange agreements and interest rate exchange agreements. While management believes each of these instruments primarily are entered into in order to effectively manage various market risks, as of December 31, 2016, none of the derivatives were designated and accounted for as hedges, primarily as a result of the extensive record-keeping requirements. From time to time, Seaboard also enters into speculative derivative transactions not directly related to its raw material requirements.
Recently Issued Accounting Standards Not Yet Adopted
In May 2014, the Financial Accounting Standards Board (“FASB”) issued guidance to develop a single, comprehensive revenue recognition model for all contracts with customers. This guidance requires an entity to recognize revenues when promised goods or services are transferred to customers in an amount that reflects the consideration to which an entity expects to be entitled for those goods and services. This guidance supersedes nearly all existing revenue recognition guidance under GAAP. Seaboard will adopt this guidance on January 1, 2018, using the cumulative effect transition method, where any cumulative effect of initially adopting the guidance is recognized at the date of adoption. Based on management’s initial assessment, Seaboard believes the adoption of this guidance will not have a material impact on its financial position or net earnings.
In July 2015, the FASB issued guidance to simplify the subsequent measurement of inventory, excluding inventory measured using LIFO or the retail inventory method. Under the new standard, inventory should be at the lower of cost and net realizable value. The new guidance is effective for interim and annual periods beginning after December 15, 2016, with early adoption permitted. Seaboard believes the adoption of this guidance will not have a material impact on its financial position or net earnings.
In January 2016, the FASB issued guidance that requires entities to measure equity investments, other than those accounted for using the equity method of accounting, at fair value and recognize any changes in fair value in net income if a readily determinable fair value exists. For investments without readily determinable fair values, the cost method of accounting is eliminated. An entity may elect to record these equity investments at cost, less impairment, and plus or minus subsequent adjustments for observable price changes. The new guidance is effective for interim and annual periods beginning after December 15, 2017. Seaboard believes the adoption of this guidance will not have a material impact on its financial position or net earnings.
34 2016 Annual Report
SEABOARD CORPORATION
Notes to Consolidated Financial Statements
In February 2016, the FASB issued guidance that a lessee should record a right-of-use (“ROU”) asset and a lease liability on the balance sheet for all leases with terms longer than 12 months. Leases will be classified as either finance or operating, with classification affecting the pattern of expense recognition in the income statement. The recognition, measurement, and presentation of expenses and cash flows arising from a financing lease have not significantly changed from the previous guidance. For operating leases, a lessee is required to: (1) recognize a ROU asset and a lease liability, initially measured at the present value of the lease payments, in the balance sheet, (2) recognize a single lease cost, calculated so that the cost of the lease is allocated over the lease term on a generally straight-line basis and (3) classify all cash payments within operating activities in the statement of cash flows. Seaboard will adopt this guidance on January 1, 2019. In transition, lessees are required to recognize and measure leases at the beginning of the earliest period presented using a modified retrospective approach, which includes a number of optional practical expedients that entities may elect to apply. Seaboard is in the preliminary stages of its assessment of the effect the guidance will have on its existing accounting policies and the consolidated financial statements, but expects there will be an increase in assets and liabilities on the consolidated balance sheets at adoption due to the recording of ROU assets and corresponding lease liabilities, which may be material. See Note 10 for information about Seaboard’s lease obligations.
Note 2
Investments
The following is a summary of the amortized cost and estimated fair value of short-term investments for both available-for-sale and trading securities at the end of each year:
|
|
|
|
|
|
|
|
|
|
|
|
|
|
|
|
|
|
December 31, 2016 |
|
December 31, 2015 |
|
||||||||
|
|
|
Amortized |
|
Fair |
|
Amortized |
|
Fair |
|
||||
|
(Millions of dollars) |
|
Cost |
|
Value |
|
Cost |
|
Value |
|
||||
|
Money market funds |
|
$ |
— |
|
$ |
— |
|
$ |
81 |
|
$ |
81 |
|
|
Total available-for-sale short-term investments |
|
|
— |
|
|
— |
|
|
81 |
|
|
81 |
|
|
Domestic equity securities |
|
|
444 |
|
|
482 |
|
|
475 |
|
|
466 |
|
|
Domestic debt securities held in mutual funds/ETFs/U.S. Treasuries |
|
|
437 |
|
|
437 |
|
|
452 |
|
|
450 |
|
|
Foreign equity securities |
|
|
198 |
|
|
199 |
|
|
120 |
|
|
120 |
|
|
High yield securities |
|
|
114 |
|
|
115 |
|
|
108 |
|
|
104 |
|
|
Collateralized loan obligations |
|
|
25 |
|
|
26 |
|
|
10 |
|
|
10 |
|
|
Money market funds held in trading accounts |
|
|
13 |
|
|
13 |
|
|
22 |
|
|
22 |
|
|
Other trading securities |
|
|
5 |
|
|
5 |
|
|
1 |
|
|
1 |
|
|
Total trading short-term investments |
|
|
1,236 |
|
|
1,277 |
|
|
1,188 |
|
|
1,173 |
|
|
Total short-term investments |
|
$ |
1,236 |
|
$ |
1,277 |
|
$ |
1,269 |
|
$ |
1,254 |
|
Unrealized gains (losses) related to trading securities were $49 million, $(12) million and $(7) million for the years ended December 31, 2016, 2015 and 2014, respectively. Seaboard had $91 million of equity securities denominated in foreign currencies at December 31, 2016, with $35 million in euros, $20 million in Japanese yen, $16 million in the British pound, $6 million in the Swiss franc and the remaining $14 million in various other currencies. Seaboard had $80 million of equity securities denominated in foreign currencies at December 31, 2015, with $25 million in euros, $20 million in Japanese yen, $15 million in the British pound, $7 million in the Swiss franc and the remaining $13 million in various other currencies. Also, money market funds included $1 million and $3 million denominated in various foreign currencies at December 31, 2016 and 2015, respectively.
In addition to its short-term investments, Seaboard also has trading securities related to Seaboard’s deferred compensation plans classified in other current assets on the consolidated balance sheets. See Note 8 for information on the types of trading securities held related to the deferred compensation plans. See Note 9 for a discussion of assets held in conjunction with investments related to Seaboard’s defined benefit pension plan.
Seaboard had $28 million and $20 million of cost method investments classified in other non-current assets on the consolidated balance sheets as of December 31, 2016 and 2015, respectively. During 2015, Seaboard invested $18 million for a 12% noncontrolling interest in a grain trading and poultry business in Morocco.
2016 Annual Report 35
SEABOARD CORPORATION
Notes to Consolidated Financial Statements
Note 3
Inventories
The following table is a summary of inventories at the end of each year:
|
|
|
|
|
|
|
|
|
|
|
|
|
|
December 31, |
|
||||
|
(Millions of dollars) |
|
|
2016 |
|
2015 |
|
||
|
At lower of LIFO cost or market: |
|
|
|
|
|
|
|
|
|
Live hogs and materials |
|
|
$ |
273 |
|
$ |
210 |
|
|
Fresh pork and materials |
|
|
|
34 |
|
|
26 |
|
|
|
|
|
|
307 |
|
|
236 |
|
|
LIFO adjustment |
|
|
|
(21) |
|
|
(28) |
|
|
Total inventories at lower of LIFO cost or market |
|
|
|
286 |
|
|
208 |
|
|
At lower of FIFO cost or market: |
|
|
|
|
|
|
|
|
|
Grains, oilseeds and other commodities |
|
|
|
279 |
|
|
330 |
|
|
Sugar produced and in process |
|
|
|
30 |
|
|
52 |
|
|
Other |
|
|
|
62 |
|
|
61 |
|
|
Total inventories at lower of FIFO cost or market |
|
|
|
371 |
|
|
443 |
|
|
Grain, flour and feed at lower of weighted average cost or market |
|
|
|
105 |
|
|
88 |
|
|
Total inventories |
|
|
$ |
762 |
|
$ |
739 |
|
The use of the LIFO method increased 2016, 2015 and 2014 net earnings by $5 million ($3.92 per common share), $5 million ($4.39 per common share), and by $16 million ($13.29 per common share), respectively. If the FIFO method had been used for certain inventories of the Pork segment, inventories would have been higher by $21 million and $28 million as of December 31, 2016 and 2015, respectively.
Note 4
Investments in and Advances to Affiliates and Notes Receivable from Affiliates
Seaboard has several investments in and advances to non-controlled, non-consolidated affiliates that are all accounted for using the equity method of accounting. Financial information from certain foreign affiliates is reported on a one- to three-month lag, depending on the specific entity.
The Turkey segment represents Seaboard’s 50% noncontrolling voting interest in Butterball, LLC (“Butterball”). Butterball is a vertically integrated producer, processor and marketer of branded and non-branded turkey and other products. As of December 31, 2016, Butterball had intangible assets of $111 million for trade name and $74 million for goodwill.
In connection with its initial investment in Butterball in December 2010, Seaboard provided Butterball with a $100 million unsecured subordinated loan (the “subordinated loan”) with a seven-year maturity and interest of 15% per annum, comprised of 5% payable in cash semi-annually, plus 10% pay-in-kind interest, compounded semi-annually, which accumulates and is paid at maturity. Also in connection with providing the subordinated loan, Seaboard received detachable warrants, which upon exercise for a nominal price, would enable Seaboard to acquire an additional 5% equity interest in Butterball. In January 2016, the interest on the subordinated loan was modified to 10% per annum, payable in cash semi-annually and the warrants were also modified, whereby Seaboard can exercise these warrants at any time after December 31, 2018 or prior to December 31, 2025 after which time the warrants expire. Butterball has the right to repurchase the warrants for fair market value. The warrant agreement essentially provides Seaboard with a 52.5% economic interest, as these warrants are in substance an additional equity interest. Therefore, Seaboard records 52.5% of Butterball’s earnings as income from affiliates in the consolidated statements of comprehensive income. However, all significant corporate governance matters would continue to be shared equally between Seaboard and its partner in Butterball even if the warrants were exercised, unless Seaboard already owned a majority of the voting rights at the time of exercise. The warrants qualify for equity treatment under accounting standards. Accordingly, as of December 2010, the warrants were allocated a value of $11 million, classified as investments in and advances to affiliates on the consolidated balance sheets, and the subordinated loan was allocated a discounted value of $89 million, classified as notes receivable from affiliates on the consolidated balance sheets, of the total $100 million subordinated financing discussed above. The discount on the subordinated loan is being accreted monthly in interest income from affiliates
36 2016 Annual Report
SEABOARD CORPORATION
Notes to Consolidated Financial Statements
through the maturity date of December 6, 2017. At December 31, 2016 and 2015, the recorded balance of this note receivable was $161 million and $158 million, respectively.
During 2011, Seaboard provided a term loan of $13 million to Butterball to pay off capital leases for certain fixed assets that originally were financed with third parties. The effective interest rate on this term loan is approximately 12%. Although the term loan expires on January 31, 2018, Butterball can pay off the term loan prior to such expiration date as Butterball has for sale all of the related assets and is required to remit the proceeds from such sale to Seaboard to repay the loan. As of December 31, 2016 and 2015, the balance of the term loan included in notes receivable from affiliates was $8 million.
Butterball had operating income in 2016, 2015 and 2014 of $162 million, $231 million and $141 million, respectively, and other condensed financial information for each of Seaboard’s years ended was as follows:
|
|
|
|
|
|
|
|
|
|
|
|
|
Turkey Segment |
|
December 31, |
|
|||||||
|
(Millions of dollars) |
|
2016 |
|
|
2015 |
|
|
2014 |
|
|
|
Net sales |
|
$ |
1,813 |
|
$ |
1,902 |
|
$ |
1,833 |
|
|
Net income |
|
$ |
139 |
|
$ |
195 |
|
$ |
104 |
|
|
Total assets |
|
$ |
1,154 |
|
$ |
1,087 |
|
$ |
1,021 |
|
|
Total liabilities |
|
$ |
529 |
|
$ |
541 |
|
$ |
547 |
|
|
Total equity |
|
$ |
625 |
|
$ |
546 |
|
$ |
474 |
|
The Pork segment has a 50% noncontrolling interest in Daily’s and Seaboard Triumph Foods, LLC (“STF”). Daily’s produces and markets raw and pre-cooked bacon, ham and sausage and has three further processing plants located in Salt Lake City, Utah, Missoula, Montana and St. Joseph, Missouri. STF is constructing a new pork processing facility in Sioux City, Iowa, with construction expected to be completed by mid-2017. Seaboard and Triumph formed STF in May 2015 with equal ownership of 50%. Seaboard originally agreed to contribute up to $207 million in connection with the development and operation of the facility, however, in the first quarter of 2016, third-party financing was obtained by STF, and the subscription agreement was amended to require $150 million in contributions. Seaboard contributed $51 million and $26 million during 2016 and 2015, respectively, and the remaining amount of $73 million is expected to be contributed in 2017. As part of the operations, Seaboard agreed to provide a portion of the hogs to be processed at the facility. The Pork segment currently has a business relationship with Triumph under which Seaboard markets substantially all of the pork products produced at Triumph’s plant in St. Joseph, Missouri.
In September 2014, the Pork segment sold to Triumph a 50% interest in Daily’s for cash proceeds of $74 million resulting in a gain on sale of controlling interest in subsidiary of $66 million ($40 million net of taxes, or $34.14 per share) in 2014. Through September 27, 2014, Seaboard consolidated the operating results of Daily’s as part of its Pork segment operations. As a result of this transaction, Seaboard deconsolidated Daily’s from its consolidated balance sheet as of September 27, 2014 (see Note 1, Supplemental Non-Cash Transactions, for details of the impact on the consolidated balance sheet from this deconsolidation). Based on the cash consideration received from this transaction and third-party valuations for fixed assets and certain intangible assets, it was determined the fair value of Seaboard’s remaining 50% investment in Daily’s exceeded book value by $33 million, which is included in the gain on sale above, for a total fair value of $74 million. In addition, both Seaboard and Triumph contributed $2 million each to Daily’s as additional equity to provide Daily’s with additional working capital resulting in a beginning total investment in affiliate of $76 million related to Daily’s. Pro forma results of operations are not presented as the effects of deconsolidation are not material to Seaboard’s results of operations, primarily as Seaboard supplies raw product to Daily’s. Triumph also supplies raw product to Daily’s.
Daily’s and STF’s combined condensed financial information for each of Seaboard’s years ended was follows:
|
|
|
|
|
|
|
|
|
|
|
|
|
Pork Segment |
|
|
December 31, |
|
||||||
|
(Millions of dollars) |
|
|
2016 |
|
|
2015 |
|
|
2014 |
|
|
Net sales |
|
$ |
319 |
|
$ |
295 |
|
$ |
71 |
|
|
Net income |
|
$ |
22 |
|
$ |
22 |
|
$ |
7 |
|
|
Total assets |
|
$ |
364 |
|
$ |
247 |
|
$ |
175 |
|
|
Total liabilities |
|
$ |
14 |
|
$ |
17 |
|
$ |
15 |
|
|
Total equity |
|
$ |
350 |
|
$ |
230 |
|
$ |
160 |
|
2016 Annual Report 37
SEABOARD CORPORATION
Notes to Consolidated Financial Statements
The CT&M segment has noncontrolling interests in foreign businesses conducting flour, maize and feed milling, baking operations, poultry production and processing, and agricultural commodity trading businesses. As of December 31, 2016, the location and percentage ownership of CT&M’s affiliates were as follows: Botswana (49%), Democratic Republic of Congo (“DRC”) (50%), Gambia (50%), Kenya (35%-49%), Lesotho (50%), Nigeria (16.2%-48.33%), South Africa (30%-50%), and Zambia (50%) in Africa, Colombia (40%-42%), Ecuador (25%-50%), Guyana (50%), Peru (50%) and Uruguay (45%) in South America, Jamaica (50%) and Haiti (33.33%) in the Caribbean, Turkey (25%) in Europe, Australia (25%), Canada (45%), and United States (34.36%). Seaboard generally is the primary provider of choice for grains, feed and supplies purchased by these non-controlled affiliates. As Seaboard conducts its agricultural commodity trading business with third parties, consolidated subsidiaries and affiliates on an interrelated basis, cost of sales on affiliates cannot be clearly distinguished without making numerous assumptions, primarily with respect to mark-to-market accounting for commodity derivatives.
The CT&M segment has a 50% noncontrolling interest in a bakery located in the DRC, which has experienced unfavorable local market conditions and operating challenges, including equipment problems, resulting in operating losses and challenges in gaining market share. In 2014, Seaboard recorded a write down of $11 million in loss from affiliate to reduce the remaining equity investment in this business to zero. There was no tax benefit from this transaction. As part of its original investment, Seaboard has an interest bearing long-term note receivable from this affiliate that had a principal and interest balance of approximately $35 million at December 31, 2015. The note receivable is 50% guaranteed by the other shareholder in the entity. The note receivable was restructured during the second quarter of 2016 to extend the maturity to June 2022 and change the bi-annual payments to monthly payments of varying amounts beginning in the fourth quarter of 2016. During the second quarter of 2016, new bakery management reevaluated its business plan and the production and profitability forecast due to the bakery’s failure to meet previous cash flow forecasts and the failure of significant equipment updates to accomplish projected improvement in quality and consistency of the bread. Based on the revised forecast, Seaboard reserved $11 million of this note receivable. During the fourth quarter of 2016, the bakery failed to make its scheduled restructured debt payments and, as a result, the business owners began discussions regarding various strategic alternatives. These alternatives include, but are not limited to, restructuring the note to further extend the term and match payments to revised cash flow estimates, enforce the guarantees from the other owner which may require legal action, sale of the bakery, or Seaboard obtaining control of the bakery at which time the entity would become consolidated. As a result, Seaboard reserved an additional $5 million in the fourth quarter of 2016 based on further revised cash flow scenarios. In aggregate for 2016, Seaboard reserved $16 million in bad debt expense within selling, general and administrative expenses in the consolidated statements of comprehensive income. There was no tax benefit from the transactions. As of December 31, 2016, the recorded balance of this note receivable and previous accrued interest was $19 million, all classified as long-term given uncertainty of the timing of payments in the future. If the future long-term cash flows of this bakery do not improve, more of the recorded value of the note receivable from affiliate could be deemed uncollectible in the future, which could result in a further charge to earnings.
The CT&M segment had a 50% noncontrolling interest in Belarina, a flour production business in Brazil, which it accounted for using the equity method of accounting prior to October 28, 2016, the date Seaboard obtained 98% of the equity ownership and control of Belarina. Seaboard accounted for this transaction as a business combination achieved in stages as discussed further in Note 12 to the consolidated financial statements. As an equity method affiliate, Seaboard had contributed a total of $63 million in investments and advances and a $13 million long-term loan, including investment and advances and pay-in-kind interest accretion totaling $14 million, $29 million and $5 million for the years ended December 31, 2016, 2015 and 2014, respectively. Seaboard recorded total losses from affiliate, which included reserves, of $10 million, $60 million and $8 million related to this investment in 2016, 2015 and 2014, respectively, and currency translation adjustment gains (losses) included in other comprehensive income (loss) of $(4) million, $5 million and $(1) million, respectively. Due to the extent of these losses, Seaboard had previously fully reserved all advances and long-term receivable, and as such, Seaboard’s investment, advances and long-term note receivable were zero as of December 31, 2015. Seaboard also had a gross trade receivable due from Belarina related to sales of grain and supplies of $17 million as of December 31, 2015, net of a reserve of $9 million based on an analysis of collectability and working capital. The net trade receivable balance was effectively settled as the entity is now consolidated.
During the first quarter of 2016, the CT&M segment provided a $12 million loan to a Peruvian affiliate. The Peruvian affiliate repaid the loan in the third quarter of 2016. Interest was payable monthly and the principal due on August 31, 2017, with no prepayment penalty.
38 2016 Annual Report
SEABOARD CORPORATION
Notes to Consolidated Financial Statements
During the fourth quarter of 2015, Seaboard contributed $13 million in cash, a small amount of other assets, certain employees and rights to sell certain agricultural commodities that Seaboard had previously sold through its subsidiary, PS International, LLC, for a 40% noncontrolling interest in a commodity trading business in Atlanta, Georgia. Also in 2015, Seaboard invested $10 million in an oilseed crushing business in the Republic of Turkey for a 25% noncontrolling interest, $8 million in a flour milling business in Botswana for a 49% noncontrolling interest, and $10 million for a 45% noncontrolling interest in a commodity trading and flour milling business in Uruguay.
At December 31, 2016, Seaboard’s carrying value of certain of CT&M segment’s investments in affiliates was more than its share of the affiliates’ book value by $22 million. The excess is attributable primarily to the valuation of property, plant and equipment and intangible assets. The amortizable assets are being amortized to income (loss) from affiliates over the remaining life of the assets. Combined condensed financial information of all the CT&M segment’s non-controlled, non-consolidated affiliates for their fiscal periods ended within each of Seaboard’s years ended was as follows:
|
|
|
|
|
|
|
|
|
|
|
|
|
Commodity Trading and Milling Segment |
|
December 31, |
|
|||||||
|
(Millions of dollars) |
|
2016 |
|
|
2015 |
|
|
2014 |
|
|
|
Net sales |
|
$ |
2,871 |
|
$ |
2,321 |
|
$ |
2,223 |
|
|
Net loss |
|
$ |
(6) |
|
$ |
(52) |
|
$ |
(20) |
|
|
Total assets |
|
$ |
1,201 |
|
$ |
1,265 |
|
$ |
1,132 |
|
|
Total liabilities |
|
$ |
734 |
|
$ |
809 |
|
$ |
732 |
|
|
Total equity |
|
$ |
467 |
|
$ |
456 |
|
$ |
400 |
|
The Marine segment has a 21% noncontrolling interest in a cargo terminal business in Jamaica and a 36% noncontrolling interest in a holding company that owns a controlling interest in two Haitian start-up projects. During the first quarter of 2016, Seaboard invested $7 million of cash and converted its $8 million note receivable to equity for its investment in the holding company. The start-up projects consist of a marine terminal operation and a free trade zone development, which includes a planned power plant. Seaboard’s first proportionate share of income (loss) from affiliates was recognized in the second quarter of 2016. In September 2014, Seaboard invested $17 million in the Jamaican cargo terminal business. Seaboard’s first proportionate share of income (loss) from affiliates was recognized in the first quarter of 2015. Both investments are reported on a three-month lag. Their combined condensed financial information for each of Seaboard’s years ended was as follows:
|
|
|
|
|
|
|
|
|
|
|
|
|
Marine Segment |
|
|
December 31, |
|
||||||
|
(Millions of dollars) |
|
|
2016 |
|
|
2015 |
|
|
2014 |
|
|
Net sales |
|
$ |
47 |
|
$ |
38 |
|
$ |
— |
|
|
Net income |
|
$ |
7 |
|
$ |
11 |
|
$ |
— |
|
|
Total assets |
|
$ |
277 |
|
$ |
148 |
|
$ |
119 |
|
|
Total liabilities |
|
$ |
109 |
|
$ |
30 |
|
$ |
36 |
|
|
Total equity |
|
$ |
168 |
|
$ |
118 |
|
$ |
83 |
|
The Sugar segment has two noncontrolling interests in sugar-related businesses in Argentina (46% and 50%, respectively). Their combined condensed financial information for each of Seaboard’s years ended was as follows:
|
|
|
|
|
|
|
|
|
|
|
|
|
Sugar Segment |
|
December 31, |
|
|||||||
|
(Millions of dollars) |
|
2016 |
|
|
2015 |
|
|
2014 |
|
|
|
Net sales |
|
$ |
10 |
|
$ |
9 |
|
$ |
9 |
|
|
Net income |
|
$ |
3 |
|
$ |
2 |
|
$ |
2 |
|
|
Total assets |
|
$ |
10 |
|
$ |
9 |
|
$ |
8 |
|
|
Total liabilities |
|
$ |
2 |
|
$ |
2 |
|
$ |
2 |
|
|
Total equity |
|
$ |
8 |
|
$ |
7 |
|
$ |
6 |
|
2016 Annual Report 39
SEABOARD CORPORATION
Notes to Consolidated Financial Statements
The Power segment has a 29.9% noncontrolling interest in an electricity generating facility and two smaller energy related businesses (45% and 50%, respectively), all in the Dominican Republic. During the second quarter of 2015, Seaboard invested an additional $10 million in a business operating a 300 megawatt electricity generating facility in the Dominican Republic that increased Seaboard's ownership interest to 29.9% from less than 20% and changed its method of accounting from a cost method investment to an equity method investment. This change in accounting required Seaboard to present its prior period financial results to reflect the equity method of accounting from the date of the initial investment. See Note 13 for more information. Combined condensed financial information of these entities for each of Seaboard’s years ended was as follows:
|
|
|
|
|
|
|
|
|
|
|
|
|
Power Segment |
|
December 31, |
|
|||||||
|
(Millions of dollars) |
|
2016 |
|
|
2015 |
|
|
2014 |
|
|
|
Net sales |
|
$ |
146 |
|
$ |
141 |
|
$ |
50 |
|
|
Net income |
|
$ |
14 |
|
$ |
12 |
|
$ |
9 |
|
|
Total assets |
|
$ |
261 |
|
$ |
327 |
|
$ |
328 |
|
|
Total liabilities |
|
$ |
175 |
|
$ |
219 |
|
$ |
230 |
|
|
Total equity |
|
$ |
86 |
|
$ |
108 |
|
$ |
98 |
|
Note 5
Net Property, Plant and Equipment
The following table is a summary of property, plant and equipment at the end of each year:
|
|
|
|
|
|
|
|
|
|
|
|
|
|
|
|
|
Useful |
|
December 31, |
|
|||||||
|
(Millions of dollars) |
|
Lives |
|
2016 |
|
2015 |
|
|||||
|
Land and improvements |
|
3 |
- |
15 |
years |
|
$ |
214 |
|
$ |
185 |
|
|
Buildings and improvements |
|
|
|
30 |
years |
|
|
486 |
|
|
405 |
|
|
Machinery and equipment |
|
3 |
- |
20 |
years |
|
|
1,142 |
|
|
1,025 |
|
|
Vessels and vehicles |
|
3 |
- |
18 |
years |
|
|
140 |
|
|
150 |
|
|
Office furniture and fixtures |
|
|
|
5 |
years |
|
|
32 |
|
|
27 |
|
|
Construction in progress |
|
|
|
|
|
|
|
58 |
|
|
38 |
|
|
|
|
|
|
|
|
|
|
2,072 |
|
|
1,830 |
|
|
Accumulated depreciation and amortization |
|
|
|
|
|
|
|
(1,066) |
|
|
(999) |
|
|
Net property, plant and equipment |
|
|
|
|
|
|
$ |
1,006 |
|
$ |
831 |
|
Seaboard’s capitalized interest on construction in progress projects was $4 million for the year ended December 31, 2016.
Note 6
Income Taxes
Income taxes attributable to continuing operations for the years ended December 31, 2016, 2015 and 2014 differed from the amounts computed by applying the statutory U.S. Federal income tax rate of 35% to earnings before income taxes excluding noncontrolling interests for the following reasons:
|
|
|
|
|
|
|
|
|
|
|
|
|
|
|
Years ended December 31, |
|
|||||||
|
(Millions of dollars) |
|
2016 |
|
2015 |
|
2014 |
|
|||
|
Computed “expected” tax expense excluding noncontrolling interests |
|
$ |
134 |
|
$ |
84 |
|
$ |
187 |
|
|
Adjustments to tax expense attributable to: |
|
|
|
|
|
|
|
|
|
|
|
Foreign tax differences |
|
|
(14) |
|
|
22 |
|
|
4 |
|
|
Tax-exempt income |
|
|
(15) |
|
|
(11) |
|
|
(9) |
|
|
State income taxes, net of federal benefit |
|
|
5 |
|
|
1 |
|
|
10 |
|
|
Federal tax credits |
|
|
(31) |
|
|
(16) |
|
|
(12) |
|
|
Domestic manufacturing deduction |
|
|
(5) |
|
|
(8) |
|
|
(11) |
|
|
Other |
|
|
(4) |
|
|
(3) |
|
|
(1) |
|
|
Total income tax expense |
|
$ |
70 |
|
$ |
69 |
|
$ |
168 |
|
40 2016 Annual Report
SEABOARD CORPORATION
Notes to Consolidated Financial Statements
Certain of Seaboard's foreign operations are subject to no income tax or a tax rate that is considerably lower than the U.S. corporate tax rate. Fluctuation of earnings or losses incurred from certain foreign operations conducting business in these jurisdictions can impact the mix of taxable earnings for each fiscal year.
Earnings before income taxes consisted of the following:
|
|
|
|
|
|
|
|
|
|
|
|
|
|
|
Years ended December 31, |
|
|||||||
|
(Millions of dollars) |
|
2016 |
|
2015 |
|
2014 |
|
|||
|
United States |
|
$ |
272 |
|
$ |
196 |
|
$ |
472 |
|
|
Foreign |
|
|
110 |
|
|
44 |
|
|
63 |
|
|
Total earnings excluding noncontrolling interests |
|
|
382 |
|
|
240 |
|
|
535 |
|
|
Less: Net income attributable to noncontrolling interests |
|
|
(2) |
|
|
(1) |
|
|
(1) |
|
|
Total earnings before income taxes |
|
$ |
384 |
|
$ |
241 |
|
$ |
536 |
|
The components of total income taxes were as follows:
|
|
|
|
|
|
|
|
|
|
|
|
|
|
|
Years ended December 31, |
|
|||||||
|
(Millions of dollars) |
|
2016 |
|
2015 |
|
2014 |
|
|||
|
Current: |
|
|
|
|
|
|
|
|
|
|
|
Federal |
|
$ |
(1) |
|
$ |
52 |
|
$ |
111 |
|
|
Foreign |
|
|
21 |
|
|
20 |
|
|
20 |
|
|
State and local |
|
|
7 |
|
|
6 |
|
|
12 |
|
|
Deferred: |
|
|
|
|
|
|
|
|
|
|
|
Federal |
|
|
36 |
|
|
(14) |
|
|
20 |
|
|
Foreign |
|
|
4 |
|
|
8 |
|
|
1 |
|
|
State and local |
|
|
3 |
|
|
(3) |
|
|
4 |
|
|
Income tax expense |
|
|
70 |
|
|
69 |
|
|
168 |
|
|
Unrealized changes in other comprehensive income |
|
|
(12) |
|
|
— |
|
|
(27) |
|
|
Total income taxes |
|
$ |
58 |
|
$ |
69 |
|
$ |
141 |
|
As of December 31, 2016 and 2015, Seaboard had income taxes receivable of $48 million and $33 million, respectively, primarily related to domestic tax jurisdictions, and had income taxes payable of $6 million and $4 million, respectively, primarily related to foreign tax jurisdictions.
Components of the net deferred income tax liability at the end of each year were as follows:
|
|
|
|
|
|
|
|
|
|
|
|
December 31, |
|
||||
|
(Millions of dollars) |
|
2016 |
|
2015 |
|
||
|
Deferred income tax liabilities: |
|
|
|
|
|
|
|
|
Depreciation |
|
$ |
112 |
|
$ |
112 |
|
|
Domestic partnerships |
|
|
69 |
|
|
53 |
|
|
LIFO |
|
|
10 |
|
|
11 |
|
|
Cash basis farming adjustment |
|
|
9 |
|
|
9 |
|
|
Other |
|
|
18 |
|
|
9 |
|
|
|
|
$ |
218 |
|
$ |
194 |
|
|
Deferred income tax assets: |
|
|
|
|
|
|
|
|
Reserves/accruals |
|
$ |
83 |
|
$ |
103 |
|
|
Deferred earnings of foreign subsidiaries |
|
|
45 |
|
|
36 |
|
|
Net operating and capital loss carry-forwards |
|
|
50 |
|
|
10 |
|
|
Tax credit carry-forwards |
|
|
13 |
|
|
14 |
|
|
Other |
|
|
8 |
|
|
9 |
|
|
|
|
|
199 |
|
|
172 |
|
|
Valuation allowance |
|
|
58 |
|
|
19 |
|
|
Net deferred income tax liability |
|
$ |
77 |
|
$ |
41 |
|
2016 Annual Report 41
SEABOARD CORPORATION
Notes to Consolidated Financial Statements
Seaboard recognizes interest accrued related to unrecognized tax benefits and penalties in income tax expense. For the years ended December 31, 2016, 2015 and 2014, such interest and penalties were not material. The Company had approximately $2 million and $4 million accrued for the payment of interest and penalties on uncertain tax positions at December 31, 2016 and 2015, respectively.
As of December 31, 2016 and 2015, Seaboard had $13 million and $7 million, respectively, in total unrecognized tax benefits all of which, if recognized, would affect the effective tax rate. Seaboard does not have any material uncertain tax positions in which it is reasonably possible that the total amounts of the unrecognized tax benefits will significantly increase or decrease within 12 months of the reporting date. The following table is a reconciliation of the beginning and ending amount of unrecognized tax benefits:
|
|
|
|
|
|
|
|
|
|
(Millions of dollars) |
|
2016 |
|
2015 |
|
||
|
Beginning balance at January 1 |
|
$ |
7 |
|
$ |
7 |
|
|
Additions for uncertain tax positions of prior years |
|
|
6 |
|
|
1 |
|
|
Decreases for uncertain tax positions of prior years |
|
|
— |
|
|
(2) |
|
|
Additions for uncertain tax positions of current year |
|
|
2 |
|
|
1 |
|
|
Lapse of statute of limitations |
|
|
(2) |
|
|
— |
|
|
Ending balance at December 31 |
|
$ |
13 |
|
$ |
7 |
|
Seaboard’s tax returns are regularly audited by federal, state and foreign tax authorities, which may result in material adjustments. The IRS examination of Seaboard’s U.S. income tax return for 2013 began in 2016. With the exception of a loss carryback to 2012, tax years prior to 2013 are generally no longer subject to U.S. tax assessment. In Seaboard’s major non-U.S. jurisdictions, including Argentina and the Dominican Republic, tax years are typically subject to examination for three to six years.
As of December 31, 2016, Seaboard had not provided for U.S. Federal income and foreign withholding taxes on $1,038 million of undistributed earnings from foreign operations, as Seaboard intends to reinvest such earnings indefinitely outside of the U.S. Determination of the tax that might be paid on these undistributed earnings if eventually remitted is not practical. If Seaboard decided at a later date to repatriate these earnings to the U.S., Seaboard would be required to provide for the net tax effects on these amounts.
Management believes Seaboard’s future taxable income will be sufficient for full realization of the net deferred tax assets. The valuation allowance relates to the tax benefits from foreign net operating losses. Management does not believe these benefits are more likely than not to be realized due to limitations imposed on the deduction of these losses. At December 31, 2016, Seaboard had foreign net operating loss carry-forwards of approximately $144 million, a portion of which expire in varying amounts between 2017 and 2033, while others have indefinite expiration periods. As of the result of its 2016 acquisition of Belarina, Seaboard recorded a deferred tax asset of $25 million and a $25 million valuation allowance related to net operating losses with an indefinite expiration period. See Note 12 for further discussion of the acquisition. At December 31, 2016, Seaboard had state tax credit carry-forwards of approximately $20 million, net of valuation allowance, all of which carry-forward indefinitely.
Seaboard has certain investments in various limited partnerships as a limited partner that are expected to enable Seaboard to obtain certain tax credits. The balance of the low income housing investments recognized on the consolidated balance sheets as of December 31, 2016 and 2015 was $8 million and $10 million, respectively. Seaboard uses the proportional amortization method of accounting for all of its qualified affordable housing project investments by amortizing the initial cost of the investment in proportion to the income tax credits received and recognizing as a component of income tax expense. Seaboard also has invested in two limited liability companies that operate refined coal processing plants that generate federal income tax credits based on production levels. Seaboard began investing in the Oklahoma plant in February 2015 and the Nebraska plant in January 2016 for total contributions of $14 million and $9 million during 2016 and 2015, respectively. Seaboard’s funding commitments vary depending on production. See Note 10 for Seaboard’s estimate of its funding commitment for both plants. Additionally, Seaboard invested $10 million during 2016 in two limited liability companies that operate solar energy production facilities that generate investment tax credits. These other alternative investments are accounted for using the equity method of accounting.
On December 18, 2015, the Protecting Americans from Tax Hikes Act of 2015 (the “2015 Tax Act”) was signed into law. The 2015 Tax Act reinstated and made permanent certain expired corporate income tax provisions that impact current and deferred taxes for financial reporting purposes. The annual effects of the provisions in this law on current
42 2016 Annual Report
SEABOARD CORPORATION
Notes to Consolidated Financial Statements
and deferred tax assets and liabilities for Seaboard were recorded in the fourth quarter of 2015. The impact was a tax benefit of $13 million, or $10.92 per common share, primarily related to certain income tax credits. In addition to this amount was a credit of $17 million, or $14.88 per common share, for the 2015 Federal blender’s credits (extended by the 2015 Tax Act through December 31, 2016) that was recognized as revenues in the fourth quarter of 2015. There was no tax expense on these transactions. Since the 2015 Tax Act extended the provisions through December 31, 2016, revenue was recognized ratably throughout 2016. The Federal blender’s credits have not been renewed for 2017.
On December 19, 2014, the Tax Increase Prevention Act of 2014 (the “2014 Tax Act”) was signed into law. The 2014 Tax Act extended many expired corporate income tax provisions through December 31, 2014, which impacted current and deferred income taxes for financial reporting purposes. The total annual effects of the provisions in this law on current and deferred tax assets and liabilities for Seaboard were recorded in the fourth quarter of 2014. The impact was a tax benefit of $11 million, or $9.68 per common share, primarily related to certain income tax credits. In addition to this amount was a credit of $15 million for the Federal blender’s credits for 2014 that was recognized as revenues in the fourth quarter of 2014. See Note 13 for further discussion of the Federal blender’s credit.
Note 7
Notes Payable and Long-Term Debt
Notes payable under uncommitted credit lines was $121 million and $141 million at December 31, 2016 and 2015, respectively. All of the notes payable outstanding at December 31, 2016 related to foreign subsidiaries, with $74 million denominated in South African rand, $26 million denominated in Argentine pesos, $14 million denominated in Brazilian reais and $7 million denominated in Zambian kwacha. The weighted average interest rate for outstanding notes payable was 14.88% and 11.74% at December 31, 2016 and 2015, respectively. As of December 31, 2016, Seaboard had uncommitted lines of credit totaling $380 million, of which $330 million related to foreign subsidiaries. The notes payable under the credit lines are unsecured and do not require compensating balances. Facility fees on these agreements are not material.
In September 2016, Seaboard entered into a $100 million committed line of credit with Wells Fargo Bank, National Association (“Wells Fargo”) that matures on September 29, 2017. Interest is computed at LIBOR plus 0.50%, and Seaboard incurs an unused commitment fee of 0.09% per annum. This line of credit is secured by certain short-term investments. The line of credit is subject to standard representations and covenants. There was no outstanding balance as of December 31, 2016. At December 31, 2016, Seaboard’s borrowing capacity under its uncommitted and committed lines of credit was reduced by $121 million drawn and $4 million of letters of credit.
The following table is a summary of long-term debt at the end of each year:
|
|
|
|
|
|
|
|
|
|
|
|
|
December 31, |
|
|||
|
(Millions of dollars) |
|
|
2016 |
|
|
2015 |
|
|
Term Loan due 2022 |
|
$ |
497 |
|
$ |
500 |
|
|
Foreign subsidiary obligations due 2018 through 2023 |
|
|
20 |
|
|
23 |
|
|
Total long-term debt at face value |
|
|
517 |
|
|
523 |
|
|
Current maturities of long-term debt and unamortized discount |
|
|
(18) |
|
|
(5) |
|
|
Long-term debt, less current maturities and unamortized discount |
|
$ |
499 |
|
$ |
518 |
|
Seaboard entered into a Term Loan Credit Agreement dated December 4, 2015 (“Credit Agreement”) with CoBank, ACB, Farm Credit Services of America, PCA, and the lenders party thereto, pursuant to which Seaboard Foods obtained a $500 million unsecured term loan (“Term Loan”). Seaboard received proceeds of $499 million, net of a $1 million discount, which will be amortized to interest expense using the effective interest method. Seaboard has guaranteed all obligations of Seaboard Foods under the Term Loan. The Term Loan provides for quarterly payments of the principal balance pursuant to the amortization schedule included in the Credit Agreement, with the balance due on the maturity date, December 4, 2022. The Term Loan bears interest at fluctuating rates based on various margins over a base rate (defined as the highest of (a) the prime rate, (b) the federal funds effective rate plus 0.50% per annum, or (c) an adjusted LIBOR rate for an interest period of one month on such day plus 1.00% per annum) or LIBOR, at the option of Seaboard Foods. The interest rate was 2.40% and 1.90% at December 31, 2016 and 2015.
The Term Loan requires, among other terms, the maintenance of certain ratios involving a maximum debt to capitalization ratio, which shall not exceed 50% at the end of any fiscal quarter, and minimum tangible net worth, as defined, of not less than $2 billion plus 25% of cumulative consolidated net income beginning with the quarter ended
2016 Annual Report 43
SEABOARD CORPORATION
Notes to Consolidated Financial Statements
December 31, 2016. The Term Loan also includes restrictions of certain subsidiaries to grant liens on assets, incur indebtedness over 15% of consolidated tangible net worth, make certain acquisitions, investments and asset dispositions in excess of specified amounts, and limits aggregate dividend payments to $25 million per year under certain circumstances. Seaboard is in compliance with all restrictive debt covenants relating to these agreements as of December 31, 2016.
Foreign subsidiary debt is primarily denominated in Argentine pesos, and all interest rates on such obligations are variable. The weighted average interest rate was 22.39% and 30.23% at December 31, 2016 and 2015, respectively. All of the foreign subsidiary debt is guaranteed by Seaboard, except $4 million is secured by property, plant and equipment.
The aggregate minimum principal payments required on long-term debt at December 31, 2016 are as follows: $17 million in 2017, $21 million in 2018, $33 million in 2019, $42 million in 2020, $38 million in 2021 and $366 million thereafter.
In 2014, Seaboard made an optional prepayment of $86 million related to long-term debt with an original maturity of 2021. As a result, Seaboard paid a $4 million prepayment penalty fee that was charged to interest expense.
Note 8
Derivatives and Fair Value of Financial Instruments
GAAP discusses valuation techniques, such as the market approach (prices and other relevant information generated by market conditions involving identical or comparable assets or liabilities), the income approach (techniques to convert future amounts to single present amounts based on market expectations including present value techniques and option pricing) and the cost approach (amount that would be required to replace the service capacity of an asset, which is often referred to as replacement cost). Seaboard uses a fair value hierarchy that prioritizes the inputs to valuation techniques used to measure fair value into the following three broad levels:
Level 1: Quoted Prices in Active Markets for Identical Assets or Liabilities - Observable inputs such as unadjusted quoted prices in active markets for identical assets or liabilities that Seaboard has the ability to access at the measurement date.
Level 2: Significant Other Observable Inputs - Inputs other than quoted prices included within Level 1 that are observable for the asset or liability, either directly or indirectly. These include quoted prices for similar assets or liabilities in active markets, and quoted prices for identical or similar assets or liabilities in markets that are not active.
Level 3: Significant Unobservable Inputs - Unobservable inputs that reflect the reporting entity’s own assumptions.
44 2016 Annual Report
SEABOARD CORPORATION
Notes to Consolidated Financial Statements
The following tables show assets and liabilities measured at fair value (derivatives exclude margin accounts) on a recurring basis as of December 31, 2016 and 2015, respectively, and also the level within the fair value hierarchy used to measure each category of assets and liabilities. Seaboard determines if there are any transfers between levels at the end of a reporting period. There were no transfers between levels that occurred in 2016 and 2015. The trading securities classified as other current assets below are assets held for Seaboard’s deferred compensation plans.
|
|
|
|
|
|
|
|
|
|
|
|
|
|
|
|
|
|
Balance |
|
|
|
|
|
|
|
|
|
|
|
|
|
|
December 31, |
|
|
|
|
|
|
|
|
|
|
|
|
(Millions of dollars) |
|
2016 |
|
Level 1 |
Level 2 |
Level 3 |
|
||||||
|
Assets: |
|
|
|
|
|
|
|
|
|
|
|
|
|
|
Trading securities – short-term investments: |
|
|
|
|
|
|
|
|
|
|
|
|
|
|
Domestic equity securities |
|
$ |
482 |
|
$ |
482 |
|
$ |
— |
|
$ |
— |
|
|
Domestic debt securities held in mutual funds/ETFs/U.S. Treasuries |
|
|
437 |
|
|
437 |
|
|
— |
|
|
— |
|
|
Foreign equity securities |
|
|
199 |
|
|
199 |
|
|
— |
|
|
— |
|
|
High yield securities |
|
|
115 |
|
|
15 |
|
|
100 |
|
|
— |
|
|
Collateralized loan obligations |
|
|
26 |
|
|
— |
|
|
26 |
|
|
— |
|
|
Money market funds held in trading accounts |
|
|
13 |
|
|
13 |
|
|
— |
|
|
— |
|
|
Other trading securities |
|
|
5 |
|
|
5 |
|
|
— |
|
|
— |
|
|
Trading securities – other current assets: |
|
|
|
|
|
|
|
|
|
|
|
|
|
|
Domestic equity securities |
|
|
30 |
|
|
30 |
|
|
— |
|
|
— |
|
|
Foreign equity securities |
|
|
3 |
|
|
3 |
|
|
— |
|
|
— |
|
|
Fixed income mutual funds |
|
|
3 |
|
|
3 |
|
|
— |
|
|
— |
|
|
Other |
|
|
4 |
|
|
4 |
|
|
— |
|
|
— |
|
|
Derivatives: |
|
|
|
|
|
|
|
|
|
|
|
|
|
|
Commodities (1) |
|
|
3 |
|
|
3 |
|
|
— |
|
|
— |
|
|
Foreign currencies |
|
|
1 |
|
|
— |
|
|
1 |
|
|
— |
|
|
Total Assets |
|
$ |
1,321 |
|
$ |
1,194 |
|
$ |
127 |
|
$ |
— |
|
|
Liabilities: |
|
|
|
|
|
|
|
|
|
|
|
|
|
|
Derivatives: |
|
|
|
|
|
|
|
|
|
|
|
|
|
|
Commodities (1) |
|
$ |
1 |
|
$ |
1 |
|
$ |
— |
|
$ |
— |
|
|
Interest rate swaps |
|
|
4 |
|
|
— |
|
|
4 |
|
|
— |
|
|
Foreign currencies |
|
|
4 |
|
|
— |
|
|
4 |
|
|
— |
|
|
Total Liabilities |
|
$ |
9 |
|
$ |
1 |
|
$ |
8 |
|
$ |
— |
|
(1) Seaboard’s commodity derivative assets and liabilities are presented in the consolidated balance sheets on a net basis, including netting the derivatives with the related margin accounts. As of December 31, 2016, the commodity derivatives had a margin account balance of $10 million resulting in a net other current asset on the consolidated balance sheet of $12 million.
2016 Annual Report 45
SEABOARD CORPORATION
Notes to Consolidated Financial Statements
|
|
|
|
|
|
|
|
|
|
|
|
|
|
|
|
|
|
Balance |
|
|
|
|
|
|
|
|
|
|
|
|
|
|
December 31, |
|
|
|
|
|
|
|
|
|
|
|
|
(Millions of dollars) |
|
2015 |
|
Level 1 |
Level 2 |
Level 3 |
|
||||||
|
Assets: |
|
|
|
|
|
|
|
|
|
|
|
|
|
|
Available-for-sale securities – short-term investments: |
|
|
|
|
|
|
|
|
|
|
|
|
|
|
Money market funds |
|
$ |
81 |
|
$ |
81 |
|
$ |
— |
|
$ |
— |
|
|
Trading securities – short-term investments: |
|
|
|
|
|
|
|
|
|
|
|
|
|
|
Domestic equity securities |
|
|
466 |
|
|
466 |
|
|
— |
|
|
— |
|
|
Domestic debt securities held in mutual funds/ETFs/U.S. Treasuries |
|
|
450 |
|
|
450 |
|
|
— |
|
|
— |
|
|
Foreign equity securities |
|
|
120 |
|
|
120 |
|
|
— |
|
|
— |
|
|
High yield securities |
|
|
104 |
|
|
— |
|
|
104 |
|
|
— |
|
|
Money market funds held in trading accounts |
|
|
22 |
|
|
22 |
|
|
— |
|
|
— |
|
|
Collateralized loan obligations |
|
|
10 |
|
|
— |
|
|
10 |
|
|
— |
|
|
Other trading securities |
|
|
1 |
|
|
— |
|
|
1 |
|
|
— |
|
|
Trading securities – other current assets: |
|
|
|
|
|
|
|
|
|
|
|
|
|
|
Domestic equity securities |
|
|
31 |
|
|
31 |
|
|
— |
|
|
— |
|
|
Foreign equity securities |
|
|
5 |
|
|
5 |
|
|
— |
|
|
— |
|
|
Fixed income mutual funds |
|
|
4 |
|
|
4 |
|
|
— |
|
|
— |
|
|
Other |
|
|
3 |
|
|
2 |
|
|
1 |
|
|
— |
|
|
Derivatives: |
|
|
|
|
|
|
|
|
|
|
|
|
|
|
Commodities (1) |
|
|
4 |
|
|
4 |
|
|
— |
|
|
— |
|
|
Foreign currencies |
|
|
8 |
|
|
— |
|
|
8 |
|
|
— |
|
|
Total Assets |
|
$ |
1,309 |
|
$ |
1,185 |
|
$ |
124 |
|
$ |
— |
|
|
Liabilities: |
|
|
|
|
|
|
|
|
|
|
|
|
|
|
Derivatives: |
|
|
|
|
|
|
|
|
|
|
|
|
|
|
Commodities (1) |
|
$ |
18 |
|
$ |
18 |
|
$ |
— |
|
$ |
— |
|
|
Interest rate swaps |
|
|
6 |
|
|
— |
|
|
6 |
|
|
— |
|
|
Total Liabilities |
|
$ |
24 |
|
$ |
18 |
|
$ |
6 |
|
$ |
— |
|
(1) Seaboard’s commodity derivative assets and liabilities are presented in the consolidated balance sheets on a net basis, including netting the derivatives with the related margin accounts. As of December 31, 2015, the commodity derivatives had a margin account balance of $29 million resulting in a net other current asset on the consolidated balance sheet of $15 million.
Financial instruments consisting of cash and cash equivalents, net receivables, notes payable and accounts payable are carried at cost, which approximates fair value, as a result of the short-term nature of the instruments. The fair value of long-term debt is estimated by comparing interest rates for debt with similar terms and maturities. As Seaboard’s long-term debt is variable-rate, its carrying amount approximates fair value. If Seaboard’s long-term debt was measured at fair value on its consolidated balance sheets, it would have been classified as level 2 in the fair value hierarchy. The amortized cost and estimated fair values of short-term investments and long-term debt at December 31, 2016 and 2015, are presented below:
|
|
|
|
|
|
|
|
|
|
|
|
|
|
|
|
December 31, |
|
2016 |
|
2015 |
|
||||||||
|
(Millions of dollars) |
|
Amortized Cost |
|
Fair Value |
|
Amortized Cost |
|
Fair Value |
|
||||
|
Short-term investments, available-for-sale |
|
$ |
— |
|
$ |
— |
|
$ |
81 |
|
$ |
81 |
|
|
Short-term investments, trading securities |
|
|
1,236 |
|
|
1,277 |
|
|
1,188 |
|
|
1,173 |
|
|
Long-term debt |
|
|
516 |
|
|
516 |
|
|
522 |
|
|
522 |
|
While management believes its derivatives are primarily economic hedges of its firm purchase and sales contracts or anticipated sales contracts, Seaboard does not perform the extensive record-keeping required to account for these types of transactions as hedges for accounting purposes.
46 2016 Annual Report
SEABOARD CORPORATION
Notes to Consolidated Financial Statements
Commodity Instruments
Seaboard uses various derivative futures and options to manage its risk to price fluctuations for raw materials and other inventories, finished product sales and firm sales commitments. Seaboard also enters into speculative derivative transactions not directly related to its raw material requirements. The nature of Seaboard’s market risk exposure has not changed materially since December 31, 2015. Commodity derivatives are recorded at fair value, with any changes in fair value being marked-to-market as a component of cost of sales on the consolidated statements of comprehensive income. Since these derivatives are not accounted for as hedges, fluctuations in the related commodity prices could have a material impact on earnings in any given period.
At December 31, 2016, Seaboard had open net derivative contracts to purchase 22 million bushels of grain, 14 million pounds of hogs, and open net derivative contracts to sell 35 million pounds of soybean oil and 4 million gallons of heating oil. At December 31, 2015, Seaboard had open net derivative contracts to purchase 25 million pounds of hogs, 22 million bushels of grain, 3 million pounds of sugar, and open net derivative contracts to sell 8 million pounds of soybean oil. For the years ended December 31, 2016, 2015 and 2014, Seaboard recognized net realized and unrealized gains (losses) of $21 million, $(45) million and $18 million, respectively, related to commodity contracts, primarily included in cost of sales on the consolidated statements of comprehensive income.
Foreign Currency Exchange Agreements
Seaboard enters into foreign currency exchange agreements to manage the foreign currency exchange rate risk with respect to certain transactions denominated in foreign currencies. Foreign currency exchange agreements that primarily relate to an underlying commodity transaction are recorded at fair value with changes in value marked-to-market as a component of cost of sales on the consolidated statements of comprehensive income. Foreign currency exchange agreements that are not related to an underlying commodity transaction are recorded at fair value with changes in value marked-to-market as a component of foreign currency gains (losses), net on the consolidated statements of comprehensive income. Since these agreements are not accounted for as hedges, fluctuations in the related foreign currency exchange rates could have a material impact on earnings in any given year. At December 31, 2016 and 2015, Seaboard had foreign currency exchange agreements to cover its firm sales and purchase commitments and related trade receivables and payables, with notional amounts of $81 million and $94 million, respectively, primarily related to the South African rand.
Interest Rate Exchange Agreements
During 2010, Seaboard entered into three ten-year interest rate exchange agreements, which involve the exchange of fixed-rate and variable-rate interest payments over the life of the agreements without the exchange of the underlying notional amounts to mitigate the effects of fluctuations in interest rates on variable-rate debt. Seaboard pays a fixed rate and receives a variable rate of interest on the notional amounts of $25 million each.
During 2014 and 2015, Seaboard entered into four, approximately eight-year interest rate exchange agreements with mandatory early termination dates, which coincided with the anticipated delivery dates in 2015 and 2016 of dry bulk vessels to be leased. These interest rate exchange agreements involved the exchange of fixed-rate and variable-rate interest payments without the exchange of the underlying notional amounts to mitigate the potential effects of fluctuations in interest rates on the anticipated dry bulk vessel leases. Seaboard paid a fixed rate and received a variable rate of interest on the notional amounts. In 2015, two agreements were terminated and not renewed with the delivery of two bulk vessels. As of December 31, 2015, two agreements remained, with an aggregate notional amount of $44 million. In the first quarter of 2016, these agreements were terminated and not renewed with the delivery of the final two bulk vessels. Payments to unwind these agreements totaled $2 million.
These interest rate exchange agreements do not qualify as hedges for accounting purposes. Accordingly, the changes in fair value of these agreements are recorded in miscellaneous, net in the consolidated statements of comprehensive income. At December 31, 2016 and 2015, Seaboard had three and five agreements outstanding, respectively, with a total notional value of $75 million and $119 million, respectively.
2016 Annual Report 47
SEABOARD CORPORATION
Notes to Consolidated Financial Statements
The following table provides the amount of gain (loss) recognized for each type of derivative and where it was recognized in the consolidated statements of comprehensive income for the year ended December 31, 2016 and 2015:
|
|
|
|
|
|
|
|
|
|
|
|
(Millions of dollars) |
|
|
|
2016 |
|
2015 |
|
||
|
Commodities |
|
Cost of sales |
|
$ |
21 |
|
$ |
(45) |
|
|
Foreign currencies |
|
Cost of sales |
|
|
(27) |
|
|
16 |
|
|
Foreign currencies |
|
Foreign currency |
|
|
1 |
|
|
2 |
|
|
Interest rate |
|
Miscellaneous, net |
|
|
(2) |
|
|
(4) |
|
The following table provides the fair value of each type of derivative held as of December 31, 2016 and 2015 and where each derivative is included on the consolidated balance sheets:
|
|
|
|
|
|
|
|
|
|
|
|
|
|
|
|
|
|
|
|
|
|
|
|
Asset Derivatives |
|
|
|
Liability Derivatives |
|
||||||||
|
|
|
|
|
December 31, |
|
December 31, |
|
|
|
December 31, |
|
December 31, |
|
||||
|
(Millions of dollars) |
|
|
|
2016 |
|
2015 |
|
|
|
2016 |
|
2015 |
|
||||
|
Commodities(1) |
|
Other current assets |
|
$ |
3 |
|
$ |
4 |
|
Other current liabilities |
|
$ |
1 |
|
$ |
18 |
|
|
Foreign currencies |
|
Other current assets |
|
|
1 |
|
|
8 |
|
Other current liabilities |
|
|
4 |
|
|
— |
|
|
Interest rate |
|
Other current assets |
|
|
— |
|
|
— |
|
Other current liabilities |
|
|
4 |
|
|
6 |
|
(1) Seaboard’s commodity derivative assets and liabilities are presented in the consolidated balance sheets on a net basis, including netting the derivatives with the related margin accounts. As of December 31, 2016 and 2015, the commodity derivatives had a margin account balance of $10 million and $29 million, respectively, resulting in a net other current asset on the consolidated balance sheets of $12 million and $15 million, respectively.
Counterparty Credit Risk
From time to time Seaboard is subject to counterparty credit risk related to its foreign currency exchange agreements and interest rate swaps should the counterparties fail to perform according to the terms of the contracts. As of December 31, 2016, Seaboard had $1 million of credit risk to two counterparties related to its foreign currency exchange agreements and no credit risk related to its interest rate exchange agreements. Seaboard does not hold any collateral related to these agreements.
Note 9
Employee Benefits
At December 31, 2016, Seaboard maintained two defined benefit pension plans (the “Plans”) for its domestic salaried and clerical employees. Employees hired before January 1, 2014 were eligible to participate in the Plans after one year of service upon attaining the age of 21. Benefits are generally based upon the number of years of service and a percentage of final average pay. Seaboard has historically based pension contributions on minimum funding standards to avoid the Pension Benefit Guaranty Corporation (“PBGC”) variable rate premiums established by the Employee Retirement Income Security Act (“ERISA”) of 1974. During the third quarter of 2016, Seaboard completed future funding analyses for the Plans and in September 2016 made a deductible contribution of $39 million for the 2015 plan year. Management currently does not plan on making any contributions in 2017. Management did not make any contributions in 2015 and 2014. Seaboard has separate investment policies for each plan because one plan has more current retirees and therefore a more conservative portfolio versus the other plan, which can assume greater risk as it will have a longer investment time horizon. Assets are invested in the Plans to achieve a diversified target allocation of approximately 40%-50% in domestic equities, 20%-25% in international equities, 10%-25% in fixed income securities and 10%-15% in alternative investments. The investment strategy provides for investment managers’ discretion, and is periodically reviewed by management for adherence to policy and performance against benchmarks. Effective January 1, 2017, the assets and liabilities of the Plans were merged, so that only one qualified defined benefit pension plan remains. The new investment policy is a weighted average of the two previous policies.
48 2016 Annual Report
SEABOARD CORPORATION
Notes to Consolidated Financial Statements
As described in Note 8 to the consolidated financial statements, Seaboard utilizes a fair value hierarchy that prioritizes the inputs to valuation techniques used to measure fair value into three broad levels. The following tables show the Plans’ assets measured at estimated fair value as of December 31, 2016 and 2015, respectively, and also the level within the fair value hierarchy used to measure each category of assets:
|
|
|
|
|
|
|
|
|
|
|
|
|
|
|
|
|
|
Balance |
|
|
|
|
|
|
|
|
|
|
|
|
|
|
December 31, |
|
|
|
|
|
|
|
|
|
|
|
|
(Millions of dollars) |
|
2016 |
|
Level 1 |
|
Level 2 |
|
Level 3 |
|
||||
|
Assets: |
|
|
|
|
|
|
|
|
|
|
|
|
|
|
Domestic equity securities |
|
$ |
76 |
|
$ |
76 |
|
$ |
— |
|
$ |
— |
|
|
Foreign equity securities |
|
|
35 |
|
|
35 |
|
|
— |
|
|
— |
|
|
Domestic fixed income mutual funds |
|
|
17 |
|
|
17 |
|
|
— |
|
|
— |
|
|
Real estate mutual fund |
|
|
8 |
|
|
8 |
|
|
— |
|
|
— |
|
|
Commodity mutual funds |
|
|
4 |
|
|
4 |
|
|
— |
|
|
— |
|
|
Money market funds |
|
|
4 |
|
|
4 |
|
|
— |
|
|
— |
|
|
Foreign fixed income mutual funds |
|
|
2 |
|
|
2 |
|
|
— |
|
|
— |
|
|
Other |
|
|
5 |
|
|
— |
|
|
5 |
|
|
— |
|
|
Total Assets |
|
$ |
151 |
|
$ |
146 |
|
$ |
5 |
|
$ |
— |
|
|
|
|
|
|
|
|
|
|
|
|
|
|
|
|
|
|
|
Balance |
|
|
|
|
|
|
|
|
|
|
|
|
|
|
December 31, |
|
|
|
|
|
|
|
|
|
|
|
|
(Millions of dollars) |
|
2015 |
|
Level 1 |
|
Level 2 |
|
Level 3 |
|
||||
|
Assets: |
|
|
|
|
|
|
|
|
|
|
|
|
|
|
Domestic equity securities |
|
$ |
64 |
|
$ |
64 |
|
$ |
— |
|
$ |
— |
|
|
Foreign equity securities |
|
|
27 |
|
|
27 |
|
|
— |
|
|
— |
|
|
Real estate mutual fund |
8 | 8 |
— |
— |
|||||||||
|
Domestic fixed income mutual funds |
|
|
5 |
|
|
5 |
|
|
— |
|
|
— |
|
|
Commodity mutual funds |
|
|
2 |
|
|
2 |
|
|
— |
|
|
— |
|
|
Foreign fixed income mutual funds |
|
|
2 |
|
|
2 |
|
|
— |
|
|
— |
|
|
Money market funds |
|
|
1 |
|
|
1 |
|
|
— |
|
|
— |
|
|
Other |
|
|
5 |
|
|
— |
|
|
5 |
|
|
— |
|
|
Total Assets |
|
$ |
114 |
|
$ |
109 |
|
$ |
5 |
|
$ |
— |
|
Seaboard also sponsors non-qualified, unfunded supplemental executive plans, and has certain individual, non-qualified, unfunded supplemental retirement agreements for certain retired employees. The unamortized prior service cost is being amortized over the average remaining working lifetime of the active participants for these plans. Management has no plans to provide funding for these supplemental executive plans in advance of when the benefits are paid.
Assumptions used in determining pension information for all of the above plans were:
|
|
|
|
|
|
|
|
|
|
|
|
|
|
|
|
|
|
Years ended December 31, |
|
||||||||||
|
|
|
2016 |
|
2015 |
|
2014 |
|
||||||
|
Weighted average assumptions |
|
|
|
|
|
|
|
|
|
|
|
|
|
|
Discount rate used to determine obligations |
|
2.90 |
- |
4.65 |
% |
3.20 |
- |
4.80 |
% |
3.15 |
- |
4.40 |
% |
|
Discount rate used to determine net periodic benefit cost |
|
3.20 |
- |
4.80 |
% |
2.70 |
- |
4.40 |
% |
3.55 |
- |
5.20 |
% |
|
Expected return on plan assets |
|
6.75 |
- |
7.00 |
% |
6.75 |
- |
7.50 |
% |
7.00 |
- |
8.00 |
% |
|
Long-term rate of increase in compensation levels |
|
|
|
4.00 |
% |
|
|
4.00 |
% |
|
|
4.00 |
% |
Management selected the discount rate based on a model-based result where the timing and amount of cash flows approximates the estimated payouts. The expected returns on the Plans’ assets assumption are based on the weighted average of asset class expected returns that are consistent with historical returns. The assumed rate selected was based on model-based results that reflect the Plans’ asset allocation and related long-term projected returns. The measurement date for all plans is December 31. The unrecognized net actuarial losses are generally amortized over the average remaining working lifetime of the active participants for all of these plans.
2016 Annual Report 49
SEABOARD CORPORATION
Notes to Consolidated Financial Statements
The changes in the plans’ benefit obligations and fair value of assets for the Plans, supplemental executive plans and retirement agreements and the funded status were as follows:
|
|
|
|
|
|
|
|
|
|
|
|
|
|
|
|
|
|
December 31, |
|
||||||||||
|
|
|
2016 |
|
2015 |
|
||||||||
|
(Millions of dollars) |
|
Assets exceed accumulated benefits |
|
Accumulated benefits exceed assets |
|
Total |
|
Accumulated benefits exceed assets |
|
||||
|
Reconciliation of benefit obligation: |
|
|
|
|
|
|
|
|
|
|
|
|
|
|
Benefit obligation at beginning of year |
|
$ |
70 |
|
$ |
179 |
|
$ |
249 |
|
$ |
257 |
|
|
Service cost |
|
|
4 |
|
|
5 |
|
|
9 |
|
|
10 |
|
|
Interest cost |
|
|
3 |
|
|
8 |
|
|
11 |
|
|
10 |
|
|
Actuarial losses (gains) |
|
|
— |
|
|
6 |
|
|
6 |
|
|
(18) |
|
|
Benefits paid |
|
|
(4) |
|
|
(9) |
|
|
(13) |
|
|
(8) |
|
|
Other |
|
|
— |
|
|
— |
|
|
— |
|
|
(2) |
|
|
Benefit obligation at end of year |
|
$ |
73 |
|
$ |
189 |
|
$ |
262 |
|
$ |
249 |
|
|
Reconciliation of fair value of plan assets: |
|
|
|
|
|
|
|
|
|
|
|
|
|
|
Fair value of plan assets at beginning of year |
|
$ |
46 |
|
$ |
68 |
|
$ |
114 |
|
$ |
122 |
|
|
Actual return on plan assets |
|
|
6 |
|
|
4 |
|
|
10 |
|
|
(4) |
|
|
Employer contributions |
|
|
39 |
|
|
1 |
|
|
40 |
|
|
4 |
|
|
Benefits paid |
|
|
(4) |
|
|
(9) |
|
|
(13) |
|
|
(8) |
|
|
Fair value of plan assets at end of year |
|
$ |
87 |
|
$ |
64 |
|
$ |
151 |
|
$ |
114 |
|
|
Funded status |
|
$ |
14 |
|
$ |
(125) |
|
$ |
(111) |
|
$ |
(135) |
|
The net funded status of the Plans was $(15) million and $(50) million at December 31, 2016 and 2015, respectively. The benefit obligation increased primarily due to a decrease in discount rates for all plans. The accumulated benefit obligation for the Plans was $142 million and $143 million and for all the other plans was $84 million and $73 million at December 31, 2016 and 2015, respectively. Expected future net benefit payments for all plans during each of the next five years and in aggregate for the five year period beginning with the sixth year are as follows: $14 million, $15 million, $14 million, $16 million, $13 million and $88 million, respectively.
The net periodic cost of benefits of these plans was as follows:
|
|
|
|
|
|
|
|
|
|
|
|
|
|
|
|
|
Years ended December 31, |
|
|||||||
|
(Millions of dollars) |
|
|
2016 |
|
2015 |
|
2014 |
|
|||
|
Components of net periodic benefit cost: |
|
|
|
|
|
|
|
|
|
|
|
|
Service cost |
|
|
$ |
9 |
|
$ |
10 |
|
$ |
8 |
|
|
Interest cost |
|
|
|
11 |
|
|
10 |
|
|
10 |
|
|
Expected return on plan assets |
|
|
|
(8) |
|
|
(8) |
|
|
(9) |
|
|
Amortization and other |
|
|
|
5 |
|
|
5 |
|
|
2 |
|
|
Agreement termination gain |
|
|
|
— |
|
|
(1) |
|
|
— |
|
|
Net periodic benefit cost |
|
|
$ |
17 |
|
$ |
16 |
|
$ |
11 |
|
The amounts not reflected in net periodic benefit cost and included in accumulated other comprehensive loss (“AOCL”) before taxes at December 31, 2016 and 2015 were $72 million and $72 million, respectively. Such amounts primarily represent accumulated losses, net of gain. The amounts in AOCL expected to be recognized as components of net periodic benefit cost in 2017 are $5 million.
Seaboard participates in a multi-employer pension fund, the United Food and Commercial Workers International Union-Industry Pension Fund, which covers certain union employees under a collective bargaining agreement. This fund’s employer identification number is 51-6055922, and this plan’s number is 001. For the plan year beginning July 1, 2016, this plan’s “zone status” is green and is not subject to a funding improvement plan. Seaboard is required to make contributions to this plan in amounts established under the collective bargaining agreement that expires in July 2019. Contribution expense for this plan was $1 million for each of the years ended December 31, 2016, 2015 and 2014, which represents less than five percent of total contributions to this plan. The applicable portion of the total plan benefits and
50 2016 Annual Report
SEABOARD CORPORATION
Notes to Consolidated Financial Statements
net assets of this plan is not separately identifiable, although Seaboard has received notice that, under certain circumstances, it could be liable for unfunded vested benefits or other expenses of this jointly administered union plan. Seaboard has not established any liabilities for potential future withdrawal, as such withdrawal from this plan is not probable.
Seaboard maintains a defined contribution plan covering most of its domestic salaried and clerical employees. In 2016, 2015 and 2014, Seaboard contributed to this plan an amount equal to 50% of the first 6% of each employee’s contributions to the plan. Employee vesting is based upon years of service, with 20% vested after one year of service and an additional 20% vesting with each additional complete year of service. Contribution expense for this plan was $2 million for each of the years ended December 31, 2016, 2015 and 2014. In addition, Seaboard maintains a defined contribution plan covering most of its hourly, non-union employees. Contribution expense for these plans was $1 million for each of the years ended December 31, 2016, 2015 and 2014.
Seaboard has a deferred compensation plan that allows certain employees to reduce their compensation in exchange for values in various investments. Seaboard also has an Investment Option Plan that allowed certain employees to reduce their compensation in exchange for an option to acquire interests measured by reference to three investments. However, as a result of U.S. tax legislation passed in 2004, reductions to compensation earned after 2004 are no longer allowed under the Investment Option Plan. The exercise price for each investment option was established based upon the fair market value of the underlying investment on the date of grant. Under both plans, Seaboard contributes 3% of the employees’ reduced compensation. Seaboard’s expense for these two deferred compensation plans, which primarily includes amounts related to the change in fair value of the underlying investment accounts, was $4 million, $0 million and $3 million for the years ended December 31, 2016, 2015 and 2014, respectively. Included in other liabilities at December 31, 2016 and 2015 are $36 million and $38 million, respectively, representing the market value of the payable to the employees upon distribution or exercise for each plan. In conjunction with these plans, Seaboard purchased the specified number of units of the employee-designated investment, plus the applicable option price for the Investment Option Plan. These investments are treated as trading securities and are stated at their fair market values. Accordingly, as of December 31, 2016 and 2015, $40 million and $43 million, respectively, were included in other current assets on the consolidated balance sheets. Investment income related to the mark-to-market of these investments for 2016, 2015 and 2014 totaled $4 million, $0 million and $3 million, respectively.
Note 10
Commitments and Contingencies
On April 29, 2015, Seaboard received from the Department of Justice, Asset Forfeiture and Money Laundering Section (“AFMLS”), a Grand Jury subpoena issued by the U.S. District Court for the District of Columbia (the “DC District Court”) requesting records related to 37 specified foreign companies and five individuals. Seaboard has previously produced documents responsive to Grand Jury subpoenas dated September 18, 2014 and October 17, 2014. The subpoena issued September 18, 2014 requested records related to nine entities and one individual, and the subpoena issued October 17, 2014 requested records with respect to eight additional entities and one additional individual. Two additional subpoenas, each dated July 2, 2015, were received by Seaboard requesting records related to a certain customer. The companies and individuals as to which the requested records relate to are not affiliated with Seaboard. On June 6, 2016, a request was received for additional information relating to an affiliate of Seaboard as to which Seaboard is in the process of responding. Seaboard has retained outside counsel and is cooperating with the government’s investigation. It is impossible at this stage either to determine the probability of a favorable or unfavorable outcome or to estimate the amount of potential loss, if any, resulting from the government’s inquiry.
On September 19, 2012, the U.S. Immigration and Customs Enforcement (“ICE”) executed three search warrants authorizing the seizure of certain records from Seaboard’s offices in Merriam, Kansas and at the Seaboard Foods employment office and the human resources department in Guymon, Oklahoma. The warrants generally called for the seizure of employment-related files, certain e-mails and other electronic records relating to Medicaid and Medicaid recipients, certain health care providers in the Guymon area, and Seaboard’s health plan and certain personnel issues. The U.S. Attorney’s Office for the Western District of Oklahoma (“USAO”), which has been leading the investigation, previously advised Seaboard that it intended to close its investigation and that no charges would be brought against Seaboard. However, discussions continue with the USAO, ICE and the Oklahoma Attorney General’s office regarding the matter, including the possibility of a settlement. No proceedings have been filed or brought as of the date of this
2016 Annual Report 51
SEABOARD CORPORATION
Notes to Consolidated Financial Statements
report. It is not possible at this time to determine whether a settlement will be reached or whether Seaboard will incur any material fines, penalties or liabilities in connection with this matter.
On February 16, 2016, Seaboard Foods received an information request from the U.S. Environmental Protection Agency (“EPA”) seeking information under the Clean Air Act with regard to various ammonia releases at Seaboard Foods’ pork processing plant in Guymon, Oklahoma. Seaboard has been cooperating with the EPA with regard to the investigation and has responded to the request. It is not possible at this time to determine whether Seaboard will incur any material fines, penalties or liabilities in connection with this matter.
Seaboard is subject to various administrative and judicial proceedings and other legal matters related to the normal conduct of its business. In the opinion of management, the ultimate resolution of these items is not expected to have a material adverse effect on the consolidated financial statements of Seaboard.
Contingent Obligations
Certain of the non-consolidated affiliates and third-party contractors who perform services for Seaboard have bank debt supporting their underlying operations. From time to time, Seaboard will provide guarantees of that debt in order to further business objectives. Seaboard does not issue guarantees of third parties for compensation. As of December 31, 2016, guarantees outstanding to third parties were not material. Seaboard has not accrued a liability for any of the third-party or affiliate guarantees as management considers the likelihood of loss to be remote. See Note 7 for discussion of letters of credit.
Commitments
As of December 31, 2016 Seaboard had various non-cancelable purchase commitments and commitments under other agreements, arrangements and operating leases, as described in the table below:
|
|
|
|
|
|
|
|
|
|
|
|
|
|
|
|
|
|
|
|
|
|
|
|
Years ended December 31, |
|
|
|
|
|||||||||||||
|
(Millions of dollars) |
|
2017 |
|
2018 |
|
2019 |
|
2020 |
|
2021 |
|
Thereafter |
|
||||||
|
Hog procurement contracts |
|
$ |
103 |
|
$ |
59 |
|
$ |
44 |
|
$ |
43 |
|
$ |
43 |
|
$ |
118 |
|
|
Grain and feed ingredients |
|
|
122 |
|
|
2 |
|
|
— |
|
|
— |
|
|
— |
|
|
— |
|
|
Grain purchase contracts for resale |
|
|
310 |
|
|
— |
|
|
— |
|
|
— |
|
|
— |
|
|
— |
|
|
Fuel supply contracts |
|
|
49 |
|
|
— |
|
|
— |
|
|
— |
|
|
— |
|
|
— |
|
|
Equipment purchases and facility improvements |
|
|
21 |
|
|
— |
|
|
— |
|
|
— |
|
|
— |
|
|
— |
|
|
Other purchase commitments |
|
|
33 |
|
|
— |
|
|
— |
|
|
— |
|
|
— |
|
|
— |
|
|
Total firm purchase commitments |
|
|
638 |
|
|
61 |
|
|
44 |
|
|
43 |
|
|
43 |
|
|
118 |
|
|
Vessel, time and voyage-charters |
|
|
47 |
|
|
27 |
|
|
26 |
|
|
26 |
|
|
26 |
|
|
46 |
|
|
Contract grower agreements |
|
|
29 |
|
|
24 |
|
|
16 |
|
|
12 |
|
|
10 |
|
|
9 |
|
|
Other operating lease payments |
|
|
31 |
|
|
27 |
|
|
27 |
|
|
24 |
|
|
22 |
|
|
176 |
|
|
Investment in affiliates |
|
|
91 |
|
|
15 |
|
|
16 |
|
|
16 |
|
|
12 |
|
|
— |
|
|
Total unrecognized non-cancelable commitments |
|
$ |
836 |
|
$ |
154 |
|
$ |
129 |
|
$ |
121 |
|
$ |
113 |
|
$ |
349 |
|
Seaboard has contracted with third parties for the purchase of live hogs to process at its pork processing plant, and has entered into grain and feed ingredient purchase contracts to support its live hog operations. The commitment amounts included in the table are based on projected market prices as of December 31, 2016. During 2016, 2015 and 2014, the Pork segment paid $133 million, $171 million and $227 million, respectively, for live hogs purchased under committed contracts.
The CT&M segment enters into grain purchase contracts, primarily to support firm sales commitments. These contracts are valued based on projected commodity prices as of December 31, 2016.
The Power segment has a natural gas supply contract for a significant portion of the fuel required for the operation of its dual fuel power generating facility. The commitment for 2017 has both fixed and variable price components, and the amount included in the table above is partially based on market prices as of December 31, 2016. The Marine segment also has fuel purchase contracts.
The Marine and CT&M segments enter into contracts to charter vessels for use in their operations, which include short-term time charters for a few months and long-term commitments ranging from one to eleven years. These segments’ charter hire expenses during 2016, 2015 and 2014 totaled $95 million, $99 million and $87 million, respectively.
52 2016 Annual Report
SEABOARD CORPORATION
Notes to Consolidated Financial Statements
To support the operations of the Pork segment, Seaboard has contract grower agreements in place with farmers to raise a portion of Seaboard’s hogs according to Seaboard’s specifications under long-term service agreements. Under the terms of some older agreements, additional payments would be required if the grower achieves certain performance standards. The contract grower obligations shown above do not reflect these incentive payments which, given current operating performance, total approximately $1 million per year. In the event the farmer is unable to perform at an acceptable level, Seaboard has the right to terminate the contract. During the years ended 2016, 2015 and 2014, Seaboard paid $26 million, $12 million and $13 million, respectively, under contract grower agreements.
Seaboard also leases various facilities and equipment under non-cancelable operating lease agreements including a terminal operations agreement at PortMiami, which runs through 2028. Rental expense for operating leases for all segments amounted to $43 million, $42 million and $35 million in 2016, 2015 and 2014, respectively.
Investment in affiliates includes obligations made to equity method investments of Seaboard. As discussed in Note 4, Seaboard agreed to contribute up to $150 million to a 50% owned joint venture, STF, to develop and operate a pork processing facility in Sioux City, Iowa. The original subscription agreement was modified in the first quarter of 2016. At December 31, 2016, $73 million remained to be contributed in 2017. During the first quarter of 2017, STF announced plans to expand the pork processing plant to be capable of processing an additional three million market hogs annually by operating a second shift. The expansion is estimated to cost approximately $47 million, of which Seaboard could be required to commit up to 50% of the amount. As part of the operations, Seaboard agreed to provide a portion of the hogs to be processed at the facility. During 2016, the Pork segment acquired hog inventory and related assets that increased Seaboard’s hog production capacity to meet the majority of such hog supply commitment for single shift processing at the new plant. Additionally, Investments in affiliates includes expected funding commitments based on production levels for two limited liability companies that operate refined coal processing plants that generate federal income tax credits.
Note 11
Stockholders’ Equity and Accumulated Other Comprehensive Loss
In October 2015, the Board of Directors extended through October 31, 2017 the share repurchase program initially approved in November 2009, and increased the authorized amount of repurchases from the $51 million that remained available to $100 million. As of December 31, 2016, $100 million remained available for repurchases under this program. Seaboard did not repurchase any shares of common stock during 2016 and 2015. In May 2014, the Board of Directors increased the dollar amount of Seaboard common stock authorized to be repurchased under the share repurchase program by $20 million, and Seaboard commenced a tender offer to repurchase shares. On June 19, 2014, Seaboard completed the tender offer, pursuant to which it repurchased 16,738 shares of common stock at a price per share of $2,950, for an aggregate cost of $49 million. In total for 2014, Seaboard used cash to repurchase 18,405 shares of common stock at a total price of $53 million.
Under this share repurchase program, Seaboard is authorized to repurchase its common stock from time to time in open market or privately negotiated purchases, which may be above or below the traded market price. During the period that the share repurchase program remains in effect, from time to time, Seaboard may enter into a 10b5-1 plan authorizing a third party to make such purchases on behalf of Seaboard. All stock repurchased will be made in compliance with applicable legal requirements and funded by cash on hand. The timing of the repurchases and the number of shares repurchased at any given time will depend upon market conditions, compliance with Securities and Exchange Commission regulations, and other factors. The Board of Directors’ stock repurchase authorization does not obligate Seaboard to acquire a specific amount of common stock, and the stock repurchase program may be suspended at any time at Seaboard’s discretion. Shares repurchased will be retired and resume the status of authorized and unissued shares.
In December 2012, Seaboard declared and paid a dividend of $12.00 per share on the common stock. The increased amount of the dividend (which has historically been $0.75 per share on a quarterly basis or $3.00 per share on an annual basis) represented a prepayment of the annual 2013, 2014, 2015 and 2016 dividends ($3.00 per share per year). Seaboard did not declare or pay a dividend in 2016, 2015 or 2014. On February 2, 2017, Seaboard declared a quarterly dividend of $1.50 per share of common stock payable on February 23, 2017.
2016 Annual Report 53
SEABOARD CORPORATION
Notes to Consolidated Financial Statements
The components of accumulated other comprehensive loss, net of related taxes, for 2014, 2015 and 2016 are as follows:
|
|
|
|
|
|
|
|
|
|
|
|
|
|
|
|
|
|
Cumulative |
|
|
|
|
|
|
|
|
|
|
|
|
|
|
Foreign |
|
Unrealized |
|
|
|
|
|
|
|
||
|
|
|
Currency |
|
Gain |
|
Unrecognized |
|
|
|
|
|||
|
|
|
Translation |
|
on |
|
Pension |
|
|
|
|
|||
|
(Millions of dollars) |
|
Adjustment |
|
Investments |
|
Cost |
|
Total |
|
||||
|
Balance December 31, 2014 |
|
$ |
(194) |
|
$ |
1 |
|
$ |
(60) |
|
$ |
(253) |
|
|
Other comprehensive income (loss) before reclassifications |
|
|
(34) |
|
|
— |
|
|
5 |
|
|
(29) |
|
|
Amounts reclassified from accumulated other comprehensive loss to net earnings |
|
|
— |
|
|
— |
|
|
4 |
(1) |
|
4 |
|
|
Other comprehensive income (loss), net of tax |
|
|
(34) |
|
|
— |
|
|
9 |
|
|
(25) |
|
|
Balance December 31, 2015 |
|
$ |
(228) |
|
$ |
1 |
|
$ |
(51) |
|
$ |
(278) |
|
|
Other comprehensive income (loss) before reclassifications |
|
|
(26) |
|
|
1 |
|
|
(4) |
|
|
(29) |
|
|
Amounts reclassified from accumulated other comprehensive income loss to net earnings |
|
|
— |
|
|
— |
|
|
3 |
(1) |
|
3 |
|
|
Other comprehensive income (loss), net of tax |
|
|
(26) |
|
|
1 |
|
|
(1) |
|
|
(26) |
|
|
Balance December 31, 2016 |
|
$ |
(254) |
|
$ |
2 |
|
$ |
(52) |
|
$ |
(304) |
|
(1) This primarily represents the amortization of actuarial losses that were included in net periodic pension cost and recorded in operating income. See Note 9 for further discussion.
The foreign currency translation adjustment primarily represents the effect of the Argentine peso currency exchange fluctuation on the net assets of the Sugar segment. At December 31, 2016, the Sugar segment had $84 million in net assets denominated in Argentine pesos and $3 million in net liabilities denominated in U.S. dollars in Argentina. At December 31, 2015, the Sugar segment had $96 million in net assets denominated in Argentine pesos and $1 million in net assets denominated in U.S. dollars in Argentina. Seaboard accounts for its Sugar segment on a one-month lag basis.
Income taxes for cumulative foreign currency translation adjustments were recorded using a 35% effective tax rate, except for $87 million and $82 million in 2016 and 2015, respectively, related to certain subsidiaries for which no tax benefit was recorded. Income taxes for all other components of accumulated other comprehensive loss were recorded using a 39% effective rate, except for unrecognized pension cost of $20 million and $18 million in 2016 and 2015, respectively, related to employees at certain subsidiaries for which no tax benefit was recorded.
Note 12
Acquisitions
On September 1, 2016, Seaboard’s Pork segment acquired certain assets of Texas Farm, LLC for total cash consideration of $59 million. Texas Farm, LLC was a hog growing operation with hog inventory, hog farms and a feed mill located in Texas. The additional hog production allows Seaboard to expand and realign its hog production in other states to supply the Guymon, Oklahoma, pork processing plant and the STF processing plant located in Sioux City, Iowa, scheduled to begin operations in mid-2017. See Note 4 for further information on STF.
The purchase was recorded at fair value in Seaboard’s Pork segment, and the allocation of the purchase price was as follows. Goodwill is primarily attributable to workforce and the benefits of acquiring an existing operation rather than incurring the costs and time to begin a new hog operation.
|
|
|
|
|
|
|
(Millions of dollars) |
|
|
|
|
|
Inventories |
|
$ |
16 |
|
|
Property, plant and equipment |
|
|
42 |
|
|
Goodwill |
|
|
3 |
|
|
Accounts payable |
|
|
(2) |
|
|
Total consideration transferred |
|
$ |
59 |
|
Operating results have been included in Seaboard’s consolidated financial statements from the date of acquisition. Net sales of $4 million and a $2 million net loss were recognized during 2016. Acquisition costs were less than $1 million.
54 2016 Annual Report
SEABOARD CORPORATION
Notes to Consolidated Financial Statements
On February 7, 2016, Seaboard’s Pork segment acquired hog inventory, a feed mill, truck washes and certain hog farms in the Central U.S. from Christensen Farms & Feedlots, Inc. and Christensen Farms Midwest, LLC (“Christensen Farms”) for total cash consideration of $148 million. Seaboard had previously agreed to provide a portion of the hogs to be processed at the new pork processing facility being developed through STF.
The purchase was recorded at fair value in Seaboard’s Pork segment, and the allocation of the purchase price was as follows. Intangible assets include customer relationships that have a weighted-average useful life of 1.6 years. Goodwill represents the farms’ established processes, workforce and close proximity to the Sioux City, Iowa, processing plant.
|
|
|
|
|
|
|
(Millions of dollars) |
|
|
|
|
|
Inventories |
|
$ |
33 |
|
|
Property, plant and equipment |
|
|
111 |
|
|
Intangible assets |
|
|
1 |
|
|
Goodwill |
|
|
3 |
|
|
Total consideration transferred |
|
$ |
148 |
|
Operating results have been included in Seaboard’s consolidated financial statements from the date of acquisition. Net sales of $119 million and a $5 million net loss were recognized during 2016. Acquisition costs were less than $1 million.
During the last half of 2016, Seaboard’s Pork segment acquired additional hog inventory and sow farms through three additional acquisitions for total cash consideration of $12 million. The purchases were recorded at fair value, and $1 million and $11 million were allocated to inventories and property, plant and equipment, respectively. No material intangible assets were identified, and acquisition costs were less than $1 million.
With these purchases, Seaboard increased its sow herd to meet the majority of its hog supply commitment for single shift processing at the new STF plant. The following unaudited pro forma information presents the combined consolidated financial results for Seaboard as if all five acquisitions had been completed at the beginning of January 1, 2015.
|
|
|
|
|
|
|
|
|
|
|
|
Twelve months ended |
|
||||
|
(Unaudited) |
|
December 31, |
|
||||
|
(Millions of dollars except per share amounts) |
|
2016 |
|
2015 |
|
||
|
Net sales |
|
$ |
5,455 |
|
$ |
5,866 |
|
|
Net earnings |
|
$ |
303 |
|
$ |
145 |
|
|
Earnings per common share |
|
$ |
257.10 |
|
$ |
123.37 |
|
|
|
|
|
|
|
|
|
|
On October 28, 2016, Seaboard’s CT&M segment increased its ownership percentage from 50% to 98% to obtain control of Belarina Alimentos S.A., a flour production business in Brazil (“Belarina”). No cash or other consideration was transferred to the other shareholder whose ownership was diluted through revision of the shareholders agreement to restructure the affiliate debt and equity of Belarina. Seaboard accounted for the transaction as a business combination achieved in stages and included the financial results of Belarina in its consolidated financial statements since the date of acquisition. See Note 4 for a discussion of the previous equity method of accounting for Belarina. As Belarina is recorded on a three-month lag, there was no impact to Seaboard’s sales and net earnings from Belarina’s operations as a result of the consolidation. Since no consideration was transferred to the other owner, Seaboard substituted the acquisition-date fair value of its 50% pre-existing interest in Belarina and the acquisition-date fair value of its pre-existing affiliate trade and note receivable for the acquisition-date fair value of the consideration transferred to measure goodwill.
The following table summarizes the preliminary purchase price allocation resulting from this consolidation:
|
|
|
|
|
|
|
(Millions of dollars) |
|
|
||
|
Accounts receivable |
|
$ |
7 |
|
|
Inventories |
|
|
6 |
|
|
Property, plant and equipment |
|
|
25 |
|
|
Other assets |
|
|
4 |
|
|
Goodwill |
|
|
1 |
|
|
Third-party debt |
|
|
(14) |
|
|
Other liabilities |
|
|
(11) |
|
|
Total business valuation |
|
$ |
18 |
|
|
Fair value of pre-existing interest |
|
$ |
18 |
|
2016 Annual Report 55
SEABOARD CORPORATION
Notes to Consolidated Financial Statements
The valuation of the noncontrolling interest was immaterial. Goodwill primarily represents the assembled workforce. Pro forma results of operations are not presented as the effects of consolidation are not material to Seaboard’s results of operations. Seaboard recorded a gain of $4 million in bad debt expense within selling, general and administrative expenses on the consolidated statement of comprehensive income, related to recognizing the fair value of its pre-existing affiliate receivables.
Note 13
Segment Information
Seaboard had six reportable segments through December 31, 2016: Pork, CT&M, Marine, Sugar, Power and Turkey, each offering a specific product or service. Seaboard’s reporting segments are based on information used by Seaboard’s Chief Executive Officer in his capacity as chief operating decision maker to determine allocation of resources and assess performance. Each of the six main segments is separately managed, and each was started or acquired independent of the other segments. The Pork segment produces and sells fresh and frozen pork products to further processors, foodservice operators, grocery stores, distributors and retail outlets throughout the U.S., and to Japan, Mexico, China and numerous other foreign markets. This segment also produces biodiesel from pork fat and other animal fat or vegetable oil for sale to third parties. Substantially all of Seaboard’s Pork segment’s hourly employees at its Guymon, Oklahoma, processing plant are covered by a collective bargaining agreement. The CT&M segment is an integrated agricultural commodity trading, processing and logistics operation that internationally markets wheat, corn, soybean meal and other agricultural commodities in bulk to third-party customers and to non-consolidated affiliates. This segment also operates flour, maize and feed mills, baking operations, and poultry production and processing in numerous foreign countries. The Marine segment, based in Miami, Florida, provides cargo shipping services between the U.S., the Caribbean and Central and South America. The Sugar segment produces and processes sugar and alcohol in Argentina, primarily to be marketed locally. The Power segment is an unregulated independent power producer in the Dominican Republic operating a floating power generating facility. The Turkey segment, accounted for using the equity method, produces and sells branded and non-branded turkeys and other products. Total assets for the Turkey segment represents Seaboard’s investment in and notes receivable from this affiliate. Revenues for the All Other segment are primarily derived from a jalapeño pepper processing operation. Below are significant segment events that impact financial results for the periods covered by this report.
During 2016, the Pork segment completed the acquisitions of five hog growing operations for total cash consideration of $219 million. These hog operations’ results have been included in Seaboard’s consolidated financial statements from the dates of acquisition. See Note 12 for further information on these acquisitions. The Pork segment’s biodiesel plants have historically received Federal blender’s credits for the biodiesel they blend. The 2015 Tax Act signed into law in December 2015, as discussed in Note 6, renewed the Federal blender’s credit, which had previously expired on December 31, 2014, retroactively to January 1, 2015 with an expiration of December 31, 2016. As a result, in the fourth quarter of 2015 the Pork segment recognized as revenue the 2015 Federal blender’s credits of $17 million. The 2014 Tax Act signed into law in December 2014 as discussed in Note 6, renewed the Federal blender’s credit that had previously expired on December 31, 2013 retroactively to January 1, 2014 with an expiration date of December 31, 2014. As a result, in the fourth quarter of 2014 the Pork segment recognized as revenue the 2014 Federal blender’s credits of $15 million. The Federal blenders credits have not been renewed for 2017.
As more fully described in Note 4, on September 27, 2014 the Pork segment sold to Triumph a 50% interest in Daily’s. As a result, Seaboard deconsolidated Daily’s from its consolidated balance sheet as of September 27, 2014. The Pork segment’s remaining 50% investment in Daily’s is accounted for using the equity method of accounting.
On October 28, 2016, the CT&M segment obtained control of Belarina, its non-consolidated affiliate with a flour production business in Brazil, and began including its financial results in its consolidated financial statements from the date of acquisition. See Note 12 for further details of the consolidation. In 2016, the CT&M segment reserved $16 million related to a note receivable to an affiliate that operates in the DRC and in 2014 recorded an $11 million write down in loss from affiliate from a decline in value considered other than temporary for this investment. The CT&M segment historically derived a significant portion of its operating income from wheat sales to another non-consolidated affiliate in the DRC. See Note 4 for further discussion of the write down and investments in affiliate in the DRC.
56 2016 Annual Report
SEABOARD CORPORATION
Notes to Consolidated Financial Statements
During 2015, the Power segment recorded a receivable and interest income of $31 million for interest recognized on certain outstanding customer receivable balances. This interest income related to amounts determined to be collectible as of December 31, 2015, but previously had been considered uncollectable in prior years. This amount was fully collected by Seaboard in early January 2016. Also in 2015, Seaboard invested an additional $10 million in a business operating a 300 megawatt electricity generating facility in the Dominican Republic and changed its method of accounting from a cost method investment at Corporate to an equity method investment in the Power segment.
The Power segment had been operating a floating power generating facility (72 megawatts) in the Dominican Republic under a short-term lease agreement. Seaboard ceased operation of the leased facility on September 3, 2014. In conjunction with ceasing operations, Seaboard sold inventory related to these operations, resulting in a $5 million gain from sale of assets in operating income related to these items in 2014.
The following tables set forth specific financial information about each segment as reviewed by Seaboard’s management, except for the Turkey segment information previously disclosed in Note 4 to the consolidated financial statements. Operating income for segment reporting is prepared on the same basis as that used for consolidated operating income. Operating income, along with income (loss) from affiliates for the CT&M and Turkey segments, are used as the measures of evaluating segment performance because management does not consider interest, other investment income (loss) and income tax expense on a segment basis.
Sales to External Customers:
|
|
|
|
|
|
|
|
|
|
|
|
|
|
|
|
|
Years ended December 31, |
|
|||||||
|
(Millions of dollars) |
|
|
2016 |
|
2015 |
|
2014 |
|
|||
|
Pork |
|
|
$ |
1,443 |
|
$ |
1,332 |
|
$ |
1,717 |
|
|
Commodity Trading and Milling |
|
|
|
2,778 |
|
|
3,022 |
|
|
3,499 |
|
|
Marine |
|
|
|
916 |
|
|
940 |
|
|
853 |
|
|
Sugar |
|
|
|
147 |
|
|
188 |
|
|
200 |
|
|
Power |
|
|
|
79 |
|
|
97 |
|
|
189 |
|
|
All Other |
|
|
|
16 |
|
|
15 |
|
|
15 |
|
|
Segment/Consolidated Totals |
|
|
$ |
5,379 |
|
$ |
5,594 |
|
$ |
6,473 |
|
Operating Income (Loss):
|
|
|
|
|
|
|
|
|
|
|
|
|
|
|
|
|
Years ended December 31, |
|
|||||||
|
(Millions of dollars) |
|
|
2016 |
|
2015 |
|
2014 |
|
|||
|
Pork |
|
|
$ |
175 |
|
$ |
116 |
|
$ |
349 |
|
|
Commodity Trading and Milling |
|
|
|
38 |
|
|
2 |
|
|
54 |
|
|
Marine |
|
|
|
33 |
|
|
19 |
|
|
(3) |
|
|
Sugar |
|
|
|
(12) |
|
|
2 |
|
|
27 |
|
|
Power |
|
|
|
7 |
|
|
7 |
|
|
19 |
|
|
All Other |
|
|
|
2 |
|
|
2 |
|
|
1 |
|
|
Segment Totals |
|
|
|
243 |
|
|
148 |
|
|
447 |
|
|
Corporate |
|
|
|
(21) |
|
|
(22) |
|
|
(23) |
|
|
Consolidated Totals |
|
|
$ |
222 |
|
$ |
126 |
|
$ |
424 |
|
Income (Loss) from Affiliates:
|
|
|
|
|
|
|
|
|
|
|
|
|
|
|
|
|
Years ended December 31, |
|
|||||||
|
(Millions of dollars) |
|
|
2016 |
|
2015 |
|
2014 |
|
|||
|
Pork |
|
|
$ |
11 |
|
$ |
11 |
|
$ |
4 |
|
|
Commodity Trading and Milling |
|
|
|
(10) |
|
|
(50) |
|
|
(24) |
|
|
Marine |
|
|
|
1 |
|
|
2 |
|
|
— |
|
|
Sugar |
|
|
|
2 |
|
|
1 |
|
|
1 |
|
|
Power |
|
|
|
4 |
|
|
3 |
|
|
2 |
|
|
Turkey |
|
|
|
73 |
|
|
103 |
|
|
54 |
|
|
Segment/Consolidated Totals |
|
|
$ |
81 |
|
$ |
70 |
|
$ |
37 |
|
2016 Annual Report 57
SEABOARD CORPORATION
Notes to Consolidated Financial Statements
Depreciation and Amortization:
|
|
|
|
|
|
|
|
|
|
|
|
|
|
|
Years ended December 31, |
|
|||||||
|
(Millions of dollars) |
|
2016 |
|
2015 |
|
2014 |
|
|||
|
Pork |
|
$ |
56 |
|
$ |
44 |
|
$ |
46 |
|
|
Commodity Trading and Milling |
|
|
6 |
|
|
5 |
|
|
5 |
|
|
Marine |
|
|
26 |
|
|
26 |
|
|
25 |
|
|
Sugar |
|
|
6 |
|
|
8 |
|
|
8 |
|
|
Power |
|
|
8 |
|
|
8 |
|
|
8 |
|
|
Segment Totals |
|
|
102 |
|
|
91 |
|
|
92 |
|
|
Corporate |
|
|
— |
|
|
— |
|
|
— |
|
|
Consolidated Totals |
|
$ |
102 |
|
$ |
91 |
|
$ |
92 |
|
Total Assets:
|
|
|
|
|
|
|
|
|
|
|
|
|
|
December 31, |
|
||||
|
(Millions of dollars) |
|
|
2016 |
|
2015 |
|
||
|
Pork |
|
|
$ |
1,157 |
|
$ |
858 |
|
|
Commodity Trading and Milling |
|
|
|
989 |
|
|
988 |
|
|
Marine |
|
|
|
314 |
|
|
296 |
|
|
Sugar |
|
|
|
166 |
|
|
202 |
|
|
Power |
|
|
|
196 |
|
|
271 |
|
|
Turkey |
|
|
|
493 |
|
|
448 |
|
|
All Other |
|
|
|
6 |
|
|
6 |
|
|
Segment Totals |
|
|
|
3,321 |
|
|
3,069 |
|
|
Corporate |
|
|
|
1,434 |
|
|
1,362 |
|
|
Consolidated Totals |
|
|
$ |
4,755 |
|
$ |
4,431 |
|
Investments in and Advances to Affiliates:
|
|
|
|
|
|
|
|
|
|
|
|
|
|
December 31, |
|
||||
|
(Millions of dollars) |
|
|
2016 |
|
2015 |
|
||
|
Pork |
|
|
$ |
175 |
|
$ |
115 |
|
|
Commodity Trading and Milling |
|
|
|
207 |
|
|
218 |
|
|
Marine |
|
|
|
33 |
|
|
19 |
|
|
Sugar |
|
|
|
4 |
|
|
3 |
|
|
Power |
|
|
|
30 |
|
|
34 |
|
|
Turkey |
|
|
|
324 |
|
|
282 |
|
|
Segment/Consolidated Totals |
|
|
$ |
773 |
|
$ |
671 |
|
Capital Expenditures:
|
|
|
|
|
|
|
|
|
|
|
|
|
|
|
Years ended December 31, |
|
|||||||
|
(Millions of dollars) |
|
2016 |
|
2015 |
|
2014 |
|
|||
|
Pork |
|
$ |
69 |
|
$ |
40 |
|
$ |
54 |
|
|
Commodity Trading and Milling |
|
|
35 |
|
|
40 |
|
|
21 |
|
|
Marine |
|
|
19 |
|
|
43 |
|
|
30 |
|
|
Sugar |
|
|
33 |
|
|
15 |
|
|
14 |
|
|
Power |
|
|
1 |
|
|
1 |
|
|
2 |
|
|
Segment Totals |
|
|
157 |
|
|
139 |
|
|
121 |
|
|
Corporate |
|
|
1 |
|
|
— |
|
|
— |
|
|
Consolidated Totals |
|
$ |
158 |
|
$ |
139 |
|
$ |
121 |
|
Administrative services provided by the corporate office are allocated to the individual segments and represent corporate services rendered to and costs incurred for each specific segment, with no allocation to individual segments of general corporate management oversight costs. Corporate assets include short-term investments, other current assets related to deferred compensation plans, fixed assets, and other miscellaneous items. Corporate operating losses represent certain operating costs not specifically allocated to individual segments and include costs related to Seaboard’s deferred
58 2016 Annual Report
SEABOARD CORPORATION
Notes to Consolidated Financial Statements
compensation programs, which are offset by the effect of the mark-to-market adjustments on these investments recorded in other investment income (loss), net.
Geographic Information
Seaboard had sales in South Africa totaling $650 million, $646 million and $597 million for the years ended December 31, 2016, 2015 and 2014, respectively, representing approximately 12%, 12% and 9% of total sales for each respective year. No other individual foreign country accounted for 10% or more of sales to external customers.
The following table provides a geographic summary of net sales based on the location of product delivery:
|
|
|
|
|
|
|
|
|
|
|
|
|
|
|
Years ended December 31, |
|
|||||||
|
(Millions of dollars) |
|
2016 |
|
2015 |
|
2014 |
|
|||
|
Caribbean, Central and South America |
|
$ |
1,990 |
|
$ |
2,112 |
|
$ |
2,414 |
|
|
Africa |
|
|
1,572 |
|
|
1,606 |
|
|
1,706 |
|
|
United States |
|
|
1,161 |
|
|
1,135 |
|
|
1,397 |
|
|
Pacific Basin and Far East |
|
|
309 |
|
|
357 |
|
|
425 |
|
|
Canada/Mexico |
|
|
236 |
|
|
242 |
|
|
348 |
|
|
Europe |
|
|
40 |
|
|
71 |
|
|
98 |
|
|
All other |
|
|
71 |
|
|
71 |
|
|
85 |
|
|
Totals |
|
$ |
5,379 |
|
$ |
5,594 |
|
$ |
6,473 |
|
The following table provides a geographic summary of Seaboard’s long-lived assets according to their physical location and primary port for the vessels:
|
|
|
|
|
|
|
|
|
|
|
|
December 31, |
|
||||
|
(Millions of dollars) |
|
2016 |
|
2015 |
|
||
|
United States |
|
$ |
713 |
|
$ |
553 |
|
|
Dominican Republic |
|
|
122 |
|
|
128 |
|
|
Argentina |
|
|
67 |
|
|
69 |
|
|
All other |
|
|
106 |
|
|
83 |
|
|
Totals |
|
$ |
1,008 |
|
$ |
833 |
|
Management believes its allowance for doubtful accounts is adequate and reduces receivables recorded to their expected net realizable value. At December 31, 2016 and 2015, Seaboard had approximately $214 million and $275 million, respectively, of foreign receivables, excluding receivables due from affiliates, which generally represent more of a collection risk than the domestic receivables, although as of December 31, 2016 no individual material amounts were deemed to have a heightened risk of collectability.
2016 Annual Report 59
SEABOARD CORPORATION
|
Board of Directors |
|
|
|
Steven J. Bresky Director and Chairman of the Board President and Chief Executive Officer of Seaboard David A. Adamsen Director, Audit Committee Member and Incentive Compensation Committee Member Former Vice President – Wholesale Sales of C&S Wholesale Grocers Paul M. Squires Director Chief Operating Officer of Seaboard Flour LLC
|
|
Douglas W. Baena Director, Audit Committee Chair and Incentive Compensation Committee Member Self-employed, engaging in facilitation of equipment leasing financings and consulting Edward I. Shifman, Jr. Director and Audit Committee Member Retired, former Managing Director and Executive Vice President of Wachovia Capital Finance |
|
Officers |
|
|
|
Steven J. Bresky President and Chief Executive Officer Robert L. Steer Executive Vice President, Chief Financial Officer David M. Becker Senior Vice President, General Counsel and Secretary James L. Gutsch Senior Vice President, Engineering Ralph L. Moss Senior Vice President, Governmental Affairs David S. Oswalt Senior Vice President, Finance and Treasurer
|
|
David H. Rankin Senior Vice President, Taxation and Business Development Michael D. Trollinger Vice President, Corporate Controller and Chief Accounting Officer Ty A. Tywater Vice President, Audit Services Zachery J. Holden Assistant Secretary Catherine M. Verschelden Assistant Secretary Adriana N. Hoskins Assistant Treasurer
|
|
Chief Executive Officers of Principal Seaboard Operations |
|
|
|
Terry J. Holton Pork David M. Dannov Commodity Trading and Milling Edward A. Gonzalez Marine
|
|
Hugo D. Rossi Sugar Armando G. Rodriguez Power |
|
Stock Transfer Agent and Registrar of Stock
Wells Fargo Shareowner Services Independent Registered Public Accounting Firm KPMG LLP 1000 Walnut Street, Suite 1100 Kansas City, Missouri 64106 Stock Listing Seaboard’s common stock is traded on the NYSE MKT under the symbol SEB. Seaboard had 2,391 shareholders of record of its common stock as of January 31, 2017. |
Availability of Form 10-K Report Seaboard files its annual report on Form 10-K with the Securities and Exchange Commission. Copies of the Form 10-K for fiscal 2016 are available without charge by writing Seaboard Corporation, 9000 West 67th Street, Merriam, Kansas 66202, Attention: Shareholder Relations or via the Internet at https://www.seaboardcorp.com/investors. Seaboard provides access to its most recent Form 10-K, Form 10-Q and Form 8-K reports on its Internet website as soon as reasonably practicable after those reports are electronically filed with the Securities and Exchange Commission. |
60 2016 Annual Report