Attached files
| file | filename |
|---|---|
| EX-32.2 - EX-32.2 - IDEXX LABORATORIES INC /DE | c716-20161231xex32_2.htm |
| EX-32.1 - EX-32.1 - IDEXX LABORATORIES INC /DE | c716-20161231xex32_1.htm |
| EX-31.2 - EX-31.2 - IDEXX LABORATORIES INC /DE | c716-20161231xex31_2.htm |
| EX-31.1 - EX-31.1 - IDEXX LABORATORIES INC /DE | c716-20161231xex31_1.htm |
| EX-23 - EX-23 - IDEXX LABORATORIES INC /DE | c716-20161231xex23.htm |
| EX-21 - EX-21 - IDEXX LABORATORIES INC /DE | c716-20161231xex21.htm |
|
|
|||
|
UNITED STATES |
|||
|
SECURITIES AND EXCHANGE COMMISSION |
|||
|
Washington, D.C. 20549 |
|||
|
Form 10-K |
|||
|
|
(Mark One) |
||
|
ANNUAL REPORT PURSUANT TO SECTION 13 OR 15(d) OF THE SECURITIES EXCHANGE ACT OF 1934 |
|||
|
|
For the fiscal year ended December 31, 2016 |
||
|
or |
|||
|
TRANSITION REPORT PURSUANT TO SECTION 13 OR 15(d) OF THE SECURITIES EXCHANGE ACT OF 1934 |
|||
|
|
For the transition period from _______________ to _______________. |
||
|
COMMISSION FILE NUMBER: 0-19271 |
|||
|
IDEXX LABORATORIES, INC. |
|||
|
(Exact name of registrant as specified in its charter) |
|||
|
|
|||
|
DELAWARE (State or other jurisdiction of incorporation or organization) ONE IDEXX DRIVE, WESTBROOK, MAINE (Address of principal executive offices) |
01-0393723 (I.R.S. Employer Identification No.) 04092 (ZIP Code) |
||
|
|
|||
|
Registrant’s telephone number, including area code: 207-556-0300 |
|||

Securities registered pursuant to Section 12(b) of the Act:
|
Title of each class |
Name of each exchange on which registered |
|
Common Stock, $0.10 par value per share |
NASDAQ Global Select Market |
Securities registered pursuant to Section 12(g) of the Act: None
Indicate by check mark if the registrant is a well-known seasoned issuer, as defined in Rule 405 of the Securities Act. Yes ☒ No ☐
Indicate by check mark if the registrant is not required to file reports pursuant to Section 13 or Section 15(d) of the Act. Yes ☐ No ☒
Indicate by check mark whether the registrant (1) has filed all reports required to be filed by Section 13 or 15(d) of the Securities Exchange Act of 1934 during the preceding 12 months (or for such shorter period that the registrant was required to file such reports), and (2) has been subject to such filing requirements for the past 90 days. Yes ☒ No ☐
Indicate by check mark whether the registrant has submitted electronically and posted on its corporate Web site, if any, every Interactive Data File required to be submitted and posted pursuant to Rule 405 of Regulation S-T (§232.405 of this chapter) during the preceding 12 months (or for such shorter period that the registrant was required to submit and post such files). Yes ☒ No ☐
Indicate by check mark if disclosure of delinquent filers pursuant to Item 405 of Regulation S-K (§229.405 of this chapter) is not contained herein, and will not be contained, to the best of registrant’s knowledge, in definitive proxy or information statements incorporated by reference in Part III of this Form 10-K or any amendment to this Form 10-K. ☐
Indicate by check mark whether the registrant is a large accelerated filer, an accelerated filer, a non-accelerated filer, or a smaller reporting company. See the definitions of “large accelerated filer,” “accelerated filer” and “smaller reporting company” in Rule 12b-2 of the Exchange Act.
|
Large accelerated filer |
Accelerated filer |
||
|
Non-accelerated filer |
☐ (Do not check if a smaller reporting company) |
Smaller reporting company |
☐ |
Indicate by check mark whether the registrant is a shell company (as defined in Rule 12b-2 of the Act). Yes ☐ No ☒
Based on the closing sale price on June 30, 2016 of the registrant’s Common Stock, the last business day of the registrant’s most recently completed second fiscal quarter, as reported by the NASDAQ Global Select Market, the aggregate market value of the voting stock held by non-affiliates of the registrant was $8,215,859,816. For these purposes, the registrant considers its directors and executive officers to be its only affiliates.
The number of shares outstanding of the registrant’s Common Stock was 88,005,221 on February 6, 2017.
DOCUMENTS INCORPORATED BY REFERENCE
Part III—Specifically identified portions of the Company’s definitive Proxy Statement to be filed in connection with the Company’s 2017 annual meeting of stockholders (the “2017 Annual Meeting”), to be held on May 3, 2017, are incorporated herein by reference.
GLOSSARY OF TERMS AND SELECTED ABBREVIATIONS
|
Term/ Abbreviation |
Definition |
|
|
|
|
2015 Amended Agreement |
Amended and Restated Multi-Currency Note Purchase and Private Shelf Agreement executed in June 2015 |
|
2021 Notes |
$50 million of 3.32% Series A Senior Notes due July 21, 2021 |
|
2022 Notes |
$75 million of 3.25% Series A Senior Notes due February 12, 2022 |
|
2023 Notes |
$75 million of 3.94% Series A Senior Notes due December 11, 2023 |
|
2024 Notes |
$75 million of 3.76% Series B Senior Notes due July 21, 2024 |
|
2025 Series B Notes |
$75 million of 4.04% Series B Senior Notes due December 11, 2025 |
|
2025 Series C Notes |
€88.9 million of 1.785% Series C Senior Notes due June 18, 2025 |
|
2026 Notes |
$75 million of unsecured 3.72% Senior notes due September 4, 2026 |
|
2027 Notes |
$75 million of 3.72% Series B Senior Notes due February 12, 2027 |
|
Adjusted operating income |
A non-GAAP financial measure that represents total Company operating income adjusted for the 2015 software impairment charge and the 2014 adjustment for the all-direct sales strategy transition impacts. Adjusted operating income should be considered in addition to, and not as a replacement for or as a superior measure to, operating income reported in accordance with U.S. GAAP. Management believes that reporting adjusted operating income provides useful information to investors by facilitating easier comparisons of our operating income performance with prior and future periods and to the performance of our peers. |
|
AOAC RI |
Association of Analytical Communities Research Institute |
|
AOCI |
Accumulated other comprehensive income or loss |
|
APHIS |
Animal and Plant Health Inspector Service |
|
BSE |
Bovine spongiform encephalopathy |
|
CAG |
Companion Animal Group, reporting segment that provides to veterinarians’ diagnostic capabilities and information management solutions that enhance the health and well-being of pets |
|
cGMP |
The FDA’s current Good Manufacturing Practice regulations |
|
Credit Facility |
Our $850 million five-year unsecured revolving credit facility under an amended and restated credit agreement that was executed in December 2015 |
|
EMA |
Extended maintenance agreements |
|
EPA |
U.S. Environmental Protection Agency |
|
EPS |
Earnings per share, if not specifically stated, EPS refers to earnings per share on a diluted basis |
|
EU |
European Union |
|
FASB |
Financial Accounting Standards Board |
|
FDA |
U.S. Food and Drug Administration |
|
FDC Act |
Food, Drug and Cosmetics Act |
|
FeLV |
Feline leukemia virus |
|
FIV |
Feline immunodeficiency virus, similar to the virus that leads to AIDS in humans |
|
FTC |
U.S. Federal Trade Commission |
|
IVLS |
IDEXX VetLab Station, connects and integrates the diagnostic information from all the IDEXX VetLab analyzers and thus provides reference laboratory information management system capability |
|
Kits and consumables |
Rapid assay kits and IDEXX VetLab consumables |
|
LPD |
Livestock, Poultry and Dairy, reporting segment that provides diagnostic products and services for livestock and poultry health and to ensure the quality and safety of milk |
|
MEA |
Multiple element arrangements, contracts with customers that include multiple deliverables |
|
MetLife Agreement |
Multi-Currency Note Purchase and Private Shelf Agreement |
|
Moss |
Moss Inc., a supplier of certain components used in our SNAP products and certain livestock and poultry testing kits |
|
NASDAQ Index |
The Total Return Index for the NASDAQ Stock Market (U.S. Companies) prepared by the Center for Research in Security Prices |
|
NCIMS |
National Conference of Interstate Milk Shipments |
|
OCI |
Other comprehensive income or loss |
|
OPTI Medical |
OPTI Medical Systems, Inc. a wholly-owned subsidiary of IDEXX Laboratories, is a supplier of dry slide electrolyte consumables and instruments for the human point-of-care medical diagnostics market, also referred to as OPTI |
2
|
Organic revenue growth |
A non-GAAP financial measure and represents the percentage change in revenue, as compared to the same period for the prior year, net of the effect of changes in foreign currency exchange rates, acquisitions and divestitures. Organic revenue growth should be considered in addition to, and not as a replacement for or as a superior measure to, revenues reported in accordance with U.S. GAAP, and may not be comparable to similarly titled measures reported by other companies. Management believes that reporting organic revenue growth provides useful information to investors by facilitating easier comparisons of our revenue performance with prior and future periods and to the performance of our peers. |
|
Ortho |
Ortho-Clinical Diagnostics, Inc., a supplier of dry slide consumables used in our Catalyst Dx Chemistry Analyzer, Catalyst One Chemistry Analyzer and the VetTest Chemistry Analyzer |
|
PACS |
Picture archiving and communication software, our software solution for accessing, storing and sharing diagnostic images |
|
R&D |
Research and Development |
|
Reagent rentals |
Refers to instruments being placed at customer sites at little or no cost in exchange for a long-term customer commitment to purchase instrument consumables. |
|
S&P |
Standard & Poor’s |
|
SaaS |
Software-as-a-service |
|
SEC |
U.S. Securities Exchange Commission |
|
Senior Notes Agreement |
Private placement senior notes having an aggregate principal amount of approximately $600 million, referred to as senior notes |
|
T4 |
Thyroxine, a hormone produced by the thyroid gland, tested to indicate thyroid health |
|
TPE |
Third-party evidence, relevant in determining revenue recognition for multiple element arrangement |
|
U.S. GAAP |
Accounting principles generally accepted in the United States of America |
|
USDA |
United States Department of Agriculture |
|
VSOE |
Vendor-specific objective evidence, relevant in determining revenue recognition for multiple element arrangements. |
|
Water |
Water quality products, reporting segment that provides water quality products around the world |
3
IDEXX LABORATORIES, INC.
Annual Report on Form 10-K
Table of Contents
|
Item No. |
|
Page No. |
|
|
|
|
|
|
PART I |
|
|
Item 1 |
Business |
6 |
|
Item 1A |
Risk Factors |
19 |
|
Item 1B |
Unresolved Staff Comments |
28 |
|
Item 2 |
Properties |
29 |
|
Item 3 |
Legal Proceedings |
29 |
|
Item 4 |
Mine Safety Disclosures |
29 |
|
|
|
|
|
|
PART II |
|
|
Item 5 |
Market for Registrant’s Common Equity, Related Stockholder Matters and Issuer Purchases of Equity Securities |
30 |
|
Item 6 |
Selected Financial Data |
33 |
|
Item 7 |
Management’s Discussion and Analysis of Financial Condition and Results of Operations |
34 |
|
Item 7A |
Quantitative and Qualitative Disclosure about Market Risk |
72 |
|
Item 8 |
Financial Statements and Supplementary Data |
73 |
|
Item 9 |
Changes in and Disagreements with Accountants on Accounting and Financial Disclosure |
73 |
|
Item 9A |
Controls and Procedures |
74 |
|
Item 9B |
Other Information |
75 |
|
|
|
|
|
|
PART III |
|
|
Item 10 |
Directors, Executive Officers and Corporate Governance |
75 |
|
Item 11 |
Executive Compensation |
75 |
|
Item 12 |
Security Ownership of Certain Beneficial Owners and Management and Related Stockholder Matters |
75 |
|
Item 13 |
Certain Relationships and Related Transactions, and Director Independence |
76 |
|
Item 14 |
Principal Accountant Fees and Services |
76 |
|
|
|
|
|
|
|
|
|
|
PART IV |
|
|
Item 15 |
Exhibits, Financial Statement Schedules |
76 |
|
Item 16 |
Form 10-K Summary |
76 |
|
Financial Statements and Supplementary Data – Index to Consolidated Financial Statements |
F-1 |
|
|
|
||
|
Exhibit Index |
||
|
Signatures |
||
|
|
|
|
4
The terms “IDEXX,” “Company,” “registrant,” “we,” “us,” and “our” included in this Annual Report on Form 10-K mean IDEXX Laboratories, Inc. and all subsidiaries that are consolidated under Generally Accepted Accounting Principles.
We have included certain terms and abbreviations used throughout this Annual Report on Form 10-K in the "Glossary of Terms and Selected Abbreviations.”
Our name, logo and the following terms used in this Annual Report on Form 10-K are either registered trademarks or trademarks of IDEXX Laboratories, Inc. in the United States and/or other countries: 4Dx®, Animana® Veterinary Software, Catalyst Dx®, Catalyst One®, Coag Dx™, Colilert®, Colisure®, Cornerstone®, DVMAX®, Enterolert®, Feline Triple®, Filta-Max®, Filta-Max xpress®, IDEXX I-Vision CR®, IDEXX I-Vision DR®, IDEXX I-Vision Mobile™, IDEXX ImageBank™ , IDEXX Neo®, IDEXX-PACS™, IDEXX Petly® Plans, IDEXX SDMA®, IDEXX VetLab®, IDEXX VPM™, LaserCyte®, LaserCyte Dx™, OPTI®, OPTI LION™, PetChek®, PetDetect®, Pet Health Network®, Practice Profile™, ProCyte Dx®, Pseudalert®, Quanti-Tray®, SediVue Dx®, SimPlate®, IDEXX SmartService™, SNAP®, SNAPduo®, SNAP Pro®, SNAP cPL® , SNAP fPL®, SNAPshot Dx®, IDEXX VetAutoread™, VetConnect®, IDEXX VetLab®UA™, VetLINK®, VetLyte®, VetStat®, VetTest® and VetVault®.
CAUTIONARY STATEMENT REGARDING FORWARD-LOOKING INFORMATION
This Annual Report on Form 10-K for the year ended December 31, 2016, contains statements which, to the extent they are not statements of historical fact, constitute “forward-looking statements.” Such forward-looking statements about our business and expectations within the meaning of the Private Securities Litigation Reform Act of 1995, Section 27A of the Securities Act of 1933, as amended, and Section 21E of the Securities Exchange Act of 1934, as amended (the “Exchange Act”), include statements relating to future revenue growth rates, earnings and other measures of financial performance; the effect of economic downturns on our business performance; demand for our products; realizability of assets; future cash flow and uses of cash; future repurchases of common stock; future levels of indebtedness and capital spending; interest expense; warranty expense; share-based compensation expense; and competition. Forward-looking statements can be identified by the use of words such as “expects,” “may,” “anticipates,” “intends,” “would,” “will,” “plans,” “believes,” “estimates,” “should,” and similar words and expressions. These forward-looking statements are intended to provide our current expectations or forecasts of future events, are based on current estimates, projections, beliefs, and assumptions, and are not guarantees of future performance. Actual events or results may differ materially from those described in the forward-looking statements. These forward-looking statements involve a number of risks and uncertainties as more fully described under the heading “Part I, Item 1A. Risk Factors” in this Annual Report on Form 10-K. Any forward-looking statements represent our estimates only as of the day this Annual Report on Form 10-K was first filed with the Securities and Exchange Commission (“SEC”) and should not be relied upon as representing our estimates as of any subsequent date. From time to time, oral or written forward-looking statements may also be included in other materials released to the public and they are subject to the risks and uncertainties described or cross-referenced in this section. While we may elect to update forward-looking statements at some point in the future, we specifically disclaim any obligation to do so, even if our estimates or expectations change.
5
PART I
ITEM 1. BUSINESS
COMPANY OVERVIEW
IDEXX was incorporated in Delaware in 1983. We develop, manufacture and distribute products and provide services primarily for the companion animal veterinary, livestock and poultry, dairy and water testing markets. We also sell a line of portable electrolytes and blood gas analyzers for the human point-of-care medical diagnostics market. Our primary products and services are:
|
· |
Point-of-care veterinary diagnostic products, comprising instruments, consumables and rapid assay test kits; |
|
· |
Veterinary reference laboratory diagnostic and consulting services; |
|
· |
Practice management and diagnostic imaging systems and services used by veterinarians; |
|
· |
Biological materials testing, laboratory diagnostic instruments and services used by the biomedical research community; |
|
· |
Diagnostic, health-monitoring products for livestock, poultry and dairy; |
|
· |
Products that test water for certain microbiological contaminants; |
|
· |
Point-of-care electrolytes and blood gas analyzers used in the human point-of-care medical diagnostics market. |
DESCRIPTION OF BUSINESS BY SEGMENT
We operate primarily through three business segments: diagnostic and information technology-based products and services for the veterinary market, which we refer to as the Companion Animal Group (“CAG”); water quality products (“Water”); and diagnostic products and services for livestock and poultry health and to ensure the quality and safety of milk and food, which we refer to as Livestock, Poultry and Dairy (“LPD”). Our Other operating segment combines and presents products for the human point-of-care medical diagnostics market (“OPTI Medical”) with our pharmaceutical product line and our out-licensing arrangements because they do not meet the quantitative or qualitative thresholds for reportable segments.
The performance of our business is particularly subject to various risks that are associated with doing business internationally. For the year ended December 31, 2016, sales of products and services to customers outside the U.S. accounted for approximately 39 percent of our overall revenue. See “Part 1, Item 1A. Risk Factors.”, Item 7. Management’s Discussion and Analysis of Financial Condition and Results of Operations and Note 15 to the consolidated financial statements for the year ended December 31, 2016, included in this Annual Report on Form 10-K for more information about our segments and revenue from customers outside of the U.S.
COMPANION ANIMAL GROUP
CAG provides veterinarians with the diagnostic capabilities and information management solutions that enhance the health and well-being of pets. We believe that the breadth of our full diagnostic solution, including novel products and services developed and made available only by IDEXX, as well as the seamless software integration of our offering, comprise a unique competitive advantage, providing veterinarians with the tools and services to offer advanced veterinary medical care. We believe that with the use of our products and services, veterinary practices significantly improve the quality of veterinary care provided to their patients, increase staff efficiencies, and effectively communicate the value of this medical care to the pet owner. We believe that these capabilities, enabled by the use of IDEXX products and services, improve the financial health of the veterinary practice.
6
CAG Diagnostics
We provide diagnostic capabilities that meet veterinarians’ diverse needs through a variety of modalities, including in-clinic diagnostic solutions and outside reference laboratory services. Regardless of modality utilized, veterinarians are provided with clinically relevant data which is integrated within our information management technologies. The result is a comprehensive view of patient diagnostic information that is easily accessible by both the veterinarian and pet owner.
Integrated Diagnostic Information Management
VetConnect PLUS is a cloud-based technology that enables veterinarians to access and analyze patients’ data from all of IDEXX’s diagnostic modalities. These integrated diagnostic results provide the veterinarian with a visualization of patient-specific testing results, allowing the veterinarian to easily see and trend diagnostic results, enabling greater medical insight and enhanced decision making. In addition, VetConnect PLUS provides instant mobile or browser-based access to results, which can be printed or emailed to pet owners and other veterinarians. In this way, VetConnect PLUS can aid veterinarians and practice staff in engaging the pet owner in the patient’s care, which can support greater compliance with medical recommendations or preventive care protocols. VetConnect PLUS is currently available in North America, Australia, New Zealand, Japan, Israel and in numerous countries throughout Europe.
In-Clinic Diagnostic Solutions
Our in-clinic diagnostic solutions are comprised of our IDEXX VetLab suite of in-clinic chemistry, hematology, immunoassay, urinalysis and coagulation analyzers, associated proprietary consumable products that provide real-time reference lab quality diagnostic results and a broad range of single-use, handheld IDEXX SNAP rapid assay test kits that provide quick, accurate and convenient point-of-care diagnostic test results for a variety of companion animal diseases and health conditions.
The IDEXX VetLab suite includes several instrument systems, as well as associated proprietary consumable products, all of which are described below. Additionally, we offer extended maintenance agreements in connection with the sale of our instruments.
Blood and Urine Chemistry. We sell three chemistry analyzers, the Catalyst Dx Chemistry Analyzer, the Catalyst One Chemistry Analyzer and the VetTest Chemistry Analyzer, that are used by veterinarians to measure levels of certain enzymes and other substances in blood or urine for monitoring health status and assisting in diagnosing physiologic conditions. These three instruments use consumables manufactured for IDEXX by Ortho-Clinical Diagnostics, Inc. (“Ortho”) based on Ortho’s dry slide technology. In addition, the Catalyst Dx and the Catalyst One analyzers also use dry slide electrolyte consumables manufactured by OPTI Medical Systems, Inc. (“OPTI Medical”), one of our wholly-owned subsidiaries, and other slides also manufactured by IDEXX. Blood tests commonly run on these analyzers include glucose, alkaline phosphatase, ALT (alanine aminotransferase), albumin, calcium, creatinine, blood urea nitrogen, total protein and many others. Tests are sold individually and in prepackaged panels. All three analyzers also run a urine test called urine protein:creatinine ratio, which assists in the detection of renal disease.
7
The Catalyst Dx and Catalyst One analyzers provide significantly improved throughput, ease of use and test menu relative to the VetTest analyzer (our original chemistry analyzer), including the ability to run electrolytes, phenobarbital, fructosamine and total thyroxine (“T4”). Key ease-of-use features include the ability to run a whole blood sample using an on-board centrifuge, the ability to run pre-packaged, multi-slide clips in addition to single chemistry slides and an automated metering system. These analyzers also enable automated dilutions, which is an ease-of-use feature both for certain blood chemistries and the test for urine protein:creatinine ratio. The Catalyst Dx analyzer allows a veterinarian to run multiple patient samples simultaneously and both the Catalyst Dx and Catalyst One run different sample types including whole blood, plasma, serum and urine. In addition, the Catalyst Dx and Catalyst One analyzers run a test to measure phenobarbital levels in blood, allowing veterinarians to adjust anticonvulsant medication more quickly and efficiently. Our fructosamine test helps veterinarians to diagnose and manage canine and feline diabetes mellitus, helping to assess insulin treatments and adjust insulin dosages. We launched our total T4 test globally for use on the Catalyst One analyzer during the first quarter of 2015 and for use on the Catalyst Dx analyzer early in the third quarter of 2015. T4 testing is essential to assessing and managing thyroid function and is an accepted standard for baseline testing for both sick pets and preventive care in senior pets.
The Catalyst One analyzer, launched in November 2014, is engineered to deliver the same laboratory-quality results and real-time work flow as the Catalyst Dx analyzer, offering an attractive in-house chemistry option when a single sample drawer is sufficient for a clinic’s work-flow requirements. The Catalyst One analyzer currently offers an expanding menu of 30 tests, including tests for thyroid disease, kidney disease, diabetes and therapeutic drug monitoring.
We also have two other chemistry analyzers, the VetLyte Electrolyte Analyzer and the VetStat Electrolyte and Blood Gas Analyzer. The VetStat analyzer runs single-use disposable cassettes that are manufactured by OPTI Medical.
Sales of consumables to customers who use our chemistry analyzers provide the majority of our instrument consumables revenues from our installed base of IDEXX VetLab instruments.
Hematology. We sell four hematology analyzers that assess the cellular components of blood, including red blood cells, white blood cells and platelets (also called a complete blood count). These analyzers include the ProCyte Dx Hematology Analyzer, the first and only in-house analyzer to combine laser-flow cytometry, optical fluorescence and laminar-flow impedance in its analysis; the original LaserCyte Hematology Analyzer and the latest generation LaserCyte Dx Hematology Analyzer, launched in 2013, which both use laser-flow cytometry technology in their analysis; and the IDEXX VetAutoread Hematology Analyzer, our original hematology analyzer. In addition, the ProCyte Dx Hematology Analyzer, the LaserCyte Dx Hematology Analyzer and the LaserCyte Hematology Analyzer each have the ability to analyze the components of certain body fluids. We also sell the Coag Dx Analyzer, which permits the detection and diagnosis of blood clotting disorders.
The ProCyte Dx analyzer, our premier hematology analyzer, provides significantly improved throughput and accuracy and more complete medical information relative to the LaserCyte, LaserCyte Dx and VetAutoread hematology analyzers. The ProCyte Dx analyzer provides up to 26 different blood parameters, including the ability to detect band neutrophils and nucleated red blood cells, for a more complete picture of a patient’s health. The ProCyte Dx is validated for many animal species (canine, feline, equine, bovine, ferret, rabbit, gerbil, pig, guinea pig, mini pig, llama, alpaca, camel, sheep, goat, dolphin and hamster) with research and development efforts focused on validating results for additional species.
Immunoassay Testing Instruments. During the first quarter of 2014, we launched the SNAP Pro Mobile Device, which automatically activates a SNAP test, properly times the run and captures an image of the result. This device improves medical care by allowing veterinarians to share the test results on the SNAP Pro Mobile screen, or via VetConnect PLUS. In addition, the SNAP Pro Mobile Device improves staff efficiency and ensures that all SNAP test runs are captured and entered into the patient record for customer billing. In January 2017, we launched ProRead for the SNAP Pro Mobile Device. ProRead is a software upgrade that enables the SNAP Pro Mobile Device to interpret the test results.
8
With multiple-patient testing functionality, the SNAPshot Dx Analyzer provides quantitative measurements of total T4, cortisol and bile acids to assist in the evaluation of thyroid, adrenal and liver function, respectively. The SNAPshot Dx Analyzer also reads, interprets and records the results of many IDEXX rapid assay SNAP tests, including our canine SNAP 4Dx Plus test, feline SNAP FIV/FeLV Combo test, canine SNAP cPL test, feline SNAP fPL test, SNAP Feline Triple test and canine SNAP Heartworm RT test.
Urinalysis. In April 2016, we launched SediVue Dx in North America. In the fourth quarter of 2016 we launched Sedivue Dx in the UK and Australia. SediVue Dx is the first and only veterinary in-clinic urine sediment analyzer. It is designed to provide automated real-time results in a fraction of the time of manual microscope analysis. SediVue Dx brings automation, speed and consistency to urinalysis, a traditionally laborious and variable process. Its leading-edge technology allows veterinary staff to perform a complete urinalysis in approximately 3 minutes. SediVue Dx uses proprietary image processing algorithms similar to facial recognition technology to identify clinically relevant particles found in urine and to capture high-contrast digital images that become part of the permanent patient record. The IDEXX VetLab UA Analyzer provides rapid, automated capture of semi-quantitative chemical urinalysis and is validated specifically for veterinary use.
IDEXX VetLab Station. The IDEXX VetLab Station (“IVLS”) connects and integrates the diagnostic information from all the IDEXX VetLab analyzers and thus provides reference laboratory information management system capability. IVLS securely connects to the internet, and in this way enables IDEXX to perform, through its SmartService Solutions wireless services, remote instrument service and software updates to IVLS and certain connected instruments. IVLS also sends all results created on connected instruments instantly to VetConnect PLUS. We sell IVLS as an integral component of the Catalyst Dx, Catalyst One, LaserCyte Dx and ProCyte Dx analyzers, SNAP Pro Mobile Device, SNAPshot Dx Analyzer and also as a standalone hardware platform. The IVLS includes a touch screen user interface to simplify laboratory work flow, connect with a practice management system and send information to run the individual analyzers. IVLS also generates one integrated patient report incorporating all of the lab work generated by the IDEXX VetLab suite, stores, retrieves and analyzes historical patient diagnostics data, including SNAP test results, and sends and receives information from practice management systems, including the IDEXX Cornerstone system, as well as a wide variety of third-party systems.
The SNAP rapid assays are single-use, handheld test kits that can work without the use of instrumentation, although many kits may also be read and recorded automatically by the SNAPshot Dx Analyzer or activated and captured automatically by the SNAP Pro Mobile Device and interpreted using ProRead, as discussed above. The principal SNAP rapid assay tests are as follows:
Single-Use Canine Tests:
|
· |
SNAP 4Dx Plus, which tests for the six vector-borne diseases; Lyme disease, Ehrlichia canis, Ehrlichia ewingii, Anaplasma phagocytophilum and Anaplasma platys, and canine heartworm; |
|
· |
SNAP Heartworm RT, which tests for heartworm; |
|
· |
SNAP Parvo, which tests for parvovirus, a virus causing life-threatening damage to the immune system and intestinal tract; |
|
· |
SNAP cPL, which tests for canine pancreatitis; |
|
· |
SNAP Giardia, which is a fecal test for soluble Giardia antigens, a common cause of waterborne infection; and |
|
· |
SNAP Lepto, which tests for leptospirosis, a life-threatening bacterial infection spread through contact with water or soil that has been contaminated by the urine of infected animals. |
Sales of canine vector-borne disease tests, including SNAP 4Dx Plus and SNAP Heartworm RT, are greater in the first half of our fiscal year due to seasonality of disease testing in the veterinary practice in the Northern Hemisphere.
9
Single-Use Feline Tests:
|
· |
SNAP Feline Triple, which tests for feline immunodeficiency virus (“FIV”) (which is similar to the virus that leads to AIDS in humans), feline leukemia virus (“FeLV”) and feline heartworm; |
|
· |
SNAP FIV/FeLV Combo Test, which tests for FIV and FeLV; |
|
· |
SNAP fPL, which tests for feline pancreatitis; |
|
· |
SNAP Giardia, which is a fecal test for soluble Giardia antigens; and |
|
· |
SNAP Feline proBNP, which uses a cardiac biomarker (NT proBNP) to test for stretch and stress on the heart. |
Outside Reference Laboratory Diagnostic and Consulting Services
We offer commercial reference laboratory diagnostic and consulting services to veterinarians worldwide, including customers in the U.S., Europe, Canada, Australia, Japan, New Zealand, South Africa, South Korea and Brazil. We have large reference laboratories in Memphis, Tennessee and Leipzig, Germany that are strategically located near large logistics hubs of major air cargo carriers. Customers use our services by submitting samples by courier or overnight delivery to one of our facilities. Most test results have same-day or next-day turnaround times. Our reference laboratories offer a large selection of tests and diagnostic panels to detect a number of disease states and other conditions in animals, including all tests that can be run in-clinic at the veterinary practice with our instruments or rapid assays. This menu of tests also includes a number of specialized and proprietary tests that we have developed that allow practitioners to diagnose increasingly relevant diseases and conditions in dogs and cats, including parasites, heart disease, allergies, pancreatitis, diabetes and infectious diseases. Canine vector-borne disease testing volumes are greater in the first half of our fiscal year due to seasonality of disease testing in the veterinary practice in the Northern Hemisphere.
In the third quarter of 2015, we launched IDEXX SDMA in North America, a new kidney test which detects the onset of canine and feline kidney disease months or years earlier than traditional methods. Upon its introduction in North America, IDEXX SDMA was included in every chemistry panel submitted by our customers at no incremental charge. During the first quarter of 2016, we launched IDEXX SDMA in all of the major European countries and Australia, followed by a full international launch of IDEXX SDMA during the remainder of 2016.
In the second quarter of 2015, we launched Hookworm and Roundworm antigen tests to all fecal panels that already include the Whipworm antigen test. These new intestinal parasite panels detect the presence of intestinal worms left undiagnosed by current methods, finding them earlier in the infection cycle and therefore enabling earlier disease diagnosis and treatment intervention.
Additionally, we provide specialized veterinary consultation, telemedicine and advisory services, including radiology, cardiology, internal medicine and ultrasound consulting. These services enable veterinarians to obtain readings and interpretations of test results transmitted by telephone and over the internet.
Our diagnostic laboratory business also provides health monitoring and diagnostic testing services to bioresearch customers in North America, Europe and Asia.
Veterinary Software, Services and Diagnostic Imaging Systems
Veterinary Software and Services. We develop, market and sell practice management systems, including hardware, software and services that run key functions of veterinary clinics, including managing patient electronic health records, scheduling (including for boarding and grooming), client communication, billing and inventory management. Our principal practice management systems are Cornerstone, DVMAX, Animana and Neo. IDEXX Neo, which we launched in the United States during the third quarter of 2015, and IDEXX Animana are cloud-based practice management systems available in the U.S., Europe and Australia. We also support several other practice management systems installed with our customers, including Better Choice, VPM, VetLINK and BeeFree. Our practice management services include Payment Solutions, Data Backup & Recovery, Cornerstone Coach, Practice Profile and PetDetect boarding collars.
10
In addition, we offer client communication and preventive care plan management services designed to strengthen the relationship between the veterinarian and the pet owner. We commercially launched Pet Health Network Pro in 2013, which is a subscription-based service that permits veterinarians to provide online communication and education to pet owners before, during and after each patient visit, thus strengthening the loyalty between a practice and its clients. Further, veterinarians can share VetConnect PLUS testing results directly with pet owners via Pet Health Network Pro. We also offer Pet Health Network 3D, an educational subscription-based service that replaces cumbersome plastic anatomy models with engaging, three-dimension anatomical animations on a desktop or mobile device. Using these services in the exam room improves client communication and facilitates adherence to veterinarian recommendations. In September 2014, we acquired Petly Plans, a cloud-based software solution for veterinary practices to customize, manage and monitor a range of monthly payment preventive care plans for their pet owner clients. Petly Plans complements the Pet Health Network suite of client marketing services by making it easier for practices to increase access to the best care and offer plans that spread the cost of that care, including examinations, vaccines and diagnostics, over the course of the year. Certain of our services are compatible with non-IDEXX practice management systems.
Diagnostic Imaging Systems. Previously named IDEXX VetLab service and accessories, our diagnostic imaging systems capture radiographic images in digital form, replacing traditional x-ray film and the film development process, which generally requires the use of hazardous chemicals and darkrooms. We market and sell three diagnostic imaging systems primarily used in small animal veterinary applications: the IDEXX ImageVue DR50, the IDEXX ImageVue DR40 and the IDEXX ImageVue CR20.
Our newest radiography system, the IDEXX ImageVue DR50, was launched in June 2016 and enables low-dose radiation image capture without sacrificing clear, high-quality images, reducing the risk posed by excess radiation exposure for veterinary professionals. The IDEXX ImageVue DR50 system also offers wireless capabilities for flexibility in patient positioning.
Our diagnostic imaging systems employ picture archiving and communication system (“PACS”) software called IDEXX-PACS, which facilitates radiographic image capture and review. IDEXX Web PACS is our cloud-based software-as-a-service (“SaaS”) offering for viewing, accessing storing and sharing multi-modality diagnostic images. IDEXX Web PACS is integrated with Cornerstone, Neo and IDEXX VetConnect PLUS to provide centralized access to diagnostic imaging results alongside patient diagnostic results from any internet connected device. IDEXX Web PACS updates automatically and offers secure storage for an unlimited number of diagnostic images. The new software features advanced radiology measurement tools as well as an interactive collaboration feature that allows veterinarians to collaborate and consult remotely with other practitioners.
IDEXX I-Vision Mobile is a software application that allows veterinarians with IDEXX digital radiography systems the ability to request, view and send images using an iPad® or an Android™ mobile tablet. This application integrates with our IDEXX-PACS software.
WATER
We provide innovative testing solutions for easy, rapid and accurate detection and quantification of various microbiological parameters in water, helping to ensure water safety for billions of people around the world.
Our principal products are the Colilert, Colilert-18 and Colisure tests, which simultaneously detect the presence of total coliforms and E. coli in water. These organisms are broadly used as microbial indicators for potential fecal contamination in water. These products utilize nutrient-indicators that produce a change in color or fluorescence when metabolized by target microbes in the sample. Our water tests are used by government laboratories, water utilities and private certified laboratories to test drinking water in compliance with regulatory standards, including U.S. Environmental Protection Agency (“EPA”) standards. The tests also are used in evaluating water used in production processes (for example, in beverage and pharmaceutical applications) and in evaluating bottled water, recreational water, wastewater and water from private wells.
11
Our Enterolert products detect the presence of enterococci in drinking, waste and recreational waters. Enterococci, bacteria normally found in human and animal waste, are organisms broadly used as microbial indicators for potential fecal contamination in water. Our Pseudalert products detect the presence of Pseudomonas aeruginosa in pool, spa and bottled water. Pseudomonas aeruginosa is a pathogen that can cause “hot-tub rash,” “swimmer’s ear” and potentially fatal infections in individuals with weakened immune systems. Our Filta-Max and Filta-Max xpress products are used in the detection of Cryptosporidium and Giardia in water. Cryptosporidium and Giardia are parasites that can cause potentially fatal gastrointestinal illness if ingested. We also distribute certain water testing kits manufactured by Thermo Fisher Scientific, Inc. that complement our Cryptosporidium and Giardia testing products.
In July 2016, we launched Legiolert, a simple culture method test for the detection of Legionella pneumophila, the most common Legionella species in water and the primary cause of Legionnaires’ disease. The Legiolert test is designed to be used on potable or non-potable water sources with results in seven days.
Our Quanti-Tray products, when used in conjunction with our Colilert, Colilert-18, Colisure, Enterolert, Pseudalert or Heterotrophic Plate Count (HPC) products, provide users quantitative measurements of microbial contamination rather than a presence/absence indication. In the second quarter of 2015, we launched the Quanti-Tray Sealer PLUS, a next generation instrument of the previously available Quanti-Tray Sealer 2X. These instruments are used with the Quanti-Tray products for the determination of bacterial density in water samples. Our SimPlate for HPC product detects the total number of the most common bacteria in a water sample.
We also sell consumables, parts and accessories to be used with many of our water testing products.
LIVESTOCK, POULTRY and dairy
We sell diagnostic tests, services and related instrumentation that are used to manage the health status of livestock and poultry, to improve bovine reproductive efficiency, and to ensure the quality and safety of milk and food. Our livestock and poultry diagnostic products are purchased by government and private laboratories that provide testing services to livestock veterinarians, producers and processors. Our herd health screening services are offered to livestock veterinarians and producers. Our principal livestock and poultry diagnostic products include tests for Bovine Viral Diarrhea Virus (“BVDV”) and Porcine Reproductive and Respiratory Syndrome (“PRRS”). BVDV is a common and contagious viral infection that suppresses the immune system, making the animal susceptible to a host of other infections, impacting beef and dairy production yields as a result. PRRS is a contagious virus causing reproductive problems and respiratory diseases in swine, leading to increased piglet mortality, reduced growth and vulnerability to secondary infections.
Our principal dairy products use our SNAP test format and are used by dairy producers and processors worldwide to detect antibiotic drug residue in milk. Our primary product lines are SNAP Beta-Lactam ST and SNAPduo Beta-Tetra ST, which detect certain beta lactam and tetracycline antibiotic residues. We also sell SNAP tests for the detection of certain other contaminants in milk, such as Aflatoxin M1.
In June 2016, we launched the Rapid Visual Pregnancy Test for cattle, which is a point-of-care test that can detect pregnancy 28 days after breeding. This test provides a quick and accurate identifier using whole blood samples that will enable veterinarians to optimize value-added medical consulting services while on farm visits.
12
OTHER
OPTI Medical
Through OPTI Medical, we sell point-of-care analyzers and related consumables for use in human medical hospitals and clinics to measure electrolytes, blood gases, acid-base balance, glucose, lactate, blood urea nitrogen and ionized calcium, and to calculate other parameters such as base excess and anion gap. These OPTI analyzers are used primarily in emergency rooms, operating rooms, cardiac monitoring areas and other locations where time-critical diagnostic testing is performed within the hospital setting. Our latest generation OPTI CCA-TS2 Blood Gas and Electrolyte Analyzer, which launched in 2013, contains many new features relative to previous generation blood gas analyzers including customized work flows, faster time to result, improved communication and a multi-level electronic control. Similar to our earlier generation OPTI CCA and OPTI Touch Electrolyte Analyzers, the OPTI CCA-TS2 runs whole blood, plasma and serum samples on single-use disposable cassettes that contain various configurations of analytes.
In addition, OPTI Medical manufactures our VetStat analyzer, an instrument and consumable system that is a member of the IDEXX VetLab suite for the veterinary market, and provides the dry slides for electrolyte testing on the Catalyst analyzers for our CAG segment.
Other Activities
We own certain drug delivery technology intellectual property, that we continue to seek to commercialize through agreements with third parties, such as pharmaceutical companies, that are included in the Other segment.
MARKETING AND DISTRIBUTION
We market, sell and service our products worldwide through our marketing, customer service, sales and technical service groups, as well as through independent distributors and other resellers. We maintain sales offices outside the U.S. in all major regions including Africa, Asia Pacific, Canada, Europe and Latin America.
Generally, we select the appropriate distribution channel for our products based on the type of product, technical service requirements, number and concentration of customers, regulatory requirements and other factors. Effective January 1, 2015, we market our companion animal diagnostic products to veterinarians directly in the U.S. Prior to January 1, 2015, we marketed our companion animal diagnostic products to veterinarians both directly and through independent veterinary distributors in the U.S., with most instruments sold directly by IDEXX sales personnel and rapid assay test kits and instrument consumables supplied primarily by distributors. Outside the U.S., we sell our companion animal diagnostic products through our direct sales force and, in certain countries, through distributors and other resellers. We sell our veterinary reference laboratory diagnostic and consulting services worldwide generally through our direct sales force. We market our diagnostic imaging products primarily through our direct sales force in the U.S. and Canada. We market our software products primarily through our direct sales force in the U.S., Canada, Europe and Australia. We market our Water and LPD products primarily through our direct sales force in the U.S. and Canada. Outside the U.S. and Canada, we market these products through selected independent distributors and, in certain countries, through our direct sales force. We sell our OPTI electrolyte and blood gas analyzers both directly and through independent human medical product distributors in the U.S. and we sell most of the related consumables through the distribution channel. Outside the U.S., we sell our OPTI products primarily through distributors and other resellers.
RESEARCH AND DEVELOPMENT
Our business includes the development and introduction of new products and services and may involve entry into new business areas. We maintain active research and development programs in each of our business areas. Our research and development expenses, which consist of salaries, employee benefits, materials and external consulting and development costs, were $101.1 million for the year ended December 31, 2016, or 5.7 percent of our consolidated revenue, $99.7 million for the year ended December 31, 2015, or 6.2 percent of our consolidated revenue and $98.3 million for the year ended December 31, 2014, or 6.6 percent of our consolidated revenue.
13
PATENTS AND LICENSES
We actively seek to obtain patent protection in the U.S. and other countries for inventions covering our products and technologies. We also license patents and technologies from third parties. Patents and licenses of patents and technologies from third parties are considered important to the Company based on a variety of factors, including providing protection for the Company’s inventions and other proprietary intellectual property, affording protection from competitors in certain markets, enabling the use of more effective and efficient technologies in the development and production of our products and offerings, strengthening our reputation and standing among customers, employees and key suppliers, and acting as a deterrent against counterfeiters, imitators and other copiers of technologies.
Important patents and licenses include:
|
· |
Exclusive licenses from the University of Texas and Tulane University to patents that expire in 2017 and 2019, respectively, relating to reagents and methods for the detection of Lyme disease utilized in certain of our SNAP products and a reference laboratory diagnostic test; |
|
· |
An exclusive license from Cornell University to patents covering methods for detecting BVDV that expire beginning in 2017 and continuing into 2022; |
|
· |
Patents relating to reagents and methods for the detection of Anaplasma phagocytophilum utilized in certain of our SNAP products that expire beginning in 2017 and continuing into 2022; |
|
· |
Patents relating to reagents and methods for the detection of Ehrlichia canis utilized in certain of our SNAP products that expire beginning in 2019 and continuing into 2022; |
|
· |
A patent concerning LaserCyte consumables that expires in 2020; |
|
· |
Patents concerning Catalyst consumables that expire beginning in 2023 and continuing into 2036; |
|
· |
Patents concerning Catalyst instruments that expire in 2026; |
|
· |
Patents relating to reagents and methods for the detection of canine pancreatic lipase that expire in 2026; and |
|
· |
Patents relating to reagents and methods for the detection of SDMA that expire in 2029. |
In addition, we have a pending U.S. patent application concerning methods for detecting SDMA. If this patent is granted, we expect that it would expire in 2036.
While we consider these proprietary technology rights to be important to us, a range of factors help to mitigate the future effects of patent and license expiration on our results of operations and financial position. These factors include our brand strength and reputation in the marketplace; the breadth, quality and integration of our product offerings; our existing customer relationships and our customer support; our sales force; our online ordering platform that enables direct ordering of (including establishing automatic reorder schedules for) our consumables, tests and other products by our customers; the applicable regulatory approval status for certain products; our continued investments in innovative product improvements that often result in new technologies and/or additional patents; our investment in diagnostic innovations that results in new product offerings that often are patentable and that expand the test menu for our in-house instruments and/or reference laboratory business; our significant know-how, scale and investments related to manufacturing processes of associated product offerings and certain supply arrangements for consumables that are compatible with our instruments. Although we have several patents and licenses of patents and technologies from third parties that expired during 2016, and are expected to expire during 2017, the expiration of these patents, individually or in the aggregate, is not expected to have a material effect on the Company’s financial position or future operations. In addition, we already face notable competition in certain areas as other companies have been successful in bringing competitive products to market, despite the protections afforded by these proprietary technology rights.
To the extent some of our products may now, or in the future, embody technologies protected by patents, copyrights or trade secrets of others, we may be required to obtain licenses to such technologies in order to continue to sell our products. These licenses may not be available on commercially reasonable terms or at all. Our failure to obtain any such licenses may delay or prevent the sale of certain new or existing products. See “Part I, Item 1A. Risk Factors.”
14
PRODUCTION AND SUPPLY
Many of the instruments that we sell are manufactured by third parties. We rely on third parties to supply us with certain important components, raw materials and consumables used in or with our products. In some cases, these third parties are sole or single source suppliers.
Instruments and consumables. Significant products supplied by sole and single source providers include Catalyst Dx and Catalyst One consumables (other than electrolyte consumables and the fructosamine and T4 slides), VetLyte consumables, LaserCyte and LaserCyte Dx consumables, VetTest, VetAutoread and ProCyte Dx analyzers and consumables, SediVue Dx urinalysis instrument and components of our SNAP Pro Mobile Device.
VetTest and Catalyst chemistry slides are supplied by Ortho under supply agreements that are currently set to expire at the end of 2028. We are required to purchase all of our requirements for our current menu of VetTest and Catalyst chemistry slides from Ortho to the extent Ortho is able to supply those requirements. The agreements provide for pricing based on purchase volumes and a fixed annual inflationary adjustment. The agreements also prohibit Ortho from promoting and selling these chemistry slides in the veterinary market, excluding the EU, other than to IDEXX.
We purchase other analyzers and consumables under supply agreements with terms extending through 2032, which in some cases may be extended at our option. We have minimum purchase obligations under some of these agreements, and our failure to satisfy these obligations may result in loss of some or all of our rights under these agreements. See “Part I, Item 1A. Risk Factors.”
Other components. We purchase certain other products, raw materials and components from sole and single source suppliers. These products include certain diagnostic imaging systems and certain components used in our SNAP rapid assay and dairy devices, livestock and poultry testing kits and water testing products.
Certain components incorporated into our SNAP products and certain livestock and poultry testing kits are supplied by Moss, Inc. (“Moss”) under a supply agreement that either party may terminate with 24 months prior written notice. Pursuant to the terms of the supply agreement, Moss has escrowed its manufacturing information relating to the components, which may be released to us upon certain triggering events that would render Moss incapable of supplying the components to us. If such a triggering event occurs, we will make royalty payments to Moss for the use of such information until Moss is able to again begin manufacturing.
We have been successful in ensuring an uninterrupted supply of products purchased from sole and single source suppliers. However, there can be no assurance that uninterrupted supply can be maintained if these agreements terminate for any reason or our suppliers otherwise are unable to satisfy our requirements for products. See “Part I, Item 1A. Risk Factors.”
BACKLOG
We do not generally maintain significant backlog orders and believe that our backlog at any particular date historically has not been indicative of future sales.
15
COMPETITION
We compete with many companies ranging from large human and animal health pharmaceutical and medical diagnostics companies to small businesses focused on animal health. Our companion animal veterinary diagnostic products and services compete with both reference laboratory service and in-clinic product providers. Our competitors vary in our different markets. In some markets, academic institutions, governmental agencies and other public and private research organizations conduct research activities and may commercialize products or services which could compete with our products, on their own or through joint ventures. Several of our direct and potential competitors have substantially greater capital, manufacturing, marketing, and research and development resources than we do.
Competitive factors in our different business areas are detailed below:
|
· |
Companion animal diagnostic offerings. We compete primarily on the basis of ease of use and speed of our products, diagnostic accuracy, product quality, breadth of our product line and services, unique product innovations, fully integrated technology, information management capability, availability of medical consultation, effectiveness of our sales and distribution channels, quality of our technical and customer service and our pricing relative to the value of our products and services in comparison with competitive products and services. Our major competitors in most geographic locations in North America are Antech Diagnostics, a unit of VCA Inc., Abaxis, Inc., Heska Corporation, Zoetis Inc., Samsung Electronics Co., Ltd. and FUJIFILM North America Corporation. In 2015, following our transition to an all-direct sales and distribution model in the U.S., certain of our competitors began to sell products through our formerly exclusive U.S. distributors. See “Part II Item 7. Results of Operations and Trends” for more information. We also compete in international markets with Fujifilm Holdings Corporation, Arkray, Inc. and BioNote, Inc. |
|
· |
Water, livestock, poultry and dairy testing products. We compete primarily on the basis of the ease of use, speed, accuracy, product quality and other performance characteristics of our products and services (including unique tests), the breadth of our product line and services, the effectiveness of our sales and distribution channels, the quality of our technical and customer service, our ability to receive regulatory approvals from governing agencies and our pricing relative to the value of our products in comparison with competitive products and services. Our competitors include highly focused smaller companies and multi-billion dollar companies with small livestock and poultry diagnostics and water testing solution franchises. |
|
· |
Veterinary Software, Services and Diagnostic Imaging Systems. We compete primarily on the basis of functionality, connectivity to equipment and other systems, performance characteristics, effectiveness of our implementation, training process and customer service, information handling capabilities, advances in technologies and our pricing relative to the value of our products and services. We sell these products primarily in North America and Europe. Our largest competitor is Henry Schein in North America and the U.K., which offers several systems and leverages their animal health distribution business in sales and service. We also compete with numerous focused smaller companies throughout the markets in which we offer veterinary software. |
|
· |
Electrolyte and blood gas analyzers for the human point-of-care medical diagnostics market. We compete primarily on the basis of the ease of use, menu, convenience, international distribution and service, instrument reliability, and our pricing relative to the value of our products. We compete primarily with large human medical diagnostics companies such as Radiometer A/S, Siemens Medical Solutions Diagnostics, Instrumentation Laboratory Company, Abbott Diagnostics, a division of Abbott Laboratories and Roche Diagnostics Corporation. |
16
GOVERNMENT REGULATION
Many of our products are subject to comprehensive regulation by U.S. and foreign regulatory agencies that relate to, among other things, product approvals, manufacturing, distribution, marketing and promotion, labeling, recordkeeping, testing, quality, storage and product disposal. The following is a description of the principal regulations affecting our businesses.
Veterinary diagnostic products. Diagnostic tests for animal health infectious diseases, including most of our livestock and poultry products and our rapid assay products, are regulated in the U.S. by the Center for Veterinary Biologics within the United States Department of Agriculture (“USDA”) Animal and Plant Health Inspection Service (“APHIS”). These products must be approved by APHIS before they may be sold in the U.S. The APHIS regulatory approval process involves the submission of product performance data and manufacturing documentation. Following regulatory approval to market a product, APHIS requires that each lot of product be submitted for review before release to customers. In addition, APHIS requires special approval to market products where test results are used in part for government-mandated disease management programs. A number of foreign governments accept APHIS approval as part of their separate regulatory approvals. However, compliance with an extensive regulatory process is required in connection with marketing diagnostic products in Japan, Germany, the Netherlands and many other countries. We are also required to have a facility license from APHIS to manufacture USDA-licensed products. We have a facility license for our manufacturing facility in Westbrook, Maine and our distribution center in Memphis, Tennessee. Our LPD manufacturing facility in Montpellier, France has been approved by APHIS and we have a permit to import products manufactured in Montpellier, France to the U.S. for distribution.
Our veterinary diagnostic instrument systems are veterinary medical devices regulated by the U.S. Food and Drug Administration (“FDA”) under the Food, Drug and Cosmetics Act (the “FDC Act”). While the sale of these products does not require premarket approval by the FDA and does not subject us to the FDA’s current Good Manufacturing Practices regulations (“cGMP”), these products must not be adulterated, mislabeled or misbranded under the FDC Act.
These instrument systems also are subject to the European Medical Device Directives, which create a single set of medical device regulations for all European Union (“EU”) member countries and require companies that wish to manufacture and distribute medical devices in EU member countries to obtain European Conformity marking for their products.
Water testing products. Our water tests are not subject to formal premarket regulatory approval. However, before a test can be used as part of a water quality monitoring program in the U.S. that is regulated by the EPA, the test must first be approved by the EPA. The EPA approval process involves submission of extensive product performance data in accordance with an EPA-approved protocol, evaluation of the data by the EPA and publication for public comment of any proposed approval in the Federal Register before final approval. Our Colilert, Colilert-18, Colisure, Quanti-Tray, Filta-Max xpress, Enterolert and SimPlate for heterotrophic plate counts products have been approved by the EPA for use under various regulatory programs. Water testing products are subject to similarly extensive regulatory processes in other countries around the world.
Dairy testing products. Dairy products used in National Conference on Interstate Milk Shipments (“NCIMS”) milk-monitoring programs in the U.S. are regulated by the FDA as veterinary medical devices. However, before products requiring FDA approval can be sold in the U.S., performance data must be submitted in accordance with an FDA-approved protocol administered by an independent body, such as the Association of Analytical Communities Research Institute (“AOAC RI”). Following approval of a product by the FDA, the product must also be approved by NCIMS, an oversight body that includes state, federal and industry representatives. Our SNAP Beta-Lactam antibiotic residue test product has been approved by the FDA, NCIMS and AOAC RI for sale in the U.S. While some foreign countries accept AOAC RI approval as part of their regulatory approval process, many countries have separate regulatory processes.
17
Human point-of-care electrolyte and blood gas analyzers. Our OPTI instrument systems are classified as Class I and/or Class II medical devices, and their design, manufacture and marketing are regulated by the FDA. Accordingly, we must comply with cGMP in the manufacture of our OPTI products. The FDA’s Quality System regulations further set forth standards for product design and manufacturing processes, require the maintenance of certain records and provide for inspections of our facilities by the FDA. New OPTI products fall into FDA classifications that require notification of and review by the FDA before marketing, and which are submitted as a 510(k) application. OPTI Medical products are also subject to the European Medical Device Directives and regulations governing the manufacture and marketing of medical devices in other countries in which they are sold.
The European Union regulates and restricts the use of certain substances that we currently use in our products or processes. These requirements include the Biocidal Products Regulation, which may require the use of approved biocides in our products prior to being used or sold in the European Union, and the European Regulation for Registration, Evaluation, Authorization and Restriction of Chemical Substances, or REACH, which regulates and restricts the use of certain chemicals in the European Union. Compliance with these regulations (and similar regulations that may be adopted elsewhere) may require registration of the applicable substances or the redesign or reformulation of our products.
In addition to the foregoing, our business is generally subject to various U.S. and foreign regulatory authorities, including the U.S. Federal Trade Commission (the “FTC”) and other anti-competition authorities, and we are also subject to anti-bribery and anti-corruption laws, such as the Foreign Corrupt Practices Act, import and export laws and regulations, including U.S. import and export control and sanctions laws and laws and regulations governing the collection, use, retention, sharing and security of data. Any acquisitions of new products and technologies may subject us to additional areas of government regulation. These may involve, medical device, water-quality and other regulations of the FDA, the EPA, the USDA, the FTC and other federal agencies, as well as state, local and foreign governments. See “Part I, Item 1A. Risk Factors.”
EMPLOYEES
As of February 6, 2017, we had approximately 7,365 employees.
AVAILABLE INFORMATION
Our principal executive offices are located at One IDEXX Drive, Westbrook, Maine 04092, our telephone number is 207-556-0300, and our internet address is www.idexx.com. References to our website in this Annual Report on Form 10-K are inactive textual references only and the content of our website should not be deemed incorporated by reference for any purpose.
We make available free of charge at www.idexx.com our Annual Report on Form 10-K, Quarterly Reports on Form 10-Q, Current Reports on Form 8-K, and amendments to those reports filed or furnished pursuant to Section 13(a) or 15(d) of the Exchange Act as soon as reasonably practicable after we file such information with, or furnish it to, the SEC. In addition, copies of our reports filed electronically with the SEC may be accessed at www.sec.gov. The public may also read and copy any materials filed with the SEC at the SEC’s Public Reference Room at 100 F Street, N.E., Washington, DC 20549. Information on the operation of the Public Reference Room may be obtained by calling the SEC at 1-800-SEC-0330.
Our Corporate Governance Guidelines and our Code of Ethics are also available on our website at www.idexx.com.
18
ITEM 1A.RISK FACTORS
Our future operating results involve a number of risks and uncertainties. Actual events or results may differ materially from those discussed in this report. Factors that could cause or contribute to such differences include, but are not limited to, the factors discussed below, as well as those factors discussed elsewhere in this report.
Our Business Lines are Highly Competitive and Our Failure to Successfully Execute Certain Strategies Could Have a Material Negative Impact on Our Growth and Profitability
The companion animal healthcare industry is highly competitive and we anticipate increasing levels of competition from both existing competitors and new market entrants. Our ability to maintain or enhance our growth rates and our profitability depends on our successful execution of many elements of our strategy, including:
|
· |
Developing, manufacturing and marketing innovative new or improved and cost competitive in-clinic laboratory analyzers that drive sales of IDEXX VetLab instruments, grow our installed base of instruments and increase demand for related recurring sales of consumable products, services and accessories; |
|
· |
Developing and introducing new proprietary diagnostic tests and services that provide valuable medical information to our customers and effectively differentiate our products and services from those of our competitors; |
|
· |
Increasing the value to our customers of our companion animal products and services by enhancing the integration of the information and transactions of these products and the management of diagnostic information derived from our products; |
|
· |
Providing our veterinary customers with the medical and business tools, information and resources that enable them to grow their practices through increased pet visits and enhanced practice of real-time care; |
|
· |
Achieving cost improvements in our worldwide network of reference laboratories by implementing global best practices, including lean processing techniques, incorporating technological enhancements, including laboratory automation and a global laboratory information management system, employing purchasing strategies to maximize leverage of our global scale, increasing the leverage of existing infrastructure and consolidating testing in high volume laboratory hubs; |
|
· |
Achieving cost improvements in the manufacture and service of our in-clinic laboratory analyzers by employing the benefits of economies of scale in both negotiating supply contracts and leveraging manufacturing overhead, and by improving reliability of our instruments; |
|
· |
Continuing to expand, develop and advance the productivity of our companion animal diagnostic sales, marketing, customer support and logistics organizations in the U.S. in support of, among other things, our all-direct sales strategy for our rapid assay kits and instrument consumables (“kits and consumables”) in the U.S.; |
|
· |
Attracting, developing and retaining key leadership and talent necessary to support all elements of our strategy; |
|
· |
Expanding our served market and growing our market share by strengthening our sales and marketing activities both within the U.S. and in geographies outside of the U.S.; |
|
· |
Identifying, completing and integrating acquisitions that enhance our existing businesses or create new business or geographic areas for us; and |
|
· |
Developing and implementing new technology and licensing strategies. |
19
If we are unsuccessful in implementing and executing on some or all of these strategies, our rate of growth or profitability may be negatively impacted.
Our Dependence on Suppliers Could Limit Our Ability to Sell Certain Products or Negatively Affect Our Operating Results
We rely on third-party suppliers to provide components in our products, manufacture products that we do not manufacture ourselves and perform services that we do not provide ourselves, including package-delivery services. Because these suppliers are independent third parties with their own financial objectives, actions taken by them could have a materially negative effect on our results of operations. The risks of relying on suppliers include our inability to enter into contracts with third-party suppliers on reasonable terms, inconsistent or inadequate quality control, relocation of supplier facilities, supplier work stoppages and suppliers’ failure to comply with applicable regulations or their contractual obligations. Problems with suppliers could materially negatively impact our ability to supply the market, substantially decrease sales, lead to higher costs or damage our reputation with our customers.
In addition, we currently purchase many products and materials from sole or single sources. Some of the products that we purchase from these sources are proprietary and, therefore, cannot be readily or easily replaced by alternative sources. These products include the majority of our Catalyst Dx and Catalyst One consumables; VetLyte electrolyte consumables, ProCyte Dx hematology, IDEXX VetAutoread hematology, VetTest chemistry analyzers and related consumables and accessories; SediVue Dx urine sediment analyzer; image capture plates used in our diagnostic imaging systems; and certain components and raw materials used in our SNAP rapid assay kits and SNAP Pro Mobile Device, Catalyst One, LaserCyte and LaserCyte Dx hematology analyzers, livestock and poultry diagnostic tests, dairy testing products, and water testing products. To mitigate risks associated with sole and single source suppliers, we seek when possible to enter into long-term contracts that provide for an uninterrupted supply of products at predictable prices. However, some suppliers decline to enter into long-term contracts and we are required to purchase products with short term contracts or on a purchase order basis. There can be no assurance that suppliers with which we do not have contracts will continue to supply our requirements for products, that suppliers with which we do have contracts will always fulfill their obligations under these contracts, or that any of our suppliers will not experience disruptions in their ability to supply our requirements for products. In cases where we purchase sole and single source products or components under purchase orders, we are more susceptible to unanticipated cost increases or changes in other terms of supply. In addition, under some contracts with suppliers we have minimum purchase obligations, and our failure to satisfy those obligations may result in loss of some or all of our rights under these contracts or require us to compensate the supplier. If we are unable to obtain adequate quantities of products in the future from sole and single source suppliers, we may be unable to supply the market, which could have a material adverse effect on our results of operations.
Our Biologic Products Are Complex and Difficult to Manufacture, Which Could Negatively Affect Our Ability to Supply the Market
Many of our rapid assay, livestock and poultry diagnostic, water and dairy products are biologic products, which are products that include materials from living organisms, such as antibodies, cells and sera. Manufacturing biologic products is highly complex due to the inherent variability of biological input materials and to the difficulty of controlling the interactions of these materials with other components of the products, samples and the environment. There can be no assurance that we will be able to maintain adequate sources of biological materials or that we will be able to consistently manufacture biologic products that satisfy applicable product release criteria. Further, products that meet release criteria at the time of manufacture may fall out of specification while in customer inventory, which could require us to incur expenses associated with recalling products and providing customers with new products, and could damage customer relations. Our inability to produce or obtain necessary biological materials or to successfully manufacture biologic products that incorporate such materials could result in our inability to supply the market with these products and have an adverse effect on our results of operations.
20
Increased Competition and Technological Advances by Our Competitors Could Negatively Affect Our Operating Results
We face intense competition within the markets in which we sell our products and services, and we expect that future competition may become even more intense. Our competitors in the veterinary diagnostic market include companies that develop, manufacture and sell veterinary diagnostic tests and commercial veterinary reference laboratories, as well as corporate hospital chains that operate reference laboratories that serve both their hospitals and unaffiliated hospitals, such as VCA Inc. (formerly named VCA Antech, Inc.). In January 2017, Mars, Incorporated and VCA announced that Mars, Incorporated agreed to acquire VCA, with the acquisition expected to close in the third quarter of 2017. If this acquisition closes, it could result in the combination of two large U.S. veterinary hospital chains into a vertically integrated corporate hospital chain providing reference laboratory services to its hospitals and unaffiliated hospitals. While we believe that our reference laboratory service offerings are competitively differentiated due to our proprietary products and services, such as the IDEXX SDMA test, there can be no assurance that increased consolidation and reference laboratory vertical integration among our customers would not have a negative impact on our ability to compete. For more information regarding the risks presented by consolidation and reference laboratory vertical integration among our customers, see “Consolidation in Our Customer Base, Including Through Increased Corporate Hospital Ownership, and Prevalence of Buying Consortiums Could Negatively Affect Our Business” below.
Competition could negatively affect our sales and profitability in a number of ways. New competitors may enter our markets through the development of new technology, the acquisition of rights to use existing technologies or the use of existing technologies when patents protecting such existing technologies expire. New or existing competitors may introduce new and competitive products and services, which could be superior to our products and services. Some of our competitors and potential competitors may choose to differentiate themselves by offering products and services similar to ours at lower sales prices, which could have an adverse effect on our results of operations through loss of market share or a decision to lower our own sales prices to remain competitive. In addition, our ability to attract and retain customers depends on the effectiveness of our customer marketing and incentive programs and multiple competitors could bundle product and service offerings through co-marketing or other arrangements, which could enhance their ability to compete with our broad product and service offering. With our transition to an all-direct sales strategy for our kits and consumables in the U.S. effective January 1, 2015, we did not renew our distribution agreements with our former key U.S. distribution partners after their expiration at the end of 2014, including exclusive distribution agreements with some of the largest U.S. distributors of companion animal veterinary products. Our former U.S. distribution partners currently promote and sell competitive instruments, consumables and rapid assay products. which may adversely affect the retention of our customers for our kits and consumables and the sales and distribution of our products, which could have an adverse effect on our results of operations. Some of our competitors and potential competitors, including large diagnostic and pharmaceutical companies, also have substantially greater financial resources than us, and greater experience in manufacturing, marketing, research and development and obtaining regulatory approvals than we do.
Various Government Regulations Could Limit or Delay Our Ability to Market and Sell Our Products or Otherwise Negatively Impact Our Business
In the U.S., the manufacture and sale of certain of our products are regulated by agencies such as the USDA, the FDA or the EPA. Our diagnostic tests for animal health applications that involve the detection of infectious diseases, including most rapid assay canine and feline SNAP tests and livestock and poultry diagnostic tests, must be approved by the USDA prior to sale in the U.S. Our dairy testing products require approval by the FDA prior to sale in the U.S. Our water testing products must be approved by the EPA before they can be used by customers in the U.S. as a part of a water quality monitoring program required by the EPA. The manufacture and sale of our OPTI line of human point-of-care electrolytes and blood gas analyzers require approval by the FDA before they may be sold commercially in the U.S. In addition, delays in obtaining regulatory approvals for new products or product upgrades could have a negative impact on our growth and profitability.
The manufacture and sale of our products, as well as our research and development processes, are subject to similar and sometimes more stringent laws in many foreign countries. For example, the European Union regulates the use of certain substances that we currently use in our products or processes. These regulations include the Biocidal Products Regulation, which may require approval for the use of certain biocides in our products prior to being used or sold in the European Union, and the European Regulation for Registration, Evaluation, Authorization
21
and Restriction of Chemical Substances, or REACH, which regulates and restricts the use of certain chemicals in the European Union. Compliance with these regulations (and similar regulations that may be adopted elsewhere) may require registration of the applicable substances or the redesign or reformulation of our products and may reduce or eliminate the availability of certain parts and components used in our products and services in the event our suppliers are unable to comply with the applicable regulations in a timely and cost-effective manner. Any redesign or reformulation or restricted supply of parts and components may negatively affect the availability or performance of our products and services, add testing lead-times for products and reformulated products, reduce our margins, result in additional costs or have other similar effects. In addition, the costs to comply with these regulations may be significant. Any of these could adversely affect our business, financial condition or results of operations. These legal and regulatory requirements are complex and subject to change, and we continue to evaluate their impact.
We are also subject to a variety of federal, state, local and international laws and regulations that govern, among other things, the importation and exportation of products; our business practices in the U.S. and abroad, such as anti-corruption and anti-competition laws; and immigration and travel restrictions. These legal and regulatory requirements differ among jurisdictions around the world and are rapidly changing and increasingly complex. The costs associated with compliance with these legal and regulatory requirements are significant and likely to increase in the future.
Any failure to comply with applicable legal and regulatory requirements could result in fines, penalties and sanctions; product recalls; suspensions or discontinuations of, or limitations or restrictions on, our ability to design, manufacture, market, import, export or sell our products; and damage to our reputation.
Consolidation in Our Customer Base, Including Through Increased Corporate Hospital Ownership, and Prevalence of Buying Consortiums Could Negatively Affect Our Business
Veterinarians are our primary customers for our CAG products and services, and the U.S. veterinary industry has been consolidating in recent years. The number of owners of veterinary hospitals has been declining, and an increasing percentage of veterinary hospitals in the U.S. are owned by corporations that are in the business of acquiring veterinary hospitals and/or opening new veterinary hospitals nationally or regionally. Major corporate hospital owners in the U.S. include Mars, Incorporated (owner of Banfield Pet Hospitals, Blue Pearl Veterinary Partners and Pet Partners), National Veterinary Associates and VCA Inc. (formerly named VCA Antech, Inc.). In January 2017, Mars, Incorporated and VCA announced that Mars, Incorporated agreed to acquire VCA, with the acquisition expected to close in the third quarter of 2017. A similar trend exists in other countries, such as in the U.K. and the Nordic countries, and may in the future also develop in other international markets. Furthermore, an increasing percentage of individually-owned veterinary hospitals in the U.S. are participating in buying consortiums. Corporate owners of veterinary hospitals and buying consortiums often seek to improve profitability by leveraging the buying power they derive from their scale to obtain favorable pricing from suppliers, which could have a negative impact on our results of operations. While we have strong supplier relationships with several corporate hospital groups and buying consortiums, decisions by larger corporate owners and buying consortiums to shift their purchasing of products and services away from us and to a competitor would have a negative impact on our results of operations. In addition, certain corporate owners, most notably VCA, our primary competitor in the U.S. and Canadian markets for veterinary reference laboratory diagnostic services, also operate reference laboratories that serve both their hospitals and unaffiliated hospitals. Any hospitals acquired by these companies generally shift all or a large portion of their testing to the reference laboratories operated by these companies, and there can be no assurance that hospitals that otherwise become affiliated with these companies would not shift all or a portion of their testing to such reference laboratories. Furthermore, because these companies compete with us in the reference laboratory services marketplace, hospitals acquired by these companies or those that establish other affiliations with these companies may cease to be customers or potential customers of our other companion animal products and services, which would cause our sales of these products and services to decline.
Our Success Is Heavily Dependent Upon Proprietary Technologies
We rely on a combination of patent, trade secret, trademark and copyright laws to protect our proprietary rights. We also license patents and technologies from third parties to enable the use of third-party technologies in the development and production of our products and offerings. If we do not have adequate protection of our proprietary rights or are unable to license third-party patents and technologies on reasonable terms, our business may be affected by competitors who utilize substantially equivalent technologies that compete with us.
22
We cannot ensure that we will obtain issued patents, that any patents issued or licensed to us will remain valid, or that any patents owned or licensed by us will provide protection against competitors with similar technologies. Even if our patents cover products sold by our competitors, the time and expense of litigating to enforce our patent rights could be substantial, and could have an adverse effect on our results of operations. In addition, expiration of patent rights could result in substantial new competition in the markets for products previously covered by those patent rights.
In the past, we have received notices claiming that our products infringe third-party patents and we may receive such notices in the future. Patent litigation is complex and expensive, and the outcome of patent litigation can be difficult to predict. We cannot ensure that we will win a patent litigation case or negotiate an acceptable resolution of such a case. If we lose, we may be prohibited from selling certain products and/or we may be required to pay damages and/or ongoing royalties as a result of the lawsuit. Any such result could have an adverse effect on our results of operations.
Changes in Testing Patterns Could Negatively Affect Our Operating Results
The market for our companion animal, livestock and poultry diagnostic tests and our dairy and water testing products could be negatively impacted by a number of factors impacting testing practices. The introduction or broad market acceptance of vaccines or preventatives for the diseases and conditions for which we sell diagnostic tests and services could result in a decline in testing. Changes in accepted medical protocols regarding the diagnosis of certain diseases and conditions could have a similar effect. Eradication or substantial declines in the prevalence of certain diseases also could lead to a decline in diagnostic testing for such diseases. Our livestock and poultry products business in particular is subject to fluctuations resulting from changes in disease prevalence. For example, the demand for our bovine spongiform encephalopathy (“BSE”) testing products has been negatively impacted as a result of regulatory changes in the European Union, including the European Union’s Standing Committee on the Food Chain and Animal Health agreement to allow European Union member states the option to eliminate BSE testing of healthy cattle at slaughter. In addition, changes in government regulations or in the availability of government funds available for monitoring programs could negatively affect sales of our products that are driven by compliance testing, such as our livestock and poultry, dairy and water products. Declines in testing for any of the reasons described, along with lost opportunities associated with a reduction in veterinary visits, could have an adverse effect on our results of operations.
Our Operations and Reputation May Be Impaired if We, Our Products or Our Services Do Not Comply with Evolving Laws and Regulations Regarding Data Privacy and Protection
We offer products and services that collect and use data provided by client practices and individuals, including practice management systems for veterinary practices (e.g., Cornerstone and Neo), online client communication tools and services (e.g., Pet Health Network Pro), and cloud-based technology through VetConnect PLUS that enables veterinarians to access and analyze patients’ diagnostic data from IDEXX in-clinic analyzers, our Rapid Assays and Reference Laboratories in one place. Some of these products and services rely on third-party providers for cloud storage. We also engage in e-commerce through various IDEXX websites and collect contact and other personally identifiable information from our customers and visitors to our websites.
Federal, state and international laws and regulations govern the collection, use, retention, sharing and security of personally identifiable information, including data that we receive from our employees, customers, vendors and visitors to our websites and data collected by our customers and others when using our products and services. In many cases, these laws apply not only to third-party transactions, but also to transfers of information between us and our subsidiaries, and among us, our subsidiaries and other parties with which we have commercial relations. Several jurisdictions have passed laws in this area, and other jurisdictions are considering imposing additional restrictions, including requiring local storage and processing of data. These laws and regulations continue to develop, are subject to differing interpretations and may be applied inconsistently from jurisdiction to jurisdiction and may be inconsistent with our current data protection and privacy policies and practices.
23
For example, on October 6, 2015, the Court of Justice of the European Union decided that the EU-U.S. Safe Harbor framework that had been in place since 2000, which allowed transfers of personal data to the U.S. in compliance with applicable EU data protection laws, was invalid. On February 2, 2016, U.S. and European Commission officials announced they had agreed upon a framework for a new data sharing agreement, called the EU-U.S. Privacy Shield, to replace the EU-U.S. Safe Harbor framework. The European Commission and the U.S. Department of Commerce issued the final text for the Privacy Shield framework in July 2016, and it became operational when the U.S. Department of Commerce began accepting applications for Privacy Shield certification on August 1, 2016. We submitted our self-certification under the Privacy Shield in September 2016 and adopted this framework to transfer personal data to the U.S. in compliance with EU data protection laws. Effective as of January 10, 2017, the U.S. Department of Commerce completed its review of our self-certification, and we joined the Privacy Shield list of participating organizations.
Additionally, in April 2016, the EU Parliament adopted the General Data Protection Regulation, or GDPR, which, among other things, imposes more stringent data protection requirements and provides for greater penalties for noncompliance and is expected to take effect in 2018. The costs associated with compliance with these evolving legal and regulatory requirements are significant and likely to increase in the future and as a result may cause us to incur substantial costs or require us to change our business practices in a manner adverse to our business. In addition, we have and post on our website our own privacy policy concerning the collection, use and disclosure of user data. Any failure, or perceived failure, by us or our products and services to protect employee or customer data (including as a result of a breach by or of a third-party provider) or to comply with any privacy-related laws, government regulations or directives or industry self-regulatory principles or our posted privacy policies could result in damage to our reputation or proceedings or actions against us by governmental entities or otherwise, which could have an adverse effect on our business.
Strengthening of the Rate of Exchange for the U.S. Dollar Has a Negative Effect on Our Business
We are a global business, with 39 percent of our revenue during the year ended December 31, 2016, attributable to sales of products and services to customers outside of the U.S. Any strengthening of the rate of exchange for the U.S. dollar against foreign currencies, and in particular the euro, British pound, Canadian dollar, Chinese renminbi, Japanese yen, Australian dollar and Brazilian real, adversely affects our results, as it reduces the dollar value of sales and profits that are made in those currencies. The strengthening of the U.S. dollar has a greater adverse effect on the profits from products manufactured or sourced in U.S. dollars that are exported to international markets and a lesser effect on profits from foreign sourced products and services due to a natural hedge from international expenses denominated in the corresponding foreign currencies. For the year ended December 31, 2016, approximately 21 percent of our consolidated revenue was derived from products manufactured or sourced in U.S. dollars and sold internationally in local currencies, as compared to 20 percent and 22 percent for the years ended December 31, 2015 and 2014, respectively. A strengthening U.S. dollar could also negatively impact the ability of customers outside the U.S. to pay for purchases denominated in U.S. dollars as well as affect our overall competitiveness in international markets. The accumulated impacts from any continued, longer-term growth in the value of the U.S. dollar against foreign currencies may have a material adverse effect on our operating results. See “Part II, Item 7A. Quantitative and Qualitative Disclosure About Market Risks” included in this Annual Report on Form 10-K for additional information regarding currency impact.
Our foreign currency hedging activities (see Note 17 — Hedging Instruments in the accompanying Notes to the Consolidated Financial Statements), which are designed to minimize and delay, but not to eliminate, the effects of foreign currency fluctuations, may not sufficiently offset the adverse financial effect of unfavorable movements in foreign exchange rates on our financial results over the limited time the hedges are in place. In addition, our hedging activities involve costs and risks, such as transactions costs and the risk that our hedging counterparties will default on their obligations.
We primarily hedge intercompany product purchases and sales denominated in the euro, British pound, Canadian dollar, Japanese yen, Australian dollar and Swiss franc. Other foreign currency exposures related to foreign sourced services and emerging markets may not be practical to hedge. In certain cases, these exposures are not offset by foreign currency denominated costs. As we primarily use foreign currency exchange contracts with durations of less than 24 months and enter into contracts to hedge incremental portions of anticipated foreign currency transactions on a quarterly basis for the current and following year, the effectiveness of our foreign currency hedging activities to offset longer-term appreciation in the value of the U.S. dollar against non-U.S.
24
currencies may be limited. Factors that could affect the effectiveness of our hedging activities include accuracy of sales and other forecasts, volatility of currency markets, and the cost and availability of hedging instruments. Since the hedging activities are designed to minimize volatility, they not only temporarily reduce the negative impact of a stronger U.S. dollar, but they also temporarily reduce the positive impact of a weaker U.S. dollar. Our future financial results could be significantly affected by a strengthening value of the U.S. dollar in relation to the foreign currencies in which we conduct business. The degree to which our financial results are affected for any given time period will depend in part upon our hedging activities.
A Weak Worldwide Economy Could Result in Reduced Demand for Our Products and Services or Increased Customer Credit Risk
A substantial percentage of our sales are made worldwide to the companion animal veterinary market. Demand for our companion animal diagnostic products and services is driven in part by the number of patient visits to veterinary hospitals and the practices of veterinarians with respect to the recommendations for diagnostic testing, as well as pet owner compliance with these recommendations. Economic weakness in our significant markets could cause pet owners to forgo or defer visits to veterinary hospitals or affect their willingness to approve certain diagnostic tests, comply with a treatment plan or, even more fundamentally, continue to own a pet. In addition, concerns about the financial resources of pet owners could cause veterinarians to be less likely to recommend certain diagnostic tests, and concerns about the economy may cause veterinarians to defer purchasing capital items such as our instruments and systems. These conditions, if they continue, could result in a decrease in sales or decrease in sales growth, of diagnostic products and services, which could have an adverse effect on our results of operations.
Demand for our water products is driven in part by the availability of funds at government laboratories, water utilities and private certified laboratories that utilize our products. Availability of funds also affects demand by government laboratories and cattle, swine and poultry producers that utilize our livestock and poultry diagnostic products, and by users of our human point-of-care diagnostic instruments. Economic weakness in our markets has caused and could continue to cause our customers to reduce their investment in such testing, which could have an adverse effect on our results of operations.
In all of our markets, a weak economy may also cause deterioration in the financial condition of our distributors and customers, which could inhibit their ability to pay us amounts owed for products delivered or services provided in a timely fashion or at all.
Risks Associated with Doing Business Internationally Could Negatively Affect Our Operating Results
For the year ended December 31, 2016, approximately 39 percent of our revenue was attributable to sales of products and services to customers outside the U.S., compared to 39 percent for the year ended December 31, 2015, and 43 percent for the year ended December 31, 2014. Although we intend to continue to expand our international operations and business, we may not be able to successfully promote, market, import, export, sell or distribute our products and services outside the U.S. Various risks associated with foreign operations may impact our international sales, including disruptions in transportation of our products, fluctuations in oil prices, increased border protection and restriction on travel, the differing product and service needs of foreign customers, difficulties in building and managing foreign operations, import/export restrictions, duties and licensing requirements, natural disasters, unexpected regulatory and economic or political changes in foreign markets, security concerns and local business and cultural factors that differ from our normal standards and practices, including business practices prohibited by the Foreign Corrupt Practices Act and other anti-corruption laws and regulations.
Further, prices that we charge to foreign customers may be different than the prices we charge for the same products in the U.S. due to competitive, market or other factors, or changes in foreign currency exchange rates. In addition, foreign government regulations may restrict our ability to repatriate funds currently held in foreign jurisdictions, and any repatriation of such funds to the U.S. may result in higher effective tax rates for us. Our results of operations are also susceptible to changes in foreign currency exchange rates. As a result, the mix of domestic and international sales in a particular period could have an adverse impact on our results of operations for that period.
25
Our Business Sells Many Products through Distributors, which Present Risks that Could Negatively Affect Our Operating Results
We sell many of our products outside of the U.S. through distributors. As a result, we are dependent on these distributors to sell our products and assist us in promoting and creating a demand for our products outside the U.S. Our distributors often offer products from several different companies, and certain of our distributors may carry our competitors’ products and promote our competitors’ products over our own products. We have limited ability, if any, to cause our distributors to devote adequate resources to promoting, marketing, selling and supporting our products. We cannot assure you that we will be successful in maintaining and strengthening our relationships with our distributors or establishing relationships with new distributors who have the ability to market, sell and support our products effectively. We may rely on one or more key distributors for a product or a region, and the loss of these distributors could reduce our revenue. Distributors may face financial difficulties, including bankruptcy, which could harm our collection of accounts receivable and financial results. In addition, violations of anti-corruption or similar laws by our distributors could have a material impact on our business, and any termination of a distributor relationship may result in increased competition in the applicable jurisdiction. Failing to manage the risks associated with our use of distributors outside of the U.S. may reduce sales, increase expenses and weaken our competitive position, which could have a negative effect on our operating results.
Our Limited Experience and Small Scale in the Human Point-of-Care Market Could Inhibit Our Success in this Market
We have limited experience in the human point-of-care medical diagnostics market and we operate at a small scale in this market. This market differs in many respects from the veterinary diagnostic market. Significant differences include the impact of third-party reimbursement on diagnostic testing, more extensive regulation, greater product liability risks, larger competitors, a more segmented customer base and more rapid technological innovation. Our limited experience and small scale in the human point-of-care medical diagnostics market could negatively affect our ability to successfully manage the risks and features of this market that differ from the veterinary diagnostic market. There can be no assurance that we will be successful in achieving growth and profitability in the human point-of-care medical diagnostics market comparable to the results we have achieved in the veterinary diagnostic market.
Our Operations are Vulnerable to Interruption as a Result of Natural and Man-Made Disasters, System Disruptions and Security Breaches, and Disruptions, Attacks or Breaches of Information Systems Could Adversely Affect Our Business
The operation of all of our facilities, as well as those of our third party business partners on which we rely, may be vulnerable to interruption as a result of natural and man-made disasters, interruptions in power supply or other system failures. While we maintain plans to continue business under such circumstances, there can be no assurance that such plans will be successful in fully or partially mitigating the effects of such events.
We manufacture many of our significant companion animal products, including our rapid assay devices and certain instruments, many of our water testing products and certain of our livestock, poultry and dairy testing products, at a single facility in Westbrook, Maine. Certain of our companion animal products, as well as our human point-of-care products, are manufactured in Roswell, Georgia. We also manufacture certain of our livestock and poultry testing products in Bern, Switzerland and Montpellier, France. In addition, we maintain major distribution facilities in North America and in the Netherlands and major reference laboratories in Memphis, Tennessee; Leipzig, Germany; Ludwigsburg, Germany; Sacramento, California; Elmhurst, Illinois; North Grafton, Massachusetts; East Brisbane, Australia; Markham, Ontario; Wetherby, U.K.; and Tokyo, Japan. Interruption of operations at any of these facilities could have an adverse effect on our results of operations.
We rely on several information systems throughout our company, as well as our business partners’ information systems, to keep financial records, analyze results of operations, process customer orders, manage inventory, process shipments to customers, store confidential or proprietary information and operate other critical functions. Although we employ system backup measures, our current disaster recovery plan may be ineffective or inadequate to address all eventualities. Further, our information systems and our business partners’ information systems may be vulnerable to attacks by hackers and other security breaches, including computer viruses, through the Internet (including via devices and applications connected to the Internet), email attachments and persons with
26
access to these information systems. We process credit card payments electronically over secure networks. Any such attack or breach could compromise our networks and the information stored there could be accessed, publicly disclosed, lost or stolen. While we have implemented network security and internal control measures and invested in our data and information technology infrastructure, there can be no assurance that these efforts will prevent a system disruption, attack or security breach. In addition, we offer products and services that connect to and are part of the “Internet of Things,” such as our connected devices (e.g., IDEXX VetLab instruments). While we have implemented security measures to protect our connected products and services from cyberattacks, the risk of system disruptions and security breaches from a cyberattack remains.
If we or our business partners were to experience a system disruption, attack or security breach that impacts any of our critical functions, or our customers were to experience a system disruption, attack or security breach via any of our connected products and services, it could result in a period of shutdown of information systems during which we (or our customers) may not be able to operate, the loss of sales and customers, financial misstatement, potential liability for damages to our customers, reputational damage and significant incremental costs, which could adversely affect our business. Furthermore, any access to, public disclosure of, or other loss of information (including any of our confidential or proprietary information) as a result of an attack or security breach could result in governmental actions or private claims or proceedings, which could damage our reputation, cause a loss of confidence in our products and services, damage our ability to develop (and protect our rights to) our proprietary technologies and adversely affect our business.
We maintain property and business interruption insurance to insure against the financial impact of certain events of this nature. However, this insurance may be insufficient to compensate us for the full amount of any losses that we may incur. In addition, such insurance will not compensate us for the long-term competitive effects of being out of the market for the period of any interruption in operations.
Risks Associated with Fluctuations in the Market Values of our Investment Portfolio
We invest our surplus cash in a diversified portfolio of marketable securities, including corporate bonds, commercial paper, and a short-term money market fund which invests in securities issued or sponsored by the U.S. government. The value and liquidity of these marketable securities may fluctuate substantially, and could be negatively affected by increases in interest rates, downgrades of the bonds and other securities included in our portfolio, instability in the global financial markets, declines in the value of collateral underlying the securities included in our portfolio, geopolitical events or other factors. Any adverse changes in the financial markets and resulting declines in the value of our portfolio could have an adverse impact on our financial condition and operating results.
If Our Quarterly or Annual Results of Operations Fluctuate, This Fluctuation May Cause Our Stock Price to Decline
Our prior operating results have fluctuated due to a number of factors, including seasonality of certain product lines; changes in our accounting estimates; the impact of acquisitions; timing of distributor purchases, product launches, operating expenditures, customer marketing and incentive programs, changes in foreign currency exchange rates, timing of regulatory approvals and licenses, litigation and claim-related expenditures; increase in the number and type of competitors; changes in competitors’ product offerings; changes in our sales and distribution model; changes in the economy affecting consumer spending; and other matters. Similarly, our future operating results may vary significantly from quarter to quarter or year to year due to these and other factors, many of which are beyond our control. If our operating results or projections of future operating results do not meet the expectations of market analysts or investors in future periods, our stock price may fall.
27
Future Operating Results Could Be Negatively Affected by Changes in Tax Rates, the Adoption of New U.S. or International Tax Legislation or Exposure to Additional Tax Liabilities
We are subject to local, state, regional and federal tax laws in the U.S. and many other international jurisdictions. Due to economic and political conditions, the various tax rates applied to the earnings of our activities are subject to significant change. Our future tax expense could be affected by changes in the mix of earnings in countries with differing statutory tax rates, changes in the valuation of deferred tax assets and liabilities or changes in tax laws or their interpretation. Also, we have received tax rulings from various governments that have jurisdictional authority over our operations. If we are unable to meet the requirements of such agreements, or if they expire or are renewed on less favorable terms, the result could negatively impact our future earnings. Additionally, the European Commission has opened formal investigations into specific tax rulings granted by several countries to specific taxpayers. While we believe that our rulings in the Netherlands and Switzerland are different than those being discussed, the ultimate resolution of such activities cannot be predicted and could also have an adverse impact on future operating results. See Note 12 to the consolidated financial statements for the year ended December 31, 2016, included in this Annual Report on Form 10-K for more information.
Our income tax filings are regularly under audit by various tax authorities, and the final determination of tax audits could be materially different than that which is reflected in historical income tax provisions and accruals. Significant judgment is required in determining our worldwide provision for income taxes. We regularly assess our exposures related to our worldwide provision for income taxes to determine the adequacy of our provision for taxes. Any reduction in these contingent liabilities or additional assessments would increase or decrease income, respectively, in the period such determination is made.
Restrictions in Our Debt Agreements or Our Inability to Obtain Financing on Favorable Terms May Limit Our Activities
Our ability to make scheduled payments and satisfy our other obligations under our unsecured revolving credit facility and senior notes depends on our future operating performance and on economic, financial, competitive and other factors beyond our control. Our business may not generate sufficient cash flows to meet these obligations or generate sufficient levels of earnings to satisfy the applicable affirmative, negative and financial covenants. Our failure to comply with these covenants and the other terms of the credit facility and senior notes could result in an event of default and acceleration of our obligations under these agreements, which may require us to seek additional financing or restructure existing debt on unfavorable terms. In addition, adverse changes in credit markets could increase our cost of borrowing and make it more difficult for us to obtain financing.
Our senior notes include provisions which stipulate a prepayment penalty for which we will be obligated in the event that we elect to repay the notes prior to their stated maturity dates. Should we elect to repay some or all of the outstanding principal balance on our senior notes, the prepayment penalty we incur could adversely affect our results of operations and cash flows.
We fund our operations, capital purchase requirements and strategic growth needs through cash on hand, funds generated from operations, amounts available under our credit facility and senior note financings. If we are unable to obtain financing on favorable terms, we could face restrictions that would limit our ability to execute certain strategies, which could have an adverse effect on our revenue growth and profitability.
ITEM 1B.UNRESOLVED STAFF COMMENTS
Not applicable.
28
ITEM 2.PROPERTIES
Our worldwide headquarters is located on a company-owned, 65-acre site in Westbrook, Maine where we occupy a 647,000 square foot building utilized for manufacturing, research and development, marketing, sales and general and administrative support functions.
Additional property ownership and leasing arrangements with approximate square footage, purpose and location are as follows:
Additional Properties Owned:
|
· |
34,200 square feet of laboratory space located in the U.S., used for our Reference Laboratory Diagnostic and Consulting Services line of business of CAG |
|
· |
23,000 square feet of office and laboratory space located in the U.K., used for our Reference Laboratory Diagnostic and Consulting Services line of business of CAG |
|
· |
3,100 square feet of laboratory space located in Canada, used for our Reference Laboratory Diagnostic and Consulting Services line of business of CAG |
Additional Properties Leased:
|
· |
537,000 total square feet of laboratory, office and warehousing space located throughout the U.S., Europe, Canada, Australia, New Zealand, Asia and South Africa, primarily used for our Reference Laboratory Diagnostic and Consulting Services line of business of CAG |
|
· |
114,400 square feet of industrial space in Tennessee for distribution and warehousing related to various lines of business |
|
· |
100,100 square feet of distribution, warehousing and office space in the Netherlands, which serves as our European headquarters |
|
· |
84,300 square feet of office, manufacturing and warehousing space in Georgia related to our OPTI Medical line of business |
|
· |
69,300 square feet of office space in Wisconsin related to our Veterinary Software, Services and Diagnostic Imaging Systems line of business of CAG |
|
· |
65,000 square feet of office space in Maine for Corporate, Customer Service and Information Technology support services |
|
· |
52,800 total square feet of office and manufacturing space in France, Switzerland and Brazil related to our Livestock, Poultry and Dairy line of business |
|
· |
7,600 square feet of manufacturing space in the U.K. related to our Water line of business |
We believe that our owned and leased properties are generally in good condition, are well-maintained, and are generally suitable and adequate to carry on our business.
ITEM 3.LEGAL PROCEEDINGS
Due to the nature of our activities, we are at times subject to pending and threatened legal actions that arise out of the ordinary course of business. In the opinion of management, based in part upon advice of legal counsel, the disposition of any such currently pending matters is not expected to have a material effect on our results of operations, financial condition or cash flows. However, the results of legal actions cannot be predicted with certainty. Therefore, it is possible that our results of operations, financial condition or cash flows could be materially adversely affected in any particular period by the unfavorable resolution of one or more legal actions.
ITEM 4.MINE SAFETY DISCLOSURES
Not applicable.
29
PART II
ITEM 5.MARKET FOR THE REGISTRANT’S COMMON EQUITY, RELATED STOCKHOLDER MATTERS AND ISSUER PURCHASES OF EQUITY SECURITIES
Market Information
Our common stock is quoted on the NASDAQ Global Select Market under the symbol IDXX. The following table shows the quarterly range of high and low sale prices per share (1) of our common stock as reported on the NASDAQ Global Select Market for the years 2015 and 2016.
|
For the Quarter Ended |
High |
Low |
||||
|
|
||||||
|
March 31, 2015 |
$ |
84.26 |
$ |
72.38 | ||
|
June 30, 2015 |
82.24 | 61.37 | ||||
|
September 30, 2015 |
79.62 | 61.58 | ||||
|
December 31, 2015 |
77.27 | 65.03 | ||||
|
|
||||||
|
March 31, 2016 |
79.03 | 63.48 | ||||
|
June 30, 2016 |
92.87 | 76.55 | ||||
|
September 30, 2016 |
115.06 | 92.52 | ||||
|
December 31, 2016 |
121.77 | 102.45 | ||||
(1) 2015 Prices have been adjusted to reflect a two-for-one stock split on June 15, 2015.
Holders of Common Stock
As of February 6, 2017, there were 494 holders of record of our common stock. Because the majority of our common stock is held by brokers and other institutions on behalf of stockholders, we are unable to estimate the total number of stockholders represented by these record holders.
Purchases of Equity Securities by the Issuer
During the three months ended December 31, 2016, we repurchased shares of common stock as described below:
|
1 |
||||||||||
|
Period |
|
Total Number of Shares Purchased (a) |
|
Average Price Paid per Share (b) |
|
Total Number of Shares Purchased as Part of Publicly Announced Plans or Programs (1) (c) |
|
Maximum Number of Shares that May Yet Be Purchased Under the Plans or Programs (d) |
||
|
|
|
|
|
|
|
|
|
|
|
|
|
October 1, 2016 to October 31, 2016 |
67,500 |
$ |
110.66 | 67,500 | 5,619,425 | |||||
|
November 1, 2016 to November 30, 2016 |
1,000,947 | 108.65 | 1,000,947 | 4,618,478 | ||||||
|
December 1, 2016 to December 31, 2016 |
886,672 | 117.24 | 882,970 | 3,735,508 | ||||||
|
Total |
1,955,119 |
(2) |
$ |
115.00 | 1,951,417 | 3,735,508 | ||||
|
|
|
|
|
|
|
|
|
|
|
|
30
(1) As of December 31, 2016, our Board of Directors had approved the repurchase of up to 65 million shares of our common stock in the open market or in negotiated transactions pursuant to the Company’s share repurchase program. The program was approved and announced on August 13, 1999, and the maximum number of shares that may be purchased under the program was subsequently increased on October 4, 1999, November 16, 1999, July 21, 2000, October 20, 2003, October 12, 2004, October 12, 2005, February 14, 2007, February 13, 2008, February 10, 2010, October 12, 2011, May 7, 2013 and again on July 16, 2014. Effective June 15, 2015, an additional 8 million shares of our common stock was authorized for repurchase, increasing the total shares of common stock authorized to be repurchased by the Company up from 57 million to 65 million shares. There is no specified expiration date for this repurchase program. There were no other repurchase programs outstanding during the three months ended December 31, 2016, and no repurchase programs expired during the period. Repurchases of 1,951,417 shares were made during the three months ended December 31, 2016, in transactions made pursuant to our repurchase program.
(2) During the three months ended December 31, 2016, we received 3,702 shares of our common stock that were surrendered by employees in payment for the minimum required withholding taxes due on the vesting of restricted stock units and settlement of deferred stock units. In the above table, these shares are included in columns (a) and (b), but excluded from columns (c) and (d). These shares do not reduce the number of shares that may yet be purchased under the repurchase program.
During the year ended December 31, 2016, we repurchased 3,070,644 shares of our common stock in transactions made pursuant to our repurchase program and received 59,860 shares of common stock that were surrendered by employees in payment for the minimum required withholding taxes due on the vesting of restricted stock units and settlement of deferred stock units. See Note 18 to the consolidated financial statements for the year ended December 31, 2016, included in this Annual Report on Form 10-K for further information.
Dividends
We have never declared or paid any cash dividends on our common stock. From time to time our Board of Directors may consider the declaration of a dividend. However, we have no intention to declare or pay a dividend at this time.
31
Stock Performance
This graph compares our total stockholder returns, the Total Return for the Standard & Poor’s (“S&P”) 500 Index, the Total Return for the S&P 500 Health Care Index and the Total Return for the NASDAQ Stock Market Index (U.S. Companies) prepared by the Center for Research in Security Prices (the “NASDAQ Index”). This graph assumes the investment of $100 on December 31, 2011, in IDEXX’s common stock, the S&P 500 Index, the S&P 500 Health Care Index and the NASDAQ Index and assumes dividends, if any, are reinvested. Measurement points are the last trading days of the years ended December 2011 to 2016.
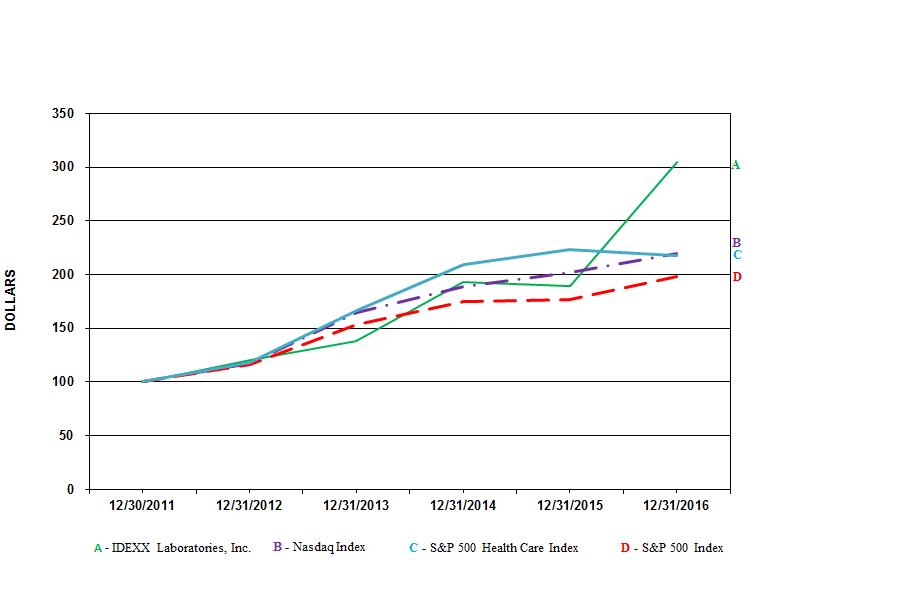
|
|
|
12/31/2011 |
|
12/31/2012 |
|
12/30/2013 |
|
12/31/2014 |
|
12/31/2015 |
|
12/31/2016 |
||||||
|
|
|
|
|
|
|
|
|
|
|
|
|
|
|
|
|
|
|
|
|
IDEXX Laboratories, Inc. |
|
$ |
100.00 |
|
$ |
120.58 |
|
$ |
138.23 |
|
$ |
192.66 |
|
$ |
189.50 |
|
$ |
304.76 |
|
NASDAQ Index |
|
|
100.00 |
|
|
117.45 |
|
|
164.57 |
|
|
188.84 |
|
|
201.98 |
|
|
219.89 |
|
S&P 500 Health Care Index |
|
|
100.00 |
|
|
117.89 |
|
|
166.76 |
|
|
209.02 |
|
|
223.42 |
|
|
217.41 |
|
S&P 500 Index |
|
|
100.00 |
|
|
116.00 |
|
|
153.57 |
|
|
174.60 |
|
|
177.01 |
|
|
198.18 |
32
ITEM 6.SELECTED FINANCIAL DATA
The following table sets forth selected consolidated financial data for each of the last five fiscal years. The selected consolidated financial data presented below has been derived from our consolidated financial statements. This financial data should be read in conjunction with the consolidated financial statements, related notes and other financial information appearing elsewhere in this Annual Report on Form 10-K.
On May 6, 2015, we announced a two-for-one split of our outstanding shares of common stock which was effected through a stock dividend that was paid through the issuance of treasury shares on June 15, 2015. All share and per share amounts presented below, for periods prior to June 15, 2015, retroactively reflect the effect of the stock split.
|
|
For the Years Ended December 31, |
|||||||||||||||
|
|
(in thousands, except per share data) |
|||||||||||||||
|
|
2016 | 2015 | 2014 | 2013 | 2012 | |||||||||||
|
|
||||||||||||||||
|
INCOME STATEMENT DATA: |
||||||||||||||||
|
Revenue |
$ |
1,775,423 |
$ |
1,601,892 |
$ |
1,485,807 |
$ |
1,377,058 |
$ |
1,293,338 | ||||||
|
Cost of revenue |
799,987 | 711,622 | 669,691 | 620,940 | 594,190 | |||||||||||
|
Gross profit |
975,436 | 890,270 | 816,116 | 756,118 | 699,148 | |||||||||||
|
Expenses: |
||||||||||||||||
|
Sales and marketing |
317,058 | 299,955 | 283,708 | 243,492 | 216,962 | |||||||||||
|
General and administrative |
207,017 | 182,510 | 173,890 | 157,861 | 137,609 | |||||||||||
|
Research and development |
101,122 | 99,681 | 98,263 | 88,003 | 82,014 | |||||||||||
|
Impairment charge |
- |
8,212 |
- |
- |
- |
|||||||||||
|
Income from operations |
350,239 | 299,912 | 260,255 | 266,762 | 262,563 | |||||||||||
|
Interest expense, net |
(28,393) | (26,771) | (13,700) | (3,501) | (1,946) | |||||||||||
|
Income before provision for income taxes |
321,846 | 273,141 | 246,555 | 263,261 | 260,617 | |||||||||||
|
Provision for income taxes |
99,792 | 81,006 | 64,604 | 75,467 | 82,330 | |||||||||||
|
Net income |
222,054 | 192,135 | 181,951 | 187,794 | 178,287 | |||||||||||
|
Less: Net income (loss) attributable to noncontrolling interest |
9 | 57 | 45 | (6) | 20 | |||||||||||
|
Net income attributable to IDEXX Laboratories, Inc. stockholders |
$ |
222,045 |
$ |
192,078 |
$ |
181,906 |
$ |
187,800 |
$ |
178,267 | ||||||
|
Earnings per share: |
||||||||||||||||
|
Basic |
$ |
2.47 |
$ |
2.07 |
$ |
1.82 |
$ |
1.77 |
$ |
1.62 | ||||||
|
Diluted |
$ |
2.44 |
$ |
2.05 |
$ |
1.79 |
$ |
1.74 |
$ |
1.59 | ||||||
|
Weighted average shares outstanding: |
||||||||||||||||
|
Basic |
89,732 | 92,601 | 100,094 | 106,318 | 109,969 | |||||||||||
|
Diluted |
90,884 | 93,649 | 101,503 | 107,970 | 112,311 | |||||||||||
|
|
||||||||||||||||
|
BALANCE SHEET DATA: |
||||||||||||||||
|
Cash and cash equivalents |
$ |
154,901 |
$ |
128,994 |
$ |
322,536 |
$ |
279,058 |
$ |
223,986 | ||||||
|
Marketable securities(1) |
236,949 | 213,591 |
- |
- |
- |
|||||||||||
|
Cash and cash equivalents and marketable securities |
$ |
391,850 |
$ |
342,585 |
$ |
322,536 |
$ |
279,058 |
$ |
223,986 | ||||||
|
Working capital |
$ |
(88,984) |
$ |
(35,127) |
$ |
(61,508) |
$ |
174,353 |
$ |
163,204 | ||||||
|
Total assets |
$ |
1,530,704 |
$ |
1,474,993 |
$ |
1,384,211 |
$ |
1,230,516 |
$ |
1,103,602 | ||||||
|
Total long-term debt(2) |
$ |
593,110 |
$ |
597,085 |
$ |
350,000 |
$ |
150,359 |
$ |
1,394 | ||||||
|
Total stockholders' equity (deficit) |
$ |
(108,213) |
$ |
(83,995) |
$ |
117,589 |
$ |
518,214 |
$ |
636,257 | ||||||
(1) During the years ended December 31, 2015 and 2016, we purchased marketable debt securities, which are classified as available-for-sale and carried at fair value in the accompanying consolidated balance sheets on a trade date basis. See Note 5 to the consolidated financial statements included in this Annual Report on Form 10-K for additional information regarding our marketable securities.
(2) Between December 2013 and June 2015, we issued and sold approximately $600 million in senior notes through private placements at fixed interest rates ranging from 1.785 percent to 4.04 percent. See Note 11 to the consolidated financial statements included in this Annual Report on Form 10-K for additional information regarding our senior notes.
33
ITEM 7.MANAGEMENT’S DISCUSSION AND ANALYSIS OF FINANCIAL CONDITION AND RESULTS OF OPERATIONS
The following discussion and analysis of our financial condition and results of operations should be read in conjunction with our consolidated financial statements and related notes appearing elsewhere in this Annual Report on Form 10‑K.
We have included certain terms and abbreviations used throughout this Annual Report on Form 10-K in the "Glossary of Terms and Selected Abbreviations.”
Description of Business Segments. We operate primarily through three business segments: diagnostic and information technology-based products and services for the veterinary market, which we refer to as the Companion Animal Group (“CAG”); water quality products (“Water”); and diagnostic products and services for livestock and poultry health and to ensure the quality and safety of milk and food, which we refer to as Livestock, Poultry and Dairy (“LPD”). Our Other operating segment combines and presents products for the human point-of-care medical diagnostics market (“OPTI Medical”) with our pharmaceutical product line and our out-licensing arrangements because they do not meet the quantitative or qualitative thresholds for reportable segments. See Note 15 to the consolidated financial statements for the year ended December 31, 2016, included in this Annual Report on Form 10-K for financial information about our segments, including our product and service categories, and our geographic areas.
During the second quarter of 2016, we renamed our customer information management and diagnostic imaging systems line of business in the CAG segment to veterinary software, services and diagnostic imaging systems. Financial results were not adjusted as a result of this name change.
During the fourth quarter of 2016, we modified our management reporting to rename IDEXX VetLab service and accessories to CAG Diagnostics service and accessories and reclassified the location of SNAP Pro service plans previously located in CAG Diagnostics capital - instruments to CAG Diagnostics service and accessories. The amount of revenue reclassified was $0.5 million during the year ended December 31, 2015, and $1.4 million during the year ended December 31, 2016. The amount reclassified was less than $0.1 million during the year ended December 31, 2014.
Certain costs not allocated to our operating segments and are instead reported under the caption “Unallocated Amounts”. These costs include costs that do not align with one of our existing operating segments or are cost prohibitive to allocate, which primarily consist of our R&D function, regional or country expenses, certain foreign currency revaluation gains and losses on monetary balances in currencies other than our subsidiaries’ functional currency and unusual items. Corporate support function costs (such as information technology, facilities, human resources, finance and legal), health benefits and incentive compensation are charged to our business segments at pre-determined budgeted amounts or rates. Differences from these pre-determined budgeted amounts or rates are captured within Unallocated Amounts.
Effective January 1, 2016, we modified our management reporting to the Chief Operating Decision Maker to provide a more comprehensive view of the performance of our operating segments by including the capitalization and subsequent recognition of variances between standard and actual manufacturing costs, which adjusts the timing of cost recognition from when the variance is created to the period in which the related inventory is sold. Prior to January 1, 2016, the capitalization and subsequent recognition of these variances were not allocated to our operating segments and were instead reported under the caption “Unallocated Amounts”.
34
The segment gross profit and income (loss) from operations within this Annual Report on Form 10-K for the years ended December 31, 2015 and 2014, has been retrospectively revised to reflect the changes to our segment performance metrics described above. The following is a summary of revised segment gross profit from operations for the years ended December 31, 2015 and 2014:
|
|
Net Impact of Standard Cost |
||||||||||||||||||
|
|
For the Year Ended |
Variance Capitalization and |
For the Year Ended |
Adjusted |
|||||||||||||||
|
Gross Profit |
December 31, 2015 |
Percent of |
Subsequent Recognition |
December 31, 2015 |
Percent of |
||||||||||||||
|
(dollars in thousands) |
As Previously Reported |
Revenue |
to the Operating Segments |
As Adjusted |
Revenue |
||||||||||||||
|
|
|||||||||||||||||||
|
CAG |
$ |
727,626 | 53.6% |
$ |
1,677 |
$ |
729,303 | 53.8% | |||||||||||
|
Water |
68,785 | 71.0% | 168 | 68,953 | 71.2% | ||||||||||||||
|
LPD |
77,227 | 60.7% | 2,760 | 79,987 | 62.9% | ||||||||||||||
|
Other |
10,574 | 49.0% | (293) | 10,281 | 47.6% | ||||||||||||||
|
Unallocated Amounts |
6,058 |
N/A |
(4,312) | 1,746 |
N/A |
||||||||||||||
|
Total Company |
$ |
890,270 | 55.6% |
$ |
- |
$ |
890,270 | 55.6% | |||||||||||
|
|
|||||||||||||||||||
|
|
Net Impact of Standard Cost |
||||||||||||||||||
|
|
For the Year Ended |
Variance Capitalization and |
For the Year Ended |
Adjusted |
|||||||||||||||
|
Gross Profit |
December 31, 2014 |
Percent of |
Subsequent Recognition |
December 31, 2014 |
Percent of |
||||||||||||||
|
(dollars in thousands) |
As Previously Reported |
Revenue |
to the Operating Segments |
As Adjusted |
Revenue |
||||||||||||||
|
|
|||||||||||||||||||
|
CAG |
$ |
655,197 | 53.6% |
$ |
(3,002) |
$ |
652,195 | 53.3% | |||||||||||
|
Water |
62,924 | 66.4% | (348) | 62,576 | 66.1% | ||||||||||||||
|
LPD |
89,519 | 63.4% | (4,461) | 85,058 | 60.2% | ||||||||||||||
|
Other |
14,236 | 53.0% | 178 | 14,414 | 53.7% | ||||||||||||||
|
Unallocated Amounts |
(5,760) |
N/A |
7,633 | 1,873 |
N/A |
||||||||||||||
|
Total Company |
$ |
816,116 | 54.9% |
$ |
- |
$ |
816,116 | 54.9% | |||||||||||
The following is a summary of revised segment operating income (loss) from operations for the years ended December 31, 2015 and 2014:
|
|
Net Impact of Standard Cost |
||||||||||||||||||||
|
|
For the Year Ended |
Variance Capitalization and |
For the Year Ended |
Adjusted |
|||||||||||||||||
|
Operating Income (Loss) |
December 31, 2015 |
Percent of |
Subsequent Recognition |
December 31, 2015 |
Percent of |
||||||||||||||||
|
(dollars in thousands) |
As Previously Reported |
Revenue |
to the Operating Segments |
As Adjusted |
Revenue |
||||||||||||||||
|
|
|||||||||||||||||||||
|
CAG |
$ |
231,642 | 17.1% |
$ |
1,677 |
$ |
233,319 | 17.2% | |||||||||||||
|
Water |
44,584 | 46.0% | 168 | 44,752 | 46.2% | ||||||||||||||||
|
LPD |
24,397 | 19.2% | 2,760 | 27,157 | 21.4% | ||||||||||||||||
|
Other |
156 | 0.7% | (293) | (137) | (0.6%) | ||||||||||||||||
|
Unallocated Amounts |
(867) |
N/A |
(4,312) | (5,179) |
N/A |
||||||||||||||||
|
Total Company |
$ |
299,912 | 18.7% |
$ |
- |
$ |
299,912 | 18.7% | |||||||||||||
|
|
|||||||||||||||||||||
|
|
Net Impact of Standard Cost |
||||||||||||||||||||
|
|
For the Year Ended |
Variance Capitalization and |
For the Year Ended |
Adjusted |
|||||||||||||||||
|
Operating Income (Loss) |
December 31, 2014 |
Percent of |
Subsequent Recognition |
December 31, 2014 |
Percent of |
||||||||||||||||
|
(dollars in thousands) |
As Previously Reported |
Revenue |
to the Operating Segments |
As Adjusted |
Revenue |
||||||||||||||||
|
|
|||||||||||||||||||||
|
CAG |
$ |
203,536 | 16.6% |
$ |
(3,002) |
$ |
200,534 | 16.4% | |||||||||||||
|
Water |
39,262 | 41.4% | (348) | 38,914 | 41.1% | ||||||||||||||||
|
LPD |
33,788 | 23.9% | (4,461) | 29,327 | 20.8% | ||||||||||||||||
|
Other |
2,479 | 9.2% | 178 | 2,657 | 9.9% | ||||||||||||||||
|
Unallocated Amounts |
(18,810) |
N/A |
7,633 | (11,177) |
N/A |
||||||||||||||||
|
Total Company |
$ |
260,255 | 17.5% |
$ |
- |
$ |
260,255 | 17.5% | |||||||||||||
35
The following is a discussion of the strategic and operating factors that we believe have the most significant effect on the performance of our business.
Companion Animal Group
Our strategy is to provide veterinarians with both the highest quality diagnostic information to support more advanced medical care and information management solutions that help demonstrate the value of diagnostics to pet owners and enable efficient practice management. By doing so, we are able to build a mutually successful partnership with our veterinarian customers based on healthy pets, loyal customers and expanding practice revenues.
CAG Diagnostics. We provide diagnostic capabilities that meet veterinarians’ diverse needs through a variety of modalities including in-clinic diagnostic solutions and outside reference laboratory services. Veterinarians that utilize our full line of diagnostic modalities obtain a single view of a patient’s diagnostic results, which allows them to track and evaluate trends and achieve greater medical insight.
The breadth and complementary nature of our diagnostic solutions also provides us scale in sales and distribution. To further increase our customer reach, effective January 1, 2015, we transitioned to an all-direct sales strategy in the U.S. and did not renew our annual contracts with our U.S. distribution partners. Under this approach, we take orders, ship product, invoice and receive payment for all rapid assay test kits and IDEXX VetLab consumables in the U.S., aligning with our direct model for instruments, reference laboratory services, and other CAG products and services. We believe these changes will continue to strengthen customer loyalty and help support growth of our diagnostic revenues in North America.
Our diagnostic capabilities generate both recurring and non-recurring revenues. Revenues related to capital placements of our in-clinic IDEXX VetLab suite of instruments and our SNAP Pro Mobile Device are non-recurring in nature in that they are sold to a particular customer only once. Revenues from the associated proprietary IDEXX VetLab consumables, SNAP rapid assay test kits, reference laboratory and consulting services, and extended maintenance agreements and accessories related to our IDEXX VetLab instruments and our SNAP Pro Mobile Device are recurring in nature, in that they are regularly purchased by our customers, typically as they perform diagnostic testing as part of ongoing veterinary care services. Our recurring revenues, most prominently IDEXX VetLab consumables and rapid assay test kits, have significantly higher gross margins than those provided by our instrument sales. Therefore, the mix of recurring and non-recurring revenues in a particular period will impact our gross margins.
Diagnostic Capital Revenue. Revenues related to the placement of the IDEXX VetLab suite of instruments are non-recurring in nature, in that the customer will buy an instrument once over its respective product life cycle, but will purchase consumables for that instrument on a recurring basis as they use that instrument for testing purposes. During the early stage of an instrument’s life cycle, we derive relatively greater revenues from instrument placements, while consumable sales become relatively more significant in later stages as the installed base of instruments increases and instrument placement revenues begin to decline. In the early stage of an instrument’s life cycle, placements are made primarily through sales transactions. As the market for the product matures, an increasing percentage of placements are made in transactions, sometimes referred to as “reagent rentals,” in which instruments are placed at customer sites at little or no cost in exchange for a long-term customer commitment to purchase instrument consumables.
Prior to the Catalyst One instrument launch during November 2014, we pre-sold the instrument under a customer marketing program through which customers preordering a Catalyst One were initially provided with the right to use a Catalyst Dx instrument. Under this marketing program, we deferred $7 million of instrument revenue in 2014, which was fully recognized in 2015 upon delivery of the Catalyst One instruments or customer election to keep the Catalyst Dx was received.
36
We place our Catalyst chemistry analyzers through sales, leases, rental and other programs. In addition, we continue to place VetTest instruments through sales, lease, rental and other programs, with substantially all of our revenues from that product line currently derived from consumable sales. As of December 31, 2016, these three chemistry analyzers provided for a combined active installed base of approximately 43,000 units globally, as compared to 40,000 units globally in 2015. Approximately 50 percent of 2016 Catalyst analyzer placements were to customers that are new to IDEXX, including customers who had been using instruments from one of our competitors, sometimes referred to as competitive accounts. Generally, placement of an instrument with a new or competitive account is more attractive as the entire consumable stream associated with that placement represents incremental recurring revenue, whereas the consumable stream associated with a Catalyst placement at a VetTest customer substitutes a Catalyst consumable stream for a VetTest consumable stream. We have found that the consumables revenues increase when a customer upgrades from a VetTest analyzer to a Catalyst analyzer due to the superior test menu capability, flexibility and ease of use of the Catalyst analyzers, which leads to additional testing by the customer.
As we continue to experience growth in placements of Catalyst analyzers and in sales of related consumables, we expect this growth to be partly offset by a decline in placements of VetTest analyzers and in sales of related consumables.
The LaserCyte Dx analyzer is our latest generation hematology analyzer, which we launched in 2013. In addition, we sell the ProCyte Dx LaserCyte and VetAutoread analyzers. As of December 31, 2016, these four hematology analyzers provided for a combined active installed base of approximately 31,000 units, as compared to 29,000 units in 2015 and 27,000 units in 2014. A substantial portion of ProCyte Dx analyzer placements continue to be made at veterinary clinics that elect to upgrade from their LaserCyte analyzer to a ProCyte Dx analyzer. In 2016, approximately 50 percent of ProCyte placements were made at competitive accounts. We also continue to place a substantial number of LaserCyte Dx and LaserCyte instruments, both new and recertified, as trade-ups from the VetAutoread analyzer and at new and competitive accounts. As we continue to experience growth in placements of ProCyte Dx analyzers and in sales of related consumables, we expect this growth to be partly offset by a decline in placements of LaserCyte and VetAutoread analyzers and a decrease in the associated recurring revenue stream.
Our SediVue Dx instrument, which we launched in North America early in 2016 and in the U.K. and Australia in the fourth quarter of 2016, is the first and only in-clinic analyzer to provide urine sediment analysis. This instrument and single-use consumable system provides an entirely new automated and highly accurate way to automate the in-house process of examining urine under a microscope. We provide customers with SediVue Dx consumables that are charged upon utilization, which we refer to as pay-per-run, as compared to other instruments where we charge upon shipment of consumables. We reported total revenues of $24.2 million from SediVue Dx instrument and pay-per-run sales during the year ended December 31, 2016.
We seek to enhance the attractiveness and customer loyalty of our SNAP rapid assay tests, by providing the SNAP Pro Mobile Device, which activates SNAP tests, properly times the run, captures, and saves images of the results and, in conjunction with IVLS, records invoice charges in the patient record. Beginning in January of 2017, with our ProRead software, the SNAP Pro Mobile Device will interpret results. These features promote practice efficiency by eliminating manual entry of test results in patient records and also helps ensure that the services are recorded and accurately invoiced. In addition, SNAP Pro Mobile Device results can be shared with pet owners on the SNAP Pro screen or, in conjunction with IVLS, via VetConnect PLUS. We also sell the SNAPshot Dx, which automatically reads certain SNAP test results and, in conjunction with IVLS, records those results in the electronic medical record. We continue to work on enhancing the functionality of our analyzers to read the results of additional tests from our canine and feline family of rapid assay products.
Prior to 2014, the SNAPshot Dx was our primary in-clinic solution for screening thyroid disease, cortisol, bile acids and interpreting SNAP rapid assay tests. Upon the launch of the total thyroxine (“T4”) slide for use with our Catalyst analyzers during 2015, we experienced a decline in SNAPshot Dx placements. We reported revenues of $1.1 million from SNAPshot DX placements during the year ended December 31, 2016, which reflects approximately a $0.4 million decrease in revenue relative to the prior year. We reported revenues of $1.5 million from SNAPshot Dx during the year ended December 31, 2015, which reflects approximately a $1 million decrease in revenue relative to the prior year. We will continue to service the existing SNAPshot Dx install base.
37
Our long-term success in the continuing growth of our CAG recurring diagnostic product and services is dependent upon new customer acquisition, customer loyalty and retention of their recurring revenues, our ability to realize price increases based on our differentiated products and customer utilization of existing and new assays introduced for use on our analyzers. We continuously seek opportunities to enhance the care that veterinary professionals give to their patients and clients through supporting the implementation of real-time care testing work flows, which is performing tests and sharing test results with the client at the time of the patient visit. Our latest generation of chemistry and hematology instruments demonstrates this commitment by offering enhanced ease of use, faster time to results, broader test menu and connectivity to various information technology platforms that enhance the value of the diagnostic information generated by the instruments. In addition, we provide marketing tools and customer support that help drive efficiencies in veterinary practice processes and allow practices to increase the number of clients they see on a daily basis.
With all of our instrument product lines, we seek to differentiate our products from our competitors’ products based on time-to-result, ease-of-use, throughput, breadth of diagnostic menu, flexibility of menu selection, accuracy, reliability, ability to handle compromised samples, analytical capability of software, integration with the IDEXX VetLab Station and VetConnect PLUS, client communications capabilities, education and training, and superior sales and customer service. Our success depends, in part, on our ability to differentiate our products in a way that justifies a premium price.
Recurring Diagnostic Revenue. Revenues from our proprietary IDEXX VetLab consumable products, our SNAP rapid assay test kits, outside reference laboratory and consulting services, and extended maintenance agreements and accessories related to our CAG Diagnostics instruments are considered recurring in nature. For the year ended December 31, 2016, recurring diagnostic revenue, which is both highly durable and profitable, accounts for approximately 72 percent of our consolidated revenue.
Our in-clinic diagnostic solutions, consisting of our IDEXX VetLab consumable products and SNAP rapid assay test kits, provide real-time reference lab quality diagnostic results for a variety of companion animal diseases and health conditions. Our outside reference laboratories provide veterinarians with the benefits of a more comprehensive list of diagnostic tests and access to consultations with board-certified veterinary specialists and pathologists, combined with the benefit of same-day or next-day turnaround times.
We derive substantial revenues and margins from the sale of consumables that are used in IDEXX VetLab instruments and the multi-year consumable revenue stream is significantly more valuable than the placement of the instrument. Our strategy is to increase diagnostic testing within veterinary practices by placing IDEXX VetLab instruments and increasing instrument utilization of consumables. Utilization can increase due to a greater number of patient samples being run or to an increase in the number of tests being run per patient sample. Our strategy is to increase both drivers. To increase utilization, we seek to educate veterinarians about best medical practices that emphasize the importance of chemistry, hematology and urinalysis testing for a variety of diagnostic purposes, as well as by introducing new testing capabilities that were previously not available to veterinarians. Additionally, we have found that veterinarian adoption of VetConnect PLUS drives utilization by spurring testing across all IDEXX diagnostic modalities. In connection with the purchase of instruments, we also offer protocol-based rebate incentives when customers utilize the broad testing functionality of our analyzers.
Our in-clinic diagnostic solutions also include SNAP rapid assay tests that address important medical needs for particular diseases prevalent in the companion animal population. We seek to differentiate these tests from those of other in-clinic test providers and reference laboratory diagnostic service providers based on critically important sensitivity and specificity, as well as overall superior performance and ease of use by providing our customers with combination tests that test a single sample for up to six diseases at once, including the ability to utilize our SNAP Pro mobile device. We further augment our product development and customer service efforts with sales and marketing programs that enhance medical awareness and understanding regarding certain diseases and the importance of diagnostic testing.
38
The expiration of a third party’s U.S. lateral flow patent in early 2015 enabled competitors to launch single use tests that competed with several of our early generation SNAP rapid assay products, including Heartworm RT, FIV/FeLV Combo Test, Feline Triple, Parvo and Giardia. These companies partnered with several of our former national distributors to gain market share by competing primarily on price. In the second half of 2015, we stabilized our market share on these products in part by communicating the significant superiority in test sensitivity for both our Canine and Feline lines over competing tests using the lateral flow platform, and in part with more effective marketing and promotion programs. Our higher sensitivity in the detection of infectious diseases is due in part to our SNAP platform, which is unique in using enzyme-linked immunosorbent assays (“ELISA”) technology. Test accuracy through specificity and sensitivity is a primary factor that customers value with these in-house tests, given the importance of detecting the presence of serious infectious diseases in the practice.
We believe that more than half of all diagnostic testing by U.S. veterinarians is provided by outside reference laboratories such as IDEXX Reference Laboratories. In several markets outside the U.S., in-clinic testing is less prevalent and an even greater percentage of diagnostic testing is done in reference laboratories. We attempt to differentiate our reference laboratory testing services from those of competitive reference laboratories and competitive in-clinic offerings primarily on the basis of a unique and proprietary test menu, technology employed, quality, turnaround time, customer service and tools such as VetConnect PLUS that demonstrate the complementary manner in which our laboratory services work with our in-clinic offerings.
Profitability in our lab business is supported, in part, by our expanding business scale globally. Profit improvements also reflect benefits from price increases and our ability to achieve efficiencies. When possible, we utilize core reference laboratories to service samples from other states or countries, expanding our customer reach without an associated expansion in our reference laboratory footprint. New laboratories that we open typically will operate at a loss until testing volumes achieve sufficient scale. Acquired laboratories frequently operate less profitably than our existing laboratories and acquired laboratories may not achieve the profitability of our existing laboratory network for several years until we complete the implementation of operating improvements and efficiencies. Therefore, in the short term, new and acquired reference laboratories generally will have a negative effect on our operating margin. Recurring reference lab revenue growth is achieved both through increased sales to existing customers and through the acquisition of new customers. We believe the increased number of customer visits by our sales professionals as a result of the implementation of our all-direct sales strategy in the U.S. and the subsequent growth in our field sales organization has led to increased reference laboratory opportunities with customers who already use one of our in-clinic diagnostic modalities. In recent years, recurring reference laboratory diagnostic and consulting revenues have also been increased through reference laboratory acquisitions, customer list acquisitions, the opening of new reference laboratories, including laboratories that are co-located with large practice customers, and as a result of our up-front customer loyalty programs. Our up-front customer loyalty programs associated with customer acquisitions provides incentives to customers in the form of cash payments or IDEXX Points upon entering multi-year agreements to purchase annual minimum amounts of products or services, including reference laboratory services.
Health Monitoring and Biological Materials Testing. We believe the acquisition of the research and diagnostic laboratory business of the College of Veterinary Medicine from the University of Missouri has allowed us to leverage our expertise in veterinary diagnostics and expand our integrated offering of reference laboratory diagnostic and consulting services and in-clinic testing solutions in the adjacent bioresearch market.
Veterinary Software, Services and Diagnostic Imaging Systems. Our portfolio of practice management offerings is designed to serve the full range of customers within the North American, Australian and European markets. Cornerstone, DVMAX, Animana and Neo practice management systems provide superior integrated information solutions, backed by exceptional customer support and education. These practice management systems allow the veterinarian to practice better medicine and achieve the practice’s business objectives, including a quality client experience, staff efficiency and practice profitability. We market Cornerstone, DVMAX and Neo to customers primarily in North America and Australia. We market Animana to customers primarily throughout Europe.
39
Animana and Neo are subscription-based SaaS practice management offerings designed to provide flexible pricing and a durable, recurring revenue stream, while utilizing cloud technology instead of a client server platform. While we continue to develop, sell and support our licensed-based Cornerstone and DVMAX software, we are growing our installed base of subscription-based practice management offerings for new customers of IDEXX practice management systems. In time, we expect that demand for Neo, our subscription-based SaaS practice management offering in North America, will moderate customer growth of license-based Cornerstone placements. We also believe that once established, this subscription-based model will provide higher profitability as compared to the historical license-based placements. Our Cornerstone and DVMAX customer base continues to be an important driver of growth through enhanced diagnostic integrations and high value add-on subscription services, such as Pet Health Network Pro, Petly Plans, and credit card processing, and we continue to make investments to enhance the customer experience of all of our license-based software offerings.
We differentiate our practice management systems through enhanced functionality, ease of use and connectivity with in-clinic IDEXX VetLab instruments and outside reference laboratory test results. Our client communication services create more meaningful pet owner experiences through personalized communication. Pet Health Network Pro online client communication and education service complements the entire IDEXX product offering by educating pet owners and building loyalty through engaging the pet owner before, during and after the visit, thereby building client loyalty and driving more patient visits.
Our diagnostic imaging systems offer a convenient radiographic solution that provides superior image quality and the ability to share images with clients virtually anywhere. IDEXX imaging software enables enhanced diagnostic features and streamlined integration with our other products and services. Our newest digital radiography systems, the ImageVue DR50 Digital Imaging System enables low-dose radiation image capture without sacrificing clear, high-quality diagnostic images, reducing the risk posed by excess radiation exposure for veterinary professionals. Placements of imaging systems are important to the growth of revenue streams that are recurring in nature, including extended maintenance agreements and IDEXX Web PACS, which is our cloud-based SaaS offering for viewing, accessing, storing and sharing multi-modality diagnostic images. We derive relatively higher margins from our subscription-based products. IDEXX Web PACS is integrated with Cornerstone, Neo and IDEXX VetConnect PLUS to provide centralized access to diagnostic imaging results alongside patient diagnostic results from any internet connected device.
Water
Our strategy in the water testing business is to develop, manufacture, market and sell proprietary products that test primarily for the presence of microbial contamination in water matrices, including drinking water supplies, with superior performance, supported by exceptional customer service. Our customers primarily consist of water utilities, government laboratories and private certified laboratories that highly value strong relationships and customer support. We expect that future growth in this business will be significantly dependent on our ability to increase international sales. Growth also will be dependent on our ability to enhance and broaden our product line. Most water microbiological testing is driven by regulation, and, in many countries, a test may not be used for compliance testing unless it has been approved by the applicable regulatory body and integrated into customers’ testing protocols. As a result, we maintain an active regulatory program that involves applying for a growing number of regulatory approvals in a number of countries, primarily in Europe. Further, we seek to receive regulatory approvals from governing agencies as a means to differentiate our products from the competition.
40
Livestock, Poultry and Dairy
We develop, manufacture, market and sell a broad range of tests and perform services for various livestock diseases and conditions, and have active research and development and in-licensing programs in this area. Our strategy is to offer proprietary tests with superior performance characteristics for use in government programs to control or eradicate disease and disease outbreaks and in livestock and poultry producers’ disease and reproductive management programs. Disease outbreaks are episodic and unpredictable, and certain diseases that are prevalent at one time may be substantially contained or eradicated at a later time. In response to outbreaks, testing initiatives may lead to exceptional demand for certain products in certain periods. Conversely, successful eradication programs may result in significantly decreased demand for certain products. In addition, increases in government funding may lead to increased demand for certain products and budgetary constraints may lead to decreased demand for certain products. As result, the performance in certain sectors of this business can fluctuate.
Our strategy in the dairy testing business is to develop, manufacture and sell antibiotic residue and contaminant testing products that satisfy applicable regulatory requirements or dairy processor standards for testing of milk and provide reliable field performance. The manufacture of these testing products leverages the SNAP platform and production assets that also support our rapid assay business, which also leverages the SNAP platform. The dairy SNAP products, incorporate customized reagents for antibiotic and contaminant detection. To successfully increase sales of dairy testing products, we believe that we need to increase penetration in dairy processors and develop product line enhancements and extensions.
The performance of the business is particularly subject to the various risks that are associated with doing business internationally. See “Part I, Item 1A. Risk Factors.”
Other
OPTI Medical. Our strategy in the OPTI Medical business for the human market is to develop, manufacture, and sell electrolyte and blood gas analyzers and related consumable products for the medical point-of-care diagnostics market worldwide, with a focus on small to mid-sized hospitals. We seek to differentiate our products based on ease of use, convenience, international distribution and service and instrument reliability. Similar to our veterinary instruments and consumables strategy, a substantial portion of the revenues from this product line is derived from the sale of consumables for use on the installed base of electrolyte and blood gas analyzers. During the early stage of an instrument’s life cycle, relatively greater revenues are derived from instrument placements, while consumable sales become relatively more significant in later stages as the installed base of instruments increases and instrument placement revenues begin to decline. Our long-term success in this area of our business is dependent upon new customer acquisition, customer retention and increased customer utilization of existing and new assays introduced on these instruments.
Our facility in Roswell, Georgia develops and manufactures the OPTI product lines using the same or similar technology to support the electrolyte needs of the veterinary market. We leverage this facility’s know-how, intellectual property and manufacturing capability to continue to expand the menu and instrument capability of the VetStat and Catalyst platforms for veterinary applications while reducing our cost of consumables by leveraging experience and economies of scale.
During the first half of 2016, management reviewed the OPTI Medical product offerings. As a result of this review, in March 2016 we discontinued certain development activities in the human point-of-care medical diagnostics market that were devoted to a new platform and focused our efforts on supporting our current generation OPTI CCA-TS2 Blood Gas and Electrolyte Analyzer.
The performance of the business is particularly subject to the various risks that are associated with doing business internationally. See “Part I, Item 1A. Risk Factors.”
41
CRITICAL ACCOUNTING POLICIES AND ESTIMATES
The discussion and analysis of our financial condition and results of operations is based upon our consolidated financial statements, which have been prepared in accordance with accounting principles generally accepted in the United States of America (“U.S. GAAP”). The preparation of these financial statements requires us to make estimates and judgments that affect the reported amounts of assets, liabilities, revenues and expenses, and related disclosure of contingent assets and liabilities. We evaluate our estimates on an ongoing basis. We base our estimates on historical experience and on various assumptions that we believe to be reasonable under the circumstances, the results of which form the basis for making judgments about the carrying values of assets and liabilities that are not readily apparent from other sources. Actual results may differ from these estimates. Note 2 to the consolidated financial statements included in this Annual Report on Form 10-K describes the significant accounting policies used in preparation of these consolidated financial statements.
We believe the following critical accounting estimates and assumptions may have a material impact on reported financial condition and operating performance and involve significant levels of judgment to account for highly uncertain matters or are susceptible to significant change.
Revenue Recognition
We recognize revenue when four criteria are met: (i) persuasive evidence of an arrangement exists; (ii) delivery has occurred or services have been rendered; (iii) the sales price is fixed or determinable; and (iv) collectability is reasonably assured. See Note 2(j) to the consolidated financial statements for the year ended December 31, 2016, included in this Annual Report on Form 10-K for additional information about our revenue recognition policy and criteria for recognizing revenue.
Multiple Element Arrangements (“MEAs”). Arrangements to sell products to customers frequently include multiple deliverables. Our most significant MEAs include the sale of one or more of the instruments from the IDEXX VetLab suite of analyzers, diagnostic imaging systems or practice management software, combined with one or more of the following products: extended maintenance agreements (“EMAs”), consumables, rapid assay kits and reference laboratory diagnostic and consulting services. Practice management software is frequently sold with post-contract customer support and implementation services. Delivery of the various products or performance of services within the arrangement may or may not coincide. Delivery of our IDEXX VetLab instruments, diagnostic imaging systems and practice management software generally occurs at the onset of the arrangement. EMAs, consumables, rapid assay kits and reference laboratory diagnostic and consulting services typically are delivered over future periods, generally one to six years. In certain arrangements, revenue recognized is limited to the amount invoiced or received that is not contingent on the delivery of products and services in the future.
We allocate revenue to each element based on the relative selling price and recognize revenue when the elements have standalone value and the four criteria for revenue recognition, as discussed above, have been met for each element. If available, we establish the selling price of each element based on vendor-specific objective evidence (“VSOE”), which represents the price charged for a deliverable when it is sold separately. We use third-party evidence (“TPE”) if VSOE is not available, or best estimate of selling price if neither VSOE nor TPE is available. When these arrangements include a separately-priced EMA, we recognize revenue related to the EMA at the stated contractual price on a straight-line basis over the life of the agreement to the extent the separately stated price is substantive. If there is no stated contractual price for an EMA, or the separately stated price is not substantive, we allocate revenue to each element based on the relative selling price and recognize revenue when the elements have standalone value and the four criteria for revenue recognition, as discussed above, have been met for each element.
42
When arrangements within the scope of software revenue recognition guidance include multiple elements, we allocate revenue to each element based on relative fair value, when VSOE exists for all elements, or by using the residual method when there is VSOE for the undelivered elements but no such evidence for the delivered elements. Under the residual method, the fair value of the undelivered elements is deferred and the residual revenue is allocated to the delivered elements. Revenue is recognized on any delivered elements when the four criteria for revenue recognition have been met for each element. If VSOE does not exist for the undelivered element, all revenue from the arrangement is deferred until the earlier of the point at which such sufficient VSOE does exist or all elements of the arrangement have been delivered. We determine fair value based on amounts charged separately for the delivered and undelivered elements to similar customers in standalone sales of the specific elements.
Certain arrangements with customers include discounts on future sales of products and services. We apply judgment in determining whether future discounts are significant and incremental. When the future discount offered is not considered significant and incremental, we do not account for the discount as an element of the original arrangement. If the future discount is significant and incremental, we recognize that discount as an element of the original arrangement and allocate the discount to the other elements of the arrangement based on relative selling price. To determine whether a discount is significant and incremental, we look to the discount provided in comparison to standalone sales of the same product or service to similar customers, the level of discount provided on other elements in the arrangement and the significance of the discount to the overall arrangement. If the discount in the MEA approximates the discount typically provided in standalone sales, that discount is not considered incremental.
Customer Programs. We record reductions to revenue related to customer marketing and incentive programs, which include end-user rebates and other volume-based incentives. Incentives may be provided in the form of IDEXX Points, credits or cash and are earned by end users upon achieving defined volume purchases or utilization levels or upon entering an agreement to purchase products or services in future periods. The summary of revenue reductions presented below reflects all revenue reductions recorded for the year for each particular program. These amounts are presented on a net basis when applicable, which accounts for any differences between estimates and actual incentives earned for the relevant customer marketing or incentive program. These differences have been insignificant in all quarterly or annual periods. Our most significant customer programs are categorized as follows:
Customer Loyalty Programs. Our customer loyalty programs offer customers the opportunity to earn incentives on a variety of IDEXX products and services as those products and services are purchased and utilized. Revenue reductions related to customer loyalty programs are recorded based on the actual issuance of incentives, incentives earned but not yet issued and estimates of incentives to be earned in the future.
Up-Front Customer Loyalty Programs. Our up-front loyalty programs provide incentives to customers in the form of cash payments or IDEXX Points upon entering multi-year agreements to purchase annual minimum amounts of future products or services. Our transition to an all-direct sales model in the U.S. and the subsequent increase in competitive activity resulted in an increase in the rate of new up-front customer loyalty incentives, predominantly in response to competitive offerings during the fourth quarter of 2014 and in 2015. We saw a slowing in the rate of increase for new up-front customer loyalty incentives beginning in the fourth quarter of 2015 and continuing through 2016.
If a customer breaches its agreement, it is required to refund all or a portion of the up-front cash or IDEXX Points, or make other repayments, remedial actions or both. These incentives are considered to be customer acquisition costs and are capitalized within other current assets and other long-term assets and are subsequently recognized as a reduction to revenue over the term of the customer agreement. If these up-front incentives are subsequently utilized to purchase IDEXX VetLab instruments, diagnostic imaging systems or Cornerstone practice management systems, product revenue and cost is deferred and recognized over the term of the customer agreement as products and services are provided to the customer. We monitor customer purchases over the term of their agreement to assess the realizability of our capitalized customer acquisition costs. For the years ended December 31, 2016, 2015 and 2014, impairments of customer acquisition costs were immaterial.
43
IDEXX Instrument Marketing Programs. Our instrument marketing programs require the customer to enroll at the time of instrument purchase and offer customers the opportunity to earn incentives in future periods based on the volume of the products they purchase and utilize over the term of the program. These arrangements are considered MEAs in accordance with our revenue recognition policy stated above. Revenue reductions related to instrument marketing programs are recorded based on an estimate of customer purchase and utilization levels and the incentive the customer will earn over the term of the program. Our estimates are based on historical experience and the specific terms and conditions of the marketing program, requiring us to apply judgment to estimate future product purchases and utilization. Differences between our estimates and actual incentives earned are accounted for as a change in estimate. These differences were not material for the years ended December 31, 2016, 2015 and 2014. At December 31, 2016, a 5 percent change in our estimate of future customer utilization would increase or reduce revenue by approximately $0.4 million.
Reagent Rental Programs. Our reagent rental programs provide our customers the right to use our instruments in consideration for multi-year agreements to purchase annual minimum amounts of consumables. No instrument revenue is recognized at the time of instrument installation. We recognize a portion of the revenue allocated to the instrument concurrent with the future sale of consumables. We determine the amount of revenue allocated from the consumable to the instrument based on relative selling prices and determine the rate of instrument revenue recognition in proportion to the customer’s minimum volume commitment. The cost of the instrument is capitalized within property and equipment or deferred within other assets, and is charged to cost of product revenue on a straight-line basis over the term of the minimum purchase agreement.
IDEXX Points may be applied against the purchase price of IDEXX products and services or applied to trade receivables due to us. IDEXX Points that have not yet been used by customers are classified as a liability until use or expiration occurs. We estimate the amount of IDEXX Points expected to expire, or breakage, based on historical expirations and we recognize the estimated benefit of breakage in proportion to actual redemptions of IDEXX Points by customers. On November 30 of each year, unused IDEXX Points earned before January 1 of the prior year generally expire and any variance from the breakage estimate is accounted for as a change in estimate. This variance was not material for the years ended December 31, 2016, 2015 and 2014.
Future market conditions and changes in product offerings may cause us to change marketing strategies to increase or decrease customer incentive offerings, possibly resulting in incremental reductions of revenue in future periods as compared to reductions in the current or prior periods. Additionally, certain customer programs require us to estimate, based on historical experience, and apply judgment to predict the number of customers who will actually redeem the incentive. In determining estimated revenue reductions, we utilize data collected directly from end users, which includes the volume of qualifying products purchased and the number of qualifying tests run as reported to us by end users via IDEXX SmartService. Differences between estimated and actual customer participation in programs may impact the amount and timing of revenue recognition.
Following is a summary of revenue reductions, net recorded in connection with our customer programs for the years ended December 31, 2016, 2015 and 2014 (in thousands):
|
|
For the Years Ended December 31, |
|||||||||
|
|
2016 | 2015 | 2014 | |||||||
|
Revenue Reductions Recorded, Net |
||||||||||
|
Customer Loyalty Programs, net (1) |
$ |
18,226 |
$ |
16,742 |
$ |
14,800 | ||||
|
Up-Front Customer Loyalty Programs |
24,595 | 19,972 | 13,089 | |||||||
|
IDEXX Instrument Marketing Programs, net (1) |
37,012 | 31,112 | 24,158 | |||||||
|
Other Customer Programs, net (1) |
417 | 664 | 2,796 | |||||||
|
Total revenue reductions, net |
$ |
80,250 |
$ |
68,490 |
$ |
54,843 | ||||
|
(1) |
Revenue reduction is provided on a net basis, which accounts for any differences between estimates and actual incentives earned. |
44
Accrued customer programs are included within accrued liabilities and other long-term liabilities, depending on the anticipated settlement date, in the consolidated balance sheets included in this Annual Report on Form 10-K. Following is a summary of changes in the accrual for estimated revenue reductions attributable to customer programs and the ending accrued customer programs balance for the years ended December 31, 2016, 2015 and 2014 (in thousands):
|
|
For the Years Ended December 31, |
|||||||||
|
|
2016 | 2015 | 2014 | |||||||
|
|
||||||||||
|
Accrued Customer Programs: |
||||||||||
|
Balance, beginning of the year |
$ |
55,133 |
$ |
48,153 |
$ |
39,345 | ||||
|
Revenue reductions for Customer Loyalty Programs, net (1) |
18,227 | 16,742 | 14,800 | |||||||
|
Up-Front Customer Loyalty Program Awards issued as IDEXX Points |
31,407 | 40,689 | 20,315 | |||||||
|
Revenue reductions for IDEXX Instrument Marketing Programs, net (1) |
37,011 | 31,112 | 24,158 | |||||||
|
Revenue reductions for Other Customer Programs, net (1) |
417 | 664 | 2,796 | |||||||
|
IDEXX Points redeemed and credits issued |
(81,733 |
) |
(81,172 |
) |
(52,035 |
) |
||||
|
Breakage |
(722 |
) |
(230 |
) |
(421 |
) |
||||
|
Exchange impact on balances denominated in foreign currency |
(308 |
) |
(825 |
) |
(805 |
) |
||||
|
Balance, end of year |
$ |
59,432 |
$ |
55,133 |
$ |
48,153 | ||||
|
|
||||||||||
|
(1) |
Revenue reduction is provided on a net basis, which accounts for any differences between estimates and actual incentives earned. |
Inventory Valuation
We write down the carrying value of inventory for estimated obsolescence by an amount equal to the difference between the cost of inventory and the estimated market value when warranted based on assumptions of future demand, market conditions, remaining shelf life or product functionality. If actual market conditions or results of estimated functionality are less favorable than those we estimated, additional inventory write-downs may be required, which would have a negative effect on results of operations.
Valuation of Goodwill and Other Intangible Assets
A significant portion of the purchase price for acquired businesses is generally assigned to intangible assets. Intangible assets other than goodwill are initially valued at fair value. If a quoted price in an active market for the identical asset is not readily available at the measurement date, the fair value of the intangible asset is estimated based on discounted cash flows using market participant assumptions, which are assumptions that are not specific to IDEXX. The selection of appropriate valuation methodologies and the estimation of discounted cash flows require significant assumptions about the timing and amounts of future cash flows, risks, appropriate discount rates, and the useful lives of intangible assets. When material, we utilize independent valuation experts to advise and assist us in determining the fair values of the identified intangible assets acquired in connection with a business acquisition and in determining appropriate amortization methods and periods for those intangible assets. Goodwill is initially valued based on the excess of the purchase price of a business combination over the fair value of acquired net assets recognized and represents the future economic benefits arising from other assets acquired that could not be individually identified and separately recognized.
We assess goodwill for impairment annually, at the reporting unit level, in the fourth quarter and whenever events or circumstances indicate impairment may exist. An impairment charge is recorded for the amount, if any, by which the carrying amount of goodwill exceeds its implied fair value. Our reporting units are the individual product and service categories that comprise our CAG operating segment, our Water and LPD operating segments and goodwill remaining from the restructuring of our pharmaceutical business in the fourth quarter of 2008, referred to herein as the Technology reporting unit. A substantial portion of the goodwill remaining from the pharmaceutical business, included in our “Other Segment”, is associated with products that have been, or that we expect to be, licensed to third parties. Realization of this goodwill is dependent upon the success of those third parties in developing and commercializing products, which will result in our receipt of royalties and other payments.
45
In evaluating goodwill for impairment, we have the option to first assess the qualitative factors to determine whether it is more likely than not that the fair value of the reporting unit is less than its carrying amount as a basis for determining whether it is necessary to perform the two-step goodwill impairment test. The more likely than not threshold is defined as having a likelihood of more than 50 percent. If, after assessing the totality of events or circumstances, we determine that it is more likely than not that the fair value of a reporting unit is less than its carrying amount, we would then perform step one of the two-step impairment test; otherwise, no further impairment test would be required. In contrast, we can opt to bypass the qualitative assessment for any reporting unit in any period and proceed directly to step one of the two-step impairment test. Doing so does not preclude us from performing the qualitative assessment in any subsequent period.
As part of our goodwill testing process, we evaluate factors specific to a reporting unit as well as industry and macroeconomic factors that are reasonably likely to have a material impact on the fair value of a reporting unit. Examples of the factors considered in assessing the fair value of a reporting unit include: the results of the most recent impairment test, the competitive environment, the regulatory environment, anticipated changes in product or labor costs, revenue growth trends, the consistency of operating margins and cash flows and current and long-range financial forecasts. The long-range financial forecasts of the reporting units, which are based upon management’s long-term view of our markets, are used by senior management and the Board of Directors to evaluate operating performance.
In the fourth quarters of 2016 and 2015, we elected to bypass the qualitative approach and instead proceeded directly to step one of the two-step impairment test to assess the fair value of all of our reporting units.
As part of step one of the two-step impairment test, we estimate the fair values of applicable reporting units using an income approach based on discounted forecasted cash flows. We make significant assumptions about the extent and timing of future cash flows, growth rates and discount rates. Model assumptions are based on our projections and best estimates, using appropriate and customary market participant assumptions. In addition, we make certain assumptions in allocating shared assets and liabilities to individual reporting units in determining the carrying value of each reporting unit. As of our fourth quarter assessment, the total aggregate fair value of the reporting units approximated the Company’s market capitalization. Valuation assumptions reflect our projections and best estimates, based on significant assumptions about the extent and timing of future cash flows, growth rates and discount rates.
We maintain approximately $6.5 million of goodwill associated with our remaining pharmaceutical product line, out-licensing arrangements and certain retained drug delivery technologies (collectively “Pharmaceutical Activities”) that we seek to commercialize through arrangements with third parties. Currently, our primary support for the carrying value of this goodwill is royalty revenue associated with the commercialization of certain intellectual property under licensing agreements that expire in 2025. There is no guarantee that we will be able to maintain or increase revenues from our remaining Pharmaceutical Activities. The results of our goodwill impairment test for these Pharmaceutical Activities indicate an excess of estimated fair value over the carrying amount of this reporting unit by approximately $7.6 million and 117 percent of the reporting unit’s carrying value. Excluding these Pharmaceutical Activities, the results of our goodwill impairment test indicate an excess of estimated fair value over the carrying amount for each of our reporting units by a range of approximately $80.0 million to $2.0 billion and 260 percent to 1220 percent of the reporting unit’s carrying value.
While we believe that the assumptions used to determine the estimated fair values of each of our reporting units are reasonable, a change in assumptions underlying these estimates could result in a material negative effect on the estimated fair value of the reporting units. Our fair value estimate assumes the achievement of future financial results contemplated in our forecasted cash flows, and there can be no assurance that we will realize that value. We use forecasts to estimate future cash flows and include an estimate of long-term future growth rates based on our most recent views of the long-term outlooks for our reporting units. Actual results may differ from those assumed in our forecasts. The discount rate is based on a weighted average cost of capital derived from industry peers. Changes in market conditions, interest rates, growth rates, tax rates, costs, pricing or the discount rate would affect the estimated fair values of our reporting units and could result in a goodwill impairment charge in a future period. No goodwill impairments were identified during the years ended December 31, 2016, 2015 or 2014.
46
A prolonged economic downturn in the U.S. or internationally resulting in lower long-term growth rates and reduced long-term profitability may reduce the fair value of our reporting units. Industry specific events or circumstances could have a negative impact on our reporting units and may also reduce the fair value of our reporting units. Should such events occur and it becomes more likely than not that a reporting unit’s fair value has fallen below its carrying value, we will perform an interim goodwill impairment test, in addition to the annual impairment test. Future impairment tests may result in an impairment of goodwill, depending on the outcome of future impairment tests. An impairment of goodwill would be reported as a non-cash charge to earnings.
We assess the realizability of intangible assets whenever events or changes in circumstances indicate that the carrying value may not be recoverable. If an impairment review is triggered, we evaluate the carrying value of intangible assets based on estimated undiscounted future cash flows over the remaining useful life of the primary asset of the asset group and compare that value to the carrying value of the asset group. The cash flows that are used contain our best estimates, using appropriate and customary assumptions and projections at the time. If the net carrying value of an intangible asset exceeds the related estimated undiscounted future cash flows, an impairment to write the intangible asset to its fair value would be reported as a non-cash charge to earnings. If necessary, we would calculate the fair value of an intangible asset using the present value of the estimated future cash flows to be generated by the intangible asset and applying a risk-adjusted discount rate.
During 2016, management reviewed the OPTI Medical product offerings. As a result of this review, we discontinued our product development activities in the human point-of-care medical diagnostics market during and focused our commercial efforts in this market on supporting our latest generation OPTI CCA-TS2 Blood Gas and Electrolyte Analyzer. Management identified unfavorable trends in our OPTI Medical line of business resulting from this change in strategy. Non-cash intangible asset impairments of $2.2 million were recorded within our condensed consolidated statement of operations within general and administration expenses during 2016. The intangibles associated with our OPTI Medical human point-of-care medical diagnostics market are fully written off. Intangible assets impairments during the years ended December 31, 2015 and 2014, were not material.
Our business combinations regularly include contingent consideration arrangements that require additional consideration to be paid based on the achievement of established objectives, most commonly surrounding the retention of customers during the post-combination period. We assess contingent consideration to determine if it is part of the business combination or if it should be accounted for separately from the business combination in the post-combination period. Contingent consideration is recognized at its fair value on the acquisition date. A liability resulting from contingent consideration is remeasured to fair value at each reporting date until the contingency is resolved, with changes in fair value recognized in earnings. Changes in fair value of contingent consideration and differences arising upon settlement were not material during the years ended December 31, 2016, 2015 and 2014. See Note 3 to the consolidated financial statements included in this Annual Report on Form 10-K for additional information regarding contingent consideration arising from business acquisitions.
Share-Based Compensation
Our share-based compensation programs provide for grants of stock options, restricted stock units and deferred stock units, along with the issuance of employee stock purchase rights. The total fair value of future awards may vary significantly from past awards based on a number of factors, including our share-based award practices. Therefore, share-based compensation expense is likely to fluctuate, possibly significantly, from year to year.
47
We use the Black-Scholes-Merton option-pricing model to determine the fair value of options granted. Option-pricing models require the input of highly subjective assumptions, particularly for the expected stock price volatility and the expected term of options. The risk-free interest rate is based on the U.S. Treasury yield for a duration similar to the expected term at the date of grant. We have never paid any cash dividends on our common stock and we have no intention to pay a dividend at this time; therefore, we assume that no dividends will be paid over the expected terms of option awards. We determine the assumptions to be used in the valuation of option grants as of the date of grant. As such, we use different assumptions during the year if we grant options at different dates. Substantially all of our options granted during the years ended December 31, 2016, 2015 and 2014 were granted in the first quarter of each year. The weighted average of each of the valuation assumptions used to determine the fair value of each option grant during each of the previous three years is as follows:
|
|
|
For the Years Ended December 31, |
|||||||
|
|
|
2016 |
|
2015 |
|
2014 | |||
|
|
|
|
|
|
|
|
|
|
|
|
Expected stock price volatility |
|
25 |
% |
|
23 |
% |
|
28 |
% |
|
Expected term, in years (1) |
5.7 | 5.6 | 5.7 | ||||||
|
Risk-free interest rate |
|
1.2 |
% |
|
1.5 |
% |
|
1.5 |
% |
|
(1) |
Options granted have a contractual term of ten years. |
Changes in the subjective input assumptions, particularly for the expected stock price volatility and the expected term of options, can materially affect the fair value estimate. Our expected stock price volatility assumption is based on the historical volatility of our stock over a period similar to the expected term and other relevant factors. Higher estimated volatility increases the fair value of a stock option, while lower estimated volatility has the opposite effect. The total fair value of stock options granted during the year ended December 31, 2016, was $13.3 million. If the weighted average of the stock price volatility assumption was increased or decreased by 1 percent, the total fair value of stock options awarded during the year ended December 31, 2016, would have increased or decreased by approximately $0.4 million and the total expense recognized for the year ended December 31, 2016, for options awarded during the same period would have increased or decreased by less than $0.1 million.
We derive the expected term assumption for stock options based on historical experience and other relevant factors concerning expected behavior with regard to option exercises. The expected term is determined using a consistent method at each grant date. A longer expected term assumption increases the fair value of stock option awards, while a shorter expected term assumption has the opposite effect. If the weighted average of the expected term was increased or decreased by one year, the total fair value of stock options awarded during the year ended December 31, 2016, would have increased or decreased by approximately $1.2 million, and the total expense recognized for the year ended December 31, 2016, for options awarded during 2016 would have increased or decreased by approximately $0.2 million.
Share-based compensation expense is recognized on a straight-line basis over the requisite service period, which ranges from one to five years, depending on the award. Share-based compensation expense is based on the number of awards expected to vest and is, therefore, reduced for an estimate of the number of awards that are expected to be forfeited. The forfeiture estimates are based on historical data and other factors; share-based compensation expense is adjusted annually for actual results. Total share-based compensation expense for the year ended December 31, 2016, was $19.9 million, which is net of a reduction of $3.0 million for actual and estimated forfeitures. Fluctuations in our overall employee turnover rate may result in changes in estimated forfeiture rates and differences between estimated forfeiture rates and actual experience and, therefore could have a significant unanticipated impact on share-based compensation expense.
Modifications of the terms of outstanding awards may result in significant increases or decreases in share-based compensation. There were no material modifications to the terms of outstanding options, restricted stock units or deferred stock units during 2016, 2015 or 2014.
The fair value of stock options, restricted stock units, deferred stock units and employee stock purchase rights issued totaled $27.0 million for the year ended December 31, 2016, $25.6 million for the year ended December 31, 2015, and $24.0 million for the year ended December 31, 2014. The total unrecognized compensation expense, net of estimated forfeitures, for unvested share-based compensation awards outstanding at December 31, 2016, was $38.0 million, which will be recognized over a weighted average period of approximately 1.6 years.
48
Income Taxes
The provision for income taxes is determined using the asset and liability approach of accounting for income taxes. Under this approach, deferred taxes represent the estimated future tax effects of temporary differences between book and tax treatment of assets and liabilities and carryforwards to the extent they are realizable.
On a quarterly basis, we assess our current and projected earnings by jurisdiction to determine whether or not our earnings during the periods when the temporary differences become deductible will be sufficient to realize the related future tax benefits. Should we determine that we would not be able to realize all or part of our net deferred tax asset in a particular jurisdiction in the future, an adjustment to the deferred tax asset would be charged to income in the period such determination was made. A reduction of net income before taxes in each subsidiary equal to 5 percent of revenue, compared to the corresponding reported amounts for the year ended December 31, 2016, would not result in the recognition of material incremental valuation allowances.
For those jurisdictions where tax carryforwards are likely to expire unused or the projected operating results indicate that realization is not more likely than not, a valuation allowance is recorded to offset the deferred tax asset within that jurisdiction. In assessing the need for a valuation allowance, we consider future taxable income and ongoing prudent and feasible tax planning strategies. Alternatively, in the event that we were to determine that we would be able to realize our deferred tax assets in the future in excess of the net recorded amount, a reduction of the valuation allowance would increase income in the period such determination was made. Likewise, should we determine that we would not be able to realize all or part of our net deferred tax asset in the future, a reduction to the deferred tax asset would be charged to income in the period such determination was made.
Our net taxable temporary differences and tax carryforwards are recorded using the enacted tax rates expected to apply to taxable income in the periods in which the deferred tax liability or asset is expected to be settled or realized. Should the expected applicable tax rates change in the future, an adjustment to the net deferred tax liability would be credited or charged, as appropriate, to income in the period such determination was made. For example, an increase of one percentage point in our anticipated U.S. state income tax rate would cause us to decrease our net deferred tax liability balance by $0.3 million. This decrease in the net deferred liability would increase net income in the period that our rate was adjusted. Likewise, a decrease of one percentage point to our anticipated U.S. state income tax rate would have the opposite effect.
We periodically assess our exposures related to our worldwide provision for income taxes and believe that we have appropriately accrued taxes for contingencies. Any reduction of these contingent liabilities or additional assessment would increase or decrease income, respectively, in the period such determination was made.
We consider the majority of the operating earnings of non-U.S. subsidiaries to be indefinitely invested outside the U.S. At December 31, 2016, the cumulative earnings of these subsidiaries were $546.7 million, of which approximately $387.0 million was held in cash and cash equivalents. No provision has been made for the payment of U.S. federal and state or international taxes that may result from future remittances of these undistributed earnings of non-U.S. subsidiaries. Should we repatriate these earnings in the future, we would have to adjust the income tax provision in the period in which the decision to repatriate earnings is made. A determination of the related tax liability that would be paid on these undistributed earnings if repatriated is not practicable for several reasons including the complexity of laws and regulations in the various jurisdictions where we operate, the varying tax treatment of potential repatriation scenarios and the timing of any future repatriation. For the operating earnings not considered to be indefinitely invested outside the U.S. we have accounted for the tax impact on a current basis.
49
We record a liability for uncertain tax positions that do not meet the more likely than not standard as prescribed by the authoritative guidance for income tax accounting. We record tax benefits for only those positions that we believe will more likely than not be sustained. For positions that we believe that it is more likely than not that we will prevail, we record a benefit considering the amounts and probabilities that could be realized upon ultimate settlement. If our judgment as to the likely resolution of the uncertainty changes, if the uncertainty is ultimately settled or if the statute of limitation related to the uncertainty expires, the effects of the change would be recognized in the period in which the change, resolution or expiration occurs. Our net liability for uncertain tax positions was $18.8 million as of December 31, 2016, and $7.4 million as of December 31, 2015, which includes estimated interest expense and penalties. The increase in net liability is primarily related to two uncertain tax positions taken during the year. The first relates to our claiming certain tax deductions under a recent court case, but one that the IRS has vowed to appeal. The second relates to certain changes we made in our transfer pricing policies to better align statutory accounting with business operations. See Note 12 to the consolidated financial statements for the year ended December 31, 2016, included in this Annual Report on Form 10-K for more information.
Future changes in tax law could impact our provision for income taxes, the amount of taxes payable, and our U.S. deferred tax liability balances. Any enacted legislation to reduce the U.S. corporate tax rate would reduce our income tax expense and payments in subsequent periods, but could also have a one-time impact in the period of enactment. Potential one-time impacts could include adjustments to our net U.S. deferred tax liability and increased tax expense resulting from the taxation of operating earnings of non-U.S. subsidiaries that have been indefinitely invested outside the U.S. and for which we have not recorded a U.S. tax liability.
RESULTS OF OPERATIONS AND TRENDS
Effects of Certain Factors on Results of Operations
Distributor Purchasing and Inventories. When selling our products through distributors, changes in distributors’ inventory levels can impact our reported sales, and these changes may be affected by many factors, which may not be directly related to underlying demand for our products by veterinary practices, which are the end users. Therefore, we believe it is important to track sales to end users in the relevant periods by our significant distributors in order to distinguish between the impact of end-user demand and the impact of distributor purchasing dynamics on our reported revenue in those periods. Effective January 1, 2015, we fully transitioned to an all-direct sales strategy in the U.S., however changes in prior year U.S. distributors’ inventory levels impacted 2015 reported growth results. In certain countries internationally, we continue to sell our products through third party distributors. Although we are unable to obtain data for sales to end users from certain less significant non-U.S. third party distributors, we do not believe the impact of changes in these distributors’ inventories had or would have a material impact on our growth rates in the relevant periods. Following our transition to an all direct U.S. distribution approach, we anticipate that changes in distributor inventory levels will have an immaterial impact on our growth in future years.
Where growth rates are affected by changes in end-user demand, we refer to this as the impact of practice-level sales on growth. Where growth rates are affected by distributor purchasing dynamics, we refer to this as the impact of changes in distributors’ inventories on growth. If during the current year, distributors’ inventories grew by less than those inventories grew in the comparable period of the prior year, then changes in distributors’ inventories would have an unfavorable impact on our reported sales growth in the current period. Conversely, if during the current year, distributors’ inventories grew by more than those inventories grew in the comparable period of the prior year, then changes in distributors’ inventories would have a favorable impact on our reported sales growth in the current period.
Effective January 1, 2015, we fully transitioned to an all-direct sales strategy in the U.S. and did not renew our existing contracts with our former key U.S. distribution partners after their expiration at the end of 2014. Under this approach, we take orders, ship product, invoice and receive payment for all rapid assay test kits and VetLab consumables in the U.S., aligning with our direct model for instruments, reference laboratory services, and other CAG products and services.
50
We incurred transition costs to implement this all-direct sales strategy in the U.S., including approximately $5 million in incremental expense during the year ended December 31, 2014, resulting from the ramp up of sales and operating resources. We also incurred $9.5 million in non-recurring expenses during the year ended December 31, 2014, associated with project management and other one-time costs required to implement this new strategy. Further, we incurred one-time transitional impacts related to the drawdown of distributor inventory in the fourth quarter of 2014, resulting in a reduction in revenue and operating profit of $25 million and $21 million, respectively, in such period.
During the three months ended December 31, 2014, we began recognizing revenue on rapid assay kits and VetLab consumables upon delivery to end users in the U.S., instead of at distribution. We also began to capture additional revenue that was previously earned by our distribution partners, net of other changes related to this all-direct strategy, such as free next-day shipping and a new returns policy for expired product. We refer to this net additional revenue as distributor margin capture. This net incremental revenue allowed us to expand our sales, marketing and customer support resources, which we expect will drive future revenue growth, and to build out our distribution capability. We expect investments in these areas will scale over time based on our expected future growth rates and provide accretive benefits to operating profit. Also as a result of the transition to an all-direct sales strategy in the U.S., we incurred additional working capital demands, including inventory costs previously borne by our distributors, and incremental accounts receivable resulting from a longer elapsed time to collect our receivables.
Currency Impact. For the year ended December 31, 2016, approximately 21 percent of our consolidated revenue was derived from products manufactured or sourced in U.S. dollars and sold internationally in local currencies, as compared to 20 percent for the year ended December 31, 2015, and 22 percent for the year ended December 31, 2014. Strengthening of the rate of exchange for the U.S. dollar relative to other currencies has a negative impact on our revenues derived in currencies other than the U.S. dollar and on profits of products manufactured or purchased in U.S. dollars and sold internationally, and a weakening of the U.S. dollar has the opposite effect. Similarly, to the extent that the U.S. dollar is stronger in current or future periods relative to the exchange rates in effect in the corresponding prior periods, our growth rate will be negatively affected. The impact of foreign currency denominated operating expenses and foreign currency denominated supply contracts partly offsets this exposure. Additionally, our designated hedges of intercompany inventory purchases and sales help delay the impact of certain exchange rate fluctuations on non-U.S. denominated revenues. See “Part II, Item 7A. Quantitative and Qualitative Disclosure About Market Risks” included in this Annual Report on Form 10-K for additional information regarding currency impact. Our future income tax expense could also be affected by changes in the mix of earnings, including as a result of changes in the rate of exchange for the U.S. dollar relative to currencies in countries with differing statutory tax rates. See “Part I, Item 1A. Risk Factors.” included in this Annual Report on Form 10-K for additional information regarding tax impacts.
The impact on revenue resulting from changes in foreign currency exchange rates is not a measure defined by accounting principles generally accepted in the United States of America (“U.S. GAAP”), otherwise referred to herein as a non-GAAP financial measure. As exchange rates are an important factor in understanding period-to-period comparisons, we believe the presentation of results normalized for changes in currency in addition to reported results helps improve investors’ ability to understand our operating results and evaluate our performance in comparison to prior periods. We calculate the impact on revenue resulting from changes in foreign currency exchange rates by applying the difference between the weighted average exchange rates during the current year period and the comparable previous year period to foreign currency denominated revenues for the prior year period.
Effects of Economic Conditions. Demand for our products and services is vulnerable to changes in the economic environment, including slow economic growth, high unemployment and credit availability. Negative or cautious consumer sentiment can lead to reduced or delayed consumer spending, resulting in a decreased number of patient visits to veterinary clinics. Unfavorable economic conditions can impact sales of instruments, diagnostic imaging and practice management systems, which are larger capital purchases for veterinarians. Additionally, economic turmoil can cause our customers to remain sensitive to the pricing of our products and services. In the U.S., we monitor patient visits and clinic revenue data provided by a subset of our CAG customers. Although this data is a limited sample and susceptible to short-term impacts such as weather, which may affect the number of patient visits in a given period, we believe that this data provides a fair and meaningful long-term representation of the trend in patient visit activity in the U.S., providing us insight regarding demand for our products and services.
51
Economic conditions can also affect the purchasing decisions of our Water and LPD business customers. Water testing volumes may be susceptible to declines in discretionary testing for existing home and commercial sales and in mandated testing as a result of decreases in home and commercial construction. Testing volumes may also be impacted by severe weather conditions such as drought. In addition, fiscal difficulties can also reduce government funding for water and herd health screening services.
We believe that the diversity of our products and services and the geographic diversity of our markets partially mitigate the potential effects of the economic environment and negative consumer sentiment on our revenue growth rates.
Effects of Patent Expiration. Although we have several patents and licenses of patents and technologies from third parties that expired during 2016 and are expected to expire during 2017, the expiration of these patents or licenses, individually or in the aggregate, is not expected to have a material effect on our financial position or future operations due to a range of factors as described in Item 1. “Patents and Licenses”.
Twelve Months Ended December 31, 2016, Compared to Twelve Months Ended December 31, 2015
Revenue
The following revenue analysis and discussion focuses on organic revenue growth. Organic revenue growth is a non-GAAP financial measure and represents the percentage change in revenue during the twelve months ended December 31, 2016, as compared to the same period for the prior year, net of the effect of changes in foreign currency exchange rates, acquisitions and divestitures. Organic revenue growth should be considered in addition to, and not as a replacement for or as a superior measure to, revenues reported in accordance with U.S. GAAP, and may not be comparable to similarly titled measures reported by other companies. Management believes that reporting organic revenue growth provides useful information to investors by facilitating easier comparisons of our revenue performance with prior and future periods and to the performance of our peers. We exclude the effect of changes in foreign currency exchange rates because changes in foreign currency exchange rates are not under management’s control, are subject to volatility and can obscure underlying business trends. We exclude the effect of acquisitions and divestitures because the nature, size and number of these transactions can vary dramatically from period to period, require or generate cash as an inherent consequence of the transaction, and therefore can also obscure underlying business and operating trends.
The percentage changes in revenue from foreign currency exchange rates and acquisitions are non-GAAP financial measures. See the subsection above titled “Effects of Certain Factors on Results of Operations – Currency Impact” for a description of the calculation of the percentage change in revenue resulting from changes in foreign currency exchange rates. The percentage change in revenue resulting from acquisitions represents incremental revenues attributable to acquisitions that have occurred since the beginning of the prior year period.
52
Total Company. The following table presents revenue by operating segment by U.S. markets and non-U.S., or international markets:
|
|
For the Year |
For the Year |
|||||||||||||||||||
|
|
Ended |
Ended |
Percentage |
Percentage |
Organic |
||||||||||||||||
|
Net Revenue |
December 31, |
December 31, |
Dollar |
Percentage |
Change from |
Change from |
Revenue |
||||||||||||||
|
(dollars in thousands) |
2016 | 2015 |
Change |
Change |
Currency |
Acquisitions |
Growth |
||||||||||||||
|
|
|||||||||||||||||||||
|
CAG |
$ |
1,522,689 |
$ |
1,356,287 |
$ |
166,402 | 12.3% | (0.6%) | 0.3% | 12.6% | |||||||||||
|
United States |
1,017,065 | 912,822 | 104,243 | 11.4% |
- |
0.2% | 11.2% | ||||||||||||||
|
International |
505,624 | 443,465 | 62,159 | 14.0% | (2.0%) | 0.5% | 15.5% | ||||||||||||||
|
|
|||||||||||||||||||||
|
Water |
103,579 | 96,884 | 6,695 | 6.9% | (1.8%) |
- |
8.7% | ||||||||||||||
|
United States |
52,852 | 48,677 | 4,175 | 8.6% |
- |
- |
8.6% | ||||||||||||||
|
International |
50,727 | 48,207 | 2,520 | 5.2% | (3.7%) |
- |
8.9% | ||||||||||||||
|
|
|||||||||||||||||||||
|
LPD |
126,491 | 127,143 | (652) | (0.5%) | (1.6%) |
- |
1.1% | ||||||||||||||
|
United States |
13,253 | 14,041 | (788) | (5.6%) |
- |
- |
(5.6%) | ||||||||||||||
|
International |
113,238 | 113,102 | 136 | 0.1% | (1.8%) |
- |
1.9% | ||||||||||||||
|
|
|||||||||||||||||||||
|
Other |
22,664 | 21,578 | 1,086 | 5.0% | (0.1%) |
- |
5.1% | ||||||||||||||
|
|
|||||||||||||||||||||
|
Total Company |
$ |
1,775,423 |
$ |
1,601,892 |
$ |
173,531 | 10.8% | (0.8%) | 0.2% | 11.4% | |||||||||||
|
United States |
1,089,595 | 980,321 | 109,274 | 11.1% | 0.1% | 0.2% | 10.8% | ||||||||||||||
|
International |
685,828 | 621,571 | 64,257 | 10.3% | (2.1%) | 0.4% | 12.0% | ||||||||||||||
U.S. and international organic revenue growth both reflect very strong volume gains in CAG Diagnostics recurring revenue, supported by our differentiated diagnostic technologies that are driving increased volumes from new and existing customers in our reference laboratory business, and continued strong growth in CAG Diagnostics capital instrument placements that are driving IDEXX VetLab consumable volume growth. International organic growth across Europe, Asia Pacific and Latin America outpaced U.S. growth, reflecting the aforementioned CAG Diagnostics recurring volume driven growth, continued growth of Colilert testing products in our Water business and LPD emerging market growth, offset by declines in LPD bovine disease eradication testing in Europe. To a lesser extent, U.S. and international LPD organic growth also reflects pressure on our dairy testing business due to a decline in worldwide milk prices.
Companion Animal Group.
The following table presents revenue by product and service category for CAG:
|
|
For the Year |
For the Year |
|||||||||||||||||||
|
|
Ended |
Ended |
Percentage |
Percentage |
Organic |
||||||||||||||||
|
Net Revenue |
December 31, |
December 31, |
Dollar |
Percentage |
Change from |
Change from |
Revenue |
||||||||||||||
|
(dollars in thousands) |
2016 | 2015 |
Change |
Change |
Currency |
Acquisitions |
Growth |
||||||||||||||
|
|
|||||||||||||||||||||
|
CAG Diagnostics recurring revenue: |
$ |
1,281,262 |
$ |
1,147,026 |
$ |
134,236 | 11.7% | (0.7%) | 0.4% | 12.0% | |||||||||||
|
IDEXX VetLab consumables |
451,456 | 396,526 | 54,930 | 13.9% | (0.8%) |
- |
14.7% | ||||||||||||||
|
Rapid assay products |
189,122 | 182,670 | 6,452 | 3.5% |
- |
- |
3.5% | ||||||||||||||
|
Reference laboratory diagnostic and consulting services |
581,067 | 512,155 | 68,912 | 13.5% | (0.9%) | 0.8% | 13.6% | ||||||||||||||
|
CAG Diagnostics service and accessories |
59,617 | 55,675 | 3,942 | 7.1% | (0.3%) |
- |
7.4% | ||||||||||||||
|
CAG Diagnostics capital - instruments |
121,191 | 98,502 | 22,689 | 23.0% | (0.7%) |
- |
23.7% | ||||||||||||||
|
Veterinary software, services and diagnostic imaging systems |
120,236 | 110,759 | 9,477 | 8.6% | (0.2%) |
- |
8.8% | ||||||||||||||
|
Net CAG revenue |
$ |
1,522,689 |
$ |
1,356,287 |
$ |
166,402 | 12.3% | (0.6%) | 0.3% | 12.6% | |||||||||||
53
The increase in CAG Diagnostics recurring revenue was due primarily to higher sales of our IDEXX VetLab consumables and reference laboratory diagnostic and consulting services resulting from increased volumes and, to a lesser extent, higher realized prices.
IDEXX VetLab consumables revenue growth was due primarily to higher sales volumes in the U.S., Europe and the Asia-Pacific region from our Catalyst consumables and, to a lesser extent, ProCyte DX consumables, resulting from growth in testing by existing customers, the acquisition of new customers and an expanded menu of available tests. These favorable impacts were partly offset by lower consumables volumes from our VetTest chemistry instrument due to customer upgrades from our previous generation VetTest to our Catalyst analyzers. IDEXX VetLab consumables revenue also benefited from higher average unit sales prices.
The increase in rapid assay revenue resulted from higher average unit price and sales volumes of SNAP 4Dx and higher sales volumes of single analyte SNAP products. These favorable factors were partly offset by the unfavorable impact of lower average unit sales prices in the U.S. for certain earlier generation rapid assay products.
The increase in reference laboratory diagnostic and consulting services revenue was due primarily to the impact of higher testing volumes throughout our worldwide network of laboratories, most prominently in the U.S., resulting from increased testing from existing customers and the net acquisition of new customers, supported by our differentiated diagnostic technologies, such as IDEXX SDMA. Also, revenue increased, to a lesser extent, from higher average unit sales prices due to price increases. Testing volumes benefited slightly from favorable weather trends experienced during the first quarter of 2016, as compared to the same period of the prior year.
CAG Diagnostic services and accessories revenue growth was primarily a result of the increase in our active installed base of instruments.
The increase in CAG Diagnostics capital instruments revenue resulted from our newly launched SediVue Dx analyzer, which contributed approximately 23 percent to reported and organic instrument revenue growth, and higher ProCyte Dx revenues, partly offset by lower Catalyst revenues resulting from a shift in placements from our Catalyst Dx analyzer to our lower priced Catalyst One analyzer and the prior year benefit of recognizing previously deferred revenues associated with pre-orders of our Catalyst One analyzer in the U.S. in 2014.
The increase in veterinary software, services and diagnostic imaging systems revenue was due primarily to increasing diagnostic imaging systems revenue, higher veterinary subscription service revenue, including increases in our Pet Health Network Pro subscriber base and higher support revenue resulting from an increase in our active installed base of diagnostic imaging and practice management systems. Revenues from diagnostic imaging systems were higher due to the timing of revenue recognized from fewer deferred revenue placements under up-front customer loyalty programs, as compared to the same period in the prior year, and the recognition of previously deferred revenues. These favorable factors were partially offset by fewer licensed-based Cornerstone placements as we evolve to a subscription-based model for new practice management customer acquisitions, as well as lower average unit sale prices on diagnostic imaging system placements.
Water. The increase in Water revenue, as compared to the same period in the prior year, was attributable to all regions in which we operate, most notably from strong performance in North America, Europe and the Asia-Pacific region. Higher revenues resulted primarily from increased sales volumes and price increases of our Colilert test products and related accessories used in coliform and E. coli testing, placements of our Quanti-Tray Sealer PLUS instrument, which we launched in June 2015, several large project orders during the first half of 2016, and to a lesser extent, from higher sales volumes of our products designed to detect cryptosporidium related to an outbreak in the United Kingdom beginning in mid-2015 through the first half of 2016. Testing volumes also benefited slightly from favorable weather trends experienced during the first quarter of 2016, as compared to the same period of the prior year.
Livestock, Poultry and Dairy. The increase in LPD organic revenue resulted from strong performance in emerging markets, most notably resulting from higher sales volumes of swine, poultry and bovine pregnancy products and services in various regions. This increase was partially offset by a decrease in sales volumes of bovine testing products within Western Europe in large part due to the success of certain disease eradication programs in the region, as well as pressure on our dairy testing business due to a decline in worldwide milk prices.
54
Other. The increase in Other revenue was due primarily to royalty revenue associated with the commercialization of certain intellectual property related to our former pharmaceutical product line, partially offset by lower sales volumes of our OPTI Medical blood gas analyzers and related consumables.
Gross Profit
Total Company. The following table presents gross profit and gross profit percentages by operating segment:
|
|
For the Year |
For the Year |
|||||||||||||||||
|
|
Ended |
Ended |
|||||||||||||||||
|
Gross Profit |
December 31, |
Percent of |
December 31, |
Percent of |
Dollar |
Percentage |
|||||||||||||
|
(dollars in thousands) |
2016 |
Revenue |
2015 |
Revenue |
Change |
Change |
|||||||||||||
|
|
|||||||||||||||||||
|
CAG |
$ |
820,322 | 53.9% |
$ |
729,303 | 53.8% |
$ |
91,019 | 12.5% | ||||||||||
|
Water |
71,878 | 69.4% | 68,953 | 71.2% | 2,925 | 4.2% | |||||||||||||
|
LPD |
73,801 | 58.3% | 79,987 | 62.9% | (6,186) | (7.7%) | |||||||||||||
|
Other |
11,561 | 51.0% | 10,281 | 47.6% | 1,280 | 12.5% | |||||||||||||
|
Unallocated amounts |
(2,126) |
N/A |
1,746 |
N/A |
(3,872) | 221.8% | |||||||||||||
|
Total Company |
$ |
975,436 | 54.9% |
$ |
890,270 | 55.6% |
$ |
85,166 | 9.6% | ||||||||||
Gross profit increased due to higher sales volumes, partly offset by a 70 basis point reduction in the gross profit percentage during the year ended December 31, 2016, as compared to the same period of the prior year. Excluding currency impacts of approximately 118 basis points, gross margins increased moderately, supported by improvements in our CAG business.
Companion Animal Group. Gross profit for CAG increased due to higher sales volumes, along with a 10 basis point increase in the gross profit percentage during the year ended December 31, 2016, as compared to the same period in the prior year. The unfavorable impact of currency during the year ended December 31, 2016, as compared to the same period of the prior year, reduced the gross profit percentage by approximately 90 basis points, resulting primarily from lower hedging gains. Excluding currency impacts, gross margins increased moderately, supported by the net benefit of price increases for our reference laboratory diagnostic services and IDEXX VetLab consumables and profitability improvements from higher relative revenue of our expanded subscription service offerings, and within our worldwide network of reference laboratories.
Water. Gross profit for Water increased due to higher sales volumes, offset by a 180 basis point reduction in the gross profit percentage. The unfavorable impact of currency during the year ended December 31, 2016, as compared to the same period in the prior year, reduced the gross profit percentage by approximately 210 basis points, resulting from lower hedging gains and changes in foreign currency exchange rates. Excluding currency impacts, the gross profit percentage increased slightly due to the net benefit of price increases on our Colilert testing products and related accessories.
Livestock, Poultry and Dairy. Gross profit for LPD decreased due to a reduction in the gross profit percentage of 460 basis points for the year ended December 31, 2016, as compared to the same period of the prior year. The decrease in the gross profit percentage resulted primarily from approximately 360 basis points of unfavorable currency impact, primarily due to lower relative hedging gains during the year ended December 31, 2016, as compared to the same period of the prior year. Additionally, higher overall manufacturing costs, which were partially offset by the expiration of royalties on certain of our swine testing products, resulted in an overall lower gross profit, as compared to the same period in the prior year.
Other. Gross profit for Other increased due to higher sales and an increase in the gross profit percentage of 340 basis points for the year ended December 31, 2016, as compared to the same period in the prior year. The increase in the gross profit percentage resulted primarily from higher relative royalty revenue associated with the commercialization of certain intellectual property related to our former pharmaceutical product line, partly offset by an increase in overall OPTI Medical product costs.
55
Unallocated Amounts. Gross profit for Unallocated Amounts decreased due primarily to higher personnel-related costs. We estimate certain personnel-related costs and allocate the budgeted expenses to the operating segments. This allocation differs from the actual expense and consequently yields a difference that is reported under the caption “Unallocated Amounts.” The increase in personnel-related costs was due primarily to higher self-insured healthcare costs and higher than budgeted employee incentives reported within Unallocated Amounts during the year ended December 31, 2016, as compared to the same period of the prior year.
Operating Expenses and Operating Income
Total Company. The following tables present operating expenses and operating income by operating segment:
|
|
For the Year |
For the Year |
|||||||||||||||||
|
|
Ended |
Ended |
|||||||||||||||||
|
Operating Expenses |
December 31, |
Percent of |
December 31, |
Percent of |
Dollar |
Percentage |
|||||||||||||
|
(dollars in thousands) |
2016 |
Revenue |
2015 |
Revenue |
Change |
Change |
|||||||||||||
|
|
|||||||||||||||||||
|
CAG |
$ |
518,980 | 34.1% |
$ |
495,984 | 36.6% |
$ |
22,996 | 4.6% | ||||||||||
|
Water |
26,176 | 25.3% | 24,201 | 25.0% | 1,975 | 8.2% | |||||||||||||
|
LPD |
54,887 | 43.4% | 52,830 | 41.6% | 2,057 | 3.9% | |||||||||||||
|
Other |
10,677 | 47.1% | 10,418 | 48.3% | 259 | 2.5% | |||||||||||||
|
Unallocated amounts |
14,477 |
N/A |
6,925 |
N/A |
7,552 | 109.1% | |||||||||||||
|
Total Company |
$ |
625,197 | 35.2% |
$ |
590,358 | 36.9% |
$ |
34,839 | 5.9% | ||||||||||
|
|
For the Year |
For the Year |
|||||||||||||||||
|
|
Ended |
Ended |
|||||||||||||||||
|
Operating Income |
December 31, |
Percent of |
December 31, |
Percent of |
Dollar |
Percentage |
|||||||||||||
|
(dollars in thousands) |
2016 |
Revenue |
2015 |
Revenue |
Change |
Change |
|||||||||||||
|
|
|||||||||||||||||||
|
CAG |
$ |
301,342 | 19.8% |
$ |
233,319 | 17.2% |
$ |
68,023 | 29.2% | ||||||||||
|
Water |
45,702 | 44.1% | 44,752 | 46.2% | 950 | 2.1% | |||||||||||||
|
LPD |
18,914 | 15.0% | 27,157 | 21.4% | (8,243) | (30.4%) | |||||||||||||
|
Other |
884 | 3.9% | (137) | (0.6%) | 1,021 | (745.3%) | |||||||||||||
|
Unallocated amounts |
(16,603) |
N/A |
(5,179) |
N/A |
(11,424) | (220.6%) | |||||||||||||
|
Total Company |
$ |
350,239 | 19.7% |
$ |
299,912 | 18.7% |
$ |
50,327 | 16.8% | ||||||||||
During the year ended December 31, 2015, we recorded an $8.2 million impairment charge related to internally-developed software not yet placed into service within Unallocated Amounts as a result of a strategic shift to refocus our development efforts within our information management business. For the year ended December 31, 2015, adjusted operating income, which is total Company operating income adjusted for the aforementioned software impairment charge was approximately $308.1 million and 19.2 percent of revenue. Adjusted operating income increased by $42.1 million or 13.7 percent for the year ended December 31, 2016, as compared to the same period in the prior year. Adjusted operating income is a non-GAAP financial measure and should be considered in addition to, and not as a replacement for or as a superior measure to, operating income reported in accordance with U.S. GAAP. Management believes that reporting adjusted operating income provides useful information to investors by facilitating easier comparisons of our operating income performance with prior and future periods and to the performance of our peers.
Companion Animal Group. The following table presents CAG operating expenses by functional area:
|
|
For the Year |
For the Year |
|||||||||||||||||
|
|
Ended |
Ended |
|||||||||||||||||
|
Operating Expenses |
December 31, |
Percent of |
December 31, |
Percent of |
Dollar |
Percentage |
|||||||||||||
|
(dollars in thousands) |
2016 |
Revenue |
2015 |
Revenue |
Change |
Change |
|||||||||||||
|
|
|||||||||||||||||||
|
Sales and marketing |
$ |
277,377 | 18.2% |
$ |
263,907 | 19.5% |
$ |
13,470 | 5.1% | ||||||||||
|
General and administrative |
168,637 | 11.1% | 159,851 | 11.8% | 8,786 | 5.5% | |||||||||||||
|
Research and development |
72,966 | 4.8% | 72,226 | 5.3% | 740 | 1.0% | |||||||||||||
|
Total operating expenses |
$ |
518,980 | 34.1% |
$ |
495,984 | 36.6% |
$ |
22,996 | 4.6% | ||||||||||
56
The increase in sales and marketing expense was due primarily to increased personnel-related costs, including investments in our global commercial infrastructure and sales performance incentives, partly offset by the favorable impact of changes in foreign currency exchange rates. The increase in general and administrative expense resulted primarily from information technology investments, including ongoing depreciation and maintenance associated with prior year projects, and higher personnel-related costs. These increases were partly offset by the favorable impact of changes in foreign currency exchange rates. Research and development expense for the year ended December 31, 2016, was generally consistent with the same period of the prior year.
Water. The following table presents Water operating expenses by functional area:
|
|
For the Year |
For the Year |
|||||||||||||||||
|
|
Ended |
Ended |
|||||||||||||||||
|
Operating Expenses |
December 31, |
Percent of |
December 31, |
Percent of |
Dollar |
Percentage |
|||||||||||||
|
(dollars in thousands) |
2016 |
Revenue |
2015 |
Revenue |
Change |
Change |
|||||||||||||
|
|
|||||||||||||||||||
|
Sales and marketing |
$ |
13,201 | 12.7% |
$ |
12,204 | 12.6% |
$ |
997 | 8.2% | ||||||||||
|
General and administrative |
10,426 | 10.1% | 9,058 | 9.3% | 1,368 | 15.1% | |||||||||||||
|
Research and development |
2,549 | 2.5% | 2,939 | 3.0% | (390) | (13.3%) | |||||||||||||
|
Total operating expenses |
$ |
26,176 | 25.3% |
$ |
24,201 | 25.0% |
$ |
1,975 | 8.2% | ||||||||||
The increase in sales and marketing expense was due primarily to higher personnel-related costs and increased advertising and marketing materials. The increase in general and administrative expense was due primarily to higher personnel-related costs. The decrease in research and development expense was a result of lower product development costs during the year ended December 31, 2016, as compared to the same period in the prior year.
Livestock, Poultry and Dairy. The following table presents LPD operating expenses by functional area:
|
|
For the Year |
For the Year |
|||||||||||||||||
|
|
Ended |
Ended |
|||||||||||||||||
|
Operating Expenses |
December 31, |
Percent of |
December 31, |
Percent of |
Dollar |
Percentage |
|||||||||||||
|
(dollars in thousands) |
2016 |
Revenue |
2015 |
Revenue |
Change |
Change |
|||||||||||||
|
|
|||||||||||||||||||
|
Sales and marketing |
$ |
22,723 | 18.0% |
$ |
22,307 | 17.5% |
$ |
416 | 1.9% | ||||||||||
|
General and administrative |
20,193 | 16.0% | 18,655 | 14.7% | 1,538 | 8.2% | |||||||||||||
|
Research and development |
11,971 | 9.5% | 11,868 | 9.3% | 103 | 0.9% | |||||||||||||
|
Total operating expenses |
$ |
54,887 | 43.4% |
$ |
52,830 | 41.6% |
$ |
2,057 | 3.9% | ||||||||||
The increase in sales and marketing expense for the year ended December 31, 2016, was due to higher commercial infrastructure investments within emerging markets. The increase in general and administrative expense resulted primarily from higher investments in emerging markets including Brazil. The increase in research and development expense resulted primarily from higher external product development and material costs. All the increases above were partially offset by the favorable impact of changes in foreign currency exchange rates.
Other. Operating expenses for Other, which totaled $10.7 million for the year ended December 31, 2016, increased $0.3 million, as compared to the same period of the prior year, due primarily to intangible impairments within our OPTI Medical business, partly offset by lower amortization expense on the aforementioned intangible assets and a reduction in personnel-related costs.
During the first half of 2016, management reviewed the OPTI Medical product offerings. As a result of this review, we discontinued our product development activities in the human point-of-care medical diagnostics market during March 2016 and focused our commercial efforts in this market on supporting our latest generation OPTI CCA-TS2 Blood Gas and Electrolyte Analyzer. Management identified unfavorable trends in our OPTI Medical line of business resulting from this change in strategy. We revised our forecasts downward, causing us to assess the realizability of the related tangible and intangible assets and determined the expected future cash flows were less than the carrying value of the OPTI Medical asset group. Non-cash intangible asset impairments of $2.2 million were recorded during the year ended December 31, 2016.
Unallocated Amounts. Operating expenses that are not allocated to our operating segments increased $7.6 million to $14.5 million for the year ended December 31, 2016, due primarily to higher personnel-related costs as compared to budget, reflecting increased employee incentives and higher self-insured health claim expenses, as well as certain foreign exchange losses on monetary assets due to strengthening of the U.S. dollar. This compares to prior
57
period cost control initiatives that resulted in lower than budgeted costs. We estimate certain personnel-related costs and allocate these budgeted expenses to the operating segments. This allocation differs from actual expense and consequently yields a difference that is reported under the caption “Unallocated Amounts.” Partially offsetting these increases was the aforementioned $8.2 million impairment charge recorded in 2015, related to internally-developed software not yet placed into service as a result of a strategic shift to refocus our development efforts within our veterinary software and services business.
Interest Income and Interest Expense
Interest income was $3.7 million for the year ended December 31, 2016, as compared to $2.5 million for the same period in the prior year. The increase in interest income was due primarily to a larger relative portfolio of marketable securities during the year ended December 31, 2016, and, to a lesser extent, higher interest rates, as compared to the same period of the prior year.
Interest expense was $32.0 million for the year ended December 31, 2016, as compared to $29.2 million for the same period of the prior year. The increase in interest expense resulted from higher relative interest incurred in 2016 as a result of approximately $250 million in senior notes that we issued and sold through private placements during the first half of 2015, for which fixed interest rates range from 1.785 percent to 3.72 percent. Additionally, the increase in interest expense was due to higher relative interest rates on our Credit Facility. See Note 11 to the consolidated financial statements included in this Annual Report on Form 10-K for additional information regarding our senior notes and Credit Facility.
Provision for Income Taxes
Our effective income tax rate was 31.0 percent for the year ended December 31, 2016, as compared to 29.7 percent for the year ended December 31, 2015. The increase in our effective tax rate for the year ended December 31, 2016, as compared to the year ended December 31, 2015, was primarily related to a change in earnings mix in 2016, with relatively higher earnings subject to domestic tax rates as opposed to lower international tax rates including the impact of foreign currency exchange rates.
Twelve Months Ended December 31, 2015, Compared to Twelve Months Ended December 31, 2014
Revenue
The following revenue analysis and discussion focuses on organic revenue growth. Organic revenue growth is a non-GAAP financial measure and represents the percentage change in revenue during the year ended December 31, 2015, as compared to the same period in 2014, net of the effect of changes in foreign currency exchange rates, acquisitions and divestitures. Organic revenue growth should be considered in addition to, and not as a replacement for or as a superior measure to, revenues reported in accordance with U.S. GAAP, and may not be comparable to similarly titled measures reported by other companies. Management believes that reporting organic revenue growth provides useful information to investors by facilitating easier comparisons of our revenue performance with prior and future periods and to the performance of our peers. We exclude the effect of changes in foreign currency exchange rates because changes in foreign currency exchange rates are not under management’s control, are subject to volatility and can obscure underlying business trends. We exclude the effect of acquisitions and divestitures because the nature, size and number of these transactions can vary dramatically from period to period, require or generate cash as an inherent consequence of the transaction, and therefore can also obscure underlying business and operating trends.
The percentage changes in revenue from foreign currency exchange rates and acquisitions are non-GAAP financial measures. See the subsection above titled “Effects of Certain Factors on Results of Operations – Currency Impact” for a description of the calculation of the percentage change in revenue resulting from changes in foreign currency exchange rates. The percentage change in revenue resulting from acquisitions represents incremental revenues attributable to acquisitions that have occurred since the beginning of the prior year period.
58
Total Company. The following table presents revenue by operating segment:
|
|
For the Year |
For the Year |
|||||||||||||||||||
|
|
Ended |
Ended |
Percentage |
Percentage |
Organic |
||||||||||||||||
|
Net Revenue |
December 31, |
December 31, |
Dollar |
Percentage |
Change from |
Change from |
Revenue |
||||||||||||||
|
(dollars in thousands) |
2015 | 2014 |
Change |
Change |
Currency |
Acquisitions |
Growth |
||||||||||||||
|
|
|||||||||||||||||||||
|
CAG |
$ |
1,356,287 |
$ |
1,223,064 |
$ |
133,223 | 10.9% | (5.6%) | 0.8% | 15.7% | |||||||||||
|
United States |
912,822 | 782,032 | 130,790 | 16.7% |
- |
0.2% | 16.5% | ||||||||||||||
|
International |
443,465 | 441,032 | 2,433 | 0.6% | (15.4%) | 1.8% | 14.2% | ||||||||||||||
|
|
|||||||||||||||||||||
|
Water |
96,884 | 94,725 | 2,159 | 2.3% | (5.5%) |
- |
7.8% | ||||||||||||||
|
United States |
48,677 | 45,551 | 3,126 | 6.9% |
- |
- |
6.9% | ||||||||||||||
|
International |
48,207 | 49,174 | (967) | (2.0%) | (10.8%) |
- |
8.8% | ||||||||||||||
|
|
|||||||||||||||||||||
|
LPD |
127,143 | 141,179 | (14,036) | (9.9%) | (12.0%) |
- |
2.1% | ||||||||||||||
|
United States |
14,041 | 13,291 | 750 | 5.6% |
- |
- |
5.6% | ||||||||||||||
|
International |
113,102 | 127,888 | (14,786) | (11.6%) | (13.3%) |
- |
1.7% | ||||||||||||||
|
|
|||||||||||||||||||||
|
Other |
21,578 | 26,839 | (5,261) | (19.6%) | (0.8%) |
- |
(18.8%) | ||||||||||||||
|
|
|||||||||||||||||||||
|
Total Company |
$ |
1,601,892 |
$ |
1,485,807 |
$ |
116,085 | 7.8% | (6.2%) | 0.6% | 13.4% | |||||||||||
|
United States |
980,321 | 848,925 | 131,396 | 15.5% |
- |
0.3% | 15.2% | ||||||||||||||
|
International |
621,571 | 636,882 | (15,311) | (2.4%) | (14.1%) | 1.2% | 10.5% | ||||||||||||||
We transitioned to an all-direct sales strategy in the U.S. during the fourth quarter of 2014, resulting in a drawdown of distributors’ inventory levels which reduced both reported CAG and total Company reported revenues by $25 million. The impact of the 2014 changes in distributors’ inventory levels increased 2015 reported CAG revenue growth by 2 percent, reported CAG U.S. revenue growth by 3 percent, total Company revenue growth by 2 percent and total U.S. revenue growth by 3 percent.
U.S. and international organic revenue growth both reflect strong volume gains in CAG Diagnostics recurring revenue, supported volume gains from new and existing customers in our reference laboratory business and continued growth in CAG Diagnostics capital instrument placements that are driving IDEXX VetLab consumable volume growth. International organic growth in Europe and Asia Pacific markets and, to a lesser extent, Latin America, reflects the aforementioned CAG Diagnostics recurring volume driven growth, continued growth of Colilert testing products in our Water business and LPD growth in bovine, poultry and swine testing, offset by declines in LPD herd health screening in the Asia-Pacific region. Changes in distributors’ inventory levels increased reported international revenue growth by less than 1 percent.
Companion Animal Group.
The following table presents revenue by product and service category for CAG:
|
|
For the Year |
For the Year |
|||||||||||||||||||
|
|
Ended |
Ended |
Percentage |
Percentage |
Organic |
||||||||||||||||
|
Net Revenue |
December 31, |
December 31, |
Dollar |
Percentage |
Change from |
Change from |
Revenue |
||||||||||||||
|
(dollars in thousands) |
2015 | 2014 |
Change |
Change |
Currency |
Acquisitions |
Growth |
||||||||||||||
|
|
|||||||||||||||||||||
|
CAG Diagnostics recurring revenue: |
$ |
1,147,026 |
$ |
1,039,252 |
$ |
107,774 | 10.4% | (5.8%) | 0.6% | 15.6% | |||||||||||
|
IDEXX VetLab consumables |
396,526 | 341,407 | 55,119 | 16.1% | (7.1%) |
- |
23.2% | ||||||||||||||
|
Rapid assay products |
182,670 | 165,647 | 17,023 | 10.3% | (3.0%) |
- |
13.3% | ||||||||||||||
|
Reference laboratory diagnostic and consulting services |
512,155 | 479,192 | 32,963 | 6.9% | (5.8%) | 1.3% | 11.4% | ||||||||||||||
|
CAG Diagnostics service and accessories |
55,675 | 53,006 | 2,669 | 5.0% | (5.9%) |
- |
10.9% | ||||||||||||||
|
CAG Diagnostics capital instruments |
98,502 | 79,993 | 18,509 | 23.1% | (10.4%) |
- |
33.5% | ||||||||||||||
|
Veterinary software, services and diagnostic imaging systems |
110,759 | 103,819 | 6,940 | 6.7% | (0.9%) | 2.6% | 5.0% | ||||||||||||||
|
Net CAG revenue |
$ |
1,356,287 |
$ |
1,223,064 |
$ |
133,223 | 10.9% | (5.6%) | 0.8% | 15.7% | |||||||||||
59
The increase in CAG Diagnostics recurring revenue was due primarily to higher sales of our VetLab consumables and our reference laboratory diagnostic services resulting from both increased volumes as well as higher realized prices from distributor margin capture relating to our transition to an all-direct sales strategy in the U.S. The impact of the 2014 drawdown of distributors’ inventory levels increased reported CAG Diagnostics recurring revenue growth by 3 percent.
IDEXX VetLab consumables revenue growth was due primarily to higher sales volumes resulting from growth in testing from existing customers and an expanded menu of available tests, including our new T4 test. Additionally, we benefitted from higher average unit sales prices, due primarily to distributor margin capture relating to our transition to an all-direct sales strategy in the U.S. The impact of the 2014 drawdown of distributors’ inventory levels increased reported consumables revenue growth by 5 percent.
The increase in rapid assay revenue was due primarily to impacts related to our transition to an all-direct sales strategy in the U.S., including higher average unit sales prices resulting from distributor margin capture and the impact of the drawdown of inventory held by distributors during the fourth quarter of 2014, which increased 2015 reported revenue growth by 8 percent. To a lesser extent, we also benefitted from higher canine SNAP 4Dx Plus sales volumes. These favorable factors were partly offset by the impact of competitive losses on certain earlier generation rapid assay products in the U.S in the first half of 2015.
The increase in reference laboratory diagnostic and consulting services revenue was due primarily to the impact of higher testing volumes throughout our worldwide network of laboratories, most prominently in the U.S., resulting from increased testing from existing customers and the net acquisition of new customers. Additionally, the increase in revenue was the result of higher average unit sales prices due to price increases.
CAG Diagnostics service and accessories revenue growth was primarily a result of the increase in our active installed base of instruments. CAG Diagnostics service and accessories revenue also benefited from higher average unit sales prices, resulting primarily from distributor margin capture relating to our transition to an all-direct sales strategy in the U.S.
The increase in CAG Diagnostics capital instruments revenue was driven by sales of our Catalyst One analyzer, resulting primarily from instrument placements in Europe and the Asia-Pacific region and the recognition of previously deferred revenue associated with 2014 U.S. preorders for our Catalyst One analyzer. Additionally, we benefitted from increased ProCyte Dx instrument placements, most notably in the U.S. These favorable factors were partly offset by lower average unit sales prices realized on our instrument placements.
The increase in veterinary software, services and diagnostic imaging systems revenue was due primarily to higher support revenue resulting from an increase in our active installed base of diagnostic imaging and practice management systems, and higher revenues from other customer information management services and an increasing Pet Health Network Pro subscriber base. These favorable factors were partly offset by fewer Cornerstone placements and the unfavorable impact of increased diagnostic imaging system placements under up-front customer loyalty programs for which the consideration and related revenue is deferred and recognized over future periods, which resulted in an overall decrease in diagnostic imaging system sales. During the third quarter of 2015, we launched IDEXX Neo practice management software, a SaaS practice management system in North America. Under this delivery model, we provide hosted software in the cloud on a subscription basis.
Water. The increase in Water revenue was distributed across all major regions and resulted primarily from higher sales volumes of our Colilert and related accessories used in our coliform and E. coli testing, placements of our Quanti-Tray Sealer PLUS instrument, which we launched in June 2015, and increased sales of our products designed to detect cryptosporidium.
Livestock, Poultry and Dairy. The increase in LPD organic revenue resulted primarily from higher sales volumes of certain bovine tests, poultry and swine tests, most prominently in the Asia-Pacific region and Europe and, to a lesser degree, in the U.S. and Latin America. These favorable factors were partly offset by a reduction in herd health screening in the Asia-Pacific region.
60
Other. The decrease in Other revenue was due primarily to lower sales volumes of our pharmaceutical product line, lower sales volumes of our OPTI Medical blood gas analyzers, most prominently in the Asia-Pacific region, and lower average unit sales prices on related OPTI Medical consumables.
Gross Profit
Total Company. The following table presents gross profit and gross profit percentages by operating segment:
|
|
For the Year |
For the Year |
|||||||||||||||||
|
|
Ended |
Ended |
|||||||||||||||||
|
Gross Profit |
December 31, |
Percent of |
December 31, |
Percent of |
Dollar |
Percentage |
|||||||||||||
|
(dollars in thousands) |
2015 |
Revenue |
2014 |
Revenue |
Change |
Change |
|||||||||||||
|
|
|||||||||||||||||||
|
CAG |
$ |
729,303 | 53.8% |
$ |
652,195 | 53.3% |
$ |
77,108 | 11.8% | ||||||||||
|
Water |
68,953 | 71.2% | 62,576 | 66.1% | 6,377 | 10.2% | |||||||||||||
|
LPD |
79,987 | 62.9% | 85,058 | 60.2% | (5,071) | (6.0%) | |||||||||||||
|
Other |
10,281 | 47.6% | 14,414 | 53.7% | (4,133) | (28.7%) | |||||||||||||
|
Unallocated amounts |
1,746 |
N/A |
1,873 |
N/A |
(127) | (6.8%) | |||||||||||||
|
Total Company |
$ |
890,270 | 55.6% |
$ |
816,116 | 54.9% |
$ |
74,154 | 9.1% | ||||||||||
Gross profit increased due to higher sales volumes, due in part to the 2014 drawdown of distributors’ inventory levels, and an increase in the gross profit percentage to 56 percent from 55 percent. The increase in the gross profit percentage resulted from the net benefit of higher CAG average unit prices, primarily resulting from distributor margin capture, net of related freight and distribution expenses relating to our transition within the U.S. to an all-direct sales strategy for our rapid assay test kits and VetLab consumables, and the positive net effect of currency. The positive net effect of currency resulted from higher relative hedging gains during 2015 as compared to 2014, which more than offset the unfavorable impact from changes in foreign currency exchange rates. These overall favorable factors were partly offset by an unfavorable product mix, resulting primarily from higher relative instrument revenues which yield lower relative margins during 2015 as compared to 2014.
Companion Animal Group. Gross profit for CAG increased due to higher sales volumes, due in part to the 2014 drawdown of distributors’ inventory levels. The gross profit percentage of 54 percent was 50 basis points higher than 2014 due to the net benefit of higher average unit prices, primarily resulting from distributor margin capture, net of related freight and distribution expenses relating to our transition within the U.S. to an all-direct sales strategy for our rapid assay test kits and VetLab consumables and the positive net effect of currency of approximately 20 basis points. The positive net effect of currency resulted from higher relative hedging gains during 2015 as compared to 2014, which more than offset the unfavorable impact from changes in foreign currency exchange rates. These increases were partially offset by the impact of unfavorable product mix, resulting primarily from higher relative instrument revenues which yield lower relative margins.
Water. Gross profit for Water increased due primarily to an increase in the gross profit percentage from 66 percent to 71 percent and higher sales volumes. The gross profit percentage was favorably impacted by approximately 120 basis points of foreign currency exchanges during the year ended December 31, 2015. The positive net effect of currency resulted from higher relative hedging gains during 2015 as compared to 2014, which more than offset the unfavorable impact from changes in foreign currency exchange rates. Additionally, the increase in the gross profit percentage resulted from the expiration of certain royalties on December 31, 2014. These overall favorable factors were partly offset by a less favorable product mix, due primarily to higher relative instrument and accessories sales which yield lower relative margins.
Livestock, Poultry and Dairy. Gross profit for LPD decreased due to lower sales volumes and a decrease in the gross profit percentage from 63 percent to 60 percent. The gross profit percentage was favorably impacted by approximately 20 basis points of foreign currency exchanges during the year ended December 31, 2015. The positive net effect of currency resulted from higher relative hedging gains during 2015 as compared to 2014, which more than offset the unfavorable impact from changes in foreign currency exchange rates. The decrease in the gross profit percentage reflects lower volume efficiencies resulting from a decrease in our Asia-Pacific region livestock testing services revenue and current year unfavorability from the absence of the one-time decrease in royalty expense which occurred during the first quarter of 2014, resulting from a settlement with a licensor of certain patents.
61
Other. Gross profit for Other decreased due to lower sales and a decrease in the gross profit percentage from 54 percent to 48 percent. The decrease in the gross profit percentage was due primarily to our OPTI Medical business, including lower average unit sales prices on consumables used by our blood gas analyzers and, to a lesser extent, higher overall manufacturing costs and the unfavorable impact from changes in foreign currency exchange rates. Additionally, the Other gross profit percentage declined due to an unfavorable product mix resulting from lower relative sales of our pharmaceutical product line.
Unallocated Amounts. Gross profit for Unallocated Amounts related to budget-to-actual differences was consistent with the prior period. We estimate certain personnel-related costs and allocate the budgeted expenses to the operating segments. This allocation differs from the actual expense and consequently yields a difference that is reported under the caption “Unallocated Amounts.”
Operating Expenses and Operating Income
Total Company. The following tables present operating expenses and operating income by operating segment:
|
|
For the Year |
For the Year |
|||||||||||||||||
|
|
Ended |
Ended |
|||||||||||||||||
|
Operating Expenses |
December 31, |
Percent of |
December 31, |
Percent of |
Dollar |
Percentage |
|||||||||||||
|
(dollars in thousands) |
2015 |
Revenue |
2014 |
Revenue |
Change |
Change |
|||||||||||||
|
|
|||||||||||||||||||
|
CAG |
$ |
495,984 | 36.6% |
$ |
451,661 | 36.9% |
$ |
44,323 | 9.8% | ||||||||||
|
Water |
24,201 | 25.0% | 23,662 | 25.0% | 539 | 2.3% | |||||||||||||
|
LPD |
52,830 | 41.6% | 55,731 | 39.5% | (2,901) | (5.2%) | |||||||||||||
|
Other |
10,418 | 48.3% | 11,757 | 43.8% | (1,339) | (11.4%) | |||||||||||||
|
Unallocated amounts |
6,925 |
N/A |
13,050 |
N/A |
(6,125) | (46.9%) | |||||||||||||
|
Total Company |
$ |
590,358 | 36.9% |
$ |
555,861 | 37.4% |
$ |
34,497 | 6.2% | ||||||||||
|
|
For the Year |
For the Year |
|||||||||||||||||
|
|
Ended |
Ended |
|||||||||||||||||
|
Operating Income |
December 31, |
Percent of |
December 31, |
Percent of |
Dollar |
Percentage |
|||||||||||||
|
(dollars in thousands) |
2015 |
Revenue |
2014 |
Revenue |
Change |
Change |
|||||||||||||
|
|
|||||||||||||||||||
|
CAG |
$ |
233,319 | 17.2% |
$ |
200,534 | 16.4% |
$ |
32,785 | 16.3% | ||||||||||
|
Water |
44,752 | 46.2% | 38,914 | 41.1% | 5,838 | 15.0% | |||||||||||||
|
LPD |
27,157 | 21.4% | 29,327 | 20.8% | (2,170) | (7.4%) | |||||||||||||
|
Other |
(137) | (0.6%) | 2,657 | 9.9% | (2,794) | (105.2%) | |||||||||||||
|
Unallocated amounts |
(5,179) |
N/A |
(11,177) |
N/A |
5,998 | 53.7% | |||||||||||||
|
Total Company |
$ |
299,912 | 18.7% |
$ |
260,255 | 17.5% |
$ |
39,657 | 15.2% | ||||||||||
During the year ended December 31, 2015, we recorded an $8.2 million impairment charge related to internally-developed software not yet placed into service within Unallocated Amounts as a result of a strategic shift to refocus our development efforts within our information management business. During the year ended December 31, 2014, the transition to an all-direct sales strategy in the U.S. within our CAG segment reduced operating profit by $35.3 million. Our all-direct transition impacts consisted of a one-time reduction in operating profit related to the drawdown of inventory held by our U.S. distributors, which reduced operating income by $20.8 million, $5.0 million in incremental expenses related to the ramp up of sales and operating resources and approximately $9.5 million of non-recurring expenses during the year ended December 31, 2014.
For the year ended December 31, 2015, adjusted operating income, which is total Company operating income adjusted for the aforementioned software impairment charge, was approximately $308.1 million and 19.2 percent of revenue, which represents an increase in adjusted operating income of $12.6 million and 4.3 percent, as compared to the year ended December 31, 2014, which is adjusted for the aforementioned all-direct sales strategy transition impacts. Adjusted operating income is a non-GAAP financial measure and should be considered in addition to, and not as a replacement for or as a superior measure to, operating income reported in accordance with U.S. GAAP. Management believes that reporting adjusted operating income provides useful information to investors by facilitating easier comparisons of our operating income performance with prior and future periods and to the performance of our peers.
62
See the subsection above titled “Effects of Certain Factors on Results of Operations – Distributor Purchasing and Inventories” for details regarding transitional costs related to moving to an all-direct sales strategy for VetLab consumables and rapid assay products and services within our CAG segment in the U.S.
Companion Animal Group. The following table presents CAG operating expenses by functional area:
|
|
For the Year |
For the Year |
|||||||||||||||||
|
|
Ended |
Ended |
|||||||||||||||||
|
Operating Expenses |
December 31, |
Percent of |
December 31, |
Percent of |
Dollar |
Percentage |
|||||||||||||
|
(dollars in thousands) |
2015 |
Revenue |
2014 |
Revenue |
Change |
Change |
|||||||||||||
|
|
|||||||||||||||||||
|
Sales and marketing |
$ |
263,907 | 19.5% |
$ |
244,190 | 20.0% |
$ |
19,717 | 8.1% | ||||||||||
|
General and administrative |
159,851 | 11.8% | 137,192 | 11.2% | 22,659 | 16.5% | |||||||||||||
|
Research and development |
72,226 | 5.3% | 70,279 | 5.5% | 1,947 | 2.8% | |||||||||||||
|
Total operating expenses |
$ |
495,984 | 36.6% |
$ |
451,661 | 36.9% |
$ |
44,323 | 9.8% | ||||||||||
The increase in sales and marketing expense was due primarily to increased personnel-related costs, resulting primarily from our transition to an all-direct sales strategy in the U.S. as well as increases in global commercial resources, and incremental information technology costs to support the all-direct sales strategy. These unfavorable factors were partly offset by the favorable impact from changes in foreign currency exchange rates and the absence of $9.5 million in non-recurring transition costs to implement this all-direct sales strategy. The increase in general and administrative expense resulted primarily from higher personnel-related costs and, to a lesser extent, incremental credit card fees associated with our transition to an all-direct sales strategy in the U.S. partly offset by the favorable impact from changes in foreign currency exchange rates. The increase in research and development expense resulted primarily from higher personnel-related costs, partly offset by lower external development and materials costs.
Water. The following table presents Water operating expenses by functional area:
|
|
For the Year |
For the Year |
|||||||||||||||||
|
|
Ended |
Ended |
|||||||||||||||||
|
Operating Expenses |
December 31, |
Percent of |
December 31, |
Percent of |
Dollar |
Percentage |
|||||||||||||
|
(dollars in thousands) |
2015 |
Revenue |
2014 |
Revenue |
Change |
Change |
|||||||||||||
|
|
|||||||||||||||||||
|
Sales and marketing |
$ |
12,204 | 12.6% |
$ |
11,494 | 12.1% |
$ |
710 | 6.2% | ||||||||||
|
General and administrative |
9,058 | 9.3% | 9,226 | 9.7% | (168) | (1.8%) | |||||||||||||
|
Research and development |
2,939 | 3.0% | 2,942 | 3.1% | (3) | (0.1%) | |||||||||||||
|
Total operating expenses |
$ |
24,201 | 25.0% |
$ |
23,662 | 25.0% |
$ |
539 | 2.3% | ||||||||||
The increase in sales and marketing expense was due primarily to higher personnel-related costs and increased spending on promotional activities, partly offset by the favorable impact of changes in foreign currency exchange rates. General and administrative expense for the year ended December 31, 2015 was generally consistent with 2014 as the favorable impact from changes in foreign currency exchange rates was almost entirely offset by increased personnel-related costs. Research and development expense was also generally consistent with 2014.
Livestock, Poultry and Dairy. The following table presents LPD operating expenses by functional area:
|
|
For the Year |
For the Year |
|||||||||||||||||
|
|
Ended |
Ended |
|||||||||||||||||
|
Operating Expenses |
December 31, |
Percent of |
December 31, |
Percent of |
Dollar |
Percentage |
|||||||||||||
|
(dollars in thousands) |
2015 |
Revenue |
2014 |
Revenue |
Change |
Change |
|||||||||||||
|
|
|||||||||||||||||||
|
Sales and marketing |
$ |
22,307 | 17.5% |
$ |
25,367 | 18.0% |
$ |
(3,060) | (12.1%) | ||||||||||
|
General and administrative |
18,655 | 14.7% | 17,354 | 12.3% | 1,301 | 7.5% | |||||||||||||
|
Research and development |
11,868 | 9.3% | 13,010 | 9.2% | (1,142) | (8.8%) | |||||||||||||
|
Total operating expenses |
$ |
52,830 | 41.6% |
$ |
55,731 | 39.5% |
$ |
(2,901) | (5.2%) | ||||||||||
The decrease in sales and marketing expense was due primarily to the favorable impact from changes in foreign currency exchange rates. The increase in general and administrative expense resulted from higher personnel-related costs, partly offset by the favorable impact from changes in foreign currency exchange rates. The decrease in research and development expense was due primarily to lower personnel-related costs and the favorable impact from changes in foreign currency exchange rates.
63
Other. Operating expenses for Other, which totaled $10.4 million for the year ended December 31, 2015, decreased $1.3 million as compared to 2014, due primarily to a reduction in OPTI Medical spending for external product development and the favorable impact of changes in foreign currency exchange rates, partly offset by higher personnel-related costs.
Unallocated Amounts. Operating expenses that are not allocated to our operating segments decreased by $6.1 million to $6.9 million for the year ended December 31, 2015, due primarily to budget-to-actual differences in personnel-related costs due to cost control initiatives, as well as the absence of certain foreign currency losses on monetary assets, partly offset by the impairment of internal-use software recorded during 2015. We estimate certain personnel-related costs and allocate these budgeted expenses to the operating segments. This allocation differs from actual expense and consequently yields a difference that is reported under the caption “Unallocated Amounts.”
Interest Income and Interest Expense
Interest income was $2.5 million for the year ended December 31, 2015, as compared to $1.7 million for the year ended December 31, 2014. The increase in interest income was due primarily to higher yields from our portfolio of marketable securities that we purchased during 2015.
Interest expense was $29.2 million for the year ended December 31, 2015, as compared to $15.4 million for 2014. The increase in interest expense was due primarily to approximately $450 million in senior notes that we issued and sold through private placements between July 2014 and June 2015, for which fixed interest rates range from 1.785 percent to 3.76 percent. See Note 11 to the consolidated financial statements included in this Annual Report on Form 10-K for additional information regarding our senior notes. In addition, increased interest expense resulted from the impact of higher average borrowings outstanding on our revolving Credit Facility.
Provision for Income Taxes
Our effective income tax rate was 29.7 percent for the year ended December 31, 2015 and 26.2 percent for the year ended December 31, 2014. The increase in our effective income tax rate for the year ended December 31, 2015, as compared to the year ended December 31, 2014, was related to lower relative earnings subject to international tax rates that are lower than domestic tax rates, including the impact of foreign currency exchange rates, as well as a non-recurring benefit recognized during the period ended December 31, 2014 related to the deferral of intercompany profits that were included in tax provisions prior to 2014 in error, which is not material to prior interim or annual periods.
On December 18, 2015 the Protecting Americans from Tax Hikes Act of 2015 was passed (2015 PATH Act). The 2015 PATH Act provided a retroactive and permanent extension of the U.S. research and development (“R&D”) tax credit. As a result, we recorded the entire 2015 tax benefit during the three months ended December 31, 2015. As the R&D tax credit was available for both the years ended December 31, 2015 and 2014, it did not have a significant impact on changes in our full-year effective tax rate.
RECENT ACCOUNTING PRONOUNCEMENTS
A discussion of recent accounting pronouncements is included in Note 2 to the consolidated financial statements for the year ended December 31, 2016 included in this Annual Report on Form 10-K.
64
LIQUIDITY AND CAPITAL RESOURCES
We fund the capital needs of our business through cash on hand, funds generated from operations, and amounts available on our $850 million five-year unsecured revolving credit facility under an amended and restated credit agreement that we executed in December 2015 (the “Credit Facility”). In addition, we issued $150 million of senior notes in February 2015 and €88.9 million of euro-denominated senior notes in June 2015. During the twelve months ended December 31, 2015, we purchased marketable debt securities using a portion of our cash balances. At December 31, 2016 we had $391.8 million of cash, cash equivalents and marketable securities, as compared to $342.6 million on December 31, 2015, and $322.5 million on December 31, 2014. Working capital, including our Credit Facility, totaled negative $89.0 million at December 31, 2016, as compared to negative $35.1 million at December 31, 2015, and negative $61.5 million at December 31, 2014. Additionally, at December 31, 2016, we had remaining borrowing availability of $238 million under our $850 million Credit Facility. We believe that, if necessary, we could obtain additional borrowings at similar rates to our existing borrowings to fund our growth objectives. We further believe that current cash and cash equivalents, our portfolio of short-duration marketable securities, funds generated from operations, and committed borrowing availability will be sufficient to fund our operations, capital purchase requirements, and anticipated growth needs for the next twelve months. We believe that these resources, coupled with our ability, as needed, to obtain additional financing on favorable terms will also be sufficient for the foreseeable future to fund our business as currently conducted.
We consider the majority of the operating earnings of certain of our non-U.S. subsidiaries to be indefinitely invested outside the U.S. No provision has been made for the payment of U.S. federal and state or international taxes that may result from future remittances of these undistributed earnings of our non-U.S. subsidiaries. Changes to this position could have adverse tax consequences. A determination of the related tax liability that would be paid on these undistributed earnings if repatriated is not practicable for several reasons including the complexity of laws and regulations in the various jurisdictions where we operate, the varying tax treatment of potential repatriation scenarios and the timing of any future repatriation. We manage our worldwide cash requirements considering available funds among all of our subsidiaries. Our foreign cash and marketable securities are generally available without restrictions to fund ordinary business operations outside the U.S.
The following table presents cash, cash equivalents and marketable securities held domestically and by our foreign subsidiaries:
|
Cash, cash equivalents and marketable securities |
For the Years Ended December 31, |
||||||||
|
(dollars in millions) |
2016 | 2015 | 2014 | ||||||
|
|
|||||||||
|
U.S. |
$ |
4.8 |
$ |
1.4 |
$ |
1.1 | |||
|
Foreign |
387.0 | 341.2 | 321.4 | ||||||
|
Total |
$ |
391.8 | 342.6 | 322.5 | |||||
|
|
|||||||||
|
Total cash, cash equivalents and marketable securities held in U.S. dollars |
$ |
285.8 |
$ |
239.2 |
$ |
211.1 | |||
|
|
|||||||||
|
Percentage of total cash, cash equivalents and marketable securities held in U.S. dollars |
72.9% | 69.8% | 65.5% | ||||||
|
|
|||||||||
These foreign held amounts are subject to material repatriation tax effects. We held marketable securities with effective maturities of two years or less that had an average AA- credit rating as of December 31, 2016.
65
The following table presents marketable securities at fair value for the years ended December 31, 2016 and 2015:
|
|
For the Year |
For the Year |
||||||||||
|
|
Ended |
Ended |
||||||||||
|
Marketable securities |
December 31, |
Percent of |
December 31, |
Percent of |
||||||||
|
(dollars in thousands) |
2016 |
Total |
2015 |
Total |
||||||||
|
|
||||||||||||
|
Corporate bonds |
$ |
130,771 | 55.2% |
$ |
177,613 | 83.2% | ||||||
|
Certificates of deposit |
40,400 | 17.1% | 3,500 | 1.6% | ||||||||
|
U.S. government bonds |
12,231 | 5.2% | 12,871 | 6.0% | ||||||||
|
Agency bonds |
4,604 | 1.9% | 12,065 | 5.6% | ||||||||
|
Asset backed securities |
27,315 | 11.5% |
- |
0.0% | ||||||||
|
Commercial paper |
20,228 | 8.5% | 3,491 | 1.6% | ||||||||
|
All other |
1,400 | 0.6% | 4,051 | 1.9% | ||||||||
|
Total marketable securities |
$ |
236,949 |
$ |
213,591 | ||||||||
We did not have any marketable securities in 2014.
Of the $154.9 million of cash and cash equivalents held as of December 31, 2016, 76 percent was held as bank deposits, 22 percent was invested in money market funds restricted to U.S. government and agency securities, and the remainder consisted of commercial paper and other securities with original maturities of less than ninety days. Of the $129.0 million of cash and cash equivalents held as of December 31, 2015, 85 percent was held as bank deposits, 6 percent was invested in money market funds restricted to U.S. government and agency securities, 6 percent was invested in money market funds invested in highly liquid investment-grade fixed-income securities and the remainder consisted of commercial paper and agency bonds with original maturities of less than ninety days.
Should we require more capital in the U.S. than is generated by our operations domestically, for example to fund significant discretionary activities, we could elect to repatriate future earnings from foreign jurisdictions or raise capital in the U.S. through debt or equity issuances. These alternatives could result in higher effective tax rates or increased interest expense and other dilution of our earnings. We have borrowed funds domestically and continue to have the ability to borrow funds domestically at reasonable interest rates.
The following table presents additional key information concerning working capital:
|
|
For the Three Months Ended |
||||||||||||||
|
|
December 31, |
September 30, |
June 30, |
March 31, |
December 31, |
||||||||||
|
|
2016 | 2016 | 2016 | 2016 | 2015 | ||||||||||
|
|
|||||||||||||||
|
Days sales outstanding (1) |
42.1 | 42.4 | 41.5 | 43.7 | 43.3 | ||||||||||
|
Inventory turns (2) |
2.0 | 1.8 | 1.7 | 1.6 | 1.5 | ||||||||||
(1) Days sales outstanding represents the average of the accounts receivable balances at the beginning and end of each quarter divided by revenue for that quarter, the result of which is then multiplied by 91.25 days.
(2) Inventory turns represent inventory-related cost of product revenue for the 12 months preceding each quarter-end divided by the inventory balance at the end of the quarter.
Sources and Uses of Cash
The following table presents cash provided (used):
|
|
For the Years Ended December 31, |
|||||||||
|
(dollars in thousands) |
2016 | 2015 | 2014 | |||||||
|
|
||||||||||
|
Net cash provided by operating activities |
$ |
334,571 |
$ |
216,364 |
$ |
235,846 | ||||
|
Net cash used by investing activities |
(90,786) | (308,406) | (80,413) | |||||||
|
Net cash used by financing activities |
(217,824) | (95,552) | (103,438) | |||||||
|
Net effect of changes in exchange rates on cash |
(54) | (5,948) | (8,517) | |||||||
|
Net increase in cash and cash equivalents |
$ |
25,907 |
$ |
(193,542) |
$ |
43,478 | ||||
66
Operating Activities. The increase in cash provided by operating activities of $118.2 million for the year ended December 31, 2016, as compared to the prior year period, was due primarily to changes in operating assets and liabilities, as well as an increase in net income including increases in non-cash charges, primarily related to deferred taxes and depreciation and amortization. The decrease in cash provided by operating activities of $19.5 million for the year ended December 31, 2015, as compared to the prior year period, was due primarily to changes in operating assets and liabilities, offset by an increase in net income including increases in non-cash charges, primarily related to depreciation and amortization and an impairment charge in 2015.
The following table presents cash flows from changes in operating assets and liabilities and the tax benefit from share-based compensation arrangements for the years ended December 31, 2016, 2015 and 2014:
|
|
For the Years Ended December 31, |
|||||||||
|
(dollars in thousands) |
2016 | 2015 | 2014 | |||||||
|
|
||||||||||
|
Accounts receivable |
$ |
(22,554) |
$ |
(50,142) |
$ |
(3,626) | ||||
|
Inventories |
7,648 | (34,969) | (38,310) | |||||||
|
Accounts payable |
2,117 | (2,468) | 6,703 | |||||||
|
Deferred revenue |
7,672 | (319) | 14,195 | |||||||
|
Other assets and liabilities |
8,119 | 18,087 | 11,319 | |||||||
|
Tax benefit from share-based compensation arrangements |
(14,702) | (11,315) | (16,078) | |||||||
|
Total change in cash due to changes in operating assets and liabilities and the tax benefit from share-based compensation arrangements |
$ |
(11,700) |
$ |
(81,126) |
$ |
(25,797) | ||||
The reduction in cash used by accounts receivable for the year ended December 31, 2016, was primarily due to the absence of the impacts related to our change in U.S. commercial strategy impacting the first quarter of 2015. The incremental cash used by accounts receivable for the year ended December 31, 2015, was primarily due to our transition to an all-direct strategy in the U.S., including the establishment of accounts receivable directly with our U.S. end-users that previously purchased from our U.S. distribution partners, which take a longer elapsed time to collect. Additionally, accounts receivable is impacted by increasing revenues for the years ended December 31, 2016 and 2015, relative to the prior periods, including the margin capture associated with the aforementioned all-direct strategy. In contrast, we received the benefit of collecting the final accounts receivable from our U.S. distribution partners during December 2014.
The net incremental cash provided by inventories for 2016 was primarily due to operational initiatives to optimize inventory levels following a period of inventory growth to support new products and increasing demand. Cash used by inventories for 2015 and 2014 were primarily due to growth in our volume commitment rental programs in international markets and relatively higher inventory levels to support new instrument and diagnostic test launches.
The cash provided by deferred revenue for the year ended December 31, 2016, as compared to cash used for the same period in 2015, was primarily due to sales under our Catalyst One introductory offer, that was introduced in 2014 and increased cash provided by deferred revenue during 2014. The amount of deferred revenue for 2015 and 2016 returned to typical operating levels. Prior to the Catalyst One instrument launch during November 2014, we pre-sold the instrument under a customer marketing program through which customers preordering a Catalyst One were initially provided with the right to use a Catalyst Dx instrument. Under this marketing program, we deferred $7 million of instrument revenue in 2014, which was fully recognized in 2015 upon delivery of the Catalyst One instruments or customer election to keep the Catalyst Dx was received.
The decrease in cash provided by other assets and liabilities for the year ended December 31, 2016, was the result of higher taxable income in 2015, as compared to the same period in the prior year. Income tax payments were lower during 2015 resulting from one-time impacts of implementing our U.S. all-direct strategy and the benefit from the Tax Increase Prevention Act enactment late in the fourth quarter of 2014. The net incremental cash provided by other assets and liabilities for 2015 was also due to the recognition of previously deferred Catalyst instrument costs under the Catalyst One introductory offer during 2015. These factors were partly offset by the incremental cash used for personnel-related accruals, including higher relative payments related to employee incentive programs and higher payments for other accruals due to increases in expenses for the year ended December 31, 2015, as compared to 2014.
67
Tax benefits from share-based compensation arrangements is the result of taxes from the vesting of restricted stock units and exercises of stock-options. This amount will fluctuate based on stock price, as compared to the strike prices of stock options, as well as employees timing of exercises.
We have historically experienced proportionally lower net cash flows from operating activities during the first quarter and proportionally higher cash flows from operating activities for the remainder of the year and for the annual period driven primarily by payments related to annual employee incentive programs in the first quarter following the year for which the bonuses were earned and the seasonality of vector-borne disease testing, which has historically resulted in significant increases in accounts receivable balances during the first quarter of the year.
Investing Activities. Cash used by investing activities was $90.8 million for the year ended December 31, 2016, as compared to $308.4 million used for the year ended December 31, 2015, and $80.4 million used for the year ended December 31, 2014. The decrease in cash used by investing activities for the year ended December 31, 2016, as well as the increase in cash used for the year ended December 31, 2015, was due primarily to the purchase of marketable securities in 2015.
Our total capital expenditure plan for 2017 is estimated to be approximately $90 million, which includes capital investments in manufacturing and reference laboratory equipment, investments in internal use software and information technology infrastructure and the renovation and expansion of our facilities and reference laboratories.
Financing Activities. Cash used by financing activities was $217.8 million, for the year ended December 31, 2016, as compared to $95.6 million used for the year ended December 31, 2015, and $103.4 million used for the year ended December 31, 2014. The increase in cash used by financing activities for the year ended December 31, 2016, as compared to the same period in 2015 was due to the issuance of senior notes in 2015, as well as a decrease in cash used to repurchase our common stock. The decrease in cash used by financing activities for year ended December 31, 2015, as compared to the same period in 2014 was due to a decrease in cash used to repurchase our common stock, the aggregate issuance of approximately $250 million of senior notes during the year ended December 31, 2015, as compared to $200 million of senior notes issued during the same period in 2014, as well as lower relative net borrowings under the Credit Facility during the year ended December 31, 2015, as compared to the same period in 2014.
In June 2015, we entered into an Amended and Restated Multi-Currency Note Purchase and Private Shelf Agreement (the “2015 Amended Agreement”), among the Company, Prudential Investment Management, Inc. (“Prudential”) and the accredited institutional purchasers named therein, which amends and restates the Note Purchase and Private Shelf Agreement dated July 21, 2014. Pursuant to the 2015 Amended Agreement, we issued and sold through a private placement a principal amount of €88.9 million of 1.785% Series C Senior Notes due June 18, 2025 (the “2025 Series C Notes”). We used the net proceeds from this issuance and sale of the 2025 Series C Notes for general corporate purposes, including repaying amounts outstanding under our Credit Facility.
In December 2014, we entered into a Multi-Currency Note Purchase and Private Shelf Agreement (the “MetLife Agreement”) with accredited institutional purchasers named therein pursuant to which we agreed to issue and sell $75 million of 3.25% Series A Senior Notes having a seven-year term (the “2022 Notes”) and $75 million of 3.72% Series B Senior Notes having a twelve-year term (the “2027 Notes”). In February 2015, we issued and sold the 2022 Notes and the 2027 Notes pursuant to the MetLife Agreement. We used the net proceeds from these issuance and sales for general corporate purposes, including repaying amounts outstanding under our Credit Facility.
68
Cash used to repurchase shares of our common stock decreased by $97.9 million during the year ended December 31, 2016, as compared to the same period in 2015. Cash used to repurchase shares of our common stock decreased by $216.2 million during the year ended December 31, 2015, as compared to the same period in 2014. From the inception of our share repurchase program in August 1999 to December 31, 2016, we have repurchased 61.3 million shares. During the year ended December 31, 2016, we purchased 3.1 million shares for an aggregate cost of $313.1 million, as compared to purchases of 5.7 million shares for an aggregate cost of $406.4 million during 2015 and purchases of 9.8 million shares for an aggregate cost of $618.2 million during 2014. We believe that the repurchase of our common stock is a favorable means of returning value to our shareholders and we also repurchase our stock to offset the dilutive effect of our share-based compensation programs. Repurchases of our common stock may vary depending upon the level of other investing activities and the share price. See Note 18 to the consolidated financial statements included in this Annual Report on Form 10-K for additional information about our share repurchases.
As noted above, we refinanced our existing $700 million Credit Facility during December 2015, increasing the principal amount there under to $850 million. The Credit Facility matures on December 4, 2020 and requires no scheduled prepayments before that date. Although the Credit Facility does not mature until December 2020, all amounts borrowed under the terms of the Credit Facility are reflected in the current liabilities section in the accompanying consolidated balance sheets because the Credit Facility contains a subjective material adverse event clause, which allows the debt holders to call the loans under the Credit Facility if we fail to notify the syndicate of such an event. Applicable interest rates on borrowings under the Credit Facility generally range from 1.250 to 1.375 percentage points above the London interbank offered rate or the Canadian Dollar-denominated bankers’ acceptance rate, based on our leverage ratio, or the prevailing prime rate plus a maximum spread of up to 0.375 percent, based on our leverage ratio.
Net borrowing and repayment activity under the Credit Facility resulted in more cash provided of $14.0 million during the year ended December 31, 2016, as compared to the same period in 2015. At December 31, 2016, we had $611.0 million outstanding under the Credit Facility. Net borrowing and repayment activity under the Credit Facility resulted in less cash provided of $248.0 million during the twelve months ended December 31, 2015, as compared to the same period of the prior year. At December 31, 2015, we had $573.0 million outstanding under the Credit Facility. The general availability of funds under the Credit Facility was further reduced by $1.0 million for a letter of credit that was issued in connection with claims under our workers’ compensation policy. The Credit Facility contains affirmative, negative and financial covenants customary for financings of this type. The negative covenants include restrictions on liens, indebtedness of subsidiaries of the Company, fundamental changes, investments, transactions with affiliates, and certain restrictive agreements and violations of laws and regulations. The financial covenant is a consolidated leverage ratio test that requires our ratio of debt to earnings before interest, taxes, depreciation, amortization and share-based compensation not to exceed 3.5-to-1. At December 31, 2016, we were in compliance with the covenants of the Credit Facility. The obligations under the Credit Facility may be accelerated upon the occurrence of an event of default under the Credit Facility, which includes customary events of default including payment defaults, defaults in the performance of the affirmative, negative and financial covenants, the inaccuracy of representations or warranties, bankruptcy and insolvency related defaults, defaults relating to judgments, certain events related to employee pension benefit plans under the Employee Retirement Income Security Act of 1974, the failure to pay specified indebtedness, cross-acceleration to specified indebtedness and a change of control default.
Since December 2013, we have issued and sold through private placements senior notes having an aggregate principal amount of approximately $600 million pursuant to certain note purchase agreements (collectively, the “Senior Note Agreements”). The Senior Note Agreements contain affirmative, negative and financial covenants customary for agreements of this type. The negative covenants include restrictions on liens, indebtedness of our subsidiaries, priority indebtedness, fundamental changes, investments, transactions with affiliates, certain restrictive agreements and violations of laws and regulations. See Note 11 to the consolidated financial statements included in this Annual Report on Form 10-K for additional information regarding our senior notes.
69
Should we elect to prepay the Senior Notes, such aggregate prepayment will include the applicable make-whole amount(s), as defined within the applicable Senior Note Agreements. Additionally, in the event of a change in control of the Company, or upon the disposition of certain assets of the Company the proceeds of which are not reinvested (as defined in the Senior Note Agreements), we may be required to prepay all or a portion of the Senior Notes. The obligations under the Senior Notes may be accelerated upon the occurrence of an event of default under the applicable Senior Note Agreement, each of which includes customary events of default including payment defaults, defaults in the performance of the affirmative, negative and financial covenants, the inaccuracy of representations or warranties, bankruptcy and insolvency related defaults, defaults relating to judgments, certain events related to employee pension benefit plans under the Employee Retirement Income Security Act of 1974, the failure to pay specified indebtedness and cross-acceleration to specified indebtedness.
The financial covenant is a consolidated leverage ratio test that requires our ratio of debt to earnings before interest, taxes, depreciation, amortization and share-based compensation, as defined in the Senior Note Agreements, not to exceed 3.5-to-1. At December 31, 2016, we were in compliance with the covenants of the Senior Note Agreements. The following details our consolidated leverage ratio calculation as of December 31, 2016 (in thousands):
|
|
December |
|||
|
Trailing 12 Months Adjusted EBITDA: |
2016 | |||
|
|
||||
|
Net income attributable to stockholders |
$ |
222,045 | ||
|
Interest expense |
32,049 | |||
|
Provision for income taxes |
99,792 | |||
|
Depreciation and amortization |
78,218 | |||
|
Share-based compensation expense |
19,891 | |||
|
Extraordinary and other non-recurring non-cash charges |
2,228 | |||
|
Adjusted EBITDA |
$ |
454,223 | ||
|
|
||||
|
|
||||
|
|
December |
|||
|
Debt to Adjusted EBITDA Ratio: |
2016 | |||
|
|
||||
|
Line of credit |
$ |
611,000 | ||
|
Long-term debt |
593,110 | |||
|
Total debt |
1,204,110 | |||
|
Acquisition-related consideration payable |
2,435 | |||
|
Capitalized leases |
581 | |||
|
U.S. GAAP change - deferred financing costs |
554 | |||
|
Gross debt |
1,207,680 | |||
|
Gross debt to Adjusted EBITDA ratio |
2.66 | |||
|
|
||||
|
Cash and cash equivalents |
(154,901) | |||
|
Marketable securities |
(236,949) | |||
|
Net debt |
$ |
815,830 | ||
|
Net debt to Adjusted EBITDA ratio |
1.80 | |||
Adjusted EBITDA, gross debt, net debt, gross debt to Adjusted EBITDA and net debt to Adjusted EBITDA ratio are non-GAAP financial measures which should be considered in addition to, and not as a replacement for, financial measures presented according to U.S. GAAP. Management believes that reporting these non-GAAP financial measures provides supplemental analysis to help investors further evaluate our business performance and available borrowing capacity under our Credit Facility.
70
Other Commitments, Contingencies and Guarantees
Under our workers’ compensation insurance policies for U.S. employees, we have retained the first $300,000 for the years ended December 31, 2016, 2015 and 2014, in claim liability per incident with aggregate maximum claim liabilities per year of $2.6 million for the year ended December 31, 2016, $3.5 million for the year ended December 31, 2015, and $2.3 million for the year ended December 31, 2014. Workers’ compensation expense recognized during the years ended December 31, 2016, 2015 and 2014 and our respective liability for such claims as of December 31, 2016, 2015, and 2014 was not material. Claims incurred during the years ended December 31, 2016 and 2015, are relatively undeveloped as of December 31, 2016. Therefore, it is possible that we could incur additional healthcare and wage indemnification costs beyond those previously recognized up to our aggregate liability for each of the respective claim years. For the years ended on or prior to December 31, 2014, based on our retained claim liability per incident and our aggregate claim liability per year, our maximum liability in excess of the amounts deemed probable and previously recognized, is not material as of December 31, 2016. As of December 31, 2016, we had outstanding letters of credit totaling $1.3 million to the insurance companies as security for these claims in connection with these policies, of which, $1.0 million reduces our availability under our Credit Facility.
Under our current employee healthcare insurance policy for U.S. employees, we retain claims liability risk per incident up to $450,000 per year in 2016, $425,000 per year in 2015 and $375,000 per year in 2014. We recognized employee healthcare claim expense of $40.4 million during the year ended December 31, 2016, $34.6 million during the year ended December 31, 2015, and $32.0 million during the year ended December 31, 2014, which represents actual claims paid and an estimate of our liability for the uninsured portion of employee healthcare obligations that have been incurred but not paid. Should employee health insurance claims exceed our estimated liability, we would have further obligations. Our estimated liability for healthcare claims that have been incurred but not paid were $4.0 million as of December 31, 2016, $4.8 million as of December 31, 2015, and $4.1 million as of December 31, 2014.
We have total acquisition-related contingent consideration liabilities outstanding of up to $6.4 million primarily related to the achievement of certain revenue milestones. We have recorded $0.9 million at December 31, 2016, $5.9 million at December 31, 2015, and $6.3 million at December 31, 2014, of contingent consideration liabilities on our consolidated balance sheets. We have not accrued for $5.5 million of contingent consideration liabilities, related to the acquisition of an intangible asset in 2008, as we do not deem the achievement of associated revenue milestones to be probable of occurring as of December 31, 2016.
We are contractually obligated to make the following payments in the years below:
|
Contractual obligations (in thousands) |
|
Total |
|
|
Less than 1 year |
|
|
1-3 years |
|
|
3-5 years |
|
|
More than 5 years |
|
||||||||
|
|
|
|
|
|
|
|
|
|
|
|
|
|
|
|
|
|
|
|
|
|
|||
|
Long-term debt obligations (1) |
|
$ |
752,985 |
|
|
$ |
20,154 |
|
|
$ |
40,309 |
|
|
$ |
89,617 |
|
|
$ |
602,905 |
|
|||
|
Operating leases |
|
|
57,861 |
|
|
|
15,724 |
|
|
|
20,829 |
|
|
|
12,258 |
|
|
|
9,050 |
|
|||
|
Purchase obligations (2) |
|
|
179,221 |
|
|
|
153,265 |
|
|
|
16,497 |
|
|
|
5,817 |
|
|
|
3,642 |
|
|||
|
Minimum royalty payments |
|
|
1,565 |
|
|
|
554 |
|
|
|
371 |
|
|
|
221 |
|
|
|
419 |
|
|||
|
Total contractual cash obligations |
|
$ |
991,632 |
|
|
$ |
189,697 |
|
|
$ |
78,006 |
|
|
$ |
107,913 |
|
|
$ |
616,016 |
|
|||
|
|
|
|
|
|
|
|
|
|
|
|
|
|
|
|
|
|
|
|
|
|
|||
|
(1) |
Long-term debt amounts include interest payments associated with long-term debt. |
|
(2) |
Purchase obligations include agreements and purchase orders to purchase goods or services that are enforceable and legally binding and that specify all significant terms, including fixed or minimum quantities, pricing, and approximate timing of purchase transactions. |
These commitments do not reflect unrecognized tax benefits of $18.5 million and $2.2 million of deferred compensation liabilities as of December 31, 2016, as the timing of recognition is uncertain. Refer to Note 12 of the consolidated financial statements for the year ended December 31, 2016, included in this Annual Report on Form 10-K for additional discussion of unrecognized tax benefits.
71
ITEM 7A.QUANTITATIVE AND QUALITATIVE DISCLOSURE ABOUT MARKET RISK
Our market risk consists primarily of foreign currency exchange risk and interest rate risk. Our functional currency is the U.S. dollar and our primary manufacturing operations and inventory supply contracts are in the U.S. or in U.S. dollars, but we distribute our products worldwide both through direct export and through our foreign subsidiaries. Our primary foreign currency transaction risk consists of intercompany purchases and sales of products and we attempt to mitigate this risk through our hedging program described below. For the year ended December 31, 2016, approximately 21 percent of our consolidated revenue was derived from products manufactured or sourced in U.S. dollars and sold internationally in local currencies, as compared to 20 percent for the year ended December 31, 2015, and 22 percent for the year ended December 31, 2014. The functional currency of most of our subsidiaries is their local currency. For three of our subsidiaries located in the Netherlands, Singapore and Dubai, the functional currency is the U.S. dollar.
Our foreign currency exchange impacts are comprised of three components: 1) local currency revenues and expenses; 2) the impact of hedge contracts; and 3) intercompany and monetary balances for our subsidiaries that are denominated in a currency that is different from the functional currency used by each subsidiary. Based on projected revenues and expenses for 2017, excluding the impact of intercompany and trade balances denominated in currencies other than the functional subsidiary currencies, a 1 percent strengthening of the U.S. dollar would reduce revenue by approximately $7 million and operating income by approximately $3 million. Additionally, our foreign currency hedge contracts in place as of December 31, 2016 would provide incremental offsetting gains of approximately $1 million. The impact of the intercompany and monetary balances referred to in the third component above have been excluded, as they are transacted at multiple times during the year and we are not able to reliably forecast the impact that changes in exchange rates would have.
At our current foreign exchange rate assumptions, we anticipate that the effect of a stronger U.S. Dollar will have an adverse effect on our operating results by decreasing our revenues, operating profit and diluted earnings per share in the year ending December 31, 2017, by approximately $26 million, $8 million, and $0.06 per share, respectively. This unfavorable impact includes foreign currency hedging activity, which is expected to increase total company operating profit by approximately $3 million and diluted earnings per share by $0.03 in the year ending December 31, 2017. The actual impact of changes in the value of the U.S. dollar against foreign currencies in which we transact may materially differ from our expectations described above. The above estimate assumes that the value of the U.S. dollar relative to other currencies will reflect the euro at $1.06, the British pound at $1.23, the Canadian dollar at $0.75, the Australian dollar at $0.75 and the Japanese yen at ¥117 to the U.S. dollar for the full year of 2017.
The following table is the foreign currency exchange impacts on our revenues, operating profit and diluted earnings per share for the years December 31, 2016, 2015 and 2014, as compared to the respective prior periods:
|
|
For the Years Ended December 31, |
|||||||||
|
(dollars in thousands) |
2016 | 2015 | 2014 | |||||||
|
|
||||||||||
|
Revenue impact |
$ |
(14,105) |
$ |
(89,692) |
$ |
(10,978) | ||||
|
|
||||||||||
|
Operating profit impact, excluding hedge activity |
$ |
(6,921) |
$ |
(38,286) |
$ |
(7,544) | ||||
|
|
||||||||||
|
Hedge gains - prior year |
(20,879) | (3,821) | (3,469) | |||||||
|
Hedge gains - current year |
3,620 | 20,879 | 3,821 | |||||||
|
Hedging activity impact |
(17,259) | 17,058 | 352 | |||||||
|
|
||||||||||
|
Operating profit impact, including hedge activity |
$ |
(24,180) |
$ |
(21,228) |
$ |
(7,192) | ||||
|
Diluted earnings per share impact, including hedge activity |
$ |
(0.20) |
$ |
(0.16) |
$ |
(0.05) | ||||
The primary purpose of our foreign currency hedging activities is to protect against the volatility associated with foreign currency transactions. We also utilize natural hedges to mitigate our transaction and commitment exposures. Our corporate policy prescribes the range of allowable hedging activity. We enter into foreign currency exchange contracts with large multinational financial institutions and we do not hold or engage in transactions involving derivative instruments for purposes other than risk management. Our accounting policies for these contracts are based on our designation of such instruments as hedging transactions. If a hedging instrument qualifies for hedge accounting, changes in the fair value of the derivative instrument from the effective portion of the hedge
72
are deferred in accumulated other comprehensive income, net of tax, and reclassified into earnings in the same period or periods during which the hedged transaction affects earnings. We immediately record in earnings the extent to which a hedge instrument is not effective in achieving offsetting changes in fair value. We primarily utilize foreign currency exchange contracts with durations of less than 24 months.
Our subsidiaries enter into foreign currency exchange contracts to manage the exchange risk associated with their forecasted intercompany inventory purchases and sales for the next year. From time to time, we may also enter into other foreign currency exchange contracts or foreign-denominated debt issuances to minimize the impact of foreign currency fluctuations associated with specific balance sheet exposures, including net investments in certain foreign subsidiaries. See Note 17 to the consolidated financial statements of this Annual Report on Form 10-K for details regarding euro-denominated notes that we designated as a hedge of our euro net investment in certain foreign subsidiaries.
Our foreign currency hedging strategy is consistent with prior periods and there were no material changes in our market risk exposure during the year ended December 31, 2016. We enter into foreign currency exchange contracts designated as cash flow hedges for amounts that are less than the full value of forecasted intercompany purchases and sales and for amounts that are equivalent to, or less than, other significant transactions. As a result, no significant ineffectiveness has resulted or been recorded through the statements of operations for the years ended December 31, 2016, 2015 and 2014. Our hedging strategy related to intercompany inventory purchases and sales is to employ the full amount of our hedges for the succeeding year at the conclusion of our budgeting process for that year. Quarterly, we enter into contracts to hedge incremental portions of anticipated foreign currency transactions for the current and following year. Accordingly, our risk with respect to foreign currency exchange rate fluctuations may vary throughout each annual cycle.
We enter into hedge agreements where we believe we have meaningful exposure to foreign currency exchange risk, with the exception of certain emerging markets where it is not practical to hedge our exposure. We hedge approximately 85 percent of the estimated exposure from intercompany product purchases and sales denominated in the euro, British pound, Canadian dollar, Japanese yen, Australian dollar and Swiss franc. We have additional unhedged foreign currency exposures related to foreign services and emerging markets where it is not practical to hedge. The notional amount of foreign currency exchange contracts to hedge forecasted intercompany purchases and sales totaled $175.9 million at December 31, 2016, and $176.1 million at December 31, 2015. At December 31, 2016, we had $5.4 million of net unrealized gains on foreign currency exchange contracts recorded in accumulated other comprehensive income, net of related tax expense.
We have a five-year unsecured revolving credit facility in the principal amount of $850 million with a syndicate of multinational banks, which matures on December 4, 2020 (“Credit Facility”) and requires no scheduled prepayments before that date. Although the Credit Facility does not mature until December 4, 2020, all individual borrowings under the terms of the Credit Facility have a stated term between 30 and 180 days. Borrowings outstanding under the Credit Facility at December 31, 2016, were $611.0 million at a weighted-average effective interest rate of 1.95 percent. Based on amounts outstanding under our Credit Facility as of December 31, 2016, an increase in the LIBOR or the CDOR of 1 percent would increase interest expense by approximately $6.1 million on an annualized basis.
During the year ended December 31, 2016, we purchased marketable debt securities, which are classified as available-for-sale and carried at fair value in the accompanying consolidated balance sheet included in this Annual Report on Form 10-K. The fair value of our cash equivalents and marketable securities is subject to changes in market interest rates. As of December 31, 2016, we estimate that a 1 percent increase in market interest rates would decrease the fair value of our marketable securities portfolio by approximately $0.9 million.
ITEM 8.FINANCIAL STATEMENTS AND SUPPLEMENTARY DATA
The response to this item is submitted as a separate section of this report commencing on page F-1.
ITEM 9.CHANGES IN AND DISAGREEMENTS WITH ACCOUNTANTS ON ACCOUNTING AND FINANCIAL DISCLOSURE
Not applicable.
73
ITEM 9A.CONTROLS AND PROCEDURES
Disclosure Controls and Procedures
Our management is responsible for establishing and maintaining disclosure controls and procedures, as defined by the SEC in its Rules 13a-15(e) and 15d-15(e) under the Exchange Act. The term “disclosure controls and procedures,” as defined in Rules 13a-15(e) and 15d-15(e) under the Exchange Act, means controls and other procedures of an issuer that are designed to ensure that information required to be disclosed by the issuer in the reports that it files or submits under the Exchange Act is recorded, processed, summarized and reported, within the time periods specified in the SEC's rules and forms. Disclosure controls and procedures include controls and procedures designed to ensure that information required to be disclosed by a company in the reports that it files or submits under the Exchange Act is accumulated and communicated to the company’s management, including its principal executive and principal financial officers, as appropriate to allow timely decisions regarding required disclosure. Management recognizes that any controls and procedures, no matter how well designed and operated, can provide only reasonable assurance of achieving their objectives and management necessarily applies its judgment in evaluating the cost-benefit relationship of possible controls and procedures. Based on the evaluation of our disclosure controls and procedures at December 31, 2016, our chief executive officer and chief financial officer have concluded that, as of such date, the Company’s disclosure controls and procedures were effective at the reasonable assurance level.
Report of Management on Internal Control Over Financial Reporting
We are responsible for establishing and maintaining adequate internal control over financial reporting as defined in Rules 13a-15(f) and 15d-15(f) under the Exchange Act. The Company’s internal control over financial reporting is designed to provide reasonable assurance regarding the reliability of financial reporting and the preparation of financial statements for external purposes in accordance with U.S. GAAP and includes those policies and procedures that:
|
· |
Pertain to the maintenance of records that in reasonable detail accurately and fairly reflect the transactions and dispositions of the assets of the Company; |
|
· |
Provide reasonable assurance that transactions are recorded as necessary to permit preparation of financial statements in accordance with generally accepted accounting principles, and that receipts and expenditures of the Company are being made only in accordance with authorizations of management and directors of the Company; and |
|
· |
Provide reasonable assurance regarding prevention or timely detection of unauthorized acquisition, use or disposition of the Company’s assets that could have a material effect on the financial statements. |
Because of its inherent limitations, internal control over financial reporting may not prevent or detect misstatements. In addition, projections of any evaluation of effectiveness to future periods are subject to risk that controls may become inadequate because of changes in conditions and that the degree of compliance with the policies and procedures may deteriorate.
We conducted an evaluation of the effectiveness of internal control over financial reporting based on the framework in Internal Control – Integrated Framework (2013) issued by the Committee of Sponsoring Organizations of the Treadway Commission. Based on this evaluation, we concluded that, at December 31, 2016, our internal control over financial reporting was effective.
The effectiveness of the Company's internal control over financial reporting at December 31, 2016, has been audited by PricewaterhouseCoopers LLP, an independent registered public accounting firm, as stated in their report which appears herein.
74
Changes in Internal Control Over Financial Reporting
There were no changes in our internal control over financial reporting (as defined in Rules 13a-15(f) and 15d-15(f) under the Exchange Act) during the three months ended December 31, 2016, that materially affected, or are reasonably likely to materially affect, the Company’s internal control over financial reporting.
Certifications
The certifications with respect to disclosure controls and procedures and internal control over financial reporting of the Company’s chief executive officer and chief financial officer are attached as Exhibits 31.1 and 31.2 to this Annual Report on Form 10-K.
ITEM 9B.OTHER INFORMATION
Not applicable.
PART III
ITEM 10.DIRECTORS, EXECUTIVE OFFICERS AND CORPORATE GOVERNANCE
The information required by this Item with respect to Directors, executive officers, compliance with Section 16(a) of the Exchange Act, our code of ethics and corporate governance is omitted from this Annual Report on Form 10-K and, pursuant to Regulation 14A of the Exchange Act, is incorporated herein by reference from the sections entitled “Corporate Governance - Proposal One - Election of Directors,” “Executive Officers,” “Stock Ownership Information - Section 16(a) Beneficial Ownership Reporting Compliance,” “Corporate Governance – Corporate Governance Guidelines and Code of Ethics” and “Corporate Governance –Board Committees” in the Company’s definitive Proxy Statement with respect to its 2017 Annual Meeting, which Proxy Statement will be filed with the SEC within 120 days after the end of the fiscal year covered by this Annual Report on Form 10-K.
ITEM 11.EXECUTIVE COMPENSATION
The information required by this Item is omitted from this Annual Report on Form 10-K and, pursuant to Regulation 14A of the Exchange Act, is incorporated herein by reference from the sections entitled “Executive Compensation – Compensation Discussion and Analysis,” “Executive Compensation – Executive Compensation Tables,” “Executive Compensation – Potential Payments Upon Termination or Change-in-Control,” “Corporate Governance –Board Committees – Compensation Committee – Compensation Committee Interlocks and Insider Participation” and “Compensation Committee Report” in the Company’s definitive Proxy Statement with respect to its 2017 Annual Meeting, which Proxy Statement will be filed with the SEC within 120 days after the end of the fiscal year covered by this Annual Report on Form 10-K.
ITEM 12.SECURITY OWNERSHIP OF CERTAIN BENEFICIAL OWNERS AND MANAGEMENT AND RELATED STOCKHOLDER MATTERS
The information required by this Item with respect to Item 201(d) of Regulation S-K is omitted from this Annual Report on Form 10-K and, pursuant to Regulation 14A of the Exchange Act, is incorporated herein by reference from the section entitled “Equity Compensation Plan Information” in the Company’s definitive Proxy Statement with respect to its 2017 Annual Meeting, which Proxy Statement will be filed with the SEC within 120 days after the end of the fiscal year covered by this Annual Report on Form 10-K. The information required by this Item with respect to Item 403 of Regulation S-K is omitted from this Annual Report on Form 10-K and, pursuant to Regulation 14A of the Exchange Act, is incorporated herein by reference from the sections entitled “Stock Ownership Information” in the Company’s definitive Proxy Statement with respect to its 2017 Annual Meeting, which Proxy Statement will be filed with the SEC within 120 days after the end of the fiscal year covered by this Annual Report on Form 10-K.
75
ITEM 13.CERTAIN RELATIONSHIPS AND RELATED TRANSACTIONS, AND DIRECTOR INDEPENDENCE
The information required by this Item is omitted from this Annual Report on Form 10-K and, pursuant to Regulation 14A of the Exchange Act, is incorporated herein by reference from the sections entitled “Corporate Governance – Related Person Transactions” and “Corporate Governance – Director Independence” in the Company’s definitive Proxy Statement with respect to its 2017 Annual Meeting, which Proxy Statement will be filed with the SEC within 120 days after the end of the fiscal year covered by this Annual Report on Form 10-K.
ITEM 14.PRINCIPAL ACCOUNTANT FEES AND SERVICES
The information required by this Item is omitted from this Annual Report on Form 10-K and, pursuant to Regulation 14A of the Exchange Act, is incorporated herein by reference from the section entitled “Audit Committee Matters - Independent Auditors’ Fees” in the Company’s definitive Proxy Statement with respect to its 2017 Annual Meeting, which Proxy Statement will be filed with the SEC within 120 days after the end of the fiscal year covered by this report.
PART IV
ITEM 15.EXHIBITS, FINANCIAL STATEMENT SCHEDULES
|
The following documents are filed as part of this Form 10-K: |
||
|
|
|
|
|
(a) (1) and (a) (2) |
The financial statements set forth in the Index to Consolidated Financial Statements and the Consolidated Financial Statement Schedule are filed as a part of this Annual Report on Form 10-K commencing on page F-1. |
|
|
|
|
|
|
(a)(3) and (b) |
The exhibits listed in the accompanying Exhibit Index are filed as part of this Annual Report on Form 10-K and either filed herewith or incorporated by reference herein, as applicable. |
|
ITEM 16.FORM 10-K SUMMARY
|
None. |
||
76
FINANCIAL STATEMENTS AND SUPPLEMENTAL DATA
INDEX TO CONSOLIDATED FINANCIAL STATEMENTS
AND
CONSOLIDATED FINANCIAL STATEMENT SCHEDULE
|
|
Page No. |
|
|
|
|
Report of Independent Registered Public Accounting Firm |
F-2 |
|
|
|
|
Consolidated Balance Sheets as of December 31, 2016 and 2015 |
F-3 |
|
|
|
|
Consolidated Statements of Income for the Years Ended December 31, 2016, 2015 and 2014 |
F-4 |
|
|
|
|
Consolidated Statements of Comprehensive Income for the Years Ended December 31, 2016, 2015 and 2014 |
F-5 |
|
|
|
|
Consolidated Statements of Stockholders’ Equity (Deficit) for the Years Ended December 31, 2016, 2015 and 2014 |
F-6 |
|
|
|
|
Consolidated Statements of Cash Flows for the Years Ended December 31, 2016, 2015 and 2014 |
F-7 |
|
|
|
|
Notes to Consolidated Financial Statements |
F-8 |
|
|
|
|
Schedule II |
|
|
Valuation and Qualifying Accounts |
F-47 |
F-1
REPORT OF INDEPENDENT REGISTERED PUBLIC ACCOUNTING FIRM
To the Board of Directors and Stockholders of IDEXX Laboratories, Inc.
In our opinion, the consolidated financial statements listed in the accompanying index present fairly, in all material respects, the financial position of IDEXX Laboratories, Inc. and its subsidiaries as of December 31, 2016 and 2015, and the results of their operations and their cash flows for each of the three years in the period ended December 31, 2016 in conformity with accounting principles generally accepted in the United States of America. In addition, in our opinion, the financial statement schedule listed in the accompanying index presents fairly, in all material respects, the information set forth therein when read in conjunction with the related consolidated financial statements. Also in our opinion, the Company maintained, in all material respects, effective internal control over financial reporting as of December 31, 2016, based on criteria established in Internal Control - Integrated Framework (2013) issued by the Committee of Sponsoring Organizations of the Treadway Commission (COSO). The Company's management is responsible for these financial statements and financial statement schedule, for maintaining effective internal control over financial reporting and for its assessment of the effectiveness of internal control over financial reporting, included in the Report of Management on Internal Control Over Financial Reporting appearing under Item 9A. Our responsibility is to express opinions on these financial statements, on the financial statement schedule, and on the Company's internal control over financial reporting based on our integrated audits. We conducted our audits in accordance with the standards of the Public Company Accounting Oversight Board (United States). Those standards require that we plan and perform the audits to obtain reasonable assurance about whether the financial statements are free of material misstatement and whether effective internal control over financial reporting was maintained in all material respects. Our audits of the financial statements included examining, on a test basis, evidence supporting the amounts and disclosures in the financial statements, assessing the accounting principles used and significant estimates made by management, and evaluating the overall financial statement presentation. Our audit of internal control over financial reporting included obtaining an understanding of internal control over financial reporting, assessing the risk that a material weakness exists, and testing and evaluating the design and operating effectiveness of internal control based on the assessed risk. Our audits also included performing such other procedures as we considered necessary in the circumstances. We believe that our audits provide a reasonable basis for our opinions.
As discussed in Note 12 to the consolidated financial statements, the Company changed the manner in which it classifies deferred taxes on the balance sheet in 2016.
A company’s internal control over financial reporting is a process designed to provide reasonable assurance regarding the reliability of financial reporting and the preparation of financial statements for external purposes in accordance with generally accepted accounting principles. A company’s internal control over financial reporting includes those policies and procedures that (i) pertain to the maintenance of records that, in reasonable detail, accurately and fairly reflect the transactions and dispositions of the assets of the company; (ii) provide reasonable assurance that transactions are recorded as necessary to permit preparation of financial statements in accordance with generally accepted accounting principles, and that receipts and expenditures of the company are being made only in accordance with authorizations of management and directors of the company; and (iii) provide reasonable assurance regarding prevention or timely detection of unauthorized acquisition, use, or disposition of the company’s assets that could have a material effect on the financial statements.
Because of its inherent limitations, internal control over financial reporting may not prevent or detect misstatements. Also, projections of any evaluation of effectiveness to future periods are subject to the risk that controls may become inadequate because of changes in conditions, or that the degree of compliance with the policies or procedures may deteriorate.
/s/ PricewaterhouseCoopers LLP
Boston, Massachusetts
February 17, 2017
F-2
IDEXX LABORATORIES, INC. AND SUBSIDIARIES
CONSOLIDATED BALANCE SHEETS
(in thousands, except per share amounts)
|
|
December 31, |
December 31, |
||||
|
|
2016 | 2015 | ||||
|
|
||||||
|
ASSETS |
||||||
|
Current Assets: |
||||||
|
Cash and cash equivalents |
$ |
154,901 |
$ |
128,994 | ||
|
Marketable securities |
236,949 | 213,591 | ||||
|
Accounts receivable, net of reserves of $4,523 in 2016 and $5,128 in 2015 |
204,494 | 188,318 | ||||
|
Inventories |
158,034 | 188,833 | ||||
|
Deferred income tax assets |
- |
39,829 | ||||
|
Other current assets |
91,206 | 62,069 | ||||
|
Total current assets |
845,584 | 821,634 | ||||
|
Long-Term Assets: |
||||||
|
Property and equipment, net |
357,422 | 333,026 | ||||
|
Goodwill |
178,228 | 178,934 | ||||
|
Intangible assets, net |
46,155 | 55,909 | ||||
|
Other long-term assets |
103,315 | 85,490 | ||||
|
Total long-term assets |
685,120 | 653,359 | ||||
|
TOTAL ASSETS |
$ |
1,530,704 |
$ |
1,474,993 | ||
|
|
||||||
|
LIABILITIES AND STOCKHOLDERS’ EQUITY (DEFICIT) |
||||||
|
Current Liabilities: |
||||||
|
Accounts payable |
$ |
60,057 |
$ |
52,648 | ||
|
Accrued liabilities |
236,131 | 205,530 | ||||
|
Line of credit |
611,000 | 573,000 | ||||
|
Current portion of deferred revenue |
27,380 | 25,583 | ||||
|
Total current liabilities |
934,568 | 856,761 | ||||
|
Long-Term Liabilities: |
||||||
|
Deferred income tax liabilities |
39,287 | 49,389 | ||||
|
Long-term debt |
593,110 | 597,085 | ||||
|
Long-term deferred revenue, net of current portion |
33,015 | 27,055 | ||||
|
Other long-term liabilities |
38,937 | 28,698 | ||||
|
Total long-term liabilities |
704,349 | 702,227 | ||||
|
Total liabilities |
1,638,917 | 1,558,988 | ||||
|
|
||||||
|
Commitments and Contingencies (Note 14) |
||||||
|
|
||||||
|
Stockholders’ Equity (Deficit): |
||||||
|
Common stock, $0.10 par value: Authorized: 120,000 shares; Issued: 103,341 shares in 2016 and 102,237 shares in 2015 |
10,334 | 10,258 | ||||
|
Additional paid-in capital |
1,011,895 | 940,534 | ||||
|
Deferred stock units: Outstanding: 231 units in 2016 and 240 units in 2015 |
5,514 | 5,409 | ||||
|
Retained earnings |
540,401 | 318,356 | ||||
|
Accumulated other comprehensive loss |
(43,053) | (42,265) | ||||
|
Treasury stock, at cost: 15,367 shares in 2016 and 12,242 shares in 2015 |
(1,633,443) | (1,316,417) | ||||
|
Total IDEXX Laboratories, Inc. stockholders’ equity (deficit) |
(108,352) | (84,125) | ||||
|
Noncontrolling interest |
139 | 130 | ||||
|
Total stockholders’ equity (deficit) |
(108,213) | (83,995) | ||||
|
TOTAL LIABILITIES AND STOCKHOLDERS’ EQUITY (DEFICIT) |
$ |
1,530,704 |
$ |
1,474,993 | ||
|
|
||||||
|
The accompanying notes are an integral part of these consolidated financial statements. |
||||||
F-3
IDEXX LABORATORIES, INC. AND SUBSIDIARIES
CONSOLIDATED STATEMENTS OF INCOME
(in thousands, except per share amounts)
|
|
|||||||||
|
|
|||||||||
|
|
For the Years Ended December 31, |
||||||||
|
|
2016 | 2015 | 2014 | ||||||
|
|
|||||||||
|
Revenue: |
|||||||||
|
Product revenue |
$ |
1,070,973 |
$ |
974,933 |
$ |
899,412 | |||
|
Service revenue |
704,450 | 626,959 | 586,395 | ||||||
|
Total revenue |
1,775,423 | 1,601,892 | 1,485,807 | ||||||
|
Cost of Revenue: |
|||||||||
|
Cost of product revenue |
416,810 | 360,208 | 335,046 | ||||||
|
Cost of service revenue |
383,177 | 351,414 | 334,645 | ||||||
|
Total cost of revenue |
799,987 | 711,622 | 669,691 | ||||||
|
Gross profit |
975,436 | 890,270 | 816,116 | ||||||
|
|
|||||||||
|
Expenses: |
|||||||||
|
Sales and marketing |
317,058 | 299,955 | 283,708 | ||||||
|
General and administrative |
207,017 | 182,510 | 173,890 | ||||||
|
Research and development |
101,122 | 99,681 | 98,263 | ||||||
|
Impairment charge |
- |
8,212 |
- |
||||||
|
Income from operations |
350,239 | 299,912 | 260,255 | ||||||
|
Interest expense |
(32,049) | (29,239) | (15,429) | ||||||
|
Interest income |
3,656 | 2,468 | 1,729 | ||||||
|
Income before provision for income taxes |
321,846 | 273,141 | 246,555 | ||||||
|
Provision for income taxes |
99,792 | 81,006 | 64,604 | ||||||
|
Net income |
222,054 | 192,135 | 181,951 | ||||||
|
Less: Net income (loss) attributable to noncontrolling interest |
9 | 57 | 45 | ||||||
|
Net income attributable to IDEXX Laboratories, Inc. stockholders |
$ |
222,045 |
$ |
192,078 |
$ |
181,906 | |||
|
|
|||||||||
|
Earnings per Share: |
|||||||||
|
Basic |
$ |
2.47 |
$ |
2.07 |
$ |
1.82 | |||
|
Diluted |
$ |
2.44 |
$ |
2.05 |
$ |
1.79 | |||
|
Weighted Average Shares Outstanding: |
|||||||||
|
Basic |
89,732 | 92,601 | 100,094 | ||||||
|
Diluted |
90,884 | 93,649 | 101,503 | ||||||
|
|
|||||||||
|
The accompanying notes are an integral part of these consolidated financial statements. |
|||||||||
F-4
IDEXX LABORATORIES, INC. AND SUBSIDIARIES
CONSOLIDATED STATEMENTS OF COMPREHENSIVE INCOME
(in thousands)
|
|
For the Years Ended December 31, |
|||||||||||
|
|
2016 | 2015 | 2014 | |||||||||
|
|
||||||||||||
|
Net income |
$ |
222,054 |
$ |
192,135 |
$ |
181,951 | ||||||
|
Other comprehensive income, net of tax: |
||||||||||||
|
Foreign currency translation adjustments |
(5,874) | (30,718) | (29,126) | |||||||||
|
Unrealized gain on net investment hedge |
2,142 | 1,894 |
- |
|||||||||
|
Unrealized gain (loss) on investments, net of tax expense (benefit) of $113 in 2016, ($93) in 2015 and ($63) in 2014 |
245 | (226) | (107) | |||||||||
|
Unrealized gain (loss) on derivative instruments: |
||||||||||||
|
Unrealized gain, net of tax expense of $2,174 in 2016, $3,736 in 2015 and $4,073 in 2014 |
4,950 | 8,839 | 9,542 | |||||||||
|
Less: reclassification adjustment for gains included in net income, net of tax expense of $949 in 2016, $5,853 in 2015 and $756 in 2014 |
(2,251) | (13,983) | (2,002) | |||||||||
|
Unrealized gain (loss) on derivative instruments |
2,699 | (5,143) | 7,540 | |||||||||
|
Other comprehensive loss, net of tax |
(788) | (34,194) | (21,693) | |||||||||
|
Comprehensive income |
221,266 | 157,941 | 160,258 | |||||||||
|
Less: comprehensive income attributable to noncontrolling interest |
9 | 57 | 45 | |||||||||
|
Comprehensive income attributable to IDEXX Laboratories, Inc. |
$ |
221,257 |
$ |
157,884 |
$ |
160,213 | ||||||
|
|
||||||||||||
|
The accompanying notes are an integral part of these consolidated financial statements. |
||||||||||||
F-5
IDEXX LABORATORIES, INC. AND SUBSIDIARIES
CONSOLIDATED STATEMENTS OF STOCKHOLDERS’ EQUITY (DEFICIT)
(in thousands, except per share amounts)
|
|
||||||||||||||||||||||||||||
|
|
Accumulated |
|||||||||||||||||||||||||||
|
|
Common Stock |
Additional |
Deferred |
Other |
Total |
|||||||||||||||||||||||
|
|
Number of Shares |
$0.10 Par Value |
Paid-in Capital |
Stock Units |
Retained Earnings |
Comprehensive Income (Loss) |
Treasury Stock |
Noncontrolling Interest |
Stockholders’ Equity (Deficit) |
|||||||||||||||||||
|
Balance January 1, 2014 |
101,188 |
$ |
10,119 |
$ |
825,320 |
$ |
5,110 |
$ |
1,493,393 |
$ |
13,622 |
$ |
(1,829,378) |
$ |
28 |
$ |
518,214 | |||||||||||
|
Net income (loss) |
- |
- |
- |
- |
181,906 |
- |
- |
45 | 181,951 | |||||||||||||||||||
|
Other comprehensive loss, net |
- |
- |
- |
- |
- |
(21,693) |
- |
- |
(21,693) | |||||||||||||||||||
|
Repurchases of common stock |
- |
- |
- |
- |
- |
- |
(623,888) |
- |
(623,888) | |||||||||||||||||||
|
Common stock issued under stock plans, including excess tax benefit |
759 | 76 | 45,162 |
- |
- |
- |
- |
- |
45,238 | |||||||||||||||||||
|
Deferred stock units activity |
- |
- |
(218) | (114) |
- |
- |
- |
- |
(332) | |||||||||||||||||||
|
Share-based compensation cost |
- |
- |
18,029 | 70 |
- |
- |
- |
- |
18,099 | |||||||||||||||||||
|
Balance December 31, 2014 |
101,947 |
$ |
10,195 |
$ |
888,293 |
$ |
5,066 |
$ |
1,675,299 |
$ |
(8,071) |
$ |
(2,453,266) |
$ |
73 |
$ |
117,589 | |||||||||||
|
Net income |
- |
- |
- |
- |
192,078 |
- |
- |
57 | 192,135 | |||||||||||||||||||
|
Other comprehensive loss, net |
- |
- |
- |
- |
- |
(34,194) |
- |
- |
(34,194) | |||||||||||||||||||
|
Repurchases of common stock |
- |
- |
- |
- |
- |
- |
(412,172) |
- |
(412,172) | |||||||||||||||||||
|
Stock split enacted through stock dividend |
- |
- |
- |
- |
(1,518,264) |
- |
1,518,264 |
- |
- |
|||||||||||||||||||
|
Shares retired |
(346) |
- |
- |
- |
(30,757) |
- |
30,757 |
- |
- |
|||||||||||||||||||
|
Common stock issued under stock plans, including excess tax benefit |
636 | 63 | 32,700 |
- |
- |
- |
- |
- |
32,763 | |||||||||||||||||||
|
Deferred stock units activity |
- |
- |
(258) | 258 |
- |
- |
- |
- |
- |
|||||||||||||||||||
|
Share-based compensation cost |
- |
- |
19,799 | 85 |
- |
- |
- |
- |
19,884 | |||||||||||||||||||
|
Balance December 31, 2015 |
102,237 |
$ |
10,258 |
$ |
940,534 |
$ |
5,409 |
$ |
318,356 |
$ |
(42,265) |
$ |
(1,316,417) |
$ |
130 |
$ |
(83,995) | |||||||||||
|
Net income |
- |
- |
- |
- |
222,045 |
- |
- |
9 | 222,054 | |||||||||||||||||||
|
Other comprehensive loss, net |
- |
- |
- |
- |
- |
(788) |
- |
- |
(788) | |||||||||||||||||||
|
Repurchases of common stock |
- |
- |
- |
- |
- |
- |
(317,026) |
- |
(317,026) | |||||||||||||||||||
|
Common stock issued under stock plans, including excess tax benefit |
1,104 | 76 | 51,904 |
- |
- |
- |
- |
- |
51,980 | |||||||||||||||||||
|
Deferred stock units activity |
- |
- |
(343) | 14 |
- |
- |
- |
- |
(329) | |||||||||||||||||||
|
Share-based compensation cost |
- |
- |
19,800 | 91 |
- |
- |
- |
- |
19,891 | |||||||||||||||||||
|
Balance December 31, 2016 |
103,341 |
$ |
10,334 |
$ |
1,011,895 |
$ |
5,514 |
$ |
540,401 |
$ |
(43,053) |
$ |
(1,633,443) |
$ |
139 |
$ |
(108,213) | |||||||||||
|
|
||||||||||||||||||||||||||||
|
The accompanying notes are an integral part of these consolidated financial statements. |
||||||||||||||||||||||||||||
F-6
IDEXX LABORATORIES, INC. AND SUBSIDIARIES
CONSOLIDATED STATEMENTS OF CASH FLOWS
(in thousands)
|
|
For the Years Ended December 31, |
||||||||
|
|
2016 | 2015 | 2014 | ||||||
|
|
|||||||||
|
Cash Flows from Operating Activities: |
|||||||||
|
Net income |
$ |
222,054 |
$ |
192,135 |
$ |
181,951 | |||
|
Adjustments to reconcile net income to net cash provided by operating activities: |
|||||||||
|
Depreciation and amortization |
78,218 | 68,956 | 58,888 | ||||||
|
Amortization on marketable securities, net |
843 | 1,432 |
- |
||||||
|
Impairment charge |
2,228 | 8,212 |
- |
||||||
|
Provision for uncollectible accounts |
1,170 | 2,200 | 2,035 | ||||||
|
Provision for deferred income taxes |
20,881 | 5,143 | 830 | ||||||
|
Share-based compensation expense |
19,891 | 19,884 | 18,099 | ||||||
|
Other |
986 | (472) | (160) | ||||||
|
Tax benefit from share-based compensation arrangements |
(14,702) | (11,315) | (16,078) | ||||||
|
Changes in assets and liabilities: |
|||||||||
|
Accounts receivable |
(22,554) | (50,142) | (3,626) | ||||||
|
Inventories |
7,648 | (34,969) | (38,310) | ||||||
|
Accounts payable |
2,117 | (2,468) | 6,703 | ||||||
|
Deferred revenue |
7,672 | (319) | 14,195 | ||||||
|
Other assets and liabilities |
8,119 | 18,087 | 11,319 | ||||||
|
Net cash provided by operating activities |
334,571 | 216,364 | 235,846 | ||||||
|
Cash Flows from Investing Activities: |
|||||||||
|
Purchases of property and equipment |
(64,787) | (82,921) | (60,523) | ||||||
|
Purchase of marketable securities |
(227,894) | (271,958) |
- |
||||||
|
Proceeds from the sale and maturities of marketable securities |
203,859 | 56,775 |
- |
||||||
|
Proceeds from sale of equity investment |
- |
- |
5,400 | ||||||
|
Acquisitions of intangible assets |
- |
- |
(175) | ||||||
|
Acquisition of businesses, net of cash acquired |
(1,964) | (10,302) | (25,115) | ||||||
|
Net cash used by investing activities |
(90,786) | (308,406) | (80,413) | ||||||
|
Cash Flows from Financing Activities: |
|||||||||
|
Borrowings on revolving credit facilities, net |
38,000 | 24,000 | 272,000 | ||||||
|
Issuance of senior notes |
- |
250,097 | 200,000 | ||||||
|
Debt issue costs |
(56) | (1,380) | (1,406) | ||||||
|
Payment of notes payable |
- |
- |
(1,394) | ||||||
|
Repurchases of common stock |
(304,086) | (401,981) | (618,158) | ||||||
|
Proceeds from exercises of stock options and employee stock purchase plans |
38,344 | 22,397 | 29,442 | ||||||
|
Payment of acquisition-related contingent consideration |
(4,728) |
- |
- |
||||||
|
Tax benefit from share-based compensation arrangements |
14,702 | 11,315 | 16,078 | ||||||
|
Net cash used by financing activities |
(217,824) | (95,552) | (103,438) | ||||||
|
Net effect of changes in exchange rates on cash |
(54) | (5,948) | (8,517) | ||||||
|
Net increase (decrease) in cash and cash equivalents |
25,907 | (193,542) | 43,478 | ||||||
|
Cash and cash equivalents at beginning of period |
128,994 | 322,536 | 279,058 | ||||||
|
Cash and cash equivalents at end of period |
$ |
154,901 |
$ |
128,994 |
$ |
322,536 | |||
|
|
|||||||||
|
The accompanying notes are an integral part of these consolidated financial statements. |
|||||||||
F-7
IDEXX LABORATORIES, INC. AND SUBSIDIARIES
NOTES TO CONSOLIDATED FINANCIAL STATEMENTS
NOTE 1. NATURE OF BUSINESS, BASIS OF PRESENTATION AND PRINCIPLES OF CONSOLIDATION
The accompanying consolidated financial statements of IDEXX Laboratories, Inc. have been prepared in accordance with accounting principles generally accepted in the United States of America (“U.S. GAAP”) and with the requirements of Regulation S-X.
These statements include the accounts of IDEXX Laboratories, Inc. and our wholly-owned and majority-owned subsidiaries (“IDEXX,” the “Company,” “we” or “our”). We do not have any variable interest entities for which we are the primary beneficiary. All intercompany transactions and balances have been eliminated in consolidation.
We have included certain terms and abbreviations used throughout this Annual Report on Form 10-K in the "Glossary of Terms and Selected Abbreviations.”
We develop, manufacture and distribute products and provide services for the veterinary, bioresearch, water, livestock, poultry and dairy markets. We also sell a line of portable electrolytes and blood gas analyzers for the human point-of-care medical diagnostics market. Our principal line of business, which we refer to as our Companion Animal Group (“CAG”) operating segment, provides diagnostic capabilities and information management solutions for the veterinary market as well as biological materials testing and services for the bioresearch market. Our principal markets for these products and services are the United States (“U.S.”) and Europe, but we also sell to customers and distributors in many other countries around the world. Our Water operating segment provides innovative testing solutions for the quality and safety of water in our principal markets of the U.S. and Europe, but we also sell to customers in many other countries around the world. Our Livestock, Poultry and Dairy (“LPD”) operating segment provides diagnostic tests and related instrumentation and performs services that are used to manage the health status of livestock and poultry, to improve bovine reproductive efficiency, and to ensure the quality and safety of milk and food. Our principal markets for these products and services is Europe, China and Australia but we also sell to customers in many other countries around the world. We also operate a smaller operating segment that comprises products for the human point-of-care medical diagnostics market (“OPTI Medical”). Financial information about our OPTI Medical operating segment is combined and presented with our pharmaceutical product line and out-licensing arrangements remaining from our pharmaceutical business in an “Other” category because they do not meet the quantitative or qualitative thresholds for reportable segments. See Note 15 for additional information regarding our reportable operating segments, products and services and geographical areas.
Stock Split
On May 6, 2015, we announced a two-for-one split of our outstanding shares of common stock which was effected through a stock dividend that was paid through the issuance of treasury shares. The stock split entitled each stockholder of record at the close of business on May 18, 2015 to receive one additional share of common stock for each outstanding share of common stock held. The additional shares of our common stock paid pursuant to the stock split were distributed by our transfer agent on June 15, 2015. All share and per share amounts in the consolidated balance sheets, consolidated statement of operations and notes to the consolidated financial statements retroactively reflect the effect of the stock split unless otherwise noted.
Reclassifications
Certain prior year amounts have been reclassified to conform with the current year presentation. Reclassifications had no material impact on previously reported results of operations, financial position or cash flows.
F-8
NOTE 2. SUMMARY OF SIGNIFICANT ACCOUNTING POLICIES
(a) Estimates
The preparation of these consolidated financial statements in accordance with U.S. GAAP requires management to make estimates and judgments that affect the reported amounts of assets, liabilities, revenues and expenses, and related disclosures. On an ongoing basis, we evaluate these estimates, including those related to reserves for accounts receivable; goodwill and other intangible assets; income taxes; inventory valuation; revenue recognition, product returns, customer programs and multiple element arrangements; share-based compensation; warranty reserves; self-insurance reserves; fair value measurements and loss contingencies. We accrue contingent liabilities when it is probable that future expenditures will be made and such expenditures can be reasonably estimated. We base our estimates on historical experience and on various other assumptions that we believe to be reasonable under the circumstances, the results of which form the basis for making judgments about the carrying values of assets and liabilities that are not readily apparent from other sources. Actual results may differ from these estimates.
(b)Cash and Cash Equivalents
We consider all highly liquid investments with original maturities of ninety days or less to be cash equivalents. Cash and cash equivalents consist primarily of demand deposits, money market funds and short duration agency bonds and commercial paper as described above. There is no restricted cash on our consolidated balance sheet for the years ended December 31, 2016 and 2015.
(c)Marketable Securities – See Note 5
(d)Inventories – See Note 6
(e)Property and Equipment – See Note 7
(f)Goodwill and Other Intangible Assets – See Note 9
(g)Warranty Reserves
We provide a standard twelve-month warranty on all instruments sold. We recognize the cost of instrument warranties in cost of product revenue at the time revenue is recognized based on the estimated cost to repair the instrument over its warranty period. Cost of product revenue reflects not only estimated warranty expense for instruments sold in the current period, but also any changes in estimated warranty expense for the portion of the aggregate installed base that is under warranty. Estimated warranty expense is based on a variety of inputs, including historical instrument performance in the customers’ environment, historical and estimated costs incurred in servicing instruments and projected instrument reliability. Should actual service rates or costs differ from our estimates, revisions to the estimated warranty liability would be required. The liability for warranties is included in accrued liabilities in the accompanying consolidated balance sheets.
(h)Income Taxes – See Note 12
(i)Taxes Remitted to Governmental Authorities by IDEXX on Behalf of Customer
We calculate, collect from our customers, and remit to governmental authorities sales, value-added and excise taxes assessed by governmental authorities in connection with revenue-producing transactions with our customers. We report these taxes on a net basis and do not include these tax amounts in revenue or cost of product or service revenue.
F-9
(j)Revenue Recognition
We recognize revenue when four criteria are met: (i) persuasive evidence of an arrangement exists; (ii) delivery has occurred or services have been rendered; (iii) the sales price is fixed or determinable; and (iv) collectability is reasonably assured. Revenue generating transactions generally fall into one of the following categories of revenue recognition:
|
· |
We recognize revenue from the sales of consumables, rapid assay test kits and other diagnostic products when the product is delivered to the customer, except as noted below. |
|
· |
We recognize revenue from the sales of instruments, non-cancelable software licenses and hardware systems upon installation and the customer’s acceptance of the instrument or system as we have no significant further obligations after this point in time. |
|
· |
We recognize service revenue at the time the service is performed. |
|
· |
We recognize revenue associated with extended maintenance agreements (“EMAs”) and our software-as-a-service subscriptions over the life of the contracts using the straight-line method, which approximates the expected timing in which applicable services are performed. Amounts collected in advance of revenue recognition are recorded as current or long-term deferred revenue based on the time from the balance sheet date to the future date of revenue recognition. |
|
· |
We recognize revenue on certain instrument systems under rental programs over the life of the rental agreement using the straight-line method. Amounts collected in advance of revenue recognition are recorded as current or long-term deferred revenue based on the time from the balance sheet date to the future date of revenue recognition. |
|
· |
We recognize revenue on practice management systems sales, where the system includes software that is considered more than incidental, either by allocating the revenue to each element of the sale based on relative fair values of the elements, including post-contract support when fair value for all elements is available, or by use of the residual method when only the fair value of the post-contract support is available. We recognize revenue for the system upon installation and customer acceptance and recognize revenue equal to the fair value of the post-contract support over the support period. |
|
· |
Shipping costs reimbursed by the customer are included in revenue. These same costs are also included in cost of product revenue. |
Multiple Element Arrangements (“MEAs”). Arrangements to sell products to customers frequently include multiple deliverables. Our most significant MEAs include the sale of one or more of the instruments from the IDEXX VetLab suite of analyzers, diagnostic imaging systems or practice management software, combined with one or more of the following products: EMAs, consumables, rapid assay kits and reference laboratory diagnostic and consulting services. Practice management software is frequently sold with post-contract customer support and implementation services. Delivery of the various products or performance of services within the arrangement may or may not coincide. Delivery of our IDEXX VetLab instruments, diagnostic imaging systems, and practice management software generally occurs at the onset of the arrangement. EMAs, consumables, rapid assay kits, and reference laboratory diagnostic and consulting services typically are delivered over future periods, generally one to six years. In certain arrangements, revenue recognized is limited to the amount invoiced or received that is not contingent on the delivery of products and services in the future.
F-10
We allocate revenue to each element based on the relative selling price and recognize revenue when the elements have standalone value and the four criteria for revenue recognition, as discussed above, have been met for each element. If available, we establish the selling price of each element based on vendor-specific objective evidence (“VSOE”), which represents the price charged for a deliverable when it is sold separately. We use third-party evidence (“TPE”) if VSOE is not available or best estimate of selling price if neither VSOE nor TPE is available. When these arrangements include a separately-priced EMA, we recognize revenue related to the EMA at the stated contractual price on a straight-line basis over the life of the agreement to the extent the separately stated price is substantive. If there is no stated contractual price for an EMA, or the separately stated price is not substantive, we allocate revenue to each element based on the relative selling price and recognize revenue when the elements have standalone value and the four criteria for revenue recognition, as discussed above, have been met for each element.
When arrangements within the scope of software revenue recognition guidance include multiple elements, we allocate revenue to each element based on relative fair value, when VSOE exists for all elements, or by using the residual method when there is VSOE for the undelivered elements but no such evidence for the delivered elements. Under the residual method, the fair value of the undelivered elements is deferred and the residual revenue is allocated to the delivered elements. Revenue is recognized on any delivered elements when the four criteria for revenue recognition have been met for each element. If VSOE does not exist for the undelivered element, all revenue from the arrangement is deferred until the earlier of the point at which such sufficient VSOE does exist or all elements of the arrangement have been delivered. We determine fair value based on amounts charged separately for the delivered and undelivered elements to similar customers in standalone sales of the specific elements.
Certain arrangements with customers include discounts on future sales of products and services. We apply judgment in determining whether future discounts are significant and incremental. When the future discount offered is not considered significant and incremental, we do not account for the discount as an element of the original arrangement. If the future discount is significant and incremental, we recognize that discount as an element of the original arrangement and allocate the discount to the other elements of the arrangement based on relative selling price. To determine whether a discount is significant and incremental, we look to the discount provided in comparison to standalone sales of the same product or service to similar customers, the level of discount provided on other elements in the arrangement, and the significance of the discount to the overall arrangement. If the discount in the MEA approximates the discount typically provided in standalone sales, that discount is not considered incremental.
Customer Programs. We record reductions to revenue related to customer marketing and incentive programs, which include end-user rebates and other volume-based incentives. Incentives may be provided in the form of IDEXX Points, credits or cash and are earned by end users upon achieving defined volumes of purchases or utilization levels or upon entering an agreement to purchase products or services in future periods. Our most significant customer programs are categorized as follows:
Customer Loyalty Programs. Our customer loyalty programs offer customers the opportunity to earn incentives on a variety of IDEXX products and services as those products and services are purchased and utilized. Revenue reductions related to customer loyalty programs are recorded based on the actual issuance of incentives, incentives earned but not yet issued and estimates of incentives to be earned in the future.
Up-Front Customer Loyalty Programs. Our up-front loyalty programs provide incentives to customers in the form of cash payments or IDEXX Points upon entering multi-year agreements to purchase annual minimum amounts of future products or services. If a customer breaches its agreement, it is required to refund all or a portion of the up-front cash or IDEXX Points, or make other repayments, remedial actions or both. These incentives are considered to be customer acquisition costs and are capitalized within other current assets and other long-term assets and are subsequently recognized as a reduction to revenue over the term of the customer agreement. If these up-front incentives are subsequently utilized to purchase IDEXX VetLab instruments, diagnostic imaging systems or Cornerstone practice management systems, product revenue and cost is deferred and recognized over the term of the customer agreement as products and services are provided to the customer. We monitor customer purchases over the term of their agreement to assess the realizability of our capitalized customer acquisition costs. For the years ended December 31, 2016, 2015 and 2014, impairments of customer acquisition costs were immaterial.
F-11
IDEXX Instrument Marketing Programs. Our instrument marketing programs require the customer to enroll at the time of instrument purchase and offer customers the opportunity to earn incentives in future periods based on the volume of the products they purchase and utilize over the term of the program. These arrangements are considered MEAs in accordance with our revenue recognition policy stated above. Revenue reductions related to instrument marketing programs are recorded based on an estimate of customer purchase and utilization levels and the incentive the customer will earn over the term of the program. Our estimates are based on historical experience and the specific terms and conditions of the marketing program and require us to apply judgment to estimate future product purchases and utilization. Differences between our estimates and actual incentives earned are accounted for as a change in estimate. These differences were not material for the years ended December 31, 2016, 2015 and 2014.
Reagent Rental Programs. Our reagent rental programs provide our customers the right to use our instruments in consideration for multi-year agreements to purchase annual minimum amounts of consumables. No instrument revenue is recognized at the time of instrument installation. We recognize a portion of the revenue allocated to the instrument concurrent with the future sale of consumables. We determine the amount of revenue allocated from the consumable to the instrument based on relative selling prices and determine the rate of instrument revenue recognition in proportion to the customer’s minimum volume commitment. The cost of the instrument is capitalized within property and equipment or other assets, and is charged to cost of product revenue on a straight-line basis over the term of the minimum purchase agreement.
IDEXX Points may be applied against the purchase price of IDEXX products and services or applied to trade receivables due to us. IDEXX Points that have not yet been used by customers are classified as a liability until use or expiration occurs. We estimate the amount of IDEXX Points expected to expire, or breakage, based on historical expirations and we recognize the estimated benefit of breakage in proportion to actual redemptions of IDEXX Points by customers. On November 30 of each year, unused IDEXX Points earned before January 1 of the prior year generally expire and any variance from the breakage estimate is accounted for as a change in estimate. This variance was not material for the years ended December 31, 2016, 2015 and 2014.
Future market conditions and changes in product offerings may cause us to change marketing strategies to increase or decrease customer incentive offerings, possibly resulting in incremental reductions of revenue in future periods as compared to reductions in the current or prior periods. Additionally, certain customer programs require us to estimate, based on historical experience, and apply judgment to predict the number of customers who will actually redeem the incentive. In determining estimated revenue reductions, we utilize data collected directly from end users, which includes the volume of qualifying products purchased and the number of qualifying tests run as reported to us by end users via IDEXX SmartService, a secure internet link that enables us to extract data and provide diagnostic service and support for certain IDEXX VetLab instruments through remote access. Differences between estimated and actual customer participation in programs may impact the amount and timing of revenue recognition.
Doubtful Accounts Receivable. We recognize revenue when collection from the customer is reasonably assured. We maintain allowances for doubtful accounts for potentially uncollectible receivables. We base our estimates on a detailed analysis of specific customer situations and a percentage of our accounts receivable by aging category. Additional allowances may be required if either the financial condition of our customers were to deteriorate or a strengthening U.S. dollar impacts the ability of foreign customers to make payments to us on their U.S. denominated purchases. Account balances are charged off against the allowance when we believe it is probable the receivable will not be recovered. We do not have any off-balance sheet credit exposure related to our customers. We have no significant customers that accounted for greater than 10 percent of our consolidated revenues for the year ended December 31, 2016. Similarly, we have no concentration of credit risk as of December 31, 2016.
(k)Research and Development Costs
Research and development costs, which consist of salaries, employee benefits, materials and external consulting and product development costs, are expensed as incurred. We evaluate our software research and development costs for capitalization after the technological feasibility of software and products containing software has been established. No costs were capitalized during the years ended December 31, 2016, 2015 and 2014.
F-12
(l)Advertising Costs
Advertising costs, which are recognized as sales and marketing expense in the period in which they are incurred, were $2.1 million for the year ended December 31, 2016, $1.2 million for the years ended December 31, 2015 and 2014.
(m)Legal Costs
Legal costs are considered period costs and accordingly are expensed in the year services are provided.
(n)Share-Based Compensation – See Note 4
(o)Self-Insurance Accruals
We self-insure costs associated with workers’ compensation and health and general welfare claims incurred by our U.S. and Canadian employees up to certain limits. The insurance company provides insurance for claims above these limits. Claim liabilities are recorded for estimates of the loss that we will ultimately incur on reported claims, as well as estimates of claims that have been incurred but not yet reported. Such liabilities are based on individual coverage, the average time from when a claim is incurred to the time it is paid and judgments about the present and expected levels of claim frequency and severity. Estimated claim liabilities could be significantly affected if future occurrences and claims differ from these assumptions and historical trends. Estimated claim liabilities are included in accrued liabilities in the accompanying consolidated balance sheets.
(p)Leases – See Note 14
(q)Earnings per Share – See Note 13
(r)Foreign Currency
The functional currency of all but three of our subsidiaries is their local currency. Assets and liabilities of these foreign subsidiaries are translated to the U.S. dollar using the exchange rate in effect at the balance sheet date. Revenue and expense accounts are translated to the U.S. dollar using the exchange rate at the date which those elements are recognized, and where it is impractical to do so, an average exchange rate in effect during the period is used to translate those elements. Cumulative translation gains and losses are shown in the accompanying consolidated balance sheets as a separate component of accumulated other comprehensive income (“AOCI”).
Revenues and expenses denominated in a currency other than the respective subsidiary’s functional currency are recorded at the current exchange rate when the transaction is recognized. Monetary assets and liabilities denominated in a currency other than the respective subsidiary’s functional currency are remeasured at each balance sheet date using the exchange rate in effect at each balance sheet date. These foreign currency gains and losses are included in general and administrative expenses. We recognized aggregate foreign currency losses of $1.3 million for the year ended December 31, 2016, $0.2 million for the year ended December 31, 2015, and $2.0 million for the year ended December 31, 2014.
(s)Hedging Instruments – See Note 17
(t)Fair Value Measurements – See Note 16
F-13
(u)Comprehensive Income
We report all changes in equity, including net income and transactions or other events and circumstances from non-owner sources during the period in which they are recognized. We have chosen to present comprehensive income, which encompasses net income, foreign currency translation adjustments, gains and losses on our net investment hedge and the difference between the cost and the fair market value of investments in debt and equity securities, forward currency exchange contracts and interest rate swap agreements, in the consolidated statements of comprehensive income. See Note 19 for information about the effects on net income of significant amounts reclassified out of each component of AOCI for the years ended December 31, 2016 and 2015. We consider the foreign currency cumulative translation adjustment to be permanently invested and, therefore, have not provided income taxes on those amounts.
(v)Concentrations of Risk
Financial Instruments. Financial instruments that potentially subject us to concentrations of credit risk are principally cash, cash equivalents, accounts receivable and derivatives. To mitigate such risk with respect to cash and cash equivalents, we place our cash with highly-rated financial institutions, in non-interest bearing accounts that are insured by the U.S. government and money market funds invested in government securities.
Concentration of credit risk with respect to accounts receivable is limited to certain customers to whom we make substantial sales. To reduce risk, we routinely assess the financial strength of our most significant customers and monitor the amounts owed to us, taking appropriate action when necessary. As a result, we believe that accounts receivable credit risk exposure is limited. We maintain an allowance for doubtful accounts, but historically have not experienced any material losses related to an individual customer or group of customers in any particular industry or geographic area.
To mitigate concentration of credit risk with respect to derivatives we enter into transactions with highly-rated financial institutions, enter into master netting arrangements with the counterparties to our derivative transactions and frequently monitor the credit worthiness of our counterparties. Our master netting arrangements reduce our exposure in that they permit outstanding receivables and payables with the counterparties to our derivative transactions to be offset in the event of default. We have not incurred such losses and consider the risk of counterparty default to be minimal.
Inventory. If we are unable to obtain adequate quantities of the inventory we need to sell our products, we could face cost increases or delays or discontinuations in product shipments, which could have a material adverse effect on our results of operations. Many of the third parties that provide us with the instruments we sell and certain components, raw materials and consumables used in or with our products are obtained from sole or single source suppliers. Some of the products that we purchase from these sources are proprietary or complex in nature, and, therefore, cannot be readily or easily replaced by alternative sources.
(w)New Accounting Pronouncements Not Yet Adopted
In May 2014, the Financial Accounting Standards Board (“FASB”) issued a new standard which will replace most of the existing revenue recognition guidance within U.S. GAAP. Under the new standard, an entity should recognize revenue for the transfer of goods or services to customers in an amount that it expects to be entitled to receive for those goods or services. In doing so, companies will be required to make certain judgments and estimates, including identifying contract performance obligations, estimating the amount of variable consideration to include in the transaction price and allocating the transaction price among separate performance obligations. Additionally, the new standard requires disclosure about the nature, amount, timing and uncertainty of revenue and cash flows arising from customer contracts, significant judgments reached in the application of the guidance and assets recognized from the costs to obtain or fulfill a contract. In July 2015, the FASB approved a one-year deferral of the effective date to all annual and interim periods beginning after December 15, 2017. The guidance permits two methods of adoption: a full retrospective method to each prior reporting period presented or a modified retrospective approach with the cumulative effect of initially applying the guidance recognized at the date of initial application. We are continuing to evaluate the impact of this new standard. While the new standard will not impact the overall economics of our products and services sold under customer incentive programs, we do expect the new standard will require us to delay revenue recognition related to certain of our customer incentive programs and to accelerate
F-14
revenue recognition for certain other customer incentive programs. The volume and mix of future customer incentive programs will affect our assessment of the overall net impact of the new standard on our results and will also influence our choice of adoption method. We plan to determine our method of adoption and provide an estimate of any impacts by October 2017, in connection with our financial reporting for the quarter ending September 30, 2017.
In February 2016, the FASB issued amendments to increase transparency and comparability among organizations’ leasing arrangements. The principal difference from previous guidance is that effective upon adoption, the lease assets and lease liabilities arising from operating leases will be recognized in the balance sheet. For public business entities, the amendments in this update are effective for fiscal years beginning after December 15, 2018, including interim periods within those fiscal years. Early adoption is permitted. In transition, we are required to recognize and measure leases at the beginning of the earliest period presented using a modified retrospective approach, including the option to utilize a number of practical expedients. We are in process of evaluating our lessee and lessor arrangements to determine the impact of this amendment on the consolidated financial statements. This evaluation includes an extensive review of revenue through leasing arrangements as well as lease expenses, which are primarily through operating lease arrangements for most of our facilities.
In March 2016, the FASB issued amendments which simplify several aspects of the accounting for share-based payment transactions, including income tax consequences, recognition of stock compensation award forfeitures, classification of awards as either equity or liabilities, the calculation of diluted shares outstanding and classification on the statement of cash flows. The most significant change resulting from these amendments is recording all the tax effects related to share-based payments at settlement through the income statement. Under existing guidance, tax benefits in excess of compensation costs (“windfalls”) are recorded in equity. Similarly, tax deficiencies below compensation costs (“shortfalls”) are recorded in equity to the extent of previous windfalls, while shortfalls in excess of this are recorded to the income statement. Furthermore, the new guidance is expected to increase the dilutive effect of share-based payment awards as a result of no longer assuming that tax benefits are used to purchase our common stock under the treasury method. The amendments also provide an alternative to estimating stock award forfeitures and instead recording at the time of forfeiture. We will adopt this update beginning in the first quarter of 2017. We estimate that tax benefits related to share-based payments will add approximately $0.12 to $0.16 in annual diluted earnings per share for 2017, primarily through a reduction in IDEXX’s effective tax rate, partially offset by an increase in diluted shares outstanding resulting from this accounting change. These impacts may vary significantly by quarter based on the timing of actual settlement activity.
In June 2016, the FASB issued amendments that requires financial assets measured at amortized cost be presented at the net amount expected to be collected. The allowance for credit losses is a valuation account that is deducted from the amortized cost basis of the financial asset to present the net carrying value at the amount expected to be collected. The income statement reflects the measurement of credit losses for newly recognized financial assets, as well as the increases or decreases of expected credit losses that have taken place during the period. The measurement of expected credit losses is based upon historical experience, current conditions, and reasonable and supportable forecasts that affect the collectability of the reported amount. Credit losses relating to available-for-sale debt securities will be recorded through an allowance for credit losses rather than as a direct write-down to the security. Credit losses on available-for-sale securities will be required when the amortized cost is below the fair market value. During 2016, the amortized cost of our available-for-sale securities was within $0.1 million of the fair value. The amendments in this update are effective for fiscal years beginning after December 15, 2019 and interim periods within those annual periods. Early adoption for fiscal year beginning after December 15, 2018 is permitted. We will apply the standard’s provisions as a cumulative-effect adjustment to retained earnings as of the beginning of the first effective reporting period. This amendment is not expected to have a material impact on our financial statements.
In August 2016, the FASB issued amendments that provide guidance on the statement of cash flows presentation of certain transactions where diversity in practice exists on the classification of certain cash receipts and payment. The effective date will be the first quarter of an entity’s fiscal year 2019, with early adoption permitted. The amendment should be adopted using a retrospective transition approach, but may be applied prospectively if retrospective application would be impracticable. This amendment is not expected to have a material impact on our financial statements.
F-15
In October 2016, the FASB issued an amendment that requires an entity to recognize the income tax consequences of an intra-entity transfer of an asset, other than inventory, when the transfer occurs, even though the pre-tax effects of that transaction are eliminated in consolidation. The amendments are effective for fiscal years, and interim periods within those fiscal years, beginning after December 15, 2017. These amendments should be applied on a modified retrospective basis through a cumulative-effect adjustment directly to retained earnings at the beginning of the period adopted. Early adoption is permitted in the first interim period of an annual reporting period for which financial statements have not been issued. We are in the process of determining the impact of these amendments on our consolidated financial statements.
In November 2016, the FASB amended current cash flow guidance to add guidance on the classification and presentation of restricted cash. These amendments require that a statement of cash flows explain the change during the period in the total of cash, cash equivalents, and amounts generally described as restricted cash or restricted cash equivalents. Amounts generally described as restricted cash and restricted cash equivalents should be included with cash and cash equivalents when reconciling the beginning-of-period and end-of-period total amounts shown on the statement of cash flows. The amendments are effective for fiscal years beginning after December 15, 2017, and interim periods within those fiscal years. We do not expect the adoption of the amendments to have a material impact our consolidated financial statements.
In January 2017, the FASB amended business combination guidance to modify the definition of a business. The amended definition of a business is an integrated set of activities and assets that is capable of being conducted and managed for the purpose of providing a return in the form of dividends, lower costs, or other economic benefits directly to investors or other owners, members or participants. In order to be considered a business, the three elements of inputs, processes and outputs must be present. In a business acquisition, if substantially all of the fair value of the gross assets acquired is concentrated in a single identifiable asset or group of similar identifiable assets, the integrated set of assets and activities acquired is not considered a business. The amendments are effective for fiscal years beginning after December 15, 2017, and interim periods within those fiscal years. Early adoption is permitted. This amendment may impact the allocation of purchase price in future acquisitions depending on the structure of future acquisitions.
In January 2017, the FASB amended the goodwill guidance to simplify the subsequent measurement of goodwill by eliminating Step 2 from the goodwill impairment test. Instead, an entity should perform its annual, or interim, goodwill impairment test by comparing the fair value of a reporting unit with its carrying amount. An entity should recognize an impairment charge for the amount by which the carrying amount exceeds the reporting unit’s fair value; however, the loss recognized should not exceed the total amount of goodwill. The amendments are effective for annual or any interim goodwill impairment test in fiscal years beginning after December 15, 2019. Early adoption is permitted for interim or annual goodwill impairment tests performed on testing dates after January 1, 2017. We do not expect the adoption of the amendments to have a material impact our consolidated financial statements.
NOTE 3. ACQUISITIONS
We believe that our acquisitions of businesses and other assets enhance our existing businesses by either expanding our geographic range and customer base or expanding our existing product lines.
During the year ended December 31, 2016, we paid an aggregate of $3.5 million in cash and amounts payable to acquire the assets of a veterinary reference laboratory testing business. We preliminarily allocated the purchase price and recognized customer related amortizable intangible assets and goodwill. The fair value of the fixed assets acquired was immaterial. Goodwill is calculated as the consideration in excess of net assets recognized and represents the future economic benefits arising from other assets acquired that could not be individually identified and separately recognized. The goodwill recorded from the business acquisition is deductible for income tax purposes. All assets acquired in connection with this acquisition were assigned to our CAG segment. Pro forma information has not been presented for this business acquisition because such information is not material to the financial statements. We expect the purchase price allocation will be completed in the first quarter of 2017.
F-16
During the year ended December 31, 2015, we paid an aggregate of $7.5 million in cash and recorded contingent consideration of $3.2 million to acquire the assets of two reference laboratory diagnostic and consulting businesses, each accounted for as a separate business combination. As part of these business acquisitions, we recognized $5.2 million in customer list amortizable intangible assets, $5.0 million in goodwill, $1.1 million in working capital, $0.3 million in fixed assets and a deferred tax liability of $0.9 million. The customer lists were each assigned useful lives of 15 years. Goodwill is calculated as the consideration in excess of net assets recognized and represents the future economic benefits arising from other assets acquired that could not be individually identified and separately recognized. The goodwill recorded from these business acquisitions is not deductible for income tax purposes. All assets acquired in connection with these business acquisitions were assigned to our CAG segment. One of the businesses acquired is located outside of the U.S. and, as such, the assets and liabilities recorded are subject to impacts of changes in foreign currency exchange rates. The results of operations of these acquired businesses have been included since the acquisition date. Pro forma information has not been presented for these business acquisitions because such information is not material to the financial statements.
During the year ended December 31, 2014, we paid an aggregate of $24.9 million, to acquire seven businesses, each accounted for as separate business combinations as described below.
We paid an aggregate of $18.7 million in cash and recorded contingent consideration of $4.2 million upon the acquisition of substantially all outstanding shares of a business and the assets of two other businesses, all of which comprise cloud-based veterinary practice software. As part of the business acquisitions, we recorded $11.7 million in amortizable intangible assets and $12.4 million in goodwill. Amortizable intangible assets primarily consisted of customer lists and software which were assigned weighted average useful lives of 16.4 years and 7.0 years, respectively. The weighted average useful life of all recognized amortizable intangible assets was 11.4 years. Of the total goodwill and amortizable assets acquired, $5.6 million of amortizable intangible assets are deductible for income tax purposes. All assets acquired in connection with these business combinations were assigned to our CAG segment. Two out of three businesses acquired are located outside of the U.S. and, as such, the assets and liabilities recorded are subject to impacts of changes in foreign currency exchange rates. The results of operations of these acquired businesses and assets have been included since the acquisition date. Pro forma information has not been presented for these business acquisitions because such information is not material to the financial statements.
We paid an aggregate of $6.2 million in cash and recorded contingent consideration of $1.5 million upon the acquisition of all outstanding shares of two veterinary reference laboratory testing businesses and to acquire the assets of two veterinary reference laboratory testing businesses. The purchase price in these business acquisitions was allocated primarily to customer list intangible assets, which were assigned a weighted average useful life of 13.3 years. $4.9 million of amortizable intangible assets associated with these acquisitions are deductible for income tax purposes. All assets acquired in connection with these business acquisitions were assigned to our CAG segment. Certain of these business acquisitions were of businesses located outside of the U.S. and, as such, the assets and liabilities recorded are subject to impacts of changes in foreign currency exchange rates. The results of operations of these acquired businesses have been included since the acquisition date. Pro forma information has not been presented for these business acquisitions because such information is not material to the financial statements.
NOTE 4. SHARE-BASED COMPENSATION
We provide for various forms of share-based compensation awards to our employees and non-employee directors. With the exception of stock options, the fair value of our awards is equal to the closing stock price of IDEXX common stock on the date of grant. We calculate the fair value of our stock option awards using the Black-Scholes-Merton option-pricing model. Share-based compensation expense is recognized net of estimated forfeitures, on a straight-line basis over the requisite service period of the award.
F-17
Share-Based Awards
Our share-based compensation plans allow for the issuance of a mix of stock options, restricted stock, stock appreciation rights, employee stock purchase rights and other stock unit awards. Other stock unit awards include restricted stock units (“RSUs”) and deferred stock units (“DSUs”). Stock options permit a holder to buy IDEXX stock upon vesting at the stock’s price on the date the option was granted. An RSU is an agreement to issue shares of IDEXX stock at the time of vesting. DSUs are granted under our Executive Deferred Compensation Plan (the “Executive Plan”) and non-employee Director Deferred Compensation Plan (the “Director Plan”). DSUs may or may not have vesting conditions depending on the plan under which they are issued. We did not issue any restricted stock or stock appreciation rights during the years ended December 31, 2016, 2015 and 2014, nor were any restricted stock or stock appreciation rights outstanding as of those years ended. There were no material modifications to the terms of outstanding options, RSUs or DSUs during the years ended December 31, 2016, 2015 or 2014.
We primarily issue shares of common stock to satisfy stock option exercises and employee stock purchase rights and to settle RSUs and DSUs. We issue shares of treasury stock to settle certain RSUs and upon the exercise of certain stock options, which were not material for the years ended December 31, 2016, 2015 and 2014. The number of shares of common stock and treasury stock issued are equivalent to the number of awards exercised or settled.
With the exception of employee stock purchase rights, equity awards are issued to employees and non-employee directors under the 2009 Stock Incentive Plan (the “2009 Stock Plan”). Our Board of Directors has authorized the issuance of 19,900,000 shares of our common stock under this share-based incentive plan. Any shares that are subject to awards of stock options or stock appreciation rights will be counted against the share limit as one share for every share granted. Any shares that are issued other than stock options and stock appreciation rights will be counted against the share limit as two shares for every share granted. If any shares issued under our prior plans are forfeited, settled for cash or expire, these shares, to the extent of such forfeiture, cash settlement or expiration, will again be available for issuance under the 2009 Stock Plan. As of December 31, 2016, there were 11,711,752 remaining shares available for issuance under the 2009 Stock Plan.
Employee stock purchase rights are issued under the 1997 Employee Stock Purchase Plan, under which we reserved and may issue up to an aggregate of 4,700,000 shares of common stock in periodic offerings. Under this plan, stock is sold to employees at a 15 percent discount off the closing price of the stock on the last day of each quarter. The dollar value of this discount is equal to the fair value of purchase rights recognized as share-based compensation. We issued 85,432, 105,000 and 93,000 shares of common stock in connection with the Employee Stock Purchase Plan during the years ended December 31, 2016, 2015 and 2014, respectively. As of December 31, 2016, there were 1,308,328 remaining shares available for issuance under the 1997 Employee Stock Purchase Plan.
Share-Based Compensation
Share-based compensation costs are classified in our consolidated financial statements consistent with the classification of cash compensation paid to the employees receiving such share-based compensation. The following is a summary of share-based compensation costs and related tax benefits recorded in our consolidated statements of income for the years ended December 31, 2016, 2015 and 2014 (in thousands):
|
|
|||||||||
|
|
For the Years Ended December 31, |
||||||||
|
|
2016 | 2015 | 2014 | ||||||
|
|
|||||||||
|
Share-based compensation expense included in cost of revenue |
$ |
2,305 |
$ |
2,138 |
$ |
1,937 | |||
|
Share-based compensation expense included in operating expenses |
17,586 | 17,746 | 16,162 | ||||||
|
Total share-based compensation expense included in consolidated statements of income |
19,891 | 19,884 | 18,099 | ||||||
|
Income tax benefit resulting from share-based compensation arrangements |
(6,143 |
) |
(6,229 |
) |
(6,107 |
) |
|||
|
Net impact of share-based compensation on net income |
$ |
13,748 |
$ |
13,655 |
$ |
11,992 | |||
Share-based compensation expense is reduced for an estimate of the number of awards that are expected to be forfeited. We use historical data and other factors to estimate expected employee terminations and to evaluate whether particular groups of employees have significantly different forfeiture expectations.
F-18
The total unrecognized compensation expense, net of estimated forfeitures, for unvested share-based compensation awards at December 31, 2016, was $38.0 million, which will be recognized over a weighted average period of approximately 1.6 years.
Stock Options
Option awards are granted with an exercise price equal to the closing market price of our common stock on the date of grant. Options granted to employees primarily vest ratably over five years on each anniversary of the date of grant and options granted to non-employee directors vest fully on the first anniversary of the date of grant. Vesting of option awards issued is conditional based on continuous service. Options granted after May 8, 2013 have a contractual term of ten years, options granted between January 1, 2006 and May 8, 2013 have contractual terms of seven years and options granted prior to January 1, 2006 had contractual terms of ten years. Upon any change in control of the company, 25 percent of the unvested stock options then outstanding will vest and become exercisable. However, if the acquiring entity does not assume outstanding options, then all options will vest immediately prior to the change in control.
We use the Black-Scholes-Merton option-pricing model to determine the fair value of options granted. Option-pricing models require the input of highly subjective assumptions, particularly for the expected stock price volatility and the expected term of options. Changes in the subjective input assumptions can materially affect the fair value estimate. Our expected stock price volatility assumptions are based on the historical volatility of our stock over periods that are similar to the expected terms of grants and other relevant factors. We derive the expected term based on historical experience and other relevant factors concerning expected employee behavior with regard to option exercise. The risk-free interest rate is based on U.S. Treasury yields for a maturity approximating the expected term calculated at the date of grant. We have never paid any cash dividends on our common stock and we have no intention to pay a dividend at this time; therefore, we assume that no dividends will be paid over the expected terms of option awards.
We determine the assumptions used in the valuation of option awards as of the date of grant. Differences in the expected stock price volatility, expected term or risk-free interest rate may necessitate distinct valuation assumptions at those grant dates. As such, we may use different assumptions for options granted throughout the year. The weighted averages of the valuation assumptions used to determine the fair value of each option award on the date of grant and the weighted average estimated fair values were as follows:
|
|
||||||||||||
|
|
For the Years Ended December 31, |
|||||||||||
|
|
2016 | 2015 | 2014 | |||||||||
|
|
||||||||||||
|
Expected stock price volatility |
25 |
% |
23 |
% |
28 |
% |
||||||
|
Expected term, in years |
5.7 | 5.6 | 5.7 | |||||||||
|
Risk-free interest rate |
1.2 |
% |
1.5 |
% |
1.5 |
% |
||||||
|
|
||||||||||||
|
Weighted average fair value of options granted |
$ |
17.87 |
$ |
19.72 |
$ |
18.07 | ||||||
F-19
A summary of the status of options granted under our share-based compensation plans at December 31, 2016, and changes during the year then ended, are presented in the table below:
|
|
|||||||||
|
|
Number of Options (000) |
Weighted Average Exercise Price |
Weighted Average Remaining Contractual Term |
Aggregate Intrinsic Value ($000) |
|||||
|
|
|||||||||
|
Outstanding as of December 31, 2015 |
3,384 |
$ |
49.76 | ||||||
|
Granted |
745 | 69.07 | |||||||
|
Exercised |
(838) | 37.04 | |||||||
|
Forfeited |
(115) | 59.34 | |||||||
|
Expired |
- |
- |
|||||||
|
Outstanding as of December 31, 2016 |
3,176 |
$ |
57.31 | 5.3 |
$ |
190,424 | |||
|
|
|||||||||
|
Fully vested as of December 31, 2016 |
1,510 |
$ |
46.92 | 3.2 |
$ |
106,255 | |||
|
|
|||||||||
|
Fully vested and expected to vest as of December 31, 2016 |
3,034 |
$ |
56.78 | 5.2 |
$ |
183,550 | |||
The total fair value of options vested was $9.3 million during the year ended December 31, 2016, $8.7 million during the year ended December 31, 2015, and $7.8 million during the year ended December 31, 2014.
Intrinsic value of stock options exercised represents the amount by which the market price of the common stock exceeded the exercise price, before applicable income taxes. The total intrinsic value of stock options exercised was $51.0 million during the year ended December 31, 2016, $35.1 million during the year ended December 31, 2015, and $51.2 million during the year ended December 31, 2014.
Restricted Stock Units
The majority of RSUs granted to employees vest ratably over five years on each anniversary of the date of grant. RSUs granted to non-employee directors vest fully on the first anniversary of the date of grant. Vesting as it relates to RSUs issued is conditional based on continuous service. Upon any change in control of the company, 25 percent of the unvested RSUs then outstanding will vest, provided, however, that if the acquiring entity does not assume the RSUs, then all such units will vest immediately prior to the change in control.
A summary of the status of RSUs granted under our share-based compensation plans at December 31, 2016, and changes during the period then ended, are presented in the table below:
|
|
|||||||||
|
|
Number of Units (000) |
Weighted Average Grant-Date Fair Value |
|||||||
|
|
|||||||||
|
Nonvested as of December 31, 2015 |
498 |
$ |
58.94 | ||||||
|
Granted |
173 | 69.14 | |||||||
|
Vested |
(170) | 52.60 | |||||||
|
Forfeited |
(33) | 60.46 | |||||||
|
Nonvested as of December 31, 2016 |
468 |
$ |
64.88 | ||||||
|
|
|||||||||
|
Expected to vest as of December 31, 2016 |
418 |
$ |
64.44 | ||||||
The total fair value of RSUs vested was $12.4 million during the year ended December 31, 2016, $15.3 million during the year ended December 31, 2015, and $15.4 million during the year ended December 31 2014. The aggregate intrinsic value of nonvested RSUs as of December 31, 2016, is equal to the fair value of IDEXX’s common stock as of December 31, 2016, multiplied by the number of nonvested units as of December 31, 2016.
F-20
Deferred Stock Units
Under our Director Plan, non-employee directors may defer a portion of their cash fees in the form of vested DSUs. Prior to 2014, certain members of our management could elect to defer a portion of their cash compensation in the form of vested deferred stock units under our Executive Plan. Each DSU represents the right to receive one unissued share of our common stock. These recipients receive a number of DSUs equal to the amount of cash fees or compensation deferred divided by the closing sale price of the common stock on the date of deferral. Also under the Director Plan, non-employee directors are awarded annual grants of DSUs that vest fully on the first anniversary of the date of grant. Vesting for these annual DSU grants is conditional based on continuous service. DSUs are exchanged for a fixed number of shares of common stock, upon vesting if vesting criteria apply, subject to the limitations of the Director and Executive Plans and applicable law.
There were approximately 231,000 and 240,000 vested DSUs outstanding under our share-based compensation plans as of December 31, 2016 and 2015, respectively. Unvested DSUs as of December 31, 2016 and 2015, were not material.
NOTE 5. MARKETABLE SECURITIES
During the year ended December 31, 2016, we purchased marketable debt securities, which are classified as available-for-sale and carried at fair value in the accompanying consolidated balance sheets on a trade date basis. We have classified our investments with maturities beyond one year as short-term, based on their highly liquid nature and because such marketable securities represent the investment of cash that is available for current operations. Unrealized holding gains and losses are deferred within accumulated other comprehensive income (“AOCI”), net of applicable taxes, except for when an impairment is determined to be other-than-temporary or the security is divested prior to maturity. Within the accompanying consolidated statements of operations, interest earned and amortization of premiums or discounts on marketable securities are included in interest income, realized gains and losses on the sale of our marketable securities are included in other income.
The amortized cost and fair value of marketable securities were as follows (in thousands):
|
As of December 31, 2016 |
Amortized Cost |
Gross Unrealized Gains |
Gross Unrealized Losses |
Fair Value |
|||||||||
|
|
|||||||||||||
|
Corporate bonds |
$ |
130,833 |
$ |
40 |
$ |
(102) |
$ |
130,771 | |||||
|
Certificates of deposit |
40,400 |
- |
- |
40,400 | |||||||||
|
Asset backed securities |
27,290 | 25 |
- |
27,315 | |||||||||
|
Commercial paper |
20,228 |
- |
- |
20,228 | |||||||||
|
U.S. government bonds |
12,244 | 1 | (14) | 12,231 | |||||||||
|
Agency bonds |
4,600 | 4 |
- |
4,604 | |||||||||
|
Municipal bonds |
1,400 |
- |
- |
1,400 | |||||||||
|
Total marketable securities |
$ |
236,995 |
$ |
70 |
$ |
(116) |
$ |
236,949 | |||||
|
|
|||||||||||||
|
As of December 31, 2015 |
Amortized Cost |
Gross Unrealized Gains |
Gross Unrealized Losses |
Fair Value |
|||||||||
|
|
|||||||||||||
|
Corporate bonds |
$ |
177,810 |
$ |
24 |
$ |
(221) |
$ |
177,613 | |||||
|
U.S. government bonds |
12,881 |
- |
(10) | 12,871 | |||||||||
|
Agency bonds |
12,068 |
- |
(3) | 12,065 | |||||||||
|
Certificates of deposit |
3,500 |
- |
- |
3,500 | |||||||||
|
Commercial paper |
3,491 |
- |
- |
3,491 | |||||||||
|
International government bonds |
1,462 |
- |
(3) | 1,459 | |||||||||
|
Municipal bonds |
1,400 |
- |
(1) | 1,399 | |||||||||
|
Treasury bill |
1,192 | 1 |
- |
1,193 | |||||||||
|
Total marketable securities |
$ |
213,804 |
$ |
25 |
$ |
(238) |
$ |
213,591 |
F-21
No marketable securities have been in a continuous unrealized loss position for more than twelve months. Our portfolio of marketable securities had an average AA- credit rating as of December 31, 2016. There were no marketable securities that we consider to be other-than-temporarily impaired as of December 31, 2016. Our investment strategy is to buy short-duration marketable securities with a high credit rating. Some of our marketable securities have call features that can effectively shorten the lifespan from the contractual maturity date. We use effective maturity date to measure the duration of the marketable securities.
Remaining effective maturities of marketable securities were as follows (in thousands):
|
As of December 31, 2016 |
Amortized Cost |
Fair Value |
|||||
|
|
|||||||
|
Due in one year or less |
$ |
169,044 |
$ |
169,002 | |||
|
Due after one through two years |
67,951 | 67,947 | |||||
|
|
$ |
236,995 |
$ |
236,949 |
NOTE 6. INVENTORIES
Inventories are stated at the lower of cost (first-in, first-out) or net realizable value. Net realizable value is the estimated selling prices in the ordinary course of business, less reasonably predictable costs of completion, disposal, and transportation. We write down the carrying value of inventory for estimated obsolescence by an amount equal to the difference between the cost of inventory and the estimated market value when warranted based on assumptions of future demand, market conditions, remaining shelf life, or product functionality. If actual market conditions or results of estimated functionality are less favorable than those we estimated, additional inventory write-downs may be required, which would have a negative effect on results of operations.
Unpaid inventory reflected within accounts payable in our consolidated balance sheets was $32.7 million at December 31, 2016, $30.1 million at December 31, 2015, and $21.4 million at December 31, 2014.
The components of inventories are as follows (in thousands):
|
|
|||||||
|
|
December 31, |
December 31, |
|||||
|
|
2016 | 2015 | |||||
|
|
|||||||
|
Raw materials |
$ |
27,561 |
$ |
31,184 | |||
|
Work-in-process |
14,998 | 18,698 | |||||
|
Finished goods |
115,475 | 138,951 | |||||
|
Total inventories |
$ |
158,034 |
$ |
188,833 | |||
NOTE 7. PROPERTY AND EQUIPMENT, NET
Property and equipment are stated at cost, net of accumulated depreciation and amortization. The costs of additions and improvements are capitalized, while maintenance and repairs are charged to expense as incurred. When an item is sold or retired, the cost and related accumulated depreciation is relieved, and the resulting gain or loss, if any, is recognized in the consolidated statements of income. We provide for depreciation and amortization primarily using the straight-line method by charges to income in amounts that allocate the cost of property and equipment over their estimated useful lives as follows:
|
Asset Classification |
Estimated Useful Life |
|
|
|
||
|
Land improvements |
15 to 20 years |
|
|
Buildings and improvements |
10 to 40 years |
|
|
Leasehold improvements |
Shorter of remaining lease term or useful life of improvements |
|
|
Machinery and equipment |
3 to 8 years |
|
|
Office furniture and equipment |
3 to 7 years |
|
|
Computer hardware and software |
3 to 7 years |
F-22
We capitalize interest on the acquisition and construction of significant assets that require a substantial period of time to be made ready for use. The capitalized interest is included in the cost of the completed asset and depreciated over the asset’s estimated useful life. The amount of interest capitalized during the years ended December 31, 2016 and 2015, was not material.
We capitalize certain costs incurred in connection with developing or obtaining software designated for internal use based on three distinct stages of development. Qualifying costs incurred during the application development stage, which consist primarily of internal payroll and direct fringe benefits and external direct project costs, including labor and travel, are capitalized and amortized on a straight-line basis over the estimated useful life of the asset. Costs incurred during the preliminary project and post-implementation and operation phases are expensed as incurred. These costs are general and administrative in nature and relate primarily to the determination of performance requirements, data conversion and training. Software developed to deliver hosted services to our customers has been designated as internal use.
Property and equipment, net, consisted of the following (in thousands):
|
|
December 31, |
December 31, |
|||||
|
|
2016 | 2015 | |||||
|
|
|||||||
|
Land and improvements |
$ |
7,255 |
$ |
7,357 | |||
|
Buildings and improvements |
171,455 | 162,146 | |||||
|
Leasehold improvements |
44,568 | 40,526 | |||||
|
Machinery and equipment |
262,718 | 224,100 | |||||
|
Office furniture and equipment |
42,124 | 39,334 | |||||
|
Computer hardware and software |
189,327 | 169,615 | |||||
|
Construction in progress |
25,145 | 35,546 | |||||
|
|
742,592 | 678,624 | |||||
|
Less accumulated depreciation and amortization |
385,170 | 345,598 | |||||
|
Total property and equipment, net |
$ |
357,422 |
$ |
333,026 | |||
Below are the amounts of depreciation and amortization, capitalized computer software for internal use and unpaid property equipment reflected in account payable and accrued expenses:
|
|
December 31, |
December 31, |
December 31, |
||||||
|
|
2016 | 2015 | 2014 | ||||||
|
|
|||||||||
|
Depreciation and amortization expense |
$ |
63,537 |
$ |
57,029 |
$ |
48,783 | |||
|
Capitalized computer software developed for internal use |
15,590 | 19,081 | 11,871 | ||||||
|
Unpaid property and equipment, reflected in accounts payable and accrued liabilities |
10,601 | 8,534 | 6,513 | ||||||
We recorded an $8.2 million impairment charge related to internally-developed software not yet placed into service within Unallocated Amounts operating expenses in our segment reporting in Note 15 during the year ended December 31, 2015 as a result of a strategic shift to refocus our development efforts within our information management business.
NOTE 8. OTHER CURRENT AND NONCURRENT ASSETS
Other current assets consisted of the following (in thousands):
|
|
|||||||
|
|
December 31, |
December 31, |
|||||
|
|
2016 | 2015 | |||||
|
|
|||||||
|
Prepaid expenses |
$ |
25,746 |
$ |
27,244 | |||
|
Taxes receivable |
27,672 | 11,792 | |||||
|
Customer acquisition costs, net |
18,085 | 16,412 | |||||
|
Other assets |
19,703 | 6,621 | |||||
|
Total other current assets |
$ |
91,206 |
$ |
62,069 | |||
F-23
Other noncurrent assets consisted of the following (in thousands):
|
|
December 31, |
December 31, |
|||||
|
|
2016 | 2015 | |||||
|
|
|||||||
|
Investment in long-term product supply arrangements |
$ |
10,978 |
$ |
12,165 | |||
|
Customer acquisition costs, net |
50,309 | 43,570 | |||||
|
Other assets |
42,028 | 29,755 | |||||
|
Total other long-term assets |
$ |
103,315 |
$ |
85,490 | |||
NOTE 9. GOODWILL AND INTANGIBLE ASSETS, NET
A significant portion of the purchase price for acquired businesses is generally assigned to intangible assets. Intangible assets other than goodwill are initially valued at fair value. If a quoted price in an active market for the identical asset is not readily available at the measurement date, the fair value of the intangible asset is estimated based on discounted cash flows using market participant assumptions, which are assumptions that are not specific to IDEXX. The selection of appropriate valuation methodologies and the estimation of discounted cash flows require significant assumptions about the timing and amounts of future cash flows, risks, appropriate discount rates, and the useful lives of intangible assets. When material, we utilize independent valuation experts to advise and assist us in determining the fair values of the identified intangible assets acquired in connection with a business acquisition and in determining appropriate amortization methods and periods for those intangible assets. Goodwill is initially valued based on the excess of the purchase price of a business combination over the fair value of acquired net assets recognized and represents the future economic benefits arising from other assets acquired that could not be individually identified and separately recognized.
Our business combinations regularly include contingent consideration arrangements that require additional consideration to be paid based on the achievement of established objectives, most commonly surrounding the retention of customers during the post-combination period. We assess contingent consideration to determine if it is part of the business combination or if it should be accounted for separately from the business combination in the post-combination period. Contingent consideration is recognized at its fair value on the acquisition date. A liability resulting from contingent consideration is remeasured to fair value at each reporting date until the contingency is resolved, with changes in fair value recognized in earnings. Changes in fair value of contingent consideration and differences arising upon settlement were not material during the years ended December 31, 2016, 2015 and 2014. See Note 3 for additional information regarding contingent consideration arising from recent business acquisitions.
We assess goodwill for impairment annually, at the reporting unit level, in the fourth quarter and whenever events or circumstances indicate impairment may exist. In evaluating goodwill for impairment, we have the option to first assess the qualitative factors to determine whether it is more likely than not that the fair value of the reporting unit is less than its carrying amount as a basis for determining whether it is necessary to perform the two-step goodwill impairment test. The more likely than not threshold is defined as having a likelihood of more than 50 percent. If, after assessing the totality of events or circumstances, we determine that it is more likely than not that the fair value of a reporting unit is less than its carrying amount, we would then perform step one of the two-step impairment test; otherwise, no further impairment test would be required. In contrast, we can opt to bypass the qualitative assessment for any reporting unit in any period and proceed directly to step one of the two-step impairment test. Doing so does not preclude us from performing the qualitative assessment in any subsequent period.
In the fourth quarters of 2016 and 2015, we elected to bypass the qualitative approach and instead proceeded directly to step one of the two-step impairment test to assess the fair value of all of our reporting units. As part of step one of the two-step impairment test, we estimate the fair values of applicable reporting units using an income approach based on discounted forecasted cash flows. We make significant assumptions about the extent and timing of future cash flows, growth rates and discount rates. Model assumptions are based on our projections and best estimates, using appropriate and customary market participant assumptions. In addition, we make certain assumptions in allocating shared assets and liabilities to individual reporting units in determining the carrying value of each reporting unit. Changes in forecasted cash flows or the discount rate would affect the estimated fair values of our reporting units and could result in a goodwill impairment charge in a future period.
No goodwill impairments were identified during the years ended December 31, 2016, 2015 or 2014.
F-24
We assess the realizability of intangible assets other than goodwill whenever events or changes in circumstances indicate that the carrying value may not be recoverable. If an impairment review is triggered, we evaluate the carrying value of intangible assets based on estimated undiscounted future cash flows over the remaining useful life of the primary asset of the asset group and compare that value to the carrying value of the asset group. The cash flows that are used contain our best estimates, using appropriate and customary assumptions and projections at the time. If the net carrying value of an intangible asset exceeds the related estimated undiscounted future cash flows, an impairment to write the intangible asset to its fair value would be reported as a non-cash charge to earnings. If necessary, we would calculate the fair value of an intangible asset using the present value of the estimated future cash flows to be generated by the intangible asset, and applying a risk-adjusted discount rate.
During the first half of 2016, management reviewed the OPTI Medical product offerings. As a result of this review, we discontinued certain development activities in the human point-of-care medical diagnostics market during March 2016 that was devoted to a new platform and focused our efforts in this market on supporting our current generation OPTI CCA-TS2 Blood Gas and Electrolyte Analyzer. Non-cash intangible asset impairments of $2.2 million were recorded within our condensed consolidated statement of operations, within general and administration expenses, within our unallocated segment, during 2016. The intangibles associated with our OPTI Medical human point-of-care medical diagnostics market are fully written off. Impairments of our intangible assets during the years ended December 31, 2015 and 2014 were not material.
We provide for amortization primarily using the straight-line method by charges to income in amounts that allocate the intangible assets over their estimated useful lives as follows:
|
|
|||
|
Asset Classification |
Estimated Useful Life |
||
|
|
|||
|
Patents |
13 years |
||
|
Product rights(1) |
5 to 15 years |
||
|
Customer-related intangible assets(2) |
5 to 17 years |
||
|
Noncompete agreements |
3 to 5 years |
|
(1) |
Product rights comprise certain technologies, intellectual property, licenses and trade names acquired from third parties. |
|
(2) |
Customer-related intangible assets comprise customer lists and customer relationships acquired from third parties. |
Intangible assets other than goodwill consisted of the following (in thousands):
|
|
December 31, 2016 |
December 31, 2015 |
|||||||||||
|
|
Cost |
Accumulated Amortization |
Cost |
Accumulated Amortization |
|||||||||
|
Patents |
$ |
2,192 |
$ |
2,075 |
$ |
2,192 |
$ |
1,907 | |||||
|
Product rights (1) |
29,748 | 20,877 | 35,318 | 22,976 | |||||||||
|
Customer-related intangible assets (2) |
74,922 | 38,190 | 86,806 | 44,232 | |||||||||
|
Noncompete agreements |
1,111 | 676 | 1,413 | 705 | |||||||||
|
|
$ |
107,973 |
$ |
61,818 |
$ |
125,729 |
$ |
69,820 | |||||
|
(1) |
Product rights comprise certain technologies, licenses and trade names acquired from third parties. |
|
(2) |
Customer-related intangible assets are comprised of customer lists and customer relationships acquired from third parties. |
Amortization expense of intangible assets other than goodwill was $9.5 million for the year ended December 31, 2016, $10.4 million for the year ended December 31, 2015, and $9.8 million for the year ended December 31, 2014. The decrease in intangible assets other than goodwill during the year ended December 31, 2016, was driven by amortization expense and the write-off of intangibles related to our OPTI Medical line of business, partly offset by intangibles recognized in connection with the acquisition of businesses.
F-25
At December 31, 2016, the aggregate amortization expense associated with intangible assets is estimated to be as follows for each of the next five years and thereafter (in thousands):
|
|
Amortization Expense |
|||
|
|
||||
|
2017 |
$ |
8,467 | ||
|
2018 |
7,453 | |||
|
2019 |
6,561 | |||
|
2020 |
5,261 | |||
|
2021 |
4,457 | |||
|
Thereafter |
13,956 | |||
|
|
$ |
46,155 | ||
The decrease in goodwill during the twelve months ended December 31, 2016, resulted from changes in foreign currency exchange rates, partly offset by goodwill recognized in connection with the acquisition of businesses. See Note 3 for information regarding goodwill and other intangible assets recognized in connection with the acquisition of businesses and other assets during the years ended December 31, 2016, 2015 and 2014.
The changes in the carrying amount of goodwill for the years ended December 31, 2016, 2015, and 2014, were as follows (in thousands):
|
|
CAG |
Water |
LPD |
Other |
Consolidated Total |
||||||||||
|
Balance as of December 31, 2013 |
$ |
141,408 |
$ |
14,515 |
$ |
18,067 |
$ |
6,531 |
$ |
180,521 | |||||
|
Business Combinations |
13,077 |
- |
- |
- |
13,077 | ||||||||||
|
Impact of Changes in Foreign Currency Exchange Rates |
(6,334) | (826) | (1,988) |
- |
(9,148) | ||||||||||
|
Balance as of December 31, 2014 |
$ |
148,151 |
$ |
13,689 |
$ |
16,079 |
$ |
6,531 |
$ |
184,450 | |||||
|
Business Combinations |
5,047 |
- |
- |
- |
5,047 | ||||||||||
|
Impact of Changes in Foreign Currency Exchange Rates |
(8,007) | (651) | (1,905) |
- |
(10,563) | ||||||||||
|
Balance as of December 31, 2015 |
$ |
145,191 |
$ |
13,038 |
$ |
14,174 |
$ |
6,531 |
$ |
178,934 | |||||
|
Business Combinations |
1,720 |
- |
- |
- |
1,720 | ||||||||||
|
Impact of Changes in Foreign Currency Exchange Rates |
(717) | (2,148) | 439 |
- |
(2,426) | ||||||||||
|
Balance as of December 31, 2016 |
$ |
146,194 |
$ |
10,890 |
$ |
14,613 |
$ |
6,531 |
$ |
178,228 |
NOTE 10. ACCRUED LIABILITIES
Accrued liabilities consisted of the following (in thousands):
|
|
December 31, |
December 31, |
|||||
|
|
2016 | 2015 | |||||
|
|
|||||||
|
Accrued expenses |
$ |
71,984 |
$ |
65,665 | |||
|
Accrued employee compensation and related expenses |
91,113 | 77,027 | |||||
|
Accrued taxes |
23,973 | 18,963 | |||||
|
Accrued customer programs |
49,061 | 43,875 | |||||
|
Total accrued liabilities |
$ |
236,131 |
$ |
205,530 | |||
F-26
NOTE 11. DEBT
Effective January 1, 2016, we adopted FASB amendments that require debt issuance costs related to a recognized debt liability be presented within the balance sheet as a direct deduction from the carrying amount of that debt liability, consistent with debt discounts. This reclassification of the presentation of deferred financing costs did not have a material impact on other long-term assets or long-term debt amounts reported in our condensed consolidated balance sheet and additionally would not have a material impact on such amounts reported in a prior period. These amendments have been reflected prospectively from the date of inception; prior period amounts have not been revised for the effects of this amendment. For line-of-credit arrangements, borrowers have the option of presenting debt issuance costs as an asset which is subsequently amortized ratably over the term of the line-of-credit arrangement, regardless of whether there are any related outstanding borrowings. As such, we continue to present deferred financing costs associated with our unsecured revolving credit facility within other long-term assets in the accompanying condensed consolidated balance sheets.
Credit Facility
In December 2015, we refinanced our existing $700 million unsecured revolving credit facility by entering into a second amended and restated credit agreement relating to a five-year unsecured revolving credit facility in the principal amount of $850 million with a syndicate of multinational banks, which matures on December 4, 2020 (the new credit facility and the prior credit facility are referred to collectively as the “Credit Facility”) and requires no scheduled prepayments before that date. Although the Credit Facility does not mature until December 4, 2020, all individual borrowings under the terms of the Credit Facility have a stated term between 30 and 180 days. At the end of each term, the obligation is either repaid or rolled over into a new borrowing. The Credit Facility contains a subjective material adverse event clause, which allows the debt holders to call the loans under the Credit Facility if we fail to provide prompt written notice to the syndicate of such an event. Based on the stated term and the existence of the subjective material adverse event clause, this Credit Facility is reflected in the current liabilities section of our consolidated balance sheets. At December 31, 2016, we had $611.0 million outstanding under our Credit Facility with a weighted average effective interest rate of 1.95 percent. At December 31, 2015, we had $573.0 million outstanding under our Credit Facility with a weighted average effective interest rate 1.9 percent. The funds available under the Credit Facility at December 31, 2016, and December 31, 2015, reflect a further reduction due to the issuance of a letter of credit for $1.0 million, which was issued in connection with our workers’ compensation policy.
Applicable interest rates on borrowings under the Credit Facility generally range from 0.875 to 1.375 percentage points (“Credit Spread”) above the London interbank offered rate, based on our leverage ratio, or the prevailing prime rate plus a maximum spread of up to 0.375 percent, based on our leverage ratio. We previously entered into forward fixed interest rate swap agreements to manage the economic effect of the first $80 million of variable interest rate borrowings. We designated the interest rate swaps as a cash flow hedges. See Note 17 for a discussion of our derivative instruments and hedging activities. Under the Credit Facility, we pay quarterly commitment fees of 0.075 percent to 0.25 percent, based on our leverage ratio, on any unused commitment.
The obligations under the Credit Facility may be accelerated upon the occurrence of an event of default under the Credit Facility, which includes customary events of default including payment defaults, defaults in the performance of the affirmative, negative and financial covenants, the inaccuracy of representations or warranties, bankruptcy and insolvency related defaults, defaults relating to judgments, certain events related to employee pension benefit plans under the Employee Retirement Income Security Act of 1974, the failure to pay specified indebtedness, cross-acceleration to specified indebtedness and a change of control default. The Credit Facility contains affirmative, negative and financial covenants customary for financings of this type. The negative covenants include restrictions on liens, indebtedness of subsidiaries of the Company, fundamental changes, investments, transactions with affiliates and certain restrictive agreements. The sole financial covenant is a consolidated leverage ratio test that requires our ratio of debt to earnings before interest, taxes, depreciation, amortization and share-based compensation defined as the consolidated leverage ratio under the terms of the Credit Facility, not to exceed 3.5-to-1. At December 31, 2016, we were in compliance with the covenants of the Credit Facility.
F-27
Senior Notes
In December 2013, we issued and sold through a private placement an aggregate principal amount of $150 million of unsecured senior notes consisting of $75 million of 3.94% Series A Senior Notes due December 11, 2023 (the “2023 Notes”) and $75 million of 4.04% Series B Senior Notes due December 11, 2025 (the “2025 Series B Notes” and together with the 2023 Notes, the “December Notes”) under a Note Purchase Agreement among the Company, New York Life Insurance Company and the accredited institutional purchasers named therein (the “December 2013 Note Agreement”).
In July 2014, we issued and sold through a private placement an aggregate principal amount of $125 million of unsecured senior notes consisting of $75 million of 3.76% Series B Senior Notes due July 21, 2024 (the “2024 Notes”) and $50 million of 3.32% Series A Senior Notes due July 21, 2021 (the “2021 Notes” and together with the 2024 Notes, the “Prudential Notes”) under a Note Purchase and Private Shelf Agreement among the Company, Prudential Investment Management, Inc. (“Prudential”) and the accredited institutional purchasers named therein (the “July 2014 Note Agreement”).
In September 2014, we issued and sold through a private placement an aggregate principal amount of $75 million of unsecured 3.72% senior notes due September 4, 2026 (the “2026 Notes”) under a Note Purchase Agreement dated as of July 22, 2014 among the Company, New York Life Insurance Company and the accredited institutional purchasers named therein (the “September 2014 Note Agreement”).
In December 2014, we entered into a Multi-Currency Note Purchase and Private Shelf Agreement among the Company, Metropolitan Life Insurance Company (“MetLife”), and the accredited institutional purchasers named therein pursuant to which we agreed to issue and sell $75 million of its unsecured 3.25% Series A Senior Notes having a seven-year term, and $75 million of its unsecured 3.72% Series B Senior Notes having a twelve-year term. The issuance, sale and purchase of these notes occurred in February 2015 (the “MetLife Notes”). The agreement (the “December 2014 Note Agreement”) also provides for an uncommitted shelf facility by which we may request that MetLife purchase, over the subsequent three years, up to $50 million of additional senior promissory notes of the Company at a fixed interest rate to be determined at the time of purchase and with a maturity date not to exceed fifteen years.
In June 2015, we entered into an Amended and Restated Multi-Currency Note Purchase and Private Shelf Agreement (the “2015 Amended Agreement”), among the Company, Prudential Investment Management, Inc. and the accredited institutional purchasers named therein, which amends and restates the Note Purchase and Private Shelf Agreement dated July 21, 2014. We refer to the 2015 Amended Agreement together with the December 2013 Note Agreement, September 2014 Note Agreement, and December 2014 Note Agreement collectively as the “Senior Note Agreements”).
Pursuant to the 2015 Amended Agreement, we issued and sold through a private placement a principal amount of €88.9 million of unsecured 1.785% Series C Senior Notes due June 18, 2025 (the “2025 Series C Notes”). We refer to the 2025 Series C Notes together with the Prudential Notes, December Notes, MetLife Notes and the 2026 Notes, collectively, as the “Senior Notes”). We used the net proceeds from this issuance and sale of the 2025 Notes for general corporate purposes, including repaying amounts outstanding under our Credit Facility.
The 2015 Amended Agreement also provides for an uncommitted shelf facility by which we may request that Prudential purchase, over the next three years, up to $75 million (or the foreign currency equivalent) of additional senior promissory notes of the Company at a fixed interest rate and with a maturity date not to exceed twelve years (the “Shelf Notes”). Prudential is under no obligation to purchase any of the Shelf Notes. The interest rate of any series of Shelf Notes will be determined at the time of purchase. The proceeds of any series of Shelf Notes are able to be used for general corporate purposes.
The Senior Note Agreements contain affirmative, negative and financial covenants customary for agreements of this type. The negative covenants include restrictions on liens, indebtedness of our subsidiaries, priority indebtedness, fundamental changes, investments, transactions with affiliates, certain restrictive agreements and violations of laws and regulations. The sole financial covenant is a consolidated leverage ratio test that requires our ratio of debt to earnings before interest, taxes, depreciation, amortization and share-based compensation, as defined in the Senior Note Agreements, not to exceed 3.5-to-1. At December 31, 2016, we were in compliance with the covenants of the Senior Note Agreements.
F-28
Should we elect to prepay the Senior Notes, such aggregate prepayment will include the applicable make-whole amount(s), as defined within the applicable Senior Note Agreements. Additionally, in the event of a change in control of the Company or upon the disposition of certain assets of the Company the proceeds of which are not reinvested (as defined in the Senior Note Agreements), we may be required to prepay all or a portion of the Senior Notes. The obligations under the Senior Notes may be accelerated upon the occurrence of an event of default under the applicable Senior Note Agreement, each of which includes customary events of default including payment defaults, defaults in the performance of the affirmative, negative and financial covenants, the inaccuracy of representations or warranties, bankruptcy and insolvency related defaults, defaults relating to judgments, certain events related to employee pension benefit plans under the Employee Retirement Income Security Act of 1974, the failure to pay specified indebtedness and cross-acceleration to specified indebtedness.
Interest paid for the periods ended December 31, 2016, 2015 and 2014, was $31.8 million, $27.2 million, and $12.3 million, respectively.
Annual principal payments on long-term debt at December 31, 2016, are as follows (in thousands):
|
|
|||
|
Years Ending December 31, |
Amount |
||
|
|
|||
|
2017 |
- |
||
|
2018 |
- |
||
|
2019 |
- |
||
|
2020 |
- |
||
|
2021 |
50,000 | ||
|
Thereafter |
543,664 | ||
|
|
$ |
593,664 |
NOTE 12. INCOME TAXES
The provision for income taxes is determined using the asset and liability approach of accounting for income taxes. Under this approach, deferred taxes represent the estimated future tax effects of temporary differences between book and tax treatment of assets and liabilities and carryforwards to the extent they are realizable. We record a valuation allowance to reduce our deferred tax assets to the amount that is more likely than not to be realized. While we consider future taxable income and ongoing prudent and feasible tax planning strategies in assessing the need for a valuation allowance, in the event we were to determine that we would be able to realize our deferred tax assets in the future in excess of the net recorded amount, a reduction of the valuation allowance would increase income in the period such determination was made. Likewise, should we determine that we would not be able to realize all or part of our net deferred tax asset in the future, a reduction to the deferred tax asset would be charged to income in the period such determination was made.
We record a liability for uncertain tax positions that do not meet the more likely than not standard as prescribed by the authoritative guidance for income tax accounting. We record tax benefits for only those positions that we believe will more likely than not be sustained. Unrecognized tax benefits are the differences between tax positions taken, or expected to be taken, in tax returns, and the benefits recognized for accounting purposes.
Significant judgment is required in determining our worldwide provision for income taxes and our income tax filings are regularly under audit by tax authorities. Any audit result differing from amounts recorded would increase or decrease income in the period that we determine such adjustment is likely. Interest expense and penalties associated with the underpayment of income taxes are included in income tax expense.
Earnings before income taxes were as follows (in thousands):
|
|
For the Years Ended December 31, |
||||||||
|
|
2016 | 2015 | 2014 | ||||||
|
|
|||||||||
|
Domestic |
$ |
227,875 |
$ |
187,200 |
$ |
148,510 | |||
|
International |
93,971 | 85,941 | 98,045 | ||||||
|
|
$ |
321,846 |
$ |
273,141 |
$ |
246,555 | |||
F-29
The provision (benefit) for income taxes comprised the following (in thousands):
|
|
|||||||||
|
|
For the Years Ended December 31, |
||||||||
|
|
2016 | 2015 | 2014 | ||||||
|
Current |
|||||||||
|
Federal |
$ |
53,285 |
$ |
52,966 |
$ |
39,713 | |||
|
State |
6,608 | 5,353 | 4,692 | ||||||
|
International |
19,291 | 17,681 | 20,213 | ||||||
|
|
79,184 | 76,000 | 64,618 | ||||||
|
Deferred |
|||||||||
|
Federal |
20,305 | 5,762 | 2,301 | ||||||
|
State |
1,196 | 526 | 33 | ||||||
|
International |
(893) | (1,282) | (2,348) | ||||||
|
|
20,608 | 5,006 | (14) | ||||||
|
|
$ |
99,792 |
$ |
81,006 |
$ |
64,604 | |||
The provision for income taxes differs from the amounts computed by applying the statutory federal income tax rate as follows:
|
|
For the Years Ended December 31, |
||||||||
|
|
2016 | 2015 | 2014 | ||||||
|
|
|||||||||
|
U.S. federal statutory rate |
35.0 |
% |
35.0 |
% |
35.0 |
% |
|||
|
State income tax, net of federal tax benefit |
1.8 | 1.6 | 1.5 | ||||||
|
International income taxes |
(4.8) | (5.3) | (7.0) | ||||||
|
Domestic manufacturing exclusions |
(1.0) | (1.5) | (1.2) | ||||||
|
Research and development credit |
(0.8) | (1.2) | (1.3) | ||||||
|
Other, net |
0.8 | 1.1 | (0.8) | ||||||
|
Effective tax rate |
31.0 |
% |
29.7 |
% |
26.2 |
% |
|||
Our effective income tax rate was 31.0 percent for the year ended December 31, 2016, and 29.7 percent for the year ended December 31, 2015. The increase in our effective income tax rate for the year ended December 31, 2016, as compared to the year ended December 31, 2015, was primarily related to a change in earnings mix in 2016, with relatively higher earnings subject to domestic tax rates as opposed to lower international tax rates including the impact of foreign currency exchange rates.
Our effective income tax rate was 29.7 percent for the year ended December 31, 2015, and 26.2 percent for the year ended December 31, 2014. The increase in our effective income tax rate for the year ended December 31, 2015, as compared to the year ended December 31, 2014, was related to lower relative earnings subject to international tax rates that are lower than domestic tax rates, including the impact of foreign currency exchange rates, as well as a non-recurring benefit recognized during period ended December 31, 2014, related to the deferral of inter-company profits that were included in prior year tax provisions in error, which is not material to prior interim or annual periods.
Income taxes paid for the periods ended December 31, 2016, 2015 and 2014 was $74.7 million, $54.9 million, and $60.2 million, respectively.
We have business operations in Switzerland and the Netherlands and have been granted tax rulings by each jurisdiction. Our Netherlands ruling is set to expire on December 31, 2022 and our Switzerland ruling remains in effect as long as our business operations comply with the ruling requirements during the period or until Switzerland finalizes the implementation dates of new international tax rules. Prior to the year ended December 31, 2016 we benefited from a Switzerland ruling which expired December 31, 2015.
As a result of the tax rulings, our net income was higher by $7.8 million for the year ended December 31, 2016, $8.5 million for the year ended December 31, 2015, and $8.5 million for the year ended December 31, 2014. The benefit from these tax rulings is reflected within the overall benefit received from international income taxes in the table above.
F-30
We consider the majority of the operating earnings of non-U.S. subsidiaries to be indefinitely invested outside the U.S. The cumulative earnings of these subsidiaries were $546.7 million at December 31, 2016. No provision has been made for U.S. federal and state, or international taxes that may result from future remittances of the undistributed earnings of non-U.S. subsidiaries. Should we repatriate these earnings in the future, we would have to adjust the income tax provision in the period in which the decision to repatriate earnings is made. A determination of the related tax liability that would be paid on these undistributed earnings if repatriated is not practicable for several reasons including the complexity of laws and regulations in the various jurisdictions where we operate, the varying tax treatment of potential repatriation scenarios and the timing of any future repatriation. For the operating earnings not considered to be indefinitely invested outside the U.S., we have accounted for the tax impact on a current basis.
The components of the net deferred tax assets (liabilities) included in the accompanying consolidated balance sheets are as follows (in thousands):
|
|
|||||||||||
|
|
December 31, 2016 |
December 31, 2015 |
|||||||||
|
|
Long-Term |
Current |
Long-Term |
||||||||
|
|
|||||||||||
|
Assets |
|||||||||||
|
Accrued expenses |
$ |
22,145 |
$ |
23,298 |
$ |
5,329 | |||||
|
Accounts receivable reserves |
2,715 | 2,973 |
- |
||||||||
|
Deferred revenue |
13,400 | 7,392 | 3,656 | ||||||||
|
Inventory basis differences |
3,959 | 3,292 | 293 | ||||||||
|
Property-based differences |
1,382 |
- |
1,524 | ||||||||
|
Share-based compensation |
13,021 | 2,565 | 10,580 | ||||||||
|
Other |
678 | 234 | 361 | ||||||||
|
Net operating loss carryforwards |
4,182 | 65 | 4,059 | ||||||||
|
Unrealized losses on foreign currency exchange contracts, interest rate swaps and investments |
148 |
- |
53 | ||||||||
|
Total assets |
61,630 | 39,819 | 25,855 | ||||||||
|
Valuation allowance |
(4,891) | (507) | (3,939) | ||||||||
|
Total assets, net of valuation allowance |
56,739 | 39,312 | 21,916 | ||||||||
|
|
|||||||||||
|
Liabilities |
|||||||||||
|
Accrued expenses |
(143) |
- |
- |
||||||||
|
Accounts receivable reserves |
(85) |
- |
- |
||||||||
|
Deferred revenue |
(36) |
- |
|||||||||
|
Deferred instrument costs |
(24,142) |
- |
(16,090) | ||||||||
|
Property-based differences |
(43,159) |
- |
(35,079) | ||||||||
|
Intangible asset basis differences |
(17,672) |
- |
(17,109) | ||||||||
|
Other |
(507) | (550) | (1,460) | ||||||||
|
Unrealized gains on foreign currency exchange contracts, interest rate swaps and investments |
(4,575) | (882) |
- |
||||||||
|
Total liabilities |
(90,319) | (1,432) | (69,738) | ||||||||
|
Net deferred tax assets (liabilities) |
$ |
(33,580) |
$ |
37,880 |
$ |
(47,822) | |||||
During the first quarter of 2016, the Company early adopted FASB amendments which require us to classify all deferred tax assets and liabilities as noncurrent within our condensed consolidated balance sheet. In accordance with the FASB’s permitted transition guidance, we applied this guidance prospectively and did not revise our prior period balance sheet presentation for the effects of this amendment.
We record a liability for uncertain tax positions that do not meet the more likely than not standard as prescribed by the authoritative guidance for income tax accounting. We record tax benefits for only those positions that we believe will more likely than not be sustained. Unrecognized tax benefits are the differences between tax positions taken, or expected to be taken, in tax returns, and the benefits recognized for accounting purposes. We classify certain uncertain tax positions as long-term liabilities.
The total amount of unrecognized tax benefits at December 31, 2016, and December 31, 2015, was $18.5 million and $7.2 million, respectively. Of the total unrecognized tax benefits at December 31, 2016 and 2015, $5.9 million and $5.9 million, respectively, comprise unrecognized tax positions that would, if recognized, affect our effective tax rate. The increase in net liability is primarily related to two uncertain tax positions taken during the year. The first relates to our claiming certain tax deductions under a recent court case, but one that the IRS has vowed to appeal. The second relates to certain changes we made in our transfer pricing policies to better align
F-31
statutory accounting with business operations. The ultimate deductibility of the remaining unrecognized tax positions is highly certain but there is uncertainty about the timing of such deductibility. Because of the impact of deferred tax accounting, other than interest and penalties, the disallowance of the shorter deductibility period would not affect the annual effective tax rate but would accelerate the payment of cash to the taxing authority to an earlier period.
During each of the years ended December 31, 2016, 2015 and 2014, we recorded interest expense and penalties of $0.3 million as income tax expense in our consolidated statement of income. At December 31, 2016 and 2015, we had $0.6 million and $0.6 million, respectively, of estimated interest expense and penalties accrued in our consolidated balance sheets.
The following table summarizes the changes in unrecognized tax benefits during the years ended December 31, 2016, 2015 and 2014 (in thousands):
|
|
|||||||||
|
|
For the Years Ended December 31, |
||||||||
|
|
2016 | 2015 | 2014 | ||||||
|
|
|||||||||
|
Total amounts of unrecognized tax benefits, beginning of period |
$ |
7,204 |
$ |
5,942 |
$ |
6,325 | |||
|
Gross increases in unrecognized tax benefits as a result of tax positions taken during a prior period |
75 | 47 | 432 | ||||||
|
Gross increases in unrecognized tax benefits as a result of tax positions taken in the current period |
12,657 | 1,569 | 1,789 | ||||||
|
Decreases in unrecognized tax benefits relating to settlements with taxing authorities |
(1,326) |
- |
(2,242) | ||||||
|
Decreases in unrecognized tax benefits as a result of a lapse of the applicable statutes of limitations |
(147) | (354) | (362) | ||||||
|
Total amounts of unrecognized tax benefits, end of period |
$ |
18,463 |
$ |
7,204 |
$ |
5,942 | |||
In the ordinary course of our business, our income tax filings are regularly under audit by tax authorities. While we believe we have appropriately provided for all uncertain tax positions, amounts asserted by taxing authorities could be greater or less than our accrued position. Accordingly, additional provisions on income tax matters, or reductions of previously accrued provisions, could be recorded in the future as we revise our estimates due to changing facts and circumstances or the underlying matters are settled or otherwise resolved. We are currently under tax examinations by various state and international tax authorities. We anticipate that these examinations will be concluded within the next year. With few exceptions, we are no longer subject to income tax examinations in any state and local, or international jurisdictions in which we conduct significant taxable activities for years before 2008.
At December 31, 2016, we had net operating loss carryforwards in certain state and international jurisdictions of approximately $21.7 million available to offset future taxable income. Most of these net operating loss carryforwards will expire at various dates through 2018 and the remainder have indefinite lives. We have recorded a valuation allowance of $4.9 million against certain deferred tax assets related to temporary differences including net operating loss carryforwards, as it is more likely than not that they will not be realized or utilized within the carryforward period.
NOTE 13. EARNINGS PER SHARE
Basic earnings per share is computed by dividing net income attributable to IDEXX Laboratories, Inc. stockholders by the weighted average number of shares of common stock and vested deferred stock units outstanding during the year. The computation of diluted earnings per share is similar to the computation of basic earnings per share, except that the denominator is increased for the assumed exercise of dilutive options and assumed issuance of unvested restricted stock units and unvested deferred stock units using the treasury stock method unless the effect is anti-dilutive. The treasury stock method assumes that proceeds, including cash received from the exercise of employee stock options, the total unrecognized compensation expense for unvested share-based compensation awards and the excess tax benefits resulting from share-based compensation tax deductions in excess of the related expense recognized for financial reporting purposes, would be used to purchase our common stock at the average market price during the period. Vested deferred stock units outstanding are included in shares outstanding for basic and diluted earnings per share because the associated shares of our common stock are issuable for no cash consideration, the number of shares of our common stock to be issued is fixed and issuance is not contingent. See Note 4 for additional information regarding deferred stock units.
F-32
The following is a reconciliation of shares outstanding for basic and diluted earnings per share for the years ended December 31, 2016, 2015 and 2014 (in thousands):
|
|
For the Years Ended December 31, |
||||||
|
|
2016 | 2015 | 2014 | ||||
|
|
|||||||
|
Shares outstanding for basic earnings per share: |
89,732 | 92,601 | 100,094 | ||||
|
|
|||||||
|
Shares outstanding for diluted earnings per share: |
|||||||
|
Shares outstanding for basic earnings per share |
89,732 | 92,601 | 100,094 | ||||
|
Dilutive effect of share-based payment awards |
1,152 | 1,048 | 1,409 | ||||
|
|
90,884 | 93,649 | 101,503 | ||||
Certain options to acquire shares have been excluded from the calculation of shares outstanding for dilutive earnings per share because they were anti-dilutive. The following table presents information concerning those anti-dilutive options for the years ended December 31, 2016, 2015 and 2014 (in thousands):
|
|
For the Years Ended December 31, |
||||||
|
|
2016 | 2015 | 2014 | ||||
|
|
|||||||
|
Weighted average number of shares underlying anti-dilutive options |
88 | 644 | 644 | ||||
|
|
|||||||
NOTE 14. COMMITMENTS, CONTINGENCIES AND GUARANTEES
Leases
The majority of our facilities are occupied under operating lease arrangements with various expiration dates through 2030. We are responsible for the real estate taxes and operating expenses related to these facilities. Additionally, we enter into operating leases for certain vehicles and office equipment in the normal course of business. We determine the expected term of any executed agreements using the non-cancelable lease term plus any renewal options by which the failure to renew imposes a penalty in such amount that renewal is reasonably assured. The derived expected term is then used in the determination of a capital or operating lease and in the calculation of straight-line rent expense. Rent escalations are considered in the calculation of minimum lease payments in our capital lease tests and in determining straight-line rent expense for operating leases.
Commitments
Rent expense charged to operations under operating leases was approximately $22.7 million for the year ended December 31, 2016, $20.5 million for the year ended December 31, 2015, and $17.2 million for the year ended December 31, 2014.
Minimum annual rental payments under these agreements are estimated as follows (in thousands):
|
|
||||
|
Years Ending December 31, |
Amount |
|||
|
|
||||
|
2017 |
$ |
15,724 | ||
|
2018 |
12,573 | |||
|
2019 |
8,256 | |||
|
2020 |
6,301 | |||
|
2021 |
5,957 | |||
|
Thereafter |
9,050 | |||
|
|
$ |
57,861 |
We have various minimum royalty payments due through 2028 of $1.6 million. If these obligations are not satisfied, the related license arrangements may be terminated, resulting in either a loss in exclusivity or the right to use the technology.
We are required to annually purchase a minimum amount of inventory from certain suppliers. Through 2022, we have a total of $14.3 million in minimum purchase commitments under these arrangements.
F-33
Contingencies
We are subject to claims that arise in the ordinary course of business, including with respect to actual and threatened litigation and other matters. We accrue for loss contingencies when it is probable that future expenditures will be made and such expenditures can be reasonably estimated. However, our actual losses with respect to these contingencies could exceed our accruals.
Under our workers’ compensation insurance policies for U.S. employees, we have retained the first $300,000, $300,000 and $300,000 in claim liability per incident with aggregate maximum claim liabilities per year of $2.6 million, $3.5 million and $2.3 million for the years ended December 31, 2016, 2015 and 2014, respectively. Workers’ compensation expense recognized during the years ended December 31, 2016, 2015 and 2014 and our respective liability for such claims as of December 31, 2016, 2015, and 2014 was not material. Claims incurred during the years ended December 31, 2016 and 2015 are relatively undeveloped as of December 31, 2016. Therefore, it is possible that we could incur additional healthcare and wage indemnification costs beyond those previously recognized up to our aggregate liability for each of the respective claim years. For the years ended on or prior to December 31, 2014, based on our retained claim liability per incident and our aggregate claim liability per year, our maximum liability in excess of the amounts deemed probable and previously recognized is not material as of December 31, 2016. As of December 31, 2016, we had outstanding letters of credit totaling $1.3 million to the insurance companies as security for these claims in connection with these policies.
Under our current employee healthcare insurance policy for U.S. employees, we retain claims liability risk per incident up to $450,000 per year in 2016, $425,000 per year in 2015 and $375,000 per year in 2014. We recognized employee healthcare claim expense of $40.4 million for the year ended December 31, 2016, $34.6 million for the year ended December 31, 2015 and $32.0 million during the year ended December 31, 2014, which represents actual claims paid and an estimate of our liability for the uninsured portion of employee healthcare obligations that have been incurred but not paid. Should employee health insurance claims exceed our estimated liability, we would have further obligations. Our estimated liability for healthcare claims that have been incurred but not paid as of December 31, 2016 and 2015, was $4.0 million as of December 31, 2016 and $4.8 million as of December 31, 2015.
We have entered into an employment agreement with our chief executive officer whereby payment may be required if we terminate his employment without cause other than following a change in control. The amount payable is based upon the executive’s salary at the time of termination and the cost to us of continuing to provide certain benefits. Had this officer been terminated without cause at December 31, 2016, other than following a change in control, we would have had an obligation for salaries and benefits of approximately $1.6 million under such agreement. In addition, the agreement provides for continued vesting of his outstanding equity awards for a period of two years.
We have entered into employment agreements with each of our officers that require us to make certain payments in the event the officer’s employment is terminated under certain circumstances within a certain period following a change in control. The amount payable by us under each of these agreements is based on the officer’s salary and bonus history at the time of termination and the cost to us of continuing to provide certain benefits. Had all of our officers been terminated in qualifying terminations following a change in control at December 31, 2016, we would have had aggregate obligations of approximately $27.1 million under these agreements. These agreements also provide for the acceleration of the vesting of all stock options and restricted stock units upon any qualifying termination following a change in control. At this time, we believe the likelihood of terminations as a result of the scenarios described is remote, and therefore, we have not accrued for such loss contingencies.
We have total contingent consideration liabilities outstanding of up to $6.4 million primarily related to the achievement of certain revenue milestones. We have recorded $0.9 million and $5.9 million of contingent consideration liabilities on our consolidated balance sheets at December 31, 2016 and 2015, respectively. We have not accrued for $5.5 million of contingent consideration liabilities, related to the acquisition of an intangible asset in 2008, as we do not deem the achievement of associated revenue milestones to be probable of occurring as of December 31, 2016.
F-34
From time to time, we have received notices alleging that our products infringe third-party proprietary rights, although we are not aware of any pending litigation with respect to such claims. Patent litigation frequently is complex and expensive, and the outcome of patent litigation can be difficult to predict. There can be no assurance that we will prevail in any infringement proceedings that may be commenced against us. If we lose any such litigation, we may be stopped from selling certain products and/or we may be required to pay damages as a result of the litigation.
Guarantees
We enter into agreements with third parties in the ordinary course of business under which we are obligated to indemnify such third parties for and against various risks and losses. The precise terms of such indemnities vary with the nature of the agreement. In many cases, we limit the maximum amount of our indemnification obligations, but in some cases those obligations may be theoretically unlimited. We have not incurred material expenses in discharging any of these indemnification obligations, and based on our analysis of the nature of the risks involved, we believe that the fair value of these agreements is minimal. Accordingly, we have recorded no liabilities for these obligations at December 31, 2016 and 2015.
When acquiring a business, we sometimes assume liability for certain events or occurrences that took place prior to the date of acquisition. We have recorded $1.8 million and $1.4 million of probable pre-acquisition liabilities in the accompanying consolidated balance sheets at December 31, 2016 and 2015, respectively.
NOTE 15. SEGMENT REPORTING
We operate primarily through three business segments: diagnostic and information technology-based products and services for the veterinary market, which we refer to as CAG; water quality products (“Water”); and diagnostic products and services for livestock and poultry health and to ensure the quality and safety of milk and food, which we refer to as LPD. Our Other operating segment combines and presents products for the human point-of-care medical diagnostics market with our pharmaceutical product line and our out-licensing arrangements because they do not meet the quantitative or qualitative thresholds for reportable segments.
During the second quarter of 2016, we renamed our customer information management and diagnostic imaging systems line of business in the CAG segment to veterinary software, services and diagnostic imaging systems. Financial results were not adjusted as a result of this name change.
During the fourth quarter of 2016, we modified our management reporting to rename IDEXX VetLab service and accessories to CAG Diagnostics service and accessories and reclassified the location of SNAP Pro service plans previously located in CAG Diagnostics capital - instruments to CAG Diagnostics service and accessories. The amount of revenue reclassified was $1.4 million during the year ended December 31, 2016, and $0.5 million during the year ended December 31, 2015. The amount reclassified was immaterial during the year ended December 31, 2014.
Prior to January 1, 2015, our CAG segment included certain herd health screening services processed within our CAG Reference Laboratories. We have transitioned the responsibility for these diagnostic services from our CAG segment to our LPD segment to more effectively align our business with the nature and customers of these livestock services. Segment revenue and income from operations for the year ended December 31, 2014 has been retrospectively revised in this Annual Report on Form 10-K to reflect this change in the composition of our reportable segments. Revenue related to these livestock diagnostic services was $13.8 million for the year ended December 31, 2014.
Operating segments are defined as components of an enterprise about which separate financial information is available that is evaluated regularly by the chief operating decision-maker, or decision-making group, in deciding how to allocate resources and in assessing performance. Our chief operating decision-maker is our Chief Executive Officer. Our operating segments include: CAG, Water, LPD, and Other. Assets are not allocated to segments for internal reporting purposes.
F-35
CAG develops, designs, manufactures and distributes products and performs services for veterinarians and the bioresearch market, primarily related to diagnostics and information management. Water develops, designs, manufactures and distributes a range of products used in the detection of various microbiological parameters in water. LPD develops, designs, manufactures and distributes diagnostic tests and related instrumentation and performs services that are used to manage the health status of livestock and poultry, to improve bovine reproductive efficiency, and to ensure the quality and safety of milk and food. OPTI Medical develops, designs, manufactures and distributes point-of-care electrolyte and blood gas analyzers and related consumable products for the human medical diagnostics market.
The accounting policies of our segments are the same as those described in the summary of significant accounting policies in Note 2 except for inventories, as discussed below. Intersegment revenues, which are not included in the table below, were not material for the years ended December 31, 2016, 2015 and 2014.
Certain costs are not allocated to our operating segments and are instead reported under the caption “Unallocated Amounts”. These costs include costs that do not align with one of our existing operating segments or are cost prohibitive to allocate, which primarily consist of our R&D function, regional or country expenses, certain foreign currency revaluation gains and losses on monetary balances in currencies other than our subsidiaries’ functional currency and unusual items. Corporate support function costs (such as information technology, facilities, human resources, finance and legal), health benefits and incentive compensation are charged to our business segments at pre-determined budgeted amounts or rates. Differences from these pre-determined budgeted amounts or rates are captured within Unallocated Amounts.
Effective January 1, 2016, we modified our management reporting to the Chief Operating Decision Maker to provide a more comprehensive view of the performance of our operating segments by including the capitalization and subsequent recognition of variances between standard and actual manufacturing costs, which adjusts the timing of cost recognition from when the variance is created to the period in which the related inventory is sold. Prior to January 1, 2016, the capitalization and subsequent recognition of these variances were not allocated to our operating segments and were instead reported under the caption “Unallocated Amounts”.
The segment income (loss) from operations within this Annual Report on Form 10-K for the years ended December 31, 2015 and 2014, has been retrospectively revised to reflect the changes to our segment performance metrics described above. The following is a summary of revised segment gross profit from operations for the years ended December 31, 2015 and 2014:
|
|
Net Impact of Standard Cost |
|||||||||||||||
|
|
For the Year Ended |
Variance Capitalization and |
For the Year Ended |
Adjusted |
||||||||||||
|
Operating Income (Loss) |
December 31, 2015 |
Percent of |
Subsequent Recognition |
December 31, 2015 |
Percent of |
|||||||||||
|
(dollars in thousands) |
As Previously Reported |
Revenue |
to the Operating Segments |
As Adjusted |
Revenue |
|||||||||||
|
|
||||||||||||||||
|
CAG |
$ |
231,642 | 17.1% |
$ |
1,677 |
$ |
233,319 | 17.2% | ||||||||
|
Water |
44,584 | 46.0% | 168 | 44,752 | 46.2% | |||||||||||
|
LPD |
24,397 | 19.2% | 2,760 | 27,157 | 21.4% | |||||||||||
|
Other |
156 | 0.7% | (293) | (137) | (0.6%) | |||||||||||
|
Unallocated Amounts |
(867) |
N/A |
(4,312) | (5,179) |
N/A |
|||||||||||
|
Total Company |
$ |
299,912 | 18.7% |
$ |
- |
$ |
299,912 | 18.7% | ||||||||
|
|
||||||||||||||||
|
|
Net Impact of Standard Cost |
|||||||||||||||
|
|
For the Year Ended |
Variance Capitalization and |
For the Year Ended |
Adjusted |
||||||||||||
|
Operating Income (Loss) |
December 31, 2014 |
Percent of |
Subsequent Recognition |
December 31, 2014 |
Percent of |
|||||||||||
|
(dollars in thousands) |
As Previously Reported |
Revenue |
to the Operating Segments |
As Adjusted |
Revenue |
|||||||||||
|
|
||||||||||||||||
|
CAG |
$ |
203,536 | 16.6% |
$ |
(3,002) |
$ |
200,534 | 16.4% | ||||||||
|
Water |
39,262 | 41.4% | (348) | 38,914 | 41.1% | |||||||||||
|
LPD |
33,788 | 23.9% | (4,461) | 29,327 | 20.8% | |||||||||||
|
Other |
2,479 | 9.2% | 178 | 2,657 | 9.9% | |||||||||||
|
Unallocated Amounts |
(18,810) |
N/A |
7,633 | (11,177) |
N/A |
|||||||||||
|
Total Company |
$ |
260,255 | 17.5% |
$ |
- |
$ |
260,255 | 17.5% | ||||||||
F-36
Below is our segment information (in thousands):
|
|
|||||||||||||||||||
|
For the Years Ended December 31, |
|||||||||||||||||||
|
|
CAG |
Water |
LPD |
Other |
Unallocated Amounts |
Consolidated Total |
|||||||||||||
|
2016 |
|||||||||||||||||||
|
Revenue |
$ |
1,522,689 |
$ |
103,579 |
$ |
126,491 |
$ |
22,664 |
$ |
- |
$ |
1,775,423 | |||||||
|
|
|||||||||||||||||||
|
Income (loss) from operations |
$ |
301,342 |
$ |
45,702 |
$ |
18,914 |
$ |
884 |
$ |
(16,603) |
$ |
350,239 | |||||||
|
Interest expense, net |
(28,393) | ||||||||||||||||||
|
Income before provision for income taxes |
321,846 | ||||||||||||||||||
|
Provision for income taxes |
99,792 | ||||||||||||||||||
|
Net income |
222,054 | ||||||||||||||||||
|
Less: Net income attributable to noncontrolling interest |
9 | ||||||||||||||||||
|
Net income attributable to IDEXX Laboratories, Inc. stockholders |
$ |
222,045 | |||||||||||||||||
|
|
|||||||||||||||||||
|
Depreciation and amortization |
$ |
64,878 |
$ |
3,098 |
$ |
5,543 |
$ |
4,699 |
$ |
- |
$ |
78,218 | |||||||
|
Expenditures for long-lived assets (1) |
$ |
56,329 |
$ |
2,102 |
$ |
4,824 |
$ |
1,532 |
$ |
- |
$ |
64,787 | |||||||
|
|
|||||||||||||||||||
|
2015 |
|||||||||||||||||||
|
Revenue |
$ |
1,356,287 |
$ |
96,884 |
$ |
127,143 |
$ |
21,578 |
$ |
- |
$ |
1,601,892 | |||||||
|
|
|||||||||||||||||||
|
Income (loss) from operations |
$ |
233,319 |
$ |
44,752 |
$ |
27,157 |
$ |
(137) |
$ |
(5,179) |
$ |
299,912 | |||||||
|
Interest expense, net |
(26,771) | ||||||||||||||||||
|
Income before provision for income taxes |
273,141 | ||||||||||||||||||
|
Provision for income taxes |
81,006 | ||||||||||||||||||
|
Net income |
192,135 | ||||||||||||||||||
|
Less: Net income attributable to noncontrolling interest |
57 | ||||||||||||||||||
|
Net income attributable to IDEXX Laboratories, Inc. stockholders |
$ |
192,078 | |||||||||||||||||
|
|
|||||||||||||||||||
|
Depreciation and amortization |
$ |
60,715 |
$ |
3,188 |
$ |
4,367 |
$ |
686 |
$ |
- |
$ |
68,956 | |||||||
|
Expenditures for long-lived assets (1) |
$ |
69,371 |
$ |
2,781 |
$ |
9,110 |
$ |
1,659 |
$ |
- |
$ |
82,921 | |||||||
|
|
|||||||||||||||||||
|
2014 |
|||||||||||||||||||
|
Revenue |
$ |
1,223,064 |
$ |
94,725 |
$ |
141,179 |
$ |
26,839 |
$ |
- |
$ |
1,485,807 | |||||||
|
|
|||||||||||||||||||
|
Income (loss) from operations |
$ |
200,534 |
$ |
38,914 |
$ |
29,327 |
$ |
2,657 |
$ |
(11,177) |
$ |
260,255 | |||||||
|
Interest expense, net |
(13,700) | ||||||||||||||||||
|
Income before provision for income taxes |
246,555 | ||||||||||||||||||
|
Provision for income taxes |
64,604 | ||||||||||||||||||
|
Net income |
181,951 | ||||||||||||||||||
|
Less: Net loss attributable to noncontrolling interest |
45 | ||||||||||||||||||
|
Net income attributable to IDEXX Laboratories, Inc. stockholders |
$ |
181,906 | |||||||||||||||||
|
|
|||||||||||||||||||
|
Depreciation and amortization |
$ |
48,740 |
$ |
2,553 |
$ |
5,144 |
$ |
2,451 |
$ |
- |
$ |
58,888 | |||||||
|
Expenditures for long-lived assets (1) |
$ |
49,270 |
$ |
2,499 |
$ |
4,025 |
$ |
4,729 |
$ |
- |
$ |
60,523 | |||||||
__________
(1)Expenditures for long-lived assets exclude expenditures for intangible assets. See Note 3 for information regarding acquisitions of intangible assets during the years ended December 31, 2016, 2015 and 2014.
F-37
Revenue by product and service categories was as follows (in thousands):
|
|
||||||||||
|
|
For the Years Ended December 31, |
|||||||||
|
|
2016 | 2015 | 2014 | |||||||
|
CAG segment revenue: |
||||||||||
|
CAG Diagnostics recurring revenue: |
$ |
1,281,262 |
$ |
1,147,026 |
$ |
1,039,252 | ||||
|
IDEXX VetLab consumables |
451,456 | 396,526 | 341,407 | |||||||
|
Rapid assay products |
189,122 | 182,670 | 165,647 | |||||||
|
Reference laboratory diagnostic and consulting services |
581,067 | 512,155 | 479,192 | |||||||
|
CAG Diagnostics service and accessories |
59,617 | 55,675 | 53,006 | |||||||
|
CAG Diagnostics capital - instruments |
121,191 | 98,502 | 79,993 | |||||||
|
Veterinary software, services and diagnostic imaging systems |
120,236 | 110,759 | 103,819 | |||||||
|
CAG segment revenue |
1,522,689 | 1,356,287 | 1,223,064 | |||||||
|
|
||||||||||
|
Water segment revenue |
103,579 | 96,884 | 94,725 | |||||||
|
LPD segment revenue |
126,491 | 127,143 | 141,179 | |||||||
|
Other segment revenue |
22,664 | 21,578 | 26,839 | |||||||
|
|
||||||||||
|
Total revenue |
$ |
1,775,423 |
$ |
1,601,892 |
$ |
1,485,807 | ||||
Revenue by principal geographic area, based on customers’ domiciles, was as follows (in thousands):
|
|
||||||||||
|
|
For the Years Ended December 31, |
|||||||||
|
|
2016 | 2015 | 2014 | |||||||
|
Americas |
||||||||||
|
United States |
$ |
1,089,595 |
$ |
980,281 |
$ |
848,928 | ||||
|
Canada |
74,923 | 69,303 | 69,743 | |||||||
|
Latin America |
38,872 | 34,725 | 34,086 | |||||||
|
|
1,203,390 | 1,084,309 | 952,757 | |||||||
|
|
||||||||||
|
Europe, the Middle East and Africa |
||||||||||
|
Germany |
80,156 | 73,395 | 85,189 | |||||||
|
United Kingdom |
77,671 | 74,879 | 74,131 | |||||||
|
France |
51,204 | 46,972 | 53,322 | |||||||
|
Italy |
28,907 | 25,903 | 28,794 | |||||||
|
Spain |
24,268 | 19,998 | 21,566 | |||||||
|
Switzerland |
16,361 | 15,631 | 14,544 | |||||||
|
Netherlands |
14,049 | 11,645 | 10,643 | |||||||
|
Other |
83,147 | 79,910 | 78,201 | |||||||
|
|
375,763 | 348,333 | 366,390 | |||||||
|
Asia Pacific Region |
||||||||||
|
Australia |
52,871 | 49,274 | 58,448 | |||||||
|
Japan |
51,544 | 43,171 | 44,132 | |||||||
|
China |
48,257 | 40,619 | 34,674 | |||||||
|
Other |
43,598 | 36,186 | 29,406 | |||||||
|
|
196,270 | 169,250 | 166,660 | |||||||
|
Total |
$ |
1,775,423 |
$ |
1,601,892 |
$ |
1,485,807 | ||||
F-38
Net long-lived assets, consisting of net property and equipment, are subject to geographic risks because they are generally difficult to move and to effectively utilize in another geographic area in a reasonable time period and because they are relatively illiquid. Net long-lived assets by principal geographic areas were as follows (in thousands):
|
|
December 31, |
December 31, |
||||||||
|
|
2016 | 2015 | ||||||||
|
Americas |
||||||||||
|
United States |
$ |
298,944 |
$ |
285,391 | ||||||
|
Brazil |
17,910 | 8,404 | ||||||||
|
Canada |
1,977 | 1,796 | ||||||||
|
|
318,831 | 295,591 | ||||||||
|
Europe, the Middle East and Africa |
||||||||||
|
United Kingdom |
9,127 | 13,269 | ||||||||
|
Germany |
5,040 | 5,159 | ||||||||
|
Netherlands |
5,948 | 4,425 | ||||||||
|
France |
2,428 | 2,679 | ||||||||
|
Switzerland |
2,450 | 2,831 | ||||||||
|
Other |
3,490 | 2,047 | ||||||||
|
|
28,483 | 30,410 | ||||||||
|
Asia Pacific Region |
||||||||||
|
Japan |
2,469 | 2,210 | ||||||||
|
Australia |
4,185 | 2,135 | ||||||||
|
Other |
3,454 | 2,680 | ||||||||
|
|
10,108 | 7,025 | ||||||||
|
Total |
$ |
357,422 |
$ |
333,026 | ||||||
NOTE 16. FAIR VALUE MEASUREMENTS
U.S. GAAP defines fair value as the price that would be received to sell an asset or paid to transfer a liability in an orderly transaction between market participants at the measurement date. U.S. GAAP requires an entity to maximize the use of observable inputs, where available, and minimize the use of unobservable inputs when measuring fair value.
We have certain financial assets and liabilities that are measured at fair value on a recurring basis, certain nonfinancial assets and liabilities that may be measured at fair value on a non-recurring basis and certain financial assets and liabilities that are not measured at fair value in our consolidated balance sheets but for which we disclose the fair value. The fair value disclosures of these assets and liabilities are based on a three-level hierarchy, which is defined as follows:
|
Level 1 |
Quoted prices in active markets for identical assets or liabilities that the entity can access at the measurement date. |
|
Level 2 |
Observable inputs other than Level 1 prices, such as quoted prices for similar assets or liabilities; quoted prices in markets that are not active; or other inputs that are observable or can be corroborated by observable market data for substantially the full term of the assets or liabilities. |
|
Level 3 |
Unobservable inputs that are supported by little or no market activity and that are significant to the fair value of the assets or liabilities. |
Assets and liabilities measured at fair value are classified in their entirety based on the lowest level of input that is significant to the fair value measurement. Our assessment of the significance of a particular input to the fair value measurement in its entirety requires judgment and considers factors specific to the asset or liability.
F-39
Our marketable debt securities are initially valued at the transaction price and are subsequently remeasured to fair value as of the balance sheet date utilizing third-party pricing services. The pricing services utilize industry standard valuation models, including both income and market-based approaches and observable market inputs to determine value. Observable market inputs include reportable trades, benchmark yields, credit spreads, broker/dealer quotes, bids, offers and other industry and economic events. We validate the prices provided by our third-party pricing services by obtaining independent market values from other pricing sources and analyzing pricing data in certain instances.
Our foreign currency exchange contracts and interest rate swap agreements are measured at fair value on a recurring basis in our accompanying consolidated balance sheets. We measure the fair value of our foreign currency exchange contracts classified as derivative instruments using an income approach, based on prevailing market forward rates less the contract rate multiplied by the notional amount. The product of this calculation is then adjusted for counterparty risk.
We measure the fair value of our interest rate swaps classified as derivative instruments using an income approach, utilizing a discounted cash flow analysis based on the terms of the contract and the interest rate curve adjusted for counterparty risk.
The amount outstanding under our unsecured revolving credit facility and long-term debt are measured at carrying value in our accompanying consolidated balance sheets though we disclose the fair value of these financial instruments. We determine the fair value of the amount outstanding under our credit facility and long-term debt using an income approach, utilizing a discounted cash flow analysis based on current market interest rates for debt issues with similar remaining years to maturity, adjusted for applicable credit risk. Our credit facility and long-term debt are valued using Level 2 inputs. The estimated fair value of our credit facility approximates its carrying value. At December 31, 2016, the estimated fair value and carrying value of our long-term debt were $609.5 million and $593.7 million, respectively. At December 31, 2015, the estimated fair value and carrying value of our long-term debt were $593.7 million and $597.1 million, respectively.
The following table sets forth our assets and liabilities that were measured at fair value on a recurring basis at December 31, 2016, and at December 31, 2015, by level within the fair value hierarchy (in thousands):
|
|
Quoted Prices |
Significant |
||||||||||
|
|
in Active |
Other |
Significant |
|||||||||
|
|
Markets for |
Observable |
Unobservable |
|||||||||
|
|
Identical Assets |
Inputs |
Inputs |
Balance at |
||||||||
|
As of December 31, 2016 |
(Level 1) |
(Level 2) |
(Level 3) |
December 31, 2016 |
||||||||
|
|
||||||||||||
|
Assets |
||||||||||||
|
Money market funds(1) |
$ |
34,208 |
$ |
- |
$ |
- |
$ |
34,208 | ||||
|
Certificates of deposit |
$ |
- |
$ |
1,500 |
$ |
- |
$ |
1,500 | ||||
|
Commercial paper |
$ |
- |
$ |
898 |
$ |
- |
$ |
898 | ||||
|
|
||||||||||||
|
Marketable securities |
||||||||||||
|
Corporate bonds |
$ |
- |
$ |
130,771 |
$ |
- |
$ |
130,771 | ||||
|
Certificates of deposit |
- |
40,400 |
- |
40,400 | ||||||||
|
Asset backed securities |
- |
27,315 |
- |
27,315 | ||||||||
|
Commercial paper |
- |
20,228 |
- |
20,228 | ||||||||
|
U.S. government bonds |
- |
12,231 |
- |
12,231 | ||||||||
|
Agency bonds |
- |
4,604 |
- |
4,604 | ||||||||
|
Municipal bonds |
- |
1,400 |
- |
1,400 | ||||||||
|
Total marketable securities |
$ |
- |
$ |
236,949 |
$ |
- |
$ |
236,949 | ||||
|
|
||||||||||||
|
Equity mutual funds(2) |
$ |
2,182 |
$ |
- |
$ |
- |
$ |
2,182 | ||||
|
Foreign currency exchange contracts(3) |
$ |
- |
$ |
8,926 |
$ |
- |
$ |
8,926 | ||||
|
Liabilities |
||||||||||||
|
Foreign currency exchange contracts(3) |
$ |
- |
$ |
1,081 |
$ |
- |
$ |
1,081 | ||||
|
Deferred compensation(4) |
$ |
2,182 |
$ |
- |
$ |
- |
$ |
2,182 | ||||
|
|
||||||||||||
F-40
|
|
Quoted Prices |
Significant |
||||||||||
|
|
in Active |
Other |
Significant |
|||||||||
|
|
Markets for |
Observable |
Unobservable |
|||||||||
|
|
Identical Assets |
Inputs |
Inputs |
Balance at |
||||||||
|
As of December 31, 2015 |
(Level 1) |
(Level 2) |
(Level 3) |
December 31, 2015 |
||||||||
|
|
||||||||||||
|
Assets |
||||||||||||
|
Money market funds(1) |
$ |
15,490 |
$ |
- |
$ |
- |
$ |
15,490 | ||||
|
Certificates of deposit |
$ |
- |
$ |
1,999 |
$ |
- |
$ |
1,999 | ||||
|
Commercial paper |
$ |
- |
$ |
1,800 |
$ |
- |
$ |
1,800 | ||||
|
|
||||||||||||
|
Marketable securities |
||||||||||||
|
Corporate bonds |
$ |
- |
$ |
177,613 |
$ |
- |
$ |
177,613 | ||||
|
U.S. government bonds |
- |
12,871 |
- |
12,871 | ||||||||
|
Agency bonds |
- |
12,065 |
- |
12,065 | ||||||||
|
Certificates of deposit |
- |
3,500 |
- |
3,500 | ||||||||
|
Commercial paper |
- |
3,491 |
- |
3,491 | ||||||||
|
International government bonds |
- |
1,459 |
- |
1,459 | ||||||||
|
Municipal bonds |
- |
1,399 |
- |
1,399 | ||||||||
|
Treasury bills |
- |
1,193 |
- |
1,193 | ||||||||
|
Total marketable securities |
$ |
- |
$ |
213,591 |
$ |
- |
$ |
213,591 | ||||
|
|
||||||||||||
|
Equity mutual funds(2) |
$ |
2,264 |
$ |
- |
$ |
- |
$ |
2,264 | ||||
|
Foreign currency exchange contracts(3) |
$ |
- |
$ |
4,876 |
$ |
- |
$ |
4,876 | ||||
|
Liabilities |
||||||||||||
|
Foreign currency exchange contracts(3) |
$ |
- |
$ |
1,365 |
$ |
- |
$ |
1,365 | ||||
|
Deferred compensation(4) |
$ |
2,264 |
$ |
- |
$ |
- |
$ |
2,264 | ||||
|
Interest rate swaps(5) |
$ |
- |
$ |
384 |
$ |
- |
$ |
384 | ||||
__________
|
(1) |
Money market funds, agency bonds and commercial paper with an original maturity of less than ninety days are included within cash and cash equivalents. The remaining balance of cash and cash equivalents as of December 31, 2016, and December 31, 2015, consisted of demand deposits. Commercial paper with an original maturity of over ninety days is included within marketable securities. |
|
(2) |
Equity mutual funds relate to a deferred compensation plan that was assumed as part of a previous business combination. This amount is included within other long-term assets, net. See number (4) below for a discussion of the related deferred compensation liability. |
|
(3) |
Foreign currency exchange contracts are included within other current assets, net; other long-term assets, net; accrued liabilities; or other long-term liabilities depending on the gain (loss) position and anticipated settlement date. |
|
(4) |
A deferred compensation plan assumed as part of a previous business combination is included within other long-term liabilities. The fair value of our deferred compensation plan is indexed to the performance of the underlying equity mutual funds discussed in number (2) above. |
|
(5) |
Interest rate swaps are included within accrued liabilities. |
We did not have any transfers between Level 1 and Level 2 or transfers in or out of Level 3 of the fair value hierarchy during the years ended December 31, 2016 and 2015.
The estimated fair value of certain financial instruments, including cash and cash equivalents, accounts receivable and accounts payable, approximate carrying value due to their short maturity.
Note 17. HEDGING Instruments
We recognize all derivative and non-derivative instruments (collectively “hedging instruments”) on the balance sheet at fair value at the balance sheet date. Instruments that do not qualify for hedge accounting treatment must be recorded at fair value through earnings. To qualify for hedge accounting treatment, cash flow and net investment hedges must be highly effective in offsetting changes to expected future cash flows or fair value on hedged transactions. If the instrument qualifies for hedge accounting, changes in the fair value of the hedging instrument from the effective portion of the hedge are deferred in AOCI, net of tax, and reclassified into earnings in the same period or periods during which the hedged transaction affects earnings. We immediately record in earnings the extent to which a hedging instrument is not effective in achieving offsetting changes in fair value. We de-designate hedging instruments from hedge accounting when the likelihood of the hedged transaction occurring becomes less than probable. For de-designated instruments, the gain or loss from the time of de-designation through maturity of the instrument is recognized in earnings. Any gain or loss in AOCI at the time of de-designation is reclassified into earnings in the same period or periods during which the hedged transaction affects earnings.
F-41
We enter into master netting arrangements with the counterparties to our derivative transactions which permit certain outstanding receivables and payables to be offset in the event of default. Our derivative contracts do not require either party to post cash collateral. We elect to present our derivative assets and liabilities in the accompanying consolidated balance sheets on a gross basis. All cash flows related to our foreign currency exchange contracts and interest rate swaps are classified as operating cash flows, which is consistent with the cash flow treatment of the underlying items being hedged.
Disclosure within this footnote is presented to provide transparency about how and why we use derivative and non-derivative instruments (collectively “hedging instruments”) and how the hedging instruments and related hedged items affect our financial position, results of operations, and cash flows. See Note 16 for additional information regarding the fair value of our derivative instruments and Note 19 for additional information regarding the effect of derivative instruments designated as cash flow hedges on the consolidated statement of operations.
We are exposed to certain risks related to our ongoing business operations. The primary risks that we manage by using hedging instruments are foreign currency exchange risk and interest rate risk. Our subsidiaries enter into foreign currency exchange contracts to manage the exchange risk associated with their forecasted intercompany inventory purchases and sales for the next year. From time to time, we may also enter into other foreign currency exchange contracts or foreign-denominated debt issuances to minimize the impact of foreign currency fluctuations associated with specific balance sheet exposures, including net investments in certain foreign subsidiaries. We enter into interest rate swaps to minimize the impact of interest rate fluctuations associated with borrowings under our variable-rate Credit Facility.
The primary purpose of our foreign currency hedging activities is to protect against the volatility associated with foreign currency transactions, including transactions denominated in euro, British pound, Japanese yen, Canadian dollar, Australian dollar and Swiss franc. We also utilize natural hedges to mitigate our transaction and commitment exposures. Our corporate policy prescribes the range of allowable hedging activity. We enter into foreign currency exchange contracts with well-capitalized multinational financial institutions, and we do not hold or engage in transactions involving hedging instruments for purposes other than risk management. Our accounting policies for these contracts are based on our designation of such instruments as hedging transactions.
Cash Flow Hedges
We have designated our foreign currency exchange contracts and variable-to-fixed interest rate swaps as cash flow hedges as these derivative instruments mitigate the exposure to variability in the cash flows of forecasted transactions attributable to foreign currency exchange and interest rates. Unless noted otherwise, we have also designated our derivative instruments as qualifying for hedge accounting treatment.
We did not de-designate any instruments from hedge accounting treatment during the years ended December 31, 2016, 2015 and 2014. Gains or losses related to hedge ineffectiveness recognized in earnings during the years ended December 31, 2016, 2015 and 2014 were not material. At December 31, 2016, the estimated amount of net gains, net of income tax expense, which are expected to be reclassified out of AOCI and into earnings within the next twelve months is $ 4.9 million if exchange and interest rates do not fluctuate from the levels at December 31, 2016.
We hedge approximately 85 percent of the estimated exposure from intercompany product purchases and sales denominated in the euro, British pound, Canadian dollar, Japanese yen, Australian dollar and Swiss franc. We have additional unhedged foreign currency exposures related to foreign services and emerging markets where it is not practical to hedge. We primarily utilize foreign currency exchange contracts with durations of less than 24 months. Quarterly, we enter into contracts to hedge incremental portions of anticipated foreign currency transactions for the current and following year. As a result, our risk with respect to foreign currency exchange rate fluctuations and the notional value of foreign currency exchange contracts may vary throughout the year. The U.S. dollar is the currency purchased or sold in all of our foreign currency exchange contracts. The notional amount of foreign currency exchange contracts to hedge forecasted intercompany inventory purchases and sales totaled $175.9 million at December 31, 2016, and $176.1 million at December 31, 2015.
F-42
We previously entered into forward fixed interest rate swap agreements to manage the economic effect of variable interest obligations on amounts borrowed under the terms of our Credit Facility. Beginning on March 30, 2012, the variable interest rate associated with $40 million of borrowings outstanding under the Credit Facility became effectively fixed at 1.36 percent plus the range of applicable interest rate fixed credit spreads (“Credit Spread”) through June 30, 2016. Beginning on March 28, 2013, the variable interest rate associated with an additional $40 million of borrowings outstanding under the Credit Facility became effectively fixed at 1.64 percent plus the Credit Spread through June 30, 2016. As of December 31, 2016, we have no outstanding interest rate swaps.
Net Investment Hedge
In June 2015, we issued and sold our 2025 Series C Notes through a private placement an aggregate principal amount of €88.9 million. We have designated these euro-denominated notes as a hedge of our euro net investment in certain foreign subsidiaries to reduce the volatility in stockholders’ equity caused by changes in foreign currency exchange rates in the euro relative to the U.S. dollar. As a result of this designation, gains and losses from the change in translated U.S. dollar value of these euro-denominated notes are recorded in AOCI rather than to earnings. We recorded a $2.1 million gain, net of income tax, within AOCI as a result of this net investment hedge for the year ended December 31, 2016. This unrealized gain recorded at December 31, 2016, will not be reclassified in earnings until the complete or substantially complete liquidation of the net investment in the hedged foreign operations or all or a portion of the hedge no longer qualifies for hedge accounting treatment. See Note 11 to the consolidated financial statements included in this Annual Report on Form 10-K for further information regarding the issuance of these 2025 Series C Notes.
Fair Values of Hedging Instruments Designated as Hedges in Consolidated Balance Sheets
The fair values of hedging instruments, and their respective classification on the consolidated balance sheets and amounts subject to offset under master netting arrangements consisted of the following (in thousands):
|
|
Hedging Assets |
|||||||
|
|
December 31, |
December 31, |
||||||
|
|
2016 | 2015 | ||||||
|
|
||||||||
|
Derivatives designated as hedging instruments |
Balance Sheet Classification |
|||||||
|
Foreign currency exchange contracts |
Other current assets |
$ |
8,926 |
$ |
4,876 | |||
|
Total derivative instruments presented as cash flow hedges on the balance sheet |
8,926 | 4,876 | ||||||
|
Gross amounts subject to master netting arrangements not offset on the balance sheet |
679 | 1,268 | ||||||
|
Net amount |
$ |
8,247 |
$ |
3,608 | ||||
|
|
Hedging Liabilities |
|||||||
|
|
December 31, |
December 31, |
||||||
|
|
2016 | 2015 | ||||||
|
|
||||||||
|
Derivatives designated as hedging instruments |
Balance Sheet Classification |
|||||||
|
Foreign currency exchange contracts |
Accrued liabilities |
$ |
1,081 |
$ |
1,365 | |||
|
Interest rate swaps |
Accrued liabilities |
- |
384 | |||||
|
Total derivative instruments presented as cash flow hedges on the balance sheet |
1,081 | 1,749 | ||||||
|
Foreign currency borrowings designated as net investment hedge on the balance sheet |
Long-term debt |
93,664 | 97,085 | |||||
|
Total hedging instruments presented on the balance sheet |
94,745 | 98,834 | ||||||
|
Gross amounts subject to master netting arrangements not offset on the balance sheet |
679 | 1,268 | ||||||
|
Net amount |
$ |
94,066 |
$ |
97,566 | ||||
|
|
||||||||
F-43
The effect of derivative instruments designated as cash flow hedges on the consolidated balance sheets for the years ended December 31, 2016, 2015 and 2014 consisted of the following (in thousands):
|
|
Gain (Loss) Recognized in AOCI on Derivative Instruments (Effective Portion) |
||||||||||
|
|
For Year Ended December 31, |
||||||||||
|
Derivative instruments |
2016 | 2015 | 2014 | ||||||||
|
|
|||||||||||
|
Foreign currency exchange contracts, net of tax |
$ |
2,457 |
$ |
(5,604) |
$ |
7,098 | |||||
|
Interest rate swaps, net of tax |
242 | 461 | 442 | ||||||||
|
Total derivative instruments, net of tax |
$ |
2,699 |
$ |
(5,143) |
$ |
7,540 | |||||
NOTE 18. REPURCHASES OF COMMON STOCK
Our Board of Directors has authorized the repurchase of up to 65,000,000 shares of our common stock in the open market or in negotiated transactions pursuant to the Company’s share repurchase program. We believe that the repurchase of our common stock is a favorable means of returning value to our shareholders, and we also repurchase to offset the dilutive effect of our share-based compensation programs. Repurchases of our common stock may vary depending upon the level of other investing activities and the share price. As of December 31, 2016, there are 3,735,508 remaining shares available for repurchase under this authorization.
We primarily acquire shares by means of repurchases in the open market. However, we also acquire shares that are surrendered by employees in payment for the minimum required withholding taxes due on the vesting of restricted stock units and the settlement of deferred stock units, otherwise referred to herein as employee surrenders.
The following is a summary of our open market common stock repurchases and shares acquired through employee surrender for the years ended December 31, 2016, 2015 and 2014 (in thousands, except per share amounts):
|
|
For the Years Ended December 31, |
||||||||
|
|
2016 | 2015 | 2014 | ||||||
|
|
|||||||||
|
Share repurchases during the period(1) |
3,071 | 5,659 | 9,761 | ||||||
|
Shares acquired through employee surrender(1) |
60 | 69 | 92 | ||||||
|
Total shares repurchased(1) |
3,131 | 5,728 | 9,853 | ||||||
|
|
|||||||||
|
Cost of share repurchases during the period |
$ |
313,072 |
$ |
406,430 |
$ |
618,158 | |||
|
Cost of employee surrenders |
4,372 | 5,457 | 5,809 | ||||||
|
Total cost of shares repurchased |
$ |
317,444 |
$ |
411,887 |
$ |
623,967 | |||
|
|
|||||||||
|
Average cost per share |
$ |
101.40 |
$ |
71.90 |
$ |
63.32 | |||
|
(1) |
Shares repurchased and acquired through employee surrender for payment of minimum required withholding taxes on and before June 15, 2015 and the associated average cost per share have been adjusted to reflect the June 2015 two-for-one stock split. Actual shares repurchased were approximately 4,313,000 and 4,927,000 for the years ended December 31, 2015 and 2014, respectively. |
F-44
NOTE 19. ACCUMULATED OTHER COMPREHENSIVE INCOME
The changes in accumulated other comprehensive income, net of tax, for the years ended December 31, 2016 and 2015 consisted of the following (in thousands):
|
|
Unrealized gain (loss) on investments, net of tax |
Unrealized gain (loss) on derivatives instruments, net of tax |
Unrealized gain on net investment hedge, net of tax |
Cumulative translation adjustment |
Total |
||||||||||
|
|
|||||||||||||||
|
Balance as of December 31, 2014 |
$ |
1 |
$ |
7,361 |
$ |
- |
$ |
(15,433) |
$ |
(8,071) | |||||
|
Other comprehensive income (loss) before reclassifications |
(226) | 8,839 | 1,894 | (30,718) | (20,211) | ||||||||||
|
Gains reclassified from accumulated other comprehensive income |
- |
(13,983) |
- |
- |
(13,983) | ||||||||||
|
Balance as of December 31, 2015 |
(225) | 2,217 | 1,894 | (46,151) | (42,265) | ||||||||||
|
Other comprehensive income (loss) before reclassifications |
245 | 4,950 | 2,142 | (5,874) | 1,463 | ||||||||||
|
Gains reclassified from accumulated other comprehensive income |
- |
(2,251) |
- |
- |
(2,251) | ||||||||||
|
Balance as of December 31, 2016 |
$ |
20 |
$ |
4,916 |
$ |
4,036 |
$ |
(52,025) |
$ |
(43,053) |
The following is a summary of reclassifications out of accumulated other comprehensive income for the years ended December 31, 2016, 2015 and 2014 (in thousands):
|
|
Amounts Reclassified from Accumulated Other |
|||||||||||
|
|
Affected Line Item in the |
Comprehensive Income |
||||||||||
|
Details about Accumulated Other |
Statement Where |
For the Years Ended December 31, |
||||||||||
|
Comprehensive Income Components |
Net Income is Presented |
2016 | 2015 | 2014 | ||||||||
|
|
||||||||||||
|
Gains (losses) on derivative instruments included in net income: |
||||||||||||
|
Foreign currency exchange contracts |
Cost of revenue |
$ |
3,621 |
$ |
20,878 |
$ |
3,822 | |||||
|
Interest rate swaps |
Interest expense |
(421) | (1,042) | (1,064) | ||||||||
|
|
Total gains before tax |
3,200 | 19,836 | 2,758 | ||||||||
|
|
Tax expense |
949 | 5,853 | 756 | ||||||||
|
|
Gains, net of tax |
$ |
2,251 |
$ |
13,983 |
$ |
2,002 | |||||
NOTE 20. PREFERRED STOCK
Our Board of Directors is authorized, subject to any limitations prescribed by law, without further stockholder approval, to issue from time to time up to 500,000 shares of Preferred Stock, $1.00 par value per share (“Preferred Stock”), in one or more series. Each such series of Preferred Stock shall have such number of shares, designations, preferences, voting powers, qualifications and special or relative rights or privileges as shall be determined by the Board of Directors, which may include, among others, dividend rights, voting rights, redemption and sinking fund provisions, liquidation preferences, conversion rights and preemptive rights. There are no shares of Preferred Stock outstanding as of December 31, 2016.
NOTE 21. IDEXX RETIREMENT AND INCENTIVE SAVINGS PLAN
We have established the IDEXX Retirement and Incentive Savings Plan (the “401(k) Plan”). U.S. employees eligible to participate in the 401(k) Plan may contribute specified percentages of their salaries. We match a portion of these contributions, not to exceed 4 percent of participants’ eligible compensation. We matched $12.5 million for the year ended December 31, 2016, $11.5 million for the year ended December 31, 2015, and $8.8 million for the year ended December 31, 2014. In addition, we may make contributions to the 401(k) Plan at the discretion of the Board of Directors. There were no discretionary contributions in 2016, 2015 or 2014.
We also have established defined contribution plans for regional employees in Europe and in Canada. With respect to these plans, our contributions over the past three years have not been material.
F-45
NOTE 22. SUMMARY OF QUARTERLY DATA (UNAUDITED)
A summary of quarterly data(1) follows (in thousands, except per share data):
|
|
For the Three Months Ended |
||||||||||||
|
|
March 31, |
June 30, |
September 30, |
December 31, |
|||||||||
|
|
|||||||||||||
|
2016 |
|||||||||||||
|
Revenue |
$ |
417,550 |
$ |
466,569 |
$ |
448,308 |
$ |
442,996 | |||||
|
Gross profit |
227,537 | 260,543 | 246,730 | 240,626 | |||||||||
|
Operating income |
73,793 | 104,162 | 88,459 | 83,825 | |||||||||
|
Net income attributable to IDEXX Laboratories, Inc. stockholders |
46,019 | 67,202 | 56,455 | 52,369 | |||||||||
|
Earnings per share: |
|||||||||||||
|
Basic |
$ |
0.51 |
$ |
0.75 |
$ |
0.63 |
$ |
0.59 | |||||
|
Diluted |
$ |
0.51 |
$ |
0.74 |
$ |
0.62 |
$ |
0.58 | |||||
|
|
|||||||||||||
|
2015 |
|||||||||||||
|
Revenue |
$ |
382,477 |
$ |
413,343 |
$ |
406,387 |
$ |
399,685 | |||||
|
Gross profit |
215,544 | 232,757 | 224,274 | 217,695 | |||||||||
|
Operating income |
72,803 | 88,303 | 71,895 | 66,911 | |||||||||
|
Net income attributable to IDEXX Laboratories, Inc. stockholders |
46,594 | 56,912 | 44,223 | 44,349 | |||||||||
|
Earnings per share: |
|||||||||||||
|
Basic |
$ |
0.49 |
$ |
0.61 |
$ |
0.48 |
$ |
0.49 | |||||
|
Diluted |
$ |
0.49 |
$ |
0.60 |
$ |
0.48 |
$ |
0.48 | |||||
|
(1) |
Amounts presented may not recalculate to full-year totals due to rounding. |
F-46
SCHEDULE II
IDEXX LABORATORIES, INC. AND SUBSIDIARIES
VALUATION AND QUALIFYING ACCOUNTS
(in thousands)
|
|
|||||||||||||||||
|
|
Balance at Beginning of Year |
Charges to Costs and Expenses |
Charges to Other Accounts(1) |
Write-Offs/Cash Payments |
Foreign Currency Translation |
Balance at End of Year |
|||||||||||
|
|
|||||||||||||||||
|
Reserves for doubtful accounts receivable: |
|||||||||||||||||
|
December 31, 2014 |
$ |
3,533 |
$ |
2,035 |
$ |
- |
$ |
(1,146) |
$ |
(116) |
$ |
4,306 | |||||
|
December 31, 2015 |
4,306 | 2,200 |
- |
(817) | (561) | 5,128 | |||||||||||
|
December 31, 2016 |
5,128 | 822 |
- |
(531) | (896) | 4,523 | |||||||||||
|
|
|||||||||||||||||
|
Valuation allowance for deferred tax assets: |
|||||||||||||||||
|
December 31, 2014 |
$ |
5,201 |
$ |
799 |
$ |
- |
$ |
(1,042) |
$ |
(280) |
$ |
4,678 | |||||
|
December 31, 2015 |
4,678 | 634 |
- |
(468) | (398) | 4,446 | |||||||||||
|
December 31, 2016 |
4,446 | 885 |
- |
(816) | 376 | 4,891 | |||||||||||
|
|
|||||||||||||||||
|
(1) Amount relates to net operating losses obtained through acquisitions where uncertainty exists as to our ability to use the tax attribute. |
|||||||||||||||||
F-47
EXHIBIT INDEX
|
Exhibit No. |
Description |
|
3.1 |
Restated Certificate of Incorporation of the Company, as amended (filed as Exhibit No. 3(i) to Quarterly Report on Form 10-Q for the quarter ended June 30, 2006, File No. 0-19271, and incorporated herein by reference). |
|
3.2 |
Amended and Restated By-Laws of the Company (filed as Exhibit No. 3.2 to Annual Report on Form 10-K for the year ended December 31, 2015, File No. 0-19271 (“2015 Form 10-K”), and incorporated herein by reference). |
|
4.1 |
Note Purchase Agreement, dated as of December 11, 2013, among the Company, as issuer, New York Life Insurance Company, and New York Life Investment Management LLC, as investment manager for New York Life Insurance and Annuity Corporation and New York Life Insurance and Annuity Corporation Institutionally Owned Life Insurance Separate Account (BOLI 30C), as purchasers (filed as Exhibit No. 99.1 to Current Report on Form 8-K filed December 11, 2013, File No. 0-19271, and incorporated herein by reference). |
|
|
|
|
4.2 |
Note Purchase and Private Shelf Agreement, dated as of July 21, 2014, among the Company, as issuer, Prudential Investment Management, Inc., Pruco Life Insurance Company, The Prudential Insurance Company of America, Prudential Investment Japan Co., Ltd., as investment manager, and Prudential Investment Management, Inc., as sub-adviser for The Gibraltar Life Insurance Co., Ltd., Prudential Arizona Reinsurance Universal Company, as grantor, and Prudential Investment Management, Inc., as investment manager for PAR U Hartford Life Insurance Comfort Trust, Prudential Private Placement Investors, L.P., as investment advisor, and Prudential Private Placement Investors, Inc., as general partner to each of, The Independent Order of Foresters, Zurich American Insurance Company, Globe Life and Accident Insurance Company, Family Heritage Life Insurance Company of America, MTL Insurance Company, The Lincoln National Life Insurance Company, William Penn Life Insurance Company of New York, Farmers Insurance Exchange and Mid Century Insurance Company, as purchasers (filed as Exhibit No. 99.1 to Current Report on Form 8-K Filed July 25, 2014, File No. 0-19271, and incorporated herein by reference). |
|
|
|
|
4.3 |
Note Purchase Agreement, dated as of July 22, 2014, among the Company, as issuer, New York Life Insurance Company, and NYL Investors LLC, as investment manager for New York Life Insurance and Annuity Corporation and New York Life Insurance and Annuity Corporation Institutionally Owned Life Insurance Separate Account (BOLI 30C), as purchasers (filed as Exhibit No. 99.2 to Current Report on Form 8-K file July 25, 2014, File No. 0-19271, and incorporated herein by reference). |
|
|
|
|
4.4 |
Amended and Restated Multi-Currency Note Purchase and Private Shelf Agreement, dated as of June 18, 2015, among the Company, Prudential Investment Management, Inc., Pruco Life Insurance Company, The Prudential Insurance Company of America, Prudential Investment Japan Co., Ltd., as investment manager, and Prudential Investment Management, Inc., as sub-adviser for The Gibraltar Life Insurance Co., Ltd., Prudential Arizona Reinsurance Universal Company, as grantor, and Prudential Private Placement Investors, L.P., as investment advisor, and Prudential Private Placement Investors, Inc., as general partner to each of, The Independent Order of Foresters, Zurich American Insurance Company, Globe Life and Accident Insurance Company, Family Heritage Life Insurance Company of America, MTL Insurance Company, The Lincoln National Life Insurance Company, William Penn Life Insurance Company of New York, Farmers Insurance Exchange and Mid Century Insurance Company, as purchasers. (filed as Exhibit No. 99.1 to Current Report on Form 8-K filed June 24, 2015 and incorporated herein by reference). |
|
|
F-48
|
10.1* |
U.S. Supply Agreement, effective as of October 16, 2003, between the Company and Ortho-Clinical Diagnostics, Inc. (“Ortho”) (filed as Exhibit No. 10.7 to Annual Report on Form 10-K for the year ended December 31, 2003, File No. 0-19271 (“2003 Form 10-K”), and incorporated herein by reference). |
|
10.2* |
Amendment No. 1 to U.S. Supply Agreement effective as of January 1, 2005, between the Company and Ortho (filed as Exhibit No. 10.1 to Quarterly Report on Form 10-Q for the quarter ended June 30, 2005, File No. 0-19271 (“June 2005 Form 10-Q”), and incorporated herein by reference). |
|
10.3 |
Amendment No. 2 to U.S. Supply Agreement effective as of October 15, 2006, between the Company and Ortho (filed as Exhibit No. 10.4 to Annual Report on Form 10-K for the year ended December 31, 2007, File No. 0-19271 (“2007 Form 10-K”), and incorporated herein by reference). |
|
10.4* |
Amendment No. 3 to U.S. Supply Agreement effective as of January 18, 2008, between the Company and Ortho (filed as Exhibit No. 10.5 to 2007 Form 10-K, and incorporated herein by reference). |
|
10.5* |
Amendment No. 4 to U.S. Supply Agreement effective as of December 28, 2011, between the Company and Ortho (filed as Exhibit No. 10.5 to Annual Report on Form 10-K for the year ended December 31, 2011, File No. 0-19271 (“2011 Form 10-K”), and incorporated herein by reference). |
|
10.6* |
Amendment No. 5 to U.S. Supply Agreement effective as of December 9, 2013, between the Company and Ortho (filed as Exhibit No. 10.6 to Annual Report on Form 10-K for the year ended December 31, 2013, File No. 0-19271 (“2013 Form 10-K”), and incorporated herein by reference). |
|
10.7* |
European Supply Agreement, effective as of October 17, 2003, between the Company and Ortho (filed as Exhibit No. 10.8 to 2003 Form 10-K, and incorporated herein by reference). |
|
10.8* |
Amendment No. 1 to European Supply Agreement effective as of January 1, 2005, between the Company and Ortho (filed as Exhibit No. 10.2 to June 2005 10-Q, and incorporated herein by reference). |
|
10.9* |
Amendment No. 2 to European Supply Agreement effective as of January 18, 2008, between the Company and Ortho (filed as Exhibit No. 10.8 to 2007 Form 10-K, and incorporated herein by reference). |
|
10.10* |
Amendment No. 3 to European Supply Agreement effective as of December 28, 2011, between the Company and Ortho (filed as Exhibit No. 10.9 to 2011 Form 10-K, and incorporated herein by reference). |
|
10.11* |
Amendment No. 4 to European Supply Agreement effective as of December 9, 2013, between the Company and Ortho (filed as Exhibit No. 10.11 to 2013 Form 10-K, and incorporated herein by reference). |
|
10.12 |
Amendment, Release and Settlement Agreement dated as of September 12, 2002, among the Company, IDEXX Europe B.V., and Ortho (filed as Exhibit No. 10.1 to Quarterly Report on Form 10-Q for the quarter ended September 30, 2002, File No. 0-19271, and incorporated herein by reference). |
|
10.13* |
Supply Agreement, effective as of May 7, 2007 between the Company and Moss, Inc. (filed as Exhibit No. 10.1 to Quarterly Report on Form 10-Q for the quarter ended June 30, 2010, File No. 0-19271 (“June 2010 Form 10-Q”), and incorporated herein by reference). |
|
10.14** |
Employment Agreement dated January 22, 2002, between the Company and Jonathan W. Ayers (filed as Exhibit No. 10.13 to Annual Report on Form 10-K for the year ended December 31, 2001, File No. 0-19271, and incorporated herein by reference). |
|
|
|
|
10.15** |
Amended and Restated Executive Employment Agreement dated May 26, 2013, between the Company and Jonathan W. Ayers (filed as Exhibit No. 10.2 to July 23, 2013 Form 10-Q for the quarter ended June 30, 2013, File No. 0-19271 (“June 2013 Form 10-Q”), and incorporated herein by reference). |
|
|
F-49
|
10.16** |
Form of Executive Employment Agreement dated May 26, 2013, between the Company and each of the Company’s Executive Officers, other than the Chief Executive Officer (filed as Exhibit No. 10.3 to June 2013 Form 10-Q, and incorporated herein by reference). |
|
10.17** |
Restated Director Deferred Compensation Plan, as amended (filed as Exhibit No. 10.1 to Quarterly Report on Form 10-Q for the quarter ended September 30, 2010, File No. 0-19271, and incorporated herein by reference). |
|
10.18* |
Restated Executive Deferred Compensation Plan, as amended (filed as Exhibit No. 10.3 to June 2010 Form 10-Q, and incorporated herein by reference). |
|
10.19** |
Form of Director Stock Option Agreement, as amended pursuant to the 2009 Stock Incentive Plan (filed as Exhibit No. 10.19 to the 2015 Form 10-K, and incorporated herein by reference). |
|
10.20** |
Form of Employee Stock Option Agreement, as amended pursuant to the 2009 Stock Incentive Plan (filed as Exhibit No. 10.20 to the 2015 Form 10-K, and incorporated herein by reference). |
|
10.21** |
IDEXX Laboratories 1997 Employee Stock Purchase Plan, as amended (filed as Exhibit No. 10.2 to the Quarterly Report on Form 10-Q for the quarterly period ended June 30, 2015 filed July 30, 2015 and incorporated herein by reference). |
|
10.22** |
Form of Restricted Stock Unit Agreement, as amended pursuant to the 2009 Stock Incentive Plan (filed as Exhibit No. 10.22 to the 2015 Form 10-Kherein by reference). |
|
|
|
|
10.23** |
2009 Stock Incentive Plan, as amended (filed as Exhibit No. 99.1 to Registration Statement on Form S-8 filed December 30, 2013, File No. 333-193136, and incorporated herein by reference). |
|
10.24** |
2014 Incentive Compensation Plan, (filed as Exhibit No. 10.2 to Quarterly Report on Form 10-Q for the quarter ended June 30, 2014, File No. 0-19271 (“June 2014 Form 10-Q”), and incorporated herein by reference). |
|
|
|
|
10.25** |
Form of Performance-Based Restricted Stock Unit Agreement pursuant to the 2009 Stock Incentive Plan (filed as Exhibit No. 10.25 to the 2015 Form 10-K, and incorporated herein by reference). |
|
10.26 |
Second Amended and Restated Credit Agreement, dated as of December 4, 2015, among the Company, IDEXX Distribution, Inc., IDEXX Operations, Inc., OPTI Medical Systems, Inc., IDEXX Laboratories Canada Corporation and IDEXX Europe B.V., as borrowers, the lenders party thereto, JPMorgan Chase Bank, N.A., as administrative agent, JPMorgan Chase Bank, N.A., Toronto Branch, as Toronto agent, and J.P. Morgan Europe Limited, as London agent (filed as Exhibit No. 10.1 to the Current Report on Form 8-K filed December 8, 2015 and incorporated herein by reference). |
|
21 |
Subsidiaries of the Company (filed herewith). |
|
23 |
Consent of PricewaterhouseCoopers LLP, an independent registered public accounting firm (filed herewith). |
|
31.1 |
Certification of Principal Executive Officer pursuant to Rules 13a-14(a) and 15d-14(a) under the Securities Exchange Act of 1934, as adopted pursuant to Section 302 of the Sarbanes-Oxley Act of 2002 (filed herewith). |
|
31.2 |
Certification of Principal Financial Officer pursuant to Rules 13a-14(a) and 15d-14(a) under the Securities Exchange Act of 1934, as adopted pursuant to Section 302 of the Sarbanes-Oxley Act of 2002 (filed herewith). |
|
32.1 |
Certification of Chief Executive Officer pursuant to 18 U.S.C. Section 1350, as adopted pursuant to Section 906 of the Sarbanes-Oxley Act of 2002 (filed herewith). |
|
32.2 |
Certification of Chief Financial Officer pursuant to 18 U.S.C. Section 1350, as adopted pursuant to Section 906 of the Sarbanes-Oxley Act of 2002 (filed herewith). |
|
101.INS |
XBRL Instance Document. |
F-50
|
101.SCH |
XBRL Taxonomy Extension Schema Document. |
|
101.CAL |
XBRL Taxonomy Extension Calculation Linkbase Document. |
|
101.DEF |
XBRL Taxonomy Extension Definition Linkbase Document. |
|
101.LAB |
XBRL Taxonomy Extension Label Linkbase Document. |
|
101.PRE |
XBRL Taxonomy Extension Presentation Linkbase Document. |
|
* |
Confidential treatment requested as to certain portions. |
|
** |
Management contract or compensatory arrangement required to be filed as an exhibit pursuant to Item 15(a)(3) of Form 10-K. |
F-51
SIGNATURES
Pursuant to the requirements of Section 13 or 15(d) of the Securities Exchange Act of 1934, the registrant has duly caused this report to be signed on its behalf by the undersigned, thereunto duly authorized.
|
|
|
|
|
IDEXX LABORATORIES, INC. |
|
|
|
|
|
|
|
|
By: /s/ Jonathan W. Ayers |
|
Date: February 17, 2017 |
Jonathan W. Ayers |
|
|
President and Chief Executive Officer |
|
|
|
|
|
|
Pursuant to the requirements of the Securities Exchange Act of 1934, this report has been signed below by the following persons on behalf of the Registrant and in the capacities and on the dates indicated:
|
|
SIGNATURE |
|
TITLE |
|
DATE |
|
||||||
|
|
|
|
|
|
|
|
||||||
|
|
|
|
|
|
|
|
||||||
|
|
/s/ Jonathan W. Ayers |
|
President, Chief Executive Officer and |
|
February 17, 2017 |
|
||||||
|
|
Jonathan W. Ayers |
|
Chairman of the Board of Directors (Principal Executive Officer) |
|
|
|
||||||
|
|
|
|
|
|
|
|
||||||
|
|
/s/ Brian P. McKeon |
|
Executive Vice President, Chief Financial |
|
February 17, 2017 |
|
||||||
|
|
Brian P. McKeon |
|
Officer and Treasurer (Principal Financial and Accounting Officer) |
|
|
|
||||||
|
|
|
|
|
|
|
|
||||||
|
|
|
|
|
|
|
|
||||||
|
|
/s/ Bruce L. Claflin |
|
Director |
|
February 17, 2017 |
|
||||||
|
|
Bruce L. Claflin |
|
|
|
|
|
||||||
|
|
|
|
|
|
|
|
||||||
|
|
/s/ Thomas Craig |
|
Director |
|
February 17, 2017 |
|
||||||
|
|
Thomas Craig |
|
|
|
|
|
||||||
|
|
|
|
|
|
|
|
||||||
|
|
/s/ William T. End |
|
Director |
|
February 17, 2017 |
|
||||||
|
|
William T. End |
|
|
|
|
|
||||||
|
|
|
|
|
|
|
|
||||||
|
|
/s/ Rebecca M. Henderson, PhD |
|
Director |
|
February 17, 2017 |
|
||||||
|
|
Rebecca M. Henderson, PhD |
|
|
|
|
|
||||||
|
|
|
|
|
|
|
|
||||||
|
|
/s/ Barry C. Johnson, PhD |
|
Director |
|
February 17, 2017 |
|
||||||
|
|
Barry C. Johnson, PhD |
|
|
|
|
|
||||||
|
|
|
|
|
|
|
|
||||||
|
|
|
|
|
|
|
|
||||||
|
|
|
|
|
|
|
|
||||||
F-52
|
|
|
|
|
|
|
|
||||||
|
|
/s/ Daniel M. Junius |
Director |
February 17, 2017 |
|||||||||
|
|
Daniel M. Junius |
|
|
|
|
|
||||||
|
|
|
|
|
|
|
|
||||||
|
|
/s/ Lawrence D. Kingsley |
|
Director |
|
February 17, 2017 |
|
||||||
|
|
Lawrence D. Kingsley |
|
|
|
|
|
||||||
|
|
|
|
|
|
|
|
||||||
|
|
/s/ M. Anne Szostak |
|
Director |
|
February 17, 2017 |
|
||||||
|
|
M. Anne Szostak |
|
|
|
|
|
||||||
|
|
|
|
|
|
|
|
||||||
|
|
/s/ Sophie V. Vandebroek, PhD |
|
Director |
|
February 17, 2017 |
|
||||||
|
|
Sophie V. Vandebroek, PhD |
|
|
|
|
|
||||||
|
|
|
|
|
|
|
|
||||||
|
|
|
|
|
|
|
|
||||||
|
|
|
|
|
|
|
|
||||||
|
|
|
|
|
|
|
|
||||||
|
|
|
|
|
|
|
|
||||||
F-53