Attached files
|
Selected Financial and Operating Data
|
||||||||||||||||||||
|
Dollars in millions except per share amounts
|
||||||||||||||||||||
|
At December 31 and for the year ended:
|
2016
|
2015
|
2014
|
2013
|
2012
|
|||||||||||||||
|
Financial Data
|
||||||||||||||||||||
|
Operating revenues
|
$
|
163,786
|
$
|
146,801
|
$
|
132,447
|
$
|
128,752
|
$
|
127,434
|
||||||||||
|
Operating expenses
|
$
|
139,439
|
$
|
122,016
|
$
|
120,235
|
$
|
98,000
|
$
|
114,380
|
||||||||||
|
Operating income
|
$
|
24,347
|
$
|
24,785
|
$
|
12,212
|
$
|
30,752
|
$
|
13,054
|
||||||||||
|
Interest expense
|
$
|
4,910
|
$
|
4,120
|
$
|
3,613
|
$
|
3,940
|
$
|
3,444
|
||||||||||
|
Equity in net income of affiliates
|
$
|
98
|
$
|
79
|
$
|
175
|
$
|
642
|
$
|
752
|
||||||||||
|
Other income (expense) - net
|
$
|
277
|
$
|
(52
|
)
|
$
|
1,581
|
$
|
596
|
$
|
134
|
|||||||||
|
Income tax expense
|
$
|
6,479
|
$
|
7,005
|
$
|
3,619
|
$
|
9,328
|
$
|
2,922
|
||||||||||
|
Net Income
|
$
|
13,333
|
$
|
13,687
|
$
|
6,736
|
$
|
18,722
|
$
|
7,574
|
||||||||||
|
Less: Net Income Attributable to Noncontrolling Interest
|
$
|
(357
|
)
|
$
|
(342
|
)
|
$
|
(294
|
)
|
$
|
(304
|
)
|
$
|
(275
|
)
|
|||||
|
Net Income Attributable to AT&T
|
$
|
12,976
|
$
|
13,345
|
$
|
6,442
|
$
|
18,418
|
$
|
7,299
|
||||||||||
|
Earnings Per Common Share:
|
||||||||||||||||||||
|
Net Income Attributable to AT&T
|
$
|
2.10
|
$
|
2.37
|
$
|
1.24
|
$
|
3.42
|
$
|
1.26
|
||||||||||
|
Earnings Per Common Share - Assuming Dilution:
|
||||||||||||||||||||
|
Net Income Attributable to AT&T
|
$
|
2.10
|
$
|
2.37
|
$
|
1.24
|
$
|
3.42
|
$
|
1.26
|
||||||||||
|
Cash and cash equivalents
|
$
|
5,788
|
$
|
5,121
|
$
|
8,603
|
$
|
3,339
|
$
|
4,868
|
||||||||||
|
Total assets
|
$
|
403,821
|
$
|
402,672
|
$
|
296,834
|
$
|
281,423
|
$
|
275,834
|
||||||||||
|
Long-term debt
|
$
|
113,681
|
$
|
118,515
|
$
|
75,778
|
$
|
69,091
|
$
|
66,152
|
||||||||||
|
Total debt
|
$
|
123,513
|
$
|
126,151
|
$
|
81,834
|
$
|
74,589
|
$
|
69,638
|
||||||||||
|
Capital expenditures
|
$
|
22,408
|
$
|
20,015
|
$
|
21,433
|
$
|
21,228
|
$
|
19,728
|
||||||||||
|
Dividends declared per common share
|
$
|
1.93
|
$
|
1.89
|
$
|
1.85
|
$
|
1.81
|
$
|
1.77
|
||||||||||
|
Book value per common share
|
$
|
20.22
|
$
|
20.12
|
$
|
17.40
|
$
|
18.10
|
$
|
17.14
|
||||||||||
|
Ratio of earnings to fixed charges
|
3.59
|
4.01
|
2.91
|
6.03
|
2.97
|
|||||||||||||||
|
Debt ratio
|
49.9
|
%
|
50.5
|
%
|
47.5
|
%
|
44.1
|
%
|
42.1
|
%
|
||||||||||
|
Weighted-average common shares outstanding (000,000)
|
6,168
|
5,628
|
5,205
|
5,368
|
5,801
|
|||||||||||||||
|
Weighted-average common shares outstanding with dilution (000,000)
|
6,189
|
5,646
|
5,221
|
5,385
|
5,821
|
|||||||||||||||
|
End of period common shares outstanding (000,000)
|
6,139
|
6,145
|
5,187
|
5,226
|
5,581
|
|||||||||||||||
|
Operating Data
|
||||||||||||||||||||
|
Total wireless customers (000)
|
146,832
|
137,324
|
120,554
|
110,376
|
106,957
|
|||||||||||||||
|
Video connections (000)
|
37,748
|
37,934
|
5,943
|
5,460
|
4,536
|
|||||||||||||||
|
In-region network access lines in service (000)
|
13,986
|
16,670
|
19,896
|
24,639
|
29,279
|
|||||||||||||||
|
Broadband connections (000)
|
15,605
|
15,778
|
16,028
|
16,425
|
16,390
|
|||||||||||||||
|
Number of employees
|
268,540
|
281,450
|
243,620
|
243,360
|
241,810
|
|||||||||||||||
1
Management’s Discussion and Analysis of Financial Condition and Results of Operations
Dollars in millions except per share and per subscriber amounts
RESULTS OF OPERATIONS
For ease of reading, AT&T Inc. is referred to as “we,” “AT&T” or the “Company” throughout this document, and the names of the particular subsidiaries and affiliates providing the services generally have been omitted. AT&T is a holding company whose subsidiaries and affiliates operate in the communications and entertainment services industry. Our subsidiaries and affiliates provide services and equipment that deliver voice, video and broadband services both domestically and internationally. During 2015, we completed our acquisitions of DIRECTV and wireless properties in Mexico. The following discussion of changes in our operating revenues and expenses is affected by the timing of these acquisitions. In accordance with U.S. generally accepted accounting principles (GAAP), our 2015 results include 160 days of DIRECTV-related operations compared with a full year in 2016. You should read this discussion in conjunction with the consolidated financial statements and accompanying notes. A reference to a “Note” in this section refers to the accompanying Notes to Consolidated Financial Statements. In the tables throughout this section, percentage increases and decreases that are not considered meaningful are denoted with a dash. Certain amounts have been reclassified to conform to the current period’s presentation.
Consolidated Results Our financial results are summarized in the table below. We then discuss factors affecting our overall results for the past three years. These factors are discussed in more detail in our “Segment Results” section. We also discuss our expected revenue and expense trends for 2017 in the “Operating Environment and Trends of the Business” section.
|
Percent Change
|
||||||||||||||||||||
|
2016
|
2015
|
2014
|
2016 vs.
2015
|
2015 vs.
2014
|
||||||||||||||||
|
Operating Revenues
|
||||||||||||||||||||
|
Service
|
$
|
148,884
|
$
|
131,677
|
$
|
118,437
|
13.1
|
%
|
11.2
|
%
|
||||||||||
|
Equipment
|
14,902
|
15,124
|
14,010
|
(1.5
|
)
|
8.0
|
||||||||||||||
|
Total Operating Revenues
|
163,786
|
146,801
|
132,447
|
11.6
|
10.8
|
|||||||||||||||
|
Operating expenses
|
||||||||||||||||||||
|
Cost of services and sales
|
||||||||||||||||||||
|
Equipment
|
18,757
|
19,268
|
18,946
|
(2.7
|
)
|
1.7
|
||||||||||||||
|
Broadcast, programming and operations
|
19,851
|
11,996
|
4,075
|
65.5
|
-
|
|||||||||||||||
|
Other cost of services
|
38,276
|
35,782
|
37,124
|
7.0
|
(3.6
|
)
|
||||||||||||||
|
Selling, general and administrative
|
36,347
|
32,919
|
39,697
|
10.4
|
(17.1
|
)
|
||||||||||||||
|
Asset abandonments and impairments
|
361
|
35
|
2,120
|
-
|
(98.3
|
)
|
||||||||||||||
|
Depreciation and amortization
|
25,847
|
22,016
|
18,273
|
17.4
|
20.5
|
|||||||||||||||
|
Total Operating Expenses
|
139,439
|
122,016
|
120,235
|
14.3
|
1.5
|
|||||||||||||||
|
Operating Income
|
24,347
|
24,785
|
12,212
|
(1.8
|
)
|
-
|
||||||||||||||
|
Interest expense
|
4,910
|
4,120
|
3,613
|
19.2
|
14.0
|
|||||||||||||||
|
Equity in net income of affiliates
|
98
|
79
|
175
|
24.1
|
(54.9
|
)
|
||||||||||||||
|
Other income (expense) – net
|
277
|
(52
|
)
|
1,581
|
-
|
-
|
||||||||||||||
|
Income Before Income Taxes
|
19,812
|
20,692
|
10,355
|
(4.3
|
)
|
99.8
|
||||||||||||||
|
Net Income
|
13,333
|
13,687
|
6,736
|
(2.6
|
)
|
-
|
||||||||||||||
|
Net Income Attributable to AT&T
|
$
|
12,976
|
$
|
13,345
|
$
|
6,442
|
(2.8
|
)%
|
-
|
%
|
||||||||||
OVERVIEW
Operating revenues increased $16,985, or 11.6%, in 2016 and $14,354, or 10.8%, in 2015.
Service revenues increased $17,207, or 13.1%, in 2016 and $13,240, or 11.2%, in 2015. The increase in 2016 was primarily due to our 2015 acquisition of DIRECTV and increases in IP broadband and fixed strategic service revenues. These were partially offset by continued declines in our legacy wireline voice and data products and lower wireless revenues from offerings that entitle customers to lower monthly service rates. The increase in 2015 was primarily due to our acquisition of DIRECTV, our new wireless operations in Mexico, and gains in fixed strategic services and our IP-based AT&T U-verse® (U-verse) services.
2
Management’s Discussion and Analysis of Financial Condition and Results of Operations (continued)
Dollars in millions except per share and per subscriber amounts
Equipment revenues decreased $222, or 1.5%, in 2016 and increased $1,114, or 8.0%, in 2015. The decline in 2016 reflects fewer domestic wireless handset sales and additional promotional offers, partially offset by the sale of higher-priced devices. The increase in 2015 was also due to postpaid wireless subscribers choosing to purchase devices on installment payment agreements rather than the device subsidy models.
Operating expenses increased $17,423, or 14.3%, in 2016 and $1,781, or 1.5%, in 2015.
Equipment expenses decreased $511, or 2.7%, in 2016 and increased $322, or 1.7%, in 2015. Expense decreases in 2016 were primarily driven by lower domestic wireless handset sales, partially offset by increased sales volumes to our Mexico wireless customers. The increase in 2015 was primarily due to customers choosing higher-priced wireless devices.
Broadcast, programming and operations expenses increased $7,855, or 65.5%, in 2016 and $7,921 in 2015. Cost increases in both years were due to our acquisition of DIRECTV. Higher content costs in both years were slightly offset by fewer U-verse TV subscribers.
Other cost of services expenses increased $2,494, or 7.0%, in 2016 and decreased $1,342, or 3.6%, in 2015. The expense increase in 2016 was primarily due to our acquisition of DIRECTV and an increase in noncash financing-related costs associated with our pension and postretirement benefits. The expense increase also reflects a $1,185 change in our annual pension postemployment benefit actuarial adjustment, which consisted of a loss in 2016 and a gain in 2015. These increases were partially offset by prior year network rationalization charges, lower net expenses associated with our deferral and amortization of customer fulfillment costs and a decline in network and access charges.
The expense decrease in 2015 was primarily due to a $3,078 reduction resulting from the annual remeasurement of our benefit plans, which was a gain in 2015 and a loss in 2014. Also contributing to the 2015 decrease were higher Connect America and High Cost Funds’ receipts from the Universal Service Fund and the fourth-quarter 2014 sale of our Connecticut wireline operations, offset by the addition of DIRECTV, increased network rationalization charges related to Leap Wireless International, Inc. (Leap), merger and integration charges and wireless handset insurance costs.
Selling, general and administrative expenses increased $3,428, or 10.4%, in 2016 and decreased $6,778, or 17.1%, in 2015. The increase in 2016 was primarily due to our acquisitions in 2015 and increased advertising activity. Expenses also include an increase of $1,991 as a result of recording an actuarial loss in 2016 and an actuarial gain in 2015. These increases were offset by noncash gains of $714 on wireless spectrum transactions, lower wireless commissions expenses and fewer employee separation costs.
In 2015, expenses decreased $6,943 as a result of recording an actuarial gain in 2015 and an actuarial loss in 2014. The 2015 decrease was also due to lower employee-related charges resulting from workforce reductions, declines in wireless commissions and the fourth-quarter 2014 sale of our Connecticut wireline operations, offset by costs resulting from the acquisition of DIRECTV.
Asset abandonments and impairments During the fourth quarter of 2016, we recorded a noncash charge of $361 for the impairment of wireless and other assets. These assets primarily arose from capitalized costs for wireless sites that are no longer in our construction plans. In 2015, we recorded a noncash charge of $35 for the abandonment of certain wireless sites. In 2014, we recorded a noncash charge of $2,120 for the abandonment in place of certain network assets; we completed a study of our network assets and determined that specific copper assets would not be necessary to support future network activity, due to declining customer demand for our legacy voice and data products and the transition of our networks to next generation IP-based technology. (See Note 6)
Depreciation and amortization expense increased $3,831, or 17.4%, in 2016 and $3,743, or 20.5%, in 2015. The amortization expense increased $2,495, or 92.0%, in 2016 and $2,198 in 2015. The increases were due to the amortization of intangibles from recent acquisitions.
3
Management’s Discussion and Analysis of Financial Condition and Results of Operations (continued)
Dollars in millions except per share and per subscriber amounts
Depreciation expense increased $1,336, or 6.9%, in 2016. The increase was primarily due to the acquisitions of DIRECTV and ongoing capital investment for network upgrades. The increases were partially offset by a $462 decrease associated with our change in the estimated useful lives and salvage values of certain assets associated with our transition to an IP-based network (see Note 1). The 2015 depreciation expense increased $1,545, or 8.7%, primarily due to the acquisitions of DIRECTV and our wireless properties in Mexico, as well as ongoing capital spending for network upgrades. The increases were partially offset by the abandonment of certain wireline network assets, which occurred in 2014, and network assets becoming fully depreciated.
Operating income decreased $438, or 1.8%, in 2016 and increased $12,573 in 2015. Our operating margin was 14.9% in 2016, compared to 16.9% in 2015 and 9.2% in 2014. Contributing $3,176 to the decrease in operating income in 2016 was a noncash actuarial loss of $1,024 and an actuarial gain of $2,152 in 2015. This decrease was partially offset by continued efforts to reduce operating costs and achieve merger synergies. Contributing $10,021 to the increase in operating income in 2015 was a noncash actuarial gain of $2,152 compared to an actuarial loss of $7,869 in 2014, partially offset by higher acquisition-related charges and expenses relating to growth areas of our business.
Interest expense increased $790, or 19.2%, in 2016 and $507, or 14.0%, in 2015. The increases were primarily due to higher average debt balances, including debt issued and debt acquired in connection with our acquisition of DIRECTV. The increase in 2016 was also driven by higher average interest rates, and in 2015 was partially offset by lower average interest rates and an increase in capitalized interest resulting from spectrum acquired in the Advanced Wireless Service (AWS)-3 Auction (see Note 5).
Equity in net income of affiliates increased $19, or 24.1%, in 2016 and decreased $96, or 54.9%, in 2015. Our results in 2016 and 2015 included income from our investments in Game Show Network and SKY Mexico, partially offset by losses from Otter Media Holdings. In 2014, results included earnings from América Móvil S.A. de C.V. (América Móvil) partially offset by our mobile wallet joint venture. (See Note 8)
Other income (expense) – net We had other income of $277 in 2016, other expense of $52 in 2015 and other income of $1,581 in 2014. Results for 2016 included net gains on the sale of non-strategic assets and investments of $184 and interest and dividend income of $118.
Other expense for 2015 included foreign exchange losses of $74, net losses on the sale of non-strategic assets and investments of $87 and interest and dividend income of $95. Results for 2014 included a combined net gain of $1,470 on the sale of América Móvil shares, our Connecticut wireline operations and other non-strategic assets and investments, and interest and dividend income of $68.
Income tax expense decreased $526, or 7.5%, in 2016 and increased $3,386 in 2015. The decrease in income tax expense in 2016 and increase in income tax expense in 2015 were primarily due to a change in income before income taxes. The decrease in 2016 also reflects a benefit resulting from our Mexico restructuring. Our effective tax rate was 32.7% in 2016, 33.9% in 2015 and 34.9% in 2014 (see Note 11).
Segment Results
Our segments are strategic business units that offer different products and services over various technology platforms and/or in different geographies that are managed accordingly. Our segment results presented in Note 4 and discussed below for each segment follow our internal management reporting. We analyze our segments based on Segment Contribution, which consists of operating income, excluding acquisition-related costs and other significant items, and equity in net income (loss) of affiliates for investments managed within each segment. Each segment’s percentage calculation of total segment operating revenue and income is derived from our segment results table in Note 4, and may total more than 100 percent due to losses in one or more segments. We have four reportable segments: (1) Business Solutions, (2) Entertainment Group, (3) Consumer Mobility and (4) International.
We also evaluate segment performance based on EBITDA and/or EBITDA margin, which is defined as Segment Contribution, excluding equity in net income (loss) of affiliates and depreciation and amortization. We believe EBITDA to be a relevant and useful measurement to our investors as it is part of our internal management reporting and planning processes and it is an important metric that management uses to evaluate operating performance. EBITDA does not give effect to cash used for debt service requirements and thus does not reflect available funds for distributions, reinvestment or other discretionary uses. EBITDA margin is EBITDA divided by total revenues.
4
Management’s Discussion and Analysis of Financial Condition and Results of Operations (continued)
Dollars in millions except per share and per subscriber amounts
The Business Solutions segment accounted for approximately 44% of our 2016 total segment operating revenues as compared to 49% in 2015 and 52% of our 2016 total Segment Contribution as compared to 59% in 2015. This segment provides services to business customers, including multinational companies; governmental and wholesale customers; and individual subscribers who purchase wireless services through employer-sponsored plans. We provide advanced IP-based services including Virtual Private Networks (VPN); Ethernet-related products and broadband, collectively referred to as fixed strategic services; as well as traditional data and voice products. We utilize our wireless and wired networks (referred to as “wired” or “wireline”) to provide a complete integrated communications solution to our business customers.
The Entertainment Group segment accounted for approximately 32% of our 2016 total segment operating revenues as compared to 24% in 2015 and 19% of our 2016 total Segment Contribution as compared to 7% in 2015. This segment provides video, internet, voice communication, and interactive and targeted advertising services to customers located in the United States or in U.S. territories. We utilize our copper and IP-based wired network and/or our satellite technology.
The Consumer Mobility segment accounted for approximately 20% of our 2016 total segment operating revenues as compared to 24% in 2015 and 31% of our 2016 total Segment Contribution as compared to 35% in 2015. This segment provides nationwide wireless service to consumers and wholesale and resale wireless subscribers located in the United States or in U.S. territories. We utilize our networks to provide voice and data services, including high-speed internet, video and home monitoring services over wireless devices.
The International segment accounted for approximately 4% of our 2016 total segment operating revenues as compared to 3% in 2015. This segment provides entertainment services in Latin America and wireless services in Mexico. Video entertainment services are provided to primarily residential customers using satellite technology. We utilize our regional and national wireless networks in Mexico to provide consumer and business customers with wireless data and voice communication services. Our international subsidiaries conduct business in their local currency, and operating results are converted to U.S. dollars using official exchange rates. Our International segment is subject to foreign currency fluctuations.
Our operating assets are utilized by multiple segments and consist of our wireless and wired networks as well as an international satellite fleet. We manage our assets to provide for the most efficient, effective and integrated service to our customers, not by segment, and therefore asset information and capital expenditures by segment are not presented. Depreciation is allocated based on network usage or asset utilization by segment.
|
Business Solutions
|
||||||||||||||||||||
|
Segment Results
|
||||||||||||||||||||
|
Percent Change
|
||||||||||||||||||||
|
2016
|
2015
|
2014
|
2016 vs.
2015
|
2015 vs.
2014
|
||||||||||||||||
|
Segment operating revenues
|
||||||||||||||||||||
|
Wireless service
|
$
|
31,850
|
$
|
30,687
|
$
|
30,182
|
3.8
|
%
|
1.7
|
%
|
||||||||||
|
Fixed strategic services
|
11,389
|
10,461
|
9,298
|
8.9
|
12.5
|
|||||||||||||||
|
Legacy voice and data services
|
16,364
|
18,468
|
20,225
|
(11.4
|
)
|
(8.7
|
)
|
|||||||||||||
|
Other service and equipment
|
3,615
|
3,558
|
3,860
|
1.6
|
(7.8
|
)
|
||||||||||||||
|
Wireless equipment
|
7,770
|
7,953
|
7,041
|
(2.3
|
)
|
13.0
|
||||||||||||||
|
Total Segment Operating Revenues
|
70,988
|
71,127
|
70,606
|
(0.2
|
)
|
0.7
|
||||||||||||||
|
Segment operating expenses
|
||||||||||||||||||||
|
Operations and support
|
44,330
|
44,946
|
45,826
|
(1.4
|
)
|
(1.9
|
)
|
|||||||||||||
|
Depreciation and amortization
|
9,832
|
9,789
|
9,355
|
0.4
|
4.6
|
|||||||||||||||
|
Total Segment Operating Expenses
|
54,162
|
54,735
|
55,181
|
(1.0
|
)
|
(0.8
|
)
|
|||||||||||||
|
Segment Operating Income
|
16,826
|
16,392
|
15,425
|
2.6
|
6.3
|
|||||||||||||||
|
Equity in Net Income of Affiliates
|
-
|
-
|
-
|
-
|
-
|
|||||||||||||||
|
Segment Contribution
|
$
|
16,826
|
$
|
16,392
|
$
|
15,425
|
2.6
|
%
|
6.3
|
%
|
||||||||||
5
Management’s Discussion and Analysis of Financial Condition and Results of Operations (continued)
Dollars in millions except per share and per subscriber amounts
|
The following tables highlight other key measures of performance for the Business Solutions segment:
|
||||||||||||||||||||
|
Percent Change
|
||||||||||||||||||||
|
2016
|
2015
|
2014
|
2016 vs.
2015
|
2015 vs.
2014
|
||||||||||||||||
|
At December 31 (in 000s)
|
||||||||||||||||||||
|
Business Wireless Subscribers
|
||||||||||||||||||||
|
Postpaid
|
50,688
|
48,290
|
45,160
|
5.0
|
%
|
6.9
|
%
|
|||||||||||||
|
Reseller
|
65
|
85
|
11
|
(23.5
|
)
|
-
|
||||||||||||||
|
Connected devices1
|
30,649
|
25,284
|
19,943
|
21.2
|
26.8
|
|||||||||||||||
|
Total Business Wireless Subscribers
|
81,402
|
73,659
|
65,114
|
10.5
|
13.1
|
|||||||||||||||
|
Business IP Broadband Connections
|
977
|
911
|
822
|
7.2
|
%
|
10.8
|
%
|
|||||||||||||
|
Percent Change
|
||||||||||||||||||||
|
2016
|
2015
|
2014
|
2016 vs.
2015
|
2015 vs.
2014
|
||||||||||||||||
|
(in 000s)
|
||||||||||||||||||||
|
Business Wireless Net Additions2,4
|
||||||||||||||||||||
|
Postpaid
|
759
|
1,203
|
2,064
|
(36.9
|
)%
|
(41.7
|
)%
|
|||||||||||||
|
Reseller
|
(33
|
)
|
13
|
6
|
-
|
-
|
||||||||||||||
|
Connected devices1
|
5,330
|
5,315
|
3,439
|
0.3
|
54.6
|
|||||||||||||||
|
Business Wireless Net Subscriber Additions
|
6,056
|
6,531
|
5,509
|
(7.3
|
)
|
18.6
|
||||||||||||||
|
Business Wireless Postpaid Churn2,3,4
|
1.00%
|
|
0.99%
|
|
0.90%
|
|
1 BP
|
9 BP
|
||||||||||||
|
Business IP Broadband Net Additions
|
66
|
89
|
191
|
(25.8
|
)%
|
(53.4
|
)%
|
|||||||||||||
|
1 Includesdata-centric devices such as session-based tablets, monitoring devices and automobile systems. Excludes postpaid tablets.
|
||||||||||||||||||||
|
2 Excludes migrations between AT&T segments and/or subscriber categories and acquisition-related additions during the period.
|
||||||||||||||||||||
|
3 Calculated by dividing the aggregate number of wireless subscribers who canceled service during a month divided by the total number of wireless subscribers at the beginning of that month. The churn rate for the year is
|
||||||||||||||||||||
| equal to the average of the churn rate for each month of that period. | ||||||||||||||||||||
|
4 Includes impacts of the year-end 2016 shutdown of our 2G network.
|
||||||||||||||||||||
Operating revenues decreased $139, or 0.2%, in 2016 and increased $521, or 0.7%, in 2015. Revenue declines in 2016 were driven by continued declines in demand for our legacy voice and data services and lower wireless equipment revenues, partially offset by continued growth in fixed strategic and wireless services. The increase in 2015 was driven by wireless revenues and continued growth in fixed strategic services, partially offset by continued declines in demand for our legacy voice and data services and foreign exchange pressures.
Wireless service revenues increased $1,163, or 3.8%, in 2016 and $505, or 1.7%, in 2015. The revenue increases reflect smartphone and tablet gains, handset insurance sales, as well as customer migrations from our Consumer Mobility segment.
Business wireless subscribers increased 10.5%, to 81.4 million subscribers at December 31, 2016 compared to 13.1%, to 73.7 million subscribers at December 31, 2015. Postpaid subscribers increased 5.0% in 2016 compared to 6.9% in 2015 reflecting the addition of new customers as well as migrations from our Consumer Mobility segment, partially offset by continuing competitive pressures in the industry. Connected devices, which have lower average revenue per average subscriber (ARPU) and lower churn, increased 21.2% in 2016 compared to 26.8% in 2015 primarily reflecting growth in our connected car business.
The effective management of subscriber churn is critical to our ability to maximize revenue growth and to maintain and improve margins. Business wireless postpaid churn increased to 1.00% in 2016 from 0.99% in 2015 and 0.90% in 2014.
6
Management’s Discussion and Analysis of Financial Condition and Results of Operations (continued)
Dollars in millions except per share and per subscriber amounts
Fixed strategic services revenues increased $928, or 8.9%, in 2016 and $1,163, or 12.5%, in 2015. Our revenues increased in 2016 and 2015 due to Ethernet increases of $224 and $389, U-verse services increases of $172 and $247, Dedicated Internet services increases of $230 and $190 and VPN increases of $89 and $116, respectively.
Due to advances in technology, our most advanced business solutions are subject to change periodically. We review and evaluate our fixed strategic service offerings annually, which may result in an updated definition and the recast of our historical financial information to conform to the current period presentation. Any modifications will be reflected in the first quarter.
Legacy voice and data service revenues decreased $2,104, or 11.4%, in 2016 and $1,757, or 8.7%, in 2015. Traditional data revenues in 2016 and 2015 decreased $1,255 and $958 and long-distance and local voice revenues decreased $823 and $797. The decreases were primarily due to lower demand as customers continue to shift to our more advanced IP-based offerings or our competitors.
Other service and equipment revenues increased $57, or 1.6%, in 2016 and decreased $302, or 7.8%, in 2015. Other service revenues include project-based revenue, which is nonrecurring in nature, as well as revenues from other managed services, outsourcing, government professional service and customer premises equipment. The increase in 2016 was primarily due to nonrecurring customer premises equipment contracts. The decline in 2015 is primarily due to lower project-based and equipment revenues, as well as impacts from foreign exchange rates.
Wireless equipment revenues decreased $183, or 2.3%, in 2016 and increased $912, or 13.0%, in 2015. The decrease in 2016 was primarily due to a decrease in handsets sold and increased promotional offers, partially offset by an increase in sales under our equipment installment agreements, including our AT&T NextSM (AT&T Next) program. The increase in 2015 was primarily due to the increase in purchases of devices on installment agreements rather than the device subsidy model and increased sales of higher-priced smartphones. We expect wireless equipment revenues to be pressured in 2017 as customers are retaining their handsets for longer periods of time and more new subscribers are bringing their own devices.
Operations and support expenses decreased $616, or 1.4%, in 2016 and $880, or 1.9%, in 2015. Operations and support expenses consist of costs incurred to provide our products and services, including costs of operating and maintaining our networks and personnel costs, such as compensation and benefits.
Expense decreases in 2016 were primarily due to:
|
·
|
Lower network costs of $283 resulting from workforce reductions and other cost initiative actions.
|
|
·
|
Declines in wireless commission expenses of $225 due to lower sales volumes and lower average commission rates, including those paid under the AT&T Next program, combined with fewer handset upgrade transactions.
|
|
·
|
Lower net expenses of $219 associated with fulfillment cost deferrals (see Note 1).
|
|
·
|
Reductions of $186 in equipment costs, driven by lower wireless handset volumes partially offset by the sale of higher-priced wireless devices and higher-priced customer premises equipment.
|
Partially offsetting the decreases in 2016 were higher wireless handset insurance cost of $195 and the impact of Connect America and High Cost Funds’ receipts.
Expense decreases in 2015 were primarily due to:
|
·
|
Lower commission costs of $995 resulting from lower average commission rates and fewer upgrade transactions.
|
|
·
|
Declines in employee-related charges of $508 resulting from workforce reductions and other cost initiatives.
|
|
·
|
Reductions of $269 in access costs due to lower interconnect, roaming and traffic compensation costs.
|
|
·
|
Lower customer service costs of $146 largely resulting from our simplified offerings and increased efforts to resolve customer inquiries on their first call.
|
Partially offsetting the decreases in 2015 were:
|
·
|
Higher wireless handset insurance cost of $370.
|
|
·
|
Increased equipment expense of $304 due to the continuing trend of customers choosing higher-cost devices.
|
|
·
|
Higher bad debt expense of $173 resulting from growth in our AT&T Next subscriber base.
|
7
Management’s Discussion and Analysis of Financial Condition and Results of Operations (continued)
Dollars in millions except per share and per subscriber amounts
Depreciation expense increased $43, or 0.4%, in 2016 and $434, or 4.6%, in 2015. The increases were primarily due to ongoing capital spending for network upgrades and expansion and accelerating depreciation related to the shutdown of our U.S. 2G network, partially offset by fully depreciated assets. The increase in 2016 was largely offset by the change in estimated useful lives and salvage values of certain assets associated with our transition to an IP-based network (see Note 1).
Operating income increased $434, or 2.6%, in 2016 and $967, or 6.3%, in 2015. Our Business Solutions segment operating income margin was 23.7% in 2016, compared to 23.0% in 2015 and 21.8% in 2014. Our Business Solutions EBITDA margin was 37.6% in 2016, compared to 36.8% in 2015 and 35.1% in 2014.
|
Entertainment Group
|
||||||||||||||||||||
|
Segment Results
|
||||||||||||||||||||
|
Percent Change
|
||||||||||||||||||||
|
2016
|
2015
|
2014
|
2016 vs.
2015
|
2015 vs.
2014
|
||||||||||||||||
|
Segment operating revenues
|
||||||||||||||||||||
|
Video entertainment
|
$
|
36,460
|
$
|
20,271
|
$
|
6,826
|
79.9
|
%
|
-
|
%
|
||||||||||
|
High-speed internet
|
7,472
|
6,601
|
5,522
|
13.2
|
19.5
|
|||||||||||||||
|
Legacy voice and data services
|
4,829
|
5,914
|
7,592
|
(18.3
|
)
|
(22.1
|
)
|
|||||||||||||
|
Other service and equipment
|
2,534
|
2,508
|
2,293
|
1.0
|
9.4
|
|||||||||||||||
|
Total Segment Operating Revenues
|
51,295
|
35,294
|
22,233
|
45.3
|
58.7
|
|||||||||||||||
|
Segment operating expenses
|
||||||||||||||||||||
|
Operations and support
|
39,338
|
28,345
|
18,992
|
38.8
|
49.2
|
|||||||||||||||
|
Depreciation and amortization
|
5,862
|
4,945
|
4,473
|
18.5
|
10.6
|
|||||||||||||||
|
Total Segment Operating Expenses
|
45,200
|
33,290
|
23,465
|
35.8
|
41.9
|
|||||||||||||||
|
Segment Operating Income (Loss)
|
6,095
|
2,004
|
(1,232
|
)
|
-
|
-
|
||||||||||||||
|
Equity in Net Income (Loss) of Affiliates
|
9
|
(4
|
)
|
(2
|
)
|
-
|
-
|
|||||||||||||
|
Segment Contribution
|
$
|
6,104
|
$
|
2,000
|
$
|
(1,234
|
)
|
-
|
%
|
-
|
%
|
|||||||||
The following tables highlight other key measures of performance for the Entertainment Group segment:
|
Percent Change
|
|||||||||||||||||||||
|
At December 31 (in 000s)
|
2016
|
2015
|
2014
|
2016 vs.
2015
|
2015 vs.
2014
|
||||||||||||||||
|
Linear Video Connections1
|
|||||||||||||||||||||
|
Satellite
|
21,012
|
19,784
|
-
|
6.2
|
%
|
-
|
%
|
||||||||||||||
|
U-verse
|
4,253
|
5,614
|
5,920
|
(24.2
|
)
|
(5.2
|
)
|
||||||||||||||
|
Total Linear Video Connections
|
25,265
|
25,398
|
5,920
|
(0.5
|
)
|
-
|
|||||||||||||||
|
Broadband Connections
|
|||||||||||||||||||||
|
IP
|
12,888
|
12,356
|
11,383
|
4.3
|
8.5
|
||||||||||||||||
|
DSL
|
1,291
|
1,930
|
3,061
|
(33.1
|
)
|
(36.9
|
)
|
||||||||||||||
|
Total Broadband Connections
|
14,179
|
14,286
|
14,444
|
(0.7
|
)
|
(1.1
|
)
|
||||||||||||||
|
Retail Consumer Switched Access Lines
|
5,853
|
7,286
|
9,243
|
(19.7
|
)
|
(21.2
|
)
|
||||||||||||||
|
U-verse Consumer VoIP Connections
|
5,425
|
5,212
|
4,759
|
4.1
|
9.5
|
||||||||||||||||
|
Total Retail Consumer Voice Connections
|
11,278
|
12,498
|
14,002
|
(9.8
|
)%
|
(10.7
|
)%
|
||||||||||||||
|
1 Includes the impact of customers that migrated to DIRECTV NOW. At December 31, 2016, we had more than 200 DIRECTV NOW subscribers.
|
|||||||||||||||||||||
8
Management’s Discussion and Analysis of Financial Condition and Results of Operations (continued)
Dollars in millions except per share and per subscriber amounts
|
Percent Change
|
||||||||||||||||||||
|
(in 000s)
|
2016
|
2015
|
2014
|
2016 vs.
2015
|
2015 vs.
2014
|
|||||||||||||||
|
Linear Video Net Additions 1,2
|
||||||||||||||||||||
|
Satellite
|
1,228
|
240
|
-
|
-
|
%
|
-
|
%
|
|||||||||||||
|
U-verse
|
(1,361
|
)
|
(306
|
)
|
663
|
-
|
-
|
|||||||||||||
|
Linear Net Video Additions
|
(133
|
)
|
(66
|
)
|
663
|
-
|
-
|
|||||||||||||
|
Broadband Net Additions
|
||||||||||||||||||||
|
IP
|
532
|
973
|
1,899
|
(45.3
|
)
|
(48.8
|
)
|
|||||||||||||
|
DSL
|
(639
|
)
|
(1,130
|
)
|
(1,768
|
)
|
43.5
|
36.1
|
||||||||||||
|
Net Broadband Additions
|
(107
|
)
|
(157
|
)
|
131
|
31.8
|
%
|
-
|
%
|
|||||||||||
|
1 Excludes acquisition-related additions during the period.
|
||||||||||||||||||||
|
2 Includes disconnections for customers that migrated to DIRECTV NOW. Net DIRECTV NOW additions were more than 200.
|
||||||||||||||||||||
Operating revenues increased $16,001, or 45.3%, in 2016 and $13,061, or 58.7%, in 2015, largely due to our acquisition of DIRECTV in July 2015. Also contributing to the increases was continued growth in consumer IP broadband, which offset lower revenues from legacy voice and data products. U-verse video revenue also contributed to higher results in 2015.
As consumers continue to demand more mobile access to video, we have launched streaming access to our subscribers, including mobile access for existing satellite and U-verse subscribers. In November 2016, we launched DIRECTV NOW, our newest video streaming option that does not require either satellite or U-verse service (commonly called over-the-top video service).
Video entertainment revenues increased $16,189, or 79.9%, in 2016 and $13,445 in 2015, primarily related to our acquisition of DIRECTV. We are now focusing our sales efforts on satellite service as there are lower marginal content costs for satellite subscribers. U-verse video revenues were $900 lower in 2016, primarily due to a 24.2% decrease in U-verse video connections, when compared to 2015, and $932 higher in 2015 when compared to 2014. As of December 31, 2016, more than 80% of our linear video subscribers were on the DIRECTV platform.
High-speed internet revenues increased $871, or 13.2%, in 2016 and $1,079, or 19.5%, in 2015. When compared to 2015, IP broadband subscribers increased 4.3%, to 12.9 million subscribers at December 31, 2016. When compared to 2014, IP broadband subscribers increased 8.5%, to 12.4 million subscribers at December 31, 2015. While IP broadband subscribers increased in 2016 and 2015, net additions declined in both years due to fewer U-verse sales promotions in each year and competitive pressures. The churn of video customers also contributed to lower net additions, as a portion of these video subscribers also chose to disconnect their IP broadband service. To compete more effectively against other broadband providers, in 2016 we continued to deploy our all-fiber, high-speed wireline network, which has improved customer retention rates.
Legacy voice and data service revenues decreased $1,085, or 18.3%, in 2016 and $1,678, or 22.1%, in 2015. For 2016, legacy voice and data services represented approximately 9% of our total Entertainment Group revenue compared to 17% for 2015 and 34% for 2014 and reflect decreases of $663 and $1,083 in local voice and long-distance, and $422 and $593 in traditional data revenues. The decreases reflect the continued migration of customers to our more advanced IP-based offerings or to competitors. At December 31, 2016, approximately 9% of our broadband connections were DSL compared to 14% at December 31, 2015.
Operations and support expenses increased $10,993, or 38.8%, in 2016 and $9,353, or 49.2%, in 2015. Operations and support expenses consist of costs incurred to provide our products and services, including costs of operating and maintaining our networks and providing video content, as well as personnel costs, such as compensation and benefits.
Increased expenses in both periods were primarily due to our acquisition of DIRECTV, which increased our Entertainment Group expenses by $11,748 in 2016 and $9,683 in 2015. The DIRECTV related increases were primarily due to higher content costs, customer support and service related charges, and advertising expenses. The increase in 2016 also reflects pressure from annual content cost increases, including the NFL SUNDAY TICKET®.
9
Management’s Discussion and Analysis of Financial Condition and Results of Operations (continued)
Dollars in millions except per share and per subscriber amounts
Partially offsetting the increased expenses in both years were lower employee charges resulting from ongoing workforce reductions and our focus on cost initiatives. Lower equipment costs also partially offset increased expenses in 2015.
Depreciation expenses increased $917, or 18.5%, in 2016 and $472, or 10.6%, in 2015. The increases were primarily due to our acquisition of DIRECTV and ongoing capital spending for network upgrades and expansion, partially offset by fully depreciated assets. The increase in 2016 was partially offset by the change in estimated useful lives and salvage value of certain assets associated with our transition to an IP-based network (see Note 1).
Operating income increased $4,091 in 2016 and $3,236 in 2015. Our Entertainment Group segment operating income margin was 11.9% in 2016, 5.7% in 2015, and (5.5)% in 2014. Our Entertainment Group EBITDA margin was 23.3% in 2016, 19.7% in 2015, and 14.6% in 2014.
|
Consumer Mobility
|
||||||||||||||||||||
|
Segment Results
|
||||||||||||||||||||
|
Percent Change
|
||||||||||||||||||||
|
2016
|
2015
|
2014
|
2016 vs.
2015
|
2015 vs.
2014
|
||||||||||||||||
|
Segment operating revenues
|
||||||||||||||||||||
|
Service
|
$
|
27,536
|
$
|
29,150
|
$
|
30,850
|
(5.5
|
)%
|
(5.5
|
)%
|
||||||||||
|
Equipment
|
5,664
|
5,916
|
5,919
|
(4.3
|
)
|
(0.1
|
)
|
|||||||||||||
|
Total Segment Operating Revenues
|
33,200
|
35,066
|
36,769
|
(5.3
|
)
|
(4.6
|
)
|
|||||||||||||
|
Segment operating expenses
|
||||||||||||||||||||
|
Operations and support
|
19,659
|
21,477
|
23,891
|
(8.5
|
)
|
(10.1
|
)
|
|||||||||||||
|
Depreciation and amortization
|
3,716
|
3,851
|
3,827
|
(3.5
|
)
|
0.6
|
||||||||||||||
|
Total Segment Operating Expenses
|
23,375
|
25,328
|
27,718
|
(7.7
|
)
|
(8.6
|
)
|
|||||||||||||
|
Segment Operating Income
|
9,825
|
9,738
|
9,051
|
0.9
|
7.6
|
|||||||||||||||
|
Equity in Net Income (Loss) of Affiliates
|
-
|
-
|
(1
|
)
|
-
|
-
|
||||||||||||||
|
Segment Contribution
|
$
|
9,825
|
$
|
9,738
|
$
|
9,050
|
0.9
|
%
|
7.6
|
%
|
||||||||||
|
The following tables highlight other key measures of performance for the Consumer Mobility segment:
|
||||||||||||||||||||
|
Percent Change
|
||||||||||||||||||||
|
2016
|
2015
|
2014
|
2016 vs.
2015
|
2015 vs.
2014
|
||||||||||||||||
|
At December 31 (in 000s)
|
||||||||||||||||||||
|
Consumer Mobility Subscribers
|
||||||||||||||||||||
|
Postpaid
|
27,095
|
28,814
|
30,610
|
(6.0
|
)%
|
(5.9
|
)%
|
|||||||||||||
|
Prepaid
|
13,536
|
11,548
|
9,965
|
17.2
|
15.9
|
|||||||||||||||
|
Branded
|
40,631
|
40,362
|
40,575
|
0.7
|
(0.5
|
)
|
||||||||||||||
|
Reseller
|
11,884
|
13,690
|
13,844
|
(13.2
|
)
|
(1.1
|
)
|
|||||||||||||
|
Connected devices1
|
942
|
929
|
1,021
|
1.4
|
(9.0
|
)
|
||||||||||||||
|
Total Consumer Mobility Subscribers
|
53,457
|
54,981
|
55,440
|
(2.8
|
)%
|
(0.8
|
)%
|
|||||||||||||
|
1 Includes data-centric devices such as session-based tablets, monitoring devices and automobile systems. Excludes postpaid tablets.
|
||||||||||||||||||||
10
Management’s Discussion and Analysis of Financial Condition and Results of Operations (continued)
Dollars in millions except per share and per subscriber amounts
|
Percent Change
|
||||||||||||||||||||
|
2016
|
2015
|
2014
|
2016 vs.
2015
|
2015 vs.
2014
|
||||||||||||||||
|
(in 000s)
|
||||||||||||||||||||
|
Consumer Mobility Net Additions1,4
|
||||||||||||||||||||
|
Postpaid
|
359
|
463
|
1,226
|
(22.5
|
)%
|
(62.2
|
)%
|
|||||||||||||
|
Prepaid
|
1,575
|
1,364
|
(311
|
)
|
15.5
|
-
|
||||||||||||||
|
Branded Net Additions
|
1,934
|
1,827
|
915
|
5.9
|
99.7
|
|||||||||||||||
|
Reseller
|
(1,813
|
)
|
(168
|
)
|
(351
|
)
|
-
|
52.1
|
||||||||||||
|
Connected devices2
|
19
|
(131
|
)
|
(465
|
)
|
-
|
71.8
|
|||||||||||||
|
Consumer Mobility Net Subscriber Additions
|
140
|
1,528
|
99
|
(90.8
|
)%
|
-
|
%
|
|||||||||||||
|
Total Churn1,3,4
|
2.15
|
%
|
1.94
|
%
|
2.06
|
%
|
21 BP
|
(12) BP
|
||||||||||||
|
Postpaid Churn1,3,4
|
1.19
|
%
|
1.25
|
%
|
1.22
|
%
|
(6) BP
|
3 BP
|
||||||||||||
|
1 Excludes migrations between AT&T segments and/or subscriber categories and acquisition-related additions during the period.
|
||||||||||||||||||||
| 2 Includes data-centric devices such as session-based tablets, monitoring devices and automobile systems. Excludes postpaid tablets. | ||||||||||||||||||||
| 3 Calculated by dividing the aggregate number of wireless subscribers who canceled service during a month divided by the total number of wireless subscribers at the beginning of that month. The churn rate for the year is | ||||||||||||||||||||
| equal to the average of the churn rate for each month of that period. | ||||||||||||||||||||
|
4 Includes the impacts of the year-end 2016 shutdown of our U.S. 2G network.
|
||||||||||||||||||||
Operating revenues decreased $1,866, or 5.3%, in 2016 and $1,703, or 4.6%, in 2015. Decreased revenues reflect declines in postpaid service revenues due to customers migrating to our Business Solutions segment and choosing Mobile Share plans, partially offset by higher prepaid service revenues. Our business wireless offerings allow for individual subscribers to purchase wireless services through employer-sponsored plans for a reduced price. The migration of these subscribers to the Business Solutions segment negatively impacted our consumer postpaid subscriber total and service revenue growth. The shutdown of our 2G network also resulted in higher overall churn as subscribers in our reseller and connected device categories upgraded their devices at lower rates than postpaid and prepaid subscribers.
Service revenue decreased $1,614, or 5.5%, in 2016 and $1,700, or 5.5%, in 2015. The decreases were largely due to the migration of of subscribers to Business Solutions and postpaid customers continuing to shift to no-device-subsidy plans that allow for discounted monthly service charges under our Mobile Share plans. Revenues from postpaid customers declined $2,285, or 10.4%, in 2016 and $2,252, or 9.3%, in 2015. Without the migration of customers to Business Solutions, postpaid wireless revenues would have decreased approximately 5.6% in 2016 and 4.0% for 2015. The decreases were partially offset by higher prepaid service revenues of $953, or 20.4%, in 2016 and $457, or 10.9%, in 2015.
Equipment revenue decreased $252, or 4.3%, in 2016 and $3, or 0.1%, in 2015. The decreases in equipment revenues resulted from lower handset sales and upgrades and increased promotional activities, partially offset by the sale of higher-priced devices and increases in devices purchased on installment payment agreements. In 2016, we had fewer customers upgrading their handsets and more new customers bringing their own devices. We expect these customer trends to continue in 2017.
Operations and support expenses decreased $1,818, or 8.5%, in 2016 and $2,414, or 10.1%, in 2015. Operations and support expenses consist of costs incurred to provide our products and services, including costs of operating and maintaining our networks and personnel expenses, such as compensation and benefits.
Expense decreases in 2016 were primarily due to:
|
·
|
Declines in equipment costs of $554 due to lower handset volumes partially offset by higher prices.
|
|
·
|
Reduced selling and commission expenses of $302 resulting from fewer upgrade transactions and lower average commission rates.
|
|
·
|
Lower network costs of $246 driven by a decline in interconnect costs resulting from our ongoing network transition to more efficient Ethernet/IP-based technologies.
|
|
·
|
Declines of $204 associated with bad debt expense.
|
|
·
|
Lower customer service costs of $145 due to cost efficiencies including lower vendor and professional services from reduced call center volumes.
|
11
Management’s Discussion and Analysis of Financial Condition and Results of Operations (continued)
Dollars in millions except per share and per subscriber amounts
Expense decreases in 2015 were primarily due to:
|
·
|
Reduced selling and commission expenses of $861 from lower average commission rates and fewer upgrade transactions.
|
|
·
|
Lower network costs of $434 driven by a decline in interconnect costs resulting from our ongoing network transition to more efficient Ethernet/IP-based technologies.
|
|
·
|
Reductions of $406 for equipment costs, reflecting lower handset volumes partially offset by the sale of higher-priced devices.
|
|
·
|
Lower customer service costs of $275 primarily due to cost efficiencies including lower vendor and professional services from reduced call center volumes.
|
|
·
|
Declines of $209 primarily due to incollect roaming fee rate declines, partially offset by increased data volume.
|
Depreciation expense decreased $135, or 3.5%, in 2016 and increased $24, or 0.6%, in 2015. The decrease in 2016 was primarily due to fully depreciated assets, partially offset by ongoing capital spending for network upgrades and expansion and accelerating depreciation related to the shutdown of our U.S. 2G network. The increase in 2015 was primarily due to ongoing capital spending for network upgrades and expansion that was largely offset by fully depreciated assets.
Operating income increased $87, or 0.9%, in 2016 and $687, or 7.6%, in 2015. Our Consumer Mobility segment operating income margin increased to 29.6% in 2016, compared to 27.8% in 2015 and 24.6% in 2014. Our Consumer Mobility EBITDA margin increased to 40.8% in 2016, compared to 38.8% in 2015 and 35.0% in 2014.
|
International
|
||||||||||||||||||||
|
Segment Results
|
||||||||||||||||||||
|
Percent Change
|
||||||||||||||||||||
|
2016
|
2015
|
2014
|
2016 vs.
2015
|
2015 vs.
2014
|
||||||||||||||||
|
Segment operating revenues
|
||||||||||||||||||||
|
Video entertainment
|
$
|
4,910
|
$
|
2,151
|
$
|
-
|
-
|
%
|
-
|
%
|
||||||||||
|
Wireless service
|
1,905
|
1,647
|
-
|
15.7
|
-
|
|||||||||||||||
|
Equipment
|
468
|
304
|
-
|
53.9
|
-
|
|||||||||||||||
|
Total Segment Operating Revenues
|
7,283
|
4,102
|
-
|
77.5
|
-
|
|||||||||||||||
|
Segment operating expenses
|
||||||||||||||||||||
|
Operations and support
|
6,830
|
3,930
|
-
|
73.8
|
-
|
|||||||||||||||
|
Depreciation and amortization
|
1,166
|
655
|
-
|
78.0
|
-
|
|||||||||||||||
|
Total Segment Operating Expenses
|
7,996
|
4,585
|
-
|
74.4
|
-
|
|||||||||||||||
|
Segment Operating Income (Loss)
|
(713
|
)
|
(483
|
)
|
-
|
(47.6
|
)
|
-
|
||||||||||||
|
Equity in Net Income (Loss)
of Affiliates
|
52
|
(5
|
)
|
153
|
-
|
-
|
||||||||||||||
|
Segment Contribution
|
$
|
(661
|
)
|
$
|
(488
|
)
|
$
|
153
|
(35.5
|
)%
|
-
|
%
|
||||||||
12
Management’s Discussion and Analysis of Financial Condition and Results of Operations (continued)
Dollars in millions except per share and per subscriber amounts
The following tables highlight other key measures of performance for the International segment:
|
Percent Change
|
||||||||||||||||||||
|
At December 31 (in 000s)
|
2016
|
2015
|
2014
|
2016 vs.
2015
|
2015 vs.
2014
|
|||||||||||||||
|
Mexico Wireless Subscribers
|
||||||||||||||||||||
|
Postpaid
|
4,965
|
4,289
|
-
|
15.8
|
%
|
-
|
%
|
|||||||||||||
|
Prepaid
|
6,727
|
3,995
|
-
|
68.4
|
-
|
|||||||||||||||
|
Branded
|
11,692
|
8,284
|
-
|
41.1
|
-
|
|||||||||||||||
|
Reseller
|
281
|
400
|
-
|
(29.8
|
)
|
-
|
||||||||||||||
|
Total Mexico Wireless Subscribers
|
11,973
|
8,684
|
-
|
37.9
|
-
|
|||||||||||||||
|
Latin America Satellite Subscribers
|
||||||||||||||||||||
|
PanAmericana
|
7,206
|
7,066
|
-
|
2.0
|
-
|
|||||||||||||||
|
SKY Brazil1
|
5,249
|
5,444
|
-
|
(3.6
|
)
|
-
|
||||||||||||||
|
Total Latin America Satellite Subscribers
|
12,455
|
12,510
|
-
|
(0.4
|
)%
|
-
|
%
|
|||||||||||||
|
1 Excludes subscribers of our International segment equity investments in SKY Mexico, in which we own a 41.3% stake. SKY Mexico had 7.9 million subscribers at September 30, 2016 and 7.3 million subscribers at December 31, 2015.
|
||||||||||||||||||||
|
Percent Change
|
||||||||||||||||||||
|
(in 000s)
|
2016
|
2015
|
2014
|
2016 vs.
2015
|
2015 vs.
2014
|
|||||||||||||||
|
Mexico Wireless Net Additions
|
||||||||||||||||||||
|
Postpaid
|
677
|
177
|
-
|
-
|
%
|
-
|
%
|
|||||||||||||
|
Prepaid
|
2,732
|
(169
|
)
|
-
|
-
|
-
|
||||||||||||||
|
Branded Net Additions
|
3,409
|
8
|
-
|
-
|
-
|
|||||||||||||||
|
Reseller
|
(120
|
)
|
(104
|
)
|
-
|
(15.4
|
)
|
-
|
||||||||||||
|
Mexico Wireless
Net Subscriber Additions
|
3,289
|
(96
|
)
|
-
|
-
|
-
|
||||||||||||||
|
Latin America Satellite Net Additions
|
||||||||||||||||||||
|
PanAmericana
|
140
|
76
|
-
|
84.2
|
-
|
|||||||||||||||
|
SKY Brazil1
|
(195
|
)
|
(223
|
)
|
-
|
12.6
|
-
|
|||||||||||||
|
Latin America Satellite
Net Subscriber Additions
|
(55
|
)
|
(147
|
)
|
-
|
62.6
|
%
|
-
|
%
|
|||||||||||
|
1 Excludes SKY Mexico net subscriber additions of 643,000 for the nine months ended September 30, 2016 and 646,000 for the year ended December 31, 2015.
|
||||||||||||||||||||
Operating Results
Our International segment consists of the Latin American operations acquired in our July 2015 acquisition of DIRECTV as well as the Mexican wireless operations acquired earlier in 2015 (see Note 5). Video entertainment services are provided to primarily residential customers using satellite technology in various countries in Latin America, including Brazil, Argentina and Colombia. Our International segment is subject to foreign currency fluctuations, with most of our international subsidiaries conducting business in their local currency. Operating results are converted to U.S. dollars using official exchange rates.
Operating revenues increased $3,181, or 77.5%, in 2016. Revenue growth in 2016 includes increases of $2,759 from video services in Latin America and $422, or 21.6%, in Mexico, primarily due to an increase in our wireless subscriber base offset by lower ARPU.
13
Management’s Discussion and Analysis of Financial Condition and Results of Operations (continued)
Dollars in millions except per share and per subscriber amounts
Operations and support expenses increased $2,900, or 73.8%, in 2016. Operations and support expenses consist of costs incurred to provide our products and services, including costs of operating and maintaining our networks and providing video content and personnel expenses, such as compensation and benefits. The increase in the 2016 expenses was largely attributable to operations in Latin America reflecting our mid-2015 DIRECTV acquisition.
Depreciation expense increased $511, or 78.0%, in 2016. The increase was primarily due to the acquisition of DIRECTV operations and our wireless network upgrade in Mexico.
Operating income decreased $230, or 47.6%, in 2016. Our International segment operating income margin was (9.8)% in 2016 and (11.8)% in 2015. Our International EBITDA margin was 6.2% in 2016 and 4.2% in 2015.
Supplemental Operating Information
As a supplemental discussion of our operating results, for comparison purposes, we are providing a view of our combined domestic wireless operations (AT&T Mobility).
|
AT&T Mobility Results
|
||||||||||||||||||||
|
Percent Change
|
||||||||||||||||||||
|
2016
|
2015
|
2014
|
2016 vs.
2015
|
2015 vs.
2014
|
||||||||||||||||
|
Operating revenues
|
||||||||||||||||||||
|
Service
|
$
|
59,386
|
$
|
59,837
|
$
|
61,032
|
(0.8
|
)%
|
(2.0
|
)%
|
||||||||||
|
Equipment
|
13,435
|
13,868
|
12,960
|
(3.1
|
)
|
7.0
|
||||||||||||||
|
Total Operating Revenues
|
72,821
|
73,705
|
73,992
|
(1.2
|
)
|
(0.4
|
)
|
|||||||||||||
|
Operating expenses
|
||||||||||||||||||||
|
Operations and support
|
43,886
|
45,789
|
48,348
|
(4.2
|
)
|
(5.3
|
)
|
|||||||||||||
|
EBITDA
|
28,935
|
27,916
|
25,644
|
3.7
|
8.9
|
|||||||||||||||
|
Depreciation and amortization
|
8,292
|
8,113
|
7,744
|
2.2
|
4.8
|
|||||||||||||||
|
Total Operating Expenses
|
52,178
|
53,902
|
56,092
|
(3.2
|
)
|
(3.9
|
)
|
|||||||||||||
|
Operating Income
|
20,643
|
19,803
|
17,900
|
4.2
|
10.6
|
|||||||||||||||
|
Equity in Net Income (Loss) of Affiliates
|
-
|
-
|
(1
|
)
|
-
|
-
|
||||||||||||||
|
Operating Contribution
|
$
|
20,643
|
$
|
19,803
|
$
|
17,899
|
4.2
|
%
|
10.6
|
%
|
||||||||||
14
Management’s Discussion and Analysis of Financial Condition and Results of Operations (continued)
Dollars in millions except per share and per subscriber amounts
|
The following tables highlight other key measures of performance for AT&T Mobility:
|
||||||||||||||
|
Percent Change
|
||||||||||||||
|
2016
|
2015
|
2014
|
2016 vs.
2015
|
2015 vs.
2014
|
||||||||||
|
At December 31 (in 000s)
|
||||||||||||||
|
Wireless Subscribers1
|
||||||||||||||
|
Postpaid smartphones
|
59,096
|
58,073
|
56,644
|
1.8
|
%
|
2.5
|
%
|
|||||||
|
Postpaid feature phones and data-centric devices
|
18,687
|
19,032
|
19,126
|
(1.8)
|
(0.5)
|
|||||||||
|
Postpaid
|
77,783
|
77,105
|
75,770
|
0.9
|
1.8
|
|||||||||
|
Prepaid
|
13,536
|
11,548
|
9,965
|
17.2
|
15.9
|
|||||||||
|
Branded
|
91,319
|
88,653
|
85,735
|
3.0
|
3.4
|
|||||||||
|
Reseller
|
11,949
|
13,774
|
13,855
|
(13.2)
|
(0.6)
|
|||||||||
|
Connected devices2
|
31,591
|
26,213
|
20,964
|
20.5
|
25.0
|
|||||||||
|
Total Wireless Subscribers
|
134,859
|
128,640
|
120,554
|
4.8
|
6.7
|
|||||||||
|
Branded smartphones
|
70,817
|
67,200
|
62,443
|
5.4
|
7.6
|
|||||||||
|
Mobile Share connections
|
57,028
|
61,275
|
52,370
|
(6.9)
|
17.0
|
|||||||||
|
Smartphones under our installment programs at
end of period
|
30,688
|
26,670
|
15,308
|
15.1
|
%
|
74.2
|
%
|
|||||||
|
1 Represents 100% of AT&T Mobility wireless subscribers.
|
||||||||||||||
|
2 Includes data-centric devices such as session-based tablets, monitoring devices and automobile systems. Excludes postpaid tablets.
|
||||||||||||||
|
Percent Change
|
||||||||||||||
|
2016
|
2015
|
2014
|
2016 vs.
2015
|
2015 vs.
2014
|
||||||||||
|
(in 000s)
|
||||||||||||||
|
Wireless Net Additions1,4
|
||||||||||||||
|
Postpaid
|
1,118
|
1,666
|
3,290
|
(32.9)
|
%
|
(49.4)
|
%
|
|||||||
|
Prepaid
|
1,575
|
1,364
|
(311)
|
15.5
|
-
|
|||||||||
|
Branded Net Additions
|
2,693
|
3,030
|
2,979
|
(11.1)
|
1.7
|
|||||||||
|
Reseller
|
(1,846)
|
(155)
|
(346)
|
-
|
55.2
|
|||||||||
|
Connected devices2
|
5,349
|
5,184
|
2,975
|
3.2
|
74.3
|
|||||||||
|
Wireless Net Subscriber Additions
|
6,196
|
8,059
|
5,608
|
(23.1)
|
43.7
|
|||||||||
|
Smartphones sold under our installment
programs during period
|
17,871
|
17,320
|
15,268
|
3.2
|
%
|
13.4
|
%
|
|||||||
|
Total Churn3,4
|
1.48%
|
1.39%
|
1.45%
|
9 BP
|
(6) BP
|
|||||||||
|
Branded Churn3,4
|
1.62%
|
1.63%
|
1.69%
|
(1) BP
|
(6) BP
|
|||||||||
|
Postpaid Churn3,4
|
1.07%
|
1.09%
|
1.04%
|
(2) BP
|
5 BP
|
|||||||||
|
Postpaid Phone Only Churn3,4
|
0.92%
|
0.99%
|
0.97%
|
(7) BP
|
2 BP
|
|||||||||
|
1 Excludes acquisition-related additions during the period.
|
||||||||||||||
|
2 Includes data-centric devices such as session-based tablets, monitoring devices and automobile systems. Excludes postpaid tablets.
|
||||||||||||||
|
3 Calculated by dividing the aggregate number of wireless subscribers who canceled service during a month divided by the total number of wireless subscribers at the beginning of that month. The churn rate for the year is equal to the average of the churn rate for each month of that period.
|
||||||||||||||
|
4 Includes the impacts of the year-end 2016 shutdown of our U.S. 2G network.
|
||||||||||||||
15
Management’s Discussion and Analysis of Financial Condition and Results of Operations (continued)
Dollars in millions except per share and per subscriber amounts
Operating income increased $840, or 4.2%, in 2016 and $1,903, or 10.6%, in 2015. The operating income margin of AT&T Mobility increased to 28.3% in 2016, compared to 26.9% in 2015 and 24.2% in 2014. AT&T Mobility’s EBITDA margin increased to 39.7% in 2016, compared to 37.9% in 2015 and 34.7% in 2014. AT&T Mobility’s EBITDA service margin increased to 48.7% in 2016, compared to 46.7% in 2015 and 42.0% in 2014. (EBITDA service margin is operating income before depreciation and amortization, divided by total service revenues.)
Subscriber Relationships
As the wireless industry continues to mature, future wireless growth will become increasingly dependent on our ability to offer innovative services, plans and devices and a wireless network that has sufficient spectrum and capacity to support these innovations on as broad a geographic basis as possible. To attract and retain subscribers in a maturing market, we have launched a wide variety of plans, including Mobile Share and AT&T Next. Additionally, beginning in 2016, we introduced an integrated offer that allows for unlimited wireless data when combined with our video services, ending the year with more than 7.9 million subscribers on this offer.
The year-end 2016 shutdown of our U.S. 2G network contributed to higher disconnections and churn of subscribers, particularly in the fourth quarter 2016. Although many 2G subscribers, especially in our postpaid and prepaid categories, chose to upgrade to newer devices before the end of the year, a portion did not. We discontinued service on virtually all of our 2G cell sites in early 2017, and as of February 1, 2017, had 766,000 subscribers that remain on 2G devices. Our 2G subscribers at December 31 are as follows:
|
(in 000s)
|
2016
|
2015
|
Percent
Change
|
||||
|
Postpaid (primarily phones)
|
89
|
928
|
(90.4)
|
%
|
|||
|
Prepaid
|
77
|
387
|
(80.1)
|
||||
|
Reseller1
|
337
|
2,796
|
(87.9)
|
||||
|
Connected devices2
|
1,813
|
5,635
|
(67.8)
|
||||
|
Total 2G Subscribers
|
2,316
|
9,746
|
(76.2)
|
%
|
|||
|
1 Primarily included in our Consumer Mobility segment.
|
|||||||
|
2 Primarily included in our Business Solutions segment.
|
|||||||
ARPU
Postpaid phone only ARPU was $59.45 and postpaid phone only ARPU plus AT&T Next subscriber installment billings was $69.76 in 2016, compared to $60.45 and $68.03 in 2015 and $62.99 and $65.80 in 2014, respectively.
Churn
The effective management of subscriber churn is critical to our ability to maximize revenue growth and to maintain and improve margins. Total churn was higher in 2016 and was negatively impacted by the loss of 2G subscribers, which contributed more than 20 basis points of pressure to total churn throughout the year. Postpaid churn and postpaid phone only churn were lower in 2016 despite competitive pressure in the industry.
Branded Subscribers
Branded subscribers increased 3.0% in 2016 and 3.4% in 2015. These increases reflect growth of 17.2% and 15.9% in prepaid subscribers and 0.9% and 1.8% in postpaid subscribers, respectively. At December 31, 2016, 91% of our postpaid phone subscriber base used smartphones, compared to 87% at December 31, 2015. Virtually all of our postpaid smartphone subscribers are on plans that provide for service on multiple devices at reduced rates, and such subscribers tend to have higher retention and lower churn rates. Device connections on our Mobile Share and unlimited wireless data integrated offer plans now represent 84% of our postpaid customer base compared to 79% at December 31, 2015. During 2016, approximately 10% of our postpaid customer base, or 7.9 million subscribers chose this new integrated offer. Such offerings are intended to encourage existing subscribers to upgrade their current services and/or add connected devices, attract subscribers from other providers and minimize subscriber churn.
16
Management’s Discussion and Analysis of Financial Condition and Results of Operations (continued)
Dollars in millions except per share and per subscriber amounts
During the first quarter of 2016, we discontinued offering subsidized smartphones to most of our customers. Under this no-subsidy model, subscribers must purchase a device on installments under an equipment installment program or choose to bring their own device (BYOD), with no annual service contract. At December 31, 2016, about 52% of the postpaid smartphone base is on an installment program compared to nearly 46% at December 31, 2015. Of the postpaid smartphone gross adds and upgrades during 2016, 93% were either equipment installment plans or BYOD, compared to 77% in 2015. While BYOD customers do not generate equipment revenue or expense, the service revenue helps improve our margins. During 2016, we added approximately 2.3 million BYOD customers, compared to 1.8 million in 2015. BYOD sales represented 11% of total postpaid smartphone sales in 2016 compared to 7% in 2015.
Our equipment installment purchase programs, including AT&T Next, allow for postpaid subscribers to purchase certain devices in installments over a period of up to 30 months. Additionally, after a specified period of time, AT&T Next subscribers also have the right to trade in the original device for a new device with a new installment plan and have the remaining unpaid balance satisfied. For installment programs, we recognize equipment revenue at the time of the sale for the amount of the customer receivable, net of the fair value of the trade-in right guarantee and imputed interest. A significant percentage of our customers choosing equipment installment programs pay a lower monthly service charge, which results in lower service revenue recorded for these subscribers.
Connected Devices
Connected devices includes data-centric devices such as session-based tablets, monitoring devices and automobile systems. Connected device subscribers increased 20.5% during 2016 and 25.0% in 2015. During 2016, we added approximately 4.9 million “connected” cars through agreements with various carmakers. We believe that these connected car agreements give us the opportunity to create future retail relationships with the car owners.
OPERATING ENVIRONMENT AND TRENDS OF THE BUSINESS
2017 Revenue Trends We expect our operating environment in 2017 to be highly competitive, as companies and consumers continue to demand instant connectivity, higher speeds and an integrated experience across their devices for both video and data. Our recent regulatory environment has been unfriendly to investment in broadband services but we are hopeful that the results of the 2016 Federal election will begin to create a regulatory environment that is more predictable and more conducive to long-term investment planning. We are also hopeful that U.S. corporate tax reform will be enacted which should stimulate the economy and increase business investment overall. In 2017, we expect the following:
|
·
|
Consolidated operating revenue growth, driven by our ability to offer integrated wireless, video and wireline services, as well as continuing growth in fixed strategic services.
|
|
·
|
Robust competition in wireless and video will continue to pressure service revenue and ARPU for those products.
|
|
·
|
Major customer categories will continue to increase their use of internet-based broadband/data services and video services.
|
|
·
|
Traditional voice and data service revenue declines.
|
|
·
|
Our 2015 acquisitions of DIRECTV and wireless properties in Mexico will increase revenues, although we expect to incur significant integration costs in the same period.
|
2017 Expense Trends We expect consolidated operating income margins to expand in 2017 as growth in AT&T Next is reducing subsidized handset costs over time and we lower our marginal cost of providing video services and operating our network. We intend to continue our focus on cost reductions, driving savings through automation, supply chain, benefit design, digitizing transactions and optimizing network costs. In addition, the ongoing transition of our network to a more efficient software-based technology is expected to continue driving favorable expense trends over the next several years. However, expenses related to growth areas of our business along with the integration of our newly acquired operations, will place offsetting pressure on our operating income margin.
Market Conditions During 2016, the ongoing slow recovery in the general U.S. economy continued to negatively affect our customers. Certain industries, such as energy and retail businesses, are being especially cautious. Residential customers continue to be price sensitive in selecting offerings, and continue to focus on products that give them efficient access to video and broadcast services. We expect continued pressure on pricing during 2017 as we respond to this intense competition, especially in the wireless and video services.
Included on our consolidated balance sheets are assets held by benefit plans for the payment of future benefits. Our pension plans are subject to funding requirements of the Employee Retirement Income Security Act of 1974, as amended (ERISA). In September 2013, we made a voluntary contribution of a preferred equity interest in AT&T Mobility II LLC to the trust used to pay pension benefits. We also agreed to make a cash contribution to the trust of $175 no later than the due date of our
17
Management’s Discussion and Analysis of Financial Condition and Results of Operations (continued)
Dollars in millions except per share and per subscriber amounts
federal income tax return for 2014, 2015 and 2016. During 2016, we accelerated the final contribution and completed our obligation with a $350 cash payment. The trust is entitled to receive cumulative annual cash distributions of $560, which will result in a $560 contribution during 2017. We expect only minimal ERISA contribution requirements to our pension plans for 2017. However, a weakness in the equity, fixed income and real asset markets could require us in future years to make contributions to the pension plans in order to maintain minimum funding requirements as established by ERISA. Investment returns on these assets depend largely on trends in the U.S. securities markets and the U.S. economy. In addition, our policy of recognizing actuarial gains and losses related to our pension and other postretirement plans in the period in which they arise subjects us to earnings volatility caused by changes in market conditions. Changes in our discount rate, which are tied to changes in the bond market, and changes in the performance of equity markets, may have significant impacts on the valuation of our pension and other postretirement obligations at the end of 2017 (see “Accounting Policies and Estimates”).
OPERATING ENVIRONMENT OVERVIEW
AT&T subsidiaries operating within the United States are subject to federal and state regulatory authorities. AT&T subsidiaries operating outside the United States are subject to the jurisdiction of national and supranational regulatory authorities in the markets where service is provided.
In the Telecommunications Act of 1996 (Telecom Act), Congress established a national policy framework intended to bring the benefits of competition and investment in advanced telecommunications facilities and services to all Americans by opening all telecommunications markets to competition and reducing or eliminating regulatory burdens that harm consumer welfare. Since the Telecom Act was passed, the Federal Communications Commission (FCC) and some state regulatory commissions have maintained or expanded certain regulatory requirements that were imposed decades ago on our traditional wireline subsidiaries when they operated as legal monopolies. However, based on their public statements and written opinions, we expect the new leadership at the FCC to chart a more predictable and balanced regulatory course that will encourage long-term investment and benefit consumers. In addition, we are pursuing, at both the state and federal levels, additional legislative and regulatory measures to reduce regulatory burdens that are no longer appropriate in a competitive telecommunications market and that inhibit our ability to compete more effectively and offer services wanted and needed by our customers, including initiatives to transition services from traditional networks to all IP-based networks. At the same time, we also seek to ensure that legacy regulations are not further extended to broadband or wireless services, which are subject to vigorous competition.
In February 2015, the FCC released an order classifying both fixed and mobile consumer broadband internet access services as telecommunications services, subject to comprehensive regulation under the Telecom Act. The FCC’s decision significantly expands its existing authority to regulate the provision of fixed and mobile broadband internet access services. AT&T and other providers of broadband internet access services challenged the FCC’s decision before the U.S. Court of Appeals for the D.C. Circuit. On June 14, 2016, a panel of the Court of Appeals upheld the FCC’s rules by a 2-1 vote. In July 2016, AT&T and several of the other parties that challenged the rules filed petitions with the Court of Appeals asking that the case be reheard either by the panel or by the full Court of Appeals. Those petitions remain pending.
In October 2016 a sharply divided FCC adopted new rules governing the use of customer information by providers of broadband internet access service. Those rules are more restrictive in certain respects than those governing other participants in the internet economy, including so-called “edge” providers such as Google and Facebook. Several petitions for reconsideration of the new rules have been filed, as well as a request for stay. The current Chairman of the FCC opposed the new rules when they were adopted, and we expect the FCC will rule on these petitions promptly.
In January 2017, the FCC removed from its list of active proceedings proposed rules on cable set-top boxes and the bulk data connections that telecom companies provide to businesses.
We provide satellite video service through our subsidiary DIRECTV, whose satellites are licensed by the FCC. The Communications Act of 1934 and other related acts give the FCC broad authority to regulate the U.S. operations of DIRECTV. In addition, states representing a majority of our local service access lines have adopted legislation that enables us to provide IP-based service through a single statewide or state-approved franchise (as opposed to the need to acquire hundreds or even thousands of municipal-approved franchises) to offer a competitive video product. We also are supporting efforts to update and improve regulatory treatment for retail services. Regulatory reform and passage of legislation is uncertain and depends on many factors.
We provide wireless services in robustly competitive markets, but are subject to substantial and increasing governmental regulation. Wireless communications providers must obtain licenses from the FCC to provide communications services at
18
Management’s Discussion and Analysis of Financial Condition and Results of Operations (continued)
Dollars in millions except per share and per subscriber amounts
specified spectrum frequencies within specified geographic areas and must comply with the FCC rules and policies governing the use of the spectrum. While wireless communications providers’ prices and offerings are generally not subject to state regulation, states sometimes attempt to regulate or legislate various aspects of wireless services, such as in the area of consumer protection.
The FCC has recognized that the explosive growth of bandwidth-intensive wireless data services requires the U.S. government to make more spectrum available. In February 2012, Congress set forth specific spectrum blocks to be auctioned and licensed by February 2015 (the “AWS-3 Auction”) and also authorized the FCC to conduct an “incentive auction,” to make available for wireless broadband use certain spectrum that is currently used by broadcast television licensees (the “600 MHz Auction”). We participated in the AWS-3 Auction. The 600 MHz Auction (Auction 1000) began on March 29, 2016, and after multiple phases, this auction is expected to conclude in the first half of 2017.
We have also submitted a bid to provide a nationwide mobile broadband network for the First Responder Network Authority (FirstNet). Should our bid be accepted, the actual reach of the network will depend on participation by the individual states.
In May 2014, in a separate proceeding, the FCC issued an order revising its policies governing mobile spectrum holdings. The FCC rejected the imposition of caps on the amount of spectrum any carrier could acquire, retaining its case-by-case review policy. Moreover, it increased the amount of spectrum that could be acquired before exceeding an aggregation “screen” that would automatically trigger closer scrutiny of a proposed transaction. On the other hand, it indicated that it will separately consider an acquisition of “low band” spectrum that exceeds one-third of the available low band spectrum as presumptively harmful to competition. In addition, the FCC imposed limits on certain bidders in the 600 MHz Auction, including AT&T, restricting them from bidding on up to 40 percent of the available spectrum in markets that cover as much as 70-80 percent of the U.S. population. On balance, the order and the spectrum screen should allow AT&T to obtain additional spectrum to meet our customers’ needs, but because AT&T uses more “low band” spectrum in its network than some other national carriers, the separate consideration of low band spectrum acquisitions might affect AT&T’s ability to expand capacity in these bands (low band spectrum has better propagation characteristics than “high band” spectrum). We seek to ensure that we have the opportunity, through the auction process and otherwise, to obtain the spectrum we need to provide our customers with high-quality service in the future.
As the wireless industry continues to mature, future wireless growth will become increasingly dependent on our ability to offer innovative video and data services and a wireless network that has sufficient spectrum and capacity to support these innovations. We continue to invest significant capital in expanding our network capacity, as well as to secure and utilize spectrum that meets our long-term needs. To that end, in 2015 we submitted winning bids for 251 AWS spectrum licenses for a near-nationwide contiguous block of high-quality AWS spectrum in the AWS-3 Auction (FCC Auction 97). Our strategy also includes redeploying spectrum previously used for basic 2G services to support more advanced mobile internet services on our 3G and 4G networks. We have bid on FirstNet, which if awarded will provide access to a nationwide low band 20 MHz of spectrum, assuming all states “opt in,” and we are participating in the current FCC 600 MHz Auction (Auction 1000). We will continue to invest in our wireless network as we look to provide future service offerings and participate in technologies such as 5G and millimeter-wave bands.
Expected Growth Areas
Over the next few years, we expect our growth to come from IP-based broadband services, video entertainment and wireless services from our expanded North American footprint. With our 2015 acquisitions of DIRECTV and wireless properties in Mexico, our revenue mix is much more diversified. We can now provide integrated services to diverse groups of customers in the United States on different technological platforms, including wireless, satellite and wireline. In 2017, we expect our largest revenue stream to come from business customers, followed by U.S. consumer video and broadband, U.S. consumer mobility and then international video and mobility.
Integration of Data/Broadband and Entertainment Services As the communications industry continues to move toward internet-based technologies that are capable of blending wireline, satellite and wireless services, we plan to offer services that take advantage of these new and more sophisticated technologies. In particular, we intend to continue to focus on expanding our high-speed internet and video offerings and on developing IP-based services that allow customers to integrate their home or business fixed services with their mobile service. During 2017, we will continue to develop and provide unique integrated video, mobile and broadband solutions. In late 2016, we began offering an over-the-top video service (DIRECTV NOW); data usage from streaming entertainment content will not count toward data limits for customers who also purchase our wireless service. We believe this offering will facilitate our customers’ desire to view video anywhere on demand and encourage customer retention.
19
Management’s Discussion and Analysis of Financial Condition and Results of Operations (continued)
Dollars in millions except per share and per subscriber amounts
Wireless We expect to deliver revenue growth in the coming years. We are in a period of rapid growth in wireless video usage and believe that there are substantial opportunities available for next-generation converged services that combine technologies and services. For example, we entered into agreements with many automobile manufacturers and began providing vehicle-embedded security and entertainment services.
As of December 31, 2016, we served 146.8 million wireless subscribers in North America, with nearly 135 million in the United States. Our LTE technology covers almost 400 million people in North America. In the United States, we cover all major metropolitan areas and almost 320 million people. We also provide 4G coverage using another technology (HSPA+), and when combined with our upgraded backhaul network, we are able to enhance our network capabilities and provide superior mobile broadband speeds for data and video services. Our wireless network also relies on other GSM digital transmission technologies for 3G data communications. We have shut down virtually all 2G cell sites, which enables us to position that spectrum to provide the more advanced services demanded by our customers.
Our acquisition of two Mexican wireless providers in 2015 brought a GSM network covering both the United States and Mexico and enabled our customers to use wireless services without roaming on other companies’ networks. We believe this seamless access will prove attractive to customers and provide a significant growth opportunity. We also announced in 2015 our plan to invest $3,000 to upgrade our network in Mexico to provide LTE coverage to 100 million people and businesses by year-end 2018. As of year-end 2016, this LTE network covered approximately 78 million people and businesses in Mexico.
REGULATORY DEVELOPMENTS
Set forth below is a summary of the most significant regulatory proceedings that directly affected our operations during 2016. Industry-wide regulatory developments are discussed above in Operating Environment Overview. While these issues may apply only to certain subsidiaries, the words “we,” “AT&T” and “our” are used to simplify the discussion. The following discussions are intended as a condensed summary of the issues rather than as a comprehensive legal analysis and description of all of these specific issues.
International Regulation Our subsidiaries operating outside the United States are subject to the jurisdiction of regulatory authorities in the market where service is provided. Our licensing, compliance and advocacy initiatives in foreign countries primarily enable the provision of enterprise (i.e., large business), wireless and satellite television services. AT&T is engaged in multiple efforts with foreign regulators to open markets to competition, foster conditions favorable to investment, and increase our scope of fully authorized services and products.
Federal Regulation In February 2015, the FCC released an order in response to the D.C. Circuit’s January 2014 decision adopting new rules, and classifying both fixed and mobile consumer broadband internet access services as telecommunications services, subject to comprehensive regulation under the Telecom Act. The FCC’s decision significantly expands the FCC’s existing authority to regulate the provision of fixed and mobile broadband internet access services. The FCC also asserted jurisdiction over internet interconnection arrangements, which until now have been unregulated. These actions could have an adverse impact on our fixed and mobile broadband services and operating results. AT&T and several other parties, including US Telecom and CTIA trade groups, have appealed the FCC’s order. On June 14, 2016, a panel of the Court of Appeals upheld the FCC’s rules by a 2-1 vote. On July 29, 2016, AT&T and several of the other parties that challenged the rules filed petitions with the Court of Appeals asking that the case be reheard either by the panel or by the full Court. Those petitions remain pending.
COMPETITION
Competition continues to increase for communications and digital entertainment services. Technological advances have expanded the types and uses of services and products available. In addition, lack of or a reduced level of regulation of comparable legacy services has lowered costs for these alternative communications service providers. As a result, we face heightened competition as well as some new opportunities in significant portions of our business.
We face substantial and increasing competition in our wireless businesses. Under current FCC rules, multiple licensees, who provide wireless services on the cellular, PCS, Advanced Wireless Services, 700 MHz and other spectrum bands, may operate in each of our U.S. service areas, which results in the potential presence of multiple competitors. Our competitors include brands such as Verizon Wireless, Sprint, T-Mobile/Metro PCS, a larger number of regional providers of cellular, PCS and other wireless communications services and resellers of those services. In addition, we face competition from providers who offer voice, text messaging and other services as applications on data networks. More than 98% of the U.S. population
20
Management’s Discussion and Analysis of Financial Condition and Results of Operations (continued)
Dollars in millions except per share and per subscriber amounts
lives in areas with at least three mobile telephone operators, and almost 94% of the population lives in areas with at least four competing carriers. We are one of three providers in Mexico, with the most significant market share controlled by América Móvil. We may experience significant competition from companies that provide similar services using other communications technologies and services. While some of these technologies and services are now operational, others are being developed or may be developed. We compete for customers based principally on service/device offerings, price, network quality, coverage area and customer service.
Our subsidiaries providing communications and digital entertainment services will face continued competitive pressure in 2017 from multiple providers, including wireless, satellite, cable and other VoIP providers, online video providers, and interexchange carriers and resellers. In addition, the desire for high-speed data on demand, including video, are continuing to lead customers to terminate their traditional wired services and use our or competitors’ wireless, satellite and internet-based services. In most U.S. markets, we compete for customers, often on pricing of bundled services, with large cable companies, such as Comcast Corporation, Cox Communications Inc. and Charter Communications (marketed as Spectrum), for high-speed internet, video and voice services and other smaller telecommunications companies for both long-distance and local services. In addition, in Latin American countries served by our DIRECTV subsidiary, we also face competition from other video providers, including América Móvil and Telefónica.
Our Entertainment Group and Business Solutions segments generally remain subject to regulation for certain legacy wireline wholesale services by state regulatory commissions for intrastate services and by the FCC for interstate services. Under the Telecom Act, companies seeking to interconnect to our wireline subsidiaries’ networks and exchange local calls enter into interconnection agreements with us. Many unresolved issues in negotiating those agreements are subject to arbitration before the appropriate state commission. These agreements (whether fully agreed-upon or arbitrated) are often then subject to review and approval by the appropriate state commission.
Our Entertainment Group and Business Solutions segments operate portions of their business under state-specific forms of regulation for retail services that were either legislatively enacted or authorized by the appropriate state regulatory commission. Some states regulate prices of retail services, while others adopt a regulatory framework that incorporates deregulation and price restrictions on a subset of our services. Some states may impose minimum customer service standards with required payments if we fail to meet the standards.
We continue to lose legacy voice and data subscribers due to competitors (e.g., wireless, cable and VoIP providers) who can provide comparable services at lower prices because they are not subject to traditional telephone industry regulation (or the extent of regulation is in dispute), utilize different technologies, or promote a different business model (such as advertising based). In response to these competitive pressures, for a number of years we have used a bundling strategy that rewards customers who consolidate their services (e.g., telephone, high-speed internet, wireless and video) with us. We continue to focus on bundling services, including combined packages of wireless data and voice and video service through our satellite and IP-based services. We will continue to develop innovative and integrated services that capitalize on our wireless and IP-based network and satellites.
Additionally, we provide local and interstate telephone and switched services to other service providers, primarily large Internet Service Providers using the largest class of nationwide internet networks (internet backbone), wireless carriers, other telephone companies, cable companies and systems integrators. These services are subject to additional competitive pressures from the development of new technologies, the introduction of innovative offerings and increasing satellite, wireless, fiber-optic and cable transmission capacity for services. We face a number of international competitors, including Orange Business Services, BT, Singapore Telecommunications Limited and Verizon Communications Inc., as well as competition from a number of large systems integrators.
ACCOUNTING POLICIES AND STANDARDS
Critical Accounting Policies and Estimates Because of the size of the financial statement line items they relate to or the extent of judgment required by our management, some of our accounting policies and estimates have a more significant impact on our consolidated financial statements than others. The following policies are presented in the order in which the topics appear in our consolidated statements of income.
Allowance for Doubtful Accounts We record expense to maintain an allowance for doubtful accounts for estimated losses that result from the failure or inability of our customers to make required payments. When determining the allowance, we consider the probability of recoverability based on past experience, taking into account current collection trends as well as general economic factors, including bankruptcy rates. Credit risks are assessed based on historical
21
Management’s Discussion and Analysis of Financial Condition and Results of Operations (continued)
Dollars in millions except per share and per subscriber amounts
write-offs, net of recoveries, as well as an analysis of the aged accounts and installment receivable balances with reserves generally increasing as the receivable ages. Accounts receivable may be fully reserved for when specific collection issues are known to exist, such as pending bankruptcy or catastrophes. The analysis of receivables is performed monthly, and the allowances for doubtful accounts are adjusted through expense accordingly. A 10% change in the amounts estimated to be uncollectible would result in a change in the provision for uncollectible accounts of approximately $147.
Pension and Postretirement Benefits Our actuarial estimates of retiree benefit expense and the associated significant weighted-average assumptions are discussed in Note 12. Our assumed weighted-average discount rate for pension and postretirement benefits of 4.40% and 4.30%, respectively, at December 31, 2016, reflects the hypothetical rate at which the projected benefit obligations could be effectively settled or paid out to participants. We determined our discount rate based on a range of factors, including a yield curve composed of the rates of return on several hundred high-quality, fixed income corporate bonds available at the measurement date and corresponding to the related expected durations of future cash outflows for the obligations. These bonds were all rated at least Aa3 or AA- by one of the nationally recognized statistical rating organizations, denominated in U.S. dollars, and neither callable, convertible nor index linked. For the year ended December 31, 2016, when compared to the year ended December 31, 2015, we decreased our pension discount rate by 0.20%, resulting in an increase in our pension plan benefit obligation of $2,189 and decreased our postretirement discount rate by 0.20%, resulting in an increase in our postretirement benefit obligation of $906. For the year ended December 31, 2015, we increased our pension discount rate by 0.30%, resulting in a decrease in our pension plan benefit obligation of $1,977 and increased our postretirement discount rate by 0.30%, resulting in a decrease in our postretirement benefit obligation of $854.
Our expected long-term rate of return on pension plan assets is 7.75% for 2017 and 2016. Our expected long-term rate of return on postretirement plan assets is 5.75% for 2017 and 2016. Our expected return on plan assets is calculated using the actual fair value of plan assets. If all other factors were to remain unchanged, we expect that a 0.50% decrease in the expected long-term rate of return would cause 2017 combined pension and postretirement cost to increase $230, which under our accounting policy would be adjusted to actual returns in the current year as part of our fourth-quarter remeasurement of our retiree benefit plans. In 2016, the actual return on our combined pension and postretirement plan assets was 7.5%, resulting in an actuarial gain of $59.
We recognize gains and losses on pension and postretirement plan assets and obligations immediately in our operating results. These gains and losses are generally measured annually as of December 31 and accordingly will normally be recorded during the fourth quarter, unless an earlier remeasurement is required. Should actual experience differ from actuarial assumptions, the projected pension benefit obligation and net pension cost and accumulated postretirement benefit obligation and postretirement benefit cost would be affected in future years. Note 12 also discusses the effects of certain changes in assumptions related to medical trend rates on retiree healthcare costs.
Depreciation Our depreciation of assets, including use of composite group depreciation and estimates of useful lives, is described in Notes 1 and 6. During 2016, we aligned the estimated useful lives and salvage values for certain network assets that are impacted by our IP strategy with our updated business cases and engineering studies. During 2014, we completed studies evaluating the periods over which we were utilizing our software assets, which resulted in our extending our estimated useful lives for certain capitalized software to five years to better reflect the estimated periods during which these assets will remain in service. Prior to 2014, all capitalized software costs were primarily amortized over a three-year period.
If all other factors were to remain unchanged, we expect that a one-year increase in the useful lives of our plant in service would have resulted in a decrease of approximately $3,273 in our 2016 depreciation expense and that a one-year decrease would have resulted in an increase of approximately $4,834 in our 2016 depreciation expense.
Asset Valuations and Impairments We record assets acquired in business combinations at fair value. For impairment testing, we estimate fair values using models that predominantly rely on the expected cash flows to be derived from the use of the asset. Goodwill, wireless licenses and orbital slots are significant assets on our consolidated balance sheets, where impairment testing is performed.
Goodwill and other indefinite lived intangible assets are not amortized but tested at least annually for impairment. We test goodwill on a reporting unit basis by comparing the estimated fair value of each reporting unit to its book value. If the fair value exceeds the book value, then no impairment is measured. We estimate fair values using an income approach (also known as a discounted cash flow) and a market multiple approach. The income approach utilizes our 10-year cash flow projections with a perpetuity value discounted at an appropriate weighted average cost of capital.
22
Management’s Discussion and Analysis of Financial Condition and Results of Operations (continued)
Dollars in millions except per share and per subscriber amounts
The market multiple approach uses the multiples of publicly traded companies whose services are comparable to those offered by the reporting units. In 2016, the calculated fair value of the reporting units exceeded book value in all circumstances, and no additional testing was necessary. In the event of a 10% drop in the fair values of the reporting units, the fair values would have still exceeded the book values of the reporting units.
We assess fair value for wireless licenses using a discounted cash flow model (the Greenfield Approach) and a corroborative market approach based on auction prices. The Greenfield Approach assumes a company initially owns only the wireless licenses and makes investments required to build an operation comparable to current use. Inputs to the model include subscriber growth, churn, revenue per user, capital investment and acquisition costs per subscriber, ongoing operating costs, and resulting EBITDA margins. We based our assumptions on a combination of average marketplace participant data and our historical results, trends and business plans. These licenses are tested annually for impairment on an aggregated basis, consistent with their use on a national scope for the United States and Mexico. For impairment testing, we assume subscriber and revenue growth will trend up to projected levels, with a long-term growth rate reflecting expected long-term inflation trends. We assume churn rates will initially exceed our current experience, but decline to rates that are in line with industry-leading churn. For the U.S. licenses, EBITDA margins are assumed to trend toward 37% annually. We used a discount rate of 8.50% for the United States and 11.0% for Mexico, based on the optimal long-term capital structure of a market participant and its associated cost of debt and equity, to calculate the present value of the projected cash flows. If either the projected rate of long-term growth of cash flows or revenues declined by 0.5%, or if the discount rate increased by 0.5%, the fair values of the wireless licenses would still be higher than the book value of the licenses. The fair value of the wireless licenses in the United States and Mexico each exceeded the book value by more than 10%.
Orbital slots are also valued using the Greenfield Approach. The projected cash flows are based on various factors, including satellite cost, other capital investment per subscriber, acquisition costs per subscriber and usage per subscriber, as well as revenue growth, subscriber growth and churn rates. For impairment testing purposes, we assumed sustainable long-term growth assumptions consistent with the business plan and industry counterparts in the United States. We used a discount rate of 10.50% to calculate the present value of the projected cash flows. If either the projected rate of long-term growth of cash flows or revenues declined by 0.5%, or if the discount rate increased by 0.5%, the fair values of the orbital slots would still be higher than the book value of the orbital slots. The fair value of the orbital slots exceeded the book value by more than 10%.
We review customer relationships and other finite-lived intangible assets for impairment whenever events or circumstances indicate that the carrying amount may not be recoverable over their remaining life. For this analysis, we compare the expected undiscounted future cash flows attributable to the asset to its book value.
We review our investments to determine whether market declines are temporary and accordingly reflected in accumulated other comprehensive income, or other-than-temporary and recorded as an expense in “Other income (expense) – net” in the consolidated statements of income. This evaluation is based on the length of time and the severity of decline in the investment’s value.
Income Taxes Our estimates of income taxes and the significant items giving rise to the deferred assets and liabilities are shown in Note 11 and reflect our assessment of actual future taxes to be paid on items reflected in the financial statements, giving consideration to both timing and probability of these estimates. Actual income taxes could vary from these estimates due to future changes in income tax law or the final review of our tax returns by federal, state or foreign tax authorities.
We use our judgment to determine whether it is more likely than not that we will sustain positions that we have taken on tax returns and, if so, the amount of benefit to initially recognize within our financial statements. We regularly review our uncertain tax positions and adjust our unrecognized tax benefits (UTBs) in light of changes in facts and circumstances, such as changes in tax law, interactions with taxing authorities and developments in case law. These adjustments to our UTBs may affect our income tax expense. Settlement of uncertain tax positions may require use of our cash.
New Accounting Standards
See Note 1 for a discussion of recently issued or adopted accounting standards.
23
Management’s Discussion and Analysis of Financial Condition and Results of Operations (continued)
Dollars in millions except per share and per subscriber amounts
OTHER BUSINESS MATTERS
Time Warner Inc. Acquisition On October 22, 2016, we entered into and announced a merger agreement (Merger Agreement) to acquire Time Warner Inc. (Time Warner) in a 50% cash and 50% stock transaction for $107.50 per share of Time Warner common stock, or approximately $85,400 at the date of the announcement (Merger). Combined with Time Warner’s net debt at September 30, 2016, the total transaction value is approximately $108,700. Each share of Time Warner common stock will be exchanged for $53.75 per share in cash and a number of shares of AT&T common stock equal to the exchange ratio. If the average stock price (as defined in the Merger Agreement) at the time of closing the Merger is between (or equal to) $37.411 and $41.349 per share, the exchange ratio will be the quotient of $53.75 divided by the average stock price. If the average stock price is greater than $41.349, the exchange ratio will be 1.300. If the average stock price is less than $37.411, the exchange ratio will be 1.437. Post-transaction, Time Warner shareholders will own between 14.4% and 15.7% of AT&T shares on a fully-diluted basis based on the number of AT&T shares outstanding. The cash portion of the purchase price will be financed with new debt and cash. See “Liquidity” for a discussion of our financing arrangements.
Time Warner is a global leader in media and entertainment whose major businesses encompass an array of some of the most respected and successful media brands. The deal combines Time Warner’s vast library of content and ability to create new premium content for audiences around the world with our extensive customer relationships and distribution; one of the world’s largest pay-TV subscriber bases; and leading scale in TV, mobile and broadband distribution.
The Merger Agreement was approved by Time Warner shareholders on February 15, 2017 and remains subject to review by the U.S. Department of Justice. While subject to change, we expect that Time Warner will not need to transfer any of its FCC licenses to AT&T in order to conduct its business operations after the closing of the transaction. It is also a condition to closing that necessary consents from certain foreign governmental entities must be obtained. The transaction is expected to close before year-end 2017. Under certain circumstances relating to a competing transaction, Time Warner may be required to pay a $1,725 termination fee to us in connection with or following a termination of the agreement. Under certain circumstances relating to the inability to obtain the necessary regulatory approvals, we may be required to pay Time Warner $500 following a termination of the agreement.
Litigation Challenging DIRECTV’s NFL SUNDAY TICKET More than two dozen putative class actions were filed in the U.S. District Courts for the Central District of California and the Southern District of New York against DIRECTV and the National Football League (NFL). These cases were brought by residential and commercial DIRECTV subscribers that have purchased NFL SUNDAY TICKET. The plaintiffs allege that (i) the 32 NFL teams have unlawfully agreed not to compete with each other in the market for nationally televised NFL football games and instead have “pooled” their broadcasts and assigned to the NFL the exclusive right to market them; and (ii) the NFL and DIRECTV have entered into an unlawful exclusive distribution agreement that allows DIRECTV to charge “supra-competitive” prices for the NFL SUNDAY TICKET package. The complaints seek unspecified treble damages and attorneys’ fees along with injunctive relief. The first complaint, Abrahamian v. National Football League, Inc., et al., was served in June 2015. In December 2015, the Judicial Panel on Multidistrict Litigation transferred the cases outside the Central District of California to that court for consolidation and management of pre-trial proceedings. In June 2016, the plaintiffs filed a consolidated amended complaint. We vigorously dispute the allegations the complaints have asserted. In August 2016, DIRECTV filed a motion to compel arbitration and the NFL defendants filed a motion to dismiss the complaint. A hearing on both motions is currently scheduled in February 2017.
SportsNet LA Litigation On November 2, 2016, the U.S. Department of Justice filed a civil antitrust complaint in federal court (Central District of California) against DIRECTV Group Holdings, LLC and AT&T Inc., as successor in interest to DIRECTV, alleging that DIRECTV, in 2014, unlawfully exchanged strategic information with certain competitors in connection with negotiations with SportsNet LA about carrying the Los Angeles Dodgers games. The complaint alleges that DIRECTV’s conduct violated Section 1 of the Sherman Act. The complaint seeks a declaration that DIRECTV’s conduct unlawfully restrained trade and seeks an injunction (1) barring DIRECTV and AT&T from engaging in unlawful information sharing in connection with future negotiations for video programming distribution, (2) requiring DIRECTV and AT&T to monitor relevant communications between their executives and competitors and to periodically report to the Department of Justice, and (3) requiring DIRECTV and AT&T to implement training and compliance programs. The complaint asks that the government be awarded its litigation costs. We vigorously dispute these allegations. On January 10, 2017, we filed a motion to dismiss the complaint. The motion remains pending.
24
Management’s Discussion and Analysis of Financial Condition and Results of Operations (continued)
Dollars in millions except per share and per subscriber amounts
Federal Trade Commission Litigation Involving DIRECTV In March 2015, the Federal Trade Commission (FTC) filed a civil suit in the U.S. District Court for the Northern District of California against DIRECTV seeking injunctive relief and unspecified money damages under Section 5 of the Federal Trade Commission Act and Section 4 of the Restore Online Shoppers’ Confidence Act. The FTC’s allegations concern DIRECTV’s advertising, marketing and sale of programming packages. The FTC alleges that DIRECTV did not adequately disclose all relevant terms. We are disputing these allegations vigorously. A trial on the matter is expected to begin in early 2017.
Unlimited Data Plan Claims In October 2014, the FTC filed a civil suit in the U.S. District Court for the Northern District of California against AT&T Mobility, LLC seeking injunctive relief and unspecified money damages under Section 5 of the Federal Trade Commission Act. The FTC’s allegations concern the application of AT&T’s Maximum Bit Rate (MBR) program to customers who enrolled in our Unlimited Data Plan from 2007-2010. MBR temporarily reduces in certain instances the download speeds of a small portion of our legacy Unlimited Data Plan customers each month after the customer exceeds a designated amount of data during the customer’s billing cycle. MBR is an industry-standard practice that is designed to affect only the most data-intensive applications (such as video streaming). Texts, emails, tweets, social media posts, internet browsing and many other applications are typically unaffected. Contrary to the FTC’s allegations, our MBR program is permitted by our customer contracts, was fully disclosed in advance to our Unlimited Data Plan customers, and was implemented to protect the network for the benefit of all customers. In March 2015, our motion to dismiss the litigation on the grounds that the FTC lacked jurisdiction to file suit was denied. In May 2015, the Court granted our motion to certify its decision for immediate appeal. The United States Court of Appeals for the Ninth Circuit subsequently granted our petition to accept the appeal, and on August 29, 2016, issued its decision reversing the district court and finding that the FTC lacked jurisdiction to proceed with the action. The FTC has asked the Court of Appeals to reconsider the decision but the Court has not ruled on that request. In addition to the FTC case, several class actions have been filed also challenging our MBR program. We vigorously dispute the allegations the complaints have asserted.
In June 2015, the FCC issued a Notice of Apparent Liability and Order (NAL) to AT&T Mobility, LLC concerning our MBR policy that applies to Unlimited Data Plan customers described above. The NAL alleges that we violated the FCC’s Open Internet Transparency Rule by using the term “unlimited” in connection with the offerings subject to the MBR policy and by failing adequately to disclose the speed reductions that apply once a customer reaches a specified data threshold. The NAL proposes a forfeiture penalty of $100, and further proposes to order us to correct any misleading and inaccurate statements about our unlimited plans, inform customers of the alleged violation, revise our disclosures to address the alleged violation and inform these customers that they may cancel their plans without penalty after reviewing the revised disclosures. In July 2015, we filed our response to the NAL. We believe that the NAL is unlawful and should be withdrawn, because we have fully complied with the Open Internet Transparency Rule and the FCC has no authority to impose the proposed remedies. The matter is currently pending before the FCC.
Labor Contracts As of January 31, 2017, we employed approximately 268,000 persons. Approximately 48% of our employees are represented by the Communications Workers of America, the International Brotherhood of Electrical Workers or other unions. Contracts covering approximately 20,000 mobility employees across the country and approximately 25,000 traditional wireline employees in our Southwest and Midwest regions have expired or will expire in 2017. Additionally, negotiations continue with approximately 15,000 traditional wireline employees in our West region where the contract expired in April 2016. Approximately 11,000 former DIRECTV employees were eligible for and chose union representation. Bargaining has resulted in approximately 70% of these employees now being covered under ratified contracts that expire between 2017 and 2020. After expiration of the current agreements, work stoppages or labor disruptions may occur in the absence of new contracts or other agreements being reached.
Environmental We are subject from time to time to judicial and administrative proceedings brought by various governmental authorities under federal, state or local environmental laws. We reference in our Forms 10-Q and 10-K certain environmental proceedings that could result in monetary sanctions (exclusive of interest and costs) of one hundred thousand dollars or more. However, we do not believe that any of those currently pending will have a material adverse effect on our results of operations.
LIQUIDITY AND CAPITAL RESOURCES
We had $5,788 in cash and cash equivalents available at December 31, 2016. Cash and cash equivalents included cash of $1,803 and money market funds and other cash equivalents of $3,985. Approximately $776 of our cash and cash equivalents resided in foreign jurisdictions, some of which are subject to restrictions on repatriation. Cash and cash equivalents increased $667 since December 31, 2015. In 2016, cash inflows were primarily provided by cash receipts from operations, including cash from our sale and transfer of certain wireless equipment installment receivables to third parties, and long-term debt
25
Management’s Discussion and Analysis of Financial Condition and Results of Operations (continued)
Dollars in millions except per share and per subscriber amounts
issuances. These inflows were offset by cash used to meet the needs of the business, including, but not limited to, payment of operating expenses, funding capital expenditures, debt repayments, dividends to stockholders, and the acquisition of wireless spectrum and other operations. We discuss many of these factors in detail below.
Cash Provided by or Used in Operating Activities
During 2016, cash provided by operating activities was $39,344 compared to $35,880 in 2015. Higher operating cash flows in 2016 were primarily due to our acquisition of DIRECTV and the timing of working capital payments.
During 2015, cash provided by operating activities was $35,880 compared to $31,338 in 2014. Higher operating cash flows in 2015 were primarily due to improved operating results, our acquisition of DIRECTV and working capital improvements.
Cash Used in or Provided by Investing Activities
During 2016, cash used in investing activities consisted primarily of $21,516 for capital expenditures, excluding interest during construction and $2,959 for the acquisition of wireless spectrum, Quickplay Media, Inc. and other operations. These expenditures were partially offset by net cash receipts of $646 from the disposition of various assets and $506 from the sale of securities.
The majority of our capital expenditures are spent on our wireless and wireline networks, our video services and related support systems. Capital expenditures, excluding interest during construction, increased $2,298 in 2016. The increase was primarily due to DIRECTV operations, fiber buildout, and wireless network expansion in Mexico. In connection with capital improvements, we have negotiated favorable payment terms (referred to as vendor financing). In 2016, vendor financing related to capital investments was $492. We do not report capital expenditures at the segment level.
We expect our 2017 capital expenditures to be in the $22,000 range, and we expect our capital expenditures to be in the 15% range of service revenues or lower for each of the years 2017 through 2019. The amount of capital expenditures is influenced by demand for services and products, capacity needs and network enhancements. Our capital spending also takes into account existing tax law and does not reflect anticipated tax reform. We are also focused on ensuring DIRECTV merger commitments are met. To that end, as of December 31, 2016, we have built out our fiber-to-the-premises network to 3.8 million customer locations of the 12.5 million locations we committed to reach by mid-2019.
Cash Used in or Provided by Financing Activities
We paid dividends of $11,797 in 2016, $10,200 in 2015, and $9,552 in 2014. The increases in 2016 and 2015 were primarily due to the increase in shares outstanding resulting from our acquisition of DIRECTV and the increase in the quarterly dividend approved by our Board of Directors in the fourth quarter of each year. In October 2016, our Board of Directors approved a 2.1% increase in the quarterly dividend from $0.48 to $0.49 per share. This follows a 2.1% dividend increase approved by our Board in December 2015. Dividends declared by our Board of Directors totaled $1.93 per share in 2016, $1.89 per share in 2015, and $1.85 per share in 2014. Our dividend policy considers the expectations and requirements of stockholders, capital funding requirements of AT&T and long-term growth opportunities. It is our intent to provide the financial flexibility to allow our Board of Directors to consider dividend growth and to recommend an increase in dividends to be paid in future periods. All dividends remain subject to declaration by our Board of Directors.
During 2016, we received net proceeds of $10,140 from the issuance of $10,013 in long-term debt in various markets, with an average weighted maturity of approximately 12 years and a weighted average coupon of 3.8%. Debt issued included:
|
·
|
February issuance of $1,250 of 2.800% global notes due 2021.
|
|
·
|
February issuance of $1,500 of 3.600% global notes due 2023.
|
|
·
|
February issuance of $1,750 of 4.125% global notes due 2026.
|
|
·
|
February issuance of $1,500 of 5.650% global notes due 2047.
|
|
·
|
May issuance of $750 of 2.300% global notes due 2019.
|
|
·
|
May issuance of $750 of 2.800% global notes due 2021.
|
|
·
|
May issuance of $1,100 of 3.600% global notes due 2023.
|
|
·
|
May issuance of $900 of 4.125% global notes due 2026.
|
|
·
|
May issuance of $500 of 4.800% global notes due 2044.
|
26
Management’s Discussion and Analysis of Financial Condition and Results of Operations (continued)
Dollars in millions except per share and per subscriber amounts
During 2016, we redeemed $10,823 in debt, primarily consisting of the following repayments:
|
·
|
February redemption of $1,250 of AT&T floating rate notes due 2016.
|
|
·
|
March prepayment of the remaining $1,000 outstanding under a $2,000 18-month credit agreement by and between AT&T and Mizuho.
|
|
·
|
May redemption of $1,750 of 2.950% global notes due 2016.
|
|
·
|
June prepayment of $5,000 of outstanding advances under our $9,155 Syndicated Credit Agreement (See “Credit Facilities” below).
|
|
·
|
August redemption of $1,500 of 2.400% global notes due 2016.
|
In March 2016, we completed a debt exchange in which $16,049 of DIRECTV notes with stated rates of 1.750% to 6.375% were tendered and accepted in exchange for $16,049 of new AT&T Inc. global notes with stated rates of 1.750% to 6.375% plus a $16 cash payment.
In September 2016, we completed a debt exchange in which $5,615 of notes of AT&T or one or more of its subsidiaries with stated rates of 5.350% to 8.250% were tendered and accepted in exchange for $4,500 of new AT&T Inc. global notes with a stated rate of 4.500% and $2,500 of new AT&T Inc. global notes with a stated rate of 4.550%.
In February 2017, aggregate bids exceeded the level required to clear Auction 1000. This auction, including the assignment phase, is expected to conclude in the first half of 2017. Our commitment to purchase 600 MHz spectrum licenses for which we submitted bids is expected to be more than satisfied by the deposits made to the FCC in the third quarter of 2016.
Our weighted average interest rate of our entire long-term debt portfolio, including the impact of derivatives, was approximately 4.2% at December 31, 2016 and 4.0% at December 31, 2015. We had $122,381 of total notes and debentures outstanding (see Note 9) at December 31, 2016, which included Euro, British pound sterling, Swiss franc, Brazilian real and Canadian dollar denominated debt of approximately $24,292.
On February 9, 2017, we completed the following long-term debt issuances:
|
·
|
$1,250 of 3.200% global notes due 2022.
|
|
·
|
$750 of 3.800% global notes due 2024.
|
|
·
|
$2,000 of 4.250% global notes due 2027.
|
|
·
|
$3,000 of 5.250% global notes due 2037.
|
|
·
|
$2,000 of 5.450% global notes due 2047.
|
|
·
|
$1,000 of 5.700% global notes due 2057.
|
At December 31, 2016, we had $9,832 of debt maturing within one year, substantially all of which was related to long-term debt issuances. Debt maturing within one year includes the following notes that may be put back to us by the holders:
|
·
|
$1,000 of annual put reset securities issued by BellSouth Corporation that may be put back to us each April until maturity in 2021.
|
|
·
|
An accreting zero-coupon note that may be redeemed each May until maturity in 2022. If the zero-coupon note (issued for principal of $500 in 2007) is held to maturity, the redemption amount will be $1,030.
|
Our Board of Directors has approved repurchase authorizations of 300 million shares each in 2013 and 2014 (see Note 14). For the year ended December 31, 2015, we repurchased approximately eight million shares totaling $269 under these authorizations and for the year ended December 31, 2016, we repurchased approximately 11 million shares totaling $444 under these authorizations. At December 31, 2016, we had approximately 396 million shares remaining from the 2013 and 2014 authorizations.
Excluding the impact of acquisitions or anticipated tax reform, the emphasis of our 2017 financing activities will be the issuance of debt and the payment of dividends, subject to approval by our Board of Directors, and the repayment of debt. We plan to fund our financing uses of cash through a combination of cash from operations, debt issuances and asset sales. We have obtained bridge loan and term loan financing to be used upon closing of our acquisition of Time Warner. The timing and mix of debt issuance will be guided by credit market conditions and interest rate trends.
27
Management’s Discussion and Analysis of Financial Condition and Results of Operations (continued)
Dollars in millions except per share and per subscriber amounts
Credit Facilities
The following is a summary of certain terms of our various credit and loan agreements and does not purport to be complete and is qualified in its entirety by reference to each agreement filed as exhibits to our Annual Report on Form 10-K.
General
In December 2015, we entered into a five-year, $12,000 revolving credit agreement (the “Revolving Credit Agreement”) with certain banks. As of December 31, 2016, we have no amounts outstanding under this agreement.
In January 2015, we entered into a $9,155 credit agreement (the “Syndicated Credit Agreement”) containing (i) a $6,286 term loan (“Loan A”) and (ii) a $2,869 term loan (“Loan B”), with certain banks. In March 2015, we borrowed all amounts available under the agreement. Loan A will be due on March 2, 2018. Amounts borrowed under Loan B will be subject to amortization from March 2, 2018, with 25% of the aggregate principal amount thereof being payable prior to March 2, 2020, and all remaining principal amount due on March 2, 2020. In June 2016, we repaid $4,000 of the outstanding amount under Loan A and $1,000 of the outstanding amount under Loan B. After repayment, the amortization in Loan B has been satisfied. As of December 31, 2016, we have $2,286 outstanding under Loan A and $1,869 outstanding under Loan B.
On October 22, 2016, in connection with entering into the Time Warner merger agreement, AT&T entered into a $40,000 bridge loan with JPMorgan Chase Bank and Bank of America, as lenders (the “Bridge Loan”).
On November 15, 2016, we entered into a $10,000 term loan credit agreement (the “Term Loan”) with a syndicate of 20 lenders. In connection with this Term Loan, the “Tranche B Commitments” totaling $10,000 under the Bridge Loan were reduced to zero. The “Tranche A Commitments” under the Bridge Loan totaling $30,000 remain in effect.
No amounts will be borrowed under either the Bridge Loan or the Term Loan prior to the closing of the Time Warner merger. Borrowings under either agreement will be used solely to finance a portion of the cash to be paid in the Merger, the refinancing of debt of Time Warner and its subsidiaries and the payment of related expenses. Prior to the closing date of the Merger, only a payment or bankruptcy event of default would permit the lenders to terminate their commitments under either the Bridge Loan or the Term Loan.
Each of our credit and loan agreements contains covenants that are customary for an issuer with an investment grade senior debt credit rating, as well as a net debt-to-EBITDA (earnings before interest, taxes, depreciation and amortization, and other modifications described in each agreement) financial ratio covenant requiring AT&T to maintain, as of the last day of each fiscal quarter, a ratio of not more than 3.5-to-1. The events of default are customary for agreements of this type and such events would result in the acceleration of, or would permit the lenders to accelerate, as applicable, required payments and would increase each agreement’s relevant Applicable Margin by 2.00% per annum.
Revolving Credit Agreement
The obligations of the lenders to advance funds under the Revolving Credit Agreement will end on December 11, 2020, unless prior to that date either: (i) AT&T reduces to $0 the commitments of the lenders, or (ii) certain events of default occur. We and lenders representing more than 50% of the facility amount may agree to extend their commitments for two one-year periods beyond the December 11, 2020 end date, under certain circumstances.
Advances under this agreement would bear interest, at AT&T’s option, either:
|
·
|
at a variable annual rate equal to (1) the highest of: (a) the base rate of the bank affiliate of Citibank, N.A., (b) 0.50% per annum above the Federal funds rate, and (c) the London Interbank Offered Rate (LIBOR) applicable to U.S. dollars for a period of one month plus 1.00% per annum, plus (2) an applicable margin (as set forth in this agreement); or
|
|
·
|
at a rate equal to: (i) LIBOR for a period of one, two, three or six months, as applicable, plus (ii) an applicable margin (as set forth in this agreement).
|
The Syndicated Credit Agreement
Advances bear interest at a rate equal to: (i) the LIBOR for deposits in dollars (adjusted upwards to reflect any bank reserve costs) for a period of three or six months, as applicable, plus (ii) the applicable margin, as set forth in this agreement. The applicable margin under Loan A equals 1.000%, 1.125% or 1.250% per annum depending on AT&T’s credit ratings. The applicable margin under Loan B equals 1.125%, 1.250% or 1.375% per annum, depending on AT&T’s credit ratings.
28
Management’s Discussion and Analysis of Financial Condition and Results of Operations (continued)
Dollars in millions except per share and per subscriber amounts
Bridge Loan
The obligations of the lenders under the Bridge Loan to provide advances will terminate on the earliest of (i) October 23, 2017, subject to extension in certain cases to April 23, 2018, (ii) the closing of the Time Warner merger without the borrowing of advances under the Bridge Loan and (iii) the termination of the Merger Agreement.
Advances would bear interest, at AT&T’s option, either:
|
·
|
at a variable annual rate equal to: (1) the highest of (a) the prime rate of JPMorgan Chase Bank, (b) 0.5% per annum above the federal funds rate, and (c) the LIBOR applicable to dollars for a period of one month plus 1.00%, plus (2) an applicable margin, as set forth in this agreement (the “Applicable Margin for Base Advances (Bridge Loan)”); or
|
|
·
|
at a rate equal to: (i) LIBOR (adjusted upwards to reflect any bank reserve costs) for a period of one, two, three or six months, as applicable, plus (ii) an applicable margin, as set forth in this agreement (the “Applicable Margin for Eurodollar Rate Advances (Bridge Loan)”).
|
The Applicable Margin for Eurodollar Rate Advances (Bridge Loan) will be equal to 0.750%, 1.000%, 1.125%, 1.250% or 1.500% per annum depending on AT&T’s credit ratings. The Applicable Margin for Base Advances (Bridge Loan) will be equal to the greater of (x) 0.00% and (y) the relevant Applicable Margin for Eurodollar Rate Advances (Bridge Loan) minus 1.00% per annum, depending on AT&T’s credit ratings.
The Applicable Margin for Eurodollar Rate Advances (Bridge Loan) and the Applicable Margin for Base Advances (Bridge Loan) are scheduled to increase by an additional 0.25% on the 90th day after the closing of the Merger and another 0.25% every 90 days thereafter.
AT&T pays a commitment fee of 0.070%, 0.090%, 0.100%, 0.125% or 0.175% of the commitment amount per annum, depending on AT&T’s credit ratings.
We also must pay an additional fee of 0.500%, 0.750% and 1.000% on the amount of advances outstanding as of the 90th, 180th and 270th day after advances are made.
The Bridge Loan requires that the commitments of the lenders be reduced and outstanding advances be repaid with the net cash proceeds if we incur certain additional debt, we issue certain additional stock or we have certain sales or dispositions of assets by AT&T or its subsidiaries, in each case subject to exceptions set forth in the Bridge Loan.
Advances under the Bridge Loan are conditioned on the absence of a material adverse effect on Time Warner and certain customary conditions and repayment of all advances must be made no later than 364 days after the date on which the advances are made.
Term Loan
Under the Term Loan, there are two tranches of commitments, each in a total amount of $5,000.
The obligations of the lenders under the Term Loan to provide advances will terminate on the earliest of (i) October 23, 2017, subject to extension in certain cases to April 23, 2018, (ii) the closing of the Time Warner merger without the borrowing of advances under the Term Loan and (iii) the termination of the Merger Agreement.
Advances would bear interest, at AT&T’s option, either:
|
·
|
at a variable annual rate equal to: (1) the highest of (a) the prime rate of JPMorgan Chase Bank, N.A., (b) 0.5% per annum above the federal funds rate, and (c) the LIBOR rate applicable to dollars for a period of one month plus 1.00%, plus (2) an applicable margin, as set forth in the Term Loan (the “Applicable Margin for Base Advances (Term Loan)”); or
|
|
·
|
at a rate equal to: (i) LIBOR (adjusted upwards to reflect any bank reserve costs) for a period of one, two, three or six months, as applicable, plus (ii) an applicable margin, as set forth in the Term Loan (the “Applicable Margin for Eurodollar Rate Advances (Term Loan)”).
|
The Applicable Margin for Eurodollar Rate Advances (Term Loan) under Tranche A is equal to 1.000%, 1.125% or 1.250% per annum, depending on AT&T’s credit ratings. The Applicable Margin for Eurodollar Rate Advances (Term Loan) under Tranche B is equal to 1.125%, 1.250% or 1.375% per annum, depending on AT&T’s credit ratings. The Applicable Margin for Base Advances (Term Loan) is equal to the greater of (x) 0.00% and (y) the relevant Applicable Margin for Eurodollar Rate Advances (Term Loan) minus 1.00% per annum, depending on AT&T’s credit ratings.
29
Management’s Discussion and Analysis of Financial Condition and Results of Operations (continued)
Dollars in millions except per share and per subscriber amounts
AT&T pays a commitment fee of 0.090%, 0.100%, or 0.125% of the commitment amount per annum, depending on AT&T’s credit ratings.
Advances under the Term Loan are conditioned on the absence of a material adverse effect on Time Warner and certain customary conditions.
Repayment of all advances with respect to Tranche A must be made no later than two years and six months after the date on which such advances are made. Amounts borrowed under Tranche B will be subject to amortization commencing two years and nine months after the date on which such advances are made, with 25% of the aggregate principal amount thereof being payable prior to the date that is four years and six months after the date on which such advances are made, and all remaining principal amount due and payable on the date that is four years and six months after the date on which such advances are made.
Collateral Arrangements
During 2016, we posted $1,022 of additional cash collateral, on a net basis, to banks and other participants in our derivative arrangements. Cash postings under these arrangements vary with changes in credit ratings and netting agreements. (See Note 10)
Other
Our total capital consists of debt (long-term debt and debt maturing within one year) and stockholders’ equity. Our capital structure does not include debt issued by our equity method investments. At December 31, 2016, our debt ratio was 49.9%, compared to 50.5% at December 31, 2015, and 47.5% at December 31, 2014. The debt ratio is affected by the same factors that affect total capital, and reflects the debt issued in 2016 and our repurchases of outstanding shares of AT&T common stock, and debt redemptions during 2016. Total capital decreased $2,168 in 2016 compared to an increase of $77,687 in 2015. The 2016 capital decrease was primarily due to a decrease in debt balances, partially offset by an increase in retained earnings.
A significant amount of our cash outflows is related to tax items and benefits paid for current and former employees. Total taxes incurred, collected and remitted by AT&T during 2016, 2015, and 2014 were $25,099, $21,501 and $20,870. These taxes include income, franchise, property, sales, excise, payroll, gross receipts and various other taxes and fees. Total health and welfare benefits provided to certain active and retired employees and their dependents totaled $4,753 in 2016, with $1,156 paid from plan assets. Of those benefits, $4,407 related to medical and prescription drug benefits. In addition, in December 2016, we prefunded $400 for future benefit payments. During 2016, we paid $3,614 of pension benefits out of plan assets.
During 2016, we also received approximately $5,281 from monetization of various assets, compared to $4,534 in 2015, primarily from our sales of certain equipment installment receivables and real estate holdings. We plan to continue to explore monetization opportunities in 2017.
In September 2013, we made a voluntary contribution of a preferred equity interest in AT&T Mobility II LLC (Mobility), the holding company for our wireless business, to the trust used to pay pension benefits under our qualified pension plans. In 2014, the U.S. Department of Labor published in the Federal Register their final retroactive approval of our voluntary contribution.
The preferred equity interest had a fair value of $8,477 at December 31, 2016 and $9,104 on the contribution date and has a liquidation value of $8,000. The trust is entitled to receive cumulative cash distributions of $560 per annum, which are distributed quarterly in equal amounts and accounted for as contributions. We distributed $560 to the trust during 2016. So long as we make the distributions, we will have no limitations on our ability to declare a dividend or repurchase shares. This preferred equity interest is a plan asset under ERISA and is recognized as such in the plan’s separate financial statements. However, because the preferred equity interest is not unconditionally transferable to an unrelated party, it is not reflected in plan assets in our consolidated financial statements and instead has been eliminated in consolidation. We also agreed to make a cash contribution to the trust of $175 no later than the due date of our federal income tax return for 2014, 2015 and 2016. During 2016, we completed our obligation, which included an acceleration of the final contribution.
The preferred equity interest is not transferable by the trust except through its put and call features. After a period of five years from the contribution or, if earlier, the date upon which the pension plan trust is fully funded as determined under GAAP, AT&T has a right to purchase from the pension plan trust some or all the preferred equity interest at the greater of their fair market value or minimum liquidation value plus any unpaid cumulative dividends. In addition, AT&T will have the
30
Management’s Discussion and Analysis of Financial Condition and Results of Operations (continued)
Dollars in millions except per share and per subscriber amounts
right to purchase the preferred equity interest in the event AT&T’s ownership of Mobility is less than 50% or there is a transaction that results in the transfer of 50% or more of the pension plan trust’s assets to an entity not under common control with AT&T (collectively, a change of control). The pension plan trust has the right to require AT&T to purchase the preferred equity interest at the greater of their fair market value or minimum liquidation value plus any unpaid cumulative dividends, and in installments, as specified in the contribution agreement upon the occurrence of any of the following: (1) at any time if the ratio of debt to total capitalization of Mobility exceeds that of AT&T, (2) the date on which AT&T is rated below investment grade for two consecutive calendar quarters, (3) upon a change of control if AT&T does not exercise its purchase option, or (4) at any time after a seven-year period from the contribution date. In the event AT&T elects or is required to purchase the preferred equity interest, AT&T may elect to settle the purchase price in cash or shares of AT&T common stock or a combination thereof.
CONTRACTUAL OBLIGATIONS, COMMITMENTS AND CONTINGENCIES
Our contractual obligations as of December 31, 2016 are in the following table:
|
Payments Due By Period
|
||||||||||||||||||||
|
Total
|
Less than
1 Year
|
1-3
Years
|
3-5
Years
|
More than
5 Years
|
||||||||||||||||
|
Contractual Obligations
|
||||||||||||||||||||
|
Long-term debt obligations1
|
$
|
130,280
|
$
|
9,609
|
$
|
16,953
|
$
|
17,793
|
$
|
85,925
|
||||||||||
|
Interest payments on long-term debt
|
82,249
|
5,440
|
10,065
|
8,891
|
57,853
|
|||||||||||||||
|
Finance obligations2
|
3,341
|
239
|
492
|
512
|
2,098
|
|||||||||||||||
|
Operating lease obligations3
|
29,657
|
3,915
|
7,154
|
6,019
|
12,569
|
|||||||||||||||
|
Unrecognized tax benefits4
|
4,484
|
984
|
-
|
-
|
3,500
|
|||||||||||||||
|
Purchase obligations5
|
35,436
|
9,181
|
11,214
|
7,799
|
7,242
|
|||||||||||||||
|
Total Contractual Obligations
|
$
|
285,447
|
$
|
29,368
|
$
|
45,878
|
$
|
41,014
|
$
|
169,187
|
||||||||||
|
1 Represents principal or payoff amounts of notes and debentures at maturity or, for putable debt, the next put opportunity (see Note 9).
|
||||||||||||||||||||
|
2 Represents future minimum payments under the Crown Castle and other arrangements (see Note 16).
|
||||||||||||||||||||
|
3 Represents operating lease payments (see Note 6).
|
||||||||||||||||||||
|
4 The noncurrent portion of the UTBs is included in the “More than 5 Years” column, as we cannot reasonably estimate the timing or amounts of additional cash payments, if any, at this time (see Note 11).
|
||||||||||||||||||||
|
5 The purchase obligations will be funded with cash provided by operations or through incremental borrowings. The minimum commitment for certain obligations is based on termination penalties that could be paid to exit the contracts. If we elect to exit these contracts, termination fees for all such contracts in the year of termination could be approximately $1,043 in 2017, $1,091 in the aggregate for 2018 and 2019, $404 in the aggregate for 2020 and 2021, and $161 in the aggregate thereafter. Certain termination fees are excluded from the above table, as the fees would not be paid every year and the timing of such payments, if any, is uncertain.
|
||||||||||||||||||||
Certain items were excluded from this table, as the year of payment is unknown and could not be reliably estimated since past trends were not deemed to be an indicator of future payment, because the settlement of the obligation will not require the use of cash, or because the items are immaterial. These items include: deferred income taxes of $60,128 (see Note 11); postemployment benefit obligations of $33,578, contributions associated with our voluntary contribution of the Mobility preferred equity interest, and expected pension and postretirement payments (see Note 12); other noncurrent liabilities of $21,748; third-party debt guarantees; fair value of our interest rate swaps; capital lease obligations; and vendor financing.
MARKET RISK
We are exposed to market risks primarily from changes in interest rates and foreign currency exchange rates. These risks, along with other business risks, impact our cost of capital. It is our policy to manage our debt structure and foreign exchange exposure in order to manage capital costs, control financial risks and maintain financial flexibility over the long term. In managing market risks, we employ derivatives according to documented policies and procedures, including interest rate swaps, interest rate locks, foreign currency exchange contracts and combined interest rate foreign currency contracts (cross-currency swaps). We do not use derivatives for trading or speculative purposes. We do not foresee significant changes in the strategies we use to manage market risk in the near future.
Interest Rate Risk
The majority of our financial instruments are medium- and long-term fixed-rate notes and debentures. Changes in interest rates can lead to significant fluctuations in the fair value of these instruments. The principal amounts by expected maturity,
31
Management’s Discussion and Analysis of Financial Condition and Results of Operations (continued)
Dollars in millions except per share and per subscriber amounts
average interest rate and fair value of our liabilities that are exposed to interest rate risk are described in Notes 9 and 10. In managing interest expense, we control our mix of fixed and floating rate debt, principally through the use of interest rate swaps. We have established interest rate risk limits that we closely monitor by measuring interest rate sensitivities in our debt and interest rate derivatives portfolios.
Most of our foreign-denominated long-term debt has been swapped from fixed-rate or floating-rate foreign currencies to fixed-rate U.S. dollars at issuance through cross-currency swaps, removing interest rate risk and foreign currency exchange risk associated with the underlying interest and principal payments. Likewise, periodically we enter into interest rate locks to partially hedge the risk of increases in the benchmark interest rate during the period leading up to the probable issuance of fixed-rate debt. We expect gains or losses in our cross-currency swaps and interest rate locks to offset the losses and gains in the financial instruments they hedge.
Following are our interest rate derivatives subject to material interest rate risk as of December 31, 2016. The interest rates illustrated below refer to the average rates we expect to pay based on current and implied forward rates and the average rates we expect to receive based on derivative contracts. The notional amount is the principal amount of the debt subject to the interest rate swap contracts. The fair value asset (liability) represents the amount we would receive (pay) if we had exited the contracts as of December 31, 2016.
|
Maturity
|
||||||||||||||||||||||||
|
Fair Value
|
||||||||||||||||||||||||
|
2017
|
2018
|
2019
|
2020
|
2021
|
Thereafter
|
Total
|
12/31/16
|
|||||||||||||||||
|
Interest Rate Derivatives
|
||||||||||||||||||||||||
|
Interest Rate Swaps:
|
||||||||||||||||||||||||
|
Receive Fixed/Pay
|
||||||||||||||||||||||||
|
Variable Notional
|
||||||||||||||||||||||||
|
Amount Maturing
|
$
|
700
|
$
|
4,100
|
$
|
4,100
|
$
|
-
|
$
|
750
|
$
|
-
|
$
|
9,650
|
$
|
65
|
||||||||
|
Weighted-Average
|
||||||||||||||||||||||||
|
Variable Rate Payable1
|
3.5%
|
4.0%
|
4.6%
|
4.9%
|
5.0%
|
-
|
||||||||||||||||||
|
Weighted-Average
|
||||||||||||||||||||||||
|
Fixed Rate Receivable
|
4.1%
|
4.0%
|
4.3%
|
4.5%
|
4.5%
|
-
|
||||||||||||||||||
|
1 Interest payable based on current and implied forward rates for One, Three, or Six Month LIBOR plus a spread ranging between approximately 14 and 425 basis points.
|
||||||||||||||||||||||||
Foreign Exchange Risk
We are exposed to foreign currency exchange risk through our foreign affiliates and equity investments in foreign companies. We do not hedge foreign currency translation risk in the net assets and income we report from these sources. However, we do hedge a portion of the exchange risk involved in anticipation of highly probable foreign currency-denominated transactions and cash flow streams, such as those related to issuing foreign-denominated debt, receiving dividends from foreign investments, and other receipts and disbursements.
Through cross-currency swaps, most of our foreign-denominated debt has been swapped from fixed-rate or floating-rate foreign currencies to fixed-rate U.S. dollars at issuance, removing interest rate and foreign currency exchange risk associated with the underlying interest and principal payments. We expect gains or losses in our cross-currency swaps to offset the gains and losses in the financial instruments they hedge.
In anticipation of other foreign currency-denominated transactions, we often enter into foreign exchange forward contracts to provide currency at a fixed rate. Our policy is to measure the risk of adverse currency fluctuations by calculating the potential dollar losses resulting from changes in exchange rates that have a reasonable probability of occurring. We cover the exposure that results from changes that exceed acceptable amounts.
For the purpose of assessing specific risks, we use a sensitivity analysis to determine the effects that market risk exposures may have on the fair value of our financial instruments and results of operations. To perform the sensitivity analysis, we assess the risk of loss in fair values from the effect of a hypothetical 10% fluctuation of the U.S. dollar against foreign currencies from the prevailing foreign currency exchange rates, assuming no change in interest rates. We had no foreign exchange forward contracts outstanding at December 31, 2016.
32
Management’s Discussion and Analysis of Financial Condition and Results of Operations (continued)
Dollars in millions except per share and per subscriber amounts
STOCK PERFORMANCE GRAPH
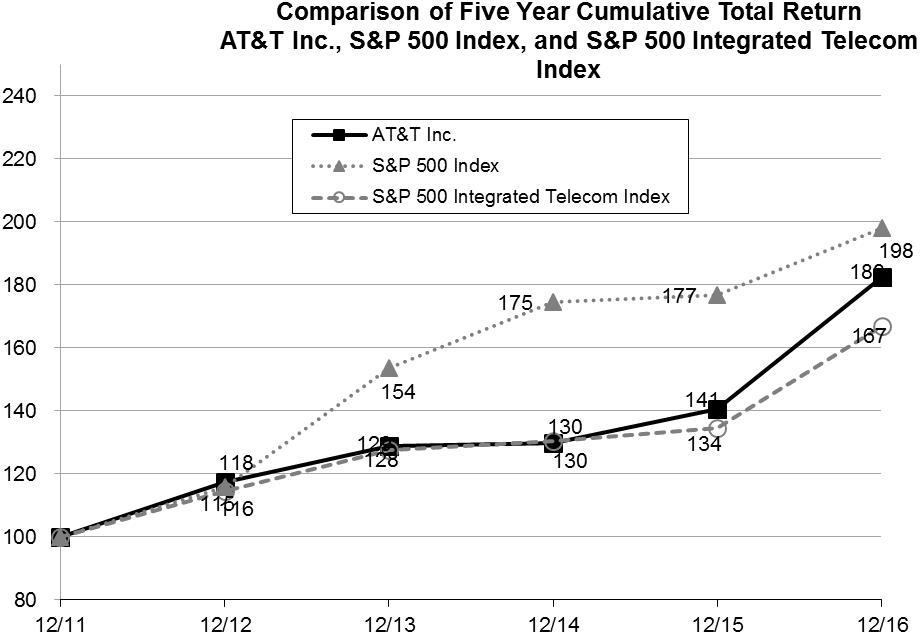
The comparison above assumes $100 invested on December 31, 2011, in AT&T common stock, Standard & Poor’s 500 Index (S&P 500), and Standard & Poor’s 500 Integrated Telecom Index (S&P 500 Integrated Telecom). Total return equals stock price appreciation plus reinvestment of dividends.
33
Management’s Discussion and Analysis of Financial Condition and Results of Operations (continued)
Dollars in millions except per share and per subscriber amounts
RISK FACTORS
In addition to the other information set forth in this document, including the matters contained under the caption “Cautionary Language Concerning Forward-Looking Statements,” you should carefully read the matters described below. We believe that each of these matters could materially affect our business. We recognize that most of these factors are beyond our ability to control and therefore we cannot predict an outcome. Accordingly, we have organized them by first addressing general factors, then industry factors and, finally, items specifically applicable to us.
The current U.S. economy has changed our customers’ buying habits and a failure to adequately respond could materially adversely affect our business.
We provide services and products predominantly to consumers and large and small businesses in the United States. We also provide services to larger businesses throughout the world. The slow economic recovery in the United States continues to pressure some of our customers’ demand for and ability to pay for existing services, especially wired and video services, and their interest in purchasing new services. Customers have changed their buying habits in response to both ongoing economic conditions and technological advances. We have responded by offering more bundled offerings and we are likely to experience greater pressure on pricing and margins as we continue to compete for customers who have less discretionary income.
U.S. corporate tax reform and changes in Federal regulatory trends should lead to improvements in the U.S. economy which would benefit our business and consumer customers.
In recent years, the U.S. economy has suffered from a lack of capital investment. High Federal corporate tax rates and a restrictive regulatory environment have significantly impeded the ability of businesses to invest. Following the 2016 Federal election, the U.S. Congressional leadership has indicated that passing legislation to lower these tax rates is now a priority. Similarly, the new FCC has indicated a priority to eliminating outdated and ineffective regulatory burdens, including those that create disincentives to invest in broadband services. Both tax and regulatory reform are expected to result in higher investment and increased demand for employment with wage improvement. As a provider of advanced business services and integrated consumer entertainment and broadband offerings, we would be well positioned to take advantage of these economic improvements.
Adverse changes in medical costs and the U.S. securities markets and continued low interest rates could materially increase our benefit plan costs.
Our costs to provide current benefits and funding for future benefits are subject to increases, primarily due to continuing increases in medical and prescription drug costs, and can be affected by lower returns on funds held by our pension and other benefit plans, which are reflected in our financial statements for that year. Investment returns on these funds depend largely on trends in the U.S. securities markets and the U.S. economy. We have experienced historically low interest rates during the last several years. While annual market returns and increased volatility have pressured asset returns in the short-term, we expect long-term market returns to stabilize. During 2016, overall bond rates decreased slightly, which results in higher benefit obligations. Conversely, an increase in overall bond rates will result in lower benefit obligations. In calculating the costs included on our financial statements of providing benefits under our plans, we have made certain assumptions regarding future investment returns, medical costs and interest rates. While we have made some changes to the benefit plans to limit our risk from increasing medical costs, if actual investment returns, medical costs and interest rates are worse than those previously assumed, our costs will increase.
The Financial Accounting Standards Board requires companies to recognize the funded status of defined benefit pension and postretirement plans as an asset or liability in our statement of financial position and to recognize changes in that funded status in the year in which the changes occur. We have elected to reflect the annual adjustments to the funded status in our consolidated statement of income. Therefore, an increase in our costs or adverse market conditions will have a negative effect on our operating results.
34
Management’s Discussion and Analysis of Financial Condition and Results of Operations (continued)
Dollars in millions except per share and per subscriber amounts
Adverse changes in global financial markets could limit our ability and our larger customers’ ability to access capital or increase the cost of capital needed to fund business operations.
While the global financial markets were generally stable during 2016, a continuing uncertainty surrounding global growth rates has resulted in increasing volatility in the credit, currency, equity and fixed income markets. Uncertainty regarding future U.S. trade policy and political developments in Europe could significantly affect global financial markets in 2017. Volatility in other areas, such as in emerging markets, may affect companies’ access to the credit markets, leading to higher borrowing costs for companies or, in some cases, the inability of these companies to fund their ongoing operations. In addition, we contract with large financial institutions to support our own treasury operations, including contracts to hedge our exposure on interest rates and foreign exchange and the funding of credit lines and other short-term debt obligations, including commercial paper. These financial institutions also face stricter capital-related and other regulations in the United States and Europe, as well as ongoing legal and financial issues concerning their loan portfolios, which may hamper their ability to provide credit or raise the cost of providing such credit. A company’s cost of borrowing is also affected by evaluations given by various credit rating agencies and these agencies have been applying tighter credit standards when evaluating a company’s debt levels and future growth prospects. While we have been successful in continuing to access the credit and fixed income markets when needed, adverse changes in the financial markets could render us either unable to access these markets or able to access these markets only at higher interest costs and with restrictive financial or other conditions, severely affecting our business operations.
Changes in available technology could increase competition and our capital costs.
The communications and digital entertainment industry has experienced rapid changes in the past several years. The development of wireless, cable and IP technologies has significantly increased the commercial viability of alternatives to traditional wired service and enhanced the capabilities of wireless networks. In addition, our customers continue to increase demand for services that can be accessed on mobile devices, especially video services. While our customers can use their traditional video subscription to access mobile programming, an increasing number of customers are also using mobile devices as the primary means of viewing video and an increasing number of non-traditional video providers are developing content and technologies to satisfy that demand. In order to remain competitive, we now offer a mobile TV service and continue to deploy sophisticated wired and wireless networks, including satellites, as well as research other new technologies. If the new technologies we have adopted or on which we have focused our research efforts fail to be cost-effective and accepted by customers, our ability to remain competitive could be materially adversely affected.
Changes to federal, state and foreign government regulations and decisions in regulatory proceedings could further increase our operating costs and/or alter customer perceptions of our operations, which could materially adversely affect us.
Our subsidiaries providing wired services are subject to significant federal and state regulation while many of our competitors are not. In addition, our subsidiaries and affiliates operating outside the United States are also subject to the jurisdiction of national and supranational regulatory authorities in the market where service is provided. Our wireless and satellite video subsidiaries are regulated to varying degrees by the FCC and some state and local agencies. Adverse regulations and rulings by the FCC relating to broadband and satellite video issues could impede our ability to manage our networks and recover costs and lessen incentives to invest in our networks. The development of new technologies, such as IP-based services, also has created or potentially could create conflicting regulation between the FCC and various state and local authorities, which may involve lengthy litigation to resolve and may result in outcomes unfavorable to us. In addition, increased public focus on a variety of issues related to our operations, such as privacy issues, government requests or orders for customer data, and potential global climate changes, have led to proposals at state, federal and foreign government levels to change or increase regulation on our operations. Should customers decide that our competitors operate in a more customer-friendly environment, we could be materially adversely affected.
35
Management’s Discussion and Analysis of Financial Condition and Results of Operations (continued)
Dollars in millions except per share and per subscriber amounts
Continuing growth in and the converging nature of wireless and broadband services will require us to deploy increasing amounts of capital and require ongoing access to spectrum in order to provide attractive services to customers.
Wireless and broadband services are undergoing rapid and significant technological changes and a dramatic increase in usage, in particular, the demand for faster and seamless usage of video and data across mobile and fixed devices. We must continually invest in our wireless and wireline networks in order to improve our wireless and broadband services to meet this increasing demand and remain competitive. Improvements in these services depend on many factors, including continued access to and deployment of adequate spectrum and the capital needed to expand our wireline network to support transport of these services. In order to stem broadband subscriber losses to cable competitors in our non-fiber wireline areas, we have been expanding our all-fiber wireline network. We must maintain and expand our network capacity and coverage for transport of video, data and voice between cell and fixed landline sites. To this end, we have participated in spectrum auctions, at increasing financial cost, and continue to deploy technology advancements in order to further improve our network.
Network service enhancements and product launches may not occur as scheduled or at the cost expected due to many factors, including delays in determining equipment and wireless handset operating standards, supplier delays, increases in network equipment and handset component costs, regulatory permitting delays for tower sites or enhancements, or labor-related delays. Deployment of new technology also may adversely affect the performance of the network for existing services. If we cannot acquire needed spectrum or deploy the services customers desire on a timely basis and at adequate cost, then our ability to attract and retain customers, and therefore maintain and improve our operating margins, could be materially adversely affected.
Increasing competition for wireless customers could materially adversely affect our operating results.
We have multiple wireless competitors in each of our service areas and compete for customers based principally on service/device offerings, price, network quality, coverage area and customer service. In addition, we are facing growing competition from providers offering services using advanced wireless technologies and IP-based networks as well as traditional wireline networks. We expect market saturation to continue to cause the wireless industry’s customer growth rate to moderate in comparison with historical growth rates, leading to increased competition for customers. We also expect that our customers’ growing demand for high-speed video and data services will place constraints on our network capacity. This competition and our capacity issues will continue to put pressure on pricing and margins as companies compete for potential customers. Our ability to respond will depend, among other things, on continued improvement in network quality and customer service as well as effective marketing of attractive products and services. These efforts will involve significant expenses and require strategic management decisions on, and timely implementation of, equipment choices, network deployment, and service offerings.
Increasing costs to provide services could adversely affect operating margins.
Our operating costs, including customer acquisition and retention costs, could continue to put pressure on margins and customer retention levels. In addition, virtually all our video programming is provided by other companies and historically the rates they charge us for programming have often increased more than the rate of inflation. As an offsetting factor, we have announced an agreement to acquire Time Warner Inc., a global leader in media and entertainment content. We also are attempting to use our increased scale and access to wireless customers to change this trend but such negotiations are difficult and also may result in programming disruption. If we are unable to restrain these costs or provide programming desired by our customers, it could impact margins and our ability to attract and retain customers.
A number of our competitors offering comparable legacy services that rely on alternative technologies and business models are typically subject to less (or no) regulation, and therefore are able to operate with lower costs. In addition, these competitors generally can focus on discrete customer segments since they do not have regulatory obligations to provide universal service. These competitors also have cost advantages compared to us, due in part to operating on newer, more technically advanced and lower-cost networks and a nonunionized workforce, lower employee benefits and fewer retirees. To this end, we have begun initiatives at both the state and federal levels to obtain regulatory approvals, where needed, to transition services from our older copper-based network to an advanced IP-based network. If we do not obtain regulatory approvals for our network transition or obtain approvals with onerous conditions, we could experience significant cost and competitive disadvantages.
36
Management’s Discussion and Analysis of Financial Condition and Results of Operations (continued)
Dollars in millions except per share and per subscriber amounts
Unfavorable litigation or governmental investigation results could require us to pay significant amounts or lead to onerous operating procedures.
We are subject to a number of lawsuits both in the United States and in foreign countries, including, at any particular time, claims relating to antitrust; patent infringement; wage and hour; personal injury; customer privacy violations; regulatory proceedings; and selling and collection practices. We also spend substantial resources complying with various government standards, which may entail related investigations and litigation. In the wireless area, we also face current and potential litigation relating to alleged adverse health effects on customers or employees who use such technologies including, for example, wireless devices. We may incur significant expenses defending such suits or government charges and may be required to pay amounts or otherwise change our operations in ways that could materially adversely affect our operations or financial results.
Cyber attacks, equipment failures, natural disasters and terrorist acts may materially adversely affect our operations.
Cyber attacks, major equipment failures or natural disasters, including severe weather, terrorist acts or other breaches of network or IT security that affect our wireline and wireless networks, including telephone switching offices, microwave links, third-party-owned local and long-distance networks on which we rely, our cell sites or other equipment, our video satellites, our customer account support and information systems, or employee and business records could have a material adverse effect on our operations. While we have been subject to security breaches or cyber attacks, these did not result in a material adverse effect on our operations. However, as such attacks continue to increase in scope and frequency, we may be unable to prevent a significant attack in the future. Our ability to maintain and upgrade our video programming also depends on our ability to successfully deploy and operate video satellites. Our inability to deploy or operate our networks or customer support systems could result in significant expenses, potential legal liability, a loss of current or future customers and reputation damage, any of which could have a material adverse effect on our operations and financial condition.
The impact of our pending acquisition of Time Warner, including our ability to obtain governmental approvals on favorable terms including any required divestitures; the risk that the businesses will not be integrated successfully; the risk that the cost savings and any other synergies from the acquisition may not be fully realized or may take longer to realize than expected; our costs in financing the acquisition and potential adverse effects on our share price and dividend amount due to the issuance of additional shares; the addition of Time Warner’s existing debt to our balance sheet; disruption from the acquisition making it more difficult to maintain relationships with customers, employees or suppliers; and competition and its effect on pricing, spending, third party relationships and revenues.
As discussed in “Other Business Matters,” on October 22, 2016, we agreed to acquire Time Warner for a total transaction value of approximately $108,700 (including Time Warner’s net debt). We believe that the acquisition will give us the scale, resources and ability to deploy video content more efficiently to more customers than otherwise possible and to provide very attractive integrated offerings of video, broadband and wireless services; compete more effectively against other video providers as well as other technology, media and communications companies; and produce cost savings and other potential synergies.
Achieving these results will depend upon obtaining governmental approvals on favorable terms within the time limits contemplated by the parties. Delays in closing, including as a result of delays in obtaining regulatory approval, could divert attention from ongoing operations on the part of management and employees, adversely affecting customers and suppliers and therefore revenues. If such approvals are obtained and the transaction is consummated, then we must integrate a large number of operational and administrative systems, which may involve significant management time and create uncertainty for employees, customers and suppliers. The integration process may also result in significant expenses and charges against earnings, both cash and noncash. While we have successfully merged large companies into our operations in the past, delays in the process could have a material adverse effect on our revenues, expenses, operating results and financial condition. This acquisition also will increase the amount of debt on our balance sheet (both Time Warner’s debt and the indebtedness needed to pay a portion of the purchase price) leading to additional interest expense and, due to additional shares being issued, will result in additional cash being required for any dividends declared. Both of these factors could put pressure on our financial flexibility to continue capital investments, develop new services and declare future dividends. In addition, events outside of our control, including changes in regulation and laws as well as economic trends, could adversely affect our ability to realize the expected benefits from this acquisition.
37
Management’s Discussion and Analysis of Financial Condition and Results of Operations (continued)
Dollars in millions except per share and per subscriber amounts
Our failure to successfully integrate our July 2015 acquisition of DIRECTV, including our failure to achieve the cost savings and any other synergies from the acquisition either on schedule or in the amounts expected; the potential adverse effects on our dividend amount due to the issuance of additional shares and the addition of acquisition-related debt to our balance sheet; disruption from the acquisition making it more difficult to maintain relationships with customers, employees or suppliers; and competition and its effect on pricing, spending, third-party relationships and revenues, all may materially adversely affect our operating results.
We completed our acquisition of DIRECTV in July 2015. We believe that the acquisition gives us the scale, resources and ability to deploy video services to more customers than otherwise possible and to provide an integrated bundle of broadband, video and wireless services enabling us to compete more effectively against cable operators as well as other technology, media and communications companies. In addition, we believe the acquisition has resulted in cost savings, especially in the area of video content costs, and other potential synergies, enabling us to expand and enhance our broadband deployment and provide more video options across multiple fixed and mobile devices. We must comply with various regulatory conditions and integrate a large number of video network and other operational systems and administrative systems. The integration process may also result in significant expenses and charges against earnings, both cash and noncash. While we have successfully merged large companies into our operations in the past, delays in the process could have a material adverse effect on our revenues, expenses, operating results and financial condition. This acquisition has increased the amount of debt on our balance sheet (both from DIRECTV’s debt and the indebtedness needed to pay a portion of the purchase price) leading to additional interest expense and, due to additional shares being issued, will result in additional cash being required for any dividends declared. Both of these factors could put pressure on our financial flexibility to continue capital investments, develop new services and declare future dividends. In addition, events outside of our control, including changes in regulation and laws as well as economic trends, could adversely affect our ability to realize the expected benefits from this acquisition.
The acquisitions of DIRECTV, GSF Telecom and Nextel Mexico have increased our exposure to both changes in the international economy and to the level of regulation on our business, and these risks could offset our expected growth opportunities from these acquisitions.
These three acquisitions have increased the magnitude of our international operations, particularly in Mexico and the rest of Latin America. We need to comply with a wide variety of new and complex local laws, regulations and treaties and government involvement in private business activity. We are now exposed to restrictions on cash repatriation, foreign exchange controls, fluctuations in currency values, changes in relationships between U.S. and foreign governments, trade restrictions including potential border taxes, and other regulations that may affect materially our earnings. While the countries involved represent significant opportunities to sell our advanced services, a number of these same countries have experienced unstable growth patterns and at times have experienced high inflation, currency devaluation, foreign exchange controls, instability in the banking sector and high unemployment. Should these conditions persist, customers in these countries may be unable to purchase the services we offer or pay for services already provided.
In addition, operating in foreign countries also typically involves participating with local businesses, either to comply with local laws or, for example, to enhance product marketing. Involvement with foreign firms exposes us to the risk of being unable to control the actions of those firms and therefore exposes us to violating the Foreign Corrupt Practices Act (FCPA). Violations of the FCPA could have a material adverse effect on our operating results.
Increases in our debt levels to fund acquisitions, additional spectrum purchases, or other strategic decisions could adversely affect our ability to finance future debt at attractive rates and reduce our ability to respond to competition and adverse economic trends.
We increased the amount of our debt during 2015 and 2016 to fund acquisitions, as well as spectrum purchases needed to compete in our industry. While we believe such decisions were prudent and necessary to take advantage of both growth opportunities and respond to industry developments, we have experienced a credit-rating downgrade. Banks and potential purchasers of our publicly-traded debt may decide that these strategic decisions and similar actions we may take in the future, as well as expected trends in the industry, will continue to increase the risk of investing in our debt and may demand a higher rate of interest, impose restrictive covenants or otherwise limit the amount of potential borrowing.
38
CAUTIONARY LANGUAGE CONCERNING FORWARD-LOOKING STATEMENTS
Information set forth in this report contains forward-looking statements that are subject to risks and uncertainties, and actual results could differ materially. Many of these factors are discussed in more detail in the “Risk Factors” section. We claim the protection of the safe harbor for forward-looking statements provided by the Private Securities Litigation Reform Act of 1995.
The following factors could cause our future results to differ materially from those expressed in the forward-looking statements:
|
·
|
Adverse economic and/or capital access changes in the markets served by us or in countries in which we have significant investments, including the impact on customer demand and our ability and our suppliers’ ability to access financial markets at favorable rates and terms.
|
|
·
|
Changes in available technology and the effects of such changes, including product substitutions and deployment costs.
|
|
·
|
Increases in our benefit plans’ costs, including increases due to adverse changes in the United States and foreign securities markets, resulting in worse-than-assumed investment returns and discount rates; adverse changes in mortality assumptions; adverse medical cost trends, and unfavorable or delayed implementation or repeal of healthcare legislation, regulations or related court decisions.
|
|
·
|
The final outcome of FCC and other federal, state or foreign government agency proceedings (including judicial review, if any, of such proceedings) involving issues that are important to our business, including, without limitation, special access and business data services, intercarrier compensation; interconnection obligations; pending Notices of Apparent Liability; the transition from legacy technologies to IP-based infrastructure including the withdrawal of legacy TDM-based services; universal service; broadband deployment; E911 services; competition policy; privacy; net neutrality including the FCC’s order classifying broadband as Title II services subject to much more comprehensive regulation; unbundled network elements and other wholesale obligations; multi-channel video programming distributor services and equipment; availability of new spectrum, on fair and balanced terms, and wireless and satellite license awards and renewals.
|
|
·
|
The final outcome of state and federal legislative efforts involving issues that are important to our business, including deregulation of IP-based services, relief from Carrier of Last Resort obligations and elimination of state commission review of the withdrawal of services.
|
|
·
|
Enactment of additional state, local, federal and/or foreign regulatory and tax laws and regulations, or changes to existing standards and actions by tax agencies and judicial authorities including the resolution of disputes with any taxing jurisdictions, pertaining to our subsidiaries and foreign investments, including laws and regulations that reduce our incentive to invest in our networks, resulting in lower revenue growth and/or higher operating costs.
|
|
·
|
Our ability to absorb revenue losses caused by increasing competition, including offerings that use alternative technologies or delivery methods (e.g., cable, wireless, VoIP and over-the-top video service) and our ability to maintain capital expenditures.
|
|
·
|
The extent of competition including from governmental networks and other providers and the resulting pressure on customer and access line totals and segment operating margins.
|
|
·
|
Our ability to develop attractive and profitable product/service offerings to offset increasing competition.
|
|
·
|
The ability of our competitors to offer product/service offerings at lower prices due to lower cost structures and regulatory and legislative actions adverse to us, including state regulatory proceedings relating to unbundled network elements and non-regulation of comparable alternative technologies (e.g., VoIP).
|
|
·
|
The continued development and delivery of attractive and profitable video offerings through satellite and IP-based networks; the extent to which regulatory and build-out requirements apply to our offerings; and the availability, cost and/or reliability of the various technologies and/or content required to provide such offerings.
|
|
·
|
Our continued ability to maintain margins, attract and offer a diverse portfolio of wireless service and devices and device financing plans.
|
|
·
|
The availability and cost of additional wireless spectrum and regulations and conditions relating to spectrum use, licensing, obtaining additional spectrum, technical standards and deployment and usage, including network management rules.
|
|
·
|
Our ability to manage growth in wireless video and data services, including network quality and acquisition of adequate spectrum at reasonable costs and terms.
|
|
·
|
The outcome of pending, threatened or potential litigation (which includes arbitrations), including, without limitation, patent and product safety claims by or against third parties.
|
|
·
|
The impact from major equipment failures on our networks, including satellites operated by DIRECTV; the effect of security breaches related to the network or customer information; our inability to obtain handsets, equipment/software or have handsets, equipment/software serviced in a timely and cost-effective manner from suppliers; and in the case of satellites launched, timely provisioning of services from vendors; or severe weather conditions, natural disasters, pandemics, energy shortages, wars or terrorist attacks.
|
|
·
|
The issuance by the Financial Accounting Standards Board or other accounting oversight bodies of new accounting standards or changes to existing standards.
|
|
·
|
Our ability to integrate our acquisition of DIRECTV.
|
|
·
|
Our ability to close our pending acquisition of Time Warner Inc. and successfully integrate its operations.
|
|
·
|
Our ability to adequately fund our wireless operations, including payment for additional spectrum, network upgrades and technological advancements.
|
|
·
|
Our increased exposure to video competition and foreign economies due to our recent acquisitions of DIRECTV and Mexican wireless properties, including foreign exchange fluctuations as well as regulatory and political uncertainty.
|
|
·
|
Changes in our corporate strategies, such as changing network-related requirements or acquisitions and dispositions, which may require significant amounts of cash or stock, to respond to competition and regulatory, legislative and technological developments.
|
|
·
|
The uncertainty surrounding further congressional action to address spending reductions, which may result in a significant decrease in government spending and reluctance of businesses and consumers to spend in general.
|
|
·
|
The uncertainty and impact of anticipated regulatory and corporate tax reform, which may impact the overall economy and incentives for business investments.
|
Readers are cautioned that other factors discussed in this report, although not enumerated here, also could materially affect our future earnings.
39
|
AT&T Inc.
|
||||||||||||
|
Consolidated Statements of Income
|
||||||||||||
|
Dollars in millions except per share amounts
|
||||||||||||
|
2016
|
2015
|
2014
|
||||||||||
|
Operating Revenues
|
||||||||||||
|
Service
|
$
|
148,884
|
$
|
131,677
|
$
|
118,437
|
||||||
|
Equipment
|
14,902
|
15,124
|
14,010
|
|||||||||
|
Total operating revenues
|
163,786
|
146,801
|
132,447
|
|||||||||
|
Operating Expenses
|
||||||||||||
|
Cost of services and sales
|
||||||||||||
|
Equipment
|
18,757
|
19,268
|
18,946
|
|||||||||
|
Broadcast, programming and operations
|
19,851
|
11,996
|
4,075
|
|||||||||
|
Other cost of services (exclusive of depreciation
|
||||||||||||
|
and amortization shown separately below)
|
38,276
|
35,782
|
37,124
|
|||||||||
|
Selling, general and administrative
|
36,347
|
32,919
|
39,697
|
|||||||||
|
Asset abandonments and impairments
|
361
|
35
|
2,120
|
|||||||||
|
Depreciation and amortization
|
25,847
|
22,016
|
18,273
|
|||||||||
|
Total operating expenses
|
139,439
|
122,016
|
120,235
|
|||||||||
|
Operating Income
|
24,347
|
24,785
|
12,212
|
|||||||||
|
Other Income (Expense)
|
||||||||||||
|
Interest expense
|
(4,910
|
)
|
(4,120
|
)
|
(3,613
|
)
|
||||||
|
Equity in net income of affiliates
|
98
|
79
|
175
|
|||||||||
|
Other income (expense) – net
|
277
|
(52
|
)
|
1,581
|
||||||||
|
Total other income (expense)
|
(4,535
|
)
|
(4,093
|
)
|
(1,857
|
)
|
||||||
|
Income Before Income Taxes
|
19,812
|
20,692
|
10,355
|
|||||||||
|
Income tax expense
|
6,479
|
7,005
|
3,619
|
|||||||||
|
Net Income
|
13,333
|
13,687
|
6,736
|
|||||||||
|
Less: Net Income Attributable to
Noncontrolling Interest
|
(357
|
)
|
(342
|
)
|
(294
|
)
|
||||||
|
Net Income Attributable to AT&T
|
$
|
12,976
|
$
|
13,345
|
$
|
6,442
|
||||||
|
Basic Earnings Per Share Attributable to AT&T
|
$
|
2.10
|
$
|
2.37
|
$
|
1.24
|
||||||
|
Diluted Earnings Per Share Attributable to AT&T
|
$
|
2.10
|
$
|
2.37
|
$
|
1.24
|
||||||
|
The accompanying notes are an integral part of the consolidated financial statements.
|
||||||||||||
40
|
AT&T Inc.
|
||||||||||||
|
Consolidated Statements of Comprehensive Income
|
||||||||||||
|
Dollars in millions
|
||||||||||||
|
2016
|
2015
|
2014
|
||||||||||
|
Net income
|
$
|
13,333
|
$
|
13,687
|
$
|
6,736
|
||||||
|
Other comprehensive income, net of tax:
|
||||||||||||
|
Foreign Currency:
|
||||||||||||
|
Translation adjustments (includes $20, $(16) and $0
attributable to noncontrolling interest), net of taxes of $357, $(595) and $(45)
|
(777
|
)
|
(1,188
|
)
|
(75
|
)
|
||||||
|
Reclassification adjustment included in net income, net of taxes of $0, $0
and $224
|
-
|
-
|
416
|
|||||||||
|
Available-for-sale securities:
|
||||||||||||
|
Net unrealized gains, net of taxes of $36, $0, and $40
|
58
|
-
|
65
|
|||||||||
|
Reclassification adjustment included in net income, net of taxes of $(1), $(9)
and $(10)
|
(1
|
)
|
(15
|
)
|
(16
|
)
|
||||||
|
Cash flow hedges:
|
||||||||||||
|
Net unrealized gains (losses), net of taxes of $371, $(411) and $140
|
690
|
(763
|
)
|
260
|
||||||||
|
Reclassification adjustment included in net income, net of taxes of $21, $20
and $18
|
38
|
38
|
36
|
|||||||||
|
Defined benefit postretirement plans:
|
||||||||||||
|
Net prior service credit arising during period, net of taxes of $305, $27
and $262
|
497
|
45
|
428
|
|||||||||
|
Amortization of net prior service credit included in net income, net of taxes of
$(525), $(523) and $(588)
|
(858
|
)
|
(860
|
)
|
(959
|
)
|
||||||
|
Reclassification adjustment included in net income, net of taxes of $0, $0
and $11
|
-
|
-
|
26
|
|||||||||
|
Other comprehensive income (loss)
|
(353
|
)
|
(2,743
|
)
|
181
|
|||||||
|
Total comprehensive income
|
12,980
|
10,944
|
6,917
|
|||||||||
|
Less: Total comprehensive income attributable to noncontrolling interest
|
(377
|
)
|
(326
|
)
|
(294
|
)
|
||||||
|
Total Comprehensive Income Attributable to AT&T
|
$
|
12,603
|
$
|
10,618
|
$
|
6,623
|
||||||
|
The accompanying notes are an integral part of the consolidated financial statements.
|
||||||||||||
41
|
AT&T Inc.
|
||||||||
|
Consolidated Balance Sheets
|
||||||||
|
Dollars in millions except per share amounts
|
||||||||
|
December 31,
|
||||||||
|
2016
|
2015
|
|||||||
|
Assets
|
||||||||
|
Current Assets
|
||||||||
|
Cash and cash equivalents
|
$
|
5,788
|
$
|
5,121
|
||||
|
Accounts receivable - net of allowances for doubtful accounts of $661 and $704
|
16,794
|
16,532
|
||||||
|
Prepaid expenses
|
1,555
|
1,072
|
||||||
|
Other current assets
|
14,232
|
13,267
|
||||||
|
Total current assets
|
38,369
|
35,992
|
||||||
|
Property, Plant and Equipment – Net
|
124,899
|
124,450
|
||||||
|
Goodwill
|
105,207
|
104,568
|
||||||
|
Licenses
|
94,176
|
93,093
|
||||||
|
Customer Lists and Relationships – Net
|
14,243
|
18,208
|
||||||
|
Other Intangible Assets – Net
|
8,441
|
9,409
|
||||||
|
Investments in Equity Affiliates
|
1,674
|
1,606
|
||||||
|
Other Assets
|
16,812
|
15,346
|
||||||
|
Total Assets
|
$
|
403,821
|
$
|
402,672
|
||||
|
Liabilities and Stockholders’ Equity
|
||||||||
|
Current Liabilities
|
||||||||
|
Debt maturing within one year
|
$
|
9,832
|
$
|
7,636
|
||||
|
Accounts payable and accrued liabilities
|
31,138
|
30,372
|
||||||
|
Advanced billings and customer deposits
|
4,519
|
4,682
|
||||||
|
Accrued taxes
|
2,079
|
2,176
|
||||||
|
Dividends payable
|
3,008
|
2,950
|
||||||
|
Total current liabilities
|
50,576
|
47,816
|
||||||
|
Long-Term Debt
|
113,681
|
118,515
|
||||||
|
Deferred Credits and Other Noncurrent Liabilities
|
||||||||
|
Deferred income taxes
|
60,128
|
56,181
|
||||||
|
Postemployment benefit obligation
|
33,578
|
34,262
|
||||||
|
Other noncurrent liabilities
|
21,748
|
22,258
|
||||||
|
Total deferred credits and other noncurrent liabilities
|
115,454
|
112,701
|
||||||
|
Stockholders’ Equity
|
||||||||
|
Common stock ($1 par value, 14,000,000,000 authorized at December 31, 2016
|
||||||||
|
and 2015: issued 6,495,231,088 at December 31, 2016 and 2015)
|
6,495
|
6,495
|
||||||
|
Additional paid-in capital
|
89,604
|
89,763
|
||||||
|
Retained earnings
|
34,734
|
33,671
|
||||||
|
Treasury stock (356,237,141 at December 31, 2016 and 350,291,239
|
||||||||
|
at December 31, 2015, at cost)
|
(12,659
|
)
|
(12,592
|
)
|
||||
|
Accumulated other comprehensive income
|
4,961
|
5,334
|
||||||
|
Noncontrolling interest
|
975
|
969
|
||||||
|
Total stockholders’ equity
|
124,110
|
123,640
|
||||||
|
Total Liabilities and Stockholders’ Equity
|
$
|
403,821
|
$
|
402,672
|
||||
|
The accompanying notes are an integral part of the consolidated financial statements.
|
||||||||
42
|
AT&T Inc.
|
||||||||||||
|
Consolidated Statements of Cash Flows
|
||||||||||||
|
Dollars in millions
|
||||||||||||
|
2016
|
2015
|
2014
|
||||||||||
|
Operating Activities
|
||||||||||||
|
Net income
|
$
|
13,333
|
$
|
13,687
|
$
|
6,736
|
||||||
|
Adjustments to reconcile net income to net cash provided by operating activities:
|
||||||||||||
|
Depreciation and amortization
|
25,847
|
22,016
|
18,273
|
|||||||||
|
Undistributed earnings from investments in equity affiliates
|
(37
|
)
|
(49
|
)
|
(27
|
)
|
||||||
|
Provision for uncollectible accounts
|
1,474
|
1,416
|
1,032
|
|||||||||
|
Deferred income tax expense
|
2,947
|
4,117
|
1,948
|
|||||||||
|
Net (gain) loss from sale of investments, net of impairments
|
(169
|
)
|
91
|
(1,461
|
)
|
|||||||
|
Actuarial loss (gain) on pension and postretirement benefits
|
1,024
|
(2,152
|
)
|
7,869
|
||||||||
|
Asset abandonments and impairments
|
361
|
35
|
2,120
|
|||||||||
|
Changes in operating assets and liabilities:
|
||||||||||||
|
Accounts receivable
|
(1,003
|
)
|
30
|
(693
|
)
|
|||||||
|
Other current assets
|
1,708
|
(1,182
|
)
|
(1,018
|
)
|
|||||||
|
Accounts payable and accrued liabilities
|
118
|
1,354
|
2,310
|
|||||||||
|
Equipment installment receivables and related sales
|
(576
|
)
|
(3,023
|
)
|
(5,043
|
)
|
||||||
|
Deferred fulfillment costs
|
(2,359
|
)
|
(1,437
|
)
|
(347
|
)
|
||||||
|
Retirement benefit funding
|
(910
|
)
|
(735
|
)
|
(560
|
)
|
||||||
|
Other - net
|
(2,414
|
)
|
1,712
|
199
|
||||||||
|
Total adjustments
|
26,011
|
22,193
|
24,602
|
|||||||||
|
Net Cash Provided by Operating Activities
|
39,344
|
35,880
|
31,338
|
|||||||||
|
Investing Activities
|
||||||||||||
|
Capital expenditures:
|
||||||||||||
|
Purchase of property and equipment
|
(21,516
|
)
|
(19,218
|
)
|
(21,199
|
)
|
||||||
|
Interest during construction
|
(892
|
)
|
(797
|
)
|
(234
|
)
|
||||||
|
Acquisitions, net of cash acquired
|
(2,959
|
)
|
(30,759
|
)
|
(3,141
|
)
|
||||||
|
Dispositions
|
646
|
83
|
8,123
|
|||||||||
|
Sales (purchases) of securities, net
|
506
|
1,545
|
(1,890
|
)
|
||||||||
|
Other
|
-
|
2
|
4
|
|||||||||
|
Net Cash Used in Investing Activities
|
(24,215
|
)
|
(49,144
|
)
|
(18,337
|
)
|
||||||
|
Financing Activities
|
||||||||||||
|
Net change in short-term borrowings with original maturities of
three months or less
|
-
|
(1
|
)
|
(16
|
)
|
|||||||
|
Issuance of long-term debt
|
10,140
|
33,969
|
15,926
|
|||||||||
|
Repayment of long-term debt
|
(10,823
|
)
|
(10,042
|
)
|
(10,400
|
)
|
||||||
|
Issuance of other long-term financing obligations
|
-
|
-
|
107
|
|||||||||
|
Purchase of treasury stock
|
(512
|
)
|
(269
|
)
|
(1,617
|
)
|
||||||
|
Issuance of treasury stock
|
146
|
143
|
39
|
|||||||||
|
Dividends paid
|
(11,797
|
)
|
(10,200
|
)
|
(9,552
|
)
|
||||||
|
Other
|
(1,616
|
)
|
(3,818
|
)
|
(2,224
|
)
|
||||||
|
Net Cash (Used in) Provided by Financing Activities
|
(14,462
|
)
|
9,782
|
(7,737
|
)
|
|||||||
|
Net increase (decrease) in cash and cash equivalents
|
667
|
(3,482
|
)
|
5,264
|
||||||||
|
Cash and cash equivalents beginning of year
|
5,121
|
8,603
|
3,339
|
|||||||||
|
Cash and Cash Equivalents End of Year
|
$
|
5,788
|
$
|
5,121
|
$
|
8,603
|
||||||
|
The accompanying notes are an integral part of the consolidated financial statements.
|
||||||||||||
43
|
AT&T Inc.
|
||||||||||||||||||||||||
|
Consolidated Statements of Changes in Stockholders' Equity
|
||||||||||||||||||||||||
|
Dollars and shares in millions except per share amounts
|
||||||||||||||||||||||||
|
2016
|
2015
|
2014
|
||||||||||||||||||||||
|
Shares
|
Amount
|
Shares
|
Amount
|
Shares
|
Amount
|
|||||||||||||||||||
|
Common Stock
|
||||||||||||||||||||||||
|
Balance at beginning of year
|
6,495
|
$
|
6,495
|
6,495
|
$
|
6,495
|
6,495
|
$
|
6,495
|
|||||||||||||||
|
Issuance of stock
|
-
|
-
|
-
|
-
|
-
|
-
|
||||||||||||||||||
|
Balance at end of year
|
6,495
|
$
|
6,495
|
6,495
|
$
|
6,495
|
6,495
|
$
|
6,495
|
|||||||||||||||
|
Additional Paid-In Capital
|
||||||||||||||||||||||||
|
Balance at beginning of year
|
$
|
89,763
|
$
|
91,108
|
$
|
91,091
|
||||||||||||||||||
|
Issuance of treasury stock
|
(43
|
)
|
(1,597
|
)
|
4
|
|||||||||||||||||||
|
Share-based payments
|
(140
|
)
|
252
|
47
|
||||||||||||||||||||
|
Change related to acquisition of interests
held by noncontrolling owners
|
24
|
-
|
(34
|
)
|
||||||||||||||||||||
|
Balance at end of year
|
$
|
89,604
|
$
|
89,763
|
$
|
91,108
|
||||||||||||||||||
|
Retained Earnings
|
||||||||||||||||||||||||
|
Balance at beginning of year
|
$
|
33,671
|
$
|
31,081
|
$
|
34,269
|
||||||||||||||||||
|
Net income attributable to AT&T ($2.10,
$2.37 and $1.24 per diluted share)
|
12,976
|
13,345
|
6,442
|
|||||||||||||||||||||
|
Dividends to stockholders ($1.93, $1.89
and $1.85 per share)
|
(11,913
|
)
|
(10,755
|
)
|
(9,630
|
)
|
||||||||||||||||||
|
Balance at end of year
|
$
|
34,734
|
$
|
33,671
|
$
|
31,081
|
||||||||||||||||||
|
Treasury Stock
|
||||||||||||||||||||||||
|
Balance at beginning of year
|
(350
|
)
|
$
|
(12,592
|
)
|
(1,308
|
)
|
$
|
(47,029
|
)
|
(1,269
|
)
|
$
|
(45,619
|
)
|
|||||||||
|
Repurchase of common stock
|
(17
|
)
|
(655
|
)
|
(8
|
)
|
(278
|
)
|
(48
|
)
|
(1,617
|
)
|
||||||||||||
|
Issuance of treasury stock
|
11
|
588
|
966
|
34,715
|
9
|
207
|
||||||||||||||||||
|
Balance at end of year
|
(356
|
)
|
$
|
(12,659
|
)
|
(350
|
)
|
$
|
(12,592
|
)
|
(1,308
|
)
|
$
|
(47,029
|
)
|
|||||||||
|
Accumulated Other Comprehensive Income
Attributable to AT&T, net of tax:
|
||||||||||||||||||||||||
|
Balance at beginning of year
|
$
|
5,334
|
$
|
8,061
|
$
|
7,880
|
||||||||||||||||||
|
Other comprehensive income (loss)
attributable to AT&T
|
(373
|
)
|
(2,727
|
)
|
181
|
|||||||||||||||||||
|
Balance at end of year
|
$
|
4,961
|
$
|
5,334
|
$
|
8,061
|
||||||||||||||||||
|
Noncontrolling Interest:
|
||||||||||||||||||||||||
|
Balance at beginning of year
|
$
|
969
|
$
|
554
|
$
|
494
|
||||||||||||||||||
|
Net income attributable to noncontrolling
interest
|
357
|
342
|
294
|
|||||||||||||||||||||
|
Distributions
|
(346
|
)
|
(294
|
)
|
(233
|
)
|
||||||||||||||||||
|
Acquisitions of noncontrolling interests
|
-
|
383
|
69
|
|||||||||||||||||||||
|
Acquisition of interests held by
noncontrolling owners
|
(25
|
)
|
-
|
(70
|
)
|
|||||||||||||||||||
|
Translation adjustments attributable to
noncontrolling interest, net of taxes
|
20
|
(16
|
)
|
-
|
||||||||||||||||||||
|
Balance at end of year
|
$
|
975
|
$
|
969
|
$
|
554
|
||||||||||||||||||
|
Total Stockholders' Equity at beginning of year
|
$
|
123,640
|
$
|
90,270
|
$
|
94,610
|
||||||||||||||||||
|
Total Stockholders' Equity at end of year
|
$
|
124,110
|
$
|
123,640
|
$
|
90,270
|
||||||||||||||||||
|
The accompanying notes are an integral part of the consolidated financial statements.
|
||||||||||||||||||||||||
44
Notes to Consolidated Financial Statements
Dollars in millions except per share amounts
NOTE 1. SUMMARY OF SIGNIFICANT ACCOUNTING POLICIES
Basis of Presentation Throughout this document, AT&T Inc. is referred to as “AT&T,” “we” or the “Company.” The consolidated financial statements include the accounts of the Company and our majority-owned subsidiaries and affiliates, including the results of DIRECTV and wireless properties in Mexico for the period from acquisition to the reporting date. Our subsidiaries and affiliates operate in the communications and digital entertainment services industry, providing services and equipment that deliver voice, video and broadband services domestically and internationally.
All significant intercompany transactions are eliminated in the consolidation process. Investments in less than majority-owned subsidiaries and partnerships where we have significant influence are accounted for under the equity method. Earnings from certain investments accounted for using the equity method are included for periods ended within up to one quarter of our period end. We also record our proportionate share of our equity method investees’ other comprehensive income (OCI) items, including actuarial gains and losses on pension and other postretirement benefit obligations and cumulative translation adjustments.
The preparation of financial statements in conformity with U.S. generally accepted accounting principles (GAAP) requires management to make estimates and assumptions that affect the amounts reported in the financial statements and accompanying notes, including estimates of probable losses and expenses. Actual results could differ from those estimates. Certain prior period amounts have been conformed to the current period’s presentation.
Network Asset Lives and Salvage Values During the fourth quarter of 2016, we aligned the estimated useful lives and salvage values for certain network assets that are impacted by our IP strategy with our updated business cases and engineering studies. This change in accounting estimate decreased depreciation expense and impacted net income $286, or $0.05 per diluted share, for 2016.
Customer Fulfillment Costs During the second quarter of 2016, we updated our analysis of the economic lives of customer relationships, which included a review of satellite customer data following the DIRECTV acquisition. As of April 1, 2016, we extended the amortization period to better reflect the estimated economic lives of satellite and certain business customer relationships. This change in accounting estimate decreased other cost of services and impacted net income $236, or $0.04 per diluted share, for 2016.
Income Taxes We provide deferred income taxes for temporary differences between the carrying amounts of assets and liabilities for financial reporting purposes and the computed tax basis of those assets and liabilities. We provide valuation allowances against the deferred tax assets (included, together with our deferred income tax assets, as part of our reportable net deferred income tax liabilities on our consolidated balance sheets), for which the realization is uncertain. We review these items regularly in light of changes in federal and state tax laws and changes in our business.
Cash and Cash Equivalents Cash and cash equivalents include all highly liquid investments with original maturities of three months or less. The carrying amounts approximate fair value. At December 31, 2016, we held $1,803 in cash and $3,985 in money market funds and other cash equivalents. Of our total cash and cash equivalents, $776 resided in foreign jurisdictions, some of which is subject to restrictions on repatriation.
Revenue Recognition Revenues derived from wireless, fixed telephone, data and video services are recognized when services are provided. This is based upon either usage (e.g., minutes of traffic/bytes of data processed), period of time (e.g., monthly service fees) or other established fee schedules. Our service revenues are billed either in advance, arrears or are prepaid.
We record revenue reductions for estimated future adjustments to customer accounts at the time revenue is recognized based on historical experience. We report revenues from transactions between us and our customers net of taxes. Cash incentives given to customers are recorded as a reduction of revenue. Revenues related to nonrefundable, upfront service activation and setup fees are deferred and recognized over the associated service contract period or customer life. Revenue recognized from contracts that bundle services and equipment is limited to the lesser of the amount allocated based on the relative selling price of the equipment and service already delivered or the amount paid and owed by the customer for the equipment and service already delivered. Service revenues also include billings to our customers for various regulatory fees imposed on us by governmental authorities. We record the sale of equipment to customers when we no longer have any requirements to perform, title has passed, and the products are accepted by customers. We record the sale of equipment and services to customers as gross revenue when we are the principal in the arrangement and net of the associated costs incurred when we are not considered the principal.
45
Notes to Consolidated Financial Statements (continued)
Dollars in millions except per share amounts
We offer to our customers the option to purchase certain wireless devices in installments over a period of up to 30 months, and, in many cases, they have the right to trade in the original equipment within a set period and have the remaining unpaid balance satisfied upon the purchase of a new device under a new installment plan. For customers that elect these equipment installment payment programs, we recognize revenue for the entire amount of the customer receivable, net of fair value of the trade-in right guarantee and imputed interest.
Allowance for Doubtful Accounts We record expense to maintain an allowance for doubtful accounts for estimated losses that result from the failure or inability of our customers to make required payments deemed collectable from the customer when the service was provided or product was delivered. When determining the allowance, we consider the probability of recoverability of accounts receivable based on past experience, taking into account current collection trends as well as general economic factors, including bankruptcy rates. Credit risks are assessed based on historical write-offs, net of recoveries, as well as an analysis of the aged accounts receivable balances with allowances generally increasing as the receivable ages. Accounts receivable may be fully reserved for when specific collection issues are known to exist, such as catastrophes or pending bankruptcies.
Inventory Inventories, which are included in “Other current assets” on our consolidated balance sheets, were $2,039 at December 31, 2016, and $4,033 at December 31, 2015. Wireless devices and accessories, which are valued at the lower of cost or net realizable value, were $1,951 at December 31, 2016, and $3,998 at December 31, 2015.
Property, Plant and Equipment Property, plant and equipment is stated at cost, except for assets acquired using acquisition accounting, which are initially recorded at fair value (see Note 6). The cost of additions and substantial improvements to property, plant and equipment is capitalized, and includes internal compensation costs for these projects; however, noncash actuarial gains or losses included in compensation costs are excluded from amounts reported as “capital expenditures.” The cost of maintenance and repairs of property, plant and equipment is charged to operating expenses. Property, plant and equipment costs are depreciated using straight-line methods over their estimated economic lives. Certain subsidiaries follow composite group depreciation methodology. Accordingly, when a portion of their depreciable property, plant and equipment is retired in the ordinary course of business, the gross book value is reclassified to accumulated depreciation, and no gain or loss is recognized on the disposition of these assets.
Property, plant and equipment is reviewed for recoverability whenever events or changes in circumstances indicate that the carrying amount of an asset group may not be recoverable. We recognize an impairment loss when the carrying amount of a long-lived asset is not recoverable. The carrying amount of a long-lived asset is not recoverable if it exceeds the sum of the undiscounted cash flows expected to result from the use and eventual disposition of the asset.
During the fourth quarter of 2016, we identified certain assets for impairment. These assets primarily related to capitalized costs for wireless sites that are no longer in our construction plans. (See Note 6)
The liability for the fair value of an asset retirement obligation is recorded in the period in which it is incurred if a reasonable estimate of fair value can be made. In periods subsequent to initial measurement, we recognize period-to-period changes in the liability resulting from the passage of time and revisions to either the timing or the amount of the original estimate. The increase in the carrying value of the associated long-lived asset is depreciated over the corresponding estimated economic life.
Software Costs We capitalize certain costs incurred in connection with developing or obtaining internal-use software. Capitalized software costs are included in “Property, Plant and Equipment” on our consolidated balance sheets. In addition, there is certain network software that allows the equipment to provide the features and functions unique to the AT&T network, which we include in the cost of the equipment categories for financial reporting purposes.
We amortize our capitalized software costs over a three-year to five-year period, reflecting the estimated period during which these assets will remain in service, which also aligns with the estimated useful lives used in the industry.
Goodwill and Other Intangible Assets AT&T has five major classes of intangible assets: goodwill; licenses, which include Federal Communications Commission (FCC) and other wireless licenses and orbital slots; other indefinite-lived intangible assets, primarily made up of the AT&T and international DIRECTV trade names including SKY; customer lists and various other finite-lived intangible assets (see Note 7).
Goodwill represents the excess of consideration paid over the fair value of identifiable net assets acquired in business combinations. Wireless licenses (including FCC licenses) provide us with the exclusive right to utilize certain radio
46
Notes to Consolidated Financial Statements (continued)
Dollars in millions except per share amounts
frequency spectrum to provide wireless communications services. While wireless licenses are issued for a fixed period of time (generally 10 years), renewals of wireless licenses have occurred routinely and at nominal cost. Moreover, we have determined that there are currently no legal, regulatory, contractual, competitive, economic or other factors that limit the useful lives of our wireless licenses. Orbital slots represent the space in which we operate the broadcast satellites that support our digital video entertainment service offerings. Similar to our wireless licenses, there are no factors that limit the useful lives of our orbital slots. We acquired the rights to the AT&T and other trade names in previous acquisitions. We have the effective ability to retain these exclusive rights permanently at a nominal cost.
Goodwill, licenses and other indefinite-lived intangible assets are not amortized but are tested at least annually for impairment. The testing is performed on the value as of October 1 each year, and compares the book value of the assets to their fair value. Goodwill is tested by comparing the book value of each reporting unit, deemed to be our principal operating segments or one level below them (Business Solutions, Entertainment Group, Consumer Mobility, and Mexico Wireless, Brazil and PanAmericana in the International segment), to the fair value using both discounted cash flow as well as market multiple approaches. Wireless licenses are tested on an aggregate basis, consistent with our use of the licenses on a national scope, using a discounted cash flow approach. Orbital slots are similarly aggregated for purposes of impairment testing. We also corroborate the value of wireless licenses with a market approach as the AWS-3 auction provided market price information for national wireless licenses. Trade names are tested by comparing the book value to a fair value calculated using a discounted cash flow approach on a presumed royalty rate derived from the revenues related to the brand name.
Intangible assets that have finite useful lives are amortized over their useful lives (see Note 7). Customer lists and relationships are amortized using primarily the sum-of-the-months-digits method of amortization over the period in which those relationships are expected to contribute to our future cash flows. The remaining finite-lived intangible assets are generally amortized using the straight-line method.
Broadcast Programming and Other Costs We recognize the costs of television programming distribution rights when we distribute the related programming. We expense the costs of television programming rights to distribute live sporting events using the straight-line method over the course of the season or tournament, which approximates the pattern of usage.
Advertising Costs We expense advertising costs for products and services or for promoting our corporate image as we incur them (see Note 18).
Traffic Compensation Expense We use various estimates and assumptions to determine the amount of traffic compensation expense recognized during any reporting period. Switched traffic compensation costs are accrued utilizing estimated rates and volumes by product, formulated from historical data and adjusted for known rate changes. Such estimates are adjusted monthly to reflect newly available information, such as rate changes and new contractual agreements. Bills reflecting actual incurred information are generally not received within three months subsequent to the end of the reporting period, at which point a final adjustment is made to the accrued traffic compensation expense. Dedicated traffic compensation costs are estimated based on the number of circuits and the average projected circuit costs.
Foreign Currency Translation We are exposed to foreign currency exchange risk through our foreign affiliates and equity investments in foreign companies. Our foreign subsidiaries and foreign investments generally report their earnings in their local currencies. We translate their foreign assets and liabilities at exchange rates in effect at the balance sheet dates. We translate their revenues and expenses using average rates during the year. The resulting foreign currency translation adjustments are recorded as a separate component of accumulated other comprehensive income (accumulated OCI) in the accompanying consolidated balance sheets (see Note 3). Operations in countries with highly inflationary economies consider the U.S. dollar as the functional currency.
We do not hedge foreign currency translation risk in the net assets and income we report from these sources. However, we do hedge a portion of the foreign currency exchange risk involved in anticipation of highly probable foreign currency-denominated transactions, which we explain further in our discussion of our methods of managing our foreign currency risk (see Note 10).
Pension and Other Postretirement Benefits See Note 12 for a comprehensive discussion of our pension and postretirement benefit expense, including a discussion of the actuarial assumptions, our policy for recognizing the associated gains and losses and our method used to estimate service and interest cost components.
47
Notes to Consolidated Financial Statements (continued)
Dollars in millions except per share amounts
New Accounting Standards
Cash Flows In August 2016, the Financial Accounting Standards Board (FASB) issued Accounting Standards Update (ASU) No. 2016-15, “Statement of Cash Flows (Topic 230): Classification of Certain Cash Receipts and Cash Payments” (ASU 2016-15), which provides guidance related to cash flows presentation and is effective for annual reporting periods beginning after December 15, 2017, subject to early adoption. The majority of the guidance in ASU 2016-15 is consistent with our current cash flow classifications. However, cash receipts on the deferred purchase price described in Note 15 will be classified as cash flows from investing activities instead of our current presentation as cash flows from operations. Under ASU 2016-15, we will continue to recognize cash receipts on owned equipment installment receivables as cash flows from operations. AT&T’s cash flows from operating activities included cash receipts on the deferred purchase price of $731 for the year ended December 31, 2016, and $536 for the year ended December 31, 2015.
Leases In February 2016, the FASB issued ASU No. 2016-02, “Leases (Topic 842)” (ASU 2016-02), which replaces existing leasing rules with a comprehensive lease measurement and recognition standard and expanded disclosure requirements. ASU 2016-02 will require lessees to recognize most leases on their balance sheets as liabilities, with corresponding “right-of-use” assets and is effective for annual reporting periods beginning after December 15, 2018, subject to early adoption. For income statement recognition purposes, leases will be classified as either a finance or an operating lease without relying upon the bright-line tests under current GAAP.
Upon initial evaluation, we believe the key change upon adoption will be the balance sheet recognition. At adoption, we will recognize a right-to-use asset and corresponding lease liability on our consolidated balance sheets. The income statement recognition of lease expense appears similar to our current methodology. We are continuing to evaluate the magnitude and other potential impacts to our financial statements.
Revenue Recognition In May 2014, the FASB issued ASU No. 2014-09, “Revenue from Contracts with Customers (Topic 606)” (ASC 606) and has modified the standard thereafter. This standard replaces existing revenue recognition rules with a comprehensive revenue measurement and recognition standard and expanded disclosure requirements. ASC 606, as amended, becomes effective for annual reporting periods beginning after December 15, 2017, at which point we plan to adopt the standard.
The FASB allows two adoption methods under ASC 606. We currently plan to adopt the standard using the “modified retrospective method.” Under that method, we will apply the rules to all contracts existing as of January 1, 2018, recognizing in beginning retained earnings an adjustment for the cumulative effect of the change and providing additional disclosures comparing results to previous accounting standards.
Upon initial evaluation, we believe the key changes in the standard that impact our revenue recognition relate to the allocation of contract revenues between various services and equipment, and the timing of when those revenues are recognized. We are still in the process of determining the impacts due to the ongoing changes in how the industry sells devices and services to customers. As a result of our accounting policy change for customer set-up and installation costs made in 2015, we believe that the requirement to defer such costs under the new standard will not result in a significant change to our results. However, the requirement to defer incremental contract acquisition costs and recognize them over the contract period or expected customer life will result in the recognition of a deferred charge on our balance sheets.
Financial Instruments In January 2016, the FASB issued ASU No. 2016-01, “Financial Instruments – Overall (Subtopic 825-10): Recognition and Measurement of Financial Assets and Financial Liabilities” (ASU 2016-01), which will require us to record changes in the fair value of our equity investments, except for those accounted for under the equity method, in net income instead of in accumulated other comprehensive income. ASU 2016-01 will become effective for fiscal years and interim periods beginning after December 15, 2017, and, with the exception of certain disclosure requirements, is not subject to early adoption.
48
Notes to Consolidated Financial Statements (continued)
Dollars in millions except per share amounts
NOTE 2. EARNINGS PER SHARE
A reconciliation of the numerators and denominators of basic and diluted earnings per share is shown in the table below:
|
Year Ended December 31,
|
2016
|
2015
|
2014
|
|||||||||
|
Numerators
|
||||||||||||
|
Numerator for basic earnings per share:
|
||||||||||||
|
Net income
|
$
|
13,333
|
$
|
13,687
|
$
|
6,736
|
||||||
|
Less: Net income attributable to noncontrolling interest
|
(357
|
)
|
(342
|
)
|
(294
|
)
|
||||||
|
Net income attributable to AT&T
|
12,976
|
13,345
|
6,442
|
|||||||||
|
Dilutive potential common shares:
|
||||||||||||
|
Share-based payment
|
13
|
13
|
13
|
|||||||||
|
Numerator for diluted earnings per share
|
$
|
12,989
|
$
|
13,358
|
$
|
6,455
|
||||||
|
Denominators (000,000)
|
||||||||||||
|
Denominator for basic earnings per share:
|
||||||||||||
|
Weighted-average number of common shares outstanding
|
6,168
|
5,628
|
5,205
|
|||||||||
|
Dilutive potential common shares:
|
||||||||||||
|
Share-based payment (in shares)
|
21
|
18
|
16
|
|||||||||
|
Denominator for diluted earnings per share
|
6,189
|
5,646
|
5,221
|
|||||||||
|
Basic earnings per share attributable to AT&T
|
$
|
2.10
|
$
|
2.37
|
$
|
1.24
|
||||||
|
Diluted earnings per share attributable to AT&T
|
$
|
2.10
|
$
|
2.37
|
$
|
1.24
|
||||||
49
Notes to Consolidated Financial Statements (continued)
Dollars in millions except per share amounts
NOTE 3. OTHER COMPREHENSIVE INCOME
Changes in the balances of each component included in accumulated OCI are presented below. All amounts are net of tax and exclude noncontrolling interest.
Following our 2015 acquisitions of DIRECTV and wireless businesses in Mexico, we have additional foreign operations that are exposed to fluctuations in the exchange rates used to convert operations, assets and liabilities into U.S. dollars. Since the dates of acquisition, when compared to the U.S. dollar, the Brazilian real exchange rate has appreciated 17.9%, the Argentine peso exchange rate has depreciated 22.8% and Mexican peso exchange rate has depreciated 20.5%.
|
Foreign
Currency
Translation Adjustment
|
Net Unrealized
Gains (Losses)
on Available-
for-Sale
Securities
|
Net Unrealized
Gains (Losses)
on Cash Flow
Hedges
|
Defined Benefit Postretirement
Plans
|
Accumulated
Other
Comprehensive
Income
|
||||||||||
|
Balance as of December 31, 2013
|
$
|
(367)
|
$
|
450
|
$
|
445
|
$
|
7,352
|
$
|
7,880
|
||||
|
Other comprehensive income
(loss) before reclassifications
|
(75)
|
65
|
260
|
428
|
678
|
|||||||||
|
Amounts reclassified
from accumulated OCI
|
416
|
1
|
(16)
|
1
|
36
|
2
|
(933)
|
3
|
(497)
|
|||||
|
Net other comprehensive
income (loss)
|
341
|
49
|
296
|
(505)
|
181
|
|||||||||
|
Balance as of December 31, 2014
|
(26)
|
499
|
741
|
6,847
|
8,061
|
|||||||||
|
Other comprehensive income
(loss) before reclassifications
|
(1,172)
|
-
|
(763)
|
45
|
(1,890)
|
|||||||||
|
Amounts reclassified
from accumulated OCI
|
-
|
1
|
(15)
|
1
|
38
|
2
|
(860)
|
3
|
(837)
|
|||||
|
Net other comprehensive
income (loss)
|
(1,172)
|
(15)
|
(725)
|
(815)
|
(2,727)
|
|||||||||
|
Balance as of December 31, 2015
|
(1,198)
|
484
|
16
|
6,032
|
5,334
|
|||||||||
|
Other comprehensive income
(loss) before reclassifications
|
(797)
|
58
|
690
|
497
|
448
|
|||||||||
|
Amounts reclassified
from accumulated OCI
|
-
|
1
|
(1)
|
1
|
38
|
2
|
(858)
|
3
|
(821)
|
|||||
|
Net other comprehensive
income (loss)
|
(797)
|
57
|
728
|
(361)
|
(373)
|
|||||||||
|
Balance as of December 31, 2016
|
$
|
(1,995)
|
$
|
541
|
$
|
744
|
$
|
5,671
|
$
|
4,961
|
||||
|
1 (Gains) losses are included in Other income (expense) - net in the consolidated statements of income.
|
||||||||||||||
|
2 (Gains) losses are included in interest expense in the consolidated statements of income. See Note 10 for additional information.
|
||||||||||||||
|
3 The amortization of prior service credits associated with postretirement benefits, net of amounts capitalized as part of construction labor, are included in Cost of services and sales and Selling, general and administrative in the consolidated statements of income (see Note 12).
|
||||||||||||||
50
Notes to Consolidated Financial Statements (continued)
Dollars in millions except per share amounts
NOTE 4. SEGMENT INFORMATION
Our segments are strategic business units that offer products and services to different customer segments over various technology platforms and/or in different geographies that are managed accordingly. We analyze our segments based on Segment Contribution, which consists of operating income, excluding acquisition-related costs and other significant items (as discussed below), and equity in net income (loss) of affiliates for investments managed within each segment. We have four reportable segments: (1) Business Solutions, (2) Entertainment Group, (3) Consumer Mobility and (4) International.
We also evaluate segment performance based on EBITDA and/or EBITDA margin, which is defined as Segment Contribution excluding equity in net income (loss) of affiliates and depreciation and amortization. We believe EBITDA to be a relevant and useful measurement to our investors as it is part of our internal management reporting and planning processes and it is an important metric that management uses to evaluate segment operating performance. EBITDA does not give effect to cash used for debt service requirements and thus does not reflect available funds for distributions, reinvestment or other discretionary uses. EBITDA margin is EBITDA divided by total revenues.
The Business Solutions segment provides services to business customers, including multinational companies; governmental and wholesale customers; and individual subscribers who purchase wireless services through employer-sponsored plans. We provide advanced IP-based services including Virtual Private Networks (VPN); Ethernet-related products and broadband, collectively referred to as fixed strategic services; as well as traditional data and voice products. We utilize our wireless and wired networks (referred to as “wired” or “wireline”) to provide a complete communications solution to our business customers.
The Entertainment Group segment provides video, internet, voice communication, and interactive and targeted advertising services to customers located in the United States or in U.S. territories. We utilize our copper and IP-based wired network and/or our satellite technology.
The Consumer Mobility segment provides nationwide wireless service to consumers and wholesale and resale wireless subscribers located in the United States or in U.S. territories. We utilize our networks to provide voice and data services, including high-speed internet, video and home monitoring services over wireless devices.
The International segment provides entertainment services in Latin America and wireless services in Mexico. Video entertainment services are provided to primarily residential customers using satellite technology. We utilize our regional and national wireless networks in Mexico to provide consumer and business customers with wireless data and voice communication services. Our international subsidiaries conduct business in their local currency, and operating results are converted to U.S. dollars using official exchange rates.
In reconciling items to consolidated operating income and income before income taxes, Corporate and Other includes: (1) operations that are not considered reportable segments and that are no longer integral to our operations or which we no longer actively market, and (2) impacts of corporate-wide decisions for which the individual segments are not being evaluated, including interest costs and expected return on plan assets for our pension and postretirement benefit plans.
Certain operating items are not allocated to our business segments, and those include:
|
·
|
Acquisition-related items which consist of (1) items associated with the merger and integration of acquired businesses and (2) the noncash amortization of intangible assets acquired in acquisitions.
|
|
·
|
Certain significant items which consist of (1) noncash actuarial gains and losses from pension and other postretirement benefits, (2) employee separation charges associated with voluntary and/or strategic offers, (3) losses resulting from abandonment or impairment of assets and (4) other items for which the segments are not being evaluated.
|
Interest expense and other income (expense) – net, are managed only on a total company basis and are, accordingly, reflected only in consolidated results.
Our operating assets are utilized by multiple segments and consist of our wireless and wired networks as well as our satellite fleet. We manage our assets to provide for the most efficient, effective and integrated service to our customers, not by segment, and, therefore, asset information and capital expenditures by segment are not presented. Depreciation is allocated based on network usage or asset utilization by segment.
51
Notes to Consolidated Financial Statements (continued)
Dollars in millions except per share amounts
|
For the year ended December 31, 2016
|
||||||||||||||||||||||||||||
|
Revenues
|
Operations
and Support
Expenses
|
EBITDA
|
Depreciation
and
Amortization
|
Operating
Income
(Loss)
|
Equity in Net
Income
(Loss) of
Affiliates
|
Segment
Contribution
|
||||||||||||||||||||||
|
Business Solutions
|
$
|
70,988
|
$
|
44,330
|
$
|
26,658
|
$
|
9,832
|
$
|
16,826
|
$
|
-
|
$
|
16,826
|
||||||||||||||
|
Entertainment Group
|
51,295
|
39,338
|
11,957
|
5,862
|
6,095
|
9
|
6,104
|
|||||||||||||||||||||
|
Consumer Mobility
|
33,200
|
19,659
|
13,541
|
3,716
|
9,825
|
-
|
9,825
|
|||||||||||||||||||||
|
International
|
7,283
|
6,830
|
453
|
1,166
|
(713
|
)
|
52
|
(661
|
)
|
|||||||||||||||||||
|
Segment Total
|
162,766
|
110,157
|
52,609
|
20,576
|
32,033
|
$
|
61
|
$
|
32,094
|
|||||||||||||||||||
|
Corporate and Other
|
1,043
|
1,173
|
(130
|
)
|
65
|
(195
|
)
|
|||||||||||||||||||||
|
Acquisition-related items
|
-
|
1,203
|
(1,203
|
)
|
5,177
|
(6,380
|
)
|
|||||||||||||||||||||
|
Certain significant items
|
(23
|
)
|
1,059
|
(1,082
|
)
|
29
|
(1,111
|
)
|
||||||||||||||||||||
|
AT&T Inc.
|
$
|
163,786
|
$
|
113,592
|
$
|
50,194
|
$
|
25,847
|
$
|
24,347
|
||||||||||||||||||
|
For the year ended December 31, 2015
|
||||||||||||||||||||||||||||
|
Revenues
|
Operations
and Support
Expenses
|
EBITDA
|
Depreciation
and
Amortization
|
Operating
Income
(Loss)
|
Equity in Net
Income
(Loss) of
Affiliates
|
Segment
Contribution
|
||||||||||||||||||||||
|
Business Solutions
|
$
|
71,127
|
$
|
44,946
|
$
|
26,181
|
$
|
9,789
|
$
|
16,392
|
$
|
-
|
$
|
16,392
|
||||||||||||||
|
Entertainment Group
|
35,294
|
28,345
|
6,949
|
4,945
|
2,004
|
(4
|
)
|
2,000
|
||||||||||||||||||||
|
Consumer Mobility
|
35,066
|
21,477
|
13,589
|
3,851
|
9,738
|
-
|
9,738
|
|||||||||||||||||||||
|
International
|
4,102
|
3,930
|
172
|
655
|
(483
|
)
|
(5
|
)
|
(488
|
)
|
||||||||||||||||||
|
Segment Total
|
145,589
|
98,698
|
46,891
|
19,240
|
27,651
|
$
|
(9
|
)
|
$
|
27,642
|
||||||||||||||||||
|
Corporate and Other
|
1,297
|
1,057
|
240
|
64
|
176
|
|||||||||||||||||||||||
|
Acquisition-related items
|
(85
|
)
|
1,987
|
(2,072
|
)
|
2,712
|
(4,784
|
)
|
||||||||||||||||||||
|
Certain significant items
|
-
|
(1,742
|
)
|
1,742
|
-
|
1,742
|
||||||||||||||||||||||
|
AT&T Inc.
|
$
|
146,801
|
$
|
100,000
|
$
|
46,801
|
$
|
22,016
|
$
|
24,785
|
||||||||||||||||||
52
Notes to Consolidated Financial Statements (continued)
Dollars in millions except per share amounts
|
For the year ended December 31, 2014
|
||||||||||||||||||||||||||||
|
Revenues
|
Operations
and Support
Expenses
|
EBITDA
|
Depreciation
and
Amortization
|
Operating
Income
(Loss)
|
Equity in Net
Income (Loss)
of
Affiliates
|
Segment
Contribution
|
||||||||||||||||||||||
|
Business Solutions
|
$
|
70,606
|
$
|
45,826
|
$
|
24,780
|
$
|
9,355
|
$
|
15,425
|
$
|
-
|
$
|
15,425
|
||||||||||||||
|
Entertainment Group
|
22,233
|
18,992
|
3,241
|
4,473
|
(1,232
|
)
|
(2
|
)
|
(1,234
|
)
|
||||||||||||||||||
|
Consumer Mobility
|
36,769
|
23,891
|
12,878
|
3,827
|
9,051
|
(1
|
)
|
9,050
|
||||||||||||||||||||
|
International
|
-
|
-
|
-
|
-
|
-
|
153
|
153
|
|||||||||||||||||||||
|
Segment Total
|
129,608
|
88,709
|
40,899
|
17,655
|
23,244
|
$
|
150
|
$
|
23,394
|
|||||||||||||||||||
|
Corporate and Other
|
2,839
|
2,471
|
368
|
105
|
263
|
|||||||||||||||||||||||
|
Acquisition-related items
|
-
|
785
|
(785
|
)
|
487
|
(1,272
|
)
|
|||||||||||||||||||||
|
Certain significant items
|
-
|
9,997
|
(9,997
|
)
|
26
|
(10,023
|
)
|
|||||||||||||||||||||
|
AT&T Inc.
|
$
|
132,447
|
$
|
101,962
|
$
|
30,485
|
$
|
18,273
|
$
|
12,212
|
||||||||||||||||||
53
Notes to Consolidated Financial Statements (continued)
Dollars in millions except per share amounts
|
The following table is a reconciliation of operating income (loss) to “Income Before Income Taxes” reported in our consolidated statements of income:
|
||||||||||||
|
2016
|
2015
|
2014
|
||||||||||
|
Business Solutions
|
$
|
16,826
|
$
|
16,392
|
$
|
15,425
|
||||||
|
Entertainment Group
|
6,104
|
2,000
|
(1,234
|
)
|
||||||||
|
Consumer Mobility
|
9,825
|
9,738
|
9,050
|
|||||||||
|
International
|
(661
|
)
|
(488
|
)
|
153
|
|||||||
|
Segment Contribution
|
32,094
|
27,642
|
23,394
|
|||||||||
| Reconciling Items: | ||||||||||||
|
Corporate and Other
|
(195
|
)
|
176
|
263
|
||||||||
|
Merger and integration charges
|
(1,203
|
)
|
(2,072
|
)
|
(785
|
)
|
||||||
|
Amortization of intangibles acquired
|
(5,177
|
)
|
(2,712
|
)
|
(487
|
)
|
||||||
|
Actuarial gain (loss)
|
(1,024
|
)
|
2,152
|
(7,869
|
)
|
|||||||
|
Employee separation costs
|
(344
|
)
|
(375
|
)
|
-
|
|||||||
|
Gain on wireless spectrum transactions
|
714
|
-
|
-
|
|||||||||
|
Storm related and other items
|
(67
|
)
|
-
|
-
|
||||||||
|
Asset abandonments and impairments
|
(390
|
)
|
(35
|
)
|
(2,154
|
)
|
||||||
|
Segment equity in net income (loss) of affiliates
|
(61
|
)
|
9
|
(150
|
)
|
|||||||
|
AT&T Operating Income
|
24,347
|
24,785
|
12,212
|
|||||||||
|
Interest expense
|
4,910
|
4,120
|
3,613
|
|||||||||
|
Equity in net income of affiliates
|
98
|
79
|
175
|
|||||||||
|
Other income (expense) - net
|
277
|
(52
|
)
|
1,581
|
||||||||
|
Income Before Income Taxes
|
$
|
19,812
|
$
|
20,692
|
$
|
10,355
|
||||||
|
The following table sets forth revenues earned from subscribers, and property, plant and equipment located in different geographic areas.
|
||||||||||||||||||||||||
|
2016
|
2015
|
2014
|
||||||||||||||||||||||
|
Revenues
|
Net Property, Plant &
Equipment
|
Revenues
|
Net Property, Plant &
Equipment
|
Revenues
|
Net Property, Plant &
Equipment
|
|||||||||||||||||||
|
United States
|
$
|
154,039
|
$
|
118,664
|
$
|
140,234
|
$
|
118,515
|
$
|
129,772
|
$
|
112,092
|
||||||||||||
|
Latin America
|
||||||||||||||||||||||||
|
Brazil
|
2,797
|
1,265
|
1,224
|
1,384
|
142
|
33
|
||||||||||||||||||
|
Other
|
2,348
|
1,828
|
1,157
|
1,530
|
99
|
67
|
||||||||||||||||||
|
Mexico
|
2,472
|
2,520
|
2,046
|
2,369
|
94
|
20
|
||||||||||||||||||
|
Other
|
2,130
|
622
|
2,140
|
652
|
2,340
|
686
|
||||||||||||||||||
|
Total
|
$
|
163,786
|
$
|
124,899
|
$
|
146,801
|
$
|
124,450
|
$
|
132,447
|
$
|
112,898
|
||||||||||||
NOTE 5. ACQUISITIONS, DISPOSITIONS AND OTHER ADJUSTMENTS
Acquisitions
DIRECTV In July 2015, we completed our acquisition of DIRECTV, a leading provider of digital television entertainment services in both the United States and Latin America. For accounting purposes, the transaction was valued at $47,409. Our consolidated balance sheets include the assets and liabilities of DIRECTV, which have been measured at fair value.
The fair values of the assets acquired and liabilities assumed were determined using income, cost and market approaches. The fair value measurements were primarily based on significant inputs that are not observable in the market and are considered Level 3 under the Fair Value Measurement and Disclosure framework, other than long-term debt assumed in the acquisition (see Note 10). The income approach was primarily used to value the intangible assets, consisting primarily of acquired customer relationships, orbital slots and trade names. The income approach estimates fair value for an asset based on the
54
Notes to Consolidated Financial Statements (continued)
Dollars in millions except per share amounts
present value of cash flows projected to be generated by the asset. Projected cash flows are discounted at a required rate of return that reflects the relative risk of achieving the cash flows and the time value of money. The cost approach, which estimates value by determining the current cost of replacing an asset with another of equivalent economic utility, was used primarily for plant, property and equipment. The cost to replace a given asset reflects the estimated reproduction or replacement cost for the property, less an allowance for loss in value due to depreciation.
Goodwill is calculated as the difference between the acquisition date fair value of the consideration transferred and the fair value of the net assets acquired, and represents the future economic benefits that we expect to achieve as a result of acquisition. Purchased goodwill is not expected to be deductible for tax purposes. The goodwill was allocated to our Entertainment Group and International segments.
The following table summarizes the fair values of the DIRECTV assets acquired and liabilities assumed and related deferred income taxes as of the acquisition date.
|
Assets acquired
|
||||
|
Cash
|
$
|
4,797
|
||
|
Accounts receivable
|
2,038
|
|||
|
All other current assets
|
1,534
|
|||
|
Property, plant and equipment (including satellites)
|
9,320
|
|||
|
Intangible assets not subject to amortization
|
||||
|
Orbital slots
|
11,946
|
|||
|
Trade name
|
1,371
|
|||
|
Intangible assets subject to amortization
|
||||
|
Customer lists and relationships
|
19,508
|
|||
|
Trade name
|
2,915
|
|||
|
Other
|
445
|
|||
|
Investments and other assets
|
2,375
|
|||
|
Goodwill
|
34,619
|
|||
|
Total assets acquired
|
90,868
|
|||
|
Liabilities assumed
|
||||
|
Current liabilities, excluding current portion of long-term debt
|
5,645
|
|||
|
Long-term debt
|
20,585
|
|||
|
Other noncurrent liabilities
|
16,875
|
|||
|
Total liabilities assumed
|
43,105
|
|||
|
Net assets acquired
|
47,763
|
|||
|
Noncontrolling interest
|
(354
|
)
|
||
|
Aggregate value of consideration paid
|
$
|
47,409
|
||
55
Notes to Consolidated Financial Statements (continued)
Dollars in millions except per share amounts
For the 160-day period ended December 31, 2015, our consolidated statement of income included $14,561 of revenues and $(46) of operating income, which included $2,254 of intangible amortization, from DIRECTV and its affiliates. The following unaudited pro forma consolidated results of operations assume that the acquisition of DIRECTV was completed as of January 1, 2014.
|
(Unaudited)
|
||||||||
|
Year Ended
|
||||||||
|
December 31,
|
||||||||
|
2015
|
2014
|
|||||||
|
Total operating revenues
|
$
|
165,694
|
$
|
165,595
|
||||
|
Net Income Attributable to AT&T
|
12,683
|
6,412
|
||||||
|
Basic Earnings Per Share Attributable to AT&T
|
$
|
2.06
|
$
|
1.04
|
||||
|
Diluted Earnings Per Share Attributable to AT&T
|
$
|
2.06
|
$
|
1.04
|
||||
Nextel Mexico In April 2015, we completed our acquisition of the subsidiaries of NII Holdings Inc., operating its wireless business in Mexico, for $1,875, including approximately $427 of net debt and other adjustments. The subsidiaries offered service under the name Nextel Mexico.
The purchase price allocation of assets acquired was: $376 in licenses, $1,167 in property, plant and equipment, $128 in customer lists and $193 of goodwill. The goodwill was allocated to our International segment.
GSF Telecom In January 2015, we acquired Mexican wireless company GSF Telecom Holdings, S.A.P.I. de C.V. (GSF Telecom) for $2,500, including net debt of approximately $700. GSF Telecom offered service under both the Iusacell and Unefon brand names in Mexico.
The purchase price allocation of assets acquired was: $735 in licenses, $658 in property, plant and equipment, $378 in customer lists, $26 in trade names and $956 of goodwill. The goodwill was allocated to our International segment.
AWS-3 Auction In January 2015, we submitted winning bids of $18,189 in the Advanced Wireless Service (AWS)-3 Auction (FCC Auction 97), a portion of which represented spectrum clearing and First Responder Network Authority funding. We provided the Federal Communications Commission (FCC) an initial down payment of $921 in October 2014 and paid the remaining $17,268 in the first quarter of 2015.
Spectrum Acquisitions and Swaps On occasion, we swap spectrum with other wireless providers to ensure we have efficient and contiguous coverage across our markets and service areas. During 2016, we swapped FCC licenses with a fair value of approximately $2,122 with other carriers and recorded a net gain of $714.
During 2015, we acquired $489 of wireless spectrum, not including the AWS auction. During 2014, we acquired $1,263 of wireless spectrum, not including Leap Wireless International, Inc. (Leap) discussed below.
Leap In March 2014, we acquired Leap, a provider of prepaid wireless service, for $15.00 per outstanding share of Leap’s common stock, or $1,248 (excluding Leap’s cash on hand), plus one nontransferable contingent value right (CVR) per share. The CVR entitled each Leap stockholder to a pro rata share of the net proceeds of the sale of the Chicago 700 MHz A-band FCC license held by Leap. In November 2016, we completed the sale of the Chicago 700 MHz A-band FCC license and proceeds will be distributed to the former Leap stockholders during the first quarter of 2017, as required by the agreement.
Pending Acquisition
Time Warner Inc. On October 22, 2016, we entered into and announced a merger agreement (Merger Agreement) to acquire Time Warner Inc. (Time Warner) in a 50% cash and 50% stock transaction for $107.50 per share of Time Warner common stock, or approximately $85,400 at the date of the announcement (Merger). Combined with Time Warner’s net debt at September 30, 2016, the total transaction value is approximately $108,700. Each share of Time Warner common stock will be exchanged for $53.75 per share in cash and a number of shares of AT&T common stock equal to the exchange ratio. If the average stock price (as defined in the Merger Agreement) at the time of closing the Merger is between (or equal to) $37.411 and $41.349 per share, the exchange ratio will be the quotient of $53.75 divided by the average stock price. If the average stock price is greater than $41.349, the exchange ratio will be 1.300. If the average stock price is less
56
Notes to Consolidated Financial Statements (continued)
Dollars in millions except per share amounts
than $37.411, the exchange ratio will be 1.437. Post-transaction, Time Warner shareholders will own between 14.4% and 15.7% of AT&T shares on a fully-diluted basis based on the number of AT&T shares outstanding. The cash portion of the purchase price will be financed with new debt and cash (see Note 9).
Time Warner is a global leader in media and entertainment whose major businesses encompass an array of some of the most respected and successful media brands. The deal combines Time Warner’s vast library of content and ability to create new premium content for audiences around the world with our extensive customer relationships and distribution; one of the world’s largest pay-TV subscriber bases; and leading scale in TV, mobile and broadband distribution.
The Merger Agreement was approved by Time Warner shareholders on February 15, 2017 and remains subject to review by the U.S. Department of Justice. While subject to change, we expect that Time Warner will not need to transfer any of its FCC licenses to AT&T in order to conduct its business operations after the closing of the transaction. It is also a condition to closing that necessary consents from certain public utility commissions and foreign governmental entities must be obtained. The transaction is expected to close before year-end 2017. If the Merger is terminated as a result of reaching the termination date (and at that time one or more of the conditions relating to certain regulatory approvals have not been satisfied) or there is a final, non-appealable order preventing the transaction relating to antitrust laws, communications laws, utilities laws or foreign regulatory laws, then under certain circumstances we would be obligated to pay Time Warner $500.
Dispositions
Connecticut Wireline In October 2014, we sold our incumbent local exchange operations in Connecticut for $2,018 and recorded a pre-tax gain of $76, which is included in “Other income (expense) – net,” in our consolidated statements of income. In conjunction with the sale, we allocated $743 of goodwill from our former Wireline reporting unit. Because the book value of the goodwill did not have a corresponding tax basis, the resulting net income impact of the sale was a loss of $360.
América Móvil In 2014, we sold our remaining equity method investment in América Móvil S.A. de C.V. (América Móvil) for approximately $5,885 and recorded a pre-tax gain of $1,330, which is included in “Other income (expense) – net,” in our consolidated statements of income.
57
Notes to Consolidated Financial Statements (continued)
Dollars in millions except per share amounts
NOTE 6. PROPERTY, PLANT AND EQUIPMENT
Property, plant and equipment is summarized as follows at December 31:
|
Lives (years)
|
2016
|
2015
|
||||||||||
|
Land
|
-
|
$
|
1,643
|
$
|
1,638
|
|||||||
|
Buildings and improvements
|
2-44
|
35,036
|
33,784
|
|||||||||
|
Central office equipment1
|
3-10
|
92,954
|
93,643
|
|||||||||
|
Cable, wiring and conduit
|
15-50
|
79,279
|
75,784
|
|||||||||
|
Satellites
|
12-15
|
2,710
|
2,088
|
|||||||||
|
Other equipment
|
2-23
|
88,436
|
81,972
|
|||||||||
|
Software
|
3-5
|
14,472
|
11,347
|
|||||||||
|
Under construction
|
-
|
5,118
|
5,971
|
|||||||||
|
319,648
|
306,227
|
|||||||||||
|
Accumulated depreciation and amortization
|
194,749
|
181,777
|
||||||||||
|
Property, plant and equipment - net
|
$
|
124,899
|
$
|
124,450
|
||||||||
|
1 Includes certain network software.
|
||||||||||||
Our depreciation expense was $20,661 in 2016, $19,289 in 2015 and $17,773 in 2014. Depreciation expense included amortization of software totaling $2,362 in 2016, $1,660 in 2015 and $1,504 in 2014.
We periodically assess our network assets for impairment and during the fourth quarter of 2016 we recorded a noncash pretax charge of $278 for the impairment of certain wireless assets that were under construction. These assets primarily related to capitalized costs for wireless sites that are no longer in our construction plans. During 2014, due to declining customer demand for our legacy voice and data products and the migration of our networks to next generation technologies, we decided to abandon in place specific copper network assets classified as cable, wiring and conduit. These abandoned assets had a gross book value of approximately $7,141, with accumulated depreciation of $5,021. In 2014, we recorded a $2,120 noncash pretax charge for this abandonment. These charges are included in “Asset abandonments and impairments” in our consolidated statements of income.
Certain facilities and equipment used in operations are leased under operating or capital leases. Rental expenses under operating leases were $4,482 for 2016, $5,025 for 2015 and $4,345 for 2014. At December 31, 2016, the future minimum rental payments under noncancelable operating leases for the years 2017 through 2021 were $3,915, $3,706, $3,448, $3,208 and $2,811, with $12,569 due thereafter. Certain real estate operating leases contain renewal options that may be exercised. Capital leases are not significant.
58
Notes to Consolidated Financial Statements (continued)
Dollars in millions except per share amounts
NOTE 7. GOODWILL AND OTHER INTANGIBLE ASSETS
The following table sets forth the changes in the carrying amounts of goodwill by segment, which is the same as reporting unit for Business Solutions, Entertainment Group and Consumer Mobility. The International segment has three reporting units: Mexico Wireless, Brazil and PanAmericana.
|
Business Solutions
|
Entertainment Group
|
Consumer Mobility
|
International
|
Wireless
|
Wireline
|
Total
|
|||||||||||||||||||||||
|
Balance as of December 31, 2014
|
$
|
|
-
|
$
|
-
|
$
|
-
|
$
|
-
|
$
|
36,469
|
$
|
33,223
|
$
|
69,692
|
||||||||||||||
|
Goodwill acquired
|
-
|
30,839
|
-
|
4,672
|
6
|
-
|
35,517
|
||||||||||||||||||||||
|
Foreign currency translation adjustments
|
-
|
-
|
-
|
(638
|
)
|
-
|
-
|
(638
|
)
|
||||||||||||||||||||
|
Allocation of goodwill
|
45,351
|
7,834
|
16,512
|
-
|
(36,471
|
)
|
(33,226
|
)
|
-
|
||||||||||||||||||||
|
Other
|
-
|
-
|
-
|
(2
|
)
|
(4
|
)
|
3
|
(3
|
)
|
|||||||||||||||||||
|
Balance as of December 31, 2015
|
45,351
|
38,673
|
16,512
|
4,032
|
-
|
-
|
104,568
|
||||||||||||||||||||||
|
Goodwill acquired
|
22
|
380
|
14
|
65
|
-
|
-
|
481
|
||||||||||||||||||||||
|
Foreign currency translation adjustments
|
-
|
-
|
-
|
167
|
-
|
-
|
167
|
||||||||||||||||||||||
|
Other
|
(9
|
)
|
-
|
-
|
-
|
-
|
-
|
(9
|
)
|
||||||||||||||||||||
|
Balance as of December 31, 2016
|
$
|
|
45,364
|
$
|
39,053
|
$
|
16,526
|
$
|
4,264
|
$
|
-
|
$
|
-
|
$
|
105,207
|
||||||||||||||
The majority of our goodwill acquired during 2016 related to the final valuation of DIRECTV, Nextel Mexico and GSF Telecom, as well as our acquisition of Quickplay Media. Other changes to our goodwill in 2016 include foreign currency translation adjustments.
The majority of our goodwill acquired during 2015 related to our acquisitions of DIRECTV, Nextel Mexico and GSF Telecom. Other changes to our goodwill in 2015 include foreign currency translation adjustments and the final valuation of Leap.
The allocation of goodwill represents goodwill previously assigned to our Wireless and Wireline segments. As part of our organizational realignment in 2015, the goodwill from the previous Wireless segment was allocated to the Business Solutions and Consumer Mobility segments and the goodwill from the previous Wireline segment was allocated to the Business Solutions and Entertainment Group segments. The allocations were based on the relative fair value of the portions of the previous Wireless and Wireline segments which were moved into the new Business Solutions, Entertainment Group and Consumer Mobility segments.
59
Notes to Consolidated Financial Statements (continued)
Dollars in millions except per share amounts
Our other intangible assets are summarized as follows:
|
December 31, 2016
|
December 31, 2015
|
|||||||||||||||||||||||
|
Other Intangible Assets
|
Gross
Carrying
Amount
|
Currency Translation Adjustment
|
Accumulated Amortization
|
Gross
Carrying
Amount
|
Currency Translation Adjustment
|
Accumulated Amortization
|
||||||||||||||||||
|
Amortized intangible assets:
|
||||||||||||||||||||||||
|
Customer lists and relationships:
|
||||||||||||||||||||||||
|
Wireless acquisitions
|
$
|
942
|
$
|
-
|
$
|
715
|
$
|
1,055
|
$
|
-
|
$
|
679
|
||||||||||||
|
BellSouth Corporation
|
4,450
|
-
|
4,429
|
4,450
|
-
|
4,347
|
||||||||||||||||||
|
DIRECTV
|
19,547
|
(125
|
)
|
5,618
|
19,505
|
(294
|
)
|
1,807
|
||||||||||||||||
|
AT&T Corp.
|
33
|
-
|
26
|
33
|
-
|
23
|
||||||||||||||||||
|
Mexican wireless
|
506
|
(108
|
)
|
214
|
485
|
(60
|
)
|
110
|
||||||||||||||||
|
Subtotal
|
25,478
|
(233
|
)
|
11,002
|
25,528
|
(354
|
)
|
6,966
|
||||||||||||||||
|
Trade name
|
2,942
|
(7
|
)
|
1,394
|
2,905
|
-
|
424
|
|||||||||||||||||
|
Other
|
707
|
(3
|
)
|
283
|
686
|
-
|
195
|
|||||||||||||||||
|
Total
|
$
|
29,127
|
$
|
(243
|
)
|
$
|
12,679
|
$
|
29,119
|
$
|
(354
|
)
|
$
|
7,585
|
||||||||||
|
Indefinite-lived intangible assets not subject to amortization:
|
||||||||||||||||||||||||
|
Licenses:
|
||||||||||||||||||||||||
|
Wireless licenses
|
$
|
82,474
|
$
|
81,147
|
||||||||||||||||||||
|
Orbital slots
|
11,702
|
11,946
|
||||||||||||||||||||||
|
Trade name
|
6,479
|
6,437
|
||||||||||||||||||||||
|
Total
|
$
|
100,655
|
$
|
99,530
|
||||||||||||||||||||
We review indefinite-lived intangible assets for impairment annually (see Note 1). Wireless licenses provide us with the exclusive right to utilize certain radio frequency spectrum to provide mobile communications services in the United States and Mexico. Orbital slots represent the space in which we operate the broadcast satellites that support our digital video entertainment service offerings.
Amortized intangible assets are definite-life assets, and, as such, we record amortization expense based on a method that most appropriately reflects our expected cash flows from these assets, over a weighted-average life of 8.5 years (9.2 years for customer lists and relationships and 4.2 years for trade names and other). Amortization expense for definite-life intangible assets was $5,186 for the year ended December 31, 2016, $2,728 for the year ended December 31, 2015 and $500 for the year ended December 31, 2014. Amortization expense is estimated to be $4,612 in 2017, $3,573 in 2018, $2,516 in 2019, $2,038 in 2020, and $1,563 in 2021.
In 2016, we wrote off approximately $117 of fully amortized intangible assets (primarily customer lists). In 2015, we wrote off approximately $1,483 of fully amortized intangible assets (primarily customer lists). We review amortized intangible assets for impairment whenever events or circumstances indicate that the carrying amount may not be recoverable over the remaining life of the asset or asset group.
60
Notes to Consolidated Financial Statements (continued)
Dollars in millions except per share amounts
NOTE 8. EQUITY METHOD INVESTMENTS
Investments in partnerships, joint ventures and less than majority-owned subsidiaries in which we have significant influence are accounted for under the equity method.
Our investments in equity affiliates at December 31, 2016 primarily include our interests in SKY Mexico, Game Show Network and Otter Media Holdings.
SKY Mexico We hold a 41.3% interest in SKY Mexico, which is a leading pay-TV provider in Mexico.
Game Show Network (GSN) We hold a 42.0% interest in GSN, a television network dedicated to game-related programming and internet interactive game playing.
Otter Media Holdings We hold a 48.3% interest in Otter Media Holdings, a venture between The Chernin Group and AT&T that is focused on acquiring, investing and launching over-the-top subscription video services.
The following table is a reconciliation of our investments in equity affiliates as presented on our consolidated balance sheets:
|
2016
|
2015
|
|||||||
|
Beginning of year
|
$
|
1,606
|
$
|
250
|
||||
|
Additional investments
|
208
|
77
|
||||||
|
DIRECTV investments acquired
|
-
|
1,232
|
||||||
|
Equity in net income of affiliates
|
98
|
79
|
||||||
|
Dividends and distributions received
|
(61
|
)
|
(30
|
)
|
||||
|
Currency translation adjustments
|
(156
|
)
|
-
|
|||||
|
Other adjustments
|
(21
|
)
|
(2
|
)
|
||||
|
End of year
|
$
|
1,674
|
$
|
1,606
|
||||
Undistributed earnings from equity affiliates were $196 and $162 at December 31, 2016 and 2015.
61
Notes to Consolidated Financial Statements (continued)
Dollars in millions except per share amounts
NOTE 9. DEBT
Long-term debt of AT&T and its subsidiaries, including interest rates and maturities, is summarized as follows at December 31:
|
2016
|
2015
|
||||||||||||
|
Notes and debentures1
|
|||||||||||||
| Interest Rates |
Maturities2
|
||||||||||||
|
0.49% – 2.99%
|
2016 – 2022 |
|
$
|
26,396
|
$
|
34,265
|
|||||||
|
3.00% – 4.99%
|
2016 – 2049 |
|
66,520
|
54,678
|
|||||||||
|
5.00% – 6.99%
|
2016 – 2095 |
|
26,883
|
31,140
|
|||||||||
|
7.00% – 9.50%
|
2016 – 2097 |
|
5,050
|
5,805
|
|||||||||
|
Other
|
4
|
15
|
|||||||||||
|
Fair value of interest rate swaps recorded in debt
|
48
|
109
|
|||||||||||
|
124,901
|
126,012
|
||||||||||||
|
Unamortized (discount) premium - net
|
(2,201
|
)
|
(842
|
)
|
|||||||||
|
Unamortized issuance costs
|
(319
|
)
|
(323
|
)
|
|||||||||
|
Total notes and debentures
|
122,381
|
124,847
|
|||||||||||
|
Capitalized leases
|
869
|
884
|
|||||||||||
|
Other
|
259
|
416
|
|||||||||||
|
Total long-term debt, including current maturities
|
123,509
|
126,147
|
|||||||||||
|
Current maturities of long-term debt
|
(9,828
|
)
|
(7,632
|
)
|
|||||||||
|
Total long-term debt
|
$
|
113,681
|
$
|
118,515
|
|||||||||
|
1 Includes credit agreement borrowings.
|
|||||||||||||
|
2 Maturities assume putable debt is redeemed by the holders at the next opportunity.
|
|||||||||||||
We had outstanding Euro, British pound sterling, Canadian dollar, Swiss franc and Brazilian real denominated debt of approximately $24,292 and $26,221 at December 31, 2016 and 2015. The weighted-average interest rate of our entire long-term debt portfolio, including the impact of derivatives, increased from 4.0% at December 31, 2015 to 4.2% at December 31, 2016.
Current maturities of long-term debt include debt that may be put back to us by the holders in 2017. We have $1,000 of annual put reset securities that may be put each April until maturity in 2021. If the holders do not require us to repurchase the securities, the interest rate will be reset based on current market conditions. Likewise, we have an accreting zero-coupon note that may be redeemed each May, until maturity in 2022. If the zero-coupon note (issued for principal of $500 in 2007) is held to maturity, the redemption amount will be $1,030.
Debt maturing within one year consisted of the following at December 31:
|
2016
|
2015
|
|||||
|
Current maturities of long-term debt
|
$
|
9,828
|
$
|
7,632
|
||
|
Bank borrowings1
|
4
|
4
|
||||
|
Total
|
$
|
9,832
|
$
|
7,636
|
||
|
1 Outstanding balance of short-term credit facility of a foreign subsidiary.
|
||||||
Financing Activities
During 2016, we issued $10,140 in long-term debt in various markets, with an average weighted maturity of approximately 12 years and a weighted average coupon of 3.8%. We redeemed $10,823 in borrowings of various notes with stated rates of 1.00% to 9.10%.
62
Notes to Consolidated Financial Statements (continued)
Dollars in millions except per share amounts
During 2016 we completed the following long-term debt issuances:
|
·
|
February issuance of $1,250 of 2.800% global notes due 2021.
|
|
·
|
February issuance of $1,500 of 3.600% global notes due 2023.
|
|
·
|
February issuance of $1,750 of 4.125% global notes due 2026.
|
|
·
|
February issuance of $1,500 of 5.650% global notes due 2047.
|
|
·
|
May issuance of $750 of 2.300% global notes due 2019.
|
|
·
|
May issuance of $750 of 2.800% global notes due 2021.
|
|
·
|
May issuance of $1,100 of 3.600% global notes due 2023.
|
|
·
|
May issuance of $900 of 4.125% global notes due 2026.
|
|
·
|
May issuance of $500 of 4.800% global notes due 2044.
|
On February 9, 2017, we completed the following long-term debt issuances:
|
·
|
$1,250 of 3.200% global notes due 2022.
|
|
·
|
$750 of 3.800% global notes due 2024.
|
|
·
|
$2,000 of 4.250% global notes due 2027.
|
|
·
|
$3,000 of 5.250% global notes due 2037.
|
|
·
|
$2,000 of 5.450% global notes due 2047.
|
|
·
|
$1,000 of 5.700% global notes due 2057.
|
As of December 31, 2016 and 2015, we were in compliance with all covenants and conditions of instruments governing our debt. Substantially all of our outstanding long-term debt is unsecured. Maturities of outstanding long-term notes and debentures, as of December 31, 2016, and the corresponding weighted-average interest rate scheduled for repayment are as follows:
|
2017
|
2018
|
2019
|
2020
|
2021
|
Thereafter
|
||||||||||||||
|
Debt repayments1
|
$
|
9,609
|
$
|
8,840
|
$
|
8,113
|
$
|
9,179
|
$
|
8,614
|
$
|
85,926
|
|||||||
|
Weighted-average interest rate
|
2.7
|
%
|
3.6
|
%
|
3.7
|
%
|
2.8
|
%
|
4.0
|
%
|
4.7
|
%
|
|||||||
|
1 Debt repayments assume putable debt is redeemed by the holders at the next opportunity.
|
|||||||||||||||||||
Credit Facilities
General
In December 2015, we entered into a five-year, $12,000 revolving credit agreement (the “Revolving Credit Agreement”) with certain banks. As of December 31, 2016, we have no amounts outstanding under this agreement.
In January 2015, we entered into a $9,155 credit agreement (the “Syndicated Credit Agreement”) containing (i) a $6,286 term loan (“Loan A”) and (ii) a $2,869 term loan (“Loan B”), with certain banks. In March 2015, we borrowed all amounts available under the agreement. Loan A will be due on March 2, 2018. Amounts borrowed under Loan B will be subject to amortization from March 2, 2018, with 25% of the aggregate principal amount thereof being payable prior to March 2, 2020, and all remaining principal amount due on March 2, 2020. In June 2016, we repaid $4,000 of the outstanding amount under Loan A and $1,000 of the outstanding amount under Loan B. After repayment, the amortization in Loan B has been satisfied. As of December 31, 2016, we have $2,286 outstanding under Loan A and $1,869 outstanding under Loan B.
On October 22, 2016, in connection with entering into the Time Warner merger agreement, AT&T entered into a $40,000 bridge loan with JPMorgan Chase Bank and Bank of America, as lenders (the “Bridge Loan”).
On November 15, 2016, we entered into a $10,000 term loan credit agreement (the “Term Loan”) with a syndicate of 20 lenders. In connection with this Term Loan, the “Tranche B Commitments” totaling $10,000 under the Bridge Loan were reduced to zero. The “Tranche A Commitments” under the Bridge Loan totaling $30,000 remain in effect.
No amounts will be borrowed under either the Bridge Loan or the Term Loan prior to the closing of the Time Warner merger. Borrowings under either agreement will be used solely to finance a portion of the cash to be paid in the Merger, the refinancing of debt of Time Warner and its subsidiaries and the payment of related expenses. Prior to the closing date of the Merger, only a payment or bankruptcy event of default would permit the lenders to terminate their commitments under either the Bridge Loan or the Term Loan.
Each of our credit and loan agreements contains covenants that are customary for an issuer with an investment grade senior debt credit rating, as well as a net debt-to-EBITDA (earnings before interest, taxes, depreciation and amortization, and other
63
Notes to Consolidated Financial Statements (continued)
Dollars in millions except per share amounts
modifications described in each agreement) financial ratio covenant requiring AT&T to maintain, as of the last day of each fiscal quarter, a ratio of not more than 3.5-to-1. The events of default are customary for agreements of this type and such events would result in the acceleration of, or would permit the lenders to accelerate, as applicable, required payments and would increase each agreement’s relevant Applicable Margin by 2.00% per annum.
Revolving Credit Agreement
The obligations of the lenders to advance funds under the Revolving Credit Agreement will end on December 11, 2020, unless prior to that date either: (i) AT&T reduces to $0 the commitments of the lenders, or (ii) certain events of default occur. We and lenders representing more than 50% of the facility amount may agree to extend their commitments for two one-year periods beyond the December 11, 2020 end date, under certain circumstances.
Advances under this agreement would bear interest, at AT&T’s option, either:
|
·
|
at a variable annual rate equal to (1) the highest of: (a) the base rate of the bank affiliate of Citibank, N.A., (b) 0.50% per annum above the Federal funds rate, and (c) the London Interbank Offered Rate (LIBOR) applicable to U.S. dollars for a period of one month plus 1.00% per annum, plus (2) an applicable margin (as set forth in this agreement); or
|
|
·
|
at a rate equal to: (i) LIBOR for a period of one, two, three or six months, as applicable, plus (ii) an applicable margin (as set forth in this agreement).
|
We will pay a facility fee of 0.070%, 0.090%, 0.100% or 0.125% per annum, depending on AT&T’s credit rating, of the amount of lender commitments.
The Syndicated Credit Agreement
Advances bear interest at a rate equal to: (i) the LIBOR for deposits in dollars (adjusted upwards to reflect any bank reserve costs) for a period of three or six months, as applicable, plus (ii) the applicable margin, as set forth in this agreement. The applicable margin under Loan A equals 1.000%, 1.125% or 1.250% per annum depending on AT&T’s credit ratings. The applicable margin under Loan B equals 1.125%, 1.250% or 1.375% per annum, depending on AT&T’s credit ratings.
Bridge Loan
The obligations of the lenders under the Bridge Loan to provide advances will terminate on the earliest of (i) October 23, 2017, subject to extension in certain cases to April 23, 2018, (ii) the closing of the Time Warner merger without the borrowing of advances under the Bridge Loan and (iii) the termination of the Merger Agreement.
Advances would bear interest, at AT&T’s option, either:
|
·
|
at a variable annual rate equal to: (1) the highest of (a) the prime rate of JPMorgan Chase Bank, (b) 0.5% per annum above the federal funds rate, and (c) the LIBOR applicable to dollars for a period of one month plus 1.00%, plus (2) an applicable margin, as set forth in this agreement (the “Applicable Margin for Base Advances (Bridge Loan)”); or
|
|
·
|
at a rate equal to: (i) LIBOR (adjusted upwards to reflect any bank reserve costs) for a period of one, two, three or six months, as applicable, plus (ii) an applicable margin, as set forth in this agreement (the “Applicable Margin for Eurodollar Rate Advances (Bridge Loan)”).
|
The Applicable Margin for Eurodollar Rate Advances (Bridge Loan) will be equal to 0.750%, 1.000%, 1.125%, 1.250% or 1.500% per annum depending on AT&T’s credit ratings. The Applicable Margin for Base Advances (Bridge Loan) will be equal to the greater of (x) 0.00% and (y) the relevant Applicable Margin for Eurodollar Rate Advances (Bridge Loan) minus 1.00% per annum, depending on AT&T’s credit ratings.
The Applicable Margin for Eurodollar Rate Advances (Bridge Loan) and the Applicable Margin for Base Advances (Bridge Loan) are scheduled to increase by an additional 0.25% on the 90th day after the closing of the Merger and another 0.25% every 90 days thereafter.
AT&T pays a commitment fee of 0.070%, 0.090%, 0.100%, 0.125% or 0.175% of the commitment amount per annum, depending on AT&T’s credit ratings.
We also must pay an additional fee of 0.500%, 0.750% and 1.000% on the amount of advances outstanding as of the 90th, 180th and 270th day after advances are made.
64
Notes to Consolidated Financial Statements (continued)
Dollars in millions except per share amounts
The Bridge Loan requires that the commitments of the lenders be reduced and outstanding advances be repaid with the net cash proceeds if we incur certain additional debt, we issue certain additional stock or we have certain sales or dispositions of assets by AT&T or its subsidiaries, in each case subject to exceptions set forth in the Bridge Loan.
Advances under the Bridge Loan are conditioned on the absence of a material adverse effect on Time Warner and certain customary conditions and repayment of all advances must be made no later than 364 days after the date on which the advances are made.
Term Loan
Under the Term Loan, there are two tranches of commitments, each in a total amount of $5,000.
The obligations of the lenders under the Term Loan to provide advances will terminate on the earliest of (i) October 23, 2017, subject to extension in certain cases to April 23, 2018, (ii) the closing of the Time Warner merger without the borrowing of advances under the Term Loan and (iii) the termination of the Merger Agreement.
Advances would bear interest, at AT&T’s option, either:
|
·
|
at a variable annual rate equal to: (1) the highest of (a) the prime rate of JPMorgan Chase Bank, N.A., (b) 0.5% per annum above the federal funds rate, and (c) the LIBOR rate applicable to dollars for a period of one month plus 1.00%, plus (2) an applicable margin, as set forth in the Term Loan (the “Applicable Margin for Base Advances (Term Loan)”); or
|
|
·
|
at a rate equal to: (i) LIBOR (adjusted upwards to reflect any bank reserve costs) for a period of one, two, three or six months, as applicable, plus (ii) an applicable margin, as set forth in the Term Loan (the “Applicable Margin for Eurodollar Rate Advances (Term Loan)”).
|
The Applicable Margin for Eurodollar Rate Advances (Term Loan) under Tranche A is equal to 1.000%, 1.125% or 1.250% per annum, depending on AT&T’s credit ratings. The Applicable Margin for Eurodollar Rate Advances (Term Loan) under Tranche B is equal to 1.125%, 1.250% or 1.375% per annum, depending on AT&T’s credit ratings. The Applicable Margin for Base Advances (Term Loan) is equal to the greater of (x) 0.00% and (y) the relevant Applicable Margin for Eurodollar Rate Advances (Term Loan) minus 1.00% per annum, depending on AT&T’s credit ratings.
AT&T pays a commitment fee of 0.090%, 0.100%, or 0.125% of the commitment amount per annum, depending on AT&T’s credit ratings.
Advances under the Term Loan are conditioned on the absence of a material adverse effect on Time Warner and certain customary conditions.
Repayment of all advances with respect to Tranche A must be made no later than two years and six months after the date on which such advances are made. Amounts borrowed under Tranche B will be subject to amortization commencing two years and nine months after the date on which such advances are made, with 25% of the aggregate principal amount thereof being payable prior to the date that is four years and six months after the date on which such advances are made, and all remaining principal amount due and payable on the date that is four years and six months after the date on which such advances are made.
65
Notes to Consolidated Financial Statements (continued)
Dollars in millions except per share amounts
NOTE 10. FAIR VALUE MEASUREMENTS AND DISCLOSURE
The Fair Value Measurement and Disclosure framework provides a three-tiered fair value hierarchy that gives highest priority to unadjusted quoted prices in active markets for identical assets or liabilities (Level 1 measurements) and the lowest priority to unobservable inputs (Level 3 measurements). The three levels of the fair value hierarchy are described below:
| Level 1 |
Inputs to the valuation methodology are unadjusted quoted prices for identical assets or liabilities in active markets that we have the ability to access.
|
| Level 2 |
Inputs to the valuation methodology include:
|
|
·
|
Quoted prices for similar assets and liabilities in active markets.
|
|
·
|
Quoted prices for identical or similar assets or liabilities in inactive markets.
|
|
·
|
Inputs other than quoted market prices that are observable for the asset or liability.
|
|
·
|
Inputs that are derived principally from or corroborated by observable market data by correlation or other means.
|
| Level 3 |
Inputs to the valuation methodology are unobservable and significant to the fair value measurement.
|
|
·
|
Fair value is often based on developed models in which there are few, if any, external observations.
|
The fair value measurements level of an asset or liability within the fair value hierarchy is based on the lowest level of any input that is significant to the fair value measurement. Our valuation techniques maximize the use of observable inputs and minimize the use of unobservable inputs.
The valuation methodologies described above may produce a fair value calculation that may not be indicative of future net realizable value or reflective of future fair values. We believe our valuation methods are appropriate and consistent with other market participants. The use of different methodologies or assumptions to determine the fair value of certain financial instruments could result in a different fair value measurement at the reporting date. There have been no changes in the methodologies used since December 31, 2015.
Long-Term Debt and Other Financial Instruments
The carrying amounts and estimated fair values of our long-term debt, including current maturities, and other financial instruments, are summarized as follows:
|
December 31, 2016
|
December 31, 2015
|
|||||||||||||||
|
Carrying
|
Fair
|
Carrying
|
Fair
|
|||||||||||||
|
Amount
|
Value
|
Amount
|
Value
|
|||||||||||||
|
Notes and debentures1
|
$
|
122,381
|
$
|
128,726
|
$
|
124,847
|
$
|
128,993
|
||||||||
|
Bank borrowings
|
4
|
4
|
4
|
4
|
||||||||||||
|
Investment securities
|
2,587
|
2,587
|
2,704
|
2,704
|
||||||||||||
|
1 Includes credit agreement borrowings.
|
||||||||||||||||
The carrying amount of debt with an original maturity of less than one year approximates fair value. The fair value measurements used for notes and debentures are considered Level 2 and are determined using various methods, including quoted prices for identical or similar securities in both active and inactive markets.
66
Notes to Consolidated Financial Statements (continued)
Dollars in millions except per share amounts
Following is the fair value leveling for available-for-sale securities and derivatives as of December 31, 2016, and December 31, 2015:
|
December 31, 2016
|
||||||||||||||||
|
Level 1
|
Level 2
|
Level 3
|
Total
|
|||||||||||||
|
Available-for-Sale Securities
|
||||||||||||||||
|
Domestic equities
|
$
|
1,215
|
$
|
-
|
$
|
-
|
$
|
1,215
|
||||||||
|
International equities
|
594
|
-
|
-
|
594
|
||||||||||||
|
Fixed income bonds
|
-
|
508
|
-
|
508
|
||||||||||||
|
Asset Derivatives1
|
||||||||||||||||
|
Interest rate swaps
|
-
|
79
|
-
|
79
|
||||||||||||
|
Cross-currency swaps
|
-
|
89
|
-
|
89
|
||||||||||||
|
Liability Derivatives1
|
||||||||||||||||
|
Interest rate swaps
|
-
|
(14
|
)
|
-
|
(14
|
)
|
||||||||||
|
Cross-currency swaps
|
-
|
(3,867
|
)
|
-
|
(3,867
|
)
|
||||||||||
|
1 Derivatives designated as hedging instruments are reflected as “Other assets,” “Other noncurrent liabilities” and, for a portion of interest rate swaps, “Other current assets” on our consolidated balance sheets.
|
||||||||||||||||
Investment Securities
Our investment securities include equities, fixed income bonds and other securities. A substantial portion of the fair values of our available-for-sale securities was estimated based on quoted market prices. Investments in securities not traded on a national securities exchange are valued using pricing models, quoted prices of securities with similar characteristics or discounted cash flows. Realized gains and losses on securities are included in “Other income (expense) – net” in the consolidated statements of income using the specific identification method. Unrealized gains and losses, net of tax, on available-for-sale securities are recorded in accumulated OCI. Unrealized losses that are considered other than temporary are recorded in “Other income (expense) – net” with the corresponding reduction to the carrying basis of the investment. Fixed income investments of $245 have maturities of less than one year, $58 within one to three years, $46 within three to five years, and $159 for five or more years.
Our cash equivalents (money market securities), short-term investments (certificate and time deposits) and nonrefundable customer deposits are recorded at amortized cost, and the respective carrying amounts approximate fair values. Short-term investments and nonrefundable customer deposits are recorded in “Other current assets” and our investment securities are recorded in “Other Assets” on the consolidated balance sheets.
Derivative Financial Instruments
We enter into derivative transactions to manage certain market risks, primarily interest rate risk and foreign currency exchange risk. This includes the use of interest rate swaps, interest rate locks, foreign exchange forward contracts and combined interest rate foreign exchange contracts (cross-currency swaps). We do not use derivatives for trading or speculative purposes. We record derivatives on our consolidated balance sheets at fair value that is derived from observable
67
Notes to Consolidated Financial Statements (continued)
Dollars in millions except per share amounts
market data, including yield curves and foreign exchange rates (all of our derivatives are Level 2). Cash flows associated with derivative instruments are presented in the same category on the consolidated statements of cash flows as the item being hedged.
Fair Value Hedging We designate our fixed-to-floating interest rate swaps as fair value hedges. The purpose of these swaps is to manage interest rate risk by managing our mix of fixed-rate and floating-rate debt. These swaps involve the receipt of fixed-rate amounts for floating interest rate payments over the life of the swaps without exchange of the underlying principal amount. Accrued and realized gains or losses from interest rate swaps impact interest expense in the consolidated statements of income. Unrealized gains on interest rate swaps are recorded at fair market value as assets, and unrealized losses on interest rate swaps are recorded at fair market value as liabilities. Changes in the fair values of the interest rate swaps are exactly offset by changes in the fair value of the underlying debt. Gains or losses realized upon early termination of our fair value hedges are recognized in interest expense. In the years ended December 31, 2016, and December 31, 2015, no ineffectiveness was measured on interest rate swaps designated as fair value hedges.
Cash Flow Hedging We designate our cross-currency swaps as cash flow hedges. We have entered into multiple cross-currency swaps to hedge our exposure to variability in expected future cash flows that are attributable to foreign currency risk generated from the issuance of our Euro, British pound sterling, Canadian dollar and Swiss franc denominated debt. These agreements include initial and final exchanges of principal from fixed foreign currency denominations to fixed U.S. dollar denominated amounts, to be exchanged at a specified rate that is usually determined by the market spot rate upon issuance. They also include an interest rate swap of a fixed or floating foreign-denominated rate to a fixed U.S. dollar denominated interest rate.
Unrealized gains on derivatives designated as cash flow hedges are recorded at fair value as assets, and unrealized losses on derivatives designated as cash flow hedges are recorded at fair value as liabilities. For derivative instruments designated as cash flow hedges, the effective portion is reported as a component of accumulated OCI until reclassified into interest expense in the same period the hedged transaction affects earnings. The gain or loss on the ineffective portion is recognized as “Other income (expense) – net” in the consolidated statements of income in each period. We evaluate the effectiveness of our cross-currency swaps each quarter. In the years ended December 31, 2016, and December 31, 2015, no ineffectiveness was measured on cross-currency swaps designated as cash flow hedges.
Periodically, we enter into and designate interest rate locks to partially hedge the risk of changes in interest payments attributable to increases in the benchmark interest rate during the period leading up to the probable issuance of fixed-rate debt. We designate our interest rate locks as cash flow hedges. Gains and losses when we settle our interest rate locks are amortized into income over the life of the related debt, except where a material amount is deemed to be ineffective, which would be immediately reclassified to “Other income (expense) – net” in the consolidated statements of income. Over the next 12 months, we expect to reclassify $59 from accumulated OCI to interest expense due to the amortization of net losses on historical interest rate locks.
We hedge a portion of the exchange risk involved in anticipation of highly probable foreign currency-denominated transactions. In anticipation of these transactions, we often enter into foreign exchange contracts to provide currency at a fixed rate. Gains and losses at the time we settle or take delivery on our designated foreign exchange contracts are amortized into income in the same period the hedged transaction affects earnings, except where an amount is deemed to be ineffective, which would be immediately reclassified to “Other income (expense) – net” in the consolidated statements of income. In the years ended December 31, 2016, and December 31, 2015, no ineffectiveness was measured on foreign exchange contracts designated as cash flow hedges.
Collateral and Credit-Risk Contingency We have entered into agreements with our derivative counterparties establishing collateral thresholds based on respective credit ratings and netting agreements. At December 31, 2016, we had posted collateral of $3,242 (a deposit asset) and held no collateral. Under the agreements, if AT&T’s credit rating had been downgraded one rating level by Fitch Ratings, before the final collateral exchange in December, we would have been required to post additional collateral of $150. If DIRECTV Holdings LLC’s credit rating had been downgraded below BBB- (S&P), we would owe an additional $274. At December 31, 2015, we had posted collateral of $2,343 (a deposit asset) and held collateral of $124 (a receipt liability). We do not offset the fair value of collateral, whether the right to reclaim cash collateral (a receivable) or the obligation to return cash collateral (a payable) exists, against the fair value of the derivative instruments.
68
Notes to Consolidated Financial Statements (continued)
Dollars in millions except per share amounts
Following are the notional amounts of our outstanding derivative positions:
|
2016
|
2015
|
|||||||
|
Interest rate swaps
|
$
|
9,650
|
$
|
7,050
|
||||
|
Cross-currency swaps
|
29,642
|
29,642
|
||||||
|
Foreign exchange contracts
|
-
|
100
|
||||||
|
Total
|
$
|
39,292
|
$
|
36,792
|
||||
|
Following are the related hedged items affecting our financial position and performance:
|
||||||||||||
|
Effect of Derivatives on the Consolidated Statements of Income
|
||||||||||||
|
Fair Value Hedging Relationships
|
||||||||||||
|
For the years ended December 31,
|
2016
|
2015
|
2014
|
|||||||||
|
Interest rate swaps (Interest expense):
|
||||||||||||
|
Gain (Loss) on interest rate swaps
|
$
|
(61
|
)
|
$
|
(16
|
)
|
$
|
(29
|
)
|
|||
|
Gain (Loss) on long-term debt
|
61
|
16
|
29
|
|||||||||
In addition, the net swap settlements that accrued and settled in the periods above were included in interest expense.
|
Cash Flow Hedging Relationships
|
||||||||||||
|
For the years ended December 31,
|
2016
|
2015
|
2014
|
|||||||||
|
Cross-currency swaps:
|
||||||||||||
|
Gain (Loss) recognized in accumulated OCI
|
$
|
1,061
|
$
|
(813
|
)
|
$
|
528
|
|||||
|
Interest rate locks:
|
||||||||||||
|
Gain (Loss) recognized in accumulated OCI
|
-
|
(361
|
)
|
(128
|
)
|
|||||||
|
Interest income (expense) reclassified from
accumulated OCI into income
|
(59
|
)
|
(58
|
)
|
(44
|
)
|
||||||
NOTE 11. INCOME TAXES
Significant components of our deferred tax liabilities (assets) are as follows at December 31:
|
2016
|
2015
|
|||||||
|
Depreciation and amortization
|
$
|
44,903
|
$
|
46,067
|
||||
|
Licenses and nonamortizable intangibles
|
22,892
|
20,732
|
||||||
|
Employee benefits
|
(10,045
|
)
|
(10,517
|
)
|
||||
|
Deferred fulfillment costs
|
3,204
|
2,172
|
||||||
|
Net operating loss and other carryforwards
|
(4,304
|
)
|
(4,029
|
)
|
||||
|
Other – net
|
(216
|
)
|
(1,478
|
)
|
||||
|
Subtotal
|
56,434
|
52,947
|
||||||
|
Deferred tax assets valuation allowance
|
2,283
|
2,141
|
||||||
|
Net deferred tax liabilities
|
$
|
58,717
|
$
|
55,088
|
||||
|
Noncurrent deferred tax liabilities
|
$
|
60,128
|
$
|
56,181
|
||||
|
Less: Noncurrent deferred tax assets
|
(1,411
|
)
|
(1,093
|
)
|
||||
|
Net deferred tax liabilities
|
$
|
58,717
|
$
|
55,088
|
||||
At December 31, 2016, we had combined net operating loss carryforwards (tax effected) for federal income tax purposes of $144, state of $830 and foreign of $1,981, expiring through 2032. Additionally, we had federal credit carryforwards of $0 and state credit carryforwards of $1,348, expiring primarily through 2036.
69
Notes to Consolidated Financial Statements (continued)
Dollars in millions except per share amounts
We recognize a valuation allowance if, based on the weight of available evidence, it is more likely than not that some portion, or all, of a deferred tax asset will not be realized. Our valuation allowances at December 31, 2016 and 2015 related primarily to state and foreign net operating losses and state credit carryforwards.
We recognize the financial statement effects of a tax return position when it is more likely than not, based on the technical merits, that the position will ultimately be sustained. For tax positions that meet this recognition threshold, we apply our judgment, taking into account applicable tax laws, our experience in managing tax audits and relevant GAAP, to determine the amount of tax benefits to recognize in our financial statements. For each position, the difference between the benefit realized on our tax return and the benefit reflected in our financial statements is recorded on our consolidated balance sheets as an unrecognized tax benefit (UTB). We update our UTBs at each financial statement date to reflect the impacts of audit settlements and other resolutions of audit issues, the expiration of statutes of limitation, developments in tax law and ongoing discussions with taxing authorities. A reconciliation of the change in our UTB balance from January 1 to December 31 for 2016 and 2015 is as follows:
|
Federal, State and Foreign Tax
|
2016
|
2015
|
||||||
|
Balance at beginning of year
|
$
|
6,898
|
$
|
4,465
|
||||
|
Increases for tax positions related to the current year
|
318
|
1,333
|
||||||
|
Increases for tax positions related to prior years
|
473
|
660
|
||||||
|
Decreases for tax positions related to prior years
|
(1,168
|
)
|
(396
|
)
|
||||
|
Lapse of statute of limitations
|
(25
|
)
|
(16
|
)
|
||||
|
Settlements
|
50
|
10
|
||||||
|
Current year acquisitions
|
-
|
864
|
||||||
|
Foreign currency effects
|
(30
|
)
|
(22
|
)
|
||||
|
Balance at end of year
|
6,516
|
6,898
|
||||||
|
Accrued interest and penalties
|
1,140
|
1,138
|
||||||
|
Gross unrecognized income tax benefits
|
7,656
|
8,036
|
||||||
|
Less: Deferred federal and state income tax benefits
|
(557
|
)
|
(582
|
)
|
||||
|
Less: Tax attributable to timing items included above
|
(3,398
|
)
|
(3,460
|
)
|
||||
|
Less: UTBs included above that relate to acquisitions that would impact goodwill
|
||||||||
|
if recognized during the measurement period
|
-
|
(842
|
)
|
|||||
|
Total UTB that, if recognized, would impact the
|
||||||||
|
effective income tax rate as of the end of the year
|
$
|
3,701
|
$
|
3,152
|
||||
Periodically we make deposits to taxing jurisdictions which reduce our UTB balance but are not included in the reconciliation above. The amount of deposits that reduced our UTB balance was $3,084 at December 31, 2016, and $3,027 at December 31, 2015.
Accrued interest and penalties included in UTBs were $1,140 as of December 31, 2016, and $1,138 as of December 31, 2015. We record interest and penalties related to federal, state and foreign UTBs in income tax expense. The net interest and penalty expense (benefit) included in income tax expense was $24 for 2016, $83 for 2015, and $(64) for 2014.
We file income tax returns in the U.S. federal jurisdiction and various state, local and foreign jurisdictions. As a large taxpayer, our income tax returns are regularly audited by the Internal Revenue Service (IRS) and other taxing authorities. The IRS has completed field examinations of our tax returns through 2010. All audit periods prior to 2003 are closed for federal examination purposes. Contested issues from our 2003 through 2010 returns are at various stages of resolution with the IRS Appeals Division; we are unable to estimate the impact the resolution of these issues may have on our UTBs.
70
Notes to Consolidated Financial Statements (continued)
Dollars in millions except per share amounts
The components of income tax (benefit) expense are as follows:
|
2016
|
2015
|
2014
|
||||||||||
|
Federal:
|
||||||||||||
|
Current
|
$
|
2,915
|
$
|
2,496
|
$
|
1,610
|
||||||
|
Deferred
|
3,127
|
3,828
|
2,060
|
|||||||||
|
6,042
|
6,324
|
3,670
|
||||||||||
|
State and local:
|
||||||||||||
|
Current
|
282
|
72
|
(102
|
)
|
||||||||
|
Deferred
|
339
|
671
|
(73
|
)
|
||||||||
|
621
|
743
|
(175
|
)
|
|||||||||
|
Foreign:
|
||||||||||||
|
Current
|
335
|
320
|
163
|
|||||||||
|
Deferred
|
(519
|
)
|
(382
|
)
|
(39
|
)
|
||||||
|
(184
|
)
|
(62
|
)
|
124
|
||||||||
|
Total
|
$
|
6,479
|
$
|
7,005
|
$
|
3,619
|
||||||
“Income Before Income Taxes” in the Consolidated Statements of Income included the following components for the years ended December 31:
|
2016
|
2015
|
2014
|
||||||||||
|
U.S. income before income taxes
|
$
|
20,911
|
$
|
21,519
|
$
|
10,244
|
||||||
|
Foreign income (loss) before income taxes
|
(1,099
|
)
|
(827
|
)
|
111
|
|||||||
|
Total
|
$
|
19,812
|
$
|
20,692
|
$
|
10,355
|
||||||
A reconciliation of income tax expense (benefit) and the amount computed by applying the statutory federal income tax rate (35%) to income from continuing operations before income taxes is as follows:
|
2016
|
2015
|
2014
|
||||||||||
|
Taxes computed at federal statutory rate
|
$
|
6,934
|
$
|
7,242
|
$
|
3,624
|
||||||
|
Increases (decreases) in income taxes resulting from:
|
||||||||||||
|
State and local income taxes – net of federal income tax benefit
|
416
|
483
|
(113
|
)
|
||||||||
|
Connecticut wireline sale
|
-
|
-
|
350
|
|||||||||
|
Loss of foreign tax credits in connection with América Móvil sale
|
-
|
-
|
386
|
|||||||||
|
Mexico restructuring
|
(471
|
)
|
-
|
-
|
||||||||
|
Other – net
|
(400
|
)
|
(720
|
)
|
(628
|
)
|
||||||
|
Total
|
$
|
6,479
|
$
|
7,005
|
$
|
3,619
|
||||||
|
Effective Tax Rate
|
32.7
|
%
|
33.9
|
%
|
34.9
|
%
|
||||||
NOTE 12. PENSION AND POSTRETIREMENT BENEFITS
Pension Benefits and Postretirement Benefits
Substantially all of our U.S. management employees hired before January 1, 2015 are covered by one of our noncontributory pension programs. The vast majority of domestic nonmanagement employees, including those hired after 2015, also participate in our noncontributory pension programs. Management participants generally receive benefits under either cash balance pension programs that include annual or monthly credits based on salary as well as an interest credit, or a traditional pension formula (i.e., a stated percentage of employees’ adjusted career income). Nonmanagement employees’ pension benefits are generally calculated using one of two formulas: a flat dollar amount applied to years of service according to job classification or a cash balance plan with negotiated annual pension band credits as well as interest credits. Most nonmanagement employees can elect to receive their pension benefits in either a lump sum payment or an annuity.
We also provide a variety of medical, dental and life insurance benefits to certain retired employees under various plans and accrue actuarially determined postretirement benefit costs as active employees earn these benefits.
71
Notes to Consolidated Financial Statements (continued)
Dollars in millions except per share amounts
We acquired DIRECTV on July 24, 2015. DIRECTV sponsored a noncontributory defined benefit pension plan, which provided benefits to most employees based on either years of service and final average salary, or eligible compensation while employed by DIRECTV. DIRECTV also maintained (1) a postretirement benefit plan for those retirees eligible to participate in health care and life insurance benefits, generally until they reach age 65 and (2) an unfunded nonqualified pension plan for certain eligible employees. At December 31, 2015, we recorded the fair value of the DIRECTV plans using assumptions and accounting policies consistent with those disclosed by AT&T.
In December 2014, we announced an opportunity for certain management employees who were retirement eligible as of March 31, 2015 to elect an enhanced, full lump sum payment option of their accrued pension if they retired on or before March 31, 2015. The lump sum value totaled approximately $1,200 which was distributed in 2015. We recorded special termination benefits of $149 as a result of the offer.
In the fourth quarter of 2014, we changed the method we use to estimate the service and interest components of net periodic benefit cost for pension (as of October 1, 2014) and other postretirement benefits (as of December 31, 2014). This change did not affect the measurement of our total benefit obligations or our annual net periodic benefit cost as the change in service and interest costs was completely offset in the actuarial (gain) loss reported. This change compared to the previous method resulted in a decrease of $150 in the service and interest components for pension cost in the fourth quarter of 2014. For the year ended December 31, 2015, the change resulted in an incremental decrease of $740 in service and interest components for pension and postretirement costs. Prior to the fourth quarter of 2014, we estimated these service and interest cost components utilizing a single weighted-average discount rate derived from the yield curve used to measure the benefit obligation at the beginning of the period. We have elected to utilize a full yield curve approach in the estimation of these components by applying the specific spot rates along the yield curve used in the determination of the benefit obligation to the relevant projected cash flows. We have made this change to provide a more precise measurement of service and interest costs by improving the correlation between projected benefit cash flows to the corresponding spot yield curve rates. We have accounted for this change as a change in accounting estimate that is inseparable from a change in accounting principle and accordingly have accounted for it prospectively.
Obligations and Funded Status
For defined benefit pension plans, the benefit obligation is the “projected benefit obligation,” the actuarial present value, as of our December 31 measurement date, of all benefits attributed by the pension benefit formula to employee service rendered to that date. The amount of benefit to be paid depends on a number of future events incorporated into the pension benefit formula, including estimates of the average life of employees and their beneficiaries and average years of service rendered. It is measured based on assumptions concerning future interest rates and future employee compensation levels.
For postretirement benefit plans, the benefit obligation is the “accumulated postretirement benefit obligation,” the actuarial present value as of measurement date of all future benefits attributed under the terms of the postretirement benefit plan to employee service.
The following table presents the change in the projected benefit obligation for the years ended December 31:
|
Pension Benefits
|
Postretirement Benefits
|
|||||||||||||||
|
2016
|
2015
|
2016
|
2015
|
|||||||||||||
|
Benefit obligation at beginning of year
|
$
|
55,464
|
$
|
59,543
|
$
|
27,898
|
$
|
30,709
|
||||||||
|
Service cost - benefits earned during the period
|
1,112
|
1,212
|
192
|
222
|
||||||||||||
|
Interest cost on projected benefit obligation
|
1,980
|
1,902
|
972
|
967
|
||||||||||||
|
Amendments
|
(206
|
)
|
(8
|
)
|
(600
|
)
|
(74
|
)
|
||||||||
|
Actuarial (gain) loss
|
1,485
|
(3,079
|
)
|
(529
|
)
|
(1,988
|
)
|
|||||||||
|
Special termination benefits
|
-
|
149
|
-
|
-
|
||||||||||||
|
Benefits paid
|
(3,614
|
)
|
(4,681
|
)
|
(1,941
|
)
|
(1,958
|
)
|
||||||||
|
DIRECTV acquisition
|
-
|
470
|
-
|
20
|
||||||||||||
|
Transfer for sale of Connecticut wireline operations
|
-
|
(42
|
)
|
-
|
-
|
|||||||||||
|
Plan transfers
|
(38
|
)
|
(2
|
)
|
35
|
-
|
||||||||||
|
Benefit obligation at end of year
|
$
|
56,183
|
$
|
55,464
|
$
|
26,027
|
$
|
27,898
|
||||||||
72
Notes to Consolidated Financial Statements (continued)
Dollars in millions except per share amounts
The following table presents the change in the fair value of plan assets for the years ended December 31 and the plans’ funded status at December 31:
|
Pension Benefits
|
Postretirement Benefits
|
|||||||||||||||
|
2016
|
2015
|
2016
|
2015
|
|||||||||||||
|
Fair value of plan assets at beginning of year
|
$
|
42,195
|
$
|
45,163
|
$
|
6,671
|
$
|
7,846
|
||||||||
|
Actual return on plan assets
|
3,123
|
604
|
407
|
64
|
||||||||||||
|
Benefits paid1
|
(3,614
|
)
|
(4,681
|
)
|
(1,156
|
)
|
(1,239
|
)
|
||||||||
|
Contributions
|
910
|
735
|
-
|
-
|
||||||||||||
|
DIRECTV acquisition
|
-
|
418
|
-
|
-
|
||||||||||||
|
Transfer for sale of Connecticut wireline operations
|
-
|
(42
|
)
|
-
|
-
|
|||||||||||
|
Plan transfers and other
|
(4
|
)
|
(2
|
)
|
(1
|
)
|
-
|
|||||||||
|
Fair value of plan assets at end of year3
|
42,610
|
42,195
|
5,921
|
6,671
|
||||||||||||
|
Unfunded status at end of year2
|
$
|
(13,573
|
)
|
$
|
(13,269
|
)
|
$
|
(20,106
|
)
|
$
|
(21,227
|
)
|
||||
|
1 At our discretion, certain postretirement benefits may be paid from AT&T cash accounts, which does not reduce Voluntary Employee Benefit Association (VEBA) assets. Future benefit payments may be made from VEBA trusts and thus reduce those asset balances.
|
||||||||||||||||
|
2 Funded status is not indicative of our ability to pay ongoing pension benefits or of our obligation to fund retirement trusts. Required pension funding is determined in accordance with the Employee Retirement Income Security Act of 1974, as amended (ERISA) regulations.
|
||||||||||||||||
|
3 Net assets available for benefits were $51,087 at December 31, 2016 and $50,909 at December 31, 2015 and include the preferred equity interest in AT&T Mobility II LLC discussed below, which was valued at $8,477 and $8,714, respectively.
|
||||||||||||||||
In July 2014, the U.S. Department of Labor published in the Federal Register their final retroactive approval of our September 9, 2013 voluntary contribution of a preferred equity interest in AT&T Mobility II LLC, the primary holding company for our wireless business, to the trust used to pay pension benefits under our qualified pension plans. The preferred equity interest had a value of $9,104 on the contribution date and was valued at $8,477 at December 31, 2016. The trust is entitled to receive cumulative cash distributions of $560 per annum, which will be distributed quarterly in equal amounts and will be accounted for as contributions. We distributed $560 to the trust during 2016. So long as we make the distributions, we will have no limitations on our ability to declare a dividend, or repurchase shares. This preferred equity interest is a plan asset under ERISA and is recognized as such in the plan’s separate financial statements. However, because the preferred equity interest is not unconditionally transferable to an unrelated party (see Note 14), it is not reflected in plan assets in our consolidated financial statements and instead has been eliminated in consolidation. At the time of the contribution of the preferred equity interest, we made an additional cash contribution of $175 and agreed to annual cash contributions of $175 no later than the due date for our federal income tax return for each of 2014, 2015 and 2016. During 2016, we accelerated the final contribution and completed our obligation with a $350 cash payment to the trust. These contributions combined with our existing pension assets are in excess of 90% of the pension obligation at December 31, 2016.
As noted above, this preferred equity interest represents a plan asset of our pension trust, which is recognized in the separate financial statements of our pension plan as a qualified plan asset for funding purposes. The following table presents a reconciliation of our pension plan assets recognized in the consolidated financial statements of the Company with the net assets available for benefits included in the separate financial statements of the pension plan at December 31:
|
2016
|
2015
|
|||||||
|
Plan assets recognized in the consolidated financial statements
|
$
|
42,610
|
$
|
42,195
|
||||
|
Preferred equity interest in Mobility
|
8,477
|
8,714
|
||||||
|
Net assets available for benefits
|
$
|
51,087
|
$
|
50,909
|
||||
73
Notes to Consolidated Financial Statements (continued)
Dollars in millions except per share amounts
Amounts recognized on our consolidated balance sheets at December 31 are listed below:
|
Pension Benefits
|
Postretirement Benefits
|
|||||||||||||||
|
2016
|
2015
|
2016
|
2015
|
|||||||||||||
|
Current portion of employee benefit obligation1
|
$
|
-
|
$
|
-
|
$
|
(1,644
|
)
|
$
|
(1,766
|
)
|
||||||
|
Employee benefit obligation2
|
(13,573
|
)
|
(13,269
|
)
|
(18,462
|
)
|
(19,461
|
)
|
||||||||
|
Net amount recognized
|
$
|
(13,573
|
)
|
$
|
(13,269
|
)
|
$
|
(20,106
|
)
|
$
|
(21,227
|
)
|
||||
|
1 Included in “Accounts payable and accrued liabilities.”
|
||||||||||||||||
|
2 Included in “Postemployment benefit obligation.”
|
||||||||||||||||
The accumulated benefit obligation for our pension plans represents the actuarial present value of benefits based on employee service and compensation as of a certain date and does not include an assumption about future compensation levels. The accumulated benefit obligation for our pension plans was $54,538 at December 31, 2016, and $54,007 at December 31, 2015.
Net Periodic Benefit Cost and Other Amounts Recognized in Other Comprehensive Income
Periodic Benefit Costs
Our combined net pension and postretirement cost (credit) recognized in our consolidated statements of income was $303, $(2,821) and $7,232 for the years ended December 31, 2016, 2015 and 2014. A portion of pension and postretirement benefit costs is capitalized as part of the benefit load on internal construction and capital expenditures, providing a small reduction in the net expense recorded. The following table presents the components of net periodic benefit cost:
|
Pension Benefits
|
Postretirement Benefits
|
|||||||||||||||||||||||
|
2016
|
2015
|
2014
|
2016
|
2015
|
2014
|
|||||||||||||||||||
|
Service cost – benefits earned
during the period
|
$
|
1,112
|
$
|
1,212
|
$
|
1,134
|
$
|
192
|
$
|
222
|
$
|
233
|
||||||||||||
|
Interest cost on projected benefit
obligation
|
1,980
|
1,902
|
2,470
|
972
|
967
|
1,458
|
||||||||||||||||||
|
Expected return on assets
|
(3,115
|
)
|
(3,317
|
)
|
(3,380
|
)
|
(355
|
)
|
(421
|
)
|
(653
|
)
|
||||||||||||
|
Amortization of prior service credit
|
(103
|
)
|
(103
|
)
|
(94
|
)
|
(1,277
|
)
|
(1,278
|
)
|
(1,448
|
)
|
||||||||||||
|
Actuarial (gain) loss
|
1,478
|
(373
|
)
|
5,419
|
(581
|
)
|
(1,632
|
)
|
2,093
|
|||||||||||||||
|
Net pension and postretirement cost (credit)
|
$
|
1,352
|
$
|
(679
|
)
|
$
|
5,549
|
$
|
(1,049
|
)
|
$
|
(2,142
|
)
|
$
|
1,683
|
|||||||||
Other Changes in Benefit Obligations Recognized in Other Comprehensive Income
The following table presents the after-tax changes in benefit obligations recognized in OCI and the after-tax prior service credits that were amortized from OCI into net periodic benefit costs:
|
Pension Benefits
|
Postretirement Benefits
|
|||||||||||||||||||||||
|
2016
|
2015
|
2014
|
2016
|
2015
|
2014
|
|||||||||||||||||||
|
Balance at beginning of year
|
$
|
512
|
$
|
575
|
$
|
583
|
$
|
5,510
|
$
|
6,257
|
$
|
6,812
|
||||||||||||
|
Prior service (cost) credit
|
128
|
1
|
45
|
372
|
45
|
383
|
||||||||||||||||||
|
Amortization of prior service credit
|
(65
|
)
|
(64
|
)
|
(58
|
)
|
(793
|
)
|
(792
|
)
|
(898
|
)
|
||||||||||||
|
Reclassification to income of prior service credit
|
-
|
-
|
5
|
-
|
-
|
(40
|
)
|
|||||||||||||||||
|
Total recognized in other
comprehensive (income) loss
|
63
|
(63
|
)
|
(8
|
)
|
(421
|
)
|
(747
|
)
|
(555
|
)
|
|||||||||||||
|
Balance at end of year
|
$
|
575
|
$
|
512
|
$
|
575
|
$
|
5,089
|
$
|
5,510
|
$
|
6,257
|
||||||||||||
The estimated prior service credits that will be amortized from accumulated OCI into net periodic benefit cost over the next fiscal year are $123 ($76 net of tax) for pension and $1,342 ($832 net of tax) for postretirement benefits.
74
Notes to Consolidated Financial Statements (continued)
Dollars in millions except per share amounts
Assumptions
In determining the projected benefit obligation and the net pension and postretirement benefit cost, we used the following significant weighted-average assumptions:
|
Pension Benefits
|
Postretirement Benefits
|
|||||||||||||||||
|
2016
|
2015
|
2014
|
2016
|
2015
|
2014
|
|||||||||||||
|
Weighted-average discount rate for determining projected benefit obligation at December 31
|
4.40
|
%
|
4.60
|
%
|
4.30
|
%
|
4.30
|
%
|
4.50
|
%
|
4.20
|
%
|
||||||
|
Discount rate in effect for determining service cost
|
4.90
|
%
|
4.60
|
%
|
5.00
|
%
|
5.00
|
%
|
4.60
|
%
|
5.00
|
%
|
||||||
|
Discount rate in effect for determining interest cost1
|
3.70
|
%
|
3.30
|
%
|
4.60
|
%
|
3.60
|
%
|
3.30
|
%
|
5.00
|
%
|
||||||
|
Long-term rate of return on plan assets
|
7.75
|
%
|
7.75
|
%
|
7.75
|
%
|
5.75
|
%
|
5.75
|
%
|
7.75
|
%
|
||||||
|
Composite rate of compensation increase for determining projected benefit obligation
|
3.00
|
%
|
3.10
|
%
|
3.00
|
%
|
3.00
|
%
|
3.10
|
%
|
3.00
|
%
|
||||||
|
Composite rate of compensation increase for determining net pension cost (benefit)
|
3.10
|
%
|
3.00
|
%
|
3.00
|
%
|
3.10
|
%
|
3.00
|
%
|
3.00
|
%
|
||||||
|
1 Weighted-average discount rate of 5.00% in effect for pension costs from January 1, 2014 through September 30, 2014. Discount rates in effect of 4.90% for service cost and 3.50% for interest cost from October 1, 2014 through December 31, 2014. A discount rate of 5.00% was used for postretirement costs for the year ended December 31, 2014.
|
||||||||||||||||||
We recognize gains and losses on pension and postretirement plan assets and obligations immediately in our operating results. These gains and losses are measured annually as of December 31 and accordingly will be recorded during the fourth quarter, unless earlier remeasurements are required.
Discount Rate Our assumed weighted-average discount rate for pension and postretirement benefits of 4.40% and 4.30% respectively, at December 31, 2016, reflects the hypothetical rate at which the projected benefit obligation could be effectively settled or paid out to participants. We determined our discount rate based on a range of factors, including a yield curve composed of the rates of return on several hundred high-quality, fixed income corporate bonds available at the measurement date and corresponding to the related expected durations of future cash outflows. These bonds were all rated at least Aa3 or AA- by one of the nationally recognized statistical rating organizations, denominated in U.S. dollars, and neither callable, convertible nor index linked. For the year ended December 31, 2016, when compared to the year ended December 31, 2015, we decreased our pension discount rate by 0.20%, resulting in an increase in our pension plan benefit obligation of $2,189 and decreased our postretirement discount rate 0.20%, resulting in an increase in our postretirement benefit obligation of $906. For the year ended December 31, 2015, we increased our pension discount rate by 0.30%, resulting in a decrease in our pension plan benefit obligation of $1,977 and increased our postretirement discount rates by 0.30%, resulting in a decrease in our postretirement benefit obligation of $854.
We utilize a full yield curve approach in the estimation of the service and interest components of net periodic benefit costs for pension and other postretirement benefits. Under this approach, we apply discounting using individual spot rates from a yield curve composed of the rates of return on several hundred high-quality, fixed income corporate bonds available at the measurement date. These spot rates align to each of the projected benefit obligations and service cost cash flows. The service cost component relates to the active participants in the plan, so the relevant cash flows on which to apply the yield curve are considerably longer in duration on average than the total projected benefit obligation cash flows, which also include benefit payments to retirees. Interest cost is computed by multiplying each spot rate by the corresponding discounted projected benefit obligation cash flows. The full yield curve approach reduces any actuarial gains and losses based upon interest rate expectations (e.g., built-in gains in interest cost in an upward sloping yield curve scenario), or gains and losses merely resulting from the timing and magnitude of cash outflows associated with our benefit obligations. Neither the annual measurement of our total benefit obligations nor annual net benefit cost is affected by the full yield curve approach.
75
Notes to Consolidated Financial Statements (continued)
Dollars in millions except per share amounts
Expected Long-Term Rate of Return In 2017, our expected long-term rate of return is 7.75% on pension plan assets and 5.75% on postretirement plan assets. Our long-term rates of return reflect the average rate of earnings expected on the funds invested, or to be invested, to provide for the benefits included in the projected benefit obligations. In setting the long-term assumed rate of return, management considers capital markets future expectations, the asset mix of the plans’ investments and average historical asset return. Actual long-term returns can, in relatively stable markets, also serve as a factor in determining future expectations. We consider many factors that include, but are not limited to, historical returns on plan assets, current market information on long-term returns (e.g., long-term bond rates) and current and target asset allocations between asset categories. The target asset allocation is determined based on consultations with external investment advisers. If all other factors were to remain unchanged, we expect that a 0.50% decrease in the expected long-term rate of return would cause 2017 combined pension and postretirement cost to increase $230. However, any differences in the rate and actual returns will be included with the actuarial gain or loss recorded in the fourth quarter when our plans are remeasured.
Composite Rate of Compensation Increase Our expected composite rate of compensation increase cost of 3.00% in 2016 and 3.10% in 2015 reflects the long-term average rate of salary increases.
Mortality Tables At December 31, 2016, we updated our assumed mortality rates to reflect our best estimate of future mortality, which decreased our pension obligation by $793 and decreased our postretirement obligations by $227. At December 31, 2015, we updated our assumed mortality rates, which decreased our pension obligation by $859 and decreased our postretirement obligations by $274.
Healthcare Cost Trend Our healthcare cost trend assumptions are developed based on historical cost data, the near-term outlook and an assessment of likely long-term trends. Based on historical experience, updated expectations of healthcare industry inflation and recent prescription drug cost experience, our 2017 assumed annual healthcare prescription drug cost trend for non-Medicare eligible participants will increase to 6.50%, grading down to our ultimate trend rate of 4.50% in 2025 and for Medicare-eligible participants will remain at an assumed annual and ultimate trend rate of 4.50%. This change in assumption increased our obligation by $21. In 2016, our assumed annual healthcare prescription drug cost trend rate for non-Medicare eligible participants was 6.25%, trending to our ultimate trend rate of 4.50% in 2023. Medicare-eligible retirees who receive access to retiree health insurance coverage through a private insurance marketplace are not subject to assumed healthcare trend. In addition to the healthcare cost trend in 2016, we assumed an annual 2.50% growth in administrative expenses and an annual 3.00% growth in dental claims.
A one percentage-point change in the assumed combined medical and dental cost trend rate would have the following effects:
|
One Percentage-
|
One Percentage-
|
|||||||
|
Point Increase
|
Point Decrease
|
|||||||
|
Increase (decrease) in total of service and interest cost components
|
$
|
50
|
$
|
(44
|
)
|
|||
|
Increase (decrease) in accumulated postretirement benefit obligation
|
511
|
(458
|
)
|
|||||
Plan Assets
Plan assets consist primarily of private and public equity, government and corporate bonds, and real assets (real estate and natural resources). The asset allocations of the pension plans are maintained to meet ERISA requirements. Any plan contributions, as determined by ERISA regulations, are made to a pension trust for the benefit of plan participants. As part of our voluntary contribution of the Mobility preferred equity interest, we will contribute $560 of cash distributions during 2017. We do not have significant ERISA required contributions to our pension plans for 2017.
We maintain VEBA trusts to partially fund postretirement benefits; however, there are no ERISA or regulatory requirements that these postretirement benefit plans be funded annually.
The principal investment objectives are to ensure the availability of funds to pay pension and postretirement benefits as they become due under a broad range of future economic scenarios, maximize long-term investment return with an acceptable level of risk based on our pension and postretirement obligations, and diversify broadly across and within the capital markets to insulate asset values against adverse experience in any one market. Each asset class has broadly diversified characteristics. Substantial biases toward any particular investing style or type of security are sought to be avoided by managing the aggregation of all accounts with portfolio benchmarks. Asset and benefit obligation forecasting studies are conducted periodically, generally every two to three years, or when significant changes have occurred in market conditions, benefits, participant demographics or funded status. Decisions regarding investment policy are made with an understanding of the effect of asset allocation on funded status, future contributions and projected expenses.
76
Notes to Consolidated Financial Statements (continued)
Dollars in millions except per share amounts
The plans’ weighted-average asset targets and actual allocations as a percentage of plan assets, including the notional exposure of future contracts by asset categories at December 31, are as follows:
|
Pension Assets
|
Postretirement (VEBA) Assets
|
|||||||||||||||||||||||||||||||||||||||
|
Target
|
2016
|
2015
|
Target
|
2016
|
2015
|
|||||||||||||||||||||||||||||||||||
|
Equity securities:
|
||||||||||||||||||||||||||||||||||||||||
|
Domestic
|
20
|
%
|
-
|
30
|
%
|
24
|
%
|
22
|
%
|
17
|
%
|
-
|
27
|
%
|
22
|
%
|
26
|
%
|
||||||||||||||||||||||
|
International
|
10
|
%
|
-
|
20
|
%
|
15
|
15
|
14
|
%
|
-
|
24
|
%
|
19
|
14
|
||||||||||||||||||||||||||
|
Fixed income securities
|
35
|
%
|
-
|
45
|
%
|
39
|
40
|
33
|
%
|
-
|
43
|
%
|
38
|
34
|
||||||||||||||||||||||||||
|
Real assets
|
6
|
%
|
-
|
16
|
%
|
11
|
10
|
0
|
%
|
-
|
6
|
%
|
1
|
1
|
||||||||||||||||||||||||||
|
Private equity
|
4
|
%
|
-
|
14
|
%
|
11
|
12
|
0
|
%
|
-
|
7
|
%
|
2
|
2
|
||||||||||||||||||||||||||
|
Other
|
0
|
%
|
-
|
5
|
%
|
-
|
1
|
13
|
%
|
-
|
23
|
%
|
18
|
23
|
||||||||||||||||||||||||||
|
Total
|
100
|
%
|
100
|
%
|
100
|
%
|
100
|
%
|
||||||||||||||||||||||||||||||||
At December 31, 2016, AT&T securities represented less than 0.5% of assets held by our pension trust and 6% of assets (primarily common stock) held by our VEBA trusts included in these financial statements.
Investment Valuation
Investments are stated at fair value. Fair value is the price that would be received to sell an asset or paid to transfer a liability at the measurement date.
Investments in securities traded on a national securities exchange are valued at the last reported sales price on the final business day of the year. If no sale was reported on that date, they are valued at the last reported bid price. Investments in securities not traded on a national securities exchange are valued using pricing models, quoted prices of securities with similar characteristics or discounted cash flows. Shares of registered investment companies are valued based on quoted market prices, which represent the net asset value of shares held at year-end.
Other commingled investment entities are valued at quoted redemption values that represent the net asset values of units held at year-end which management has determined approximates fair value.
Real estate and natural resource direct investments are valued at amounts based upon appraisal reports. Fixed income securities valuation is based upon observable prices for comparable assets, broker/dealer quotes (spreads or prices), or a pricing matrix that derives spreads for each bond based on external market data, including the current credit rating for the bonds, credit spreads to Treasuries for each credit rating, sector add-ons or credits, issue-specific add-ons or credits as well as call or other options.
Purchases and sales of securities are recorded as of the trade date. Realized gains and losses on sales of securities are determined on the basis of average cost. Interest income is recognized on the accrual basis. Dividend income is recognized on the ex-dividend date.
Non-interest bearing cash and overdrafts are valued at cost, which approximates fair value.
Fair Value Measurements
See Note 10 for a discussion of fair value hierarchy that prioritizes the inputs to valuation techniques used to measure fair value.
77
Notes to Consolidated Financial Statements (continued)
Dollars in millions except per share amounts
The following tables set forth by level, within the fair value hierarchy, the pension and postretirement assets and liabilities at fair value as of December 31, 2016:
|
Pension Assets and Liabilities at Fair Value as of December 31, 2016
|
||||||||||||||||
|
Level 1
|
Level 2
|
Level 3
|
Total
|
|||||||||||||
|
Non-interest bearing cash
|
$
|
94
|
$
|
-
|
$
|
-
|
$
|
94
|
||||||||
|
Interest bearing cash
|
-
|
77
|
-
|
77
|
||||||||||||
|
Foreign currency contracts
|
-
|
7
|
-
|
7
|
||||||||||||
|
Equity securities:
|
||||||||||||||||
|
Domestic equities
|
8,299
|
-
|
-
|
8,299
|
||||||||||||
|
International equities
|
4,389
|
-
|
5
|
4,394
|
||||||||||||
|
Fixed income securities:
|
||||||||||||||||
|
Asset-backed securities
|
-
|
399
|
-
|
399
|
||||||||||||
|
Mortgage-backed securities
|
-
|
838
|
-
|
838
|
||||||||||||
|
Collateralized mortgage-backed securities
|
-
|
208
|
-
|
208
|
||||||||||||
|
Collateralized mortgage obligations/REMICS
|
-
|
269
|
-
|
269
|
||||||||||||
|
Corporate and other fixed income instruments and funds
|
75
|
8,442
|
40
|
8,557
|
||||||||||||
|
Government and municipal bonds
|
80
|
4,889
|
-
|
4,969
|
||||||||||||
|
Real estate and real assets
|
-
|
-
|
2,273
|
2,273
|
||||||||||||
|
Securities lending collateral
|
207
|
1,977
|
-
|
2,184
|
||||||||||||
|
Receivable for variation margin
|
8
|
-
|
-
|
8
|
||||||||||||
|
Purchased options
|
-
|
1
|
-
|
1
|
||||||||||||
|
Assets at fair value
|
13,152
|
17,107
|
2,318
|
32,577
|
||||||||||||
|
Investments sold short and other liabilities at fair value
|
(643
|
)
|
(7
|
)
|
(4
|
)
|
(654
|
)
|
||||||||
|
Total plan net assets at fair value
|
$
|
12,509
|
$
|
17,100
|
$
|
2,314
|
$
|
31,923
|
||||||||
|
Assets held at net asset value practical expedient
|
||||||||||||||||
|
Private equity funds
|
4,648
|
|||||||||||||||
|
Real estate funds
|
2,392
|
|||||||||||||||
|
Commingled funds
|
5,721
|
|||||||||||||||
|
Total assets held at net asset value practical expedient
|
12,761
|
|||||||||||||||
|
Other assets (liabilities)1
|
(2,074
|
)
|
||||||||||||||
|
Total Plan Net Assets
|
$
|
42,610
|
||||||||||||||
|
1 Other assets (liabilities) include amounts receivable, accounts payable and net adjustment for securities lending payable.
|
||||||||||||||||
78
|
Postretirement Assets and Liabilities at Fair Value as of December 31, 2016
|
||||||||||||||||
|
Level 1
|
Level 2
|
Level 3
|
Total
|
|||||||||||||
|
Interest bearing cash
|
$
|
175
|
$
|
593
|
$
|
-
|
$
|
768
|
||||||||
|
Foreign currencies
|
6
|
-
|
-
|
6
|
||||||||||||
|
Equity securities:
|
||||||||||||||||
|
Domestic equities
|
1,178
|
7
|
-
|
1,185
|
||||||||||||
|
International equities
|
896
|
2
|
-
|
898
|
||||||||||||
|
Fixed income securities:
|
||||||||||||||||
|
Asset-backed securities
|
-
|
33
|
4
|
37
|
||||||||||||
|
Collateralized mortgage-backed securities
|
-
|
108
|
13
|
121
|
||||||||||||
|
Collateralized mortgage obligations
|
-
|
32
|
2
|
34
|
||||||||||||
|
Corporate and other fixed income instruments and funds
|
-
|
422
|
7
|
429
|
||||||||||||
|
Government and municipal bonds
|
20
|
659
|
-
|
679
|
||||||||||||
|
Securities lending collateral
|
-
|
128
|
-
|
128
|
||||||||||||
|
Total plan net assets at fair value
|
$
|
2,275
|
$
|
1,984
|
$
|
26
|
$
|
4,285
|
||||||||
|
Assets held at net asset value practical expedient
|
||||||||||||||||
|
Private equity funds
|
118
|
|||||||||||||||
|
Real estate funds
|
61
|
|||||||||||||||
|
Commingled funds
|
1,667
|
|||||||||||||||
|
Total assets held at net asset value practical expedient
|
1,846
|
|||||||||||||||
|
Other assets (liabilities)1
|
(210
|
)
|
||||||||||||||
|
Total Plan Net Assets
|
$
|
5,921
|
||||||||||||||
|
1 Other assets (liabilities) include amounts receivable, accounts payable and net adjustment for securities lending payable.
|
||||||||||||||||
|
Pension Assets
|
Equities
|
Fixed Income Funds
|
Real Estate and Real Assets
|
Total
|
||||||||||||
|
Balance at beginning of year
|
$
|
-
|
$
|
44
|
$
|
2,062
|
$
|
2,106
|
||||||||
|
Realized gains (losses)
|
-
|
(17
|
)
|
(103
|
)
|
(120
|
)
|
|||||||||
|
Unrealized gains (losses)
|
3
|
19
|
377
|
399
|
||||||||||||
|
Transfers in
|
(4
|
)
|
-
|
77
|
73
|
|||||||||||
|
Transfers out
|
-
|
(2
|
)
|
-
|
(2
|
)
|
||||||||||
|
Purchases
|
3
|
-
|
65
|
68
|
||||||||||||
|
Sales
|
(1
|
)
|
(4
|
)
|
(205
|
)
|
(210
|
)
|
||||||||
|
Balance at end of year
|
$
|
1
|
$
|
40
|
$
|
2,273
|
$
|
2,314
|
||||||||
|
Postretirement Assets
|
Fixed Income Funds
|
Total
|
||||||
|
Balance at beginning of year
|
$
|
15
|
$
|
15
|
||||
|
Realized gains (losses)
|
(2
|
)
|
(2
|
)
|
||||
|
Unrealized gains (losses)
|
2
|
2
|
||||||
|
Transfers in
|
16
|
16
|
||||||
|
Sales
|
(5
|
)
|
(5
|
)
|
||||
|
Balance at end of year
|
$
|
26
|
$
|
26
|
||||
79
Notes to Consolidated Financial Statements (continued)
Dollars in millions except per share amounts
The following tables set forth by level, within the fair value hierarchy, the pension and postretirement assets and liabilities at fair value as of December 31, 2015:
|
Pension Assets and Liabilities at Fair Value as of December 31, 2015
|
||||||||||||||||
|
Level 1
|
Level 2
|
Level 3
|
Total
|
|||||||||||||
|
Non-interest bearing cash
|
$
|
160
|
$
|
-
|
$
|
-
|
$
|
160
|
||||||||
|
Interest bearing cash
|
-
|
25
|
-
|
25
|
||||||||||||
|
Foreign currency contracts
|
-
|
25
|
-
|
25
|
||||||||||||
|
Equity securities:
|
||||||||||||||||
|
Domestic equities
|
8,315
|
4
|
-
|
8,319
|
||||||||||||
|
International equities
|
4,287
|
-
|
-
|
4,287
|
||||||||||||
|
Fixed income securities:
|
||||||||||||||||
|
Asset-backed securities
|
-
|
403
|
1
|
404
|
||||||||||||
|
Mortgage-backed securities
|
-
|
792
|
-
|
792
|
||||||||||||
|
Collateralized mortgage-backed securities
|
-
|
278
|
-
|
278
|
||||||||||||
|
Collateralized mortgage obligations/REMICS
|
-
|
345
|
-
|
345
|
||||||||||||
|
Corporate and other fixed income instruments and funds
|
65
|
8,274
|
43
|
8,382
|
||||||||||||
|
Government and municipal bonds
|
75
|
4,495
|
-
|
4,570
|
||||||||||||
|
Real estate and real assets
|
-
|
-
|
2,062
|
2,062
|
||||||||||||
|
Securities lending collateral
|
512
|
3,538
|
-
|
4,050
|
||||||||||||
|
Receivable for variation margin
|
13
|
-
|
-
|
13
|
||||||||||||
|
Assets at fair value
|
13,427
|
18,179
|
2,106
|
33,712
|
||||||||||||
|
Investments sold short and other liabilities at fair value
|
(824
|
)
|
(12
|
)
|
-
|
(836
|
)
|
|||||||||
|
Total plan net assets at fair value
|
$
|
12,603
|
$
|
18,167
|
$
|
2,106
|
$
|
32,876
|
||||||||
|
Assets held at net asset value practical expedient
|
||||||||||||||||
|
Private equity funds
|
4,926
|
|||||||||||||||
|
Real estate funds
|
2,295
|
|||||||||||||||
|
Commingled funds
|
5,854
|
|||||||||||||||
|
Total assets held at net asset value practical expedient
|
13,075
|
|||||||||||||||
|
Other assets (liabilities)1
|
(3,756
|
)
|
||||||||||||||
|
Total Plan Net Assets
|
$
|
42,195
|
||||||||||||||
|
1 Other assets (liabilities) include amounts receivable, accounts payable and net adjustment for securities lending payable.
|
||||||||||||||||
80
Notes to Consolidated Financial Statements (continued)
Dollars in millions except per share amounts
|
Postretirement Assets and Liabilities at Fair Value as of December 31, 2015
|
||||||||||||||||
|
Level 1
|
Level 2
|
Level 3
|
Total
|
|||||||||||||
|
Interest bearing cash
|
$
|
220
|
$
|
1,292
|
$
|
-
|
$
|
1,512
|
||||||||
|
Foreign currencies
|
4
|
-
|
-
|
4
|
||||||||||||
|
Equity securities:
|
||||||||||||||||
|
Domestic equities
|
1,187
|
9
|
-
|
1,196
|
||||||||||||
|
International equities
|
869
|
2
|
-
|
871
|
||||||||||||
|
Fixed income securities:
|
||||||||||||||||
|
Asset-backed securities
|
-
|
35
|
2
|
37
|
||||||||||||
|
Collateralized mortgage-backed securities
|
-
|
120
|
13
|
133
|
||||||||||||
|
Collateralized mortgage obligations
|
-
|
45
|
-
|
45
|
||||||||||||
|
Corporate and other fixed income instruments and funds
|
-
|
378
|
-
|
378
|
||||||||||||
|
Government and municipal bonds
|
-
|
617
|
-
|
617
|
||||||||||||
|
Securities lending collateral
|
6
|
189
|
-
|
195
|
||||||||||||
|
Futures Contracts
|
1
|
-
|
-
|
1
|
||||||||||||
|
Total plan net assets at fair value
|
$
|
2,287
|
$
|
2,687
|
$
|
15
|
$
|
4,989
|
||||||||
|
Assets held at net asset value practical expedient
|
||||||||||||||||
|
Private equity funds
|
155
|
|||||||||||||||
|
Real estate funds
|
81
|
|||||||||||||||
|
Commingled funds
|
1,682
|
|||||||||||||||
|
Total assets held at net asset value practical expedient
|
1,918
|
|||||||||||||||
|
Other assets (liabilities)1
|
(236
|
)
|
||||||||||||||
|
Total Plan Net Assets
|
$
|
6,671
|
||||||||||||||
|
1 Other assets (liabilities) include amounts receivable, accounts payable and net adjustment for securities lending payable.
|
||||||||||||||||
The tables below set forth a summary of changes in the fair value of the Level 3 pension and postretirement assets for the year ended December 31, 2015:
|
Pension Assets
|
Equities
|
Fixed Income Funds
|
Real Estate and Real Assets
|
Total
|
||||||||||||
|
Balance at beginning of year
|
$
|
-
|
$
|
51
|
$
|
2,140
|
$
|
2,191
|
||||||||
|
Realized gains (losses)
|
(1
|
)
|
(19
|
)
|
247
|
227
|
||||||||||
|
Unrealized gains (losses)
|
1
|
16
|
192
|
209
|
||||||||||||
|
Purchases
|
-
|
1
|
195
|
196
|
||||||||||||
|
Sales
|
-
|
(5
|
)
|
(712
|
)
|
(717
|
)
|
|||||||||
|
Balance at end of year
|
$
|
-
|
$
|
44
|
$
|
2,062
|
$
|
2,106
|
||||||||
|
Postretirement Assets
|
Fixed Income Funds
|
Total
|
||||||
|
Balance at beginning of year
|
$
|
2
|
$
|
2
|
||||
|
Transfers in
|
15
|
15
|
||||||
|
Transfers out
|
(1
|
)
|
(1
|
)
|
||||
|
Sales
|
(1
|
)
|
(1
|
)
|
||||
|
Balance at end of year
|
$
|
15
|
$
|
15
|
||||
Estimated Future Benefit Payments
Expected benefit payments are estimated using the same assumptions used in determining our benefit obligation at December 31, 2016. Because benefit payments will depend on future employment and compensation levels, average years employed, average life spans, and payment elections, among other factors, changes in any of these assumptions could significantly affect these expected amounts. The following table provides expected benefit payments under our pension and postretirement plans:
81
Notes to Consolidated Financial Statements (continued)
Dollars in millions except per share amounts
|
Pension Benefits
|
Postretirement Benefits
|
|||||||
|
2017
|
$
|
4,938
|
$
|
1,809
|
||||
|
2018
|
4,437
|
1,797
|
||||||
|
2019
|
4,312
|
1,788
|
||||||
|
2020
|
4,264
|
1,783
|
||||||
|
2021
|
4,200
|
1,776
|
||||||
|
Years 2022 - 2026
|
19,764
|
8,225
|
||||||
Supplemental Retirement Plans
We also provide certain senior- and middle-management employees with nonqualified, unfunded supplemental retirement and savings plans. While these plans are unfunded, we have assets in a designated nonbankruptcy remote trust that are independently managed and used to provide for these benefits. These plans include supplemental pension benefits as well as compensation-deferral plans, some of which include a corresponding match by us based on a percentage of the compensation deferral.
We use the same significant assumptions for the composite rate of compensation increase in determining our projected benefit obligation and the net pension and postemployment benefit cost. Our discount rates of 4.20% at December 31, 2016 and 4.40% at December 31, 2015 were calculated using the same methodologies used in calculating the discount rate for our qualified pension and postretirement benefit plans. The following tables provide the plans’ benefit obligations and fair value of assets at December 31 and the components of the supplemental retirement pension benefit cost. The net amounts are recorded as “Other noncurrent liabilities” on our consolidated balance sheets.
The following table provides information for our supplemental retirement plans with accumulated benefit obligations in excess of plan assets at December 31:
|
2016
|
2015
|
|||||||
|
Projected benefit obligation
|
$
|
(2,378
|
)
|
$
|
(2,444
|
)
|
||
|
Accumulated benefit obligation
|
(2,314
|
)
|
(2,372
|
)
|
||||
|
Fair value of plan assets
|
-
|
-
|
||||||
The following tables present the components of net periodic benefit cost and other changes in plan assets and benefit obligations recognized in OCI:
|
Net Periodic Benefit Cost
|
2016
|
2015
|
2014
|
|||||||||
|
Service cost – benefits earned during the period
|
$
|
12
|
$
|
9
|
$
|
7
|
||||||
|
Interest cost on projected benefit obligation
|
83
|
77
|
109
|
|||||||||
|
Amortization of prior service cost (credit)
|
(1
|
)
|
1
|
(1
|
)
|
|||||||
|
Actuarial (gain) loss
|
72
|
(36
|
)
|
243
|
||||||||
|
Net supplemental retirement pension cost
|
$
|
166
|
$
|
51
|
$
|
358
|
||||||
|
Other Changes Recognized in
Other Comprehensive Income
|
2016
|
2015
|
2014
|
|||||||||
|
Prior service (cost) credit
|
$
|
1
|
$
|
(1
|
)
|
$
|
(11
|
)
|
||||
|
Amortization of prior service cost (credit)
|
(1
|
)
|
1
|
(1
|
)
|
|||||||
|
Total recognized in other comprehensive (income) loss (net of tax)
|
$
|
-
|
$
|
-
|
$
|
(12
|
)
|
|||||
The estimated prior service credit for our supplemental retirement plan benefits that will be amortized from accumulated OCI into net periodic benefit cost over the next fiscal year is $(1).
Deferred compensation expense was $148 in 2016, $122 in 2015 and $121 in 2014. Our deferred compensation liability, included in “Other noncurrent liabilities,” was $1,273 at December 31, 2016, and $1,221 at December 31, 2015.
82
Notes to Consolidated Financial Statements (continued)
Dollars in millions except per share amounts
Contributory Savings Plans
We maintain contributory savings plans that cover substantially all employees. Under the savings plans, we match in cash or company stock a stated percentage of eligible employee contributions, subject to a specified ceiling. There are no debt-financed shares held by the Employee Stock Ownership Plans, allocated or unallocated.
Our match of employee contributions to the savings plans is fulfilled with purchases of our stock on the open market or company cash. Benefit cost is based on the cost of shares or units allocated to participating employees’ accounts and was $631, $653 and $654 for the years ended December 31, 2016, 2015 and 2014.
NOTE 13. SHARE-BASED PAYMENTS
Under our various plans, senior and other management employees and nonemployee directors have received nonvested stock and stock units. In conjunction with the acquisition of DIRECTV, restricted stock units issued under DIRECTV plans were converted to AT&T shares. The remaining shares will vest over a period of one to two years in accordance with the terms of those plans. We do not intend to issue any additional grants under the DIRECTV plans. Any future grants will be made under the AT&T plans.
We grant performance stock units, which are nonvested stock units, based upon our stock price at the date of grant and award them in the form of AT&T common stock and cash at the end of a three-year period, subject to the achievement of certain performance goals. We treat the cash settled portion of these awards as a liability. We grant forfeitable restricted stock and stock units, which are valued at the market price of our common stock at the date of grant and predominantly vest over a four- or five-year period. We also grant other nonvested stock units and award them in cash at the end of a three-year period, subject to the achievement of certain market based conditions. As of December 31, 2016, we were authorized to issue up to approximately 130 million shares of common stock (in addition to shares that may be issued upon exercise of outstanding options or upon vesting of performance stock units or other nonvested stock units) to officers, employees and directors pursuant to these various plans.
We account for our share-based payment arrangements based on the fair value of the awards on their respective grant date, which may affect our ability to fully realize the value shown on our consolidated balance sheets of deferred tax assets associated with compensation expense. We record a valuation allowance when our future taxable income is not expected to be sufficient to recover the asset. Accordingly, there can be no assurance that the current stock price of our common shares will rise to levels sufficient to realize the entire tax benefit currently reflected on our consolidated balance sheets. However, to the extent we generate excess tax benefits (i.e., that additional tax benefits in excess of the deferred taxes associated with compensation expense previously recognized) the potential future impact on income would be reduced.
Our consolidated statements of income include the compensation cost recognized for those plans as operating expenses, as well as the associated tax benefits, which are reflected in the table below:
|
2016
|
2015
|
2014
|
||||||||||
|
Performance stock units
|
$
|
480
|
$
|
299
|
$
|
226
|
||||||
|
Restricted stock and stock units
|
152
|
147
|
93
|
|||||||||
|
Other nonvested stock units
|
21
|
5
|
(1
|
)
|
||||||||
|
Total
|
$
|
653
|
$
|
451
|
$
|
318
|
||||||
|
Income tax benefit
|
$
|
250
|
$
|
172
|
$
|
122
|
||||||
83
Notes to Consolidated Financial Statements (continued)
Dollars in millions except per share amounts
A summary of the status of our nonvested stock units as of December 31, 2016, and changes during the year then ended is presented as follows (shares in millions):
|
Nonvested Stock Units
|
Shares
|
Weighted-Average Grant-Date Fair
Value
|
||||||
|
Nonvested at January 1, 2016
|
36
|
$
|
33.78
|
|||||
|
Granted
|
16
|
36.65
|
||||||
|
Vested
|
(19
|
)
|
33.12
|
|||||
|
Forfeited
|
(2
|
)
|
35.16
|
|||||
|
Nonvested at December 31, 2016
|
31
|
$
|
35.57
|
|||||
As of December 31, 2016, there was $587 of total unrecognized compensation cost related to nonvested share-based payment arrangements granted. That cost is expected to be recognized over a weighted-average period of 2.24 years. The total fair value of shares vested during the year was $614 for 2016, compared to $450 for 2015 and $327 for 2014.
It is our intent to satisfy share option exercises using our treasury stock. Cash received from stock option exercises was $179 for 2016, $46 for 2015 and $43 for 2014.
NOTE 14. STOCKHOLDERS’ EQUITY
Stock Repurchase Program From time to time, we repurchase shares of common stock for distribution through our employee benefit plans or in connection with certain acquisitions. In March 2013, our Board of Directors approved an authorization to repurchase 300 million shares, under which we repurchased shares during 2014. In March 2014, our Board of Directors approved an additional authorization to repurchase up to 300 million shares of our common stock. For the year ended December 31, 2016, we had repurchased approximately 11 million shares for distribution through our employee benefit plans totaling $444 under these authorizations. For the year ended December 31, 2015, we had repurchased approximately eight million shares totaling $269 under these authorizations.
To implement these authorizations, we used open market repurchase programs, relying on Rule 10b5-1 of the Securities Exchange Act of 1934 where feasible.
Authorized Shares There are 14 billion authorized common shares of AT&T stock and 10 million authorized preferred shares of AT&T stock. As of December 31, 2016 and 2015, no preferred shares were outstanding.
Dividend Declarations In October 2016, the Company declared an increase in its quarterly dividend to $0.49 per share of common stock. In December 2015, the Company declared an increase in its quarterly dividend to $0.48 per share of common stock.
Preferred Equity Interest The preferred equity interest discussed in Note 12 is not transferable by the trust except through its put and call features, and therefore has been eliminated in consolidation. After a period of five years from the contribution or, if earlier, the date upon which the pension plan trust is fully funded as determined under GAAP, AT&T has a right to purchase from the pension plan trust some or all of the preferred equity interest at the greater of the fair market value or minimum liquidation value plus any unpaid cumulative dividends. In addition, AT&T will have the right to purchase the preferred equity interest in the event AT&T’s ownership of Mobility is less than 50% or there is a transaction that results in the transfer of 50% or more of the pension plan trust’s assets to an entity not under common control with AT&T (collectively, a change of control). The pension plan trust has the right to require AT&T to purchase the preferred equity interest at the greater of their fair market value or minimum liquidation value plus any unpaid cumulative dividends, and in installments, as specified in the contribution agreement upon the occurrence of any of the following: (1) at any time if the ratio of debt to total capitalization of Mobility exceeds that of AT&T, (2) the date on which AT&T Inc. is rated below investment grade for two consecutive calendar quarters, (3) upon a change of control if AT&T does not exercise its purchase option, or (4) at any time after a seven-year period from the contribution date. In the event AT&T elects or is required to purchase the preferred equity interest, AT&T may elect to settle the purchase price in cash or shares of AT&T common stock or a combination thereof. Because the preferred equity interest was not considered outstanding for accounting purposes at year-end, it did not affect the calculation of earnings per share for any of the periods presented.
84
Notes to Consolidated Financial Statements (continued)
Dollars in millions except per share amounts
NOTE 15. SALES OF EQUIPMENT INSTALLMENT RECEIVABLES
We offer our customers the option to purchase certain wireless devices in installments over a period of up to 30 months and, in many cases, they have the right to trade in the original equipment for a new device within a set period and have the remaining unpaid balance satisfied. As of December 31, 2016 and December 31, 2015, gross equipment installment receivables of $5,665 and $5,719 were included on our consolidated balance sheets, of which $3,425 and $3,239 are notes receivable that are included in “Accounts receivable - net.”
In 2014, we entered into an uncommitted agreement pertaining to the sale of equipment installment receivables and related security with Citibank and various other relationship banks as purchasers (collectively, the Purchasers). Under this agreement, we transferred certain receivables to the Purchasers for cash and additional consideration upon settlement of the receivables, referred to as the deferred purchase price. Under the terms of the agreement, we continue to bill and collect the payments from our customers on behalf of the Purchasers. Since inception, cash proceeds received, net of remittances (excluding amounts returned as deferred purchase price), were $3,436.
The following table sets forth a summary of equipment installment receivables sold:
|
2016
|
2015
|
2014
|
||||||||||
|
Gross receivables sold
|
$
|
7,629
|
$
|
7,436
|
$
|
4,707
|
||||||
|
Net receivables sold1
|
6,913
|
6,704
|
4,126
|
|||||||||
|
Cash proceeds received
|
4,574
|
4,439
|
2,528
|
|||||||||
|
Deferred purchase price recorded
|
2,368
|
2,266
|
1,629
|
|||||||||
|
1 Receivables net of allowance, imputed interest and trade-in right guarantees.
|
||||||||||||
The deferred purchase price is initially recorded at estimated fair value, which is based on remaining installment payments expected to be collected, adjusted by the expected timing and value of device trade-ins, and subsequently carried at the lower of cost or net realizable value. The estimated value of the device trade-ins considers prices offered to us by independent third parties that contemplate changes in value after the launch of a device model. The fair value measurements used are considered Level 3 under the Fair Value Measurement and Disclosure framework (see Note 10).
The following table shows the equipment installment receivables, previously sold to the Purchasers, that we repurchased in exchange for the associated deferred purchase price:
|
2016
|
2015
|
2014
|
||||||||||
|
Fair value of repurchased receivables
|
$
|
1,675
|
$
|
685
|
$
|
-
|
||||||
|
Carrying value of deferred purchase price
|
1,638
|
534
|
-
|
|||||||||
|
Gain on repurchases1
|
$
|
37
|
$
|
151
|
$
|
-
|
||||||
|
1 These gains are included in “Selling, general and administrative” in the consolidated statements of income.
|
||||||||||||
At December 31, 2016 and December 31, 2015, our deferred purchase price receivable was $3,090 and $2,961, respectively, of which $1,606 and $1,772 are included in “Other current assets” on our consolidated balance sheets, with the remainder in “Other Assets.” Our maximum exposure to loss as a result of selling these equipment installment receivables is limited to the amount of our deferred purchase price at any point in time.
The sales of equipment installment receivables did not have a material impact on our consolidated statements of income or to “Total Assets” reported on our consolidated balance sheets. We reflect the cash flows related to the arrangement as operating activities in our consolidated statements of cash flows because the cash received from the Purchasers upon both the sale of the receivables and the collection of the deferred purchase price is not subject to significant interest rate risk.
NOTE 16. TOWER TRANSACTION
In December 2013, we closed our transaction with Crown Castle International Corp. (Crown Castle) in which Crown Castle gained the exclusive rights to lease and operate 9,048 wireless towers and purchased 627 of our wireless towers for $4,827 in cash. The leases have various terms with an average length of approximately 28 years. As the leases expire, Crown Castle will have fixed price purchase options for these towers totaling approximately $4,200, based on their estimated fair market
85
Notes to Consolidated Financial Statements (continued)
Dollars in millions except per share amounts
values at the end of the lease terms. We sublease space on the towers from Crown Castle for an initial term of 10 years at current market rates, subject to optional renewals in the future.
We determined our continuing involvement with the tower assets prevented us from achieving sale-leaseback accounting for the transaction, and we accounted for the cash proceeds from Crown Castle as a financing obligation on our consolidated balance sheets. We record interest on the financing obligation using the effective interest method at a rate of approximately 3.9%. The financing obligation is increased by interest expense and estimated future net cash flows generated and retained by Crown Castle from operation of the tower sites, and reduced by our contractual payments. We continue to include the tower assets in “Property, plant and equipment” on our consolidated balance sheets and depreciate them accordingly. At December 31, 2016 and 2015, the tower assets had a balance of $921 and $960, respectively. Our depreciation expense for these assets was $39 for each of 2016, 2015 and 2014.
Payments made to Crown Castle under this arrangement were $230 for 2016. At December 31, 2016, the future minimum payments under the sublease arrangement are $234 for 2017, $239 for 2018, $244 for 2019, $248 for 2020, $253 for 2021, and $2,052 thereafter.
NOTE 17. CONTINGENT LIABILITIES
We are party to numerous lawsuits, regulatory proceedings and other matters arising in the ordinary course of business. In evaluating these matters on an ongoing basis, we take into account amounts already accrued on the balance sheet. In our opinion, although the outcomes of these proceedings are uncertain, they should not have a material adverse effect on our financial position, results of operations or cash flows.
We have contractual obligations to purchase certain goods or services from various other parties. Our purchase obligations are expected to be approximately $9,181 in 2017, $11,214 in total for 2018 and 2019, $7,799 in total for 2020 and 2021 and $7,242 in total for years thereafter.
See Note 10 for a discussion of collateral and credit-risk contingencies.
NOTE 18. ADDITIONAL FINANCIAL INFORMATION
|
December 31,
|
||||||||
|
Consolidated Balance Sheets
|
2016
|
2015
|
||||||
|
Current customer fulfillment costs (included in Other current assets)
|
$
|
3,398
|
$
|
2,923
|
||||
|
Accounts payable and accrued liabilities:
|
||||||||
|
Accounts payable
|
$
|
22,027
|
$
|
21,047
|
||||
|
Accrued payroll and commissions
|
2,450
|
2,629
|
||||||
|
Current portion of employee benefit obligation
|
1,644
|
1,766
|
||||||
|
Accrued interest
|
2,023
|
1,974
|
||||||
|
Other
|
2,994
|
2,956
|
||||||
|
Total accounts payable and accrued liabilities
|
$
|
31,138
|
$
|
30,372
|
||||
|
Consolidated Statements of Income
|
2016
|
2015
|
2014
|
|||||||||
|
Advertising expense
|
$
|
3,768
|
$
|
3,632
|
$
|
3,272
|
||||||
|
Interest expense incurred
|
$
|
5,802
|
$
|
4,917
|
$
|
3,847
|
||||||
|
Capitalized interest
|
(892
|
)
|
(797
|
)
|
(234
|
)
|
||||||
|
Total interest expense
|
$
|
4,910
|
$
|
4,120
|
$
|
3,613
|
||||||
|
Consolidated Statements of Cash Flows
|
2016
|
2015
|
2014
|
|||||||||
|
Cash paid during the year for:
|
||||||||||||
|
Interest
|
$
|
5,696
|
$
|
4,822
|
$
|
4,099
|
||||||
|
Income taxes, net of refunds
|
3,721
|
1,851
|
1,532
|
|||||||||
No customer accounted for more than 10% of consolidated revenues in 2016, 2015 or 2014.
86
Notes to Consolidated Financial Statements (continued)
Dollars in millions except per share amounts
Labor Contracts As of January 31, 2017, we employed approximately 268,000 persons. Approximately 48% of our employees are represented by the Communications Workers of America, the International Brotherhood of Electrical Workers or other unions. Contracts covering approximately 20,000 mobility employees across the country and approximately 25,000 traditional wireline employees in our Southwest and Midwest regions have expired or will expire in 2017. Additionally, negotiations continue with approximately 15,000 traditional wireline employees in our West region where the contract expired in April 2016. Approximately 11,000 former DIRECTV employees were eligible for and chose union representation. Bargaining has resulted in approximately 70% of these employees now being covered under ratified contracts that expire between 2017 and 2020. After expiration of the current agreements, work stoppages or labor disruptions may occur in the absence of new contracts or other agreements being reached.
NOTE 19. QUARTERLY FINANCIAL INFORMATION (UNAUDITED)
The following tables represent our quarterly financial results:
|
2016 Calendar Quarter
|
|||||||||||||||||||||
|
First
|
Second
|
Third
|
Fourth1
|
Annual
|
|||||||||||||||||
|
Total Operating Revenues
|
$
|
40,535
|
$
|
40,520
|
$
|
40,890
|
$
|
41,841
|
$
|
163,786
|
|||||||||||
|
Operating Income
|
7,131
|
6,560
|
6,408
|
4,248
|
24,347
|
||||||||||||||||
|
Net Income
|
3,885
|
3,515
|
3,418
|
2,515
|
13,333
|
||||||||||||||||
|
Net Income Attributable to AT&T
|
3,803
|
3,408
|
3,328
|
2,437
|
12,976
|
||||||||||||||||
|
Basic Earnings Per Share
|
|||||||||||||||||||||
|
Attributable to AT&T2
|
$
|
0.62
|
$
|
0.55
|
$
|
0.54
|
$
|
0.39
|
$
|
2.10
|
|||||||||||
|
Diluted Earnings Per Share
|
|||||||||||||||||||||
|
Attributable to AT&T2
|
$
|
0.61
|
$
|
0.55
|
$
|
0.54
|
$
|
0.39
|
$
|
2.10
|
|||||||||||
|
Stock Price
|
|||||||||||||||||||||
|
High
|
$
|
39.45
|
$
|
43.21
|
$
|
43.47
|
$
|
42.73
|
|||||||||||||
|
Low
|
33.51
|
37.86
|
39.71
|
36.13
|
|||||||||||||||||
|
Close
|
39.17
|
43.21
|
40.61
|
42.53
|
|||||||||||||||||
|
1 Includes an actuarial loss on pension and postretirement benefit plans (Note 12), asset impairment charge (Note 1) and change in accounting estimate (Note 1).
|
|||||||||||||||||||||
|
2 Quarterly earnings per share impacts may not add to full-year earnings per share impacts due to the difference in weighted-average common shares for the quarters versus the weighted-average common shares for the year.
|
|||||||||||||||||||||
|
2015 Calendar Quarter
|
||||||||||||||||||||
|
First
|
Second
|
Third
|
Fourth1
|
Annual
|
||||||||||||||||
|
Total Operating Revenues
|
$
|
32,576
|
$
|
33,015
|
$
|
39,091
|
$
|
42,119
|
$
|
146,801
|
||||||||||
|
Operating Income
|
5,557
|
5,773
|
5,923
|
7,532
|
24,785
|
|||||||||||||||
|
Net Income
|
3,339
|
3,184
|
3,078
|
4,086
|
13,687
|
|||||||||||||||
|
Net Income Attributable to AT&T
|
3,263
|
3,082
|
2,994
|
4,006
|
13,345
|
|||||||||||||||
|
Basic Earnings Per Share
|
||||||||||||||||||||
|
Attributable to AT&T2
|
$
|
0.63
|
$
|
0.59
|
$
|
0.50
|
$
|
0.65
|
$
|
2.37
|
||||||||||
|
Diluted Earnings Per Share
|
||||||||||||||||||||
|
Attributable to AT&T2
|
$
|
0.63
|
$
|
0.59
|
$
|
0.50
|
$
|
0.65
|
$
|
2.37
|
||||||||||
|
Stock Price
|
||||||||||||||||||||
|
High
|
$
|
35.07
|
$
|
36.45
|
$
|
35.93
|
$
|
34.99
|
||||||||||||
|
Low
|
32.41
|
32.37
|
30.97
|
32.17
|
||||||||||||||||
|
Close
|
32.65
|
35.52
|
32.58
|
34.41
|
||||||||||||||||
|
1 Includes an actuarial gain on pension and postretirement benefit plans (Note 12) and asset abandonment charges (Note 6).
|
||||||||||||||||||||
|
2 Quarterly earnings per share impacts may not add to full-year earnings per share impacts due to the difference in weighted-average common shares for the quarters versus the weighted-average common shares for the year.
|
||||||||||||||||||||
Report of Management
The consolidated financial statements have been prepared in conformity with U.S. generally accepted accounting principles. The integrity and objectivity of the data in these financial statements, including estimates and judgments relating to matters not concluded by year end, are the responsibility of management, as is all other information included in the Annual Report, unless otherwise indicated.
The financial statements of AT&T Inc. (AT&T) have been audited by Ernst & Young LLP, Independent Registered Public Accounting Firm. Management has made available to Ernst & Young LLP all of AT&T’s financial records and related data, as well as the minutes of stockholders’ and directors’ meetings. Furthermore, management believes that all representations made to Ernst & Young LLP during its audit were valid and appropriate.
Management maintains disclosure controls and procedures that are designed to ensure that information required to be disclosed by AT&T is recorded, processed, summarized, accumulated and communicated to its management, including its principal executive and principal financial officers, to allow timely decisions regarding required disclosure, and reported within the time periods specified by the Securities and Exchange Commission’s rules and forms.
Management also seeks to ensure the objectivity and integrity of its financial data by the careful selection of its managers, by organizational arrangements that provide an appropriate division of responsibility and by communication programs aimed at ensuring that its policies, standards and managerial authorities are understood throughout the organization.
The Audit Committee of the Board of Directors meets periodically with management, the internal auditors and the independent auditors to review the manner in which they are performing their respective responsibilities and to discuss auditing, internal accounting controls and financial reporting matters. Both the internal auditors and the independent auditors periodically meet alone with the Audit Committee and have access to the Audit Committee at any time.
Assessment of Internal Control
The management of AT&T is responsible for establishing and maintaining adequate internal control over financial reporting, as defined in Rule 13a-15(f) or 15d-15(f) under the Securities Exchange Act of 1934. AT&T’s internal control system was designed to provide reasonable assurance to the company’s management and Board of Directors regarding the preparation and fair presentation of published financial statements.
AT&T management assessed the effectiveness of the company’s internal control over financial reporting as of December 31, 2016. In making this assessment, it used the criteria set forth by the Committee of Sponsoring Organizations of the Treadway Commission (COSO) in Internal Control – Integrated Framework (2013 framework). Based on its assessment, AT&T management believes that, as of December 31, 2016, the company’s internal control over financial reporting is effective based on those criteria.
Ernst & Young LLP, the independent registered public accounting firm that audited the financial statements included in this Annual Report, has issued an attestation report on the company’s internal control over financial reporting.
/s/ Randall Stephenson /s/ John J. Stephens
Randall Stephenson John J. Stephens
Chairman of the Board, Senior Executive Vice President and
Chief Executive Officer and President Chief Financial Officer
88
Report of Independent Registered Public Accounting Firm
The Board of Directors and Stockholders of AT&T Inc.
We have audited the accompanying consolidated balance sheets of AT&T Inc. (the Company) as of December 31, 2016 and 2015, and the related consolidated statements of income, comprehensive income, changes in stockholders’ equity and cash flows for each of the three years in the period ended December 31, 2016. These financial statements are the responsibility of the Company’s management. Our responsibility is to express an opinion on these financial statements based on our audits.
We conducted our audits in accordance with the standards of the Public Company Accounting Oversight Board (United States). Those standards require that we plan and perform the audit to obtain reasonable assurance about whether the financial statements are free of material misstatement. An audit includes examining, on a test basis, evidence supporting the amounts and disclosures in the financial statements. An audit also includes assessing the accounting principles used and significant estimates made by management, as well as evaluating the overall financial statement presentation. We believe that our audits provide a reasonable basis for our opinion.
In our opinion, the financial statements referred to above present fairly, in all material respects, the consolidated financial position of the Company at December 31, 2016 and 2015, and the consolidated results of its operations and its cash flows for each of the three years in the period ended December 31, 2016, in conformity with U.S. generally accepted accounting principles.
We also have audited, in accordance with the standards of the Public Company Accounting Oversight Board (United States), the Company’s internal control over financial reporting as of December 31, 2016, based on criteria established in Internal Control-Integrated Framework issued by the Committee of Sponsoring Organizations of the Treadway Commission (2013 framework) and our report dated February 17, 2017 expressed an unqualified opinion thereon.
/s/ Ernst and Young LLP
Dallas, Texas
February 17, 2017
89
Report of Independent Registered Public Accounting Firm
The Board of Directors and Stockholders of AT&T Inc.
We have audited AT&T Inc.’s (the Company) internal control over financial reporting as of December 31, 2016, based on criteria established in Internal Control-Integrated Framework issued by the Committee of Sponsoring Organizations of the Treadway Commission (2013 framework) (the COSO criteria). The Company’s management is responsible for maintaining effective internal control over financial reporting, and for its assessment of the effectiveness of internal control over financial reporting included in the accompanying Report of Management. Our responsibility is to express an opinion on the Company’s internal control over financial reporting based on our audit.
We conducted our audit in accordance with the standards of the Public Company Accounting Oversight Board (United States). Those standards require that we plan and perform the audit to obtain reasonable assurance about whether effective internal control over financial reporting was maintained in all material respects. Our audit included obtaining an understanding of internal control over financial reporting, assessing the risk that a material weakness exists, testing and evaluating the design and operating effectiveness of internal control based on the assessed risk, and performing such other procedures as we considered necessary in the circumstances. We believe that our audit provides a reasonable basis for our opinion.
A company’s internal control over financial reporting is a process designed to provide reasonable assurance regarding the reliability of financial reporting and the preparation of financial statements for external purposes in accordance with generally accepted accounting principles. A company’s internal control over financial reporting includes those policies and procedures that (1) pertain to the maintenance of records that, in reasonable detail, accurately and fairly reflect the transactions and dispositions of the assets of the company; (2) provide reasonable assurance that transactions are recorded as necessary to permit preparation of financial statements in accordance with generally accepted accounting principles, and that receipts and expenditures of the company are being made only in accordance with authorizations of management and directors of the company; and (3) provide reasonable assurance regarding prevention or timely detection of unauthorized acquisition, use, or disposition of the company’s assets that could have a material effect on the financial statements.
Because of its inherent limitations, internal control over financial reporting may not prevent or detect misstatements. Also, projections of any evaluation of effectiveness to future periods are subject to the risk that controls may become inadequate because of changes in conditions, or that the degree of compliance with the policies or procedures may deteriorate.
In our opinion, the Company maintained, in all material respects, effective internal control over financial reporting as of December 31, 2016, based on the COSO criteria.
We also have audited, in accordance with the standards of the Public Company Accounting Oversight Board (United States), the consolidated balance sheets of the Company as of December 31, 2016 and 2015, and the related consolidated statements of income, comprehensive income, changes in stockholders’ equity and cash flows for each of the three years in the period ended December 31, 2016 and our report dated February 17, 2017 expressed an unqualified opinion thereon.
/s/ Ernst and Young LLP
Dallas, Texas
February 17, 2017
February 17, 2017
90