Attached files
| file | filename |
|---|---|
| EX-21.1 - EXHIBIT 21.1 - Urban Edge Properties | exhibit211subsidiaries.htm |
| EX-32.2 - EXHIBIT 32.2 - Urban Edge Properties | exhibit322certofceoandcfo-.htm |
| EX-32.1 - EXHIBIT 32.1 - Urban Edge Properties | exhibit321certofceoandcfo-.htm |
| EX-31.4 - EXHIBIT 31.4 - Urban Edge Properties | exhibit314certofcfo-sox302.htm |
| EX-31.3 - EXHIBIT 31.3 - Urban Edge Properties | exhibit313certofceo-sox302.htm |
| EX-31.2 - EXHIBIT 31.2 - Urban Edge Properties | exhibit312certofcfo-sox302.htm |
| EX-31.1 - EXHIBIT 31.1 - Urban Edge Properties | exhibit311certofceo-sox302.htm |
| EX-23.2 - EXHIBIT 23.2 - Urban Edge Properties | exhibit232consentofindepen.htm |
| EX-23.1 - EXHIBIT 23.1 - Urban Edge Properties | exhibit231consentofindepen.htm |
UNITED STATES
SECURITIES AND EXCHANGE COMMISSION
WASHINGTON, D. C. 20549
FORM 10-K
x | ANNUAL REPORT PURSUANT TO SECTION 13 OR 15(d) OF THE SECURITIES EXCHANGE ACT OF 1934 | |
For the annual period ended December 31, 2016
OR
o | TRANSITION REPORT PURSUANT TO SECTION 13 OR 15(d) OF THE SECURITIES EXCHANGE ACT OF 1934 | |
For the transition period from __________to__________
Commission File Number: 001-36523 (Urban Edge Properties)
Commission File Number: 333-212951-01 (Urban Edge Properties LP)
URBAN EDGE PROPERTIES
URBAN EDGE PROPERTIES LP
(Exact name of Registrant as specified in its charter)
Maryland (Urban Edge Properties) | 47-6311266 | |
Delaware (Urban Edge Properties LP) | 36-4791544 | |
(State or other jurisdiction of incorporation or organization) | (I.R.S. Employer Identification Number) | |
888 Seventh Avenue, New York, New York | 10019 | |
(Address of Principal Executive Offices) | (Zip Code) | |
Registrant’s telephone number including area code: | (212) 956‑2556 |
Securities registered pursuant to Section 12(b) of the Act:
Urban Edge Properties
Title of Each Class | Name of Each Exchange on Which Registered | |
Common Shares, $.01 par value per share | New York Stock Exchange | |
Urban Edge Properties LP
Title of Each Class | Name of Each Exchange on Which Registered | |
None | N/A | |
Securities registered pursuant to Section 12(g) of the Act:
Urban Edge Properties: None Urban Edge Properties LP: Units of Partnership Interest
_______________________________
Indicate by check mark if the registrant is a well-known seasoned issuer, as defined in Rule 405 of the Securities Act.
Urban Edge Properties YES x NO o Urban Edge Properties LP YES o NO x
Indicate by check mark if the registrant is not required to file reports pursuant to Section 13 or Section 15(d) of the Act.
Urban Edge Properties YES o NO x Urban Edge Properties LP YES o NO x
Indicate by check mark whether the registrant: (1) has filed all reports required to be filed by Section 13 or 15(d) of the Securities Exchange Act of 1934 during the preceding 12 months (or for such shorter period that the registrant was required to file such reports), and (2) has been subject to such filing requirements for the past 90 days.
Urban Edge Properties YES x NO o Urban Edge Properties LP YES x NO o
Indicate by check mark whether the registrant has submitted electronically and posted on its corporate website, if any, every Interactive Data File required to be submitted and posted pursuant to Rule 405 of Regulation S-T (232.405 of this chapter) during the preceding 12 months (or for such shorter period that the registrant was required to submit and post such files).
Urban Edge Properties YES x NO o Urban Edge Properties LP YES x NO o
Indicate by check mark if disclosure of delinquent filers pursuant to Item 405 of Regulation S-K is not contained herein, and will not be contained, to the best of the registrant’s knowledge, in definitive proxy or information statements incorporated by reference in Part III of this Form 10-K or any amendment to this Form 10-K.
Urban Edge Properties o Urban Edge Properties LP o
Indicate by check mark whether the registrant is a large accelerated filer, an accelerated filer, a non-accelerated filer or a smaller reporting company. See the definitions of “large accelerated filer,” “accelerated filer” and “smaller reporting company” in Rule 12b-2 of the Exchange Act.
Urban Edge Properties:
Large Accelerated Filer x | Accelerated Filer o | Non-Accelerated Filer o | Smaller Reporting Company o |
Urban Edge Properties LP:
Large Accelerated Filer o | Accelerated Filer o | Non-Accelerated Filer x | Smaller Reporting Company o |
Indicate by check mark whether the registrant is a shell company (as defined in Rule 12b-2 of the Exchange Act).
Urban Edge Properties YES o NO x Urban Edge Properties LP YES o NO x
As of June 30, 2016, the last business day of the Registrant’s most recently completed second fiscal quarter, the aggregate market value of the Common Stock held by nonaffiliates of the Registrant was approximately $3.0 billion based upon the last reported sale price of $29.86 per share on the New York Stock Exchange on such date.
As of January 31, 2017, Urban Edge Properties had 99,749,917 common shares outstanding.
DOCUMENTS INCORPORATED BY REFERENCE
Part III incorporates by reference information from certain portions of the Urban Edge Properties’ definite proxy statement for the 2017 annual meeting of shareholders to be filed with the Securities and Exchange Commission within 120 days after the close of the fiscal year.
EXPLANATORY NOTE
This report combines the annual reports on Form 10-K for the period ended December 31, 2016 of Urban Edge Properties and Urban Edge Properties LP. Unless stated otherwise or the context otherwise requires, references to “UE” and “Urban Edge” mean Urban Edge Properties, a Maryland real estate investment trust (“REIT”), and references to “UELP” and the “Operating Partnership” mean Urban Edge Properties LP, a Delaware limited partnership. References to the “Company,” “we,” “us” and “our” mean collectively UE, UELP and those entities/subsidiaries consolidated by UE.
UELP is the entity through which we conduct substantially all of our business and own, either directly or through subsidiaries, substantially all of our assets. UE is the sole general partner and also a limited partner of UELP. As the sole general partner of UELP, UE has exclusive control of UELP’s day-to-day management.
As of December 31, 2016, UE owned an approximate 94.0% ownership interest in UELP. The remaining approximate 6.0% interest is owned by limited partners. The other limited partners of UELP are Vornado Realty L.P. (owning approximately 5.4% of the ownership interest of UELP), and members of management and our Board of Trustees. Under the limited partnership agreement of UELP, unitholders may present their common units of UELP for redemption at any time (subject to restrictions agreed upon at the time of issuance of the units that may restrict such right for a period of time). Upon presentation of a common unit for redemption, UELP must redeem the unit for cash equal to the then value of a share of UE’s common shares, as defined by the limited partnership agreement. In lieu of cash redemption by UELP, however, UE may elect in its sole discretion to acquire any common units so tendered by issuing common shares of UE in exchange for the common units. If UE so elects, its common shares will be exchanged for common units on a one-for-one basis. This one-for-one exchange ratio is subject to specified adjustments to prevent dilution. UE generally expects that it will elect to issue its common shares in connection with each such presentation for redemption rather than having UELP pay cash. With each such exchange or redemption, UE’s percentage ownership in UELP will increase. In addition, whenever UE issues common shares other than to acquire common units of UELP, UE must contribute any net proceeds it receives to UELP and UELP must issue to UE an equivalent number of common units of UELP. This structure is commonly referred to as an umbrella partnership REIT, or UPREIT.
The Company believes that combining the annual reports on Form 10-K of UE and UELP into this single report provides the following benefits:
• | enhances investors’ understanding of UE and UELP by enabling investors to view the business as a whole in the same manner as management views and operates the business; |
• | eliminates duplicative disclosure and provides a more streamlined and readable presentation because a substantial portion of the disclosure applies to both UE and UELP; and |
• | creates time and cost efficiencies throughout the preparation of one combined report instead of two separate reports. |
The Company believes it is important to understand the few differences between UE and UELP in the context of how UE and UELP operate as a consolidated company. The financial results of UELP are consolidated into the financial statements of UE. UE does not have any other significant assets, liabilities or operations, other than its investment in UELP, nor does it have employees of its own. UELP, not UE, generally executes all significant business relationships other than transactions involving the securities of UE. UELP holds substantially all of the assets of UE. UELP conducts the operations of the business and is structured as a partnership with no publicly traded equity. Except for the net proceeds from equity offerings by UE, which are contributed to the capital of UELP in exchange for common units of partnership in UELP, as applicable, UELP generates all remaining capital required by the Company’s business. These sources may include working capital, net cash provided by operating activities, borrowings under the revolving credit facility, the issuance of secured and unsecured debt and equity securities and proceeds received from the disposition of certain properties.
Shareholders’ equity, partners’ capital and noncontrolling interests are the main areas of difference between the consolidated financial statements of UE and UELP. The limited partners of UELP are accounted for as partners’ capital in UELP’s financial statements and as noncontrolling interests in UE’s financial statements. The noncontrolling interests in UELP’s financial statements include the interests of unaffiliated partners in consolidated entities. The noncontrolling interests in UE’s financial statements include the same noncontrolling interests at UELP’s level and limited partners of UELP. The differences between shareholders’ equity and partners’ capital result from differences in the equity issued at UE and UELP levels.
To help investors better understand the key differences between UE and UELP, certain information for UE and UELP in this report has been separated, as set forth below: Part II, Item 8. Financial Statements which includes specific disclosures for UE and UELP, and Note 15, Equity and Noncontrolling Interests, Note 17, Earnings Per Share and Unit and Note 18 thereto, Quarterly Financial Data.
This report also includes separate Part II, Item 9A. Controls and Procedures sections and separate Exhibits 31 and 32 certifications for each of UE and UELP in order to establish that the requisite certifications have been made and that UE and UELP are compliant with Rule 13a-15 or Rule 15d-15 of the Securities Exchange Act of 1934 and 18 U.S.C. §1350.
URBAN EDGE PROPERTIES AND URBAN EDGE PROPERTIES LP
ANNUAL REPORT ON FORM 10-K
YEAR ENDED DECEMBER 31, 2016
TABLE OF CONTENTS
Business | ||||
Item 1A. | Risk Factors | |||
Item 1B. | Unresolved Staff Comments | |||
Item 2. | Properties | |||
Item 3. | Legal Proceedings | |||
Item 4. | Mine Safety Disclosures | |||
PART II | ||||
Item 5. | Market For Registrant’s Common Equity, Related Stockholder Matters and Issuer Purchases of Equity Securities | |||
Item 6. | Selected Financial Data | |||
Item 7. | Management’s Discussion and Analysis of Financial Condition and Results of Operations | |||
Item 7A. | Quantitative and Qualitative Disclosures About Market Risk | |||
Item 8. | Financial Statements and Supplementary Data | |||
Item 9. | Changes in and Disagreements with Accountants on Accounting and Financial Disclosure | |||
Item 9A. | Controls and Procedures | |||
Item 9B. | Other Information | |||
Item 10. | Directors, Executive Officers and Corporate Governance | |||
Item 11. | Executive Compensation | |||
Item 12. | Security Ownership of Certain Beneficial Owners and Management and Related Stockholder Matters | |||
Item 13. | Certain Relationships and Related Transactions and Director Independence | |||
Item 14. | Principal Accounting Fees and Services | |||
PART IV | ||||
Item 15. | Exhibits and Financial Statement Schedules | |||
Signatures | ||||
PART I
ITEM 1. | BUSINESS |
The Company
Urban Edge Properties (“UE” or the “Company”) (NYSE: UE) is a Maryland real estate investment trust focused on managing, developing, redeveloping, and acquiring retail real estate in urban communities, primarily in the New York metropolitan region. Urban Edge Properties LP (“UELP” or the “Operating Partnership”) is a Delaware limited partnership formed to serve as UE’s majority-owned partnership subsidiary and to own, through affiliates, all of our real estate properties and other assets. UE and UELP were created to own the majority of Vornado Realty Trust’s (“Vornado”) (NYSE: VNO) former shopping center business. As of December 31, 2016, the Company’s portfolio consisted of 79 shopping centers, three malls and a warehouse park adjacent to one of its centers totaling 14.8 million square feet with an occupancy rate of 97.2%.
Prior to the separation, the portfolio is referred to as “UE Businesses.” On January 15, 2015, pursuant to a separation and distribution agreement between UE and Vornado (the “Separation Agreement”), the interests in certain properties held by Vornado’s operating partnership, Vornado Realty L.P. (“VRLP”), were contributed or otherwise transferred to UE in exchange for 100% of our outstanding common shares. Following that contribution, VRLP distributed 100% of our outstanding common shares to Vornado and the other common limited partners of VRLP, pro rata with respect to their ownership of common limited partnership units in VRLP. Vornado then distributed all of the UE common shares it had received from VRLP to Vornado common shareholders on a pro rata basis. As a result, VRLP common limited partners and Vornado common shareholders all received common shares of UE in the spin-off at a ratio of one common share of UE to every two VRLP common units and every two common shares of Vornado.
Substantially concurrently with such distribution, the interests in certain properties held by VRLP, including interests in entities holding properties, were contributed or otherwise transferred to UELP in exchange for approximately 5.4% of UELP’s outstanding common limited partnership interests in the Operating Partnership (“OP Units”).
As part of the separation transaction, Vornado capitalized UE with $225 million of cash and agreed to provide transition services to UE including human resources, information technology, risk management, public reporting and tax services for up to two years pursuant to a transition services agreement between UE and Vornado (the “Transition Services Agreement”). On June 28, 2016, the Company executed an amendment to the Transition Services Agreement, extending Vornado’s provision of information technology, risk management services and the portion of human resources service related to health and benefits through July 31, 2018, unless terminated earlier. The fees charged to us by Vornado for these transition services approximate the actual cost incurred by Vornado in providing such transition services to us. Pursuant to the Transition Services Agreement, UE provides leasing, property management and development services to Vornado for certain of Vornado’s shopping center properties for which we receive management and other fees believed to be at a market rate.
We review operating and financial information for each property on an individual basis and, therefore, each property represents an individual operating segment. We aggregate all of our properties into one reportable segment due to their similarities with regard to the nature and economics of the properties, tenants and operational process.
Unless the context otherwise requires, “we”, “us” and “our” refer to UE after giving effect to the transfer of assets and liabilities from Vornado as well as to UE Businesses prior to the date of completion of the separation.
The Company elected to be taxed as a REIT under sections 856-860 of the Internal Revenue Code of 1986, as amended, commencing with the filing of its 2015 tax return. Under those sections, a REIT which distributes at least 90% of its REIT taxable income as a dividend to its shareholders each year and which meets certain other conditions will not be taxed on that portion of its taxable income which is distributed to its shareholders. Prior to the separation from Vornado, UE Businesses historically operated under Vornado’s REIT structure. As Vornado operates as a REIT and distributes 100% of taxable income, no provision for federal income taxes was made in the accompanying consolidated and combined financial statements for periods prior to the separation. If we fail to qualify as a REIT for any taxable year, we will be subject to federal income taxes at regular corporate rates (including any alternative minimum tax) and may not be able to qualify as a REIT for the four subsequent taxable years. Our two Puerto Rico malls are subject to a 29% non-resident withholding tax which is included in income tax expense in the consolidated and combined statements of income.
1
Company Strategies
Our goal is to be the leading owner of retail real estate in and on the edges of major urban markets, principally in the New York metropolitan region. We believe urban markets offer attractive investment opportunities resulting from a unique interplay of demographic, supply/demand and redevelopment/development trends. To achieve this goal, our primary strategies include:
Maximizing the value of existing properties through proactive management. We intend to maximize the value of each of our assets through a comprehensive, proactive management strategy encompassing: continuous asset evaluation for highest-and-best-use; efficient and cost-conscious day-to-day operations that minimize retailer operating expense and preserve property quality; and thoughtful leasing. Leasing is a critical value-creation function and includes the following:
• | Monitoring retailer sales, merchandising, store operations, timeliness of payments, overall financial condition and related factors; |
• | Being constantly aware of each asset’s competitive positioning and making physical improvements or adjusting merchandising if circumstances warrant; |
• | Continuously canvassing trade areas to identify unique operators that can distinguish a property and enhance its offerings; |
• | Maintaining regular contact with the brokerage community to stay abreast of new merchants, potential relocations, new supply and overall trade area dynamics; |
• | Conducting regular portfolio reviews with key tenants; |
• | Building and nurturing broad and deep relationships with retailer decision-makers; |
• | Focusing on spaces with below-market leases that might be recaptured; |
• | Understanding the potential impact of options, exclusives, co-tenancy and other restrictive lease provisions; and |
• | Optimizing required capital investment in every transaction. |
Actively investing. We intend to redevelop existing properties, to selectively develop new shopping centers and to acquire properties in targeted markets. Each investment must meet our standards for risk-adjusted return and for overall quality compared to our existing portfolio.
Investment considerations include:
• | Geography: Our primary focus is on the New York metropolitan area and the Washington DC to Boston corridor. |
• | Product: We generally target retail properties that serve local communities with necessity and convenience-oriented retailers. We also seek large shopping centers (with a grocer where possible) in our targeted markets where significant density and supply constraints provide attractive market rent dynamics. |
• | Tenancy: We consider tenant mix, sales performance and related occupancy cost, lease term, lease provisions and other factors. Our current tenant base comprises a diverse group of merchants including department stores, grocers, category killers, discounters, entertainment offerings, health clubs, DIY stores, in-line specialty shops, restaurants and other food and beverage vendors and service providers. We believe that this diversification provides stability to our cash flows as no specific retail category constitutes more than 20% of our portfolio’s annual base rental revenue and no one retailer contributed more than 7% of our annual base rental revenue in 2016. |
• | Rent: We consider existing rents relative to market rents. Additionally, we target submarkets that have potential for market rent growth as evidenced by strong retailer performance. |
• | Competition and Barriers-to-Entry: We seek assets in underserved, high barrier-to-entry markets in densely populated, affluent trade areas. We believe that retail properties located in such markets present more attractive risk-return profile relative to other markets. We intend to invest in our existing core markets, and, over time, may expand into new markets that have similar characteristics. |
• | Access and Visibility: We seek assets with convenient access and good visibility. |
• | Physical Condition: We seek assets in good physical condition taking into account aesthetic, functional, structural and environmental considerations. |
2
Constantly evaluating our portfolio and, where appropriate, engaging in selective dispositions. We intend to regularly evaluate the prospects for each property and, where appropriate, to dispose of those properties that do not meet our investment criteria. We intend to reinvest a large part of the proceeds from any dispositions into redevelopment, development and acquisitions, or we may use such proceeds to reduce outstanding debt.
Maintaining capital discipline. We intend to keep our balance sheet flexible and capable of supporting growth. We expect to generate increasing levels of cash from internally generated funds and to have substantial borrowing capacity under our existing line of credit and from potential secured debt financing on our existing assets.
Significant Tenants
None of our tenants accounted for more than 10% of total revenues in any of the years ended December 31, 2016, 2015 and 2014. As of December 31, 2016, The Home Depot was our largest tenant and accounted for approximately $20.2 million, or 6.2% of our total revenue.
Employees
Our headquarters are located at 888 Seventh Avenue, New York, NY 10019. As of December 31, 2016, we had 114 employees and believe that our relationships with our employees are good.
Available Information
Copies of our Annual Report on Form 10‑K, Quarterly Reports on Form 10‑Q, Current Reports on Form 8‑K, and amendments to those reports, as well as Reports on Forms 3, 4 and 5 regarding officers, trustees or 10% beneficial owners of us, filed or furnished pursuant to Section 13(a), 15(d) or 16(a) of the Securities Exchange Act of 1934, are available free of charge through our website (www.uedge.com) as soon as reasonably practicable after they are electronically filed with, or furnished to, the Securities and Exchange Commission. Also available on our website are copies of our Audit Committee Charter, Compensation Committee Charter, Corporate Governance and Nominating Committee Charter, Code of Business Conduct and Ethics and Corporate Governance Guidelines. In the event of any changes to these charters or the code or guidelines, changed copies will also be made available on our website. Copies of these documents are also available directly from us free of charge. Our website also includes other financial information, including certain non-GAAP financial measures, none of which is a part of this Annual Report on Form 10-K. Copies of our filings under the Securities Exchange Act of 1934 are also available free of charge from us, upon request.
ITEM 1A. | RISK FACTORS |
You should carefully consider the following risks and other material in this information statement in evaluating our company and our common shares. Any of the following risks could materially and adversely affect our business, results of operations and financial condition. These risks have been separated into four groups: (1) Risks Related to Our Business and Operations and to Our Status as a REIT, (2) Risks Related to the Separation, (3) Risks Related to Our Common Shares and (4) Our Declaration of Trust and Applicable Law May Hinder Any Attempt to Acquire us.
RISKS RELATED TO OUR BUSINESS AND OPERATIONS AND TO OUR STATUS AS A REIT
Factors that may materially and adversely affect our business, results of operations and financial condition are summarized below. The risks and uncertainties described herein may not be the only ones we face. Additional risks and uncertainties not presently known to us or that we currently believe to be immaterial, may also adversely affect our business. See “Forward-Looking Statements” contained herein.
The Value of and Income from Real Estate Investments Fluctuate Due to Various Factors.
We are subject to risks that affect the general retail environment.
Our properties are in the retail shopping center real estate market. This fact means that we are subject to factors that affect the retail environment generally, including the level of consumer spending and consumer confidence, unemployment rates, the threat of terrorism and increasing competition from discount retailers, outlet malls, retail websites and catalog companies. These factors could materially and adversely affect the financial condition of our retail tenants and the willingness of retailers to lease space in our shopping centers.
3
E-commerce may have an adverse impact on our tenants and our business.
E-commerce continues to gain in popularity and growth in internet sales is likely to continue in the future. E-commerce could result in a downturn in the business of some of our current tenants and could affect the way other current and future tenants lease space. For example, the migration towards e-commerce has led many omnichannel retailers to prune the number and size of their traditional “bricks and mortar” locations to increasingly rely on e-commerce and alternative distribution channels. Many tenants also permit merchandise purchased on their websites to be picked up at, or returned to, their physical store locations, which may have the effect of decreasing the reported amount of their in-store sales and the amount of rent we are able to collect from them (particularly with respect to those tenants who pay rent based on a percentage of their in-store sales). We cannot predict with certainty how growth in e-commerce will impact the demand for space at our properties or how much revenue will be generated at traditional store locations in the future. If we are unable to anticipate and respond promptly to trends in retailer and consumer behavior, our occupancy levels could be materially and adversely affected.
Retail real estate is a competitive business.
We compete with a large number of property owners and developers, some of which may be willing to accept lower returns on their investments. Given the number of store closings announced by a variety of department stores and fast fashion concepts, there is increased pressure on shopping center owners to seek a smaller number of top retailers. Other owners and developers may attempt to take tenants from our shopping centers by offering lower rents or other incentives to compel them to relocate.
We depend on leasing space to tenants on economically favorable terms and on collecting rent from tenants who ultimately may not be able to pay.
Our financial results depend significantly on leasing space in our properties to tenants on economically favorable terms. A majority of our income depends on the ability of our tenants to pay the full amount of rent and other charges due under their leases on a timely basis. Some of our leases provide for the payment, in addition to base rent, of additional rent above the base amount according to a specified percentage of the gross sales generated by the tenants and generally provide for reimbursement of real estate taxes and expenses of operating the property. Economic and/or competitive conditions may impact the success of our tenants’ retail operations and therefore the amount of rent and expense reimbursements we receive from our tenants. While demand for our retail spaces has been strong, there can be no assurance in our ability to maintain our occupancy levels on favorable terms. Any reduction in our tenants’ abilities to pay base rent, percentage rent or other charges on a timely basis will decrease our income, funds available to pay indebtedness and funds available for distribution to shareholders. If a tenant does not pay its rent, we might not be able to enforce our rights as landlord without delays and might incur substantial legal and other costs. During periods of economic adversity, there may be an increase in the number of tenants that cannot pay their rent and an increase in vacancy rates.
We may be unable to renew leases or relet space as leases expire.
When our tenants decide not to renew their leases upon their expiration, we may not be able to relet the space. Even if tenants do renew or we can relet the space, the terms of the renewal or reletting, taking into account among other things, the cost of improvements to the property and leasing commissions, may be less favorable than the terms in the expired leases. In addition, changes in space utilization by our tenants may impact our ability to renew or relet space without the need to incur substantial costs in renovating or redesigning the internal configuration of the relevant property. If we are unable to promptly renew the leases or relet the space at similar rates or if we incur substantial costs in renewing or reletting the space, our cash flow and ability to service debt obligations and pay dividends and distributions to security holders could be adversely affected.
Bankruptcy or insolvency of tenants may decrease our revenues, net income and available cash.
From time to time, some of our tenants have declared bankruptcy and other tenants may declare bankruptcy or become insolvent in the future. In the case of our shopping centers, the bankruptcy or insolvency of a major tenant could cause us to have difficulty leasing the remainder of the affected property (see dependence on anchors and major tenants). Our leases generally do not contain restrictions designed to ensure the ongoing creditworthiness of our tenants. As a result, the bankruptcy or insolvency of a major tenant could result in a lower level of net income and funds available to pay our indebtedness or make distributions to shareholders.
We derive a significant portion of our revenues from four of our properties.
As of December 31, 2016, four of our properties in the aggregate generated in excess of 25% of our Net Operating Income (as such term is described in Part II. Item 7 of this Annual Report on Form 10-K) (The Outlets at Bergen Town Center and Tonnelle Commons in New Jersey and The Outlets at Montehiedra and Las Catalinas Mall in Puerto Rico). The occurrence of events that have a negative impact on one or more of these properties, such as an economic downturn affecting the surrounding area or a natural disaster that damages one or more of the properties, would have a much larger adverse effect on our revenues than a corresponding occurrence affecting less significant properties.
4
Some of our properties depend on anchor or major tenants and decisions made by these tenants, or adverse developments in the businesses of these tenants, could materially and adversely affect our business, results of operations and financial condition.
Some of our properties have anchor or major tenants that generally occupy larger spaces, sometimes pay a significant portion of a property’s total rent and often contribute to the success of other tenants by drawing customers to a property. If an anchor or major tenant closes, such closure could adversely affect the property even if the tenant continues to pay rent due to the loss of the anchor or major tenant’s drawing power. Additionally, closure of an anchor or major tenant could result in lease terminations by, or reductions in rent from, other tenants if the other tenants’ leases have co-tenancy clauses that permit cancellation or rent reduction if an anchor tenant closes. Retailer consolidation, store rationalization, competition from internet sales and general economic conditions may decrease the number of potential tenants available to fill available anchor tenant spaces. As a result, in the event one or more anchor tenants were to leave one or more of our centers, we cannot be sure that we would be able to lease the vacant space on equivalent terms or at all. In addition, we may not be able to recover costs owed us by the closed tenant. In certain cases, some anchor and non-anchor tenants may be able to terminate their leases if they do not achieve defined sales levels.
We may be unable to reposition or redevelop some of our properties.
Our business strategy includes redeveloping a number of our properties. In connection therewith, we are subject to various risks, including:
• | we may not have sufficient capital to proceed with planned repositioning or redevelopment activities; |
• | redevelopment costs for a project may exceed original estimates, possibly making the project infeasible or unprofitable; |
• | we may not be able to obtain zoning or other required governmental permits and authorizations; |
• | we may not be able to obtain anchor store and mortgage lender approvals, if applicable, for repositioning or redevelopment activities; and |
• | we may not be able to finance such projects at favorable rates and terms. |
There can be no assurance that our redevelopment projects will have the desired results of attracting and retaining desirable tenants and increasing customer traffic. If redevelopment projects are unsuccessful, our investments in those projects may not be fully recoverable from future operations or sales.
Many real estate costs are fixed, even if income from our properties decreases.
Our financial results depend primarily on leasing space in our properties to tenants on terms favorable to us. Costs associated with real estate investment, such as real estate taxes, insurance and maintenance costs, generally are not reduced even when a property is not fully occupied, rental rates decrease, or other circumstances cause a reduction in income from the property. As a result, cash flow from the operations of our properties may be reduced if a tenant does not pay its rent or we are unable to rent our properties on favorable terms. Under those circumstances, we might not be able to enforce our rights as landlord without delays and may incur substantial legal costs.
Loss of our key personnel could adversely affect the value of our business, results of operations and financial condition.
We are dependent on the efforts of our key executive personnel. Although we believe qualified replacements could be found for these key executives in the event of a departure, the loss of one or more of their services could materially and adversely affect our business, results of operations and financial condition.
Our business and operations would suffer in the event of system failures.
Despite system redundancy, the implementation of security measures and the existence of a disaster recovery plan for our information technology infrastructure, our systems are vulnerable to damages from any number of sources, including computer viruses, unauthorized access, energy blackouts, natural disasters, terrorism, war and telecommunication failures. Any system failure or accident that causes interruptions in our operations could result in a material and adverse disruption to our business. We may also incur additional costs to remedy damages caused by such disruptions.
The occurrence of cyber incidents or a deficiency in our cybersecurity could cause a disruption to our operations, a compromise or corruption of our confidential information and/or damage to our business relationships.
A cyber incident is considered to be any adverse event that threatens the confidentiality, integrity, or availability of our information resources. More specifically, a cyber incident is an intentional attack or an unintentional event that can include gaining unauthorized access to systems to disrupt operations, corrupt data, or steal confidential information. As our reliance on technology has increased, so have the risks posed to our systems, both internal and those we have outsourced. The primary risks that could directly result
5
from the occurrence of a cyber incident are operational interruption, damage to our relationship with our tenants and private data exposure. In accordance with the Transition Services Agreement, Vornado provides information technology services to the Company. Vornado has implemented processes, procedures and controls to help mitigate these risks and we maintain cyber insurance, but these measures do not eliminate such risks.
We may incur significant costs to comply with environmental laws and environmental contamination may impair our ability to lease and/or sell real estate.
Our operations and properties are subject to various federal, state and local laws and regulations concerning the protection of the environment including air and water quality, hazardous or toxic substances and health and safety. Under some environmental laws, a current or previous owner or operator of real estate may be required to investigate and clean up hazardous or toxic substances released at a property. The owner or operator may also be held liable to a governmental entity or to third parties for property damage or personal injuries and for investigation and clean-up costs incurred by those parties because of the contamination. These laws often impose liability without regard to whether the owner or operator knew of the release of the substances or caused such release. The presence of contamination or the failure to remediate contamination may impair our ability to sell or lease real estate or to borrow using the real estate as collateral. Other laws and regulations govern indoor and outdoor air quality including those that can require the abatement or removal of asbestos-containing materials in the event of damage, demolition, renovation or remodeling and also govern emissions of and exposure to asbestos fibers in the air. The maintenance and removal of lead paint and certain electrical equipment containing polychlorinated biphenyls (PCBs) are also regulated by federal and state laws. We are also subject to risks associated with human exposure to chemical or biological contaminants such as molds, pollens, viruses and bacteria which, above certain levels, can be alleged to be connected to allergic or other health effects and symptoms in susceptible individuals. We could incur fines for environmental compliance and be held liable for the costs of remedial action with respect to the foregoing regulated substances or related claims arising out of environmental contamination or human exposure at or from our properties.
Most of our properties have been subjected to varying degrees of environmental assessment at various times. To date, these environmental assessments have not revealed any environmental condition material and adverse to our business. However, identification of new compliance concerns or undiscovered areas of contamination, changes in the extent or known scope of contamination, human exposure to contamination or changes in cleanup or compliance requirements could result in significant costs to us.
Generally, our tenants must comply with environmental laws and meet remediation requirements. Our leases typically impose obligations on our tenants to indemnify us from any compliance costs we may incur as a result of the environmental conditions on the property caused by the tenant. If a lease does not require compliance or if a tenant fails to or cannot comply, we could be forced to pay these costs. If not addressed, environmental conditions could impair our ability to sell or re-lease the affected properties in the future or result in lower sales prices or rent payments.
Some of our potential losses may not be covered by insurance.
We maintain general liability insurance with limits of $200 million per occurrence for properties in the U.S. and Puerto Rico, and all-risk property and rental value insurance with limits of $500 million for properties in the U.S. and $139 million for properties in Puerto Rico per occurrence, with sub-limits for certain perils such as floods and earthquakes. We also maintain coverage for terrorism acts with limits of $500 million for properties in the U.S. and $139 million for properties in Puerto Rico per occurrence and in the aggregate for terrorism events excluding coverage for nuclear, biological, chemical or radiological (“NBCR”) terrorism events, as defined by Terrorism Risk Insurance Program Reauthorization Act which expires in December 2020. In addition, we maintain coverage for cybersecurity with limits of $5 million in the aggregate providing first and third party coverage including network interruption, event management, cyber extortion and claims for media content, security and privacy liability. Insurance premiums are charged directly to each of the retail properties and warehouses. We will be responsible for deductibles and losses in excess of insurance coverage, which could be material.
We continue to monitor the state of the insurance market and the scope and costs of coverage for acts of terrorism. However, we cannot anticipate what coverage will be available on commercially reasonable terms in the future. The incurrence of uninsured losses or costs could materially and adversely affect our business, results of operations and financial condition.
Certain of our loans and other agreements contain customary covenants requiring the maintenance of insurance coverage. Although we believe that we currently have adequate insurance coverage for purposes of these agreements, we may not be able to obtain an equivalent amount of coverage at reasonable costs in the future. If lenders or other counterparties insist on greater coverage than we are able to obtain, such requirement could materially and adversely affect our ability to finance our properties and expand our portfolio.
6
Future terrorist acts and shooting incidents could harm the demand for, and the value of, our properties
Over the past several years, a number of highly publicized terrorist acts and shootings have occurred at domestic and international retail properties. In the event concerns regarding safety were to alter shopping habits or deter customers from visiting shopping centers, our tenants would be adversely affected as would the general demand for retail space. Additionally, if such incidents were to continue, insurance for such acts may become limited or subject to substantial cost increases. Such an incident at one of our properties, particularly one in which we generate a significant amount of revenue, could materially and adversely affect our business, results of operations and financial condition.
Our assets may be subject to impairment charges.
Our long-lived assets, including real estate held for investment, are carried at net book value unless circumstances indicate that the carrying value of the assets may not be recoverable. Our properties are reviewed for impairment if events or changes in circumstances indicate that the carrying amount of the property may not be recoverable. When assets are identified as held for sale, we estimate the sales prices net of selling costs of such assets. If, in our opinion, the net sales prices of the assets which have been identified for sale are expected to be less than the net book value of the assets, an impairment charge is recorded and we write down the asset to fair value. An impairment charge may also be recorded for any asset if it is probable, in our estimation, that the aggregate future cash flows (undiscounted and without interest charges) to be generated by the property are less than the carrying value of the property. Recording an impairment charge results in an immediate reduction in our income in the period in which the charge is taken, which could materially and adversely affect our business, results of operations and financial condition.
Compliance or failure to comply with the Americans with Disabilities Act, safety regulations or other requirements could result in substantial costs.
The Americans with Disabilities Act (“ADA”) generally requires that public buildings including our properties meet certain federal requirements related to access and use by disabled persons. Noncompliance could result in the imposition of fines by the federal government or the award of damages to private litigants and/or legal fees to their counsel. We could be required under the ADA to make substantial alterations to, and capital expenditures at, one or more of our properties, including the removal of access barriers, it could materially and adversely affect our business, results of operations and financial condition.
Our properties are subject to various federal, state and local regulatory requirements such as state and local fire and life safety regulations. If we fail to comply with these requirements, we could incur fines or private damage awards. We do not know whether existing requirements will change or whether compliance with future requirements will require significant unanticipated expenditures.
There may be changes in accounting standards.
New accounting standards or pronouncements that may become applicable to us from time to time, or changes in the interpretation of existing standards and pronouncements, could have a material and adverse effect on our reported results for the affected periods.
We face possible adverse changes in tax laws, which may result in an increase in our tax liability and adverse consequences to our shareholders.
Changes in U.S. federal, state and local tax laws or regulations, with or without retroactive application, could have a negative effect on us. New legislation, Treasury regulations, administrative interpretations or court decisions could significantly and negatively affect our ability to qualify to be taxed as a REIT and/or the U.S. federal income tax consequences to our investors and to our company of such qualification. In addition, recent election results and the shortfall in tax revenues for states and municipalities in recent years may lead to an increase in the frequency and size of such tax law changes. Even changes that do not impose greater taxes on us could potentially result in adverse consequences to our shareholders. For example, a decrease in corporate tax rates could decrease the attractiveness of the REIT structure relative to companies that are not organized as REITs.
In any event, the rules of Section 355 of the Code and the Treasury Regulations promulgated thereunder, which apply to determine the taxability of the separation and the combination, have been the subject of change and may continue to be the subject of change, possibly with retroactive application, which could have a negative effect on us and our shareholders. If such changes occur, we may be required to pay additional taxes on our assets or income. These increased tax costs could materially and adversely affect our business, results of operations and financial condition, and the amount of cash available for payment of dividends.
7
Our Investments Are Concentrated in the Northeast and Puerto Rico.
A significant number of our properties are located in the Northeast and are affected by the economic cycles there.
Real estate markets are subject to economic downturns and we cannot predict the economic conditions in the Northeast in either the short-term or long-term. Factors negatively affecting economic conditions in the Northeast include: industry slowdowns or recession, unemployment levels, downsizing, relocations of businesses, changing demographics, increases in telecommuting and use of alternative offices, infrastructure quality, increases in real estate and other taxes, the cost of complying with governmental regulations increases in regulation, changes in local laws, and reduced demand for real estate.
We own and operate two malls in Puerto Rico that are affected by the struggling local economy and that may be adversely affected by pending changes in tax laws.
Our two malls in Puerto Rico make up approximately 11% of our Net Operating Income (as such term is described in “Management’s Discussion and Analysis of Financial Condition and Results of Operations” included as Part II, Item 7 of this Annual Report on 10-K). Since 2007, Puerto Rico has experienced a struggling economy, with total employment and the size of the labor force decreasing causing the unemployment rate to rise. The government and its agencies are struggling to service and to restructure their debt and a series of new consumer and business taxes have been implemented and proposed. A continued economic downturn and increases in taxes in Puerto Rico may result in continued or increased migration of residents from Puerto Rico to the mainland United States and elsewhere, which could decrease the territory’s tax base, exacerbating the territorial government’s cash flow issues, and decrease the number of consumers in Puerto Rico. The combination of these circumstances could result in less disposable income for the purchase of goods sold in our centers, declining merchant sales and merchant inability to pay rent and other charges, and could negatively impact our ability to lease space on terms and conditions we seek.
Natural disasters could have a concentrated impact on us.
We own properties near the Atlantic Coast and in Puerto Rico which are subject to natural disasters such as hurricanes, floods and storm surge. We also have four properties in California that could be impacted by earthquakes. As a result, we could become subject to significant losses and repair costs and to business interruption, all of which may or may not be fully covered by insurance.
We May Develop, Redevelop, Acquire or Sell Assets. Our Inability to Consummate or Manage These Activities Could Materially and Adversely Affect Us.
We may develop, redevelop or acquire properties and these activities may create risks.
We may develop, redevelop or acquire properties when we believe that a development, redevelopment or acquisition project is consistent with our business strategy. We may not, however, succeed in consummating desired acquisitions or in completing developments and redevelopments on time or within budget. In addition, we may face competition in pursuing development, redevelopment and acquisition opportunities. When we do pursue a project or acquisition, we may not succeed in leasing developed, redeveloped or acquired properties at rents sufficient to cover the costs of development, redevelopment, acquisitions and operations. Difficulties in integrating acquisitions may prove costly or time-consuming and could divert management’s attention. If we choose to pursue acquisitions in new markets or acquire assets that contain non-retail uses where we do not have the same level of market knowledge, it may result in weaker than anticipated performance. We may abandon development, redevelopment and acquisition opportunities that we have begun pursuing and consequently fail to recover expenses already incurred.
It may be difficult to buy and sell real estate quickly, which may limit our flexibility.
Real estate investments are relatively difficult to buy and sell quickly. Consequently, we may have limited ability to promptly change our portfolio in response to changes in economic or other conditions. Moreover, our ability to buy, sell, or finance real estate assets may be materially and adversely affected during periods of uncertainty or unfavorable conditions in the credit markets as we or potential buyers of our assets may experience difficulty in obtaining financing, which may limit our flexibility.
Our capital recycling strategy entails various risks.
We intend to selectively explore opportunities to sell non-core properties and reinvest the sale proceeds in other parts of our business, including in the acquisition of higher quality properties in our target markets and the development and redevelopment of our properties, or to use the proceeds to pay down debt. While we hope to minimize the dilutive effect of these sales through acquisitions, earnings from acquired properties may be less than the earnings from the disposed assets. Also, in the event we are unable to sell these assets for amounts equal to or in excess of their current carrying values, we would be required to recognize impairment charges. Any such impairment charges or earnings dilution could materially and adversely affect our business, financial condition and results of operations. The sale of our assets may generate gains for tax purposes if not adequately deferred through a Section 1031 exchange, creating the obligation to make additional distributions to our shareholders.
8
We face significant competition for acquisitions of real properties, which may reduce the number of acquisition opportunities available to us and increase the costs of these acquisitions.
The current market for acquisitions is extremely competitive. This competition may increase the demand for the types of properties in which we typically invest and, therefore, increase the prices paid for such acquisition properties. We also face significant competition for attractive acquisition opportunities from an indeterminate number of investors, including publicly-traded and privately-held REITs, private equity investors and institutional investment funds, some of which have greater financial resources, greater ability to borrow funds and the willingness to accept more risk than we can prudently manage, including risks with respect to the geographic proximity of investments and the payment of higher acquisition prices. This competition will increase if investments in real estate become more attractive relative to other forms of investment. Competition for investments may reduce the number of suitable investment opportunities available to us and may have the effect of increasing prices paid for such acquisition properties and, as a result, adversely affecting our ability to grow through acquisitions.
Our Organizational and Financial Structure Gives Rise to Operational and Financial Risks.
Economic conditions and capital markets can materially and adversely affect our liquidity, financial condition, results of operations and the value of our debt and equity securities.
There are many factors that can affect the value of our equity securities and any debt securities we may issue in the future, including the state of the capital markets and the economy. Government action or inaction may adversely affect the state of the capital markets. The cost and availability of credit may be adversely affected by illiquid credit markets and wider credit spreads may materially and adversely affect our liquidity and the liquidity and financial condition of our tenants. Our inability or the inability of our tenants to timely refinance maturing liabilities and access the capital markets to meet liquidity needs could materially and adversely affect our business, financial condition and results of operations and the value of our equity securities and any debt securities we may issue in the future.
Covenants in our existing financing agreements may restrict our operating, financing, redevelopment, development, acquisition and other activities.
The mortgages on our properties contain customary covenants such as those that limit our ability, without the prior consent of the lender, to further mortgage the applicable property or to reduce insurance coverage. Our existing revolving credit facility contains, and any debt that we may obtain in the future may contain, customary restrictions, requirements and other limitations on our ability to incur indebtedness, including covenants (i) that limit our ability to incur debt based upon (1) our ratio of total debt to total assets, (2) our ratio of secured debt to total assets, (3) our ratio of earnings before interest, tax, depreciation and amortization (EBITDA) to interest expense and (4) our ratio of EBITDA to fixed charges, and (ii) that require us to maintain a certain level of unencumbered assets to unsecured debt. Our ability to borrow is subject to compliance with these and other covenants. Failure to comply with our covenants could cause a default under the applicable debt instrument and we may then be required to repay such debt with capital from other sources or to give possession of a secured property to the lender. Under those circumstances, other sources of capital may not be available to us, or may be available only on unattractive terms.
We have outstanding debt. The amount of debt and its cost may increase and refinancing may not be available on acceptable terms.
If we are unable to obtain debt financing or refinance existing indebtedness upon maturity, our financial condition and results of operations would likely be adversely affected. In addition, the cost of our existing debt may increase, especially in the case of a rising interest rate environment, and we may not be able to refinance our existing debt in sufficient amounts or on acceptable terms. If the cost or amount of our indebtedness increases or we cannot refinance our debt in sufficient amounts or on acceptable terms, we are at risk of default on our obligations.
Rising interest rates could adversely affect our cash flows.
Of our $2.0 billion of debt outstanding as of December 31, 2016, $38.8 million bears interest at variable rates. We have a $500 million revolving credit facility, on which no balance is outstanding at December 31, 2016, that bears interest at LIBOR plus 1.15%. We may borrow additional funds at variable interest rates in the future. Increases in interest rates would increase the interest expense on our variable rate debt and reduce our cash flow, which could adversely affect our ability to service our debt and met our other obligations and also could reduce the amount we are able to distribute to our shareholders.
We may not be able to obtain capital to make investments.
We depend primarily on external financing to fund the growth of our business because one of the requirements of the Internal Revenue Code (the “Code”) for a REIT is that it distributes at least 90% of its taxable income, excluding net capital gains, to its shareholders. There is a separate requirement to distribute net capital gains or pay a corporate level tax in lieu thereof. Our access
9
to debt or equity financing depends on the willingness of third parties to lend to or to make equity investments and on conditions in the capital markets generally. Although we believe that we will be able to finance any investments we may wish to make in the foreseeable future, there can be no assurance that new financing or other capital will be available or available on acceptable terms. The failure to obtain financing or other capital could materially and adversely affect our business, results of operations and financial condition. For information about our available sources of funds, see “Management’s Discussion and Analysis of Financial Condition and Results of Operations — Liquidity and Capital Resources” and the notes to the audited consolidated and combined financial statements included in Part II, Item 8. in this Annual Report on Form 10-K.
We may fail to qualify or remain qualified as a REIT and may be required to pay income taxes at corporate rates.
Although we believe that we will remain organized and will continue to operate so as to qualify as a REIT for federal income tax purposes, we may fail to remain so qualified. Qualifications are governed by highly technical and complex provisions of the Code for which there are only limited judicial or administrative interpretations and that depend on various facts and circumstances that are not entirely within our control. In addition, legislation, new regulations, administrative interpretations or court decisions may significantly change the relevant tax laws and/or the federal income tax consequences of qualifying as a REIT. If, with respect to any taxable year, we fail to maintain our qualification as a REIT and do not qualify under statutory relief provisions, we could not deduct distributions to shareholders in computing our taxable income and would have to pay federal income tax on our taxable income at regular corporate rates. The federal income tax payable would include any applicable alternative minimum tax. If we had to pay federal income tax, the amount of money available to distribute to shareholders and pay our indebtedness would be reduced for the year or years involved, and we would no longer be required to make distributions to shareholders. In addition, we would also be disqualified as a REIT for the four taxable years following the year during which qualification was lost unless we were entitled to relief under the relevant statutory provisions.
We are also required to pay certain corporate-level taxes on our assets located in Puerto Rico and such taxes may increase if recently proposed taxes are implemented.
REIT distribution requirements could adversely affect our liquidity and our ability to execute our business plan.
To qualify to be taxed as a REIT, and assuming that certain other requirements are also satisfied, we generally must distribute at least 90% of our REIT taxable income, determined without regard to the dividends paid deduction and excluding any net capital gains, to our shareholders each year so that U.S. federal corporate income tax does not apply to earnings that we distribute. To the extent that we satisfy this distribution requirement and qualify for taxation as a REIT, but distribute less than 100% of our REIT taxable income, determined without regard to the dividends paid deduction and including any net capital gains, we will be subject to U.S. federal corporate income tax on our undistributed net taxable income. In addition, we will be subject to a 4% nondeductible excise tax if the actual amount that we distribute to our shareholders in a calendar year is less than a minimum amount specified under U.S. federal income tax laws. We intend to distribute 100% of our REIT taxable income to our shareholders.
From time to time, we may generate taxable income greater than our cash flow as a result of differences in timing between the recognition of taxable income and the actual receipt of cash or the effect of nondeductible capital expenditures, the creation of reserves, or required debt or amortization payments. If we do not have other funds available in these situations, we could be required to borrow funds on unfavorable terms, sell assets at disadvantageous prices, distribute amounts that would otherwise be invested in future acquisitions, capital expenditures or repayment of debt, or make taxable distributions of our shares or debt securities to make distributions sufficient to enable us to pay out enough of our taxable income to satisfy the REIT distribution requirement and avoid corporate income tax and the 4% excise tax in a particular year. These alternatives could increase our costs or reduce our equity. Further, amounts distributed will not be available to fund investment activities. Thus, compliance with the REIT requirements may hinder our ability to grow, which could adversely affect the value of our shares. Any restrictions on our ability to incur additional indebtedness or make certain distributions could preclude us from meeting the 90% distribution requirement. Decreases in funds from operations due to unfinanced expenditures for acquisitions of properties or increases in the number of shares outstanding without commensurate increases in funds from operations would adversely affect our ability to maintain distributions to our shareholders. Consequently, there can be no assurance that we will be able to make distributions at the anticipated distribution rate or any other rate.
If a transaction intended to qualify as a Section 1031 Exchange is later determined to be taxable, we may face adverse consequences, and if the laws applicable to such transactions are amended or repealed, we may not be able to dispose of properties on a tax deferred basis.
From time to time we may dispose of properties in transactions that are intended to qualify as “like kind exchanges” under Section 1031 of the Code (“Section 1031 Exchanges”). It is possible that the qualification of a transaction as a Section 1031 Exchange could be successfully challenged and determined to be currently taxable. In such case, our taxable income and earnings and profits would increase. In some circumstances, we may be required to pay additional dividends or, in lieu of that, corporate income tax,
10
possibly including interest and penalties. As a result, we may be required to borrow funds in order to pay additional dividends or taxes, and the payment of such taxes could cause us to have less cash available to distribute to our shareholders. In addition, if a Section 1031 Exchange were later to be determined to be taxable, we may be required to amend our tax returns for the applicable year in question, including any information reports we sent our shareholders. Moreover, it is possible that legislation could be enacted that could modify or repeal the laws with respect to Section 1031 Exchanges, which could make it more difficult or not possible for us to dispose of properties on a tax deferred basis.
RISKS RELATED TO THE SEPARATION
Our historical combined financial information for periods prior to our spin-off on January 15, 2015 are not necessarily representative of the results that we would have achieved as a separate, publicly-traded company and may not be a reliable indicator of our future results.
The combined financial statements for periods prior to our spin-off on January 15, 2015 refer to our business as operated by and integrated with Vornado. That historical financial information was derived from the consolidated financial statements and accounting records of Vornado. Accordingly, the historical combined financial information does not necessarily reflect the financial condition, results of operations or cash flows that we would have achieved as a separate, publicly-traded company during those historic periods or those that we achieve in the future. Factors which could cause our results to differ from those reflected in such historical financial information and which may materially and adversely impact our ability to achieve similar results in the future may include, but are not limited to, the following:
• | Prior to the separation, our business was operated by Vornado as part of its broader corporate organization rather than as an independent company. During the two year period following the separation, Vornado provided various corporate functions for us, such as human resources, information technology, risk management, public reporting and tax services, and, currently, continues to provide information technology, risk management and certain human resources services. Prior to 2015, our historical financial results reflect allocations of corporate expenses from Vornado for such functions and are less than the expenses we have incurred as a separate, publicly-traded company. We have and will need to continue to make significant investments to replicate or outsource from other providers certain, systems, infrastructure and personnel to which we no longer have access after expiration of the Transition Services Agreement, currently July 2018. Developing our ability to operate without access to certain elements of Vornado’s current operational and administrative infrastructure has and will continue to be costly and may present difficulties. We may not be able to operate our business efficiently or at comparable costs and our profitability may decline; |
• | Prior to the separation, our business was integrated with the other businesses of Vornado and we were able to take advantage of Vornado’s purchasing power in areas such as information technology, marketing, insurance, treasury services, property support and the procurement of goods. Although we have entered into certain transition and other separation-related agreements with Vornado, these arrangements may not fully capture the benefits we previously enjoyed as a result of being integrated with Vornado and may result in us paying higher charges than in the past for these services. In addition, services provided to us under the Transition Services Agreement will only be provided through July 2018 and this time may not be sufficient to meet our needs. As an independent company, we may be unable to obtain goods and services at the prices and terms obtained prior to the separation, which could decrease our overall profitability; |
• | Generally, prior to 2015, our working capital requirements and capital for our general corporate purposes, including acquisitions and capital expenditures, have historically been satisfied as part of the corporation-wide cash management policies of Vornado. We may now need to obtain additional financing from banks, through public offerings or private placements of debt or equity securities, from strategic relationships or through other arrangements, all of which may not be on terms as favorable to those obtained by Vornado. As a result, the cost of capital for our business may be higher than Vornado’s cost of capital prior to the separation; and |
• | As a public company, we are subject to the reporting requirements of the Exchange Act, the Sarbanes-Oxley Act and the Dodd-Frank Act and will be required to prepare our financial statements according to the rules and regulations required by the SEC. Complying with these requirements result in significant costs to us and require us to divert substantial resources, including management time, from other activities. |
Other significant changes may occur in our cost structure, management, financing and business operations as a result of operating as an independent company. For additional information about the past financial performance of our business and the basis of presentation of the historical combined financial statements, please refer to “Selected Financial Data,” “Management’s Discussion and Analysis of Financial Condition and Results of Operations” and the audited consolidated and combined financial statements and accompanying notes in Part II in this Annual Report on Form 10-K.
11
If the distribution by each of Vornado and VRLP together with certain related transactions does not qualify as a transaction that is generally tax-free for U.S. federal income tax purposes, Vornado and Vornado shareholders could be subject to significant tax liabilities. In addition, under its Tax Matters Agreement with Vornado, UE is subject to certain restrictions and could be required to indemnify Vornado for certain material tax obligations that could arise.
Vornado received a private letter ruling from the IRS to the effect that the distribution of UE common shares by each of Vornado and VRLP, together with certain related transactions, will, with respect to UE, VRLP, Vornado and the shareholders of Vornado, qualify as transactions that are generally tax-free for U.S. federal income tax purposes under Sections 351 and 355 of the Code. Vornado obtained an opinion from of Roberts & Holland LLP, special tax counsel to Vornado, satisfactory to the Vornado Board of Trustees, to the effect that the distribution of UE common shares by each of Vornado and VRLP, together with certain related transactions, with respect to UE, VRLP, Vornado and the shareholders of Vornado, qualifies as transactions that are generally tax-free for U.S. federal income tax purposes under Sections 351, 355, and 731 of the Code, including with respect to certain matters relating to these transactions that are not covered by the private letter ruling from the IRS. The private letter ruling is, and the opinion of Roberts & Holland LLP is based on, among other things, certain facts and assumptions, as well as certain representations, statements and undertakings of Vornado and UE (including those relating to the past and future conduct of Vornado and UE). If any of these representations, statements or undertakings are, or become, inaccurate or incomplete, or if Vornado or UE breach any of their respective covenants in the separation documents, the private letter ruling from the IRS and the opinion of Roberts & Holland LLP may be invalid and the conclusions reached therein could be jeopardized. In such case, the IRS could assert that the distribution of UE common shares by each of Vornado and VRLP, together with certain related transactions, should be treated as a taxable transaction. The opinion of Roberts & Holland LLP is not binding on the IRS or any courts.
If the distribution, together with certain related transactions, fails to qualify for tax-free treatment, in general, Vornado would recognize taxable gain as if it had sold the UE common shares in a taxable sale for its fair market value and Vornado shareholders who received UE common shares in the distribution could be subject to tax as if they had received a taxable distribution equal to the fair market value of such shares.
The Tax Matters Agreement between UE and Vornado governs Vornado’s and UE’s respective rights, responsibilities and obligations with respect to taxes and liabilities, including taxes arising in the ordinary course of business, taxes, if any, incurred as a result of any failure of the spin and certain related transactions to qualify as tax-free for U.S. federal income tax purposes, tax attributes, tax returns, tax elections, tax contests and certain other tax matters. The agreement imposes certain restrictions on UE and its subsidiaries, including restrictions on share issuances, business combinations, sales of assets and similar transactions designed to preserve the tax-free status of the distribution and certain related transactions. In addition, UE may be required to indemnify Vornado against any additional taxes resulting from any violation of a covenant or any inaccuracy or falsity of a representation made by UE related to these matters, or from the taking of these restricted actions by UE.
Potential indemnification obligations to Vornado pursuant to the Separation Agreement could materially and adversely affect our financial condition.
The Separation Agreement with Vornado contains provisions governing certain aspects of our relationship with Vornado. Among other things, the Separation Agreement provides for indemnification obligations designed to make us financially responsible for substantially all liabilities that may exist relating to our business activities, whether incurred prior to or after the separation and distribution, as well as those obligations of Vornado that we assumed pursuant to the Separation Agreement. These indemnity obligations could be substantial.
Certain of our Trustees and Executive Officers may have actual or potential conflicts of interest because of their previous or continuing equity interest in, or positions at, Vornado.
Some of our Trustees and Executive Officers are persons who are or have been employees of Vornado. Because of their current or former positions with Vornado, certain of the Trustees and Executive Officers may own Vornado common shares or other equity awards. Even though our Board of Trustees consists of a majority of Trustees who are independent, some of our Executive Officers and some of our Trustees continue to have a financial interest in Vornado common shares. In addition, one of our Trustees is the Chairman of the Board of Trustees and CEO of Vornado. Continued ownership of Vornado common shares, or service as a Trustee at both companies, could create, or appear to create, potential conflicts of interest.
We may not achieve some or all of the expected benefits of the separation and the separation may materially and adversely affect our business, financial condition and results of operations.
We may not be able to achieve the full strategic and financial benefits expected to result from the separation, or such benefits may be delayed due to a variety of circumstances, not all of which may be under our control. We may not achieve these benefits for a variety of reasons, including, among others that we may be more susceptible to market fluctuations and other adverse events than if we were still a part of Vornado and our business is less diversified than Vornado’s business prior to the separation.
12
Our agreements with Vornado in connection with the separation and distribution involve potential conflicts of interest and may not reflect terms that would have resulted from negotiations between unaffiliated third parties.
Because the separation and distribution involved the division of certain of Vornado’s existing businesses into two independent companies, we have entered into certain agreements with Vornado including a Separation Agreement, a Transition Services Agreement, a Tax Matters Agreement and an Employee Matters Agreement. The terms of these agreements were determined while we were still a wholly-owned subsidiary of Vornado. They were determined by persons who were, at the time, employees, officers or trustees of Vornado or its subsidiaries and, accordingly, had a conflict of interest. For example, during the period in which the terms of those agreements were prepared, we did not have a board of trustees that was independent of Vornado. As a result, the terms of those agreements may not reflect terms that would have resulted from arm’s-length negotiations between unaffiliated third parties. Arm’s-length negotiations between Vornado and an unaffiliated third party in another form of transaction, such as a buyer in a sale of a business transaction, may have resulted in more favorable terms to the unaffiliated third party. See “Certain Relationships and Related Person Transactions.”
In connection with our separation from Vornado, Vornado will indemnify us for certain pre-distribution liabilities and liabilities related to Vornado assets. However, there can be no assurance that these indemnities will be sufficient to protect us against the full amount of such liabilities, or that Vornado’s ability to satisfy its indemnification obligation will not be impaired in the future.
Pursuant to the Separation Agreement, Vornado has agreed to indemnify us for certain liabilities. However, third parties could seek to hold us responsible for any of the liabilities that Vornado agreed to retain and to indemnify us from and there can be no assurance that Vornado will be able to fully satisfy its indemnification obligations. Moreover, even if we ultimately succeed in recovering from Vornado any amounts for which we are held liable, such indemnification may be insufficient to fully offset the financial impact of such liabilities and we may be temporarily required to bear these losses while seeking recovery from Vornado.
RISKS RELATED TO OUR COMMON SHARES
We cannot guarantee the timing, amount, or payment of dividends on our common shares.
Although we expect to pay regular cash dividends, the timing, declaration, amount and payment of dividends to shareholders falls within the discretion of our Board of Trustees. Our Board of Trustees’ decisions regarding the payment of dividends depends on factors such as our financial condition, earnings, capital requirements, debt service obligations, limitations under our financing arrangements, industry practice, legal requirements, regulatory constraints, and other considerations that it deems relevant. Our ability to pay dividends depends on our ongoing ability to generate cash from operations and access to the capital markets. We cannot guarantee that we will pay dividends in the future.
Your percentage of ownership in our company may be diluted in the future.
In the future, your ownership in us may be diluted because of equity issuances for acquisitions, capital market transactions or otherwise. For example, in August 2016, we entered into distribution agreements with various financial institutions as part of our implementation of a continuous equity offering program (the "ATM Program") under which we may sell up to $250 million in common shares, par value of $0.01 per share, from time to time in “at-the-market” offerings or certain other transactions. In addition, we have and anticipate that we will continue to grant compensatory equity awards to our trustees, officers, employees, advisers and consultants who will provide services to us. The issuance of additional common shares, including sales under the ATM Program and awards to our executives, would dilute the interests of our current shareholders, and could depress the market price of our common shares, impair our ability to raise capital through the sale of additional equity securities, or impact our ability to pay dividends. We cannot predict the effect that future sales of our common shares or other equity-related securities including the issuance of OP units would have on the market price of our common shares.
In addition, our declaration of trust authorizes us to issue, without the approval of our shareholders, one or more classes or series of preferred shares having such designation, voting powers, preferences, rights and other terms, including preferences over our common shares respecting dividends and distributions, as our Board of Trustees generally may determine. The terms of one or more classes or series of preferred shares could dilute the voting power or reduce the value of our common shares. For example, we could grant the holders of preferred shares the right to elect some number of our trustees in all events or on the occurrence of specified events, or the right to veto specified transactions. Similarly, the repurchase or redemption rights or liquidation preferences we could assign to holders of preferred shares could affect the residual value of the common shares.
13
OUR DECLARATION OF TRUST AND APPLICABLE LAW MAY HINDER ANY ATTEMPT TO ACQUIRE US
Our Declaration of Trust sets limits on the ownership of our shares.
Generally, for us to maintain a qualification as a REIT under the Code, not more than fifty percent (50%) in value of the outstanding shares of beneficial interest of the Company may be owned, directly or indirectly, by five or fewer individuals at any time during the last half of the Company’s taxable year. The Code defines “individuals” for purposes of the requirement described in the preceding sentence to include some types of entities. Under the Company’s Declaration of Trust, no person or entity may own more than 9.8% of the outstanding common shares, or 9.8% of the outstanding preferred shares of any class or series, with some exceptions for persons or entities approved by the Company’s Board of Trustees. These restrictions on transferability and ownership may delay, deter or prevent a change in control of the Company or other transaction that might involve a premium price or otherwise be in the best interest of the shareholders.
Maryland law contains provisions that may reduce the likelihood of certain takeover transactions.
Maryland imposes conditions and restrictions on certain “business combinations” (including, among other transactions, a merger, consolidation, share exchange, or, in certain circumstances, an asset transfer or issuance of equity securities) between a Maryland real estate investment trust and certain persons who beneficially own at least 10% of the trust’s shares (an “interested shareholder”). Unless approved in advance by the Board of Trustees of the trust, or otherwise exempted by the statute, such a business combination is prohibited for a period of five years after the most recent date on which the interested shareholder became an interested shareholder. After such five-year period, a business combination with an interested shareholder must be: (a) recommended by the Board of Trustees of the trust, and (b) approved by the affirmative vote of at least (i) 80% of the corporation’s outstanding shares entitled to vote and (ii) two-thirds of the corporation’s outstanding shares entitled to vote which are not held by the interested shareholder with whom the business combination is to be effected, unless, among other things, the corporation’s common shareholders receive a “fair price” (as defined by the statute) for their shares and the consideration is received in cash or in the same form as previously paid by the interested shareholder for his or her shares.
In approving a transaction, the Board of Trustees may provide that their approval is subject to compliance, at or after the time of approval, with any terms and conditions determined by the board. The business combination provisions of Maryland law may have the effect of delaying, deferring or preventing a change in control of UE or other transaction that might involve a premium price or otherwise be in the best interest of our shareholders. The business combination statute may discourage others from attempting to acquire control of UE and increase the difficulty of consummating any offer.
Until the 2018 annual meeting of shareholders, UE will have a classified Board of Trustees and that may reduce the likelihood of certain takeover transactions.
Our Board of Trustees is currently divided into three classes of trustees. The initial terms of the second and third classes will expire at the second and third annual meetings of shareholders held following the separation, respectively. Shareholders elect only one class of trustees each year. Shareholders elected successors to trustees of the first class for a two-year term and will elect successors to trustees of the second class for a one-year term, in each case upon the expiration of the terms of the initial trustees of each class. Commencing with the 2017 annual meeting of shareholders, and each annual meeting of shareholders held thereafter, the successors to the Trustees whose terms expire at each annual meeting shall be elected to hold office for a term expiring at the next annual meeting of shareholders and until their successors are duly elected and qualify. There is no cumulative voting in the election of trustees. Until the 2018 annual meeting of the shareholders, the classified board may reduce the possibility of a tender offer or an attempt to change control of UE, even though a tender offer or change in control might be in the best interest of UE’s shareholders and UE.
We may issue additional shares in a manner that could adversely affect the likelihood of certain takeover transactions.
The Company’s Declaration of Trust and bylaws authorize the Board of Trustees in its sole discretion and without shareholder approval, to:
• | cause UE to issue additional authorized, but unissued, common or preferred shares; |
• | classify or reclassify, in one or more classes or series, any unissued common or preferred shares; |
• | set the preferences, rights and other terms of any classified or reclassified shares that the Company issues; and |
• | increase the number of shares of beneficial interest that the Company may issue. |
The Board of Trustees can establish a class or series of common or preferred shares whose terms could delay, deter or prevent a change in control of the Company or other transaction that might involve a premium price or otherwise be in the best interest of the Company’s shareholders, although the Board of Trustees does not now intend to establish a class or series of common or
14
preferred shares of this kind. The Company’s declaration of trust and bylaws contain other provisions that may delay, deter or prevent a change in control of the Company or other transaction that might involve a premium price or otherwise be in the best interest of our shareholders and the Company.
We may change our policies without obtaining the approval of our shareholders.
Our operating and financial policies, including our policies with respect to acquisitions of real estate or other companies, growth, operations, indebtedness, capitalization and dividends, are exclusively determined by our Board of Trustees. Accordingly, our shareholders do not control these policies.
ITEM 1B. | UNRESOLVED STAFF COMMENTS |
There are no unresolved comments from the staff of the Securities and Exchange Commission as of the date of this Annual Report on Form 10-K.
ITEM 2. PROPERTIES
As of December 31, 2016, our portfolio is comprised of 79 shopping centers, three malls and a warehouse park totaling approximately 14.8 million square feet. We own 59 properties 100% in fee simple, except for Walnut Creek (Mt. Diablo) where we own a 95% interest. We lease 19 properties under ground and/or building leases as indicated in the table below. Where a property is subject to a ground and/or building lease to a third party, we have included the year of contractual maturity of the lease next to the name of the property. As of December 31, 2016, we had $1.2 billion of outstanding mortgage indebtedness which is secured by our properties. The following pages provide details of our properties as of December 31, 2016.
Property | Total Square Feet (1) | Percent Leased (1) | Weighted Average Annual Rent per sq ft (2) | Major Tenants | ||||
SHOPPING CENTERS AND MALLS: | ||||||||
California: | ||||||||
Signal Hill | 45,000 | 100.0% | $26.49 | Best Buy | ||||
Vallejo (leased through 2043)(6) | 45,000 | 100.0% | 19.26 | Best Buy | ||||
Walnut Creek (1149 South Main Street)(5) | 31,000 | 100.0% | 70.00 | Anthropologie | ||||
Walnut Creek (Mt. Diablo) (3) | 7,000 | 100.0% | 115.00 | Z Gallerie | ||||
Connecticut: | ||||||||
Newington | 189,000 | 100.0% | 9.72 | Walmart, Staples | ||||
Maryland: | ||||||||
Baltimore (Towson) | 155,000 | 100.0% | 22.97 | hhgregg, Staples, HomeGoods, Golf Galaxy, Tuesday Morning, Ulta, Kirkland's, Five Below (4 leases not commenced) | ||||
Glen Burnie | 121,000 | 90.4% | 9.54 | Gavigan’s Home Furnishings, Pep Boys | ||||
Rockville | 94,000 | 98.1% | 24.53 | Regal Cinemas | ||||
Wheaton (leased through 2060)(6) | 66,000 | 100.0% | 16.36 | Best Buy | ||||
Massachusetts: | ||||||||
Cambridge (leased through 2033)(6) | 48,000 | 100.0% | 21.83 | PetSmart, Modell’s Sporting Goods | ||||
Chicopee | 224,000 | 100.0% | 5.50 | Walmart | ||||
Milford (leased through 2019)(6) | 83,000 | 100.0% | 9.01 | Kohl’s | ||||
Springfield | 182,000 | 100.0% | 5.67 | Walmart | ||||
New Hampshire: | ||||||||
Salem (leased through 2102)(6) | 37,000 | 100.0% | 12.58 | Babies “R” Us | ||||
New Jersey: | ||||||||
Bergen Town Center - East, Paramus | 211,000 | 97.4% | 19.41 | Lowe's, REI, Kirkland's (lease not commenced) | ||||
15
Bergen Town Center - West, Paramus | 960,000 | 99.3% | 32.09 | Target, Century 21, Whole Foods Market, Marshalls, Nordstrom Rack, Saks Off 5th, HomeGoods, H&M, Bloomingdale's Outlet, Nike Factory Store, Old Navy, Nieman Marcus Last Call Studio | ||||
Brick | 278,000 | 100.0% | 18.69 | Kohl's, ShopRite, Marshalls, Kirkland's (lease not commenced) | ||||
Carlstadt (leased through 2050)(6) | 78,000 | 100.0% | 23.45 | Stop & Shop | ||||
Cherry Hill | 261,000 | 99.2% | 9.16 | Walmart, Toys “R” Us, Maxx Fitness | ||||
East Brunswick | 427,000 | 100.0% | 14.93 | Lowe’s, Kohl’s, Dick’s Sporting Goods, P.C. Richard & Son, T.J. Maxx, LA Fitness | ||||
East Hanover (200 - 240 Route 10 West) | 343,000 | 96.9% | 20.31 | The Home Depot, Dick's Sporting Goods, Saks Off Fifth (lease not commenced), Marshalls | ||||
East Hanover (280 Route 10 West) | 28,000 | 100.0% | 34.71 | REI | ||||
East Rutherford (leased through 2194)(6) | 197,000 | 100.0% | 12.71 | Lowe’s | ||||
Eatontown | 30,000 | 15.0% | 44.00 | Citibank | ||||
Englewood(5) | 41,000 | 64.1% | 20.83 | New York Sports Club | ||||
Garfield | 263,000 | 100.0% | 13.70 | Walmart, Burlington, Marshalls, PetSmart | ||||
Hackensack | 275,000 | 96.2% | 21.89 | The Home Depot, Staples, Petco, 99 Ranch (lease not commenced) | ||||
Hazlet | 95,000 | 100.0% | 3.43 | Stop & Shop (4) | ||||
Jersey City | 236,000 | 100.0% | 12.37 | Lowe’s, P.C. Richard & Son | ||||
Kearny | 104,000 | 98.2% | 18.86 | LA Fitness, Marshalls | ||||
Lawnside | 147,000 | 99.3% | 14.63 | The Home Depot, PetSmart | ||||
Lodi (Route 17 North) | 171,000 | 100.0% | 12.50 | National Wholesale Liquidators | ||||
Lodi (Washington Street) | 85,000 | 83.6% | 20.39 | Blink Fitness, Aldi | ||||
Manalapan | 208,000 | 100.0% | 17.47 | Best Buy, Bed Bath & Beyond, Babies “R” Us, Modell’s Sporting Goods, PetSmart | ||||
Marlton | 213,000 | 100.0% | 14.18 | Kohl’s, ShopRite, PetSmart | ||||
Middletown | 231,000 | 100.0% | 13.21 | Kohl’s, Stop & Shop | ||||
Montclair | 18,000 | 100.0% | 26.20 | Whole Foods Market | ||||
Morris Plains | 177,000 | 91.2% | 21.59 | Kohl’s, ShopRite (4) | ||||
North Bergen (Kennedy Blvd) | 62,000 | 100.0% | 13.73 | Food Bazaar | ||||
North Bergen (Tonnelle Ave) | 410,000 | 100.0% | 20.47 | Walmart, BJ’s Wholesale Club, PetSmart, Staples | ||||
North Plainfield | 218,000 | 99.0% | 10.02 | Costco, The Tile Shop, La-Z-Boy, Petco (lease not commenced) | ||||
Paramus (leased through 2033)(6) | 63,000 | 100.0% | 46.61 | 24 Hour Fitness | ||||
Rockaway | 173,000 | 94.8% | 13.41 | ShopRite, T.J. Maxx | ||||
South Plainfield (leased through 2039)(6) | 56,000 | 96.3% | 20.53 | Staples, Party City | ||||
Totowa | 271,000 | 100.0% | 16.96 | The Home Depot, Bed Bath & Beyond, buy buy Baby, Marshalls, Staples | ||||
Turnersville | 92,000 | 100.0% | 7.00 | Haynes Furniture Outlet (DBA The Dump), Verizon Wireless (lease not commenced) | ||||
Union (2445 Springfield Ave) | 232,000 | 100.0% | 17.85 | The Home Depot | ||||
Union (Route 22 and Morris Ave) | 276,000 | 99.4% | 18.75 | Lowe’s, Toys “R” Us, Office Depot | ||||
Watchung | 170,000 | 98.3% | 16.84 | BJ’s Wholesale Club | ||||
Woodbridge | 226,000 | 84.1% | 13.76 | Walmart | ||||
New York: | ||||||||
Bronx (1750-1780 Gun Hill Road) | 77,000 | 100.0% | 34.50 | Planet Fitness, Aldi | ||||
Bronx (Bruckner Boulevard)(5) | 489,000 | 83.3% | 16.86 | Kmart, Toys “R” Us, ShopRite (lease not commenced) | ||||
Buffalo (Amherst) | 311,000 | 96.9% | 9.19 | BJ’s Wholesale Club, T.J. Maxx, HomeGoods, Toys “R” Us, LA Fitness | ||||
Commack (leased through 2021)(6) | 47,000 | 100.0% | 20.69 | PetSmart, Ace Hardware | ||||
Dewitt (leased through 2041)(6) | 46,000 | 100.0% | 22.51 | Best Buy | ||||
Freeport (240 West Sunrise Highway) (leased through 2040)(6) | 44,000 | 100.0% | 20.28 | Bob’s Discount Furniture | ||||
Freeport (437 East Sunrise Highway) | 173,000 | 100.0% | 21.95 | The Home Depot, Staples | ||||
Huntington | 204,000 | 99.7% | 15.64 | Kmart, Marshalls, Old Navy, Petco | ||||
Inwood | 100,000 | 100.0% | 19.54 | Stop & Shop | ||||
Mount Kisco | 189,000 | 100.0% | 16.85 | Target, Stop & Shop | ||||
New Hyde Park (leased through 2029)(6) | 101,000 | 100.0% | 20.21 | Stop & Shop | ||||
16
Oceanside | 16,000 | 100.0% | 28.00 | Party City | ||||
Queens(5) | 46,000 | 81.3% | 37.73 | |||||
Rochester | 205,000 | 100.0% | 3.08 | Walmart | ||||
Rochester (Henrietta) (leased through 2055)(6) | 165,000 | 97.9% | 4.15 | Kohl’s | ||||
Staten Island | 165,000 | 88.8% | 24.05 | Western Beef, Planet Fitness | ||||
West Babylon | 66,000 | 95.1% | 17.17 | Best Market, Rite Aid | ||||
Pennsylvania: | ||||||||
Allentown | 372,000 | 100.0% | 12.16 | Burlington Coat Factory, Giant Food, Dick's Sporting Goods, T.J. Maxx, Petco, Big Lots | ||||
Bensalem | 185,000 | 100.0% | 12.84 | Kohl's, Ross Dress for Less, Staples, Petco | ||||
Bethlehem | 153,000 | 93.9% | 7.33 | Giant Food, Petco | ||||
Broomall | 169,000 | 100.0% | 10.85 | Giant Food, Planet Fitness, A.C. Moore, PetSmart | ||||
Glenolden | 102,000 | 100.0% | 12.43 | Walmart | ||||
Lancaster | 228,000 | 100.0% | 4.76 | Lowe's, Community Aid, Mattress Firm | ||||
Springfield (leased through 2025)(6) | 41,000 | 100.0% | 22.99 | PetSmart | ||||
Wilkes-Barre (461 - 499 Mundy Street) | 204,000 | 91.8% | 12.89 | Bob's Discount Furniture, Babies "R" Us, Ross Dress for Less, Marshalls, Petco | ||||
Wyomissing (leased through 2065)(6) | 76,000 | 93.4% | 15.86 | LA Fitness, PetSmart | ||||
York | 111,000 | 100.0% | 9.21 | Ashley Furniture, Tractor Supply Company, Aldi | ||||
South Carolina: | ||||||||
Charleston (leased through 2063)(6) | 45,000 | 100.0% | 14.19 | Best Buy | ||||
Virginia: | ||||||||
Norfolk (leased through 2050)(6) | 114,000 | 100.0% | 7.08 | BJ’s Wholesale Club | ||||
Tyson’s Corner (leased through 2035)(6) | 38,000 | 100.0% | 43.04 | Best Buy | ||||
Puerto Rico: | ||||||||
Las Catalinas | 356,000 | 93.9% | 36.04 | Kmart, Forever 21 | ||||
Montehiedra(5) | 540,000 | 93.8% | 18.35 | Kmart, The Home Depot, Marshalls, Caribbean Theatres, Tiendas Capri | ||||
Total Shopping Centers and Malls | 13,831,000 | 97.2% | $17.07 | |||||
WAREHOUSES: | ||||||||
East Hanover - Five Buildings(5) | 942,000 | 91.7% | 4.77 | J & J Tri-State Delivery, Foremost Groups Inc., PCS Wireless, Fidelity Paper & Supply Inc., Meyer Distributing Inc., Consolidated Simon Distributors Inc., Givaudan Flavors Corp., Opulux (lease not commenced) | ||||
Total Urban Edge Properties | 14,773,000 | 96.8% | $16.43 | |||||
(1) Percent leased is expressed as a percent of total existing square feet (gross leasable area) subject to a lease.
(2) Weighted average annual rent per square foot including ground leases and executed leases for which rent has not commenced is calculated by annualizing tenant's current base rent (excluding any free rent periods), and excludes tenant reimbursements, concessions and storage rent. Excluding ground leases where the Company is the lessor, the weighted average annual rent per square foot for our retail portfolio is $19.77 per square foot.
(3) Our ownership of Walnut Creek (Mt. Diablo) is 95% at December 31, 2016.
(4) The tenant has ceased operations at this location but continues to pay rent.
(5) Not included in the same-property pool for the purposes of calculating same-property cash NOI as of December 31, 2016. Refer to “Non-GAAP Financial Measures” on page 32 for the definition and further discussion of same-property cash NOI.
(6) The Company is a lessee under a ground or building lease. The total square feet disclosed for the building will revert to the lessor upon lease expiration.
As of December 31, 2016, we had approximately 1,200 leases. Lease terms generally range from five years or less in some instances for smaller tenants to 25 years or more for major tenants. The majority of our leases provide for reimbursements of real estate taxes, insurance and common area maintenance charges (including roof and structure in shopping centers, unless it is the tenant’s direct responsibility), and percentage rents based on tenant sales volume. Percentage rents accounted for less than 1% of total revenues during 2016.
17
Occupancy
The following table sets forth the consolidated retail portfolio occupancy rate (excluding warehouses), square footage and weighted average annual base rent per square foot of properties in our retail portfolio as of December 31 for the last five years:
December 31, | ||||||||||||||||||||
2016 | 2015 | 2014 | 2013 | 2012 | ||||||||||||||||
Total square feet | 13,831,000 | 13,901,000 | 13,880,000 | 13,922,000 | 13,645,000 | |||||||||||||||
Occupancy Rate | 97.2 | % | 96.2 | % | 95.8 | % | 95.6 | % | 95.0 | % | ||||||||||
Average Annual Base Rent per sf | $17.07 | $16.64 | $16.57 | $16.38 | $16.35 | |||||||||||||||
The following table sets forth the occupancy rate, square footage and weighted average annual base rent per square foot of our warehouses as of December 31 for the last five years:
December 31, | ||||||||||||||||||||
2016 | 2015 | 2014 | 2013 | 2012 | ||||||||||||||||
Total square feet | 942,000 | 942,000 | 942,000 | 942,000 | 942,000 | |||||||||||||||
Occupancy Rate | 91.7 | % | 79.1 | % | 60.8 | % | 45.6 | % | 55.9 | % | ||||||||||
Average Annual Base Rent per sf | $4.77 | $4.80 | $4.41 | $4.35 | $4.34 | |||||||||||||||
Major Tenants
The following table sets forth information for the 10 largest tenants by total revenues for the year ended December 31, 2016:
Tenant | Number of Stores | Square Feet | % of Total Square Feet | 2016 Revenues | % of Total Revenues | ||||||||
The Home Depot | 7 | 920,000 | 6.2% | $ | 20,213,000 | 6.2% | |||||||
Walmart | 9 | 1,439,000 | 9.7% | 18,516,000 | 5.7% | ||||||||
Lowe's | 6 | 976,000 | 6.6% | 13,209,000 | 4.1% | ||||||||
Stop & Shop / Koninklijke Ahold NV | 9 | 656,000 | 4.4% | 12,033,000 | 3.7% | ||||||||
The TJX Companies, Inc. | 15 | 543,000 | 3.7% | 11,510,000 | 3.5% | ||||||||
Kohl's | 8 | 716,000 | 4.8% | 9,637,000 | 3.0% | ||||||||
Best Buy Co., Inc. | 7 | 313,000 | 2.1% | 8,045,000 | 2.5% | ||||||||
BJ's Wholesale Club | 4 | 454,000 | 3.1% | 7,766,000 | 2.4% | ||||||||
Sears Holding, Inc. (Kmart) | 4 | 547,000 | 3.7% | 7,248,000 | 2.2% | ||||||||
PetSmart, Inc. | 10 | 253,000 | 1.7% | 6,617,000 | 2.0% | ||||||||
18
Lease Expirations
The following table sets forth the anticipated expirations of tenant leases in our consolidated portfolio for each year from 2017 through 2027 and thereafter, assuming no exercise of renewal options or early termination rights:
Percentage of | Weighted Average Annual | |||||||||||||||
Number of | Square Feet of | Retail Properties | Base Rent of Expiring Leases | |||||||||||||
Year | Expiring Leases | Expiring Leases | Square Feet | Total | Per Square Foot | |||||||||||
Month-To-Month | 21 | 49,000 | 0.4% | $ | 2,023,700 | $ | 41.30 | |||||||||
2017 | 72 | 284,000 | 2.0% | 8,159,320 | 28.73 | (1) | ||||||||||
2018 | 71 | 1,033,000 | 7.4% | 14,988,830 | 14.51 | (1) | ||||||||||
2019 | 104 | 1,198,000 | 8.7% | 26,475,800 | 22.10 | |||||||||||
2020 | 82 | 1,270,000 | 9.2% | 22,936,200 | 18.06 | |||||||||||
2021 | 79 | 879,000 | 6.3% | 18,265,620 | 20.78 | |||||||||||
2022 | 67 | 1,197,000 | 8.7% | 15,441,300 | 12.90 | |||||||||||
2023 | 47 | 1,093,000 | 7.9% | 20,253,290 | 18.53 | |||||||||||
2024 | 58 | 1,352,000 | 9.8% | 18,292,560 | 13.53 | |||||||||||
2025 | 38 | 544,000 | 3.9% | 9,694,080 | 17.82 | |||||||||||
2026 | 47 | 618,000 | 4.5% | 8,095,800 | 13.10 | |||||||||||
2027 | 41 | 739,000 | 5.3% | 14,403,110 | 19.49 | |||||||||||
Thereafter | 55 | 3,189,000 | 23.1% | 51,119,670 | 16.03 | |||||||||||
Sub-total/Average | 782 | 13,445,000 | 97.2% | $ | 230,312,850 | $ | 17.13 | |||||||||
Vacant | 97 | 386,000 | 2.8% | N/A | N/A | |||||||||||
Total | 879 | 13,831,000 | 100.0% | $ | 230,312,850 | N/A | ||||||||||
(1) We expect to achieve moderate increases in average rents as we renew or re-lease these spaces.
ITEM 3. | LEGAL PROCEEDINGS |
We are party to various legal actions that arise in the ordinary course of business. In our opinion, after consultation with legal counsel, the outcome of such matters is not expected to have a material adverse effect on our financial position, results of operations, or cash flows.
ITEM 4. | MINE SAFETY DISCLOSURES |
Not applicable.
19
PART II
ITEM 5. | MARKET FOR REGISTRANT’S COMMON EQUITY, RELATED STOCKHOLDER MATTERS AND ISSUER PURCHASES OF EQUITY SECURITIES |
Market Information and Dividends
Our common shares are listed on the NYSE under the symbol “UE”. Our common shares began “regular way” trading on January 15, 2015. As of February 15, 2017, there were 1,748 holders of record of our common shares. There have been no repurchases of equity securities. The following table sets forth the high and low closing prices and the cash dividends declared on our common shares by quarter for 2016 and 2015:
2016 | 2015 | ||||||||||||||||||||||
High Price | Low Price | Cash Dividends Declared Per Share | High Price | Low Price | Cash Dividends Declared Per Share | ||||||||||||||||||
Quarter Ended | |||||||||||||||||||||||
Fourth quarter | $ | 28.21 | $ | 24.74 | $ | 0.22 | $ | 24.33 | $ | 21.58 | $ | 0.20 | |||||||||||
Third quarter | 30.15 | 27.06 | 0.20 | 23.06 | 20.12 | 0.20 | |||||||||||||||||
Second quarter | 29.86 | 24.49 | 0.20 | 24.02 | 20.79 | 0.20 | |||||||||||||||||
First quarter | 25.99 | 22.22 | 0.20 | 24.67 | 23.25 | 0.20 | |||||||||||||||||
The Company elected to be taxed as a REIT under sections 856-860 of the Internal Revenue Code of 1986, as amended, commencing with the filing of its 2015 tax return. Under those sections, a REIT which distributes at least 90% of its REIT taxable income as a dividend to its shareholders each year and which meets certain other conditions will not be taxed on that portion of its taxable income which is distributed to its shareholders. Prior to the separation from Vornado, UE Businesses historically operated under Vornado’s REIT structure. As Vornado operates as a REIT and distributes 100% of taxable income, no provision for federal income taxes was made in the accompanying consolidated and combined financial statements for periods prior to the separation. If we fail to qualify as a REIT for any taxable year, we will be subject to federal income taxes at regular corporate rates (including any alternative minimum tax) and may not be able to qualify as a REIT for the four subsequent taxable years.
Future distributions will be declared and paid at the discretion of the Board of Trustees and will depend upon cash generated by operating activities, our financial condition, capital requirements, annual dividend requirements under the REIT provisions of the Internal Revenue Code of 1986, as amended, and such other factors as our Board of Trustees deems relevant.
Our total annual dividends per common share for 2016 was $0.82 per share. The annual dividend amount may differ from dividends as calculated for federal income tax purposes. Distributions to the extent of our current and accumulated earnings and profits for federal income tax purposes generally will be taxable to a shareholder as ordinary dividend income. Distributions in excess of current and accumulated earnings and profits will be treated as a nontaxable reduction of the shareholder’s basis in such shareholder’s shares, to the extent thereof, and thereafter as taxable capital gains. Distributions that are treated as a reduction of the shareholder’s basis in its shares will have the effect of increasing the amount of gain, or reducing the amount of loss, recognized upon the sale of the shareholder’s shares. No assurances can be given regarding what portion, if any, of distributions in 2016 or subsequent years will constitute a return of capital for federal income tax purposes. During a year in which a REIT earns a net long-term capital gain, the REIT can elect under Section 857(b)(3) of the Code to designate a portion of dividends paid to shareholders as capital gain dividends. If this election is made, the capital gain dividends are generally taxable to the shareholder as long-term capital gains.
We have determined the dividends paid on our common shares during 2016 and 2015 qualify for the following tax treatment:
Total Distribution per Share | Ordinary Dividends | Long Term Capital Gains | Return of Capital | ||||||||||||
2016 | $ | 0.82 | $ | 0.82 | $ | — | $ | — | |||||||
2015 | 0.80 | 0.80 | — | — | |||||||||||
20
Total Shareholder Return Performance
The following performance graph compares the cumulative total shareholder return of our common shares with the Russell 2000 Index, the S&P 500 Index, SNL U.S. REIT Equity Index and the SNL REIT Retail Shopping Ctr Index as provided by SNL Financial LC, from January 15, 2015 to December 31, 2016, assuming an investment of $100 and the reinvestment of all dividends into additional common shares during the holding period. Historical stock performance is not necessarily indicative of future results.
The performance graph shall not be deemed incorporated by reference by any general statement incorporating by reference this annual report into any filing under the Securities Act of 1933, as amended, or the Securities Exchange Act of 1934, as amended, except to the extent we specifically incorporate this information by reference, and shall not otherwise be deemed filed under such acts.
COMPARISON OF CUMULATIVE TOTAL RETURN(1)
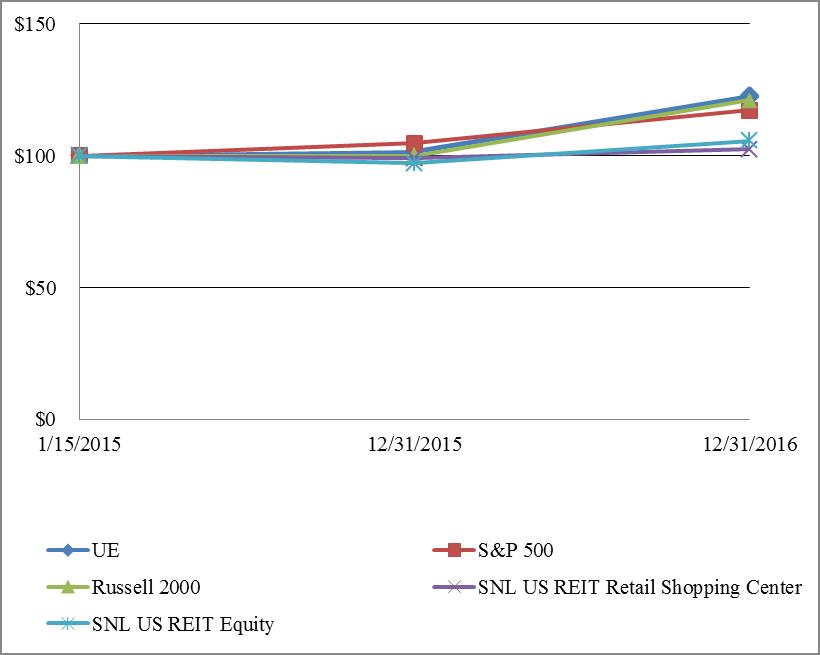
(1) $100 invested on January 15, 2015 in stock or index, including reinvestment of dividends.
Cumulative(1) Total Return % | Total Return $ as of | ||||||||||
Stock/Index | 1/15/2015 | 12/31/2015 | 12/31/2016 | ||||||||
UE | 22.6 | 100 | 101.4 | 122.6 | |||||||
S&P 500 | 17.2 | 100 | 104.7 | 117.2 | |||||||
Russell 2000 | 20.9 | 100 | 99.7 | 120.9 | |||||||
SNL U.S. REIT Equity | 5.7 | 100 | 97.1 | 105.7 | |||||||
SNL U.S. REIT Retail Shopping Center | 2.4 | 100 | 98.9 | 102.4 | |||||||
(1) Cumulative total return is for the period from the separation date on January 15, 2015 to December 31, 2016.
21
Recent Sales of Unregistered Shares
Under the terms of UELP’s limited partnership agreement, the common limited partnership units in our limited partnership may be redeemed, subject to certain conditions, for cash or an equivalent number of our common shares, at our option. During the three months ended December 31, 2016, there were no redemptions of operating partnership units. All other equity securities sold by us during 2016 that were not registered have been previously reported in a Quarterly Report on Form 10-Q or Current Report on Form 8-K.
Purchases of Equity Securities by the Issuer and Affiliated Purchasers
During 2016, 2,744 restricted common shares were forfeited by former employees. We did not repurchase any of our equity securities during the three months ended December 31, 2016. All other securities repurchased by us have been previously reported in a Quarterly Report on Form 10-Q or Current Report on Form 8-K.
Equity Compensation Plan Information
Information regarding equity compensation plans is presented in Part III, Item 12 of this Annual Report on Form 10-K and incorporated herein by reference.
22
ITEM 6. | SELECTED FINANCIAL DATA |
The following table includes selected consolidated and combined financial data set forth for the Company and the Operating Partnership as of and for each of the five years in the period ended December 31, 2016. The consolidated balance sheets as of December 31, 2016 and December 31, 2015 reflects the consolidation of properties that are wholly-owned and properties in which we own less than 100% interest, but in which we have a controlling interest. The consolidated statement of income for the year ended December 31, 2016 includes the consolidated accounts of the Company. The consolidated and combined statement of income for the year ended December 31, 2015 includes the consolidated accounts of the Company and the combined accounts of UE Businesses. Accordingly, the results presented for the year ended December 31, 2015 reflect the aggregate operations, changes in cash flows and equity on a carved-out and combined basis for the period from January 1, 2015 through the date of separation and on a consolidated basis subsequent to the date of separation. The financial data for the periods prior to the separation date are prepared on a carved-out and combined basis from the consolidated financial statements of Vornado as UE Businesses were under common control of Vornado prior to January 15, 2015. This selected financial data should be read in conjunction with “Management’s Discussion and Analysis of Financial Condition and Results of Operations”, and our audited consolidated and combined financial statements and related notes included in Part II, Items 7 and 8, respectively, of this Annual Report on Form 10-K.
Urban Edge Properties
Year Ended December 31, | |||||||||||||||||||
(Amounts in thousands, except per share amounts) | 2016 | 2015 | 2014 | 2013 | 2012 | ||||||||||||||
Operating Data: | |||||||||||||||||||
Property rentals | $ | 236,798 | $ | 231,867 | $ | 232,592 | $ | 228,282 | $ | 232,031 | |||||||||
Tenant expense reimbursements | 84,921 | 84,617 | 81,887 | 73,170 | 70,453 | ||||||||||||||
Income from Stop & Shop settlement | — | — | — | 59,599 | — | ||||||||||||||
Management and development fees | 1,759 | 2,261 | 535 | 606 | 794 | ||||||||||||||
Other income | 2,498 | 4,200 | 662 | 1,338 | 955 | ||||||||||||||
Total revenue | 325,976 | 322,945 | 315,676 | 362,995 | 304,233 | ||||||||||||||
Total expenses | 192,958 | 224,869 | 193,236 | 195,782 | 179,267 | ||||||||||||||
Operating income | 133,018 | 98,076 | 122,440 | 167,213 | 124,966 | ||||||||||||||
Net income | 96,630 | 41,348 | 65,794 | 109,335 | 69,850 | ||||||||||||||
Net income attributable to operating partnership | (5,812 | ) | (2,547 | ) | — | — | — | ||||||||||||
Net income attributable to consolidated subsidiaries | (3 | ) | (16 | ) | (22 | ) | (21 | ) | (13 | ) | |||||||||
Net income attributable to common shareholders(1) | $ | 90,815 | $ | 38,785 | $ | 65,772 | $ | 109,314 | $ | 69,837 | |||||||||
Earnings per common share - Basic(2): | 0.91 | 0.39 | 0.66 | 1.10 | 0.70 | ||||||||||||||
Earnings per common share - Diluted(2): | 0.91 | 0.39 | 0.66 | 1.10 | 0.70 | ||||||||||||||
Weighted average shares outstanding - Basic(2) | 99,364 | 99,252 | 99,248 | 99,248 | 99,248 | ||||||||||||||
Weighted average shares outstanding - Diluted(2) | 99,794 | 99,278 | 99,248 | 99,248 | 99,248 | ||||||||||||||
Dividends declared per common share | 0.82 | 0.80 | — | — | — | ||||||||||||||
(1) Net income earned prior to January 15, 2015 is attributable to Vornado as it was the sole shareholder prior to January 15, 2015. Refer to Note 1 to the consolidated and combined financial statements included in Part II, Item 8 of this Annual Report on Form 10-K.
(2) The common shares outstanding at the date of separation are reflected as outstanding for all periods prior to the separation. Refer to Note 2 to the consolidated and combined financial statements included in Part II, Item 8 of this Annual Report on Form 10-K.
23
Year Ended December 31, | |||||||||||||||||||
(Amounts in thousands) | 2016 | 2015 | 2014 | 2013 | 2012 | ||||||||||||||
Balance Sheet Data as of period end: | |||||||||||||||||||
Real estate, net of accumulated depreciation | $ | 1,597,423 | $ | 1,575,530 | $ | 1,555,301 | $ | 1,562,416 | $ | 1,609,121 | |||||||||
Total assets | 1,904,138 | 1,918,931 | 1,731,176 | 1,749,965 | 1,857,055 | ||||||||||||||
Mortgages payable, net | 1,197,513 | 1,233,983 | 1,278,182 | 1,200,762 | 1,251,234 | ||||||||||||||
Total liabilities | 1,408,021 | 1,447,477 | 1,472,313 | 1,408,381 | 1,467,167 | ||||||||||||||
Redeemable noncontrolling interests | 35,451 | 33,177 | — | — | — | ||||||||||||||
Total equity | 496,117 | 471,454 | 258,863 | 341,584 | 389,888 | ||||||||||||||
Other Data: | |||||||||||||||||||
Cash flow Statement Data: | |||||||||||||||||||
Provided by operating activities | 137,249 | 138,078 | 105,688 | 240,527 | 108,364 | ||||||||||||||
Used in investing activities | (59,230 | ) | (66,415 | ) | (45,586 | ) | (24,926 | ) | (31,875 | ) | |||||||||
Provided by (used in) financing activities | (115,858 | ) | 93,795 | (63,807 | ) | (212,636 | ) | (73,385 | ) | ||||||||||
Urban Edge Properties LP
Year Ended December 31, | |||||||||||||||||||
(Amounts in thousands, except per unit amounts) | 2016 | 2015 | 2014 | 2013 | 2012 | ||||||||||||||
Operating Data: | |||||||||||||||||||
Property rentals | $ | 236,798 | $ | 231,867 | $ | 232,592 | $ | 228,282 | $ | 232,031 | |||||||||
Tenant expense reimbursements | 84,921 | 84,617 | 81,887 | 73,170 | 70,453 | ||||||||||||||
Income from Stop & Shop settlement | — | — | — | 59,599 | — | ||||||||||||||
Management and development fees | 1,759 | 2,261 | 535 | 606 | 794 | ||||||||||||||
Other income | 2,498 | 4,200 | 662 | 1,338 | 955 | ||||||||||||||
Total revenue | 325,976 | 322,945 | 315,676 | 362,995 | 304,233 | ||||||||||||||
Total expenses | 192,958 | 224,869 | 193,236 | 195,782 | 179,267 | ||||||||||||||
Operating income | 133,018 | 98,076 | 122,440 | 167,213 | 124,966 | ||||||||||||||
Net income | 96,630 | 41,348 | 65,794 | 109,335 | 69,850 | ||||||||||||||
Net income attributable to consolidated subsidiaries | (3 | ) | (16 | ) | (22 | ) | (21 | ) | (13 | ) | |||||||||
Net income attributable to unitholders(1) | $ | 96,627 | $ | 41,332 | $ | 65,772 | $ | 109,314 | $ | 69,837 | |||||||||
Earnings per unit - Basic(2): | 0.91 | 0.39 | 0.63 | 1.04 | 0.67 | ||||||||||||||
Earnings per unit - Diluted(2): | 0.91 | 0.39 | 0.63 | 1.04 | 0.67 | ||||||||||||||
Weighted average units outstanding - Basic(2) | 105,455 | 105,276 | 104,965 | 104,965 | 104,965 | ||||||||||||||
Weighted average units outstanding - Diluted(2) | 106,099 | 105,374 | 104,965 | 104,965 | 104,965 | ||||||||||||||
Distributions declared per unit | 0.82 | 0.80 | — | — | — | ||||||||||||||
(1) Net income earned prior to January 15, 2015 is attributable to Vornado as it was the sole unitholder prior to January 15, 2015. Refer to Note 1 to the consolidated and combined financial statements included in Part II, Item 8 of this Annual Report on Form 10-K.
(2) The units outstanding at the date of separation are reflected as outstanding for all periods prior to the separation. Refer to Note 2 to the consolidated and combined financial statements included in Part II, Item 8 of this Annual Report on Form 10-K.
24
Year Ended December 31, | |||||||||||||||||||
(Amounts in thousands) | 2016 | 2015 | 2014 | 2013 | 2012 | ||||||||||||||
Balance Sheet Data as of period end: | |||||||||||||||||||
Real estate, net of accumulated depreciation | $ | 1,597,423 | $ | 1,575,530 | $ | 1,555,301 | $ | 1,562,416 | $ | 1,609,121 | |||||||||
Total assets | 1,904,138 | 1,918,931 | 1,731,176 | 1,749,965 | 1,857,055 | ||||||||||||||
Mortgages payable, net | 1,197,513 | 1,233,983 | 1,278,182 | 1,200,762 | 1,251,234 | ||||||||||||||
Total liabilities | 1,408,021 | 1,447,477 | 1,472,313 | 1,408,381 | 1,467,167 | ||||||||||||||
Total equity | 496,117 | 471,454 | 258,863 | 341,584 | 389,888 | ||||||||||||||
Other Data: | |||||||||||||||||||
Cash flow Statement Data: | |||||||||||||||||||
Provided by operating activities | 137,249 | 138,078 | 105,688 | 240,527 | 108,364 | ||||||||||||||
Used in investing activities | (59,230 | ) | (66,415 | ) | (45,586 | ) | (24,926 | ) | (31,875 | ) | |||||||||
Provided by (used in) financing activities | (115,858 | ) | 93,795 | (63,807 | ) | (212,636 | ) | (73,385 | ) | ||||||||||
ITEM 7. | MANAGEMENT’S DISCUSSION AND ANALYSIS OF FINANCIAL CONDITION AND RESULTS OF OPERATIONS |
Certain statements contained herein constitute forward-looking statements as such term is defined in Section 27A of the Securities Act of 1933, as amended, and Section 21E of the Securities Exchange Act of 1934, as amended. Forward-looking statements are not guarantees of future performance. They represent our intentions, plans, expectations and beliefs and are subject to numerous assumptions, risks and uncertainties. Our future results, financial condition and business may differ materially from those expressed in these forward-looking statements. You can find many of these statements by looking for words such as “approximates,” “believes,” “expects,” “anticipates,” “estimates,” “intends,” “plans,” “would,” “may” or other similar expressions in this Annual Report on Form 10-K. Many of the factors that will determine the outcome of these and our other forward-looking statements are beyond our ability to control or predict. For further discussion of factors that could materially affect the outcome of our forward-looking statements, see “Risk Factors” in Part I, Item 1A, of this Annual Report on Form 10-K for the year ended December 31, 2016.
For these statements, we claim the protection of the safe harbor for forward-looking statements contained in the Private Securities Litigation Reform Act of 1995. You are cautioned not to place undue reliance on our forward-looking statements, which speak only as of the date of this Annual Report on Form 10-K. All subsequent written and oral forward-looking statements attributable to us or any person acting on our behalf are expressly qualified in their entirety by the cautionary statements contained or referred to in this section. We do not undertake any obligation to release publicly any revisions to our forward-looking statements to reflect events or circumstances occurring after the date of this Annual Report on Form 10-K.
The following discussion should be read in conjunction with the consolidated and combined financial statements and notes thereto included in Part II, Item 8 of this Annual Report on Form 10-K.
Overview
Urban Edge Properties (“UE” or the “Company”) (NYSE: UE) is a Maryland real estate investment trust that owns, manages, acquires, develops, redevelops and operates retail real estate in high barrier-to-entry markets. Urban Edge Properties LP (“UELP” or the “Operating Partnership”) is a Delaware limited partnership formed to serve as the Company’s majority-owned partnership subsidiary and to own, through affiliates, all of the Company’s real estate properties and other assets. UE and UELP were created to own the majority of Vornado Realty Trust’s (“Vornado”) (NYSE: VNO) former shopping center business. Prior to the separation, the portfolio is referred to as “UE Businesses.” Unless the context otherwise requires, references to “we”, “us” and “our” refer to Urban Edge Properties and UELP and their consolidated entities/subsidiaries after giving effect to the transfer of assets and liabilities from Vornado as well as to UE Businesses prior to the date of the separation.
Prior to its separation on January 15, 2015, UE was a wholly owned subsidiary of Vornado. Pursuant to a separation and distribution agreement between UE and Vornado (the “Separation Agreement”), the interests in certain properties held by Vornado’s operating partnership, Vornado Realty L.P. (“VRLP”), were contributed or otherwise transferred to UE in exchange for 100% of our outstanding common shares. Following that contribution, VRLP distributed 100% of our outstanding common shares to Vornado and the other common limited partners of VRLP, pro rata with respect to their ownership of common limited partnership units in VRLP. Vornado then distributed all of the UE common shares it had received from VRLP to Vornado common shareholders on
25
a pro rata basis. As a result, VRLP common limited partners and Vornado common shareholders all received common shares of UE in the spin-off at a ratio of one common share of UE to every two VRLP common units and every two common shares of Vornado.
Substantially concurrently with such distribution, the interests in certain properties held by VRLP, including interests in entities holding properties, were contributed or otherwise transferred to UELP in exchange for approximately 5.4% of UELP’s outstanding common limited partnership interests in the Operating Partnership (“OP Units”).
The Operating Partnership’s capital includes OP Units. As of December 31, 2016, Urban Edge owned approximately 94.0% of the outstanding common OP Units with the remaining limited OP Units held by VRLP, and members of management and our Board of Trustees. Urban Edge serves as the sole general partner of the Operating Partnership. The third party unitholders have limited rights over the Operating Partnership such that they do not have characteristics of a controlling financial interest. As such, the Operating Partnership is considered a variable interest entity (“VIE”), and the Company is the primary beneficiary which consolidates it. The Company’s only investment is the Operating Partnership.
As part of the separation, Vornado capitalized UE with $225 million of cash. Vornado also paid $21.9 million of the transaction costs incurred in connection with the separation, which is reflected within non-cash separation costs paid by Vornado within the statement of cash flows. Of the $21.9 million transaction costs, $17.4 million were contingent on the completion of the separation. The remaining $4.5 million of transaction costs were allocated to Vornado on the separation date.
As of December 31, 2016, our portfolio consisted of 79 shopping centers, three malls and a warehouse park totaling 14.8 million square feet.
Operating Strategies. Our operating strategy is to maximize the value of our existing assets through proactive management encompassing: continuous asset evaluation for highest-and-best-use; efficient and cost-conscious operations that minimize retailer operating expense and preserve property quality; and thoughtful leasing to the most desirable tenants. During 2016, we accomplished the following leasing results:
• | increased same-property retail portfolio occupancy(1) to 98.0% as of December 31, 2016 from 97.2% as of December 31, 2015; |
• | increased consolidated retail portfolio occupancy(2) to 97.2% as of December 31, 2016 from 96.2% as of December 31, 2015; |
• | signed 54 new leases totaling 354,911 square feet, including 26 new leases on a same-space(3) basis totaling 132,315 square feet at an average rental rate of $32.00 per square foot on a GAAP basis and $29.47 per square foot on a cash basis, generating average rent spreads of 41.7% on a GAAP basis and 25.8% on a cash basis; and |
• | renewed or extended 52 leases totaling 554,259 square feet, including 52 leases on a same-space basis totaling 554,259 square feet at an average rental rate of $16.87 per square foot on a GAAP basis and $16.53 per square foot on a cash basis, generating average rent spreads of 13.1% on a GAAP basis and 7.1% on a cash basis. |
Investment Strategies. Our investment strategy is to selectively deploy capital through a combination of acquisitions, redevelopment and development in our target markets that is expected to generate attractive risk-adjusted returns and, at the same time, to sell assets that no longer meet our investment criteria. In addition to creating value from our existing assets through proactive management, when appropriate, we will redevelop certain assets, will pursue new developments and will acquire properties adjacent to them. During 2016, we:
• | increased the number of active development and redevelopment projects which have a total expected investment of $191.7 million of which $110.5 million remains to be funded; |
• | completed projects at Walnut Creek and East Hanover REI; |
• | identified approximately $73.0 million of development and redevelopment pipeline projects expected to be completed over the next several years; |
• | completed the sale of a shopping center located in Waterbury, CT for $21.6 million resulting in a gain of $15.6 million; The sale completed the reverse Section 1031 tax deferred exchange transaction with the acquisition of Cross Bay Commons; |
(1)Information provided on a same-property basis includes the results of properties that were owned and operated for the entirety of the reporting periods being compared and excludes properties that were under development, redevelopment or that involve anchor repositioning where a substantial portion of the gross leasable area is taken out of service and properties acquired, sold, or in the foreclosure process during the periods being compared and totals 77 properties as of December 31, 2016 and December 31, 2015. | |||
(2)Our retail portfolio includes shopping centers and malls and excludes warehouses. | |||
(3)The “same-space” designation is used to compare leasing terms (cash leasing spreads) from the prior tenant to the new/current tenant. In some cases, leases are excluded from "same-space" because the gross leasable area of the prior lease is combined/divided to form a larger/smaller, non-comparable space. | |||
26
• | acquired a 0.3 acre outparcel adjacent to Tonnelle Commons in North Bergen, NJ for $2.7 million on December 22, 2016, which will be the future site of a 2,000 sf Popeye's and; |
• | executed contracts to acquire Hudson Mall in Jersey City, NJ for an aggregate purchase price of $43.7 million, the Shops at Bruckner in the Bronx, NY for an aggregate purchase price of $32.0 million, and Yonkers Gateway Center in Yonkers, NY for an aggregate purchase price of $51.7 million. These acquisitions closed subsequent to December 31, 2016. |
Capital Strategies. Our capital strategy is to keep our balance sheet flexible and capable of supporting growth by using cash flow from operations, borrowing under our existing line of credit and reinvesting funds from selective asset sales. During 2016, we:
• | prepaid $21.2 million of the variable rate portion of our cross-collateralized mortgage loan to maintain compliance with covenant requirements, in connection with the sale of our property in Waterbury, CT; |
• | transferred our property in Englewood, NJ to receivership; the receiver manages the property while the Company remains the title owner until the receiver disposes of the property; and |
• | ended the year with cash and cash equivalents of $131.7 million and net debt (net of cash) to total market capitalization of 26.0% as of December 31, 2016. |
2017 Outlook. We seek growth in earnings, funds from operations, and cash flows primarily through a combination of the following:
• | leasing vacant spaces, extending expiring leases at higher rents, processing the exercise of tenant options and, when possible, replacing underperforming tenants with tenants that can pay higher rent; |
• | expediting the delivery of space to and the collection of rent from tenants with executed leases that have not yet commenced; |
• | creating additional value from our existing assets by redevelopment of existing space, development of new space such as expansion and pad sites and by anchor repositioning; and |
• | disposing of non-core assets and, when possible, reinvesting the proceeds in the redevelopment of and/or new development on existing properties and in acquiring additional properties meeting our investment criteria. |
Critical Accounting Policies and Estimates
The preparation of financial statements in conformity with accounting principles generally accepted in the United States of America, referred to as “GAAP”, requires management to make estimates and assumptions that in certain circumstances affect the reported amounts of assets and liabilities, disclosure of contingent assets and liabilities, and revenue and expenses. These estimates are prepared using management’s best judgment, after considering past and current events and economic conditions. In addition, certain information relied upon by management in preparing such estimates includes internally generated financial and operating information, external market information, when available, and when necessary, information obtained from consultations with third party experts. Actual results could differ from these estimates. A discussion of possible risks which may affect these estimates is included in “Item 1A. Risk Factors” of this Annual Report on Form 10-K. Management considers an accounting estimate to be critical if changes in the estimate could have a material impact on our consolidated and combined results of operations or financial condition.
Our significant accounting policies are more fully described in Note 3 to the consolidated and combined financial statements included in Part II, Item 8 of this Annual Report on Form 10-K; however, the most critical accounting policies, which involve the use of estimates and assumptions as to future uncertainties and, therefore, may result in actual amounts that differ from estimates, are as follows:
Real Estate — The nature of our business as an owner, redeveloper and operator of retail shopping centers means that we invest significant amounts of capital into our properties. Depreciation, amortization and maintenance costs relating to our properties constitute substantial costs for us as well as the industry as a whole. Real estate is capitalized and depreciated on a straight-line basis in accordance with GAAP and consistent with industry standards based on our best estimates of the assets’ physical and economic useful lives which range from 3 to 40 years. We periodically review the estimated lives of our assets and implement changes, as necessary, to these estimates. These assessments have a direct impact on our net income. Real estate is carried at cost, net of accumulated depreciation and amortization. Expenditures for ordinary maintenance and repairs are expensed to operations as they are incurred. Significant renovations and improvements that improve or extend the useful lives of assets are capitalized.
Real estate undergoing redevelopment activities is also carried at cost but no depreciation is recognized. All property operating expenses directly associated with and attributable to, the redevelopment, including interest, are capitalized to the extent the capitalized costs of the property do not exceed the estimated fair value of the redeveloped property when completed. If the cost of the redeveloped property, including the net book value of the existing property, exceeds the estimated fair value of redeveloped property, the excess is charged to impairment expense. The capitalization period begins when redevelopment activities are underway and ends when the project is substantially complete. Generally, a redevelopment is considered substantially completed and ready for its intended use upon completion of tenant improvements, but no later than one year from completion of major construction
27
activity. We make judgments as to the time period over which to capitalize such costs and these assumptions have a direct impact on net income because capitalized costs are not subtracted in calculating net income.
Upon the acquisition of real estate, we assess the fair value of acquired assets (including land, buildings and improvements, identified intangibles, such as acquired above and below-market leases, acquired in-place leases and tenant relationships) and acquired liabilities. We assess fair value based on estimated cash flow projections utilizing appropriate discount and capitalization rates and available market information. Estimates of future cash flows are based on a number of factors including historical operating results, known trends, and market/economic conditions. Based on these estimates, we allocate the purchase price to the applicable assets and liabilities.
In allocating the purchase price to identified intangible assets and liabilities of an acquired property, the value of above-market and below-market leases is estimated based on the present value of the difference between the contractual amounts, including fixed rate below-market renewal options, to be paid pursuant to the in-place leases and our estimate of the market lease rates and other lease provisions for comparable leases measured over a period equal to the estimated remaining term of the lease. Tenant related intangibles and improvements are amortized on a straight-line basis over the related lease term, including any bargain renewal options. We amortize identified intangibles that have finite lives over the period they are expected to contribute directly or indirectly to the future cash flows of the property or business acquired. We consider qualitative and quantitative factors in evaluating the likelihood of a tenant exercising a below market renewal option and include such renewal options in the calculation of in-place leases. If the value of below-market lease intangibles includes renewal option periods, we include such renewal periods in the amortization period utilized. If a lease terminates prior to its stated expiration, all unamortized amounts relating to that lease are written off.
Our properties are individually reviewed for impairment whenever events or changes in circumstances indicate that the carrying amount may not be recoverable. An impairment exists when the carrying amount of an asset exceeds the aggregate projected future cash flows over the anticipated holding period on an undiscounted basis. An impairment loss is measured based on the excess of the property’s carrying amount over its estimated fair value. Impairment analyses are based on our current plans, intended holding periods and available market information at the time the analyses are prepared. If our estimates of the projected future cash flows, anticipated holding periods, or market conditions change, our evaluation of impairment losses may be different and such differences could be material to our consolidated and combined financial statements. The evaluation of anticipated cash flows is subjective and is based, in part, on assumptions regarding future occupancy, rental rates and capital requirements that could differ materially from actual results. Plans to hold properties over longer periods decrease the likelihood of recording impairment losses.
Allowance for Doubtful Accounts — We make estimates of the collectibility of our current accounts receivable and straight-line rents receivable which require significant judgment by management. The collectibility of receivables is affected by numerous factors including current economic conditions, bankruptcies, and the ability of the tenant to perform under the terms of their lease agreement. While we make estimates of potentially uncollectible amounts and provide an allowance for them through bad debt expense, actual collectibility could differ from those estimates which could affect our net income.
With respect to the allowance for current uncollectible tenant receivables, we assess the collectibility of outstanding receivables by evaluating such factors as nature and age of the receivable, credit history and current financial condition of the specific tenant including our assessment of the tenant’s ability to meet its contractual lease obligations, and the status of any pending disputes or lease negotiations with the tenant.
The straight-line receivable arises from earnings recognized in excess of amounts currently due under the lease agreements. Due to the nature of the straight-line receivable, the collection period of these amounts typically extends beyond one year. The extended collection period for straight-line rents along with our evaluation of tenant credit risk may result in the deferral of a portion of straight-line rental income until the collection of such income is reasonably assured. These estimates have a direct impact on our earnings.
Revenue Recognition — We have the following revenue sources and revenue recognition policies:
• | Base Rent - income arising from minimum lease payments from tenant leases. These rents are recognized over the non-cancelable term of the related leases on a straight-line basis which includes the effects of rent steps and rent abatements under the leases. We commence rental revenue recognition when the tenant takes possession of the leased space and the leased space is substantially ready for its intended use. In addition, in circumstances where we provide a lease incentive to tenants, we recognize the incentive as a reduction of rental revenue on a straight-line basis over the term of the lease. |
28
• | Percentage Rent - income arising from retail tenant leases that is contingent upon tenant sales exceeding defined thresholds. These rents are recognized only after the contingency has been removed (i.e., when tenant sales thresholds have been achieved). |
• | Expense Reimbursements - revenue arising from tenant leases which provide for the recovery of all or a portion of the operating expenses, real estate taxes and capital improvements of the respective property. This revenue is accrued in the same periods as the expenses are incurred. |
• | Management, Leasing and Other Fees - income arising from contractual agreements with third parties. This revenue is recognized as the related services are performed under the respective agreements. |
Recent Accounting Pronouncements
See Note 3 to the audited consolidated and combined financial statements in Part II, Item 8 of this Annual Report on Form 10-K for information regarding recent accounting pronouncements that may affect us.
Results of Operations
We derive substantially all of our revenue from rents received from tenants under existing leases on each of our properties. This revenue includes fixed based rents, recoveries of expenses that we have incurred and that we pass through to the individual tenants and percentage rents that are based on specified percentages of tenants’ revenue, in each case as provided in the respective leases.
Our primary cash expenses consist of our property operating and capital expenses, general and administrative expenses, and interest and debt expense. Property operating expenses include: real estate taxes, repairs and maintenance, management expenses, insurance, and utilities; general and administrative expenses include payroll, office expenses, professional fees, acquisition costs, and other administrative expenses; and interest expense is primarily on our mortgage debt and amortization of deferred financing costs on our revolving credit facility. In addition, we incur substantial non-cash charges for depreciation and amortization on our properties. We also capitalize certain expenses, such as taxes, interest, and salaries related to properties under development or redevelopment until the property is ready for its intended use.
Our consolidated and combined results of operations often are not comparable from period to period due to the impact of property acquisitions, dispositions, developments and redevelopments. The results of operations of any acquired property are included in our financial statements as of the date of its acquisition.
The following provides an overview of our key financial metrics based on our consolidated and combined results of operations (refer to cash Net Operating Income (“NOI”), same-property cash NOI and Funds From Operations applicable to diluted common shareholders (“FFO”) described later in this section):
Year Ended December 31, | |||||||
(Amounts in thousands) | 2016 | 2015 | |||||
Net income | $ | 96,630 | $ | 41,348 | |||
FFO applicable to diluted common shareholders(1) | 136,493 | 97,951 | |||||
Cash NOI(2) | 211,541 | 205,262 | |||||
Same-property cash NOI(2) | 187,999 | 180,591 | |||||
(1) FFO applicable to diluted common shareholders is utilized as a performance measure for Urban Edge, refer to page 34 for a reconciliation to the nearest GAAP measure.
(2) Refer to page 33 for a reconciliation to the nearest GAAP measure.
29
Comparison of the Year Ended December 31, 2016 to 2015
Net income for the year ended December 31, 2016 was $96.6 million, compared to net income of $41.3 million for the year ended December 31, 2015. The following table summarizes certain line items from our consolidated and combined statements of income that we believe are important in understanding our operations and/or those items which significantly changed in the year ended December 31, 2016 as compared to the same period of 2015:
For the year ended December 31, | |||||||||||
(Amounts in thousands) | 2016 | 2015 | $ Change | ||||||||
Total revenue | $ | 325,976 | $ | 322,945 | $ | 3,031 | |||||
Real estate tax expenses | 51,429 | 49,311 | 2,118 | ||||||||
Property operating expenses | 45,280 | 50,595 | (5,315 | ) | |||||||
General and administrative expenses | 27,438 | 32,044 | (4,606 | ) | |||||||
Transaction costs | 1,405 | 24,011 | (22,606 | ) | |||||||
Gain on sale of real estate | 15,618 | — | 15,618 | ||||||||
Interest and debt expense | 51,881 | 55,584 | (3,703 | ) | |||||||
Income tax expense | 804 | 1,294 | (490 | ) | |||||||
Total revenue of $326.0 million in the year ended December 31, 2016 increased $3.0 million from $322.9 million in the year ended December 31, 2015. The increase is primarily attributable to:
• | $4.4 million net increase in property rentals due to rent commencements from higher occupancy, contractual rent increases and increase in specialty leasing income, offset by tenant vacancies at development projects; |
• | $0.5 million net increase associated with properties acquired and sold in 2016 and 2015; |
• | $0.3 million increase in tenant expense reimbursements due to recoveries derived from the growth in capital improvements partially offset by a decrease in recoverable expenses; |
• | partially offset by $1.7 million lower tenant bankruptcy settlement income; and |
• | $0.5 million decrease in management and development fee income due to properties under management sold during 2015. |
Real estate tax expenses increased by $2.1 million to $51.4 million in the year ended December 31, 2016 from $49.3 million in the year ended December 31, 2015. The increase is primarily attributable to:
• | $2.3 million increase due to higher assessed values and tax refunds received in 2015; |
• | $0.5 million increase due to the acquisition of Cross Bay Commons in December 2015; and |
• | partially offset by $0.7 million of additional real estate taxes capitalized related to space taken out of service for development and redevelopment projects. |
Property operating expenses decreased by $5.3 million to $45.3 million in the year ended December 31, 2016 from $50.6 million in the year ended December 31, 2015. The decrease is primarily attributable to:
• | $3.2 million lower common area maintenance expenses; |
• | $1.4 million of environmental remediation costs accrued in 2015; and |
• | $0.7 million decrease in non-recoverable operating expenses including property level litigation costs. |
General and administrative expenses decreased by $4.6 million to $27.4 million in the year ended December 31, 2016 from $32.0 million in the year ended December 31, 2015. The decrease is primarily attributable to:
• | $7.1 million of share-based compensation expense incurred in 2015 in connection with the one-time issuance of LTIP units to certain executives in connection with our separation transaction; and |
• | partially offset by $2.5 million of share-based compensation expense incurred in 2016 due to equity awards granted and the vesting of existing equity awards. |
Transaction costs decreased $22.6 million to $1.4 million in the year ended December 31, 2016 from $24.0 million in the year ended December 31, 2015. The decrease is primarily due to costs incurred in connection with the separation transaction in 2015.
Gain on sale of real estate assets of $15.6 million in the year ended December 31, 2016 was recognized as a result of the sale of our property in Waterbury, CT on June 9, 2016. The sale completed the reverse Section 1031 tax deferred exchange transaction with the acquisition of Cross Bay Commons.
30
Interest and debt expense decreased $3.7 million to $51.9 million in the year ended December 31, 2016 from $55.6 million in the year ended December 31, 2015. The decrease is primarily attributable to:
• | $1.9 million of additional interest capitalized related to increased levels of development and redevelopment; |
• | $1.1 million of costs expensed in connection with the refinancing of the loan secured by Montehiedra in January 2015; and |
• | $0.7 million due to a lower mortgage payable balance as a result of scheduled principal payments and debt prepayment in connection with the sale of our property in Waterbury, CT during the second quarter of 2016. |
Income tax expense decreased $0.5 million resulting in income tax expense of $0.8 million in the year ended December 31, 2016 from $1.3 million of expense in the year ended December 31, 2015 as a result of a $0.6 million reduction to the accrued income tax liability recorded during 2016, partially offset by the current period income tax expense accrual.
Comparison of the Year Ended December 31, 2015 to 2014
Net income attributable to common shareholders for the year ended December 31, 2015 was $38.8 million compared to net income of $65.8 million for the year ended December 31, 2014. The following table summarizes certain line items from our consolidated and combined statements of income that we believe are important in understanding our operations and/or those items which significantly changed in the year ended December 31, 2015 as compared to the same period of 2014:
For the year ended December 31, | |||||||||||
(Amounts in thousands) | 2015 | 2014 | $ Change | ||||||||
Total revenue | $ | 322,945 | $ | 315,676 | $ | 7,269 | |||||
Real estate tax expenses | 49,311 | 49,835 | (524 | ) | |||||||
Property operating expenses | 50,595 | 51,988 | (1,393 | ) | |||||||
Depreciation and amortization | 57,253 | 53,653 | 3,600 | ||||||||
General and administrative expenses | 32,044 | 17,820 | 14,224 | ||||||||
Transaction costs | 24,011 | 8,604 | 15,407 | ||||||||
Interest and debt expense | 55,584 | 54,960 | 624 | ||||||||
Income tax expense | 1,294 | 1,721 | (427 | ) | |||||||
Net income attributable to noncontrolling interests | 2,563 | 22 | 2,541 | ||||||||
Total revenue increased by $7.3 million to $322.9 million in the year ended December 31, 2015 from $315.7 million in the year ended December 31, 2014. The increase is primarily attributable to:
• | $3.7 million of tenant bankruptcy settlement and lease termination income; |
• | $2.7 million in tenant expense reimbursements as a result of higher occupancy and recoverable costs; and |
• | $1.7 million in management and development fees due to additional properties under management; |
• | partially offset by a net decrease in property rentals of $0.9 million. |
Real estate tax expenses decreased by $0.5 million to $49.3 million in the year ended December 31, 2015 from $49.8 million in the year ended December 31, 2014. The decrease is primarily attributable to $0.5 million of real estate tax settlement income received in 2015 related to prior periods.
Property operating expenses decreased by $1.4 million to $50.6 million in the year ended December 31, 2015 from $52.0 million the year ended December 31, 2014. The decrease is primarily attributable to:
• | $0.8 million lower utility and insurance costs including amounts capitalized for properties in redevelopment; |
• | $0.7 million of landlord costs associated with deferred maintenance on vacancies and other non-recurring expenses incurred in the fourth quarter of 2014; |
• | partially offset by $0.1 million higher other property operating expenses incurred in the year ended December 31, 2015. |
General and administrative expenses increased by $14.2 million to $32.0 million in the year ended December 31, 2015 from $17.8 million in the year ended December 31, 2014. The increase is primarily attributable to:
• | $7.1 million of share-based compensation expense, including the one-time issuance of LTIP units to certain executives in connection with our separation transaction; and |
• | $7.1 million associated with operating as a separate, publicly traded company including added headcount and a separate executive team. |
31
Transaction costs increased $15.4 million to $24.0 million in the year ended December 31, 2015 from $8.6 million in the year ended December 31, 2014. The increase is primarily attributable to:
• | $13.3 million of transaction costs incurred in connection with the separation transaction including $10.0 million of professional fees and $3.3 million of transfer taxes; and |
• | $2.1 million of transaction costs related to acquisitions and potential transactions in 2015. |
Interest and debt expense increased $0.6 million to $55.6 million in the year ended December 31, 2015 from $55.0 million in the year ended December 31, 2014. The increase is primarily attributable to:
• | $3.1 million related to recognition of a full year of interest on financing obtained for Las Catalinas on July 16, 2014; |
• | $1.6 million of fees and amortization of deferred financing costs associated with the revolving credit facility entered into on January 15, 2015; |
• | partially offset by $1.9 million of interest capitalized related to development projects in 2015; |
• | $1.7 million of interest on $29.1 million of loans repaid during the first quarter of 2015 and $28.0 million of loans repaid in 2014; and |
• | $0.5 million of interest due to the lowering of the interest rate of the mortgage loan secured by Montehiedra from 6.04% to 5.33% in connection with the debt restructuring on January 6, 2015. |
Income tax expense decreased $0.4 million to $1.3 million in the year ended December 31, 2015 from $1.7 million in December 31, 2014. The decrease is attributable to an adjustment to update our projected annual income tax provision on our Puerto Rico properties based on estimated taxable income.
Net income attributable to noncontrolling interests increased $2.5 million to $2.6 million in 2015. The increase is attributable to the 5% noncontrolling interest in the property operations as well as net income of $2.5 million allocated to the OP and LTIP unit holders, representing a 5.8% weighted average interest in the Operating Partnership in the year ended December 31, 2015.
Non-GAAP Financial Measures
Throughout this section, we have provided certain information on a “same-property” cash basis which includes the results of operations that we consolidated (or combined), owned and operated for the entirety of both periods being compared, totaling 77 properties for the twelve months ended December 31, 2016 and 2015. Information provided on a same-property basis excludes properties under development, redevelopment or that involve anchor repositioning where a substantial portion of the gross leasable area is taken out of service and also excludes properties acquired, sold, or that are in the foreclosure process during the periods being compared. As such, same-property cash NOI assists in eliminating disparities in net income due to the development, redevelopment, acquisition or disposition of properties during the periods presented, and thus provides a more consistent performance measure for the comparison of the operating performance of the Company’s properties. While there is judgment surrounding changes in designations, a property is removed from the same-property pool when it is designated as a redevelopment property because it is undergoing significant renovation or retenanting pursuant to a formal plan that is expected to have a significant impact on its operating income. A development or redevelopment property is moved back to the same-property pool once a substantial portion of the NOI growth expected from the development or redevelopment is reflected in both the current and comparable prior year period, generally the earlier of one year after construction is substantially complete or when gross leasable area related to the redevelopment is 90% leased. Acquisitions are moved into the same-property pool once we have owned the property for the entirety of the comparable periods and the property is not under significant development or redevelopment.
We calculate same-property cash NOI using net income as defined by GAAP reflecting only those income and expense items that are incurred at the property level, adjusted for the following items: lease termination fees, bankruptcy settlement income, non-cash rental income and ground rent expense and income or expenses that we do not believe are representative of ongoing operating results, if any.
The most directly comparable GAAP financial measure to cash NOI is net income. Cash NOI excludes certain components from net income in order to provide results that are more closely related to a property’s results of operations. We calculate cash NOI by adjusting GAAP operating income to add back depreciation and amortization expense, general and administrative expenses, real estate impairment losses and non-cash ground rent expense, and deduct non-cash rental income resulting from the straight-lining of rents and amortization of acquired below market leases net of above market leases.
We use cash NOI internally to make investment and capital allocation decisions and to compare the unlevered performance of our properties to our peers. Further, we believe cash NOI is useful to investors as a performance measure because, when compared across periods, cash NOI reflects the impact on operations from trends in occupancy rates, rental rates, operating costs and acquisition and disposition activity on an unleveraged basis, providing perspective not immediately apparent from operating
32
income or net income. Cash NOI and same-property cash NOI should not be considered substitutes for operating income or net income and may not be comparable to similarly titled measures employed by others.
Same-property cash NOI increased by $7.4 million, or 4.1% for the twelve months ended December 31, 2016 as compared to the twelve months ended December 31, 2015.
The following table reconciles net income to cash NOI and same-property cash NOI for the twelve months ended December 31, 2016 and 2015.
For the year ended December 31, | |||||||
(Amounts in thousands) | 2016 | 2015 | |||||
Net income | $ | 96,630 | $ | 41,348 | |||
Add: income tax expense | 804 | 1,294 | |||||
Income before income taxes | 97,434 | 42,642 | |||||
Gain on sale of real estate | (15,618 | ) | — | ||||
Interest income | (679 | ) | (150 | ) | |||
Interest and debt expense | 51,881 | 55,584 | |||||
Operating income | 133,018 | 98,076 | |||||
Depreciation and amortization | 56,145 | 57,253 | |||||
General and administrative expense | 27,438 | 32,044 | |||||
Transaction costs | 1,405 | 24,011 | |||||
NOI | 218,006 | 211,384 | |||||
Less: non-cash revenue and expenses | (6,465 | ) | (6,122 | ) | |||
Cash NOI | 211,541 | 205,262 | |||||
Adjustments: | |||||||
Cash NOI related to properties being redeveloped | (17,315 | ) | (17,497 | ) | |||
Tenant bankruptcy settlement income(2) | (2,378 | ) | (4,022 | ) | |||
Management and development fee income from non-owned properties | (1,759 | ) | (2,261 | ) | |||
Cash NOI related to properties acquired, disposed, or in foreclosure | (2,246 | ) | (1,920 | ) | |||
Environmental remediation costs | — | 1,379 | |||||
Real estate tax settlement income related to prior periods | — | (532 | ) | ||||
Other(1) | 156 | 182 | |||||
Subtotal adjustments | (23,542 | ) | (24,671 | ) | |||
Same-property cash NOI | $ | 187,999 | $ | 180,591 | |||
(1) Other adjustments include revenue and expense items attributable to non-same properties and corporate activities.
(2) Tenant bankruptcy settlement income includes lease termination income.
Funds From Operations
33
FFO for the twelve months ended December 31, 2016 was $136.5 million compared to $98.0 million for the twelve months ended December 31, 2015.
We calculate FFO in accordance with the National Association of Real Estate Investment Trusts’ (‘‘NAREIT’’) definition. NAREIT defines FFO as net income (computed in accordance with GAAP), excluding gains (or losses) from sales of depreciated real estate assets, real estate impairment losses, rental property depreciation and amortization expense. We believe FFO is a meaningful non-GAAP financial measure useful in comparing our levered operating performance from period to period both internally and among our peers because this non-GAAP measure excludes net gains on sales of depreciable real estate, real estate impairment losses, rental property depreciation and amortization expense which implicitly assumes that the value of real estate diminishes predictably over time rather than fluctuating based on market conditions. FFO does not represent cash flows from operating activities in accordance with GAAP, should not be considered an alternative to net income as an indication of our performance, and is not indicative of cash flow as a measure of liquidity or our ability to make cash distributions. FFO may not be comparable to similarly titled measures employed by others.
Twelve Months Ended December 31, | |||||||
(Amounts in thousands) | 2016 | 2015 | |||||
Net income | $ | 96,630 | $ | 41,348 | |||
Less (net income) attributable to noncontrolling interests in: | |||||||
Operating partnership | (5,812 | ) | (2,547 | ) | |||
Consolidated subsidiaries | (3 | ) | (16 | ) | |||
Net income attributable to common shareholders | 90,815 | 38,785 | |||||
Adjustments: | |||||||
Gain on sale of real estate | (15,618 | ) | — | ||||
Rental property depreciation and amortization | 55,484 | 56,619 | |||||
Limited partnership interests in operating partnership(1) | 5,812 | 2,547 | |||||
FFO applicable to diluted common shareholders | $ | 136,493 | $ | 97,951 | |||
(1) Represents earnings allocated to vested LTIP and OP unit holders for unissued common shares which have been excluded for purposes of calculating earnings per diluted share for the periods presented. FFO calculations include earnings allocated to vested LTIP and OP unit holders and the respective weighted average share totals include the shares that may be issued upon redemption of units as their inclusion is dilutive.
34
Liquidity and Capital Resources
Due to the nature of our business, we typically generate significant amounts of cash from operations; however, the cash generated from operations is primarily paid to our shareholders and the unitholders of the Operating Partnership in the form of distributions. Our status as a REIT requires that we distribute 90% of our REIT taxable income each year. Our Board of Trustees declared a quarterly dividend of $0.20 per common share and OP Unit for each of the first three quarters in 2016, and a dividend of $0.22 per common share and OP Unit for the fourth quarter of 2016, or an annual rate of $0.82. We expect to pay regular cash dividends, however, the timing, declaration, amount and payment of distributions to shareholders and unitholders of the Operating Partnership falls within the discretion of our Board of Trustees. Our Board of Trustees’ decisions regarding the payment of dividends depends on many factors, such as maintaining our REIT tax status, our financial condition, earnings, capital requirements, debt service obligations, limitations under our financing arrangements, industry practice, legal requirements, regulatory constraints, and other factors.
Property rental income is our primary source of cash flow and is dependent on a number of factors including our occupancy level and rental rates, as well as our tenants’ ability to pay rent. Our properties provide us with a relatively consistent stream of cash flow that enables us to pay operating expenses, debt service and recurring capital expenditures. Other sources of liquidity to fund cash requirements may include proceeds from financings, equity offerings and asset sales.
Our short-term liquidity requirements consist of normal recurring operating expenses, lease obligations, regular debt service requirements (including debt service relating to additional or replacement debt, as well as scheduled debt maturities), recurring expenditures (general & administrative expenses), non-recurring expenditures (such as tenant improvements and redevelopments) and distributions to shareholders and unitholders of the Operating Partnership. Our long-term capital requirements consistent primarily of maturities under our long-term debt agreements, development and redevelopment costs and potential acquisitions.
At December 31, 2016, we had cash and cash equivalents of $131.7 million and no amounts drawn on our line of credit. On August 8, 2016, the Company established an at-the-market (“ATM”) equity program, pursuant to which the Company may offer and sell its common shares, par value $0.01 per share, with an aggregate gross sales price of up to $250.0 million. From September 2016 to December 2016, the Company issued 307,342 common shares at a weighted average price of $28.45 under the ATM equity program, generating cash proceeds of $8.7 million. We have no debt maturing in 2017. We currently believe that cash flows from operations over the next 12 months, together with cash on hand, our ATM equity program, our line of credit and our general ability to access the capital markets will be sufficient to finance our operations and fund our debt service requirements and capital expenditures.
Summary of Cash Flows
Our cash flow activities are summarized as follows:
Twelve Months Ended December 31, | |||||||||||
(Amounts in thousands) | 2016 | 2015 | Increase (Decrease) | ||||||||
Net cash provided by operating activities | $ | 137,249 | $ | 138,078 | $ | (829 | ) | ||||
Net cash used in investing activities | (59,230 | ) | (66,415 | ) | 7,185 | ||||||
Net cash (used in) provided by financing activities | (115,858 | ) | 93,795 | (209,653 | ) | ||||||
Cash and cash equivalents including restricted cash was $140.2 million at December 31, 2016, compared to $178.0 million as of December 31, 2015, a decrease of $37.8 million. Net cash provided by operating activities of $137.2 million for the year ended December 31, 2016 comprised of $140.1 million of cash from operating income and $2.9 million net decrease in cash due to timing of cash receipts and payments related to changes in operating assets and liabilities. Net cash used in investing activities of $59.2 million for the year ended December 31, 2016 was comprised of (i) $69.9 million of real estate additions and (ii) $9.3 million from the acquisition of real estate, partially offset by, (iii) $19.9 million proceeds from the sale of operating properties. Net cash used in financing activities of $115.9 million for the year ended December 31, 2016 was comprised of (i) $86.3 million of distributions paid to common shareholders and unitholders of the Operating Partnership and (ii) $38.5 million for debt repayments, offset by, (iii) $8.9 million proceeds from the issuance of common shares including shares issued under our ATM equity program.
Cash and cash equivalents including restricted cash was $178.0 million at December 31, 2015, compared to $12.6 million as of December 31, 2014, an increase of $165.5 million. This increase resulted primarily from net cash provided by operating activities of $138.1 million for 2015, which was comprised of (i) $124.0 million increase in cash from operating income and (ii) $14.1 million net increase in cash due to timing of cash receipts and payments related to changes in operating assets and liabilities. Net cash used in investing activities of $66.4 million for 2015 was comprised of (i) $36.3 million of real estate additions and (ii) $30.1
35
million of real estate acquisitions. Net cash provided by financing activities of $93.8 million for 2015 was comprised of (i) $227.7 million of Vornado’s contributions, net, in connection with the spin-off partially offset by, (ii) $79.2 million of dividends paid to common shareholders, (iii) $44.7 million for debt repayments, (iv) $5.2 million of debt issuance costs primarily related to our revolving credit facility, and (v) $4.9 million of distributions to redeemable noncontrolling interests.
Financing Activities and Contractual Obligations
Below is a summary of our outstanding debt and maturities as of December 31, 2016.
Interest Rate at | Principal Balance at | |||||||
(Amounts in thousands) | Maturity | December 31, 2016 | December 31, 2016 | |||||
Cross collateralized mortgage loan: | ||||||||
Fixed Rate | 9/10/2020 | 4.36% | $ | 519,125 | ||||
Variable Rate(1) | 9/10/2020 | 2.36% | 38,756 | |||||
Total cross collateralized | 557,881 | |||||||
First mortgages secured by: | ||||||||
North Bergen (Tonnelle Avenue) | 1/9/2018 | 4.59% | 73,951 | |||||
Englewood(3) | 10/1/2018 | 6.22% | 11,537 | |||||
Montehiedra Town Center, Senior Loan(2) | 7/6/2021 | 5.33% | 87,308 | |||||
Montehiedra Town Center, Junior Loan(2) | 7/6/2021 | 3.00% | 30,000 | |||||
Bergen Town Center | 4/8/2023 | 3.56% | 300,000 | |||||
Las Catalinas | 8/6/2024 | 4.43% | 130,000 | |||||
Mount Kisco (Target) | 11/15/2034 | 6.40% | 14,883 | |||||
Total mortgages payable | 1,205,560 | |||||||
Unamortized debt issuance costs | (8,047 | ) | ||||||
Total mortgages payable, net of unamortized debt issuance costs | $ | 1,197,513 | ||||||
(1) | Subject to a LIBOR floor of 1.00%, currently bears interest at LIBOR plus 136 bps. In June 2016, in connection with the sale of our property in Waterbury, CT, we prepaid $21.2 million of the variable rate portion of our cross collateralized mortgage loan to maintain compliance with covenant requirements. |
(2) | On January 6, 2015, we completed a loan restructuring applicable to the $120.0 million, 6.04% mortgage loan secured by Montehiedra Town Center. Refer to Note 7- Mortgages Payable of our consolidated and combined financial statements included in Part II, Item 8 of this Annual Report on Form 10-K. |
(3) | On March 30, 2015, we notified the lender that due to tenants vacating, the property’s operating cash flow would be insufficient to pay its debt service. As of December 31, 2016 we were in default and the property was transferred to receivership. Urban Edge no longer manages the property but will remain its title owner until the receiver disposes of the property. |
The net carrying amount of real estate collateralizing the above indebtedness amounted to approximately $859.2 million as of December 31, 2016. Our mortgage loans contain covenants that limit our ability to incur additional indebtedness on these properties and in certain circumstances, require lender approval of tenant leases and/or yield maintenance upon repayment prior to maturity. Our property in Waterbury, CT was held as collateral in our cross collateralized mortgage loan. In connection with the sale of our property in Waterbury, CT on June 9, 2016, we prepaid $21.2 million of the variable rate component of our cross collateralized mortgage loan in order to maintain compliance with covenant requirements. As of December 31, 2016, we were in compliance with all debt covenants.
On January 15, 2015, we entered into a $500 million unsecured Revolving Credit Agreement (the “Agreement”) with certain financial institutions. The Agreement has a four-year term with two six-month extension options. Borrowings under the Agreement are subject to interest at LIBOR plus 1.15% and we are required to pay an annual facility fee of 20 basis points which is expensed as incurred. Both the spread over LIBOR and the facility fee are based on our current leverage ratio and are subject to increase if our leverage ratio increases above predefined thresholds. The Agreement contains customary financial covenants including a maximum leverage ratio of 60% and a minimum fixed charge coverage ratio of 1.5x. No amounts have been drawn to date under the Agreement.
During the year ended December 31, 2014, Montehiedra Town Center (“Montehiedra”), our property in the San Juan area of Puerto Rico, was experiencing financial difficulties which resulted in a substantial decline in its net operating cash flows. As such, we transferred the mortgage loan secured by Montehiedra to the special servicer and discussed restructuring the terms of the mortgage loan. In January 2015 we completed the modification of the $120.0 million, 6.04% mortgage loan. The loan was extended from
36
July 2016 to July 2021 and separated into two tranches, a senior $90.0 million position with interest at 5.33% to be paid currently and a junior $30.0 million position with interest accruing at 3.0%. As part of the planned redevelopment of the property, we committed to fund $20.0 million through an intercompany loan for leasing and capital expenditures of which $16.9 million has been funded as of December 31, 2016. This $20.0 million intercompany loan is senior to the $30.0 million mortgage position noted above and accrues interest at 10%. Both the intercompany loan and related interest are eliminated in our consolidated and combined financial statements. We incurred $2.0 million of debt issuance costs in connection with the loan modification.
Below is a summary of contractual obligations as of December 31, 2016:
Commitments Due by Period | ||||||||||||||||||||||||||||
(Amounts in thousands) | Total | 2017 | 2018 | 2019 | 2020 | 2021 | Thereafter | |||||||||||||||||||||
Contractual cash obligations(1) | ||||||||||||||||||||||||||||
Long-term debt obligations | $ | 1,450,618 | $ | 70,322 | $ | 147,941 | $ | 64,218 | $ | 553,810 | $ | 140,768 | $ | 473,559 | ||||||||||||||
Operating lease obligations | 68,303 | 8,964 | 7,676 | 7,354 | 5,110 | 4,522 | 34,677 | |||||||||||||||||||||
$ | 1,518,921 | $ | 79,286 | $ | 155,617 | $ | 71,572 | $ | 558,920 | $ | 145,290 | $ | 508,236 | |||||||||||||||
(1) Includes interest and principal payments. Interest on variable rate debt is computed using rates in effect as of December 31, 2016.
Capital Expenditures
The following summarizes capital expenditures presented on a cash basis for the twelve months ended December 31, 2016 and 2015:
Twelve Months Ended December 31, | ||||||||
(Amounts in thousands) | 2016 | 2015 | ||||||
Capital expenditures: | ||||||||
Development and redevelopment costs | $ | 51,585 | $ | 20,624 | ||||
Maintenance capital expenditures | 15,180 | 12,714 | ||||||
Tenant improvements and allowances | 3,136 | 2,951 | ||||||
Total capital expenditures | $ | 69,901 | $ | 36,289 | ||||
The increase in cash spent on development and redevelopment during the twelve months ended December 31, 2016 as compared to the same period in 2015 was primarily the result of the advancement of our active redevelopment projects at Bruckner Boulevard, Montehiedra Town Center and Garfield totaling $31.8 million. The increase in maintenance capital expenditures during the twelve months ended December 31, 2016 as compared to the same period in 2015 was primarily the result of the timing of capital projects across our portfolio.
As of December 31, 2016, we had approximately $186.2 million of active redevelopment, development and anchor repositioning projects at various stages of completion and $5.5 million of completed projects pending twelve month stabilization, an increase of $68.9 million from $122.8 million of projects as of December 31, 2015. We have advanced these projects $49.4 million since December 31, 2015 and anticipate that these projects will require an additional $110.5 million over the next three years to complete. We expect to fund these projects using cash on hand, proceeds from dispositions, borrowings under our line of credit and/or using secured debt, or issuing equity.
Commitments and Contingencies
Loan Commitments
In January 2015 we completed a modification of the $120.0 million, 6.04% mortgage loan secured by Montehiedra. As part of the planned redevelopment of the property, we committed to fund $20.0 million for leasing and other capital expenditures of which $16.9 million has been funded as of December 31, 2016.
Insurance
We maintain general liability insurance with limits of $200 million per occurrence for properties in the U.S. and Puerto Rico, and all-risk property and rental value insurance with limits of $500 million for properties in the U.S. and $139 million for properties in Puerto Rico per occurrence, with sub-limits for certain perils such as floods and earthquakes on each of our properties. We also maintain coverage for terrorism acts with limits of $500 million for properties in the U.S. and $139 million for properties in Puerto
37
Rico per occurrence and in the aggregate excluding coverage for nuclear, biological, chemical or radiological terrorism events as defined by the Terrorism Risk Insurance Program Reauthorization Act, which expires in December 2020. In addition, we maintain coverage for cybersecurity with limits of $5 million in the aggregate providing first and third party coverage including network interruption, event management, cyber extortion and claims for media content, security and privacy liability. Insurance premiums are charged directly to each of the retail properties and warehouses. We will be responsible for deductibles and losses in excess of insurance coverage, which could be material.
We continue to monitor the state of the insurance market and the scope and costs of coverage for acts of terrorism. However, we cannot anticipate what coverage will be available on commercially reasonable terms in the future.
Our mortgage loans are non-recourse and contain customary covenants requiring adequate insurance coverage. Although we believe that we currently have adequate insurance coverage for purposes of these agreements, we may not be able to obtain an equivalent amount of coverage at reasonable costs in the future. If lenders insist on greater coverage than we are able to obtain, it could adversely affect our ability to finance our properties and expand our portfolio.
Environmental Matters
Each of our properties has been subjected to varying degrees of environmental assessment at various times. Based on these assessments and the projected remediation costs, we have accrued costs of $1.4 million on our consolidated balance sheets for potential remediation costs for environmental contamination at two properties. While this accrual reflects our best estimates of the potential costs of remediation at these properties, $0.1 million has currently been expended and there can be no assurance that the actual costs will not exceed this amount. With respect to our other properties, the environmental assessments did not reveal any material environmental contamination. However, there can be no assurance that the identification of new areas of contamination, changes in the extent or known scope of contamination, the discovery of additional sites, or changes in cleanup requirements would not result in significant costs to us.
Bankruptcies
Although base rent is supported by long-term lease contracts, tenants who file bankruptcy may have the legal right to reject any or all of their leases and close related stores. In the event that a tenant with a significant number of leases in our shopping centers files bankruptcy and cancels its leases, we could experience a reduction in our revenues. We monitor the operating performance and rent payments of all tenants in our shopping centers, especially those tenants in arrears or operating retail formats that are experiencing significant changes in competition, business practice, or store closings in other locations. We are not aware of any bankruptcy or announced store closings by any tenants in our shopping centers that would individually cause a material reduction in our revenues.
Inflation and Economic Condition Considerations
Most of our leases contain provisions designed to partially mitigate the impact of inflation. Although inflation has been low in recent periods and has had a minimal impact on the performance of our shopping centers, there are more recent data suggesting that inflation may be a greater concern in the future given economic conditions and governmental fiscal policy. Most of our leases require tenants to pay their share of operating expenses, including common area maintenance, real estate taxes and insurance, thereby reducing our exposure to increases in costs and operating expenses resulting from inflation, although some larger tenants have capped the amount of these operating expenses they are responsible for under the lease. A small number of our leases also include percentage rent clauses enabling us to receive additional rent based on tenant sales above a predetermined level, which sales generally increase as prices rise and are typically related to increases in the Consumer Price Index or similar inflation indices.
Off-Balance Sheet Arrangements
We do not have any off-balance sheet arrangements as of December 31, 2016 or December 31, 2015.
38
ITEM 7A. | QUANTITATIVE AND QUALITATIVE DISCLOSURES ABOUT MARKET RISK |
Interest Rate Risk
We have exposure to fluctuations in interest rates, which are sensitive to many factors that are beyond our control. The following table discusses our exposure to hypothetical changes in market rates of interest on interest expense for our variable rate debt and fixed-rate debt. Interest rate risk amounts were determined by considering the impact of hypothetical interest rates on our debt. This analysis does not take into account all of the factors that may affect our debt, such as the effect that a changing interest rate environment could have on the overall level of economic activity or the action that our management might take to reduce our exposure to the change. This analysis assumes no change in our financial structure. Our exposure to a change in interest rates is summarized in the table below.
2016 | 2015 | ||||||||||||||
(Amounts in thousands) | December 31, Balance | Weighted Average Interest Rate | Effect of 1% Change in Base Rates | December 31, Balance | Weighted Average Interest Rate | ||||||||||
Variable Rate | $ | 38,756 | 2.36% | $ | 388 | (2) | $ | 60,000 | 2.36% | ||||||
Fixed Rate | 1,166,804 | 4.26% | — | 1,183,957 | 4.25% | ||||||||||
$ | 1,205,560 | (1) | $ | 388 | $ | 1,243,957 | (1) | ||||||||
(1) Excludes unamortized debt issuance costs. The fixed rate debt was presented net of unamortized fees of $1.7 million as of December 31, 2015 in our Form 10-K as filed with SEC for Urban Edge Properties. The net unamortized fees of $1.7 million were revised to be presented with unamortized debt issuance costs as disclosed in Note 7 - Mortgages Payable to our consolidated and combined financial statements included in Part II, Item 8 of this Annual Report on Form 10-K.
(2) The variable rate debt is subject to a LIBOR floor such that a 1% change in base rates does not impact the actual borrowing rate by 1%.
We may utilize various financial instruments to mitigate the impact of interest rate fluctuations on our cash flows and earnings, including hedging strategies, depending on our analysis of the interest rate environment and the costs and risks of such strategies. As of December 31, 2016, we did not have any hedging instruments in place.
Fair Value of Debt
The estimated fair value of our consolidated debt is calculated based on current market prices and discounted cash flows at the current rate at which similar loans would be made to borrowers with similar credit ratings for the remaining term of such debt. As of December 31, 2016, the estimated fair value of our consolidated debt was $1.2 billion.
Other Market Risks
As of December 31, 2016, we had no material exposure to any other market risks (including foreign currency exchange risk or commodity price risk).
In making this determination and for purposes of the SEC’s market risk disclosure requirements, we have estimated the fair value of our financial instruments at December 31, 2016 based on pertinent information available to management as of that date. Although management is not aware of any factors that would significantly affect the estimated amounts as of December 31, 2016, future estimates of fair value and the amounts which may be paid or realized in the future may differ significantly from amounts presented.
39
ITEM 8. | FINANCIAL STATEMENTS AND SUPPLEMENTARY DATA |
INDEX TO CONSOLIDATED AND COMBINED FINANCIAL STATEMENTS AND
FINANCIAL STATEMENT SCHEDULES
Page | ||
Report of Independent Registered Public Accounting Firm for Urban Edge Properties | ||
Report of Independent Registered Public Accounting Firm for Urban Edge Properties LP | ||
Urban Edge Properties Consolidated Balance Sheets as of December 31, 2016 and 2015 | ||
Urban Edge Properties Consolidated and Combined Statements of Income for the years ended December 31, 2016, 2015 and 2014 | ||
Urban Edge Properties Consolidated and Combined Statement of Changes in Equity for the years ended December 31, 2016, 2015 and 2014 | ||
Urban Edge Properties Consolidated and Combined Statements of Cash Flows for the years ended December 31, 2016, 2015 and 2014 | ||
Urban Edge Properties LP Consolidated Balance Sheets as of December 31, 2016 and 2015 | ||
Urban Edge Properties LP Consolidated and Combined Statements of Income for the years ended December 31, 2016, 2015 and 2014 | ||
Urban Edge Properties LP Consolidated and Combined Statement of Changes in Equity for the years ended December 31, 2016, 2015 and 2014 | ||
Urban Edge Properties LP Consolidated and Combined Statements of Cash Flows for the years ended December 31, 2016, 2015 and 2014 | ||
Notes to Consolidated and Combined Financial Statements | ||
40
REPORT OF INDEPENDENT REGISTERED PUBLIC ACCOUNTING FIRM
Shareholders and Board of Trustees
Urban Edge Properties
New York, New York
We have audited the accompanying consolidated balance sheets of Urban Edge Properties (the "Company") as of December 31, 2016 and 2015, and the related consolidated and combined statements of income, changes in equity, and cash flows for each of the three years in the period ended December 31, 2016. Our audits also included the financial statement schedules listed in the Index at Item 15. These consolidated and combined financial statements and financial statement schedules are the responsibility of the Company's management. Our responsibility is to express an opinion on the consolidated and combined financial statements and financial statement schedules based on our audits.
We conducted our audits in accordance with the standards of the Public Company Accounting Oversight Board (United States). Those standards require that we plan and perform the audit to obtain reasonable assurance about whether the financial statements are free of material misstatement. An audit includes examining, on a test basis, evidence supporting the amounts and disclosures in the financial statements. An audit also includes assessing the accounting principles used and significant estimates made by management, as well as evaluating the overall financial statement presentation. We believe that our audits provide a reasonable basis for our opinion.
In our opinion, such consolidated and combined financial statements present fairly, in all material respects, the financial position of Urban Edge Properties as of December 31, 2016 and 2015, and the results of its operations and its cash flows for each of the three years in the period ended December 31, 2016, in conformity with accounting principles generally accepted in the United States of America. Also, in our opinion, such financial statement schedules, when considered in relation to the basic consolidated and combined financial statements taken as a whole, present fairly, in all material respects, the information set forth therein.
As discussed in Note 2 to the consolidated and combined financial statements, the combined financial statements of the Company include allocations of certain expenses from Vornado Realty Trust. These costs may not be reflective of the actual costs which would have been incurred had the Company operated as an independent, stand-alone entity separate from Vornado Realty Trust.
We have also audited, in accordance with the standards of the Public Company Accounting Oversight Board (United States), the Company's internal control over financial reporting as of December 31, 2016, based on the criteria established in Internal Control - Integrated Framework (2013) issued by the Committee of Sponsoring Organizations of the Treadway Commission and our report dated February 16, 2017 expressed an unqualified opinion on the Company's internal control over financial reporting.
/s/ DELOITTE & TOUCHE LLP
New York, New York
February 16, 2017
41
REPORT OF INDEPENDENT REGISTERED PUBLIC ACCOUNTING FIRM
Partners of
Urban Edge Properties LP
New York, New York
We have audited the accompanying consolidated balance sheets of Urban Edge Properties LP (the "Operating Partnership") as of December 31, 2016 and 2015, and the related consolidated and combined statements of income, changes in equity, and cash flows for each of the three years in the period ended December 31, 2016. Our audits also included the financial statement schedules listed in the Index at Item 15. These consolidated and combined financial statements and financial statement schedules are the responsibility of the Operating Partnership's management. Our responsibility is to express an opinion on the consolidated and combined financial statements and financial statement schedules based on our audits.
We conducted our audits in accordance with the standards of the Public Company Accounting Oversight Board (United States). Those standards require that we plan and perform the audit to obtain reasonable assurance about whether the financial statements are free of material misstatement. An audit includes examining, on a test basis, evidence supporting the amounts and disclosures in the financial statements. An audit also includes assessing the accounting principles used and significant estimates made by management, as well as evaluating the overall financial statement presentation. We believe that our audits provide a reasonable basis for our opinion.
In our opinion, such consolidated and combined financial statements present fairly, in all material respects, the financial position of Urban Edge Properties LP as of December 31, 2016 and 2015, and the results of its operations and its cash flows for each of the three years in the period ended December 31, 2016, in conformity with accounting principles generally accepted in the United States of America. Also, in our opinion, such financial statement schedules, when considered in relation to the basic consolidated and combined financial statements taken as a whole, present fairly, in all material respects, the information set forth therein.
As discussed in Note 2 to the consolidated and combined financial statements, the combined financial statements of the Operating Partnership include allocations of certain expenses from Vornado Realty Trust. These costs may not be reflective of the actual costs which would have been incurred had the Operating Partnership operated as an independent, stand-alone entity separate from Vornado Realty Trust.
We have also audited, in accordance with the standards of the Public Company Accounting Oversight Board (United States), the Operating Partnership's internal control over financial reporting as of December 31, 2016, based on the criteria established in Internal Control - Integrated Framework (2013) issued by the Committee of Sponsoring Organizations of the Treadway Commission and our report dated February 16, 2017 expressed an unqualified opinion on the Operating Partnership's internal control over financial reporting.
/s/ DELOITTE & TOUCHE LLP
New York, New York
February 16, 2017
42
URBAN EDGE PROPERTIES
CONSOLIDATED BALANCE SHEETS
(In thousands, except share and per share amounts)
December 31, | December 31, | ||||||
2016 | 2015 | ||||||
ASSETS | |||||||
Real estate, at cost: | |||||||
Land | $ | 384,217 | $ | 389,080 | |||
Buildings and improvements | 1,650,054 | 1,630,539 | |||||
Construction in progress | 99,236 | 61,147 | |||||
Furniture, fixtures and equipment | 4,993 | 3,876 | |||||
Total | 2,138,500 | 2,084,642 | |||||
Accumulated depreciation and amortization | (541,077 | ) | (509,112 | ) | |||
Real estate, net | 1,597,423 | 1,575,530 | |||||
Cash and cash equivalents | 131,654 | 168,983 | |||||
Restricted cash | 8,532 | 9,042 | |||||
Tenant and other receivables, net of allowance for doubtful accounts of $2,332 and $1,926, respectively | 9,340 | 10,364 | |||||
Receivable arising from the straight-lining of rents, net of allowance for doubtful accounts of $261 and $148, respectively | 87,695 | 88,778 | |||||
Identified intangible assets, net of accumulated amortization of $22,361 and $22,090, respectively | 30,875 | 33,953 | |||||
Deferred leasing costs, net of accumulated amortization of $13,909 and $12,987, respectively | 19,241 | 18,455 | |||||
Deferred financing costs, net of accumulated amortization of $726 and $709, respectively | 1,936 | 2,838 | |||||
Prepaid expenses and other assets | 17,442 | 10,988 | |||||
Total assets | $ | 1,904,138 | $ | 1,918,931 | |||
LIABILITIES AND EQUITY | |||||||
Liabilities: | |||||||
Mortgages payable, net | $ | 1,197,513 | $ | 1,233,983 | |||
Identified intangible liabilities, net of accumulated amortization of $72,528 and $65,220, respectively | 146,991 | 154,855 | |||||
Accounts payable and accrued expenses | 48,842 | 45,331 | |||||
Other liabilities | 14,675 | 13,308 | |||||
Total liabilities | 1,408,021 | 1,447,477 | |||||
Commitments and contingencies | |||||||
Shareholders’ equity: | |||||||
Common shares: $0.01 par value; 500,000,000 shares authorized and 99,754,900 and 99,290,952 shares issued and outstanding, respectively | 997 | 993 | |||||
Additional paid-in capital | 488,375 | 475,369 | |||||
Accumulated deficit | (29,066 | ) | (38,442 | ) | |||
Noncontrolling interests: | |||||||
Redeemable noncontrolling interests | 35,451 | 33,177 | |||||
Noncontrolling interest in consolidated subsidiaries | 360 | 357 | |||||
Total equity | 496,117 | 471,454 | |||||
Total liabilities and equity | $ | 1,904,138 | $ | 1,918,931 | |||
See notes to consolidated and combined financial statements.
43
URBAN EDGE PROPERTIES
CONSOLIDATED AND COMBINED STATEMENTS OF INCOME
(In thousands, except share and per share data)
Year Ended December 31, | ||||||||||||
2016 | 2015 | 2014 | ||||||||||
REVENUE | ||||||||||||
Property rentals | $ | 236,798 | $ | 231,867 | $ | 232,592 | ||||||
Tenant expense reimbursements | 84,921 | 84,617 | 81,887 | |||||||||
Management and development fees | 1,759 | 2,261 | 535 | |||||||||
Other income | 2,498 | 4,200 | 662 | |||||||||
Total revenue | 325,976 | 322,945 | 315,676 | |||||||||
EXPENSES | ||||||||||||
Depreciation and amortization | 56,145 | 57,253 | 53,653 | |||||||||
Real estate taxes | 51,429 | 49,311 | 49,835 | |||||||||
Property operating | 45,280 | 50,595 | 51,988 | |||||||||
General and administrative | 27,438 | 32,044 | 17,820 | |||||||||
Ground rent | 10,047 | 10,129 | 10,304 | |||||||||
Transaction costs | 1,405 | 24,011 | 8,604 | |||||||||
Provision for doubtful accounts | 1,214 | 1,526 | 1,032 | |||||||||
Total expenses | 192,958 | 224,869 | 193,236 | |||||||||
Operating income | 133,018 | 98,076 | 122,440 | |||||||||
Gain on sale of real estate | 15,618 | — | — | |||||||||
Interest income | 679 | 150 | 35 | |||||||||
Interest and debt expense | (51,881 | ) | (55,584 | ) | (54,960 | ) | ||||||
Income before income taxes | 97,434 | 42,642 | 67,515 | |||||||||
Income tax expense | (804 | ) | (1,294 | ) | (1,721 | ) | ||||||
Net income | 96,630 | 41,348 | 65,794 | |||||||||
Less net income attributable to noncontrolling interests in: | ||||||||||||
Operating partnership | (5,812 | ) | (2,547 | ) | — | |||||||
Consolidated subsidiaries | (3 | ) | (16 | ) | (22 | ) | ||||||
Net income attributable to common shareholders | $ | 90,815 | $ | 38,785 | $ | 65,772 | ||||||
Earnings per common share - Basic: | $ | 0.91 | 0.39 | 0.66 | ||||||||
Earnings per common share - Diluted: | $ | 0.91 | 0.39 | 0.66 | ||||||||
Weighted average shares outstanding - Basic | 99,364 | 99,252 | 99,248 | |||||||||
Weighted average shares outstanding - Diluted | 99,794 | 99,278 | 99,248 | |||||||||
See notes to consolidated and combined financial statements.
44
URBAN EDGE PROPERTIES
CONSOLIDATED AND COMBINED STATEMENTS OF CHANGES IN EQUITY
(In thousands, except share and per share amounts)
Common Shares | Noncontrolling Interests (“NCI”) | |||||||||||||||||||||||||||||
Shares | Amount | Additional Paid-In Capital | Vornado Equity | Accumulated Earnings (Deficit) | Redeemable NCI | NCI in Consolidated Subsidiaries | Total Equity | |||||||||||||||||||||||
Balance, January 1, 2014 | — | $ | — | $ | — | $ | 341,265 | $ | — | $ | — | $ | 319 | $ | 341,584 | |||||||||||||||
Net income attributable to Vornado | — | — | — | 65,772 | — | — | — | 65,772 | ||||||||||||||||||||||
Net income attributable to noncontrolling interests | — | — | — | — | — | — | 22 | 22 | ||||||||||||||||||||||
Distributions to Vornado net | — | — | — | (148,515 | ) | — | — | — | (148,515 | ) | ||||||||||||||||||||
Balance, December 31, 2014 | — | — | — | 258,522 | — | — | 341 | 258,863 | ||||||||||||||||||||||
Net income (loss) attributable to common shareholders(1) | — | — | — | (2,022 | ) | 40,807 | — | — | 38,785 | |||||||||||||||||||||
Net income attributable to noncontrolling interests | — | — | — | — | — | 2,547 | 16 | 2,563 | ||||||||||||||||||||||
Limited partnership units issued to Vornado at separation | — | — | — | (27,649 | ) | — | 27,649 | — | — | |||||||||||||||||||||
Contributions from Vornado | — | — | — | 245,067 | — | — | — | 245,067 | ||||||||||||||||||||||
Issuance of shares in connection with separation | 99,247,806 | 993 | 472,925 | (473,918 | ) | — | — | — | — | |||||||||||||||||||||
Common shares issued | 43,146 | — | 258 | — | (258 | ) | — | — | — | |||||||||||||||||||||
Dividends on common shares ($0.80 per share) | — | — | — | — | (79,167 | ) | — | — | (79,167 | ) | ||||||||||||||||||||
Share-based compensation expense | — | — | 2,186 | — | 176 | 7,899 | — | 10,261 | ||||||||||||||||||||||
Distributions to redeemable NCI ($0.80 per unit) | — | — | — | — | — | (4,918 | ) | — | (4,918 | ) | ||||||||||||||||||||
Balance, December 31, 2015 | 99,290,952 | 993 | 475,369 | — | (38,442 | ) | 33,177 | 357 | 471,454 | |||||||||||||||||||||
Net income attributable to common shareholders | — | — | — | — | 90,815 | — | — | 90,815 | ||||||||||||||||||||||
Net income attributable to noncontrolling interests | — | — | — | — | — | 5,812 | 3 | 5,815 | ||||||||||||||||||||||
Common shares issued | 465,534 | 4 | 9,293 | — | (348 | ) | — | — | 8,949 | |||||||||||||||||||||
Share-based awards retained for taxes | (1,586 | ) | — | (38 | ) | — | — | — | — | (38 | ) | |||||||||||||||||||
Dividends on common shares ($0.82 per share) | — | — | — | — | (81,240 | ) | — | — | (81,240 | ) | ||||||||||||||||||||
Share-based compensation expense | — | — | 3,751 | — | 149 | 1,533 | — | 5,433 | ||||||||||||||||||||||
Distributions to redeemable NCI ($0.82 per unit) | — | — | — | — | — | (5,071 | ) | — | (5,071 | ) | ||||||||||||||||||||
Balance, December 31, 2016 | 99,754,900 | $ | 997 | $ | 488,375 | $ | — | $ | (29,066 | ) | $ | 35,451 | $ | 360 | $ | 496,117 | ||||||||||||||
(1) Net loss earned from January 1, 2015 through January 15, 2015 is attributable to Vornado as it was the sole shareholder prior to January 15, 2015. Refer to Note 1 - Organization.
See notes to consolidated and combined financial statements.
45
URBAN EDGE PROPERTIES
CONSOLIDATED AND COMBINED STATEMENTS OF CASH FLOWS
(In thousands)
Twelve Months Ended December 31, | |||||||||||
2016 | 2015 | 2014 | |||||||||
CASH FLOWS FROM OPERATING ACTIVITIES | |||||||||||
Net income | $ | 96,630 | $ | 41,348 | $ | 65,794 | |||||
Adjustments to reconcile net income to net cash provided by operating activities: | |||||||||||
Depreciation and amortization | 57,178 | 58,299 | 54,897 | ||||||||
Amortization of deferred financing costs | 2,830 | 2,738 | 1,660 | ||||||||
Amortization of below market leases, net | (7,776 | ) | (7,907 | ) | (8,762 | ) | |||||
Straight-lining of rent | 227 | 333 | (1,559 | ) | |||||||
Share-based compensation expense | 5,433 | 10,261 | 3,878 | ||||||||
Gain on sale of real estate | (15,618 | ) | — | — | |||||||
Non-cash separation costs paid by Vornado | — | 17,403 | — | ||||||||
Provision for doubtful accounts | 1,214 | 1,526 | 1,032 | ||||||||
Change in operating assets and liabilities: | |||||||||||
Tenant and other receivables | (78 | ) | (4 | ) | (5,914 | ) | |||||
Deferred leasing costs | (3,815 | ) | (2,940 | ) | (1,963 | ) | |||||
Prepaid and other assets | 141 | (671 | ) | 767 | |||||||
Accounts payable and accrued expenses | (237 | ) | 11,300 | (4,929 | ) | ||||||
Other liabilities | 1,120 | 6,392 | 787 | ||||||||
Net cash provided by operating activities | 137,249 | 138,078 | 105,688 | ||||||||
CASH FLOWS FROM INVESTING ACTIVITIES | |||||||||||
Real estate additions | (69,901 | ) | (36,290 | ) | (39,509 | ) | |||||
Acquisition of real estate | (9,267 | ) | (30,125 | ) | (6,077 | ) | |||||
Proceeds from sale of operating properties | 19,938 | — | — | ||||||||
Net cash used in investing activities | (59,230 | ) | (66,415 | ) | (45,586 | ) | |||||
CASH FLOWS FROM FINANCING ACTIVITIES | |||||||||||
Debt repayments | (38,458 | ) | (44,654 | ) | (42,481 | ) | |||||
Contributions from Vornado | — | 227,732 | (148,786 | ) | |||||||
Dividends paid to shareholders | (81,240 | ) | (79,167 | ) | — | ||||||
Distributions to redeemable noncontrolling interests | (5,071 | ) | (4,918 | ) | — | ||||||
Debt issuance costs | — | (5,198 | ) | — | |||||||
Taxes withheld for vested restricted shares | (38 | ) | — | (2,540 | ) | ||||||
Proceeds from issuance of common shares | 8,949 | — | — | ||||||||
Proceeds from borrowings | — | — | 130,000 | ||||||||
Net cash (used in) provided by financing activities | (115,858 | ) | 93,795 | (63,807 | ) | ||||||
Net (decrease) increase in cash and cash equivalents and restricted cash | (37,839 | ) | 165,458 | (3,705 | ) | ||||||
Cash and cash equivalents and restricted cash at beginning of period | 178,025 | 12,567 | 16,272 | ||||||||
Cash and cash equivalents and restricted cash at end of period | $ | 140,186 | $ | 178,025 | $ | 12,567 | |||||
See notes to consolidated and combined financial statements.
46
Twelve Months Ended December 31, | |||||||||||
2016 | 2015 | 2014 | |||||||||
SUPPLEMENTAL DISCLOSURE OF CASH FLOW INFORMATION | |||||||||||
Cash payments for interest (includes amounts capitalized of $3,763, $1,856 and $0, respectively) | $ | 51,137 | $ | 52,814 | $ | 53,133 | |||||
Cash payments for income taxes | 1,277 | 1,907 | 1,342 | ||||||||
NON-CASH INVESTING AND FINANCING ACTIVITIES | |||||||||||
Accrued capital expenditures included in accounts payable and accrued expenses | 12,492 | 8,699 | 1,592 | ||||||||
Write-off of fully depreciated assets | 4,585 | 10,588 | 2,612 | ||||||||
RECONCILIATION OF CASH AND CASH EQUIVALENTS AND RESTRICTED CASH | |||||||||||
Cash and cash equivalents per consolidated balance sheet | $ | 131,654 | $ | 168,983 | $ | 2,600 | |||||
Restricted cash per consolidated balance sheet | 8,532 | 9,042 | 9,967 | ||||||||
Cash and cash equivalents and restricted cash per consolidated and combined statement of cash flow | $ | 140,186 | $ | 178,025 | $ | 12,567 | |||||
See notes to consolidated and combined financial statements.
47
URBAN EDGE PROPERTIES LP
CONSOLIDATED BALANCE SHEETS
(In thousands, except unit and per unit amounts)
December 31, | December 31, | ||||||
2016 | 2015 | ||||||
ASSETS | |||||||
Real estate, at cost: | |||||||
Land | $ | 384,217 | $ | 389,080 | |||
Buildings and improvements | 1,650,054 | 1,630,539 | |||||
Construction in progress | 99,236 | 61,147 | |||||
Furniture, fixtures and equipment | 4,993 | 3,876 | |||||
Total | 2,138,500 | 2,084,642 | |||||
Accumulated depreciation and amortization | (541,077 | ) | (509,112 | ) | |||
Real estate, net | 1,597,423 | 1,575,530 | |||||
Cash and cash equivalents | 131,654 | 168,983 | |||||
Restricted cash | 8,532 | 9,042 | |||||
Tenant and other receivables, net of allowance for doubtful accounts of $2,332 and $1,926, respectively | 9,340 | 10,364 | |||||
Receivable arising from the straight-lining of rents, net of allowance for doubtful accounts of $261 and $148, respectively | 87,695 | 88,778 | |||||
Identified intangible assets, net of accumulated amortization of $22,361 and $22,090, respectively | 30,875 | 33,953 | |||||
Deferred leasing costs, net of accumulated amortization of $13,909 and $12,987, respectively | 19,241 | 18,455 | |||||
Deferred financing costs, net of accumulated amortization of $726 and $709, respectively | 1,936 | 2,838 | |||||
Prepaid expenses and other assets | 17,442 | 10,988 | |||||
Total assets | $ | 1,904,138 | $ | 1,918,931 | |||
LIABILITIES AND EQUITY | |||||||
Liabilities: | |||||||
Mortgages payable, net | $ | 1,197,513 | $ | 1,233,983 | |||
Identified intangible liabilities, net of accumulated amortization of $72,528 and $65,220, respectively | 146,991 | 154,855 | |||||
Accounts payable and accrued expenses | 48,842 | 45,331 | |||||
Other liabilities | 14,675 | 13,308 | |||||
Total liabilities | 1,408,021 | 1,447,477 | |||||
Commitments and contingencies | |||||||
Equity: | |||||||
Partners’ capital: | |||||||
General partner: 99,754,900 and 99,290,952 units outstanding, respectively | 489,372 | 476,362 | |||||
Limited partners: 6,378,704 and 6,150,224 units outstanding, respectively | 37,081 | 35,548 | |||||
Accumulated deficit | (30,696 | ) | (40,813 | ) | |||
Total partners’ capital | 495,757 | 471,097 | |||||
Noncontrolling interest in consolidated subsidiaries | 360 | 357 | |||||
Total equity | 496,117 | 471,454 | |||||
Total liabilities and equity | $ | 1,904,138 | $ | 1,918,931 | |||
See notes to consolidated and combined financial statements.
48
URBAN EDGE PROPERTIES LP
CONSOLIDATED AND COMBINED STATEMENTS OF INCOME
(In thousands, except unit and per unit amounts)
Year Ended December 31, | |||||||||||
2016 | 2015 | 2014 | |||||||||
REVENUE | |||||||||||
Property rentals | $ | 236,798 | $ | 231,867 | 232,592 | ||||||
Tenant expense reimbursements | 84,921 | 84,617 | 81,887 | ||||||||
Management and development fees | 1,759 | 2,261 | 535 | ||||||||
Other income | 2,498 | 4,200 | 662 | ||||||||
Total revenue | 325,976 | 322,945 | 315,676 | ||||||||
EXPENSES | |||||||||||
Depreciation and amortization | 56,145 | 57,253 | 53,653 | ||||||||
Real estate taxes | 51,429 | 49,311 | 49,835 | ||||||||
Property operating | 45,280 | 50,595 | 51,988 | ||||||||
General and administrative | 27,438 | 32,044 | 17,820 | ||||||||
Ground rent | 10,047 | 10,129 | 10,304 | ||||||||
Transaction costs | 1,405 | 24,011 | 8,604 | ||||||||
Provision for doubtful accounts | 1,214 | 1,526 | 1,032 | ||||||||
Total expenses | 192,958 | 224,869 | 193,236 | ||||||||
Operating income | 133,018 | 98,076 | 122,440 | ||||||||
Gain on sale of real estate | 15,618 | — | — | ||||||||
Interest income | 679 | 150 | 35 | ||||||||
Interest and debt expense | (51,881 | ) | (55,584 | ) | (54,960 | ) | |||||
Income before income taxes | 97,434 | 42,642 | 67,515 | ||||||||
Income tax expense | (804 | ) | (1,294 | ) | (1,721 | ) | |||||
Net income | 96,630 | 41,348 | 65,794 | ||||||||
Less: net income attributable to NCI in consolidated subsidiaries | (3 | ) | (16 | ) | (22 | ) | |||||
Net income attributable to unitholders | $ | 96,627 | $ | 41,332 | $ | 65,772 | |||||
Earnings per unit - Basic: | $ | 0.91 | $ | 0.39 | $ | 0.63 | |||||
Earnings per unit - Diluted: | $ | 0.91 | $ | 0.39 | $ | 0.63 | |||||
Weighted average units outstanding - Basic | 105,455 | 105,276 | 104,965 | ||||||||
Weighted average units outstanding - Diluted | 106,099 | 105,374 | 104,965 | ||||||||
See notes to consolidated and combined financial statements.
49
URBAN EDGE PROPERTIES LP
CONSOLIDATED AND COMBINED STATEMENT OF CHANGES IN EQUITY
(In thousands, except unit and per unit amounts)
General Partner | Limited Partners(1) | Vornado Equity | Accumulated Earnings (Deficit) | NCI in Consolidated Subsidiaries | Total Equity | ||||||||||||||||||
Balance, January 1, 2014 | $ | — | $ | — | $ | 341,265 | $ | — | $ | 319 | $ | 341,584 | |||||||||||
Net income attributable to Vornado | — | — | 65,772 | — | — | 65,772 | |||||||||||||||||
Net income attributable to noncontrolling interests | — | — | — | — | 22 | 22 | |||||||||||||||||
Distributions to Vornado, net | — | — | (148,515 | ) | — | — | (148,515 | ) | |||||||||||||||
Balance, December 31, 2014 | — | — | 258,522 | — | 341 | 258,863 | |||||||||||||||||
Net income (loss) attributable to unitholders(2) | — | — | (2,022 | ) | 43,354 | — | 41,332 | ||||||||||||||||
Net income attributable to noncontrolling interests | — | — | — | — | 16 | 16 | |||||||||||||||||
Contributions from Vornado | — | — | 245,067 | — | — | 245,067 | |||||||||||||||||
Issuance of units in connection with separation | 473,918 | 27,649 | (501,567 | ) | — | — | — | ||||||||||||||||
Common units issued as a result of common shares issued by Urban Edge | 258 | — | — | (258 | ) | — | — | ||||||||||||||||
Distributions to Partners ($0.80 per unit) | — | — | — | (84,085 | ) | — | (84,085 | ) | |||||||||||||||
Share-based compensation expense | 2,186 | 7,899 | — | 176 | — | 10,261 | |||||||||||||||||
Balance, December 31, 2015 | 476,362 | 35,548 | — | (40,813 | ) | 357 | 471,454 | ||||||||||||||||
Net income attributable to unitholders | — | — | — | 96,627 | — | 96,627 | |||||||||||||||||
Net income attributable to noncontrolling interests | — | — | — | — | 3 | 3 | |||||||||||||||||
Common units issued as a result of common shares issued by Urban Edge | 9,297 | — | — | (348 | ) | — | 8,949 | ||||||||||||||||
Distributions to Partners ($0.82 per unit) | — | — | — | (86,311 | ) | — | (86,311 | ) | |||||||||||||||
Share-based compensation expense | 3,751 | 1,533 | — | 149 | — | 5,433 | |||||||||||||||||
Share-based awards retained for taxes | (38 | ) | — | — | — | — | (38 | ) | |||||||||||||||
Balance, December 31, 2016 | $ | 489,372 | $ | 37,081 | $ | — | $ | (30,696 | ) | $ | 360 | $ | 496,117 | ||||||||||
(1) Limited partners have a 6.0% common limited partnership interest in the Operating Partnership as of December 31, 2016 in the form of units of interest in the Operating Partnership (“OP Units”) and Long Term Incentive Plan (“LTIP”) units.
(2) Net loss earned from January 1, 2015 through January 15, 2015 is attributable to Vornado as it was the sole unitholder prior to January 15, 2015. Refer to Note 1 - Organization.
See notes to consolidated and combined financial statements.
50
URBAN EDGE PROPERTIES LP
CONSOLIDATED AND COMBINED STATEMENTS OF CASH FLOWS
(In thousands)
Twelve Months Ended December 31, | |||||||||||
2016 | 2015 | 2014 | |||||||||
CASH FLOWS FROM OPERATING ACTIVITIES | |||||||||||
Net income | $ | 96,630 | $ | 41,348 | $ | 65,794 | |||||
Adjustments to reconcile net income to net cash provided by operating activities: | |||||||||||
Depreciation and amortization | 57,178 | 58,299 | 54,897 | ||||||||
Amortization of deferred financing costs | 2,830 | 2,738 | 1,660 | ||||||||
Amortization of below market leases, net | (7,776 | ) | (7,907 | ) | (8,762 | ) | |||||
Straight-lining of rent | 227 | 333 | (1,559 | ) | |||||||
Share-based compensation expense | 5,433 | 10,261 | 3,878 | ||||||||
Gain on sale of real estate | (15,618 | ) | — | — | |||||||
Non-cash separation costs paid by Vornado | — | 17,403 | — | ||||||||
Provision for doubtful accounts | 1,214 | 1,526 | 1,032 | ||||||||
Change in operating assets and liabilities: | |||||||||||
Tenant and other receivables | (78 | ) | (4 | ) | (5,914 | ) | |||||
Deferred leasing costs | (3,815 | ) | (2,940 | ) | (1,963 | ) | |||||
Prepaid and other assets | 141 | (671 | ) | 767 | |||||||
Accounts payable and accrued expenses | (237 | ) | 11,300 | (4,929 | ) | ||||||
Other liabilities | 1,120 | 6,392 | 787 | ||||||||
Net cash provided by operating activities | 137,249 | 138,078 | 105,688 | ||||||||
CASH FLOWS FROM INVESTING ACTIVITIES | |||||||||||
Real estate additions | (69,901 | ) | (36,290 | ) | (39,509 | ) | |||||
Acquisition of real estate | (9,267 | ) | (30,125 | ) | (6,077 | ) | |||||
Proceeds from sale of operating properties | 19,938 | — | — | ||||||||
Net cash used in investing activities | (59,230 | ) | (66,415 | ) | (45,586 | ) | |||||
CASH FLOWS FROM FINANCING ACTIVITIES | |||||||||||
Debt repayments | (38,458 | ) | (44,654 | ) | (42,481 | ) | |||||
Contributions from Vornado | — | 227,732 | (148,786 | ) | |||||||
Distributions to partners | (86,311 | ) | (84,085 | ) | — | ||||||
Debt issuance costs | — | (5,198 | ) | (2,540 | ) | ||||||
Taxes withheld for vested restricted units | (38 | ) | — | — | |||||||
Proceeds from issuance of units | 8,949 | — | — | ||||||||
Proceeds from borrowings | — | — | 130,000 | ||||||||
Net cash (used in) provided by financing activities | (115,858 | ) | 93,795 | (63,807 | ) | ||||||
Net (decrease) increase in cash and cash equivalents and restricted cash | (37,839 | ) | 165,458 | (3,705 | ) | ||||||
Cash and cash equivalents and restricted cash at beginning of period | 178,025 | 12,567 | 16,272 | ||||||||
Cash and cash equivalents and restricted cash at end of period | $ | 140,186 | $ | 178,025 | $ | 12,567 | |||||
SUPPLEMENTAL DISCLOSURE OF CASH FLOW INFORMATION | |||||||||||
Cash payments for interest (includes amounts capitalized of $3,763, $1,856 and $0, respectively) | $ | 51,137 | $ | 52,814 | $ | 53,133 | |||||
Cash payments for income taxes | 1,277 | 1,907 | 1,342 | ||||||||
NON-CASH INVESTING AND FINANCING ACTIVITIES | |||||||||||
Accrued capital expenditures included in accounts payable and accrued expenses | 12,492 | 8,699 | 1,592 | ||||||||
Write-off of fully depreciated assets | 4,585 | 10,588 | 2,612 | ||||||||
RECONCILIATION OF CASH AND CASH EQUIVALENTS AND RESTRICTED CASH | |||||||||||
Cash and cash equivalents per consolidated balance sheet | $ | 131,654 | $ | 168,983 | $ | 2,600 | |||||
Restricted cash per consolidated balance sheet | 8,532 | 9,042 | 9,967 | ||||||||
Cash and cash equivalents and restricted cash per consolidated and combined statement of cash flow | $ | 140,186 | $ | 178,025 | $ | 12,567 | |||||
See notes to consolidated and combined financial statements.
51
URBAN EDGE PROPERTIES AND URBAN EDGE PROPERTIES LP
NOTES TO CONSOLIDATED AND COMBINED FINANCIAL STATEMENTS
1. | ORGANIZATION |
Urban Edge Properties (“UE”, “Urban Edge” or the “Company”) (NYSE: UE) is a Maryland real estate investment trust that owns, manages, acquires, develops, redevelops and operates retail real estate in high barrier-to-entry markets. Urban Edge Properties LP (“UELP” or the “Operating Partnership”) is a Delaware limited partnership formed to serve as the Company’s majority-owned partnership subsidiary and to own, through affiliates, all of the Company’s real estate properties and other assets. Prior to its separation on January 15, 2015, UE was a wholly owned subsidiary of Vornado Realty Trust (“Vornado”) (NYSE: VNO). UE and UELP were created to own the majority of Vornado’s former shopping center business. Prior to the separation, the portfolio is referred to as “UE Businesses.” Unless the context otherwise requires, references to “we”, “us” and “our” refer to Urban Edge Properties and UELP and their consolidated entities/subsidiaries after giving effect to the transfer of assets and liabilities from Vornado as well as to UE Businesses prior to the date of the separation.
Pursuant to a separation and distribution agreement between UE and Vornado (the “Separation Agreement”), the interests in certain properties held by Vornado’s operating partnership, Vornado Realty L.P. (“VRLP”), were contributed or otherwise transferred to UE in exchange for 100% of our outstanding common shares. Following that contribution, VRLP distributed 100% of our outstanding common shares to Vornado and the other common limited partners of VRLP, pro rata with respect to their ownership of common limited partnership units in VRLP. Vornado then distributed all of the UE common shares it had received from VRLP to Vornado common shareholders on a pro rata basis. As a result, VRLP common limited partners and Vornado common shareholders all received common shares of UE in the spin-off at a ratio of one common share of UE to every two VRLP common units and every two common shares of Vornado.
Substantially concurrently with such distribution, the interests in certain properties held by VRLP, including interests in entities holding properties, were contributed or otherwise transferred to UELP in exchange for 5.4% of UELP’s outstanding common limited partnership interests in the Operating Partnership (“OP Units”).
The Operating Partnership’s capital includes OP Units. As of December 31, 2016, Urban Edge owned approximately 94.0% of the outstanding common OP Units with the remaining limited OP Units held by VRLP, and members of management and our Board of Trustees. Urban Edge serves as the sole general partner of the Operating Partnership. The third party unitholders have limited rights over the Operating Partnership such that they do not have characteristics of a controlling financial interest. As such, the Operating Partnership is considered a variable interest entity (“VIE”), and the Company is the primary beneficiary which consolidates it. The Company’s only investment is the Operating Partnership.
As part of the separation, Vornado capitalized UE with $225 million of cash. Vornado also paid $21.9 million of the transaction costs incurred in connection with the separation, which is reflected within non-cash separation costs paid by Vornado within the statement of cash flows. Of the $21.9 million transaction costs, $17.4 million were contingent on the completion of the separation. The remaining $4.5 million of transaction costs were allocated to Vornado on the separation date.
As of December 31, 2016 our portfolio consisted of 79 shopping centers, three malls and a warehouse park totaling 14.8 million square feet.
2. | BASIS OF PRESENTATION AND PRINCIPLES OF CONSOLIDATION AND COMBINATION |
The accompanying consolidated and combined financial statements have been prepared in accordance with accounting principles generally accepted in the United States of America (“GAAP”) for annual financial information and with the instructions of Form 10-K. The consolidated financial statements as of and for the year ended December 31, 2016 reflect the consolidation of the Company, the Operating Partnership, wholly-owned subsidiaries and those entities in which we have a controlling financial interest, including entities where we have been determined to be a primary beneficiary of a variable interest entity (“VIE”).
The results presented for the year ended December 31, 2015 reflect the operations and changes in cash flows on a carved-out and combined basis for the period from January 1, 2015 through the date of separation and on a consolidated basis subsequent to the date of separation. The financial statements for the periods prior to the separation date are prepared on a carved-out and combined basis from the consolidated financial statements of Vornado as UE Businesses were under common control of Vornado prior to January 15, 2015. Such carved-out and combined amounts were determined using the historical results of operations and carrying amounts of the assets and liabilities transferred to UE Businesses. The financial statements reflect the common shares as of the date of the separation as outstanding for all periods prior to the separation. All intercompany transactions have been eliminated in consolidation and combination.
52
For periods presented prior to the date of the separation, our historical combined financial results for UE Businesses reflect charges for certain corporate costs which we believe are reasonable. These charges were based on either actual costs incurred by Vornado or a proportion of costs estimated to be applicable to UE Businesses based on an analysis of key metrics including total revenues, real estate assets, leasable square feet and operating income. Such costs do not necessarily reflect what the actual costs would have been if the Company were operating as a separate stand-alone public company. These charges are discussed further in Note 5 — Related Party Transactions.
Our primary business is the ownership, management, redevelopment, development and operation of retail shopping centers. We do not distinguish our primary business or group our operations on a geographical basis for purposes of measuring performance. We review operating and financial information for each property on an individual basis and therefore, each property represents an individual operating segment. None of our tenants accounted for more than 10% of our revenue or property operating income. We aggregate all of our properties into one reportable segment due to their similarities with regard to the nature and economics of the properties, tenants and operations, as well as long-term average financial performance.
3. SUMMARY OF SIGNIFICANT ACCOUNTING POLICIES
Use of Estimates — The preparation of financial statements in conformity with GAAP requires management to make estimates and assumptions that affect the reported amount of assets and liabilities and disclosure of contingent assets and liabilities at the date of the financial statements and the reported amounts of revenue and expenses during the reporting period. Actual results could differ from those estimates.
Real Estate — Real estate is carried at cost, net of accumulated depreciation and amortization. Expenditures for ordinary maintenance and repairs are expensed to operations as they are incurred. Significant renovations and improvements that improve or extend the useful lives of assets are capitalized. As real estate is undergoing redevelopment activities, all property operating expenses directly associated with and attributable to the redevelopment, including interest, are capitalized to the extent the capitalized costs of the property do not exceed the estimated fair value of the redeveloped property when completed. If the cost of the redeveloped property, including the net book value of the existing property, exceeds the estimated fair value of redeveloped property, the excess is charged to impairment expense. We capitalize all property operating expenses directly associated with and attributable to the development of a project, including interest expense. The capitalization period begins when redevelopment activities are underway and ends when the project is substantially complete. Depreciation is recognized on a straight-line basis over estimated useful lives which range from 3 to 40 years. Tenant related intangibles and improvements are amortized on a straight-line basis over the lease term, including any bargain renewal options.
Upon the acquisition of real estate, we assess the fair value of acquired assets (including land, buildings and improvements, identified intangibles, such as acquired above and below-market leases, acquired in-place leases and tenant relationships) and acquired liabilities and we allocate the purchase price based on these assessments. We assess fair value based on estimated cash flow projections utilizing appropriate discount and capitalization rates and available market information. Estimates of future cash flows are based on a number of factors including historical operating results, known trends, and market/economic conditions. We record acquired intangible assets (including acquired above-market leases, acquired in-place leases and tenant relationships) and acquired intangible liabilities (including below-market leases) at their estimated fair value separate and apart from goodwill. We amortize identified intangibles that have finite lives over the period they are expected to contribute directly or indirectly to the future cash flows of the property or business acquired.
Our properties are individually reviewed for impairment whenever events or changes in circumstances indicate that the carrying amount may not be recoverable. An impairment exists when the carrying amount of an asset exceeds the aggregate projected future cash flows over the anticipated holding period on an undiscounted basis. An impairment loss is measured based on the excess of the property’s carrying amount over its estimated fair value. Impairment analyses are based on our current plans, intended holding periods and available market information at the time the analyses are prepared. If our estimates of the projected future cash flows, anticipated holding periods, or market conditions change, our evaluation of impairment losses may be different and such differences could be material to our consolidated and combined financial statements. The evaluation of anticipated cash flows is subjective and is based, in part, on assumptions regarding future occupancy, rental rates and capital requirements that could differ materially from actual results. Plans to hold properties over longer periods decrease the likelihood of recording impairment losses.
Cash and Cash Equivalents — Cash and cash equivalents consist of highly liquid investments with original maturities of three months or less and are carried at cost, which approximates fair value due to their short-term maturities. The majority of our cash and cash equivalents consists of (i) deposits at major commercial banks, which may at times exceed the Federal Deposit Insurance Corporation limit and (ii) United States Treasury Bills. To date we have not experienced any losses on our invested cash.
53
Restricted Cash — Restricted cash consists of security deposits and cash escrowed under loan agreements for debt service, real estate taxes, property insurance, tenant improvements, leasing commissions and capital expenditures.
Accounts Receivable and Allowance for Doubtful Accounts — Accounts receivable includes unpaid amounts billed to tenants and accrued revenues for future billings to tenants for property expenses. We periodically evaluate the collectibility of amounts due from tenants and maintain an allowance for doubtful accounts for estimated losses resulting from the inability of tenants to make required payments under the lease agreements. We also maintain an allowance for receivables arising from the straight-lining of rents. These receivables arise from earnings recognized in excess of amounts currently due under the lease agreements. Management exercises judgment in establishing these allowances and considers payment history and current credit status in developing these estimates. Accounts receivable are written-off when they are deemed to be uncollectible and we are no longer actively pursuing collection.
Deferred Leasing Costs — Deferred leasing costs include direct salaries, third-party fees and other costs incurred by us to originate a lease. Such costs are capitalized and amortized on a straight-line basis over the term of the related leases.
Deferred Financing Costs — Deferred financing costs include fees associated with our revolving credit agreement. Such fees are amortized on a straight-line basis over the terms of the related revolving credit agreement as a component of interest expense, which approximates the effective interest rate method, in accordance with the terms of the agreement. No amounts have been drawn to date under the agreement.
Revenue Recognition — We have the following revenue sources and revenue recognition policies:
• | Base Rent - income arising from minimum lease payments from tenant leases. These rents are recognized over the non-cancelable term of the related leases on a straight-line basis which includes the effects of rent steps and rent abatements under the leases. We commence rental revenue recognition when the tenant takes possession of the leased space and the leased space is substantially ready for its intended use. In addition, in circumstances where we provide a lease incentive to tenants, we recognize the incentive as a reduction of rental revenue on a straight-line basis over the term of the lease. |
• | Percentage Rent - income arising from retail tenant leases that is contingent upon tenant sales exceeding defined thresholds. These rents are recognized only after the contingency has been removed (i.e., when tenant sales thresholds have been achieved). |
• | Expense Reimbursements - revenue arising from tenant leases which provide for the recovery of all or a portion of the operating expenses, real estate taxes and capital improvements of the respective property. This revenue is accrued in the same periods as the expenses are incurred. |
• | Management, Leasing and Other Fees - income arising from contractual agreements with third parties. This revenue is recognized as the related services are performed under the respective agreements. |
Noncontrolling Interests — Noncontrolling interests represent the portion of equity that we do not own in those entities that we consolidate. We identify our noncontrolling interests separately within the equity section on the consolidated balance sheets.
Redeemable Noncontrolling Interests — Redeemable noncontrolling interests include OP units and limited partnership interests in the Operating Partnership in the form of long-term incentive plan (“LTIP”) unit awards.
Variable Interest Entities - Certain entities that do not have sufficient equity at risk for the entity to finance its activities without additional subordinated financial support from other parties or in which equity investors do not have the characteristics of a controlling financial interest qualify as VIEs. VIEs are required to be consolidated by their primary beneficiary. The primary beneficiary of a VIE has both the power to direct the activities that most significantly impact economic performance of the VIE and the obligation to absorb losses or the right to receive benefits that could potentially be significant to the VIE. The consolidated and combined financial statements reflect the consolidation of VIEs in which the Company is the primary beneficiary.
Earnings Per Share and Unit — Basic earnings per common share and unit is computed by dividing net income attributable to common shareholders and unitholders by the weighted average common shares and units outstanding during the period. Unvested share-based payment awards that entitle holders to receive non-forfeitable dividends, such as our restricted stock awards, are classified as “participating securities.” Because the awards are considered participating securities, the Company and the Operating Partnership are required to apply the two-class method of computing basic and diluted earnings that would otherwise have been available to common shareholders and unitholders. Under the two-class method, earnings for the period are allocated between common shareholders and unitholders and other shareholders and unitholders, based on their respective rights to receive dividends.
54
During periods of net loss, losses are allocated only to the extent the participating securities are required to absorb their share of such losses. Diluted earnings per common share and unit reflects the potential dilution of the assumed exercises of shares including stock options and unvested restricted shares to the extent they are dilutive.
Share-Based Compensation — We grant stock options, LTIP units, OP units, restricted share awards and performance-based units to our officers, trustees and employees. The term of each award is determined by the compensation committee of our Board of Trustees (the “Compensation Committee”), but in no event can such term be longer than ten years from the date of grant. The vesting schedule of each award is determined by the Compensation Committee, in its sole and absolute discretion, at the date of grant of the award. Dividends are paid on certain shares of unvested restricted stock, which makes the restricted stock a participating security.
Fair value is determined, depending on the type of award, using either the Black-Scholes option-pricing model or the Monte Carlo method, both of which are intended to estimate the fair value of the awards at the grant date. In using the Black-Scholes option-pricing model, expected volatilities and dividend yields are primarily based on available implied data and peer group companies historical data. The risk-free interest rate is based on the U.S. Treasury yield curve in effect at the time of grant.
Compensation expense for restricted share awards is based on the fair value of our common shares at the date of the grant and is recognized ratably over the vesting period. For grants with a graded vesting schedule or a cliff vesting schedule, we have elected to recognize compensation expense on a straight-line basis. Also included in Share-based compensation expense is the unrecognized compensation expense of awards issued under Vornado’s outperformance plan (“OPP”) prior to the separation for the Company’s employees who were previously Vornado employees. The OPP unrecognized compensation expense is recognized on a straight-line basis over the remaining life of the OPP awards issued. Share-based compensation expense is included in general and administrative expenses on the consolidated and combined statements of income.
When the Company issues common shares as compensation, it receives a like number of common units from the Operating Partnership. Accordingly, the Company’s ownership in the Operating Partnership will increase based on the number of common shares awarded under our 2015 Omnibus Share Plan. As a result of the issuance of common units to the Company for share-based compensation, the Operating Partnership accounts for share-based compensation in the same manner as the Company.
Income Taxes — Our two Puerto Rico malls are subject to income taxes which are based on estimated taxable income and are included in income tax expense in the consolidated and combined statements of income. Income taxes are accounted for under the asset and liability method. Deferred tax assets and liabilities are recognized for the estimated tax consequences attributable to differences between the financial statement carrying amounts of existing assets and liabilities and their respective tax basis. Deferred tax assets and liabilities are measured using the enacted tax rates in effect for the year in which these temporary differences are expected to be recovered or settled. Earnings and profits, which determine the taxability of dividends to shareholders, differs from net income reported for financial reporting purposes primarily because of differences in depreciable lives and cost bases of the malls, as well as other timing differences.
Concentration of Credit Risk — A concentration of credit risk arises in our business when a national or regionally-based tenant occupies a substantial amount of space in multiple properties owned by us. In that event, if the tenant suffers a significant downturn in its business, it may become unable to make its contractual rent payments to us, exposing us to potential losses in rental revenue, expense recoveries, and percentage rent. Further, the impact may be magnified if the tenant is renting space in multiple locations. Generally, we do not obtain security from our national or regionally-based tenants in support of their lease obligations to us. We regularly monitor our tenant base to assess potential concentrations of credit risk. None of our tenants accounted for more than 10% of total revenues in the year ended December 31, 2016. As of December 31, 2016, The Home Depot was our largest tenant with 7 stores which comprised an aggregate of 920,000 square-feet and accounted for approximately $20.2 million, or 6.2% of our total revenue for the year ended December 31, 2016.
Recently Issued Accounting Literature
In January 2017, the FASB issued an update (“ASU 2017-01”) Clarifying the Definition of a Business, which introduces amendments that are intended to make the guidance on the definition of a business more consistent and cost-efficient. The objective of the update is to add further guidance that assists entities in evaluating whether a transaction will be accounted for as an acquisition of an asset or a business by providing a screen to determine when the set of assets and activities acquired is not a business. ASU 2017-01 is effective for annual periods beginning after December 15, 2017, with early adoption permitted. Early adoption is permitted as of the beginning of a reporting period for which financial statements have not yet been issued. The ASU must be applied prospectively on or after the effective date. The adoption of this standard will result in less real estate acquisitions qualifying as businesses and, accordingly, acquisition costs for those acquisitions that are not businesses will be capitalized rather than expensed.
55
In November 2016, the FASB issued an update (“ASU 2016-18”) Statement of Cash Flows - Restricted Cash, that requires entities to show the changes in the total of cash, cash equivalents, restricted cash and restricted cash equivalents in the statement of cash flows. As a result, entities will no longer present transfers between cash and cash equivalents and restricted cash and restricted cash equivalents in the statement of cash flows. ASU 2016-18 is effective for annual periods beginning after December 15, 2017, with early adoption permitted. We elected to early adopt ASU 2016-18 including retrospective adoption for all prior periods. The impact of the adoption of ASU 2016-18 is the addition of a reconciliation of the totals in the statement of cash flows to the related captions in the balance sheet.
In August 2016, the FASB issued an update (“ASU 2016-15”) Statement of Cash Flows - Classification of Certain Cash Receipts and Cash Payments, which addresses specific cash flow classification issues where there is currently diversity in practice including debt prepayment and proceeds from the settlement of insurance claims. ASU 2016-15 is effective for annual periods beginning after December 15, 2017, with early adoption permitted. We elected to early adopt ASU 2016-15 effective as of September 30, 2016. The adoption of ASU 2016-15 did not impact our results of operations or cash flows.
In June 2016, the FASB issued an update (“ASU 2016-13”) Measurement of Credit Losses on Financial Instruments, which replaces the incurred impairment methodology in current GAAP with a methodology that reflects expected credit losses. The update is intended to provide financial statement users with more decision-useful information about the expected credit losses on financial instruments and other commitments to extend credit held by a reporting entity at each reporting date. ASU 2016-13 is effective for annual periods beginning after December 15, 2019, with early adoption permitted for annual periods beginning after December 15, 2018. We are evaluating the impact this standard will have on our consolidated and combined financial statements.
In February 2016, the FASB issued an update (“ASU 2016-02”) Leases, which revises the accounting related to lease accounting. Under the new guidance, lessees will be required to recognize a lease liability and a right-of-use asset for all leases with terms greater than 12 months. Leases will be classified as either finance or operating, with classification affecting the pattern of expense recognition in the income statement. The provisions of ASU 2016-02 are effective for fiscal years beginning after December 15, 2018 and should be applied through a modified retrospective transition approach for leases existing at, or entered into after, the beginning of the earliest comparative period presented in the financial statements. Early adoption is permitted. We elected the modified retrospective transition approach and expects to adopt the standard beginning January 1, 2019. This standard will impact our consolidated financial statements by the recording of right-of-use assets and lease liabilities on our consolidated balance sheets for operating and finance leases where we are the lessee. In addition, leases where we are the lessor that meet the criteria of a finance lease will be amortized using the effective interest method with corresponding charges to interest expense and amortization expense. Leases where we are the lessor that meet the criteria of an operating lease will continue to be amortized on a straight-line basis. Lastly, internal leasing department overhead previously capitalized will be expensed.
In April 2015, the FASB issued an update (“ASU 2015-03”) Simplifying the Presentation of Debt Issuance Costs to ASC Topic 835-30 Interest - Imputation of Interest. ASU 2015-03 requires that debt issuance costs related to a recognized debt liability be presented in the balance sheet as a direct deduction from that debt liability, consistent with the presentation of a debt discount. The recognition and measurement guidance for debt issuance costs is not affected by the amendments in ASU 2015-03. ASU 2015-03 is effective for public business entities for financial statements issued for fiscal years beginning after December 15, 2015 with early adoption permitted. We elected to early adopt ASU 2015-03 effective as of December 31, 2015. The effect of ASU 2015-03 was to reclassify the net unamortized balance of debt issuance costs of $10.0 million as of December 31, 2015 from deferred financing costs to a contra liability deduction of mortgages payable. Mortgages payable as of December 31, 2016 are presented net of $8.0 million of unamortized debt issuance costs. The adoption of ASU 2015-03 did not impact our results of operations or cash flows.
In February 2015, the FASB issued an update (“ASU 2015-02”) Amendments to the Consolidation Analysis to ASC Topic 810 Consolidation. Under amendments in this update, all reporting entities are within the scope of Subtopic 810-10 Consolidation - Overall, including limited partnerships and similar legal entities, unless a scope exception applies. The presumption that a general partner controls a limited partnership has been eliminated. Overall the amendments in this update are to simplify the codification and reduce the number of consolidation models and place more emphasis on risk of loss when determining controlling financial interests. ASU 2015-02 is effective for public businesses for interim and annual periods beginning after December 15, 2015. We adopted ASU 2015-02 as of March 31, 2016. Under ASU 2015-02 the Company’s Operating Partnership is considered a variable interest entity (“VIE”). The Company is the primary beneficiary of the VIE, the VIE’s assets can be used for purposes other than the settlement of the VIE’s obligations and the Company’s partnership interest is considered a majority voting interest. The Operating Partnership was formed to serve as the Company’s majority-owned partnership subsidiary and to own, through affiliates, all of the Company’s real estate properties and other assets. The Company consolidates the Operating Partnership as it is the primary beneficiary of the VIE.
56
In May 2014, the FASB issued an update (“ASU 2014-09”) Revenue from Contracts with Customers to ASC Topic 606, which supersedes the revenue recognition requirements in ASC Topic 605, Revenue Recognition. ASU 2014-09 requires additional disclosure about the nature, amount, timing and uncertainty of revenue and cash flows arising from customer contracts, including significant judgments and changes in judgments and assets recognized from costs incurred to obtain or fulfill a contract. During the year ended December 31, 2016, the FASB issued the following updates to ASC Topic 606 to clarify and/or amend the guidance in ASU 2014-09: (i) ASU 2016-08 Principal versus Agent Considerations (Reporting Revenue Gross versus Net), which clarifies the implementation guidance on principal versus agent considerations, (ii) ASU 2016-10 Identifying Performance Obligations and Licensing, which clarifies guidance related to identifying performance obligations and licensing implementation guidance and (iii) ASU 2016-12 Narrow-Scope Improvements and Practical Expedients, which amends certain aspects of ASU 2014-09. In August 2015, the FASB issued an update (“ASU 2015-09”) Revenue from Contracts with Customers to ASC Topic 606, which defers the effective date of ASU 2014-09 for all entities by one year. ASU 2015-09 is effective beginning after December 15, 2017, including interim reporting periods within that reporting period. Early adoption is permitted only for annual reporting periods beginning after December 15, 2016, including interim reporting periods within that reporting period. We are permitted to use either the modified retrospective or the retrospective method for adopting this standard. We are currently evaluating the impact of the adoption on our consolidated and combined financial statements including gain recognition on real estate sales and the presentation of tenant reimbursement income.
4. | ACQUISITIONS AND DISPOSITIONS |
During the year ended December 31, 2016, we purchased land that is the site of a future 2,000 sf Popeye’s for $2.7 million. During the year ended December 31, 2015, we acquired three properties with existing leases. All acquisitions have been accounted for as business combinations. The purchase prices were allocated to the acquired assets based on their estimated fair values at date of acquisition.
The following table provides a summary of acquisition activity in 2016 and 2015:
Date Purchased | Property Name | City | State | Square Feet/Acres | Purchase Price | |||||||||
(unaudited) | (in thousands) | |||||||||||||
April 29, 2015 | Bergen Town Center - outparcel | Paramus | NJ | 0.8 | (1) | $ | 2,750 | |||||||
June 29, 2015 | Lawnside - outparcel | Lawnside | NJ | 2,000 | 375 | |||||||||
December 23, 2015 | Cross Bay Commons | Queens | NY | 46,000 | 27,000 | |||||||||
2015 Total | 30,125 | |||||||||||||
December 22, 2016 | North Bergen - outparcel | North Bergen | NJ | 0.3 | (1) | 2,667 | ||||||||
2016 Total | $ | 2,667 | ||||||||||||
(1) In acres.
The aggregate purchase price of the above property acquisitions have been allocated as follows:
Amount | |||||||
(Amounts in thousands) | 2016 | 2015 | |||||
Land | $ | 2,667 | $ | 17,145 | |||
Buildings and improvements | — | 12,821 | |||||
Identified intangible assets | — | 1,760 | |||||
Deferred leasing costs | — | 594 | |||||
Identified intangible liabilities | — | (2,195 | ) | ||||
$ | 2,667 | $ | 30,125 | ||||
We expensed approximately $1.2 million of transaction-related costs in connection with completed or pending property acquisitions that were closed subsequent to December 31, 2016 which are included in Transaction costs in the consolidated and combined statements of operations.
In conjunction with the acquisition of Cross Bay Commons on December 23, 2015, we entered into a reverse like-kind exchange agreement under Section 1031 of the Internal Revenue Code with a third party intermediary. The exchange agreement was for a maximum of 180 days and allowed us, for tax purposes, to defer gains on the sale of other properties sold within 180 days after the acquisition date.
57
On June 9, 2016, we completed the sale of a shopping center located in Waterbury, CT. The sales price of this property of $21.6 million, less costs to sell, resulted in net proceeds of $19.9 million. Accordingly, we recorded a gain on sale of $15.6 million. The sale completed the reverse Section 1031 tax deferred exchange transaction with the acquisition of Cross Bay Commons.
From December 23, 2015 to June 9, 2016, a third party intermediary was the legal owner of Cross Bay Commons, although we controlled the activities that most significantly impacted the property and retained all of the economic benefits and risks associated with it, and therefore we concluded it was a VIE and we were the primary beneficiary of the VIE. Accordingly, effective December 23, 2015, we consolidated Cross Bay Commons and its operations even during the period it was held by a third party intermediary. The consolidated balance sheets included total assets and liabilities of Cross Bay Commons of $29.5 million and $2.5 million, respectively, as of December 31, 2015.
Refer to Note 19 - Subsequent Events for acquisitions closed subsequent to December 31, 2016.
5. RELATED PARTY TRANSACTIONS
In connection with the separation, the Company and Vornado entered into a transition services agreement under which Vornado provided transition services to the Company including human resources, information technology, risk management, tax services and office space and support. The fees charged to us by Vornado for those transition services approximated the actual cost incurred by Vornado in providing such services. On June 28, 2016, the Company executed an amendment to the transition services agreement, extending Vornado’s provision of information technology, risk management services and the portion of the human resources service related to health and benefits through July 31, 2018, unless terminated earlier. Fees for these services remain the same except that they may be adjusted for inflation. As of December 31, 2016 there were no amounts due to Vornado related to such services.
During the twelve months ended December 31, 2016 and 2015 there were $1.7 million and $2.4 million of costs paid to Vornado included in general and administrative expenses, respectively, which consisted of $0.9 million and $0.4 million of rent expense for two of our office locations and $0.8 million and $2.0 million of transition services fees, respectively.
Management and Development Fees
In connection with the separation, the Company and Vornado entered into a property management agreement under which the Company provides management, development, leasing and other services to certain properties owned by Vornado and its affiliates, including Interstate Properties (“Interstate”) and Alexander’s, Inc. (NYSE:ALX). Interstate is a general partnership that owns retail properties in which Steven Roth, Chairman of Vornado’s Board and Chief Executive Officer of Vornado, and a member of our Board of Trustees, is the managing general partner. Interstate and its partners beneficially owned an aggregate of approximately 7.1% of the common shares of beneficial interest of Vornado as of December 31, 2016. As of the year ended December 31, 2016, Vornado owned 32.4% of Alexander’s, Inc. During the twelve months ended December 31, 2016, 2015, and 2014 we recognized management and development fee income of $1.8 million, $2.3 million, and $0.5 million respectively. As of December 31, 2016 and December 31, 2015, there were $0.3 million and $0.7 million of fees, respectively, due from Vornado included in tenant and other receivables in our consolidated balance sheets.
58
6. IDENTIFIED INTANGIBLE ASSETS AND LIABILITIES
The following table summarizes our identified intangible assets and liabilities:
(Amounts in thousands) | December 31, 2016 | December 31, 2015 | |||||
In-place leases | $ | 29,065 | $ | 31,872 | |||
Accumulated amortization | (12,244 | ) | (13,032 | ) | |||
Below-market ground leases(1) | 23,730 | 23,730 | |||||
Accumulated amortization | (9,847 | ) | (8,875 | ) | |||
Above-market leases | 441 | 441 | |||||
Accumulated amortization | (270 | ) | (183 | ) | |||
Identified intangible assets, net of accumulated amortization | 30,875 | 33,953 | |||||
Below-market leases | 219,519 | 220,075 | |||||
Accumulated amortization | (72,528 | ) | (65,220 | ) | |||
Identified intangible liabilities, net of accumulated amortization | $ | 146,991 | $ | 154,855 | |||
(1) Intangible assets related to below-market leases where the Company is a lessee under a ground lease.
Amortization of acquired below-market leases, net of acquired above-market leases resulted in additional rental income of $7.8 million, $7.9 million and $8.8 million for the years ended December 31, 2016, 2015 and 2014, respectively.
Amortization of acquired in-place leases and customer relationships resulted in additional depreciation and amortization expense of $2.0 million, $1.5 million and $1.6 million for the years ended December 31, 2016, 2015 and 2014, respectively.
Certain shopping centers were acquired subject to ground leases or ground and building leases. Amortization of these acquired below-market leases resulted in additional rent expense of $1.0 million in each of the years ended December 31, 2016, 2015 and 2014.
The following table sets forth the estimated annual amortization related to intangible assets and liabilities for the five succeeding years commencing January 1, 2017:
(Amounts in thousands) | Below-Market | Below-Market | ||||||||||
Year | Operating Leases(1)(3) | In-Place Leases(2) | Ground Leases(4) | |||||||||
2017 | $ | 7,419 | $ | 1,482 | $ | 972 | ||||||
2018 | 7,198 | 1,300 | 972 | |||||||||
2019 | 7,175 | 1,179 | 972 | |||||||||
2020 | 7,182 | 1,136 | 972 | |||||||||
2021 | 7,153 | 1,037 | 622 | |||||||||
(1) Estimated annual amortization of acquired below-market leases, net of acquired above-market leases.
(2) Estimated annual amortization of acquired in-place leases and customer relationships.
(3) The annual amortization of the below-market intangible liabilities in the table above includes $1.6 million associated with our ground lease for the Shops at Bruckner which was sold subsequent to December 31, 2016. Refer to Note 19 - Subsequent Events for further information.
(4) Estimated annual amortization of below-market leases where the Company is a lessee under a ground lease.
59
7. MORTGAGES PAYABLE
The following is a summary of mortgages payable as of December 31, 2016 and December 31, 2015.
Interest Rate at | December 31, | December 31, | ||||||||||
(Amounts in thousands) | Maturity | December 31, 2016 | 2016 | 2015 | ||||||||
Cross collateralized mortgage loan: | ||||||||||||
Fixed Rate | 9/10/2020 | 4.36% | $ | 519,125 | $ | 533,459 | ||||||
Variable Rate(1) | 9/10/2020 | 2.36% | 38,756 | 60,000 | ||||||||
Total cross collateralized | 557,881 | 593,459 | ||||||||||
First mortgages secured by: | ||||||||||||
North Bergen (Tonnelle Avenue) | 1/9/2018 | 4.59% | 73,951 | 75,000 | ||||||||
Englewood(3) | 10/1/2018 | 6.22% | 11,537 | 11,537 | ||||||||
Montehiedra Town Center, Senior Loan(2)(4) | 7/6/2021 | 5.33% | 87,308 | 88,676 | ||||||||
Montehiedra Town Center, Junior Loan(2) | 7/6/2021 | 3.00% | 30,000 | 30,000 | ||||||||
Bergen Town Center | 4/8/2023 | 3.56% | 300,000 | 300,000 | ||||||||
Las Catalinas | 8/6/2024 | 4.43% | 130,000 | 130,000 | ||||||||
Mount Kisco (Target)(5) | 11/15/2034 | 6.40% | 14,883 | 15,285 | ||||||||
Total mortgages payable | 1,205,560 | 1,243,957 | ||||||||||
Unamortized debt issuance costs | (8,047 | ) | (9,974 | ) | ||||||||
Total mortgages payable, net of unamortized debt issuance costs | $ | 1,197,513 | $ | 1,233,983 | ||||||||
(1) | Subject to a LIBOR floor of 1.00%, bears interest at LIBOR plus 136 bps. In June 2016, in connection with the sale of our property in Waterbury, CT, we prepaid $21.2 million of the variable rate portion of our cross collateralized mortgage loan to maintain compliance with covenant requirements. |
(2) | On January 6, 2015, we completed the modification of the $120.0 million, 6.04% mortgage loan secured by Montehiedra Town Center. Refer to “Troubled Debt Restructuring” disclosure below. |
(3) | On March 30, 2015, we notified the lender that due to tenants vacating, the property’s operating cash flow would be insufficient to pay its debt service. As of December 31, 2016 we were in default and the property was transferred to receivership. Urban Edge no longer manages the property but will remain its title owner until the receiver disposes of the property. We have determined this property is held in a VIE for which we are the primary beneficiary. Accordingly, as of December 31, 2016 we consolidated Englewood and its operations. The consolidated balance sheet included total assets and liabilities of $12.4 million and $14.2 million, respectively. |
(4) | The mortgage payable balance secured by Montehiedra was presented net of unamortized fees of $1.7 million as of December 31, 2015 in our Form 10-K as filed with SEC for Urban Edge Properties. The net unamortized fees of $1.7 million were revised to be presented with the unamortized debt issuance costs. |
(5) | The mortgage payable balance on the loan secured by Mt. Kisco (Target) includes $1.1 million of unamortized debt discount as of December 31, 2016 and December 31, 2015. The effective interest rate including amortization of the debt discount is 7.26% as of December 31, 2016. |
The net carrying amount of real estate collateralizing the above indebtedness amounted to approximately $859.2 million as of December 31, 2016. Our mortgage loans contain covenants that limit our ability to incur additional indebtedness on these properties and in certain circumstances, require lender approval of tenant leases and/or yield maintenance upon repayment prior to maturity. Our property in Waterbury, CT was held as collateral in our cross collateralized mortgage loan. In connection with the sale of our property in Waterbury, CT on June 9, 2016, we prepaid $21.2 million of the variable rate component of our cross collateralized mortgage loan in order to maintain compliance with covenant requirements. As of December 31, 2016, we were in compliance with all debt covenants.
As of December 31, 2016, the principal repayments for the next five years and thereafter are as follows:
(Amounts in thousands) | |||
Year Ending December 31, | |||
2017 | 17,120 | ||
2018 | 99,708 | ||
2019 | 17,320 | ||
2020 | 513,870 | ||
2021 | 120,048 | ||
Thereafter | 437,494 | ||
60
On January 15, 2015, we entered into a $500 million Revolving Credit Agreement (the “Agreement”) with certain financial institutions. The Agreement has a four-year term with two six-month extension options. Borrowings under the Agreement are subject to interest at LIBOR plus 1.15% and we are required to pay an annual facility fee of 20 basis points which is expensed as incurred. Both the spread over LIBOR and the facility fee are based on our current leverage ratio and are subject to increase if our leverage ratio increases above predefined thresholds. The Agreement contains customary financial covenants including a maximum leverage ratio of 60% and a minimum fixed charge coverage ratio of 1.5x. No amounts have been drawn to date under the Agreement. Financing fees associated with the Agreement of $1.9 million and $2.8 million as of December 31, 2016 and December 31, 2015, respectively, are included in deferred financing fees in the consolidated balance sheets.
Troubled Debt Restructuring
During the year ended December 31, 2014, Montehiedra Town Center (“Montehiedra”), our property in the San Juan area of Puerto Rico, was experiencing financial difficulties which resulted in a substantial decline in its net operating cash flows. As such, we transferred the mortgage loan secured by Montehiedra to the special servicer and discussed restructuring the terms of the mortgage loan. In January 2015 we completed the modification of the $120.0 million, 6.04% mortgage loan. The loan was extended from July 2016 to July 2021 and separated into two tranches, a senior $90.0 million position with interest at 5.33% to be paid currently and a junior $30.0 million position with interest accruing at 3.0%. As part of the planned redevelopment of the property, we committed to fund $20.0 million through an intercompany loan for leasing and capital expenditures of which $16.9 million has been funded as of December 31, 2016. This $20.0 million intercompany loan is senior to the $30.0 million mortgage position noted above and accrues interest at 10%. Both the intercompany loan and related interest are eliminated in our consolidated and combined financial statements. We incurred $2.0 million of debt issuance costs in connection with the loan modification.
8. | INCOME TAXES |
The Company has elected to qualify as a REIT under sections 856-860 of the Internal Revenue Code of 1986, as amended, commencing with the filing of our tax return for the 2015 fiscal year. Under those sections, a REIT, which distributes at least 90% of its REIT taxable income as a dividend to its shareholders each year and which meets certain other conditions, will not be taxed on that portion of its taxable income which is distributed to its shareholders. Prior to the separation from Vornado, UE Businesses historically operated under Vornado’s REIT structure. As Vornado operates as a REIT and distributes 100% of taxable income, no provision for federal income taxes has been made in the accompanying consolidated and combined financial statements for periods prior to the separation. If we fail to qualify as a REIT for any taxable year, we will be subject to federal income taxes at regular corporate rates (including any alternative minimum tax) and may not be able to qualify as a REIT for the four subsequent taxable years.
The following summarizes the tax status of dividends paid for the years ended December 31, 2016 and 2015:
Year Ended December 31, | |||||||
2016 | 2015 | ||||||
Dividend paid per share | $ | 0.82 | $ | 0.80 | |||
Ordinary income | 100 | % | 100 | % | |||
Return of capital | — | % | — | % | |||
Capital gains | — | % | — | % | |||
The REIT and the other minority members are partners in the Operating Partnership. As such, the partners are required to report their share of taxable income on their tax returns. We are also subject to certain other taxes, including state and local taxes and franchise taxes which are included in general and administrative expenses in the consolidated and combined statements of income.
Our two Puerto Rico malls are subject to a 29% non-resident withholding tax which is included in income tax expense in the consolidated and combined statements of income. The Puerto Rico tax expense recorded was $0.8 million, $1.3 million, and $1.7 million for the twelve months ended December 31, 2016, 2015, and 2014 respectively. Both properties are held in a special partnership for Puerto Rico tax reporting (the general partner being a qualified REIT subsidiary or “QRS”).
61
Income tax expense consists of the following:
Year Ended December 31, | |||||||||||
(Amounts in thousands) | 2016 | 2015 | 2014 | ||||||||
Income tax expense: | |||||||||||
Current(1) | $ | 609 | $ | 1,417 | $ | 1,721 | |||||
Deferred(2) | 195 | (123 | ) | — | |||||||
Total income tax expense | $ | 804 | $ | 1,294 | $ | 1,721 | |||||
(1) Current income tax expense for the year ended December 31, 2016 is net of a $0.6 million reduction to the accrued income tax liability recorded in the second quarter of 2016.
(2) The deferred portion of income tax expense related to temporary differences for periods prior to the separation date are reflected as contributions from Vornado in the consolidated and combined statement of changes in equity.
A net deferred tax liability of $3.8 million is included in our consolidated balance sheet within Other Liabilities as of December 31, 2016, comprised of temporary differences related to our two Puerto Rico properties, a deferred tax liability of $4.5 million offset by a deferred tax asset of $0.7 million. The deferred tax liability of $4.5 million is comprised of $2.3 million of tax depreciation in excess of GAAP depreciation, $1.9 million straight-line rents and $0.3 million of amortization of acquired leases not recorded for tax purposes. The deferred tax asset of $0.7 million is comprised of $0.3 million of GAAP to tax depreciation adjustment, $0.2 million of amortization of deferred financing fees not recorded for tax purposes and $0.2 million excess of bad debt expense for tax purposes.
The temporary differences resulting from activity during the years ended December 31, 2016 and 2015 is recorded within Income Tax Expense on the consolidated and combined statements of income.
Below is a table summarizing the net deferred income tax liability balance as of December 31, 2016 and 2015:
(Amounts in thousands) | |||
Balance at January 1, 2015 | $ | (3,730 | ) |
Change in deferred tax assets: | |||
Depreciation | (123 | ) | |
Amortization of deferred financing costs | 254 | ||
Provision for doubtful accounts | (72 | ) | |
Change in deferred tax liabilities: | |||
Depreciation | (2 | ) | |
Straight-line rent | 51 | ||
Amortization of acquired leases | 15 | ||
Balance at December 31, 2015 | (3,607 | ) | |
Change in deferred tax assets: | |||
Depreciation | (94 | ) | |
Amortization of deferred financing costs | (46 | ) | |
Provision for doubtful accounts | (14 | ) | |
Change in deferred tax liabilities: | |||
Depreciation | (88 | ) | |
Straight-line rent | 39 | ||
Amortization of acquired leases | 8 | ||
Balance at December 31, 2016 | $ | (3,802 | ) |
The Operating Partnership is organized as limited partnership and is generally not subject to federal income tax. Accordingly, no provision for federal income taxes has been reflected in the accompanying consolidated and combined financial statements. The Operating Partnership, however, is subject to the non-resident withholding tax at our two Puerto Rico malls.
62
9. FAIR VALUE MEASUREMENTS
ASC 820, Fair Value Measurement and Disclosures defines fair value and establishes a framework for measuring fair value. The objective of fair value is to determine the price that would be received upon the sale of an asset or paid to transfer a liability in an orderly transaction between market participants at the measurement date (the exit price). ASC 820 establishes a fair value hierarchy that prioritizes observable and unobservable inputs used to measure fair value into three levels: Level 1 - quoted prices (unadjusted) in active markets that are accessible at the measurement date for assets or liabilities; Level 2 - observable prices based on inputs not quoted in active markets, but corroborated by market data; and Level 3 - unobservable inputs used when little or no market data is available. The fair value hierarchy gives the highest priority to Level 1 inputs and the lowest priority to Level 3 inputs. In determining fair value, we utilize valuation techniques that maximize the use of observable inputs and minimize the use of unobservable inputs to the extent possible as well as consider counterparty credit risk in our assessment of fair value.
Financial Assets and Liabilities Measured at Fair Value on a Recurring or Non-Recurring Basis
There were no financial assets or liabilities measured at fair value on a recurring or non-recurring basis as of December 31, 2016 and December 31, 2015.
Financial Assets and Liabilities not Measured at Fair Value
Financial assets and liabilities that are not measured at fair value on the consolidated balance sheets include cash and cash equivalents and mortgages payable. Cash and cash equivalents are carried at cost, which approximates fair value. The fair value of mortgages payable is calculated by discounting the future contractual cash flows of these instruments using current risk-adjusted rates available to borrowers with similar credit ratings, which are provided by a third-party specialist. The fair value of cash and cash equivalents is classified as Level 1 and the fair value of mortgages payable is classified as Level 2. The table below summarizes the carrying amounts and fair value of these financial instruments as of December 31, 2016 and December 31, 2015.
As of December 31, 2016 | As of December 31, 2015 | |||||||||||||||
(Amounts in thousands) | Carrying Amount | Fair Value | Carrying Amount | Fair Value | ||||||||||||
Assets: | ||||||||||||||||
Cash and cash equivalents | $ | 131,654 | $ | 131,654 | $ | 168,983 | $ | 168,983 | ||||||||
Liabilities: | ||||||||||||||||
Mortgages payable(1) | $ | 1,205,560 | $ | 1,216,989 | $ | 1,243,957 | $ | 1,262,483 | ||||||||
(1) Excludes unamortized debt issuance costs.
The following interest rates were used by the Company to estimate the fair value of mortgages payable:
December 31, 2016 | December 31, 2015 | ||||||
Low | High | Low | High | ||||
Mortgages payable | 2.0% | 2.3% | 2.0% | 2.3% | |||
63
10. LEASES
As Lessor
We lease space to tenants under operating leases which expire from 2017 to 2072. The leases provide for the payment of fixed base rents payable monthly in advance as well as reimbursements of real estate taxes, insurance and maintenance costs. Retail leases may also provide for the payment by the lessee of additional rents based on a percentage of their sales.
Future base rental revenue under these non-cancelable operating leases excluding extension options is as follows:
(Amounts in thousands) | ||||
Year Ending December 31, | ||||
2017 | $ | 221,690 | ||
2018 | 211,175 | |||
2019 | 192,078 | |||
2020 | 166,899 | |||
2021 | 149,882 | |||
Thereafter | 960,042 | |||
These future minimum amounts do not include additional rents based on a percentage of tenants’ sales or reimbursements. For the years ended December 31, 2016, 2015 and 2014, these additional rents were $0.8 million, $1.2 million, and $1.5 million respectively.
As Lessee
We are a tenant under long-term ground leases or ground and building leases for certain of our properties. Lease expirations range from 2017 to 2102. Future lease payments under these agreements, excluding extension options, are as follows:
(Amounts in thousands) | ||||
Year Ending December 31, | ||||
2017 | $ | 8,964 | ||
2018 | 7,676 | |||
2019 | 7,354 | |||
2020 | 5,110 | |||
2021 | 4,522 | |||
Thereafter | 34,677 | |||
11. COMMITMENTS AND CONTINGENCIES
Legal Matters: There are various legal actions against us in the ordinary course of business. In our opinion, after consultation with legal counsel, the outcome of such matters will not have a material adverse effect on our financial condition, results of operations or cash flows.
Loan Commitments: In January 2015 we completed the modification of the $120.0 million, 6.04% mortgage loan secured by Montehiedra. As part of the planned redevelopment of the property, we committed to fund $20.0 million for leasing and building capital expenditures of which $16.9 million has been funded as of December 31, 2016.
Redevelopment: As of December 31, 2016, we had approximately $191.7 million of active development, redevelopment and anchor repositioning projects underway of which $110.5 million remains to be funded as of December 31, 2016. Based on current plans and estimates we anticipate the remaining amounts will be expended over the next three years.
Insurance: We maintain general liability insurance with limits of $200 million per occurrence for properties in the U.S. and Puerto Rico, and all-risk property and rental value insurance coverage with limits of $500 million for properties in the U.S. and $139 million for properties in Puerto Rico per occurrence, with sub-limits for certain perils such as floods and earthquakes on each of our properties. We also maintain coverage for terrorism acts with limits of $500 million for properties in the U.S. and $139 million for properties in Puerto Rico per occurrence and in the aggregate excluding coverage for nuclear, biological, chemical or radiological terrorism events as defined by the Terrorism Risk Insurance Program Reauthorization Act, which expires in December 2020. In addition, we maintain coverage for cybersecurity with limits of $5 million in the aggregate providing first and third party coverage
64
including network interruption, event management, cyber extortion and claims for media content, security and privacy liability. Insurance premiums are charged directly to each of the retail properties and warehouses. We will be responsible for deductibles and losses in excess of insurance coverage, which could be material.
We continue to monitor the state of the insurance market and the scope and costs of coverage for acts of terrorism. However, we cannot anticipate what coverage will be available on commercially reasonable terms in the future.
Our mortgage loans are non-recourse and contain customary covenants requiring adequate insurance coverage. Although we believe that we currently have adequate insurance coverage for purposes of these agreements, we may not be able to obtain an equivalent amount of coverage at reasonable costs in the future. If lenders insist on greater coverage than we are able to obtain it could adversely affect our ability to finance our properties and expand our portfolio.
Environmental Matters: Each of our properties has been subjected to varying degrees of environmental assessment at various times. Based on these assessments and the projected remediation costs, we have accrued costs of $1.4 million on our consolidated balance sheets for potential remediation costs for environmental contamination at two properties. While this accrual reflects our best estimates of the potential costs of remediation at these properties, $0.1 million has currently been expended and there can be no assurance that the actual costs will not exceed this amount. With respect to our other properties, the environmental assessments did not reveal any material environmental contamination. However, there can be no assurance that the identification of new areas of contamination, changes in the extent or known scope of contamination, the discovery of additional sites, or changes in cleanup requirements would not result in significant costs to us.
12. PREPAID EXPENSES AND OTHER ASSETS
The following is a summary of the composition of the prepaid expenses and other assets in the consolidated balance sheets:
Balance at | |||||||
(Amounts in thousands) | December 31, 2016 | December 31, 2015 | |||||
Deposits for acquisitions | $ | 6,600 | $ | 100 | |||
Other assets | 2,161 | 2,367 | |||||
Prepaid expenses: | |||||||
Real estate taxes | 5,198 | 5,646 | |||||
Insurance | 2,545 | 1,934 | |||||
Rent, licenses/fees | 938 | 941 | |||||
Total Prepaid expenses and other assets | $ | 17,442 | $ | 10,988 | |||
13. OTHER LIABILITIES
The following is a summary of the composition of other liabilities in the consolidated balance sheets:
Balance at | |||||||
(Amounts in thousands) | December 31, 2016 | December 31, 2015 | |||||
Deferred ground rent expense | $ | 6,284 | $ | 6,038 | |||
Deferred tax liability, net | 3,802 | 3,607 | |||||
Deferred tenant revenue | 3,280 | 2,284 | |||||
Environmental remediation costs | 1,309 | 1,379 | |||||
Total Other liabilities | $ | 14,675 | $ | 13,308 | |||
65
14. INTEREST AND DEBT EXPENSE
The following table sets forth the details of interest and debt expense.
Twelve Months Ended December 31, | |||||||||||
(Amounts in thousands) | 2016 | 2015 | 2014 | ||||||||
Interest expense | $ | 49,051 | $ | 52,846 | $ | 53,300 | |||||
Amortization of deferred financing costs | 2,830 | 2,738 | 1,660 | ||||||||
Total Interest and debt expense | $ | 51,881 | $ | 55,584 | $ | 54,960 | |||||
15. EQUITY AND NONCONTROLLING INTEREST
At-The-Market Program
On August 8, 2016, the Company established an at-the-market (“ATM”) equity program, pursuant to which the Company may offer and sell its common shares, par value $0.01 per share, with an aggregate gross sales price of up to $250.0 million through a consortium of broker-dealers acting as sales agents. Sales of common shares may be made, as needed, from time to time in ATM offerings as defined in Rule 415 of the Securities Act of 1933, including by means of ordinary brokers’ transactions on the NYSE or otherwise (i) at market prices prevailing at the time of sale (ii) at prices related to prevailing market prices or (iii) as otherwise agreed to with the applicable sales agent.
From September 2016 to December 31, 2016, the Company issued 307,342 common shares at a weighted average price of $28.45 under its ATM equity program, generating cash proceeds of $8.7 million. We paid $0.1 million of commissions to distribution agents and $0.4 million in additional offering expenses related to the issuance of these common shares. We used the net proceeds to fund acquisition opportunities and fund our development and redevelopment pipeline. Actual future sales will depend on a variety of factors including, but not limited to, market conditions, the trading price of our common shares and our capital needs. We have no obligation to sell the remaining shares available under the active ATM equity program.
Common Units of the Operating Partnership
Operating Partnership units were issued by the Operating Partnership to the Company in connection with the issuance of common shares by the Company under its ATM equity program, as discussed above.
Dividends and Distributions
During the twelve months ended December 31, 2016 and 2015, the Company declared dividends on our common shares and OP unit distributions of $0.82 per share/unit, and $0.80 per share/unit, respectively.
Redeemable Noncontrolling Interests
Redeemable noncontrolling interests reflected on the consolidated balance sheets of the Company are comprised of OP Units and limited partnership interests in the Operating Partnership in the form of LTIP unit awards. In connection with the separation, the Company issued 5.7 million OP units, representing a 5.4% interest in the Operating Partnership to VRLP in exchange for interests in VRLP properties contributed by VRLP. LTIP unit awards were granted to certain executives pursuant to our Omnibus Share Plan (the “Omnibus Share Plan”). The total of the OP units and LTIP units represent a 6.0% weighted-average interest in the Operating Partnership for twelve months ended December 31, 2016. Holders of outstanding vested LTIP units may, from and after two years from the date of issuance, redeem their LTIP units for cash, or for the Company’s common shares on a one-for-one basis, solely at the Company’s election. Holders of outstanding OP units may, at a determinable date, redeem their units for cash or the Company’s common shares on a one-for-one basis solely at our election.
Noncontrolling Interest
The noncontrolling interest relates to the 5% interest held by others in our property in Walnut Creek, CA (Mt. Diablo). The net income attributable to noncontrolling interest is presented separately in our consolidated and combined statements of income.
66
16. SHARE-BASED COMPENSATION
On January 7, 2015 our board and initial shareholder approved the Urban Edge Properties Omnibus Share Plan, under which awards may be granted up to a maximum of 15,000,000 of our common shares or share equivalents. Pursuant to the Omnibus Share Plan, stock options, LTIP units, operating partnership units and restricted shares were granted. We have a Dividend Reinvestment Plan (the “DRIP”), whereby shareholders may use their dividends to purchase shares. During the twelve months ended December 31, 2016 and 2015, 12,564 and 11,407 shares were issued under the DRIP, respectively.
On November 3, 2015, the Compensation Committee of the Board of Trustees of the Company approved the Company’s 2015 Outperformance Plan (“OPP”). The OPP is a multi-year, performance-based equity compensation plan under which participants, including our Chairman and Chief Executive Officer, have the opportunity to earn awards in the form of LTIP Units if, and only if, we outperform a predetermined total shareholder return (“TSR”) and/or outperform the market with respect to a relative TSR in any year during the requisite performance periods as described below. The aggregate notional amount of the 2015 OPP grant was $10.2 million.
Awards under the 2015 OPP may be earned if we (i) achieve a TSR level greater than 7% per annum, or 21% over the three-year performance measurement period (the “Absolute Component”), and/or (ii) achieve a TSR equal to or above, that of the 50th percentile of a retail REIT peer group (“Peer Group”) comprised of 15 of our peer companies, over a three-year performance measurement period (the “Relative Component”). Dividends on awards accrue during the measurement period.
If the designated performance objectives are achieved, LTIP Units are also subject to time-based vesting requirements. Awards earned under the 2015 OPP vest 50% in year three, 25% in year four and 25% in year five. Our executive officers are required to hold earned 2015 OPP awards for one year following vesting.
The fair value of the 2015 OPP on the date of grant was $3.9 million using a Monte Carlo simulation to estimate the fair value based on the probability of satisfying the market conditions and the projected share price at the time of payment, discounted to the valuation date over a three-year performance period. Assumptions include historic volatility (25.0%), risk-free interest rates (1.2%), and historic daily return as compared to our Peer Group (which ranged from 19.0% to 27.0%). Such amount is being amortized into expense over a five-year period from the date of grant, using a graded vesting attribution model. In the twelve months ended December 31, 2016 and 2015, we recognized $1.1 million and $0.2 million of compensation expense related to the OPP’s LTIP Units, respectively. As of December 31, 2016 there was $2.6 million of total unrecognized compensation cost related to the OPP’s LTIP Units, which will be recognized over a weighted-average period of 2.6 years.
All stock options granted have ten-year contractual lives, containing vesting terms of three to five years. As of December 31, 2016, the weighted average contractual term of shares under option outstanding at the end of the period is 8.3 years. The following table presents stock option activity for the twelve months ended December 31, 2016 and 2015:
Shares Under Options | Weighted Average Exercise Price per Share | Weighted Average Remaining Expected Term | |||||||
(In years) | |||||||||
Outstanding at January 1, 2015 | — | $ | — | — | |||||
Granted | 2,302,762 | 23.89 | 6.15 | ||||||
Exercised | — | — | — | ||||||
Forfeited or expired | (13,623 | ) | 24.46 | — | |||||
Outstanding at December 31, 2015 | 2,289,139 | 23.89 | 6.15 | ||||||
Granted | 196,713 | 23.52 | 6.00 | ||||||
Exercised | (8,501 | ) | 24.46 | — | |||||
Forfeited or expired | (5,067 | ) | 24.46 | — | |||||
Outstanding at December 31, 2016 | 2,472,284 | $ | 23.86 | 5.33 | |||||
Exercisable at December 31, 2016 | 45,352 | $ | 23.74 | — | |||||
67
During the twelve months ended December 31, 2016 and 2015, the fair value of the options granted was estimated on the grant date using the Black-Scholes pricing model with the following assumptions:
February 17, 2015 | March 12, 2015 | April 20, 2015 | August 17, 2015 | February 8, 2016 | |||||
Risk-free interest rate | 1.76% | 1.91% | 1.60% | 1.95% | 1.31% | ||||
Expected option life | 6.00 | 6.50 | 6.25 | 6.25 | 6.25 | ||||
Expected volatility | 24.00% | 25.00% | 26.00% | 27.00% | 23.94% | ||||
The options were granted with an exercise price equivalent to the average of the high and low share price on the grant date. No options were granted during the year ended December 31, 2014.
The following table presents information regarding restricted share activity during the twelve months ended December 31, 2016 and 2015:
Shares | Weighted Average Grant Date Fair Value per Share | |||||
Unvested at January 1, 2015 | — | — | ||||
Granted | 35,460 | $ | 22.84 | |||
Vested | (1,022 | ) | 24.46 | |||
Forfeited | (3,721 | ) | 24.18 | |||
Unvested at December 31, 2015 | 30,717 | 22.62 | ||||
Granted | 117,399 | 24.55 | ||||
Vested | (15,977 | ) | 23.17 | |||
Forfeited | (2,744 | ) | 23.55 | |||
Unvested at December 31, 2016 | 129,395 | $ | 24.29 | |||
During the twelve months ended December 31, 2016 and 2015, we granted 117,399 and 35,460 restricted shares, respectively, that are subject to forfeiture and vest over periods ranging from one to four years. The total grant date value of the 15,977 and 1,022 restricted shares vested during the years ended December 31, 2016 and 2015 was $0.4 million and $25 thousand, respectively.
There were 433,040 LTIP units issued to executives during the year ended December 31, 2015, 343,232 of which were issued in connection with the separation transaction and were immediately vested. During the year ended December 31, 2016, 39,439 units vested. The remaining 50,369 units vest over a weighted average period of 2.2 years.
Share-based compensation expense, which is included in general and administrative expenses in our consolidated and combined statements of income, is summarized as follows:
Year Ended December 31, | |||||||
(Amounts in thousands) | 2016 | 2015 | |||||
Share-based compensation expense components(2): | |||||||
Restricted share expense | $ | 1,314 | $ | 282 | |||
Stock option expense | 2,437 | 1,901 | |||||
LTIP expense(3) | 473 | 7,748 | |||||
Outperformance Plan (“OPP”) expense(1) | 1,209 | 330 | |||||
Total Share-based compensation expense | $ | 5,433 | $ | 10,261 | |||
(1) OPP Expense for the years ended December 31, 2016 and 2015 includes $0.1 million and $0.2 million, respectively, of unrecognized compensation expense of awards issued under Vornado’s OPP for UE employees who were previously Vornado employees. The remaining OPP unrecognized compensation expense was transferred from Vornado to UE as of the separation date and is amortized on a straight-line basis over the remaining life of the OPP awards issued.
(2) We did not have any equity awards issued prior to the date of the separation. $3.9 million of share-based compensation expense is included in general and administrative expenses in our combined statements of income for the year ended December 31, 2014 and is related to Vornado equity awards issued prior to the separation for Vornado employees.
(3) LTIP expense excludes the expense associated with LTIP units under the 2015 OPP.
68
As of December 31, 2016, we had a total of $11.0 million of unrecognized compensation expense related to unvested and restricted share-based payment arrangements including unvested stock options, LTIP units, and restricted share awards which were granted under our Omnibus Share Plan as well as OPP awards issued by Vornado. This expense is expected to be recognized over a weighted average period of 1.8 years.
17. EARNINGS PER SHARE AND UNIT
Urban Edge Earnings per Share
The Company has calculated earnings per share (“EPS”) under the two-class method. The two-class method is an earnings allocation methodology whereby EPS for each class of Urban Edge common shares and participating securities is calculated according to dividends declared and participating rights in undistributed earnings. Restricted shares issued pursuant to our share-based compensation program are considered participating securities, and as such have non-forfeitable rights to receive dividends.
The computation of diluted EPS reflects potential dilution of securities by adding potential common shares, including stock options and unvested restricted shares, to the weighted average number of common shares outstanding for the period. For the year ended December 31, 2015, there were options outstanding for 2,289,139 shares, that potentially could be exercised for common shares. These options, with exercise prices ranging from $24.46 to $22.83, have been excluded from the diluted EPS calculation, as their effect is anti-dilutive to the Company’s net income because the option prices were greater than the average market prices of our common shares during 2015. In addition, there were 129,395 unvested restricted shares outstanding that potentially could become unrestricted common shares. The computation of diluted EPS for the years ended December 31, 2016 and 2015 included the 114,354 and 25,829 weighted average unvested restricted shares outstanding, respectively, as their effect is dilutive.
The effect of the redemption of OP and vested LTIP units is not reflected in the computation of basic and diluted earnings per share, as they are redeemable for common shares on a one-for-one basis. The income allocable to such units is allocated on this same basis and reflected as noncontrolling interests in the accompanying consolidated and combined financial statements. As such, the assumed redemption of these units would have no net impact on the determination of diluted earnings per share since they would be anti-dilutive.
As described in Note 2, the common shares outstanding at the date of the separation are reflected as outstanding for all periods prior to the separation. The following table sets forth the computation of our basic and diluted earnings per share:
Year Ended December 31, | |||||||||||
(Amounts in thousands, except per share amounts) | 2016 | 2015 | 2014 | ||||||||
Numerator: | |||||||||||
Net income attributable to common shareholders | $ | 90,815 | $ | 38,785 | $ | 65,772 | |||||
Less: Earnings allocated to unvested participating securities | (114 | ) | (23 | ) | — | ||||||
Net income available for common shareholders - basic | 90,701 | 38,762 | 65,772 | ||||||||
Impact of assumed conversions: | |||||||||||
Unvested LTIP units | 53 | — | — | ||||||||
Net income available for common shareholders - diluted | $ | 90,754 | $ | 38,762 | $ | 65,772 | |||||
Denominator: | |||||||||||
Weighted average common shares outstanding - basic | 99,364 | 99,252 | 99,248 | ||||||||
Effect of dilutive securities: | |||||||||||
Stock options using the treasury stock method | 257 | — | — | ||||||||
Restricted share awards | 114 | 26 | — | ||||||||
Assumed conversion of unvested LTIP units | 59 | — | — | ||||||||
Weighted average common shares outstanding - diluted | 99,794 | 99,278 | 99,248 | ||||||||
Earnings per share available to common shareholders: | |||||||||||
Earnings per common share - Basic | $ | 0.91 | $ | 0.39 | $ | 0.66 | |||||
Earnings per common share - Diluted | $ | 0.91 | $ | 0.39 | $ | 0.66 | |||||
69
Operating Partnership Earnings per Unit
As described in Note 2, the units outstanding at the date of the separation are reflected as outstanding for all periods prior to the separation. The following table sets forth the computation of basic and diluted earnings per unit:
Year Ended December 31, | |||||||||||
(Amounts in thousands, except per unit amounts) | 2016 | 2015 | 2014 | ||||||||
Numerator: | |||||||||||
Net income attributable to unitholders | $ | 96,627 | $ | 41,332 | $ | 65,772 | |||||
Less: net income attributable to participating securities | (211 | ) | (22 | ) | — | ||||||
Net income available for unitholders - basic and diluted | $ | 96,416 | $ | 41,310 | $ | 65,772 | |||||
Denominator: | |||||||||||
Weighted average units outstanding - basic | 105,455 | 105,276 | 104,965 | ||||||||
Effect of dilutive securities issued by Urban Edge | 371 | 26 | — | ||||||||
Unvested LTIP units | 273 | 72 | — | ||||||||
Weighted average units outstanding - diluted | 106,099 | 105,374 | 104,965 | ||||||||
Earnings per unit available to unitholders: | |||||||||||
Earnings per unit - Basic | $ | 0.91 | $ | 0.39 | $ | 0.63 | |||||
Earnings per unit - Diluted | $ | 0.91 | $ | 0.39 | $ | 0.63 | |||||
18. QUARTERLY FINANCIAL DATA (unaudited)
The following tables summarize the quarterly results of operations of Urban Edge Properties and Urban Edge Properties LP for the years ended December 31, 2016 and 2015:
Three Months Ended, | |||||||||||||||
(Amounts in thousands, except per share/unit amounts) | December 31, 2016 | September 30, 2016 | June 30, 2016 | March 31, 2016 | |||||||||||
Total revenue | $ | 83,478 | $ | 79,973 | $ | 79,457 | $ | 83,068 | |||||||
Operating income | 33,428 | 33,414 | 32,790 | 33,386 | |||||||||||
Net income | 20,266 | 20,505 | 36,071 | 19,788 | |||||||||||
Net income attributable to noncontrolling interests in operating partnership | (1,218 | ) | (1,239 | ) | (2,201 | ) | (1,154 | ) | |||||||
Net (income) loss attributable to noncontrolling interests in consolidated subsidiaries | (4 | ) | (1 | ) | (2 | ) | 4 | ||||||||
Net income attributable to common shareholders | 19,044 | 19,265 | 33,868 | 18,638 | |||||||||||
Net income attributable to unitholders | 20,262 | 20,504 | 36,069 | 19,792 | |||||||||||
Earnings per common share - Basic | 0.19 | 0.19 | 0.34 | 0.19 | |||||||||||
Earnings per common share - Diluted | 0.19 | 0.19 | 0.34 | 0.19 | |||||||||||
Earnings per common unit - Basic | 0.19 | 0.19 | 0.34 | 0.19 | |||||||||||
Earnings per common unit - Diluted | 0.19 | 0.19 | 0.34 | 0.19 | |||||||||||
70
Three Months Ended, | |||||||||||||||
(Amounts in thousands, except per share/unit amounts) | December 31, 2015 | September 30, 2015 | June 30, 2015 | March 31, 2015 | |||||||||||
Total revenue | $ | 80,622 | $ | 79,825 | $ | 78,715 | $ | 83,783 | |||||||
Operating income | 29,576 | 34,011 | 30,807 | 3,682 | |||||||||||
Net income (loss) | 16,167 | 20,045 | 17,153 | (12,017 | ) | ||||||||||
Net (income) loss attributable to noncontrolling interests in operating partnership | (942 | ) | (1,179 | ) | (986 | ) | 560 | ||||||||
Net (income) loss attributable to noncontrolling interests in consolidated subsidiaries | 1 | (6 | ) | (5 | ) | (6 | ) | ||||||||
Net income (loss) attributable to common shareholders | 15,226 | 18,860 | 16,162 | (11,463 | ) | ||||||||||
Net income (loss) attributable to unitholders | 16,168 | 20,039 | 17,148 | (12,023 | ) | ||||||||||
Earnings (loss) per common share - Basic | 0.15 | 0.19 | 0.16 | (0.12 | ) | ||||||||||
Earnings (loss) per common share - Diluted | 0.15 | 0.19 | 0.16 | (0.12 | ) | ||||||||||
Earnings (loss) per common unit - Basic | 0.15 | 0.19 | 0.16 | (0.12 | ) | ||||||||||
Earnings (loss) per common unit - Diluted | 0.15 | 0.19 | 0.16 | (0.12 | ) | ||||||||||
19. SUBSEQUENT EVENTS
Pursuant to the Subsequent Events Topic of the FASB ASC, we have evaluated subsequent events and transactions that occurred after our December 31, 2016 consolidated balance sheet date for potential recognition or disclosure in our consolidated and combined financial statements.
Subsequent to December 31, 2016, we completed the acquisition of the following properties:
Date Purchased | Property Name | City | State | Square Feet | Purchase Price (in thousands) | ||||||||
January 4, 2017 | Yonkers Gateway Center(1) | Yonkers | NY | 191,500 | $ | 51,700 | |||||||
January 17, 2017 | Shops at Bruckner(2) | Bronx | NY | 114,000 | $ | 32,000 | |||||||
February 2, 2017 | Hudson Mall(3) | Jersey City | NJ | 383,000 | $ | 43,700 | |||||||
(1) On January 4, 2017 we acquired interests in Yonkers Gateway Center. Consideration for this purchase consisted of the issuance of $48.8 million in OP units and $2.9 million of cash. The total number of OP units issued was 1.8 million.
(2) On January 17, 2017, we acquired the leasehold interest in the Shops at Bruckner for $32.0 million, consisting of the assumption of the existing debt of $12.6 million and $19.4 million of cash. The property is a 114,000 sf retail center in the Bronx, NY directly across from the Company’s 375,000 sf Bruckner Commons. The Company owns the land under the Shops at Bruckner and has been leasing it to the seller under a ground lease. Concurrent with the acquisition, the Company has written-off the existing intangible balance related to the below-market ground lease. As a result, the Company will recognize lease settlement income in the first quarter of 2017.
(3) On February 2, 2017, we acquired Hudson Mall, a 383,000 sf retail center in Jersey City, NJ adjacent to our existing Hudson Commons shopping center. Consideration for this purchase consisted of the assumption of the existing debt of $23.8 million and $19.9 million of cash.
The above acquisitions were funded using a combination of available cash on hand, equity and the assumption of existing mortgage debt. Acquisition related expenses totaling $0.5 million were expensed as incurred. We have not yet measured the fair value of the tangible and identified intangible assets and liabilities nor the proforma results of operations.
71
ITEM 9. | CHANGES IN AND DISAGREEMENTS WITH ACCOUNTANTS ON ACCOUNTING AND FINANCIAL DISCLOSURES |
None.
ITEM 9A. | CONTROLS AND PROCEDURES |
Controls and Procedures (Urban Edge Properties)
Evaluation of Disclosure Controls and Procedures
We maintain disclosure controls and procedures (as defined in Rules 13a-15(e) and 15d-15(e) under the Securities Exchange Act of 1934 (the “Exchange Act”)) that are designed to provide reasonable assurance that information required to be disclosed in the reports that we file or submit under the Exchange Act is recorded, processed, summarized and reported within the time periods specified in the SEC’s rules and forms, and that such information is accumulated and communicated to our management, including our Chief Executive Officer and Chief Financial Officer, as appropriate to allow timely decisions regarding required disclosures. Because of inherent limitations, disclosure controls and procedures, no matter how well designed and operated, can provide only reasonable, and not absolute, assurance that the objectives of disclosure controls and procedures are met.
Our management, with the participation of our Chief Executive Officer and Chief Financial Officer, evaluated the effectiveness of the design and operation of our disclosure controls and procedures. Based on that evaluation, our Chief Executive Officer and Chief Financial Officer concluded that, as of the end of the period covered by this report, our disclosure controls and procedures are effective.
Management’s Annual Report on Internal Control over Financial Reporting
The management of Urban Edge Properties and subsidiaries (the “Company”) is responsible for establishing and maintaining adequate internal control over financial reporting for the Company, defined in Rule 13a-15(f) promulgated under the Securities Exchange Act of 1934, as amended, as a process designed by, or under the supervision of, the Company’s principal executive and principal financial officers, or persons performing similar functions, and effected by the Company’s board of trustees, management and other personnel, to provide reasonable assurance regarding the reliability of financial reporting, which requires the use of certain estimates and judgments, and the preparation of financial statements for external purposes in accordance with generally accepted accounting principles and includes those policies and procedures that:
• | Pertain to the maintenance of records that in reasonable detail accurately and fairly reflect the transactions and dispositions of the assets of the Company; |
• | Provide reasonable assurance that transactions are recorded as necessary to permit preparation of financial statements in accordance with generally accepted accounting principles, and that receipts and expenditures of the Company are being made only in accordance with authorizations of management and trustees of the Company; and |
• | Provide reasonable assurance regarding prevention or timely detection of unauthorized acquisition, use or disposition of the Company’s assets that could have a material effect on the financial statements. |
Management, including our Chief Executive Officer and Chief Financial Officer, do not expect that our disclosure controls and procedures or internal control over financial reporting will prevent all errors and fraud. In designing and evaluating our control system, management recognized that any control system, no matter how well designed and operated, can provide only reasonable, not absolute, assurance of achieving the desired control objectives. Further, the design of a control system must reflect the fact that there are resource constraints, and management necessarily was required to apply its judgment in evaluating the cost-benefit relationship of possible controls and procedures. Because of the inherent limitations in all control systems, no evaluation of controls can provide absolute assurance that all control issues and instances of fraud, if any, that may affect our operation have been or will be detected. These inherent limitations include the realities that judgments in decision-making can be faulty, and that breakdowns can occur because of simple error or mistake. Additionally, controls can be circumvented by the individual acts of some persons, by collusion of two or more people, or by management’s override of the control. The design of any system of controls also is based in part upon certain assumptions about the likelihood of future events, and there can be no assurance that any design will succeed in achieving its stated goals under all potential future conditions. Over time, controls may become inadequate because of changes in conditions that cannot be anticipated at the present time, or the degree of compliance with the policies or procedures may deteriorate. Because of the inherent limitations in a cost-effective control system, misstatements due to error or fraud may occur and may not be detected.
72
The Company’s management assessed the effectiveness of the Company’s internal control over financial reporting as of December 31, 2016. In making this assessment, the Company’s management used the criteria set forth by the Internal Control-Integrated Framework issued by the Committee of Sponsoring Organizations of the Treadway Commission (2013 Framework) (the COSO criteria). Based on this assessment, management has concluded that, as of December 31, 2016, the Company’s internal control over financial reporting is effective.
The effectiveness of the Company’s internal control over financial reporting as of December 31, 2016 has been audited by Deloitte & Touche LLP, an independent registered public accounting firm as stated in their attestation report which is included herein.
Changes in Internal Control Over Financial Reporting
There have not been any changes in our internal control over financial reporting (as defined in Rule 13a-15(f)) that occurred during the three months ended December 31, 2016 that have materially affected, or are reasonably likely to materially affect, our internal control over financial reporting.
Controls and Procedures (Urban Edge Properties LP)
Evaluation of Disclosure Controls and Procedures
The Operating Partnership’s management maintains disclosure controls and procedures (as defined in Rules 13a-15(e) and 15d-15(e) under the Securities Exchange Act of 1934 (the “Exchange Act”)) that are designed to provide reasonable assurance that information required to be disclosed in the reports that we file or submit under the Exchange Act is recorded, processed, summarized and reported within the time periods specified in the SEC’s rules and forms, and that such information is accumulated and communicated to our management, including the Chief Executive Officer and Chief Financial Officer of our general partner, as appropriate to allow timely decisions regarding required disclosures. Because of inherent limitations, disclosure controls and procedures, no matter how well designed and operated, can provide only reasonable, and not absolute, assurance that the objectives of disclosure controls and procedures are met.
The Operating Partnership’s management, with the participation of the Chief Executive Officer and Chief Financial Officer of our general partner, evaluated the effectiveness of the design and operation of our disclosure controls and procedures. Based on that evaluation, the Chief Executive Officer and Chief Financial Officer of our general partner concluded that, as of the end of the period covered by this report, our disclosure controls and procedures are effective.
Management’s Annual Report on Internal Control over Financial Reporting
The Operating Partnership’s management is responsible for establishing and maintaining adequate internal control over financial reporting for the Operating Partnership, defined in Rule 13a-15(f) promulgated under the Securities Exchange Act of 1934, as amended, as a process designed by, or under the supervision of, the Operating Partnership’s principal executive and principal financial officers, or persons performing similar functions, and effected by the board of trustees, management and other personnel of the Operating Partnership’s general partner, to provide reasonable assurance regarding the reliability of financial reporting, which requires the use of certain estimates and judgments, and the preparation of financial statements for external purposes in accordance with generally accepted accounting principles and includes those policies and procedures that:
• | Pertain to the maintenance of records that in reasonable detail accurately and fairly reflect the transactions and dispositions of the assets of the Company; |
• | Provide reasonable assurance that transactions are recorded as necessary to permit preparation of financial statements in accordance with generally accepted accounting principles, and that receipts and expenditures of the Company are being made only in accordance with authorizations of management and trustees of the Operating Partnership’s general partner; and |
• | Provide reasonable assurance regarding prevention or timely detection of unauthorized acquisition, use or disposition of the Company’s assets that could have a material effect on the financial statements. |
The Operating Partnership’s management, including the Chief Executive Officer and Chief Financial Officer of our general partner, do not expect that our disclosure controls and procedures or internal control over financial reporting will prevent all errors and fraud. In designing and evaluating our control system, management recognized that any control system, no matter how well designed and operated, can provide only reasonable, not absolute, assurance of achieving the desired control objectives. Further, the design of a control system must reflect the fact that there are resource constraints, and management necessarily was required to apply its judgment in evaluating the cost-benefit relationship of possible controls and procedures. Because of the inherent limitations in all control systems, no evaluation of controls can provide absolute assurance that all control issues and instances of fraud, if any, that may affect our operation have been or will be detected. These inherent limitations include the realities that
73
judgments in decision-making can be faulty, and that breakdowns can occur because of simple error or mistake. Additionally, controls can be circumvented by the individual acts of some persons, by collusion of two or more people, or by management’s override of the control. The design of any system of controls also is based in part upon certain assumptions about the likelihood of future events, and there can be no assurance that any design will succeed in achieving its stated goals under all potential future conditions. Over time, controls may become inadequate because of changes in conditions that cannot be anticipated at the present time, or the degree of compliance with the policies or procedures may deteriorate. Because of the inherent limitations in a cost-effective control system, misstatements due to error or fraud may occur and may not be detected.
The Operating Partnership’s management assessed the effectiveness of the Operating Partnership’s internal control over financial reporting as of December 31, 2016. In making this assessment, the Operating Partnership’s management used the criteria set forth by the Internal Control-Integrated Framework issued by the Committee of Sponsoring Organizations of the Treadway Commission (2013 Framework) (the COSO criteria). Based on this assessment, management has concluded that, as of December 31, 2016, the Operating Partnership’s internal control over financial reporting is effective.
The effectiveness of the Operating Partnership’s internal control over financial reporting as of December 31, 2016 has been audited by Deloitte & Touche LLP, an independent registered public accounting firm as stated in their attestation report which is included herein.
Changes in Internal Control Over Financial Reporting
There have not been any changes in our internal control over financial reporting (as defined in Rule 13a-15(f)) that occurred during the three months ended December 31, 2016 that have materially affected, or are reasonably likely to materially affect, our internal control over financial reporting.
74
REPORT OF INDEPENDENT REGISTERED PUBLIC ACCOUNTING FIRM
Shareholders and Board of Trustees
Urban Edge Properties
New York, New York
We have audited the internal control over financial reporting of Urban Edge Properties (the "Company") as of December 31, 2016, based on criteria established in Internal Control - Integrated Framework (2013) issued by the Committee of Sponsoring Organizations of the Treadway Commission. The Company's management is responsible for maintaining effective internal control over financial reporting and for its assessment of the effectiveness of internal control over financial reporting, included in the accompanying Management’s Report on Internal Control Over Financial Reporting. Our responsibility is to express an opinion on the Company's internal control over financial reporting based on our audit.
We conducted our audit in accordance with the standards of the Public Company Accounting Oversight Board (United States). Those standards require that we plan and perform the audit to obtain reasonable assurance about whether effective internal control over financial reporting was maintained in all material respects. Our audit included obtaining an understanding of internal control over financial reporting, assessing the risk that a material weakness exists, testing and evaluating the design and operating effectiveness of internal control based on the assessed risk, and performing such other procedures as we considered necessary in the circumstances. We believe that our audit provides a reasonable basis for our opinion.
A company's internal control over financial reporting is a process designed by, or under the supervision of, the company's principal executive and principal financial officers, or persons performing similar functions, and effected by the company's board of directors, management, and other personnel to provide reasonable assurance regarding the reliability of financial reporting and the preparation of financial statements for external purposes in accordance with generally accepted accounting principles. A company's internal control over financial reporting includes those policies and procedures that (1) pertain to the maintenance of records that, in reasonable detail, accurately and fairly reflect the transactions and dispositions of the assets of the company; (2) provide reasonable assurance that transactions are recorded as necessary to permit preparation of financial statements in accordance with generally accepted accounting principles, and that receipts and expenditures of the company are being made only in accordance with authorizations of management and directors of the company; and (3) provide reasonable assurance regarding prevention or timely detection of unauthorized acquisition, use, or disposition of the company's assets that could have a material effect on the financial statements.
Because of the inherent limitations of internal control over financial reporting, including the possibility of collusion or improper management override of controls, material misstatements due to error or fraud may not be prevented or detected on a timely basis. Also, projections of any evaluation of the effectiveness of the internal control over financial reporting to future periods are subject to the risk that the controls may become inadequate because of changes in conditions, or that the degree of compliance with the policies or procedures may deteriorate.
In our opinion, the Company maintained, in all material respects, effective internal control over financial reporting as of December 31, 2016, based on the criteria established in Internal Control - Integrated Framework (2013) issued by the Committee of Sponsoring Organizations of the Treadway Commission.
We have also audited, in accordance with the standards of the Public Company Accounting Oversight Board (United States), the consolidated and combined financial statements and financial statement schedules as of and for the year ended December 31, 2016 of the Company and our report dated February 16, 2017 expressed an unqualified opinion on those financial statements and financial statement schedules and included an explanatory paragraph regarding the allocations of certain expenses from Vornado Realty Trust as discussed in Note 2 to the consolidated and combined financial statements.
/s/ DELOITTE & TOUCHE LLP
New York, New York
February 16, 2017
75
REPORT OF INDEPENDENT REGISTERED PUBLIC ACCOUNTING FIRM
Partners of
Urban Edge Properties LP
New York, New York
We have audited the internal control over financial reporting of Urban Edge Properties LP (the "Operating Partnership") as of December 31, 2016, based on criteria established in Internal Control - Integrated Framework (2013) issued by the Committee of Sponsoring Organizations of the Treadway Commission. The Operating Partnership's management is responsible for maintaining effective internal control over financial reporting and for its assessment of the effectiveness of internal control over financial reporting, included in the accompanying Management’s Report on Internal Control Over Financial Reporting. Our responsibility is to express an opinion on the Operating Partnership's internal control over financial reporting based on our audit.
We conducted our audit in accordance with the standards of the Public Company Accounting Oversight Board (United States). Those standards require that we plan and perform the audit to obtain reasonable assurance about whether effective internal control over financial reporting was maintained in all material respects. Our audit included obtaining an understanding of internal control over financial reporting, assessing the risk that a material weakness exists, testing and evaluating the design and operating effectiveness of internal control based on the assessed risk, and performing such other procedures as we considered necessary in the circumstances. We believe that our audit provides a reasonable basis for our opinion.
A company's internal control over financial reporting is a process designed by, or under the supervision of, the company's principal executive and principal financial officers, or persons performing similar functions, and effected by the company's board of directors, management, and other personnel to provide reasonable assurance regarding the reliability of financial reporting and the preparation of financial statements for external purposes in accordance with generally accepted accounting principles. A company's internal control over financial reporting includes those policies and procedures that (1) pertain to the maintenance of records that, in reasonable detail, accurately and fairly reflect the transactions and dispositions of the assets of the company; (2) provide reasonable assurance that transactions are recorded as necessary to permit preparation of financial statements in accordance with generally accepted accounting principles, and that receipts and expenditures of the company are being made only in accordance with authorizations of management and directors of the company; and (3) provide reasonable assurance regarding prevention or timely detection of unauthorized acquisition, use, or disposition of the company's assets that could have a material effect on the financial statements.
Because of the inherent limitations of internal control over financial reporting, including the possibility of collusion or improper management override of controls, material misstatements due to error or fraud may not be prevented or detected on a timely basis. Also, projections of any evaluation of the effectiveness of the internal control over financial reporting to future periods are subject to the risk that the controls may become inadequate because of changes in conditions, or that the degree of compliance with the policies or procedures may deteriorate.
In our opinion, the Operating Partnership maintained, in all material respects, effective internal control over financial reporting as of December 31, 2016, based on the criteria established in Internal Control - Integrated Framework (2013) issued by the Committee of Sponsoring Organizations of the Treadway Commission.
We have also audited, in accordance with the standards of the Public Company Accounting Oversight Board (United States), the consolidated and combined financial statements and financial statement schedules as of and for the year ended December 31, 2016 of the Operating Partnership and our report dated February 16, 2017 expressed an unqualified opinion on those financial statements and financial statement schedules and included an explanatory paragraph regarding the allocations of certain expenses from Vornado Realty Trust as discussed in Note 2 to the consolidated and combined financial statements.
/s/ DELOITTE & TOUCHE LLP
New York, New York
February 16, 2017
76
ITEM 9B. | OTHER INFORMATION |
None.
PART III
ITEM 10. | DIRECTORS, EXECUTIVE OFFICERS AND CORPORATE GOVERNANCE |
We hereby incorporate by reference the information appearing under the caption “Information about our Board of Trustees and its Committees” in our definitive proxy statement relating to our 2017 Annual Meeting of Shareholders to be held on May 10, 2017.
ITEM 11. | EXECUTIVE COMPENSATION |
We hereby incorporate by reference the information appearing under the caption “Executive Officer Compensation” in our definitive proxy statement relating to our 2017 Annual Meeting of Shareholders to be held on May 10, 2017.
ITEM 12. | SECURITY OWNERSHIP OF CERTAIN BENEFICIAL OWNERS AND MANAGEMENT AND RELATED STOCKHOLDER MATTERS |
We hereby incorporate by reference the information appearing under the caption “Security Ownership of Certain Beneficial Owners and Management” in our definitive proxy statement relating to our 2017 Annual Meeting of Shareholders to be held on May 10, 2017.
ITEM 13. | CERTAIN RELATIONSHIPS AND RELATED TRANSACTIONS, AND DIRECTOR INDEPENDENCE |
We hereby incorporate by reference the information appearing under the caption “Certain Relationships and Related Transactions” in our definitive proxy statement relating to our 2017 Annual Meeting of Shareholders to be held on May 10, 2017.
ITEM 14. | PRINCIPAL ACCOUNTING FEES AND SERVICES |
We hereby incorporate by reference the information appearing under the caption “Principal Accounting Fees and Services” in our definitive proxy statement relating to our 2017 Annual Meeting of Shareholders to be held on May 10, 2017.
77
PART IV
ITEM 15. | EXHIBITS AND FINANCIAL STATEMENT SCHEDULES |
(a)(1) Financial Statements
Our consolidated and combined financial statements and notes thereto, together with the Reports of Independent Registered Public Accounting Firm are included as a separate section of this Annual Report on Form 10-K commencing on page 41.
(2) Financial Statement Schedules
Our financial statement schedules are included in a separate section of this Annual Report on Form 10-K commencing on page 81.
(3) Exhibits
A list of exhibits to this Annual Report on Form 10-K is set forth on the Exhibit Index immediately preceding such exhibits and is incorporated herein by reference.
(b) See Exhibit Index
(c) Schedules other than those listed above are omitted because they are not applicable or the information required is included in the combined financial statements or the notes thereto.
78
SIGNATURES
Pursuant to the requirements of the Securities Exchange Act of 1934, the registrants have duly caused this report to be signed on their behalf by the undersigned thereunto duly authorized.
URBAN EDGE PROPERTIES | ||
(Registrant) | ||
Date: February 16, 2017 | By: | /s/ Mark Langer |
Mark Langer, Chief Financial Officer | ||
URBAN EDGE PROPERTIES LP | ||
By: Urban Edge Properties, General Partner | ||
Date: February 16, 2017 | By: | /s/ Mark Langer |
Mark Langer, Chief Financial Officer | ||
79
KNOWN BY ALL PERSONS BY THESE PRESENTS, that the individuals whose signatures appear below hereby constitute and appoint Jeffrey S. Olson and Mark Langer, and each of them severally, as his or her true and lawful attorneys-in-fact and agents with full power of substitution and resubstitution for him or her and in his or her name, place and stead in any and all capacities to sign any and all amendments to this Annual Report on Form 10-K and to file the same, with all exhibits thereto, and other documents in connection therewith, with the Securities and Exchange Commission, granting unto said attorneys-in-fact and agents, full power and authority to do or perform each and every act and thing requisite and necessary to be done in connection therewith, as fully to all intents and purposes as he or she might or could do in person, hereby ratifying and confirming all that said attorneys-in-fact and agents or any of them, or of his substitute or substitutes, may lawfully do to cause to be done by virtue hereof.
Pursuant to the requirements of the Securities Exchange Act of 1934, this report has been signed below by the following persons on behalf of the Registrant and in the capacities and on the dates indicated:
Signature | Title | Date | |||
By: | /s/ Jeffrey S. Olson | Chairman of the Board of Trustees | February 16, 2017 | ||
Jeffrey S. Olson | and Chief Executive Officer | ||||
(Principal Executive Officer) | |||||
By: | /s/ Mark Langer | Chief Financial Officer | February 16, 2017 | ||
Mark Langer | (Principal Financial Officer) | ||||
By: | /s/ Jennifer Holmes | Chief Accounting Officer | February 16, 2017 | ||
Jennifer Holmes | (Principal Accounting Officer) | ||||
By: | /s/ Michael A. Gould | Trustee | February 16, 2017 | ||
Michael A. Gould | |||||
By: | /s/ Steven H. Grapstein | Trustee | February 16, 2017 | ||
Steven H. Grapstein | |||||
By: | /s/ Steven J. Guttman | Trustee | February 16, 2017 | ||
Steven J. Guttman | |||||
By: | /s/ Amy B. Lane | Trustee | February 16, 2017 | ||
Amy B. Lane | |||||
By: | /s/ Kevin P. O’Shea | Trustee | February 16, 2017 | ||
Kevin P. O’Shea | |||||
By: | /s/ Steven Roth | Trustee | February 16, 2017 | ||
Steven Roth | |||||
80
URBAN EDGE PROPERTIES AND URBAN EDGE PROPERTIES LP
SCHEDULE II- VALUATION AND QUALIFYING ACCOUNTS
(in thousands)
Column A | Column B | Column C | Column D | Column E | ||||||||||||
Description | Balance at Beginning of Year | Additions (Reversals) Expensed | Uncollectible Accounts Written-Off | Balance at End of Year | ||||||||||||
Year Ended December 31, 2016: | ||||||||||||||||
Allowance for doubtful accounts | $ | 1,926 | $ | 1,214 | $ | (547 | ) | $ | 2,593 | |||||||
Year Ended December 31, 2015: | ||||||||||||||||
Allowance for doubtful accounts | 2,432 | 1,526 | (2,032 | ) | 1,926 | |||||||||||
Year Ended December 31, 2014: | ||||||||||||||||
Allowance for doubtful accounts | 2,398 | 1,032 | (998 | ) | 2,432 | |||||||||||
81
URBAN EDGE PROPERTIES AND URBAN EDGE PROPERTIES LP
SCHEDULE III - REAL ESTATE AND ACCUMULATED DEPRECIATION
(in thousands)
Initial cost to company | Gross amount at which carried at close of period | |||||||||||||||||||||||||||||||||||
Description | Encumbrances | Land | Building and improvements | Costs capitalized subsequent to acquisition | Land | Building and improvements | Total(2) | Accumulated depreciation and amortization(1) | Date of construction | Date acquired | ||||||||||||||||||||||||||
SHOPPING CENTERS AND MALLS: | ||||||||||||||||||||||||||||||||||||
Allentown, PA | $ | 27,506 | $ | 187 | $ | 15,580 | $1,823 | $ | 187 | $ | 17,403 | $ | 17,590 | $ | 13,806 | 1957 | 1957 | |||||||||||||||||||
Baltimore (Towson), MD | 14,331 | 581 | 3,227 | 11,306 | 435 | 14,680 | 15,115 | 6,392 | 1968 | 1968 | ||||||||||||||||||||||||||
Bensalem, PA | 13,652 | 2,727 | 6,698 | 2,042 | 2,728 | 8,740 | 11,468 | 4,061 | 1972/ 1999 | 1972 | ||||||||||||||||||||||||||
Bergen Town Center - East, Paramus, NJ | — | 6,305 | — | 33,434 | 6,305 | 33,434 | 39,739 | 6,334 | 1957/ 2009 | 2003 | ||||||||||||||||||||||||||
Bergen Town Center - West, Paramus, NJ | 300,000 | 15,812 | 82,240 | 331,835 | 33,563 | 396,324 | 429,887 | 98,118 | 1957/ 2009 | 2003/ 2015 | ||||||||||||||||||||||||||
Bethlehem, PA | 5,129 | 827 | 5,200 | 1,344 | 839 | 6,532 | 7,371 | 5,727 | 1966 | 1966 | ||||||||||||||||||||||||||
Brick, NJ | 29,316 | 1,391 | 11,179 | 7,031 | 1,391 | 18,210 | 19,601 | 13,746 | 1968 | 1968 | ||||||||||||||||||||||||||
Bronx (Bruckner Boulevard), NY | — | 66,100 | 259,503 | (52,180) | 48,890 | 224,533 | 273,423 | 13,703 | N/A | 2007 | ||||||||||||||||||||||||||
Bronx (1750-1780 Gun Hill Road), NY | — | 6,427 | 11,885 | 22,124 | 6,428 | 34,009 | 40,437 | 7,124 | 2009 | 2005 | ||||||||||||||||||||||||||
Broomall, PA | 9,805 | 850 | 2,171 | 1,399 | 850 | 3,570 | 4,420 | 2,739 | 1966 | 1966 | ||||||||||||||||||||||||||
Buffalo (Amherst), NY | — | 5,743 | 4,056 | 13,078 | 5,107 | 17,770 | 22,877 | 7,905 | 1968 | 1968 | ||||||||||||||||||||||||||
Cambridge (leased through 2033)(3), MA | — | — | — | 261 | — | 261 | 261 | 231 | N/A | |||||||||||||||||||||||||||
Carlstadt (leased through 2050)(3), NJ | — | — | 16,458 | — | — | 16,458 | 16,458 | 3,785 | N/A | 2007 | ||||||||||||||||||||||||||
Charleston (leased through 2063)(3), SC | — | — | 3,634 | — | — | 3,634 | 3,634 | 931 | N/A | 2006 | ||||||||||||||||||||||||||
Cherry Hill, NJ | 12,722 | 5,864 | 2,694 | 4,840 | 4,864 | 8,534 | 13,398 | 4,402 | 1964 | 1964 | ||||||||||||||||||||||||||
Chicopee, MA | 7,618 | 895 | — | — | 895 | — | 895 | — | 1969 | 1969 | ||||||||||||||||||||||||||
Commack (leased through 2021)(3), NY | — | — | 43 | 184 | — | 227 | 227 | 187 | N/A | 2006 | ||||||||||||||||||||||||||
Dewitt (leased through 2041)(3), NY | — | — | 7,116 | — | — | 7,116 | 7,116 | 1,805 | N/A | 2006 | ||||||||||||||||||||||||||
Rockaway, NJ | 12,068 | 559 | 6,363 | 3,938 | 559 | 10,301 | 10,860 | 5,745 | 1964 | 1964 | ||||||||||||||||||||||||||
East Brunswick, NJ | 33,640 | 2,417 | 17,169 | 7,046 | 2,417 | 24,215 | 26,632 | 16,977 | 1957/ 1972 | 1957/ 1972 | ||||||||||||||||||||||||||
East Hanover (200 - 240 Route 10 West), NJ | 35,098 | 2,232 | 18,241 | 9,533 | 2,671 | 27,335 | 30,006 | 15,746 | 1962 | 1962/ 1998 | ||||||||||||||||||||||||||
East Hanover (280 Route 10 West), NJ | 4,174 | — | — | 7,075 | — | 7,075 | 7,075 | 1,959 | N/A | |||||||||||||||||||||||||||
East Rutherford, (leased through 2194)(3), NJ | 12,471 | — | 36,727 | 60 | — | 36,787 | 36,787 | 6,687 | 2007 | 2007 | ||||||||||||||||||||||||||
Eatontown, NJ | — | 4,653 | 4,999 | 108 | 4,653 | 5,107 | 9,760 | 1,466 | N/A | 2005 | ||||||||||||||||||||||||||
Englewood, NJ | 11,537 | 2,300 | 17,245 | (8,390) | 1,495 | 9,660 | 11,155 | 1,129 | N/A | 2007 | ||||||||||||||||||||||||||
Freeport (240 West Sunrise Highway) (leased through 2040)(3), NY | — | — | — | 260 | — | 260 | 260 | 195 | N/A | 2005 | ||||||||||||||||||||||||||
Freeport (437 East Sunrise Highway), NY | 19,611 | 1,231 | 4,747 | 4,158 | 1,231 | 8,905 | 10,136 | 5,883 | 1981 | 1981 | ||||||||||||||||||||||||||
82
Initial cost to company | Gross amount at which carried at close of period | |||||||||||||||||||||||||||||||||||
Description | Encumbrances | Land | Building and improvements | Costs capitalized subsequent to acquisition | Land | Building and improvements | Total(2) | Accumulated depreciation and amortization(1) | Date of construction | Date acquired | ||||||||||||||||||||||||||
Garfield, NJ | — | 45 | 8,068 | 39,218 | 45 | 47,286 | 47,331 | 10,179 | 2009 | 1998 | ||||||||||||||||||||||||||
Glen Burnie, MD | — | 462 | 2,571 | 2,073 | 462 | 4,644 | 5,106 | 3,334 | 1958 | 1958 | ||||||||||||||||||||||||||
Glenolden, PA | 6,286 | 850 | 1,820 | 715 | 850 | 2,535 | 3,385 | 2,219 | 1975 | 1975 | ||||||||||||||||||||||||||
Hackensack, NJ | 37,211 | 692 | 10,219 | 4,948 | 542 | 15,317 | 15,859 | 9,480 | 1963 | 1963 | ||||||||||||||||||||||||||
Hazlet, NJ | — | 7,400 | 9,413 | (2,165) | 7,400 | 7,248 | 14,648 | 1,736 | N/A | 2007 | ||||||||||||||||||||||||||
Queens, NY | — | 14,537 | 12,304 | 1,024 | 14,537 | 13,328 | 27,865 | 381 | N/A | 2015 | ||||||||||||||||||||||||||
Huntington, NY | 15,286 | 21,200 | 33,667 | 2,951 | 21,200 | 36,618 | 57,818 | 8,138 | N/A | 2007 | ||||||||||||||||||||||||||
Inwood, NY | — | 12,419 | 19,097 | 2,280 | 12,419 | 21,377 | 33,796 | 6,218 | N/A | 2004 | ||||||||||||||||||||||||||
Jersey City, NJ | 18,605 | 652 | 7,495 | 844 | 652 | 8,339 | 8,991 | 3,173 | 1965 | 1965 | ||||||||||||||||||||||||||
Kearny, NJ | — | 309 | 3,376 | 7,798 | 309 | 11,174 | 11,483 | 3,640 | 1938 | 1959 | ||||||||||||||||||||||||||
Lancaster, PA | 4,953 | 3,140 | 63 | 2,129 | 3,140 | 2,192 | 5,332 | 693 | 1966 | 1966 | ||||||||||||||||||||||||||
Las Catalinas, Puerto Rico | 130,000 | 15,280 | 64,370 | 12,696 | 15,280 | 77,066 | 92,346 | 34,373 | 1996 | 2002 | ||||||||||||||||||||||||||
Lawnside, NJ | 9,805 | 1,226 | 3,164 | 1,005 | 1,226 | 4,169 | 5,395 | 3,744 | 1969 | 1969/ 2015 | ||||||||||||||||||||||||||
Lodi (Route 17 North), NJ | 10,409 | 238 | 9,446 | (1) | 238 | 9,446 | 9,684 | 4,072 | 1999 | 1975 | ||||||||||||||||||||||||||
Lodi (Washington Street), NJ | — | 7,606 | 13,125 | 2,644 | 7,606 | 15,769 | 23,375 | 4,391 | N/A | 2004 | ||||||||||||||||||||||||||
Manalapan, NJ | 19,309 | 725 | 7,189 | 6,825 | 1,046 | 13,693 | 14,739 | 9,052 | 1971 | 1971 | ||||||||||||||||||||||||||
Marlton, NJ | 15,840 | 1,611 | 3,464 | 10,988 | 1,454 | 14,609 | 16,063 | 9,769 | 1973 | 1973 | ||||||||||||||||||||||||||
Middletown, NJ | 15,940 | 283 | 5,248 | 3,249 | 283 | 8,497 | 8,780 | 6,388 | 1963 | 1963 | ||||||||||||||||||||||||||
Milford (leased through 2019)(3), MA | — | — | — | — | — | — | — | — | N/A | 1976 | ||||||||||||||||||||||||||
Montclair, NJ | 2,414 | 66 | 419 | 419 | 66 | 838 | 904 | 714 | 1972 | 1972 | ||||||||||||||||||||||||||
Montehiedra, Puerto Rico | 117,308 | 9,182 | 66,751 | 23,176 | 9,267 | 89,842 | 99,109 | 35,533 | 1996/ 2015 | 1997 | ||||||||||||||||||||||||||
Morris Plains, NJ | 19,611 | 1,104 | 6,411 | 1,889 | 1,104 | 8,300 | 9,404 | 7,165 | 1961 | 1985 | ||||||||||||||||||||||||||
Mount Kisco, NY | 14,883 | 22,700 | 26,700 | 1,815 | 23,297 | 27,918 | 51,215 | 6,133 | N/A | 2007 | ||||||||||||||||||||||||||
New Hyde Park (leased through 2029)(3), NY | — | — | 4 | — | — | 4 | 4 | 126 | 1970 | 1976 | ||||||||||||||||||||||||||
Newington, CT | 10,308 | 2,421 | 1,200 | 1,486 | 2,421 | 2,686 | 5,107 | 1,087 | 1965 | 1965 | ||||||||||||||||||||||||||
Norfolk (leased through 2050)(3), VA | — | — | 3,927 | 15 | — | 3,942 | 3,942 | 3,285 | N/A | 2005 | ||||||||||||||||||||||||||
North Bergen (Kennedy Boulevard), NJ | 4,676 | 2,308 | 636 | 175 | 2,308 | 810 | 3,118 | 501 | 1993 | 1959 | ||||||||||||||||||||||||||
North Bergen (Tonnelle Avenue), NJ | 73,951 | 24,493 | — | 66,537 | 34,473 | 56,557 | 91,030 | 12,863 | 2009 | 2006 | ||||||||||||||||||||||||||
North Plainfield, NJ | — | 6,577 | 13,983 | (2,653) | 6,577 | 11,329 | 17,906 | 3,087 | 1955 | 1989 | ||||||||||||||||||||||||||
Oceanside, NY | — | 2,710 | 2,306 | — | 2,710 | 2,306 | 5,016 | 552 | N/A | 2007 | ||||||||||||||||||||||||||
Paramus (leased through 2033)(3), NJ | — | — | — | 12,569 | — | 12,569 | 12,569 | 3,083 | 1957/ 2009 | 2003 | ||||||||||||||||||||||||||
Rochester, NY | 4,023 | 2,172 | — | — | 2,172 | — | 2,172 | — | 1966 | 1966 | ||||||||||||||||||||||||||
Rochester (Henrietta) (leased through 2055)(3), NY | — | — | 2,647 | 1,228 | — | 3,875 | 3,875 | 3,481 | 1971 | 1971 | ||||||||||||||||||||||||||
Rockville, MD | — | 3,470 | 20,599 | 2,541 | 3,470 | 23,140 | 26,610 | 6,508 | N/A | 2005 | ||||||||||||||||||||||||||
Salem (leased through 2102)(3), NH | — | 6,083 | — | — | 6,083 | — | 6,083 | — | N/A | 2006 | ||||||||||||||||||||||||||
Signal Hill, CA | — | 9,652 | 2,940 | 1 | 9,652 | 2,941 | 12,593 | 754 | N/A | 2006 | ||||||||||||||||||||||||||
83
Initial cost to company | Gross amount at which carried at close of period | |||||||||||||||||||||||||||||||||||
Description | Encumbrances | Land | Building and improvements | Costs capitalized subsequent to acquisition | Land | Building and improvements | Total(2) | Accumulated depreciation and amortization(1) | Date of construction | Date acquired | ||||||||||||||||||||||||||
South Plainfield (leased through 2039)(3), NJ | 4,702 | — | 10,044 | 2,286 | — | 12,330 | 12,330 | 2,959 | N/A | 2007 | ||||||||||||||||||||||||||
Springfield, MA | 5,255 | 2,797 | 2,471 | 494 | 2,797 | 2,965 | 5,762 | 1,118 | 1993 | 1966 | ||||||||||||||||||||||||||
Springfield (leased through 2025)(3), PA | — | — | — | 80 | — | 80 | 80 | 80 | N/A | 2005 | ||||||||||||||||||||||||||
Staten Island, NY | — | 11,446 | 21,262 | 4,055 | 11,446 | 25,317 | 36,763 | 7,667 | N/A | 2004 | ||||||||||||||||||||||||||
Totowa, NJ | 22,729 | 120 | 11,994 | 5,544 | 92 | 17,566 | 17,658 | 13,722 | 1957/ 1999 | 1957 | ||||||||||||||||||||||||||
Turnersville, NJ | — | 900 | 1,342 | 1,708 | 900 | 3,049 | 3,949 | 2,228 | 1974 | 1974 | ||||||||||||||||||||||||||
Tyson’s Corner (leased through 2035)(3), VA | — | — | — | — | — | — | — | — | N/A | 2006 | ||||||||||||||||||||||||||
Union (2445 Springfield Avenue), NJ | 26,148 | 19,700 | 45,090 | — | 19,700 | 45,090 | 64,790 | 10,802 | N/A | 2007 | ||||||||||||||||||||||||||
Union (Route 22 and Morris Avenue), NJ | 29,668 | 3,025 | 7,470 | 3,634 | 3,025 | 11,104 | 14,129 | 5,978 | 1962 | 1962 | ||||||||||||||||||||||||||
Vallejo (leased through 2043)(3), CA | — | — | 2,945 | 221 | — | 3,166 | 3,166 | 863 | N/A | 2006 | ||||||||||||||||||||||||||
Walnut Creek (1149 South Main Street), CA | — | 2,699 | 19,930 | (1,112) | 2,699 | 18,818 | 21,517 | 219 | N/A | 2006 | ||||||||||||||||||||||||||
Walnut Creek (Mt. Diablo), CA | — | 5,909 | — | 1,691 | 5,908 | 1,692 | 7,600 | 306 | N/A | 2007 | ||||||||||||||||||||||||||
Watchung, NJ | 13,828 | 4,178 | 5,463 | 2,774 | 4,441 | 7,974 | 12,415 | 4,916 | 1994 | 1959 | ||||||||||||||||||||||||||
West Babylon, NY | — | 6,720 | 13,786 | 712 | 6,720 | 14,498 | 21,218 | 3,121 | N/A | 2007 | ||||||||||||||||||||||||||
Wheaton (leased through 2060)(3), MD | — | — | 5,367 | — | — | 5,367 | 5,367 | 1,375 | N/A | 2006 | ||||||||||||||||||||||||||
Wilkes-Barre (461 - 499 Mundy Street), PA | — | 6,053 | 26,646 | 1,146 | 6,053 | 27,792 | 33,845 | 6,501 | N/A | 2007 | ||||||||||||||||||||||||||
Woodbridge, NJ | 18,957 | 1,509 | 2,675 | 2,526 | 1,539 | 5,171 | 6,710 | 2,741 | 1959 | 1959 | ||||||||||||||||||||||||||
Wyomissing (leased through 2065)(3), PA | — | — | 2,646 | 1,869 | — | 4,515 | 4,515 | 3,348 | N/A | 2005 | ||||||||||||||||||||||||||
York, PA | 4,777 | 409 | 2,568 | 1,452 | 409 | 4,020 | 4,429 | 3,192 | 1970 | 1970 | ||||||||||||||||||||||||||
— | ||||||||||||||||||||||||||||||||||||
WAREHOUSES: | — | |||||||||||||||||||||||||||||||||||
East Hanover - Five Buildings, NJ | — | 576 | 7,752 | 29,694 | 691 | 37,332 | 38,023 | 16,196 | 1972 | 1972 | ||||||||||||||||||||||||||
TOTAL UE PROPERTIES | 1,205,560 | 374,755 | 1,089,248 | 669,502 | 384,217 | 1,749,290 | 2,133,507 | 539,967 | ||||||||||||||||||||||||||||
Leasehold Improvements, Equipment and Other | — | — | — | 4,993 | — | 4,993 | 4,993 | 1,110 | ||||||||||||||||||||||||||||
TOTAL | $ | 1,205,560 | $ | 374,755 | $ | 1,089,248 | $ | 674,495 | $ | 384,217 | $ | 1,754,283 | $ | 2,138,500 | $ | 541,077 | ||||||||||||||||||||
(1) | Depreciation of the buildings and improvements are calculated over lives ranging from the life of the lease to forty years. |
(2) | Aggregate cost for federal income tax purposes was $1.9 billion as of December 31, 2016. |
(3) | The Company is a lessee under a ground or building lease. The building will revert to the lessor upon lease expiration. |
84
URBAN EDGE PROPERTIES AND URBAN EDGE PROPERTIES LP
SCHEDULE III - REAL ESTATE AND ACCUMULATED DEPRECIATION
(Amounts in Thousands)
The following is a reconciliation of real estate assets and accumulated depreciation:
Year Ended December 31, | ||||||||||||
2016 | 2015 | 2014 | ||||||||||
Real Estate | ||||||||||||
Balance at beginning of period | $ | 2,084,642 | $ | 2,022,804 | $ | 1,984,172 | ||||||
Additions during the period: | ||||||||||||
Land | 2,667 | 10,984 | 6,077 | |||||||||
Buildings & improvements | 18,316 | 8,840 | 31,998 | |||||||||
Construction in progress | 47,234 | 52,602 | 3,169 | |||||||||
2,152,859 | 2,095,230 | 2,025,416 | ||||||||||
Less: Impairments and assets sold or written-off | (14,359 | ) | (10,588 | ) | (2,612 | ) | ||||||
Balance at end of period | $ | 2,138,500 | $ | 2,084,642 | $ | 2,022,804 | ||||||
Accumulated Depreciation | ||||||||||||
Balance at beginning of period | $ | 509,112 | $ | 467,503 | $ | 421,756 | ||||||
Additions charged to operating expenses | 42,989 | 52,197 | 48,359 | |||||||||
552,101 | 519,700 | 470,115 | ||||||||||
Less: Accumulated depreciation on assets written-off | (11,024 | ) | (10,588 | ) | (2,612 | ) | ||||||
Balance at end of period | $ | 541,077 | $ | 509,112 | $ | 467,503 | ||||||
85
INDEX TO EXHIBITS
The following exhibits are filed as part of this Annual Report on Form 10-K:
Exhibit Number | Exhibit Description | |
2.1 | Separation and Distribution Agreement by and among Vornado Realty Trust, Vornado Realty L.P., Urban Edge Properties and Urban Edge Properties LP, dated as of January 14, 2015 (incorporated by reference to Exhibit 2.1 to Form 8-K filed January 21, 2015) | |
3.1 | Declaration of Trust of Urban Edge Properties, as amended and restated (incorporated by reference to Exhibit 3.1 to Form 8-K filed January 21, 2015) | |
3.2 | Amended and Restated Bylaws of Urban Edge Properties (incorporated by reference to Exhibit 3.2 to Form 8-K filed January 21, 2015) | |
10.1 | Employment Offer Letter between Urban Edge Properties and Herb Eilberg (incorporated by reference to Exhibit 10.1 to Form 10-Q filed on May 4, 2016) | |
10.2 | Form of Non-Employee Trustee Restricted Stock Agreement under Urban Edge Properties 2015 Omnibus Share Plan (incorporated by reference to Exhibit 10.2 to Form 10-Q filed on May 4, 2016) | |
10.3 | Amendment to Transition Services Agreement by and between Vornado Realty Trust and Urban Edge Properties, dated as of June 28, 2016 (incorporated by reference to Exhibit 10.1 to Form 10-Q filed on August 5, 2016) | |
10.4 | Limited Partnership Agreement of Urban Edge Properties LP, dated as of January 14, 2015 (incorporated by reference to Exhibit 10.1 to Form 8-K filed January 21, 2015) | |
10.5 | Transition Services Agreement by and between Vornado Realty Trust and Urban Edge Properties, dated as of January 15, 2015 (incorporated by reference to Exhibit 10.2 to Form 8-K filed January 21, 2015) | |
10.6 | Tax Matters Agreement by and between Vornado Realty Trust and Urban Edge Properties, dated as of January 15, 2015 (incorporated by reference to Exhibit 10.3 to Form 8-K filed January 21, 2015) | |
10.7* | Employee Matters Agreement by and between Vornado Realty Trust, Vornado Realty L.P., Urban Edge Properties and Urban Edge Properties LP, dated as of January 15, 2015 (incorporated by reference to Exhibit 10.4 to Form 8-K filed January 21, 2015) | |
10.8* | Urban Edge Properties 2015 Omnibus Share Plan (incorporated by reference to Exhibit 10.5 to Form 8-K filed January 21, 2015) | |
10.9* | Form of Stock Option Agreement under Urban Edge Properties 2015 Omnibus Share Plan (incorporated by reference to Exhibit 10.6 to Form 8-K filed January 21, 2015) | |
10.10* | Form of Restricted Stock Agreement under Urban Edge Properties 2015 Omnibus Share Plan (incorporated by reference to Exhibit 10.7 to Form 8-K filed January 21, 2015) | |
10.11* | Form of Restricted LTIP Unit Agreement under Urban Edge Properties 2015 Omnibus Share Plan (incorporated by reference to Exhibit 10.8 to Form 8-K filed January 21, 2015) | |
10.12* | Form of Non-Employee Trustee Restricted LTIP Unit Agreement under Urban Edge Properties 2015 Omnibus Share Plan (incorporated by reference to Exhibit 10.9 to Form 8-K filed January 21, 2015) | |
10.13 | Revolving Credit Agreement among Urban Edge Properties LP, as Borrower, the Banks party thereto, and Wells Fargo Bank, National Association, as Administrative Agent, dated as of January 15, 2015 (incorporated by reference to Exhibit 10.10 to Form 8-K filed January 21, 2015) | |
10.14 | Loan and Security Agreement, between the Individual Borrowers party thereto, Towson VF L.L.C. and Vornado Finance II L.P., dated August 18, 2010 (incorporated by reference to Exhibit 10.5 to Amendment No. 2 to Form 10 filed November 13, 2014) | |
10.15 | Loan Agreement between VNO Bergen Mall Owner LLC and Wells Fargo Bank, National Association, dated March 25, 2013 (incorporated by reference to Exhibit 10.6 to Amendment No. 2 to Form 10 filed November 13, 2014) | |
10.16* | Amended and Restated Employment Agreement between Vornado Realty Trust and Jeffrey Olson (incorporated by reference to Exhibit 10.7 to Amendment No. 3 to Form 10 filed December 11, 2014) | |
10.17* | Amendment, dated as of January 14, 2015, to Amended and Restated Employment Agreement between Vornado Realty Trust and Jeffrey Olson (incorporated by reference to Exhibit 10.11 to Form 8-K filed January 21, 2015) | |
10.18* | Form of Indemnification Agreement between Urban Edge Properties and each of its trustees and executive officers (incorporated by reference to Exhibit 10.15 to Form 10-K/A filed on March 23, 2015) | |
10.19* | Urban Edge Properties 2015 Employee Share Purchase Plan (incorporated by reference to Exhibit 4.4 to Form S-8 filed February 17, 2015) | |
10.20* | Employment Agreement between Urban Edge Properties and Mark Langer (incorporated by reference to Exhibit 10.1 to Form 8-K filed on April 7, 2015) | |
86
10.21* | Employment Agreement between Urban Edge Properties and Robert Minutoli (incorporated by reference to Exhibit 10.2 to Form 10-Q filed on May 14, 2015) | |
10.22* | Form of Performance LTIP Unit Agreement (incorporated by reference to Exhibit 10.1 to Form 8-K filed on November 5, 2015) | |
21.1† | List of Subsidiaries | |
23.1† | Consent of Independent Registered Public Accounting Firm for Urban Edge Properties | |
23.2† | Consent of Independent Registered Public Accounting Firm for Urban Edge Properties LP | |
24.1† | Power of Attorney (included on signature page) | |
31.1† | Certification by the Chief Executive Officer for Urban Edge Properties pursuant to rule 13a-14(a)/15d-14(a) of the Securities Exchange Act of 1934, as adopted pursuant to Section 302 of the Sarbanes-Oxley Act of 2002 | |
31.2† | Certification by the Chief Financial Officer for Urban Edge Properties pursuant to rule 13a-14(a)/15d-14(a) of the Securities Exchange Act of 1934, as adopted pursuant to Section 302 of the Sarbanes-Oxley Act of 2002 | |
31.3† | Certification by the Chief Executive Officer for Urban Edge Properties LP pursuant to rule 13a-14(a)/15d-14(a) of the Securities Exchange Act of 1934, as adopted pursuant to Section 302 of the Sarbanes-Oxley Act of 2002 | |
31.4† | Certification by the Chief Financial Officer for Urban Edge Properties LP pursuant to rule 13a-14(a)/15d-14(a) of the Securities Exchange Act of 1934, as adopted pursuant to Section 302 of the Sarbanes-Oxley Act of 2002 | |
32.1† | Certification by the Chief Executive Officer and Chief Financial Officer for Urban Edge Properties pursuant to 18 U.S.C. Section 1350, as adopted pursuant to Section 906 of the Sarbanes-Oxley Act of 2002 | |
32.2† | Certification by the Chief Executive Officer and Chief Financial Officer for Urban Edge Properties LP pursuant to 18 U.S.C. Section 1350, as adopted pursuant to Section 906 of the Sarbanes-Oxley Act of 2002 | |
101.INS | XBRL Instance Document | |
101.SCH | XBRL Taxonomy Extension Schema | |
101.CAL | XBRL Extension Calculation Linkbase | |
101.LAB | XBRL Extension Labels Linkbase | |
101.PRE | XBRL Taxonomy Extension Presentation Linkbase | |
101.DEF | XBRL Taxonomy Extension Definition Linkbase | |
* Management contracts and compensatory plans or arrangements required to be filed pursuant to Item 15(b) of Form 10-K.
† Filed electronically herewith
87