Attached files
| file | filename |
|---|---|
| EX-31.1 - EXHIBIT 31.1 CEO 302 CERT WFT 123116 - Weatherford International plc | ex311ceo302certwft123116.htm |
| EX-21.1 - EXHIBIT 21.1 SIGNIFICANT SUBSIDIARIES 123116 - Weatherford International plc | ex211-significantsubswft12.htm |
| EX-32.2 - EXHIBIT 32.2 CFO 906 CERT WFT 123116 - Weatherford International plc | ex322cfo906certwft123116.htm |
| EX-32.1 - EXHIBIT 32.1 CEO 906 CERT WFT 123116 - Weatherford International plc | ex321ceo906certwft123116.htm |
| EX-31.2 - EXHIBIT 31.2 CFO 302 CERT WFT 123116 - Weatherford International plc | ex312cfo302certwft123116.htm |
| EX-23.1 - EXHIBIT 23.1 KPMG CONSENT WFT 123116 - Weatherford International plc | ex231-kpmgconsentwft123116.htm |
| EX-12.1 - EXHIBIT 12.1 RATIO OF EARNINGS TO FIXED CHARGES 123116 - Weatherford International plc | ex121-ratioofearningstofix.htm |
UNITED STATES | ||
SECURITIES AND EXCHANGE COMMISSION | ||
Washington, D.C. 20549 | ||
(Mark One) | Form 10-K | |||
þ | ANNUAL REPORT PURSUANT TO SECTION 13 OR 15(d) OF THE SECURITIES EXCHANGE ACT OF 1934 | |
For the fiscal year ended December 31, 2016 | ||
or | ||
¨ | TRANSITION REPORT PURSUANT TO SECTION 13 OR 15(d) OF THE SECURITIES EXCHANGE ACT OF 1934 | |
For the transition period from __________________________________to __________________________________ | ||
Commission file number 001-36504 | ||
Weatherford International public limited company
(Exact name of registrant as specified in its charter)
Ireland | 98-0606750 | |
(State or other jurisdiction of incorporation or organization) | (I.R.S. Employer Identification No.) | |
Bahnhofstrasse 1, 6340 Baar, Switzerland | CH 6340 | |
(Address of principal executive offices) | (Zip Code) | |
Registrant’s telephone number, including area code: +41.22.816.1500
Securities registered pursuant to Section 12(b) of the Act:
Title of each class | Name of each exchange on which registered | |
Ordinary Shares, par value $0.001 per share | New York Stock Exchange | |
Securities registered pursuant to Section 12(g) of the Act: None
Indicate by check mark if the registrant is a well-known seasoned issuer, as defined in Rule 405 of the Securities Act. Yes o No þ
Indicate by check mark if the registrant is not required to file reports pursuant to Section 13 or Section 15(d) of the Act. Yes o No þ
Indicate by check mark whether the registrant: (1) has filed all reports required to be filed by Section 13 or 15(d) of the Securities Exchange Act of 1934 during the preceding 12 months (or for such shorter period that the registrant was required to file such reports), and (2) has been subject to such filing requirements for the past 90 days. Yes þ No o
Indicate by check mark whether the registrant has submitted electronically and posted on its corporate Web site, if any, every Interactive Data File required to be submitted and posted pursuant to Rule 405 of Regulation S-T during the preceding 12 months (or for such shorter period that the registrant was required to submit and post such files). Yes þ No o
Indicate by check mark if disclosure of delinquent filers pursuant to Item 405 of Regulation S-K is not contained herein, and will not be contained, to the best of registrant’s knowledge, in definitive proxy or information statements incorporated by reference in Part III of this Form 10-K or any amendment to this Form 10-K. o
Indicate by check mark whether the registrant is a large accelerated filer, an accelerated filer, a non-accelerated filer, or a smaller reporting company. See the definitions of “large accelerated filer,” “accelerated filer” and “smaller reporting company” in Rule 12b-2 of the Exchange Act.
Large accelerated filer þ | Accelerated filer o | Non-accelerated filer o | Smaller reporting company o |
Indicate by check mark whether the registrant is a shell company (as defined in Rule 12b-2 of the Act). Yes o No þ
The aggregate market value of the voting stock held by non-affiliates of the registrant as of June 30, 2016 was approximately $5.0 billion based upon the closing price on the New York Stock Exchange as of such date.
The registrant had 983,392,495 ordinary shares outstanding as of February 6, 2017.
DOCUMENTS INCORPORATED BY REFERENCE
Portions of the registrant’s proxy statement for the 2017 Annual General Meeting of Shareholders to be held on June 15, 2017 are incorporated into Part III of this Form 10-K.
Weatherford International plc
Form 10-K for the Year Ended December 31, 2016
Table of Contents
PAGE | ||
Item 1 | ||
Item 1A | ||
Item 1B | ||
Item 2 | ||
Item 3 | ||
Item 4 | ||
Item 5 | ||
Item 6 | ||
Item 7 | ||
Item 7A | ||
Item 8 | ||
Item 9 | ||
Item 9A | ||
Item 9B | ||
Item 10 | ||
Item 11 | ||
Item 12 | ||
Item 13 | ||
Item 14 | ||
Item 15 | ||
Item 16 | ||
1
Forward-Looking Statements
This report contains various statements relating to future financial performance and results, including certain projections, business trends and other statements that are not historical facts. These statements constitute forward-looking statements. These forward-looking statements generally are identified by the words “believe,” “project,” “expect,” “anticipate,” “estimate,” “intend,” “budget,” “strategy,” “plan,” “guidance,” “outlook,” “may,” “should,” “could,” “will,” “would,” “will be,” “will continue,” “will likely result,” and similar expressions, although not all forward-looking statements contain these identifying words.
Forward-looking statements reflect our beliefs and expectations based on current estimates and projections. While we believe these expectations, and the estimates and projections on which they are based, are reasonable and were made in good faith, these statements are subject to numerous risks and uncertainties. Accordingly, our actual outcomes and results may differ materially from what we have expressed or forecasted in the forward-looking statements. Furthermore, from time to time, we update the various factors we consider in making our forward-looking statements and the assumptions we use in those statements. However, we undertake no obligation to correct, update or revise any forward-looking statement, whether as a result of new information, future events, or otherwise, except to the extent required under federal securities laws. The following sets forth various assumptions we use in our forward-looking statements, as well as risks and uncertainties relating to those statements. Certain of these risks and uncertainties may cause actual results to be materially different from projected results contained in forward-looking statements in this report and in our other disclosures. These risks and uncertainties include, but are not limited to, those described below under “Item 1A. – Risk Factors” and the following:
• | the price and price volatility of oil, natural gas and natural gas liquids; |
• | global political, economic and market conditions, political disturbances, war, terrorist attacks, changes in global trade policies, weak local economic conditions and international currency fluctuations; |
• | nonrealization of expected benefits from our acquisitions or business dispositions and our ability to execute such acquisitions and dispositions; |
• | our ability to realize expected revenues and profitability levels from current and future contracts; |
• | our ability to manage our workforce, supply chain and business processes, information technology systems and technological innovation and commercialization, including the impact of our cost and support reduction plans; |
• | our high level of indebtedness; |
• | increases in the prices and availability of our raw materials; |
• | potential non-cash asset impairment charges for long-lived assets, goodwill, intangible assets or other assets; |
• | changes to our effective tax rate; |
• | nonrealization of potential earnouts associated with business dispositions; |
• | downturns in our industry which could further affect the carrying value of our goodwill; |
• | member-country quota compliance within the Organization of Petroleum Exporting Countries (“OPEC”); |
• | adverse weather conditions in certain regions of our operations; |
• | our ability to realize the expected benefits from our redomestication from Switzerland to Ireland and to maintain our Swiss tax residency; |
• | failure to ensure on-going compliance with current and future laws and government regulations, including but not limited to environmental and tax and accounting laws, rules and regulations; and |
• | limited access to capital, significantly higher cost of capital, or difficulty raising additional funds in the equity or debt capital markets. |
Finally, our future results will depend upon various other risks and uncertainties, including, but not limited to, those detailed in our other filings with the SEC under the Securities Exchange Act of 1934, as amended (the “Exchange Act”) and the Securities Act. For additional information regarding risks and uncertainties, see our other filings with the SEC.
2
PART I
Item 1. Business
Weatherford International plc, an Irish public limited company and Swiss tax resident, together with its subsidiaries (“Weatherford,” the “Company,” “we,” “us” and “our”), is a multinational oilfield service company. Weatherford is one of the world’s leading providers of equipment and services used in the drilling, evaluation, completion, production and intervention of oil and natural gas wells. Many of our businesses, including those of our predecessor companies, have been operating for more than 50 years.
We conduct operations in approximately 90 countries and have service and sales locations in nearly all of the oil and natural gas producing regions in the world. Our operational performance is reviewed on a geographic basis and we report the following regions as separate, distinct reporting segments: North America, Latin America, Europe/Sub-Sahara Africa (“SSA”)/Russia, Middle East/North Africa (“MENA”)/Asia Pacific and Land Drilling Rigs.
Our headquarters are located at Bahnhofstrasse 1, 6340 Baar, Switzerland and our telephone number at that location is +41.22.816.1500. Our internet address is www.weatherford.com. General information about us, including our corporate governance policies, code of business conduct and charters for the committees of our Board of Directors, can be found on our website under the “Investor Relations” section. On our website we make available, free of charge, our annual reports on Form 10-K, quarterly reports on Form 10-Q, current reports on Form 8-K, and amendments to those reports filed or furnished pursuant to Section 13(a) or 15(d) of the Exchange Act as soon as reasonably practicable after we electronically file or furnish them to the SEC. The public may read and copy any materials we have filed with the SEC at the SEC’s Public Reference Room at 100 F Street, NE, Washington, DC 20549. Information on the operation of the Public Reference Room may be obtained by calling the SEC at 1-800-SEC-0330. The SEC maintains a website that contains our reports, proxy and information statements, and our other SEC filings. The address of that site is www.sec.gov. Our ordinary shares are listed on the NYSE under the symbol “WFT”.
Strategy
Our primary objective is to build stakeholder value through profitable growth in our core product lines with disciplined use of capital and a strong customer focus.
Principal components of our strategy include the following:
• | Continuously improving the efficiency, productivity and quality of our products and services and their respective delivery to our customers, in order to grow revenues and operating margins from our core operations (Formation Evaluation and Well Construction and Completion and Production) and Land Drilling Rigs in all of our geographic markets at a rate exceeding underlying market activity; |
• | A commitment to the innovation, invention and integration, development and commercialization of new products and service that meet the evolving needs of our customers across the reservoir lifecycle; and |
• | Further extending the process, productivity, service quality, safety and competency across our global infrastructure to meet client demands for our core products and services in an operationally efficient manner. |
Markets
We are a leading provider of equipment and services to the oil and natural gas exploration and production industry. Demand for our industry’s services and products depends upon commodity prices for oil and gas, the number of oil and natural gas wells drilled, the depth and drilling conditions of wells, the number of well completions, the depletion and age of existing wells and the level of workover activity worldwide.
Technology has become increasingly critical to the oil and natural gas marketplace as a result of the maturity of the world’s oil and natural gas reservoirs, the acceleration of production decline rates and the focus on complex well designs, including deepwater prospects. Clients continue to seek, test and use production-enabling technologies at an increasing rate. We have invested a substantial amount of our time and resources into building our technology offerings, which helps us to provide our clients with more efficient tools to find and produce oil and natural gas. We believe our products and services enable our clients to reduce their costs of drilling and production, increase production rates, or both. Furthermore, these offerings afford us additional opportunities to sell our core products and services to our clients.
3
Products and Services
Our principal business is to provide equipment and services to the oil and natural gas exploration and production industry, both on land and offshore, through our three business groups: (1) Formation Evaluation and Well Construction, (2) Completion and Production and (3) Land Drilling Rigs, which together include 14 product lines.
• | Formation Evaluation and Well Construction includes Managed-Pressure Drilling, Drilling Services, Tubular Running Services, Drilling Tools and Rental Equipment, Wireline Services, Testing and Production Services, Re-entry and Fishing Services, Cementing Products, Liner Systems, Reservoir Solutions and Surface Logging Systems. |
• | Completion and Production includes Artificial Lift Systems, Stimulation and Completion Systems. |
• | Land Drilling Rigs encompasses our land drilling rigs business, including the products and services ancillary thereto. |
Formation Evaluation and Well Construction
Within the Formation Evaluation and Well Construction business group we provide formation evaluation services from early well planning to reservoir management services, including core analysis, surface logging, well site geochemistry, logging while drilling and wireline services. Our full suite of formation evaluation services has broad applications across all types of reservoirs. We also provide well construction services to help clients ensure well integrity for the full life cycle of the well using reliable casing and tubing strings, cementation design, reliable liner top isolation and methods that ensure the well reaches total depth in the best condition possible. Further descriptions of our product lines are as follows:
Managed-Pressure Drilling helps to manage wellbore pressure and incorporates various technologies including rotating control devices and advanced automated control systems as well as several drilling techniques including closed-loop drilling, air drilling, managed-pressure drilling and underbalanced drilling.
Drilling Services includes directional drilling, logging while drilling, measurement while drilling and rotary steerable systems. This service line also includes our full range of downhole equipment including high temperature and high pressure sensors, drilling reamers and circulation subs.
Tubular Running Services provides equipment, tubular handling and tubular connection services for the drilling, completion and workover of oil or natural gas wells. The services include automated rig systems, real-time torque-monitoring and remote viewing of makeup and breakout verification.
Drilling Tools and Rental Equipment includes our patented tools and equipment for drilling oil and natural gas wells. This includes drillpipe and collars, bottomhole assembly tools, tubular-handling equipment, pressure-control equipment, and machine-shop services.
Wireline Services includes open hole and cased-hole logging services to measure the physical properties of underground formations to determine the production potential, location of resources and detection of cement and casing integrity issues of an oil and gas reservoir. The service line also includes well intervention and remediation operations that use cable to convey equipment into oil and natural gas wells.
Testing and Production Services provide well test data and slickline and intervention services. The service line includes drillstem test tools, surface well testing services, and multiphase flow measurement.
Re-entry and Fishing Services provides re-entry, fishing, wellbore cleaning and well abandonment services as well as advanced multilateral well systems.
Cementing Products allows operators to centralize the casing throughout the wellbore and control the displacement of cement and other fluids for proper zonal isolation. We offer specialized equipment including plugs, float and stage equipment, and torque-and-drag reduction technology. Our cementing engineers also analyze complex wells and provide all job requirements from pre-job planning to installation.
Liner Systems includes liner hangers, which allow suspension of strings of casing within a wellbore without the need to extend the casing to the surface. The service line offers a comprehensive liner-hanger portfolio, along with engineering and executional experience, for a wide range of applications, including high-temperature and high-pressure wells.
4
Reservoir Solutions provides rock and fluid analysis for the purpose of evaluating hydrocarbon resources, advisory solutions including engineering strategy and technologies for assets at various development stages, and software products for production optimization and drilling automation.
Surface Logging Systems provides real-time formation evaluation data from cuttings, gases, and fluids obtained while drilling the well. Our offerings include advanced gas analysis, drilling instrumentation, mud logging services and wellsite consultants.
Completion and Production
The Completion and Production business group provides a comprehensive line of products and services, plus specialized technologies, to effectively complete, stimulate and produce wells in all types of reservoirs. Our completion products, reservoir stimulation designs and engineering capabilities are delivered to unlock reserves in deepwater, unconventional and aging reservoirs. Our suite of production optimization services boosts field productivity and profitability through our artificial lift portfolio as well as production workflows and optimization software. Further descriptions are as follows:
Artificial Lift Systems provides a mechanical method to producing oil or gas from a well that is lacking sufficient reservoir pressure to produce oil or natural gas. We provide most forms of lift, including reciprocating rod lift systems, progressing cavity pumping, gas lift systems, hydraulic lift systems, plunger lift systems and hybrid lift systems for special applications. We also offer related automation and control systems.
Stimulation offers clients advanced chemical technology and services for safe and effective production enhancements. We provide a full fleet of pressure pumping assets and reservoir stimulation services, including acidizing, fracturing and fluid systems, cementing services and coiled tubing intervention. Our U.S. pressure pumping assets are currently idled.
Completion Systems includes downhole equipment and offers clients a comprehensive line of completion tools such as safety systems, production packers, reservoir monitoring, flow control, isolation packers, multi-stage fracturing systems, and sand control technologies.
Land Drilling Rigs
The Land Drilling Rigs business group provides onshore contract drilling services and related operations globally for the oil and gas industry. We operate a fleet of land drilling and workover rigs with a concentration in the Middle East and North Africa. With our technologically diverse fleet, we have the capabilities to perform a broad range of advanced drilling projects that include multi-well pad drilling, high pressure high temperature drilling, deep gas drilling, special well design and other unconventional drilling methods in various climatic conditions.
Other Business Data
Competition
We provide our products and services worldwide and compete in a variety of distinct segments with a number of competitors. Our principal competitors include Schlumberger, Halliburton, Baker Hughes (which is expected to be acquired by GE Oil and Gas in 2017), National Oilwell Varco, Noble Energy, Nabors Industries and Frank’s International. We also compete with various other regional suppliers that provide a limited range of equipment and services tailored for local markets. Competition is based on a number of factors, including performance, safety, quality, reliability, service, price, response time and, in some cases, breadth of products. See “Item 1A. – Risk Factors – The oilfield services business is highly competitive, which may adversely affect our ability to succeed. Additionally, the impact of consolidation and acquisitions of our competitors is difficult to predict and may harm our business.”
Raw Materials
We purchase a wide variety of raw materials as well as parts and components made by other manufacturers and suppliers for use in our manufacturing. Many of the products or components of products sold by us are manufactured by other parties. We are not dependent in any material respect on any single supplier for our raw materials or purchased components.
5
Customers
Substantially all of our customers are engaged in the energy industry. Most of our international sales are to large international or national oil companies and these sales have resulted in a concentration of receivables from certain national oil companies worldwide, especially in Latin America. As of December 31, 2016, Latin America accounted for 38% of our net outstanding accounts receivables. Venezuela, Ecuador and Mexico represent 43%, 16% and 10%, respectively, of the Latin America balance. During 2016, 2015 and 2014, no individual customer accounted for 10% or more of our consolidated revenues.
Backlog
Our services are usually short-term in nature, day-rate based and cancellable should our customer wish to alter the scope of work. Consequently, our backlog of firm orders is not material to the Company.
Research, Development and Patents
We maintain world-class technology and training centers throughout the world. Additionally, we have research, development and engineering facilities that are focused on improving existing products and services and developing new technologies to meet customer demands for improved drilling performance and enhanced reservoir productivity. Weatherford has also developed significant expertise, trade secrets, and know-how with respect to manufacturing equipment and providing services. Our expenditures for research and development totaled $159 million in 2016, $231 million in 2015 and $290 million in 2014.
As many areas of our business rely on patents and proprietary technology, we seek patent protection both inside and outside the U.S. for products and methods that appear to have commercial significance. We amortize patents over the years that we expect to benefit from their existence, which typically extends from the grant of the patent through and until 20 years after the filing date of the patent application.
Although in the aggregate our patents are important to the manufacturing and marketing of many of our products and services, we do not believe that the expiration of any one of our patents would have a material adverse effect on our business.
Seasonality
Weather and natural phenomena can temporarily affect the level of demand for our products and services. Spring months in Canada and winter months in the North Sea and Russia can affect our operations negatively. Additionally, heavy rains or an exceedingly cold winter in a given region or climate changes may impact our results. The unpredictable impact of climate changes or unusually harsh weather conditions could lengthen the periods of reduced activity and have a detrimental impact to our results of operations. The widespread geographical locations of our operations serve to mitigate the overall impact of the seasonal nature of our business.
Federal Regulation and Environmental Matters
Our operations are subject to federal, state and local laws and regulations relating to the energy industry in general and the environment in particular. In December 2015, the U.S. Environmental Protection Agency (“EPA”) conducted an investigation and records review regarding our pressure pumping facilities for perceived violations of the Resource Conservation and Recovery Act (“RCRA”). The EPA has alleged that we failed to meet RCRA notification requirements and failed to operate within its stated generator status. During 2016, we settled and paid a fine of $335,200 related to this matter.
Our 2016 expenditures to comply with environmental laws and regulations were not material, and we currently do not expect the cost of compliance with environmental laws and regulations for 2017 to be material.
6
Employees
As of December 31, 2016, we employed approximately 30,000 employees, which is 24% and 46% lower than our workforce as of December 31, 2015 and 2014, respectively. In response to the significant decline in the price of crude oil and a lower level of exploration and production spending, we reduced our overall costs and workforce to better align with anticipated activity levels starting in 2014 and throughout 2015 and 2016. See “Item 8. – Financial Statements and Supplementary Data - Note 3 – Restructuring Charges” for details on our workforce reductions. Certain of our operations are subject to union contracts and these contracts cover approximately 17% of our employees. We believe we have a highly motivated and capable workforce despite the significant headcount reductions over the past two years, which were necessary to adapt our Company to the difficult market conditions.
Item 1A. Risk Factors
An investment in our securities involves various risks. You should consider carefully all of the risk factors described below, the matters discussed herein under “Forward-Looking Statements” and other information included and incorporated by reference in this Form 10-K, as well as in other reports and materials that we file with the SEC. If any of the risks described below or elsewhere in this Form 10-K were to materialize, our business, financial condition, results of operations, cash flows or prospects could be materially adversely affected. In such case, the trading price of our common stock could decline and you could lose part or all of your investment. Additional risks and uncertainties not currently known to us or that we currently deem immaterial may also materially adversely affect our financial condition, results of operations and cash flows.
Demand for our services and products is affected by fluctuations in oil and natural gas prices, especially a substantial or extended decline, which, in turn, affect the level of exploration, development and production activity of our customers and could have a material adverse effect on our business, financial condition, results of operations and impede our growth.
Demand for our services and products is tied to the level of exploration, development and production activity and the corresponding capital expenditures by oil and natural gas companies, including national oil companies. The level of exploration, development and production activity is directly affected by fluctuations in oil and natural gas prices, which historically have been volatile and are likely to continue to be volatile in the future, especially given current geopolitical and economic conditions. Therefore, declines in oil and natural gas prices or sustained low oil and natural gas prices (as has occurred since late 2014) or customer perceptions that oil and natural gas prices will remain depressed or further decrease in the future could result in a continued reduction in the demand and pricing for our equipment and will likely continue at lower rates for our services.
Prices for oil and natural gas are highly volatile and are subject to large fluctuations in response to relatively minor changes in the supply of and demand for oil and natural gas. For example, during 2016, West Texas Intermediate (“WTI”) crude oil prices on the New York Mercantile Exchange fluctuated from a low of less than $27.00 per barrel in the first quarter to a high of $54.06 per barrel in late December. Factors that can or could cause these price fluctuations include: excess supply of crude oil relative to demand; domestic and international drilling activity; global market uncertainty; the risk of slowing economic growth or recession in the United States, China, Europe or emerging markets; the ability of OPEC to set and maintain production levels for oil; the decision of OPEC to abandon production quotas and/or member-country quota compliance within OPEC; oil and gas production levels by non-OPEC countries; the nature and extent of governmental regulation, including environmental regulation; technological advances affecting energy consumption; adverse weather conditions and a variety of other economic factors that are beyond our control. Any perceived or actual further reduction in oil and natural gas prices will depress the immediate levels of exploration, development and production activity and decrease spending by our customers, which could have a material adverse effect on our business, financial condition and results of operations.
The substantial and sustained decline in oil and natural gas prices has led to a significant decrease in spending by our customers over the past two years, and further decreases in oil and natural gas prices could lead to further cuts in spending. Our customers also take into account the volatility of energy prices and other risk factors when determining whether to pursue capital projects and higher perceived risks generally mandate higher required returns. Any of these factors could affect the demand for oil and natural gas and could have a material adverse effect on our business, financial condition, results of operations and cash flow.
Our business is dependent on capital spending by our customers, and reductions in capital spending by our customers has had and could continue to have an adverse effect on our business, financial condition and results of operations.
The substantial and sustained decline in oil and natural gas prices has led to a significant decrease in capital expenditures by our customers. Most of our contracts can be cancelled by our customer at any time. Low commodity prices, the short-term tenor of most of our contracts and the extreme financial stress experienced by our customers (some of whom may have to seek bankruptcy protection) have combined to generate demands by many of our customers for significant reductions in the prices of our products
7
and services. Further reductions in capital spending or requests for further cost reductions by our customers could directly impact our business by reducing demand for our services and products and have a material adverse effect on our business, financial condition, results of operations and prospects. Spending by exploration and production companies can also be impacted by conditions in the capital markets, which have been volatile in recent years. Limitations on the availability of capital or higher costs of capital may cause exploration and production companies to make additional reductions to capital budgets even if oil and natural gas prices increase from current levels. Any such cuts in spending will curtail drilling programs as well as discretionary spending on well services, which may result in a reduction in the demand for our services, the rates we can charge and the utilization of our assets. Moreover, reduced discovery rates of new oil and natural gas reserves or a decrease in the development rate of reserves in our market areas, whether due to increased governmental regulation, limitations on exploration and drilling activity or other factors, could also have a material adverse impact on our business, even in a stronger oil and natural gas price environment. With respect to national oil company customers, we are also subject to risk of policy, regime, currency and budgetary changes all of which may affect their capital expenditures.
The credit risks of our concentrated customer base in the energy industry could result in losses.
The concentration of our customer base in the energy industry may impact our overall exposure to credit risk as our customers may be similarly affected by prolonged changes in economic and industry conditions. Some of our customers are experiencing extreme financial distress as a result of falling commodity prices and may be forced to seek protection under applicable bankruptcy laws. Furthermore, countries that rely heavily upon income from hydrocarbon exports have been negatively and significantly affected by the drop in oil prices, which could affect our ability to collect from our customers in these countries, particularly national oil companies. Laws in some jurisdictions in which we operate could make collection difficult or time consuming. We perform on-going credit evaluations of our customers and do not generally require collateral in support of our trade receivables. While we maintain reserves for potential credit losses, we cannot assure such reserves will be sufficient to meet write-offs of uncollectible receivables or that our losses from such receivables will be consistent with our expectations. Additionally, in the event of a bankruptcy of any of our customers, we may be treated as an unsecured creditor and may collect substantially less, or none, of the amounts owed to us by such customer.
Seasonal and weather conditions could adversely affect demand for our services and operations.
Variation from normal weather patterns, such as cooler or warmer summers and winters, can have a significant impact on demand. Adverse weather conditions, such as hurricanes in the Gulf of Mexico or extreme winter conditions in Canada, Russia and the North Sea, may interrupt or curtail our operations, or our customers’ operations, cause supply disruptions or loss of productivity or result in a loss of revenue or damage to our equipment and facilities, which may or may not be insured. Any of these outcomes could have a material adverse effect on our business, financial condition and results of operations.
The oilfield services business is highly competitive, which may adversely affect our ability to succeed. Additionally, the impact of consolidation and acquisitions of our competitors is difficult to predict and may harm our business.
Our business is highly competitive, particularly with respect to marketing our products and services to our customers and securing equipment and trained personnel. Currently the oilfield service industry has significant excess capacity relative to customer demand, and, in most cases, multiple sources of comparable oilfield services are available from a number of different competitors. This competitive environment could impact our ability to maintain market share, defend, maintain or increase pricing for our products and services and negotiate acceptable contract terms with our customers and suppliers. In order to remain competitive, we must continue to add value for our customers by providing, relative to our peers, new technologies, reliable products and services and competent personnel. The anticipated timing and cost of the development of competitive technology and new product introductions can impact our financial results, particularly if one of our competitors were to develop competing technology that accelerates the obsolescence of any of our products or services. Additionally, we may be disadvantaged competitively and financially by a significant movement of exploration and production operations to areas of the world in which we are not currently active, particularly if one or more of our competitors is already operating in that area of the world.
Recent, ongoing, and future mergers, combinations and consolidations in our industry could result in existing competitors increasing their market share and may result in stronger competitors, which in turn, could have a material adverse effect on our business, financial condition and results of operations. In 2016, Baker Hughes and GE Oil and Gas announced a plan to merge after the planned merger between Baker Hughes and Halliburton was called off earlier in the year. In 2016, Schlumberger and Cameron International completed their previously announced merger. We may not be able to compete successfully in an increasingly consolidated industry and cannot predict with certainty how industry consolidation will affect our other competitors or us.
8
Physical dangers are inherent in our operations and may expose us to significant potential losses. Personnel and property may be harmed during the process of drilling for oil and natural gas.
Drilling for and producing hydrocarbons, and the associated products and services that we provide, include inherent dangers that may lead to property damage, personal injury, death or the discharge of hazardous materials into the environment. Many of these events are outside our control. Typically, we provide products and services at a well site where our personnel and equipment are located together with personnel and equipment of our customer and third parties, such as other service providers. At many sites, we depend on other companies and personnel to conduct drilling operations in accordance with appropriate safety standards. From time to time, personnel are injured or equipment or property is damaged or destroyed as a result of accidents, failed equipment, faulty products or services, failure of safety measures, uncontained formation pressures or other dangers inherent in drilling for oil and natural gas. Any of these events can be the result of human error. With increasing frequency, our products and services are deployed on more challenging prospects both onshore and offshore, where the occurrence of the types of events mentioned above can have an even more catastrophic impact on people, equipment and the environment. Such events may expose us to significant potential losses.
We may not be fully indemnified against financial losses in all circumstances where damage to or loss of property, personal injury, death or environmental harm occur.
As is customary in our industry, our contracts typically require that our customers indemnify us for claims arising from the injury or death of their employees (and those of their other contractors), the loss or damage of their equipment (and that of their other contractors), damage to the well or reservoir and pollution originating from the customer’s equipment or from the reservoir (including uncontained oil flow from a reservoir) and claims arising from catastrophic events, such as a well blowout, fire, explosion and from pollution below the surface. Conversely, we typically indemnify our customers for claims arising from the injury or death of our employees, the loss or damage of our equipment (other than equipment lost in the hole) or pollution originating from our equipment above the surface of the earth or water.
Our indemnification arrangements may not protect us in every case. For example, from time to time we may enter into contracts with less favorable indemnities or perform work without a contract that protects us. Our indemnity arrangements may also be held to be overly broad in some courts and/or contrary to public policy in some jurisdictions, and to that extent unenforceable. Additionally, some jurisdictions which permit indemnification nonetheless limit its scope by statute. We may be subject to claims brought by third parties or government agencies with respect to which we are not indemnified. Furthermore, the parties from which we seek indemnity may not be solvent, may become bankrupt, may lack resources or insurance to honor their indemnities or may not otherwise be able to satisfy their indemnity obligations to us. The lack of enforceable indemnification could expose us to significant potential losses.
Further, our assets generally are not insured against loss from political violence such as war, terrorism or civil commotion. If any of our assets are damaged or destroyed as a result of an uninsured cause, we could recognize a loss of those assets.
Our business may be exposed to uninsured claims and, as a result, litigation might result in significant potential losses. The cost of our insured risk management program may increase.
In the ordinary course of business, we become the subject of various claims and litigation. We maintain liability insurance, which includes insurance against damage to people, property and the environment, up to maximum limits of $600 million, subject to self-insured retentions and deductibles.
Our insurance policies are subject to exclusions, limitations and other conditions and may not apply in all cases, for example where willful wrongdoing on our part is alleged. It is possible an unexpected judgment could be rendered against us in cases in which we could be uninsured and beyond the amounts we currently have reserved or anticipate incurring, and in some cases those potential losses could be material.
Our insurance may not be sufficient to cover any particular loss or our insurance may not cover all losses. For example, although we maintain product liability insurance, this type of insurance is limited in coverage and it is possible an adverse claim could arise in excess of our coverage. Additionally, insurance rates have in the past been subject to wide fluctuation and may be unavailable on terms that we or our customers believe are economically acceptable. Reductions in coverage, changes in the insurance markets and accidents affecting our industry may result in further increases in our cost and higher deductibles and retentions in future years and may also result in reduced activity levels in certain markets. Any of these events would have an adverse impact on our financial performance.
9
Our operations are subject to numerous laws and regulations, including environmental laws and regulations, that may expose us to significant liabilities and could reduce our business opportunities and revenues.
We are subject to various laws and regulations relating to the energy industry in general and the environment in particular. These laws are often complex and may not always be applied consistently in emerging markets. These laws and regulations often change and can cover broad subject matters, including tax, trade, customs (import/export) and the environment. In the case of environmental regulations, an environmental claim could arise with respect to one or more of our current businesses, products or services, or a business or property that one of our predecessors owned or used, and such claims could involve material expenditures. Generally, environmental laws have in recent years become more stringent and have sought to impose greater liability on a larger number of potentially responsible parties. The scope of regulation of our industry and our products and services may increase further, including possible increases in liabilities or funding requirements imposed by governmental agencies. We also cannot ensure that our future business in the deepwater Gulf of Mexico, if any, will be profitable in light of regulations that have been, and may continue to be, promulgated and in light of the current risk environment and insurance markets. Additional regulations on deepwater drilling elsewhere in the world could be imposed, and those regulations could limit our business where they are imposed.
In addition, members of the U.S. Congress, the U.S. Environmental Protection Agency and various agencies of several states within the U.S. frequently review, consider and propose more stringent regulation of hydraulic fracturing, a service we previously provided (and may, in the future, resume providing) to clients and regulators are investigating whether any chemicals used in the fracturing process might adversely affect groundwater or whether the fracturing processes could lead to other unintended effects or damages. For example, in December 2016, the EPA released its final report regarding the potential impacts of hydraulic fracturing on drinking water resources, concluding that water cycle activities associated with hydraulic fracturing may impact drinking water resources under certain circumstances. In recent years, several cities and states within the U.S. passed new laws and regulations concerning or banning hydraulic fracturing. A significant portion of North American service activity today is directed at prospects that require hydraulic fracturing in order to produce hydrocarbons. Therefore, additional regulation could increase the costs of conducting our business by subjecting fracturing to more stringent regulation. Such regulation, among other things, may change construction standards for wells intended for hydraulic fracturing, require additional certifications concerning the conduct of hydraulic fracturing operations, change requirements pertaining to the management of water used in hydraulic fracturing operations, require other measures intended to prevent operational hazards or ban hydraulic fracturing completely. Any such federal, state, local or foreign legislation could increase our costs of providing services or could materially reduce our business opportunities and revenues if our customers decrease their levels of activity in response to such regulation or if we are not able to pass along any cost increases to our customers. We are unable to predict whether changes in laws or regulations or any other governmental proposals or responses will ultimately occur, and accordingly, we are unable to assess the potential financial or operational impact they may have on our business.
Finally, in December 2015, the U.S. joined the international community at the 21st Conference of the Parties of the United Nations Framework Convention on Climate Change in Paris, France that requires member countries to review and “represent a progression” in their intended nationally determined contributions, which set greenhouse gas (“GHG”) emission reduction goals every five years beginning in 2020. The agreement entered into was in full force in November 2016. The implementation of this treaty and other efforts to reduce GHG emissions in the U.S. and other countries could materially affect our customers by reducing demand for oil and natural gas, thereby potentially materially affecting demand for our services.
10
We conduct some of our business using fixed-fee or turn-key contracts, which subject us to risks associated with cost over-runs, operating cost inflation and potential claims for liquidated damages.
We conduct our business under various types of contracts, including in some cases fixed-fee or turn-key contracts where we estimate costs in advance of our performance. We price these types of contracts based in part on assumptions including prices and availability of labor, equipment and materials as well as productivity, performance and future economic conditions. If our cost estimates prove inaccurate, there are errors or ambiguities as to contract specifications or if circumstances change due to, among other things, unanticipated technical problems, difficulties in obtaining permits or approvals, changes in local laws or labor conditions, weather delays, changes in the costs of equipment and materials or our suppliers’ or subcontractors’ inability to perform, then cost over-runs may occur. We may not be able to obtain compensation for additional work performed or expenses incurred in all cases. Additionally, in some contracts we may be required to pay liquidated damages if we do not achieve schedule or performance requirements of our contracts. Our failure to accurately estimate the resources and time required for fixed-fee contracts or our failure to complete our contractual obligations within the time frame and costs committed could result in reduced profits or a loss for that contract. If the contract is significant, or we encounter issues that impact multiple contracts, cost over-runs could have a material adverse effect on our business, financial condition and results of operations. For example, as of December 31, 2016, we recognized cumulative estimated project losses totaling $532 million related to our long-term early production facility construction contracts in Iraq that are accounted for under the percentage-of-completion method.
If our long-lived assets, goodwill, other intangible assets and other assets are further impaired, we may be required to record significant non-cash charges to our earnings.
We recognize impairments of goodwill to its implied fair value when the fair value of any of our reporting units becomes less than its carrying value. Our estimates of fair value are based on assumptions about future cash flows of each reporting unit, discount rates applied to these cash flows and current market estimates of value. Based on the uncertainty of future revenue growth rates, gross profit performance, and other assumptions used to estimate our reporting units’ fair value, future reductions in our expected cash flows could cause a material non-cash impairment charge of goodwill, which could have a material adverse effect on our results of operations and financial condition.
We also have certain long-lived assets, other intangible assets and other assets which could be at risk of impairment or may require reserves based upon anticipated future benefits to be derived from such assets. Any change in the valuation of such assets could have a material effect on our profitability. For example, during 2016, 2015 and 2014, we recognized long-lived asset impairment charges of $436 million, $638 million and $495 million, respectively.
We have significant operations that would be adversely impacted in the event of war, political instability or disruption, civil disturbance, regime changes, treaty changes, economic and legal sanctions, pandemics, changes in global trade policies or weak local economic conditions.
Like most multinational oilfield service companies, we have operations in certain international areas, including parts of the Middle East, Africa, Latin America, the Asia Pacific, Europe and Russia regions that are subject to significant risks of war, political instability and disruption, civil disturbance, regime changes, treaty changes, economic and legal sanctions (such as restrictions against countries that the U.S. government may deem to sponsor terrorism), pandemics, changes in global trade policies or weak local economic conditions. Our operations, which are subject to these various risks unique to each country in which we operate, may be restricted or prohibited if any of the foregoing risks occur, which in turn, could materially and adversely impact our results of operations:
• | disruption of oil and natural gas exploration and production activities; |
• | restriction of the movement and exchange of funds; |
• | our inability to collect receivables; |
• | loss of or nationalization of assets in affected jurisdictions; |
• | enactment of additional or stricter U.S., EU or other applicable government or international sanctions; and |
• | limitation of our access to markets for periods of time. |
For example, the economic sanctions against Russia resulting from its annexation of the Crimean region of Ukraine in March 2014 have, and may continue to, adversely impact our business, results of operations and financial condition of our Russia operations. In the event of further sanctions or changes to existing sanctions our ability to do business in Russia may be further reduced or impacted.
11
We risk loss of assets in any location where hostilities arise and persist. In these areas we also may not be able to perform the work we are contracted to perform, which could lead to forfeiture of performance bonds, or we may not be able to collect payment for work performed. Political instability in our regions of operation may also result in the need for additional security, resources and ability to quickly navigate a changing landscape. In addition, the trade and investment policies of the current U.S. administration regarding some jurisdictions where we operate is currently unclear.
We may not be able to complete the contemplated divestiture of our land drilling rigs or our pressure pumping business and we may not achieve the intended benefits of our 2014 divestitures.
In 2014, we divested certain of our non-core businesses (land drilling rigs in Russia and Venezuela, engineered chemistry and Integrity drilling fluids, pipeline and specialty services and production services). Due to sustained unfavorable market conditions, we have not yet completed the divestiture of the remaining portion of our land drilling rigs. Any such divestiture, accomplished through an initial public offering, a spin-off, an asset sale, or some combination of the foregoing, will be complex in nature and may be affected by unanticipated developments, such as the continued significant and sustained decrease in the price of crude oil, delays in obtaining regulatory or governmental approvals and challenges in establishing processes and infrastructure for both the underlying business and for potential investors or buyers of the business, which may result in such divestiture being delayed, or not being completed at all. There is no guarantee that we will fully realize the intended benefits of consummating such divestiture transactions.
In addition, in November 2016, we shut down our U.S. pressure pumping operations and idled the related assets. We currently intend to dispose of all assets, the related infrastructure and commitments, which we may not be able to conclude on in the intended time frame or with favorable pricing and terms.
We have been the subject of governmental and internal investigations related to alleged corrupt conduct and violations of U.S. sanctioned country laws, which were costly to conduct, resulted in a loss of revenue and substantial financial penalties and created other disruptions for the business. If we are the subject of such investigations in the future, it could have a material adverse effect on our business, financial condition and results of operations.
In 2013 and 2014, we settled investigations of prior alleged violations by us and certain of our subsidiaries related to certain trade sanctions laws, participation in the United Nations oil-for-food program governing sales of goods into Iraq and non-compliance with the Foreign Corrupt Practices Act (“FCPA”). These settlement agreements required us to pay $253 million and to retain, for a period of 18 months, an independent monitor responsible for assessing our compliance with the terms of the settlement agreements so as to address and reduce the risk of recurrence of alleged misconduct. Notwithstanding such internal control policies and procedures, including those related to training and compliance, programs for our employees and agents with respect to the FCPA, we cannot assure that our policies, procedures and programs always will prevent or protect us from reckless or criminal acts committed by our employees or agents.
To the extent we violate trade sanctions laws, the FCPA , the United Kingdom Bribery Act, or other laws or regulations in the future, additional fines and other penalties may be imposed and there would be uncertainty as to the ultimate amount of any penalties we could pay and there can be no assurance that actual fines or penalties, if any, will not have a material adverse effect on our business, financial condition and results of operations.
For additional information about these actions and claims, you should refer to the section entitled “Item 8. – Financial Statements and Supplementary Data – Notes to Consolidated Financial Statements – Note 21 – Disputes, Litigation and Contingencies.”
If another party claims that we have infringed its intellectual property rights, we may be subject to litigation or we may need to take remedial steps to eliminate or mitigate liability.
A third party may claim that we sell equipment or perform services that infringes the third party’s patent rights or unlawfully uses the third party’s trade secrets. Addressing such claims of patent infringement or trade secret misappropriation could result in significant legal and other costs, and may adversely impact our business. To resolve such claims, we may be required to enter into license agreements that require us to make royalty payments to continue selling equipment or providing of services. Alternatively, the development of non-infringing technologies could be costly. If an allegation of patent infringement or trade secret misappropriation cannot be resolved through a license agreement, we might not be able to continue selling particular equipment or providing particular services, which could adversely affect our financial condition, results of operations, and cash flow.
12
Our significant international operations subject us to economic and repatriation risks, and we may be adversely affected by changes in foreign currency including devaluation and changes in local banking and currency regulations and exchange controls.
We operate in virtually every oil and natural gas exploration and production region in the world. In some parts of the world, such as Latin America, the Middle East and Southeast Asia, the currency of our primary economic environment is generally the U.S. dollar, and we use the U.S. dollar as our functional currency. In other parts of the world, we conduct our business in currencies other than the U.S. dollar, and the functional currency is generally the applicable local currency. As such, we are exposed to significant currency exchange risk and devaluation risk. For example, in 2016, 2015 and 2014, we recognized pre-tax currency-related charges of $41 million, $85 million and $245 million, respectively. In 2016, currency devaluation charges reflect the impact of the devaluation of the Angolan kwanza and the Egyptian pound. In 2015, currency devaluation charges reflect the impacts of the devaluation of the Angolan kwanza and Argentine peso and the recognized remeasurement charges related to the Venezuelan bolivar and the Kazakhstani tenge. The charges in 2014 were related to the devaluation of the Venezuelan bolivar. For information about the currency devaluations, refer to the section entitled “Item 8. – Financial Statements and Supplementary Data – Notes to Consolidated Financial Statements – Note 1 – Summary of Significant Accounting Policies.” Any future change in the exchange rates in these or other countries could cause us to take additional charges on the foreign denominated assets held by our subsidiaries.
We are also subject to risks resulting from changes in the implementation of exchange controls, as well as limitations on our ability to reinvest earnings from operations in one country to fund the capital needs of our operations in other countries. If we are unable to reinvest earnings or repatriate foreign income, our liquidity may be negatively affected. Additionally, changing tax rules could result in an increased income tax expense on repatriation of funds.
Our business in Venezuela subjects us to actions by the Venezuelan government or our primary customer which could have a material adverse effect on our liquidity, results of operations and financial condition.
The future results of our Venezuelan operations may be adversely affected by many factors, including our ability to take action to mitigate the effect of future exchange controls, actions of the Venezuelan government and the general economic conditions in the country, continued inflation, and future customer payments and spending. We may continue to see a delay in payment on our receivables from our primary customer in Venezuela or may be compelled to accept bonds as payment, which may then be sold at a loss, similar to our bond transactions in 2016 and 2013 related to $120 million and $127 million of net trade receivables, respectively. During the second quarter of 2016, we accepted a note with a face value of $120 million from Petroleos de Venezuela, S.A. (“PDVSA”) in exchange for $120 million in net trade receivables. We carried the note at the lower of cost or fair value and recognized a loss in the second quarter of 2016 of $84 million to adjust the note to fair value. In the fourth quarter of 2016, we sold the economic rights in the note receivable for $44 million. If PDVSA further delays paying or fails to pay a significant amount of our outstanding receivables, or if there is a major action by the Venezuelan government, it could have a material adverse effect on our liquidity, consolidated results of operations and consolidated financial condition.
Credit rating agencies have lowered and could further lower our credit ratings.
Our credit ratings were downgraded by multiple credit rating agencies in 2016 and these agencies could further downgrade our credit ratings. Our Standard & Poor’s Global Ratings (“S&P”) credit rating on our senior unsecured debt and short-term ratings are both currently B with a negative outlook. Our Moody’s Investors Services (“Moody’s”) rating on our senior unsecured debt is currently Caa1 and our short-term rating is SGL-3, both with a negative outlook. Our Fitch Rating is CCC- for our senior unsecured debt and C for our short-term debt with a negative outlook. The lowering of our credit ratings to non-investment grade levels in 2016 resulted in our loss of access to the commercial paper market for our short-term liquidity needs. Furthermore, our non-investment grade status may further limit our ability to refinance our existing debt, could cause us to refinance or issue debt with less favorable and more restrictive terms and conditions, and could increase certain fees and interest rates of our borrowings. Suppliers and financial institutions may lower or eliminate the level of credit provided through payment terms or intraday funding when dealing with us thereby increasing the need for higher levels of cash on hand, which would decrease our ability to repay debt balances.
13
Our indebtedness and liabilities could limit cash flow available for our operations, expose us to risks that could adversely affect our business, financial condition and results of operations and impair our ability to satisfy our obligations under the notes.
Our indebtedness could have significant negative consequences for our business, results of operations and financial condition, including:
• | increasing our vulnerability to adverse economic and industry conditions; |
• | limiting our ability to obtain additional financing; |
• | requiring the dedication of a substantial portion of our cash flow from operations to service our indebtedness, thereby reducing the amount of our cash flow available for other purposes; |
• | limiting our flexibility in planning for, or reacting to, changes in our business; and |
• | placing us at a possible competitive disadvantage with less leveraged competitors or competitors that may have better access to capital resources. |
Any harm to our business and operations resulting from our current or future level of indebtedness could adversely affect our ability to pay amounts due on the notes.
If we are unable to comply with the restrictions and covenants in the agreements governing the Revolving Credit Agreement, the Term Loan Agreement and our other indebtedness, including our indentures, as supplemented (our “indentures”), there could be a default under the terms of these agreements, which could result in an acceleration of payment of funds that we have borrowed and would affect our ability to make principal and interest payments on the notes.
Any default under the agreements governing our indebtedness that is not cured or waived by the required lenders, and the remedies sought by the holders of any such indebtedness, could make us unable to pay principal and interest on the notes and substantially decrease the market value of the notes. If we are unable to generate sufficient cash flow and are otherwise unable to obtain funds necessary to meet required payments of principal and interest on our indebtedness, or if we otherwise fail to comply with the various covenants, including financial and operating covenants, in the agreements governing our indebtedness (including covenants in the Revolving Credit Agreement, the Term Loan Agreement and our indentures), we could be in default under the terms of such agreements. In the event of such default:
• | the holders of such indebtedness could elect to declare all the funds borrowed thereunder to be due and payable, together with accrued and unpaid interest; |
• | the lenders under such agreements could elect to terminate their commitment thereunder and cease making further loans; and |
• | we could be forced into bankruptcy or liquidation. |
If our operating performance declines, we may in the future need to obtain waivers under the Revolving Credit Agreement, the Term Loan Agreement or our indentures. If we breach our covenants under the Revolving Credit Agreement, the Term Loan Agreement or our indentures, and seek a waiver, we may not be able to obtain a waiver from the required lenders or noteholders. If this occurs, we would be in default under such agreements, the lenders or trustee could exercise their rights or remedies, as described above, and we could be forced into bankruptcy or liquidation.
The terms of the Revolving Credit Agreement and Term Loan Agreement restrict, and our indentures will restrict, our current and future operations, particularly our ability to respond to changes or to pursue our business strategies.
The Revolving Credit Agreement and Term Loan Agreement contain, and our indentures will contain, a number of restrictive covenants that impose significant operating and financial restrictions on us and may limit our ability to engage in acts that may be in our long-term best interest, including restrictions on our ability to:
• | incur additional indebtedness; |
• | pay dividends and make other distributions; |
• | prepay, redeem or repurchase certain debt; |
• | make loans and investments; |
14
• | sell assets and incur liens; |
• | enter into transactions with affiliates; |
• | enter into agreements restricting our subsidiaries’ ability to pay dividends; and |
• | consolidate, merge or sell all or substantially all of our assets. |
As a result of these restrictions, we may be:
• | limited in how we conduct our business; |
• | unable to raise additional debt of equity financing to operate during general economic or business downturns; or |
• | unable to compete effectively, execute our growth strategy or take advantage of new business opportunities. |
In addition, the restrictive covenants in the Revolving Credit Agreement and Term Loan Agreement require us to maintain specified financial ratios. Our ability to meet those financial ratios can be affected by events beyond our control.
A breach of the covenants under the Revolving Credit Agreement, the Term Loan Agreement or our indentures could result in an event of default thereunder. Such a default may allow the lenders or the trustee to accelerate the related indebtedness and may result in the acceleration of any other indebtedness to which a cross-acceleration or cross-default provision applies. In addition, an event of default under the Revolving Credit Agreement or Term Loan Agreement would permit the lenders thereunder to terminate all commitments. Furthermore, if we were unable to repay the amounts due and payable under the Term Loan Agreement, the lenders thereunder could proceed against the collateral granted to them to secure that indebtedness. In the event our lenders accelerate the repayment of our borrowings, we and our subsidiaries may not have sufficient assets to repay that indebtedness.
Capital financing may not be available to us at economic rates.
Credit and equity markets have been highly volatile in recent years, the cost to obtain capital financing has increased, and some markets may not be available at certain times. Credit and equity market conditions and the potential impact on liquidity of major financial institutions may have an adverse effect on our ability to fund operational needs or other activities through borrowings under either existing or newly created instruments in the public or private markets on terms we believe to be reasonable. If we are unable to borrow further via debt offerings or our credit facility, or to obtain additional equity financing, we could experience a reduction of liquidity and may result in difficulty funding our operations, repayment of short-term borrowings, payments of interest and other obligations. This could be detrimental to our business and have a material adverse effect on our liquidity, consolidated results of operations and financial condition.
A terrorist attack or other geopolitical crisis could have a material and adverse effect on our business.
We operate in many dangerous countries, such as Iraq, Nigeria, and Turkey in which acts of terrorism or political violence are a substantial and frequent risk. We also operate in countries not customarily considered dangerous, where terrorist acts have become more frequent. Such acts could result in kidnappings, illegal detainment, or the loss of life of our employees or contractors, a loss of equipment, which may or may not be insurable in all cases, or a cessation of business in an affected area. We cannot be certain that our security efforts will in all cases be sufficient to deter or prevent acts of political violence or terrorist strikes against us or our customers’ operations.
Our business could be negatively affected by cybersecurity threats and other disruptions.
We rely heavily on information systems to conduct and protect our business. These information systems are increasingly subject to sophisticated cybersecurity threats such as unauthorized access to data and systems, loss or destruction of data (including confidential customer information), computer viruses, or other malicious code, phishing and cyber attacks, and other similar events. These threats arise from numerous sources, not all of which are within our control, including fraud or malice on the part of third parties, accidental technological failure, electrical or telecommunication outages, failures of computer servers or other damage to our property or assets, or outbreaks of hostilities or terrorist acts.
Given the rapidly evolving nature of cyber threats, there can be no assurance that the systems we have designed and implemented to prevent or limit the effects of cyber incidents or attacks will be sufficient in preventing all such incidents or attacks, or avoiding a material impact to our systems when such incidents or attacks do occur. If we were to be subject to a cyber incident or attack, it could result in the disclosure of confidential or proprietary customer information, theft or loss of intellectual property, damage to our reputation with our customers and the market, failure to meet customer requirements or customer dissatisfaction, theft or
15
exposure to litigation, damage to equipment (which could cause environmental or safety issues) and other financial costs and losses. In addition, as cybersecurity threats continue to evolve, we may be required to devote additional resources to continue to enhance our protective measures or to investigate or remediate any cybersecurity vulnerabilities.
Our failure to maintain effective internal controls over financial reporting has resulted in governmental investigations, shareholder lawsuits, significant fines, penalties and settlements, and could further result in material misstatements in our financial statements which, in turn, could require us to restate financial statements, may cause investors to lose confidence in our reported financial information and could have an adverse effect on our share price or our debt ratings.
We have previously identified a material weakness in our internal controls over financial reporting that had resulted in a material weakness in accounting for income taxes. As of December 31, 2013, we remediated our material weakness in accounting for income taxes. We cannot assure that additional material weaknesses in our internal controls over financial reporting will not be identified in the future. Any failure to maintain or implement required new or improved controls, or any difficulties we encounter in their implementation, could result in additional material weaknesses, cause us to fail to meet our periodic reporting obligations or result in material misstatements in our financial statements. Any such failure could also adversely affect the results of periodic management evaluations regarding the effectiveness of our internal controls over financial reporting. The existence of a material weakness could result in errors in our financial statements that could result in a restatement of financial statements, cause us to fail to meet our reporting obligations and/or cause investors to lose confidence in our reported financial information, potentially leading to a decline in our share price.
The SEC and DOJ were investigating certain accounting issues associated with the material weakness in our internal control over financial reporting for income taxes and the restatements of our historical financial statements in 2011 and 2012. In September of 2016, we settled this matter for a total civil monetary penalty of $140 million, with $50 million due within 21 days from the settlement agreement and three installments of $30 million due in 2017. We also agreed to prepare and deliver certain reports and certifications to the SEC for the next 2 years regarding our tax internal controls. For additional information about these actions and claims, you should refer to the section entitled “Item 8. – Financial Statements and Supplementary Data – Notes to Consolidated Financial Statements – Note 21 – Disputes, Litigation and Contingencies.”
In addition to the SEC and DOJ investigations, in the past several years, we, and certain of our directors and officers, have been defendants in several shareholder derivative and class actions. These matters have been costly to settle and have required a significant amount of time and resources. For additional information about these actions and claims, you should refer to the section entitled “Item 8. – Financial Statements and Supplementary Data – Notes to Consolidated Financial Statements – Note 21 – Disputes, Litigation and Contingencies.”
Adverse changes in tax laws both in the United States and abroad, changes in tax rates or exposure to additional income tax liabilities could have a material adverse effect on our results of operations.
In 2002, we reorganized from the United States to a foreign jurisdiction. There are frequent legislative proposals in the United States that attempt to treat companies that have undertaken similar transactions as U.S. corporations subject to U.S. taxes or to limit the tax deductions or tax credits available to United States subsidiaries of these corporations. Our tax expense could be impacted by changes in tax laws, tax treaties or tax regulations or the interpretation or enforcement thereof or differing interpretation or enforcement of applicable law by the U.S. Internal Revenue Service and other taxing jurisdictions, acting in unison or separately. The inability to reduce our tax expense could have a material impact on our financial statements.
The Organization of Economic Cooperation and Development (“OECD”), which represents a coalition of member countries, has issued various white papers addressing Tax Base Erosion and Jurisdictional Profit Shifting. The recommendations in these white papers are generally aimed at combating what they believe is tax avoidance. Numerous jurisdictions in which we operate have been influenced by these white papers as well as other factors and are increasingly active in evaluating changes to their tax laws. Changes in tax laws could significantly increase our tax expense and require us to take actions, at potential significant expense, to seek to preserve our current level of tax expense.
Our effective tax rate has fluctuated in the past and may fluctuate in the future. Future effective tax rates could be affected by changes in the composition of earnings in countries in which we operate with differing tax rates, changes in tax laws, or changes in deferred tax assets and liabilities. We assess our deferred tax assets on a quarterly basis to determine whether a valuation allowance may be required. We have recorded a valuation allowance on substantially all of our current and future deferred tax assets. A prolonged downturn could result in us not being able to benefit future losses, which would negatively impact our financial results.
16
We may be prohibited from fully using our U.S. net operating loss carryforwards, which could affect our financial performance.
As a result of the recent losses we have incurred in the U.S., we have a valuation allowance against all future tax benefits of our U.S. net operating loss carryforwards. As of December 31, 2016, we had gross net operating loss (“NOL”) and research tax credit carryforwards of approximately $1.7 billion and $30 million, respectively for federal income tax purposes, expiring in varying amounts through the year 2036. Under Section 382 of the Internal Revenue Code of 1986, as amended, if a corporation undergoes an “ownership change,” generally defined as a greater than 50% change (by value) in its equity ownership over a three year period, the corporation’s ability to use its pre-change NOL carryforwards and other pre-change tax attributes (such as research tax credits) to offset its post-change income may be limited. As of December 31, 2016, we have not experienced an ownership change. Therefore our utilization of NOL carryforwards was not subject to an annual limitation. However, we may experience ownership changes in the future as a result of subsequent shifts in our stock ownership. As a result, if we earn taxable income, our ability to use our pre-change NOL carryforwards to offset U.S. federal taxable income may be subject to limitations, which could potentially result in increased future tax liability to us. In addition, at the state level, there may be periods during which the use of NOL carryforwards is suspended or otherwise limited, which could accelerate or permanently increase state taxes owed. Furthermore, these losses could expire before we generate sufficient income to utilize them.
The anticipated benefits of our redomestication to Ireland may not be realized. Additionally, we and our shareholders could be subject to increased taxation if we are considered to be a tax resident in both Switzerland and Ireland.
In 2014, we redomesticated from Switzerland to Ireland. We may not realize the benefits we anticipate from this redomestication. Our failure to realize those benefits could have an adverse effect on our business, results of operations and financial condition. Additionally, while we moved our place of incorporation from Switzerland to Ireland in 2014, we continue to be effectively managed from Switzerland. Under current Swiss law a company is regarded as a Swiss tax resident if it has its place of effective management in Switzerland or is incorporated in Switzerland. Where a company is treated as a tax resident of Switzerland as a result of having its place of effective management in Switzerland, Irish law provides Ireland will generally treat the company as not resident in Ireland for Irish tax purposes. We intend to maintain our place of effective management in Switzerland and therefore qualify as a Swiss, but not Irish, tax resident. However, it is possible that in the future, whether as a result of a change in law or tax treaty or how we manage our business that we could become a tax resident in Ireland in addition to Switzerland. If we were to be considered to be a tax resident of Ireland, we could become liable for Irish and Swiss corporation tax and any dividends paid to its shareholders could be subject to Irish and Swiss dividend withholding tax.
The rights of our shareholders are governed by Irish law; Irish law differs from the laws in effect in the United States and may afford less protection to holders of our securities.
As an Irish company, we are governed by the Irish Companies Act, which differs in some material respects from laws generally applicable to U.S. corporations and shareholders, including, among others, provisions relating to interested directors, mergers and acquisitions, takeovers, shareholder lawsuits and indemnification of directors. Likewise, the duties of directors and officers of an Irish company generally are owed to the company only. Shareholders of Irish companies generally do not have a personal right of action against directors or officers of the company and may exercise such rights of action on behalf of the company only in limited circumstances. Accordingly, holders of our securities may have more difficulty protecting their interests than would holders of securities of a corporation incorporated in a jurisdiction of the United States. Additionally, while we are an Irish company, we hold shareholders meetings in Switzerland, which may make attendance in person more difficult for some investors.
17
We are incorporated in Ireland and a significant portion of our assets are located outside the United States. As a result, it might not be possible for shareholders to enforce civil liability provisions of the federal or state securities laws of the United States.
We are organized under the laws of Ireland, and a significant portion of our assets are located outside the United States. The United States currently does not have a treaty with Ireland providing for the reciprocal recognition and enforcement of judgments in civil and commercial matters. As such, a shareholder who obtains a court judgment based on the civil liability provisions of U.S. federal or state securities laws may be unable to enforce the judgment against us in Ireland. In addition, there is some doubt as to whether the courts of Ireland and other countries would recognize or enforce judgments of U.S. courts obtained against us or our directors or officers based on the civil liabilities provisions of the federal or state securities laws of the United States or would hear actions against us or those persons based on those laws. The laws of Ireland do, however, as a general rule, provide that the judgments of the courts of the United States have the same validity in Ireland as if rendered by Irish Courts. Certain important requirements must be satisfied before the Irish Courts will recognize the U.S. judgment. The originating court must have been a court of competent jurisdiction, the judgment must be final and conclusive and the judgment may not be recognized if it was obtained by fraud or its recognition would be contrary to Irish public policy. Any judgment obtained in contravention of the rules of natural justice or that is irreconcilable with an earlier foreign judgment would not be enforced in Ireland.
Similarly, judgments might not be enforceable in countries other than the United States where we have assets.
Item 1B. Unresolved Staff Comments
None.
18
Item 2. Properties
Our operations are conducted in approximately 90 countries and we have manufacturing facilities, research and technology centers, fluids and processing centers and sales, service and distribution locations throughout the world. The following sets forth the locations of our principal owned or leased facilities for our commercial operations by geographic segment as of December 31, 2016:
Region | Specific Location |
North America: | Greenville, Houston, Huntsville, Katy, Longview, Odessa, Pasadena, and San Antonio, Texas; Broussard and Schriever, Louisiana; Williston, North Dakota; and Calgary, Edmonton, and Nisku, Canada. |
Latin America: | Cutral Co, Argentina; Rio de Janeiro, Brazil; Venustiano Carranza and Villahermosa, Mexico; and Anaco, Venezuela. |
Europe/SSA/Russia: | Langenhagen, Germany; Aberdeen, UK; Atyrau, Kazakhstan; Nizhnevartovsk, Russia; Port Harcourt, Nigeria and Stavanger, Norway. |
MENA/Asia Pacific: | Hassi Messaoud, Algeria; Luanda, Angola; Cairo, Egypt; Dhahran, Saudi Arabia; North Rumaila, Iraq; Abu Dhabi, Dubai and Sharjah, United Arab Emirates; Jiangsu and Shifang, China; Barmer, India; and Singapore, Singapore. |
Our headquarters are in Switzerland, with offices in Geneva and Baar, and we have corporate offices in Houston, Texas. We own or lease numerous other facilities such as service centers, shops and sales and administrative offices throughout the geographic regions in which we operate. Certain of material U.S. properties are all mortgaged to the lenders under our Term Loan. All of our remaining owned properties are unencumbered, however the lenders could require we mortgage them as well. We believe the facilities that we currently occupy are suitable for their intended use.
Item 3. Legal Proceedings
In the ordinary course of business, we are the subject of various claims and litigation. We maintain insurance to cover many of our potential losses, and we are subject to various self-retention limits and deductibles with respect to our insurance.
Please see the following:
• | “Item 1. – Business – Other Business Data – Federal Regulation and Environmental Matters,” which is incorporated by reference into this item. |
• | “Item 1A. – Risk Factors – We have been the subject of governmental and internal investigations related to alleged corrupt conduct and violations of U.S. sanctioned country laws, which were costly to conduct, resulted in a loss of revenue and substantial financial penalties and created other disruptions for the business. If we are the subject of such investigations in the future, it could have a material adverse effect on our business, financial condition and results of operations,” which is incorporated by reference into this item. |
• | “Item 8. – Financial Statements and Supplementary Data – Notes to Consolidated Financial Statements – Note 21 – Disputes, Litigation and Contingencies.” |
Although we are subject to various on-going items of litigation, we do not believe it is probable that any of the items of litigation to which we are currently subject will result in any material uninsured losses to us. It is possible, however, that an unexpected judgment could be rendered against us, or we could decide to resolve a case or cases that would result in a liability that could be uninsured and beyond the amounts we currently have reserved and in some cases those losses could be material.
Item 4. Mine Safety Disclosures
Not applicable.
19
PART II
Item 5. Market for Registrant’s Common Equity, Related Stockholder Matters and Issuer Purchases of Equity Securities
Our ordinary shares are traded under the symbol “WFT” on the New York Stock Exchange (“NYSE”). As of February 6, 2017, there were 1,707 shareholders of record. The following table sets forth, for the periods indicated, the range of high and low sales prices per share for our stock as reported on the NYSE.
Price | |||||||
High | Low | ||||||
Year ending December 31, 2016 | |||||||
First Quarter | $ | 8.80 | $ | 4.95 | |||
Second Quarter | 8.49 | 4.71 | |||||
Third Quarter | 6.39 | 5.01 | |||||
Fourth Quarter | 6.38 | 3.73 | |||||
Year ending December 31, 2015 | |||||||
First Quarter | $ | 13.12 | $ | 9.40 | |||
Second Quarter | 14.91 | 12.10 | |||||
Third Quarter | 12.35 | 7.21 | |||||
Fourth Quarter | 11.49 | 7.52 | |||||
On February 6, 2017, the closing sales price of our shares as reported by the NYSE was $6.00 per share. We have not declared or paid cash dividends on our shares since 1984. We intend to retain any future earnings and do not expect to pay any cash dividends in the near future.
Information concerning securities authorized for issuance under equity compensation plans is set forth in Part III of this report under “Item 12(d). – Securities Authorized for Issuance under Equity Compensation Plans,” which is incorporated by reference into this item.
20
Performance Graph
This graph compares the yearly cumulative return on our shares with the cumulative return on the Dow Jones U.S. Oil Equipment & Services Index and the Dow Jones U.S. Index for the last five years. The graph assumes the value of the investment in our shares and each index was $100 on December 31, 2011. The stockholder return set forth below is not necessarily indicative of future performance. The following graph and related information shall not be deemed “soliciting material” or to be “filed” with the SEC, nor shall such information be incorporated by reference into any future filing under the Securities Act or the Exchange Act, except to the extent that we specifically incorporate it by reference into such filing.
Comparison of Five-Year Cumulative Total Return
Weatherford ordinary shares, the Dow Jones U.S.
Oil Equipment and Services Index and
the Dow Jones U.S. Index
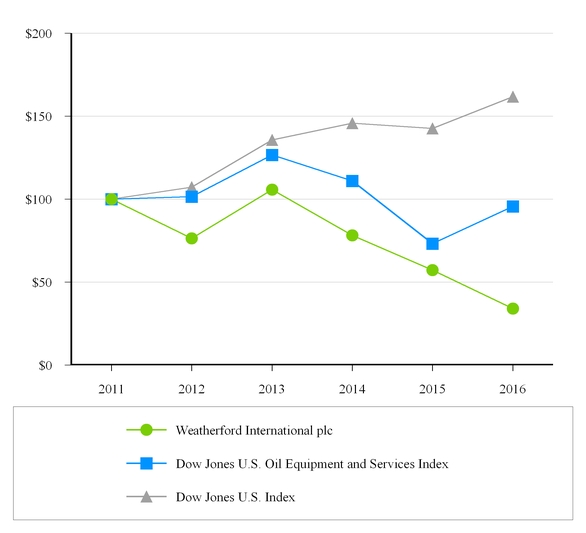
21
Item 6. Selected Financial Data
The following table sets forth certain selected historical consolidated financial data and should be read in conjunction with “Item 7. – Management’s Discussion and Analysis of Financial Condition and Results of Operations” and “Item 8. – Financial Statements and Supplementary Data,” which contain information on the comparability of the selected financial data and are both contained in this report. Discussion of material uncertainties is included in “Item 8. – Financial Statements and Supplementary Data – Notes to Consolidated Financial Statements – Note 21 – Disputes, Litigation and Contingencies.” The following information may not be indicative of our future operating results.
Year Ended December 31, | |||||||||||||||||||
(Dollars in millions, except per share amounts) | 2016 | 2015 | 2014 | 2013 | 2012 | ||||||||||||||
Statements of Operations Data: | |||||||||||||||||||
Revenues | $ | 5,749 | $ | 9,433 | $ | 14,911 | $ | 15,263 | $ | 15,215 | |||||||||
Operating Income (Loss) | (2,251 | ) | (1,546 | ) | 505 | 523 | 298 | ||||||||||||
Net Loss Attributable to Weatherford | (3,392 | ) | (1,985 | ) | (584 | ) | (345 | ) | (778 | ) | |||||||||
Basic Loss Per Share Attributable To Weatherford | (3.82 | ) | (2.55 | ) | (0.75 | ) | (0.45 | ) | (1.02 | ) | |||||||||
Diluted Loss Per Share Attributable To Weatherford | (3.82 | ) | (2.55 | ) | (0.75 | ) | (0.45 | ) | (1.02 | ) | |||||||||
Balance Sheet Data: | |||||||||||||||||||
Total Assets | $ | 12,664 | $ | 14,760 | $ | 18,854 | $ | 21,937 | $ | 22,751 | |||||||||
Short-term Borrowings and Current Portion of Long-term Debt | 179 | 1,582 | 727 | 1,653 | 1,585 | ||||||||||||||
Long-term Debt | 7,403 | 5,852 | 6,762 | 7,021 | 7,005 | ||||||||||||||
Total Shareholders’ Equity | 2,068 | 4,365 | 7,033 | 8,203 | 8,818 | ||||||||||||||
Cash Dividends Per Share | — | — | — | — | — | ||||||||||||||
22
Item 7. Management’s Discussion and Analysis of Financial Condition and Results of Operations
As used herein, the “Company,” “we,” “us” and “our” refer to Weatherford International plc (“Weatherford Ireland”), a public limited company organized under the laws of Ireland, and its subsidiaries on a consolidated basis, or for periods prior to June 17, 2014, to our predecessor, Weatherford International Ltd. (“Weatherford Switzerland”), a Swiss joint-stock corporation and its subsidiaries on a consolidated basis.
The following discussion should be read in conjunction with our Consolidated Financial Statements and Notes thereto included in “Item 8. – Financial Statements and Supplementary Data.” Our discussion includes various forward-looking statements about our markets, the demand for our products and services and our future results. These statements include certain risks and uncertainties. For information about these risks and uncertainties, refer to the section entitled “Forward-Looking Statements” and the section entitled “Item 1A. – Risk Factors.”
Overview
General
We conduct operations in approximately 90 countries and have service and sales locations in nearly all of the oil and natural gas producing regions in the world. Our operational performance is reviewed on a geographic basis, and we report the following regions as separate, distinct reporting segments: North America, MENA/Asia Pacific, Europe/SSA/Russia, Latin America and Land Drilling Rigs.
We principally provide products, equipment and services to the oil and natural gas exploration and production industry, both on land and offshore, through our three business groups: (1) Formation Evaluation and Well Construction and (2) Completion and Production, and (3) Land Drilling Rigs, which together include 14 product lines.
• | Formation Evaluation and Well Construction includes Managed-Pressure Drilling, Drilling Services, Tubular Running Services, Drilling Tools, Wireline Services, Testing and Production Services, Re-entry and Fishing, Cementing, Liner Systems, Reservoir Solutions and Surface Logging. |
• | Completion and Production includes Artificial Lift Systems, Stimulation and Completion Systems. |
• | Land Drilling Rigs encompasses our land drilling business, including the products and services ancillary thereto. |
We may sell our products and services separately or may bundle them together to provide integrated solutions up to, and including, integrated well construction where we are responsible for the entire process of drilling, constructing and completing a well. Our customers include both exploration and production companies and other oilfield service companies. Depending on the service line, customer and location, our contracts vary in their terms, provisions and indemnities. We earn revenues under our contracts when products are delivered and services are performed. Typically, we provide products and services at a well site where our personnel and equipment may be located together with personnel and equipment of our customer and third parties, such as other service providers. Our services are usually short-term in nature, day-rate based and cancellable should our customer wish to alter the scope of work. Consequently, our backlog of firm orders is not material to the Company.
Industry Trends
The level of spending in the energy industry is heavily influenced by the current and expected future prices of oil and natural gas. Changes in expenditures result in an increased or decreased demand for our products and services. Rig count is an indicator of the level of spending for the exploration for and production of oil and natural gas reserves. The following chart sets forth certain statistics that reflect historical market conditions:
23
WTI Oil (a) | Henry Hub Gas (b) | North American Rig Count (c) | International Rig Count (c) | ||||||||||
2016 | $ | 53.72 | $ | 3.68 | 770 | 925 | |||||||
2015 | 37.04 | 2.36 | 910 | 1,105 | |||||||||
2014 | 53.27 | 2.90 | 2,294 | 1,315 | |||||||||
(a) | Price per barrel of West Texas Intermediate (“WTI”) crude oil as of the last business day of the year indicated at Cushing Oklahoma – Source: Thomson Reuters |
(b) | Price per MM/BTU as of the last business day of the year indicated at Henry Hub Louisiana – Source: Thomson Reuters |
(c) | Quarterly average rig count – Source: Baker Hughes Rig Count |
West Texas Intermediate crude oil prices on the New York Mercantile Exchange fluctuated during 2016, ranging from a low of less than of $27.00 per barrel early in the first quarter to a high of $54.06 per barrel in late December. Natural gas ranged from a low of $1.64 MM/BTU in early March to a high of $3.83 MM/BTU in late December. Factors influencing oil and natural gas prices during the period include hydrocarbon inventory levels, realized and expected global economic growth, realized and expected levels of hydrocarbon demand, level of production capacity and weather and geopolitical uncertainty.
Outlook
In 2016, we continued to be challenged by the continued weakness in oil prices and severe market contraction for our product and services. We believe the bottom of the down cycle was reached during the third quarter and the industry is at the beginning of a modest recovery. The market weakness and contraction has materially reduced capital spending by our customers, which has reduced our revenue, both through lower activity levels and pricing. In response to the weakness in the price of crude oil and the decline in the anticipated level of exploration and production spending in 2016, we completed a workforce reduction of just under 10,000 during 2016, surpassing the initial 8,000 plan. We also exceeded our target to close nine manufacturing and service facilities during 2016 by closing 15. We planned to close over 70 of our operating and non-operating facilities in 2016 and ultimately closed nearly 80 locations.
In 2017, we expect growth in North America driven by completion systems, artificial lift, and drilling services as pricing power improves and supplies tighten. Internationally, we anticipate growth in the Middle East and North Africa regions as a result of the 2016 market share gains that began in the second half of that year are increasing to their full scope of work in 2017 while activity in Russia will increase and Europe is expected to remain stable. We believe Latin America will remain relatively subdued in 2017 while the deepwater markets in both Sub-Sahara Africa and Asia Pacific have likely reached their bottom with no expected improvements in the near term.
With recovering industry conditions, steadier oil prices and an increase in spending and activity, we believe that over the longer term the outlook for our core businesses is favorable. As decline rates accelerate and reservoir productivity complexities increase, our clients will continue to face challenges associated with decreasing the cost of extraction activities and securing desired rates of production. These challenges increase our customers’ requirements for technologies that improve productivity and efficiency and therefore increase demand for our products and services. These factors provide us with a positive outlook for our core businesses over the longer term. However, the level of improvement in our core businesses in the future will depend heavily on pricing, volume of work and our ability to offer solutions to more efficiently extract hydrocarbons, control costs and penetrate new and existing markets with our newly developed technologies.
We continually seek opportunities to maximize efficiency and value through various transactions, including purchases or dispositions of assets, businesses, investments or joint ventures. We evaluate our disposition candidates based on the strategic fit within our business and/or objectives. We intend to dispose of our U.S. pressure pumping business through a sale or by partnering up with another company to form a joint venture. It is also our intention to divest our remaining land drilling rigs when market conditions improve. Upon completion, the cash proceeds from any divestitures are expected to be used to for working capital or repay or repurchase debt. Any such debt reduction may include the repurchase of our outstanding senior notes prior to their maturity in the open market similar to the transactions from the second quarter 2016, or through a privately negotiated transaction or otherwise.
The oilfield services industry growth is highly dependent on many external factors, such as our customers’ capital expenditures, world economic and political conditions, the price of oil and natural gas, member-country quota compliance within the Organization of Petroleum Exporting Countries and weather conditions and other factors, including those described in the section entitled “Forward-Looking Statements” and the section entitled “Item 1A. – Risk Factors.”
24
Opportunities and Challenges
Our industry offers many opportunities and challenges. The cyclicality of the energy industry impacts the demand for our products and services. Certain of our products and services, such as our drilling and evaluation services, well installation services and well completion services, depend on the level of exploration and development activity and the completion phase of the well life cycle. Other products and services, such as our production optimization and artificial lift systems, are dependent on production activity. We have created a long-term strategy aimed at growing our businesses, servicing our customers, and most importantly, creating value for our shareholders. The success of our long-term strategy will be determined by our ability to manage effectively any industry cyclicality, including the ongoing and prolonged industry downturn and our ability to respond to industry demands and periods of over-supply or low oil prices, successfully maximize the benefits from our acquisitions and complete the disposition of our land drilling rigs business.
Overview of Significant Activities
Debt Transactions and Equity Issuances
During 2016, through a series of debt offerings we received net proceeds of $3.7 billion from the issuance of various unsecured debt instruments and a secured term loan. We used certain proceeds from our debt offerings to fund tender offers to buy back our senior notes with a principal balance of $1.9 billion and used the remaining proceeds to repay our revolving credit facility and for general corporate purposes. We recognized a cumulative loss of $78 million on the tender offers buyback transaction. See “Note 12 – Short-term Borrowings and Other Debt Obligations” and “Note 13 – Long-term Debt” for additional details of our financing activities.
During 2016, we received total cash proceeds of $1.1 billion from the issuance of 200 million ordinary shares of the Company. In addition, in November 2016 we issued one warrant that permits the holder to purchase 84.5 million ordinary shares on or prior to May 21, 2019 at an exercise price of $6.43 per ordinary share.
Summary of Operating Charges
For the year ended December 31, 2016 we had impairments, asset write-downs and other charges of $1.5 billion including $710 million related to long-lived asset impairments, asset write-downs, receivables write-offs and other charges and credits, $280 million of severance and restructuring charges, $220 million of litigation charges, $219 million of inventory write-downs and $114 million of pressure pumping related charges. The pressure pumping charges were related to our shutdown of the business.
For the year ended December 31, 2015 we had impairments, asset write-downs and other charges of $1.5 billion including $638 million of long-lived asset impairments, $232 million of severance and restructuring charges, $223 million of inventory write-downs, $130 million of pressure pumping supply contract related charges, $116 million of litigation charges, $48 million of bad debt expense charges and $83 million of other charges.
Long-lived Asset Impairments and Other Asset Charges
In 2016, the prolonged downturn in the oil and gas industry contributed to continued lower exploration and production spending and continued low utilization of our land drilling rigs and certain asset groups. During 2016, based on our impairment tests, we recognized long-lived asset impairment charges of $436 million of which $388 million was related to product line property, plant and equipment (“PP&E”) impairments and $48 million was related to the impairment of intangible assets. The PP&E impairment charges were related to our MENA/Asia Pacific Pressure Pumping and North America Well Construction, Drilling Services and Secure Drilling Service product lines. In 2016, we also recognized $114 million related to pressure pumping related charges in our North America segment. These long-lived asset impairments and other related charges are reported as “Long-Lived Asset Impairments, Write-Downs and Other Charges” on our Consolidated Statements of Operations.
In 2015, the weakness in crude oil prices contributed to lower exploration and production spending and a decline in the utilization of our land drilling rigs and certain U.S. asset groups. During 2015, based on our impairment tests, we recognized total long-lived impairment charges of $638 million with $383 million related to pressure pumping, drilling tools and wireline assets in the U.S. and $255 million related to Land Drilling Rigs segment assets. In 2015, we also recognized $130 million related to supply agreement charges in our North America segment. These long-lived asset impairments and other related charges are reported as “Long-Lived Asset Impairments, Write-Downs and Other Charges” on our Consolidated Statements of Operations.
In connection with our long-lived asset impairments in 2015, we prepared an analysis to determine the fair value of our equity method investments. We assessed these declines in value as other than temporary and recognized an impairment loss of $25 million.
25
For the year ended December 31, 2014, we had total non-cash asset impairment charges of $656 million. In the fourth quarter of 2014, we recognized a long-lived asset impairment of $352 million and a $40 million goodwill impairment charge to adjust the assets of our Land Drilling Rig business to fair value. In the second and third quarters of 2014, as a result of our commitment to sell our land drilling and workover rig operations in Russia and Venezuela, we recorded a $143 million long-lived asset impairment loss and a $121 million goodwill impairment loss.
See “Note 8 – Long-Lived Asset Impairments,” “Note 9 – Goodwill” and “Note 14 – Fair Value of Financial Instruments, Assets and Equity Investments” for additional information regarding the long-lived, other asset and goodwill impairments.
Recent Litigation Settlements
In 2016, the SEC and DOJ continued to investigate certain accounting issues associated with the material weakness in our internal control over financial reporting for income taxes and the restatements of our historical financial statements in 2011 and 2012. During the first quarter 2016, we recorded a loss contingency in the amount of $65 million. In the second quarter 2016, we increased our loss contingency to $140 million reflecting our best estimate for the potential settlement of this matter which ultimately became the final settlement. As disclosed in a Form 8-K filed on September 27, 2016, the Company agreed to pay the SEC a total civil monetary penalty of $140 million to resolve the investigation. For additional information about this resolution, see “Note 21 – Disputes, Litigation and Contingencies.”
On June 30, 2015, we settled a purported securities class action for $120 million in exchange for the dismissal with prejudice of the litigation and the unconditional release of all claims captioned Freedman v. Weatherford International Ltd., et al., that were filed in the Southern District of New York against us and certain current and former officers in March 2012. The settlement agreement was subject to notice to the class, approval by the U.S. District Court for the Southern District of New York and other conditions. The settlement amount was paid into escrow in August 2015. We are pursuing reimbursement from our insurance carriers and recovered $19 million of the settlement amount as of December 31, 2016. See “Note 21 – Disputes, Litigation and Contingencies” for additional information.
Prior Divestitures
Throughout 2014, we successfully disposed of several of our non-core businesses and an equity investment. We received cash proceeds totaling approximately $1.7 billion from these dispositions and used approximately $1.2 billion of the proceeds to reduce debt. For the year ended December 31, 2014, we recognized a gain on these dispositions of $349 million. Dispositions in 2014 included our land drilling and workover rig operations in Russia and Venezuela, pipeline and specialty services business, engineered chemistry and Integrity drilling fluids businesses and the disposal of all our shares in Proserv. See “Note 2 – Business Combinations and Divestitures” for additional information. In 2015 and 2016, we did not complete any material dispositions.
26
Results of Operations
The following table contains selected financial data comparing our consolidated and segment results from operations for 2016, 2015 and 2014. See “Notes to Consolidated Financial Statements – Note 23 – Segment Information” for additional information regarding variances in operating income.
Percentage Change | |||||||||||||||||
Year Ended December 31, | Favorable (Unfavorable) | ||||||||||||||||
(Dollars in millions, except per share data) | 2016 | 2015 | 2014 | 2016 vs 2015 | 2015 vs 2014 | ||||||||||||
Revenues: | |||||||||||||||||
North America | $ | 1,878 | $ | 3,494 | $ | 6,852 | (46 | )% | (49 | )% | |||||||
MENA/Asia Pacific | 1,453 | 1,947 | 2,406 | (25 | )% | (19 | )% | ||||||||||
Europe/SSA/Russia | 939 | 1,533 | 2,129 | (39 | )% | (28 | )% | ||||||||||
Latin America | 1,059 | 1,746 | 2,282 | (39 | )% | (23 | )% | ||||||||||
Subtotal | 5,329 | 8,720 | 13,669 | (39 | )% | (36 | )% | ||||||||||
Land Drilling Rigs | 420 | 713 | 1,242 | (41 | )% | (43 | )% | ||||||||||
Total Revenues | $ | 5,749 | $ | 9,433 | $ | 14,911 | (39 | )% | (37 | )% | |||||||
Operating Income (Loss): | |||||||||||||||||
North America | $ | (382 | ) | $ | (308 | ) | $ | 1,005 | (24 | )% | (131 | )% | |||||
MENA/Asia Pacific | 5 | (28 | ) | 115 | 118 | % | (124 | )% | |||||||||
Europe/SSA/Russia | (11 | ) | 173 | 367 | (106 | )% | (53 | )% | |||||||||
Latin America | 65 | 254 | 339 | (74 | )% | (25 | )% | ||||||||||
Subtotal | (323 | ) | 91 | 1,826 | (455 | )% | (95 | )% | |||||||||
Land Drilling Rigs | (87 | ) | (13 | ) | (103 | ) | (569 | )% | 87 | % | |||||||
Total Segment Operating Income (Loss) | (410 | ) | 78 | 1,723 | (626 | )% | (95 | )% | |||||||||
Research and Development | (159 | ) | (231 | ) | (290 | ) | 31 | % | 20 | % | |||||||
Corporate Expenses | (139 | ) | (194 | ) | (178 | ) | 28 | % | (9 | )% | |||||||
Long-Lived Asset Impairments, Write-Downs and Other | (1,043 | ) | (768 | ) | (495 | ) | (36 | )% | (55 | )% | |||||||
Restructuring Charges | (280 | ) | (232 | ) | (331 | ) | (21 | )% | 30 | % | |||||||
Litigation Charges, Net | (220 | ) | (116 | ) | — | (90 | )% | — | % | ||||||||
Goodwill and Equity Investment Impairment | — | (25 | ) | (161 | ) | 100 | % | 84 | % | ||||||||
Gain (Loss) on Sale of Businesses and Investments, Net | — | (6 | ) | 349 | 100 | % | (102 | )% | |||||||||
Other Items | — | (52 | ) | (112 | ) | 100 | % | 54 | % | ||||||||
Total Operating Income (Loss) | $ | (2,251 | ) | $ | (1,546 | ) | $ | 505 | (46 | )% | (406 | )% | |||||
Interest Expense, Net | $ | (499 | ) | $ | (468 | ) | $ | (498 | ) | (7 | )% | 6 | % | ||||
Bond Tender Premium, Net | (78 | ) | — | — | — | % | — | % | |||||||||
Currency Devaluation Charges | (41 | ) | (85 | ) | (245 | ) | 52 | % | 65 | % | |||||||
Other Income (Expense), Net | (8 | ) | 3 | (17 | ) | (367 | )% | 118 | % | ||||||||
Income Tax (Provision) Benefit | (496 | ) | 145 | (284 | ) | (442 | )% | 151 | % | ||||||||
Net Loss per Diluted Share | (3.82 | ) | (2.55 | ) | (0.75 | ) | (50 | )% | (240 | )% | |||||||
Weighted Average Diluted Shares Outstanding | 887 | 779 | 777 | (14 | )% | — | % | ||||||||||
Depreciation and Amortization | 956 | 1,200 | 1,371 | 20 | % | 12 | % | ||||||||||
27
Revenues
The following table contains the percentage distribution of our consolidated revenues by business groups for 2016, 2015 and 2014:
Year Ended December 31, | ||||||||
2016 | 2015 | 2014 | ||||||
Formation Evaluation and Well Construction | 57 | % | 55 | % | 52 | % | ||
Completion and Production | 36 | 37 | 40 | |||||
Land Drilling Rigs | 7 | 8 | 8 | |||||
Total | 100 | % | 100 | % | 100 | % | ||
Consolidated Revenues
2016 vs 2015 Consolidated Revenues Analysis
Consolidated revenues decreased $3.7 billion, or 39%, in 2016 compared to 2015. Revenues decreased in 2016 compared to 2015 across all our segments as follows:
• | North America revenues declined $1.6 billion, or 46%, in 2016 compared to 2015, due to the 15% decrease in North American rig count since December 31, 2015, continued customer pricing pressures and reduced exploration activity due to lower customer spending across our product lines in the United States and Canada. The significantly lower activity particularly impacted our artificial lift, well construction, and pressure pumping product lines; |
• | International segment revenues declined $1.8 billion, or 34%, in 2016 compared to 2015, due to the16% decrease in international rig count since December 31, 2015, continued customer pricing pressures and reduced activity from lower customer spending across our product lines. The MENA/Asia Pacific segment revenues declines were partly offset by an improvement from the recognition of revenue as part of the settlement agreement signed in the second quarter of 2016 for the Zubair percentage-of-completion project in Iraq; and |
• | Land Drilling Rigs revenues declined $293 million, or 41%, in 2016 compared to 2015, the decrease was primarily attributable to the decline in rig utilization and drilling activity consistent with the rig count declines. |
2015 vs 2014 Consolidated Revenues Analysis
Consolidated revenues decreased $5.5 billion, or 37%, in 2015 compared to 2014. Revenues decreased in 2015 compared to 2014 across all our segments as follows:
• | North America revenues declined $3.4 billion, or 49% in 2015 compared to 2014, consistent with the 60% decrease in North American rig count since December 31, 2014 with significant declines across product lines, particularly pressure pumping, drilling tools, artificial lift, intervention services and drilling services. The decline in the North America segment was driven by a combination of lower activity and customer pricing pressures, with the largest decline primarily in the United States. The disposition of our engineered chemistry business on December 31, 2014 also negatively impacted revenues when compared to the prior year; |
• | International segment revenues declined $1.6 billion, or 23% in 2015 compared to 2014, the decline is in line with the decrease in international rig count of 16% since December 31, 2014 as well as declines in revenue from Europe/SSA/Russia and MENA/Asia Pacific due to pricing pressures and reduced activity across all our product lines. Lastly, our Latin America segment experienced lower activity particularly in the Well Construction and Formation Evaluation product lines; and |
• | Land Drilling Rigs revenues declined $529 million, or 43% in 2015 compared to 2014, and is primarily attributable to the decline in drilling activity consistent with the rig count declines, decreases in new drilling activity and the 2014 disposal of our land drilling and workover rig operations in Russia and Venezuela. |
28
Operating Loss
2016 vs 2015 Operating Loss Drivers
Consolidated operating loss increased $705 million, or 46%, in 2016 compared to 2015. The higher operating loss was due to low customer activity levels and pricing pressures from the low price of crude oil. The decline was partly offset by income recognized from the settlement of our Zubair percentage-of-completion project, reduced corporate and research and development expenses, and other cost reduction measures.
Consolidated operating loss for 2016 includes $1.5 billion of charges as follows:
• | $710 million related to long-lived asset impairments, asset write-downs, receivables write-offs and other charges and credits; |
• | $280 million of severance and other restructuring charges; |
• | $220 million primarily for the increase in litigation reserves in the settlement of a restatement related litigation pertaining to prior periods with the SEC/DOJ; |
• | $219 million in inventory write-downs; and |
• | $114 million of U.S. pressure pumping related charges. |
2015 vs 2014 Operating Loss Drivers
Consolidated operating income decreased $2.1 billion, or 406%, in 2015 compared to 2014. The decrease in operating income is consistent with the reduction in activity resulting from the significant decline in both the price of oil and rig counts, which has put pressure on our pricing and has resulted in a lower volume of work.
Consolidated operating loss for 2015 includes $1.5 billion of charges as follows:
• | $768 million of long-lived asset impairment charges and supply contract related charges; |
• | $232 million of severance and other restructuring charges; |
• | $223 million in inventory write-downs and $48 million of bad debt expense charges; |
• | $116 million of litigation charges primarily for the settlement of a lawsuit related to the restatement of our historical financial statements in previous years; |
• | $58 million in professional and other fees, divestiture related charges and facility closures, loss on sale of businesses and investments, and other charges; and |
• | $25 million of equity investment impairment charges. |
Comparatively, in 2014, we had net charges of $750 million which include $495 million of long-lived asset charges, $161 million of goodwill impairment charges, $331 million of severance and restructuring charges and $112 million of non-core business and other charges. These charges we partially offset by a $349 million net gain on the sale of businesses and investments, which includes gains on the disposition of our engineered chemistry and Integrity drilling fluids businesses, Proserv investment and pipeline and specialty services business, offset by a loss on the sale of our land drilling and workover rigs operations.
For additional information regarding charges by segment, see the subsection entitled “Segment Revenues and Operating Income (Loss)” and “Restructuring Charges.”
Gain (Loss) on Sale of Businesses and Investments, Net
During 2016 and 2015, we did not recognize any material net gain or loss on sale of businesses and investments. During 2014, we recognized a $349 million net gain on sale of businesses and investments, which includes a $250 million gain on the disposition of our engineered chemistry and Integrity drilling fluids businesses, a $65 million gain on the disposition of our Proserv investment and a $49 million gain on the disposition of our pipeline and specialty services business. These gains were partially offset by a $15 million loss on the sale of our land drilling and workover rig operations in Russia and Venezuela.
29
Currency Devaluation Charges
Currency devaluation charges are included in current earnings in “Currency Devaluation Charges” on the accompanying Consolidated Statements of Operations. In 2016, currency devaluation charges reflect the impact of the devaluation of the Angolan kwanza of $31 million and Egyptian pound of $10 million. In 2015, currency devaluations charges were $85 million. These charges reflect the impacts of the devaluation of the Angolan kwanza of $39 million, $26 million related to the depreciated Venezuelan bolivar, $11 million related to the devaluation of the Argentina peso and $9 million related to the depreciated Kazakhstani tenge.
The devaluation of the Argentine peso was due to the modifying of currency control restrictions on purchasing foreign currencies by the Argentine Central Bank. The depreciation of the Kazakhstani tenge during 2015 occurred after the National Bank of Kazakhstan abandoned its peg of the tenge to the U.S. dollar. The Venezuelan bolivar charge reflects remeasurement charges when we began using the exchange rate published by the Venezuelan currency exchange system known as the “Marginal Currency System” or SIMADI. The SIMADI opened for trading in February 2015, replacing the Venezuela’s Supplementary Foreign Currency Administration System auction rate (“SICAD II”) mechanism. The SIMADI is intended to provide limited access to a free market rate of exchange.
In 2014, we recognized charges of $245 million on the devaluation of the Venezuelan bolivar. The charges were related to our adoption of the SICAD II exchange rate provided by Venezuela’s Supplementary Foreign Currency Administration System approximately of 50 Venezuelan bolivars per U.S. dollar. This rate was used at December 31, 2014 for the purposes of remeasuring Venezuelan bolivar denominated assets and liabilities (primarily cash, accounts receivables, trade payables and other current liabilities).
Segment Revenues and Operating Income (Loss)
North America Segment
2016 vs 2015 Results
Revenues in our North America segment decreased $1.6 billion, or 46%, in 2016 compared to 2015 primarily due to the 15% decline in the North America rig count since December 31, 2015, continued customer pricing pressures and reduced exploration activity due to lower customer spending across our product lines in the United States and Canada. The significantly lower activity particularly impacted our artificial lift, well construction, and pressure pumping product lines. Total revenues in the U.S. were $1.5 billion in 2016, $2.9 billion in 2015 and $5.6 billion in 2014. The remaining revenues of our North America segment of $355 million in 2016, $630 million in 2015 and $1.3 billion in 2014, were derived from our operations in Canada.
Operating loss in our North America segment worsened $74 million, or 24%, in 2016 compared to 2015 due to lower activity related to decreased customer spending and pricing pressure impacting artificial lift, completion and well construction, partly offset by cost savings from cost reduction efforts, minimizing operating losses despite large revenue declines. Operating margins were negative 20% in 2016 compared to negative 9% in 2015.
2015 vs 2014 Results
Revenues in our North America segment decreased $3.4 billion, or 49%, in 2015 compared to 2014 primarily due to the 60% decline in the North America rig count since December 31, 2014. The decline in revenue in 2015 was driven by lower activity and pricing pressure that broadly impacted all product lines, particularly pressure pumping, drilling tools, artificial lift, intervention services and drilling services. The disposition of our engineered chemistry business on December 31, 2014 also negatively impacted revenues when compared to the prior year.
Operating income in our North America segment decreased $1.3 billion, or 131%, in 2015 compared to 2014. Operating margins were negative 9% in 2015 compared to 15% in 2014. The same factors contributing to the decline in revenues directly contributed to the decline in operating income. During 2015, we recognized inventory write-down charges of $73 million and bad debt expense charges of $20 million.
30
MENA/Asia Pacific Segment
2016 vs 2015 Results
Revenues in our MENA/Asia Pacific segment decreased $494 million, or 25%, in 2016 compared to 2015. The revenue decline affected most countries, particularly in Australia, China and Malaysia of the Asia Pacific due to activity decline. Lower revenues in the Middle East were concentrated in Saudi Arabia and Iraq. Although all product lines were negatively impacted, the largest declines were in well construction, tubular running services, and completion.
Operating income improved $33 million, or 118%, in 2016 compared to 2015. The improvement was primarily attributable to the profit recognition from the Zubair contract settlement. Excluding charges to inventory, operating income was $6 million lower in 2016 compared to 2015.
2015 vs 2014 Results
Revenues in our MENA/Asia Pacific segment decreased $459 million, or 19%, in 2015 compared to 2014. The revenue decline affected most product lines although primarily intervention services, wireline, testing and production services, and well construction. The decline was attributable to lower revenues from our legacy Zubair contract in Iraq, lower activity in Yemen from the political disruption and lower activity levels in the Asia Pacific region, primarily in China, Indonesia and Malaysia. Pricing pressure also had an impact on the revenue decline. In addition, our lower revenues reflect the sale of the pipeline and specialty services business in September 2014.
Operating income decreased $143 million, or 124%, in 2015 compared to 2014. The decrease in operating income is primarily attributable to legacy contract project losses in Iraq, lower activity across most product lines and a gain on a step acquisition of a joint venture investment in China in 2014 that did not recur in 2015. The decline was also partially offset by improved profitability for the tubular running services line in 2015 and higher profitability resulting from the closure of unprofitable locations in 2014. During 2015, we recognized inventory write-down charges of $38 million and bad debt expense charges of $7 million.
Europe/SSA/Russia Segment
2016 vs 2015 Results
Revenues in our Europe/SSA/Russia segment decreased $594 million, or 39%, in 2016 compared to 2015. The decline in customer activity and overall lower demand broadly impacted all product lines, particularly in tubular running services, well construction, and completion and were concentrated in Russia, United Kingdom and Angola.
Operating income decreased $184 million, or 106%, in 2016 compared to 2015. The factors contributing to the revenue decline directly impacted the operating income decline.
2015 vs 2014 Results
Revenues in our Europe/SSA/Russia segment decreased $596 million, or 28%, in 2015 compared to 2014. The decline in activity directly impacted the decline in revenues in all product lines due to lower demand and pricing pressure. The overall decline was led by Europe, primarily in Norway and Romania. The lower activity from continued project delays and cancellations in Angola and Gabon in Sub-Sahara Africa contributed to the revenue decline while the sale of the pipeline and specialty services and engineered chemistry product lines in the third and fourth quarters of 2014 also resulted in lower segment revenues.
Operating income decreased $194 million, or 53%, in 2015 compared to 2014. The decline was the direct impact of lower revenue activity and pricing pressure as mentioned above. During 2015, we recognized inventory write-down charges of $32 million and bad debt expense charges of $12 million.
31
Latin America Segment
2016 vs 2015 Results
Revenues in our Latin America segment decreased $687 million, or 39%, in 2016 compared to 2015. The decline in revenue was concentrated in Brazil, Argentina, and Colombia due to customer pricing adjustments and budget spending reductions by our customers. All product lines were negatively impacted by the reduced demand, and managed-pressure drilling, well construction, and drilling services were most impacted. Operating income decreased $189 million, or 74%, in 2016 compared to 2015. The decline in operating income is primarily due to customer pricing adjustments as well as reduced demand broadly impacting all product lines.
2015 vs 2014 Results
Revenues in our Latin America segment decreased $536 million, or 23%, in 2015 compared to 2014. The decline in revenue is primarily due to reduced demand across our core product lines, primarily artificial lift, drilling services, intervention and pressure pumping in Mexico, Colombia, Venezuela and Ecuador, partially offset by an increase in sales in our managed-pressure drilling product line in Brazil.
Operating income decreased $85 million, or 25%, in 2015 compared to 2014. The same factors contributing to the decline in revenues directly contributed to the decline in operating income, which were partially offset by cost reduction initiatives in Mexico and a continued focus on higher margin activity in Brazil. During 2015, we recognized inventory write-down charges of $54 million and bad debt expense charges of $9 million.
Land Drilling Rigs Segment
2016 vs 2015 Results
Revenues in our Land Drilling Rigs segment decreased $293 million, or 41%, in 2016 compared to 2015 and were concentrated in the Middle East and North Africa. The operating loss degradation of $74 million, or 569%, in 2016 compared to 2015 and was also concentrated in the Middle East and North Africa. The decrease was primarily from lower rig utilization and from project delays due to rig maintenance along with overall reduced drilling activity.
2015 vs 2014 Results
Revenues in our Land Drilling Rigs segment decreased $529 million, or 43%, in 2015 compared to 2014. The decrease was due to the sale of the Russian Land Drilling Rigs business in July 2014, in addition to the overall decrease in the international rig count and drilling activity, partially offset by improved activity in Oman and Kuwait. Operating loss decreased $90 million, or 87%, in 2015 compared to 2014. The decrease is primarily the result of improved drilling efficiencies in Iraq and Oman and contract termination fees in Chad and India while 2014 included facility closure costs that did not reoccur in 2015. During 2015, we recognized inventory write-down charges of $26 million.
Interest Expense, Net
Net interest expense was $499 million in 2016 compared to $468 million in 2015. This increase of $31 million, or 7%, in 2016 compared to 2015 is primarily due to higher interest rates on the senior notes and exchangeable notes issued in 2016, partially offset by repayments and the repurchases of debt during 2016.
Net interest expense was $468 million in 2015 compared to $498 million in 2014. This decrease of $30 million, or 6%, in 2015 compared to 2014 was primarily due to a reduction in our debt balance as a result of lower net debt from divestiture proceeds received in 2014 and the repurchase of certain senior notes in 2014 and 2015.
32
Other Income/Expense, Net
We had other expense of $8 million in 2016, other income of $3 million in 2015 and other expense of $17 million in 2014. In 2016, other expense was primarily driven by losses on the repurchase of certain senior notes and by foreign currency exchange losses due to the strengthening U.S. dollar compared to our foreign denominated operations. This loss was partially offset by other income of $16 million related to the fair value adjustment to our warrant liability.
In 2015, other income of $3 million were primarily driven by gains on the repurchase of certain senior notes offset by foreign currency exchange losses due to the strengthening U.S. dollar compared to our foreign denominated operations. In 2014, other expense represented foreign currency exchange losses due to the weakening of foreign currencies of our foreign denominated operations compared to the U.S. dollar, partially offset by gains on the repurchase of certain senior notes.
Income Taxes
We provide for income taxes based on the laws and rates in effect in the countries in which operations are conducted, or in which we or our subsidiaries are considered resident for income tax purposes. We are exempt from Swiss cantonal and communal tax on income derived outside Switzerland, and are also granted participation relief from Swiss federal tax for qualifying dividend income and capital gains related to the sale of qualifying investments in subsidiaries. We expect that the participation relief will result in a full exemption of participation income from Swiss federal income tax.
The relationship between our pre-tax income or loss from continuing operations and our income tax benefit or provision varies from period to period as a result of various factors which include changes in total pre-tax income or loss, the jurisdictions in which our income is earned, the tax laws in those jurisdictions, the impacts of tax planning activities and the resolution of tax audits. Our income derived in Switzerland is taxed at a rate of 7.83%; however, our effective rate is substantially above the Swiss statutory tax rate as the majority of our operations are taxed in jurisdictions with much higher tax rates.
For the year ended December 31, 2016, we had a tax expense of $496 million on a loss before income taxes of $2.9 billion. The primary component of the income tax expense for 2016 relates to the Company’s conclusion that certain deferred tax assets that had previously been benefited are not more likely than not to be realized. As a result, additional valuation allowances have been established for the United States and other jurisdictions.
Weatherford records deferred tax assets for net operating losses and temporary differences between the book and tax basis of assets and liabilities that are expected to produce tax deductions in future periods. The ultimate realization of the deferred tax assets is dependent upon the generation of future taxable income during the periods in which those deferred tax assets would be deductible. The Company assesses the realizability of its deferred tax assets each period by considering whether it is more likely than not that all or a portion of the deferred tax assets will not be realized. The Company considers all available evidence (both positive and negative) when determining whether a valuation allowance is required. The Company evaluated possible sources of taxable income that may be available to realize the benefit of deferred tax assets, including projected future taxable income, the reversal of existing temporary differences, taxable income in carryback years and available tax planning strategies in making this assessment. The realizability of the deferred tax assets is dependent upon judgments and assumptions inherent in the determination of future taxable income, including factors such as future operation conditions (particularly as related to prevailing oil prices and market demand for our products and services).
Operations in the United States and other jurisdictions continue to experience losses due to the prolonged downturn in the demand for oil field services. Our expectations regarding the recovery were and are more measured due to the difficulties in obtaining pricing increases from our customers and a slower recovery in the U.S. land market. Also, the Company recorded significant long-lived asset impairments and established allowances for inventory and other assets in the third quarter of 2016. As a result of the historical and projected future losses, and limited objective positive evidence to overcome negative evidence, the Company concluded that it needed to record a valuation allowance of $526 million in the third quarter of 2016 against certain previously benefited deferred tax assets since it cannot support that it is more likely than not that the deferred tax assets will be realized. The valuation allowance primarily relates to operations in the United States.
The Company will continue to evaluate whether valuation allowances are needed in future reporting periods. Valuation allowances will remain until the Company can determine that net deferred tax assets are more likely than not to be realized. In the event that the Company were to determine that it would be able to realize the deferred income tax assets in the future as a result of significant improvement in earnings as a result of market conditions, the Company would adjust the valuation allowance, reducing the provision for income taxes in the period of such adjustment.
33
Our income tax provision in 2016 was $496 million compared to an income tax benefit of $145 million in 2015 and $284 million in 2014, respectively, which resulted in an effective tax rate of (17)%, 7% and (111)%, respectively. Our 2016 effective tax rate was driven by the tax valuation allowance, tax provision on loss before income taxes and charges without a significant tax benefit. Results for the year ended December 31, 2016 also include charges with no significant tax benefit principally related to $436 million of long-lived asset impairments, $219 million of excess and obsolete inventory charges, $140 million of settlement agreement charges, $114 million of pressure pumping related charges, $78 million of bond tender premium, $76 million of PDVSA note receivable net adjustment, $62 million in accounts receivable reserves and write-offs, and $41 million of currency devaluation related to the Angolan kwanza and Egyptian pound. In addition, we recorded $137 million for a non-cash tax expense related to an internal restructuring of subsidiaries.
In 2015, we had an income tax benefit of $145 million on a loss before income taxes of $2.1 billion. The income tax benefit was favorably impacted by a U.S. loss, which included restructuring impairment charges and a worthless stock deduction. Our results for 2015, includes $255 million of Land Drilling Rig impairment charges, $232 million of restructuring charges, $116 million of litigation settlements, $153 million of legacy project losses, $85 million of currency devaluation and related losses and $25 million of equity investment impairment, all with no significant tax benefit. In addition, we recorded a tax charge of $265 million for a non cash tax expense on distribution of subsidiary earnings.
In 2014, we had an income tax provision of $284 million on a loss before income taxes of $255 million. Our results for 2014 included a $161 million goodwill impairment charge, a $245 million loss due to the devaluation of Venezuela bolivar and $72 million of project losses related to our early production facility contracts in Iraq, all of which provided no tax benefit. In addition, we incurred a $495 million long-lived assets impairment charge, with limited tax benefit. During 2014, we also sold our land drilling and workover rig operations in Russia and Venezuela, pipeline and specialty services business, engineered chemistry, Integrity drilling fluids business and our equity investment in Proserv for a total gain of approximately $349 million. Our results in 2014 include significant tax losses in Mexico, Venezuela, and Iraq upon which we recorded valuation allowances of $172 million.
Our effective tax rate for these periods was also negatively impacted by the taxing regimes in certain countries and our operating structure. Several of the countries in which we operate, primarily in our MENA and SSA regions, tax us based on "deemed", rather than actual, profits. We are not currently profitable in certain of those countries, which results in us accruing and paying taxes based on a "deemed profit" instead of recognizing no tax expense or potentially recognizing a tax benefit. Our operating structure results in us paying withholding taxes on intercompany charges for items such as rentals, management fees, royalties, and interest as well as on applicable third party transactions. Such net withholding taxes were $88 million in 2016, $101 million in 2015 and $140 million in 2014 prior to possibly receiving a tax benefit in the jurisdiction of the payee. We also incur pre-tax losses in certain jurisdictions that do not have a corporate income tax and thus we are not able to recognize an income tax benefit on those losses.
Our effective tax rate improved in 2015 compared to 2014 primarily due to utilization of tax benefits on loss from operations, tax restructuring benefits and decrease in our reserve for uncertain tax positions due to audit settlements and statute expirations, offset by additional valuation allowances booked on non U.S. deferred tax assets and a tax charge for a non cash tax expense on distribution of subsidiary earnings. Our effective tax rate decreased from 2014 to 2015 primarily due to the sale of our non-core businesses during the year, non-tax deductible losses, such as the Venezuela bolivar devaluation, Iraq project losses and goodwill impairment, which are partially offset by the decrease of our reserve for uncertain tax benefits due to settlements and statute expirations.
We are continuously under tax examination in various jurisdictions. We cannot predict the timing or outcome regarding resolution of these tax examinations or if they will have a material impact on our financial statements. We anticipate that it is reasonably possible that the amount of uncertain tax positions may decrease by up to $40 million in the next twelve months due to expiration of statutes of limitations, settlements and/or conclusions of tax examinations.
34
Restructuring Charges
In response to continuing fluctuation of crude oil prices and lower levels of exploration and production spending in 2016, we initiated an additional plan to reduce our overall costs and workforce to better align with anticipated activity levels. This 2016 cost reduction plan (the “2016 Plan”) included a workforce reduction and other cost reduction measures initiated across our geographic regions. In 2015, we began and completed a cost reduction plan (the “2015 Plan”) targeting approximately 14,000 employee positions and other cost reduction measures to better align with lower anticipated business activity levels. In the first quarter of 2014, we announced a cost reduction plan (“the 2014 Plan”), which included a worldwide workforce reduction of more than 6,000 employee positions and other cost reduction measures in response to the significant decline in the price of crude oil and our anticipation of a lower level of exploration and production spending.
In connection with the 2016 Plan, we recognized restructuring charges of $280 million in 2016, which include severance benefits of $196 million, restructuring related asset charges of $44 million and other restructuring charges of $40 million. Other restructuring charges include contract termination costs, relocation and other associated costs.
In the fourth quarter of 2014, we announced the 2015 Plan to reduce costs, which included a worldwide workforce reduction and other cost reduction measures. In connection with the 2015 Plan, we recognized restructuring charges of $232 million in 2015 and $58 million in 2014. Our restructuring charges during 2015 in connection with the 2015 Plan include severance benefits of $149 million, restructuring related asset charges of $64 million and other restructuring charges of $19 million. Restructuring related asset charges include asset write-offs of $26 million related to Yemen due to the political disruption and $38 million in other regions. Other restructuring charges include exit costs, contract termination costs, relocation costs and other associated costs. Our restructuring charges during 2014 in connection with the 2015 Plan include severance benefits of $58 million.
In the first quarter of 2014, we announced the 2014 Plan to reduce costs, which included a worldwide workforce reduction and other cost reduction measures. In connection with the 2014 Plan, we recognized restructuring charges of $273 million in 2014. The restructuring charges in connection with the 2014 Plan include restructuring related asset charges of $135 million, severance benefits of $114 million and other restructuring charges of $24 million. Other restructuring charges include contract termination costs, relocation and other associated costs.
The impairments recognized in connection with the 2014 Plan primarily pertain to operations in our Middle East/North Africa (“MENA”) region, where geopolitical issues and recent disruptions in North Africa, primarily Libya, resulted in the decisions in the third quarter of 2014 to exit product lines in selected markets. The 2014 Plan activities resulted in $106 million of cash payments in 2014.
The following tables present the components of the restructuring charges by segment and plan for the years ended December 31, 2016, 2015 and 2014.
Year Ended December 31, 2016 | |||||||||
Other | Total | ||||||||
(Dollars in millions) | Severance | Restructuring | Severance and | ||||||
2016 Plan | Charges | Charges | Other Charges | ||||||
North America | $ | 38 | $ | 58 | $ | 96 | |||
MENA/Asia Pacific | 29 | 4 | 33 | ||||||
Europe/SSA/Russia | 27 | 9 | 36 | ||||||
Latin America | 43 | 13 | 56 | ||||||
Subtotal | 137 | 84 | 221 | ||||||
Land Drilling Rigs | 7 | — | 7 | ||||||
Corporate and Research and Development | 52 | — | 52 | ||||||
Total | $ | 196 | $ | 84 | $ | 280 | |||
35
Year Ended December 31, 2015 | |||||||||
Other | Total | ||||||||
(Dollars in millions) | Severance | Restructuring | Severance and | ||||||
2015 Plan | Charges | Charges | Other Charges | ||||||
North America | $ | 28 | $ | 24 | $ | 52 | |||
MENA/Asia Pacific | 21 | 35 | 56 | ||||||
Europe/SSA/Russia | 34 | 22 | 56 | ||||||
Latin America | 38 | 2 | 40 | ||||||
Subtotal | 121 | 83 | 204 | ||||||
Land Drilling Rigs | 12 | — | 12 | ||||||
Corporate and Research and Development | 16 | — | 16 | ||||||
Total | $ | 149 | $ | 83 | $ | 232 | |||
Year Ended December 31, 2014 | |||||||||
Other | Total | ||||||||
Severance | Restructuring | Severance and | |||||||
(Dollars in millions) | Charges | Charges | Other Charges | ||||||
2014 Plan: | |||||||||
North America | $ | 17 | $ | 27 | $ | 44 | |||
MENA/Asia Pacific | 19 | 106 | 125 | ||||||
Europe/SSA/Russia | 17 | 13 | 30 | ||||||
Latin America | 29 | 7 | 36 | ||||||
Subtotal | 82 | 153 | 235 | ||||||
Land Drilling Rigs | 5 | 4 | 9 | ||||||
Corporate and Research and Development | 27 | 2 | 29 | ||||||
2014 Plan Total | $ | 114 | $ | 159 | $ | 273 | |||
2015 Plan: | |||||||||
North America | $ | 32 | $ | — | 32 | ||||
MENA/Asia Pacific | 8 | — | 8 | ||||||
Europe/SSA/Russia | 5 | — | 5 | ||||||
Latin America | 12 | — | 12 | ||||||
Subtotal | 57 | — | 57 | ||||||
Land Drilling Rigs | — | — | — | ||||||
Corporate and Research and Development | 1 | — | 1 | ||||||
2015 Plan Total | $ | 58 | $ | — | $ | 58 | |||
Total | $ | 172 | $ | 159 | $ | 331 | |||
36
Liquidity and Capital Resources
Cash Flows
At December 31, 2016, we had cash and cash equivalents of $1.0 billion compared to $467 million at December 31, 2015 and $474 million at December 31, 2014. For the years ended December 31, 2016, 2015 and 2014, cash balances were impacted negatively by the effect of exchange rate changes by $50 million, $66 million and $74 million, respectively. The 2016 impact was primarily driven by the devaluation of foreign currencies in Angola and Egypt. The 2015 impact was primarily due to devaluations of foreign currencies in Venezuela, Angola, Argentina and Kazakhstan. The 2014 impact was due to the devaluation of the Venezuelan bolivar. The following table summarizes cash provided by (used in) each type of business activity, for the years ended December 31, 2016, 2015 and 2014:
Year Ended December 31, | |||||||||||
(Dollars in millions) | 2016 | 2015 | 2014 | ||||||||
Net Cash Provided by (Used in) Operating Activities | $ | (314 | ) | $ | 706 | $ | 963 | ||||
Net Cash Provided by (Used in) Investing Activities | (137 | ) | (659 | ) | 330 | ||||||
Net Cash Provided by (Used in) Financing Activities | 1,071 | 12 | (1,180 | ) | |||||||
Operating Activities
Cash flows used in operating activities were $314 million in 2016 compared to cash flows provided by operating activities of $706 million during 2015. The decline in operating cash flow in 2016 compared to 2015 was attributable to a decline in operating income due to the significant decline in oil prices and drilling activity, partially offset by cash flow from working capital.
Cash flows provided by operating activities were $706 million in 2015 compared to $963 million in 2014. The decrease in operating cash flow is primarily due to the reduction in income associated with the significant decline in drilling activity resulting from the significant decline in commodity prices and the net payment of $105 million related to the Freedman litigation.
Cash flows provided by operating activities were $963 million in 2014. The cash provided by our operating activities in 2014 is a result of our positive operating results excluding the non-cash impact of $656 million in long-lived assets and goodwill impairment, the $245 million Venezuelan bolivar devaluation charge and $112 million of Land Drilling Rig business related write-down and reserve charges. The significant uses of operating cash in 2014 included over $340 million of completion and end of contract payments associated with our legacy percentage-of-completion contracts in Iraq and the payment of $253 million to settle the United Nations oil-for-food program governing sales of goods into Iraq and FCPA matters.
Investing Activities
Our investing activities used cash of $137 million and $659 million during 2016 and 2015, respectively, versus providing cash of $330 million in 2014. The primary driver of our investing cash flow activities is capital expenditures for PP&E. Capital expenditures were $204 million, $682 million and $1.5 billion for 2016, 2015 and 2014, respectively. The amount we spend for capital expenditures varies each year based on the type of contracts into which we enter, our asset availability and our expectations with respect to industry activity levels in the following year. The significant decline in capital expenditures is due to the continued price fluctuation of crude oil, continued weakness in demand and lower than expected exploration and production spending.
In addition, during 2016, cash proceeds received from investing activities included $39 million of insurance proceeds from the casualty loss of a rig in Kuwait, cash proceeds of $49 million from the disposition of assets and $30 million on the promissory note from the 2013 sale of our equity interest in Borets International Limited. These proceeds were partially offset by cash payments of $36 million for working capital adjustment payments related to the sale of our businesses and $15 million in payments related to acquisition of businesses and intangibles. See “Note 2 – Business Combinations and Divestitures” for additional information.
Investing activities in 2015 also included cash proceeds of $37 million from the disposition of assets, partially offset by cash paid of $22 million to acquire businesses and intellectual property.
Investing activities in 2014 provided cash of $330 million primarily due to $1.7 billion in cash proceeds from the sale of businesses in 2014. Dispositions in 2014 included our land drilling and workover rig operations in Russia and Venezuela, pipeline and specialty services business, engineered chemistry and Integrity drilling fluids businesses and the disposal of all our shares in Proserv. In 2014, we also received net cash of $18 million from consolidation following the purchase of additional ownership
37
interest in a joint venture in China. These proceeds from dispositions contributed to the early repayment or repurchase of portions of our short-term and long-term debt in 2014 and 2015. See details of the repayment in financing activities below.
Financing Activities
During 2016, we received total cash proceeds of $1.1 billion from the issuance of 200 million ordinary shares of the Company. Our financing activities also consisted of the borrowing and repayment of short-term and long-term debt. During 2016, through a series of offerings and transactions, we received proceeds, net of underwriting fees, of $3.7 billion from the issuance of our $1.265 billion 5.875% exchangeable senior notes, $750 million 7.75% senior notes, $750 million 8.25% senior notes, $540 million 9.875% senior notes, and $500 million secured term loan.
We used the proceeds of certain debt offerings to fund tender offers to buy back our 6.35% senior notes, 6.00% senior notes, 9.625% senior notes and 5.125% senior notes with a principal balance of $1.9 billion and used the remaining proceeds to repay our revolving credit facility, term loan and for general corporate purposes. We recognized a cumulative loss of $78 million on the tender offers buyback transaction. Financing activities during 2016 also included the payment of $87 million related to the purchase of previously leased rig equipment. See “Note 12 – Short-term Borrowings and Other Debt Obligations” and “Note 13 – Long-term Debt” for additional details of our financing activities.
Our 2015 financing activities primarily consisted of the borrowing and repayment of short-term and long-term debt. Our short-term borrowings, net of repayments, were $505 million and total net long-term repayments were $470 million. In 2015, through a series of open market transactions, we repurchased certain of our senior notes with a total book value of $527 million. We recognized a cumulative gain of $84 million on these transactions in “Other Income (Expense), Net” on the accompanying Consolidated Statements of Operations. Our other financing activities in 2015 included dividends paid to noncontrolling partners in consolidated joint ventures of $49 million and proceeds from the exercise of stock options issued to our employees and directors of $26 million.
Our 2014 financing activities primarily consisted of repayment and repurchase of approximately $924 million of short-term debt and $259 million of long-term debt, including the repurchase of senior notes. In December 2014, through a series of open market transactions, we repurchased certain of our senior notes with a total book value of $138 million and recognized a gain of approximately $11 million.
In conjunction with our 2014 redomestication, we amended our Executive Deferred Compensation Stock Ownership Plan to provide that benefits thereunder may be payable in cash in lieu of our shares. The trustee for our executive deferred compensation plan, a consolidated subsidiary, sold 973,611 shares of our common stock realizing $22 million in cash proceeds for the benefit of the plan participants. Our other financing activities in 2014 included dividends paid to noncontrolling partners in consolidated joint ventures of $39 million and proceeds from the exercise of stock options issued to our employees and directors of $11 million.
Sources of Liquidity
Our sources of available liquidity include cash and cash equivalent balances, cash generated from operations, accounts receivable factoring, dispositions, and availability under committed lines of credit. We also historically have accessed banks for short-term loans from uncommitted borrowing arrangements and have accessed the capital markets with debt and equity offerings. From time to time we may and have disposed of businesses or capital assets that are no longer core to our long-term strategy.
Revolving Credit Facility and Secured Term Loan Agreement
At December 31, 2016, we have a revolving credit facility (the “Revolving Credit Agreement”) and a secured term loan agreement (the “Term Loan Agreement” and collectively with the Revolving Credit Agreement, the “Credit Agreements”) and we had $1.3 billion available under the Credit Agreements and $63 million in outstanding letters of credit in addition to borrowings under the Credit Agreements.
Our Credit Agreements require that we maintain the following financial covenants:
1) | Leverage ratio of no greater than 3.0 to 1 through December 31, 2016 and 2.5 to 1 thereafter until maturity. This ratio measures our indebtedness guaranteed by subsidiaries under the Credit Agreements and other guaranteed facilities to the trailing four quarters consolidated adjusted earnings before interest, taxes, depreciation, amortization and other specified charges (“EBITDA”); |
38
2) | Leverage and letters of credit ratio of no greater than 4.0 to 1 on or before December 31, 2016 and 3.5 to 1 thereafter calculated as our indebtedness guaranteed by subsidiaries under the Credit Agreements and other guaranteed facilities and all letters of credit to the trailing four quarters consolidated adjusted EBITDA; and |
3) | Asset coverage ratio of at least 4.0 to 1, which is calculated as our asset value to indebtedness guaranteed by subsidiaries under the Credit Agreements and other guaranteed facilities. |
On July 19, 2016, we amended these facilities to make minor changes and amendments to certain collateral provisions, negative covenants and related definitions, and added an accordion feature to permit new and existing lenders to add up to a maximum of $250 million in additional commitments. Our Credit Agreements contain customary events of default, including our failure to comply with the financial covenants. As of December 31, 2016, we were in compliance with our financial covenants as defined in the Credit Agreements and in the covenants under our indentures. We also expect to remain in compliance with all of our covenants throughout 2017. Should circumstances arise where we are not in compliance with our covenants during any quarterly reporting period, we may have to seek a waiver from our lenders or take measures to reduce indebtedness under the Credit Agreements to a level that would comply with the covenants.
The following summarizes our availability under the Credit Agreements at December 31, 2016 (dollars in millions):
Facility | $ | 1,805 | |
Less uses of facility: | |||
Revolving credit facility | — | ||
Secured term loan before debt issuance cost | 425 | ||
Letters of credit | 63 | ||
Borrowing Availability | $ | 1,317 | |
Other Short-Term Borrowings and Other Debt Activity
We have short-term borrowings with various domestic and international institutions pursuant to uncommitted credit facilities. At December 31, 2016, we had $2 million in short-term borrowings under these arrangements, primarily from overdraft facility borrowings, with a weighted average interest rate of 0.7%. In 2016, we repaid $180 million borrowed under a credit agreement that matured in the first half of 2016.
Ratings Services’ Credit Ratings
Our Standard & Poor’s (“S&P”) Global Ratings on our senior unsecured debt and short-term debt are currently B with a negative outlook. The current rating on our senior unsecured debt was lowered from its’ initial level at the beginning of 2016, which was BB+. Both S&P ratings carry a negative outlook. Our Moody’s Investors Services (“Moody’s”) credit rating on our senior unsecured debt is currently Caa1 and our short-term rating is SGL-3, both with a negative outlook. Our current Moody’s ratings were lowered from their initial levels at the beginning of 2016, which were Ba1 for our senior unsecured debt and SGL-2 for our short-term rating. Our Fitch Rating is CCC- for our senior unsecured debt with a negative outlook, which was lowered from BB during 2016. Our Fitch rating for our short-term debt of C was lowered from a rating of B during 2016. The lowering of our credit ratings to non-investment grade levels in 2016 resulted in our loss of access to the commercial paper market for our short-term liquidity needs. We continue to have access and expect we will continue to have access to most credit markets.
Cash Requirements
During 2017, we anticipate our cash requirements will include payments for capital expenditures, repayment of debt, interest payments on our outstanding debt, SEC settlement payments, severance payments and payments for short-term working capital needs. Our cash requirements may also include opportunistic debt repurchases, business acquisitions and other amounts to settle litigation related matters described in “Item 1A. – Risk Factors” and “Item 8. – Financial Statements and Supplementary Data – Notes to Consolidated Financial Statements – Note 21 – Disputes, Litigation and Contingencies.” We anticipate funding these requirements from cash and cash equivalent balances, cash generated from operations, availability under our credit facilities, accounts receivable factoring, and if completed, proceeds from disposals of businesses or capital assets. We anticipate that cash generated from operations will be augmented by working capital improvements, increased activity and improved margins. We also historically have accessed banks for short-term loans from uncommitted borrowing arrangements and have accessed the capital markets with debt and equity offerings. From time to time we may and have entered into transactions to dispose of businesses or capital assets that are no longer core to our long-term strategy.
39
Capital expenditures for 2017 are projected to be approximately $250 million (excluding the purchase of certain leased equipment utilized in our North America pressure pumping business for a total amount of $240 million in January 2017) compared to capital expenditures of $204 million in 2016 due to higher anticipated activity in the oil and gas business related to higher volume of work and increased rig count. The amounts we ultimately spend will depend on a number of factors including the type of contracts we enter into, asset availability and our expectations with respect to industry activity levels in 2017. Expenditures are expected to be used primarily to supporting ongoing activities of our core businesses and our sources of liquidity are anticipated to be sufficient to meet our needs.
Cash and cash equivalent of $1.0 billion at December 31, 2016, are held by subsidiaries outside of Switzerland, the taxing jurisdiction in which the Company is taxed. Based on the nature of our structure, we are generally able to redeploy cash with no incremental tax. However, in 2016 we recorded $137 million for a non-cash tax expense related to an internal restructuring of subsidiaries. As of December 31, 2016, $120 million of our cash and cash equivalent balance was denominated in Angolan kwanza. The National Bank of Angola supervises all kwanza exchange operations and has limited U.S. Dollar conversions. These prolonged Angolan limitations have and may further limit our ability to repatriate earnings and expose us to additional exchange rate risk.
Accounts Receivable Factoring and Other Receivables
From time to time we participate in factoring arrangements to sell accounts receivable to third party financial institutions. In 2016, we sold accounts receivables of $156 million, received cash totaling $154 million and recognized a loss of $0.7 million. In 2015, we sold accounts receivables of $78 million, received cash totaling $77 million and recognized a loss of $0.2 million. Our factoring transactions were recognized as sales, and the proceeds are included as operating cash flows in our Consolidated Statements of Cash Flows. We did not sell any accounts receivable during 2014.
During the second quarter of 2016, we accepted a note with a face value of $120 million from PDVSA in exchange for $120 million in net trade receivables. The note had a three year term at a 6.5% stated interest rate. We carried the note at lower of cost or fair value and recognized a loss in the second quarter of 2016 of $84 million to adjust the note to fair value. In the fourth quarter of 2016, we sold the economic rights in the note receivable for $44 million and recognized a gain of $8 million.
Contractual Obligations
The following summarizes our contractual obligations and contingent commitments by period. The obligations we pay in future periods may vary due to certain assumptions including the duration of our obligations and anticipated actions by third parties.
Payments Due by Period | |||||||||||||||||||
(Dollars in millions) | 2017 | 2018 and 2019 | 2020 and 2021 | Thereafter | Total | ||||||||||||||
Short-term Debt | $ | 2 | $ | — | $ | — | $ | — | $ | 2 | |||||||||
Long-term Debt (a) | 175 | 676 | 2,562 | 4,182 | 7,595 | ||||||||||||||
Interest on Long-term Debt | 498 | 944 | 791 | 2,865 | 5,098 | ||||||||||||||
Noncancellable Operating Leases (b) | 214 | 268 | 105 | 201 | 788 | ||||||||||||||
Purchase Obligations | 139 | 95 | 28 | — | 262 | ||||||||||||||
$ | 1,028 | $ | 1,983 | $ | 3,486 | $ | 7,248 | $ | 13,745 | ||||||||||
(a) | Amounts represent the expected cash payments of principal associated with our long-term debt. These amounts do not include the unamortized discounts or deferred gains on terminated interest rate swap agreements. |
(b) | In November 2016, we shut down our U.S. pressure pumping operations and idled our assets. In January 2017, we purchased certain leased equipment utilized in our North America pressure pumping business for a total amount of $240 million. |
Due to the uncertainty with respect to the timing of future cash flows associated with our uncertain tax positions, we are unable to make reasonably reliable estimates of the period of cash settlement, if any, to the respective taxing authorities. Therefore, $259 million in uncertain tax positions, including interest and penalties, have been excluded from the contractual obligations table above.
We have defined benefit pension and other post-retirement benefit plans covering certain of our U.S. and international employees. During 2016, we made contributions and paid direct benefits of approximately $6 million in connection with those plans and we anticipate funding approximately $3 million with cash and $22 million with shares during 2017. Our projected benefit obligations for our defined benefit pension and other post-retirement benefit plans were $205 million as of December 31, 2016.
40
Derivative Instruments
Warrant
During the fourth quarter of 2016, in conjunction with the issuance of 84.5 million shares of common stock, we also issued a warrant that gives the holder the option to acquire an additional 84.5 million shares. The exercise price on the warrant is $6.43 per share and is exercisable any time prior to May 21, 2019. The warrant is classified as a liability at fair value with changes in its fair value reported as “Other Income (Expense), Net” on our Consolidated Statements of Operations. The warrant had a fair value of $172 million at November 16, 2016 (date of issuance) and $156 million at December 31, 2016. This change in value of $16 million was primarily driven by the decrease in our stock price from the inception date to December 31, 2016. If exercised, we expect to receive an additional $543 million in cash proceeds. See “Note 15 – Derivative Instruments” for information related to the warrant.
Fair Value Hedges
We may use interest rate swaps to help mitigate exposures related to changes in the fair values of fixed-rate debt. As of December 31, 2016 and 2015, we had net unamortized premiums of $7 million and $23 million, respectively, associated with fair value hedge swap terminations. These premiums are being amortized over the remaining term of the originally hedged debt as a reduction to interest expense. See “Note 15 – Derivative Instruments” to our Consolidated Financial Statements for additional details.
Cash Flow Hedges
We may use interest rate swaps to mitigate our exposure to variability in forecasted cash flows due to changes in interest rates. In 2008, we entered into interest rate derivative instruments to hedge projected exposures to interest rates in anticipation of a debt offering. These hedges were terminated at the time of the issuance of the debt, and the associated loss is being amortized from Accumulated Other Comprehensive Income (Loss) to interest expense over the remaining term of the debt. As of December 31, 2016 and 2015, we had net unamortized losses of $9 million and $10 million, respectively, associated with our cash flow hedge terminations.
Other Derivative Instruments
We enter into contracts to hedge our exposure to currency fluctuations in various foreign currencies. As of December 31, 2016 and 2015, we had outstanding foreign currency forward contracts with total notional amounts totaling $1.6 billion and $1.7 billion, respectively. The notional amounts of our foreign currency forward contracts do not generally represent amounts exchanged by the parties and thus are not a measure of the cash requirements related to these contracts or of any possible loss exposure. The amounts actually exchanged at maturity are calculated by reference to the notional amounts and by other terms of the derivative contracts, such as exchange rates. See “Note 15 – Derivative Instruments” for additional information.
Our foreign currency forward contracts and cross-currency swaps are not designated as hedges, and the changes in fair value of the contracts are recorded in current earnings each period in the line captioned “Other Income (Expense), Net” on the accompanying Consolidated Statements of Operations. See “Note 15 – Derivative Instruments” for additional information.
Off-Balance Sheet Arrangements
Guarantees
Weatherford Ireland guarantees the obligations of our subsidiaries Weatherford International Ltd. (“Weatherford Bermuda”) and Weatherford International, LLC (“Weatherford Delaware”), including the notes and credit facilities listed below.
The following obligations of Weatherford Delaware were guaranteed by Weatherford Bermuda at December 31, 2016 and 2015: (1) 6.35% senior notes and (2) 6.80% senior notes.
The following obligations of Weatherford Bermuda were guaranteed by Weatherford Delaware at December 31, 2016 and 2015: (1) 6.50% senior notes, (2) 6.00% senior notes, (3) 7.00% senior notes, (4) 9.625% senior notes, (5) 9.875% senior notes due 2039, (6) 5.125% senior notes, (7) 6.75% senior notes, (8) 4.50% senior notes and (9) 5.95% senior notes. At December 31, 2015, Weatherford Delaware also guaranteed the revolving credit facility and the 5.50% senior notes of Weatherford Bermuda.
41
The following obligations of Weatherford Bermuda were guaranteed by Weatherford Delaware at December 31, 2016: (1) Revolving Credit Agreement, (2) Term Loan Agreement, (3) 5.875% exchangeable senior notes, (4) 7.75% senior notes and (5) 8.25% senior notes and (6) 9.875% senior notes due 2024.
Certain of these guarantee arrangements require us to present condensed consolidating financial information. See guarantor financial information presented in “Note 24 – Consolidating Financial Statements.”
Letters of Credit and Performance and Bid Bonds
We use letters of credit and performance and bid bonds in the normal course of our business. As of December 31, 2016, we had $513 million of letters of credit consisting of $450 million outstanding under various uncommitted credit facilities and $63 million of letters of credit outstanding under our Credit Agreement. In addition, we had $54 million of surety bonds, primarily performance bonds, issued by financial sureties against an indemnification from us. These obligations could be called by the beneficiaries should we breach certain contractual or performance obligations. If the beneficiaries were to call the letters of credit under our committed facility, our available liquidity would be reduced by the amount called.
Critical Accounting Policies and Estimates
Our discussion and analysis of our financial condition and results of operation is based upon our Consolidated Financial Statements. We prepare these financial statements in conformity with U.S. GAAP. As such, we are required to make certain estimates, judgments and assumptions that affect the reported amounts of assets and liabilities at the date of the financial statements and the reported amounts of revenues and expenses during the periods presented. We base our estimates on historical experience, available information and various other assumptions we believe to be reasonable under the circumstances. On an on-going basis, we evaluate our estimates; however, actual results may differ from these estimates under different assumptions or conditions. The accounting policies we believe require management’s most difficult, subjective or complex judgments and are the most critical to our reporting of results of operations and financial position are as follows:
Business Combinations and Goodwill
Goodwill represents the excess of consideration paid over the fair value of net tangible and identifiable intangible assets acquired and liabilities assumed in a business combination. Goodwill is allocated to Weatherford’s reporting units when initially acquired. Reporting units are operating segments or one level below the operating segment level. Our reporting units are based on our regions and include the United States, Canada, Latin America, Europe, SSA, Russia, MENA, Asia Pacific and Land Drilling Rigs. Land Drilling Rigs was separated into its own reportable segment and reporting unit in the first quarter of 2015 in order to align our business structure with management’s current view and future growth objectives.
Goodwill is not amortized but is evaluated for impairment. We perform an impairment test for goodwill annually as of October 1 or more frequently if indicators of potential impairment exist that would more-likely-than-not reduce the fair value of the reporting unit below its carrying value. We have the option to assess qualitative factors to determine if it is necessary to perform further goodwill impairment tests. If it is more-likely-than-not that the fair value of a reporting unit is less than its carrying value, we must perform the first step of the goodwill impairment test. We also have the option to bypass the qualitative assessment at any time and perform the first step. Goodwill impairment is evaluated using a two-step process. The first step of the goodwill impairment test involves a comparison of the fair value of each of our reporting units with their carrying values.
If we perform the first step, the fair value of our reporting units is determined using a combination of the income approach and the market approach. The income approach estimates fair value by discounting each reporting unit’s estimated future cash flows. The income approach requires us to make certain estimates and judgments. To arrive at our future cash flows, we use estimates of economic and market information, including growth rates in revenues and costs, working capital and capital expenditure requirements, and operating margins and tax rates. Several of the assumptions used in our discounted cash flow analysis are based upon our annual financial forecast. Our annual planning process takes into consideration many factors including historical results and operating performance, related industry trends, pricing strategies, customer analysis, operational issues, competitor analysis, and marketplace data, among others. Assumptions are also made for periods beyond the financial forecast period. The discount rate used in the income approach is determined using a weighted average cost of capital and reflects the risks and uncertainties in the cash flow estimates. The weighted average cost of capital includes a cost of debt and equity. The cost of equity is estimated using the capital asset pricing model, which includes inputs for a long-term risk-free rate, equity risk premium, country risk premium, and an asset beta appropriate for the assets in the reporting unit. The discount rates for our reporting units ranged from 11.0% to 17.75% as of our October 1, 2016 annual impairment test. The market approach estimates fair value using as a multiple of each reporting unit’s actual and forecasted earnings using earnings multiples of comparable publicly traded companies.
42
We used an independent valuation specialist in each of our annual impairment tests to assist us in our valuations under both methods. The final estimate of each reporting unit’s fair value is determined by using an appropriate weighting of the values from each method, where the income method was weighted heavier than the market method as we believe that the income method and assumptions therein are more reflective of a market participant’s view of fair value given current market conditions.
The fair values estimated using the income approach and the market approach cannot be directly compared to our market capitalization due to several factors, most importantly the premium that would be paid by a market participant to acquire a controlling interest in Weatherford, which is not reflected in the price of our publicly traded stock. The sum of the fair values of Weatherford’s reporting units’ implied a control premium of approximately 12% as of our October 1, 2016 testing date which is within the range of observable control premiums in market transactions.
The fair values of our reporting units that have goodwill were in excess of their carrying value as of our October 1, 2016 annual impairment test.
Our estimates of fair value are sensitive to the aforementioned inputs to the valuation approaches. If any one of the above inputs changes, it could reduce the estimated fair value of the affected reporting unit and result in an impairment charge to goodwill. Some of the inputs, such as forecasts of revenue and earnings growth, are subject to change given their uncertainty. Other inputs, such as the discount rate used in the income approach and the valuation multiple used in the market approach, are subject to change as they are outside of our control. In the event that discount rates increased by more than 100 basis points for each of our reporting units with goodwill as of October 1, 2016, all else being equal, the resulting fair value would still exceed the reporting unit’s carrying value.
If the carrying value of a reporting unit’s goodwill were to exceed its fair value, the second step of the goodwill impairment test shall be performed. The second step compares the implied fair value of the reporting unit’s goodwill to the carrying value of its goodwill. The implied fair value of goodwill is determined by performing a hypothetical purchase price allocation of the reporting unit’s assets and liabilities using the fair value of the reporting unit as the purchase price in the calculation. If the amount of goodwill resulting from this hypothetical purchase price allocation is less than the carrying value of a reporting unit’s goodwill, the recorded carrying value of goodwill is written down to the implied fair value.
We did not recognize a goodwill impairment charge in 2016 or 2015. Based on the results of our impairment tests, we recognized goodwill impairments of $161 million in 2014.
In 2014, our annual goodwill impairment test indicated that the goodwill of the Land Drilling Rigs reporting units in Latin America, Europe and Asia Pacific was impaired. The results of our “step-one” analysis were accompanied by other indicators in the form of a decline in the anticipated utilization rates for our drilling rig fleet. The “step two” analysis indicated that the goodwill for these reporting units was fully impaired and we recognized an impairment loss of $40 million related to Land Drilling Rigs segment in Latin America, Europe and Asia Pacific.
In addition, during the second quarter of 2014, we engaged in negotiation to sell our land drilling and workover operations in Russia and Venezuela and we subsequently entered into an agreement to sell the businesses in July 2014. During this time frame we expected the sale would significantly impact the revenues and results of operations of our Russia reporting unit. Consequently, we considered the associated circumstances to assess whether an event or change had occurred that, more likely than not, reduced the fair value of our reporting units below their carrying amount. We concluded that the planned sale represented an indicator of impairment and we prepared the analysis necessary to identify the potential impairment and recognized the required impairment loss. The analysis indicated that the goodwill for the Russia reporting unit was impaired, and we recognized a goodwill impairment loss of $121 million, $95 million of which pertained to goodwill classified in current assets held for sale.
For further analysis and discussion of goodwill refer to “Item 8. – Financial Statements and Supplementary Data – Notes to Consolidated Financial Statements – Note 9 – Goodwill” of this Form 10-K.
43
Long-Lived Assets
Long-lived assets, which include PP&E and definite-lived intangibles, comprise a significant amount of our assets. We must make estimates about the expected useful lives of the assets. The value of the long-lived assets is then amortized over its expected useful life. A change in the estimated useful lives of our long-lived assets would have an impact on our results of operations. We estimate the useful lives of our long-lived asset groups as follows:
Estimated Useful Lives | |
Buildings and leasehold improvements | 10 – 40 years or lease term |
Rental and service equipment | 2 – 20 years |
Machinery and other | 2 – 12 years |
Intangible assets | 2 – 20 years |
In estimating the useful lives of our property, plant and equipment, we rely primarily on our actual experience with the same or similar assets. The useful lives of our intangible assets are determined by the years over which we expect the assets to generate a benefit based on legal, contractual or regulatory terms.
Long-lived assets to be held and used by us are reviewed to determine whether any events or changes in circumstances indicate that we may not be able to recover the carrying amount of the asset. Factors that might indicate a long-lived asset may not be recoverable may include, but are not limited to, significant decreases in the market value of the long-lived asset, a significant change in the long-lived asset’s physical condition, the introduction of competing technologies, legal challenges, a reduction in the utilization rate of the assets, a change in industry conditions, or a reduction in cash flows driven by pricing pressure as a result of oversupply associated with the use of the long-lived asset. If these or other factors exist that indicate the carrying amount of the asset may not be recoverable, we determine whether an impairment has occurred through the use of an undiscounted cash flow analysis. The undiscounted cash flow analysis consists of estimating the future cash flows that are directly associated with, and are expected to arise from, the use and eventual disposition of the asset over its remaining useful life. These cash flows are inherently subjective and require estimates based upon historical experience and future expectations. If the undiscounted cash flows do not exceed the carrying value of the long-lived asset, the asset is not recoverable and impairment is recognized to the extent the carrying amount exceeds the estimated fair value of the asset. The fair value of the asset is measured using market prices, or in the absence of market prices, is based on an estimate of discounted cash flows. Cash flows are discounted at an interest rate commensurate with our weighted average cost of capital for a similar asset.
Assets are grouped at the lowest level at which cash flows are identifiable and independent. We generally group operating assets by product line of the respective region. We have long-lived assets, such as facilities, utilized by multiple operating divisions that do not have identifiable cash flows and impairment testing for these long-lived assets is based on the consolidated entity.
During 2016, we recognized long-lived asset impairment charges of $436 million, of which $388 million was related to product line PP&E impairments and $48 million was related to the impairment of intangible assets. The PP&E impairment charges were related to our MENA/Asia Pacific Pressure Pumping and North America Well Construction, Drilling Services and Secure Drilling Service product lines. We recognized total long-lived asset impairment charges of $638 million in 2015 with $383 million related to U.S. Pressure Pumping, Drilling Tools and Wireline product lines $255 million related to Land Drilling Rigs product line assets. In 2014 we recognized total long-lived and other asset impairments of $495 million, of which $352 million related to the Land Drilling Rig product line and $143 million related to the sale of our land drilling and workover operations in Russia and Venezuela.
The long-lived assets impairment charges were due to the prolonged downturn in the oil and gas industry, whose recovery in the third quarter was not as strong as expected and whose recovery in the fourth quarter of 2016 and in 2017 was and is expected to be slower than had previously been anticipated. The change in the expectations of the market’s recovery, in addition to successive negative operating cash flows in certain asset groups represented an indicator that those assets will no longer be recoverable over their remaining useful lives.
A significant decline in crude oil prices contributed and a prolonged downturn in the oil and gas industry led to lower anticipated exploration and production spending and a decline in the anticipated utilization rates for our assets. The recovery in the oil and gas industry was not as strong as expected and is expected to be slower than had previously been anticipated. The decline and its impact on demand represent a significant adverse change in the business climate and an indication that some of our long-lived assets may not be recoverable. Based on the impairment indicators noted we performed an analysis of our long-lived assets in
44
2016, 2015 and 2014 and recorded long-lived and other asset impairment charges to adjust to fair value. See “Note 8 – Long-Lived Asset Impairments” for additional information regarding the long-lived assets impairment.
Management cannot predict the occurrence of future impairment-triggering events, so we continue to assess whether indicators of impairment to long-lived assets exist due to the current business conditions in the oilfield services industry.
Percentage-of-Completion Revenue Recognition
Revenue from long-term contracts, primarily for our integrated project management services, is reported on the percentage-of-completion method of accounting. This method of accounting requires us to calculate contract profit to be recognized in each reporting period for each contract based upon our projections of future outcomes, which include:
•estimates of the available revenue under the contracts;
•estimates of the total cost to complete the project;
•estimates of project schedule and completion date;
•estimates of the extent of progress toward completion; and
•amounts of any change orders or claims included in revenue.
Measurements of progress are generally based on costs incurred to date as a percentage of total estimated costs or output related to physical progress. At the outset of each contract, we prepare a detailed analysis of our estimated cost to complete the project. Risks related to service delivery, usage, productivity and other factors are considered in the estimation process. Our personnel periodically evaluate the estimated costs, claims, change orders and percentage-of-completion at the contract level. The recording of profits and losses on long-term contracts requires an estimate of the total profit or loss over the life of each contract. This estimate requires consideration of total contract value, change orders and claims, less costs incurred and estimated costs to complete. Anticipated losses on contracts are recorded in full in the period in which they become evident. Profits are recorded based upon the total estimated contract profit multiplied by the current estimated percentage complete for the contract. There are many factors that impact future costs, including but not limited to weather, inflation, client activity levels and budgeting constraints, labor and community disruptions, timely availability of materials, productivity and other factors as outlined in our “Item 1A. – Risk Factors.”
During 2016, we were break-even for our Zubair contract and cumulative estimated loss from the Iraq contracts was $532 million as of December 31, 2016. On May 26, 2016, we entered into an agreement with our customer containing the terms and conditions of the settlement on the Zubair contract. The settlement to be paid to us is a gross amount of $150 million, of which $62 million and $72 million was received in the second and third quarters of 2016, respectively. The settlement includes variation order requests, claims for extension of time, payments of remaining contract milestones and new project completion timelines that resulted in relief from the liquidated damages provisions. Of the remaining gross settlement, we collected $16 million during January 2017.
As of December 31, 2016, we have no claims revenue, and our percentage-of-completion project estimate includes a cumulative $25 million in approved change orders and $16 million of back charges. Our net billings in excess of costs as of December 31, 2016 were $45 million and are shown in the “Other Current Liabilities” on the Consolidated Balance Sheet. The amounts associated with contract change orders or claims are included in revenue only when they can be reliably estimated and their realization is reasonably assured.
During 2015, we recognized estimated project losses of $153 million related to our long-term early production facility construction contracts in Iraq accounted for under the percentage-of-completion method. Total estimated losses on these loss projects were $532 million at December 31, 2015. As of December 31, 2015, our percentage-of-completion project estimates include $116 million of claims revenue and $28 million of back charges. During 2015, an additional $32 million of claims revenue was included in our project estimates. Our costs in excess of billings as of December 31, 2015 were $6 million and are shown in the “Other Current Assets” on our Consolidated Balance Sheets. We also had a variety of unapproved contract change orders or claims that are not included in our revenues as of December 31, 2015. The amounts associated with these contract change orders or claims are included in revenue only when they can be reliably estimated and their realization is reasonably assured.
During 2014, we recognized estimated project losses of $72 million related to our long-term early production facility construction contracts in Iraq accounted for under the percentage-of-completion method. Total estimated losses on these projects were $379 million at December 31, 2014. As of December 31, 2014, our percentage-of-completion project estimates include $90
45
million of claims revenue and $24 million of back charges. Our costs in excess of billings as of December 31, 2014 were $128 million and are shown in the “Other Current Assets” on the balance sheet. We had a variety of unapproved contract change orders or claims that were not included in our revenues as of December 31, 2014. During 2014, an additional $80 million of claims revenue was included in our project estimates and $26 million of our prior claims were approved.
Income Taxes
We take into account the differences between the financial statement treatment and tax treatment of certain transactions. Deferred tax assets and liabilities are recognized for the future tax consequences attributable to differences between the financial statement carrying amounts of existing assets and liabilities and their respective tax bases. Deferred tax assets and liabilities are measured using enacted tax rates expected to apply to taxable income in the years in which those temporary differences are expected to be recovered or settled. The effect of a change in tax rates is recognized as income or expense in the period that includes the enactment date. Our income tax provision in 2016 was $496 million compared to an income tax benefit of $145 million in 2015 and an income tax provision of $284 million in 2014, respectively, which resulted in an effective tax rate of (17)%, 7% and (111)%, respectively.
We recognize the impact of an uncertain tax position taken or expected to be taken on an income tax return in the financial statements at the largest amount that is more likely than not to be sustained upon examination by the relevant taxing authority.
We operate in approximately 90 countries through hundreds of legal entities. As a result, we are subject to numerous tax laws in the jurisdictions, and tax agreements and treaties among the various taxing authorities. Our operations in these jurisdictions in which we operate are taxed on various bases: income before taxes, deemed profits (which is generally determined using a percentage of revenues rather than profits), withholding taxes based on revenue, and other alternative minimum taxes. The calculation of our tax liabilities involves consideration of uncertainties in the application and interpretation of complex tax regulations in a multitude of jurisdictions across our global operations. We recognize potential liabilities and record tax liabilities for anticipated tax audit issues in the tax jurisdictions based on our estimate of whether, and the extent to which, additional taxes will be due. As of December 31, 2016, we had recorded reserves for uncertain tax positions of $208 million, excluding accrued interest and penalties of $51 million. The tax liabilities are reflected net of realized tax loss carryforwards. We adjust these reserves upon specific events; however, due to the complexity of some of these uncertainties, the ultimate resolution may result in a payment that is different from our current estimate of the tax liabilities.
If our estimate of tax liabilities proves to be less than the ultimate assessment, an additional charge to expense would result. If payment of these amounts ultimately proves to be less than the recorded amounts, the reversal of the liabilities would result in tax benefits being recognized in the period when the contingency has been resolved and the liabilities are no longer necessary. Changes in tax laws, regulations, agreements and treaties, foreign currency exchange restrictions or our level of operations or profitability in each taxing jurisdiction could have an impact upon the amount of income taxes that we provide during any given year.
Valuation Allowance for Deferred Tax Assets
We record a valuation allowance to reduce the carrying value of our deferred tax assets when it is more likely than not that a portion or all of the deferred tax assets will expire before realization of the benefit. The ultimate realization of the deferred tax assets depends on the ability to generate sufficient taxable income of the appropriate character and in the related jurisdiction in the future. In evaluating our ability to recover our deferred tax assets, we consider the available positive and negative evidence, including our past operating results, the existence of cumulative losses in the most recent years and our forecast of future taxable income. In estimating future taxable income, we develop assumptions, including the amount of future pre-tax operating income, the reversal of temporary differences and the implementation of feasible and prudent tax planning strategies. These assumptions require significant judgment.
We have considered various tax planning strategies that we would implement, if necessary, to enable the realization of our deferred tax assets; however, when the likelihood of the realization of existing deferred tax assets changes, adjustments to the valuation allowance are charged to our income tax provision in the period in which the determination is made.
As a result of the historical and projected future losses, and limited objective positive evidence to overcome negative evidence, the Company concluded that it needed to record a valuation allowance of $526 million in the third quarter of 2016 against certain previously benefited deferred tax assets since it cannot support that it is more likely than not that the deferred tax assets will be realized. The valuation allowance primarily relates to operations in the United States.
46
As of December 31, 2016, our gross deferred tax assets were $1.9 billion before a related valuation allowance of $1.7 billion. As of December 31, 2015, our gross deferred tax assets were $1.6 billion before a related valuation allowance of $868 million. The gross deferred tax assets were also offset by gross deferred tax liabilities of $259 million and $474 million as of December 31, 2016 and 2015, respectively.
Allowance for Doubtful Accounts
We maintain an allowance for doubtful accounts in order to record accounts receivable at their net realizable value. Significant judgment is involved in recognizing this allowance. The determination of the collectability requires us to use estimates and make judgments regarding future events and trends, including monitoring our customers’ payment history and current creditworthiness to determine that collectability is reasonably assured, as well as consideration of the overall business and political climate in which our customers operate. Provisions for doubtful accounts are recorded when it becomes evident that customer accounts are uncollectible. At December 31, 2016 and 2015, the allowance for doubtful accounts totaled $129 million, or 9%, and $113 million, or 6%, of total gross accounts receivable, respectively. In 2016 and 2015, we recognized a charge for bad debt expense of $69 million and $48 million, respectively. We believe that our allowance for doubtful accounts is adequate to cover bad debt losses under current conditions. However, uncertainties regarding changes in the financial condition of our customers, either adverse or positive, could impact the amount and timing of any additional provisions for doubtful accounts that may be required. A 5% change in the allowance for doubtful accounts would have had an impact on loss before income taxes of approximately $6 million in 2016.
Inventory Reserves
Inventory represents a significant component of current assets and is stated at the lower of cost or market using either a first-in, first-out (“FIFO”) or average cost method. To maintain a book value that is the lower of cost or market, we maintain reserves for excess, slow moving and obsolete inventory. To determine these reserve amounts, we review inventory quantities on hand, future product demand, market conditions, production requirements and technological obsolesce. This review requires us to make judgments regarding potential future outcomes. At December 31, 2016 and 2015, inventory reserves totaled $265 million, or 13%, and $288 million, or 11%, of gross inventory, respectively. During 2016 and 2015, we recognized inventory charges, including excess and obsolete inventory charges totaling $252 million and $186 million, respectively. These charges were largely attributable to the downturn in the oil and gas industry, where certain inventory has been deemed commercially unviable or technologically obsolete considering current and future demand. We believe that our reserves are adequate to properly value excess, slow-moving and obsolete inventory under current conditions.
Disputes, Litigation and Contingencies
As of December 31, 2016, we have accrued an estimate of the probable and estimable cost to resolve certain legal and investigation matters. For matters not deemed probable and reasonably estimable, we have not accrued any amounts in accordance with U.S. GAAP. Our legal department manages all pending or threatened claims and investigations on our behalf. The estimate of the probable costs related to these matters is developed in consultation with internal and outside legal counsel. Our contingent loss estimates are based upon an analysis of potential results, assuming a combination of probable litigation and settlement strategies. The accuracy of these estimates is impacted by the complexity of the issues. Whenever possible, we attempt to resolve these matters through settlements, mediation and arbitration proceedings if advantageous to us. If the actual settlement costs, final judgments or fines differ from our estimates, our future financial results may be adversely affected. For a more comprehensive discussion of our Disputes, Litigation and Contingencies, see “Item 8. – Financial Statements and Supplementary Data – Notes to Consolidated Financial Statements – Note 21 – Disputes, Litigation and Contingencies.”
New Accounting Pronouncements
See “Note 1 – Summary of Significant Accounting Policies” to our Consolidated Financial Statements for additional information.
47
Item 7A. Quantitative and Qualitative Disclosures about Market Risk
We are currently exposed to market risk from changes in foreign currency and changes in interest rates. From time to time, we may enter into derivative financial instrument transactions to manage or reduce our market risk. A discussion of our market risk exposure in these financial instruments follows.
Foreign Currency Exchange Rates and Inflationary Impacts
We operate in virtually every oil and natural gas exploration and production region in the world. In some parts of the world, such as Latin America, the Middle East and Southeast Asia, the currency of our primary economic environment is the U.S. dollar, and we use the U.S. dollar as our functional currency. In other parts of the world, we conduct our business in currencies other than the U.S. dollar, and the functional currency is the applicable local currency.
Currency devaluation charges are included in current earnings in “Currency Devaluation Charges” on the accompanying Consolidated Statements of Operations. In 2016, currency devaluation charges reflect the impact of the devaluation of the Angolan kwanza and Egyptian pound of $41 million. In 2015, currency devaluations charges were $85 million. These charges reflect the impacts of the devaluation of the Angolan kwanza of $39 million, the remeasurement charges of $26 million related to the Venezuelan bolivar, $11 million related to the devaluation of the Argentina peso and $9 million related to the depreciated Kazakhstani tenge.
The devaluation of the Argentine peso in 2015 was due to the modification of currency control restrictions on the purchase of foreign currencies by the Argentine Central Bank. The depreciation of the Kazakhstani tenge during 2015 occurred after the National Bank of Kazakhstan abandoned its peg of the tenge to the U.S. dollar. The Venezuelan bolivar charge in 2015 reflects remeasurement charges when we began using the exchange rate published by the Venezuelan currency exchange system known as the “Marginal Currency System” or SIMADI. The SIMADI opened for trading in February 2015, replacing the Venezuela’s Supplementary Foreign Currency Administration System auction rate (“SICAD II”) mechanism. The SIMADI is intended to provide limited access to a free market rate of exchange.
In 2014, we recognized charges of $245 million on the devaluation of the Venezuelan bolivar, the charges were related to our adoption of the SICAD II exchange rate provided by Venezuela’s Supplementary Foreign Currency Administration System approximately of 50 Venezuelan bolivars per U.S. dollar. This rate was used at December 31, 2015 for the purposes of remeasuring Venezuelan bolivar denominated assets and liabilities (primarily cash, accounts receivables, trade payables and other current liabilities).
Foreign Currency, Foreign Currency Forward Contracts and Cross-Currency Swaps
Assets and liabilities of entities for which the functional currency other than the U.S. dollar are translated into U.S. dollars using the exchange rates in effect at the balance sheet date result in translation adjustments that are reflected in Accumulated Other Comprehensive Loss in the Shareholders’ Equity section on our Consolidated Balance Sheets. We recorded a $12 million and $789 million adjustment to decrease shareholders’ equity for 2016 and 2015, respectively, to reflect the change in the U.S. dollar against various foreign currencies.
As of December 31, 2016 and 2015, we had outstanding foreign currency forward contracts with total notional amounts aggregating $1.6 billion and $1.7 billion, respectively. These contracts were entered into in order to hedge our net monetary exposure to currency fluctuations in various foreign currencies. The total estimated fair value of these contracts and amounts owed associated with closed contracts at December 31, 2016 and 2015, resulted in a net liability of approximately $163 million and $9 million, respectively. These derivative instruments were not designated as hedges, and the changes in fair value of the contracts are recorded each period in current earnings.
Interest Rates
We are subject to interest rate risk on our long-term fixed-interest rate debt and variable-interest rate borrowings. Variable rate debt exposes us to short-term changes in market interest rates. Fixed rate debt exposes us to changes in market interest rates reflected in the fair value of the debt and to the risk that we may need to refinance maturing debt with new debt at a higher rate. All other things being equal, the fair value of our fixed rate debt will increase or decrease inversely to changes in interest rates.
48
Our senior notes that were outstanding at December 31, 2016 and 2015, and that were subject to interest rate risk consist of the following:
December 31, | |||||||||||||||
2016 | 2015 | ||||||||||||||
(Dollars in millions) | Carrying Amount | Fair Value | Carrying Amount | Fair Value | |||||||||||
5.50% Senior Notes due 2016 | $ | — | $ | — | $ | 350 | $ | 351 | |||||||
6.35% Senior Notes due 2017 | 89 | 89 | 604 | 585 | |||||||||||
6.00% Senior Notes due 2018 | 66 | 66 | 498 | 463 | |||||||||||
9.625% Senior Notes due 2019 | 489 | 518 | 1,012 | 965 | |||||||||||
5.125% Senior Notes due 2020 | 363 | 342 | 768 | 626 | |||||||||||
5.875% Exchangeable Senior Notes due 2021 (a) | 1,147 | 1,199 | — | — | |||||||||||
7.75% Senior Notes due 2021 | 739 | 761 | — | — | |||||||||||
4.50% Senior Notes due 2022 | 642 | 565 | 642 | 484 | |||||||||||
8.250% Senior Notes due 2023 | 738 | 757 | — | — | |||||||||||
9.875% Senior Notes due 2024 | 528 | 575 | — | — | |||||||||||
6.50% Senior Notes due 2036 | 447 | 364 | 446 | 291 | |||||||||||
6.80% Senior Notes due 2037 | 255 | 213 | 255 | 180 | |||||||||||
7.00% Senior Notes due 2038 | 456 | 384 | 455 | 347 | |||||||||||
9.875% Senior Notes due 2039 | 245 | 250 | 245 | 213 | |||||||||||
6.75% Senior Notes due 2040 | 456 | 373 | 456 | 327 | |||||||||||
5.95% Senior Notes due 2042 | 368 | 283 | 368 | 263 | |||||||||||
Total | $ | 7,028 | $ | 6,739 | $ | 6,099 | $ | 5,095 | |||||||
(a) | The Exchangeable Senior Notes due 2021 have been separated into the exchange feature, which is reported in Capital in Excess of Par Value, and the debt component, which is reflected in the table above and is reported in long-term debt. The estimated fair value reflected above is for the debt component only. The estimated fair value as of December 31, 2016 for the entire Exchangeable Senior Notes, which have a principal value of $1.265 billion, is $1.373 billion. |
During 2016, through a series offering, we received proceeds net of underwriting fees of $3.7 billion from the issuance various unsecured debt instruments and a secured term loan. We used certain proceeds from our initial debt offering to fund tender offers to buy back our senior notes with a principal balance of $1.87 billion and used the remaining proceeds to repay our revolving credit facility and for general corporate purposes. We recognized a cumulative loss of $78 million on the tender offers buyback transaction. During 2015, through a series of open market transactions, we repurchased certain of our senior notes with a total book value of $527 million. We recognized a cumulative gain of approximately $84 million on these transactions. In December 2014, through a series of open market transactions, we repurchased certain of our senior notes with an aggregate book value of $138 million and recognized a gain of approximately $11 million. See “Note 12 – Short-term Borrowings and Other Debt Obligations” and “Note 13 – Long-term Debt” for additional details of our financing activities.
We have various capital lease and other long-term debt instruments of $552 million at December 31, 2016, but believe the impact of changes in interest rates in the near term will not be material to these instruments. The carrying value of our short-term borrowings of $2 million at December 31, 2016 approximates their fair value.
As it relates to our variable rate debt, if market interest rates increase by an average of 1% from the rates as of December 31, 2016, interest expense for 2016 would increase by less than $1 million. This amount was determined by calculating the effect of the hypothetical interest rate on our variable rate debt. For purposes of this sensitivity analysis, we assumed no changes in our capital structure.
49
Interest Rate Swaps and Derivatives
We manage our debt portfolio to limit our exposure to interest rate volatility and may employ interest rate derivatives as a tool to achieve that goal. The major risks from interest rate derivatives include changes in the interest rates affecting the fair value of such instruments, potential increases in interest expense due to market increases in floating interest rates and the creditworthiness of the counterparties in such transactions. The counterparties to our interest rate swaps are multinational commercial banks. We continually re-evaluate counterparty creditworthiness and modify our requirements accordingly.
Amounts paid or received upon termination of the interest rate swaps represent the fair value of the agreements at the time of termination. Derivative gains and losses are recognized each period in current earnings or other comprehensive income (loss), depending on whether the derivative is designated as part of a hedge relationship, and if so, the type of hedge.
Item 8. Financial Statements and Supplementary Data
INDEX TO FINANCIAL STATEMENTS AND FINANCIAL STATEMENT SCHEDULE
PAGE | |
Financial Statement Schedule II: | |
50
Report of Independent Registered Public Accounting Firm
The Board of Directors and Shareholders
Weatherford International plc:
We have audited the accompanying consolidated balance sheets of Weatherford International plc and subsidiaries as of December 31, 2016 and 2015, and the related consolidated statements of operations, comprehensive loss, shareholders’ equity, and cash flows for each of the years in the three-year period ended December 31, 2016. In connection with our audits of the consolidated financial statements, we also have audited financial statement schedule II for each of the years in the three-year period ended December 31, 2016. These consolidated financial statements and financial statement schedule are the responsibility of the Company’s management. Our responsibility is to express an opinion on these consolidated financial statements and financial statement schedule based on our audits.
We conducted our audits in accordance with the standards of the Public Company Accounting Oversight Board (United States). Those standards require that we plan and perform the audit to obtain reasonable assurance about whether the financial statements are free of material misstatement. An audit includes examining, on a test basis, evidence supporting the amounts and disclosures in the financial statements. An audit also includes assessing the accounting principles used and significant estimates made by management, as well as evaluating the overall financial statement presentation. We believe that our audits provide a reasonable basis for our opinion.
In our opinion, the consolidated financial statements referred to above present fairly, in all material respects, the financial position of Weatherford International plc and subsidiaries as of December 31, 2016 and 2015, and the results of their operations and their cash flows for each of the years in the three-year period ended December 31, 2016, in conformity with U.S. generally accepted accounting principles. Also in our opinion, the related financial statement schedule, when considered in relation to the basic consolidated financial statements taken as a whole, presents fairly, in all material respects, the information set forth therein.
As discussed in Note 1 to the consolidated financial statements, the Company changed its method of accounting for deferred income taxes effective January 1, 2016 due to the adoption of FASB ASU 2015-17, Balance Sheet Classification of Deferred Taxes. Additionally, as discussed in Note 1 to the consolidated financial statements, the Company changed its accounting method for debt issuance costs effective January 1, 2015 due to the adoption of FASB ASU 2015-03, Simplifying the Presentation of Debt Issuance Costs.
We also have audited, in accordance with the standards of the Public Company Accounting Oversight Board (United States), Weatherford International plc’s internal control over financial reporting as of December 31, 2016, based on criteria established in Internal Control - Integrated Framework (2013) issued by the Committee of Sponsoring Organizations of the Treadway Commission (COSO), and our report dated February 14, 2017 expressed an unqualified opinion on the effectiveness of the Company’s internal control over financial reporting.
/s/ KPMG LLP
Houston, Texas
February 14, 2017
51
Report of Independent Registered Public Accounting Firm
The Board of Directors and Shareholders
Weatherford International plc:
We have audited Weatherford International plc’s internal control over financial reporting as of December 31, 2016, based on criteria established in Internal Control - Integrated Framework (2013) issued by the Committee of Sponsoring Organizations of the Treadway Commission (COSO). Weatherford International plc’s management is responsible for maintaining effective internal control over financial reporting and for its assessment of the effectiveness of internal control over financial reporting, included in the accompanying Management’s Report on Internal Control over Financial Reporting. Our responsibility is to express an opinion on the Company’s internal control over financial reporting based on our audit.
We conducted our audit in accordance with the standards of the Public Company Accounting Oversight Board (United States). Those standards require that we plan and perform the audit to obtain reasonable assurance about whether effective internal control over financial reporting was maintained in all material respects. Our audit included obtaining an understanding of internal control over financial reporting, assessing the risk that a material weakness exists, and testing and evaluating the design and operating effectiveness of internal control based on the assessed risk. Our audit also included performing such other procedures as we considered necessary in the circumstances. We believe that our audit provides a reasonable basis for our opinion.
A company’s internal control over financial reporting is a process designed to provide reasonable assurance regarding the reliability of financial reporting and the preparation of financial statements for external purposes in accordance with generally accepted accounting principles. A company’s internal control over financial reporting includes those policies and procedures that (1) pertain to the maintenance of records that, in reasonable detail, accurately and fairly reflect the transactions and dispositions of the assets of the company; (2) provide reasonable assurance that transactions are recorded as necessary to permit preparation of financial statements in accordance with generally accepted accounting principles, and that receipts and expenditures of the company are being made only in accordance with authorizations of management and directors of the company; and (3) provide reasonable assurance regarding prevention or timely detection of unauthorized acquisition, use, or disposition of the company’s assets that could have a material effect on the financial statements.
Because of its inherent limitations, internal control over financial reporting may not prevent or detect misstatements. Also, projections of any evaluation of effectiveness to future periods are subject to the risk that controls may become inadequate because of changes in conditions, or that the degree of compliance with the policies or procedures may deteriorate.
In our opinion, Weatherford International plc maintained, in all material respects, effective internal control over financial reporting as of December 31, 2016, based on criteria established in Internal Control - Integrated Framework (2013) issued by the Committee of Sponsoring Organizations of the Treadway Commission (COSO).
We also have audited, in accordance with the standards of the Public Company Accounting Oversight Board (United States), the consolidated balance sheets of Weatherford International plc and subsidiaries as of December 31, 2016 and 2015, and the related consolidated statements of operations, comprehensive loss, shareholders’ equity, and cash flows for each of the years in the three-year period ended December 31, 2016, and our report dated February 14, 2017 expressed an unqualified opinion on those consolidated financial statements.
/s/ KPMG LLP
Houston, Texas
February 14, 2017
52
WEATHERFORD INTERNATIONAL PLC AND SUBSIDIARIES | |||||||||||
CONSOLIDATED STATEMENTS OF OPERATIONS | |||||||||||
Year Ended December 31, | |||||||||||
(Dollars and shares in millions, except per share amounts) | 2016 | 2015 | 2014 | ||||||||
Revenues: | |||||||||||
Products | $ | 2,059 | $ | 3,573 | $ | 6,059 | |||||
Services | 3,690 | 5,860 | 8,852 | ||||||||
Total Revenues | 5,749 | 9,433 | 14,911 | ||||||||
Costs and Expenses: | |||||||||||
Cost of Products | 2,143 | 3,433 | 4,942 | ||||||||
Cost of Services | 3,046 | 4,588 | 6,519 | ||||||||
Research and Development | 159 | 231 | 290 | ||||||||
Selling, General and Administrative Attributable to Segments | 970 | 1,353 | 1,727 | ||||||||
Corporate General and Administrative | 139 | 227 | 290 | ||||||||
Long-Lived Asset Impairments, Write-Downs and Other Charges | 1,043 | 768 | 495 | ||||||||
Goodwill and Equity Investment Impairment | — | 25 | 161 | ||||||||
Restructuring Charges | 280 | 232 | 331 | ||||||||
Litigation Charges, Net | 220 | 116 | — | ||||||||
Loss (Gain) on Sale of Businesses and Investments, Net | — | 6 | (349 | ) | |||||||
Total Costs and Expenses | 8,000 | 10,979 | 14,406 | ||||||||
Operating Income (Loss) | (2,251 | ) | (1,546 | ) | 505 | ||||||
Other Income (Expense): | |||||||||||
Interest Expense, Net | (499 | ) | (468 | ) | (498 | ) | |||||
Bond Tender Premium, Net | (78 | ) | — | — | |||||||
Currency Devaluation Charges | (41 | ) | (85 | ) | (245 | ) | |||||
Other Income (Expense), Net | (8 | ) | 3 | (17 | ) | ||||||
Loss Before Income Taxes | (2,877 | ) | (2,096 | ) | (255 | ) | |||||
Income Tax (Provision) Benefit | (496 | ) | 145 | (284 | ) | ||||||
Net Loss | (3,373 | ) | (1,951 | ) | (539 | ) | |||||
Net Income Attributable to Noncontrolling Interests | 19 | 34 | 45 | ||||||||
Net Loss Attributable to Weatherford | $ | (3,392 | ) | $ | (1,985 | ) | $ | (584 | ) | ||
Loss Per Share Attributable to Weatherford: | |||||||||||
Basic & Diluted | $ | (3.82 | ) | $ | (2.55 | ) | $ | (0.75 | ) | ||
Weighted Average Shares Outstanding: | |||||||||||
Basic & Diluted | 887 | 779 | 777 | ||||||||
The accompanying notes are an integral part of these consolidated financial statements.
53
WEATHERFORD INTERNATIONAL PLC AND SUBSIDIARIES | |||||||||||
CONSOLIDATED STATEMENTS OF COMPREHENSIVE LOSS | |||||||||||
Year Ended December 31, | |||||||||||
(Dollars in millions) | 2016 | 2015 | 2014 | ||||||||
Net Loss | $ | (3,373 | ) | $ | (1,951 | ) | $ | (539 | ) | ||
Foreign Currency Translation | (12 | ) | (789 | ) | (673 | ) | |||||
Defined Benefit Pension Activity | 42 | 28 | (19 | ) | |||||||
Other | 1 | 1 | (2 | ) | |||||||
Other Comprehensive Income (Loss) | 31 | (760 | ) | (694 | ) | ||||||
Comprehensive Loss | (3,342 | ) | (2,711 | ) | (1,233 | ) | |||||
Comprehensive Income Attributable to Noncontrolling Interests | 19 | 34 | 45 | ||||||||
Comprehensive Loss Attributable to Weatherford | $ | (3,361 | ) | $ | (2,745 | ) | $ | (1,278 | ) | ||
The accompanying notes are an integral part of these consolidated financial statements.
54
WEATHERFORD INTERNATIONAL PLC AND SUBSIDIARIES | |||||||
CONSOLIDATED BALANCE SHEETS | |||||||
December 31, | |||||||
(Dollars and shares in millions, except par value) | 2016 | 2015 | |||||
Current Assets: | |||||||
Cash and Cash Equivalents | $ | 1,037 | $ | 467 | |||
Accounts Receivable, Net of Allowance for Uncollectible Accounts of $129 in 2016 and $113 in 2015 | 1,383 | 1,781 | |||||
Inventories, Net | 1,802 | 2,344 | |||||
Prepaid Expenses | 263 | 343 | |||||
Deferred Tax Assets | — | 165 | |||||
Other Current Assets | 425 | 464 | |||||
Total Current Assets | 4,910 | 5,564 | |||||
Property, Plant and Equipment: | |||||||
Land, Buildings and Leasehold Improvements | 1,622 | 1,780 | |||||
Rental and Service Equipment | 7,975 | 8,702 | |||||
Machinery and Other | 2,245 | 2,432 | |||||
Property, Plant and Equipment, Gross | 11,842 | 12,914 | |||||
Less: Accumulated Depreciation | 7,362 | 7,235 | |||||
Property, Plant and Equipment, Net | 4,480 | 5,679 | |||||
Goodwill | 2,797 | 2,803 | |||||
Intangible Assets, Net | 248 | 356 | |||||
Equity Investments | 66 | 76 | |||||
Other Non-current Assets | 163 | 282 | |||||
Total Assets | $ | 12,664 | $ | 14,760 | |||
Current Liabilities: | |||||||
Short-term Borrowings and Current Portion of Long-term Debt | $ | 179 | $ | 1,582 | |||
Accounts Payable | 845 | 948 | |||||
Accrued Salaries and Benefits | 291 | 406 | |||||
Income Taxes Payable | 255 | 330 | |||||
Other Current Liabilities | 858 | 765 | |||||
Total Current Liabilities | 2,428 | 4,031 | |||||
Long-term Debt | 7,403 | 5,852 | |||||
Other Non-current Liabilities | 765 | 512 | |||||
Total Liabilities | 10,596 | 10,395 | |||||
Shareholders’ Equity: | |||||||
Shares - Par Value $0.001; Authorized 1,356 shares, Issued and Outstanding 983 shares and 779 shares at December 31, 2016 and 2015, respectively | 1 | 1 | |||||
Capital in Excess of Par Value | 6,571 | 5,502 | |||||
Retained (Deficit) Earnings | (2,950 | ) | 442 | ||||
Accumulated Other Comprehensive Loss | (1,610 | ) | (1,641 | ) | |||
Weatherford Shareholders’ Equity | 2,012 | 4,304 | |||||
Noncontrolling Interests | 56 | 61 | |||||
Total Shareholders’ Equity | 2,068 | 4,365 | |||||
Total Liabilities and Shareholders’ Equity | $ | 12,664 | $ | 14,760 | |||
The accompanying notes are an integral part of these consolidated financial statements.
55
WEATHERFORD INTERNATIONAL PLC AND SUBSIDIARIES | |||||||||||||||||||||||||||
CONSOLIDATED STATEMENTS OF SHAREHOLDERS’ EQUITY | |||||||||||||||||||||||||||
(Dollars in millions) | Par Value of Issued Shares | Capital In Excess of Par Value | Retained Earnings | Accumulated Other Comprehensive Income (Loss) | Treasury Shares | Non-controlling Interests | Total Shareholders’ Equity | ||||||||||||||||||||
Balance at December 31, 2013 | $ | 775 | $ | 4,600 | $ | 3,011 | $ | (187 | ) | $ | (37 | ) | $ | 41 | $ | 8,203 | |||||||||||
Net Income (Loss) | — | — | (584 | ) | — | — | 45 | (539 | ) | ||||||||||||||||||
Other Comprehensive Loss | — | — | — | (694 | ) | — | — | (694 | ) | ||||||||||||||||||
Consolidation of Joint Venture | — | — | — | — | — | 27 | 27 | ||||||||||||||||||||
Dividends Paid to Noncontrolling Interests | — | — | — | — | — | (39 | ) | (39 | ) | ||||||||||||||||||
Change in Common Shares, Treasury Shares and Paid in Capital Associated with Redomestication | (778 | ) | 750 | — | — | 39 | — | 11 | |||||||||||||||||||
Equity Awards Granted, Vested and Exercised | 4 | 54 | — | — | (2 | ) | — | 56 | |||||||||||||||||||
Excess Tax Benefit of Share-Based Compensation Plans | — | 7 | — | — | — | — | 7 | ||||||||||||||||||||
Other | — | — | — | — | — | 1 | 1 | ||||||||||||||||||||
Balance at December 31, 2014 | $ | 1 | $ | 5,411 | $ | 2,427 | $ | (881 | ) | $ | — | $ | 75 | $ | 7,033 | ||||||||||||
Net Income (Loss) | — | — | (1,985 | ) | — | — | 34 | (1,951 | ) | ||||||||||||||||||
Other Comprehensive Loss | — | — | — | (760 | ) | — | — | (760 | ) | ||||||||||||||||||
Dividends Paid to Noncontrolling Interests | — | — | — | — | — | (48 | ) | (48 | ) | ||||||||||||||||||
Equity Awards Granted, Vested and Exercised | — | 91 | — | — | — | — | 91 | ||||||||||||||||||||
Balance at December 31, 2015 | $ | 1 | $ | 5,502 | $ | 442 | $ | (1,641 | ) | $ | — | $ | 61 | $ | 4,365 | ||||||||||||
Net Income (Loss) | — | — | (3,392 | ) | — | — | 19 | (3,373 | ) | ||||||||||||||||||
Other Comprehensive Income | — | — | — | 31 | — | — | 31 | ||||||||||||||||||||
Dividends Paid to Noncontrolling Interests | — | — | — | — | — | (24 | ) | (24 | ) | ||||||||||||||||||
Issuance of Common Shares | — | 894 | — | — | — | — | 894 | ||||||||||||||||||||
Issuance of Exchangeable Notes | — | 97 | — | — | — | — | 97 | ||||||||||||||||||||
Equity Awards Granted, Vested and Exercised | — | 78 | — | — | — | — | 78 | ||||||||||||||||||||
Balance at December 31, 2016 | $ | 1 | $ | 6,571 | $ | (2,950 | ) | $ | (1,610 | ) | $ | — | $ | 56 | $ | 2,068 | |||||||||||
The accompanying notes are an integral part of these consolidated financial statements.
56
WEATHERFORD INTERNATIONAL PLC AND SUBSIDIARIES | |||||||||||
CONSOLIDATED STATEMENTS OF CASH FLOWS | |||||||||||
Year Ended December 31, | |||||||||||
(Dollars in millions) | 2016 | 2015 | 2014 | ||||||||
Cash Flows From Operating Activities: | |||||||||||
Net Loss | $ | (3,373 | ) | $ | (1,951 | ) | $ | (539 | ) | ||
Adjustments to Reconcile Net Loss to Net Cash Provided by Operating Activities: | |||||||||||
Depreciation and Amortization | 956 | 1,200 | 1,371 | ||||||||
Long-Lived Asset Impairments and Other Charges | 436 | 638 | 495 | ||||||||
Inventory Charges | 219 | 202 | 48 | ||||||||
Goodwill and Equity Investment Impairment | — | 25 | 161 | ||||||||
Restructuring and Other Asset Charges | 194 | 194 | 135 | ||||||||
Divestiture Related and Other Charges | — | — | 64 | ||||||||
Currency Devaluation and Related Charges | 41 | 85 | 245 | ||||||||
Litigation Charges | 157 | 40 | 25 | ||||||||
Bond Tender Premium | 78 | — | — | ||||||||
Employee Share-Based Compensation Expense | 87 | 73 | 56 | ||||||||
Bad Debt Expense | 69 | 48 | 27 | ||||||||
Loss (Gain) on Sale of Businesses, Net | — | 6 | (349 | ) | |||||||
Deferred Income Tax Provision (Benefit) | 381 | (448 | ) | (66 | ) | ||||||
Excess Tax Benefits from Share-Based Compensation | — | — | (7 | ) | |||||||
Other, Net | 151 | 34 | 50 | ||||||||
Change in Operating Assets and Liabilities, Net of Effect of Businesses Acquired: | |||||||||||
Accounts Receivable | 214 | 1,031 | 78 | ||||||||
Inventories | 260 | 349 | (167 | ) | |||||||
Other Current Assets | 67 | 128 | (80 | ) | |||||||
Accounts Payable | (21 | ) | (813 | ) | (150 | ) | |||||
Billings in Excess of Costs and Estimated Earnings | 45 | (1 | ) | (126 | ) | ||||||
Other Current Liabilities | (248 | ) | (65 | ) | (219 | ) | |||||
Other, Net | (27 | ) | (69 | ) | (89 | ) | |||||
Net Cash Provided by (Used in) Operating Activities | (314 | ) | 706 | 963 | |||||||
Cash Flows From Investing Activities: | |||||||||||
Capital Expenditures for Property, Plant and Equipment | (204 | ) | (682 | ) | (1,450 | ) | |||||
Acquisitions of Businesses, Net of Cash Acquired | (5 | ) | (14 | ) | 18 | ||||||
Acquisition of Intellectual Property | (10 | ) | (8 | ) | (5 | ) | |||||
Acquisition of Equity Investments in Unconsolidated Affiliates | — | — | (3 | ) | |||||||
Insurance Proceeds Related to Asset Casualty Loss | 39 | — | — | ||||||||
Proceeds (Payment) Related to Sale of Businesses and Equity Investment, Net | (6 | ) | 8 | 1,711 | |||||||
Proceeds from Sale of Assets | 49 | 37 | 59 | ||||||||
Net Cash Provided by (Used in) Investing Activities | (137 | ) | (659 | ) | 330 | ||||||
Cash Flows From Financing Activities: | |||||||||||
Borrowings of Long-term Debt | 3,681 | 4 | — | ||||||||
Repayments of Long-term Debt | (1,963 | ) | (474 | ) | (259 | ) | |||||
Borrowings (Repayments) of Short-term Debt, Net | (1,512 | ) | 505 | (924 | ) | ||||||
Proceeds from Issuance of Ordinary Common Shares and Warrant | 1,071 | — | — | ||||||||
Bond Tender Premium | (78 | ) | — | — | |||||||
Payment for Leased Asset Purchase | (87 | ) | — | — | |||||||
Excess Tax Benefits from Share-Based Compensation | — | — | 7 | ||||||||
Proceeds from Sale of Executive Deferred Compensation Ordinary Shares | — | — | 22 | ||||||||
Other Financing Activities, Net | (41 | ) | (23 | ) | (26 | ) | |||||
Net Cash Provided by (Used in) Financing Activities | 1,071 | 12 | (1,180 | ) | |||||||
Effect of Exchange Rate Changes on Cash and Cash Equivalents | (50 | ) | (66 | ) | (74 | ) | |||||
Net Increase (Decrease) in Cash and Cash Equivalents | 570 | (7 | ) | 39 | |||||||
Cash and Cash Equivalents at Beginning of Year | 467 | 474 | 435 | ||||||||
Cash and Cash Equivalents at End of Year | $ | 1,037 | $ | 467 | $ | 474 | |||||
The accompanying notes are an integral part of these consolidated financial statements.
57
WEATHERFORD INTERNATIONAL PLC AND SUBSIDIARIES
NOTES TO CONSOLIDATED FINANCIAL STATEMENTS
1. Summary of Significant Accounting Policies
Organization and Nature of Operations
Weatherford International plc (“Weatherford Ireland”), an Irish public limited company and Swiss tax resident, together with its subsidiaries (“Weatherford,” the “Company,” “we,” “us” and “our”), is a multinational oilfield service company. Weatherford is one of the world’s leading providers of equipment and services used in the drilling, evaluation, completion, production and intervention of oil and natural gas wells. We operate in approximately 90 countries, which are located in nearly all of the oil and natural gas producing regions in the world. Many of our businesses, including those of our predecessor companies, have been operating for more than 50 years.
On June 17, 2014, we completed the change in our place of incorporation from Switzerland to Ireland, whereby Weatherford Ireland became the new public holding company and the parent of the Weatherford group of companies (the “Merger”). The Merger was effected through an agreement between Weatherford International Ltd. (“Weatherford Switzerland”) and Weatherford Ireland pursuant to which each registered share of Weatherford Switzerland was exchanged for the allotment of one ordinary share of Weatherford Ireland. The authorized share capital of Weatherford Ireland includes 1.356 billion ordinary shares with a par value of $0.001 per share. Our ordinary shares are listed on the New York Stock Exchange (the “NYSE”) under the symbol “WFT,” the same symbol under which Weatherford Switzerland registered shares were previously listed.
In February 2009, we completed a share exchange transaction in which Weatherford International Ltd., a Bermuda exempted company (“Weatherford Bermuda”), and our then parent company, became a wholly owned subsidiary of Weatherford Switzerland, for purposes of changing the Company’s place of incorporation from Bermuda to Switzerland. Prior to 2002, our parent company was Weatherford International, Inc., a Delaware corporation (“Weatherford Delaware”), until we moved our incorporation to Bermuda in 2002. Weatherford Bermuda and Weatherford Delaware continue to be wholly owned subsidiaries of Weatherford Ireland. In 2013, Weatherford Delaware converted its corporate form and now exists as Weatherford International, LLC, a Delaware limited liability company.
Principles of Consolidation
We consolidate all wholly owned subsidiaries, controlled joint ventures and variable interest entities where the Company has determined it is the primary beneficiary. All material intercompany accounts and transactions have been eliminated in consolidation.
Certain prior year amounts have been reclassified to conform to the current year presentation related to the adoption of new accounting standards. Net income and shareholders’ equity were not affected by these reclassifications. See subsection entitled “New Accounting Pronouncements” for additional details.
Investments in affiliates in which we exercise significant influence over operating and financial policies are accounted for using the equity method. We recognize equity in earnings of unconsolidated affiliates in Selling, General and Administration attributable to segments in our Consolidated Statements of Operations (see “Note 11 – Equity Investments”).
Use of Estimates
The preparation of financial statements in conformity with accounting principles generally accepted in the United States of America (“U.S. GAAP”) requires management to make estimates and assumptions that affect the reported amounts of assets and liabilities at the date of the financial statements, the reported amounts of revenues and expenses during the reporting period, and disclosure of contingent assets and liabilities. On an on-going basis, we evaluate our estimates and assumptions, including those related to uncollectible accounts receivable, lower of cost or market of inventories, equity investments, derivative financial instruments, intangible assets and goodwill, property, plant and equipment (“PP&E”), income taxes, percentage-of-completion accounting for long-term contracts, self-insurance, foreign currency exchange rates, pension and post-retirement benefit plans, disputes, litigation, contingencies and share-based compensation. We base our estimates on historical experience and on various other assumptions that are believed to be reasonable under the circumstances, the results of which form the basis for making judgments about the carrying values of assets and liabilities that are not readily apparent from other sources. Actual results could differ from those estimates.
58
Disputes, Litigation and Contingencies
We accrue an estimate of the probable and estimable cost to resolve certain legal and investigation matters. For matters not deemed probable and reasonably estimable, we have not accrued any amounts in accordance with U.S. GAAP. Our contingent loss estimates are based upon an analysis of potential results, assuming a combination of probable litigation and settlement strategies. The accuracy of these estimates is impacted by the complexity of the associated issues.
Cash and Cash Equivalents
We consider all highly liquid investments with original maturities of three months or less to be cash equivalents.
Allowance for Doubtful Accounts
We establish an allowance for doubtful accounts based on various factors including historical experience, the current aging status of our customer accounts, the financial condition of our customers and the business and political environment in which our customers operate. Provisions for doubtful accounts are recorded when it becomes probable that customer accounts are uncollectible.
Major Customers and Credit Risk
Substantially all of our customers are engaged in the energy industry. This concentration of customers may impact our overall exposure to credit risk, either positively or negatively, in that customers may be similarly affected by changes in economic and industry conditions. We perform on-going credit evaluations of our customers and do not generally require collateral in support of our trade receivables. We maintain allowances for potential credit losses, and actual losses have historically been within our expectations. International sales also present various risks, including risks of war, civil disturbances and governmental activities that may limit or disrupt markets, restrict the movement of funds, or result in the deprivation of contract rights or the taking of property without fair consideration. Most of our international sales are to large international or national oil companies and these sales have resulted in a concentration of receivables from certain national oil companies in Latin America. As of December 31, 2016, Latin America accounted for 38% of our net outstanding accounts receivables. Venezuela, Ecuador and Mexico represent 43%, 16% and 10%, respectively, of the Latin America balance. In 2016, we accepted a note with a face value of $120 million from Petroleos de Venezuela, S.A. (“PDVSA”) in exchange for $120 million in net trade receivables. The note had a three year term at a 6.5% stated interest rate. We carried the note at fair value and recognized a loss in the second quarter of 2016 of $84 million to adjust the note to fair value. In the fourth quarter of 2016, we sold the economic rights in the note receivable for $44 million and recognized a gain of $8 million. During 2016, 2015 and 2014, no individual customer accounted for more than 10% of our consolidated revenues.
Inventories
We value our inventories at lower of cost or market using either the first-in, first-out (“FIFO”) or average cost method. Cost represents third-party invoice or production cost. Production cost includes material, labor and manufacturing overhead. Work in process and finished goods inventories include the cost of materials, labor and manufacturing overhead. To maintain a book value that is the lower of cost or market, we maintain reserves for excess, slow moving and obsolete inventory. We regularly review inventory quantities on hand and record provisions for excess, slow moving and obsolete inventory.
Property, Plant and Equipment
We carry our property, plant and equipment, both owned and under capital lease, at cost less accumulated depreciation. The carrying values are based on our estimates and judgments relative to capitalized costs, useful lives and salvage value, where applicable. We expense maintenance and repairs as incurred. We capitalize expenditures for improvements as well as renewals and replacements that extend the useful life of the asset. We depreciate our fixed assets on a straight-line basis over their estimated useful lives, allowing for salvage value where applicable.
Our depreciation expense was $896 million, $1.1 billion and $1.3 billion for the years ended December 31, 2016, 2015 and 2014, respectively. We classify our rig assets as “Rental and Service Equipment” on the Consolidated Balance Sheets.
59
The estimated useful lives of our major classes of PP&E are as follows:
Major Classes of Property, Plant and Equipment | Estimated Useful Lives |
Buildings and leasehold improvements | 10 – 40 years or lease term |
Rental and service equipment | 2 – 20 years |
Machinery and other | 2 – 12 years |
Goodwill
Goodwill represents the excess of consideration paid over the fair value of net tangible and identifiable intangible assets acquired in a business combination. Goodwill is not amortized but is evaluated for impairment. We perform an impairment test for goodwill annually as of October 1 or more frequently if indicators of potential impairment exist that would more-likely-than-not reduce the fair value of the reporting unit below its carrying value. Goodwill impairment is evaluated using a two-step process. The first step of the goodwill impairment test involves a comparison of the fair value of each of our reporting units with their carrying values. We have the option to assess qualitative factors to determine if it is necessary to perform the first step of the impairment test. If it is not more-likely-than-not that the fair value of a reporting unit is less than its carrying value, further testing is not required.
If the fair value of a reporting unit is less than the recorded book value of the reporting unit’s net assets (including goodwill), then a hypothetical purchase price allocation is performed on the reporting unit’s assets and liabilities using the fair value of the reporting unit as the purchase price in the calculation. If the implied fair value of goodwill is less than the recorded amount of goodwill, the recorded goodwill is written down to the new amount.
Intangible Assets
Our intangible assets, excluding goodwill, are acquired technology, licenses, patents, customer relationships and other identifiable intangible assets. Intangible assets are amortized on a straight-line basis over their estimated economic lives generally ranging from two to 20 years, except for intangible assets with indefinite lives, which are not amortized. As many areas of our business rely on patents and proprietary technology, we seek patent protection both inside and outside the U.S. for products and methods that appear to have commercial significance. We capitalize patent defense costs when we determine that a successful defense is probable.
Long-Lived Assets
We initially record our long-lived assets at cost, and review on a regular basis to determine whether any events or changes in circumstances indicate the carrying amount of the assets may not be recoverable. Factors that might indicate a potential impairment may include, but are not limited to, significant decreases in the market value of the long-lived asset, a significant change in the long-lived asset’s physical condition, the introduction of competing technologies, legal challenges, a reduction in the utilization rate of the assets, a change in industry conditions or a reduction in cash flows associated with the use of the long-lived asset. If these or other factors indicate the carrying amount of the asset may not be recoverable, we determine whether an impairment has occurred through analysis of undiscounted cash flow of the asset at the lowest level that has an identifiable cash flow. If an impairment has occurred, we recognize a loss for the difference between the carrying amount and the fair value of the asset. We estimate the fair value of the asset using market prices when available or, in the absence of market prices, based on an estimate of discounted cash flows or replacement cost. Cash flows are generally discounted using an interest rate commensurate with a weighted average cost of capital for a similar asset.
Research and Development Expenditures
Research and development expenditures are expensed as incurred.
Environmental Expenditures
Environmental expenditures that relate to the remediation of an existing condition caused by past operations and that do not contribute to future revenues are expensed. Liabilities for these expenditures are recorded when it is probable that obligations have been incurred and costs can be reasonably estimated. Estimates are based on available facts and technology, enacted laws and regulations and our prior experience in remediation of contaminated sites.
60
Derivative Financial Instruments
We record derivative instruments on the balance sheet at their fair value as either assets or liabilities. Changes in the fair value of derivatives are recorded each period in current earnings or other comprehensive income (loss), depending on whether the derivative is designated as part of a hedge relationship, and if so, the type of hedge.
Foreign Currency
Results of operations for our foreign subsidiaries with functional currencies other than the U.S. dollar are translated using average exchange rates during the period. Assets and liabilities of these foreign subsidiaries are translated using the exchange rates in effect at the balance sheet dates, and the resulting translation adjustments are included in Accumulated Other Comprehensive Loss, a component of shareholders’ equity.
For our subsidiaries that have a functional currency that differs from the currency of their balances and transactions, inventories, PP&E and other non-monetary assets and liabilities, together with their related elements of expense or income, are remeasured into the functional currency using historical exchange rates. All monetary assets and liabilities are remeasured into the functional currency at current exchange rates. All revenues and expenses are translated into the functional currency at average exchange rates. Remeasurement gains and losses for these subsidiaries are recognized in our results of operations during the period incurred. We had net foreign currency losses, net of gains and losses on foreign currency derivatives (See “Note 15 – Derivative Instruments”), but excluding charges relating to the Venezuelan bolivar fuertes (“bolivar”), the Angolan kwanza, Argentinian peso, Egyptian pound and Kazakhstani tenge as described under the caption “Currency Devaluation and Related Charges,” of $9 million, $53 million and $18 million in 2016, 2015 and 2014, respectively, which are included in “Other Income (Expense), Net” on the accompanying Consolidated Statements of Operations.
Currency Devaluation and Related Charges
Currency devaluation charges are included in current earnings in “Currency Devaluation Charges” on the accompanying Consolidated Statements of Operations. In 2016, currency devaluation charges include charges related to the Angolan kwanza of $31 million and the Egyptian pound of $10 million. In 2015, currency devaluations charges of $85 million include charges related to the Angolan kwanza of $39 million, the Venezuelan bolivar of $26 million, the Argentina peso of $11 million and Kazakhstani tenge of $9 million. In 2014, currency charges include $245 million related to the Venezuelan bolivar. The charges were related to our adoption of the SICAD II exchange rate provided by Venezuela’s Supplementary Foreign Currency Administration System approximately of 50 Venezuelan bolivars per U.S. dollar. See “Note 4 – Supplementary Information” for additional information related to currency devaluation charges.
At December 31, 2016 our net monetary asset position denominated in Angolan kwanza was approximately $116 million. The net monetary positions denominated in Venezuelan bolivar, Argentine peso and Kazakhstani tenge were not material.
Share-Based Compensation
We account for all share-based payment awards, including shares issued under employee stock purchase plans, stock options, restricted shares, restricted share units and performance units by measuring these awards at the date of grant and recognizing the grant date fair value as an expense, net of expected forfeitures, over the service period, which is usually the vesting period.
Income Taxes
Income taxes have been provided based upon the tax laws and rates in the countries in which our operations are conducted and income is earned. Deferred tax assets and liabilities are recognized for the future tax consequences attributable to differences between the financial statement carrying amounts of existing assets and liabilities and their respective tax bases. A valuation allowance for deferred tax assets is recorded when it is more likely than not that some or all of the benefit from the deferred tax asset will not be realized. The impact of an uncertain tax position taken or expected to be taken on an income tax return is recognized in the financial statements at the largest amount that is more likely than not to be sustained upon examination by the relevant taxing authority.
61
Revenue Recognition
Revenue is recognized when all of the following criteria have been met: (1) evidence of an arrangement exists; (2) delivery to and acceptance by the customer has occurred; (3) the price to the customer is fixed or determinable; and (4) collectability is reasonably assured.
Our services and products are generally sold based upon purchase orders, contracts or other persuasive evidence of an arrangement with our customers that include fixed or determinable prices but do not generally include right of return provisions or other significant post-delivery obligations. Our products are produced in a standard manufacturing operation, even if produced to our customer’s specifications. Revenue is recognized for products upon delivery and when the customers assume the risks and rewards of ownership. Revenue is recognized for services when they are rendered. Both contract drilling and pipeline service revenue is contractual by nature and generally governed by day-rate based contracts. We recognize revenue for day-rate contracts as the services are rendered.
Up-front payments for preparation and mobilization of equipment and personnel in connection with new drilling contracts are deferred along with any related incremental costs incurred directly related to preparation and mobilization. The deferred revenue and costs are recognized over the primary contract term using the straight-line method. Costs of relocating equipment without contracts are expensed as incurred. Demobilization fees received are recognized, along with any related expenses, upon completion of contracts.
We incur rebillable expenses including shipping and handling, third-party inspection and repairs, and customs costs and duties. We recognize the revenue associated with these rebillable expenses when reimbursed by customers as Product Revenues and all related costs as Cost of Products in the accompanying Consolidated Statements of Operations.
Percentage-of-Completion
Revenue from certain long-term construction type contracts is reported based on the percentage-of-completion method of accounting. This method of accounting requires us to calculate contract profit to be recognized in each reporting period for each contract based upon our projections of future outcomes, which include:
•estimates of the available revenue under the contracts;
•estimates of the total cost to complete the project;
•estimates of project schedule and completion date;
•estimates of the extent of progress toward completion; and
•change order amounts or claims included in revenue.
Measurements of progress are based on costs incurred to date as a percentage of total estimated costs or output related to physical progress. At the outset of each contract, we prepare a detailed analysis of our estimated cost to complete the project. Risks related to service delivery, usage, productivity and other factors are considered in the estimation process. We periodically evaluate the estimated costs, claims, change orders and percentage-of-completion at the contract level. The recording of profits and losses on long-term contracts requires an estimate of the total profit or loss over the life of each contract. This estimate requires consideration of total contract value, change orders and claims, less costs incurred and estimated costs to complete. Anticipated losses on contracts are recorded in full in the period in which they become evident. Profits are recorded based upon the total estimated contract profit multiplied by the current estimated percentage complete for the contract. There are many factors that impact future costs, including but not limited to weather, inflation, customer activity levels and budgeting constraints, labor and community disruptions, timely availability of materials, productivity and other factors.
Earnings per Share
Basic earnings per share for all periods presented equals net income divided by the weighted average number of our shares outstanding during the period including participating securities. Diluted earnings per share is computed by dividing net income by the weighted average number of our shares outstanding during the period including participating securities, adjusted for the dilutive effect of our stock options, restricted shares and performance units.
Unvested share-based payment awards and other instruments issued by the Company that contain non-forfeitable rights to dividends or dividend equivalents, whether paid or unpaid, are participating securities and are included in the computation of earnings per share following the two-class method. Accordingly, we include our restricted share awards (“RSA”) and the outstanding warrant, which contain the right to receive dividends, in the computation of both basic and diluted earnings per share when diluted.
62
New Accounting Pronouncements
Accounting Changes
In April 2015, the Financial Accounting Standards Board (“FASB”) issued ASU 2015-03, Interest - Imputation of Interest (Subtopic 835-30): Simplifying the Presentation of Debt Issuance Costs, which requires that debt issuance costs related to a recognized debt liability be presented in the balance sheet as a direct deduction from the carrying amount of that debt liability. We adopted ASU 2015-03 in the first quarter of 2016 retrospectively, which reduced Long-term debt and Other non-current assets by $27 million as of December 31, 2015.
In November 2015, the FASB issued ASU 2015-17, Income Taxes (Topic 740): Balance Sheet Classification of Deferred Taxes, which eliminates the current requirement to present deferred tax liabilities and assets as current and noncurrent in a classified balance sheet. We adopted ASU 2015-17 in the fourth quarter of 2016 and have reclassified net current deferred tax assets of $257 million and net current deferred tax liabilities of $33 million into non-current deferred tax asset and liabilities. We adopted ASC 2015-17 prospectively and no prior periods have been restated to conform to the new presentation. The adoption has no effect on net income or cash flows.
Accounting Standards Issued Not Yet Adopted
In October 2016, the FASB issued ASU 2016-16, Income Taxes (Topic 740): Intra-Entity Transfers of Assets Other Than Inventory, which eliminates a current exception in U.S. GAAP to the recognition of the income tax effects of temporary differences that result from intra-entity transfers of non-inventory assets. The intra-entity exception is being eliminated under the ASU. The standard is required to be applied on a modified retrospective basis and will be effective beginning with the first quarter of 2018. Early adoption is permitted, and we are evaluating the impact that this new standard will have on our Consolidated Financial Statements.
In August 2016, the FASB issued ASU 2016-15, Statement of Cash Flows (Topic 230): Classification of Certain Cash Receipts and Cash Payments. ASU 2016-15 provides guidance on the cash flow reporting of certain issues that were either unclear or not addressed under existing U.S. GAAP. The standard requires the retrospective transition method to each period presented and will be effective beginning with the first quarter of 2018, although early adoption is permitted. We are evaluating the impact that ASC 2016-15 will have on our Consolidated Statements of Cash Flows.
In June 2016, the FASB issued ASU 2016-13, Financial Instruments - Credit Losses (Topic 326): Measurement of Credit Losses on Financial Instruments, which requires financial assets measured at amortized cost basis to be presented at the net amount expected to be collected. The new standard applies to trade receivables and requires expected credit losses to be based on past events, current conditions and reasonable and supportable forecasts that affect the instrument’s collectability. The new standard will be effective for us beginning with the first quarter of 2020. Early adoption is permitted in 2019. We are evaluating the impact that this new standard will have on our Consolidated Financial Statements.
In March 2016, the FASB issued ASU 2016-09, Compensation - Stock Compensation (Topic 718): Improvements to Employee Share-Based Payment Accounting, which impacts certain aspects of the accounting for share-based payment transactions. This update provides various transition requirements that include both prospective, modified retrospective and retrospective application guidance. The new standard will be effective for us beginning with the first quarter of 2017. Early adoption is permitted, but it must include all amendments in the same period. We are evaluating the impact that this new standard will have on our Consolidated Financial Statements.
In February 2016, the FASB issued ASU No. 2016-02, Leases (Topic 842), which requires a lessee to recognize a lease asset and lease liability for most leases, including those classified as operating leases under existing GAAP. The ASU also changes the definition of a lease and requires expanded quantitative and qualitative disclosures for both lessees and lessors.
Under ASU 2016-02, we will revise our leasing policies to require most of the leases, where we are the lessee, to be recognized on the balance sheet as a lease asset and lease liability whereas currently we do not recognize operating leases on our balance sheet. Further, we will separate leases from other contracts where we are either the lessor or lessee when the rights conveyed under the contract indicate there is a lease, where we may not be required to do so under existing policies. While we cannot calculate the impact ASU 2016-02 will have on Weatherford’s financial statements, we anticipate that Weatherford’s assets and liabilities will increase by a significant amount.
63
This standard will be effective for us beginning with the first quarter of 2019. We do not anticipate adopting ASU 2016-02 early, which is permitted under the standard. ASU 2016-02 requires lessees and lessors to recognize and measure leases at the beginning of the earlies period presented using a modified retrospective transition method but permits certain practical expedients to be applied, which may exclude certain leases that commenced before the effective date.
In July 2015, the FASB issued ASU 2015-11, Inventory (Topic 330): Simplifying the Measurement of Inventory, which requires inventory not measured using either the last in, first out (LIFO) or the retail inventory method to be measured at the lower of cost and net realizable value. Net realizable value is the estimated selling price in the ordinary course of business, less reasonably predictable cost of completion, disposal, and transportation. The new standard will be effective for us beginning with the first quarter of 2017, and will be applied prospectively. Early adoption is permitted. We do not expect the impact of our adoption to have a material effect on our Consolidated Financial Statements.
In May 2014, the FASB issued ASU 2014-09, Revenue from Contracts with Customers (Topic 606), which will replace most existing revenue recognition guidance in GAAP. ASU 2014-09 will require an entity to recognize revenue to depict the transfer of promised goods or services to customers in an amount that reflects the consideration to which the entity expects to be entitled in exchange for those goods or services. ASU 2014-09 requires a five-step approach to recognizing revenue: 1) identify the contract, 2) identify performance obligations, 3) determine the transaction price, 4) allocate the transaction price, and 5) recognize revenue. Subsequent to ASU 2014-09’s issuance, Topic 606 has been affected by other FASB updates that address certain aspects or Topic 606 or revised the effective date of the accounting changes.
Under ASU 2014-09, we will revise our revenue recognition policy to require revenue recognition when control passes. This is a change from current policies, which generally require revenue recognition when delivery has occurred and risk and rewards of ownership have passed. Further, we will also begin estimating variable revenues and recognizing them sooner, whereas under current policies such variable revenues were generally not recognized until their collection was determinable. The impact of these and other changes will be to either slow the recognition of revenue in certain situations and to accelerate it in others. The expected impact is not yet determinable. The changes are not expected to have any direct impact to our cash flows.
We intend to adopt ASU 2014-09 as of its effective date in the first quarter 2018. ASU 2014-09 permits two transition methods: the retrospective or the modified retrospective. The retrospective method is applied by restating all prior years whereas the modified retrospective method requires the recognition of a cumulative effect as an adjustment to opening retained earnings. Weatherford is currently evaluating the transition method it will select, but will likely utilize the modified retrospective method.
We have planned and commenced our implementation of ASU 2014-09. We are in the process of assessing differences from current accounting practices (gap analysis). Remaining implementation matters include completing the gap analysis, implementing appropriate technology enhancements, establishing new policies, procedures, and controls, and quantifying any adoption date adjustments.
64
2. Business Combinations and Divestitures
Acquisitions
From time to time, we acquire businesses we believe are important to our long-term strategy. Results of operations for acquisitions are included in the accompanying Consolidated Statements of Operations from the date of acquisition. The balances included in the Consolidated Balance Sheets related to current year acquisitions are based on preliminary information and are subject to change when final asset valuations are obtained and the potential for liabilities has been evaluated. The purchase price for the acquisitions is allocated to the net assets acquired based upon their estimated fair values at the date of acquisition. We did not complete any material acquisitions or divestitures during the year ended December 31, 2016 or 2015.
In April 2014, we acquired an additional 30% ownership interest in a joint venture in China. We paid $13 million for the incremental interest, thereby increasing our ownership interest from 45% to 75% and gaining control of the joint venture. As a result of this transaction, we adjusted our previously held equity investment to fair value, recognizing a $16 million gain, and we applied the consolidation method of accounting, recognizing $6 million of goodwill and $30 million of cash.
In May 2012, we acquired a company that designs and produces well completion tools. Our purchase consideration included a contingent consideration valued at approximately $17 million that we paid at settlement during the fourth quarter of 2016. This contingent consideration arrangement is dependent on the acquired company’s revenue and is marked to market through current earnings in each reporting period prior to settlement. The liability is valued using Level 3 inputs.
Divestitures
On December 31, 2014, we completed the sale of our engineered chemistry and Integrity drilling fluids businesses for proceeds totaling $750 million less estimated working capital adjustments of $16 million and transaction fees of $12 million and recognized a gain of $250 million. In addition, we disposed of all of our shares in Proserv Group Inc. (“Proserv”) and recognized a gain of $65 million resulting from this transaction.
The income before income taxes related to our engineered chemistry and Integrity drilling fluids businesses of $57 million in 2014 were segregated from our Consolidated Financial Statements. The major classes of assets sold in this transaction included $48 million of accounts receivable, $99 million of inventory and $369 million of other assets primarily comprised of PP&E and other intangible assets. Liabilities of $44 million were also transferred in the sale, of which $32 million were current liabilities.
In September 2014, we completed the sale of our pipeline and specialty services business. We received cash consideration of $246 million ($245 million, net of cash disposed) and recognized a gain of approximately $49 million resulting from this transaction.
In July 2014, we completed the sale of our land drilling and workover rig operations in Russia and Venezuela. We received cash consideration upon closing of $499 million ($486 million, net of cash disposed). As a result of our commitment to sell, we recorded a $143 million long-lived assets impairment loss and a $121 million goodwill impairment loss in the second quarter of 2014. Of the $121 million goodwill impairment loss, $95 million pertained to goodwill attributable to our divested land drilling and workover rig operations in Russia. See “Note 9 – Goodwill” for additional information regarding the goodwill impairment.
On October 7, 2013, we completed the sale of our 38.5% equity interest in Borets International Limited (“Borets”) for $400 million, net of settlement items. We recorded a gain on sale of $18 million. The consideration consisted of $359 million in cash and a three-year $30 million promissory note. In the fourth quarter of 2016, we received the principal and interest due on the promissory note.
65
3. Restructuring Charges
In response to continuing fluctuation of crude oil prices and lower levels of exploration and production spending in 2016, we initiated an additional plan to reduce our overall costs and workforce to better align with anticipated activity levels. This cost reduction plan (the “2016 Plan”) included a workforce reduction and other cost reduction measures initiated across our geographic regions.
In connection with the 2016 Plan, we recognized restructuring charges of $280 million in 2016, which include severance benefits of $196 million, restructuring related asset charges of $40 million and other restructuring charges of $44 million. Other restructuring charges include contract termination costs, relocation and other associated costs.
In the fourth quarter of 2014, we announced a cost reduction plan (the “2015 Plan”), which included a worldwide workforce reduction and other cost reduction measures. In connection with the 2015 Plan, we recognized restructuring charges of $232 million in 2015 and $58 million in 2014. Our restructuring charges during 2015 in connection with the 2015 Plan include severance benefits of $149 million, restructuring related asset charges of $64 million and other restructuring charges of $19 million. Restructuring related asset charges include asset write-offs of $26 million related to Yemen due to the political disruption and $38 million in other regions. Other restructuring charges include exit costs, contract termination costs, relocation costs and other associated costs. Our restructuring charges during 2014 in connection with the 2015 Plan include severance benefits of $58 million.
In the first quarter of 2014, we announced a cost reduction plan (the “2014 Plan”), which included a worldwide workforce reduction and other cost reduction measures. In connection with the 2014 Plan, we recognized restructuring charges of $273 million in 2014. The restructuring charges in connection with the 2014 Plan include restructuring related asset charges of $135 million, severance benefits of $114 million and other restructuring charges of $24 million. Other restructuring charges include contract termination costs, relocation and other associated costs.
The impairments recognized in connection with the 2014 Plan primarily pertain to operations in our Middle East/North Africa (“MENA”) region, where geopolitical issues and recent disruptions in North Africa, primarily Libya, resulted in the decisions in the third quarter of 2014 to exit product lines in selected markets. The 2014 Plan activities resulted in $106 million of cash payments in 2014.
The following tables present the components of the restructuring charges by segment and plan for the years ended December 31, 2016, 2015 and 2014.
Year Ended December 31, 2016 | |||||||||
Other | Total | ||||||||
(Dollars in millions) | Severance | Restructuring | Severance and | ||||||
2016 Plan | Charges | Charges | Other Charges | ||||||
North America | $ | 38 | $ | 58 | $ | 96 | |||
MENA/Asia Pacific | 29 | 4 | 33 | ||||||
Europe/SSA/Russia | 27 | 9 | 36 | ||||||
Latin America | 43 | 13 | 56 | ||||||
Subtotal | 137 | 84 | 221 | ||||||
Land Drilling Rigs | 7 | — | 7 | ||||||
Corporate and Research and Development | 52 | — | 52 | ||||||
Total | $ | 196 | $ | 84 | $ | 280 | |||
66
Year Ended December 31, 2015 | |||||||||
Other | Total | ||||||||
(Dollars in millions) | Severance | Restructuring | Severance and | ||||||
2015 Plan | Charges | Charges | Other Charges | ||||||
North America | $ | 28 | $ | 24 | $ | 52 | |||
MENA/Asia Pacific | 21 | 35 | 56 | ||||||
Europe/SSA/Russia | 34 | 22 | 56 | ||||||
Latin America | 38 | 2 | 40 | ||||||
Subtotal | 121 | 83 | 204 | ||||||
Land Drilling Rigs | 12 | — | 12 | ||||||
Corporate and Research and Development | 16 | — | 16 | ||||||
Total | $ | 149 | $ | 83 | $ | 232 | |||
Year Ended December 31, 2014 | |||||||||
Other | Total | ||||||||
Severance | Restructuring | Severance and | |||||||
(Dollars in millions) | Charges | Charges | Other Charges | ||||||
2014 Plan: | |||||||||
North America | $ | 17 | $ | 27 | $ | 44 | |||
MENA/Asia Pacific | 19 | 106 | 125 | ||||||
Europe/SSA/Russia | 17 | 13 | 30 | ||||||
Latin America | 29 | 7 | 36 | ||||||
Subtotal | 82 | 153 | 235 | ||||||
Land Drilling Rigs | 5 | 4 | 9 | ||||||
Corporate and Research and Development | 27 | 2 | 29 | ||||||
2014 Plan Total | $ | 114 | $ | 159 | $ | 273 | |||
2015 Plan: | |||||||||
North America | $ | 32 | $ | — | 32 | ||||
MENA/Asia Pacific | 8 | — | 8 | ||||||
Europe/SSA/Russia | 5 | — | 5 | ||||||
Latin America | 12 | — | 12 | ||||||
Subtotal | 57 | — | 57 | ||||||
Land Drilling Rigs | — | — | — | ||||||
Corporate and Research and Development | 1 | — | 1 | ||||||
2015 Plan Total | $ | 58 | $ | — | $ | 58 | |||
Total | $ | 172 | $ | 159 | $ | 331 | |||
67
The severance and other restructuring charges gave rise to certain liabilities, the components of which are summarized below, and largely relate to the severance accrued as part of the 2014 Plan and 2015 Plan that will be paid pursuant to the respective arrangements and statutory requirements.
At December 31, 2016 | |||||||||||||||||
2016 Plan | 2015 and 2014 Plans | Total | |||||||||||||||
Severance | |||||||||||||||||
Severance | Other | Severance | Other | and Other | |||||||||||||
(Dollars in millions) | Liability | Liability | Liability | Liability | Liability | ||||||||||||
North America | $ | 8 | $ | 16 | $ | 2 | $ | 1 | $ | 27 | |||||||
MENA/Asia Pacific | 6 | 4 | 1 | 1 | 12 | ||||||||||||
Europe/SSA/Russia | 7 | 2 | — | 7 | 16 | ||||||||||||
Latin America | — | — | — | — | — | ||||||||||||
Subtotal | 21 | 22 | 3 | 9 | 55 | ||||||||||||
Land Drilling Rigs | 1 | — | — | — | 1 | ||||||||||||
Corporate and Research and Development | 30 | — | — | — | 30 | ||||||||||||
Total | $ | 52 | $ | 22 | $ | 3 | $ | 9 | $ | 86 | |||||||
The following table presents the restructuring accrual activity for the year ended December 31, 2016.
Year Ended December 31, 2016 | |||||||||||||||||||
(Dollars in millions) | Accrued Balance at December 31, 2015 | Charges | Cash Payments | Other | Accrued Balance at December 31, 2016 | ||||||||||||||
2016 Plan: | |||||||||||||||||||
Severance liability | $ | — | $ | 196 | $ | (147 | ) | $ | 3 | $ | 52 | ||||||||
Other restructuring liability | — | 44 | (18 | ) | (4 | ) | 22 | ||||||||||||
2015 and 2014 Plan: | |||||||||||||||||||
Severance liability | 37 | — | (28 | ) | (6 | ) | 3 | ||||||||||||
Other restructuring liability | 14 | — | (5 | ) | — | 9 | |||||||||||||
Total severance and other restructuring liability | $ | 51 | $ | 240 | $ | (198 | ) | $ | (7 | ) | $ | 86 | |||||||
68
4. Supplementary Information
Cash paid for interest and income taxes was as follows:
Year Ended December 31, | |||||||||||
(Dollars in millions) | 2016 | 2015 | 2014 | ||||||||
Interest paid, net of capitalized interest | $ | 467 | $ | 477 | $ | 511 | |||||
Income taxes paid, net of refunds | 161 | 331 | 386 | ||||||||
In 2016, currency devaluation charges reflect the impact of the devaluation of $41 million related to the Angolan kwanza and Egyptian pound. Currency devaluation charges are included in “Currency Devaluation Charges” on the accompanying Consolidated Statements of Operations.
In 2015, currency devaluation charges reflect the impacts of the devaluation of the Angolan kwanza and Argentine peso and the recognized remeasurement charges related to the Venezuelan bolivar and the Kazakhstani tenge resulting in a $85 million pre-tax charge of which $43 million negatively impacted cash. The Angolan kwanza charges reflect currency devaluations in 2015 and the Kazakhstan tenge depreciated as a result of the National Bank of Kazakhstan abandoning its peg of the tenge to the U.S. dollar. The devaluation of the Argentine peso was due to the modifying of currency control restrictions on purchasing foreign currencies by the Argentine Central Bank. The Venezuelan bolivar charge reflects remeasurement charges when we began using the latest Venezuelan currency exchange system known as the “Marginal Currency System” or SIMADI. The SIMADI opened for trading February 12, 2015, replacing the Venezuela Supplementary Foreign Currency Administration System auction rate (“SICAD II”) mechanism. The SIMADI is intended to provide limited access to a free market rate of exchange.
In December 2014, we remeasured our Venezuelan bolivar denominated monetary assets and liabilities (primarily cash, accounts receivables, trade payables and other current liabilities) to the SICAD II exchange rate of 50 Venezuelan bolivars per U.S. dollar resulting in a $245 million pre-tax charge of which $92 million was related to the remeasurement of cash held in Venezuelan bolivar.
During 2016, 2015 and 2014 we received proceeds from the asset disposition totaling $49 million, $37 million and $59 million, respectively. In 2016, we had non-cash investing and financing activities related to capital lease of equipment of $25 million.
5. Percentage-of-Completion Contracts
During 2016, we were break-even for our Zubair contract and cumulative estimated loss from the Iraq contracts was $532 million as of December 31, 2016. On May 26, 2016, we entered into an agreement with our customer containing the terms and conditions of the settlement on the Zubair contract. The settlement to be paid to us is a gross amount of $150 million, of which $62 million and $72 million was received in the second and third quarters of 2016, respectively. The settlement includes variation order requests, claims for extension of time, payments of remaining contract milestones and new project completion timelines that resulted in relief from the liquidated damages provisions. Of the remaining gross settlement, we collected $16 million during January 2017.
As of December 31, 2016, we have no claims revenue, and our percentage-of-completion project estimate includes a cumulative $25 million in approved change orders and $16 million of back charges. Our net billings in excess of costs as of December 31, 2016 were $45 million and are shown in the “Other Current Liabilities” on the Consolidated Balance Sheet. The amounts associated with contract change orders or claims are included in revenue only when they can be reliably estimated and their realization is reasonably assured.
During 2015, we recognized estimated project losses of $153 million related to our long-term early production facility construction contracts in Iraq accounted for under the percentage-of-completion method. Total estimated losses on these loss projects were $532 million at December 31, 2015. As of December 31, 2015, our percentage-of-completion project estimates include $116 million of claims revenue and $28 million of back charges. During 2015, an additional $32 million of claims revenue was included in our project estimates. Our costs in excess of billings as of December 31, 2015 were $6 million and are shown in the “Other Current Assets” on our Consolidated Balance Sheets. We also had a variety of unapproved contract change orders or claims that are not included in our revenues as of December 31, 2015. The amounts associated with these contract change orders or claims are included in revenue only when they can be reliably estimated and their realization is reasonably assured.
69
During 2014, we recognized estimated project losses of $72 million related to our long-term early production facility construction contracts in Iraq accounted for under the percentage-of-completion method. Total estimated losses on these projects were $379 million at December 31, 2014. As of December 31, 2014, our percentage-of-completion project estimates include $90 million of claims revenue and $24 million of back charges. Our costs in excess of billings as of December 31, 2014 were $128 million and are shown in the “Other Current Assets” on the balance sheet. We had a variety of unapproved contract change orders or claims that were not included in our revenues as of December 31, 2014. During 2014, an additional $80 million of claims revenue was included in our project estimates and $26 million of our prior claims were approved.
6. Accounts Receivable Factoring and Other Receivables
From time to time, we participate in factoring arrangements to sell accounts receivable to third-party financial institutions. In 2016, we sold accounts receivables of $156 million, received cash totaling $154 million and recognized a loss of $0.7 million. In 2015, we sold accounts receivables of $78 million, received cash totaling $77 million and recognized a loss of $0.2 million. Our factoring transactions were recognized as sales, and the proceeds are included as operating cash flows in our Consolidated Statements of Cash Flows. We did not sell any accounts receivable during 2014.
During the second quarter of 2016, we accepted a note with a face value of $120 million from PDVSA in exchange for $120 million in net trade receivables. The note had a three year term at a 6.5% stated interest rate. We carried the note at lower of cost or fair value and recognized a loss in the second quarter of 2016 of $84 million to adjust the note to fair value. In the fourth quarter of 2016, we sold the economic rights in the note receivable for $44 million and recognized a gain of $8 million.
7. Inventories, Net
Inventories, net of reserves, by category were as follows:
December 31, | |||||||
(Dollars in millions) | 2016 | 2015 | |||||
Raw materials, components and supplies | $ | 168 | $ | 172 | |||
Work in process | 49 | 61 | |||||
Finished goods | 1,585 | 2,111 | |||||
$ | 1,802 | $ | 2,344 | ||||
Work in process and finished goods inventories include cost of materials, labor and manufacturing overhead. During 2016, 2015 and 2014, we recognized inventory charges, including excess and obsolete inventory charges totaling $252 million, $186 million and $113 million, respectively. These charges were largely attributable to downturn in the oil and gas industry, where certain inventory has been deemed commercially unviable or technologically obsolete considering current and future demand.
70
8. Long-Lived Asset Impairments
During the third quarter of 2016, we recognized long-lived asset impairment charges of $436 million, of which $388 million was related to product line PP&E impairments and $48 million was related to the impairment of intangible assets. The PP&E impairment charges were related to our MENA/Asia Pacific Pressure Pumping and North America Well Construction, Drilling Services and Secure Drilling Service product lines. These impairment charges were attributed to the following segments: $235 million in North America, $109 million in MENA/Asia Pacific, $12 million in Europe/SSA/Russia, $16 million in Latin America and $16 million in Land Drilling Rigs. The intangible asset charge is related to the Well Construction and Completions businesses with $35 million attributable to the North America segment and $13 million related the Europe/SSA/Russia segment.
The impairments were due to the prolonged downturn in the oil and gas industry, whose recovery in the third quarter was not as strong as expected and whose recovery in the fourth quarter of 2016 and in 2017 was and is expected to be slower than had previously been anticipated. The change in the expectations of the market’s recovery, in addition to successive negative operating cash flows in certain asset groups represented an indicator that those assets will no longer be recoverable over their remaining useful lives. See “Note 14 – Fair Value of Financial Instruments, Assets and Equity Investments” for additional information regarding the fair value determination used in the impairment calculation.
We recognized total long-lived impairment charges of $638 million in 2015 due to the continued weakness in crude oil prices contributing to lower exploration and production spending and a decline in the utilization of our assets. The decline in oil prices and its impact on demand represented a significant adverse change in the business climate and an indication that these long-lived assets may not be recoverable. Based on the presence of impairment indicators, we performed an analysis of these asset groups and recorded long-lived asset impairment charges to adjust the assets to fair value.
During 2015, we recognized long-lived asset impairment charges of $124 million for pressure pumping assets in our North America segment, $259 million for equipment in our drilling tools, pressure pumping and wireline assets in our North America segment and $255 million related to assets for our Land Drilling Rigs segment. The fair value of our drilling tools, pressure pumping, and wireline assets were estimated using a combination of the income approach, the cost approach, and the market approach. See “Note 14 – Fair Value of Financial Instruments, Assets and Equity Investments” for additional information regarding the fair value determination.
In the fourth quarter of 2014, a significant decline in crude oil prices contributed to lower anticipated exploration and production spending and a decline in the anticipated utilization of our drilling rig fleet. Based on the impairment indicators noted we performed an analysis of our drilling rig fleet and recorded long-lived asset impairment charges of $352 million to adjust the assets of our Land Drilling Rig business to fair value. The impairment charges included the impairment of our drilling rigs and certain related intangible assets. To determine the fair value of these assets we utilized an income approach.
In July 2014, we completed the sale of our rig operations in Russia and Venezuela. We expected the sale would significantly impact the revenues and results of operations of our Russia reporting unit. As a result of our commitment to sell, we recorded a $143 million long-lived assets impairment charge during the second quarter of 2014.
9. Goodwill
In 2016 and 2015, our annual goodwill impairment test indicated that goodwill was not impaired. In 2014, our annual goodwill impairment test indicated that the goodwill of the Land Drilling Rigs reporting units in Latin America, Europe and Asia Pacific was impaired. The results of our “step-one” analysis were accompanied by other indicators in the form of a decline in the anticipated utilization rates for our drilling rig fleet. Responsive to the impairment indicators noted, we performed a “step two” analysis, comparing the implied fair value of reporting unit goodwill with the carrying amount of that goodwill. The “step two” analysis indicated that the goodwill for these reporting units was fully impaired and we recognized an impairment loss of $40 million related to Land Drilling Rigs segment in Latin America, Europe and Asia Pacific.
In addition, during the second quarter of 2014, we engaged in negotiations to sell our land drilling and workover operations in Russia and Venezuela, and we subsequently entered into an agreement to sell the business in July 2014. During this time frame we expected the sale would significantly impact the revenues and results of operations of our Russia reporting unit, and consequently, we considered the associated circumstances to assess whether an event or change had occurred that, more likely than not, reduced the fair value of our reporting units below their carrying amount. We concluded that the planned sale represented an indicator of impairment, and we prepared the analysis necessary to identify the potential impairment and recognize any necessary impairment loss. The analysis indicated that the goodwill for the Russia reporting unit was impaired, and we recognized a goodwill impairment loss of $121 million, $95 million of which pertained to goodwill that had been reclassified during 2014 into current assets held
71
for sale. See “Note 2 – Business Combinations and Divestitures” for additional information regarding the non-cash impairment charges to our assets held for sale.
The changes in the carrying amount of goodwill by reportable segment for the two years ended December 31, 2016 and 2015, were as follows:
(Dollars in millions) | North America | MENA/ Asia Pacific | Europe/ SSA/ Russia | Latin America | Total | ||||||||||||||
Balance at December 31, 2014 | $ | 1,896 | $ | 195 | $ | 623 | $ | 297 | $ | 3,011 | |||||||||
Acquisitions | 3 | — | — | — | 3 | ||||||||||||||
Purchase price and other adjustments | — | 1 | — | — | 1 | ||||||||||||||
Foreign currency translation | (143 | ) | (6 | ) | (50 | ) | (13 | ) | (212 | ) | |||||||||
Balance at December 31, 2015 | $ | 1,756 | $ | 190 | $ | 573 | $ | 284 | $ | 2,803 | |||||||||
Foreign currency translation | 21 | (1 | ) | (30 | ) | 4 | (6 | ) | |||||||||||
Balance at December 31, 2016 | $ | 1,777 | $ | 189 | $ | 543 | $ | 288 | $ | 2,797 | |||||||||
10. Intangible Assets
The components of intangible assets were as follows:
December 31, 2016 | December 31, 2015 | |||||||||||||||||||||
Gross | Net | Gross | Net | |||||||||||||||||||
Carrying | Accumulated | Intangible | Carrying | Accumulated | Intangible | |||||||||||||||||
(Dollars in millions) | Amount | Amortization | Assets | Amount | Amortization | Assets | ||||||||||||||||
Acquired technology | $ | 373 | $ | (300 | ) | $ | 73 | $ | 386 | $ | (291 | ) | $ | 95 | ||||||||
Licenses | 177 | (166 | ) | 11 | 234 | (176 | ) | 58 | ||||||||||||||
Patents | 215 | (134 | ) | 81 | 233 | (123 | ) | 110 | ||||||||||||||
Customer relationships and contracts | 193 | (144 | ) | 49 | 198 | (139 | ) | 59 | ||||||||||||||
Other | 91 | (57 | ) | 34 | 88 | (54 | ) | 34 | ||||||||||||||
$ | 1,049 | $ | (801 | ) | $ | 248 | $ | 1,139 | $ | (783 | ) | $ | 356 | |||||||||
Additions to intangible assets were $11 million and $26 million for the years ended December 31, 2016 and 2015, respectively. During 2016, we recognized $48 million of license and patent impairment charges related to the Well Construction and Completions businesses.
Amortization expense was $60 million, $88 million and $108 million for the years ended December 31, 2016, 2015 and 2014, respectively. Future estimated amortization expense for the carrying amount of intangible assets as of December 31, 2016 is expected to be as follows (dollars in millions):
Period | Amount | ||
2017 | $ | 57 | |
2018 | 47 | ||
2019 | 41 | ||
2020 | 34 | ||
2021 | 21 | ||
11. Equity Investments
Our equity investments in unconsolidated affiliates were $66 million and $76 million for the years ended December 31, 2016 and 2015, respectively. Equity in earnings of unconsolidated affiliates for the years ended December 31, 2016, 2015 and 2014 totaled $2 million, $3 million and $9 million, respectively.
72
During 2015, we determined that the fair values of certain equity investments were significantly below their carrying values. We assessed these declines in value to be other than temporary and recognized an impairment loss of $25 million. See “Note 14 – Fair Value of Financial Instruments, Assets and Equity Investments” for additional information regarding the fair value determination. During 2014, we sold our interests in Proserv, resulting in a gain on the sale of $65 million.
12. Short-term Borrowings and Other Debt Obligations
Our short-term borrowings and current portion of long-term debt consists of the followings:
December 31, | |||||||
(Dollars in millions) | 2016 | 2015 | |||||
Revolving credit facility | — | 967 | |||||
Other short-term bank loans | 2 | 214 | |||||
Total short-term borrowings | 2 | 1,181 | |||||
Current portion of long-term debt | 177 | 401 | |||||
Short-term borrowings and current portion of long-term debt | $ | 179 | $ | 1,582 | |||
Weighted average interest rate on short-term borrowings outstanding at end of year | 0.7 | % | 2.7 | % | |||
Revolving Credit Facility and Secured Term Loan Agreement
We have a revolving credit facility (the “Revolving Credit Agreement”) in the amount of $1.38 billion and a $425 million secured term loan agreement (the “Term Loan Agreement” and collectively with the Revolving Credit Agreement, the “Credit Agreements”). For lenders that extended their commitments (“extending lenders”), the Revolving Credit Agreement matures in July of 2019. For lenders that did not extend their commitments (such lenders, representing $229 million, the “non-extending lenders”), the Revolving Credit Agreement matures in July of 2017. The Term Loan Agreement matures on July of 2020, and beginning September 30, 2016, a principal repayment of $12.5 million is required on the last day of each quarter. At December 31, 2016, we had $1.3 billion available for borrowing under our Revolving Credit Agreement and there were $63 million in outstanding letters of credit.
Loans under the Credit Agreements are subject to varying rates of interest based on whether the loan is a Eurodollar loan or an alternate base rate loan. We also incur a quarterly facility fee on the amount of the Revolving Credit Agreement. See “Note 13 – Long-term Debt”, for information related to interest rate applicable for the Term Loan Agreement.
Eurodollar Loans. Eurodollar loans bear interest at the Eurodollar rate, which is LIBOR, plus the applicable margin. The applicable margin for Eurodollar loans under the Revolving Credit Agreement depends on whether the lender is an extending lender or a non-extending lender. For non-extending lenders, the applicable margin under the Revolving Credit Agreement ranges from 0.75% to 1.925% depending on our credit rating, and for extending lenders under the Revolving Credit Agreement the applicable margin ranges from 1.925% to 3.7% depending on our leverage ratio.
Alternate Base Rate Loans. Alternate base rate loans bear interest at the alternate base rate plus the applicable margin. The applicable margin for alternate base rate loans under the Revolving Credit Agreement depends on whether the lender is an extending lender or a non-extending lender. For non-extending lenders, the applicable margin under the Revolving Credit Agreement ranges from 0% to 0.925% depending on our credit rating, and for extending lenders the applicable margin under the Revolving Credit Agreement ranges from 0.925% to 2.7% depending on our leverage ratio.
For the year ended December 31, 2016, the interest rate for the Revolving Credit Agreement was LIBOR plus a margin rate of 1.925%. See “Note 13 – Long-term Debt” for the interest rate details for the Term Loan Agreement. Borrowings under our Revolving Credit Agreement may be repaid from time to time without penalty. Obligations under the Term Loan Agreement are secured by substantially all of our assets. In addition, obligations under the Credit Agreements are guaranteed by a material portion of our subsidiaries.
Our Credit Agreements contain covenants including, among others, the following:
• | a prohibition against incurring debt, subject to permitted exceptions; |
• | a restriction on creating liens on our assets and the assets of our operating subsidiaries, subject to permitted exceptions; |
• | restrictions on mergers or asset dispositions; |
73
• | restrictions on use of proceeds, investments, transactions with affiliates, or change of principal business; and |
• | maintenance of the following financial covenants: |
1) | Leverage ratio of no greater than 3.0 to 1 through December 31, 2016 and 2.5 to 1 thereafter until maturity. This ratio measures our indebtedness guaranteed by subsidiaries under the Credit Agreements and other guaranteed facilities to the trailing four quarters consolidated adjusted earnings before interest, taxes, depreciation, amortization and other specified charges (“EBITDA”); |
2) | Leverage and letters of credit ratio of no greater than 4.0 to 1 on or before December 31, 2016 and 3.5 to 1 thereafter calculated as our indebtedness guaranteed by subsidiaries under the Credit Agreements and other guaranteed facilities and all letters of credit to the trailing four quarters consolidated adjusted EBITDA; and |
3) | Asset coverage ratio of at least 4.0 to 1, which is calculated as our asset value to indebtedness guaranteed by subsidiaries under the Credit Agreements and other guaranteed facilities. |
Our Credit Agreements contain customary events of default, including our failure to comply with the financial covenants described above. As of December 31, 2016, we were in compliance with these financial covenants.
On July 19, 2016, we amended these facilities to make minor changes and amendments to certain collateral provisions, negative covenants and related definitions, and to add an accordion feature to permit new and existing lenders to add up to a maximum of $250 million in additional commitments.
Other Short-Term Borrowings and Other Debt Activity
We have short-term borrowings with various domestic and international institutions pursuant to uncommitted credit facilities. At December 31, 2016, we had $2 million in short-term borrowings under these arrangements. In 2016, we repaid $180 million, with a LIBOR-based weighted average interest rate of 1.95%, borrowed under a credit agreement that matured in the first half of 2016. In addition, we had $450 million of letters of credit under various uncommitted facilities and $54 million of surety bonds, primarily performance bonds, issued by financial sureties against an indemnification from us at December 31, 2016.
At December 31, 2016, the current portion of long-term debt was primarily related to our 6.35% Senior Notes due 2017 and the current portion of our secured term loan and capital leases. Our 5.50% senior notes with a principal balance of $350 million were repaid in February 2016.
364-Day Term Loan Facility
On April 9, 2015, we repaid the $175 million balance of our $400 million, 364-day term loan facility with a syndicate of banks. Previously in 2014, proceeds from this 364-day term loan facility were used to refinance our prior 364-day term loan facility and had substantially similar terms and conditions to our prior 364-day term loan facility.
74
13. Long-term Debt
We have issued various senior notes, all of which rank equally with our existing and future senior unsecured indebtedness, which have semi-annual interest payments and no sinking fund requirements. Our Long-term Debt consisted of the following:
December 31, | |||||||
(Dollars in millions) | 2016 | 2015 | |||||
5.50% Senior Notes due 2016 | $ | — | $ | 350 | |||
6.35% Senior Notes due 2017 | 89 | 604 | |||||
6.00% Senior Notes due 2018 | 66 | 498 | |||||
9.625% Senior Notes due 2019 | 489 | 1,012 | |||||
5.125% Senior Notes due 2020 | 363 | 768 | |||||
5.875% Exchangeable Senior Notes due 2021 | 1,147 | — | |||||
7.75% Senior Notes due 2021 | 739 | — | |||||
4.50% Senior Notes due 2022 | 642 | 642 | |||||
8.25% Senior Notes due 2023 | 738 | — | |||||
9.875% Senior Notes due 2024 | 528 | — | |||||
6.50% Senior Notes due 2036 | 447 | 446 | |||||
6.80% Senior Notes due 2037 | 255 | 255 | |||||
7.00% Senior Notes due 2038 | 456 | 455 | |||||
9.875% Senior Notes due 2039 | 245 | 245 | |||||
6.75% Senior Notes due 2040 | 456 | 456 | |||||
5.95% Senior Notes due 2042 | 368 | 368 | |||||
Secured Term Loan due 2020 | 420 | — | |||||
4.82% secured borrowing | 5 | 9 | |||||
Capital and other lease obligations | 120 | 116 | |||||
Other | 7 | 29 | |||||
Total Senior Notes and other debt | 7,580 | 6,253 | |||||
Less amounts due in one year | 177 | 401 | |||||
Long-term debt | $ | 7,403 | $ | 5,852 | |||
The accrued interest on our borrowings was $127 million and $115 million at December 31, 2016 and 2015, respectively. The following is a summary of scheduled Long-term Debt maturities by year (dollars in millions):
2017 | $ | 177 | |
2018 | 137 | ||
2019 | 541 | ||
2020 | 675 | ||
2021 | 1,889 | ||
Thereafter | 4,161 | ||
$ | 7,580 | ||
Secured Term Loan Agreement
As of the fourth quarter of 2016, our borrowings, net of repayments, under the Term Loan Agreement were $425 million. The interest rate under the Term Loan Agreement is variable and is determined by our leverage ratio as of the most recent fiscal quarter, as either (1) the one-month London Interbank Offered Rate (“LIBOR”) plus a variable margin rate ranging from 1.425% to 3.2% or (2) the alternate base rate plus the applicable margin ranging from 0.425% to 2.2%. For the year ended December 31, 2016, the interest rate for the Term Loan Agreement was LIBOR plus a margin rate of 2.3%. The Term Loan Agreement requires a principal
75
repayment of $12.5 million on the last day of each quarter. In the third and fourth quarters of 2016, we paid down $75 million on our Term Loan Agreement.
Exchangeable Senior Notes, Senior Notes and Tender Offers
We have issued various senior notes, all of which rank equally with our existing and future senior unsecured indebtedness, which have semi-annual interest payments and no sinking fund requirements.
Exchangeable Senior Notes
On June 7, 2016, we issued exchangeable notes with a par value of $1.265 billion and an interest rate of 5.875%. The notes have a conversion price of $7.74 per share and are exchangeable into a total of 163.4 million shares of the Company upon the occurrence of certain events on or after January 1, 2021. The notes mature on July 1, 2021. We have the choice to settle an exchange of the notes in any combination of cash or shares. As of December 31, 2016, the if-converted value did not exceed the principal amount of the notes.
The exchange feature is reported with a carrying amount of $97 million in “Capital in Excess of Par Value” on the accompanying Consolidated Balance Sheets. The debt component of the exchangeable notes has been reported separately in “Long-term Debt” on the accompanying Consolidated Balance Sheets with a carrying value of $1.147 billion at December 31, 2016, net of remaining unamortized discount and debt issuance costs of $118 million. The discount on the debt component is being amortized over the remaining maturity of the exchangeable notes at an effective interest rate of 8.4%. During 2016, interest expense on the notes was $54 million, of which $42 million related to accrued interest and $12 million related to amortization of the discount.
Senior Notes
On November 18, 2016, we issued $540 million in aggregate principal amount of 9.875% notes due 2024. On June 17, 2016, we issued $750 million in aggregate principal amount of 7.75% senior notes due 2021 and $750 million in aggregate principal amount of 8.25% senior notes due 2023.
Tender Offers and Early Retirement of Senior Notes
We commenced a cash tender offer on June 1, 2016 (and amended the offer on June 8, 2016 and June 10, 2016), which included an early tender option with an early settlement date of June 17, 2016 and an expiration date of June 30, 2016 with a final settlement date of July 1, 2016 to repurchase a portion of our 6.35% senior notes due 2017, 6.00% senior notes due 2018, 9.625% senior notes due 2019, and 5.125% senior notes due 2020. On June 17, 2016, we settled the early tender offers in cash in the amount of $1.972 billion, retiring an aggregate face value of senior notes tendered of $1.87 billion and accrued interest of $27 million. We recognized a cumulative loss of $78 million on these transactions in “Bond Tender Premium, Net” on the accompanying Consolidated Statements of Operations. On June 30, 2016, we accepted additional tenders of $2 million of debt, which we settled in cash on July 1, 2016.
In 2015, through a series of open market transactions, we repurchased certain of our 4.50% senior notes, 5.125% senior notes, 5.95% senior notes, 6.50% senior notes, 6.75% senior notes, 6.80% senior notes and 7.00% senior notes with a total book value of $527 million. We recognized a cumulative gain of approximately $84 million on these transactions in the line captioned “Other Income (Expense), Net” on the accompanying Consolidated Statements of Operations.
14. Fair Value of Financial Instruments, Assets and Equity Investments
Financial Instruments Measured and Recognized at Fair Value
We estimate fair value at a price that would be received to sell an asset or paid to transfer a liability in an orderly transaction between market participants in the principal market for the asset or liability. Our valuation techniques require inputs that we categorize using a three level hierarchy, from highest to lowest level of observable inputs. Level 1 inputs are unadjusted quoted prices in active markets for identical assets or liabilities. Level 2 inputs are quoted prices or other market data for similar assets and liabilities in active markets, or inputs that are observable for the asset or liability, either directly or indirectly through market corroboration, for substantially the full term of the financial instrument. Level 3 inputs are unobservable inputs based upon our own judgment and assumptions used to measure assets and liabilities at fair value. Classification of a financial asset or liability within the hierarchy is determined based on the lowest level of input that is significant to the fair value measurement. Other than the contingent consideration discussed in “Note 2 – Business Combinations and Divestitures” and our derivative instruments discussed
76
in “Note 15 – Derivative Instruments,” we had no assets or liabilities measured and recognized at fair value on a recurring basis at December 31, 2016 and 2015.
Fair Value of Other Financial Instruments
Our other financial instruments include cash and cash equivalents, accounts receivable, accounts payable, short-term borrowings and long-term debt. The carrying value of our cash and cash equivalents, accounts receivable, accounts payable, short-term borrowings approximates their fair value due to their short maturities. These short-term borrowings are classified as Level 2 in the fair value hierarchy.
The fair value of our long-term debt fluctuates with changes in applicable interest rates among other factors. Fair value will generally exceed carrying value when the current market interest rate is lower than the interest rate at which the debt was originally issued and will generally be less than the carrying value when the market rate is greater than the interest rate at which the debt was originally issued. The fair value of our long-term debt is classified as Level 2 in the fair value hierarchy and is established based on observable inputs in less active markets.
The fair value and carrying value of our senior notes were as follows:
December 31, | |||||||
(Dollars in millions) | 2016 | 2015 | |||||
Fair value | $ | 6,739 | $ | 5,095 | |||
Carrying value | 7,028 | 6,099 | |||||
Non-recurring Fair Value Measurements - Impairments
During the third quarter of 2016, long-lived assets were impaired and written down to their estimated fair values. The Level 3 fair values of the long-lived assets were determined using either an income approach or a market approach. The unobservable inputs to the income approach included the assets’ estimated future cash flows and estimates of discount rates commensurate with the assets’ risks. The market approach considered unobservable estimates of market sales values, which in most cases was a scrap of salvage value estimate.
During the second quarter of 2016, we adjusted the note from PDVSA to its estimated fair value. The Level 3 fair value was estimated based on unobservable pricing indications.
During 2015, long-lived assets related to pressure pumping, drilling tools, wireline, and land drilling rigs were impaired and written down to their estimated fair values. The level 3 fair values of the long-lived assets were determined using a combination of the income approach, the cost approach and the market approach, which used inputs that included replacement costs (unobservable), physical deterioration estimates (unobservable), projections of estimated future operating cash flows (unobservable), discount rates for the applicable assets and market sales data for comparable assets. Also during 2015, an equity method investment was impaired and written down to its fair value. The equity investment level 3 fair value was determined using an income based approach utilizing estimates of future cash flow, discount rate, long-term growth rate, and marketability discount, all of which were unobservable.
During the second quarter of 2014, long-lived assets in the rig operations in Russia and Venezuela and goodwill for the Russia reporting unit were impaired and written down to their estimated fair values. The level 3 fair value of the long-lived assets in the rig operations was determined using the market approach that considered the estimated sales price of those businesses. The goodwill level 3 fair value was determined using a combination of the income and market approaches with observable inputs that consisted of earnings multiples and unobservable inputs that included estimates of future cash flows, discount rate, long-term growth rate, and control premiums. During the fourth quarter of 2015, we impaired to the fair values of certain land drilling rigs and related intangible assets. The level 3 fair values were determined using an income approach that considered the remaining estimated cash flows of the associated assets, which were unobservable.
77
15. Derivative Instruments
From time to time, we may enter into derivative financial instrument transactions to manage or reduce our market risk. We manage our debt portfolio to achieve an overall desired position of fixed and floating rates, and we may employ interest rate swaps as a tool to achieve that goal. We enter into foreign currency forward contracts and cross-currency swap contracts to economically hedge our exposure to fluctuations in various foreign currencies. The major risks from interest rate derivatives include changes in the interest rates affecting the fair value of such instruments, potential increases in interest expense due to market increases in floating interest rates, changes in foreign exchange rates and the creditworthiness of the counterparties in such transactions.
We monitor the creditworthiness of our counterparties, which are multinational commercial banks. The fair values of all our outstanding derivative instruments are determined using a model with Level 2 inputs including quoted market prices for contracts with similar terms and maturity dates.
Warrant
During the fourth quarter of 2016, in conjunction with the issuance of 84.5 million shares of common stock, we also issued a warrant that gives the holder the option to acquire an additional 84.5 million shares. The exercise price on the warrant is $6.43 per share and is exercisable any time prior to May 21, 2019. The warrant is classified as a liability and carried at fair value with changes in its fair value reported through earnings. The warrant participates in dividends and other distributions as if the shares subject to the warrants were outstanding. In addition, the warrant permits early redemption due to change in control.
The warrant fair value is considered a Level 3 valuation and is estimated using a combination of the Black Scholes option valuation model and Monte-Carlo simulation. Inputs to these models include Weatherford’s stock price, volatility and the risk free interest rate. The valuation also considers the probabilities of future stock issuances and anticipated issuance discounts, which are considered Level 3 inputs. The fair value of the warrant was $172 million on its issuance date of November 16, 2016 and $156 million on December 31, 2016, generating an unrealized gain of $16 million. The warrant valuation would be negatively affected due to an increase in the likelihood of a future stock issuance.
Fair Value Hedges
We may use interest rate swaps to help mitigate exposures related to changes in the fair values of the fixed-rate debt. The interest rate swap is recorded at fair value with changes in fair value recorded in earnings. The carrying value of fixed-rate debt is also adjusted for changes in interest rates, with the changes in value recorded in earnings. After termination of the hedge, any discount or premium on the fixed-rate debt is amortized to interest expense over the remaining term of the debt.
As of December 31, 2016 and 2015, we had net unamortized premiums on fixed-rate debt of $7 million and $23 million, respectively, associated with fair value hedge swap terminations. These premiums are being amortized over the remaining term of the originally hedged debt as a reduction of interest expense which are included in the line captioned “Interest Expense, Net” on the accompanying Consolidated Statements of Operations.
Cash Flow Hedges
In 2008, we entered into interest rate derivative instruments to hedge projected exposures to interest rates in anticipation of a debt offering. These hedges were terminated at the time of the issuance of the debt, and the associated loss is being amortized from Accumulated Other Comprehensive Loss to interest expense over the remaining term of the debt. As of December 31, 2016 and 2015, we had net unamortized losses of $9 million and $10 million, respectively, associated with our cash flow hedge terminations.
Foreign Currency Derivative Instruments
At December 31, 2016 and 2015, we had outstanding foreign currency forward contracts with total notional amounts aggregating $1.6 billion and $1.7 billion, respectively. The notional amounts of our foreign currency forward contracts do not generally represent amounts exchanged by the parties and thus are not a measure of the cash requirements related to these contracts or of any possible loss exposure. The amounts actually exchanged are calculated by reference to the notional amounts and by other terms of the derivative contracts, such as exchange rates.
78
Our foreign currency forward contracts and cross-currency swaps are not designated as hedges, and the changes in fair value of the contracts are recorded in current earnings each period in the line captioned “Other Income (Expense), Net” on the accompanying Consolidated Statements of Operations.
The total estimated fair values of these foreign currency forward contracts and amounts receivable or owed associated with closed foreign currency contracts and the total estimated fair value of our cross-currency contracts are as follows:
December 31, | |||||||||
(Dollars in millions) | 2016 | 2015 | Classifications | ||||||
Derivative assets not designated as hedges: | |||||||||
Foreign currency forward contracts | $ | 7 | $ | 5 | Other Current Assets | ||||
Derivative liabilities not designated as hedges: | |||||||||
Foreign currency forward contracts | (14 | ) | (14 | ) | Other Current Liabilities | ||||
Warrant on Weatherford Shares | (156 | ) | — | Other Non-current Liabilities | |||||
The amount of derivative instruments’ gain or (loss) on the Consolidated Statements of Operations is in the table below.
Year Ended December 31, | |||||||||||||||
(Dollars in millions) | 2016 | 2015 | 2014 | Classification | |||||||||||
Foreign currency forward contracts | $ | (25 | ) | $ | (115 | ) | $ | (22 | ) | Other Income (Expense), Net | |||||
Cross-currency swap contracts | — | 13 | 16 | Other Income (Expense), Net | |||||||||||
Warrant on Weatherford Shares | 16 | — | — | Other Income (Expense), Net | |||||||||||
79
16. Shareholders’ Equity
Changes in our Issued and Treasury shares during the years ended December 31, 2016, 2015 and 2014, were as follows:
(Shares in millions) | Issued | Treasury | |||
Balance at December 31, 2013 | 840 | (73 | ) | ||
Change in Shares Associated with Redomestication | (840 | ) | 71 | ||
Issuance of Weatherford Ireland Shares | 774 | — | |||
Equity awards granted, vested and exercised | — | 2 | |||
Balance at December 31, 2014 | 774 | — | |||
Equity awards granted, vested and exercised | 5 | — | |||
Balance at December 31, 2015 | 779 | — | |||
Share Issuance | 200 | — | |||
Equity awards granted, vested and exercised | 4 | — | |||
Balance at December 31, 2016 | 983 | — | |||
In March 2016, we issued 115 million ordinary shares, and the amount in excess of par value of $623 million is reported in “Capital in Excess of Par Value” on the accompanying Consolidated Balance Sheets.
On June 7, 2016, we issued exchangeable notes with a par value of $1.265 billion. The exchange feature carrying value of $97 million is included in “Capital in Excess of Par Value” on the accompanying Consolidated Balance Sheets.
On November 21, 2016, we issued 84.5 million ordinary shares at a price of $5.40 per ordinary share, and a warrant to purchase 84.5 million ordinary shares on or prior to May 21, 2019 at an exercise price of $6.43 per ordinary share to a selected institutional investor. The amount in excess of par value for the ordinary shares net of warrant was $271 million and is reported in “Capital in Excess of Par Value.” At December 31, 2016, the fair value of the warrant of $156 million is classified as “Other Non-current Liabilities” on the accompanying Consolidated Balance Sheets.
On June 17, 2014, we completed the change in our place of incorporation from Switzerland to Ireland, whereby Weatherford Ireland became the new public holding company and the parent of the Weatherford group of companies, pursuant to which each registered share of Weatherford Switzerland was exchanged as consideration for the allotment of one ordinary share of Weatherford Ireland (excluding shares held by, or for the benefit of, Weatherford Switzerland or any of its subsidiaries). The Weatherford Switzerland shares were then cancelled. Weatherford Ireland issued ordinary shares with a par value of $0.001 per share. In conjunction with the redomestication, the shares held by our executive deferred compensation plan were sold and the remaining treasury shares were cancelled.
Accumulated Other Comprehensive Loss
The following table presents the changes in our accumulated other comprehensive loss by component for the year ended December 31, 2016 and 2015:
(Dollars in millions) | Currency Translation Adjustment | Defined Benefit Pension | Deferred Loss on Derivatives | Total | |||||||||||
Balance at December 31, 2014 | $ | (813 | ) | $ | (57 | ) | $ | (11 | ) | $ | (881 | ) | |||
Other comprehensive (loss) income before reclassifications | (789 | ) | 28 | — | (761 | ) | |||||||||
Reclassifications | — | — | 1 | 1 | |||||||||||
Net activity | (789 | ) | 28 | 1 | (760 | ) | |||||||||
Balance at December 31, 2015 | (1,602 | ) | (29 | ) | (10 | ) | (1,641 | ) | |||||||
Other comprehensive (loss) income before reclassifications | (12 | ) | 41 | — | 29 | ||||||||||
Reclassifications | — | 1 | 1 | 2 | |||||||||||
Net activity | (12 | ) | 42 | 1 | 31 | ||||||||||
Balance at December 31, 2016 | $ | (1,614 | ) | $ | 13 | $ | (9 | ) | $ | (1,610 | ) | ||||
80
For the year ended December 31, 2016, the defined benefit pension component of other comprehensive income before reclassifications relates primarily to a net actuarial gain resulting from the revaluation of the pension obligation associated with our supplemental executive retirement plan. For the year ended December 31, 2015, the defined benefit pension component of other comprehensive income before reclassifications relates primarily to a net actuarial gain resulting from the conversion of one of our international pension plans from a defined benefit plan to a defined contribution plan. In addition, other comprehensive income reflects the reclassification of our deferred loss on derivatives related to the early redemption of our senior notes.
The reclassification from the currency translation adjustment component of other comprehensive income includes $90 million from the sale of our land drilling and workover rig operations in Russia and Venezuela and pipeline and specialty service businesses. This amount was recognized in the “Gain on Sale of Businesses and Investments, Net” line in our Consolidated Statements of Operations for the year ended December 31, 2014.
17. Earnings per Share
Basic earnings per share for all periods presented equals net income divided by the weighted average number of our shares outstanding during the period including participating securities. Diluted earnings per share is computed by dividing net income by the weighted average number of our shares outstanding during the period including participating securities, adjusted for the dilutive effect of our stock options, restricted shares and performance units.
The following discloses basic and diluted weighted average shares outstanding:
Year Ended December 31, | ||||||||
(Shares in millions) | 2016 | 2015 | 2014 | |||||
Basic and Diluted weighted average shares outstanding | 887 | 779 | 777 | |||||
Our basic and diluted weighted average shares outstanding for the years ended December 31, 2016, 2015 and 2014, are equivalent due to the net loss attributable to shareholders. Diluted weighted average shares outstanding for the years ended December 31, 2016, 2015 and 2014, exclude potential shares for stock options, restricted shares, performance units, exchangeable notes, warrants outstanding and the Employee Stock Purchase Plan (“ESPP”) as we have net losses for those periods and their inclusion would be anti-dilutive. The following table discloses the number of anti-dilutive shares excluded:
Year Ended December 31, | ||||||||
(Shares in millions) | 2016 | 2015 | 2014 | |||||
Anti-dilutive potential shares | 104 | 3 | 5 | |||||
18. Share-Based Compensation
Incentive Plans
Our incentive plans permit the grant of options, stock appreciation rights, RSAs, restricted share units (“RSUs”), performance share awards, performance unit awards (“PUs”), other share-based awards and cash-based awards to any employee, non-employee directors and other individual service providers or any affiliate. Compensation expense is recognized on a straight-line basis over the requisite service period for the separately vesting portion of each award.
The provisions of each award vary based on the type of award granted and are determined by the Compensation Committee of our Board of Directors. Those awards, such as stock options that are based on a specific contractual term, will be granted with a term not to exceed 10 years. Upon grant of an RSA, the recipient has the rights of a shareholder, including but not limited to the right to vote such shares and the right to receive any dividends paid on such shares, but not the right to disposition prior to vesting. Recipients of RSU awards do not have the rights of a shareholder until such date as the shares are issued or transferred to the recipient. As of December 31, 2016, approximately 25 million shares were available for grant under our incentive plans.
81
Share-Based Compensation Expense
We recognized the following share-based compensation expense during each of the years ended December 31, 2016, 2015 and 2014:
Year Ended December 31, | |||||||||||
(Dollars in millions) | 2016 | 2015 | 2014 | ||||||||
Share-based compensation | $ | 87 | $ | 73 | $ | 56 | |||||
Related tax (provision) benefit | — | 14 | 12 | ||||||||
Options
Stock options were granted with an exercise price equal to or greater than the fair market value of our shares as of the date of grant. We used the Black-Scholes option pricing model to determine the fair value of stock options awarded. The estimated fair value of our stock options was expensed over their vesting period, which was generally one to four years. There were no stock options granted during 2016, 2015 or 2014. The intrinsic value of stock options exercised during 2015 and 2014 was $15 million and $13 million, respectively. No stock options were exercised during 2016. All options were fully vested.
A summary of option activity for the year ended December 31, 2016, is presented below:
Options | Weighted Average Exercise Price | Weighted Average Remaining Term | Aggregate Intrinsic Value | |||||||||
(In thousands) | (In thousands) | |||||||||||
Outstanding at December 31, 2015 | 2,503 | $ | 14.67 | 0.93 years | $ | 36 | ||||||
Exercised | — | — | ||||||||||
Expired | (1,905 | ) | 15.32 | |||||||||
Outstanding and Vested at December 31, 2016 | 598 | 12.59 | 0.91 years | — | ||||||||
Exercisable at December 31, 2016 | — | — | 0.00 years | — | ||||||||
Restricted Share Awards and Restricted Share Units
RSAs and RSUs vest based on continued employment, generally over a two to five-year period. The fair value of RSAs and RSUs is determined based on the closing price of our shares on the date of grant. The total fair value, less assumed forfeitures, is expensed over the vesting period. The weighted-average grant date fair value of RSAs and RSUs granted during the years ended December 31, 2016, 2015 and 2014 was $6.20, $11.94 and $18.98, respectively. The total fair value of RSAs and RSUs vested during the years ended December 31, 2016, 2015 and 2014 was $38 million, $37 million and $52 million, respectively. As of December 31, 2016, there was $83 million of unrecognized compensation expense related to unvested RSAs and RSUs, which is expected to be recognized over a weighted average period of two years. A summary of RSA and RSU activity for the year ended December 31, 2016 is presented below:
RSA | Weighted Average Grant Date Fair Value | RSU | Weighted Average Grant Date Fair Value | |||||||||||
(In thousands) | (In thousands) | |||||||||||||
Non-Vested at December 31, 2015 | 871 | $ | 14.85 | 11,964 | $ | 12.94 | ||||||||
Granted | — | — | 8,142 | 6.20 | ||||||||||
Vested | (625 | ) | 14.26 | (5,833 | ) | 12.02 | ||||||||
Forfeited | (109 | ) | 14.95 | (1,479 | ) | 12.26 | ||||||||
Non-Vested at December 31, 2016 | 137 | 17.42 | 12,794 | 9.15 | ||||||||||
82
Performance Units
The performance units we granted in 2016 and 2015 vest over three years and the performance units we granted prior to 2014 vest at the end of a three-year period assuming continued employment and the Company’s achievement of certain market-based performance goals. Depending on the performance levels achieved in relation to the predefined targets, shares may be issued for up to 200% of the units awarded. If the established performance goals are not met, the performance units will expire unvested and no shares will be issued. The grant date fair value of the performance units we have granted was determined through use of the Monte Carlo simulation method. The assumptions used in the Monte Carlo simulation during the year ended December 31, 2016, included a risk-free rate of 0.80%, volatility of 68.0% and a zero dividend yield. The weighted-average grant date fair value of the performance units we granted during the years ended December 31, 2016, 2015 and 2014 was $5.11, $10.45 and $14.31, respectively. For the years ended December 31, 2016 and 2015, we did not issue any shares. The total fair value of shares issued in connection with performance units during the years ended December 31, 2014 was $11 million. For the year ended December 31, 2014, 541 thousand shares of stock were issued for the performance units related to the departure of certain former executive officers. As of December 31, 2016, there was $7 million of unrecognized compensation expense related to performance units, which is expected to be recognized over a weighted average period of two years.
A summary of performance unit activity for the year ended December 31, 2016, is presented below:
Performance Units | Weighted Average Grant Date Fair Value | |||||
(In thousands) | ||||||
Non-vested at December 31, 2015 | 2,857 | $ | 11.17 | |||
Granted | 2,112 | 5.11 | ||||
Vested | — | — | ||||
Forfeited | (3,037 | ) | 9.56 | |||
Non-vested at December 31, 2016 | 1,932 | 7.08 | ||||
Employee Stock Purchase Plan
In June 2016, our shareholders adopted our ESPP and approved 12 million shares to be reserved for issuance under the plan. The ESPP permits eligible employees to make payroll deductions to purchase Weatherford stock. Each offering period has a six-month duration beginning on either March 1 or September 1. Shares are purchased at 90% of the lower of the closing price for our common stock on the first or last day of the offering period. As the inaugural offering period is still in progress, no shares have been issued under the ESPP as of December 31, 2016.
19. Retirement and Employee Benefit Plans
We have defined contribution plans covering certain employees. Contribution expenses related to these plans totaled $30 million, $66 million and $79 million in 2016, 2015 and 2014, respectively. The decrease in employer contributions in 2016 compared to 2015 relates primarily to the suspension of employer matching contributions to our U.S. 401(k) savings plan and other contribution plans sponsored by the Company.
83
We have defined benefit pension and other post-retirement benefit plans covering certain U.S. and international employees. Plan benefits are generally based on factors such as age, compensation levels and years of service. Early in 2015, we converted one of our larger defined benefit plans to a defined contribution plan. As a result, amounts shown for 2015 are significantly lower than previous years. Net periodic benefit cost related to these plans totaled $9 million, $9 million and $18 million in 2016, 2015 and 2014, respectively. The projected benefit obligations on a consolidated basis were $205 million and $245 million as of December 31, 2016 and 2015, respectively. The decrease year over year is due primarily to a net actuarial gain associated with our supplemental executive retirement plan. The fair values of plan assets on a consolidated basis (determined primarily using Level 2 inputs) were $118 million and $121 million as of December 31, 2016 and 2015, respectively. As of December 31, 2016, the net underfunded obligation was primarily recorded within Other Non-current Liabilities with approximately $22 million recorded in Accrued Salaries and Benefits. As of December 31, 2015, the net underfunded obligation was substantially all recorded within Other Non-current Liabilities. Additionally, consolidated pre-tax amounts in accumulated other comprehensive income that have not yet been recognized as components of net periodic benefit cost were income of $3 million and loss of $38 million as of December 31, 2016 and 2015, respectively. The increase in other comprehensive income (loss) year over year is due primarily to the net actuarial gain mentioned above.
The weighted average assumption rates used for benefit obligations were as follows:
Year Ended December 31, | |||||
2016 | 2015 | ||||
Discount rate: | |||||
United States plans | 1.00% - 4.00% | 1.00% - 4.25% | |||
International plans | 1.90% - 7.50% | 2.30% - 8.00% | |||
Rate of compensation increase: | |||||
United States plans | — | — | |||
International plans | 2.00% - 3.50% | 2.00% - 3.20% | |||
During 2016 and 2015, we made contributions and paid direct benefits of $6 million and $6 million, respectively, in connection with our defined benefit pension and other post-retirement benefit plans. In 2017, we expect to fund approximately $3 million with cash and $22 million with shares related to those plans. In addition, we expect to recognize net gains of approximately $40 million in net periodic benefit cost in conjunction with amortization associated primarily with our supplemental executive retirement plan.
20. Income Taxes
We are exempt from Swiss cantonal and communal tax on income derived outside Switzerland, and we are also granted participation relief from Swiss federal tax for qualifying dividend income and capital gains related to the sale of qualifying investments in subsidiaries. We expect that the participation relief will result in a full exemption of participation income from Swiss federal income tax.
We provide for income taxes based on the laws and rates in effect in the countries in which operations are conducted, or in which we or our subsidiaries are considered resident for income tax purposes. The relationship between our pre-tax income or loss and our income tax provision or benefit varies from period to period as a result of various factors which include changes in total pre-tax income or loss, the jurisdictions in which our income is earned, the tax laws in those jurisdictions and in our operating structure.
Our income tax (provision) benefit from continuing operations consisted of the following:
Year Ended December 31, | |||||||||||
(Dollars in millions) | 2016 | 2015 | 2014 | ||||||||
Total Current Provision | $ | (115 | ) | $ | (303 | ) | $ | (350 | ) | ||
Total Deferred (Provision) Benefit | (381 | ) | 448 | 66 | |||||||
(Provision) Benefit for Income Taxes | $ | (496 | ) | $ | 145 | $ | (284 | ) | |||
Weatherford records deferred tax assets for net operating losses and temporary differences between the book and tax basis of assets and liabilities that are expected to produce tax deductions in future periods. The ultimate realization of the deferred tax
84
assets is dependent upon the generation of future taxable income during the periods in which those deferred tax assets would be deductible. The Company assesses the realizability of its deferred tax assets each period by considering whether it is more likely than not that all or a portion of the deferred tax assets will not be realized. The Company considers all available evidence (both positive and negative) when determining whether a valuation allowance is required. The Company evaluated possible sources of taxable income that may be available to realize the benefit of deferred tax assets, including projected future taxable income, the reversal of existing temporary differences, taxable income in carryback years and available tax planning strategies in making this assessment. The realizability of the deferred tax assets is dependent upon judgments and assumptions inherent in the determination of future taxable income, including factors such as future operation conditions (particularly as related to prevailing oil prices and market demand for our products and services).
Operations in the United States and other jurisdictions continue to experience losses due to the prolonged downturn in the demand for oil field services. Our expectations regarding the recovery were and are more measured due to the difficulties in obtaining pricing increases from our customers and a slower recovery in the U.S. land market. Also, the Company recorded significant long-lived asset impairments and established allowances for inventory and other assets in the third quarter of 2016. As a result of the historical and projected future losses, and limited objective positive evidence to overcome negative evidence, the Company concluded that it needed to record a valuation allowance of $526 million in the third quarter of 2016 against certain previously benefited deferred tax assets since it cannot support that it is more likely than not that the deferred tax assets will be realized. The valuation allowance primarily relates to operations in the United States.
The Company will continue to evaluate whether valuation allowances are needed in future reporting periods. Valuation allowances will remain until the Company can determine that net deferred tax assets are more likely than not to be realized. In the event that the Company were to determine that it would be able to realize the deferred income tax assets in the future as a result of significant improvement in earnings as a result of market conditions, the Company would adjust the valuation allowance, reducing the provision for income taxes in the period of such adjustment.
The difference between the income tax (provision) benefit at the Swiss federal income tax rate and the income tax (provision) benefit attributable to “Loss Before Income Taxes” for each of the three years ended December 31, 2016, 2015 and 2014 is analyzed below:
Year Ended December 31, | |||||||||||
(Dollars in millions) | 2016 | 2015 | 2014 | ||||||||
Swiss federal income tax rate at 7.83% | $ | 225 | $ | 164 | $ | 20 | |||||
Tax on operating earnings subject to rates different than the Swiss federal income tax rate | 319 | 411 | (70 | ) | |||||||
Tax on divestitures gains subject to different tax rate | — | — | (109 | ) | |||||||
Non-cash tax expense on distribution of subsidiary earnings | (137 | ) | (265 | ) | — | ||||||
Change in valuation allowance | (872 | ) | (159 | ) | (222 | ) | |||||
Change in uncertain tax positions | (31 | ) | (6 | ) | 97 | ||||||
(Provision) Benefit for Income Taxes | $ | (496 | ) | $ | 145 | $ | (284 | ) | |||
Our income tax provision in 2016 was $496 million on a loss before income taxes of $2.9 billion. The primary component of the tax expense relates to the Company’s conclusion that certain deferred tax assets that had previously been benefited are not more likely than not to be realized. Our results for 2016 also include charges with no significant tax benefit principally related to $436 million of long-lived asset impairments, $219 million of excess and obsolete inventory charges, $140 million of settlement agreement charges, $41 million of currency devaluation related to the Angolan kwanza, $78 million of bond tender premium, and $76 million of PDVSA note receivable net adjustment, $62 million in accounts receivable reserves and write-offs, and $114 million in pressure pumping related charges. In addition, we recorded $137 million for a non-cash tax expense related to an internal restructuring of subsidiaries.
In 2015, we had a tax benefit of $145 million on a loss before income taxes of $2.1 billion. The tax benefit was favorably impacted by a U.S. loss, which included restructuring, impairment charges and a worthless stock deduction. Our results for 2015 include $255 million of Land Drilling Rig impairment charges, $232 million of restructuring charges, $116 million of litigation settlements, $153 million of legacy project losses, $85 million of currency devaluation and related losses and $25 million of equity investment impairment, all with no significant tax benefit. In addition, we recorded a tax charge of $265 million for a non-cash tax expense on distribution of subsidiary earnings.
85
In 2014, we had a tax provision of $284 million on a loss before income taxes of $255 million. Our results for 2014 include a $161 million goodwill impairment charge, a $245 million loss due to the devaluation of Venezuela bolivar and $72 million of project losses related to our early production facility contracts in Iraq, all of which provided no tax benefit. In addition, we incurred a $495 million long-lived assets impairments charge, with limited tax benefit. During 2014, we also sold our land drilling and workover rig operations in Russia and Venezuela, pipeline and specialty services business, engineered chemistry, Integrity drilling fluids business and our equity investment in Proserv for a total gain of approximately $349 million.
Deferred tax assets and liabilities are recognized for the estimated future tax effects of temporary differences between the tax basis of an asset or liability and its reported amount in the Consolidated Financial Statements. The measurement of deferred tax assets and liabilities is based on enacted tax laws and rates currently in effect in each of the jurisdictions in which we have operations. For 2015, deferred tax assets and liabilities are classified as current or non-current according to the classification of the related asset or liability for financial reporting. For 2016, we adopted ASU 2015-17 and classify net deferred tax assets and liabilities as non-current.
The components of the net deferred tax asset (liability) attributable to continuing operations were as follows:
December 31, | |||||||
(Dollars in millions) | 2016 | 2015 | |||||
Net operating losses carryforwards | $ | 1,258 | $ | 972 | |||
Accrued liabilities and reserves | 200 | 190 | |||||
Tax credit carryforwards | 102 | 102 | |||||
Employee benefits | 34 | 52 | |||||
Inventory | 75 | 64 | |||||
Other differences between financial and tax basis | 252 | 267 | |||||
Valuation allowance | (1,738 | ) | (868 | ) | |||
Total deferred tax assets | 183 | 779 | |||||
Deferred tax liabilities: | |||||||
Property, plant and equipment | (13 | ) | (53 | ) | |||
Intangible assets | (212 | ) | (209 | ) | |||
Deferred Income | (9 | ) | (21 | ) | |||
Undistributed Subsidiary Earnings | — | (179 | ) | ||||
Other differences between financial and tax basis | (25 | ) | (12 | ) | |||
Total deferred tax liabilities | (259 | ) | (474 | ) | |||
Net deferred tax asset (liability) | $ | (76 | ) | $ | 305 | ||
The overall increase in the valuation allowance in 2016 is primarily attributable to the establishment of a valuation allowance against current year net operating losses (“NOLs”) and beginning-of-year deferred tax assets in the United States, Brazil, and Colombia. The valuation allowance increase for 2015 is primarily attributable to the establishment of a valuation allowance against current year NOLs and tax credits in Mexico, Venezuela, and Iraq.
Deferred income taxes generally have not been recognized on the cumulative undistributed earnings of our non-Swiss subsidiaries because they are considered to be indefinitely reinvested or they can be distributed on a tax free basis. Distribution of these earnings in the form of dividends or otherwise may result in a combination of income and withholding taxes payable in various countries. In 2015 the company reversed its indefinitely reinvested assertion on a portion of those earnings and recorded a non-cash tax charge of $265 million. In addition, during the third quarter of 2016 we recorded a tax charge of $137 million for a non-cash tax expense related to an internal restructuring of subsidiaries. These charges covered the tax expense on distributions of earnings made during the fourth quarter of 2016 from subsidiaries to the U.S. As of December 31, 2016, the pool of positive undistributed earnings of our non-Swiss subsidiaries that are considered indefinitely reinvested and may be subject to tax if distributed amounts to approximately $3.6 billion. Due to complexities in the tax laws and the manner of repatriation, it is not practicable to estimate the unrecognized amount of deferred income taxes and the related dividend withholding taxes associated with these undistributed earnings.
86
At December 31, 2016, we had approximately $4.5 billion of NOLs in various jurisdictions, $1.7 billion of which were generated by certain U.S. subsidiaries. Loss carryforwards, if not utilized, will mostly expire for U.S. subsidiaries from 2033 through 2036 and at various dates from 2017 through 2036 for non-U.S. subsidiaries. At December 31, 2016, we had $102 million of tax credit carryovers, of which $82 million is for U.S. subsidiaries. The U.S. credits primarily consists of $30 million of research and development tax credit carryforwards which expire from 2018 through 2036, and $52 million of foreign tax credit carryforwards which expire from 2017 through 2023.
A tabular reconciliation of the total amounts of uncertain tax positions at the beginning and end of the period is as follows:
Year Ended December 31, | |||||||||||
(Dollars in millions) | 2016 | 2015 | 2014 | ||||||||
Balance at beginning of year | $ | 195 | $ | 235 | $ | 289 | |||||
Additions as a result of tax positions taken during a prior period | 30 | 28 | 23 | ||||||||
Reductions as a result of tax positions taken during a prior period | (1 | ) | (9 | ) | (35 | ) | |||||
Additions as a result of tax positions taken during the current period | 20 | 5 | 2 | ||||||||
Reductions relating to settlements with taxing authorities | (19 | ) | (46 | ) | (24 | ) | |||||
Reductions as a result of a lapse of the applicable statute of limitations | (12 | ) | (7 | ) | (9 | ) | |||||
Foreign exchange effects | (5 | ) | (11 | ) | (11 | ) | |||||
Balance at end of year | $ | 208 | $ | 195 | $ | 235 | |||||
Substantially all of the uncertain tax positions, if recognized in future periods, would impact our effective tax rate. To the extent penalties and interest would be assessed on any underpayment of income tax, such amounts have been accrued and classified as a component of income tax expense and other non-current liabilities in the Consolidated Financial Statements in accordance with our accounting policy. We recorded an expense of $2 million, and a benefit of $4 million and $53 million of interest and penalty for the years ended December 31, 2016, 2015 and 2014, respectively. The amounts in the table above exclude cumulative accrued interest and penalties of $51 million, $50 million, and $58 million at December 31, 2016, 2015 and 2014, respectively, which are included in other liabilities.
We are subject to income tax in many of the approximately 90 countries where we operate. As of December 31, 2016, the following table summarizes the tax years that remain subject to examination for the major jurisdictions in which we operate:
Canada | 2008 - 2016 |
Mexico | 2007 - 2016 |
Russia | 2013 - 2016 |
Switzerland | 2010 - 2016 |
United States | 2010 - 2016 |
Venezuela | 2010 - 2016 |
We are continuously under tax examination in various jurisdictions. We cannot predict the timing or outcome regarding resolution of these tax examinations or if they will have a material impact on our financial statements. We anticipate that it is reasonably possible that the amount of uncertain tax positions may decrease by up to $40 million in the next twelve months due to expiration of statutes of limitations, settlements and/or conclusions of tax examinations.
87
21. Disputes, Litigation and Contingencies
Shareholder Litigation
In 2010, three shareholder derivative actions were filed, purportedly on behalf of the Company, asserting breach of duty and other claims against certain current and former officers and directors of the Company related to the United Nations oil-for-food program governing sales of goods into Iraq, the FCPA and trade sanctions related to the U.S. government investigations disclosed in our U.S. Securities and Exchange Commission (the “SEC”) filings since 2007. Those shareholder derivative cases were filed in Harris County, Texas state court and consolidated under the caption Neff v. Brady, et al., No. 2010040764 (collectively referred to as the “Neff Case”). Other shareholder demand letters covering the same subject matter were received by the Company in early 2014, and a fourth shareholder derivative action was filed, purportedly on behalf of the Company, also asserting breach of duty and other claims against certain current and former officers and directors of the Company related to the same subject matter as the Neff Case. That case, captioned Erste-Sparinvest KAG v. Duroc-Danner, et al., No. 201420933 (Harris County, Texas) was consolidated into the Neff Case in September 2014. A motion to dismiss was granted May 15, 2015 and an appeal, which remains pending, was filed on June 15, 2015.
We cannot reliably predict the outcome of the appeal including the amount of any possible loss. If one or more negative outcomes were to occur relative to the Neff Case, the aggregate impact to our financial condition could be material.
Securities Class Action Settlement
On June 30, 2015, we signed a stipulation to settle a shareholder securities class action captioned Freedman v. Weatherford International Ltd., et al., No. 1:12-cv-02121-LAK (S.D.N.Y.) for $120 million subject to notice to the class and court approval. The Freedman lawsuit had been filed in the U.S. District Court for the Southern District of New York in March 2012, and alleged that we and certain current and former officers of Weatherford violated the federal securities laws in connection with the restatements of the Company’s historical financial statements announced on February 21, 2012 and July 24, 2012. On November 4, 2015, the U.S. District Court for the Southern District of New York entered a final judgment and an order approving the settlement. Pursuant to the settlement, we were required to pay $120 million, which was partially funded by insurance proceeds. There was no admission of liability or fault by a party in connection with the settlement. We are pursuing reimbursement from our insurance carriers and recovered $19 million of the settlement amount, of which $4 million was recovered in 2016.
On January 30, 2015, the U.S. District Court for the Southern District of New York approved the settlement of a purported shareholder securities class action captioned Dobina v. Weatherford International Ltd., et al., No. 1:11-cv-01646-LAK (S.D.N.Y.) for $53 million. The action named Weatherford and certain current and former officers as defendants. It alleged violation of the federal securities laws in connection with the material weakness in our internal controls over financial reporting for income taxes, and restatement of our historical financial statements announced in March 2011. The settlement was entirely funded by our insurers. There was no admission of liability or fault by any party in connection with the settlement.
Shareholder Derivative Actions Settlement
We signed an amended stipulation of settlement in November 2014 to resolve two shareholder derivative actions related to the Company’s restatement of its financial statements and material weakness in internal controls over financial reporting for income taxes. On June 24, 2015, the U.S. District Court for the Southern District of New York approved the settlement and entered final judgment in one of the two cases, Wandel v. Duroc-Danner, et al., No. 1:12-cv-01305-LAK. By agreement with the plaintiffs, a substantially identical shareholder derivative case, Iron Workers Mid-South Pension Fund v. Duroc-Danner, et al., No. 201119822, pending in Harris County, Texas, state court was voluntarily dismissed with prejudice. The two cases, purportedly brought on behalf of the Company against certain current and former officers and directors, alleged breaches of duty related to our material weakness and restatements. The settlement included an agreed upon set of revised corporate procedures, no monetary payment by the defendants and an award of attorney’s fees and reimbursement of expenses for a total amount of $0.6 million for the plaintiff’s counsel, which we paid in July 2015. There was no admission of liability or fault by any party in connection with the settlement.
88
U.S. Government and Internal Investigations
The SEC and the U.S. Department of Justice (“DOJ”) were investigating certain accounting issues associated with the material weakness in our internal control over financial reporting for income taxes that was disclosed in a notification of late filing on Form 12b-25 filed on March 1, 2011 and in current reports on Form 8-K filed on February 21, 2012 and on July 24, 2012 and the subsequent restatements of our historical financial statements. During the first quarter 2016, we recorded a loss contingency in the amount of $65 million, and increased it to $140 million in the second quarter to reflect our best estimate of the potential settlement. As disclosed on the Form 8-K filed on September 27, 2016, the Company settled with the SEC without admitting or denying the findings of the SEC, by consenting to the entry of an administrative order that requires the Company to cease and desist from committing or causing any violations and any future violations of the anti-fraud provisions of the Securities Act of 1933, and the anti-fraud, reporting, books and records, and internal controls provisions of the Securities Exchange Act of 1934, and the rules promulgated thereunder. As part of the terms of the SEC settlement, the Company agreed to pay a total civil monetary penalty of $140 million, with 50 million due within 21 days from the settlement agreement and three installments of $30 million due within 120, 240 and 360 days. In addition, certain reports and certifications must be delivered to the SEC in the following two years regarding our tax internal controls. The first installment of $50 million was paid during the fourth quarter of 2016. The second installment of $30 million was paid in January of 2017.
Other Disputes and Litigation
In August 2016, after a bench trial in Harris County, Texas, the court entered a judgment in favor of Spitzer Industries, Inc. (“Spitzer”) in connection with Spitzer’s fabrication work on a two mobile capture vessels used in the cleanup of marine oil spills. The Company has taken a reserve in the full amount of the judgment and has initiated an appeal of the judgment to the First Court of Appeals in Houston, Texas.
Additionally, we are aware of various disputes and potential claims and are a party in various litigation involving claims against us, including as a defendant in various employment claims alleging our failure to pay certain classes of workers overtime in compliance with the Fair Labor Standards Act for which an agreement was reached and settled during 2016. Some of these disputes and claims are covered by insurance. For claims, disputes and pending litigation in which we believe a negative outcome is probable and a loss can be reasonably estimated, we have recorded a liability for the expected loss. These liabilities are immaterial to our financial condition and results of operations.
In addition we have certain claims, disputes and pending litigation for which we do not believe a negative outcome is probable or for which we can only estimate a range of liability. It is possible, however, that an unexpected judgment could be rendered against us, or we could decide to resolve a case or cases, that would result in liability that could be uninsured and beyond the amounts we currently have reserved and in some cases those losses could be material. If one or more negative outcomes were to occur relative to these matters, the aggregate impact to our financial condition could be material.
Accrued litigation and settlements recorded in “Other Current Liabilities” on the accompanying Consolidated Balance Sheets as of December 31, 2016 and 2015 were $181 million and $53 million, respectively. The accrued litigation balance as of December 31, 2016 included the remaining SEC settlement obligation of $90 million.
22. Commitments and Other Contingencies
We are committed under various operating lease agreements primarily related to office space and equipment. Generally, these leases include renewal provisions and rental payments, which may be adjusted for taxes, insurance and maintenance related to the property. Future minimum commitments under noncancellable operating leases are as follows (dollars in millions):
2017 | $ | 214 | |
2018 | 166 | ||
2019 | 102 | ||
2020 | 60 | ||
2021 | 45 | ||
Thereafter | 201 | ||
$ | 788 | ||
Total rent expense incurred under operating leases was approximately $324 million, $426 million and $536 million for the years ended December 31, 2016, 2015 and 2014, respectively. The future rental commitment table above does not include leases that are short-term in nature or can be cancelled with notice of less than three months.
89
Other Contingencies
We have a contractual residual value guarantee at December 31, 2016 of $28 million in “Other Non-Current Liabilities” on the accompanying Consolidated Balance Sheets related to certain leased equipment in our North America pressure pumping business.
We have supply contract related minimum purchase commitments and maintain a liability at December 31, 2016 of $155 million for expected penalties to be paid, of which $34 million is recorded in “Other Current Liabilities” and $121 million is recorded in “Other Non-Current Liabilities” on our Consolidated Balance Sheets.
23. Segment Information
Reporting Segments
We have a total of five reportable segments which are North America, MENA/Asia Pacific, Europe/SSA/Russia, Latin America and Land Drilling Rigs. The operational performance of our segments is reviewed and managed primarily on a geographic basis, and we report the regional segments as separate, distinct reporting segments. In addition, our Land Drilling Rigs business, which we intend to divest, is reviewed and managed apart from our regional segments. Our corporate and other expenses that do not individually meet the criteria for segment reporting continue to be reported separately as Corporate and Research and Development. Each business reflects a reportable segment led by separate business segment management that reports directly or indirectly to our chief operating decision maker (“CODM”). Our CODM assesses performance and allocates resources on the basis of the five reportable segments.
Financial information by segment is summarized below. Revenues are attributable to countries based on the ultimate destination of the sale of products or performance of services. The accounting policies of the segments are the same as those described in “Note 1 – Summary of Significant Accounting Policies”. Included in the income (loss) from operations in MENA/Asia Pacific are losses related to our long-term early production facility construction contracts in Iraq accounted for under the percentage-of-completion method as described in “Note 5 – Percentage of Completion Contracts”.
Year Ended December 31, 2016 | |||||||||||||||
(Dollars in millions) | Net Operating Revenues | Income (Loss) from Operations | Depreciation and Amortization | Capital Expenditures | |||||||||||
North America | $ | 1,878 | $ | (382 | ) | $ | 208 | $ | 35 | ||||||
MENA/Asia Pacific | 1,453 | 5 | 233 | 21 | |||||||||||
Europe/SSA/Russia | 939 | (11 | ) | 182 | 34 | ||||||||||
Latin America | 1,059 | 65 | 228 | 20 | |||||||||||
Subtotal | 5,329 | (323 | ) | 851 | 110 | ||||||||||
Land Drilling Rigs | 420 | (87 | ) | 89 | 79 | ||||||||||
5,749 | (410 | ) | 940 | 189 | |||||||||||
Corporate and Research and Development | (298 | ) | 16 | 15 | |||||||||||
Long-Lived Asset Impairments, Write-Downs and Other Charges (a) | (1,043 | ) | |||||||||||||
Restructuring Charges (b) | (280 | ) | |||||||||||||
Litigation Charges, Net | (220 | ) | |||||||||||||
Total | $ | 5,749 | $ | (2,251 | ) | $ | 956 | $ | 204 | ||||||
(a) | Includes $710 million related to long-lived asset impairments, asset write-downs, receivable write-offs and other charges and credits, $219 million in inventory write-downs and $114 million of pressure pumping related charges. |
(b) | Includes restructuring charges of $280 million: $96 million in North America, $56 million in Latin America, $36 million in Europe/SSA/Russia, $33 million in MENA/Asia Pacific, $52 million in Corporate and Research and Development and $7 million in Land Drilling Rigs. |
90
Year Ended December 31, 2015 | |||||||||||||||
(Dollars in millions) | Net Operating Revenues | Income (Loss) from Operations (c) | Depreciation and Amortization | Capital Expenditures | |||||||||||
North America | $ | 3,494 | $ | (308 | ) | $ | 362 | $ | 161 | ||||||
MENA/Asia Pacific | 1,947 | (28 | ) | 254 | 75 | ||||||||||
Europe/SSA/Russia | 1,533 | 173 | 201 | 132 | |||||||||||
Latin America | 1,746 | 254 | 249 | 227 | |||||||||||
Subtotal | 8,720 | 91 | 1,066 | 595 | |||||||||||
Land Drilling Rigs | 713 | (13 | ) | 110 | 68 | ||||||||||
9,433 | 78 | 1,176 | 663 | ||||||||||||
Corporate and Research and Development | (425 | ) | 24 | 19 | |||||||||||
Long-Lived Asset Impairment and Other Related Charges (d) | (768 | ) | |||||||||||||
Equity Investment Impairment | (25 | ) | |||||||||||||
Restructuring Charges (e) | (232 | ) | |||||||||||||
Litigation Charges | (116 | ) | |||||||||||||
Loss on Sale of Businesses and Investments, Net | (6 | ) | |||||||||||||
Other Items (f) | (52 | ) | |||||||||||||
Total | $ | 9,433 | $ | (1,546 | ) | $ | 1,200 | $ | 682 | ||||||
(c) | Includes inventory write-downs of $223 million attributable to the reporting segments as follows: $73 million in North America, $54 million in Latin America, $38 million in MENA/Asia Pacific, $32 million in Europe/SSA/Russia, and $26 million for Land Drilling Rigs. Also includes bad debt expense of $48 million of which $31 million was taken in the fourth quarter attributable to our reporting segments as follows: $20 million in North America, $12 million for Europe/SSA/Russia, $9 million in Latin America, and $7 million in MENA/Asia Pacific. |
(d) | Includes $638 million of long-lived asset impairment charges, supply agreement charges related to a non-core business divestiture of $67 million, and pressure pumping related charges of $63 million. |
(e) | Includes restructuring charges of $232 million: $52 million in North America, $56 million in MENA/Asia Pacific, $56 million in Europe/SSA/Russia, $40 million in Latin America, $12 million in Land Drilling Rigs and $16 million in Corporate and Research and Development. |
(f) | Includes $17 million in professional and other fees, $11 million in divestiture related charges and facility closures and $24 million in other charges. |
91
Year Ended December 31, 2014 | |||||||||||||||
(Dollars in millions) | Net Operating Revenues | Income (Loss) from Operations | Depreciation and Amortization | Capital Expenditures | |||||||||||
North America | $ | 6,852 | $ | 1,005 | $ | 430 | $ | 454 | |||||||
MENA/Asia Pacific | 2,406 | 115 | 280 | 183 | |||||||||||
Europe/SSA/Russia | 2,129 | 367 | 218 | 282 | |||||||||||
Latin America | 2,282 | 339 | 241 | 311 | |||||||||||
Subtotal | 13,669 | 1,826 | 1,169 | 1,230 | |||||||||||
Land Drilling Rigs | 1,242 | (103 | ) | 179 | 158 | ||||||||||
14,911 | 1,723 | 1,348 | 1,388 | ||||||||||||
Corporate and Research and Development | (468 | ) | 23 | 62 | |||||||||||
Long-Lived Asset Impairments | (495 | ) | |||||||||||||
Goodwill Impairment | (161 | ) | |||||||||||||
Restructuring Charges (g) | (331 | ) | |||||||||||||
Gain on Sale of Businesses and Investments, Net | 349 | ||||||||||||||
Other Items (h) | (112 | ) | |||||||||||||
Total | $ | 14,911 | $ | 505 | $ | 1,371 | $ | 1,450 | |||||||
(g) | Includes restructuring charges of $331 million: $76 million in North America, $133 million in MENA/Asia Pacific, $35 million in Europe/SSA/Russia, $48 million in Latin America, $9 million in Land Drilling Rigs and $30 million in Corporate and Research and Development. |
(h) | Includes professional fees of $107 million related to the divestiture of our non-core businesses, restatement related litigation, the settlement of the U.S. government investigations, and our 2014 redomestication from Switzerland to Ireland and other charges of $5 million. |
The following table presents total assets by segment at December 31:
Total Assets at December 31, | ||||||
(Dollars in millions) | 2016 | 2015 | ||||
North America | $ | 3,921 | $ | 5,100 | ||
MENA/Asia Pacific | 2,131 | 2,536 | ||||
Europe/SSA/Russia | 2,036 | 2,480 | ||||
Latin America | 2,151 | 2,684 | ||||
Land Drilling Rigs | 1,419 | 1,516 | ||||
Corporate and Research and Development | 1,006 | 444 | ||||
Total | $ | 12,664 | $ | 14,760 | ||
Total assets in the United States, which is part of our North America segment, were $3.3 billion and $4.4 billion as of December 31, 2016 and 2015, respectively. The remaining North America total assets balance of $608 million and $731 million, respectively as of December 31, 2016 and 2015, is related to our operations in Canada.
Products and Services
We are one of the world’s leading providers of equipment and services used in the drilling, evaluation, completion, production and intervention of oil and natural gas wells. The composition of our consolidated revenues by product service line group is as follows:
92
Year Ended December 31, | ||||||||
2016 | 2015 | 2014 | ||||||
Formation Evaluation and Well Construction | 57 | % | 55 | % | 52 | % | ||
Completion and Production | 36 | 37 | 40 | |||||
Land Drilling Rigs | 7 | 8 | 8 | |||||
Total | 100 | % | 100 | % | 100 | % | ||
Geographic Areas
Financial information by geographic area is summarized below. Revenues from customers and long-lived assets in Ireland were insignificant in each of the years presented. Long-lived assets exclude goodwill and intangible assets as well as deferred tax assets of $81 million and $207 million at December 31, 2016 and 2015, respectively.
Revenues | Long-lived Assets | ||||||||||||||||||
(Dollars in millions) | 2016 | 2015 | 2014 | 2016 | 2015 | ||||||||||||||
United States | $ | 1,523 | $ | 2,864 | $ | 5,567 | $ | 1,008 | $ | 1,478 | |||||||||
Middle East and North Africa | 1,513 | 1,843 | 2,038 | 1,595 | 1,686 | ||||||||||||||
Latin America | 1,064 | 1,782 | 2,381 | 903 | 1,143 | ||||||||||||||
Europe/SSA/Russia | 939 | 1,613 | 2,584 | 629 | 862 | ||||||||||||||
Asia Pacific | 355 | 701 | 1,057 | 354 | 471 | ||||||||||||||
Canada | 355 | 630 | 1,284 | 140 | 191 | ||||||||||||||
$ | 5,749 | $ | 9,433 | $ | 14,911 | $ | 4,629 | $ | 5,831 | ||||||||||
93
24. Consolidating Financial Statements
Weatherford Ireland, a public limited company organized under the laws of Ireland, a Swiss tax resident, and the ultimate parent of the Weatherford group, guarantees the obligations of our subsidiaries – Weatherford Bermuda and Weatherford Delaware, including the notes and credit facilities listed below.
The following obligations of Weatherford Delaware were guaranteed by Weatherford Bermuda at December 31, 2016 and 2015: (1) 6.35% senior notes and (2) 6.80% senior notes.
The following obligations of Weatherford Bermuda were guaranteed by Weatherford Delaware at December 31, 2016 and 2015: (1) 6.50% senior notes, (2) 6.00% senior notes, (3) 7.00% senior notes, (4) 9.625% senior notes, (5) 9.875% senior notes due 2039, (6) 5.125% senior notes, (7) 6.75% senior notes, (8) 4.50% senior notes and (9) 5.95% senior notes. At December 31, 2015, Weatherford Delaware also guaranteed the revolving credit facility and the 5.50% senior notes of Weatherford Bermuda.
The following obligations of Weatherford Bermuda were guaranteed by Weatherford Delaware at December 31, 2016: (1) Revolving Credit Agreement, (2) Term Loan Agreement, (3) 5.875% exchangeable senior notes, (4) 7.75% senior notes, (5) 8.25% senior notes and (6) 9.875% senior notes due 2024. Additionally, the 364-day term loan facility held by Weatherford Bermuda and guaranteed by Weatherford Delaware was repaid during 2015.
As a result of these guarantee arrangements, we are required to present the following condensed consolidating financial information. The accompanying guarantor financial information is presented on the equity method of accounting for all periods presented. Under this method, investments in subsidiaries are recorded at cost and adjusted for our share in the subsidiaries’ cumulative results of operations, capital contributions and distributions and other changes in equity. Elimination entries relate primarily to the elimination of investments in subsidiaries and associated intercompany balances and transactions.
Condensed Consolidating Statement of Operations and
Comprehensive Income (Loss)
Year Ended December 31, 2016
(Dollars in Millions) | Weatherford Ireland | Weatherford Bermuda | Weatherford Delaware | Other Subsidiaries | Eliminations | Consolidation | |||||||||||||||||
Revenues | $ | — | $ | — | $ | — | $ | 5,749 | $ | — | $ | 5,749 | |||||||||||
Costs and Expenses | (151 | ) | (3 | ) | 5 | (7,851 | ) | — | (8,000 | ) | |||||||||||||
Operating Income (Loss) | (151 | ) | (3 | ) | 5 | (2,102 | ) | — | (2,251 | ) | |||||||||||||
Other Income (Expense): | |||||||||||||||||||||||
Interest Expense, Net | — | (465 | ) | (49 | ) | 4 | 11 | (499 | ) | ||||||||||||||
Intercompany Charges, Net | (76 | ) | 4 | (196 | ) | (274 | ) | 542 | — | ||||||||||||||
Equity in Subsidiary Income | (3,181 | ) | (2,403 | ) | (944 | ) | — | 6,528 | — | ||||||||||||||
Other Income (Expense), Net | 16 | (38 | ) | 43 | (78 | ) | (70 | ) | (127 | ) | |||||||||||||
Income (Loss) Before Income Taxes | (3,392 | ) | (2,905 | ) | (1,141 | ) | (2,450 | ) | 7,011 | (2,877 | ) | ||||||||||||
(Provision) for Income Taxes | — | — | (154 | ) | (342 | ) | — | (496 | ) | ||||||||||||||
Net Income (Loss) | (3,392 | ) | (2,905 | ) | (1,295 | ) | (2,792 | ) | 7,011 | (3,373 | ) | ||||||||||||
Net Income Attributable to Noncontrolling Interests | — | — | — | 19 | — | 19 | |||||||||||||||||
Net Income (Loss) Attributable to Weatherford | $ | (3,392 | ) | $ | (2,905 | ) | $ | (1,295 | ) | $ | (2,811 | ) | $ | 7,011 | $ | (3,392 | ) | ||||||
Comprehensive Income (Loss) Attributable to Weatherford | $ | (3,361 | ) | $ | (3,081 | ) | $ | (1,425 | ) | $ | (2,780 | ) | $ | 7,286 | $ | (3,361 | ) | ||||||
94
Condensed Consolidating Statement of Operations and
Comprehensive Income (Loss)
Year Ended December 31, 2015
(Dollars in millions) | Weatherford Ireland | Weatherford Bermuda | Weatherford Delaware | Other Subsidiaries | Eliminations | Consolidation | |||||||||||||||||
Revenues | $ | — | $ | — | $ | — | $ | 9,433 | $ | — | $ | 9,433 | |||||||||||
Costs and Expenses | (101 | ) | (7 | ) | 2 | (10,873 | ) | — | (10,979 | ) | |||||||||||||
Operating Income (Loss) | (101 | ) | (7 | ) | 2 | (1,440 | ) | — | (1,546 | ) | |||||||||||||
Other Income (Expense): | |||||||||||||||||||||||
Interest Expense, Net | — | (398 | ) | (57 | ) | (13 | ) | — | (468 | ) | |||||||||||||
Intercompany Charges, Net | (83 | ) | (110 | ) | (282 | ) | (403 | ) | 878 | — | |||||||||||||
Equity in Subsidiary Income | (1,801 | ) | (1,868 | ) | (492 | ) | — | 4,161 | — | ||||||||||||||
Other Income (Expense), Net | — | 51 | 11 | (144 | ) | — | (82 | ) | |||||||||||||||
Income (Loss) Before Income Taxes | (1,985 | ) | (2,332 | ) | (818 | ) | (2,000 | ) | 5,039 | (2,096 | ) | ||||||||||||
Benefit for Income Taxes | — | — | 114 | 31 | — | 145 | |||||||||||||||||
Net Income (Loss) | (1,985 | ) | (2,332 | ) | (704 | ) | (1,969 | ) | 5,039 | (1,951 | ) | ||||||||||||
Net Income Attributable to Noncontrolling Interests | — | — | — | 34 | — | 34 | |||||||||||||||||
Net Income (Loss) Attributable to Weatherford | $ | (1,985 | ) | $ | (2,332 | ) | $ | (704 | ) | $ | (2,003 | ) | $ | 5,039 | $ | (1,985 | ) | ||||||
Comprehensive Income (Loss) Attributable to Weatherford | $ | (2,745 | ) | $ | (2,610 | ) | $ | (754 | ) | $ | (2,762 | ) | $ | 6,126 | $ | (2,745 | ) | ||||||
Condensed Consolidating Statement of Operations and
Comprehensive Income (Loss)
Year Ended December 31, 2014
(Dollars in millions) | Weatherford Ireland | Weatherford Bermuda | Weatherford Delaware | Other Subsidiaries | Eliminations | Consolidation | |||||||||||||||||
Revenues | $ | — | $ | — | $ | — | $ | 14,911 | $ | — | $ | 14,911 | |||||||||||
Costs and Expenses | (59 | ) | (18 | ) | 3 | (14,332 | ) | — | (14,406 | ) | |||||||||||||
Operating Income (Loss) | (59 | ) | (18 | ) | 3 | 579 | — | 505 | |||||||||||||||
Other Income (Expense): | |||||||||||||||||||||||
Interest Expense, Net | — | (422 | ) | (57 | ) | (19 | ) | — | (498 | ) | |||||||||||||
Intercompany Charges, Net | (99 | ) | 7,291 | (266 | ) | (8,802 | ) | 1,876 | — | ||||||||||||||
Equity in Subsidiary Income | (424 | ) | (430 | ) | 407 | (2 | ) | 449 | — | ||||||||||||||
Other Income (Expense), Net | — | 20 | (3 | ) | (279 | ) | — | (262 | ) | ||||||||||||||
Income (Loss) Before Income Taxes | (582 | ) | 6,441 | 84 | (8,523 | ) | 2,325 | (255 | ) | ||||||||||||||
(Provision) Benefit for Income Taxes | (2 | ) | — | 131 | (413 | ) | — | (284 | ) | ||||||||||||||
Net Income (Loss) | (584 | ) | 6,441 | 215 | (8,936 | ) | 2,325 | (539 | ) | ||||||||||||||
Net Income Attributable to Noncontrolling Interests | — | — | — | 45 | — | 45 | |||||||||||||||||
Net Income (Loss) Attributable to Weatherford | $ | (584 | ) | $ | 6,441 | $ | 215 | $ | (8,981 | ) | $ | 2,325 | $ | (584 | ) | ||||||||
Comprehensive Income (Loss) Attributable to Weatherford | $ | (1,278 | ) | $ | 5,811 | $ | (128 | ) | $ | (9,674 | ) | $ | 3,991 | $ | (1,278 | ) | |||||||
95
Condensed Consolidating Balance Sheet
December 31, 2016
(Dollars in millions) | Weatherford Ireland | Weatherford Bermuda | Weatherford Delaware | Other Subsidiaries | Eliminations | Consolidation | |||||||||||||||||
Current Assets: | |||||||||||||||||||||||
Cash and Cash Equivalents | $ | — | $ | 586 | $ | 4 | $ | 447 | $ | — | $ | 1,037 | |||||||||||
Other Current Assets | 1 | — | 512 | 3,891 | (531 | ) | 3,873 | ||||||||||||||||
Total Current Assets | 1 | 586 | 516 | 4,338 | (531 | ) | 4,910 | ||||||||||||||||
Equity Investments in Affiliates | 2,415 | 8,669 | 8,301 | 1,037 | (20,422 | ) | — | ||||||||||||||||
Intercompany Receivables, Net | — | — | — | 3,762 | (3,762 | ) | — | ||||||||||||||||
Other Assets | 2 | 13 | — | 7,751 | (12 | ) | 7,754 | ||||||||||||||||
Total Assets | $ | 2,418 | $ | 9,268 | $ | 8,817 | $ | 16,888 | $ | (24,727 | ) | $ | 12,664 | ||||||||||
Current Liabilities: | |||||||||||||||||||||||
Short-term Borrowings and Current Portion of Long-Term Debt | $ | — | $ | 53 | $ | 94 | $ | 32 | $ | — | $ | 179 | |||||||||||
Accounts Payable and Other Current Liabilities | 105 | 198 | — | 2,488 | (542 | ) | 2,249 | ||||||||||||||||
Total Current Liabilities | 105 | 251 | 94 | 2,520 | (542 | ) | 2,428 | ||||||||||||||||
Long-term Debt | — | 6,944 | 148 | 204 | 107 | 7,403 | |||||||||||||||||
Intercompany Payables, Net | 145 | 224 | 3,393 | — | (3,762 | ) | — | ||||||||||||||||
Other Long-term Liabilities | 156 | 152 | 146 | 457 | (146 | ) | 765 | ||||||||||||||||
Total Liabilities | 406 | 7,571 | 3,781 | 3,181 | (4,343 | ) | 10,596 | ||||||||||||||||
Weatherford Shareholders’ Equity | 2,012 | 1,697 | 5,036 | 13,651 | (20,384 | ) | 2,012 | ||||||||||||||||
Noncontrolling Interests | — | — | — | 56 | — | 56 | |||||||||||||||||
Total Liabilities and Shareholders’ Equity | $ | 2,418 | $ | 9,268 | $ | 8,817 | $ | 16,888 | $ | (24,727 | ) | $ | 12,664 | ||||||||||
96
Condensed Consolidating Balance Sheet
December 31, 2015
(Dollars in millions) | Weatherford Ireland | Weatherford Bermuda | Weatherford Delaware | Other Subsidiaries | Eliminations | Consolidation | |||||||||||||||||
Current Assets: | |||||||||||||||||||||||
Cash and Cash Equivalents | $ | — | $ | 2 | $ | 22 | $ | 443 | $ | — | $ | 467 | |||||||||||
Other Current Assets | 4 | — | 651 | 5,146 | (704 | ) | 5,097 | ||||||||||||||||
Total Current Assets | 4 | 2 | 673 | 5,589 | (704 | ) | 5,564 | ||||||||||||||||
Equity Investments in Affiliates | 5,693 | 8,709 | 9,187 | 3,483 | (27,072 | ) | — | ||||||||||||||||
Intercompany Receivables, Net | — | — | — | 10,423 | (10,423 | ) | — | ||||||||||||||||
Other Assets | 3 | 2 | 16 | 9,175 | — | 9,196 | |||||||||||||||||
Total Assets | $ | 5,700 | $ | 8,713 | $ | 9,876 | $ | 28,670 | $ | (38,199 | ) | $ | 14,760 | ||||||||||
Current Liabilities: | |||||||||||||||||||||||
Short-term Borrowings and Current Portion of Long-Term Debt | $ | — | $ | 1,503 | $ | 6 | $ | 73 | $ | — | $ | 1,582 | |||||||||||
Accounts Payable and Other Current Liabilities | 19 | 212 | — | 2,922 | (704 | ) | 2,449 | ||||||||||||||||
Total Current Liabilities | 19 | 1,715 | 6 | 2,995 | (704 | ) | 4,031 | ||||||||||||||||
Long-term Debt | — | 4,885 | 862 | 105 | — | 5,852 | |||||||||||||||||
Intercompany Payables, Net | 1,362 | 6,147 | 2,914 | — | (10,423 | ) | — | ||||||||||||||||
Other Long-term Liabilities | 15 | 77 | 10 | 410 | — | 512 | |||||||||||||||||
Total Liabilities | 1,396 | 12,824 | 3,792 | 3,510 | (11,127 | ) | 10,395 | ||||||||||||||||
Weatherford Shareholders’ Equity | 4,304 | (4,111 | ) | 6,084 | 25,099 | (27,072 | ) | 4,304 | |||||||||||||||
Noncontrolling Interests | — | — | — | 61 | — | 61 | |||||||||||||||||
Total Liabilities and Shareholders’ Equity | $ | 5,700 | $ | 8,713 | $ | 9,876 | $ | 28,670 | $ | (38,199 | ) | $ | 14,760 | ||||||||||
97
Condensed Consolidating Statement of Cash Flows
Year Ended December 31, 2016
(Dollars in millions) | Weatherford Ireland | Weatherford Bermuda | Weatherford Delaware | Other Subsidiaries | Eliminations | Consolidation | |||||||||||||||||
Cash Flows from Operating Activities: | |||||||||||||||||||||||
Net Income (Loss) | $ | (3,392 | ) | $ | (2,905 | ) | $ | (1,295 | ) | $ | (2,792 | ) | $ | 7,011 | $ | (3,373 | ) | ||||||
Adjustments to Reconcile Net Income(Loss) to Net Cash Provided (Used) by Operating Activities: | |||||||||||||||||||||||
Charges from Parent or Subsidiary | 76 | (4 | ) | 196 | 274 | (542 | ) | — | |||||||||||||||
Equity in (Earnings) Loss of Affiliates | 3,181 | 2,403 | 944 | — | (6,528 | ) | — | ||||||||||||||||
Deferred Income Tax Provision (Benefit) | — | — | 26 | 355 | 381 | ||||||||||||||||||
Other Adjustments | 1,230 | 75 | 257 | 1,057 | 59 | 2,678 | |||||||||||||||||
Net Cash Provided by (Used in) Operating Activities | 1,095 | (431 | ) | 128 | (1,106 | ) | — | (314 | ) | ||||||||||||||
Cash Flows from Investing Activities: | |||||||||||||||||||||||
Capital Expenditures for Property, Plant and Equipment | — | — | — | (204 | ) | — | (204 | ) | |||||||||||||||
Acquisitions of Businesses, Net of Cash Acquired | — | — | — | (5 | ) | — | (5 | ) | |||||||||||||||
Acquisition of Intellectual Property | — | — | — | (10 | ) | — | (10 | ) | |||||||||||||||
Insurance Proceeds Related to Asset Casualty Loss | — | — | — | 39 | — | 39 | |||||||||||||||||
Proceeds (Payment) Related to Sale of Businesses and Equity Investment, Net | — | — | — | (6 | ) | — | (6 | ) | |||||||||||||||
Proceeds from Sale of Assets | — | — | — | 49 | — | 49 | |||||||||||||||||
Net Cash Provided by (Used in) Investing Activities | — | — | — | (137 | ) | — | (137 | ) | |||||||||||||||
Cash Flows from Financing Activities: | |||||||||||||||||||||||
Borrowings (Repayments) Short-term Debt, Net | — | (1,497 | ) | — | (15 | ) | — | (1,512 | ) | ||||||||||||||
Borrowings (Repayments) Long-term Debt, Net | — | 2,299 | (516 | ) | (65 | ) | — | 1,718 | |||||||||||||||
Borrowings (Repayments) Between Subsidiaries, Net | (1,095 | ) | 213 | 370 | 512 | — | — | ||||||||||||||||
Proceeds from Issuance of Ordinary Common Shares and Warrant | — | — | — | 1,071 | — | 1,071 | |||||||||||||||||
Other, Net | — | — | — | (206 | ) | — | (206 | ) | |||||||||||||||
Net Cash Provided by (Used in) Financing Activities | (1,095 | ) | 1,015 | (146 | ) | 1,297 | — | 1,071 | |||||||||||||||
Effect of Exchange Rate Changes On Cash and Cash Equivalents | — | — | — | (50 | ) | — | (50 | ) | |||||||||||||||
Net Increase (Decrease) in Cash and Cash Equivalents | — | 584 | (18 | ) | 4 | — | 570 | ||||||||||||||||
Cash and Cash Equivalents at Beginning of Year | — | 2 | 22 | 443 | — | 467 | |||||||||||||||||
Cash and Cash Equivalents at End of Year | $ | — | $ | 586 | $ | 4 | $ | 447 | $ | — | $ | 1,037 | |||||||||||
98
Condensed Consolidating Statement of Cash Flows
Year Ended December 31, 2015
(Dollars in millions) | Weatherford Ireland | Weatherford Bermuda | Weatherford Delaware | Other Subsidiaries | Eliminations | Consolidation | |||||||||||||||||
Cash Flows from Operating Activities: | |||||||||||||||||||||||
Net Income (Loss) | $ | (1,985 | ) | $ | (2,332 | ) | $ | (704 | ) | $ | (1,969 | ) | $ | 5,039 | $ | (1,951 | ) | ||||||
Adjustments to Reconcile Net Income(Loss) to Net Cash Provided (Used) by Operating Activities: | |||||||||||||||||||||||
Charges from Parent or Subsidiary | 83 | 110 | 282 | 403 | (878 | ) | — | ||||||||||||||||
Equity in (Earnings) Loss of Affiliates | 1,801 | 1,868 | 492 | — | (4,161 | ) | — | ||||||||||||||||
Deferred Income Tax Provision (Benefit) | — | — | 14 | (462 | ) | — | (448 | ) | |||||||||||||||
Other Adjustments | (35 | ) | 210 | (86 | ) | 3,016 | — | 3,105 | |||||||||||||||
Net Cash Provided by (Used in) Operating Activities | (136 | ) | (144 | ) | (2 | ) | 988 | — | 706 | ||||||||||||||
Cash Flows from Investing Activities: | |||||||||||||||||||||||
Capital Expenditures for Property, Plant and Equipment | — | — | — | (682 | ) | — | (682 | ) | |||||||||||||||
Acquisitions of Businesses, Net of Cash Acquired | — | — | — | (14 | ) | — | (14 | ) | |||||||||||||||
Acquisition of Intellectual Property | — | — | — | (8 | ) | — | (8 | ) | |||||||||||||||
Proceeds (Payment) Related to Sale of Businesses and Equity Investment, Net | — | — | — | 8 | — | 8 | |||||||||||||||||
Proceeds from Sale of Assets | — | — | — | 37 | — | 37 | |||||||||||||||||
Net Cash Provided by (Used in) Investing Activities | — | — | — | (659 | ) | — | (659 | ) | |||||||||||||||
Cash Flows from Financing Activities: | |||||||||||||||||||||||
Borrowings (Repayments) Short-term Debt, Net | — | 535 | — | (30 | ) | — | 505 | ||||||||||||||||
Borrowings (Repayments) Long-term Debt, Net | — | (411 | ) | (31 | ) | (28 | ) | — | (470 | ) | |||||||||||||
Borrowings (Repayments) Between Subsidiaries, Net | 135 | 22 | 33 | (190 | ) | — | — | ||||||||||||||||
Other, Net | — | — | — | (23 | ) | — | (23 | ) | |||||||||||||||
Net Cash Provided by (Used in) Financing Activities | 135 | 146 | 2 | (271 | ) | — | 12 | ||||||||||||||||
Effect of Exchange Rate Changes On Cash and Cash Equivalents | — | — | — | (66 | ) | — | (66 | ) | |||||||||||||||
Net Increase in Cash and Cash Equivalents | (1 | ) | 2 | — | (8 | ) | — | (7 | ) | ||||||||||||||
Cash and Cash Equivalents at Beginning of Year | 1 | — | 22 | 451 | — | 474 | |||||||||||||||||
Cash and Cash Equivalents at End of Year | $ | — | $ | 2 | $ | 22 | $ | 443 | $ | — | $ | 467 | |||||||||||
99
Condensed Consolidating Statement of Cash Flows
Year Ended December 31, 2014
(Dollars in millions) | Weatherford Ireland | Weatherford Bermuda | Weatherford Delaware | Other Subsidiaries | Eliminations | Consolidation | |||||||||||||||||
Cash Flows from Operating Activities: | |||||||||||||||||||||||
Net Income (Loss) | $ | (584 | ) | $ | 6,441 | $ | 215 | $ | (8,936 | ) | $ | 2,325 | $ | (539 | ) | ||||||||
Adjustments to Reconcile Net Income (Loss) to Net Cash Provided (Used) by Operating Activities: | |||||||||||||||||||||||
Charges from Parent or Subsidiary | 99 | (7,291 | ) | 266 | 8,802 | (1,876 | ) | — | |||||||||||||||
Equity in (Earnings) Loss of Affiliates | 424 | 430 | (407 | ) | 2 | (449 | ) | — | |||||||||||||||
Deferred Income Tax (Provision) Benefit | — | — | (25 | ) | (41 | ) | — | (66 | ) | ||||||||||||||
Other Adjustments | 23 | (180 | ) | (42 | ) | 1,767 | — | 1,568 | |||||||||||||||
Net Cash Provided by (Used in) Operating Activities | (38 | ) | (600 | ) | 7 | 1,594 | — | 963 | |||||||||||||||
Cash Flows from Investing Activities: | |||||||||||||||||||||||
Capital Expenditures for Property, Plant and Equipment | — | — | — | (1,450 | ) | — | (1,450 | ) | |||||||||||||||
Acquisitions of Businesses, Net of Cash Acquired | — | — | — | 18 | — | 18 | |||||||||||||||||
Acquisition of Intellectual Property | — | — | — | (5 | ) | — | (5 | ) | |||||||||||||||
Acquisition of Equity Investments in Unconsolidated Affiliates | — | — | — | (3 | ) | — | (3 | ) | |||||||||||||||
Proceeds (Payment) Related to Sale of Businesses and Equity Investment, Net | — | — | — | 1,711 | — | 1,711 | |||||||||||||||||
Proceeds from Sale of Assets | — | — | — | 59 | — | 59 | |||||||||||||||||
Net Cash Provided by (Used in) Investing Activities | — | — | — | 330 | — | 330 | |||||||||||||||||
Cash Flows from Financing Activities: | |||||||||||||||||||||||
Borrowings (Repayments) Short-term Debt, Net | — | (827 | ) | — | (97 | ) | — | (924 | ) | ||||||||||||||
Borrowings (Repayments) Long-term Debt, Net | — | (153 | ) | (92 | ) | (14 | ) | — | (259 | ) | |||||||||||||
Borrowings (Repayments) Between Subsidiaries, Net | 39 | 1,580 | 107 | (1,726 | ) | — | — | ||||||||||||||||
Proceeds from Sale of Executive Deferred Compensation Ordinary Shares | — | — | — | 22 | — | 22 | |||||||||||||||||
Other, Net | — | — | — | (19 | ) | — | (19 | ) | |||||||||||||||
Net Cash Provided by (Used in) Financing Activities | 39 | 600 | 15 | (1,834 | ) | — | (1,180 | ) | |||||||||||||||
Effect of Exchange Rate Changes on Cash and Cash Equivalents | — | — | — | (74 | ) | — | (74 | ) | |||||||||||||||
Net Increase in Cash and Cash Equivalents | 1 | — | 22 | 16 | — | 39 | |||||||||||||||||
Cash and Cash Equivalents at Beginning of Period | — | — | — | 435 | — | 435 | |||||||||||||||||
Cash and Cash Equivalents at End of Period | $ | 1 | $ | — | $ | 22 | $ | 451 | $ | — | $ | 474 | |||||||||||
100
25. Subsequent Events
In November 2016, we shut down our U.S. pressure pumping operations and idled our assets. In January 2017, we purchased certain leased equipment utilized in our North America pressure pumping business for a total amount of $240 million. We intend to dispose of our U.S. pressure pumping business through a sale or by partnering up with another company to form a joint venture.
26. Quarterly Financial Data (Unaudited)
Summarized quarterly financial data for the years ended December 31, 2016 and 2015 are presented in the following tables. In the following tables, the sum of basic and diluted “Loss Per Share” for the four quarters may differ from the annual amounts due to the required method of computing weighted average number of shares in the respective periods. Additionally, due to the effect of rounding, the sum of the individual quarterly earnings per share amounts may not equal the calculated year earnings per share amount.
2016 Quarters | |||||||||||||||||||
(Dollars in millions, except per share amounts) | First | Second | Third | Fourth | Total | ||||||||||||||
Revenues | $ | 1,585 | $ | 1,402 | $ | 1,356 | $ | 1,406 | $ | 5,749 | |||||||||
Gross Profit | 111 | 164 | 126 | 159 | 560 | ||||||||||||||
Net Loss Attributable to Weatherford | (498 | ) | (a) | (565 | ) | (b) | (1,780 | ) | (c) | (549 | ) | (d) | (3,392 | ) | |||||
Basic & Diluted Loss Per Share | (0.61 | ) | (0.63 | ) | (1.98 | ) | (0.59 | ) | (3.82 | ) | |||||||||
(a) | Includes charges of $285 million primarily related to severance and restructuring, litigation charges, pressure pumping related charges and an estimated project loss on our long-term early production facility construction contract. |
(b) | Includes charges of $347 million primarily related to litigation charges, an adjustment to a note from PDVSA to fair value, a bond tender premium incurred from a tender offer and severance and restructuring charges partially offset by an estimated project income on our long-term early production facility construction contract. |
(c) | Includes charges of $771 million primarily related to long-lived asset impairments, inventory write-downs and severance and restructuring. |
(d) | Includes charges of $245 million primarily related to severance and restructuring, litigation charges and pressure pumping related charges. |
2015 Quarters | |||||||||||||||||||
(Dollars in millions, except per share amounts) | First | Second | Third | Fourth | Total | ||||||||||||||
Revenues | $ | 2,794 | $ | 2,390 | $ | 2,237 | $ | 2,012 | $ | 9,433 | |||||||||
Gross Profit | 592 | 374 | 368 | 78 | 1,412 | ||||||||||||||
Net Loss Attributable to Weatherford (i) | (118 | ) | (e) | (489 | ) | (f) | (170 | ) | (g) | (1,208 | ) | (h) | (1,985 | ) | |||||
Basic & Diluted Loss Per Share | (0.15 | ) | (0.63 | ) | (0.22 | ) | (1.54 | ) | (2.55 | ) | |||||||||
(e) | Includes charges of $59 million primarily related to severance and restructuring. |
(f) | Includes charges of $395 million primarily related to long-lived asset impairments, litigation and severance and restructuring. |
(g) | Includes charges of $77 million primarily related to severance and restructuring and supply contracts. |
(h) | Includes $668 million primarily related to long-lived asset impairments, severance and restructuring and supply contracts, a $265 million charge for a non-cash tax expense on distribution of subsidiary earnings and $217 million of inventory write-downs and adjustments. |
(i) | Includes estimated project income of $42 million, for the first quarter of 2015, estimated project loss of $69 million, $44 million and $82 million for the second, third and fourth quarter of 2015, respectively, from our long-term early production facility construction contracts. |
101
Item 9. Changes in and Disagreement with Accountants on Accounting and Financial Disclosure
None.
Item 9A. Controls and Procedures
Disclosure controls and procedures (as defined in Rules 13a-15(e) and 15d-15(e) under the Exchange Act, are designed to ensure that information required to be disclosed in our reports filed under the Exchange Act is recorded, processed, summarized and reported within the time periods specified in the SEC’s rules and forms. This information is collected and communicated to management, including our Chief Executive Officer (“CEO”) and the Chief Financial Officer (“CFO”), as appropriate, to allow timely decisions regarding required disclosures. Our management, under the supervision of and with the participation of our CEO and CFO, evaluated the effectiveness of the design and operation of our disclosure controls and procedures at December 31, 2016. Based on that evaluation, our CEO and CFO concluded that our disclosure controls and procedures were effective as of December 31, 2016.
Management’s Annual Report on Internal Controls Over Financial Reporting
Management of the Company is responsible for establishing and maintaining adequate internal control over financial reporting as such term is defined in Rules 13a-15(f) of the Exchange Act. The Company’s internal controls are designed to provide reasonable, but not absolute, assurance as to the reliability of its financial reporting and the preparation of financial statements for external purposes in accordance with U.S. GAAP.
Our management, including our CEO and CFO, does not expect that our internal controls over financial reporting will prevent all errors and all fraud. A control system, no matter how well conceived and operated, can provide only reasonable, not absolute, assurance that the objectives of the control system are met. Further, the benefits of controls must be considered relative to their costs. Because of the inherent limitations in a system of internal control over financial reporting, no evaluation of controls can provide absolute assurance that all control issues and instances of fraud, if any, have been detected. These inherent limitations include the realities that judgments in decision-making can be faulty and that breakdowns can occur because of simple error or mistake. Additionally, controls can be circumvented by the individual acts of some persons, by collusion of two or more people, or by management override of the control. The design of any control system is also based, in part, upon certain assumptions about the likelihood of future events, and there can be no assurance that any design will succeed in achieving its stated goals under all potential future conditions. Because of the inherent limitations in a cost-effective control system, misstatements due to error or fraud may occur and not be detected.
Management assessed the effectiveness of the Company’s internal control over financial reporting as of December 31, 2016 using the criteria set forth by the Committee of Sponsoring Organizations of the Treadway Commission in Internal Control – An Integrated Framework (2013). As a result of this assessment management concluded that as of December 31, 2016, our internal control over financial reporting was effective based on these criteria.
KPMG LLP has issued an attestation report dated February 14, 2017, on our internal control over financial reporting, which is contained in this Annual Report on Form 10-K.
Evaluation of Disclosure Controls and Procedures
At the end of the period covered by this Annual Report on Form 10-K, we carried out an evaluation, under the supervision of and with the participation of management, including the CEO and the CFO, of the effectiveness of our disclosure controls and procedures (as defined in Rules 13a-15(e) and 15d-15(e) under the Exchange Act). Based upon that evaluation, our CEO and CFO have concluded our disclosure controls and procedures were effective, as of December 31, 2016, to provide reasonable assurance that information required to be disclosed in the reports we file and submit under the Exchange Act is recorded, processed, summarized and reported within the time period specified in the SEC’s rules and forms.
Changes in Internal Controls
Our management, identified no change in our internal control over financial reporting that occurred during the fourth quarter ended December 31, 2016, that has materially affected, or is reasonably likely to materially affect, our internal control over financial reporting.
102
Item 9B. Other Information
None.
PART III
Item 10. Directors, Executive Officers and Corporate Governance
Pursuant to General Instructions G(3), information on directors and executive officers of the Registrant and corporate governance matters is incorporated by reference from our Proxy Statement for the 2017 Annual General Meeting of Shareholders to be held on June 15, 2017.
The Company has adopted a code of ethics entitled “Code of Business Conduct,” which applies to all our employees, officers and directors and our board of directors has also adopted a separate “Supplemental Code of Business Conduct” for our senior officers. Copies of these codes can also be found at www.weatherford.com.
We intend to satisfy the requirement under Item 5.05 of Form 8-K to disclose any amendments to our Code of Business Conduct and any waiver from any provision of our Code of Business Conduct by posting such information on our web site at www.weatherford.com.
Item 11. Executive Compensation
Pursuant to General Instructions G(3), information on executive compensation is incorporated by reference from our Proxy Statement for the 2017 Annual General Meeting of Shareholders to be held on June 15, 2017.
Item 12. Security Ownership of Certain Beneficial Owners and Management and Related Stockholder Matters
Pursuant to General Instructions G(3), information on security ownership of certain beneficial owners is incorporated by reference from our Proxy Statement for the 2017 Annual General Meeting of Shareholders to be held on June 15, 2017.
Item 12(b). Security Ownership of Management
Pursuant to General Instructions G(3), information on security ownership of management is incorporated by reference from our Proxy Statement for the 2017 Annual General Meeting of Shareholders to be held on June 15, 2017.
Item 12(c). Changes in Control
Not applicable.
103
Item 12(d). Securities Authorized for Issuance under Equity Compensation Plans
The following table provides information as of December 31, 2016, about the number of shares to be issued upon vesting or exercise of equity awards as well as the number of shares remaining available for issuance under our equity compensation plans.
Plan Category (Shares in thousands, except share prices) | Numbers of Securities to be Issued Upon Exercise of Outstanding Options, Warrants and Rights | Weighted Average Exercise Price of Outstanding Options, Warrants and Rights (a) | Number of Securities Available for Future Issuance Under Equity Compensation Plans (b) | ||||||
Equity compensation plans approved by shareholders (c) (d) | 14,725 | $ | — | 25,328 | |||||
Equity compensation plans not approved by shareholders (e) | 705 | 12.59 | — | ||||||
Total | 15,430 | 12.59 | 25,328 | ||||||
(a) | The weighted average price does not take into account the shares issuable upon vesting of outstanding PUs or RSUs, which have no exercise price. |
(b) | Excluding shares reflected in the first column of this table. |
(c) | Includes our Omnibus Plan, which was approved by our shareholders in May 2006, our 2010 Omnibus Plan, as amended, which was approved by our shareholders in June 2010, and our Employee Stock Purchase Plan, which was approved by our shareholders in June 2016. |
(d) | Includes PUs calculated at target. |
(e) | Includes the following compensation plans that were not approved by our shareholders: our 1998 Employee Stock Option Plan and our Non-Employee Director Deferred Compensation Plan. No awards have been issued under these plans since May 2006 when our Omnibus Plan was approved. The unapproved plans and other individual compensation arrangements that were not approved by our shareholders with significant shares to be issued are described below: |
Our 1998 Employee Stock Option Plan (“1998 Plan”) provides for the grant of nonqualified options to purchase our shares to employees or employees of our affiliates, as determined by the Compensation Committee of our Board of Directors. The price at which shares may be purchased is based on the market price of the shares and cannot be less than the aggregate par value of the shares on the date the option was granted. Unless otherwise provided in an option agreement, no option may be exercised after one day less than 10 years from the date of vesting. All options under this plan are vested. Subsequent to the shareholder approval of our Omnibus Plan in May 2006, awards are no longer granted under the 1998 Plan.
Item 13. Certain Relationships and Related Transactions, and Director Independence
Pursuant to General Instruction G(3), information on certain relationships and related transactions and director independence is incorporated by reference from our Proxy Statement for the 2017 Annual General Meeting of Shareholders to be held on June 15, 2017.
Item 14. Principal Accounting Fees and Services
Pursuant to General Instruction G(3), information on principal accounting fees and services is incorporated by reference from our Proxy Statement for the 2017 Annual General Meeting of Shareholders to be held on June 15, 2017.
104
PART IV
Item 15. Exhibits, Financial Statement Schedules
(a) | The following documents are filed as part of this report or incorporated by reference: |
1. | The Consolidated Financial Statements of the Company listed on page 50 of this report. |
2. | The financial statement schedule on page 113 of this report. |
3. | The exhibits of the Company listed below under Item 15(b); all exhibits are incorporated herein by reference to a prior filing as indicated, unless designated by a dagger (†) or double dagger (††). |
(b) Exhibits:
Exhibit Number | Description | Original Filed Exhibit | File Number | |||
2.1 | Merger Agreement, dated April 2, 2014, between Weatherford Switzerland and Weatherford Ireland | Exhibit 2.1 of the Company's Current Report on Form 8-K filed April 2, 2014 | File No. 1-34258 | |||
3.1 | Memorandum and Articles of Association of Weatherford International public limited company | Exhibit 3.1 of the Company's Current Report on Form 8-K12B filed June 17, 2014 | File No. 1-36504 | |||
4.1 | Indenture, dated October 1, 2003, among Weatherford Bermuda, Weatherford Delaware, and Deutsche Bank Trust Company Americas | Exhibit 4.1 to the Company's Current Report on Form 8-K filed October 2, 2003 | File No. 1-31339 | |||
4.2 | First Supplemental Indenture, dated March 25, 2008, among Weatherford Bermuda, Weatherford Delaware and Deutsche Bank Trust Company Americas | Exhibit 4.1 to the Company's Current Report on Form 8-K filed March 25, 2008 | File No. 1-31339 | |||
4.3 | Second Supplemental Indenture, dated as of January 8, 2009, among Weatherford Bermuda Weatherford Delaware, and Deutsche Bank Trust Company Americas | Exhibit 4.1 to the Company's Current Report on Form 8-K filed January 8, 2009 | File No. 1-31339 | |||
4.4 | Third Supplemental Indenture, dated as of February 26, 2009, among Weatherford Bermuda, Weatherford Delaware, Weatherford Switzerland and Deutsche Bank Trust Company Americas | Exhibit 4.2 to the Company's Current Report on Form 8-K filed February 26, 2009 | File No. 1-34258 | |||
4.5 | Fourth Supplemental Indenture, dated as of September 23, 2010, among Weatherford Delaware, Weatherford Bermuda, Weatherford Switzerland, and Deutsche Bank Trust Company Americas | Exhibit 4.1 to the Company's Quarterly Report on Form 10-Q for the quarter ended September 30, 2010 filed November 2, 2010 | File No. 1-34258 | |||
4.6 | Fifth Supplemental Indenture, dated as of April 4, 2012, among Weatherford Delaware, Weatherford Bermuda, Weatherford Switzerland, and Deutsche Bank Trust Company Americas | Exhibit 4.1 to the Company's Current Report on Form 8-K filed April 4, 2012 | File No. 1-34258 | |||
4.7 | Sixth Supplemental Indenture, dated as of August 14, 2012, among Weatherford Delaware, Weatherford Bermuda, Weatherford Switzerland, and Deutsche Bank Trust Company Americas | Exhibit 4.1 to the Company's Current Report on Form 8-K filed August 14, 2012 | File No. 1-34258 | |||
4.8 | Seventh Supplemental Indenture, dated as of March 31, 2013, among Weatherford Delaware, Weatherford Bermuda, Weatherford Switzerland, and Deutsche Bank Trust Company Americas | Exhibit 4.1 to the Company's Quarterly Report on Form 10-Q for the quarter ended March 31, 2013 filed May 3, 2013 | File No. 1-34258 | |||
105
Exhibit Number | Description | Original Filed Exhibit | File Number | |||
4.9 | Eighth Supplemental Indenture, dated June 17, 2014, among Weatherford Ireland, Weatherford Bermuda, Weatherford Delaware and Deutsche Bank Trust Company Americas, as trustee, to the indenture dated as of October 1, 2003 | Exhibit 4.1 of the Company's Current Report on Form 8-K12B filed June 17, 2014 | File No. 1-36504 | |||
4.10 | Ninth Supplemental Indenture dated June 7, 2016 among Weatherford International Ltd. (Bermuda), Weatherford International plc (Ireland), and Weatherford International LLC (Delaware) and Deutsche Bank Trust Company Americas, as trustee, to the indenture dated as of October 1, 2003 | Exhibit 4.1 of the Company's Current Report on Form 8-K filed June 7, 2016 | File No. 1-36504 | |||
4.11 | Tenth Supplemental Indenture, dated June 17, 2016, among Weatherford International Ltd. (Bermuda), Weatherford International plc (Ireland), Weatherford International, LLC, (Delaware) and Deutsche Bank Trust Company Americas, as trustee | Exhibit 4.3 of the Company's Current Report on Form 8-K filed June 7, 2016 | File No. 1-36504 | |||
4.12 | Eleventh Supplemental Indenture, dated November 18, 2016, by and among Weatherford International Ltd., as issuer, Weatherford International plc, as guarantor, Weatherford International, LLC, as guarantor, and Deutsche Bank Trustee Company Americas, as trustee. | Exhibit 4.1 of the Company's Current Report on Form 8-K filed November 21, 2016 | File No. 1-36504 | |||
4.13 | Registration Rights Agreement, dated November 18, 2016, by and among Weatherford International plc, Weatherford International Ltd., Weatherford International, LLC and Morgan Stanley & Co. LLC | Exhibit 4.2 of the Company's Current Report on Form 8-K filed November 21, 2016 | File No. 1-36504 | |||
4.14 | Form of Warrant | Exhibit 4.3 of the Company's Current Report on Form 8-K filed November 21, 2016 | File No. 1-36504 | |||
4.15 | Indenture, dated June 18, 2007, among Weatherford Delaware, Weatherford Bermuda and Deutsche Bank Trust Company Americas | Exhibit 4.1 to the Company's Current Report on Form 8-K filed on June 18, 2007 | File No. 1-31339 | |||
4.16 | First Supplemental Indenture, dated June 18, 2007, among Weatherford Delaware, Weatherford Bermuda, and Deutsche Bank Trust Company Americas (including forms of notes) | Exhibit 4.2 to the Company's Current Report on Form 8-K filed on June 18, 2007 | File No. 1-31339 | |||
4.17 | Second Supplemental Indenture, dated as of February 26, 2009, among Weatherford Delaware, Weatherford Bermuda, Weatherford Switzerland, and Deutsche Bank Trust Company Americas | Exhibit 4.3 to the Company's Current Report on Form 8-K filed February 26, 2009 | File No. 1-31339 | |||
4.18 | Third Supplemental Indenture, dated as of August 14, 2012, among Weatherford Delaware, Weatherford Bermuda, Weatherford Switzerland and Deutsche Bank Trust Company Americas | Exhibit 4.2 to the Company's Current Report on Form 8-K filed August 14, 2012 | File No. 1-34258 | |||
4.19 | Fourth Supplemental Indenture, dated as of March 31, 2013, among Weatherford Delaware, Weatherford Bermuda, Weatherford Switzerland, and Deutsche Bank Trust Company Americas | Exhibit 4.2 to the Company's Quarterly Report on Form 10-Q for the quarter ended March 31, 2013 filed May 3, 2013 | File No. 1-34258 | |||
106
Exhibit Number | Description | Original Filed Exhibit | File Number | |||
4.20 | Fifth Supplemental Indenture, dated June 17, 2014, among Weatherford Ireland, Weatherford Bermuda, Weatherford Delaware and Deutsche Bank Trust Company Americas | Exhibit 4.2 of the Company's Current Report on Form 8-K12B filed June 17, 2014 | File No. 1-36504 | |||
4.21 | Officer’s Certificate, dated August 7, 2006, establishing the series of 6.50% Senior Notes due 2036 | Exhibit 4.1 to the Company's Current Report on Form 8-K filed August 7, 2006 | File No. 1-31339 | |||
4.22 | Form of $500,000,000 global note for 6.50% Senior Notes due 2036 | Exhibit 4.2 to the Company's Current Report on Form 8-K filed August 7, 2006 | File No. 1-31339 | |||
4.23 | Form of $100,000,000 global note for 6.50% Senior Notes due 2036 | Exhibit 4.3 to the Company's Current Report on Form 8-K filed August 7, 2006 | File No. 1-31339 | |||
4.24 | Form of Global Note for 6.35% Senior Notes due 2017 | Exhibit 4.16 to the Company's Registration Statement on Form S-4 filed November 8, 2007 | Reg. No. 333-146695 | |||
4.25 | Form of global note for 6.80% Senior Notes due 2037 | Exhibit 4.17 to the Company's Registration Statement on Form S-4 filed November 8, 2007 | Reg. No. 333-146695 | |||
4.26 | Form of global note for 6.00% Senior Notes due 2018 | Exhibit 4.3 to the Company's Current Report on Form 8-K filed March 25, 2008 | File No. 1-31339 | |||
4.27 | Form of global note for 7.00% Senior Notes due 2038 | Exhibit 4.4 to the Company's Current Report on Form 8-K filed March 25, 2008 | File No. 1-31339 | |||
4.28 | Form of global note for 9.625% Senior Notes due 2019 | Exhibit 4.2 to the Company's Current Report on Form 8-K filed January 8, 2009 | File No. 1-31339 | |||
4.29 | Form of global note for 9.875% Senior Notes due 2039 | Exhibit 4.1 to the Company's Current Report on Form 8-K filed January 8, 2009 | File No. 1-31339 | |||
4.30 | Form of global note for 5.125% Senior Notes due 2020 | Exhibit 4.3 to the Company's Current Report on Form 8-K filed September 22, 2010 | File No. 1-34258 | |||
4.31 | Form of global note for 6.750% Senior Notes due 2040 | Exhibit 4.4 to the Company's Current Report on Form 8-K filed September 22, 2010 | File No. 1-34258 | |||
4.32 | Form of global note for 4.50% Senior Notes due 2022 | Exhibit 4.2 to the Company's Current Report on Form 8-K filed April 4, 2012 | File No. 1-34258 | |||
4.33 | Form of global note for 5.95% Senior Notes due 2042 | Exhibit 4.3 to the Company's Current Report on Form 8-K filed April 4, 2012 | File No. 1-34258 | |||
107
Exhibit Number | Description | Original Filed Exhibit | File Number | |||
4.34 | Form of global note for 5.875% Exchangeable Senior Notes due 2021 | Exhibit A of Exhibit 4.1 to the Company's Current Report on Form 8-K filed June 7, 2016 | File No. 1-36504 | |||
4.35 | Form of global note for 7.75% Senior Notes due 2021 | Annex A of Exhibit 4.1 to the Company's Current Report on Form 8-K filed June 7, 2016 | File No. 1-36504 | |||
4.36 | Form of global note for 8.25% Senior Notes due 2023 | Annex B of Exhibit 4.1 to the Company's Current Report on Form 8-K filed June 7, 2016 | File No. 1-36504 | |||
4.37 | Form of guarantee notation | Exhibit 4.5 to the Company's Current Report on Form 8-K filed September 22, 2010 | File No. 1-34258 | |||
4.38 | Form of guarantee notation | Exhibit 4.4 to the Company's Current Report on Form 8-K filed April 4, 2012 | File No. 1-34258 | |||
*10.1 | Weatherford International Ltd. Nonqualified Executive Retirement Plan, amended and restated effective December 31, 2008 | Exhibit 10.8 to the Company's Current Report on Form 8-K filed December 31, 2008 | File No. 1-31339 | |||
*10.2 | Weatherford International Ltd. Non-Employee Director Retirement Plan, as amended and restated effective December 31, 2008 | Exhibit 10.6 to the Company's Current Report on Form 8-K filed December 31, 2008 | File No. 1-31339 | |||
*10.3 | Weatherford International Ltd. Supplemental Executive Retirement Plan, effective January 1, 2010 | Exhibit 10.2 to the Company's Current Report on Form 8-K filed December 31, 2009 | File No. 1-34258 | |||
*10.4 | First Amendment to the Weatherford International Ltd. Supplemental Executive Retirement Plan, effective March 31, 2010 | Exhibit 10.1 to the Company's Current Report on Form 8-K filed March 23, 2010 | File No. 1-34258 | |||
*10.5 | Second Amendment to the Weatherford International Ltd. Supplemental Executive Retirement Plan, effective April 8, 2010 | Exhibit 10.1 to the Company's Current Report on Form 8-K filed April 9, 2010 | File No. 1-34258 | |||
*10.6 | Third Amendment to the Weatherford International Ltd. Supplemental Executive Retirement Plan (as amended on June 16, 2014) | Exhibit 10.10 of the Company's Current Report on Form 8-K12B filed June 17, 2014 | File No. 1-36504 | |||
*10.7 | Weatherford International, Inc. 1998 Employee Stock Option Plan, as amended, including form of agreement for officers | Exhibit 10.18 to the Company's Annual Report on Form 10-K for the year ended December 31, 2003 filed March 10, 2004 | File No. 1-13086 | |||
*10.8 | Deed Poll of Assumption, dated June 16, 2014, executed by Weatherford Ireland | Exhibit 10.3 of the Company's Current Report on Form 8-K12B filed June 17, 2014 | File No. 1-36504 | |||
108
Exhibit Number | Description | Original Filed Exhibit | File Number | |||
*10.9 | Weatherford International plc 2006 Omnibus Incentive Plan (as amended and restated, conformed as of June 16, 2015) | Exhibit 10.2 of the Company's Quarterly Report on Form 10-Q for the quarter ended June 30, 2015 filed July 24, 2015 | File No. 1-36504 | |||
*10.10 | Form of Restricted Share Unit Award Agreement pursuant to Weatherford International plc 2006 Omnibus Incentive Plan | Exhibit 10.5 of the Company's Current Report on Form 8-K12B filed June 17, 2014 | File No. 1-36504 | |||
*10.11 | Form of Stock Option Agreement for Officers pursuant to Weatherford International plc 2006 Omnibus Incentive Plan | Exhibit 10.46 to the Company's Annual Report on Form 10-K for the year ended December 31, 2006 filed February 23, 2007 | File No. 1-31339 | |||
*10.12 | Weatherford International, Inc. Executive Deferred Compensation Stock Ownership Plan, as amended and restated effective December 31, 2008 | Exhibit 10.3 to the Company's Current Report on Form 8-K filed December 31, 2008 | File No. 1-31339 | |||
*10.13 | First Amendment to the Weatherford International, Inc. Executive Deferred Compensation Stock Ownership Plan | Exhibit 10.1 of the Company's Current Report on Form 8-K filed April 2, 2014 | File No. 1-34258 | |||
*10.14 | Weatherford International Ltd. Deferred Compensation Plan for Non-Employee Directors, as amended and restated effective December 31, 2008 | Exhibit 10.5 to the Company's Current Report on Form 8-K filed December 31, 2008 | File No. 1-31339 | |||
*10.15 | Weatherford International plc 2010 Omnibus Incentive Plan (as amended and restated) | Exhibit 10.6 of the Company's Current Report on Form 8-K12B filed June 17, 2014 | File No. 1-36504 | |||
*10.16 | First Amendment to Weatherford International plc 2010 Omnibus Incentive Plan | Annex A of the Company's Definitive Proxy Statement on Schedule 14A filed April 29, 2015 | File No. 1-36504 | |||
*10.17 | Form of Restricted Share Unit Award Agreement pursuant to Weatherford International plc 2010 Omnibus Incentive Plan | Exhibit 10.7 of the Company's Current Report on Form 8-K12B filed June 17, 2014 | File No. 1-36504 | |||
*10.18 | Form of Performance Unit Award Agreement pursuant to Weatherford International plc 2010 Omnibus Incentive Plan | Exhibit 10.1 of the Company's Quarterly Report on Form 10-Q for the quarter ended March 31, 2015 filed April 24, 2015 | File No. 1-36504 | |||
*10.19 | Form of Restricted Share Units Award Agreement (CIC - Officer) pursuant to the Weatherford International plc 2010 Omnibus Incentive Plan | Exhibit 10.21 of the Company Annual Report on Form 10-K filed February 16, 2016 | File No. 1-36504 | |||
*10.20 | Form of Restricted Share Units Award Agreement (CIC - Director) pursuant to the Weatherford International plc 2010 Omnibus Incentive Plan | Exhibit 10.5 of the Company's Quarterly Report on Form 10-Q for the quarter ended June 30, 2015 filed July 24, 2015 | File No. 1-36504 | |||
109
Exhibit Number | Description | Original Filed Exhibit | File Number | |||
*10.21 | Forms of Annex (Relative TSR and Absolute TSR) to Performance Unit Award Agreements for use under the Weatherford International plc 2010 Omnibus Incentive Plan | Exhibit 10.1 to the Company's Current Report on Form 8-K filed February 22, 2012 | File No. 1-34258 | |||
*10.22 | Form of addendum for use with certain equity grants under the Weatherford International plc 2010 Omnibus Incentive Plan | Exhibit 10.26 to the Company's Annual Report on Form 10-K filed February 17, 2015 | File No. 1-36504 | |||
*10.23 | Form of Restricted Share Unit Award Agreement - U.K. pursuant to Weatherford International plc 2010 Omnibus Incentive Plan | Exhibit 10.9 of the Company's Current Report on Form 8-K12B filed June 17, 2014 | File No. 1-36504 | |||
*10.24 | Form of Performance Unit Award Agreement pursuant to Weatherford International plc 2010 Omnibus Incentive Plan | Exhibit 10.1 to the Company's Current Report on Form 8-K filed February 22, 2011 | File No. 1-34258 | |||
*10.25 | Form of Performance Unit Award Agreement pursuant to Weatherford International plc 2010 Omnibus Incentive Plan (Shareholder Return) | Exhibit 10.2 to the Company's Current Report on Form 8-K filed March 4, 2014 | File No. 1-34258 | |||
*10.26 | Form of Performance Units Award Agreement (CIC) pursuant to the Weatherford International plc 2010 Omnibus Incentive Plan | Exhibit 10.28 of the Company's Annual Report on Form 10-K filed February 16, 2016 | File No. 1-36504 | |||
*10.27 | Weatherford International Ltd. (Switzerland) Executive Non-Equity Incentive Compensation Plan (as amended and restated, February 27, 2014) to be effective January 1, 2014 | Exhibit 10.1 of the Company's Current Report on Form 8-K filed March 4, 2014 | File No. 1-34258 | |||
*10.28 | Form of Amended and Restated Employment Agreement entered into by Bernard J. Duroc-Danner (April 10, 2010) | Exhibit 10.1 to the Company's Current Report on Form 8-K filed April 13, 2010 | File No. 1-34258 | |||
*10.29 | Executive Employment Agreement, dated June 20, 2013, between Weatherford International Ltd. and Douglas M. Mills | Exhibit 10.1 to the Company's Quarterly Report on Form 10-Q for the quarter ended June 30, 2013 filed July 31, 2013 | File No. 1-34258 | |||
*10.30 | Executive Employment Agreement, dated November 4, 2013, between Weatherford International Ltd. and Krishna Shivram | Exhibit 10.1 to the Company's Current Report on Form 8-K filed November 4, 2013 | File No. 1-34258 | |||
*10.31 | Form of Amended and Restated Executive Employment Agreement entered into by Antony J. Branch and Lance R. Marklinger, dated December, 22, 2014 | Exhibit 10.33 of the Company's Annual Report on Form 10-K filed February 16, 2016 | File No. 1-36504 | |||
*10.32 | Form of Restricted Share Award Agreement, dated November 6, 2013, between Weatherford International Ltd. and Krishna Shivram | Exhibit 10.3 to the Company's Current Report on Form 8-K filed November 4, 2013 | File No. 1-34258 | |||
110
Exhibit Number | Description | Original Filed Exhibit | File Number | |||
*10.33 | Form of Change of Control Agreement, entered into by Christina Ibrahim (May 4, 2015), Mario Ruscev (March 25, 2016), Christoph Bausch and Frederico Justus (December 13, 2016) | Exhibit 10.1 of the Company's Current Report on Form 8-K filed December 15, 2016 | File No. 1-36504 | |||
*10.34 | Form of Deed of Indemnity of Weatherford Ireland entered into by each director of Weatherford Ireland and each of the following executive officers of Weatherford Ireland: Bernard J. Duroc-Danner, Krishna Shivram, Douglas M. Mills, Antony J. Branch, Lance R. Marklinger (June 17, 2014), Christina Ibrahim (May 4, 2015), Christoph Bausch and Frederico Justus (December 13, 2016) | Exhibit 10.11 of the Company's Current Report on Form 8-K12B filed June 17, 2014 | File No. 1-36504 | |||
*10.35 | Form of Deed of Indemnity of Weatherford Bermuda entered into by each director of Weatherford Ireland and each of the following executive officers of Weatherford Ireland: Bernard J. Duroc-Danner, Krishna Shivram, Douglas M. Mills, Antony J. Branch, Lance R. Marklinger (June 17, 2014), Christina Ibrahim (May 4, 2015), Christoph Bausch and Frederico Justus (December 13, 2016) | Exhibit 10.12 of the Company's Current Report on Form 8-K12B filed June 17, 2014 | File No. 1-36504 | |||
*10.36 | Form of Employment Agreement Assignment Letter by Weatherford Management Company Switzerland LLC, Weatherford Switzerland, Weatherford Ireland and the following executive officers of Weatherford Ireland: Krishna Shivram and Douglas M. Mills (June 16, 2014) | Exhibit 10.13 of the Company's Current Report on Form 8-K12B filed June 17, 2014 | File No. 1-36504 | |||
*10.37 | Form of Secondment Letter entered into by Weatherford Management Company Switzerland LLC, Weatherford U.S., L.P. and the following executive officers of Weatherford Ireland: Krishna Shivram and Douglas M. Mills (June 16, 2014) | Exhibit 10.14 of the Company's Current Report on Form 8-K12B filed June 17, 2014 | File No. 1-36504 | |||
10.38 | Amendment and Restatement Agreement, dated May 4, 2016, by and among Weatherford International plc (Ireland), Weatherford International Ltd. (Bermuda), as the Borrower, Weatherford International, LLC (Delaware), the lenders party thereto and JPMorgan Chase Bank, N.A., as administrative agent | Exhibit 10.1 of the Company's Current Report on Form 8-K filed May 10, 2016 | File No. 1-36504 | |||
10.39 | Amended and Restated Credit Agreement, effective as of May 9, 2016, by and among Weatherford International Ltd. (Bermuda), Weatherford International plc (Ireland), the other borrowers party thereto, the lenders party thereto and JPMorgan Chase Bank, N.A., as administrative agent | Exhibit 10.2 of the Company's Current Report on Form 8-K filed May 10, 2016 | File No. 1-36504 | |||
10.40 | Amendment No. 1 to Amended and Restated Credit Agreement, dated July 19, 2016, among Weatherford International Ltd. (Bermuda), Weatherford International plc (Ireland), the lenders party thereto and JPMorgan Chase Bank, N.A., as administrative agent | Exhibit 10.1 of the Company's Current Report on Form 8-K filed July 22, 2016 | File No. 1-36504 | |||
10.41 | Term Loan Agreement, dated May 4, 2016, by and among Weatherford International Ltd. (Bermuda), as the borrower, Weatherford International plc, (Ireland), the lenders party thereto and JPMorgan Chase Bank, N.A., as administrative agent for the lenders | Exhibit 10.3 of the Company's Current Report on Form 8-K filed May 10, 2016 | File No. 1-36504 | |||
111
Exhibit Number | Description | Original Filed Exhibit | File Number | |||
10.42 | Amendment No. 1 to Term Loan Agreement, dated July 19, 2016, among Weatherford International Ltd. (Bermuda), Weatherford International plc (Ireland), the lenders party thereto and JPMorgan Chase Bank, N.A., as administrative agent | Exhibit 10.2 of the Company's Current Report on Form 8-K filed July 22, 2016 | File No. 1-36504 | |||
10.43 | U.S. Pledge and Security Agreement, dated as of May 9, 2016, by and among the subsidiary parties thereto and JPMorgan Chase Bank, N.A., as administrative agent of the Term Loan Agreement, dated May 4, 2016 | Exhibit 10.4 of the Company's Current Report on Form 8-K filed May 10, 2016 | File No. 1-36504 | |||
10.44 | Guaranty Agreement, dated as of May 9, 2016, by Weatherford International plc (Ireland) and certain subsidiary parties thereto, as guarantors, in favor of JPMorgan Chase Bank, N.A., as administrative agent of the Amended and Restated Credit Agreement, effective as of May 9, 2016 | Exhibit 10.5 of the Company's Current Report on Form 8-K filed May 10, 2016 | File No. 1-36504 | |||
10.45 | Guaranty Agreement, dated as of May 9, 2016, by Weatherford International plc (Ireland) and certain subsidiary parties thereto, as guarantors, in favor of JPMorgan Chase Bank, N.A., as administrative agent of the Term Loan Agreement, dated as of May 4, 2016 | Exhibit 10.6 of the Company's Current Report on Form 8-K filed May 10, 2016 | File No. 1-36504 | |||
†12.1 | Ratio of Earnings to Fixed Charges | |||||
†21.1 | Subsidiaries of Weatherford International plc | |||||
†23.1 | Consent of KPMG LLP | |||||
†31.1 | Certification of Chief Executive Officer pursuant to Section 302 of the Sarbanes-Oxley Act of 2002 | |||||
†31.2 | Certification of Chief Financial Officer pursuant to Section 302 of the Sarbanes-Oxley Act of 2002 | |||||
††32.1 | Certification of Chief Executive Officer pursuant to Section 906 of the Sarbanes-Oxley Act of 2002 | |||||
††32.2 | Certification of Chief Financial Officer pursuant to Section 906 of the Sarbanes-Oxley Act of 2002 | |||||
**101 | The following materials from Weatherford International plc's Annual Report on Form 10-K for the year ended December 31, 2016, formatted in XBRL (eXtensible Business Reporting Language): (1) the Consolidated Balance Sheets, (2) the Consolidated Statements of Operations, (3) the Consolidated Statements of Comprehensive Income (Loss), (4) the Consolidated Statements of Shareholders' Equity, (5) the Consolidated Statements of Cash Flows, and (6) the related notes to the Consolidated Financial Statements | |||||
* Management contract or compensatory plan or arrangement.
** Submitted pursuant to Rule 405 and 406T of Regulation S-T.
† Filed herewith.
†† Furnished herewith.
As permitted by Item 601(b)(4)(iii)(A) of Regulation S-K, the Company has not filed with this Annual Report on Form 10-K certain instruments defining the rights of holders of long-term debt of the Company and its subsidiaries because the total amount of securities authorized under any of such instruments does not exceed 10% of the total assets of the Company and its subsidiaries on a consolidated basis. We will furnish a copy of any of such instruments to the Securities and Exchange Commission upon request.
112
We will furnish to any requesting shareholder a copy of any of the above named exhibits upon the payment of our reasonable expenses of obtaining, duplicating and mailing the requested exhibits. All requests for copies of exhibits should be made in writing to our U.S. Investor Relations Department at 2000 St James Place, Houston, TX 77056.
Item 16. Form 10-K Summary
None.
Financial Statement Schedules
1. | Valuation and qualifying accounts and allowances. |
SCHEDULE II
WEATHERFORD INTERNATIONAL PLC AND SUBSIDIARIES
VALUATION AND QUALIFYING ACCOUNTS AND ALLOWANCES
FOR THE THREE YEARS ENDED DECEMBER 31, 2016
Balance at | (Recovery) | Balance at | |||||||||||||
Beginning | and | Other | End of | ||||||||||||
(Dollars in millions) | of Period | Expense | Additions | Reductions (a) (b) | Period | ||||||||||
Year Ended December 31, 2016: | |||||||||||||||
Allowance for uncollectible accounts receivable | 113 | 69 | — | (53 | ) | 129 | |||||||||
Valuation allowance on deferred tax assets | 868 | 872 | — | (2 | ) | 1,738 | |||||||||
Year Ended December 31, 2015: | |||||||||||||||
Allowance for uncollectible accounts receivable | 108 | 48 | (1 | ) | (42 | ) | 113 | ||||||||
Valuation allowance on deferred tax assets | 732 | 159 | — | (23 | ) | 868 | |||||||||
Year Ended December 31, 2014: | |||||||||||||||
Allowance for uncollectible accounts receivable | 106 | 32 | (4 | ) | (26 | ) | 108 | ||||||||
Valuation allowance on deferred tax assets | 554 | 222 | — | (44 | ) | 732 | |||||||||
(a) | Includes write-offs and amounts reclassified to assets held for sale. |
(b) | Other reductions for valuation allowance on deferred taxes primarily due to currency translation. |
All other schedules are omitted because they are not required or because the information is included in the financial statements or the related notes.
113
SIGNATURES
Pursuant to the requirements of Section 13 or 15(d) of the Securities Exchange Act of 1934, the Registrant has duly caused this Report to be signed on its behalf by the undersigned, thereunto duly authorized, on February 14, 2017.
Weatherford International plc
/s/ Krishna Shivram
Krishna Shivram
Chief Executive Officer
(Principal Executive Officer)
Pursuant to the requirements of the Securities Exchange Act of 1934, this Report has been signed by the following persons on behalf of the Registrant and in the capacities and on the dates indicated.
Signatures | Title | Date |
/s/ Krishna Shivram | Chief Executive Officer | February 14, 2017 |
Krishna Shivram | (Principal Executive Officer) | |
/s/ Christoph Bausch | Executive Vice President and | February 14, 2017 |
Christoph Bausch | Chief Financial Officer | |
(Principal Financial Officer) | ||
/s/ Doug M. Mills | Vice President and | February 14, 2017 |
Doug M. Mills | Chief Accounting Officer | |
(Principal Accounting Officer) | ||
/s/ Mohamed A. Awad | Director | February 14, 2017 |
Mohamed A. Awad | ||
/s/ David J. Butters | Director | February 14, 2017 |
David J. Butters | ||
/s/John D. Gass | Director | February 14, 2017 |
John D. Gass | ||
/s/Francis S. Kalman | Director | February 14, 2017 |
Francis S. Kalman | ||
/s/ William E. Macaulay | Director | February 14, 2017 |
William E. Macaulay | ||
/s/ Robert K. Moses, Jr. | Director | February 14, 2017 |
Robert K. Moses, Jr. | ||
/s/Guillermo Ortiz | Director | February 14, 2017 |
Guillermo Ortiz | ||
/s/ Emyr Jones Parry | Director | February 14, 2017 |
Emyr Jones Parry | ||
/s/Robert A. Rayne | Director | February 14, 2017 |
Robert A. Rayne | ||
114