Attached files
| file | filename |
|---|---|
| 8-K - Walker & Dunlop, Inc. | wd-20170208x8k.htm |
Exhibit 99.1

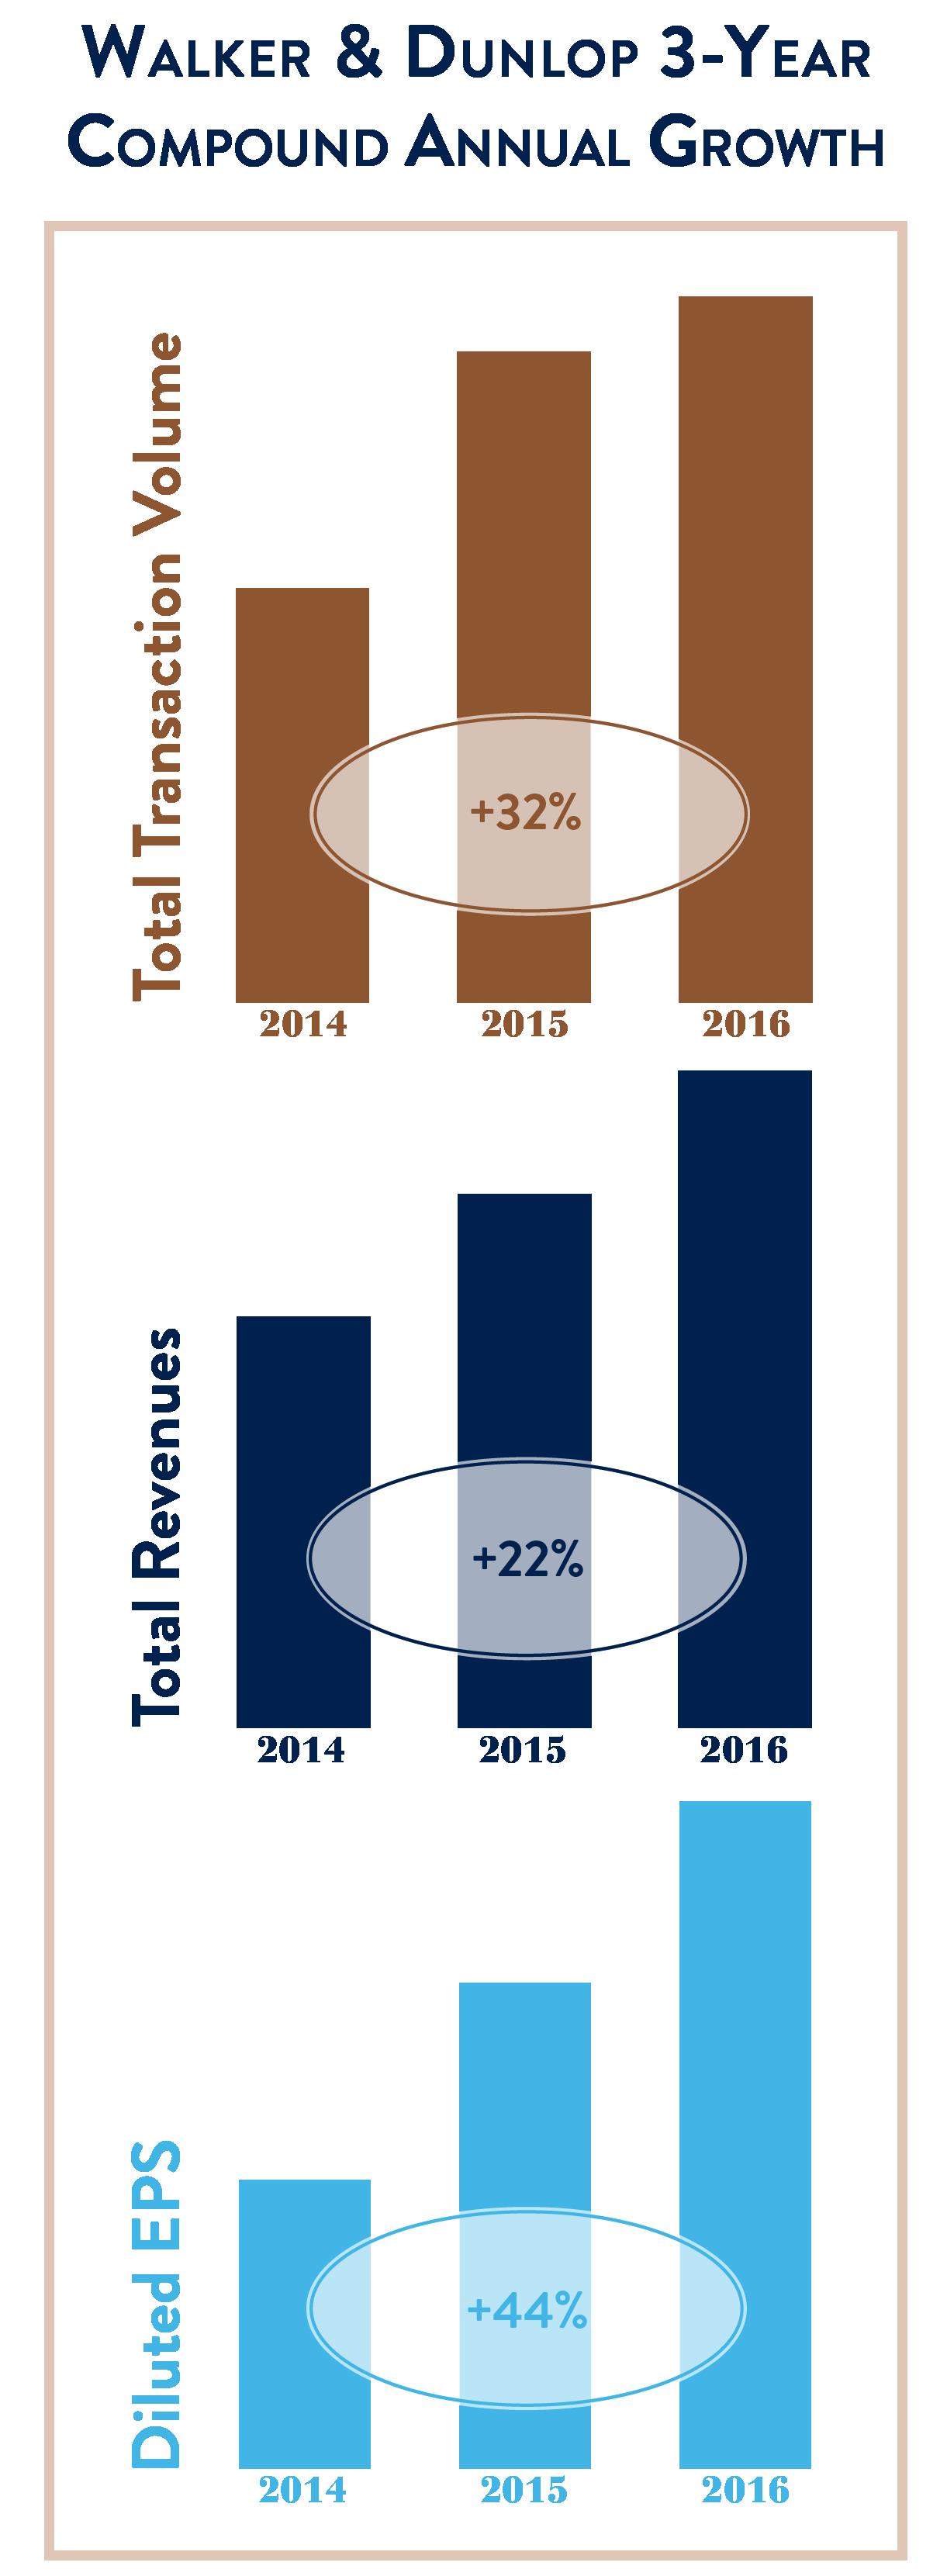
Walker & Dunlop Caps Record Year with 80% Growth in Fourth Quarter Earnings
2016 Marks the Third Straight Year of Greater Than 30% Growth in Diluted EPS
|
FOURTH QUARTER 2016 HIGHLIGHTS |
|
|
|
|
|
|
|
● |
Total revenues of $178.4 million, up 47% from Q4’15 |
|
|
● |
Net income of $36.8 million, or $1.16 per diluted share, up 80% from Q4’15 |
|
|
● |
Adjusted EBITDA1 of $34.6 million, up 19% from Q4’15 |
|
|
● |
Total transaction volume of $6.3 billion, up 34% from Q4’15 |
|
|
|
|
|
|
FULL YEAR 2016 HIGHLIGHTS |
||
|
|
|
|
|
● |
Total revenues of $575.3 million, up 23% over 2015 |
|
|
● |
Net income of $113.9 million or $3.65 per diluted share, up 39% over 2015 |
|
|
● |
Total transaction volume of $19.3 billion, up 9% over 2015 |
|
|
● |
Operating Margin of 32% compared to 29% in 2015 |
|
|
● |
Increased number of mortgage bankers and investment sales brokers by 29% since Q1’16 |
|
|
● |
Servicing portfolio of $63.1 billion at December 31, 2016, up 26% from December 31, 2015 |
|
|
● |
Repurchased $9.2 million of stock during 2016; Board reauthorized share repurchases of up to $75 million over the next 12 months |
|
|
|
|
|
|
Bethesda, MD – February 8, 2017 – Walker & Dunlop, Inc. (NYSE: WD) (the “Company”) reported fourth quarter and full-year 2016 results, adding $1.00 in earnings per diluted share year over year. Total revenues were $178.4 million for the fourth quarter 2016, a 47% increase over the fourth quarter 2015. Net income increased 80% from the fourth quarter 2015 to $36.8 million, or $1.16 per diluted share. Adjusted EBITDA for the fourth quarter 2016 was $34.6 million compared to $29.0 million for the fourth quarter 2015, a 19% increase. Net income for 2016 increased 39% to $113.9 million, or $3.65 per diluted share, from $82.1 million, or $2.65 per diluted share, for 2015. Total revenues were $575.3 million, a 23% increase from 2015 and well above the Company’s goal of $500 million. Adjusted EBITDA for 2016 was $129.9 million compared to $124.3 million in 2015, a 5% increase. |
||
1
"Walker & Dunlop's growth and financial performance continue to outpace the market by broad margins," commented Willy Walker, Chairman and CEO. "This was the second consecutive year adding $1.00 or more in EPS, reflective of the highly profitable business model that underpins Walker & Dunlop's growth. Over the past three years, our origination volumes have increased at a compound annual growth rate of 26%, twice the rate of the commercial real estate financing market, resulting in annual growth in revenues and earnings of 22% and 40%, respectively. Our team of financing professionals, national platform, well-known brand and loyal client base are building off one another, creating new growth opportunities and generating fantastic financial performance."
FOURTH QUARTER 2016 OPERATING RESULTS
TOTAL REVENUES were $178.4 million for the fourth quarter 2016 compared to $121.4 million for the fourth quarter 2015. The 47% increase was driven by the mix of loans originated during the quarter, which included increased lending with Fannie Mae and HUD, and increased servicing fees due to the growth in our servicing portfolio. Fannie Mae and HUD loan originations, our most profitable executions, comprised 48% of loan origination volume in the fourth quarter 2016 compared to 33% in the fourth quarter 2015, which drove the growth in gains from mortgage banking activities.
GAINS FROM MORTGAGE BANKING ACTIVITIES for the fourth quarter 2016 were $117.8 million compared to $77.0 million for the fourth quarter 2015, a 53% increase. GAINS ATTRIBUTABLE TO MORTGAGE SERVICING RIGHTS (“MSRs”) were $65.1 million for the fourth quarter 2016, an 80% increase from $36.1 million for the fourth quarter 2015. LOAN ORIGINATION FEES were $52.7 million for the fourth quarter 2016 compared to $40.8 million for the fourth quarter 2015, a 29% increase.
SERVICING FEES were $39.4 million for the fourth quarter 2016 compared to $30.5 million for the fourth quarter 2015. The 29% increase in servicing fees was driven by the continued growth of the portfolio resulting from strong loan origination activity and the acquisition of a large HUD servicing portfolio in the second quarter 2016.
NET WAREHOUSE INTEREST INCOME, which includes net interest earned on loans held for sale and loans held for investment (the Company’s on balance sheet interim loan portfolio), was $7.8 million for the fourth quarter 2016, a 27% increase from $6.1 million for the fourth quarter 2015. The increase in net warehouse interest income was a result of an increase in the average balance of loans held for sale from $1.1 billion for the fourth quarter 2015 to $1.7 billion for the fourth quarter 2016.
TOTAL EXPENSES were $117.2 million for the fourth quarter 2016 compared to $87.5 million for the fourth quarter 2015, a 34% increase, which was primarily driven by a 49% increase in personnel costs due to increased average headcount and increased variable compensation costs, a product of the Company’s record financial performance. As a percentage of total revenues, personnel expense was 41% during the fourth quarter 2016, in line with the prior year fourth quarter. Additionally, amortization and depreciation costs increased 25% due to the growth of the servicing portfolio year over year.
PROVISION FOR CREDIT LOSSES was a benefit of $0.8 million for the fourth quarter 2016 compared to an expense of $1.1 million for the fourth quarter 2015. The benefit is due to the receipt of a $0.8 million cash recovery that reduced the losses on two previously settled defaults. NET WRITE-OFFS during the fourth quarter 2016 was a benefit of $0.8 million due to the recovery payment noted above compared to zero in the fourth quarter 2015. We had no loans delinquent or in default in our at-risk portfolio at December 31, 2016.
OPERATING MARGIN was 34% for the fourth quarter 2016, up from 28% for the fourth quarter 2015. The increase in operating margin was driven by the scale of our transaction and servicing platform and efficient operation of the business, which drove total revenues up 47%, while total expenses grew only 34%.
NET INCOME was $36.8 million, or $1.16 per diluted share, for the fourth quarter 2016 compared to net income of $20.4 million, or $0.67 per diluted share, for the fourth quarter 2015. The 80% increase in net income was driven by increased gains from mortgage banking activities and growth in servicing fees, partially offset by increases in personnel costs and amortization and depreciation.
2
ADJUSTED EBITDA was $34.6 million for the fourth quarter 2016 compared to $29.0 million for the fourth quarter 2015. The 19% increase was driven by increases in loan origination and servicing fees, partially offset by the increase in personnel costs.
ANNUALIZED RETURN ON EQUITY was 25% for the fourth quarter 2016, up from 17% for the fourth quarter 2015. In the fourth quarter 2016, return on equity benefitted from increased total revenues and net income.
2016 OPERATING RESULTS
TOTAL REVENUES were $575.3 million for 2016 compared to $468.2 million for 2015, a 23% increase. The increase in total revenues was largely driven by a 44% increase in MSRs, an 11% increase in origination fees, and a 23% increase in servicing fees.
GAINS FROM MORTGAGE BANKING ACTIVITIES increased 26% to $367.2 million in 2016 compared to $290.5 million for the prior year, as the mix and type of loans originated changed, and the volume of loan originations increased. MSRs were $192.8 million for 2016 compared to $133.6 million for 2015, a 44% increase. LOAN ORIGINATION FEES were $174.4 million for 2016 compared to $156.8 million for the prior year, an 11% increase.
SERVICING FEES were $140.9 million in 2016, up 23% from $114.8 million the prior year, as a result of the 26% growth in the servicing portfolio.
NET WAREHOUSE INTEREST INCOME for 2016 was $23.7 million, down slightly from $24.0 million due to a 20% decrease in the average unpaid principal balance of loans held for investment from 2015 to 2016.
TOTAL EXPENSES for 2016 were $389.5 million compared to $332.8 million for the prior year, a 17% increase. The increase in total expenses was due primarily to increased personnel costs and amortization and depreciation expense. Personnel expense as a percentage of total revenues for 2016 was 40% compared to 39% in 2015.
PROVISION FOR CREDIT LOSSES was a benefit of $0.6 million in 2016 compared to a charge of $1.6 million in 2015.
OPERATING MARGIN for 2016 was 32% compared to an operating margin of 29% for 2015. The lift in operating margin was driven by significant growth in gains from mortgage servicing rights, which are not subject to our variable compensation arrangements, and growth in our servicing portfolio and related servicing fee income, which is a highly scalable component of our business. As a result, total revenues grew 23% while total expenses increased only 17%.
NET INCOME was $113.9 million, or $3.65 per diluted share, for 2016 compared to net income of $82.1 million, or $2.65 per diluted share for 2015. The 39% increase in net income was driven by increased gains from mortgage banking activities and growth in servicing fees, partially offset by increases in personnel costs and amortization and depreciation.
ADJUSTED EBITDA was $129.9 million for 2016 compared to $124.3 million for 2015, a 5% increase. The increase was driven by growth in cash earnings such as servicing fees, investment sales revenues, and escrow income, offset by the increase in personnel expenses.
RETURN ON EQUITY was 21% for 2016, up from 19% for 2015, driven by the year-over-year increase in total revenues and net income.
3
FOURTH QUARTER AND FULL YEAR 2016 TOTAL TRANSACTION VOLUME
TOTAL TRANSACTION VOLUME for the fourth quarter 2016 was $6.3 billion, up 34% from $4.7 billion for the fourth quarter 2015. Total transaction volume includes loan origination and investment sales volumes. LOAN ORIGINATION VOLUME was up 22% from the fourth quarter 2015 to $5.3 billion. Loan originations with Fannie Mae were $2.3 billion, an increase of 81% from the fourth quarter 2015. Brokered loan originations totaled $1.3 billion, a 38% increase from the fourth quarter 2015. Loan originations with Freddie Mac were $1.2 billion, a 35% decrease from the fourth quarter 2015. HUD loan originations totaled $261.2 million, a 49% increase from the fourth quarter 2015. Interim loan originations were $184.6 million, a 360% increase from the fourth quarter 2015. INVESTMENT SALES VOLUME was $1.0 billion for the fourth quarter 2016 compared to $376.3 million for the fourth quarter 2015, a 167% increase.
TOTAL TRANSACTION VOLUME for 2016 was $19.3 billion, up 9% from $17.8 billion for 2015. LOAN ORIGINATION VOLUME for 2016 was $16.7 billion, up 3% from $16.2 billion in 2015. The $485.0 million increase in loan origination volume was driven primarily by a 40% increase in lending with Fannie Mae, a 49% increase in lending with HUD, and a 127% increase in interim lending, partially offset by a 33% decrease in lending with Freddie Mac. INVESTMENT SALES VOLUME of $2.6 billion in 2016 was an increase of 69% from $1.5 billion for the eight months we operated our investment sales business in 2015.
STOCK BUYBACK PROGRAM
On February 9, 2016, the Company's Board of Directors authorized the repurchase of up to $75.0 million of its outstanding common stock over a one-year period. During this one-year period, the company repurchased 396,357 shares for $9.2 million. On February 7, 2017, the Company’s Board of Directors reauthorized the repurchase of up to $75.0 million of the Company’s outstanding common stock over the coming one-year period.
Purchases made pursuant to the program will be made in the open market or in privately negotiated transactions from time to time as permitted by federal securities laws and other legal requirements. The timing, manner, price and amount of any repurchases will be determined by the Company in its discretion and will be subject to economic and market conditions, stock price, applicable legal requirements and other factors. The repurchase program may be suspended or discontinued at any time.
SERVICING PORTFOLIO
The SERVICING PORTFOLIO totaled $63.1 billion at December 31, 2016, an increase of 26% from $50.2 billion at December 31, 2015. During the fourth quarter 2016, there were $4.0 billion of net loan additions to the servicing portfolio. At December 31, 2016, the weighted average remaining term of the portfolio increased to 10.3 years, compared to 9.6 years in the fourth quarter 2015, and the WEIGHTED AVERAGE SERVICING FEE increased to 26 basis points from 25 basis points at December 31, 2015.
CREDIT QUALITY
The Company’s AT RISK SERVICING PORTFOLIO, which is comprised of loans subject to a defined risk-sharing formula, was $24.1 billion at December 31, 2016 compared to $19.5 billion at December 31, 2015. There were no 60+ DAY DELINQUENCIES or defaults in the Company’s at risk servicing portfolio at December 31, 2016.
The on-balance sheet INTERIM LOAN PORTFOLIO, which is comprised of loans for which Walker & Dunlop has full risk of loss, was $222.3 million at December 31, 2016 compared to $233.4 million at December 31, 2015. All of the Company’s interim loans are current and performing at December 31, 2016.
4
1 Adjusted EBITDA is a non-GAAP financial measure the Company presents to help investors better understand our operating performance. For a reconciliation of adjusted EBITDA to net income, refer to the sections of this press release below titled “Non-GAAP Financial Measures” and “Adjusted Financial Metric Reconciliation to GAAP.”
Conference Call Information
The Company will host a conference call to discuss its quarterly results on Wednesday, February 8, 2017 at 8:30 a.m. Eastern time. Analysts and investors interested in participating are invited to call (888) 632-3381 from within the United States or (785) 424-1678 from outside the United States and are asked to reference the Conference ID: WDQ416. A simultaneous webcast of the call will be available on the Investor Relations section of the Walker & Dunlop website at http://www.walkerdunlop.com. Presentation materials, related to the conference call, will be posted to the Investor Relations section of the Company’s website prior to the call.
A telephonic replay of the call will also be available from approximately 11:00 a.m. Eastern time February 8, 2017 through February 22, 2017. Please call (800) 688-7036 from the United States or (402) 220-1346 from outside the United States. An audio replay will also be available on the Investor Relations section of the Company’s website, along with the presentation materials.
About Walker & Dunlop
Walker & Dunlop (NYSE: WD), headquartered in Bethesda, Maryland, is one of the largest commercial real estate finance companies in the United States providing financing and investment sales to owners of multifamily and commercial properties. Walker & Dunlop, which is included in the S&P SmallCap 600 Index, has over 500 professionals in over 25 offices across the nation with an unyielding commitment to client satisfaction.
Non-GAAP Financial Measures
To supplement our financial statements presented in accordance with United States generally accepted accounting principles (GAAP), the Company uses adjusted EBITDA, a non-GAAP financial measure. The presentation of adjusted EBITDA is not intended to be considered in isolation or as a substitute for, or superior to, the financial information prepared and presented in accordance with GAAP. When analyzing our operating performance, readers should use adjusted EBITDA in addition to, and not as an alternative for, net income. Adjusted EBITDA represents net income before income taxes, interest expense on our term loan facility, and amortization and depreciation, adjusted for provision for credit losses net of write-offs, stock-based incentive compensation charges, and non-cash revenues such as gains attributable to MSRs. Because not all companies use identical calculations, our presentation of adjusted EBITDA may not be comparable to similarly titled measures of other companies. Furthermore, adjusted EBITDA is not intended to be a measure of free cash flow for our management's discretionary use, as it does not reflect certain cash requirements such as tax and debt service payments. The amounts shown for adjusted EBITDA may also differ from the amounts calculated under similarly titled definitions in our debt instruments, which are further adjusted to reflect certain other cash and non-cash charges that are used to determine compliance with financial covenants.
We use adjusted EBITDA to evaluate the operating performance of our business, for comparison with forecasts and strategic plans, and for benchmarking performance externally against competitors. We believe that this non-GAAP measure, when read in conjunction with the Company's GAAP financials, provides useful information to investors by offering:
|
· |
the ability to make more meaningful period-to-period comparisons of the Company's on-going operating results; |
|
· |
the ability to better identify trends in the Company's underlying business and perform related trend analyses; and |
|
· |
a better understanding of how management plans and measures the Company's underlying business. |
5
We believe that adjusted EBITDA has limitations in that it does not reflect all of the amounts associated with the Company's results of operations as determined in accordance with GAAP and that adjusted EBITDA should only be used to evaluate the Company's results of operations in conjunction with net income. For more information on adjusted EBITDA, refer to the section of this press release below titled "Adjusted Financial Metric Reconciliation to GAAP."
Forward-Looking Statements
Some of the statements contained in this press release may constitute forward-looking statements within the meaning of the federal securities laws. Forward-looking statements relate to expectations, projections, plans and strategies, anticipated events or trends and similar expressions concerning matters that are not historical facts. In some cases, you can identify forward-looking statements by the use of forward-looking terminology such as ''may,'' ''will,'' ''should,'' ''expects,'' ''intends,'' ''plans,'' ''anticipates,'' ''believes,'' ''estimates,'' ''predicts,'' or ''potential'' or the negative of these words and phrases or similar words or phrases that are predictions of or indicate future events or trends and which do not relate solely to historical matters. You can also identify forward-looking statements by discussions of strategy, plans or intentions.
The forward-looking statements contained in this press release reflect our current views about future events and are subject to numerous known and unknown risks, uncertainties, assumptions and changes in circumstances that may cause actual results to differ significantly from those expressed or contemplated in any forward-looking statement.
While forward-looking statements reflect our good faith projections, assumptions and expectations, they are not guarantees of future results. Furthermore, we disclaim any obligation to publicly update or revise any forward-looking statement to reflect changes in underlying assumptions or factors, new information, data or methods, future events or other changes, except as required by applicable law. Factors that could cause our results to differ materially include, but are not limited to: (1) general economic conditions and multifamily and commercial real estate market conditions, (2) regulatory and or legislative changes to Freddie Mac, Fannie Mae or HUD, (3) our ability to retain and attract loan originators and other professionals, and (4) changes in federal government fiscal and monetary policies, including any constraints or cuts in federal funds allocated to HUD for loan originations.
For a further discussion of these and other factors that could cause future results to differ materially from those expressed or contemplated in any forward-looking statements, see the section titled ''Risk Factors" in our most recent Annual Report on Form 10-K, as it may be updated or supplemented by our Quarterly Reports on Form 10-Q and our other filings with the SEC. Such filings are available publicly on our Investor Relations web page at www.walkerdunlop.com.
Contacts:
|
Investors: |
Media: |
|
Claire Harvey |
Susan Weber |
|
Vice President, Investor Relations |
Chief Marketing Officer |
|
Phone 301.634.2143 |
Phone 301.215.5515 |
|
investorrelations@walkeranddunlop.com |
info@walkeranddunlop.com |
|
Phone 301.215.5500 7501 Wisconsin Avenue, Suite 1200E Bethesda, Maryland 20814 |
|
6
Walker & Dunlop, Inc. and Subsidiaries
Consolidated Balance Sheets
December 31, 2016 and 2015
(In thousands, except per share data)
|
|
|
December 31, |
|
||||
|
|
|
2016 (Unaudited) |
|
2015
|
|
||
|
Assets |
|
|
|
|
|
|
|
|
Cash and cash equivalents |
|
$ |
118,756 |
|
$ |
136,988 |
|
|
Restricted cash |
|
|
9,861 |
|
|
5,306 |
|
|
Pledged securities, at fair value |
|
|
84,850 |
|
|
72,190 |
|
|
Loans held for sale, at fair value |
|
|
1,858,358 |
|
|
2,499,111 |
|
|
Loans held for investment, net |
|
|
220,377 |
|
|
231,493 |
|
|
Servicing fees and other receivables, net |
|
|
29,459 |
|
|
23,844 |
|
|
Derivative assets |
|
|
61,824 |
|
|
11,678 |
|
|
Mortgage servicing rights |
|
|
521,930 |
|
|
412,348 |
|
|
Goodwill and other intangible assets |
|
|
97,372 |
|
|
91,488 |
|
|
Other assets |
|
|
49,645 |
|
|
30,545 |
|
|
Total assets |
|
$ |
3,052,432 |
|
$ |
3,514,991 |
|
|
|
|
|
|
|
|
|
|
|
Liabilities |
|
|
|
|
|
|
|
|
Accounts payable and other liabilities |
|
$ |
93,211 |
|
$ |
67,684 |
|
|
Performance deposits from borrowers |
|
|
10,480 |
|
|
5,112 |
|
|
Derivative liabilities |
|
|
4,396 |
|
|
1,333 |
|
|
Guaranty obligation, net of accumulated amortization |
|
|
32,292 |
|
|
27,570 |
|
|
Allowance for risk-sharing obligations |
|
|
3,613 |
|
|
5,586 |
|
|
Deferred tax liabilities, net |
|
|
139,020 |
|
|
101,425 |
|
|
Warehouse notes payable |
|
|
1,990,183 |
|
|
2,649,470 |
|
|
Note payable |
|
|
164,163 |
|
|
164,462 |
|
|
Total liabilities |
|
$ |
2,437,358 |
|
$ |
3,022,642 |
|
|
|
|
|
|
|
|
|
|
|
Equity |
|
|
|
|
|
|
|
|
Preferred shares, 50,000 authorized, none issued. |
|
$ |
— |
|
$ |
— |
|
|
Common stock, $0.01 par value. Authorized 200,000; issued and outstanding 29,551 shares at December 31, 2016 and 29,466 shares at December 31, 2015 |
|
|
296 |
|
|
295 |
|
|
Additional paid-in capital |
|
|
228,889 |
|
|
215,575 |
|
|
Retained earnings |
|
|
381,031 |
|
|
272,030 |
|
|
Total stockholders’ equity |
|
$ |
610,216 |
|
$ |
487,900 |
|
|
Noncontrolling interests |
|
|
4,858 |
|
|
4,449 |
|
|
Total equity |
|
$ |
615,074 |
|
$ |
492,349 |
|
|
Commitments and contingencies |
|
|
— |
|
|
— |
|
|
Total liabilities and equity |
|
$ |
3,052,432 |
|
$ |
3,514,991 |
|
7
Walker & Dunlop, Inc. and Subsidiaries
Consolidated Statements of Income
(In thousands, except per share data)
|
|
|
For the three months ended |
|
For the year ended |
|
||||||||
|
|
|
December 31, |
|
December 31, |
|
||||||||
|
|
|
2016 (Unaudited) |
|
2015 (Unaudited) |
|
2016 (Unaudited) |
|
2015
|
|
||||
|
Revenues |
|
|
|
|
|
|
|
|
|
|
|
|
|
|
Gains from mortgage banking activities |
|
$ |
117,779 |
|
$ |
76,986 |
|
$ |
367,185 |
|
$ |
290,466 |
|
|
Servicing fees |
|
|
39,370 |
|
|
30,530 |
|
|
140,924 |
|
|
114,757 |
|
|
Net warehouse interest income, loans held for sale |
|
|
5,465 |
|
|
3,477 |
|
|
16,245 |
|
|
14,541 |
|
|
Net warehouse interest income, loans held for investment |
|
|
2,337 |
|
|
2,659 |
|
|
7,482 |
|
|
9,419 |
|
|
Escrow earnings and other interest income |
|
|
2,943 |
|
|
1,350 |
|
|
9,168 |
|
|
4,473 |
|
|
Other |
|
|
10,497 |
|
|
6,363 |
|
|
34,272 |
|
|
34,542 |
|
|
Total revenues |
|
$ |
178,391 |
|
$ |
121,365 |
|
$ |
575,276 |
|
$ |
468,198 |
|
|
|
|
|
|
|
|
|
|
|
|
|
|
|
|
|
Expenses |
|
|
|
|
|
|
|
|
|
|
|
|
|
|
Personnel |
|
$ |
73,126 |
|
$ |
49,224 |
|
$ |
227,491 |
|
$ |
184,590 |
|
|
Amortization and depreciation |
|
|
30,603 |
|
|
24,385 |
|
|
111,427 |
|
|
98,173 |
|
|
Provision (benefit) for credit losses |
|
|
(778) |
|
|
1,068 |
|
|
(612) |
|
|
1,644 |
|
|
Interest expense on corporate debt |
|
|
2,432 |
|
|
2,485 |
|
|
9,851 |
|
|
9,918 |
|
|
Other operating expenses |
|
|
11,827 |
|
|
10,331 |
|
|
41,338 |
|
|
38,507 |
|
|
Total expenses |
|
$ |
117,210 |
|
$ |
87,493 |
|
$ |
389,495 |
|
$ |
332,832 |
|
|
Income from operations |
|
$ |
61,181 |
|
$ |
33,872 |
|
$ |
185,781 |
|
$ |
135,366 |
|
|
Income tax expense |
|
|
24,175 |
|
|
13,592 |
|
|
71,470 |
|
|
52,771 |
|
|
Net income before noncontrolling interests |
|
$ |
37,006 |
|
$ |
20,280 |
|
$ |
114,311 |
|
$ |
82,595 |
|
|
Less: net income from noncontrolling interests |
|
|
216 |
|
|
(131) |
|
|
414 |
|
|
467 |
|
|
Walker & Dunlop net income |
|
$ |
36,790 |
|
$ |
20,411 |
|
$ |
113,897 |
|
$ |
82,128 |
|
|
|
|
|
|
|
|
|
|
|
|
|
|
|
|
|
Basic earnings per share |
|
$ |
1.25 |
|
$ |
0.70 |
|
$ |
3.87 |
|
$ |
2.76 |
|
|
Diluted earnings per share |
|
$ |
1.16 |
|
$ |
0.67 |
|
$ |
3.65 |
|
$ |
2.65 |
|
|
|
|
|
|
|
|
|
|
|
|
|
|
|
|
|
Basic weighted average shares outstanding |
|
|
29,477 |
|
|
29,310 |
|
|
29,432 |
|
|
29,754 |
|
|
Diluted weighted average shares outstanding |
|
|
31,701 |
|
|
30,610 |
|
|
31,172 |
|
|
30,949 |
|
8
SUPPLEMENTAL OPERATING DATA
Unaudited
|
|
|
For the three months ended |
|
For the year ended |
|
||||||||
|
|
|
December 31, |
|
December 31, |
|
||||||||
|
(in thousands; except per share data) |
|
2016 |
|
2015 |
|
2016 |
|
2015 |
|
||||
|
Transaction Volume: |
|
|
|
|
|
|
|
|
|
|
|
|
|
|
Loan Origination Volume by Product Type |
|
|
|
|
|
|
|
|
|
|
|
|
|
|
Fannie Mae |
|
$ |
2,273,379 |
|
$ |
1,254,692 |
|
$ |
7,000,942 |
|
$ |
5,012,790 |
|
|
Freddie Mac |
|
|
1,231,766 |
|
|
1,896,245 |
|
|
4,234,071 |
|
|
6,326,471 |
|
|
Ginnie Mae - HUD |
|
|
261,204 |
|
|
175,133 |
|
|
879,941 |
|
|
592,026 |
|
|
Brokered (1) |
|
|
1,304,724 |
|
|
943,774 |
|
|
4,189,116 |
|
|
4,122,307 |
|
|
Interim Loans |
|
|
184,560 |
|
|
40,125 |
|
|
419,600 |
|
|
185,075 |
|
|
Total Loan Origination Volume |
|
$ |
5,255,633 |
|
$ |
4,309,969 |
|
$ |
16,723,670 |
|
$ |
16,238,669 |
|
|
Investment Sales Volume |
|
|
1,005,265 |
|
|
376,314 |
|
|
2,574,442 |
|
|
1,520,079 |
|
|
Total Transaction Volume |
|
$ |
6,260,898 |
|
$ |
4,686,283 |
|
$ |
19,298,112 |
|
$ |
17,758,748 |
|
|
|
|
|
|
|
|
|
|
|
|
|
|
|
|
|
Key Performance Metrics: |
|
|
|
|
|
|
|
|
|
|
|
|
|
|
Operating margin |
|
|
34 |
% |
|
28 |
% |
|
32 |
% |
|
29 |
% |
|
Return on equity |
|
|
25 |
% |
|
17 |
% |
|
21 |
% |
|
19 |
% |
|
Walker & Dunlop net income |
|
$ |
36,790 |
|
$ |
20,411 |
|
$ |
113,897 |
|
$ |
82,128 |
|
|
Adjusted EBITDA (2) |
|
$ |
34,625 |
|
$ |
28,988 |
|
$ |
129,928 |
|
$ |
124,279 |
|
|
Diluted EPS |
|
$ |
1.16 |
|
$ |
0.67 |
|
$ |
3.65 |
|
$ |
2.65 |
|
|
|
|
|
|
|
|
|
|
|
|
|
|
|
|
|
Key Expense Metrics (as a percentage of total revenues): |
|
|
|
|
|
|
|
|
|
|
|
|
|
|
Personnel expenses |
|
|
41 |
% |
|
41 |
% |
|
40 |
% |
|
39 |
% |
|
Other operating expenses |
|
|
7 |
% |
|
9 |
% |
|
7 |
% |
|
8 |
% |
|
Key Origination Metrics (as a percentage of loan origination volume): |
|
|
|
|
|
|
|
|
|
|
|
|
|
|
Origination related fees |
|
|
1.00 |
% |
|
0.95 |
% |
|
1.04 |
% |
|
0.97 |
% |
|
Gains attributable to MSRs |
|
|
1.24 |
% |
|
0.84 |
% |
|
1.15 |
% |
|
0.82 |
% |
|
Gains attributable to MSRs, as a percentage of GSE and HUD origination volume (3) |
|
|
1.73 |
% |
|
1.09 |
% |
|
1.59 |
% |
|
1.12 |
% |
|
|
|
As of December 31, |
|
|||||||
|
Servicing Portfolio by Product: |
|
2016 |
|
2015 |
|
2014 |
|
|||
|
Fannie Mae |
|
$ |
27,728,164 |
|
$ |
22,915,088 |
|
$ |
20,521,425 |
|
|
Freddie Mac |
|
|
20,688,410 |
|
|
17,810,007 |
|
|
12,916,705 |
|
|
Ginnie Mae - HUD |
|
|
9,155,794 |
|
|
5,657,809 |
|
|
5,828,981 |
|
|
Brokered (1) |
|
|
5,286,473 |
|
|
3,595,990 |
|
|
4,539,461 |
|
|
Interim Loans |
|
|
222,313 |
|
|
233,370 |
|
|
225,318 |
|
|
Total Servicing Portfolio |
|
$ |
63,081,154 |
|
$ |
50,212,264 |
|
$ |
44,031,890 |
|
|
|
|
|
|
|
|
|
|
|
|
|
|
Key Servicing Metric (end of period): |
|
|
|
|
|
|
|
|
|
|
|
Weighted-average servicing fee rate (basis points) |
|
|
26.1 |
|
|
24.8 |
|
|
24.4 |
|
|
(1) |
Brokered transactions for commercial mortgage backed securities, life insurance companies, and commercial banks. |
|
(2) |
This is a non-GAAP financial measure. For more information on adjusted EBITDA, refer to the section above titled “Non-GAAP Financial Measures.” |
|
(3) |
The fair value of the expected net cash flows associated with the servicing of the loan, net of any guaranty obligations retained, as a percentage of GSE and HUD volume. |
9
ADJUSTED FINANCIAL METRIC RECONCILIATION TO GAAP
Unaudited
|
|
|
|
For the three months ended |
|
For the year ended |
|||||||
|
|
|
|
December 31, |
|
December 31, |
|||||||
|
(in thousands) |
|
|
2016 |
|
|
2015 |
|
2016 |
|
2015 |
||
|
Reconciliation of Walker & Dunlop Net Income to Adjusted EBITDA |
|
|
|
|
|
|
|
|
|
|
|
|
|
Walker & Dunlop Net Income |
|
$ |
36,790 |
|
$ |
20,411 |
|
$ |
113,897 |
|
$ |
82,128 |
|
Income tax expense |
|
|
24,175 |
|
|
13,592 |
|
|
71,470 |
|
|
52,771 |
|
Interest expense |
|
|
2,432 |
|
|
2,485 |
|
|
9,851 |
|
|
9,918 |
|
Amortization and depreciation |
|
|
30,603 |
|
|
24,385 |
|
|
111,427 |
|
|
98,173 |
|
Provision (benefit) for credit losses |
|
|
(778) |
|
|
1,068 |
|
|
(612) |
|
|
1,644 |
|
Net recoveries (write-offs) |
|
|
810 |
|
|
— |
|
|
(1,757) |
|
|
(808) |
|
Stock compensation expense |
|
|
5,693 |
|
|
3,187 |
|
|
18,477 |
|
|
14,084 |
|
Gains attributable to mortgage servicing rights (1) |
|
|
(65,100) |
|
|
(36,140) |
|
|
(192,825) |
|
|
(133,631) |
|
Adjusted EBITDA |
|
$ |
34,625 |
|
$ |
28,988 |
|
$ |
129,928 |
|
$ |
124,279 |
|
(1) |
Represents the fair value of the expected net cash flows from servicing recognized at commitment, net of the expected guaranty obligation. |
10
Key Credit Metrics
Unaudited
|
|
|
For the year ended December 31, |
|
|||||||
|
(dollars in thousands) |
|
2016 |
|
2015 |
|
2014 |
|
|||
|
Key Credit Metrics |
|
|
|
|
|
|
|
|
|
|
|
Risk-sharing servicing portfolio: |
|
|
|
|
|
|
|
|
|
|
|
Fannie Mae Full Risk |
|
$ |
20,669,404 |
|
$ |
17,180,577 |
|
$ |
15,116,490 |
|
|
Fannie Mae Modified Risk |
|
|
6,396,812 |
|
|
4,970,569 |
|
|
4,747,015 |
|
|
Freddie Mac Modified Risk |
|
|
53,368 |
|
|
53,506 |
|
|
53,635 |
|
|
GNMA - HUD Full Risk |
|
|
4,431 |
|
|
4,585 |
|
|
4,728 |
|
|
Total risk-sharing servicing portfolio |
|
$ |
27,124,015 |
|
$ |
22,209,237 |
|
$ |
19,921,868 |
|
|
|
|
|
|
|
|
|
|
|
|
|
|
Non risk-sharing servicing portfolio: |
|
|
|
|
|
|
|
|
|
|
|
Fannie Mae No Risk |
|
$ |
661,948 |
|
$ |
763,942 |
|
$ |
657,920 |
|
|
Freddie Mac No Risk |
|
|
20,635,042 |
|
|
17,756,501 |
|
|
12,863,070 |
|
|
GNMA - HUD No Risk |
|
|
9,151,363 |
|
|
5,653,224 |
|
|
5,824,253 |
|
|
Brokered |
|
|
5,286,473 |
|
|
3,595,990 |
|
|
4,539,461 |
|
|
Total non risk-sharing servicing portfolio |
|
$ |
35,734,826 |
|
$ |
27,769,657 |
|
$ |
23,884,704 |
|
|
|
|
|
|
|
|
|
|
|
|
|
|
Total loans serviced for others |
|
$ |
62,858,841 |
|
$ |
49,978,894 |
|
$ |
43,806,572 |
|
|
|
|
|
|
|
|
|
|
|
|
|
|
Interim loans (full risk) servicing portfolio |
|
|
222,313 |
|
|
233,370 |
|
|
225,318 |
|
|
|
|
|
|
|
|
|
|
|
|
|
|
Total servicing portfolio unpaid principal balance |
|
$ |
63,081,154 |
|
$ |
50,212,264 |
|
$ |
44,031,890 |
|
|
|
|
|
|
|
|
|
|
|
|
|
|
At risk servicing portfolio (1) |
|
$ |
24,072,347 |
|
$ |
19,544,422 |
|
$ |
17,393,870 |
|
|
Maximum exposure to at risk portfolio (2) |
|
|
4,921,802 |
|
|
4,062,971 |
|
|
4,072,911 |
|
|
60+ day delinquencies, within at risk portfolio |
|
|
— |
|
|
— |
|
|
16,610 |
|
|
At risk loan balances associated with allowance for risk-sharing obligations |
|
$ |
— |
|
$ |
16,884 |
|
$ |
25,609 |
|
|
|
|
|
|
|
|
|
|
|
|
|
|
60+ day delinquencies as a percentage of the at risk portfolio |
|
|
0.00 |
% |
|
0.00 |
% |
|
0.10 |
% |
|
Allowance for risk-sharing as a percentage of the at risk portfolio |
|
|
0.02 |
% |
|
0.03 |
% |
|
0.02 |
% |
|
Allowance for risk-sharing as a percentage of the specifically identified at risk balances |
|
|
N/A |
|
|
33.08 |
% |
|
15.24 |
% |
|
Allowance for risk-sharing as a percentage of maximum exposure |
|
|
0.07 |
% |
|
0.14 |
% |
|
0.10 |
% |
|
Allowance for risk-sharing and guaranty obligation as a percentage of maximum exposure |
|
|
0.73 |
% |
|
0.82 |
% |
|
0.71 |
% |
|
(1) |
At risk servicing portfolio is defined as the balance of Fannie Mae DUS loans subject to the risk-sharing formula described below, as well as an immaterial balance of Freddie Mac and GNMA-HUD loans on which we share in the risk of loss. Use of the at risk portfolio provides for comparability of the full risk-sharing and modified risk-sharing loans because the provision and allowance for risk-sharing obligations are based on the at risk balances of the associated loans. Accordingly, we have presented the key statistics as a percentage of the at risk portfolio. |
For example, a $15 million loan with 50% DUS risk-sharing has the same potential risk exposure as a $7.5 million loan with full DUS risk-sharing. Accordingly, if the $15 million loan with 50% DUS risk-sharing was to default, the Company would view the overall loss as a percentage of the at risk balance, or $7.5 million, to ensure comparability between all risk-sharing obligations. To date, substantially all of the risk-sharing obligations that we have settled have been from full risk-sharing loans.
|
(2) |
Represents the maximum loss we would incur under our risk-sharing obligations if all of the loans we service, for which we retain some risk of loss, were to default and all of the collateral underlying these loans was determined to be without value at the time of settlement. The maximum exposure is not representative of the actual loss we would incur. |
11