Attached files
| file | filename |
|---|---|
| EX-99.3 - TRUEBLUE INVESTOR PRESENTATION - TrueBlue, Inc. | investorroadshowpresenta.htm |
| EX-99.1 - TRUEBLUE PRESS RELEASE - TrueBlue, Inc. | tbi2016q4pressreleaseexhib.htm |
| 8-K - TRUEBLUE FORM 8-K - TrueBlue, Inc. | tbi2016q4pressrelease.htm |

www.TrueBlue.com

www.TrueBlue.com
Forward-Looking Statements
This document contains forward-looking statements relating to our plans and expectations, all of which are subject to risks and
uncertainties. Such statements are based on management’s expectations and assumptions as of the date of this release and
involve many risks and uncertainties that could cause actual results to differ materially from those expressed or implied in our
forward-looking statements. We presently consider the following to be important factors that could cause actual results to differ
materially from the company’s expectations: (1) national and global economic conditions, (2) our ability to attract and retain
customers, (3) our ability to maintain profit margins, (4) new laws and regulations that could have a material effect on our operations
or financial results, (5) our ability to successfully complete and integrate acquisitions. Other information regarding factors that could
affect our results is included in our SEC filings, including the company's most recent reports on Forms 10-K and 10-Q, copies of
which may be obtained by visiting our on our website at www.trueblue.com under the Investor Relations section or the SEC's
website at www.sec.gov. We assume no duty to update or revise any forward-looking statements contained in this release.
In addition, we use several non-GAAP financial measures when presenting our financial results in this release. Please refer to the
reconciliations between our GAAP and non-GAAP financial measures included below and on our website at www.trueblue.com
under the Investor Relations section for a complete perspective on both current and historical periods. Any comparisons made to
other periods today are based on a comparison to the same period in the prior year unless otherwise stated.
Use of estimates and forecasts:
Any references made to fiscal 2017 are based on management’s outlook issued February 8, 2017, and are included for
informational purposes only. We assume no obligation to update or revise any forward-looking statement, whether as a result of new
information, future events, or otherwise, except as required by law. Any other reference to future financial estimates are included for
informational purposes only and subject to risk factors discussed in our most recent filings with the Securities Exchange
Commission.
Financial Comparisons
All comparisons are to prior year periods unless stated otherwise.

www.TrueBlue.com
Q4 2016 Summary
14-week revenue and net income decline of -9% and -36%, respectively
Comparable 13-week revenue1 decline of -14%, or +5% growth excluding Amazon
Comparable 13-week revenue of $701M v. comparable 13-week outlook of $670M to $686M
Comparable 13-week adjusted EBITDA2 -12% with margin expansion of 10 bps
Disciplined pricing and cost management
Acquisitions accretive to adjusted EBITDA margin
Successful performance of acquisitions
Exceeded original full-year adjusted EBITDA targets
1 As previously disclosed, the company’s fiscal fourth quarter includes a 14th week and the week-ending date has been moved from Friday to the following Sunday, Jan 1st to better align with the work week of our customers. The
impact of the extra week is an EBITDA loss of approximately $1 million. All figures in this presentation are given on a 14-week and 53-week GAAP basis unless specifically noted.
2 See Appendix for definitions of non-GAAP financial terms.

www.TrueBlue.com
4 Comparable basis excludes the 14th week from Q4 2016 and Fiscal Year 2016 to be comparable to the prior year 13-week Q4 and 52-week fiscal year.
2 Organic calculations exclude acquired businesses from results.
Financial Summary
The definition of adjusted net income1 changed and prior periods recast for the following:
o Ongoing, effective income tax rate now 28% (was 32%)
o Processing fees for work opportunity tax credit now included
1 See Appendix for definitions of non-GAAP financial terms.
Amounts in millions, except per share data Q4 2016 Y/Y Change FY 2016 Y/Y Change
Revenue
$735
-9%
-15% organic2
$2,751
+2%
-6% organic
Net Income (Loss) 3 $18 -36% -$15 -121%
Net Income (Loss) Per Share $0.43 -36% -$0.37 -121%
Revenue – Comparable4 Basis $701 -14% $2,717 +1%
Adjusted Net Income Per Share1 – Comparable Basis $0.58 -13% $2.12 +1%
Adjusted EBITDA – Comparable Basis
% Margin
$41
5.8%
-12%
+10 bps
$148
5.5%
+1%
Flat
Revenue – Comparable Basis ex Largest Customer $669 +5% $2,547 +9%
Adjusted EBITDA – Comparable Basis and
% Margin ex Largest Customer
$40
6.0%
+14%
+50 bps
$143
5.6%
+16%
+40 bps
3 Net Loss of $15M includes a non-cash impairment charge of $104M, primarily related to reduced scope of service with our largest customer.

www.TrueBlue.com
Gross Margin and SG&A Bridges
SG&A
Amounts in millions
Gross Margin
22.8%
24.6% 0.3%
1.1%
0.4%
Q4 2015 Acquisitions Staffing PeopleScout Q4 2016
$141 $145
$11
$2 $[VALUE] $16
Q4 2015 Acquisitions EBITDA Addbacks 14th Week Organic Business Q4 2016

www.TrueBlue.com
New segment reporting enhances transparency
Now reporting three segments - aligns with new brand structure and increases transparency for investors
Less unallocated corporate expense – more expense to segments enhancing accountability
New
Segments:
FY 2016 Mix by
Segment:
General labor and skilled
trades, on demand, via a
nationwide branch
network.
.
On-site contingent
workforce management
solutions.
Outsourced talent
solutions for the
recruitment of
permanent employees.1
59%
34%
7%
93%
7%
74%
19%
23%
-16% -22%
96%
26%
New
Segments
Old
Segments
R
ev
en
u
e
Ad
ju
sted
EBI
T
D
A
Staffing Services
Managed
Services
Old
Segments:
1 Also includes management of contingent service provider business which provides customers with improved quality and spend management of their contingent labor vendors.
Corporate
Unallocated

www.TrueBlue.com
PeopleReady Segment
Amounts in millions Q4 2016 Y/Y Change FY 2016 Y/Y Change
Revenue $431 -1% $1,629 Flat
Adjusted EBITDA $26 -20% $109 -14%
Revenue – Comparable Basis $411 -6% $1,609 -1%
Adjusted EBITDA – Comparable Basis
% Margin
$26
6.3%
-21%
-120 bps
$109
6.8%
-14%
-100 bps
Improving revenue trends (comparable week basis)
o Oct -9%, Nov -6%, Dec -5%
Better trends in most industry verticals and geographies

www.TrueBlue.com
PeopleManagement Segment
Comparable 13-week revenue + 23%, excluding Amazon
Comparable 13-week organic revenue + 4%, excluding Amazon
Amounts in millions Q4 2016 Y/Y Change FY 2016 Y/Y Change
Revenue
$258
-26%
-35% organic
$940
-3%
-18% organic
Adjusted EBITDA $12 -38% $28 -25%
Revenue – Comparable Basis
$246
-29%
-39% organic
$929
-4%
-19 organic
Adjusted EBITDA – Comparable Basis
% Margin
$12
4.9%
-38%
-70 bps
$28
3.0%
-24%
-80 bps
Revenue – Comparable Basis ex Largest Customer
$214
23%
4% organic
$759
24%
Flat
Adjusted EBITDA – Comparable Basis and
% Margin ex Largest Customer
$11
5.3%
42%
+70 bps
$23
3.0%
81%
+90 bps

www.TrueBlue.com
PeopleScout Segment
Amounts in millions Q4 2016 Y/Y Change FY 2016 Y/Y Change
Revenue
$46
69%
6% organic
$181
73%
9% organic
Adjusted EBITDA $7 n.m. $34 268%
Revenue – Comparable Basis
$44
62%
2% organic
$179
71%
8% organic
Adjusted EBITDA – Comparable Basis
% Margin
$7
16.3%
n.m.
+1520 bps
$35
19.5%
273%
+1060 bps
Comparable 13-week revenue +62%
Comparable 13-week organic revenue +2%
Comparable 13-week Adjusted EBITDA +7M
o RPO division of Aon Hewitt acquisition and related synergies
o Pricing and cost management in legacy business

www.TrueBlue.com
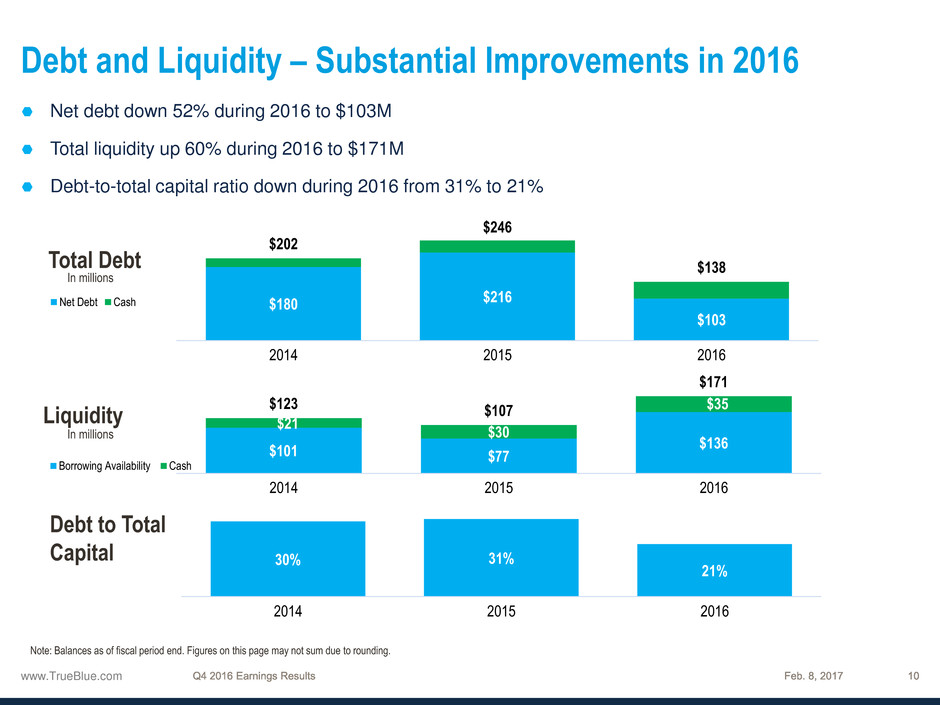
$180 $216
$103
$202
$246
$138
2014 2015 2016
Net Debt Cash
$101 $77
$136
$21
$30
$35 $123 $107
$171
2014 2015 2016
Borrowing Availability Cash
Debt and Liquidity – Substantial Improvements in 2016
30% 31%
21%
2014 2015 2016
Total Debt
Liquidity
Debt to Total
Capital
In millions
In millions
Note: Balances as of fiscal period end. Figures on this page may not sum due to rounding.
Net debt down 52% during 2016 to $103M
Total liquidity up 60% during 2016 to $171M
Debt-to-total capital ratio down during 2016 from 31% to 21%

www.TrueBlue.com
Q1 2017 Outlook
Amounts in millions, except per share data Outlook Notes
Revenue
Growth Ranges
Total Revenue
PeopleReady
PeopleManagement
PeopleScout
$560M to $575M
-13% to -11%
-7% to -4%
-24% to -22%
-10% to 0%
• Total revenue decline excluding our largest customer of 2% to 5%
Net Income
Adjusted Net Income
$0 to $2M
$4M to $6M
• Assumes income tax rate of 28%
• Adjustments include $0M for acquisition and integration costs
EPS
Adjusted EPS
-$0.01 to $0.04
$0.09 to $0.14
Adjusted EBITDA $12M to $15M
D&A / CapEx $12M / $6M

www.TrueBlue.com

www.TrueBlue.com
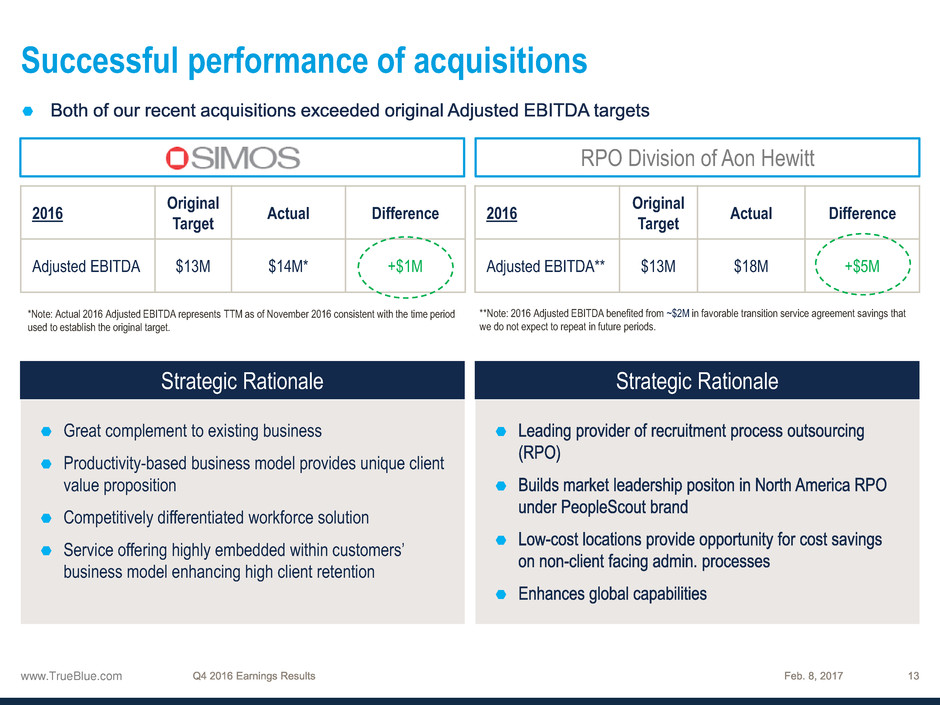
Successful performance of acquisitions
Strategic Rationale
Great complement to existing business
Productivity-based business model provides unique client
value proposition
Competitively differentiated workforce solution
Service offering highly embedded within customers’
business model enhancing high client retention
Strategic Rationale
2016
Original
Target
Actual Difference
Adjusted EBITDA $13M $14M* +$1M
RPO Division of Aon Hewitt SIMOS
2016
Original
Target
Actual Difference
Adjusted EBITDA** $13M $18M +$5M
**Note: 2016 Adjusted EBITDA benefited from ~$2M in favorable transition service agreement savings that
we do not expect to repeat in future periods.
*Note: Actual 2016 Adjusted EBITDA represents TTM as of November 2016 consistent with the time period
used to establish the original target.

www.TrueBlue.com
Non-GAAP Terms and Definitions
EBITDA and Adjusted EBITDA are non-GAAP financial measures. EBITDA excludes interest, taxes, depreciation and amortization.
Adjusted EBITDA further excludes from EBITDA, costs related to acquisition and integration, goodwill and intangible asset
impairment charges, other charges, and Work Opportunity Tax Credit third-party processing fees. EBITDA and Adjusted EBITDA
are key measures used by management to assess performance and, in our opinion, enhance comparability and provide investors
with useful insight into the underlying trends of the business. EBITDA and Adjusted EBITDA should not be considered measures of
financial performance in isolation or as an alternative to Income from operations in the Consolidated Statements of Operations in
accordance with U.S. GAAP, and may not be comparable to similarly titled measures of other companies.
Adjusted net income and adjusted net income per diluted share are non-GAAP financial measures which exclude from net income
and net income on a per diluted share basis costs related to acquisition and integration, goodwill and intangible asset impairment
charges, other charges, amortization of intangibles of acquired businesses as well as accretion expense related to acquisition
earn-out, tax effect of each adjustment to U.S. GAAP net income, and adjusts income taxes to the expected ongoing effective tax
rate. Adjusted net income and adjusted net income per diluted share are key measures used by management to assess
performance and, in our opinion, enhance comparability and provide investors with useful insight into the underlying trends of the
business. Adjusted net income and adjusted net income per diluted share should not be considered measures of financial
performance in isolation or as an alternative to net income or net income per diluted share in the Consolidated Statements of
Operations in accordance with U.S. GAAP, and may not be comparable to similarly titled measures of other companies.
See “Financials” in the Investors section of our web site at www.trueblue.com for a full reconciliation of non-GAAP financial
measures to U.S. GAAP financial results.
Feb. 8, 2017
