Attached files
| file | filename |
|---|---|
| EX-99.1 - EXHIBIT 99.1 - CCUR Holdings, Inc. | v458590_ex99-1.htm |
| 8-K - FORM 8-K - CCUR Holdings, Inc. | v458590_8k.htm |
Exhibit 99.2

FEBRUARY 8, 2017 Q2 FISCAL 2017 INVESTOR CONFERENCE CALL
Certain statements made or incorporated by reference in this release may constitute "forward - looking statements" within the mean ing of the federal securities laws. Statements regarding future events and developments and the company's future performance, including, but not limited to, mana gem ent's expectations, beliefs, plans, estimates, or projections relating to the future, are forward - looking statements within the meaning of these laws. All forward - l ooking statements are subject to certain risks and uncertainties that could cause actual events to differ materially from those projected. The risks and uncertainties which could affect our financial condition or results of operations include, without limitation: the potential consolidation of the markets that we serve; U.S. Government sequestration; European austerity measures; delays or cancellations of customer orders; non - renewal of maintenance and support service agreements with customers; changes in product demand; economic conditions; various inventory risks due to changes in market c ond itions; margins of the content delivery business to capture new business; fluctuations and timing of large content delivery orders; risks associated with ou r o perations in the People's Republic of China; uncertainties relating to the development and ownership of intellectual property; uncertainties relating to our abilit y a nd the ability of other companies to enforce their intellectual property rights; the pricing and availability of equipment, materials and inventories; the concentration o f o ur customers; failure to effectively manage change; delays in testing and introductions of new products; the impact of reductions in force on our operations; rapid techn olo gy changes; system errors or failures; reliance on a limited number of suppliers and failure of components provided by those suppliers; uncertainties associated wit h i nternational business activities, including foreign regulations, trade controls, taxes, tariffs and currency fluctuations; the impact of competition on the pri cin g of content delivery products; failure to effectively service the installed base; the entry of new well - capitalized competitors into our markets; the success of new conte nt delivery products, including acceptance of our new storage solutions, including acceptance of our new storage solutions; the success of our relationships with techno log y and channel partners; capital spending patterns by a limited customer base; the current challenging macroeconomic environment; continuing unevenness of the gl obal economic recovery; global terrorism; privacy concerns over data collection; our ability to utilize net operating losses to offset cash taxes in the eve nt of an ownership change as defined by the Internal Revenue Service; earthquakes, tsunamis, floods and other natural disasters in areas in which our customers and suppl ier s operate; the process of evaluation of strategic alternatives; and the availability of debt or equity financing to support our liquidity needs. Other important risk factors are discussed in Concurrent's Form 10 - K filed August 30, 2016 with the Securities and Exchange Commission ("SEC"), and in subsequent filings of periodic reports with the SEC. The risk factors discussed in the Form 10 - K and subsequently filed periodic reports un der the heading "Risk Factors" are specifically incorporated by reference in this press release. Forward - looking statements are based on current expectations and s peak only as of the date of such statements. Concurrent undertakes no obligation to publicly update or revise any forward - looking statement, whether as a result of future events, new information, or otherwise. SAFE HARBOR STATEMENT 2
To supplement the company’s condensed consolidated financial statements prepared in accordance with U.S. generally accepted a cco unting principles (“GAAP”), this presentation provides information concerning the company’s Adjusted EBITDA, a non - GAAP financial measure. Reconciliations of Adj usted EBITDA to net income, the most comparable GAAP financial measure, can be found in tables immediately following this slide. For purposes of this presentation, Adjusted EBITDA is defined as GAAP net income, less interest income and other income (expe nse ), net, provision for income taxes, depreciation and amortization expenses, share - based compensation expense and gain on the sale of assets. The company considers A djusted EBITDA important to understanding its historical results and identifying current and future trends impacting its business. Management uses Adjust ed EBITDA to compare the company’s performance to that of prior periods and evaluate the company’s financial and operating results on a consistent basis from pe rio d to period. The company also believes this measure, when viewed in combination with the company’s financial results prepared in accordance with GAAP, provides usef ul information to investors to evaluate ongoing operating results and trends. The adjustments to the company’s GAAP results are made with the intent of providing bot h m anagement and investors a more complete understanding of the company’s underlying operational results, trends and performance. Additionally, adjusted EBITDA is not intended to be a measure of cash flow for management’s discretionary use. We believe that the inclusion of Adjusted EBITDA is appropriate to provide addi tio nal information to investors because securities analysts, noteholders and other investors use these non - GAAP financial measures to assess our operating performance a cross periods on a consistent basis and to evaluate the relative risk of an investment in our securities. Adjusted EBITDA has limitations as an analytical tool, however, including the following: • Although depreciation and amortization are non - cash charges, the assets being depreciated and amortized will often have to be re placed in the future and adjusted EBITDA does not reflect any cash requirements for such replacements; • Adjusted EBITDA does not reflect our cash expenditures, or future requirements for capital expenditures or contractual commit men ts; • Adjusted EBITDA does not reflect changes in, or cash requirements for, our working capital needs; • Adjusted EBITDA does not reflect our tax expense or any cash requirements to pay income taxes; and • Adjusted EBITDA does not reflect the impact of earnings or charges resulting from matters we do not consider to be indicative of our ongoing operations, but may nonetheless have a material impact on our results of operations . The presentation of Adjusted EBITDA is not meant to be considered in isolation or as a substitute for or superior to the comp any ’s financial results determined in accordance with GAAP. In addition, the company’s presentation of Adjusted EBITDA may not be computed in the same manner as si mil arly titled measures used by other companies, including other companies in our industry. EXPLANATION OF NON - GAAP FINANCIAL MEASURES 3
Second Quarter Review Update on Concurrent’s Content Delivery & Storage Market Opportunity Concurrent’s Solutions for the Market Key Milestones Ahead Your Questions TODAY’S AGENDA 4

• Total revenue up 19% sequentially; 4% YoY to $15.5 million • Real - Time segment driven by Asia - Pacific strength and expanding Automotive business • Total Active Content Delivery customers grew by 16% YoY to 22 – Aquari product line added 3 new customers in Q2, for a total of 11 • 2 New Content Delivery channel partners added in the quarter • 3 Content Delivery channel partners generated revenue • Delivered Positive Adjusted EBITDA SECOND QUARTER FISCAL 2017 OPERATING HIGHLIGHTS 5
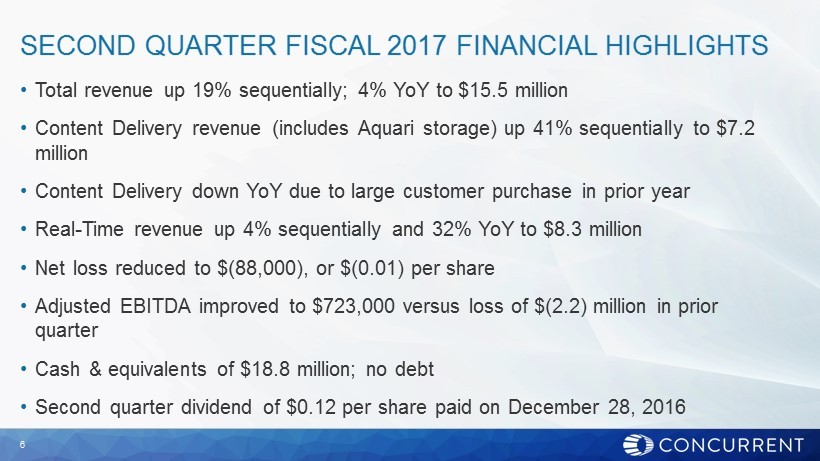
• Total revenue up 19% sequentially; 4% YoY to $15.5 million • Content Delivery revenue (includes Aquari storage) up 41% sequentially to $7.2 million • Content Delivery down YoY due to large customer purchase in prior year • Real - Time revenue up 4% sequentially and 32% YoY to $8.3 million • Net loss reduced to $(88,000), or $(0.01) per share • Adjusted EBITDA improved to $723,000 versus loss of $(2.2) million in prior quarter • Cash & equivalents of $18.8 million; no debt • Second quarter dividend of $0.12 per share paid on December 28, 2016 SECOND QUARTER FISCAL 2017 FINANCIAL HIGHLIGHTS 6
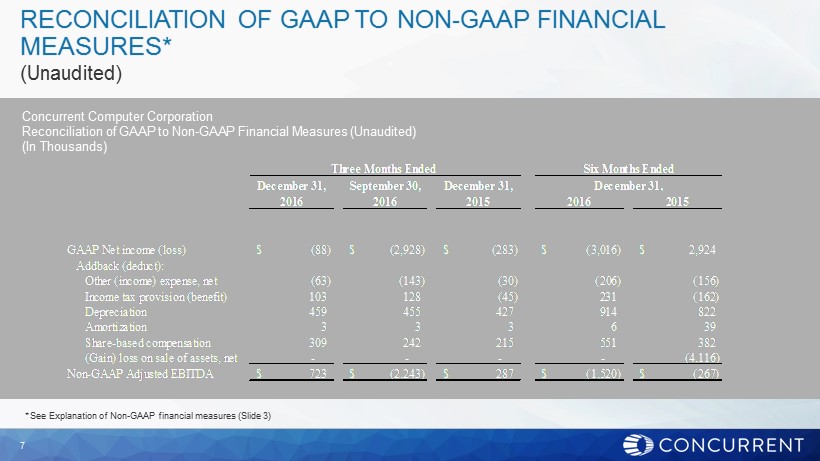
Concurrent Computer Corporation Reconciliation of GAAP to Non - GAAP Financial Measures (Unaudited) (In Thousands) December 31, September 30, December 31, 2016 2016 2015 2016 2015 GAAP Net income (loss) (88)$ (2,928)$ (283)$ (3,016)$ 2,924$ Addback (deduct): Other (income) expense, net (63) (143) (30) (206) (156) Income tax provision (benefit) 103 128 (45) 231 (162) Depreciation 459 455 427 914 822 Amortization 3 3 3 6 39 Share-based compensation 309 242 215 551 382 (Gain) loss on sale of assets, net - - - - (4,116) Non-GAAP Adjusted EBITDA 723$ (2,243)$ 287$ (1,520)$ (267)$ December 31, Three Months Ended Six Months Ended RECONCILIATION OF GAAP TO NON - GAAP FINANCIAL MEASURES* (Unaudited) 7 * See E xplanation of Non - GAAP financial measures (Slide 3)
• Total revenue for the year is expected to be flat to slightly up from 2016 revenue of $61.1 million • Adjusted EBITDA is expected to remain positive for the remainder of fiscal 2017 PREVIOUS FISCAL 2017 GUIDANCE REITERATED 8
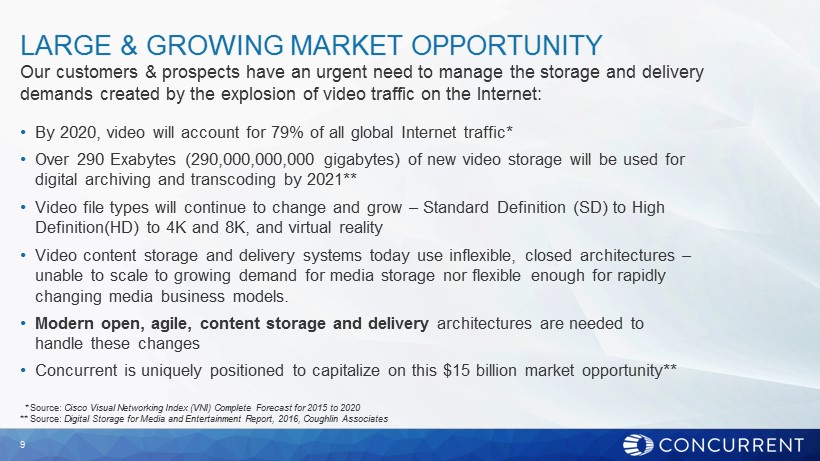
Our customers & prospects have an urgent need to manage the storage and delivery demands created by the explosion of video traffic on the Internet: • By 2020, video will account for 79% of all global Internet traffic* • Over 290 Exabytes (290,000,000,000 gigabytes) of new video storage will be used for digital archiving and transcoding by 2021** • Video file types will continue to change and grow – Standard Definition (SD) to High Definition(HD) to 4K and 8K, and virtual reality • Video content storage and delivery systems today use inflexible, closed architectures – unable to scale to growing demand for media storage nor flexible enough for rapidly changing media business models. • Modern open, agile, content storage and delivery architectures are needed to handle these changes • Concurrent is uniquely positioned to capitalize on this $15 billion market opportunity** LARGE & GROWING MARKET OPPORTUNITY * Source: Cisco Visual Networking Index ( VNI ) Complete Forecast for 2015 to 2020 ** Source: Digital Storage for Media and Entertainment Report, 2016, Coughlin Associates 9 DS1
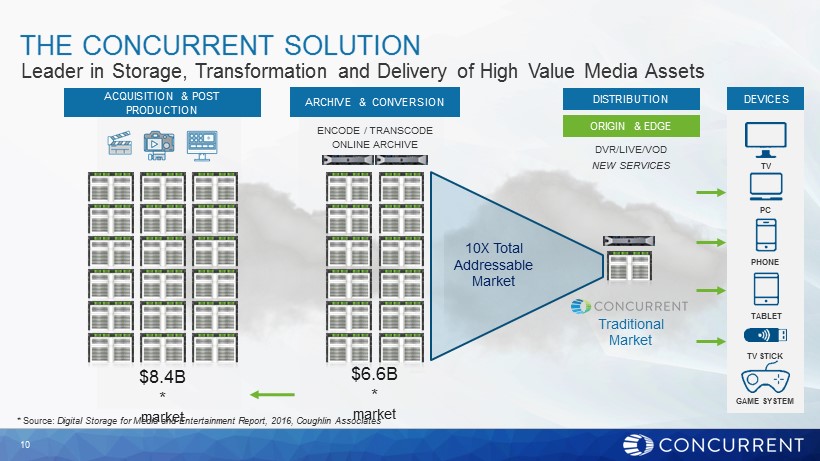
10 THE CONCURRENT SOLUTION Leader in Storage, Transformation and Delivery of High Value Media Assets PHONE TV PC GAME SYSTEM TABLET TV STICK DEVICES ACQUISITION & POST PRODUCTION $8.4B * market ARCHIVE & CONVERSION ENCODE / TRANSCODE ONLINE ARCHIVE $6.6B * market DISTRIBUTION DVR/LIVE/VOD NEW SERVICES ORIGIN & EDGE Traditional Market 10X Total Addressable Market * Source: Digital Storage for Media and Entertainment Report, 2016, Coughlin Associates
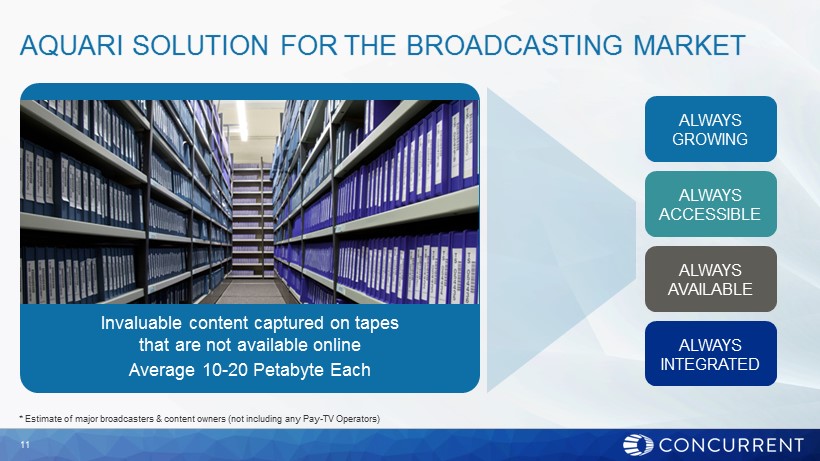
11 AQUARI SOLUTION FOR THE BROADCASTING MARKET Invaluable content captured on tapes that are not available online Average 10 - 20 Petabyte Each ALWAYS INTEGRATED ALWAYS AVAILABLE ALWAYS ACCESSIBLE ALWAYS GROWING * Estimate of major broadcasters & content owners (not including any Pay - TV Operators)

NEW PARTNERSHIPS – Technology – Channels MILESTONES WE ARE DRIVING TO ACHIEVE BY 6/30/18 NEW ACCOUNT / APPLICATION WINS EXPANDED CUSTOMER RELATIONSHIPS 12

Q&A Q2 FISCAL 2017 INVESTOR CONFERENCE CALL FEBRUARY 8, 2017