Attached files
| file | filename |
|---|---|
| EX-95 - EXHIBIT 95 - Baker Hughes Holdings LLC | fy16form10-kexhibit95.htm |
| EX-32 - EXHIBIT 32 - Baker Hughes Holdings LLC | fy16form10-kexhibit32.htm |
| EX-31.2 - EXHIBIT 31.2 - Baker Hughes Holdings LLC | fy16form10-kexhibit312.htm |
| EX-31.1 - EXHIBIT 31.1 - Baker Hughes Holdings LLC | fy16form10-kexhibit311.htm |
| EX-23.1 - EXHIBIT 23.1 - Baker Hughes Holdings LLC | fy16form10-kexhibit231.htm |
| EX-21.1 - EXHIBIT 21.1 - Baker Hughes Holdings LLC | fy16form10-kexhibit211.htm |
| EX-10.41 - EXHIBIT 10.41 - Baker Hughes Holdings LLC | fy16form10-kexhibit1041.htm |
| EX-10.7 - EXHIBIT 10.7 - Baker Hughes Holdings LLC | fy16form10-kexhibit107.htm |
UNITED STATES
SECURITIES AND EXCHANGE COMMISSION
Washington, D.C. 20549
Form 10-K
[X] ANNUAL REPORT PURSUANT TO SECTION 13 OR 15(d) OF THE SECURITIES EXCHANGE ACT OF 1934
FOR THE FISCAL YEAR ENDED DECEMBER 31, 2016
OR
[ ] TRANSITION REPORT PURSUANT TO SECTION 13 OR 15(d)
OF THE SECURITIES EXCHANGE ACT OF 1934
Commission file number 1-9397
Baker Hughes Incorporated
(Exact name of registrant as specified in its charter)
Delaware | 76-0207995 | |
(State or other jurisdiction of incorporation or organization) | (I.R.S. Employer Identification No.) | |
17021 Aldine Westfield Road, Houston, Texas | 77073-5101 | |
(Address of principal executive offices) | (Zip Code) | |
Securities registered pursuant to Section 12(b) of the Act:
Title of each class | Name of each exchange on which registered | |
Common Stock, $1 Par Value per Share | New York Stock Exchange | |
SIX Swiss Exchange | ||
Securities registered pursuant to Section 12(g) of the Act: None
Indicate by check mark if the registrant is a well-known seasoned issuer, as defined in Rule 405 of the Securities Act. YES [X] NO [ ]
Indicate by check mark if the registrant is not required to file reports pursuant to Section 13 or 15(d) of the Act. YES [ ] NO [X]
Indicate by check mark whether the registrant (1) has filed all reports required to be filed by Section 13 or 15(d) of the Securities Exchange Act of 1934 during the preceding 12 months (or for such shorter period that the registrant was required to file such reports), and (2) has been subject to such filing requirements for the past 90 days. YES [X] NO [ ]
Indicate by check mark whether the registrant has submitted electronically and posted on its corporate website, if any, every Interactive Data File required to be submitted and posted pursuant to Rule 405 of Regulation S-T (§232.405 of this chapter) during the preceding 12 months (or for such shorter period that the registrant was required to submit and post such files). YES [X] NO [ ]
Indicate by check mark if disclosure of delinquent filers pursuant to Item 405 of Regulation S-K (§229.405 of this chapter) is not contained herein, and will not be contained, to the best of registrant's knowledge, in definitive proxy or information statements incorporated by reference in Part III of this Form 10-K or any amendment to this Form 10-K. [X]
Indicate by check mark whether the registrant is a large accelerated filer, an accelerated filer, a non-accelerated filer, or a smaller reporting company. See the definitions of "large accelerated filer," "accelerated filer" and "smaller reporting company" in Rule 12b-2 of the Exchange Act.
(Check one):
Large accelerated filer [X] | Accelerated filer [ ] | Non-accelerated filer [ ] | Smaller reporting company [ ] | |||
(Do not check if a smaller reporting company)
Indicate by check mark whether the registrant is a shell company (as defined in Rule 12b-2 of the Act). YES [ ] NO [X]
The aggregate market value of the voting and non-voting common stock held by non-affiliates as of the last business day of the registrant's most recently completed second fiscal quarter (based on the closing price on June 30, 2016 reported by the New York Stock Exchange) was approximately $19,263,511,000.
As of January 31, 2017, the registrant has outstanding 425,325,600 shares of common stock, $1 par value per share.
DOCUMENTS INCORPORATED BY REFERENCE
Portions of Registrant's Definitive Proxy Statement for the 2017 Annual Meeting of Stockholders are incorporated by reference into Part III of this Form 10-K.
Baker Hughes Incorporated
Table of Contents
Page | ||
1
PART I
ITEM 1. BUSINESS
Baker Hughes Incorporated is a Delaware corporation engaged in the oilfield services industry. As used herein, phrases such as "Baker Hughes," "Company," "we," "our" and "us" intend to refer to Baker Hughes Incorporated and/or its subsidiaries. The use of these terms is not intended to connote any particular corporate status or relationships.
AVAILABILITY OF INFORMATION FOR STOCKHOLDERS
Our annual reports on Form 10-K, quarterly reports on Form 10-Q, current reports on Form 8-K and amendments to those reports filed or furnished pursuant to Section 13(a) or 15(d) of the Securities Exchange Act of 1934, as amended (the "Exchange Act"), are made available free of charge on our Internet website at www.bakerhughes.com as soon as reasonably practicable after these reports have been electronically filed with, or furnished to, the Securities and Exchange Commission (the "SEC"). Information contained on or connected to our website is not incorporated by reference into this annual report on Form 10-K and should not be considered part of this annual report or any other filing we make with the SEC.
We have a Business Code of Conduct to provide guidance to our directors, officers and employees on matters of business conduct and ethics, including compliance standards and procedures. We have also required our principal executive officer, principal financial officer and principal accounting officer to sign a Code of Ethical Conduct Certification.
Our Business Code of Conduct and Code of Ethical Conduct Certifications are available on the Investor Relations section of our website at www.bakerhughes.com. We will disclose on a current report on Form 8-K or on our website information about any amendment or waiver of these codes for our executive officers and directors. Waiver information disclosed on our website will remain on the website for at least 12 months after the initial disclosure of a waiver. Our Corporate Governance Guidelines and the charters of our Audit/Ethics Committee, Compensation Committee, Executive Committee, Finance Committee and Governance and HS&E Committee are also available on the Investor Relations section of our website at www.bakerhughes.com. In addition, a copy of our Business Code of Conduct, Code of Ethical Conduct Certifications, Corporate Governance Guidelines and the charters of the committees referenced above are available in print at no cost to any stockholder who requests them by writing or telephoning us at the following address or telephone number:
Baker Hughes Incorporated
17021 Aldine Westfield Road
Houston, TX 77073
Attention: Investor Relations
Telephone: (713) 439-8600
ABOUT BAKER HUGHES
Baker Hughes is a leading supplier of oilfield services, products, technology and systems used in the worldwide oil and natural gas industry. We also provide products and services for other businesses including downstream chemicals, and process and pipeline services. Baker Hughes was formed as a corporation in April 1987 in connection with the combination of Baker International Corporation and Hughes Tool Company. We conduct our operations through subsidiaries, affiliates, ventures and alliances. We conduct business in more than 80 countries around the world and our corporate headquarters is in Houston, Texas. As of December 31, 2016, we had approximately 33,000 employees, of which approximately 64% work outside the United States (the "U.S.").
Our global oilfield operations are organized into a number of geomarket organizations, which are combined into four regions for assessing performance and allocating resources. The President of Global Operations manages our oilfield organization and reports to our chief executive officer. These regions form the basis of our four geographical operating segments as follows: North America; Latin America; Europe/Africa/Russia Caspian; and Middle East/Asia Pacific.
2
Through the geographic organization, our management is located close to our customers, facilitating strong customer relationships and allowing us to react quickly to local market conditions and customer needs. The geographic organization supports our oilfield operations and is responsible for sales, field operations and well site execution. In addition to the above, we have an Industrial Services segment, which includes the downstream chemicals business and the process and pipeline services business.
Certain support operations are organized at the enterprise level and include the supply chain and product line technology organizations. The supply chain organization is responsible for the cost-effective procurement and manufacturing of our products as well as product quality and reliability. The product line technology organization is responsible for innovating, developing, commercializing, and marketing reliable products designed to advance the performance of reservoirs for our customers. The product line technology organization also facilitates the development of cross-product line solutions, sales processes and integrated operations capabilities.
Further information about our segments is set forth in Item 7. Management's Discussion and Analysis of Financial Condition and Results of Operations and Note 6. "Segment Information" of the Notes to Consolidated Financial Statements in Item 8 herein.
HALLIBURTON TERMINATED MERGER AGREEMENT
On November 16, 2014, Baker Hughes and Halliburton Company ("Halliburton") entered into a definitive agreement and plan of merger (the "Merger Agreement") under which Halliburton would acquire all outstanding shares of Baker Hughes in a stock and cash transaction (the "Merger"). In accordance with the provisions of Section 9.1 of the Merger Agreement, Baker Hughes and Halliburton agreed to terminate the Merger Agreement on April 30, 2016, as a result of the failure of the Merger to occur on or before April 30, 2016 due to the inability to obtain certain specified antitrust related approvals. Halliburton paid $3.5 billion to Baker Hughes on May 4, 2016, representing the antitrust termination fee required to be paid pursuant to the Merger Agreement. For further information about the Merger, see Note 2. "Halliburton Terminated Merger Agreement" of the Notes to Consolidated Financial Statements in Item 8 herein.
GENERAL ELECTRIC TRANSACTION AGREEMENT
On October 30, 2016, Baker Hughes, General Electric Company ("GE"), Bear Newco, Inc. ("Newco"), a direct wholly owned subsidiary of Baker Hughes, and Bear MergerSub, Inc. ("Merger Sub"), a direct wholly owned subsidiary of Newco, entered into a Transaction Agreement and Plan of Merger (the "Transaction Agreement"). Pursuant to the terms of the Transaction Agreement, Merger Sub will merge with and into Baker Hughes, with Baker Hughes as the surviving corporation (the "Surviving Entity") and a direct wholly owned subsidiary of Newco. As a result of the merger, each outstanding share of the Baker Hughes' common stock will be converted into the right to receive one share of Class A common stock of Newco ("Newco Class A Common Stock"). Immediately following the merger, Newco will cause the Surviving Entity to be converted into a Delaware limited liability company ("Newco LLC") and Newco will become the sole managing member of Newco LLC. Following this conversion, GE will receive an approximate 62.5% membership interest in Newco LLC in exchange for contributing $7.4 billion (less the Class B Purchase Price, as defined below) in cash and GE's oil and gas business ("GE O&G") to Newco LLC, and will also receive Class B common stock of Newco (the "Newco Class B Common Stock"), representing approximately 62.5% of the voting power of the outstanding shares of common stock of Newco, in exchange for contributing the par value thereof (the "Class B Purchase Price") to Newco. Newco will distribute as a special dividend an amount equal to $17.50 per share to the holders of record of the Newco Class A Common Stock, which are the former Baker Hughes stockholders. Newco will operate as a public company.
Immediately following the closing (the "Closing") of the transactions contemplated by the Transaction Agreement (collectively the "GE Transaction"), GE will hold 100% of the Newco Class B Common Stock, which will represent approximately 62.5% of the voting power of the outstanding shares of common stock of Newco, and Baker Hughes' stockholders immediately prior to the Closing will hold 100% of the Newco Class A Common Stock, which will represent approximately 37.5% of the voting power of the outstanding shares of common stock of Newco. In addition, GE will hold an approximate 62.5% membership interest in Newco LLC and Newco will hold an approximate 37.5% membership interest in Newco LLC. The membership interests in Newco LLC, together with the Newco Class B Common Stock, will be exchangeable on a 1:1 basis for Newco Class A Common Stock, subject to certain adjustments. The rights (including voting rights) of Newco Class A Common Stock and Newco Class B
3
Common Stock are identical; provided that Newco Class B Common Stock has no economic rights. Effective from and following the Closing, Newco and its subsidiaries will operate under the name "Baker Hughes, a GE Company."
The GE Transaction is subject to the approval of Baker Hughes' stockholders, regulatory approvals and customary closing conditions. Baker Hughes and GE expect the GE Transaction to close in mid-2017. However, Baker Hughes cannot predict with certainty when, or if, the GE Transaction will be completed because completion of the GE Transaction is subject to conditions beyond the control of Baker Hughes. For further information about the GE Transaction, see Note 3. "General Electric Transaction Agreement" of the Notes to Consolidated Financial Statements in Item 8 herein.
PRODUCTS AND SERVICES
Oilfield Operations
We offer a full suite of products and services to our customers around the world. Our oilfield products and services fall into one of two categories, Drilling and Evaluation or Completion and Production. This classification is based on the two major phases of constructing an oil and/or natural gas well, the drilling phase and the completion phase, and how our products and services are utilized for each phase.
Drilling and Evaluation products and services consist of the following:
• | Drill Bits - Includes Tricone™ roller cone drill bits, polycrystalline diamond composite (PDC or "diamond" drill bits, Kymera™ hybrid drill bits and related cutter technology used for performance drilling, hole enlargement and coring. |
• | Drilling Services - Includes directional drilling systems and services (rotary steerables, drilling motors, measurement-while-drilling (MWD) systems, etc.), logging-while-drilling (LWD) systems and services (resistivity, imaging, pressure testing and sampling, etc.), surface logging and coring systems and services, and geoscience services. |
• | Wireline Services - Includes both open hole (imaging, fluids sampling, etc.) and cased hole (production logging, wellbore integrity, pipe recovery, etc.) well logging services. |
• | Drilling and Completion Fluids - Includes emulsion (oil-based) and water-based drilling fluids systems; reservoir drill-in fluids; completion fluids, and fluids environmental services. |
Completion and Production products and services consist of the following:
• | Completion Systems - Includes products and services used to control the flow of hydrocarbons within a wellbore including upper completions (packers, liner hangers, safety systems, etc.), lower completions (sand screens, tubing conveyed perforating, etc.) and unconventional multistage completion systems (frac plugs, frac balls, etc.). |
• | Intelligent Production Systems - Includes products, services, and software used to monitor, analyze, and dynamically control production to optimize returns and ultimate recovery (production decisions services, chemical injection service, well monitoring services, intelligent well systems, and artificial lift monitoring). |
• | Wellbore Intervention - Includes products and services used to intervene in existing wellbores to improve production and solve problems within the well (fishing services, wellbore cleanup, casing exit systems, workover systems, smart interventional technologies, and through-tubing intervention tools). |
• | Artificial Lift - Includes products and services used to maintain production, improve recovery rates, and lower operating costs in wells in which a reservoir can no longer flow naturally (in-well electric submersible pumping systems; progressing cavity pump systems; gas lift systems); and horizontal surface pumping systems that move fluids on the surface for applications such as injection, disposal, transfer, and pipeline boosting. |
• | Upstream Chemicals - Includes chemical technologies and services that solve production challenges related to flow assurance, production optimization, asset integrity, and water management. |
• | Pressure Pumping - Includes onshore and offshore cementing, stimulation services (hydraulic fracturing, acidizing, stimulation vessels, etc.) and coiled tubing services used in the completion of new oil and natural gas wells and in remedial work on existing wells. Hydraulic fracturing is the practice of pumping fluid through a wellbore at pressures and rates sufficient to crack rock in the target formation, extend the cracks, and leave behind a propping agent to keep the cracks open after pumping ceases. |
4
The purpose of the cracks is to provide a pathway that allows for the passage of hydrocarbons from the rock to the wellbore, thus improving the production of hydrocarbons to the surface. On December 30, 2016, we contributed our North American onshore pressure pumping business to a newly formed venture ("BJ Services, LLC"), of which we retained a 46.7% interest and accounted for as an equity method investment.
We also provide dedicated project solutions to our customers through our Integrated Operations group. Integrated Operations is focused on the execution of projects that have one or more of the following attributes: project management, well site supervision, well construction, intervention, third-party contractor management, procurement and rig management. Contracts for this business unit tend to be longer in duration, often spanning multiple years, and may include significant third-party components to supplement the core products and services provided by us. By partnering with Integrated Operations, our customers have access to a comprehensive business solution that leverages our technical expertise, relationships with third-party and rig providers, and our industry leading technologies.
Additional information regarding our oilfield products and services can be found on the Company's website at www.bakerhughes.com. Our website also includes details of our hydraulic fracturing operations, including our hydraulic fracturing chemical disclosure policy and support of the online national hydraulic fracturing chemical registry at www.fracfocus.org, and information on our SmartCare™ qualified systems and products, which are intended to maximize performance while minimizing our impact on the community and environment.
Industrial Services
Industrial Services consists primarily of our downstream chemicals, and process and pipeline services businesses and provides chemical technologies, equipment, and services that optimize operations throughout the industrial lifecycle (midstream and transportation, processing and refining, water treatment, petrochemical processing). Specifically, downstream chemicals provides products and services that help to increase refinery production, as well as improve plant safety and equipment. Process and pipeline services work to improve efficiency and reduce downtime with inspection, pre-commissioning and commissioning of new and existing pipeline systems and process plants.
MARKETING, COMPETITION AND CONTRACTING
We market our products and services within our four geographic regions on a product line basis primarily through our own sales organizations. We provide technical and advisory services to assist in our customers' use of our products and services. Stock points and service centers for our products and services are located in areas of drilling and production activity throughout the world.
Our primary competitors include the major diversified oilfield service companies such as Schlumberger, Halliburton and Weatherford International, where the breadth of service capabilities as well as competitive position of each product line are the keys to differentiation in the market. We also compete with other companies who may participate in only a few of the same product lines as us, such as National Oilwell Varco, Ecolab, Newpark Resources and FTS International. Our products and services are sold in highly competitive markets and revenue and earnings are affected by changes in commodity prices, fluctuations in the level of drilling, workover and completion activity in major markets, general economic conditions, foreign currency exchange fluctuations and governmental regulations. We believe that the principal competitive factors in our industries are product and service quality, reliability and availability, health, safety and environmental standards, technical proficiency and price.
Our customers include the large integrated major and super-major oil and natural gas companies, U.S. and international independent oil and natural gas companies and the national or state-owned oil companies. No single customer accounts for more than 10% of our business. While we may have contracts with customers that include multiple well projects and that may extend over a period of time ranging from two to four years, our services and products are generally provided on a well-by-well basis. Most contracts cover our pricing of the products and services, but do not necessarily establish an obligation to use our products and services.
We strive to negotiate the terms of our customer contracts consistent with what we consider to be best practices. The general industry practice is for oilfield service providers, like us, to be responsible for their own products and services and for our customers to retain liability for drilling and related operations. Consistent with this
5
practice, we generally take responsibility for our own people and property while our customers, such as the operator of a well, take responsibility for their own people, property and all liabilities related to the well and subsurface operations, regardless of either party's negligence. In general, any material limitations on indemnifications to us from our customers in support of this allocation of responsibility arise only by applicable statutes.
Certain states such as Texas, Louisiana, Wyoming, and New Mexico have enacted oil and natural gas specific statutes that void any indemnity agreement that attempts to relieve a party from liability resulting from its own negligence ("anti-indemnity statutes"). These statutes can void the allocation of liability agreed to in a contract; however, both the Texas and Louisiana anti-indemnity statutes include important exclusions. The Louisiana statute does not apply to property damage, and the Texas statute allows mutual indemnity agreements that are supported by insurance and has exclusions, which include, among other things, loss or liability for property damage that results from pollution and the cost of well control events. We negotiate with our customers in the U.S. to include a choice of law provision adopting the law of a state that does not have an anti-indemnity statute because both Baker Hughes and our customers generally prefer to contract on the basis as we mutually agree. When this does not occur, we will generally use Texas law. With the exclusions contained in the Texas anti-indemnity statute, we are usually able to structure the contract such that the limitation on the indemnification obligations of the customer is limited and should not have a material impact on the terms of the contract. State law, laws or public policy in countries outside the U.S., or the negotiated terms of our agreement with the customer may also limit the customer's indemnity obligations in the event of the gross negligence or willful misconduct of a Company employee. The Company and the customer may also agree to other limitations on the customer's indemnity obligations in the contract.
The Company maintains a commercial general liability insurance policy program that covers against certain operating hazards, including product liability claims and personal injury claims, as well as certain limited environmental pollution claims for damage to a third party or its property arising out of contact with pollution for which the Company is liable; however, clean up and well control costs are not covered by such program. All of the insurance policies purchased by the Company are subject to deductible and/or self-insured retention amounts for which we are responsible for payment, specific terms, conditions, limitations and exclusions. There can be no assurance that the nature and amount of Company insurance will be sufficient to fully indemnify us against liabilities related to our business.
RESEARCH AND DEVELOPMENT AND PATENTS
Our products and technology organization engages in research and development activities directed primarily toward the development of new products, processes and services, the improvement of existing products and services and the design of specialized products to meet specific customer needs. We have technology centers located in the U.S. (several in Houston, Texas and surrounding areas and one in Claremore, Oklahoma), Germany (Celle), Russia (Novosibirsk), and Saudi Arabia (Dhahran). For information regarding the total amount of research and development expense in each of the three years in the period ended December 31, 2016, see Note 1. "Summary of Significant Accounting Policies" of the Notes to Consolidated Financial Statements in Item 8 herein.
We have followed a policy of seeking patent and trademark protection in numerous countries and regions throughout the world for products and methods that appear to have commercial significance. We believe our patents, trademarks, and related intellectual property rights are adequate for the conduct of our business, and aggressively pursue protection of our intellectual property rights against infringement worldwide. Additionally, we consider the quality and timely delivery of our products, the service we provide to our customers and the technical knowledge and skills of our personnel to be other important components of the portfolio of capabilities and assets supporting our ability to compete. No single patent or trademark is considered to be critical to our business.
SEASONALITY
Our operations can be affected by seasonal weather, which can temporarily affect the delivery and performance of our products and services, and our customers' budgetary cycles. Examples of seasonal events that can impact our business are set forth below:
• | The severity and duration of both the summer and the winter in North America can have a significant impact on activity levels. In Canada, the timing and duration of the spring thaw directly affects activity levels, which |
6
reach seasonal lows during the second quarter and build through the third and fourth quarters to a seasonal high in the first quarter.
• | Adverse weather conditions such as hurricanes and typhoons can disrupt coastal and offshore drilling and production operations. |
• | Severe weather during the winter months normally results in reduced activity levels in the North Sea and Russia generally in the first quarter. |
• | Scheduled repair and maintenance of offshore facilities in the North Sea can reduce activity in the second and third quarters. |
• | Many of our international oilfield customers increase orders for certain products and services in the fourth quarter. |
• | Our Industrial Services segment typically experiences lower sales during the first and fourth quarters of the year due to the Northern Hemisphere winter. |
RAW MATERIALS
We purchase various raw materials and component parts for use in manufacturing our products and delivering our services. The principal materials we purchase include, but are not limited to, steel alloys (including chromium and nickel), titanium, barite, beryllium, copper, lead, tungsten carbide, synthetic and natural diamonds, gels, sand and other proppants, printed circuit boards and other electronic components and hydrocarbon-based chemical feed stocks. These materials are generally available from multiple sources and may be subject to price volatility. While we generally do not experience significant or long-term shortages of these materials, we have from time to time experienced temporary shortages of particular raw materials. We do not expect significant interruptions in the supply of raw materials, but there can be no assurance that there will be no price or supply issues over the long-term.
EMPLOYEES
As of December 31, 2016, we had approximately 33,000 employees, of which the majority are outside the U.S. Approximately 10% of these employees are represented under collective bargaining agreements or similar-type labor arrangements.
EXECUTIVE OFFICERS OF BAKER HUGHES INCORPORATED
The following table shows, as of February 7, 2017, the name of each of our executive officers, together with his or her age and all offices presently or previously held. There are no family relationships among our executive officers.
Name | Age | Background | ||
Martin S. Craighead | 57 | Chairman of the Board of Directors of the Company since April 2013 and Director since 2011. Chief Executive Officer of the Company since January 2012 and President since 2010. Chief Operating Officer from 2009 to 2012. Group President of Drilling and Evaluation from 2007 to 2009. President of INTEQ from 2005 to 2007 and President of Baker Atlas from February 2005 to August 2005. Employed by the Company in 1986. | ||
Kimberly A. Ross | 51 | Senior Vice President and Chief Financial Officer of the Company since October 2014. Executive Vice President and Chief Financial Officer of Avon Products Incorporated from 2011 to 2014. Executive Vice President and Chief Financial Officer of Royal Ahold N.V. from 2007 to 2011 and various other finance positions with Royal Ahold from 2001 to 2007. Ms. Ross serves on the board of directors and the audit committee of Chubb Limited. Employed by the Company in October 2014. | ||
Belgacem Chariag | 54 | President, Global Operations since May 2016. Chief Integration Officer from December 2014 to May 2016. President, Global Products and Services of the Company from October 2013 to December 2014. President, Eastern Hemisphere Operations from 2009 to 2013. Vice President/Director HSE of Schlumberger Limited from May 2008 to May 2009. Various other executive positions at Schlumberger from 1989 to 2008. Employed by the Company in 2009. | ||
7
Archana Deskus | 51 | Vice President and Chief Information Officer of the Company since 2013. Vice President and Chief Information Officer for Ingersoll-Rand from 2011 to 2012. Senior Vice President and Chief Information Officer for Timex Group from 2006 to 2011. Various positions at United Technologies from 1987 to 2006, including Vice President and Chief Information Officer for Carrier North America. Employed by the Company in 2013. | ||
Jack Hinton | 63 | Vice President, Health, Safety and Environment since 2015. Vice President, Enterprise Solutions at the Company from 2011 to 2014 and Director Health, Safety and Environment at the Company from 2005 to 2010. Dean and professor at the Kazakhstan Institute of Management, Economics and Strategic Research from 2004 to 2005. He previously spent 26 years at Texaco in various Health, Safety and Environment leadership roles. Employed by the Company in 2005. | ||
Kelly C. Janzen | 44 | Vice President, Controller and Chief Accounting Officer since September 2016. Vice President, Finance and Chief Accounting Officer for McDermott International from December 2014 to August 2016. Distributed Power Global Controller at General Electric Company ("GE") from April 2013 to November 2014 and Operational Controller, Global Growth and Operations at GE from August 2011 to April 2013. Various corporate roles at GE from 2007 to 2011. Employed by the Company in 2016. | ||
Murali Kuppuswamy | 55 | Chief Human Resources Officer since May 2016. Vice President, Human Resources for Europe, Africa and Russia Caspian from December 2013 through May 2016. Vice President, Human Resources for Global Products and Technology from September 2011 through December 2013. Various human resources leadership roles at GE from 1993 to 2011. Employed by the Company in 2011. | ||
William D. Marsh | 54 | Vice President and General Counsel of the Company since February 2013. Vice President-Legal for Western Hemisphere from May 2009 to February 2013. Various executive, legal and corporate roles within the Company from 1998 to 2009. Partner at Ballard Spahr LLP from 1997 to 1998. Mr. Marsh serves on the Board of Directors of People's Utah Bancorp (bank holding company). Employed by the Company in 1998. | ||
Jay G. Martin | 65 | Vice President, Chief Compliance Officer and Senior Deputy General Counsel of the Company since 2004. Shareholder at Winstead Sechrest & Minick P.C. from 2001 to 2004. Employed by the Company in 2004. | ||
Derek Mathieson | 46 | Chief Commercial Officer since May 2016. Chief Technology and Marketing Officer of the Company from September 2015 to May 2016 and Chief Strategy Officer from October 2013 to September 2015. President Western Hemisphere Operations from 2012 to 2013. President, Products and Technology from May 2009 to January 2012. Chief Technology and Marketing Officer of the Company from December 2008 to May 2009. Employed by the Company in 2008. | ||
Arthur L. Soucy | 54 | President, Products and Technology from May 2016. President, Europe, Africa and Russia Caspian Region of the Company from 2013 to May 2016. President, Global Products and Services from 2012 to 2013. Vice President Supply Chain of the Company from April 2009 to January 2012. Vice President, Global Supply Chain for Pratt and Whitney from 2007 to 2009. Employed by the Company in 2009. | ||
ENVIRONMENTAL MATTERS
We are committed to the health and safety of people, protection of the environment and compliance with laws, regulations and our policies. Our past and present operations include activities that are subject to extensive domestic (including U.S. federal, state and local) and international regulations with regard to air, land and water quality and other environmental matters. We believe we are in substantial compliance with these regulations. Regulation in this area continues to evolve, and changes in standards of enforcement of existing regulations, as well as the enactment and enforcement of new legislation, may require us and our customers to modify, supplement or replace equipment or facilities or to change or discontinue present methods of operation. Our environmental compliance expenditures and our capital costs for environmental control equipment may change accordingly.
We are involved in voluntary remediation projects at certain of our facilities. On rare occasions, remediation activities are conducted as specified by a government agency-issued consent decree or agreed order. Estimated remediation costs are accrued using currently available facts, existing environmental permits, technology and presently enacted laws and regulations. For sites where we are primarily responsible for the remediation, our cost estimates are developed based on internal evaluations and are not discounted. We record accruals when it is probable that we will be obligated to pay amounts for environmental site evaluation, remediation or related activities,
8
and such amounts can be reasonably estimated. Accruals are recorded even if significant uncertainties exist over the ultimate cost of the remediation. Ongoing environmental compliance costs, such as obtaining environmental permits, installation of pollution control equipment and waste disposal, are expensed as incurred.
The Comprehensive Environmental Response, Compensation and Liability Act (known as "Superfund") imposes liability for the release of a "hazardous substance" into the environment. Superfund liability is imposed without regard to fault, even if the waste disposal was in compliance with laws and regulations. The U.S. Environmental Protection Agency (the "EPA") and appropriate state agencies supervise investigative and cleanup activities at Superfund sites. We have been identified as a potentially responsible party ("PRP") in remedial activities related to various Superfund sites, and we accrue our share of the estimated remediation costs of the site based on the ratio of the estimated volume of waste we contributed to the site to the total volume of waste disposed at the site. PRPs in Superfund actions have joint and several liability for all costs of remediation. Accordingly, a PRP may be required to pay more than its proportional share of such costs. For some projects, it is not possible to quantify our ultimate exposure because the projects are either in the investigative or early remediation stage, or allocation information is not yet available. However, based upon current information, we do not believe that probable or reasonably possible expenditures in connection with the sites are likely to have a material adverse effect on our consolidated financial statements because we have recorded adequate reserves to cover the estimate we presently believe will be our ultimate liability in the matter. Further, other PRPs involved in the sites have substantial assets and may reasonably be expected to pay their share of the cost of remediation, and, in some circumstances, we have insurance coverage or contractual indemnities from third parties to cover a portion of the ultimate liability.
Based upon current information, we believe that our overall compliance with environmental regulations, including routine environmental compliance costs and capital expenditures for environmental control equipment, will not have a material adverse effect on our capital expenditures, earnings or competitive position because we have either established adequate reserves or our cost for that compliance is not expected to be material to our consolidated financial statements. Our total accrual for environmental remediation was $31 million and $35 million at December 31, 2016 and 2015, respectively, which included accruals of $2 million in each year for the various Superfund sites.
We are subject to various other governmental proceedings and regulations, including foreign regulations, relating to environmental matters, but we do not believe that any of these matters are likely to have a material adverse effect on our consolidated financial statements. We continue to focus on reducing future environmental liabilities by maintaining appropriate Company standards and by improving our assurance programs.
ITEM 1A. RISK FACTORS
An investment in our common stock involves various risks. When considering an investment in Baker Hughes, one should carefully consider all of the risk factors described below, as well as other information included and incorporated by reference in this annual report. There may be additional risks, uncertainties and matters not listed below, that we are unaware of, or that we currently consider immaterial. Any of these may adversely affect our business, financial condition, results of operations and cash flows and, thus, the value of an investment in Baker Hughes.
Risk Factors Related to the Worldwide Oil and Natural Gas Industry
Our business is focused on providing products and services to the worldwide oil and natural gas industry; therefore, our risk factors include those factors that impact, either positively or negatively, the markets for oil and natural gas. Expenditures by our customers for exploration, development and production of oil and natural gas are based on their expectations of future hydrocarbon demand, their expectations for future energy prices, the risks associated with developing the reserves, their ability to finance exploration for and development of reserves, and the future value of the reserves. Their evaluation of the future value is based, in part, on their expectations for global demand, global supply, spare productive capacity, inventory levels and other factors that influence oil and natural gas prices. The key risk factors we believe are currently influencing the worldwide oil and natural gas markets are discussed below.
9
Demand for oil and natural gas is subject to factors beyond our control, which may adversely affect our operating results. Changes in the global economy could impact our customers' spending levels and our revenue and operating results.
Demand for oil and natural gas, as well as the demand for our services, is highly correlated with global economic growth, and in particular by the economic growth of countries such as the U.S., India, China, and developing countries in Asia and the Middle East who are either significant users of oil and natural gas or whose economies are experiencing the most rapid economic growth compared to the global average. Weakness or deterioration of the global economy or credit markets could reduce our customers' spending levels and reduce our revenue and operating results. Events such as Britain's vote in late June 2016 to leave the European Union and incremental weakness in global economic activity, particularly in China, India, Europe, the Middle East and developing countries in Asia, could reduce demand for oil and natural gas and result in lower oil and natural gas prices. Incremental strength in global economic activity in such areas will create more demand for oil and natural gas and support higher oil and natural gas prices. In addition, demand for oil and natural gas could be impacted by environmental regulation, including cap and trade legislation, regulation of hydraulic fracturing, carbon taxes and the cost for carbon capture and sequestration related regulations.
Supply of oil and natural gas is subject to factors beyond our control, which may adversely affect our operating results.
Productive capacity for oil and natural gas is dependent on our customers' decisions to develop and produce oil and natural gas reserves and on the regulatory environment in which our customers and we operate. The ability to produce oil and natural gas can be affected by the number and productivity of new wells drilled and completed, as well as the rate of production and resulting depletion of existing wells. Advanced technologies, such as horizontal drilling and hydraulic fracturing, improve total recovery but also result in a more rapid production decline and may become subject to more stringent regulation in the future.
Productive capacity in excess of demand ("spare productive capacity") is also an important factor influencing energy prices and spending by oil and natural gas exploration companies. Spare productive capacity and oil and natural gas storage inventory levels are an indicator of the relative balance between supply and demand. High or increasing storage, inventories, or spare productive capacity generally indicate that supply is exceeding demand and that energy prices are likely to soften. Low or decreasing storage, inventories, or spare productive capacity are generally an indicator that demand is growing faster than supply and that energy prices are likely to rise.
Access to prospects is also important to our customers and such access may be limited because host governments do not allow access to the reserves. Government regulations and the costs incurred by oil and natural gas exploration companies to conform to and comply with government regulations may also limit the quantity of oil and natural gas that may be economically produced.
Supply can also be impacted by the degree to which individual Organization of Petroleum Exporting Countries ("OPEC") nations and other large oil and natural gas producing countries, including, but not limited to, Norway and Russia, are willing and able to control production and exports of oil, to decrease or increase supply and to support their targeted oil price while meeting their market share objectives. Any of these factors could affect the supply of oil and natural gas and could have a material effect on our results of operations.
Volatility of oil and natural gas prices can adversely affect demand for our products and services.
Volatility in oil and natural gas prices can also impact our customers' activity levels and spending for our products and services. Current energy prices are important contributors to cash flow for our customers and their ability to fund exploration and development activities. Since 2014, oil prices have declined significantly due in large part to increasing supplies, weakening demand growth and OPEC's position to not cut production until the fourth quarter of 2016. Expectations about future prices and price volatility are important for determining future spending levels.
10
Lower oil and natural gas prices generally lead to decreased spending by our customers. While higher oil and natural gas prices generally lead to increased spending by our customers, sustained high energy prices can be an impediment to economic growth, and can therefore negatively impact spending by our customers. Our customers also take into account the volatility of energy prices and other risk factors by requiring higher returns for individual projects if there is higher perceived risk. Any of these factors could affect the demand for oil and natural gas and could have a material effect on our results of operations.
Our customers' activity levels and spending for our products and services and ability to pay amounts owed us could be impacted by the reduction of their cash flow and the ability of our customers to access equity or credit markets.
Our customers' access to capital is dependent on their ability to access the funds necessary to develop projects based upon their expectations of future energy prices, required investments and resulting returns. Limited access to external sources of funding has and may continue to cause customers to reduce their capital spending plans to levels supported by internally-generated cash flow. In addition, a reduction of cash flow resulting from declines in commodity prices, a reduction in borrowing bases under reserve-based credit facilities or the lack of available debt or equity financing may impact the ability of our customers to pay amounts owed to us and could cause us to increase our reserve for doubtful accounts.
Seasonal and weather conditions could adversely affect demand for our services and operations.
Variation from normal weather patterns, such as cooler or warmer summers and winters, can have a significant impact on demand. Adverse weather conditions, such as hurricanes in the Gulf of Mexico, may interrupt or curtail our operations, or our customers' operations, cause supply disruptions and result in a loss of revenue and damage to our equipment and facilities, which may or may not be insured. Extreme winter conditions in Canada, Russia or the North Sea may interrupt or curtail our operations, or our customers' operations, in those areas and result in a loss of revenue.
Risk Factors Related to Our Business
Our expectations regarding our business are affected by the following risk factors and the timing of any of these risk factors:
We operate in a highly competitive environment, which may adversely affect our ability to succeed.
We operate in a highly competitive environment for marketing oilfield services and securing equipment and trained personnel. Our ability to continually provide competitive products and services can impact our ability to defend, maintain or increase prices for our products and services, maintain market share, and negotiate acceptable contract terms with our customers. In order to be competitive, we must provide new technologies, reliable products and services that perform as expected and that create value for our customers, and successfully recruit, train and retain competent personnel. Our investments in new technologies and property, plant and equipment may not provide competitive returns. Our ability to defend, maintain or increase prices for our products and services is in part dependent on the industry's capacity relative to customer demand, and on our ability to differentiate the value delivered by our products and services from our competitors' products and services.
Managing development of competitive technology and new product introductions on a forecasted schedule and at forecasted costs can impact our financial results. Development of competing technology that accelerates the obsolescence of any of our products or services can have a detrimental impact on our financial results.
We may be disadvantaged competitively and financially by a significant movement of exploration and production operations to areas of the world in which we are not currently active.
The high cost or unavailability of infrastructure, materials, equipment, supplies and personnel, particularly in periods of rapid growth, could adversely affect our ability to execute our operations on a timely basis.
Our manufacturing operations are dependent on having sufficient raw materials, component parts and manufacturing capacity available to meet our manufacturing plans at a reasonable cost while minimizing inventories. Our ability to effectively manage our manufacturing operations and meet these goals can have an
11
impact on our business, including our ability to meet our manufacturing plans and revenue goals, control costs, and avoid shortages or over supply of raw materials and component parts. Raw materials and components of particular concern include steel alloys (including chromium and nickel), titanium, barite, beryllium, copper, lead, tungsten carbide, synthetic and natural diamonds, gels, sand and other proppants, printed circuit boards and other electronic components and hydrocarbon-based chemical feed stocks. Our ability to repair or replace equipment damaged or lost in the well can also impact our ability to service our customers. A lack of manufacturing capacity could result in increased backlog, which may limit our ability to respond to orders with short lead times.
People are a key resource to developing, manufacturing and delivering our products and services to our customers around the world. Our ability to manage the recruiting, training, retention and efficient usage of the highly skilled workforce required by our plans and to manage the associated costs could impact our business. A well-trained, motivated workforce has a positive impact on our ability to attract and retain business. Periods of rapid growth present a challenge to us and our industry to recruit, train and retain our employees, while managing the impact of wage inflation and potential lack of available qualified labor in the markets where we operate.
Likewise, if the downturn in the economy or our markets continues, we may have to adjust our workforce to control costs and may lose our skilled and diverse workforce. Labor-related actions, including strikes, slowdowns and facility occupations can also have a negative impact on our business.
Our business could be impacted by geopolitical and terrorism threats.
Geopolitical and terrorism risks continue to grow in a number of key countries where we do business. Geopolitical and terrorism risks could lead to, among other things, a loss of our investment in the country, impairment of the safety of our employees and impairment of our ability to conduct our operations.
Our business operations may be impacted by civil unrest, government expropriations and/or epidemic outbreaks.
In addition to other geopolitical and terrorism risks, civil unrest continues to grow in a number of key countries where we do business. Our ability to conduct business operations may be impacted by that civil unrest and our assets in these countries may also be subject to expropriation by governments or other parties involved in civil unrest. Epidemic outbreaks may also impact our business operations by, among other things, restricting travel to protect the health and welfare of our employees and decisions by our customers to curtail or stop operations in impacted areas.
Our business could be impacted by cybersecurity risks and threats.
Threats to our information technology systems associated with cybersecurity risks and cyber incidents or attacks continue to grow and it is possible that breaches to our systems could go unnoticed for some period of time. Risks associated with these threats include, among other things, loss of intellectual property, impairment of our ability to conduct our operations, disruption of our customers' operations, loss or damage to our customer data delivery systems, and increased costs to prevent, respond to or mitigate cybersecurity events.
Our failure to comply with the Foreign Corrupt Practices Act ("FCPA") and other laws could have a negative impact on our ongoing operations.
Our ability to comply with the FCPA, the U.K. Bribery Act and various other anti-bribery and anti-corruption laws is dependent on the success of our ongoing compliance program, including our ability to continue to manage our agents and business partners, and supervise, train and retain competent employees. Our compliance program is also dependent on the efforts of our employees to comply with applicable law and the Baker Hughes Business Code of Conduct. We could be subject to sanctions and civil and criminal prosecution as well as fines and penalties in the event of a finding of a violation of any of these laws by us or any of our employees.
Compliance with and changes in laws could be costly and could affect operating results. In addition, government disruptions could negatively impact our ability to conduct our business.
We conduct business in the U.S. and in more than 80 countries that can be impacted by expected and unexpected changes in the legal and business environments in which we operate. Compliance related issues could
12
also limit our ability to do business in certain countries and impact our earnings. Changes that could impact the legal environment include new legislation, new regulations, new policies, investigations and legal proceedings and new interpretations of existing legal rules and regulations, in particular, changes in export control laws or exchange control laws, additional restrictions on doing business in countries subject to sanctions, and changes in laws in countries where we operate or intend to operate. In addition, government disruptions, such as a U.S. government shutdown, may delay or halt the granting and renewal of permits, licenses and other items required by us and our customers to conduct our business.
Changes in tax laws or tax rates, adverse positions taken by taxing authorities and tax audits could impact operating results.
The U.S. and global tax environment today is evolving rapidly with a number of countries in which we operate enacting, or planning to enact, legislative changes that conform to the Organization for Economic Cooperation and Development's ("OECD") Base Erosion and Profit Shifting ("BEPS") project or otherwise make fundamental modifications to their tax regimes. These changes in tax laws or tax rates, the resolution of tax assessments or audits by various tax authorities, and the ability to fully utilize our tax loss carryforwards and tax credits could impact operating results, including additional valuation allowances for deferred tax assets. In addition, we may periodically restructure our legal entity organization. If taxing authorities were to disagree with our tax positions in connection with any such restructurings, our effective tax rate could be materially impacted.
Our tax filings for various periods are subject to audit by the tax authorities in most jurisdictions where we conduct business. We have received tax assessments from various taxing authorities and are currently at varying stages of appeals and/or litigation regarding these matters. These audits may result in assessment of additional taxes that are resolved with the authorities or through the courts. We believe these assessments may occasionally be based on erroneous and even arbitrary interpretations of local tax law. Resolution of any tax matter involves uncertainties and there are no assurances that the outcomes will be favorable.
Changes in and compliance with restrictions or regulations on offshore drilling may adversely affect our business and operating results and reduce the need for our services in those areas.
Legislation and regulation in the U.S. and other parts of the world of the offshore oil and natural gas industry may result in substantial increases in costs or delays in drilling or other operations in the Gulf of Mexico and other parts of the world, oil and natural gas projects becoming potentially non-economic, and a corresponding reduced demand for our services. If the U.S. or other countries where we operate, enact stricter restrictions on offshore drilling or further regulate offshore drilling or contracting services operations, higher operating costs could result and adversely affect our business and operating results.
If the Company were to be involved in a future incident similar to the 2010 Deepwater Horizon accident, the Company could suffer significant financial losses that could severely impair the Company. Protections available to the Company through contractual terms and insurance coverage may not be sufficient to protect the Company in the event we were involved in that type of an incident.
Compliance with, and rulings and litigation in connection with, environmental regulations and the environmental impacts of our or our customers' operations may adversely affect our business and operating results.
Our business is impacted by material changes in environmental laws, rulings and litigation. Our expectations regarding our compliance with environmental laws and our expenditures to comply with environmental laws, including (without limitation) our capital expenditures for environmental control equipment, are only our forecasts regarding these matters. These forecasts may be substantially different from actual results, which may be affected by factors such as: changes in law that impose new restrictions on air emissions, wastewater management, waste disposal, hydraulic fracturing, or wetland and land use practices; more stringent enforcement of existing environmental regulations; a change in our allocation or other unexpected, adverse outcomes with respect to sites where we have been named as a PRP, including (without limitation) Superfund sites; the discovery of other sites where additional expenditures may be required to comply with environmental legal obligations; and the accidental discharge of hazardous materials.
13
International, national, and state governments and agencies continue to evaluate and promulgate legislation and regulations that are focused on restricting emissions commonly referred to as greenhouse gas ("GHG") emissions. In the U.S., the EPA has taken steps to regulate GHG emissions as air pollutants under the Clean Air Act. The EPA's Greenhouse Gas Reporting Rule requires monitoring and reporting of GHG emissions from, among others, certain mobile and stationary GHG emission sources in the oil and natural gas industry, which in turn may include data from some of our wellsite equipment and operations. The EPA has also proposed other related GHG emission standards that are applicable to the oil and natural gas industry, including several targeting methane, some of which have been adopted. The impact of these standards on our business, both proposed and adopted, remains unclear given recent actions taken by Congress and the current U.S. Administration. Other developments focused on restricting GHG emissions include the United Nations Framework Convention on Climate Change, which includes the Paris Agreement and the Kyoto Protocol; the European Union Emission Trading System; and, the United Kingdom's Carbon Reduction Commitment which affects more than 40 Baker Hughes facilities. Other regulatory changes have been proposed related to climate change including emissions trading schemes, carbon taxes and emissions reduction targets in various areas across the globe.
We are unable to predict whether proposed changes in laws or regulations will ultimately occur or what the adopted and proposed changes will ultimately require, and accordingly, we are unable to assess the potential financial or operational impact they may have on our business. In addition, current or future legislation, regulations and developments may curtail production and demand for hydrocarbons such as oil and natural gas in areas of the world where our customers operate and thus adversely affect future demand for our services, which may in turn adversely affect future results of operations.
We may be subject to litigation if another party claims that we have infringed upon its intellectual property rights.
The tools, techniques, methodologies, programs and components we use to provide our services may infringe upon the intellectual property rights of others. Infringement claims generally result in significant legal and other costs and may distract management from running our core business. Royalty payments under licenses from third parties, if available, would increase our costs. Additionally, developing non-infringing technologies would increase our costs. If a license were not available, we might not be able to continue providing a particular service or product, which could adversely affect our financial condition, results of operations and cash flows.
Uninsured claims and litigation against us could adversely impact our operating results.
We could be impacted by the outcome of pending litigation as well as unexpected litigation or proceedings. We have insurance coverage against operating hazards, including product liability claims and personal injury claims related to our products, to the extent deemed prudent by our management and to the extent insurance is available; however, no assurance can be given that the nature and amount of that insurance will be sufficient to fully indemnify us against liabilities arising out of pending and future claims and litigation. This insurance has deductibles or self-insured retentions and contains certain coverage exclusions. The insurance does not cover damages from breach of contract by us or based on alleged fraud or deceptive trade practices. In addition, the following risks apply with respect to our insurance coverage:
• | we may not be able to continue to obtain insurance on commercially reasonable terms; |
• | we may be faced with types of liabilities that will not be covered by our insurance; |
• | our insurance carriers may not be able to meet their obligations under the policies; or |
• | the dollar amount of any liabilities may exceed our policy limits. |
Whenever possible, we obtain agreements from customers that limit our liability. However, state law, laws or public policy in countries outside the U.S., or the negotiated terms of the agreement with the customer may not recognize those limitations of liability and/or limit the customer's indemnity obligations to the Company. In addition, insurance and customer agreements do not provide complete protection against losses and risks from an event like a well control failure that can lead to property damage, personal injury, death or the discharge of hazardous materials into the environment. Our results of operations could be adversely affected by unexpected claims not covered by insurance.
14
Control of oil and natural gas reserves by state-owned oil companies may impact the demand for our services and create additional risks in our operations.
Much of the world's oil and natural gas reserves are controlled by state-owned oil companies. State-owned oil companies may require their contractors to meet local content requirements or other local standards, such as joint ventures, that could be difficult or undesirable for the Company to meet. The failure to meet the local content requirements and other local standards may adversely impact the Company's operations in those countries. In addition, our ability to work with state-owned oil companies is subject to our ability to negotiate and agree upon acceptable contract terms.
Providing services on an integrated or turnkey basis could require the Company to assume additional risks.
Many state-owned oil companies and other operators may require integrated contracts or turnkey contracts and the Company may choose to provide services outside its core business. Providing services on an integrated or turnkey basis generally subjects the Company to additional risks, such as costs associated with unexpected delays or difficulties in drilling or completion operations and risks associated with subcontracting arrangements.
Currency fluctuations or devaluations may impact our operating results.
Fluctuations or devaluations in foreign currencies relative to the U.S. Dollar can impact our revenue and our costs of doing business. Most of our products and services are sold through contracts denominated in U.S. Dollars or local currency indexed to U.S. Dollars; however, some of our revenue, local expenses and manufacturing costs are incurred in local currencies and therefore changes in the exchange rates between the U.S. Dollar and foreign currencies can increase or decrease our revenue and expenses reported in U.S. Dollars and may impact our results of operations.
Changes in economic and/or market conditions may impact our ability to borrow and/or cost of borrowing.
The condition of the capital markets and equity markets in general can affect the price of our common stock and our ability to obtain financing, if necessary. If the Company's credit rating is downgraded, this could increase borrowing costs under our credit facility and commercial paper program, as well as the cost of renewing or obtaining, or make it more difficult to renew or obtain or issue new debt financing.
Our restructuring activities may not achieve the results we expect and could increase, which could materially and adversely affect our results of operations and financial condition.
During 2015 and 2016, we implemented a number of restructuring activities to reduce expenses, which included a reduction in our workforce, the termination of various contracts, the closing or abandoning of certain facilities, the downsizing of our presence in select markets and the contribution of our North American onshore pressure pumping business to BJ Services, LLC. There can be no assurance that our restructuring activities will produce the cost savings we anticipate in the expected timeframe or that the cumulative restructuring activities and charge will not have to increase in order to achieve our cost savings targets. Any delay or failure to achieve the expected cost savings and any increase in our anticipated cumulative restructuring activities and charge would likely cause our future earnings to be lower than anticipated.
The BJ Services, LLC venture may not achieve the results we expect and could result in a loss of our investment in the North America onshore pressure pumping business.
The Company will no longer control its North America onshore pressure pumping business and must rely on the management of BJ Services, LLC to operate that business. Poor performance or additional government regulation of that business could result in lower profitability than expected and could ultimately result in a loss of the investment the Company has in the business through its ownership of the LLC. This investment, and the related earnings, will be excluded from our North America segment.
15
Risk Factors Related to the GE Transaction
Our expectations regarding our business may be impacted by the following risk factors related to the pending GE Transaction:
The pendency of the GE Transaction could adversely affect our business.
In connection with the GE Transaction, some of our suppliers and customers may delay or defer sales and purchasing decisions, which could negatively impact revenues, earnings and cash flows regardless of whether the GE Transaction is completed. We have agreed in the Transaction Agreement to refrain from taking certain actions with respect to our business and financial affairs during the pendency of the GE Transaction, which restrictions could be in place for an extended period of time if completion of the GE Transaction is delayed and could adversely impact our financial condition, results of operations or cash flows. These restrictions may prevent us from pursuing otherwise attractive business opportunities and making other changes to our business before completion of the GE Transaction or termination of the Transaction Agreement. The process of seeking to accomplish the GE Transaction could also divert the focus of our management from pursuing other opportunities that could be beneficial to us.
The pursuit of the GE Transaction and the preparation for the integration of Baker Hughes and GE O&G have placed, and will continue to place, a significant burden on our management and internal resources. There is a significant degree of difficulty and management distraction inherent in the process of seeking to close the GE Transaction and integrate Baker Hughes and GE O&G, which could cause an interruption of, or loss of momentum in, the activities of our existing business, regardless of whether the GE Transaction is eventually completed. Our management team will be required to devote considerable amounts of time to this integration process, which will decrease the time they will have to manage our existing businesses, service existing customers, attract new customers and develop new products, services or strategies. One potential consequence of such distractions could be the failure of management to realize other opportunities that could be beneficial to us. If our senior management is not able to effectively manage the process leading up to and immediately following Closing, or if any significant business activities are interrupted as a result of the integration process, the business of Baker Hughes could suffer.
We may be unable to attract and retain key employees during the pendency of the GE Transaction.
In connection with the GE Transaction, current and prospective employees of Baker Hughes may experience uncertainty about their future roles with Baker Hughes, a GE Company following the GE Transaction ("New Baker Hughes"), which may materially adversely affect our ability to attract and retain key personnel during the pendency of the GE Transaction. Key employees may depart because of issues relating to the uncertainty and difficulty of integration or a desire not to remain with New Baker Hughes following the Transaction. The departure of existing key employees or the failure of potential key employees to accept employment with New Baker Hughes, despite our recruiting efforts, could have a material adverse impact on our business, financial condition and operating results, regardless of whether the GE Transaction is eventually completed.
The GE Transaction may not be completed on the terms or timeline currently contemplated, or at all, and failure to complete the GE Transaction may result in material adverse consequences to our business and operations.
The GE Transaction is subject to several closing conditions, including the adoption of the Transaction Agreement by our stockholders, the expiration or termination of any applicable waiting period under the U.S. Hart-Scott-Rodino Antitrust Improvements Act of 1976, as amended (the "HSR Act") and the receipt of regulatory approvals in certain other jurisdictions. The closing conditions also include the delivery by GE to us of the audited financial statements of GE O&G and the absence of differences between such audited financial statements and the unaudited financial statements of GE O&G that were delivered by GE to us prior to the date of the Transaction Agreement that are material to the intrinsic value of GE O&G (as determined in a manner consistent with appropriate valuation methodologies), excluding changes in goodwill and certain other exclusions. If any one of these conditions is not satisfied or waived, the GE Transaction may not be completed. There is no assurance that the GE Transaction will be completed on the terms or timeline currently contemplated, or at all.
The parties have not yet obtained all regulatory clearances, consents and approvals required to complete the GE Transaction. Governmental or regulatory agencies could still seek to block or challenge the GE Transaction or
16
could impose restrictions they deem necessary or desirable in the public interest as a condition to approving the GE Transaction. These restrictions could include a requirement to sell certain specified businesses that GE is obligated under the terms of the Transaction Agreement to divest if necessary to obtain such regulatory approvals. If these approvals are not received, then neither we nor GE will be obligated to complete the GE Transaction. If the approvals could be received, but the applicable regulatory agency is not satisfied that a qualified buyer has been found or imposes on a party any antitrust action that would have an effect exceeding $200 million in revenue for the twelve months ended December 31, 2015 (other than with respect to the divestiture of certain specified businesses, which are not subject to the preceding limitations), GE would not be required to agree to undertake such actions and neither we nor GE would be obligated to complete the GE Transaction.
If our stockholders do not approve and adopt the Transaction Agreement or if the GE Transaction is not completed for any other reason, we would be subject to a number of risks, including the following:
• | the attention of our management may have been diverted to the GE Transaction instead of on our operations and pursuit of other opportunities that may have been beneficial to us; |
• | resulting negative customer perception could adversely affect our ability to compete for, or to win, new and renewal business in the marketplace; |
• | we and our stockholders would not realize the anticipated benefits of the GE Transaction, including a special one-time cash dividend of $17.50 per share of Newco Class A Common Stock and any anticipated synergies from combining our business with GE O&G; |
• | we may be required to pay a termination fee of $750 million if the Transaction Agreement is terminated in the case of certain events described in the Transaction Agreement, including due to an adverse change in our board of directors' recommendation to our stockholders to approve the GE Transaction; |
• | the trading price of our common stock may experience increased volatility to the extent that the current market prices reflect a market assumption that the GE Transaction will be completed; or |
• | the Company could be subject to litigation from shareholders related to the Transaction Agreement. |
The occurrence of any of these events individually or in combination could have a material adverse effect on our results of operations or the trading price of our common stock.
Even if the GE Transaction is closed, the integration of Baker Hughes and GE O&G following the Closing will present significant challenges that may result in a decline in the anticipated benefits of the GE Transaction.
The GE Transaction involves the combination of two businesses that currently operate as independent businesses. New Baker Hughes will be required to devote management attention and resources to integrating its business practices and operations, and prior to the GE Transaction, management attention and resources will be required to plan for such integration. Potential difficulties New Baker Hughes may encounter in the integration process include the following:
• | the inability to successfully integrate the two businesses, including operations, technologies, products and services, in a manner that permits New Baker Hughes to achieve the cost savings and operating synergies anticipated to result from the GE Transaction, which could result in the anticipated benefits of the GE Transaction not being realized partly or wholly in the time frame currently anticipated or at all; |
• | lost sales and customers as a result of certain customers of either or both of the two businesses deciding not to do business with New Baker Hughes, or deciding to decrease their amount of business in order to reduce their reliance on a single company; |
• | the necessity of coordinating geographically separated organizations, systems and facilities; |
• | potential unknown liabilities and unforeseen increased expenses, delays or regulatory conditions associated with the GE Transaction; |
17
• | integrating personnel with diverse business backgrounds and business cultures, while maintaining focus on providing consistent, high-quality products and services; |
• | consolidating and rationalizing information technology platforms and administrative infrastructures as well as accounting systems and related financial reporting activities; |
• | preserving important relationships of both Baker Hughes and GE O&G and resolving potential conflicts that may arise; and |
• | performance shortfalls at one or both of Baker Hughes and GE O&G as a result of the diversion of management's attention caused by completing the GE Transaction and integrating the two businesses' operations. |
The Transaction Agreement contains provisions that may discourage other companies from trying to acquire us.
The Transaction Agreement contains provisions that may discourage third parties from submitting business combination proposals to us that might result in greater value to our stockholders than the GE Transaction. The Transaction Agreement generally prohibits us from soliciting any competing acquisition proposal. In addition, if the Transaction Agreement is terminated by us or GE in circumstances that obligates us to pay a termination fee and to reimburse transaction expenses to GE, our financial condition may be adversely affected as a result of the payment of the termination fee and transaction expenses, which might deter third parties from proposing alternative business combination proposals.
ITEM 1B. UNRESOLVED STAFF COMMENTS
None.
ITEM 2. PROPERTIES
We own or lease numerous properties throughout the world. We consider our manufacturing plants, equipment assembly, maintenance and overhaul facilities, grinding plants, drilling fluids and chemical processing centers, and primary research and technology centers to be our principal properties. The following sets forth the location of our principal owned or leased facilities for our oilfield operations and Industrial Services segments as of December 31, 2016:
North America: | Houston, Pasadena, and The Woodlands, Texas; Broken Arrow, Claremore, Tulsa and Sand Springs, Oklahoma; Bossier City, Broussard, and Lafayette, Louisiana - all located in the United States; and Leduc, Canada | |
Europe/Africa/Russia Caspian: | Aberdeen, Scotland; Liverpool, England; Celle, Germany; Tananger, Norway; Port Harcourt, Nigeria; Luanda, Angola; Tyumen and Novosibirsk, Russia | |
Middle East/Asia Pacific: | Dubai, United Arab Emirates; Dhahran, Saudi Arabia; Singapore, Singapore; Chonburi, Thailand; and Hsinchu, Taiwan | |
Industrial Services: | Pasadena, Texas; Sand Springs and Barnsdall, Oklahoma; Taft, California; and Liverpool, England | |
We own or lease numerous other facilities such as service centers, blend plants, workshops and sales and administrative offices throughout the geographic regions in which we operate. We also have a significant investment in service vehicles, tools and manufacturing and other equipment. All of our owned properties are unencumbered. We believe that our facilities are well maintained and suitable for their intended purposes.
18
ITEM 3. LEGAL PROCEEDINGS
We are subject to a number of lawsuits and claims arising out of the conduct of our business. The ability to predict the ultimate outcome of such matters involves judgments, estimates and inherent uncertainties. We record a liability for those contingencies where the incurrence of a loss is probable and the amount can be reasonably estimated, including accruals for self-insured losses which are calculated based on historical claim data, specific loss development factors and other information. A range of total possible losses for all litigation matters cannot be reasonably estimated. Based on a consideration of all relevant facts and circumstances, we do not expect the ultimate outcome of any currently pending lawsuits or claims against us will have a material adverse effect on our financial position, results of operations or cash flows; however, there can be no assurance as to the ultimate outcome of these matters.
We insure against risks arising from our business to the extent deemed prudent by our management and to the extent insurance is available, but no assurance can be given that the nature and amount of that insurance will be sufficient to fully indemnify us against liabilities arising out of pending or future legal proceedings or other claims. Most of our insurance policies contain deductibles or self-insured retentions in amounts we deem prudent and for which we are responsible for payment. In determining the amount of self-insurance, it is our policy to self-insure those losses that are predictable, measurable and recurring in nature, such as claims for automobile liability, general liability and workers compensation.
The following lawsuits were filed in Delaware in connection with our Merger with Halliburton. Subsequent to the filing of the lawsuits, on April 30, 2016, the Merger Agreement with Halliburton was terminated as described in Note 2. "Halliburton Terminated Merger Agreement."
• | On November 24, 2014, Gary Molenda, a purported shareholder of the Company, filed a class action lawsuit in the Court of Chancery of the State of Delaware ("Delaware Chancery Court") against Baker Hughes, the Company's Board of Directors, Halliburton, and Red Tiger LLC, a wholly owned subsidiary of Halliburton ("Red Tiger" and together with all defendants, "Defendants") styled Gary R. Molenda v. Baker Hughes, Inc., et al., Case No. 10390-CB. |
• | On November 26, 2014, a second purported shareholder of the Company, Booth Family Trust, filed a substantially similar class action lawsuit in Delaware Chancery Court. |
• | On December 1, 2014, New Jersey Building Laborers Annuity Fund and James Rice, two additional purported shareholders of the Company, filed substantially similar class action lawsuits in Delaware Chancery Court. |
• | On December 10, 2014, a fifth purported shareholder of the Company, Iron Workers Mid-South Pension Fund, filed another substantially similar class action lawsuit in the Delaware Chancery Court. |
• | On December 24, 2014, a sixth purported shareholder of the Company, Annette Shipp, filed another substantially similar class action lawsuit in the Delaware Chancery Court. |
All of the lawsuits make substantially similar claims. The plaintiffs generally allege that the members of the Company's Board of Directors breached their fiduciary duties to our shareholders in connection with the Merger negotiations by entering into the Merger Agreement and by approving the Merger, and that the Company, Halliburton, and Red Tiger aided and abetted the purported breaches of fiduciary duties. More specifically, the lawsuits allege that the Merger Agreement provides inadequate consideration to our shareholders, that the process resulting in the Merger Agreement was flawed, that the Company's directors engaged in self-dealing, and that certain provisions of the Merger Agreement improperly favor Halliburton and Red Tiger, precluding or impeding third parties from submitting potentially superior proposals, among other things. The lawsuit filed by Annette Shipp also alleges that our Board of Directors failed to disclose material information concerning the proposed Merger in the preliminary registration statement on Form S-4. On January 7, 2015, James Rice amended his complaint, adding similar allegations regarding the disclosures in the preliminary registration statement on Form S-4. The lawsuits seek unspecified damages, injunctive relief enjoining the Merger, and rescission of the Merger Agreement, among other relief. On January 23, 2015, the Delaware lawsuits were consolidated under the caption In re Baker Hughes Inc. Stockholders Litigation, Consolidated C.A. No. 10390-CB (the "Consolidated Case"). Pursuant to the Court's consolidation order, plaintiffs filed a consolidated complaint on February 4, 2015, which alleges substantially similar claims and seeks substantially similar relief to that raised in the six individual complaints, except that while Baker Hughes is named as a defendant, no claims are asserted against the Company.
19
On March 18, 2015, the parties reached an agreement in principle to settle the Consolidated Case in exchange for the Company making certain additional disclosures. Those disclosures were contained in a Form 8-K filed with the SEC on March 18, 2015. The settlement was made subject to certain conditions, including consummation of the Merger, final documentation, and court approval. With the termination of the Merger Agreement with Halliburton, the March 18, 2015 settlement agreement is rendered null and void. On May 31, 2016, the Consolidated Case and the claims asserted therein were dismissed, save and except for plaintiffs counsel's Fee and Expense Application to the Delaware Chancery Court. On October 13, 2016, the Delaware Chancery Court ruled on plaintiffs counsel's Fee and Expense Application. The amount awarded does not have a material impact on our financial position, results of operations or cash flows.
On October 9, 2014, one of our subsidiaries filed a Request for Arbitration against a customer before the London Court of International Arbitration, pursuing claims for the non-payment of invoices for goods and services provided in an amount provisionally quantified to exceed $67.9 million. In our Request for Arbitration, we also noted that invoices in an amount exceeding $57 million had been issued to the customer, and would be added to the claim in the event that they became overdue. On November 6, 2014, the customer filed its Response and Counterclaim, denying liability and counterclaiming damages for breach of contract of approximately $182 million. On March 31, 2016, the parties agreed to a settlement principally involving the purchase by the customer of certain inventory held by our subsidiary, with all other claims and counterclaims being released and discharged by each party, and the arbitral proceedings being discontinued. On April 18, 2016, all claims and counterclaims filed in the London Court of International Arbitration were released and discontinued. The settlement did not have a material impact on our financial position, results of operations or cash flows.
During 2014, we received customer notifications related to a possible equipment failure in a natural gas storage system in Northern Germany, which includes certain of our products. We are currently investigating the cause of the possible failure and, if necessary, possible repair and replacement options for our products. Similar products were utilized in other natural gas storage systems for this and other customers. The customer initiated arbitral proceedings against us on June 19, 2015, under the rules of the German Institute of Arbitration e.V. (DIS). On August 3, 2016, the customer amended its claims and now alleges damages of approximately $224 million plus interest at an annual rate of prime + 5%. A hearing before the arbitration panel was held January 16, 2017 through January 23, 2017, and an additional hearing is scheduled for March 20, 2017 and March 21, 2017. In addition, on September 21, 2015, TRIUVA Kapitalverwaltungsgesellschaft mbH filed a lawsuit in the United States District Court for the Southern District of Texas Houston Division against the Company and Baker Hughes Oilfield Operations, Inc. alleging that the plaintiff is the owner of gas storage caverns in Etzel, Germany in which the Company provided certain equipment in connection with the development of the gas storage caverns. The plaintiff further alleges that the Company supplied equipment that was either defectively designed or failed to warn of risks that the equipment posed, and that these alleged defects caused damage to the plaintiff's property. The plaintiff seeks recovery of alleged compensatory and punitive damages of an unspecified amount, in addition to reasonable attorneys' fees, court costs and pre-judgment and post-judgment interest. The allegations in this lawsuit are related to the claims made in the June 19, 2015 German arbitration referenced above. At this time, we are not able to predict the outcome of these claims or whether either will have any material impact on our financial position, results of operations or cash flows.
On August 31, 2015, a customer of one of the Company's subsidiaries issued a Letter of Claim pursuant to a Construction and Engineering Contract. The customer had claimed $369 million plus loss of production resulting from a breach of contract related to five electric submersible pumps installed by the subsidiary in Europe. On January 29, 2016, the Customer served its Statement of Claim, Case No. CL-2015-00584, in the Commercial Court Queen's Bench Division of the High Court of Justice. On September 20, 2016, the parties entered a settlement agreement by which all claims were released and discharged by each party. On October 6, 2016, the Commercial Court entered a Consent Order dismissing all claims in the litigation. The settlement did not have a material impact on our financial position, results of operations or cash flows.
On October 30, 2015, Chieftain Sand and Proppant Barron, LLC initiated arbitration against our subsidiary, Baker Hughes Oilfield Operations, Inc., in the American Arbitration Association. The Claimant alleged that the Company failed to purchase the required sand tonnage for the contract year 2014-2015 and further alleged that the Company repudiated its yearly purchase obligations over the remaining contract term. The Claimant alleged damages of approximately $110 million plus interest, attorneys' fees and costs. On June 2, 2016, the parties agreed to a settlement of all claims and counterclaims asserted in the Arbitration. The settlement did not have a material impact on our financial position, results of operations or cash flows.
20
On April 30, 2015, a class and collective action lawsuit alleging that we failed to pay a nationwide class of workers overtime in compliance with the Fair Labor Standards Act and North Dakota law was filed titled Williams et al. v. Baker Hughes Oilfield Operations, Inc. in the U.S. District Court for the District of North Dakota. On February 8, 2016, the Court conditionally certified certain subclasses of employees for collective action treatment. We are evaluating the background facts and at this time cannot predict the outcome of this lawsuit and are not able to reasonably estimate the potential impact, if any, such outcome would have on our financial position, results of operations or cash flows.
On July 31, 2015, Rapid Completions LLC filed a lawsuit in federal court in the Eastern District of Texas against Baker Hughes Incorporated, Baker Hughes Oilfield Operations, Inc., and others claiming infringement of U.S. Patent Nos. 6,907,936; 7,134,505; 7,543,634; 7,861,774; and 8,657,009. On August 6, 2015, Rapid Completions amended its complaint to allege infringement of U.S. Patent No. 9,074,451. On September 17, 2015, Rapid Completions and Packers Plus Energy Services Inc., sued Baker Hughes Canada Company in the Canada Federal Court on related Canadian patent 2,412,072. On April 1, 2016, Rapid Completions removed U.S. Patent No. 6,907,936 from its claims in the lawsuit. On April 5, 2016, Rapid Completions filed a second lawsuit in federal court in the Eastern District of Texas against Baker Hughes Incorporated, Baker Hughes Oilfield Operations, Inc. and others claiming infringement of U.S. Patent No. 9,303,501. These patents relate primarily to certain specific downhole completions equipment. The plaintiff has requested a permanent injunction against further alleged infringement, damages in an unspecified amount, supplemental and enhanced damages, and additional relief such as attorney's fees and costs. During August and September 2016, the United States Patent and Trademark office agreed to institute an inter-partes review of U.S. Patent Nos 7,861,774; 7,134,505; 7,534,634; 6,907,936; 8,657,009; and 9,074,451. At this time, we are not able to predict the outcome of these claims or whether they will have a material impact on our financial position, results of operations or cash flows.
On April 6, 2016, a civil Complaint against Baker Hughes Incorporated and Halliburton Company was filed by the United States of America seeking a permanent injunction restraining Baker Hughes and Halliburton from carrying out the planned acquisition of Baker Hughes by Halliburton or any other transaction that would combine the two companies. The lawsuit is styled United States of America v. Halliburton Co. and Baker Hughes Inc., in the U.S. District Court for the District of Delaware, Case No. 1:16-cv-00233-UNA. The Complaint alleges that the proposed transaction between Halliburton and Baker Hughes would violate Section 7 of the Clayton Act. Subsequent to the filing of the Complaint, on April 30, 2016, the Merger Agreement with Halliburton was terminated as described in Note 2. "Halliburton Terminated Merger Agreement." On May 4, 2016, the United States filed a Notice of Voluntary Dismissal of the Complaint.
On May 30, 2013, we received a Civil Investigative Demand ("CID") from the U.S. Department of Justice ("DOJ") pursuant to the Antitrust Civil Process Act. The CID sought documents and information from us for the period from May 29, 2011 through the date of the CID in connection with a DOJ investigation related to pressure pumping services in the U.S. On May 18, 2016, we received notice from the DOJ that they have closed the investigation with no further action requested of the Company.
ITEM 4. MINE SAFETY DISCLOSURES
Our barite mining operations, in support of our drilling fluids products and services business, are subject to regulation by the federal Mine Safety and Health Administration under the Federal Mine Safety and Health Act of 1977. Information concerning mine safety violations or other regulatory matters required by Section 1503(a) of the Dodd-Frank Wall Street Reform and Consumer Protection Act and Item 104 of Regulation S-K is included in Exhibit 95 to this annual report.
21
PART II
ITEM 5. MARKET FOR REGISTRANT'S COMMON EQUITY, RELATED STOCKHOLDER MATTERS AND ISSUER PURCHASES OF EQUITY SECURITIES
Our common stock, $1.00 par value per share, is principally traded on the New York Stock Exchange. Our common stock is also traded on the SIX Swiss Exchange. As of January 31, 2017, there were approximately 8,847 stockholders of record.
For information regarding quarterly high and low sales prices on the New York Stock Exchange for our common stock during the two years ended December 31, 2016, and information regarding dividends declared on our common stock during the two years ended December 31, 2016, see Note 17. "Quarterly Data (Unaudited)" of the Notes to Consolidated Financial Statements in Item 8 herein.
The following table contains information about our purchases of equity securities during the fourth quarter of 2016.
Issuer Purchases of Equity Securities
Period | Total Number of Shares Purchased (1) | Average Price Paid Per Share (1) | Total Number of Shares Purchased as Part of a Publicly Announced Program (2) | Maximum Dollar Value of Shares that May Yet Be Purchased Under the Program (3) | ||||||||
October 1-31, 2016 | 9,640 | $ | 52.35 | — | $ | 1,237,161,230 | ||||||
November 1-30, 2016 | — | — | — | $ | 1,237,161,230 | |||||||
December 1-31, 2016 | 69,214 | 64.71 | — | $ | 1,237,161,230 | |||||||
Total | 78,854 | $ | 63.20 | — | ||||||||
(1) | Represents shares purchased from employees to satisfy the tax withholding obligations in connection with the vesting of restricted stock awards and restricted stock units. |
(2) | There were no repurchases during the fourth quarter of 2016 under our previously announced purchase program. |
(3) | Under the transaction agreement with General Electric, as described in Note 3. "General Electric Transaction Agreement" of the Notes to Consolidated Financial Statements in Item 8 herein, we have agreed not to repurchase any shares of our common stock other than in connection with shares repurchased from employees to satisfy the tax withholding obligations in connection with the vesting of equity awards. |
22
Corporate Performance Graph
The following graph compares the yearly change in our cumulative total stockholder return on our common stock (assuming reinvestment of dividends into common stock at the date of payment) with the cumulative total return on the published Standard & Poor's ("S&P") 500 Stock Index and the cumulative total return on the S&P 500 Oil and Gas Equipment and Services Index over the preceding five-year period.
Comparison of Five-Year Cumulative Total Return *
Baker Hughes Incorporated; S&P 500 Index and S&P 500 Oil and Gas Equipment and Services Index
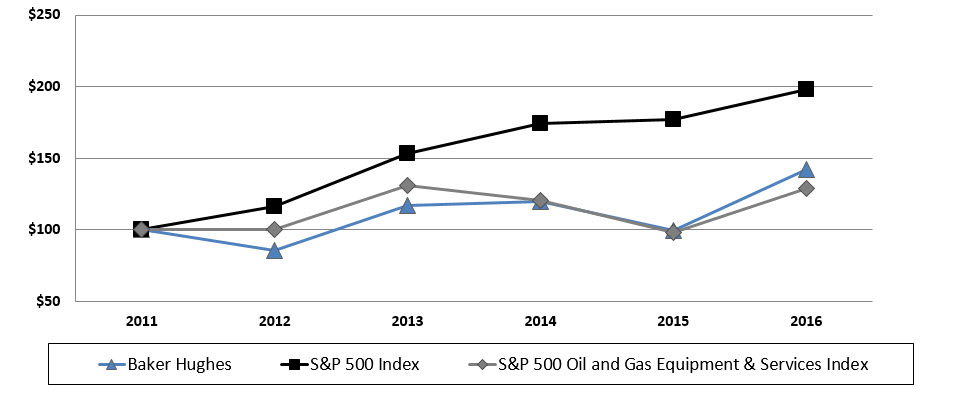
2011 | 2012 | 2013 | 2014 | 2015 | 2016 | ||||||||||||||||||
Baker Hughes | $ | 100.00 | $ | 85.18 | $ | 116.65 | $ | 119.55 | $ | 99.62 | $ | 142.17 | |||||||||||
S&P 500 Index | 100.00 | 115.93 | 153.39 | 174.29 | 176.75 | 197.75 | |||||||||||||||||
S&P 500 Oil and Gas Equipment and Services Index | 100.00 | 100.00 | 130.65 | 120.46 | 97.87 | 129.12 | |||||||||||||||||
* Total return assumes reinvestment of dividends on a quarterly basis.
The comparison of total return on investment (change in year-end stock price plus reinvested dividends) assumes that $100 was invested on December 31, 2011 in Baker Hughes common stock, the S&P 500 Index and the S&P 500 Oil and Gas Equipment and Services Index.
The corporate performance graph and related information shall not be deemed "soliciting material" or to be "filed" with the SEC, nor shall such information be incorporated by reference into any future filing under the Securities Act or the Exchange Act, except to the extent that Baker Hughes specifically incorporates it by reference into such filing.
23
ITEM 6. SELECTED FINANCIAL DATA
The Selected Financial Data should be read in conjunction with Item 7. Management's Discussion and Analysis of Financial Condition and Results of Operations and Item 8. Financial Statements and Supplementary Data, both contained herein.
Year Ended December 31, | |||||||||||||||||||
(In millions, except per share amounts) | 2016 | 2015 | 2014 | 2013 | 2012 | ||||||||||||||
Revenue | $ | 9,841 | $ | 15,742 | $ | 24,551 | $ | 22,364 | $ | 21,361 | |||||||||
Gross Profit | (516 | ) | 861 | 4,192 | 3,255 | 3,508 | |||||||||||||
Marketing, general and administrative | 815 | 969 | 1,333 | 1,306 | 1,316 | ||||||||||||||
Impairment and restructuring charges (1) | 1,735 | 1,993 | — | — | — | ||||||||||||||
Goodwill impairment (2) | 1,858 | — | — | — | — | ||||||||||||||
Merger and related costs | 199 | 295 | — | — | — | ||||||||||||||
Merger termination fee (3) | (3,500 | ) | — | — | — | — | |||||||||||||
Operating (loss) income | (1,623 | ) | (2,396 | ) | 2,859 | 1,949 | 2,192 | ||||||||||||
Non-operating expense, net | (417 | ) | (217 | ) | (232 | ) | (234 | ) | (210 | ) | |||||||||
(Loss) income before income taxes | (2,040 | ) | (2,613 | ) | 2,627 | 1,715 | 1,982 | ||||||||||||
Income tax (provision) benefit | (696 | ) | 639 | (896 | ) | (612 | ) | (665 | ) | ||||||||||
Net (loss) income | (2,736 | ) | (1,974 | ) | 1,731 | 1,103 | 1,317 | ||||||||||||
Net (income) loss attributable to noncontrolling interests | (2 | ) | 7 | (12 | ) | (7 | ) | (6 | ) | ||||||||||
Net (loss) income attributable to Baker Hughes | $ | (2,738 | ) | $ | (1,967 | ) | $ | 1,719 | $ | 1,096 | $ | 1,311 | |||||||
Per share of common stock: | |||||||||||||||||||
Net (loss) income attributable to Baker Hughes: | |||||||||||||||||||
Basic | $ | (6.31 | ) | $ | (4.49 | ) | $ | 3.93 | $ | 2.47 | $ | 2.98 | |||||||
Diluted | (6.31 | ) | (4.49 | ) | 3.92 | 2.47 | 2.97 | ||||||||||||
Dividends | 0.68 | 0.68 | 0.64 | 0.60 | 0.60 | ||||||||||||||
Balance Sheet Data: | |||||||||||||||||||
Cash, cash equivalents and short-term investments | $ | 4,572 | $ | 2,324 | $ | 1,740 | $ | 1,399 | $ | 1,015 | |||||||||
Working capital (current assets minus current liabilities) | 6,863 | 6,493 | 7,408 | 6,717 | 6,293 | ||||||||||||||
Total assets | 19,034 | 24,080 | 28,827 | 27,934 | 26,689 | ||||||||||||||
Long-term debt | 2,886 | 3,890 | 3,913 | 3,882 | 3,837 | ||||||||||||||
Total equity | 12,737 | 16,382 | 18,730 | 17,912 | 17,268 | ||||||||||||||
Notes To Selected Financial Data
(1) | Impairment and restructuring charges associated with asset impairments, workforce reductions, facility closures and contract terminations recorded during 2015 and 2016. See Note 4. "Impairment and Restructuring Charges" of the Notes to Consolidated Financial Statements in Item 8 herein for further discussion. |
(2) | Goodwill impairment recognized in the second and third quarters of 2016. See Note 12. "Goodwill and Intangible Assets" of the Notes to Consolidated Financial Statements in Item 8 herein for further discussion. |
(3) | Merger termination fee received from Halliburton. See Note 2. "Halliburton Terminated Merger Agreement" of the Notes to Consolidated Financial Statements in Item 8 herein for further discussion. |
24
ITEM 7. MANAGEMENT'S DISCUSSION AND ANALYSIS OF FINANCIAL CONDITION AND RESULTS OF OPERATIONS
Management's Discussion and Analysis of Financial Condition and Results of Operations ("MD&A") should be read in conjunction with the consolidated financial statements included in Item 8. Financial Statements and Supplementary Data contained herein.
EXECUTIVE SUMMARY
Baker Hughes is a leading supplier of oilfield services, products, technology and systems used in the worldwide oil and natural gas industry, referred to as our oilfield operations. We manage our oilfield operations through four geographic segments consisting of North America, Latin America, Europe/Africa/Russia Caspian, and Middle East/Asia Pacific. Our Industrial Services businesses are reported in a fifth segment. As of December 31, 2016, Baker Hughes had approximately 33,000 employees compared to approximately 43,000 employees as of December 31, 2015.
Within our oilfield operations, the primary driver of our businesses is our customers' capital and operating expenditures dedicated to oil and natural gas exploration, field development and production. The main products and services provided by oilfield operations fall into one of two categories, Drilling and Evaluation or Completion and Production. This classification is based on the two major phases of constructing an oil and/or natural gas well, the drilling phase and the completion phase, and how our products and services are utilized in each phase. We also provide products and services to the downstream chemicals, and process and pipeline services, referred to as Industrial Services.
During 2016, we continued to face difficult industry conditions as commodity prices deteriorated to levels not seen in more than a decade. Activity declined across the globe as reflected by the worldwide rig count, which decreased 32% as compared to the 2015 average. Customers continued to reduce spending to cope with this challenging low-commodity price environment, resulting in further price deterioration for our products and services. The steady decline in U.S. oil production along with the production cuts announced during the fourth quarter of 2016 by OPEC and certain non-OPEC countries drove oil prices higher resulting in an 11% increase when comparing the fourth quarter closing price for West Texas Intermediate Cushing Crude of $53.72/Bbl to the third quarter closing price of $48.24/Bbl. This increase stimulated improvement in activity in the North America market as evidenced by the 29% growth in the rig count in the fourth quarter of 2016 as compared to the third quarter of 2016. Despite this improvement, there has yet to be any meaningful increase in the prices we are able to charge for our products and services, and thus the impact on our profitability has been minimal. International and deep water activity continued to decline in the fourth quarter, as most operators are awaiting for a sustainable rebalancing of the oil market before increasing activity.
Against the back-drop of another difficult year for the industry, we achieved significant progress on our commitment to improve financial performance by reducing costs and simplifying our operational structure, optimizing our capital structure, and strengthening our commercial strategy. More specifically, we generated $4.23 billion of cash flows from operations, which includes the $3.5 billion Halliburton merger termination fee, paid down $1.0 billion in debt, repurchased $763 million in shares, accelerated innovation with over 100 new product introductions, and built new sales channels to take our products and technology to market faster and more efficiently. As we executed on our strategy to strengthen profitability and return on invested capital, we rationalized under-performing product lines in select markets based on our objectives of profitable growth. While these reductions have had minimal impact on our revenue they have had a positive impact on operating profitability. In addition, we contributed our North American onshore pressure pumping business into a new venture that is better positioned to participate efficiently and cost-effectively in the anticipated growth of this market segment.
For 2016, we generated revenue of $9.84 billion, a decrease of $5.90 billion, or 37%, compared to 2015. Net loss attributable to Baker Hughes was $2.74 billion for 2016 compared to $1.97 billion for 2015. The steep decline in activity, as evidenced by the 32% decline in the average global rig count year-over-year, and price deterioration experienced across all our segments are the main drivers for the decline in revenue and profitability. We have continued to restructure and adjust our operations and cost structure to reflect reduced activity levels. As a result of these restructuring activities, we recorded charges totaling $1.17 billion in 2016, which included workforce reductions, contract terminations, facility closures and the write-down of excess machinery and equipment. In
25
addition to our restructuring activities, as a result of the downturn in the energy market and its impact on our business outlook, we determined that the carrying amount of certain assets exceeded their respective fair values; therefore, we recorded an impairment charge of $567 million. Further, we recorded goodwill impairment charges primarily related to our North America reporting unit totaling $1.86 billion. These charges have been excluded from the results of our operating segments.
OUTLOOK
Oil prices started to rebound in the fourth quarter of 2016 as a result of the announced supply cut agreements by OPEC and 11 non-OPEC producers, and a modest increase in the forecasted demand for oil. However, North American production remains uncertain due to the unpredictable actions of North American shale operators who can bring on production and impact commodity prices much more quickly than their peers in other operating environments. Since details of OPEC’s plans surfaced in October, rig counts for the fourth quarter of 2016 increased by 23% in the U.S. compared to the third quarter of 2016, with a corresponding increase in U.S. shale production already materializing. Therefore, the operators' ability to quickly get resources from the ground into production could limit near-term commodity price gains. This North America dynamic, combined with questions about OPEC's ability to implement and sustain these cuts, leave room for skepticism that these agreed-upon production cuts could lead to a more sustainable improvement in oil prices, and in turn, to a more material increase in spending by exploration and production companies.
While some are more optimistic about the prospects for the near-term recovery, we continue to believe that oil prices sustained in the mid-to-high $50s are required for confidence in the customer community to improve and investment to accelerate. Also, activity needs to increase meaningfully before excess service capacity can be substantially absorbed and meaningful pricing recovery takes place. We are seeing the first signs of this in select product lines in a few of the North American basins, but we still believe there remains a fair amount of capacity that must be absorbed before service pricing will become more tightly correlated with higher commodity prices and increased activity.
Further, we believe recovery paths will vary depending on the location and operating environment. In the North American market, onshore activity continues to climb upward, and we expect that trend to continue through 2017. Conversely, in offshore markets around the world, where full cycle lifting costs are higher, particularly deepwater, we expect activity to remain challenging with more declines expected in 2017. Overall, internationally we expect the market to be flat to down slightly in the first half of 2017, with continued activity declines and pricing pressure near-term, partially offset by pockets of moderate growth onshore. As a result of the expected continued market variability, we believe our tax rate will continue to be volatile.
Despite the near-term volatility, the long-term outlook for our industry remains strong. We believe the world’s demand for energy will continue to rise, and the supply of energy will continue to increase in complexity, requiring greater service intensity and more advanced technology from oilfield service companies. As such, we remain focused on delivering innovative cost-efficient solutions that deliver step changes in operating and economic performance for our customers.
HALLIBURTON TERMINATED MERGER AGREEMENT
On November 16, 2014, Baker Hughes and Halliburton Company ("Halliburton") entered into a definitive agreement and plan of merger (the "Merger Agreement") under which Halliburton would acquire all outstanding shares of Baker Hughes in a stock and cash transaction (the "Merger"). In accordance with the provisions of Section 9.1 of the Merger Agreement, Baker Hughes and Halliburton agreed to terminate the Merger Agreement on April 30, 2016, as a result of the failure of the Merger to occur on or before April 30, 2016, due to the inability to obtain certain specified antitrust related approvals. Halliburton paid $3.5 billion to Baker Hughes on May 4, 2016, representing the antitrust termination fee required to be paid pursuant to the Merger Agreement. For further information about the Merger, see Note 2. "Halliburton Terminated Merger Agreement" of the Notes to Consolidated Financial Statements in Item 8 herein.
26
GENERAL ELECTRIC TRANSACTION AGREEMENT
On October 30, 2016, Baker Hughes, GE, Newco and Merger Sub entered into a Transaction Agreement and Plan of Merger, pursuant to which, among other things, GE’s oil and gas business and Baker Hughes will be combined and operate under the name "Baker Hughes, a GE Company". The GE Transaction is subject to the approval of Baker Hughes’ stockholders, regulatory approvals and customary closing conditions. Baker Hughes and GE expect the GE Transaction to close in mid-2017. However, Baker Hughes cannot predict with certainty when, or if, the GE Transaction will be completed because completion of the GE Transaction is subject to conditions beyond the control of Baker Hughes. For further information about the transaction, see Note 3. "General Electric Transaction Agreement" of the Notes to Consolidated Financial Statements in Item 8 herein. Newco will operate as a public company.
BUSINESS ENVIRONMENT
We conduct business in more than 80 countries helping customers find, evaluate, drill, produce, transport and process hydrocarbon resources. Our revenue is predominately generated from the sale of products and services to major, national, and independent oil and natural gas companies worldwide, and is dependent on spending by our customers for oil and natural gas exploration, field development and production. This spending is dependent on a number of factors, including our customers' forecasts of future energy demand and supply, their access to resources to develop and produce oil and natural gas, their ability to fund their capital programs, the impact of new government regulations and most importantly, their expectations for oil and natural gas prices as a key driver of their cash flows.
Oil and Natural Gas Prices
Oil and natural gas prices are summarized in the table below as averages of the daily closing prices during each of the periods indicated.
2016 | 2015 | 2014 | |||||||||
Brent oil prices ($/Bbl) (1) | $ | 44.11 | $ | 52.31 | $ | 98.88 | |||||
WTI oil prices ($/Bbl) (2) | 43.34 | 48.68 | 93.03 | ||||||||
Natural gas prices ($/mmBtu) (3) | 2.49 | 2.61 | 4.35 | ||||||||
(1) | Bloomberg Dated Brent ("Brent") Oil Spot Price per Barrel |
(2) | Bloomberg West Texas Intermediate ("WTI") Cushing Crude Oil Spot Price per Barrel |
(3) | Bloomberg Henry Hub Natural Gas Spot Price per million British Thermal Unit |
Outside North America, customer spending is most heavily influenced by Brent oil prices, which fluctuated significantly throughout the year, ranging from a low of $26.39/Bbl in January 2016 to a high of $55.57/Bbl in December 2016. Oil prices bottomed early in 2016 due to the impending production increases in Iran after economic sanctions were lifted. During 2016, OPEC considered production cuts, and in the fourth quarter they announced their first agreement since 2008 to cut production. Along with OPEC's agreed-upon production cuts, other non-OPEC countries similarly agreed to reduce production. As a result, in the fourth quarter, Brent oil prices shifted meaningfully higher. In addition, demand for oil was higher than expected due to robust consumption in North America and revisions to Chinese, Russian, and European demand growth expectations.
In North America, customer spending is highly driven by WTI oil prices, which, similar to Brent oil prices, fluctuated significantly throughout the year, with the highest prices being recorded towards the end of the year. Overall, WTI oil prices ranged from a low of $26.21/Bbl in February 2016 to a high of $54.06/Bbl in December 2016.
Although oil prices have rebounded more than 100% from the previous twelve-year low of $26/Bbl reached earlier this year to near $55/Bbl at the end of the year, there has yet to be any material change in customer behavior, other than in certain U.S. basins, to suggest a near-term broader recovery in activity levels.
In North America, natural gas prices, as measured by the Henry Hub Natural Gas Spot Price, averaged $2.49/mmBtu in 2016, representing a 5% decrease over the prior year. The warmer-than-average winter at the start of
27
2016 significantly reduced demand and storage inventories hit record highs. In late 2016, once production and drilling activity tapered off and the seasonal demand picked up, the spot prices improved. According to the U.S. Department of Energy ("DOE"), working natural gas in storage at the end of 2016 was 3,311 billion cubic feet ("Bcf"), which was 9.9%, or 364 Bcf, below the corresponding week in 2015.
Baker Hughes Rig Count
The Baker Hughes rig counts are an important business barometer for the drilling industry and its suppliers. When drilling rigs are active they consume products and services produced by the oil service industry. Rig count trends are driven by the exploration and development spending by oil and natural gas companies, which in turn is influenced by current and future price expectations for oil and natural gas. Therefore, the counts may reflect the relative strength and stability of energy prices and overall market activity. However, these counts should not be solely relied on as other specific and pervasive conditions may exist that affect overall energy prices and market activity.
Baker Hughes has been providing rig counts to the public since 1944. We gather all relevant data through our field service personnel, who obtain the necessary data from routine visits to the various rigs, customers, contractors and other outside sources, as necessary. We base the classification of a well as either oil or natural gas primarily upon filings made by operators in the relevant jurisdiction. This data is then compiled and distributed to various wire services and trade associations and is published on our website. We believe the counting process and resulting data is reliable; however, it is subject to our ability to obtain accurate and timely information. Rig counts are compiled weekly for the U.S. and Canada and monthly for all international rigs. Published international rig counts do not include rigs drilling in certain locations, such as Russia, the Caspian region, Iran and onshore China because this information is not readily available.
Rigs in the U.S. and Canada are counted as active if, on the day the count is taken, the well being drilled has been started but drilling has not been completed and the well is anticipated to be of sufficient depth to be a potential consumer of our drill bits. In international areas, rigs are counted on a weekly basis and deemed active if drilling activities occurred during the majority of the week. The weekly results are then averaged for the month and published accordingly. The rig count does not include rigs that are in transit from one location to another, rigging up, being used in non-drilling activities including production testing, completion and workover, and are not expected to be significant consumers of drill bits.
The rig counts are summarized in the table below as averages for each of the periods indicated.
2016 | 2015 | 2014 | ||||||
U.S. - onshore | 490 | 948 | 1,804 | |||||
U.S. - offshore | 23 | 36 | 57 | |||||
Canada | 129 | 194 | 379 | |||||
North America | 642 | 1,178 | 2,240 | |||||
Latin America | 198 | 319 | 397 | |||||
North Sea | 28 | 37 | 40 | |||||
Continental Europe | 68 | 80 | 105 | |||||
Africa | 85 | 106 | 134 | |||||
Middle East | 390 | 406 | 406 | |||||
Asia Pacific | 187 | 220 | 254 | |||||
Outside North America | 956 | 1,168 | 1,336 | |||||
Worldwide | 1,598 | 2,346 | 3,576 | |||||
28
2016 Compared to 2015
The rig count in North America decreased 46% in 2016 compared to 2015 primarily driven by a 44% decline in oil-directed rigs, as a result of reduced spending from our customers as they adapt to a lower oil price environment. The oil-directed rig count decreased 45% in the U.S. as lower WTI prices have forced operators to reduce their exploration and development spending in order to protect their cash flows, as they focus more on production optimization opportunities. In Canada, the oil-directed rig count has decreased by 28% as many operators curtailed their drilling plans as most heavy oil sands projects are not economical at current oil prices. The natural gas-directed rig count in North America declined 50% in 2016 as natural gas well productivity improved, with natural gas-directed drilling declining 56% in the U.S. and 38% in Canada.
Outside North America, the rig count decreased 18% in 2016 compared to 2015, also driven by reduced customer spending and a lower oil price environment. The rig count in Latin America decreased 38% as a result of customer budgetary constraints across most of the region, primarily in Argentina, Mexico, Brazil, and Colombia. The North Sea rig count decreased by 24%, largely due to a decline in the drilling activity in the United Kingdom. The rig count in Continental Europe decreased by 15% as a result of reduced drilling across the area with the largest decline seen in Romania. In Africa, the rig count decreased 20%, predominantly due to reduced customer spending across the majority of the region, particularly in Nigeria, Angola, Chad, and Gabon. The rig count in the Middle East decreased 4% in 2016 due to reduced activity in Egypt and Iraq, partially offset by increased activity in Abu Dhabi. The rig count in Asia Pacific decreased 15% as a consequence of reduced drilling activity primarily in Indonesia and Australia.
2015 Compared to 2014
The rig count in North America decreased 47% in 2015 compared to 2014 primarily driven by a 52% decline in oil-directed rigs, as a result of reduced spending from our customers as they adapt to a lower oil price environment. The oil-directed rig count decreased 51% in the U.S. as lower WTI prices have forced operators to reduce their exploration and development spending in order to protect their cash flows, as they focus more on production optimization opportunities. In Canada, the oil-directed rig count has decreased by 61% as many operators curtailed their drilling plans as most heavy oil sands projects are not economical at current oil prices. The natural gas-directed rig count in North America declined 32% in 2015 as natural gas prices deteriorated 40% compared to the 2014 average, with natural gas-directed drilling declining 32% in the U.S. and 33% in Canada.
Outside North America, the rig count decreased 13% in 2015 compared to 2014, also driven by reduced customer spending and a lower oil price environment. The rig count in Latin America decreased 20% as a result of customer budgetary constraints across most of the region, primarily in Mexico, Colombia, and Ecuador. The one exception was in the emerging unconventional plays in Argentina where activity remained relatively stable in 2015. The North Sea rig count decreased by 7%, largely due to a decline in the drilling activity in the Netherlands. The rig count in Continental Europe decreased by 24%, mainly as a result of reduced drilling in Turkey and Romania. In Africa, the rig count decreased 21%, predominantly due to reduced customer spending across the majority of the region, particularly in Libya, Chad, Angola, and Nigeria. The 2015 rig count in the Middle East remained unchanged from 2014 as activity declines in Iraq and Egypt were offset by increased activity in Saudi Arabia, Oman, Abu Dhabi and Kuwait. The rig count in Asia Pacific decreased 13% as a consequence of reduced drilling activity primarily in India, Indonesia, Australia and New Zealand.
RESULTS OF OPERATIONS
The discussions below relating to significant line items from our consolidated statements of income (loss) are based on available information and represent our analysis of significant changes or events that impact the comparability of reported amounts. Where appropriate, we have identified specific events and changes that affect comparability or trends and, where reasonably practicable, have quantified the impact of such items. In addition, the discussions below for revenue and cost of revenue are on a total basis as the business drivers for product sales and services are similar. All dollar amounts in tabulations in this section are in millions of dollars, unless otherwise stated.
29
Revenue and Profit Before Tax
Revenue and operating profit (loss) before tax for each of our five operating segments is provided below. The performance of our operating segments is evaluated based on operating profit (loss) before tax, which is defined as income (loss) before income taxes and before the following: net interest expense, corporate expenses, impairment and restructuring charges, goodwill impairment charges, the merger termination fee, loss on sale of business interest, loss on early extinguishment of debt, and certain gains and losses not allocated to the operating segments.
Beginning in 2016, we excluded merger and related costs, from both the terminated Halliburton and the proposed GE transactions, from our operating segments. These costs are now presented as a separate line item in the consolidated statement of income (loss). Prior year merger and related costs have been reclassified to conform to the current year presentation.
2016 Compared to 2015
Year Ended December 31, | ||||||||||||||
2016 | 2015 | $ Change | % Change | |||||||||||
Revenue: | ||||||||||||||
North America | $ | 2,936 | $ | 6,009 | $ | (3,073 | ) | (51 | )% | |||||
Latin America | 980 | 1,799 | (819 | ) | (46 | )% | ||||||||
Europe/Africa/Russia Caspian | 2,201 | 3,278 | (1,077 | ) | (33 | )% | ||||||||
Middle East/Asia Pacific | 2,705 | 3,441 | (736 | ) | (21 | )% | ||||||||
Industrial Services | 1,019 | 1,215 | (196 | ) | (16 | )% | ||||||||
Total | $ | 9,841 | $ | 15,742 | $ | (5,901 | ) | (37 | )% | |||||
Year Ended December 31, | ||||||||||||||
2016 | 2015 | $ Change | % Change | |||||||||||
Operating Profit (Loss) Before Tax: | ||||||||||||||
North America | $ | (687 | ) | $ | (639 | ) | $ | (48 | ) | (8 | )% | |||
Latin America | (276 | ) | 144 | (420 | ) | (292 | )% | |||||||
Europe/Africa/Russia Caspian | (273 | ) | 183 | (456 | ) | (249 | )% | |||||||
Middle East/Asia Pacific | 69 | 229 | (160 | ) | (70 | )% | ||||||||
Industrial Services | (6 | ) | 108 | (114 | ) | (106 | )% | |||||||
Total Operations | (1,173 | ) | 25 | (1,198 | ) | N/M | ||||||||
Corporate | (158 | ) | (133 | ) | (25 | ) | 19 | % | ||||||
Loss on sale of business interest | (97 | ) | — | (97 | ) | N/M | ||||||||
Loss on early extinguishment of debt | (142 | ) | — | (142 | ) | N/M | ||||||||
Interest expense, net | (178 | ) | (217 | ) | 39 | (18 | )% | |||||||
Impairment and restructuring charges | (1,735 | ) | (1,993 | ) | 258 | (13 | )% | |||||||
Goodwill impairment | (1,858 | ) | — | (1,858 | ) | N/M | ||||||||
Merger and related costs | (199 | ) | (295 | ) | 96 | (33 | )% | |||||||
Merger termination fee | 3,500 | — | 3,500 | N/M | ||||||||||
Total | $ | (2,040 | ) | $ | (2,613 | ) | $ | 573 | (22 | )% | ||||
"N/M" represents not meaningful.
North America
North America revenue for 2016 was $2.94 billion, a decrease of $3.07 billion, or 51%, compared to 2015, primarily as a result of the steep drop in activity as reflected in the 46% year-over-year average rig count decline,
30
and to a lesser extent, deteriorating pricing conditions as operators further reduced their spending levels in 2016. All product lines have been unfavorably impacted by the drop in activity. In addition, our onshore pressure pumping business incurred share reductions, driven by efforts to reduce losses and improve cash flow in a market where pricing was unsustainable. Conversely, production chemicals reflected the smallest decrease in activity as revenue in this product line is more highly correlated to production than rig count. In addition, deepwater operations and artificial lift also showed signs of resilience.
North America operating loss before tax was $687 million in 2016, a decrease of $48 million, or 8%, compared to the $639 million operating loss in 2015. Although operating results were negatively impacted by the sharp reduction in activity and an increasingly unfavorable pricing environment, actions taken in the past year to reduce our workforce, close and consolidate facilities and improve commercial terms with vendors resulted in significantly lower operating costs. These actions to restructure our North America operations to operate in a lower activity and pricing environment, combined with the reduction of depreciation and amortization expense from asset impairments, helped mitigate the impact of the ongoing decline in revenue experienced since early 2015. Our operating results for 2016 include $230 million of costs related to writing off certain excess inventory, compared to costs of $181 million during 2015 due to lower of cost or market adjustments.
On December 30, 2016, we contributed our North American onshore pressure pumping business to a newly formed venture, of which we retained a 46.7% interest and accounted for as an equity method investment. This investment, and the related earnings, will be excluded from our operating segments. For further information, see Note 5. "Acquisitions and Dispositions" of the Notes to Consolidated Financial Statements in Item 8 herein.
Latin America
Latin America revenue for 2016 was $980 million, a decrease of $819 million, or 46%, compared to 2015. The reduction in this segment is attributed to activity declines across the region as evident in the 38% drop in the rig count. Activity has declined across the entire segment and across all product lines. The largest year-over-year declines were pressure pumping in Argentina, artificial lift in the Andean Area, and drilling services in Brazil and Mexico.
Latin America operating loss before tax was $276 million in 2016, a decrease of $420 million, or 292%, compared to operating profit before tax of $144 million in 2015. The reduction in profitability is mainly attributed to the decline in activity, and to a lesser extent price, which was exacerbated by an increase of $96 million for provisions for doubtful accounts year-over-year, almost entirely in Ecuador. Additionally, we incurred costs of $84 million in 2016 to write off the carrying value of certain excess inventory compared to $13 million in 2015. The reduction in profitability was partially mitigated by lower operating costs and depreciation and amortization expense resulting from our efforts to structurally align the segment to reflect current and expected near-term activity levels. We also benefited from reduced foreign exchanges losses.
Europe/Africa/Russia Caspian ("EARC")
EARC revenue for 2016 was $2.20 billion, a decrease of $1.08 billion, or 33%, compared to 2015. The decrease can be attributed primarily to activity reductions across all markets and product lines, with the largest decline experienced in the North Sea and West Africa, most notably in the drilling services and completion systems product lines. In addition to reduced activity in the North Sea, the region was also negatively impacted by labor union strikes in the fourth quarter of 2016. To a lesser extent, unfavorable pricing also impacted revenue. In addition, in 2016 unfavorable exchange rates, mainly for the British Pound, Nigerian Naira, Russian Ruble, Angolan Kwanza and the Norwegian Krone accounted for more than 10% of the decline in revenue. Despite the activity reductions, we did see resiliency in our production chemicals product line as a result of increased share in Africa.
EARC operating loss before tax was $273 million in 2016, a decrease of $456 million, or 249%, compared to operating profit before tax of $183 million in 2015. The decline in operating profit from lower activity levels and unfavorable pricing was compounded by valuation allowances on indirect taxes in Africa. In addition, we incurred costs of $143 million to write off certain excess inventory during 2016. These reductions in profitability were partially offset by the benefit of implemented cost reduction measures, lower depreciation and amortization expense, and reduced foreign exchange losses.
31
Middle East/Asia Pacific ("MEAP")
MEAP revenue for 2016 was $2.71 billion, a decrease of $736 million, or 21%, compared to 2015. The revenue decline in this segment was driven by lower activity across most of the region, and to a lesser extent region-wide pricing pressure. The most noticeable reductions occurred in completion systems, pressure pumping and drilling services across Asia Pacific, particularly in Australia, Malaysia and Vietnam, across all product lines in Iraq, and in deepwater operations in India. These reductions were partially offset by activity growth in Kuwait, mainly in artificial lift, drilling services and pressure pumping.
MEAP operating profit before tax decreased $160 million, or 70%, in 2016 compared to 2015. The reduction in profitability was driven largely by lower activity levels and unfavorable pricing, partially offset by operating cost reductions and lower depreciation and amortization expense from asset impairments. During 2016, we incurred costs of $117 million to write off certain excess inventory. During 2015, we incurred charges in Iraq related to our integrated operations.
Industrial Services
Industrial Services revenue was $1.02 billion, a decrease of $196 million, or 16%, compared to 2015. The decline in revenue in this segment was driven by activity reductions as customers reduced spending and delayed projects including several major pipeline construction and maintenance projects. Revenue was further negatively impacted by pricing deterioration.
Industrial Services operating loss before tax in 2016 was $6 million, a decrease 106% compared to operating profit before tax of $108 million in 2015. The reduction in profitability resulting from lower activity levels and pricing deterioration was partially offset by operating cost reductions and lower depreciation and amortization expense from asset impairments. During 2016, we incurred costs of $43 million to write off certain excess inventory.
2015 Compared to 2014
Year Ended December 31, | ||||||||||||||
2015 | 2014 | $ Change | % Change | |||||||||||
Revenue: | ||||||||||||||
North America | $ | 6,009 | $ | 12,078 | $ | (6,069 | ) | (50 | )% | |||||
Latin America | 1,799 | 2,236 | (437 | ) | (20 | )% | ||||||||
Europe/Africa/Russia Caspian | 3,278 | 4,417 | (1,139 | ) | (26 | )% | ||||||||
Middle East/Asia Pacific | 3,441 | 4,456 | (1,015 | ) | (23 | )% | ||||||||
Industrial Services | 1,215 | 1,364 | (149 | ) | (11 | )% | ||||||||
Total | $ | 15,742 | $ | 24,551 | $ | (8,809 | ) | (36 | )% | |||||
32
Year Ended December 31, | ||||||||||||||
2015 | 2014 | $ Change | % Change | |||||||||||
Operating Profit (Loss) Before Tax: | ||||||||||||||
North America | $ | (639 | ) | $ | 1,466 | $ | (2,105 | ) | (144 | )% | ||||
Latin America | 144 | 290 | (146 | ) | (50 | )% | ||||||||
Europe/Africa/Russia Caspian | 183 | 621 | (438 | ) | (71 | )% | ||||||||
Middle East/Asia Pacific | 229 | 675 | (446 | ) | (66 | )% | ||||||||
Industrial Services | 108 | 119 | (11 | ) | (9 | )% | ||||||||
Total Operations | 25 | 3,171 | (3,146 | ) | (99 | )% | ||||||||
Corporate | (133 | ) | (312 | ) | 179 | (57 | )% | |||||||
Interest expense, net | (217 | ) | (232 | ) | 15 | (6 | )% | |||||||
Impairment and restructuring charges | (1,993 | ) | — | (1,993 | ) | N/M | ||||||||
Merger and related costs | (295 | ) | — | (295 | ) | N/M | ||||||||
Total | $ | (2,613 | ) | $ | 2,627 | $ | (5,240 | ) | (199 | )% | ||||
North America
North America revenue for 2015 was $6.01 billion, a decrease of $6.07 billion, or 50%, compared to 2014. The steep reduction in commodity prices experienced by the industry in 2015 severely impacted onshore North America exploration and production companies as a result of the higher lifting cost per barrel of many of these producers. These operators have addressed these cash constraints by reducing drilling activity in less economical unconventional plays, delaying well completion activities, and driving price discounts from their service providers as they await higher commodity prices. These lower activity levels, as evident in the 47% rig count drop, and deteriorating pricing conditions were the main drivers for the revenue decline in this segment. All product lines have been unfavorably impacted by the drop in activity, with production chemicals, deepwater operations and artificial lift showing the most resilience. Additionally, the reduced activity and well completion delays created an oversupply of hydraulic fracturing equipment, which caused the price deterioration in the onshore pressure pumping product line to be more severe. As such, we lost market share in this product line in 2015 as we worked to maintain cash flow positive operations despite an oversupplied market.
North America operating loss before tax was $639 million in 2015, a decrease of $2.11 billion, or 144%, compared to operating profit before tax of $1.47 billion in 2014. The reduction in profitability was primarily due to the sharp decline in activity and an increasingly unfavorable pricing environment. Additionally, as a result of the industry downturn and its impact on our business, we incurred costs of $181 million in 2015 to write down the carrying value of certain inventory. The impact from these unfavorable market conditions was partially mitigated by actions taken in the year to reduce our workforce, close and consolidate facilities and improve commercial terms with vendors, which ultimately resulted in lower operating costs.
Latin America
Latin America revenue for 2015 was $1.80 billion, a decrease of $437 million, or 20%, compared to 2014. The reduction in this segment is attributed to activity declines across the region as a result of customer budgetary constraints, predominately in the Andean area where the rig count has declined 46%, and in Venezuela where we restructured our operational footprint in late 2014. This reduction was partially offset by revenue growth in Brazil from share gains in our drilling services product line.
Latin America operating profit before tax decreased $146 million, or 50%, in 2015 compared to 2014. The reduction in profitability is mainly attributed to the decline in activity, foreign exchange losses, primarily in Argentina, and an increase in expense related to reserves for doubtful accounts. Additionally, we incurred costs of $13 million in 2015 to write down the carrying value of certain inventory. This was partially offset by improvements made to our operational cost structure.
33
Europe/Africa/Russia Caspian
EARC revenue for 2015 was $3.28 billion, a decrease of $1.14 billion, or 26%, compared to 2014. The decrease was driven mainly by activity declines and unfavorable pricing across the region. Revenue was also negatively impacted by the unfavorable change in foreign exchange rates, which accounted for approximately one third of the revenue reduction in 2015. The deconsolidation of a joint venture in North Africa late last year also contributed to the decline in revenue. All product lines have been unfavorably impacted by the drop in activity and price, with production chemicals and drilling services showing the most resilience.
EARC operating profit before tax decreased $438 million, or 71%, in 2015 compared to 2014. The unfavorable impact to profitability from pricing deterioration, lower activity levels, the change in foreign exchange rates, and increased costs related to reserves for doubtful accounts was partially offset by the savings from recent cost reduction measures. In addition, in 2015 unfavorable exchange rates, mainly for the Russian Ruble, Euro and the British Pound, accounted for approximately 40% of the decline in profitability. Also, 2014 included a $58 million charge associated with the restructuring of our operations in North Africa, and impairment of certain assets, that did not repeat in 2015.
Middle East/Asia Pacific
MEAP revenue for 2015 was $3.44 billion, a decrease of $1.02 billion, or 23%, compared to 2014. The revenue decline in this segment was driven primarily by lower activity across most of Asia, in particular China, Australia and Vietnam, and reduced revenue in Iraq. The revenue drop in Iraq is attributed to reduced activity, as evident by the 34% decline in rig count, and the rationalization of our operational footprint in the country, including completing our integrated operations activities. Revenue was also impacted by unfavorable pricing across the region.
MEAP operating profit before tax decreased $446 million, or 66%, in 2015 compared to 2014. The reduction in profitability was driven largely by lower activity levels and unfavorable pricing. The current year also includes charges related to reducing our operations in Iraq. These reductions were partially offset by the benefit of the recent cost-saving actions.
Industrial Services
Industrial Services revenue was $1.22 billion, a decrease of $149 million, or 11%, compared to 2014. The decline in revenue in this segment was driven primarily by reduced activity and the unfavorable change in foreign exchange rates.
Industrial Services operating profit before tax decreased 9% in 2015 compared to 2014. The reduction in profitability resulting from lower activity levels was partially offset by cost-saving efforts. However, Industrial Services profit before tax for the prior year included integration costs related to the pipeline services business acquired in 2014, which we did not incur in 2015.
34
Costs and Expenses
The table below details certain data from our consolidated statements of income (loss) and as a percentage of revenue.
2016 | 2015 | 2014 | ||||||||||||||||||
$ | % | $ | % | $ | % | |||||||||||||||
Revenue | $ | 9,841 | 100 | % | $ | 15,742 | 100 | % | $ | 24,551 | 100 | % | ||||||||
Cost of revenue | 9,973 | 101 | % | 14,415 | 92 | % | 19,746 | 80 | % | |||||||||||
Research and engineering | 384 | 4 | % | 466 | 3 | % | 613 | 2 | % | |||||||||||
Marketing, general and administrative | 815 | 8 | % | 969 | 6 | % | 1,333 | 5 | % | |||||||||||
Impairment and restructuring charges | 1,735 | 18 | % | 1,993 | 13 | % | — | — | % | |||||||||||
Goodwill impairment | 1,858 | 19 | % | — | — | % | — | — | % | |||||||||||
Merger and related costs | 199 | 2 | % | 295 | 2 | % | — | — | % | |||||||||||
Merger termination fee | (3,500 | ) | (36 | )% | — | — | % | — | — | % | ||||||||||
Loss on sale of business interest | 97 | 1 | % | — | — | % | — | — | % | |||||||||||
Loss on early extinguishment of debt | 142 | 1 | % | — | — | % | — | — | % | |||||||||||
Interest expense, net | 178 | 2 | % | 217 | 1 | % | 232 | 1 | % | |||||||||||
Cost of Revenue
Cost of revenue as a percentage of revenue was 101% and 92% for 2016 and 2015, respectively. The increase in cost of revenue as a percentage of revenue is due mainly to deteriorating pricing conditions as operators reduced their spending, partially offset by the benefit of implemented cost reduction measures and lower depreciation and amortization expense from asset impairments. Despite actions to restructure our global operations to operate in a lower price and activity environment, the decline in revenue has outpaced the benefit of our cost saving measures. Additionally, the product lines most significantly impacted by the downturn in rig activity are also the most capital-intensive. Accordingly, the fixed costs associated with those product lines lessened the positive impact of our cost reduction efforts in 2016 and 2015. Cost of revenue for 2016 was also negatively impacted by a charge of $617 million to write off and dispose of certain excess inventory compared to a write-down of $194 million in the prior year due to lower of cost or market adjustments.
Cost of revenue as a percentage of revenue was 92% and 80% for 2015 and 2014, respectively. As a result of the steep decline in activity and customer spending, we experienced significant pricing pressure and a decline in the demand for our products and services. Cost of revenue for 2015 was also negatively impacted by a charge of $194 million to adjust the carrying value of certain inventory due to the industry-wide market decline.
Research and Engineering
Research and engineering expenses decreased 18% in 2016 compared to 2015 and decreased 24% in 2015 compared to 2014. These declines were driven by cost reduction measures in light of the severe decline in activity resulting in lower revenues and profitability.
Marketing, General and Administrative
Marketing, general and administrative ("MG&A") expenses decreased by $154 million, or 16%, in 2016 compared to 2015. The reduction in MG&A costs is mainly a result of workforce reductions, lower discretionary spending, reduced foreign exchange losses and a $23 million investment gain, partially offset by legal settlement costs of $44 million.
MG&A expenses decreased by $364 million, or 27%, in 2015 compared to 2014. The reduction in MG&A costs is mainly a result of workforce reductions and lower discretionary spending.
35
Impairment and Restructuring Charges
During 2016, we recorded impairment and restructuring charges of $1.74 billion consisting of $272 million for workforce reduction costs, $192 million for contract termination costs and $1.27 billion for asset impairments related to excess machinery and equipment, facilities and intangible assets. Total cash paid during 2016 related to workforce reductions and contract terminations was $419 million.
During 2015, we recorded impairment and restructuring charges of $830 million consisting of $436 million for workforce reduction costs, $121 million for contract termination costs and $273 million for asset impairments related to excess machinery and equipment and facilities. Total cash paid during 2015 related to these charges was $446 million. In addition to our restructuring activities, in response to the downturn in the energy market and its impact on our business outlook, we determined that the carrying amount of a number of our assets exceeded their respective fair values; therefore, we recorded an impairment charge of $1.16 billion. These charges have been excluded from the results of our operating segments. For further discussion of these impairment and restructuring charges, see Note 4. "Impairment and Restructuring Charges" of the Notes to Consolidated Financial Statements in Item 8 herein.
The reduction in costs from eliminated depreciation, reduced employee expenses, and reduced interest expense on long-term debt in 2016 is approximately $550 million, and is expected to be approximately $900 million on an annualized basis, $700 million of which is related to actions taken post Halliburton merger.
Goodwill Impairment
In the second quarter of 2016, we determined the fair value of our reporting units using a combination of techniques including discounted cash flows derived from our long-term plans and a market approach that provides value indications through a comparison with guideline public companies. Based on the results of our impairment test, we determined that goodwill of two of our reporting units was impaired, and performed the second step of the goodwill impairment test. We substantially completed all actions necessary in the determination of the implied fair value of goodwill in the second quarter of 2016; however, some of the estimated fair values and allocations were subject to adjustment once the valuations and other computations were completed. Accordingly, in the second quarter of 2016, we recorded an estimate of the goodwill impairment loss of $1.84 billion, which consisted of $1.53 billion for the North America segment and $311 million for the Industrial Services segment. During the third quarter of 2016, we finalized all valuations and computations, and adjusted our final goodwill impairment loss for the first nine months of 2016 to $1.86 billion, consisting of $1.55 billion for the North America segment and $309 million for the Industrial Services segment. There were no goodwill-related impairments recorded in the fourth quarter of 2016.
Merger and Related Costs and Merger Termination Fee
We incurred costs related to the terminated merger with Halliburton of $180 million and $295 million in 2016 and 2015, respectively. These costs included certain expenses under our retention programs and obligations for minimum incentive compensation costs which, based on meeting eligibility criteria, have been treated as merger and related costs. On April 30, 2016, the Merger Agreement with Halliburton was terminated and as a result, Halliburton paid us $3.5 billion on May 4, 2016, which represents the termination fee required to be paid pursuant to the Merger Agreement. In 2016, we also incurred costs related to the pending transaction with GE of $19 million.
Interest Expense, Net
Interest expense, net of interest income of $33 million, was $178 million in 2016, a decrease of $39 million compared to $217 million, net of interest income of $20 million, in 2015. The decrease is due primarily to the bond buy back that occurred in June of 2016, and to a lesser extent, the growth in interest income earned on higher cash balances and short-term investments. Interest expense, net of interest income, of $217 million in 2015 decreased by $15 million compared to $232 million, net of interest income of $13 million, in 2014. The reduction is due primarily to lower short-term borrowings in Latin America and an increase in interest income.
36
Income Taxes
Total income tax expense was $696 million in 2016 compared to income tax benefit of $639 million for 2015 and income tax expense of $896 million for 2014. Our effective tax rate on operating profits or losses in 2016, 2015 and 2014 was (34.1)%, 24.5% and 34.1%, respectively. The 2016 negative effective tax rate is due primarily to the geographical mix of earnings and losses such that taxes in certain jurisdictions, including withholding and deemed profit taxes, exceed the tax benefit from the losses in other jurisdictions due to valuation allowances provided in most jurisdictions and goodwill impairments with no tax benefit. The 2015 effective tax rate is lower than the U.S. statutory income tax rate of 35% due to losses in foreign jurisdictions with no tax benefit and adjustments to prior years' tax positions, partially offset by favorable amended returns and other return to accrual adjustments. The 2014 effective tax rate is lower than the U.S. statutory income tax rate of 35% due to lower rates on certain international operations, partially offset by state income taxes and adjustments to prior years' tax positions.
As a result of the geographic mix of earnings and losses, including the goodwill impairment, asset impairment, restructuring charges, and other discrete tax items, our rate has been, and will continue to be volatile until the market stabilizes.
COMPLIANCE
We conduct business in more than 80 countries, including approximately 15 of the countries having the lowest scores in the Transparency International's Corruption Perception Index survey for 2016, which indicates high levels of corruption. We devote significant resources to the development, maintenance, communication and enforcement of our Business Code of Conduct, our anti-bribery compliance policies, our internal control processes and procedures and numerous other compliance related policies. Notwithstanding the devotion of such resources, and in part as a consequence thereof, from time to time we discover or receive information alleging potential violations of laws and regulations, including the FCPA and our policies, processes and procedures. We conduct timely internal investigations of these potential violations and take appropriate action depending upon the outcome of the investigation.
We anticipate that the devotion of significant resources to compliance-related issues, including the necessity for investigations, will continue to be an aspect of doing business in a number of the countries in which oil and natural gas exploration, development and production take place and in which we conduct operations. Compliance-related issues have, from time to time, limited our ability to do business or have raised the cost of operating in these countries. In order to provide products and services in some of these countries, we may in the future utilize ventures with third parties, sell products to distributors or otherwise modify our business approach in order to improve our ability to conduct our business in accordance with applicable laws and regulations and our Business Code of Conduct.
Our Best-in-Class Global Ethics and Compliance Program (our "Compliance Program") is based on (i) our Core Values of Integrity, Performance, Teamwork, Learning and Courage; (ii) the standards contained in our Business Code of Conduct; and (iii) the laws of the countries where we operate. Our Compliance Program is referenced within the Company as "C2" or "Completely Compliant." The Completely Compliant theme is intended to establish the proper Tone-at-the-Top throughout the Company. Employees are consistently reminded that they play a crucial role in ensuring that the Company always conducts its business ethically, legally and safely.
Highlights of our Compliance Program include the following:
• | We have comprehensive internal policies over such areas as facilitating payments; travel, entertainment, gifts and charitable donations connected to non-U.S. government officials; payments to non-U.S. commercial sales representatives; and the use of non-U.S. police or military organizations for security purposes. In addition, we have country-specific guidance for customs standards, visa processing, export and re-export controls, economic sanctions and antiboycott laws. |
• | We have a comprehensive employee compliance training program covering substantially all employees. |
• | We have a due diligence procedure for commercial sales, processing and professional agents and an enhanced risk-based process for classifying distributors and suppliers. |
• | We have continued our reduction of the use of commercial sales representatives and processing agents, including the reduction of customs agents. |
37
• | We have a compliance governance committee, which includes senior officers of the Company, that reviews our effectiveness and compliance with processes and controls of the Company's global Compliance Program including all areas covered by the Business Code of Conduct. |
• | We have a special compliance committee, which is made up of senior officers, that meets no less than once a year to review the oversight reports for all active commercial sales representatives. |
• | We have compliance committees that have been formed and are operating successfully in all of the Company's geomarkets. |
• | We use technology to monitor and report on compliance matters, including an internal investigations management software, a web-based antiboycott reporting tool and a global trade management software tool. |
• | We have a compliance program designed to encourage reporting of any ethics or compliance matter without fear of retaliation including a worldwide business helpline operated by a third party and currently available toll-free in 150 languages to ensure that our helpline is easily accessible to employees in their own language. |
• | We have a centralized finance organization including an enterprise-wide accounting system and company-wide policies. In addition, the corporate audit function has incorporated anti-corruption procedures in audits of certain countries. We also conduct FCPA risk assessments and legal audit procedures relating to higher risk third parties in non-U.S. jurisdictions. |
• | We continue to work to ensure that we have adequate legal compliance coverage around the world, including the coordination of compliance advice and customized training across all regions and countries where we do business. |
• | We have a centralized human resources function, including, among other things, consistent standards for pre-hire screening of employees, the screening of existing employees prior to promoting them to positions where they may be exposed to corruption-related risks, and a uniform policy for new hire training with a compliance component. |
LIQUIDITY AND CAPITAL RESOURCES
Our objective in financing our business is to maintain sufficient liquidity, adequate financial resources and financial flexibility in order to fund the requirements of our business. At December 31, 2016, we had cash and cash equivalents of $4.57 billion compared to $2.32 billion of cash and cash equivalents at December 31, 2015. On May 4, 2016, Halliburton paid us $3.5 billion, which represents the termination fee required to be paid pursuant to the Merger Agreement. Part of the proceeds received were used to purchase $1.0 billion face value of our long-term notes and debentures, which included portions of each tranche of notes and debentures, and $763 million of our common stock.
At December 31, 2016, approximately $2.92 billion of our cash and cash equivalents was held by foreign subsidiaries compared to approximately $2.01 billion at December 31, 2015. A substantial portion of the cash held by foreign subsidiaries at December 31, 2016 was reinvested in our international operations as our current intent is to use this cash to, among other things, fund the operations of our foreign subsidiaries. If we decide at a later date to repatriate those funds to the U.S., we may be required to provide taxes on certain of those funds based on applicable U.S. tax rates net of foreign tax credits. We have a committed revolving credit facility (the "credit facility") with commercial banks and a related commercial paper program under which the maximum combined borrowing at any time under both the credit facility and the commercial paper program is $2.5 billion. At December 31, 2016, we had no commercial paper outstanding; therefore, the amount available for borrowing under the credit facility as of December 31, 2016 was $2.5 billion. During 2016, we used cash to fund a variety of activities including certain working capital needs and restructuring costs, capital expenditures, repurchases of long-term debt and common stock, and the payment of dividends. We believe that cash on hand, cash flows generated from operations and the available credit facility, including the issuance of commercial paper, will provide sufficient liquidity to manage our global cash needs.
38
Cash Flows
Cash flows provided by (used in) each type of activity were as follows for the years ended December 31:
(In millions) | 2016 | 2015 | 2014 | ||||||||
Operating activities | $ | 4,229 | $ | 1,796 | $ | 2,953 | |||||
Investing activities | 203 | (905 | ) | (1,659 | ) | ||||||
Financing activities | (2,185 | ) | (282 | ) | (939 | ) | |||||
Operating Activities
Cash flows from operating activities provided cash of $4.23 billion and $1.80 billion for the year ended December 31, 2016 and 2015, respectively. Cash flows from operating activities increased $2.43 billion in 2016 primarily due to the receipt of the $3.5 billion merger termination fee, changes in the components of our working capital (receivables, inventories and accounts payable) as a result of lower activity which provided cash of $695 million, and an income tax refund in the U.S. of approximately $415 million. These cash inflows were partially offset by an increase in our net loss, adjusted for non-cash items. Included in our cash flows from operating activities for 2016 and 2015 are payments of $419 million and $446 million, respectively, made for employee severance and contract termination costs as a result of our restructuring activities initiated during the year.
Cash flows from operating activities provided cash of $1.80 billion and $2.95 billion for the year ended December 31, 2015 and 2014, respectively. Cash flows from operating activities decreased $1.16 billion in 2015 primarily due to the decrease in our net income, adjusted for non-cash items, partially offset by the changes in the components of our working capital due to lower activity levels, which provided more cash in 2015 compared to 2014.
Investing Activities
Our principal recurring investing activity is the funding of capital expenditures to ensure that we have the appropriate levels and types of machinery and equipment in place to generate revenue from operations. Expenditures for capital assets totaled $332 million, $965 million and $1.79 billion for 2016, 2015 and 2014, respectively. The decline in capital expenditures over the past two years is a result of lower demand for our products and services and our continued focus on capital discipline.
Proceeds from the disposal of assets were $283 million, $388 million and $437 million for 2016, 2015 and 2014, respectively. These disposals related to equipment that was lost-in-hole and property, machinery, and equipment no longer used in operations that was sold throughout the year.
In 2016, we purchased short-term and long-term investment securities totaling $349 million and received proceeds of $453 million from the maturities of various investment securities.
During the fourth quarter of 2016, we contributed our North American onshore pressure pumping business into a new venture and received $142 million of cash, net of $8 million of direct transaction fees, and a 46.7% interest in the new venture. As a result of this transaction, we deconsolidated this business and recognized a $97 million loss on the sale of our majority interest in this business. See Note 5. "Acquisitions and Dispositions" of the Notes to Consolidated Financial Statements in Item 8 herein for further discussion.
Financing Activities
We had net repayments of commercial paper and other short-term debt of $60 million, $45 million and $248 million in 2016, 2015 and 2014, respectively. Total debt outstanding at December 31, 2016 was $3.02 billion, a decrease of $1.02 billion compared to December 31, 2015. The total debt-to-capital (defined as total debt plus equity) ratio was 0.19 at December 31, 2016 and 0.20 at December 31, 2015.
In June 2016, we purchased $1.0 billion of the aggregate outstanding principal amount associated with our long-term outstanding notes and debentures, which included portions of each tranche of notes and debentures.
39
Pursuant to a cash tender offer, the purchases resulted in the payment of an early-tender premium, including various fees, of $135 million and a pre-tax loss on the early extinguishment of debt of $142 million, which includes the premium and the write-off of a portion of the remaining original debt issue costs and debt discounts or premiums. The bond purchases will result in $55 million of annualized interest savings and $632 million of interest savings over the life of the bonds.
We received proceeds of $91 million, $116 million and $216 million in 2016, 2015 and 2014, respectively, from the issuance of common stock through the exercise of stock options and the employee stock purchase plan.
We paid dividends of $293 million, $297 million and $279 million in 2016, 2015 and 2014, respectively.
Beginning in May 2016, following the termination of the Merger with Halliburton, through September 30, 2016, we repurchased 16.2 million shares of our common stock at an average price of $47.09 per share, for a total of $763 million. We had authorization remaining to repurchase approximately $1.24 billion in common stock at December 31, 2016. We had no stock repurchases during the fourth quarter of 2016 or during 2015. In 2014, we repurchased 9.1 million shares of our common stock at an average price of $65.75 per share, for a total of $600 million.
Under the Transaction Agreement with GE entered into on October 30, 2016 as described in Note 3. "General Electric Transaction Agreement" of the Notes to Consolidated Financial Statements in Item 8 herein, we have generally agreed not to repurchase any shares of common stock or increase the quarterly dividend while the transaction is pending.
Available Credit Facility
On July 13, 2016, we entered into a new five-year $2.5 billion committed revolving credit facility (the "2016 Credit Agreement") with commercial banks maturing in July 2021, which replaced our existing credit facility of $2.5 billion, but maintained the existing commercial paper program. The previous credit facility had a maturity date in September of 2016. The maximum combined borrowing at any time under both the 2016 Credit Agreement and the commercial paper program is $2.5 billion. The 2016 Credit Agreement contains certain covenants, which, among other things, require the maintenance of a total debt-to-total capitalization ratio, restrict certain merger transactions or the sale of all or substantially all of our assets or a significant subsidiary and limit the amount of subsidiary indebtedness. Upon the occurrence of certain events of default, our obligations under the 2016 Credit Agreement may be accelerated. Such events of default include payment defaults to lenders under the 2016 Credit Agreement, covenant defaults and other customary defaults.
We were in compliance with all of the credit facility's covenants, and there were no direct borrowings under the credit facility during 2016. Under the commercial paper program, we may issue from time to time up to $2.5 billion in commercial paper with maturities of no more than 270 days. The amount available to borrow under the credit facility is reduced by the amount of any commercial paper outstanding. At December 31, 2016, we had no outstanding borrowings under the commercial paper program.
If market conditions were to change and our revenue was reduced significantly or operating costs were to increase, our cash flows and liquidity could be reduced. Additionally, it could cause the rating agencies to lower our credit rating. There are no ratings triggers that would accelerate the maturity of any borrowings under our committed credit facility. However, a downgrade in our credit ratings could increase the cost of borrowings under the credit facility and could also limit or preclude our ability to issue commercial paper. Should this occur, we would seek alternative sources of funding, including borrowing under the credit facility.
We believe our current credit ratings would allow us to obtain interim financing over and above our existing credit facility for any currently unforeseen significant needs.
Cash Requirements
In 2017, we believe cash on hand, cash flows from operating activities and the available credit facility will provide us with sufficient capital resources and liquidity to manage our working capital needs, meet contractual obligations, fund capital expenditures and dividends, and support the development of our short-term and long-term
40
operating strategies. If necessary, we may issue commercial paper or other short-term debt to fund cash needs in the U.S. in excess of the cash generated in the U.S.
Our capital expenditures can be adjusted and managed by us to match market demand and activity levels. In light of the current market conditions, capital expenditures in 2017 will be made as appropriate at a rate that we estimate would equal $450 million to $500 million on an annualized basis. The expenditures are expected to be used primarily for normal, recurring items necessary to support our business. We also anticipate making income tax payments in the range of $225 million to $275 million in 2017. For all defined benefit, defined contribution and other postretirement plans, we expect to contribute between $205 million to $222 million to these plans in 2017. See Note 14. "Employee Benefit Plans" of the Notes to Consolidated Financial Statements in Item 8 herein for further discussion.
We anticipate paying dividends in the range of $140 million to $160 million in the first half of 2017 prior to the expected Closing of the GE Transaction.
Contractual Obligations
In the table below, we set forth our contractual cash obligations as of December 31, 2016. Certain amounts included in this table are based on our estimates and assumptions about these obligations, including their duration, anticipated actions by third parties and other factors. The contractual cash obligations we will actually pay in future periods may vary from those reflected in the table because the estimates and assumptions are subjective.
Payments Due by Period | |||||||||||||||||||
(In millions) | Total | Less Than 1 Year | 2 - 3 Years | 4 - 5 Years | More Than 5 Years | ||||||||||||||
Total debt and capital lease obligations (1) | $ | 3,038 | $ | 132 | $ | 778 | $ | 538 | $ | 1,590 | |||||||||
Estimated interest payments (2) | 1,953 | 168 | 269 | 216 | 1,300 | ||||||||||||||
Operating leases (3) | 344 | 118 | 106 | 48 | 72 | ||||||||||||||
Purchase obligations (4) | 286 | 102 | 81 | 66 | 37 | ||||||||||||||
Liabilities for uncertain income tax positions (5) | 351 | 216 | 68 | 32 | 35 | ||||||||||||||
Other long-term liabilities | 164 | 34 | 42 | 14 | 74 | ||||||||||||||
Total (6) | $ | 6,136 | $ | 770 | $ | 1,344 | $ | 914 | $ | 3,108 | |||||||||
(1) | Amounts represent the expected cash payments for the principal amounts related to our debt, including capital lease obligations. Amounts for debt do not include any unamortized discounts or deferred issuance costs. Expected cash payments for interest are excluded from these amounts. |
(2) | Amounts represent the expected cash payments for interest on our long-term debt and capital lease obligations. |
(3) | Amounts represent the future minimum payments under noncancelable operating leases with initial or remaining terms of one year or more. We enter into operating leases, some of which include renewal options; however, we have excluded renewal options from the table above unless it is anticipated that we will exercise such renewals. |
(4) | Purchase obligations include capital improvements as well as agreements to purchase goods or services that are enforceable and legally binding and that specify all significant terms, including: fixed or minimum quantities to be purchased; fixed, minimum or variable price provisions; and the approximate timing of the transaction. |
(5) | The estimated income tax liabilities for uncertain tax positions will be settled as a result of expiring statutes, audit activity, competent authority proceedings related to transfer pricing, or final decisions in matters that are the subject of litigation in various taxing jurisdictions in which we operate. The timing of any particular settlement will depend on the length of the tax audit and related appeals process, if any, or an expiration of a statute. If a liability is settled due to a statute expiring or a favorable audit result, the settlement of the tax liability would not result in a cash payment. |
(6) | Amounts do not include expected contributions to our pension and other postretirement defined benefit plans of between $70 million to $80 million in 2017 as the majority of these contributions are amounts in excess of minimum funding requirements and as such would not be considered a contractual obligation. |
41
Off-Balance Sheet Arrangements
In the normal course of business with customers, vendors and others, we have entered into off-balance sheet arrangements, such as surety bonds for performance, letters of credit and other bank issued guarantees, which totaled approximately $1.0 billion at December 31, 2016. It is not practicable to estimate the fair value of these financial instruments. None of the off-balance sheet arrangements either has, or is likely to have, a material effect on our consolidated financial statements.
As of December 31, 2016, we had no material off-balance sheet financing arrangements other than normal operating leases, as discussed above. As such, we are not materially exposed to any financing, liquidity, market or credit risk that could arise if we had engaged in such financing arrangements.
CRITICAL ACCOUNTING ESTIMATES
The preparation of our consolidated financial statements requires us to make estimates and judgments that affect the reported amounts of assets, liabilities, revenue and expenses and related disclosures as well as disclosures about any contingent assets and liabilities. We base these estimates and judgments on historical experience and other assumptions and information that are believed to be reasonable under the circumstances. Estimates and assumptions about future events and their effects are subject to uncertainty and, accordingly, these estimates may change as new events occur, as more experience is acquired, as additional information is obtained and as the business environment in which we operate changes.
We have defined a critical accounting estimate as one that is both important to the portrayal of either our financial condition or results of operations and requires us to make difficult, subjective or complex judgments or estimates about matters that are uncertain. The Audit/Ethics Committee of our Board of Directors has reviewed our critical accounting estimates and the disclosure presented below. During the past three fiscal years, we have not made any material changes in the methodology used to establish the critical accounting estimates, and we believe that the following are the critical accounting estimates used in the preparation of our consolidated financial statements. There are other items within our consolidated financial statements that require estimation and judgment but they are not deemed critical as defined above.
Allowance for Doubtful Accounts
The determination of the collectability of amounts due from our customers requires us to make judgments and estimates regarding our customers' ability to pay amounts due us in order to determine the amount of valuation allowances required for doubtful accounts. We monitor our customers' payment history and current credit worthiness to determine that collectability is reasonably assured. We also consider the overall business climate in which our customers operate. Provisions for doubtful accounts are recorded based on the aging status of the customer accounts or when it becomes evident that the customer will not make the required payments at either contractual due dates or in the future. At December 31, 2016 and 2015, the allowance for doubtful accounts totaled $509 million, or 18%, and $383 million, or 11%, of total gross accounts receivable, respectively. We believe that our allowance for doubtful accounts is adequate to cover potential bad debt losses under current conditions; however, uncertainties regarding changes in the financial condition of our customers, either adverse or positive, could impact the amount and timing of any additional provisions for doubtful accounts that may be required. A five percent change in the allowance for doubtful accounts would have had an impact on income (loss) before income taxes of approximately $25 million in 2016.
Inventory Reserves
Inventory is a significant component of current assets and is stated at the lower of cost or net realizable value. This requires us to record provisions and maintain reserves for excess, slow moving and obsolete inventory. To determine these reserve amounts, we regularly review inventory quantities on hand and compare them to estimates of future product demand, market conditions, production requirements and technological developments. These estimates and forecasts inherently include uncertainties and require us to make judgments regarding potential future outcomes. At December 31, 2016 and 2015, inventory reserves totaled $188 million, or 9%, and $278 million, or 9%, of gross inventory, respectively. During 2016, we wrote off the carrying value of certain excess inventory resulting in charges of $583 million. This amount was net of existing reserves of $272 million. We believe
42
that our reserves are adequate to properly value potential excess, slow moving and obsolete inventory under current conditions. Significant or unanticipated changes to our estimates and forecasts could impact the amount and timing of any additional provisions for excess, slow moving or obsolete inventory that may be required. A five percent change in this inventory reserve balance would have had an impact on income (loss) before income taxes of approximately $9 million in 2016.
Goodwill and Other Long-Lived Assets
The purchase price of acquired businesses is allocated to its identifiable assets and liabilities based upon estimated fair values as of the acquisition date. Goodwill is the excess of the purchase price over the fair value of tangible and identifiable intangible assets and liabilities acquired in a business acquisition. Our goodwill at December 31, 2016 and 2015, totaled $4.08 billion and $6.07 billion, respectively. We perform an annual impairment test of goodwill on a qualitative or quantitative basis for each of our reporting units as of October 1 of each year, or more frequently when circumstances indicate an impairment may exist at the reporting unit level. Our reporting units are the same as our five reportable segments. When performing the annual impairment test we have the option of performing a qualitative or quantitative assessment to determine if an impairment has occurred. If a qualitative assessment indicates that it is more likely than not that the fair value of a reporting unit is less than its carrying amount, then we would be required to perform a quantitative impairment test for goodwill.
Goodwill is tested for impairment using a two-step approach. In the first step, the fair value of each reporting unit is determined and compared to the reporting unit's carrying value, including goodwill. If the fair value of a reporting unit is less than its carrying value, the second step of the goodwill impairment test is performed to measure the amount of impairment, if any. In the second step, the fair value of the reporting unit is allocated to the assets and liabilities of the reporting unit as if it had been acquired in a business combination and the purchase price was equivalent to the fair value of the reporting unit. The excess of the fair value of the reporting unit over the amounts assigned to its assets and liabilities is referred to as the implied fair value of goodwill. The implied fair value of the reporting unit's goodwill is then compared to the actual carrying value of goodwill. If the implied fair value of goodwill is less than the carrying value of goodwill, an impairment loss is recognized for the difference.
In determining the carrying amount of reporting units, corporate and other assets and liabilities are allocated to the extent that they relate to the operations of those reporting units. When necessary, we calculate the fair value of a reporting unit using various valuation techniques, including a market approach, a comparable transactions approach and discounted cash flow ("DCF") methodology. The market approach and comparable transactions approach provide value indications for a company through a comparison with guideline public companies or guideline transactions, respectively. Both entail selecting relevant financial information of the subject company, and capitalizing those amounts using valuation multiples that are based on empirical market observations. The DCF methodology includes, but is not limited to, assumptions regarding matters such as discount rates, anticipated growth rates, expected profitability rates and the timing of expected future cash flows. Unanticipated changes, including even small revisions, to these assumptions could result in a provision for impairment in a future period. In addition, a decline in our stock price could result in an impairment. Given the nature of these evaluations and their application to specific assets and time-frames, it is not possible to reasonably quantify the impact of changes in these assumptions.
In the second quarter of 2016, as a result of the termination of the Merger Agreement with Halliburton, we concluded it was necessary to conduct a quantitative assessment for potential goodwill impairment and determined that goodwill of two of our reporting units was impaired. The quantitative assessment was calculated using a combination of market and discounted cash flow approaches. As a result, we recorded an impairment charge of $1.86 billion, of which $1.55 billion pertained to the North America reporting unit and $309 million pertained to Industrial Services. See Note 12. "Goodwill and Intangible Assets" of the Notes to Consolidated Financial Statements in Item 8 herein for further description. In addition to the quantitative assessment performed in the second quarter of 2016, and consistent with our policy stated above, we also performed our annual goodwill impairment test for all reporting units as of October 1, 2016. This assessment was performed on a qualitative basis, and included our consideration of changes in industry and market conditions since the performance of our quantitative analysis in the second quarter of 2016. Based on this assessment, we determined no additional impairment of goodwill was necessary in the fourth quarter of 2016. In 2015 and 2014, we performed a qualitative assessment for our annual goodwill impairment test and determined no impairments of goodwill were necessary in 2015 or 2014.
43
Long-lived assets, which include property and equipment, intangible assets other than goodwill, and certain other assets, comprise a significant amount of our total assets. We review the carrying values of these assets for impairment periodically, and at least annually for certain intangible assets or whenever events or changes in circumstances indicate that the carrying amounts may not be recoverable. An impairment loss is recorded in the period in which it is determined that the carrying amount is not recoverable. This requires us to make judgments regarding long-term forecasts of future revenue and costs and cash flows related to the assets subject to review. These forecasts are uncertain in that they require assumptions about demand for our products and services, future market conditions and technological developments. See Note 4. "Impairment and Restructuring Charges" of the Notes to Consolidated Financial Statements in Item 8 herein for further discussion of impairment of certain property and equipment and intangible assets recorded in 2016 and 2015.
Income Taxes
The liability method is used for determining our income tax provisions, under which current and deferred tax liabilities and assets are recorded in accordance with enacted tax laws and rates. Under this method, the amounts of deferred tax liabilities and assets at the end of each period are determined using the tax rate expected to be in effect when taxes are actually paid or recovered. Valuation allowances are established to reduce deferred tax assets when it is more likely than not that some portion or all of the deferred tax assets will not be realized. In determining the need for valuation allowances, we have considered and made judgments and estimates regarding estimated future taxable income and ongoing prudent and feasible tax planning strategies. These estimates and judgments include some degree of uncertainty and changes in these estimates and assumptions could require us to adjust the valuation allowances for our deferred tax assets. Historically, changes to valuation allowances have been caused by major changes in the business cycle in certain countries and changes in local country law. The ultimate realization of the deferred tax assets depends on the generation of sufficient taxable income in the applicable taxing jurisdictions.
We conduct business in more than 80 countries under many legal forms. As a result, we are subject to the jurisdiction of numerous domestic and foreign tax authorities, as well as to tax agreements and treaties among these governments. Our operations in these different jurisdictions are taxed on various bases, including actual income before taxes, deemed profits (which are generally determined using a percentage of revenue rather than profits) and withholding taxes based on revenue. Determination of taxable income in any jurisdiction requires the interpretation of the related tax laws and regulations and the use of estimates and assumptions regarding significant future events such as the amount, timing and character of deductions, permissible revenue recognition methods under the tax law and the sources and character of income and tax credits. Changes in tax laws, regulations, agreements and treaties, foreign currency exchange restrictions or our level of operations or profitability in each taxing jurisdiction could have an impact on the amount of income taxes that we provide during any given year.
Our tax filings for various periods are subject to audit by the tax authorities in most jurisdictions where we conduct business. These audits may result in assessments of additional taxes that are resolved with the authorities or through the courts. We believe these assessments may occasionally be based on erroneous and even arbitrary interpretations of local tax law. Resolution of these situations inevitably includes some degree of uncertainty; accordingly, we provide taxes only for the amounts we believe will ultimately result from these proceedings. The resulting change to our tax liability, if any, is dependent on numerous factors including, among others, the amount and nature of additional taxes potentially asserted by local tax authorities; the willingness of local tax authorities to negotiate a fair settlement through an administrative process; the impartiality of the local courts; the number of countries in which we do business; and the potential for changes in the tax paid to one country to either produce, or fail to produce, an offsetting tax change in other countries. Our experience has been that the estimates and assumptions we have used to provide for future tax assessments have proven to be appropriate. However, past experience is only a guide, and the potential exists that the tax resulting from the resolution of current and potential future tax controversies may differ materially from the amount accrued.
In addition to the aforementioned assessments that have been received from various tax authorities, we also provide for taxes for uncertain tax positions where formal assessments have not been received. The determination of these liabilities requires the use of estimates and assumptions regarding future events. Once established, we adjust these amounts only when more information is available or when a future event occurs necessitating a change to the reserves such as changes in the facts or law, judicial decisions regarding the application of existing law or a favorable audit outcome. We believe that the resolution of tax matters will not have a material effect on the
44
consolidated financial condition of the Company, although a resolution could have a material impact on our consolidated statements of income (loss) for a particular period and on our effective tax rate for any period in which such resolution occurs.
Pensions and Postretirement Benefit Obligations
Pensions and postretirement benefit obligations and the related expenses are calculated using actuarial models and methods. This involves the use of two critical assumptions, the discount rate and the expected rate of return on assets, both of which are important elements in determining pension expense and in measuring plan liabilities. We evaluate these critical assumptions at least annually, and as necessary, we utilize third-party actuarial firms to assist us. Although considered less critical, other assumptions used in determining benefit obligations and related expenses, such as demographic factors like retirement age, mortality and turnover, are also evaluated periodically and are updated to reflect our actual and expected experience.
The discount rate enables us to determine expected future cash flows at a present value on the measurement date. The development of the discount rate for our largest plans was based on a bond matching model whereby the cash flows underlying the projected benefit obligation are matched against a yield curve constructed from a bond portfolio of high-quality, fixed-income securities. Use of a lower discount rate would increase the present value of benefit obligations and increase pension expense. We used a weighted average discount rate of 3.9% in 2016, 3.6% in 2015 and 4.5% in 2014 to determine pension expense. A 50 basis point reduction in the weighted average discount rate would have increased pension expense of our principal pension plans by approximately $1 million in 2016.
To determine the expected rate of return on plan assets, we consider the current and target asset allocations, as well as historical and expected future returns on various categories of plan assets. A lower rate of return would decrease plan assets which results in higher pension expense. We assumed a weighted average expected rate of return on our plan assets of 5.9% in 2016, 6.8% in 2015 and 6.7% in 2014. A 50 basis point reduction in the weighted average expected rate of return on assets of our principal pension plans would have increased pension expense by approximately $6 million in 2016.
New Accounting Standards
See Note 1. "Summary of Significant Accounting Policies" of the Notes to Consolidated Financial Statements in Item 8 herein for further discussion of accounting standards adopted and to be adopted.
RELATED PARTY TRANSACTIONS
There were no significant related party transactions during the three years ended December 31, 2016.
FORWARD-LOOKING STATEMENTS
This Form 10-K, including MD&A and certain statements in the Notes to Consolidated Financial Statements, contains forward-looking statements within the meaning of Section 27A of the Securities Act of 1933, as amended, and Section 21E of the Exchange Act of 1934, as amended, (each a "forward-looking statement"). The words "anticipate," "believe," "ensure," "expect," "if," "intend," "estimate," "probable," "project," "forecasts," "predict," "outlook," "aim," "will," "could," "should," "would," "potential," "may," "likely" and similar expressions, and the negative thereof, are intended to identify forward-looking statements. Our forward-looking statements are based on assumptions that we believe to be reasonable but that may not prove to be accurate. The statements do not include the potential impact of future transactions, such as an acquisition, disposition, merger, joint venture or other transaction that could occur, including the pending Merger with GE. We undertake no obligation to publicly update or revise any forward-looking statement. Our expectations regarding our business outlook, including changes in revenue, pricing, capital spending, profitability, strategies for our operations, impact of any common stock repurchases, oil and natural gas market conditions, the business plans of our customers, market share and contract terms, costs and availability of resources, legal, economic and regulatory conditions, and environmental matters are only our forecasts regarding these matters.
45
All of our forward-looking information is subject to risks and uncertainties that could cause actual results to differ materially from the results expected. Although it is not possible to identify all risk factors, these risks and uncertainties include the factors and the timing of any of those factors identified in this annual report under Item 1A. Risk Factors and Item 7. Management's Discussion and Analysis of Financial Condition and Results of Operations and those set forth from time to time in our filings with the SEC. These documents are available through our website or through the SEC's Electronic Data Gathering and Analysis Retrieval (EDGAR) system at http://www.sec.gov. In light of such risks and uncertainties, we caution you not to place undue reliance on these forward-looking statements. These forward-looking statements speak only as of the date of this annual report, or if earlier, as of the date they were made. We do not intend to, and disclaim any obligation to, update or revise any forward-looking statements unless required by securities law.
ITEM 7A. QUANTITATIVE AND QUALITATIVE DISCLOSURES ABOUT MARKET RISK
We are exposed to certain market risks that are inherent in our financial instruments and arise from changes in interest rates and foreign currency exchange rates. We may enter into derivative financial instrument transactions to manage or reduce market risk but do not enter into derivative financial instrument transactions for speculative purposes. A discussion of our primary market risk exposure in financial instruments is presented below.
INTEREST RATE RISK
We have debt in fixed and floating rate instruments. We are subject to interest rate risk on our debt and investment portfolio. We maintain an interest rate risk management strategy which primarily uses a mix of fixed and variable rate debt that is intended to mitigate the risk exposure to changes in interest rates in the aggregate. We may use interest rate swaps to manage the economic effect of fixed rate obligations associated with certain debt. There were no outstanding interest rate swap agreements as of December 31, 2016 or 2015. The following table sets forth our fixed rate long-term debt and the related weighted average interest rates by expected maturity dates.
(In millions) | 2017 | 2018 | 2019 | 2020 | 2021 | Thereafter | Total (3) | ||||||||||||||||||||
As of December 31, 2016 | |||||||||||||||||||||||||||
Long-term debt (1) (2) | $ | — | $ | 751 | $ | 27 | $ | 12 | $ | 526 | $ | 1,590 | $ | 2,906 | |||||||||||||
Weighted average interest rates | — | % | 7.39 | % | 6.45 | % | 5.03 | % | 3.43 | % | 5.84 | % | 5.86 | % | |||||||||||||
As of December 31, 2015 | |||||||||||||||||||||||||||
Long-term debt (1) (2) | $ | 24 | $ | 1,022 | $ | 22 | $ | 12 | $ | 761 | $ | 2,077 | $ | 3,918 | |||||||||||||
Weighted average interest rates | 7.77 | % | 7.28 | % | 5.94 | % | 5.03 | % | 3.40 | % | 5.84 | % | 5.79 | % | |||||||||||||
(1) | Amounts do not include any unamortized discounts, premiums or deferred issuance costs on our fixed rate long-term debt. |
(2) | Fair market value of our fixed rate long-term debt was $3.23 billion at December 31, 2016 and $4.17 billion at December 31, 2015. |
(3) | Amounts represent the principal value of our long-term debt outstanding and related weighted average interest rates at the end of the respective period. |
FOREIGN CURRENCY EXCHANGE RISK
We conduct our operations around the world in a number of different currencies, and we are exposed to market risks resulting from fluctuations in foreign currency exchange rates. Many of our significant foreign subsidiaries have designated the local currency as their functional currency. As such, future earnings are subject to change due to fluctuations in foreign currency exchange rates when transactions are denominated in currencies other than our functional currencies. To minimize the need for foreign currency forward contracts to hedge this exposure, our objective is to manage foreign currency exposure by maintaining a minimal consolidated net asset or net liability position in a currency other than the functional currency.
At December 31, 2016 and 2015, we had outstanding foreign currency forward contracts with notional amounts aggregating $271 million and $499 million, respectively, to hedge exposure to currency fluctuations in various foreign currencies. These contracts are either undesignated hedging instruments or designated and qualify as fair value hedging instruments. The notional amounts of our foreign currency forward contracts do not generally
46
represent amounts exchanged by the parties, and thus are not a measure of the cash requirements related to these contracts or of any possible loss exposure. The amounts actually exchanged are calculated by reference to the notional amounts and by other terms of the derivative contracts, such as exchange rates. Based on quoted market prices as of December 31, 2016 and 2015 for contracts with similar terms and maturity dates, we recorded a gain of $1 million and a loss of $1 million, respectively, to adjust these foreign currency forward contracts to their fair market value. These gains and losses offset designated foreign currency exchange gains and losses resulting from the underlying exposures and are included in MG&A expenses in the consolidated statements of income (loss).
47
ITEM 8. FINANCIAL STATEMENTS AND SUPPLEMENTARY DATA
Management's Report on Internal Control Over Financial Reporting
Our management is responsible for establishing and maintaining adequate internal control over our financial reporting, as such term is defined in Exchange Act Rules 13a-15(f). Our internal control over financial reporting is a process designed to provide reasonable assurance regarding the reliability of financial reporting and the preparation of financial statements for external purposes in accordance with generally accepted accounting principles.
Under the supervision and with the participation of our management, including our principal executive officer and principal financial officer, we assessed the effectiveness of our internal control over financial reporting based on the 2013 framework in Internal Control - Integrated Framework issued by the Committee of Sponsoring Organizations of the Treadway Commission. Based on our assessment, our principal executive officer and principal financial officer concluded that our internal control over financial reporting was effective as of December 31, 2016. This conclusion is based on the recognition that there are inherent limitations in all systems of internal control. Because of the inherent limitations of internal control over financial reporting, including the possibility of collusion or improper management override of controls, material misstatements due to error or fraud may not be prevented or detected on a timely basis. Also, projections of any evaluation of effectiveness to future periods are subject to the risk that controls may become inadequate because of changes in conditions, or that the degree of compliance with the policies or procedures may deteriorate.
Deloitte & Touche LLP, the Company's independent registered public accounting firm, has issued an attestation report on the effectiveness of the Company's internal control over financial reporting.
/s/ MARTIN S. CRAIGHEAD Martin S. Craighead Chairman and Chief Executive Officer | /s/ KIMBERLY A. ROSS Kimberly A. Ross Senior Vice President and Chief Financial Officer | /s/ KELLY C. JANZEN Kelly C. Janzen Vice President, Controller and Chief Accounting Officer | ||
Houston, Texas
February 7, 2017
48
REPORT OF INDEPENDENT REGISTERED PUBLIC ACCOUNTING FIRM
To the Board of Directors and Stockholders of Baker Hughes Incorporated
Houston, Texas
We have audited the accompanying consolidated balance sheets of Baker Hughes Incorporated and subsidiaries (the "Company") as of December 31, 2016 and 2015, and the related consolidated statements of income (loss), comprehensive income (loss), changes in equity, and cash flows for each of the three years in the period ended December 31, 2016. Our audits also included financial statement schedule II, valuation and qualifying accounts, listed in the Index at Item 15. We also have audited the Company's internal control over financial reporting as of December 31, 2016, based on criteria established in Internal Control - Integrated Framework (2013) issued by the Committee of Sponsoring Organizations of the Treadway Commission. The Company's management is responsible for these financial statements and financial statement schedule, for maintaining effective internal control over financial reporting, and for its assessment of the effectiveness of internal control over financial reporting, included in the accompanying Management's Report on Internal Control Over Financial Reporting. Our responsibility is to express an opinion on these financial statements and financial statement schedule and an opinion on the Company's internal control over financial reporting based on our audits.
We conducted our audits in accordance with the standards of the Public Company Accounting Oversight Board (United States). Those standards require that we plan and perform the audit to obtain reasonable assurance about whether the financial statements are free of material misstatement and whether effective internal control over financial reporting was maintained in all material respects. Our audits of the financial statements included examining, on a test basis, evidence supporting the amounts and disclosures in the financial statements, assessing the accounting principles used and significant estimates made by management, and evaluating the overall financial statement presentation. Our audit of internal control over financial reporting included obtaining an understanding of internal control over financial reporting, assessing the risk that a material weakness exists, and testing and evaluating the design and operating effectiveness of internal control based on the assessed risk. Our audits also included performing such other procedures as we considered necessary in the circumstances. We believe that our audits provide a reasonable basis for our opinions.
A company's internal control over financial reporting is a process designed by, or under the supervision of, the company's principal executive and principal financial officers, or persons performing similar functions, and effected by the company's board of directors, management, and other personnel to provide reasonable assurance regarding the reliability of financial reporting and the preparation of financial statements for external purposes in accordance with generally accepted accounting principles. A company's internal control over financial reporting includes those policies and procedures that (1) pertain to the maintenance of records that, in reasonable detail, accurately and fairly reflect the transactions and dispositions of the assets of the company; (2) provide reasonable assurance that transactions are recorded as necessary to permit preparation of financial statements in accordance with generally accepted accounting principles and that receipts and expenditures of the company are being made only in accordance with authorizations of management and directors of the company; and (3) provide reasonable assurance regarding prevention or timely detection of unauthorized acquisition, use, or disposition of the company's assets that could have a material effect on the financial statements.
Because of the inherent limitations of internal control over financial reporting, including the possibility of collusion or improper management override of controls, material misstatements due to error or fraud may not be prevented or detected on a timely basis. Also, projections of any evaluation of the effectiveness of the internal control over financial reporting to future periods are subject to the risk that the controls may become inadequate because of changes in conditions, or that the degree of compliance with the policies or procedures may deteriorate.
In our opinion, the consolidated financial statements referred to above present fairly, in all material respects, the financial position of Baker Hughes Incorporated and subsidiaries as of December 31, 2016 and 2015, and the results of their operations and their cash flows for each of the three years in the period ended December 31, 2016, in conformity with accounting principles generally accepted in the United States of America. Also, in our opinion, such financial statement schedule, when considered in relation to the basic consolidated financial statements taken as a whole, presents fairly, in all material respects, the information set forth therein. Also, in our opinion, the Company maintained, in all material respects, effective internal control over financial reporting as of December 31, 2016, based on the criteria established in Internal Control - Integrated Framework (2013) issued by the Committee of Sponsoring Organizations of the Treadway Commission.
/s/ DELOITTE & TOUCHE LLP
Houston, Texas
February 7, 2017
49
BAKER HUGHES INCORPORATED
CONSOLIDATED STATEMENTS OF INCOME (LOSS)
Year Ended December 31, | |||||||||||
(In millions, except per share amounts) | 2016 | 2015 | 2014 | ||||||||
Revenue: | |||||||||||
Sales | $ | 3,870 | $ | 5,649 | $ | 8,056 | |||||
Services | 5,971 | 10,093 | 16,495 | ||||||||
Total revenue | 9,841 | 15,742 | 24,551 | ||||||||
Costs and expenses: | |||||||||||
Cost of sales | 3,722 | 4,833 | 6,294 | ||||||||
Cost of services | 6,251 | 9,582 | 13,452 | ||||||||
Research and engineering | 384 | 466 | 613 | ||||||||
Marketing, general and administrative | 815 | 969 | 1,333 | ||||||||
Impairment and restructuring charges | 1,735 | 1,993 | — | ||||||||
Goodwill impairment | 1,858 | — | — | ||||||||
Merger and related costs | 199 | 295 | — | ||||||||
Merger termination fee | (3,500 | ) | — | — | |||||||
Total costs and expenses | 11,464 | 18,138 | 21,692 | ||||||||
Operating (loss) income | (1,623 | ) | (2,396 | ) | 2,859 | ||||||
Loss on sale of business interest | (97 | ) | — | — | |||||||
Loss on early extinguishment of debt | (142 | ) | — | — | |||||||
Interest expense, net | (178 | ) | (217 | ) | (232 | ) | |||||
(Loss) income before income taxes | (2,040 | ) | (2,613 | ) | 2,627 | ||||||
Income tax (provision) benefit | (696 | ) | 639 | (896 | ) | ||||||
Net (loss) income | (2,736 | ) | (1,974 | ) | 1,731 | ||||||
Net (income) loss attributable to noncontrolling interests | (2 | ) | 7 | (12 | ) | ||||||
Net (loss) income attributable to Baker Hughes | $ | (2,738 | ) | $ | (1,967 | ) | $ | 1,719 | |||
Basic (loss) earnings per share attributable to Baker Hughes | $ | (6.31 | ) | $ | (4.49 | ) | $ | 3.93 | |||
Diluted (loss) earnings per share attributable to Baker Hughes | $ | (6.31 | ) | $ | (4.49 | ) | $ | 3.92 | |||
See Notes to Consolidated Financial Statements
50
BAKER HUGHES INCORPORATED
CONSOLIDATED STATEMENTS OF COMPREHENSIVE INCOME (LOSS)
Year Ended December 31, | |||||||||||
(In millions) | 2016 | 2015 | 2014 | ||||||||
Net (loss) income | $ | (2,736 | ) | $ | (1,974 | ) | $ | 1,731 | |||
Other comprehensive (loss) income: | |||||||||||
Foreign currency translation adjustments | (5 | ) | (241 | ) | (216 | ) | |||||
Pension and other postretirement benefits, net of tax | (23 | ) | (15 | ) | (29 | ) | |||||
Other comprehensive loss | (28 | ) | (256 | ) | (245 | ) | |||||
Comprehensive (loss) income | (2,764 | ) | (2,230 | ) | 1,486 | ||||||
Comprehensive (income) loss attributable to noncontrolling interests | (2 | ) | 7 | (12 | ) | ||||||
Comprehensive (loss) income attributable to Baker Hughes | $ | (2,766 | ) | $ | (2,223 | ) | $ | 1,474 | |||
See Notes to Consolidated Financial Statements
51
BAKER HUGHES INCORPORATED
CONSOLIDATED BALANCE SHEETS
December 31, | |||||||
(In millions, except par value) | 2016 | 2015 | |||||
ASSETS | |||||||
Current Assets: | |||||||
Cash and cash equivalents | $ | 4,572 | $ | 2,324 | |||
Accounts receivable - less allowance for doubtful accounts (2016 - $509; 2015 - $383) | 2,251 | 3,217 | |||||
Inventories, net | 1,809 | 2,917 | |||||
Other current assets | 535 | 810 | |||||
Total current assets | 9,167 | 9,268 | |||||
Property, plant and equipment - less accumulated depreciation (2016 - $6,567; 2015 - $7,378) | 4,271 | 6,693 | |||||
Goodwill | 4,084 | 6,070 | |||||
Intangible assets, net | 318 | 583 | |||||
Other assets | 1,194 | 1,466 | |||||
Total assets | $ | 19,034 | $ | 24,080 | |||
LIABILITIES AND EQUITY | |||||||
Current Liabilities: | |||||||
Accounts payable | $ | 1,027 | $ | 1,409 | |||
Short-term debt and current portion of long-term debt | 132 | 151 | |||||
Accrued employee compensation | 566 | 690 | |||||
Income taxes payable | 78 | 55 | |||||
Other accrued liabilities | 501 | 470 | |||||
Total current liabilities | 2,304 | 2,775 | |||||
Long-term debt | 2,886 | 3,890 | |||||
Deferred income taxes and other tax liabilities | 328 | 252 | |||||
Liabilities for pensions and other postretirement benefits | 626 | 646 | |||||
Other liabilities | 153 | 135 | |||||
Commitments and contingencies | |||||||
Equity: | |||||||
Common stock, one dollar par value (shares authorized - 750; issued and outstanding: 2016 - 424; 2015 - 437) | 425 | 437 | |||||
Capital in excess of par value | 6,708 | 7,261 | |||||
Retained earnings | 6,583 | 9,614 | |||||
Accumulated other comprehensive loss | (1,033 | ) | (1,005 | ) | |||
Treasury stock | (27 | ) | (9 | ) | |||
Baker Hughes stockholders' equity | 12,656 | 16,298 | |||||
Noncontrolling interests | 81 | 84 | |||||
Total equity | 12,737 | 16,382 | |||||
Total liabilities and equity | $ | 19,034 | $ | 24,080 | |||
See Notes to Consolidated Financial Statements
52
BAKER HUGHES INCORPORATED
CONSOLIDATED STATEMENTS OF CHANGES IN EQUITY
Baker Hughes Stockholders' Equity | |||||||||||||||||||||||||||
(In millions, except per share amounts) | Common Stock | Capital in Excess of Par Value | Retained Earnings | Accumulated Other Comprehensive Loss | Treasury Stock | Non-controlling Interests | Total | ||||||||||||||||||||
Balance at December 31, 2013 | $ | 438 | $ | 7,341 | $ | 10,438 | $ | (504 | ) | $ | — | $ | 199 | $ | 17,912 | ||||||||||||
Comprehensive income: | |||||||||||||||||||||||||||
Net income | 1,719 | 12 | 1,731 | ||||||||||||||||||||||||
Other comprehensive loss | (245 | ) | (245 | ) | |||||||||||||||||||||||
Activity related to stock plans | 5 | 200 | 205 | ||||||||||||||||||||||||
Repurchase and retirement of common stock | (9 | ) | (591 | ) | (600 | ) | |||||||||||||||||||||
Stock-based compensation cost | 122 | 122 | |||||||||||||||||||||||||
Cash dividends ($0.64 per share) | (279 | ) | (279 | ) | |||||||||||||||||||||||
Net activity related to noncontrolling interests | (10 | ) | (106 | ) | (116 | ) | |||||||||||||||||||||
Balance at December 31, 2014 | $ | 434 | $ | 7,062 | $ | 11,878 | $ | (749 | ) | $ | — | $ | 105 | $ | 18,730 | ||||||||||||
Comprehensive income: | |||||||||||||||||||||||||||
Net loss | (1,967 | ) | (7 | ) | (1,974 | ) | |||||||||||||||||||||
Other comprehensive loss | (256 | ) | (256 | ) | |||||||||||||||||||||||
Activity related to stock plans | 3 | 101 | (9 | ) | 95 | ||||||||||||||||||||||
Stock-based compensation cost | 120 | 120 | |||||||||||||||||||||||||
Cash dividends ($0.68 per share) | (297 | ) | (297 | ) | |||||||||||||||||||||||
Net activity related to noncontrolling interests | (22 | ) | (14 | ) | (36 | ) | |||||||||||||||||||||
Balance at December 31, 2015 | $ | 437 | $ | 7,261 | $ | 9,614 | $ | (1,005 | ) | $ | (9 | ) | $ | 84 | $ | 16,382 | |||||||||||
Comprehensive income: | |||||||||||||||||||||||||||
Net loss | (2,738 | ) | 2 | (2,736 | ) | ||||||||||||||||||||||
Other comprehensive loss | (28 | ) | (28 | ) | |||||||||||||||||||||||
Activity related to stock plans | 4 | 69 | (18 | ) | 55 | ||||||||||||||||||||||
Repurchase and retirement of common stock | (16 | ) | (747 | ) | (763 | ) | |||||||||||||||||||||
Stock-based compensation cost | 125 | 125 | |||||||||||||||||||||||||
Cash dividends ($0.68 per share) | (293 | ) | (293 | ) | |||||||||||||||||||||||
Net activity related to noncontrolling interests | (5 | ) | (5 | ) | |||||||||||||||||||||||
Balance at December 31, 2016 | $ | 425 | $ | 6,708 | $ | 6,583 | $ | (1,033 | ) | $ | (27 | ) | $ | 81 | $ | 12,737 | |||||||||||
See Notes to Consolidated Financial Statements
53
BAKER HUGHES INCORPORATED
CONSOLIDATED STATEMENTS OF CASH FLOWS
Year Ended December 31, | |||||||||||
(In millions) | 2016 | 2015 | 2014 | ||||||||
Cash flows from operating activities: | |||||||||||
Net (loss) income | $ | (2,736 | ) | $ | (1,974 | ) | $ | 1,731 | |||
Adjustments to reconcile net (loss) income to net cash flows from operating activities: | |||||||||||
Depreciation and amortization | 1,166 | 1,742 | 1,814 | ||||||||
Impairment of assets | 1,271 | 1,436 | — | ||||||||
Goodwill impairment | 1,858 | — | — | ||||||||
Inventory write-down | 583 | 194 | — | ||||||||
Loss on early extinguishment of debt | 142 | — | — | ||||||||
Provision (benefit) for deferred income taxes | 349 | (809 | ) | (70 | ) | ||||||
Gain on disposal of assets | (109 | ) | (157 | ) | (297 | ) | |||||
Provision for doubtful accounts | 188 | 193 | 102 | ||||||||
Provision for excess and obsolete inventory | 181 | 195 | 37 | ||||||||
Other noncash items | 222 | 120 | 122 | ||||||||
Changes in operating assets and liabilities: | |||||||||||
Accounts receivable | 762 | 1,943 | (524 | ) | |||||||
Inventories | 293 | 703 | (296 | ) | |||||||
Other current assets | 441 | 61 | 23 | ||||||||
Accounts payable | (360 | ) | (1,349 | ) | 291 | ||||||
Income taxes payable | 18 | (305 | ) | 90 | |||||||
Other assets and liabilities, net | (40 | ) | (197 | ) | (70 | ) | |||||
Net cash flows provided by operating activities | 4,229 | 1,796 | 2,953 | ||||||||
Cash flows from investing activities: | |||||||||||
Expenditures for capital assets | (332 | ) | (965 | ) | (1,791 | ) | |||||
Proceeds from disposal of assets | 283 | 388 | 437 | ||||||||
Proceeds from maturities of investment securities | 453 | — | — | ||||||||
Purchase of investment securities | (349 | ) | (310 | ) | — | ||||||
Net proceeds from sale of business interest | 142 | — | — | ||||||||
Acquisition of businesses, net of cash acquired | (14 | ) | — | (314 | ) | ||||||
Other investing items, net | 20 | (18 | ) | 9 | |||||||
Net cash flows provided by (used in) investing activities | 203 | (905 | ) | (1,659 | ) | ||||||
Cash flows from financing activities: | |||||||||||
Net repayments of commercial paper borrowings and other debt with three months or less original maturity | (29 | ) | (53 | ) | (216 | ) | |||||
Repayment of short-term debt with greater than three months original maturity | (100 | ) | (293 | ) | (217 | ) | |||||
Proceeds of short-term debt with greater than three months original maturity | 69 | 301 | 185 | ||||||||
Repayment of long-term debt | (1,135 | ) | — | — | |||||||
Repurchase of common stock | (763 | ) | — | (600 | ) | ||||||
Proceeds from issuance of common stock | 91 | 116 | 216 | ||||||||
Dividends paid | (293 | ) | (297 | ) | (279 | ) | |||||
Other financing items, net | (25 | ) | (56 | ) | (28 | ) | |||||
Net cash flows used in financing activities | (2,185 | ) | (282 | ) | (939 | ) | |||||
Effect of foreign exchange rate changes on cash and cash equivalents | 1 | (25 | ) | (14 | ) | ||||||
Increase in cash and cash equivalents | 2,248 | 584 | 341 | ||||||||
Cash and cash equivalents, beginning of period | 2,324 | 1,740 | 1,399 | ||||||||
Cash and cash equivalents, end of period | $ | 4,572 | $ | 2,324 | $ | 1,740 | |||||
Supplemental cash flows disclosures: | |||||||||||
Income taxes paid, net of refunds | $ | (74 | ) | $ | 483 | $ | 881 | ||||
Interest paid | $ | 217 | $ | 242 | $ | 250 | |||||
Supplemental disclosure of noncash investing activities: | |||||||||||
Capital expenditures included in accounts payable | $ | 33 | $ | 44 | $ | 171 | |||||
See Notes to Consolidated Financial Statements
54
Baker Hughes Incorporated
Notes to Consolidated Financial Statements
NOTE 1. SUMMARY OF SIGNIFICANT ACCOUNTING POLICIES
Nature of Operations
Baker Hughes Incorporated ("Baker Hughes," "Company," "we," "our," or "us,") is a leading supplier of oilfield services, products, technology and systems used in the worldwide oil and natural gas industry. We also provide products and services for other businesses including downstream chemicals, and process and pipeline services.
Basis of Presentation
Our consolidated financial statements are prepared in conformity with United States generally accepted accounting principles ("GAAP"). The consolidated financial statements include the accounts of Baker Hughes and all of our subsidiaries where we exercise control. For investments in subsidiaries that are not wholly-owned, but where we exercise control, the equity held by the minority owners and their portions of net income (loss) are reflected as noncontrolling interests. Investments over which we have the ability to exercise significant influence over operating and financial policies, but do not hold a controlling interest, are accounted for using the equity method of accounting. Intercompany accounts and transactions have been eliminated in consolidation. In the Notes to Consolidated Financial Statements, all dollar and share amounts in tabulations are in millions of dollars and shares, respectively, unless otherwise indicated.
Beginning in 2016, all merger and related costs are presented as a separate line item in the consolidated statements of income (loss). Prior year merger and related costs were reclassified to conform to the current year presentation. See Note. 2 "Halliburton Merger Agreement" and Note 3. "General Electric Transaction Agreement" for further information.
Use of Estimates
The preparation of financial statements in conformity with GAAP requires management to make estimates and judgments that affect the reported amounts of assets and liabilities, disclosure of any contingent assets or liabilities at the date of the financial statements and the reported amounts of revenue and expenses during the reporting period. We base our estimates and judgments on historical experience and on various other assumptions and information that are believed to be reasonable under the circumstances. Estimates and assumptions about future events and their effects cannot be perceived with certainty, and accordingly, these estimates may change as new events occur, as more experience is acquired, as additional information is obtained and as our operating environment changes. While we believe that the estimates and assumptions used in the preparation of the consolidated financial statements are appropriate, actual results could differ from those estimates. Estimates are used for, but are not limited to, determining the following: allowance for doubtful accounts and inventory valuation reserves; recoverability of long-lived assets; useful lives used in depreciation and amortization; income taxes and related valuation allowances; accruals for contingencies; actuarial assumptions to determine costs and liabilities related to employee benefit plans; stock-based compensation expense and the fair value of assets acquired and liabilities assumed in acquisitions.
Revenue Recognition
Our products and services are sold based upon purchase orders, contracts or other agreements with the customer that include fixed or determinable prices and that do not include right of return or other similar provisions or other significant post-delivery obligations. We recognize revenue for products sold when title and risk of loss passes, when collectability is reasonably assured and when there are no further significant obligations for future performance. Provisions for estimated warranty returns or similar arrangements are made at the time the related revenue is recognized. Revenue for services is recognized as the services are rendered and when collectability is reasonably assured. Rates for services are typically priced on a per day, per distance drilled, per man hour or similar basis. In certain situations, revenue is generated from transactions that may include multiple products and services under one contract or agreement and which may be delivered to the customer over an extended period of time. Revenue from these arrangements is recognized in accordance with the above criteria and as each item or service is delivered based on their relative fair value.
55
Baker Hughes Incorporated
Notes to Consolidated Financial Statements
Research and Engineering
Research and engineering expenses are expensed as incurred and include costs associated with the research and development of new products and services and costs associated with sustaining engineering of existing products and services. Costs for research and development of new products and services were $271 million, $330 million and $430 million for the years ended December 31, 2016, 2015 and 2014, respectively.
Cash and Cash Equivalents
Cash equivalents include only those investments with an original maturity of three months or less. We maintain cash deposits with major financial institutions. At times, such amounts may exceed federally insured limits. We monitor the credit ratings and our concentration of risk with these financial institutions on a continuing basis to safeguard our cash deposits.
Allowance for Doubtful Accounts
We establish an allowance for doubtful accounts based on various factors including the payment history and financial condition of our customers and the economic environment. Provisions for doubtful accounts are recorded based on the aging status of the customer accounts or when it becomes evident that the customer will not make the required payments at either contractual due dates or in the future. Provision for doubtful accounts recorded in cost of sales was $188 million, $193 million and $102 million for the years ended December 31, 2016, 2015 and 2014, respectively.
Concentration of Credit Risk
We grant credit to our customers who primarily operate in the oil and natural gas industry. Although this concentration affects our overall exposure to credit risk, our trade receivables are spread over a diverse group of customers across many countries, which mitigates this risk. We perform periodic credit evaluations of our customers' financial condition, including monitoring our customers' payment history and current credit worthiness to manage this risk. We do not generally require collateral in support of our trade receivables, but we may require payment in advance or security in the form of a letter of credit or bank guarantee. During 2016, 2015 and 2014, no individual customer accounted for more than 10% of our consolidated revenue.
Inventories
As of January 1, 2016, inventories are stated at the lower of cost or net realizable value as a result of the adoption of Accounting Standard Update 2015-11, which is described below. Prior to our adoption of this standard, inventories were stated at the lower of cost or market. Cost is determined using the average cost method, and includes the cost of materials, labor and manufacturing overhead. Net realizable value is the estimated selling price in the ordinary course of business, less reasonably predictable costs of completion, disposal and transportation. As necessary, we record provisions and maintain reserves for excess, slow moving and obsolete inventory. To determine these reserve amounts, we regularly review inventory quantities on hand and compare them to estimates of future product demand, market conditions, production requirements and technological developments.
Property, Plant and Equipment and Accumulated Depreciation
Property, plant and equipment ("PP&E") is stated at cost less accumulated depreciation, which is generally provided by using the straight-line method over the estimated useful lives of the individual assets. Significant improvements and betterments are capitalized if they extend the useful life of the asset. We manufacture a substantial portion of our tools and equipment and the cost of these items, which includes direct and indirect manufacturing costs, is capitalized and carried in inventory until it is completed. When complete, the cost is reflected in capital expenditures and is classified as machinery, equipment and other in PP&E. Maintenance and repairs are charged to expense as incurred. Upon sale or other disposition, the applicable amounts of asset cost and accumulated depreciation are removed from the balance sheet and the net amount, less proceeds from disposal, is charged or credited to income. The capitalized costs of computer software developed or purchased for internal use are classified in machinery, equipment and other.
56
Baker Hughes Incorporated
Notes to Consolidated Financial Statements
Goodwill, Intangible Assets and Amortization
Goodwill is the excess of the consideration transferred over the fair value of the tangible and identifiable intangible assets and liabilities recognized in acquisitions. Goodwill and intangible assets with indefinite lives are not amortized. Intangible assets with finite useful lives, all of which are amortized on a basis that reflects the pattern in which the economic benefits of the intangible assets are realized, which is generally on a straight-line basis over the asset's estimated useful life.
Impairment of Goodwill, PP&E, Intangibles and Other Long-lived Assets
We perform an annual impairment test of goodwill for each of our reporting units as of October 1, or more frequently if an event occurs or circumstances change to indicate that it is more likely than not that an impairment may exist. Our reporting units are based on our organizational and reporting structure and are the same as our five reportable segments. Corporate and other assets and liabilities are allocated to the reporting units to the extent that they relate to the operations of those reporting units in determining their carrying amount. When performing the annual impairment test we have the option of first performing a qualitative assessment to determine the existence of events and circumstances that would lead to a determination that it is more likely than not that the fair value of a reporting unit is less than its carrying amount. If such a conclusion is reached, we would then be required to perform a quantitative impairment assessment of goodwill. However, if the assessment leads to a determination that it is more likely than not that the fair value of a reporting unit is greater than its carrying amount, then no further assessments are required. A quantitative assessment for the determination of impairment is made by comparing the carrying amount of each reporting unit with its fair value, which is generally calculated using a combination of market, comparable transaction and discounted cash flow approaches. See Note 12. "Goodwill and Intangible Assets" for further information about the goodwill impairment recorded in 2016.
We review PP&E, intangible assets and certain other long-lived assets for impairment whenever events or changes in circumstances indicate that the carrying amount may not be recoverable and at least annually for certain intangible assets. The determination of recoverability is made based upon the estimated undiscounted future net cash flows. The amount of impairment loss, if any, is determined by comparing the fair value, as determined by a discounted cash flow analysis, with the carrying value of the related assets.
In 2015 and 2014, we performed a qualitative assessment for our annual goodwill impairment test and determined that it was more likely than not that the fair value of each of our reporting units exceeded its carrying amount at that time. As such, no impairments of goodwill were recorded for the years ended December 31, 2015 or 2014.
Income Taxes
We use the liability method in determining our provision and liabilities for our income taxes, under which current and deferred tax liabilities and assets are recorded in accordance with enacted tax laws and rates. Deferred tax liabilities and assets, which are computed on the estimated income tax effect of temporary differences between financial and tax bases in assets and liabilities, are determined using the tax rate expected to be in effect when taxes are actually paid or recovered. A valuation allowance to reduce deferred tax assets is established when it is more likely than not that some portion or all of the deferred tax assets will not be realized.
We currently intend to indefinitely reinvest certain earnings of our foreign subsidiaries in operations outside the U.S., and accordingly, we have not provided for U.S. income taxes on such earnings. We do provide for the U.S. and additional non-U.S. taxes on earnings anticipated to be repatriated from our non-U.S. subsidiaries.
Our tax filings for various periods are subject to audit by tax authorities in most jurisdictions where we conduct business. These audits may result in assessments of additional taxes that are resolved with the authorities or through the courts. We have provided for the amounts we believe will ultimately result from these proceedings. In addition to the assessments that have been received from various tax authorities, we also provide for taxes for uncertain tax positions where formal assessments have not been received. We classify interest and penalties related to uncertain tax positions as income taxes in our financial statements.
57
Baker Hughes Incorporated
Notes to Consolidated Financial Statements
Environmental Matters
Estimated remediation costs are accrued using currently available facts, existing environmental permits, technology and enacted laws and regulations. Our cost estimates are developed based on internal evaluations and are not discounted. Accruals are recorded when it is probable that we will be obligated to pay for environmental site evaluation, remediation or related activities, and such costs can be reasonably estimated. As additional information becomes available, accruals are adjusted to reflect current cost estimates. Ongoing environmental compliance costs, such as obtaining environmental permits, installation of pollution control equipment and waste disposal are expensed as incurred. Where we have been identified as a potentially responsible party in a U.S. federal or state Comprehensive Environmental Response, Compensation and Liability Act ("Superfund") site, we accrue our share of the estimated remediation costs of the site. This share is based on the ratio of the estimated volume of waste we contributed to the site to the total volume of waste disposed at the site.
Foreign Currency
A number of our significant foreign subsidiaries have designated the local currency as their functional currency and, as such, gains and losses resulting from balance sheet translation of foreign operations are included as a separate component of accumulated other comprehensive loss within stockholders' equity. Gains and losses from foreign currency transactions, such as those resulting from the settlement of receivables or payables in the non-functional currency, are included in marketing, general and administrative ("MG&A") expenses in the consolidated statements of income (loss) as incurred. For those foreign subsidiaries that have designated the U.S. Dollar ("USD") as the functional currency, monetary assets and liabilities are remeasured at period-end exchange rates, and nonmonetary items are remeasured at historical exchange rates. Gains and losses resulting from this balance sheet remeasurement are also included in MG&A expenses as incurred.
Fair Value Measurement
We define fair value as the price that would be received from selling an asset or paid to transfer a liability in an orderly transaction between market participants at a measurement date. We apply the following fair value hierarchy, which prioritizes the inputs used to measure fair value into three levels and bases the categorization within the hierarchy upon the lowest level of input that is available and significant to the fair value measurement:
• | Level One: The use of quoted prices in active markets for identical financial instruments. |
• | Level Two: The use of quoted prices for similar instruments in active markets or quoted prices for identical or similar instruments in markets that are not active or other inputs that are observable in the market or can be corroborated by observable market data. |
• | Level Three: The use of significantly unobservable inputs that typically require the use of management's estimates of assumptions that market participants would use in pricing. |
Financial Instruments
Our financial instruments include cash and cash equivalents, accounts receivable, investments, accounts payable, short and long-term debt, and derivative financial instruments. Except for long-term debt, the estimated fair value of our financial instruments at December 31, 2016 and 2015 approximates their carrying value as reflected in our consolidated balance sheets. For further information on the fair value of our debt, see Note 13. "Indebtedness."
We monitor our exposure to various business risks including commodity prices, foreign currency exchange rates and interest rates and regularly use derivative financial instruments to manage these risks. Our policies do not permit the use of derivative financial instruments for speculative purposes. At the inception of a new derivative, we designate the derivative as a hedge or we determine the derivative to be undesignated as a hedging instrument. We document the relationships between the hedging instruments and the hedged items, as well as our risk management objectives and strategy for undertaking various hedge transactions.
We have a program that utilizes foreign currency forward contracts to reduce the risks associated with the effects of certain foreign currency exposures. Under this program, our strategy is to have gains or losses on the
58
Baker Hughes Incorporated
Notes to Consolidated Financial Statements
foreign currency forward contracts mitigate the foreign currency transaction and translation gains or losses to the extent practical. These foreign currency exposures typically arise from changes in the value of assets and liabilities which are denominated in currencies other than the functional currency. Our foreign currency forward contracts generally settle in less than 180 days. We record all derivatives as of the end of our reporting period in our consolidated balance sheet at fair value. We record the changes in fair value of the forward contracts in our consolidated statements of income (loss) along with the change in fair value of the hedged item. Recognized gains and losses on derivatives entered into to manage foreign currency exchange risk are included in MG&A expenses in the consolidated statements of income (loss).
We had outstanding foreign currency forward contracts with notional amounts aggregating $271 million and $499 million to hedge exposure to currency fluctuations in various foreign currencies at December 31, 2016 and 2015, respectively. Based on quoted market prices as of December 31, 2016 or 2015 for forward contracts with similar terms and maturity dates, we recorded a gain of $1 million and a loss of $1 million, respectively, to adjust these forward contracts to their fair market value.
New Accounting Standards Adopted
In July 2015, the Financial Accounting Standards Board ("FASB") issued Accounting Standards Update ("ASU") No. 2015-11, Simplifying the Measurement of Inventory, which requires inventory measured using average cost methods, which we utilize, to be subsequently measured at the lower of cost or net realizable value. Net realizable value is the estimated selling price in the ordinary course of business, less reasonably predictable costs of completion, disposal and transportation. We elected to early adopt this guidance as of January 1, 2016 because we believe this approach reduces the complexity in the subsequent measurement of our inventory. Previously, inventory was required to be subsequently measured at the lower of cost or market with market defined as replacement cost, net realizable value or net realizable value less a normal profit margin. The impact of adopting this standard was immaterial to our financial statements. The guidance stipulates that the amendments in ASU No.2015-11 shall be adopted on a prospective basis, therefore our adoption had no impact on prior reporting periods.
New Accounting Standards To Be Adopted
In May 2014, the FASB issued ASU No. 2014-09, Revenue from Contracts with Customers. The ASU will supersede most of the existing revenue recognition requirements in U.S. GAAP and will require entities to recognize revenue at an amount that reflects the consideration to which the Company expects to be entitled in exchange for transferring goods or services to a customer. The new standard also requires significantly expanded disclosures regarding the qualitative and quantitative information of an entity's nature, amount, timing, and uncertainty of revenue and cash flows arising from contracts with customers. The pronouncement is effective for annual reporting periods beginning after December 15, 2017, including interim periods within that reporting period, and is to be applied using a retrospective or modified retrospective approach. Early adoption is permitted. We are currently evaluating the provisions of ASU 2014-09 and assessing the impact, if any, it may have on our financial position and results of operations. As part of our assessment work to-date, we have formed an implementation work team, completed training of the new ASU's revenue recognition model and begun contract review and documentation.
In November 2015, the FASB issued ASU No. 2015-17, Balance Sheet Classification of Deferred Taxes, which amends existing guidance on income taxes to require the classification of all deferred tax assets and liabilities as noncurrent on the balance sheet. The pronouncement is effective for annual reporting periods beginning after December 15, 2016, and will be adopted prospectively. We have completed an evaluation of the pronouncement and determined that the reclassification of deferred taxes will not be material to our consolidated financial statements and related disclosures.
In February 2016, the FASB issued ASU No. 2016-02, Leases, a new standard on accounting for leases. The ASU introduces a lessee model that brings most leases on the balance sheet. The new standard also aligns many of the underlying principles of the new lessor model with those in the current accounting guidance as well as the FASB's new revenue recognition standard. However, the ASU eliminates the use of bright-line tests in determining lease classification as required in the current guidance. The ASU also requires additional qualitative disclosures along with specific quantitative disclosures to better enable users of financial statements to assess the amount,
59
Baker Hughes Incorporated
Notes to Consolidated Financial Statements
timing, and uncertainty of cash flows arising from leases. The pronouncement is effective for annual reporting periods beginning after December 15, 2018, including interim periods within that reporting period, using a modified retrospective approach. Early adoption is permitted. We are currently evaluating the provisions of ASU 2016-02 and assessing the impact it will have on our consolidated financial statements and related disclosures. As part of our assessment work to-date, we have formed an implementation work team, completed training of the new ASU's lease model with the implementation team, and begun review and documentation.
In March 2016, the FASB issued ASU No. 2016-09, Improvements to Employee Share-Based Payment Accounting. The standard provides a new requirement to record all of the tax effects related to share-based payments at settlement (or expiration) through the income statement. This pronouncement is effective for annual reporting periods beginning after December 15, 2016. We have completed an evaluation of the pronouncement and determined that its impact upon adoption will not be material to our consolidated financial statements and related disclosures.
In June 2016, the FASB issued ASU No. 2016-13, Financial Instruments-Credit Losses: Measurement of Credit Losses on Financial Instruments. The new standard amends the impairment model for trade receivables, net investments in leases, debt securities, loans and certain other instruments to utilize an expected loss methodology in place of the currently used incurred loss methodology. This pronouncement is effective for annual periods beginning after December 15, 2019, including interim periods within those annual periods. Early adoption will be permitted for annual periods beginning after December 15, 2018. We are currently evaluating the provisions of the pronouncement and assessing the impact, if any, on our financial statements and related disclosures.
In August 2016, the FASB issued ASU No. 2016-15, Classification of Certain Cash Receipts and Cash Payments. The standard addresses the classification and presentation of eight specific cash flow issues that currently result in diverse practices. This pronouncement is effective for annual reporting periods beginning after December 15, 2017. The amendments in this ASU should be applied using a retrospective approach. We have not completed an evaluation of the impact the pronouncement will have on our consolidated financial statements and related disclosures, but the impact is not expected to be material.
In October 2016, the FASB issued ASU No. 2016-16, Accounting for Income Taxes: Intra-Entity Asset Transfers of Assets Other than Inventory. The standard removes the prohibition in ASC 740 against the immediate recognition of the current and deferred income tax effects of intra-entity transfers of assets other than inventory. This pronouncement is effective for annual reporting periods beginning after December 15, 2017. The amendments in this ASU should be applied using a retrospective approach. We have not completed an evaluation of the impact the pronouncement will have on our consolidated financial statements and related disclosures, but the impact is not expected to be material.
NOTE 2. HALLIBURTON TERMINATED MERGER AGREEMENT
On November 16, 2014, Baker Hughes, Halliburton Company ("Halliburton") and a wholly owned subsidiary of Halliburton ("Merger Sub"), entered into an Agreement and Plan of Merger (the "Merger Agreement"), under which Halliburton would acquire all of the outstanding shares of Baker Hughes through a merger of Baker Hughes with and into Merger Sub (the "Merger").
In accordance with the provisions of Section 9.1 of the Merger Agreement, Baker Hughes and Halliburton agreed to terminate the Merger Agreement on April 30, 2016, as a result of the failure of the Merger to occur on or before April 30, 2016 due to the inability to obtain certain specified antitrust related approvals. Halliburton paid $3.5 billion to Baker Hughes on May 4, 2016, representing the termination fee required to be paid pursuant to the Merger Agreement.
Baker Hughes incurred costs related to the Merger of $180 million and $295 million during 2016 and 2015, respectively, including costs under our retention program and obligations for minimum incentive compensation costs, which, based on meeting eligibility criteria, have been treated as Merger and related costs.
60
Baker Hughes Incorporated
Notes to Consolidated Financial Statements
NOTE 3. GENERAL ELECTRIC TRANSACTION AGREEMENT
On October 30, 2016, Baker Hughes, General Electric Company ("GE"), Bear Newco, Inc. ("Newco"), a Delaware corporation and a direct wholly owned subsidiary of Baker Hughes, and Bear MergerSub, Inc. ("Merger Sub"), a Delaware corporation and a direct wholly owned subsidiary of Newco, entered into a Transaction Agreement and Plan of Merger (the "Transaction Agreement"), pursuant to which, among other things, (i) Merger Sub will merge with and into Baker Hughes, with Baker Hughes as the surviving corporation (the "Surviving Entity") and a direct wholly owned subsidiary of Newco, (ii) each outstanding share of the Baker Hughes' common stock will be converted into the right to receive one share of Class A common stock, par value $0.0001 per share, of Newco ("Newco Class A Common Stock"), (iii) Newco will cause the Surviving Entity to be converted into a Delaware limited liability company ("Newco LLC") and Newco will become the sole managing member of Newco LLC, (iv) GE will (A) receive an approximate 62.5% membership interest in Newco LLC in exchange for contributing $7.4 billion (less the Class B Purchase Price, as defined below) in cash and GE's oil and gas business ("GE O&G") to Newco LLC, and (B) receive Class B common stock, par value $0.0001 per share, of Newco (the "Newco Class B Common Stock"), representing approximately 62.5% of the voting power of the outstanding shares of common stock of Newco, in exchange for contributing the par value thereof (the "Class B Purchase Price") to Newco and (v) Newco will distribute as a special dividend an amount equal to $17.50 per share to the holders of record of the Newco Class A Common Stock, which are the former Baker Hughes stockholders (collectively the " GE Transaction"). Newco will operate as a public company.
Immediately following the closing of the GE Transaction (the "Closing"), (i) (A) GE will hold 100% of the Newco Class B Common Stock, which will represent approximately 62.5% of the voting power of the outstanding shares of common stock of Newco, and (B) Baker Hughes' stockholders immediately prior to the Closing will hold 100% of the Newco Class A Common Stock, which will represent approximately 37.5% of the voting power of the outstanding shares of common stock of Newco, (ii) (A) GE will hold an approximate 62.5% membership interest in Newco LLC and (B) Newco will hold an approximate 37.5% membership interest in Newco LLC and (iii) the membership interests in Newco LLC, together with the Newco Class B Common Stock, will be exchangeable on a 1:1 basis for Newco Class A Common Stock, subject to certain adjustments. The rights (including voting rights) of Newco Class A Common Stock and Newco Class B Common Stock are identical; provided that Newco Class B Common Stock has no economic rights. Effective from and following the Closing, Newco and its subsidiaries will operate under the name "Baker Hughes, a GE Company."
Baker Hughes and GE each made customary representations, warranties and covenants in the Transaction Agreement, including, among others, covenants by each of Baker Hughes and GE to, subject to certain exceptions, conduct its business (in the case of Baker Hughes) or GE O&G (in the case of GE) in the ordinary course during the interim period between the execution of the Transaction Agreement and the Closing. In particular, among other restrictions and subject to certain exceptions, Baker Hughes agreed to generally refrain from acquiring new businesses, incurring new indebtedness, repurchasing shares, issuing new common stock or equity awards (other than equity awards granted to employees, officers and directors materially consistent with historical long-term incentive awards granted), or entering into new material contracts or commitments outside the normal course of business, without the consent of GE, during the period between the execution of the Transaction Agreement and the consummation of the GE Transaction. With respect to equity awards granted after the Transaction Agreement to officers and employees, such awards will not vest solely as a result of the GE Transaction but will be converted to an equivalent Newco equity award. However, they will vest entirely if an officer or employee is terminated within one year following the Closing of the GE Transaction.
Baker Hughes is permitted to pay regular quarterly cash dividends to its stockholders between signing and Closing. GE O&G is permitted to pay dividends to GE between signing and Closing; provided that GE O&G is required to have a minimum level of working capital at Closing.
The obligation of the parties to consummate the GE Transaction is subject to customary closing conditions, including, among others, (i) the approval of holders of a majority of the outstanding shares of Baker Hughes common stock; (ii) (A) the expiration or termination of the applicable waiting period under the Hart-Scott-Rodino Antitrust Improvements Act of 1976, as amended; (B) the European Commission issuing a decision under the Council Regulation (EC) No. 139/2004 of January 20, 2004 on the control of concentrations between undertakings (published in the Official Journal of the European Union on January 29, 2004 at L 24/1) declaring the GE
61
Baker Hughes Incorporated
Notes to Consolidated Financial Statements
Transaction compatible with the common market, or, if the European Commission has adopted any decision under Article 9 of such regulations to refer the GE Transaction in part to any Member State of the European Economic Area, the European Commission issuing a decision declaring the part of the GE Transaction not so referred to that Member State compatible with the common market and every Member State to which part of the Transaction has been referred under Article 9 issuing a decision clearing the GE Transaction; and (C) the expiration or termination of all other applicable waiting and other time periods under certain other regulatory and competition laws; (iii) the absence of legal restraints and prohibitions; (iv) the effectiveness of the registration statement on Form S-4 to be filed by Newco with the Securities and Exchange Commission and the approval of the listing on the New York Stock Exchange of Newco Class A Common Stock to be issued in the GE Transaction; and (v) the completion in all material respects of certain restructuring transactions in connection with the Transaction. The obligation of each party to consummate the GE Transaction is also conditioned upon the other party's representations and warranties being true and correct (subject to certain materiality exceptions) and the other party having performed in all material respects its obligations under the Transaction Agreement. In addition, Baker Hughes' obligation to consummate the Transaction is subject to the financial statement-related condition described below.
As promptly as reasonably practicable following December 31, 2016 (and in any event no later than April 15, 2017 or April 30, 2017 in the case of the September 30, 2016 audited financial statements), GE is required to deliver to Baker Hughes certain audited financial statements of GE O&G, including those required to be included in Newco's registration statement on Form S-4. If such audited financial statements differ from the unaudited financial statements of GE O&G provided to Baker Hughes in a manner that is material to the intrinsic value of GE O&G in an adverse manner, Baker Hughes may terminate the Transaction Agreement. In the event of such termination, GE would be required to reimburse Baker Hughes for certain expenses, up to $40 million.
GE is required to take all actions necessary to obtain regulatory approvals (including agreeing to divestitures of certain specified businesses and any businesses of which any such business forms a substantial part (the "Specified Businesses")) unless the assets, businesses or product lines subject to such actions would account for more than $200 million of revenue in 2015. The divestiture of the Specified Businesses will not be taken into account for purposes of calculating the $200 million divestiture limit. Subject to certain exceptions, proceeds of any divestitures would remain with GE O&G and be transferred to Newco LLC following the Closing of the Transaction.
Additionally, the Transaction Agreement provides for certain termination rights for each of Baker Hughes and GE, including (i) GE's right to terminate the Transaction Agreement if Baker Hughes' board of directors changes its recommendation that Baker Hughes' stockholders approve the Transaction Agreement; (ii) Baker Hughes' right to terminate the Transaction Agreement, prior to obtaining the approval of its stockholders, to enter into a definitive agreement providing for a superior proposal; and (iii) the right of each party to terminate the Transaction Agreement if the GE Transaction has not been consummated by the "termination date" of January 30, 2018, subject to each party's right to extend the termination date until April 30, 2018, if all closing conditions (other than receipt of certain regulatory approvals) has been satisfied by January 30, 2018.
The Transaction Agreement provides for the payment by Baker Hughes to GE of a termination fee of $750 million if certain events described in the Transaction Agreement occur, including if Baker Hughes' board of directors changes its recommendation that Baker Hughes' stockholders approve the Transaction Agreement.
Baker Hughes is also required to reimburse GE for certain expenses (up to $40 million) if the Transaction Agreement is terminated because Baker Hughes' stockholders have not approved the Transaction Agreement upon a vote taken thereon, and prior to the Baker Hughes stockholder meeting, a proposal for an alternative transaction was publicly announced and not withdrawn. If, within twelve months after such termination, Baker Hughes enters into an agreement providing for, or consummates, an alternative transaction with a third party, thereby triggering the $750 million termination fee described above, that termination fee will be reduced by the amount of any expenses previously reimbursed.
In the event the Transaction Agreement is terminated by (i) either party as a result of the failure of the GE Transaction to occur on or before the termination date (as it may be extended) due to the failure to achieve certain antitrust-related approvals if all closing conditions (other than receipt of antitrust and other specified regulatory approvals and conditions that by their nature cannot be satisfied until the Closing but subject to such conditions being capable of being satisfied if the Closing date were the date of termination) have been satisfied, (ii) either party
62
Baker Hughes Incorporated
Notes to Consolidated Financial Statements
as a result of any antitrust-related final, non-appealable order or injunction prohibiting the Closing, or (iii) Baker Hughes, as a result of GE's material breach of its obligations to obtain regulatory approvals such that the antitrust-related condition to closing is incapable of being satisfied, then in each case GE would be required to pay Baker Hughes a termination fee of $1.3 billion.
Baker Hughes and GE expect the GE Transaction to close in mid-2017. However, Baker Hughes cannot predict with certainty when, or if, the GE Transaction will be completed because completion of the GE Transaction is subject to conditions beyond the control of Baker Hughes. Baker Hughes incurred costs of $19 million related to the GE Transaction, which was recorded as Merger and related costs during the fourth quarter of 2016.
NOTE 4. IMPAIRMENT AND RESTRUCTURING CHARGES
IMPAIRMENT CHARGES
We conduct impairment tests on long-lived assets whenever events or changes in circumstances indicate that the carrying value may not be recoverable based on estimated future cash flows. Although oil prices have risen since the lows reached in February 2016 and rig counts have begun to stabilize, customer spending and activity remained at low levels throughout 2016, resulting in lower demand for our products and services. We considered our customers' constrained capital spending budgets for 2016 to be impairment indicators and accordingly evaluated our long-lived assets for impairment.
As a result of our testing in 2016, certain machinery and equipment was written down to its estimated fair value, resulting in impairment charges of $453 million. Additionally in 2016, certain intangible assets, comprised of technology, customer relationships and trade names were written down to their estimated fair values, resulting in impairment charges of $114 million. Total impairment charges of $567 million for 2016 are described by segment in the table below. The estimated fair values for these assets were determined using discounted future cash flows. The significant level 3 unobservable inputs used in the determination of the fair value of these assets were the estimated future cash flows and the weighted average cost of capital ("WACC"). The WACC's used to discount future cash flows for the impairments recognized in 2016 are included in the table below.
Impairment Charges | Net Carrying Value | ||||||||||||||||
Segments | Machinery, Equipment and Other | Intangible Assets | Total Impairment Charges | Machinery, Equipment and Other | Intangible Assets | WACC | |||||||||||
North America | $ | 84 | $ | 85 | $ | 169 | $ | 241 | $ | 125 | 10.0 | % | |||||
Latin America | 66 | 5 | 71 | 245 | 17 | 16.0 | % | ||||||||||
Europe/Africa/Russia Caspian | 124 | 4 | 128 | 222 | 8 | (1 | ) | ||||||||||
Middle East/Asia Pacific | 166 | 17 | 183 | 433 | 49 | (1 | ) | ||||||||||
Industrial Services | 13 | 3 | 16 | 196 | 44 | 10.0 | % | ||||||||||
Total | $ | 453 | $ | 114 | $ | 567 | $ | 1,337 | $ | 243 | |||||||
(1) | The WACC's used by region in 2016 were as follows: Europe - 10.5%; Africa - 19.5%; Russia/Caspian - 15.0%; Middle East - 14.0%; Asia Pacific - 13.5%. |
As a result of our testing in 2015, certain machinery and equipment with a total carrying value of $1.64 billion was written down to its estimated fair value, resulting in impairment charges of $1.05 billion. Additionally, certain intangible assets, comprised primarily of customer relationships and trade names, with a total carrying value of $178 million were written down to their estimated fair values, resulting in impairment charges of $116 million. Total impairment charges for 2015 were $1.16 billion, the majority of which related to our pressure pumping business in North America. The WACC used to discount future cash flows for the impairments recognized in North America was 9.8%.
63
Baker Hughes Incorporated
Notes to Consolidated Financial Statements
RESTRUCTURING CHARGES
We recognize restructuring charges for costs associated with workforce reductions, contract terminations, facility closures and impairments related to the permanent removal from service and disposal of excess machinery and equipment. As a result of the downturn in the industry in 2015 and its impact on our business outlook, we took actions to restructure and adjust our operations and cost structure to reflect current and expected activity levels to the extent allowable under the Merger Agreement with Halliburton. Following the termination of the Merger Agreement in the second quarter of 2016, to address ongoing industry challenges, we took additional actions to reduce costs, simplify our organization, refine and rationalize our operating strategy and adjust our capacity to meet expected levels of future demand. These actions necessitated workforce reductions, contract terminations, facility closures and the permanent removal from service and disposal of excess machinery and equipment. As a result of these restructuring activities, we recorded restructuring charges of $1.17 billion and $830 million in 2016 and 2015, respectively. Depending on future market conditions and activity levels, further actions may be necessary to adjust our operations, which may result in additional charges.
Our restructuring charges as summarized below as of December 31:
Restructuring Charges | 2016 | 2015 | |||||
Workforce reductions | $ | 272 | $ | 436 | |||
Contract terminations | 192 | 121 | |||||
Impairment of buildings and improvements | 214 | 82 | |||||
Impairment of machinery and equipment | 490 | 191 | |||||
Total restructuring charges | $ | 1,168 | $ | 830 | |||
Workforce reduction costs: During 2016 and 2015, we initiated workforce reductions resulting in the combined elimination of approximately 26,200 positions worldwide. As a result of these workforce reductions, we recorded a charge for severance expense of $272 million and $436 million during 2016 and 2015, respectively, net of related employee benefit plan gains of $9 million and $10 million, respectively. The amount accrued for any unpaid severance is based on our written severance policy for ongoing benefit arrangements or the country mandated scheme and the positions being eliminated. In 2016 and 2015, we have made payments totaling $289 million and $365 million, respectively, relating to workforce reductions. We expect that substantially all of the accrued severance remaining will be paid by the middle of 2017.
Contract termination costs: During 2016 and 2015, we incurred costs of $192 million and $121 million, respectively, to terminate or restructure various contracts, primarily in North America. This includes the accrual for costs to settle leases on closed facilities and certain equipment, and other estimated exit costs, and is net of expected sublease income. This also includes costs to terminate or restructure certain take-or-pay supply contracts related to the purchase of materials used in our pressure pumping operations in North America, including the write-off of $14 million of prepayments made in 2014. In 2016 and 2015, we have made payments totaling $130 million and $81 million, respectively, relating to contract termination costs. We expect that substantially all of the accrued contract termination costs remaining will be paid by the end of 2017.
Impairment of buildings and improvements: During 2016 and 2015, we consolidated and closed certain facilities, both owned and leased, and recorded related impairment charges of $214 million and $82 million, respectively. In 2016, the total impairment of buildings and improvements reduced our segment assets as follows: North America - $145 million; Latin America - $18 million; Europe/Africa/Russia Caspian - $41 million; Middle East/Asia Pacific - $9 million; and Industrial Services - $1 million. In 2015, the impairment charges related to facilities primarily in North America and Latin America. These facilities have been taken out of service and will be disposed.
Impairment of machinery and equipment: Following the termination of the Merger Agreement with Halliburton in the second quarter of 2016, we evaluated our capacity and made adjustments to align our capacity to expected future operational levels and strategy. These actions impacted all product lines and as a result, we recognized an impairment loss of $490 million in 2016 relating to the cost to impair excess machinery and equipment to its net realizable value. The total machinery and equipment impairments reduced our segment assets as follows: North America - $203 million; Latin America - $80 million; Europe/Africa/Russia Caspian - $88 million;
64
Baker Hughes Incorporated
Notes to Consolidated Financial Statements
Middle East/Asia Pacific - $85 million; and Industrial Services - $34 million. In 2015, we exited or substantially downsized our presence in select markets primarily in our pressure pumping product line in North America and Latin America. As a result, we recognized $191 million of impairment losses to adjust the carrying value of certain machinery and equipment to its fair value, net of costs to dispose. We have been disposing of all excess machinery and equipment, and were substantially complete by the end of 2016.
INVENTORY AND OTHER CHARGES
During 2016, in connection with the evaluation of our current inventory levels and expected future demand and to align with our future strategy, we recorded charges of $617 million, including $34 million of disposal costs, of which $204 million is reported in cost of sales and $413 million is reported in cost of services, to write off the carrying value of inventory deemed excess. These actions impacted all product lines. The amount of the inventory write-off recorded by segment is as follows: North America - $230 million; Latin America - $84 million; Europe/Africa/Russia Caspian - $143 million; Middle East/Asia Pacific - $117 million; and Industrial Services - $43 million. We have been disposing of the excess inventory, and were substantially complete by the end of 2016. During 2015, we also recorded charges of $194 million, of which $37 million is reported in cost of sales and $157 million is reported in cost of services, to write down the carrying value of certain inventory. The write-down was primarily due to lower of cost or market adjustments triggered by the significant decline in activity and related prices for our products coupled with declines in replacement costs. The product lines impacted are primarily the pressure pumping and drilling and completion fluids in North America.
NOTE 5. ACQUISITIONS AND DISPOSITIONS
AQUISITIONS
In September 2014, we completed the acquisition of the pipeline and specialty services business of Weatherford International Ltd. ("PSS") for total cash consideration of $248 million. PSS provides an expanded range of pre-commissioning, deepwater and in-line inspection services worldwide and is included in our Industrial Services segment. The transaction has been accounted for using the acquisition method of accounting and accordingly, assets acquired and liabilities assumed were recorded at their fair values as of the acquisition date. As a result of the acquisition, we recorded approximately $73 million of goodwill and approximately $37 million of intangible assets. Pro forma results of operations for this acquisition have not been presented because the effect of this acquisition was not material to our consolidated financial statements.
DISPOSITIONS
In December 2016, we closed the transaction contemplated by the contribution agreement among Baker Hughes, CSL Capital Management ("CSL") and West Street Energy Partners ("WSEP"), a fund managed by the Merchant Banking Division of Goldman Sachs, to create a North American onshore pressure pumping company, called BJ Services, LLC ("BJ Services"). Under the terms of the agreement, we contributed our wholly-owned North American onshore cementing and hydraulic fracturing business, which was comprised of the U.S. and Canada operations. This also includes personnel, technology and infrastructure.
Net book value of the assets contributed totaled approximately $516 million, which was comprised of fixed assets, inventory and certain patents and technology. We also allocated goodwill to the contributed business of $139 million. We received consideration of $142 million in cash, net of $8 million of direct transaction fees, and a 46.7% interest in BJ Services, which we recorded as an equity method investment valued at $416 million included in Other Assets in our consolidated balance sheet. This resulted in a loss on the deconsolidation of this business of $97 million.
We will provide customary support services during a transition period. BJ Services will have access to certain of Baker Hughes' pressure pumping technology through a licensing agreement. Utilizing a strategic collaboration, we will have access to BJ Services' product and service portfolio to continue to provide solutions to customers in the North American onshore market. Revenue from these operations totaled $231 million, $1.27 billion and $4.30 billion in 2016, 2015 and 2014, respectively. Operating loss before tax and allocations of indirect costs and expenses totaled $251 million in 2016 and $559 million in 2015, and operating profit before tax and allocations of indirect
65
Baker Hughes Incorporated
Notes to Consolidated Financial Statements
costs and expenses in 2014 totaled $279 million. See Note. 6 "Segment Information" for our description of operating profit (loss) before tax.
NOTE 6. SEGMENT INFORMATION
We are a supplier of oilfield services, products, technology and systems to the worldwide oil and natural gas business, referred to as oilfield operations, which are managed through operating segments that are aligned with our geographic regions. We also provide services and products to the downstream chemicals, and process and pipeline services, referred to as Industrial Services.
The performance of our operating segments is evaluated based on operating profit (loss) before tax, which is defined as income (loss) before income taxes and before the following: net interest expense, corporate expenses, impairment and restructuring charges, goodwill impairment charges, the merger termination fee, loss on sale of business interest, loss on early extinguishment of debt, and certain gains and losses not allocated to the operating segments.
Beginning in 2016, we excluded merger and related costs, from both the terminated Halliburton and the proposed GE transactions, from our operating segments. These costs are now presented as a separate line item in the consolidated statement of income (loss). Prior year merger and related costs have been reclassified to conform to the current year presentation.
The following table presents revenue and operating profit (loss) before tax by segment for the years ended December 31:
2016 | 2015 | 2014 | |||||||||||||||||||||
Segments | Revenue | Operating Profit (Loss) Before Tax | Revenue | Operating Profit (Loss) Before Tax | Revenue | Operating Profit (Loss) Before Tax | |||||||||||||||||
North America | $ | 2,936 | $ | (687 | ) | $ | 6,009 | $ | (639 | ) | $ | 12,078 | $ | 1,466 | |||||||||
Latin America | 980 | (276 | ) | 1,799 | 144 | 2,236 | 290 | ||||||||||||||||
Europe/Africa/Russia Caspian | 2,201 | (273 | ) | 3,278 | 183 | 4,417 | 621 | ||||||||||||||||
Middle East/Asia Pacific | 2,705 | 69 | 3,441 | 229 | 4,456 | 675 | |||||||||||||||||
Industrial Services | 1,019 | (6 | ) | 1,215 | 108 | 1,364 | 119 | ||||||||||||||||
Total Operations | 9,841 | (1,173 | ) | 15,742 | 25 | 24,551 | 3,171 | ||||||||||||||||
Corporate | — | (158 | ) | — | (133 | ) | — | (312 | ) | ||||||||||||||
Loss on sale of business interest | — | (97 | ) | — | — | — | — | ||||||||||||||||
Loss on early extinguishment of debt | — | (142 | ) | — | — | — | — | ||||||||||||||||
Interest expense, net | — | (178 | ) | — | (217 | ) | — | (232 | ) | ||||||||||||||
Impairment and restructuring charges | — | (1,735 | ) | — | (1,993 | ) | — | — | |||||||||||||||
Goodwill impairment | — | (1,858 | ) | — | — | — | — | ||||||||||||||||
Merger and related costs | — | (199 | ) | — | (295 | ) | — | — | |||||||||||||||
Merger termination fee | — | 3,500 | — | — | — | — | |||||||||||||||||
Total | $ | 9,841 | $ | (2,040 | ) | $ | 15,742 | $ | (2,613 | ) | $ | 24,551 | $ | 2,627 | |||||||||
66
Baker Hughes Incorporated
Notes to Consolidated Financial Statements
The following table presents total assets by segment at December 31:
2016 | 2015 | 2014 | |||||||||
Segments | Assets | Assets | Assets | ||||||||
North America | $ | 3,049 | $ | 6,599 | $ | 9,782 | |||||
Latin America | 1,530 | 2,323 | 2,508 | ||||||||
Europe/Africa/Russia Caspian | 2,446 | 3,077 | 4,106 | ||||||||
Middle East/Asia Pacific | 2,746 | 3,441 | 4,029 | ||||||||
Industrial Services | 631 | 1,106 | 1,260 | ||||||||
Shared assets | 5,129 | 5,613 | 5,423 | ||||||||
Total Operations | 15,531 | 22,159 | 27,108 | ||||||||
Corporate | 3,503 | 1,921 | 1,719 | ||||||||
Total | $ | 19,034 | $ | 24,080 | $ | 28,827 | |||||
Shared assets consist primarily of the assets carried at the enterprise level and include assets related to our supply chain, product line technology and information technology organizations. These assets are used to support our operating segments and consist primarily of manufacturing inventory, property, plant and equipment used in manufacturing and information technology, intangible assets related to technology, and certain deferred tax assets. All costs and expenses from these organizations, including depreciation and amortization, are allocated to our operating segments as these enterprise organizations support our global operations. Corporate assets include cash, certain facilities, our equity method investment in BJ Services, and certain other noncurrent assets related to certain employee retirement plans.
The following table presents capital expenditures and depreciation and amortization by segment for the years ended December 31:
2016 | 2015 | 2014 | |||||||||||||||||||||
Segments | Capital Expenditures | Depreciation and Amortization | Capital Expenditures | Depreciation and Amortization | Capital Expenditures | Depreciation and Amortization | |||||||||||||||||
North America | $ | 75 | $ | 356 | $ | 228 | $ | 714 | $ | 465 | $ | 842 | |||||||||||
Latin America | 35 | 160 | 103 | 213 | 171 | 220 | |||||||||||||||||
Europe/Africa/Russia Caspian | 122 | 268 | 175 | 378 | 373 | 351 | |||||||||||||||||
Middle East/Asia Pacific | 83 | 300 | 247 | 344 | 385 | 321 | |||||||||||||||||
Industrial Services | 7 | 77 | 21 | 87 | 46 | 70 | |||||||||||||||||
Shared assets | 9 | — | 188 | — | 342 | — | |||||||||||||||||
Total Operations | 331 | 1,161 | 962 | 1,736 | 1,782 | 1,804 | |||||||||||||||||
Corporate | 1 | 5 | 3 | 6 | 9 | 10 | |||||||||||||||||
Total | $ | 332 | $ | 1,166 | $ | 965 | $ | 1,742 | $ | 1,791 | $ | 1,814 | |||||||||||
67
Baker Hughes Incorporated
Notes to Consolidated Financial Statements
The following tables present geographic consolidated revenue based on the location to where the product is shipped or the services are performed for the years ended December 31, and net property, plant and equipment by its geographic location at December 31. Amounts for Industrial Services have been included in the applicable geographic locations.
2016 | 2015 | 2014 | |||||||||
Revenue | Revenue | Revenue | |||||||||
U.S. | $ | 2,875 | $ | 5,800 | $ | 11,499 | |||||
Canada and other | 598 | 839 | 1,336 | ||||||||
North America | 3,473 | 6,639 | 12,835 | ||||||||
Latin America | 1,006 | 1,847 | 2,300 | ||||||||
Europe/Africa/Russia Caspian | 2,457 | 3,555 | 4,705 | ||||||||
Middle East/Asia Pacific | 2,905 | 3,701 | 4,711 | ||||||||
Total | $ | 9,841 | $ | 15,742 | $ | 24,551 | |||||
2016 | 2015 | 2014 | |||||||||
Net Property, Plant and Equipment | Net Property, Plant and Equipment | Net Property, Plant and Equipment | |||||||||
U.S. | $ | 1,792 | $ | 2,989 | $ | 4,417 | |||||
Canada and other | 148 | 260 | 482 | ||||||||
North America | 1,940 | 3,249 | 4,899 | ||||||||
Latin America | 466 | 716 | 890 | ||||||||
Europe/Africa/Russia Caspian | 984 | 1,400 | 1,805 | ||||||||
Middle East/Asia Pacific | 881 | 1,328 | 1,469 | ||||||||
Total | $ | 4,271 | $ | 6,693 | $ | 9,063 | |||||
The following table presents consolidated revenue for each category of similar products and services for the years ended December 31:
2016 | 2015 | 2014 | |||||||||
Completion and Production | $ | 5,681 | $ | 8,831 | $ | 14,572 | |||||
Drilling and Evaluation | 3,141 | 5,696 | 8,615 | ||||||||
Industrial Services | 1,019 | 1,215 | 1,364 | ||||||||
Total | $ | 9,841 | $ | 15,742 | $ | 24,551 | |||||
NOTE 7. STOCK-BASED COMPENSATION
Stock-based compensation cost is measured at the date of grant based on the calculated fair value of the award and is generally recognized on a straight-line basis over the vesting period of the equity grant. The compensation cost is determined based on awards ultimately expected to vest; therefore, we have reduced the cost for estimated forfeitures based on historical forfeiture rates. Forfeitures are estimated at the time of grant and revised, if necessary, in subsequent periods to reflect actual forfeitures. There were no stock-based compensation costs capitalized as the amounts were not material.
68
Baker Hughes Incorporated
Notes to Consolidated Financial Statements
Stock-based compensation costs are as follows for the years ended December 31:
2016 | 2015 | 2014 | |||||||||
Stock-based compensation cost | $ | 125 | $ | 120 | $ | 122 | |||||
Tax benefit | (33 | ) | (28 | ) | (26 | ) | |||||
Stock-based compensation cost, net of tax | $ | 92 | $ | 92 | $ | 96 | |||||
For our stock options and restricted stock awards and units, we currently have 60.7 million shares authorized for issuance and as of December 31, 2016, approximately 16.9 million shares were available for future grants. Our policy is to issue new shares for exercises of stock options, when restricted stock awards are granted, at vesting of restricted stock units and for issuances under the employee stock purchase plan.
Stock Options
Our stock option plans provide for the issuance of stock options to directors, officers and other key employees at an exercise price equal to the fair market value of the stock at the date of grant. Although subject to the terms of the stock option agreement, substantially all of the stock options become exercisable in three equal annual installments, beginning a year from the date of grant, and generally expire ten years from the date of grant. The stock option plans provide for the acceleration of vesting upon the employee's retirement; therefore, the service period is reduced for employees that are or will become retirement eligible during the vesting period, and accordingly, the recognition of compensation expense for these employees is accelerated. No stock options were granted in 2016 or 2015.
The fair value of each stock option granted is estimated using the Black-Scholes option pricing model. The following table presents the weighted average assumptions used in the option pricing model for options granted. The expected life of the options represents the period of time the options are expected to be outstanding. The expected life is based on our historical exercise trends and post-vest termination data incorporated into a forward-looking stock price model. The expected volatility is based on our implied volatility, which is the volatility forecast that is implied by the prices of actively traded options to purchase our stock observed in the market. The risk-free interest rate is based on the observed U.S. Treasury yield curve in effect at the time the options were granted. The dividend yield is based on our history of dividend payouts.
2014 | ||||
Expected life (years) | 4.6 | |||
Risk-free interest rate | 1.5 | % | ||
Volatility | 31.9 | % | ||
Dividend yield | 1.0 | % | ||
Weighted average fair value per share at grant date | $ | 16.81 | ||
69
Baker Hughes Incorporated
Notes to Consolidated Financial Statements
The following table presents the changes in stock options outstanding and related information (in thousands, except per option prices):
Number of Options | Weighted Average Exercise Price Per Option | |||||||||
Outstanding at December 31, 2015 | 8,602 | $ | 54.56 | |||||||
Granted | — | — | ||||||||
Exercised | (765 | ) | 44.04 | |||||||
Forfeited | (78 | ) | 60.35 | |||||||
Expired | (522 | ) | 75.55 | |||||||
Outstanding at December 31, 2016 | 7,237 | $ | 54.09 | |||||||
Exercisable at December 31, 2016 | 6,993 | $ | 53.76 | |||||||
The weighted average remaining contractual term for options outstanding and options exercisable at December 31, 2016 were 3.77 years and 3.66 years, respectively.
The total intrinsic value of stock options (defined as the amount by which the market price of our common stock on the date of exercise exceeds the exercise price of the option) exercised in 2016, 2015 and 2014 was $11 million, $15 million and $70 million, respectively. The income tax benefit realized from stock options exercised was $1 million, $3.8 million and $19.6 million in 2016, 2015 and 2014, respectively.
The total fair value of options vested in 2016, 2015 and 2014 was $13 million, $24 million and $29 million, respectively. As of December 31, 2016, there was $1 million of total unrecognized compensation cost related to unvested stock options, which is expected to be recognized over a weighted average period of six months.
The total intrinsic value of stock options outstanding at December 31, 2016 was $97 million, of which $96 million relates to options vested and exercisable. The intrinsic value for stock options outstanding is calculated as the amount by which the quoted price of $64.97 of our common stock as of the end of 2016 exceeds the exercise price of the options.
Restricted Stock Awards and Units
In addition to stock options, our officers, directors and key employees may be granted restricted stock awards ("RSA"), which is an award of common stock with no exercise price, or restricted stock units ("RSU"), where each unit represents the right to receive, at the end of a stipulated period, one unrestricted share of stock with no exercise price. RSAs and RSUs are subject to cliff or graded vesting, generally ranging over a three year period, or over a one year period for non-employee directors. We determine the fair value of restricted stock awards and restricted stock units based on the market price of our common stock on the date of grant. The following table presents the combined changes of RSAs and RSUs and related information (in thousands, except per award/unit prices):
Number of Awards and Units | Weighted Average Grant Date Fair Value Per Award/Unit | |||||
Unvested balance at December 31, 2015 | 3,356 | $ | 58.99 | |||
Granted | 3,313 | 40.56 | ||||
Vested | (1,809 | ) | 55.50 | |||
Forfeited | (809 | ) | 49.73 | |||
Unvested balance at December 31, 2016 | 4,051 | $ | 47.33 | |||
70
Baker Hughes Incorporated
Notes to Consolidated Financial Statements
The weighted average grant date fair value per share for RSAs and RSUs granted in 2016, 2015 and 2014 was $40.56, $57.37 and $69.67, respectively. The total fair value of RSAs and RSUs vested in 2016, 2015 and 2014 was $100 million, $72 million and $60 million, respectively. As of December 31, 2016, there was $110 million of total unrecognized compensation cost related to unvested RSAs and RSUs, which is expected to be recognized over a weighted average period of two years.
Employee Stock Purchase Plan
The Employee Stock Purchase Plan ("ESPP") provides for eligible employees to purchase shares on an after-tax basis in an amount between 1% and 10% of their annual pay: (i) on June 30 of each year at a 15% discount of the fair market value of our common stock on January 1 or June 30, whichever is lower, and (ii) on December 31 of each year at a 15% discount of the fair market value of our common stock on July 1 or December 31, whichever is lower. An employee may not contribute more than $5,000 in either of the six-month measurement periods described above or $10,000 annually.
We currently have 30.5 million shares authorized for issuance, and at December 31, 2016, there were 2.7 million shares reserved for future issuance. Compensation cost for the years ended December 31, was calculated using the Black-Scholes option pricing model with the following assumptions:
2016 | 2015 | 2014 | |||||||||
Expected life (years) | 0.5 | 0.5 | 0.5 | ||||||||
Risk-free interest rate | 0.5 | % | 0.1 | % | 0.03 | % | |||||
Volatility | 46.2 | % | 30.9 | % | 24.7 | % | |||||
Dividend yield | 1.5 | % | 1.2 | % | 1.0 | % | |||||
Fair value per share of the 15% cash discount | $ | 6.85 | $ | 8.79 | $ | 9.72 | |||||
Fair value per share of the look-back provision | 5.86 | 4.97 | 4.39 | ||||||||
Total weighted average fair value per share at grant date | $ | 12.71 | $ | 13.76 | $ | 14.11 | |||||
We calculated estimated volatility using historical daily prices based on the expected life of the stock purchase plan. The risk-free interest rate is based on the observed U.S. Treasury yield curve in effect at the time the ESPP shares were granted. The dividend yield is based on our history of dividend payouts.
NOTE 8. INCOME TAXES
The provision or benefit for income taxes is comprised of the following for the years ended December 31:
2016 | 2015 | 2014 | |||||||||
Current: | |||||||||||
U.S. | $ | 139 | $ | (55 | ) | $ | 365 | ||||
Foreign | 208 | 225 | 601 | ||||||||
Total current | 347 | 170 | 966 | ||||||||
Deferred: | |||||||||||
U.S. | 269 | (762 | ) | (52 | ) | ||||||
Foreign | 80 | (47 | ) | (18 | ) | ||||||
Total deferred | 349 | (809 | ) | (70 | ) | ||||||
Provision (benefit) for income taxes | $ | 696 | $ | (639 | ) | $ | 896 | ||||
71
Baker Hughes Incorporated
Notes to Consolidated Financial Statements
The geographic sources of loss or income before income taxes are as follows for the years ended December 31:
2016 | 2015 | 2014 | |||||||||
U.S. | $ | (347 | ) | $ | (2,288 | ) | $ | 920 | |||
Foreign | (1,693 | ) | (325 | ) | 1,707 | ||||||
(Loss) income before income taxes | $ | (2,040 | ) | $ | (2,613 | ) | $ | 2,627 | |||
The benefit or provision for income taxes differs from the amount computed by applying the U.S. statutory income tax rate to the loss or income before income taxes for the reasons set forth below for the years ended December 31:
2016 | 2015 | 2014 | ||||||
U.S. statutory income tax rate | 35.0 | % | 35.0 | % | 35.0 | % | ||
Effect of foreign operations | 1.3 | (1.5 | ) | (5.3 | ) | |||
Change in valuation allowances | (39.2 | ) | (7.3 | ) | 4.0 | |||
Adjustments of prior years' tax positions | (3.8 | ) | (1.5 | ) | 1.2 | |||
Goodwill impairment | (27.6 | ) | — | — | ||||
State income taxes - net of U.S. tax benefit | 1.2 | 1.4 | 0.9 | |||||
Other - net | (1.0 | ) | (1.6 | ) | (1.7 | ) | ||
Total effective tax rate | (34.1 | )% | 24.5 | % | 34.1 | % | ||
Deferred income taxes reflect the net tax effects of temporary differences between the carrying amounts of assets and liabilities for financial reporting purposes and the amounts used for income tax purposes, as well as operating loss and tax credit carryforwards.
The tax effects of our temporary differences and carryforwards are as follows at December 31:
2016 | 2015 | ||||||
Deferred tax assets: | |||||||
Receivables | $ | 184 | $ | 84 | |||
Inventory | 196 | 253 | |||||
Property | 261 | — | |||||
Employee benefits | 128 | 143 | |||||
Other accrued expenses | 125 | 141 | |||||
Operating loss carryforwards | 1,111 | 1,153 | |||||
Tax credit carryforwards | 214 | 458 | |||||
Other | 52 | 112 | |||||
Subtotal | 2,271 | 2,344 | |||||
Valuation allowances | (2,010 | ) | (1,210 | ) | |||
Total | 261 | 1,134 | |||||
Deferred tax liabilities: | |||||||
Goodwill and other intangibles | 133 | 272 | |||||
Property | — | 47 | |||||
Undistributed earnings of foreign subsidiaries | 27 | 21 | |||||
Other | 6 | 35 | |||||
Total | 166 | 375 | |||||
Net deferred tax asset | $ | 95 | $ | 759 | |||
72
Baker Hughes Incorporated
Notes to Consolidated Financial Statements
At December 31, 2016, we had approximately $127 million of foreign tax credits which may be carried forward indefinitely under applicable foreign law, and $59 million of foreign tax credits and $28 million of other credits that will expire in 2017 through 2036 under U.S. tax law. The decrease in tax credit carryforwards of approximately $244 million is primarily due to utilization of foreign tax credits under U.S. tax law. This is primarily due to the $3.5 billion termination fee received from Halliburton (see Note 2. "Halliburton Terminated Merger Agreement"), that generated sufficient taxable income in 2016 resulting in utilization of foreign tax credit carryforwards that existed as of December 31, 2015. Additionally, we had $1.11 billion of net operating loss carryforwards, of which approximately $435 million will expire within five years, $142 million will expire over twenty years, and the remainder can be carried forward indefinitely.
We record a valuation allowance when it is more likely than not that some portion or all of the deferred tax assets will not be realized. The ultimate realization of the deferred tax assets depends on the ability to generate sufficient taxable income of the appropriate character in the future and in the appropriate taxing jurisdictions. At December 31, 2016, the $2.01 billion of valuation allowances are recorded against various deferred tax assets, including foreign net operating losses ("NOL") of $1.01 billion, U.S. federal and foreign tax credit carryforwards of $186 million, other U.S. NOL's and tax credit carryforwards of $55 million, and certain other U.S. and foreign deferred tax assets of $761 million. The increase in valuation allowances are due to valuation allowances recorded against U.S. deferred tax assets as well as increased foreign deferred tax assets that require a valuation allowance. Due to the significant downturn in the U.S. market during the year and the uncertainty as to whether the U.S. will generate sufficient future taxable income to utilize the U.S. deferred tax assets, we concluded that valuation allowances were required. There are $76 million of deferred tax assets related to foreign net operating loss carryforwards without a valuation allowance as we expect that the deferred tax assets will be realized within the carryforward period.
We have provided relevant U.S. and foreign taxes for the anticipated repatriation of certain earnings of our foreign subsidiaries. We consider the undistributed earnings of our foreign subsidiaries above the amount for which taxes have already been provided to be indefinitely reinvested, as we have no current intention to repatriate these earnings. As of December 31, 2016, the cumulative amount of foreign earnings upon which the U.S. income taxes have not been provided is approximately $4.5 billion. These additional foreign earnings could become subject to additional tax, if remitted, or deemed remitted, as a dividend. Computation of the potential deferred tax liability associated with these undistributed earnings and any other basis differences, is not practicable.
During 2016, property and goodwill were impaired and written down to their estimated fair value and the majority are not currently deductible for tax purposes. As a result of the impairments, the book basis decreased with no change in tax basis resulting in a significant change in deferred balances when comparing 2016 to 2015 balances.
At December 31, 2016, we had $351 million of tax liabilities for total gross unrecognized tax benefits related to uncertain tax positions, which includes liabilities for interest and penalties of $48 million and $26 million, respectively. If we were to prevail on all uncertain tax positions, the net effect would result in an income tax benefit of approximately $341 million. The remaining approximately $10 million is offset by deferred tax assets that represent tax benefits that would be received in different taxing jurisdictions in the event that we did not prevail on all uncertain tax positions.
73
Baker Hughes Incorporated
Notes to Consolidated Financial Statements
The following table presents the changes in our gross unrecognized tax benefits and associated interest and penalties included in the consolidated balance sheets.
Gross Unrecognized Tax Benefits, Excluding Interest and Penalties | Interest and Penalties | Total Gross Unrecognized Tax Benefits | |||||||||||||
Balance at December 31, 2013 | $ | 228 | $ | 54 | $ | 282 | |||||||||
(Decrease) increase in prior year tax positions | (7 | ) | 1 | (6 | ) | ||||||||||
Increase in current year tax positions | 39 | 2 | 41 | ||||||||||||
Decrease related to settlements with taxing authorities | (5 | ) | (1 | ) | (6 | ) | |||||||||
Decrease related to lapse of statute of limitations | (6 | ) | (3 | ) | (9 | ) | |||||||||
Decrease due to effects of foreign currency translation | (7 | ) | (4 | ) | (11 | ) | |||||||||
Balance at December 31, 2014 | 242 | 49 | 291 | ||||||||||||
Increase in prior year tax positions | 19 | 15 | 34 | ||||||||||||
Increase in current year tax positions | 26 | 1 | 27 | ||||||||||||
Decrease related to settlements with taxing authorities | (8 | ) | (2 | ) | (10 | ) | |||||||||
Decrease related to lapse of statute of limitations | (11 | ) | (7 | ) | (18 | ) | |||||||||
Decrease due to effects of foreign currency translation | (8 | ) | (4 | ) | (12 | ) | |||||||||
Balance at December 31, 2015 | 260 | 52 | 312 | ||||||||||||
Increase in prior year tax positions | 28 | 34 | 62 | ||||||||||||
Increase in current year tax positions | 17 | 1 | 18 | ||||||||||||
Decrease related to settlements with taxing authorities | (9 | ) | (1 | ) | (10 | ) | |||||||||
Decrease related to lapse of statute of limitations | (8 | ) | (8 | ) | (16 | ) | |||||||||
Decrease due to effects of foreign currency translation | (11 | ) | (4 | ) | (15 | ) | |||||||||
Balance at December 31, 2016 | $ | 277 | $ | 74 | $ | 351 | |||||||||
It is expected that the amount of unrecognized tax benefits will change in the next twelve months due to expiring statutes, audit activity, tax payments, competent authority proceedings related to transfer pricing or final decisions in matters that are the subject of litigation in various taxing jurisdictions in which we operate. At December 31, 2016, we had approximately $214 million of tax liabilities, net of $2 million of tax assets, related to uncertain tax positions, each of which are individually insignificant, and each of which are reasonably possible of being settled within the next twelve months.
At December 31, 2016, approximately $135 million of tax liabilities for total gross unrecognized tax benefits were included in the noncurrent portion of our income tax liabilities, for which the settlement period cannot be determined; however, it is not expected to be within the next twelve months.
We conduct business in more than 80 countries and are subject to income taxes in most taxing jurisdictions in which we operate. The following table summarizes the earliest tax years that remain subject to examination by the major taxing jurisdictions in which we operate. In addition to the U.S., we include foreign jurisdictions that have historically generated the highest tax liability.
Jurisdiction | Earliest Open Tax Period | Jurisdiction | Earliest Open Tax Period | |||
Argentina | 2009 | Norway | 2006 | |||
Ecuador | 2005 | Saudi Arabia | 2004 | |||
Netherlands | 2010 | U.S. | 2010 | |||
74
Baker Hughes Incorporated
Notes to Consolidated Financial Statements
NOTE 9. EARNINGS PER SHARE
A reconciliation of the number of shares used for the basic and diluted loss or earnings per share ("EPS") computations is as follows for the years ended December 31:
2016 | 2015 | 2014 | ||||||
Weighted average common shares outstanding for basic EPS | 434 | 438 | 437 | |||||
Effect of dilutive securities - stock plans | — | — | 2 | |||||
Adjusted weighted average common shares outstanding for diluted EPS | 434 | 438 | 439 | |||||
Anti-dilutive shares excluded from diluted EPS (1) | 1 | 2 | — | |||||
Future potentially dilutive shares excluded from diluted EPS (2) | 3 | 3 | 2 | |||||
(1) | The calculation of diluted net loss per share for 2016 and 2015, excludes shares potentially issuable under stock-based incentive compensation plans and the employee stock purchase plan, as their effect, if included, would have been anti-dilutive. |
(2) | Options where the exercise price exceeds the average market price are excluded from the calculation of diluted net loss or earnings per share because their effect would be anti-dilutive. |
NOTE 10. INVENTORIES
Inventories, net of reserves of $188 million and $278 million in 2016 and 2015, respectively, are comprised of the following at December 31:
2016 | 2015 | ||||||
Finished goods | $ | 1,607 | $ | 2,649 | |||
Work in process | 105 | 132 | |||||
Raw materials | 97 | 136 | |||||
Total inventories | $ | 1,809 | $ | 2,917 | |||
During 2016, we wrote off the carrying value of certain excess inventory resulting in charges of $583 million, net of existing reserves of $272 million. In addition, during 2016 we accrued $34 million of related disposal costs. During 2015, we recorded charges of $194 million primarily related to lower of cost or market adjustments due to the significant decline in activity and related prices for our products coupled with declines in replacement costs. See Note 4. "Impairment and Restructuring Charges" for further discussion. Substantially all of the excess inventory was disposed by December 31, 2016.
75
Baker Hughes Incorporated
Notes to Consolidated Financial Statements
NOTE 11. PROPERTY, PLANT AND EQUIPMENT
Property, plant and equipment are comprised of the following at December 31:
Useful Life | 2016 | 2015 | |||||||
Land | $ | 211 | $ | 263 | |||||
Buildings and improvements | 5 - 30 years | 2,146 | 2,624 | ||||||
Machinery, equipment and other | 1 - 20 years | 8,481 | 11,184 | ||||||
Subtotal | 10,838 | 14,071 | |||||||
Less: Accumulated depreciation | 6,567 | 7,378 | |||||||
Total property, plant and equipment | $ | 4,271 | $ | 6,693 | |||||
Depreciation expense relating to property, plant and equipment was $1.09 billion, $1.64 billion and $1.71 billion in 2016, 2015 and 2014, respectively. During 2016 and 2015, we recorded impairment charges relating to property, plant and equipment totaling $1.16 billion and $1.32 billion, respectively. See Note 4. "Impairment and Restructuring Charges" for further discussion.
NOTE 12. GOODWILL AND INTANGIBLE ASSETS
The changes in the carrying amount of goodwill are detailed below by segment.
North America | Latin America | Europe/ Africa/ Russia Caspian | Middle East/ Asia Pacific | Industrial Services | Total Goodwill | ||||||||||||||||||
Balance at December 31, 2015 | $ | 3,097 | $ | 584 | $ | 1,068 | $ | 819 | $ | 502 | $ | 6,070 | |||||||||||
Impairments | (1,549 | ) | — | — | — | (309 | ) | (1,858 | ) | ||||||||||||||
Disposition | (139 | ) | — | — | — | — | (139 | ) | |||||||||||||||
Currency translation adjustments and other | 6 | 4 | — | 1 | — | 11 | |||||||||||||||||
Balance at December 31, 2016 | $ | 1,415 | $ | 588 | $ | 1,068 | $ | 820 | $ | 193 | $ | 4,084 | |||||||||||
We perform an annual impairment test of goodwill on a qualitative or quantitative basis for each of our reporting units as of October 1 of each year, or more frequently when circumstances indicate an impairment may exist at the reporting unit level. During the second quarter of 2016, as a result of the termination of the Merger Agreement with Halliburton, we concluded it was necessary to conduct a quantitative goodwill impairment review. Our reporting units are the same as our five reportable segments. Goodwill is tested for impairment using a two-step approach. In the first step, the fair value of each reporting unit is determined and compared to the reporting unit's carrying value, including goodwill. If the fair value of a reporting unit is less than its carrying value, the second step of the goodwill impairment test is performed to measure the amount of impairment, if any. In the second step, the fair value of the reporting unit is allocated to the assets and liabilities of the reporting unit as if it had been acquired in a business combination and the purchase price was equivalent to the fair value of the reporting unit. The excess of the fair value of the reporting unit over the amounts assigned to its assets and liabilities is referred to as the implied fair value of goodwill. The implied fair value of the reporting unit's goodwill is then compared to the actual carrying value of goodwill. If the implied fair value of goodwill is less than the carrying value of goodwill, an impairment loss is recognized for the difference.
We determined the fair value of our reporting units using a combination of techniques including discounted cash flows derived from our long-term plans and a market approach that provides value indications through a comparison with guideline public companies. The inputs used to determine the fair values were classified as Level 3 in the fair value hierarchy. Based on the results of our impairment test during the second quarter of 2016, we determined that goodwill of two of our reporting units was impaired, and performed the second step of the goodwill impairment test. We substantially completed all actions necessary in the determination of the implied fair value of goodwill in the
76
Baker Hughes Incorporated
Notes to Consolidated Financial Statements
second quarter of 2016; however, some of the estimated fair values and allocations were subject to adjustment once the valuations and other computations were completed. During the third quarter of 2016, we finalized all valuations and computations. The total impairment is reflected in the table above.
In addition to the quantitative assessment performed in the second quarter of 2016, and consistent with our policy, we also performed our annual goodwill impairment test for all reporting units as of October 1, 2016. This assessment was performed on a qualitative basis, and included our consideration of changes in industry and market conditions since the performance of our quantitative analysis in the second quarter of 2016. Based on increasing oil prices and projections of increased drilling and exploration activity over the near and long term, which would drive higher customer spending, we determined that it is more likely than not that the fair value of each of our reporting units exceeded its carrying amount at that time. Thus, no additional impairment of goodwill was necessary in the fourth quarter of 2016. In 2015 and 2014, we performed a qualitative assessment for our annual goodwill impairment test and determined that it was more likely than not that the fair value of each of our reporting units exceeded its carrying amount at that time. As such, no impairments of goodwill were recorded for the years ended December 31, 2015 or 2014.
The volatility that currently exists in the oil and natural gas industry and further declines in future commodity prices and customer spending could negatively impact our forecasted profitability and operating cash flows, necessitating a future goodwill impairment review. Depending on the changes in our business outlook and other assumptions underlying the fair value measurements of our reporting units, we may be required to recognize additional goodwill impairments.
Intangible assets are comprised of the following at December 31:
2016 | 2015 | ||||||||||||||||||||||
Gross Carrying Amount | Less: Accumulated Amortization | Net | Gross Carrying Amount | Less: Accumulated Amortization | Net | ||||||||||||||||||
Technology(1) | $ | 527 | $ | 267 | $ | 260 | $ | 866 | $ | 452 | $ | 414 | |||||||||||
Customer relationships (1) | 74 | 31 | 43 | 251 | 106 | 145 | |||||||||||||||||
Trade names (1) | 90 | 79 | 11 | 108 | 89 | 19 | |||||||||||||||||
Other | 17 | 13 | 4 | 18 | 13 | 5 | |||||||||||||||||
Total intangibles | $ | 708 | $ | 390 | $ | 318 | $ | 1,243 | $ | 660 | $ | 583 | |||||||||||
(1) | During 2016 and 2015, we recorded impairments relating to our technology, customer relationships and trade names intangible assets totaling $114 million and $116 million, respectively. See Note 4. "Impairment and Restructuring Charges" for further discussion. |
Intangible assets are generally amortized on a straight-line basis with estimated useful lives ranging from 3 to 30 years. Amortization expense for the years ended December 31, 2016, 2015 and 2014 was $76 million, $104 million and $107 million, respectively. Estimated amortization expense for each of the subsequent five fiscal years is expected to be as follows:
Year | Estimated Amortization Expense | ||
2017 | $ | 54 | |
2018 | 49 | ||
2019 | 46 | ||
2020 | 38 | ||
2021 | 33 | ||
77
Baker Hughes Incorporated
Notes to Consolidated Financial Statements
NOTE 13. INDEBTEDNESS
Total debt consisted of the following at December 31, net of unamortized discount and debt issuance cost:
2016 | 2015 | ||||||
6.0% Notes due June 2018 | $ | 199 | $ | 255 | |||
7.5% Senior Notes due November 2018 | 524 | 747 | |||||
3.2% Senior Notes due August 2021 | 511 | 746 | |||||
8.55% Debentures due June 2024 | 112 | 149 | |||||
6.875% Notes due January 2029 | 301 | 394 | |||||
5.125% Notes due September 2040 | 1,132 | 1,482 | |||||
Other debt | 239 | 268 | |||||
Total debt | 3,018 | 4,041 | |||||
Less: short-term debt and current portion of long-term debt | 132 | 151 | |||||
Total long-term debt | $ | 2,886 | $ | 3,890 | |||
The estimated fair value of total debt at December 31, 2016 and 2015 was $3.36 billion and $4.32 billion, respectively, which differs from the carrying amounts of $3.02 billion and $4.04 billion, respectively, included in our consolidated balance sheets. The fair value was determined using quoted period end market prices.
In June 2016, we purchased $1.0 billion of the aggregate outstanding principal amount associated with our long-term outstanding notes and debentures, which included portions of each tranche of notes and debentures. Pursuant to a cash tender offer, the purchases resulted in the payment of an early-tender premium, including various fees, of $135 million and a pre-tax loss on the early extinguishment of debt of $142 million, which includes the premium and the write-off of a portion of the remaining original debt issue costs and debt discounts or premiums.
On July 13, 2016, we entered into a new five-year $2.5 billion committed revolving credit facility (the "2016 Credit Agreement") with commercial banks maturing in July 2021, which replaced our existing credit facility of $2.5 billion, but maintained the existing commercial paper program. The previous credit facility had a maturity date in September of 2016. The maximum combined borrowing at any time under both the 2016 Credit Agreement and the commercial paper program is $2.5 billion. The 2016 Credit Agreement contains certain covenants, which, among other things, require the maintenance of a total debt-to-total capitalization ratio, restrict certain merger transactions or the sale of all or substantially all of our assets or a significant subsidiary and limit the amount of subsidiary indebtedness. Upon the occurrence of certain events of default, our obligations under the 2016 Credit Agreement may be accelerated. Such events of default include payment defaults to lenders under the 2016 Credit Agreement, covenant defaults and other customary defaults. To the extent we have outstanding commercial paper, the aggregate ability to borrow under the 2016 Credit Agreement is reduced.
As of December 31, 2016, we were in compliance with all of the credit facility's covenants, and there were no direct borrowings under the credit facility during 2016. Under the commercial paper program, we may issue from time to time up to $2.5 billion in commercial paper with maturities of no more than 270 days. The amount available to borrow under the credit facility is reduced by the amount of any commercial paper outstanding. At December 31, 2016, we had no borrowings outstanding under the commercial paper program. Maturities of debt for each of the five years in the period ending December 31, 2021, and in the aggregate thereafter, are listed in the table below:
2017 | 2018 | 2019 | 2020 | 2021 | Thereafter | ||||||||||||||||||
Total debt | $ | 132 | $ | 753 | $ | 26 | $ | 12 | $ | 524 | $ | 1,571 | |||||||||||
The weighted average interest rate on short-term borrowings outstanding at December 31, 2016 and 2015 were 12.3% and 12.2%, respectively.
78
Baker Hughes Incorporated
Notes to Consolidated Financial Statements
NOTE 14. EMPLOYEE BENEFIT PLANS
DEFINED BENEFIT PLANS
We have both funded and unfunded noncontributory defined benefit pension plans ("Pension Benefits") covering certain employees primarily in the U.S., the U.K., Germany and Canada. Under the provisions of the U.S. qualified pension plan (the "U.S. Pension Plan"), a hypothetical cash balance account is established for each participant. Such accounts receive quarterly credits based on a percentage according to the employee's age on the last day of the quarter applied to quarterly eligible compensation and interest credits based on the balance in the account on the last day of the quarter. The U.K. and Canada plans are frozen for the majority of the participants; therefore, we do not accrue benefits for those participants. The Germany pension plan is an unfunded plan where benefits are based on creditable years of service, creditable pay and accrual rates. We also provide certain postretirement health care benefits ("Other Postretirement Benefits"), through an unfunded plan, to a closed group of U.S. employees who retire and have met certain age and service requirements. During 2016 and 2015, as a result of the workforce reductions stemming from our restructuring activities, we remeasured certain pension and other postretirement benefit obligations, which resulted in reductions in our projected benefit obligations of $18 million and $28 million, respectively, and curtailment gains of $9 million and $18 million, respectively.
Funded Status
Below is the reconciliation of the beginning and ending balances of benefit obligations, fair value of plan assets and the funded status of our plans.
U.S. Pension Benefits | Non-U.S. Pension Benefits | Other Postretirement Benefits | |||||||||||||||||||||
2016 | 2015 | 2016 | 2015 | 2016 | 2015 | ||||||||||||||||||
Change in benefit obligation: | |||||||||||||||||||||||
Benefit obligation at beginning of year | $ | 735 | $ | 728 | $ | 798 | $ | 872 | $ | 107 | $ | 122 | |||||||||||
Service cost | 52 | 64 | 14 | 15 | 4 | 5 | |||||||||||||||||
Interest cost | 29 | 26 | 27 | 30 | 4 | 4 | |||||||||||||||||
Actuarial loss (gain) | (13 | ) | (4 | ) | 165 | (23 | ) | — | (10 | ) | |||||||||||||
Benefits paid | (63 | ) | (59 | ) | (38 | ) | (35 | ) | (14 | ) | (11 | ) | |||||||||||
Curtailment | (12 | ) | (24 | ) | (2 | ) | (2 | ) | (4 | ) | (2 | ) | |||||||||||
Other | (2 | ) | 4 | — | (6 | ) | — | (1 | ) | ||||||||||||||
Foreign currency translation adjustments | — | — | (118 | ) | (53 | ) | — | — | |||||||||||||||
Benefit obligation at end of year | 726 | 735 | 846 | 798 | 97 | 107 | |||||||||||||||||
Change in plan assets: | |||||||||||||||||||||||
Fair value of plan assets at beginning of year | 595 | 648 | 713 | 767 | — | — | |||||||||||||||||
Actual return on plan assets | 29 | (5 | ) | 118 | 4 | — | — | ||||||||||||||||
Employer contributions | 44 | 16 | 24 | 28 | 14 | 11 | |||||||||||||||||
Benefits paid | (63 | ) | (59 | ) | (38 | ) | (35 | ) | (14 | ) | (11 | ) | |||||||||||
Other | (5 | ) | (5 | ) | — | (6 | ) | — | — | ||||||||||||||
Foreign currency translation adjustments | — | — | (118 | ) | (45 | ) | — | — | |||||||||||||||
Fair value of plan assets at end of year | 600 | 595 | 699 | 713 | — | — | |||||||||||||||||
Funded status - underfunded at end of year | $ | (126 | ) | $ | (140 | ) | $ | (147 | ) | $ | (85 | ) | $ | (97 | ) | $ | (107 | ) | |||||
Accumulated benefit obligation | $ | 682 | $ | 681 | $ | 810 | $ | 763 | $ | 97 | $ | 107 | |||||||||||
79
Baker Hughes Incorporated
Notes to Consolidated Financial Statements
The amounts recognized in the consolidated balance sheets consist of the following at December 31:
U.S. Pension Benefits | Non-U.S. Pension Benefits | Other Postretirement Benefits | |||||||||||||||||||||
2016 | 2015 | 2016 | 2015 | 2016 | 2015 | ||||||||||||||||||
Noncurrent assets | $ | — | $ | — | $ | 3 | $ | 51 | $ | — | $ | — | |||||||||||
Current liabilities | (1 | ) | (2 | ) | (6 | ) | (6 | ) | (16 | ) | (16 | ) | |||||||||||
Noncurrent liabilities | (125 | ) | (138 | ) | (144 | ) | (130 | ) | (81 | ) | (91 | ) | |||||||||||
Net amount recognized | $ | (126 | ) | $ | (140 | ) | $ | (147 | ) | $ | (85 | ) | $ | (97 | ) | $ | (107 | ) | |||||
The funded status position represents the difference between the benefit obligation and the plan assets. The projected benefit obligation ("PBO") for pension benefits represents the actuarial present value of benefits attributed to employee services and compensation and includes an assumption about future compensation levels. The accumulated benefit obligation ("ABO") is the actuarial present value of pension benefits attributed to employee service to date and present compensation levels. The ABO differs from the PBO in that the ABO does not include any assumptions about future compensation levels.
Information for the plans with ABOs in excess of plan assets is as follows at December 31:
U.S. Pension Benefits | Non-U.S. Pension Benefits | Other Postretirement Benefits | |||||||||||||||||||||
2016 | 2015 | 2016 | 2015 | 2016 | 2015 | ||||||||||||||||||
Projected benefit obligation | $ | 725 | $ | 735 | $ | 821 | $ | 149 | n/a | n/a | |||||||||||||
Accumulated benefit obligation | $ | 682 | $ | 681 | $ | 786 | $ | 114 | $ | 97 | $ | 107 | |||||||||||
Fair value of plan assets | $ | 600 | $ | 595 | $ | 672 | $ | 12 | n/a | n/a | |||||||||||||
Weighted average assumptions used to determine benefit obligations for these plans are as follows for the years ended December 31:
U.S. Pension Benefits | Non-U.S. Pension Benefits | Other Postretirement Benefits | |||||||||||||||
2016 | 2015 | 2016 | 2015 | 2016 | 2015 | ||||||||||||
Discount rate | 4.0 | % | 4.2 | % | 2.6 | % | 3.7 | % | 3.6 | % | 3.7 | % | |||||
Rate of compensation increase | 5.5 | % | 5.9 | % | 4.2 | % | 4.1 | % | n/a | n/a | |||||||
Social security increase | 2.8 | % | 2.8 | % | 2.0 | % | 2.2 | % | n/a | n/a | |||||||
The development of the discount rate for our U.S. plans and substantially all non-U.S. plans was based on a bond matching model, whereby a hypothetical bond portfolio of high-quality, fixed-income securities is selected that will match the cash flows underlying the projected benefit obligation.
80
Baker Hughes Incorporated
Notes to Consolidated Financial Statements
Accumulated Other Comprehensive Loss
The amount recorded before-tax in accumulated other comprehensive loss related to employee benefit plans consists of the following at December 31:
U.S. Pension Benefits | Non-U.S. Pension Benefits | Other Postretirement Benefits | |||||||||||||||||||||
2016 | 2015 | 2016 | 2015 | 2016 | 2015 | ||||||||||||||||||
Net actuarial loss | $ | 166 | $ | 191 | $ | 266 | $ | 229 | $ | 6 | $ | 10 | |||||||||||
Net prior service cost (credit) | — | — | — | — | (37 | ) | (54 | ) | |||||||||||||||
Total | $ | 166 | $ | 191 | $ | 266 | $ | 229 | $ | (31 | ) | $ | (44 | ) | |||||||||
The estimated net actuarial loss and prior service cost for the defined benefit pension plans that will be amortized from accumulated other comprehensive loss and included in net periodic benefit cost in 2017 are $16 million and $0.8 million, respectively. The estimated prior service credit for the other postretirement benefits that will be amortized from accumulated other comprehensive loss and included in net periodic benefit cost in 2017 is $8 million. No amortization of the net actuarial loss for the other postretirement benefits from accumulated other comprehensive loss is expected in 2017.
Net Periodic Cost
The components of net periodic cost are as follows for the years ended December 31:
U.S. Pension Benefits | Non-U.S. Pension Benefits | Other Postretirement Benefits | |||||||||||||||||||||||||||||||||
2016 | 2015 | 2014 | 2016 | 2015 | 2014 | 2016 | 2015 | 2014 | |||||||||||||||||||||||||||
Service cost | $ | 52 | $ | 64 | $ | 70 | $ | 14 | $ | 15 | $ | 11 | $ | 4 | $ | 5 | $ | 6 | |||||||||||||||||
Interest cost | 29 | 26 | 28 | 27 | 30 | 34 | 4 | 4 | 5 | ||||||||||||||||||||||||||
Expected return on plan assets | (41 | ) | (49 | ) | (44 | ) | (33 | ) | (47 | ) | (41 | ) | — | — | — | ||||||||||||||||||||
Amortization of prior service credit | — | 1 | — | — | — | — | (9 | ) | (11 | ) | (11 | ) | |||||||||||||||||||||||
Amortization of net actuarial loss | 11 | 9 | 8 | 6 | 6 | 5 | — | 1 | 1 | ||||||||||||||||||||||||||
Curtailment gain | — | — | — | (2 | ) | (1 | ) | — | (7 | ) | (17 | ) | — | ||||||||||||||||||||||
Other | 3 | 8 | — | — | — | — | — | — | (3 | ) | |||||||||||||||||||||||||
Net periodic cost | $ | 54 | $ | 59 | $ | 62 | $ | 12 | $ | 3 | $ | 9 | $ | (8 | ) | $ | (18 | ) | $ | (2 | ) | ||||||||||||||
Weighted average assumptions used to determine net periodic cost for these plans are as follows for the years ended December 31:
U.S. Pension Benefits | Non-U.S. Pension Benefits | Other Postretirement Benefits | ||||||||||||||||||||||||
2016 | 2015 | 2014 | 2016 | 2015 | 2014 | 2016 | 2015 | 2014 | ||||||||||||||||||
Discount rate | 4.2 | % | 3.7 | % | 4.5 | % | 3.7 | % | 3.5 | % | 4.4 | % | 3.7 | % | 3.3 | % | 4.0 | % | ||||||||
Expected long-term return on plan assets | 7.0 | % | 7.6 | % | 7.3 | % | 5.0 | % | 6.3 | % | 6.1 | % | n/a | n/a | n/a | |||||||||||
Rate of compensation increase | 5.7 | % | 5.8 | % | 5.6 | % | 4.1 | % | 4.1 | % | 4.4 | % | n/a | n/a | n/a | |||||||||||
Social security increase | 2.8 | % | 2.8 | % | 2.8 | % | 2.1 | % | 2.1 | % | 2.4 | % | n/a | n/a | n/a | |||||||||||
In selecting the expected rate of return on plan assets, we consider the average rate of earnings expected on the funds invested or to be invested to provide for the benefits of these plans. This includes considering the trusts' asset allocation and the expected returns likely to be earned over the life of the plans.
81
Baker Hughes Incorporated
Notes to Consolidated Financial Statements
Health Care Cost Trend Rates
Assumed health care cost trend rates can have a significant effect on the amounts reported for other postretirement benefits. As of December 31, 2016, the health care cost trend rate was 6.9% for employees under age 65, declining gradually each successive year until it reaches 4.5%. A one percentage point change in assumed health care cost trend rates would have had the following effects on 2016:
One Percentage Point Increase | One Percentage Point Decrease | ||||||
Effect on total of service and interest cost components | $ | 0.1 | $ | (0.1 | ) | ||
Effect on postretirement welfare benefit obligation | $ | 0.9 | $ | (1.2 | ) | ||
Plan Assets
We have investment committees that meet regularly to review the portfolio returns and to determine asset-mix targets based on asset/liability studies. Third-party investment consultants assist such committees in developing asset allocation strategies to determine our expected rates of return and expected risk for various investment portfolios. The investment committees considered these strategies in the formal establishment of the current asset-mix targets based on the projected risk and return levels for all major asset classes.
The majority of investments are held in the form of units of funds. The funds hold underlying securities and are redeemable as of the measurement date. Investments in equities and fixed-income funds are generally measured at fair value based on daily closing prices provided by active exchanges or on the basis of observable, market-based inputs. Investments in hedge funds are generally measured at fair value on the basis of their net asset values, which are provided by the investment sponsor or third-party administrator. The fair values of private equity investments and real estate funds are based on appraised values developed using comparable market transactions or discounted cash flows.
U.S. Pension Plan
The investment policy of the U.S. Pension Plan was developed after examining the historical relationships of risk and return among asset classes and the relationship between the expected behavior of the U.S. Plan's assets and liabilities. The investment policy of the U.S. Plan is designed to provide the greatest probability of meeting or exceeding the U.S. Plan's objectives at the lowest possible risk. In evaluating risk, the investment committee for the U.S. Pension Plan ("U.S. Committee") reviews the long-term characteristics of various asset classes, focusing on balancing risk with expected return. Accordingly, the U.S. Committee selected the following six asset classes as allowable investments for the assets of the U.S. Pension Plan: U.S. equities, non-U.S. equities, global fixed-income securities, real estate, hedge funds and private equity.
82
Baker Hughes Incorporated
Notes to Consolidated Financial Statements
The table below presents the fair value of the assets in the U.S. Pension Plan by asset category and by valuation technique at December 31:
2016 | 2015 | ||||||||||||||||||||||||||||||
Asset Category | Total Asset Value | Level One | Level Two | Level Three | Total Asset Value | Level One | Level Two | Level Three | |||||||||||||||||||||||
Cash and Cash Equivalents | $ | 2 | $ | — | $ | 2 | $ | — | $ | 16 | $ | 12 | $ | 4 | $ | — | |||||||||||||||
Fixed Income (1) | 120 | — | 120 | — | 109 | — | 109 | — | |||||||||||||||||||||||
Non-U.S. Equity (2) | 126 | 31 | 95 | — | 129 | 31 | 98 | — | |||||||||||||||||||||||
U.S. Equity (3) | 131 | — | 131 | — | 129 | — | 129 | — | |||||||||||||||||||||||
Hedge Funds (4) | 150 | — | — | 150 | 152 | — | — | 152 | |||||||||||||||||||||||
Real Estate Funds (5) | 8 | — | — | 8 | 10 | — | — | 10 | |||||||||||||||||||||||
Real Estate Investment Trust Equity | 12 | — | 12 | — | 9 | — | 9 | — | |||||||||||||||||||||||
Private Equity Fund (6) | 51 | — | — | 51 | 41 | — | — | 41 | |||||||||||||||||||||||
Total | $ | 600 | $ | 31 | $ | 360 | $ | 209 | $ | 595 | $ | 43 | $ | 349 | $ | 203 | |||||||||||||||
(1) | A multi-manager strategy investing in fixed income securities and funds. The current allocation includes: 39% in unconstrained bond funds; 25% in government bonds; 12% in corporate bonds; 10% in government mortgage-backed securities; 6% in a passive index bond; 1% in commercial mortgage-backed securities; 1% in short-term bills and notes; 1% in asset-backed securities; and 5% in cash and other securities. |
(2) | Multi-manager strategy investing in common stocks of non-U.S. listed companies using both value and growth approaches. |
(3) | Multi-manager strategy investing in common stocks of U.S. listed companies using value and growth approaches. |
(4) | Strategies taking long and short positions in equities, fixed income securities, currencies and derivative contracts. |
(5) | Strategy investing in the global private real estate secondary market using a value-based investment approach. |
(6) | Partnership making opportunistic investments on a global basis across asset classes, capital structures and geographies. |
Non-U.S. Pension Plans
The investment policies of our pension plans with plan assets, which are primarily in Canada and the U.K., (the "Non-U.S. Plans"), cover the asset allocations that the governing boards believe are the most appropriate for these Non-U.S. Plans in the long-term, taking into account the nature of the liabilities they expect to incur. The suitability of asset allocations and investment policies are reviewed periodically to ensure alignment with plan liabilities.
83
Baker Hughes Incorporated
Notes to Consolidated Financial Statements
The table below presents the fair value of the assets in our Non-U.S. Plans by asset category and by valuation technique at December 31:
2016 | 2015 | ||||||||||||||||||||||||||||||
Asset Category | Total Asset Value | Level One | Level Two | Level Three | Total Asset Value | Level One | Level Two | Level Three | |||||||||||||||||||||||
Cash and Cash Equivalents | $ | 5 | $ | 5 | $ | — | $ | — | $ | 5 | $ | 5 | $ | — | $ | — | |||||||||||||||
Asset Allocation (1) | 122 | — | 122 | — | 152 | — | 152 | — | |||||||||||||||||||||||
Bonds - Canada - Corporate (2) | 6 | — | 6 | — | 6 | — | 6 | — | |||||||||||||||||||||||
Bonds - Canada - Government (3) | 17 | — | 17 | — | 19 | — | 19 | — | |||||||||||||||||||||||
Bonds - U.K. - Corporate (4) | 8 | — | 8 | — | 8 | — | 8 | — | |||||||||||||||||||||||
Bonds - U.K. - Government (5) | 225 | — | 225 | — | 211 | — | 211 | — | |||||||||||||||||||||||
Bonds - Global - Corporate (6) | 57 | — | 57 | — | 64 | — | 64 | — | |||||||||||||||||||||||
Equities (7) | 122 | — | 122 | — | 128 | — | 128 | — | |||||||||||||||||||||||
Real Estate Fund (8) | 19 | — | — | 19 | 23 | — | — | 23 | |||||||||||||||||||||||
Pooled Swap Funds (9) | 106 | — | 106 | — | 85 | — | 85 | — | |||||||||||||||||||||||
Insurance contracts | 12 | — | — | 12 | 12 | — | — | 12 | |||||||||||||||||||||||
Total | $ | 699 | $ | 5 | $ | 663 | $ | 31 | $ | 713 | $ | 5 | $ | 673 | $ | 35 | |||||||||||||||
(1) | Invests in mixes of global common stocks and bonds to achieve broad diversification. |
(2) | Invests in Canadian Dollar-denominated high quality corporate bonds. |
(3) | Invests in Canadian Dollar-denominated government issued bonds intended to match the duration of plan liabilities. |
(4) | Invests passively in British Pound Sterling-denominated investment grade corporate bonds. |
(5) | Invests passively in British Pound Sterling-denominated government issued bonds. |
(6) | Invests globally in high quality corporate bonds. |
(7) | Invests in broad equity funds based on securities offered in various regions or countries. Equity funds are allocated by region as follows: 47% Global; 32% U.K.; 7% Emerging Markets; 5% North America; 5% Asia Pacific; and 4% Europe. |
(8) | Invests in a diversified range of property throughout the U.K., principally in the retail, office and industrial/warehouse sectors. |
(9) | Invests in a range of pooled funds which include positions in swap contracts and U.K. sovereign bonds; pooled funds are categorized by maturities of underlying positions. Pooled funds employ leverage in order to match the U.K. Plan's duration and inflation. |
84
Baker Hughes Incorporated
Notes to Consolidated Financial Statements
The following table presents the changes in the fair value of assets determined using level 3 unobservable inputs:
U.S. Private Equity Fund | U.S. Real Estate Fund | U.S. Hedge Funds | Non-U.S. Real Estate Fund | Non-U.S. Insurance Contracts | Total | ||||||||||||||||||
Balance at December 31, 2013 | $ | 16 | $ | 9 | $ | 190 | $ | 21 | $ | 18 | $ | 254 | |||||||||||
Unrealized gains (losses) | — | 1 | 6 | 1 | (1 | ) | 7 | ||||||||||||||||
Realized gains | 1 | — | 7 | — | — | 8 | |||||||||||||||||
Sales | (4 | ) | — | (85 | ) | — | — | (89 | ) | ||||||||||||||
Purchases | 8 | — | 46 | — | — | 54 | |||||||||||||||||
Balance at December 31, 2014 | 21 | 10 | 164 | 22 | 17 | 234 | |||||||||||||||||
Unrealized gains (losses) | — | — | (6 | ) | — | (2 | ) | (8 | ) | ||||||||||||||
Realized gains | — | 1 | 1 | — | — | 2 | |||||||||||||||||
Sales | (4 | ) | (2 | ) | (15 | ) | — | (5 | ) | (26 | ) | ||||||||||||
Purchases | 24 | 1 | 8 | 1 | 2 | 36 | |||||||||||||||||
Balance at December 31, 2015 | 41 | 10 | 152 | 23 | 12 | 238 | |||||||||||||||||
Unrealized gains (losses) | 3 | 1 | — | (5 | ) | — | (1 | ) | |||||||||||||||
Realized losses | — | — | (1 | ) | — | — | (1 | ) | |||||||||||||||
Sales | (5 | ) | (3 | ) | (22 | ) | — | (3 | ) | (33 | ) | ||||||||||||
Purchases | 12 | — | 21 | 1 | 3 | 37 | |||||||||||||||||
Balance at December 31, 2016 | $ | 51 | $ | 8 | $ | 150 | $ | 19 | $ | 12 | $ | 240 | |||||||||||
Expected Cash Flows
For all pension plans, we make annual contributions to the plans in amounts equal to or greater than amounts necessary to meet minimum governmental funding requirements. In 2017, we expect to contribute between $55 million and $60 million to our funded pension plans.
The following table presents the expected benefit payments over the next ten years. The U.S. and non-U.S. pension benefit payments are made by the respective pension trust funds.
Year | U.S. Pension Benefits | Non-U.S. Pension Benefits | Other Postretirement Benefits | ||||||||||||
2017 | $ | 46 | $ | 22 | $ | 16 | |||||||||
2018 | $ | 44 | $ | 24 | $ | 12 | |||||||||
2019 | $ | 46 | $ | 29 | $ | 10 | |||||||||
2020 | $ | 47 | $ | 27 | $ | 9 | |||||||||
2021 | $ | 48 | $ | 32 | $ | 9 | |||||||||
2022-2026 | $ | 264 | $ | 182 | $ | 37 | |||||||||
85
Baker Hughes Incorporated
Notes to Consolidated Financial Statements
DEFINED CONTRIBUTION PLANS
During the periods reported, generally all of our U.S. employees were eligible to participate in our sponsored 401(k) plan ("Thrift Plan"). The Thrift Plan allows eligible employees to elect to contribute portions of their salaries to an investment trust. Employee contributions are matched by the Company in cash at the rate of $1.00 per $1.00 employee contribution for the first 5% of the employee's salary, and such contributions vest immediately. In addition, we make cash contributions for all eligible employees between 2% and 5% of their salary depending on the employee's age. Such contributions are fully vested to the employee after three years of employment. Effective April 2016, employer contributions to certain plans were suspended for the remainder of 2016. All employer contributions will recommence as of January 1, 2017. The Thrift Plan provides several investment options, for which the employee has sole investment discretion. The Thrift Plan does not offer the Company's common stock as an investment option. Our contributions to the Thrift Plan and several other non-U.S. defined contribution plans amounted to $75 million, $202 million and $263 million in 2016, 2015 and 2014, respectively.
For certain non-U.S. employees who are not eligible to participate in the Thrift Plan, we provide a non-qualified defined contribution international retirement plan that provides basically the same benefits as those provided in the Thrift Plan. In addition, we provide a non-qualified supplemental retirement plan ("SRP") for certain officers and employees whose benefits under the Thrift Plans and/or the U.S. qualified pension plan are limited by federal tax law. The SRP also allows eligible employees to defer a portion of their eligible compensation and provides for employer matching and base contributions pursuant to limitations. Both non-qualified plans are invested through trusts, and the assets and corresponding liabilities are included in our consolidated balance sheets. Our contributions to these non-qualified plans amounted to $9 million, $15 million and $17 million in 2016, 2015 and 2014, respectively. In 2017, we estimate we will contribute between $135 million and $145 million to all of our defined contribution plans.
POSTEMPLOYMENT BENEFITS
We provide certain postemployment disability income, medical and other benefits to substantially all qualifying former or inactive U.S. employees. Income benefits for long-term disability are provided through a fully-insured plan. The continuation of medical and other benefits while on disability ("Continuation Benefits") are provided through a qualified self-insured plan. The accrued postemployment liability for Continuation Benefits at December 31, 2016 and 2015 was $32 million and $34 million, respectively, and is included in other liabilities in our consolidated balance sheets.
NOTE 15. COMMITMENTS AND CONTINGENCIES
LEASES
At December 31, 2016, we had long-term non-cancelable operating leases covering certain facilities and equipment. The minimum annual rental commitments, net of amounts due under subleases, for each of the five years in the period ending December 31, 2021 are $118 million, $62 million, $44 million, $29 million and $19 million, respectively, and $72 million in the aggregate thereafter. Rent expense was $355 million, $514 million and $747 million for the years ended December 31, 2016, 2015 and 2014, respectively. We did not enter into any significant capital leases during the three years ended December 31, 2016.
LITIGATION
We are subject to a number of lawsuits and claims arising out of the conduct of our business. The ability to predict the ultimate outcome of such matters involves judgments, estimates and inherent uncertainties. We record a liability for those contingencies where the incurrence of a loss is probable and the amount can be reasonably estimated, including accruals for self-insured losses which are calculated based on historical claim data, specific loss development factors and other information. A range of total possible losses for all litigation matters cannot be reasonably estimated. Based on a consideration of all relevant facts and circumstances, we do not expect the ultimate outcome of any currently pending lawsuits or claims against us will have a material adverse effect on our financial position, results of operations or cash flows; however, there can be no assurance as to the ultimate outcome of these matters.
86
Baker Hughes Incorporated
Notes to Consolidated Financial Statements
We insure against risks arising from our business to the extent deemed prudent by our management and to the extent insurance is available, but no assurance can be given that the nature and amount of that insurance will be sufficient to fully indemnify us against liabilities arising out of pending or future legal proceedings or other claims. Most of our insurance policies contain deductibles or self-insured retentions in amounts we deem prudent and for which we are responsible for payment. In determining the amount of self-insurance, it is our policy to self-insure those losses that are predictable, measurable and recurring in nature, such as claims for automobile liability, general liability and workers compensation.
The following lawsuits were filed in Delaware in connection with our Merger with Halliburton. Subsequent to the filing of the lawsuits, on April 30, 2016, the Merger Agreement with Halliburton was terminated as described in Note 2. "Halliburton Terminated Merger Agreement."
• | On November 24, 2014, Gary Molenda, a purported shareholder of the Company, filed a class action lawsuit in the Court of Chancery of the State of Delaware ("Delaware Chancery Court") against Baker Hughes, the Company's Board of Directors, Halliburton, and Red Tiger LLC, a wholly owned subsidiary of Halliburton ("Red Tiger" and together with all defendants, "Defendants") styled Gary R. Molenda v. Baker Hughes, Inc., et al., Case No. 10390-CB. |
• | On November 26, 2014, a second purported shareholder of the Company, Booth Family Trust, filed a substantially similar class action lawsuit in Delaware Chancery Court. |
• | On December 1, 2014, New Jersey Building Laborers Annuity Fund and James Rice, two additional purported shareholders of the Company, filed substantially similar class action lawsuits in Delaware Chancery Court. |
• | On December 10, 2014, a fifth purported shareholder of the Company, Iron Workers Mid-South Pension Fund, filed another substantially similar class action lawsuit in the Delaware Chancery Court. |
• | On December 24, 2014, a sixth purported shareholder of the Company, Annette Shipp, filed another substantially similar class action lawsuit in the Delaware Chancery Court. |
All of the lawsuits make substantially similar claims. The plaintiffs generally allege that the members of the Company's Board of Directors breached their fiduciary duties to our shareholders in connection with the Merger negotiations by entering into the Merger Agreement and by approving the Merger, and that the Company, Halliburton, and Red Tiger aided and abetted the purported breaches of fiduciary duties. More specifically, the lawsuits allege that the Merger Agreement provides inadequate consideration to our shareholders, that the process resulting in the Merger Agreement was flawed, that the Company's directors engaged in self-dealing, and that certain provisions of the Merger Agreement improperly favor Halliburton and Red Tiger, precluding or impeding third parties from submitting potentially superior proposals, among other things. The lawsuit filed by Annette Shipp also alleges that our Board of Directors failed to disclose material information concerning the proposed Merger in the preliminary registration statement on Form S-4. On January 7, 2015, James Rice amended his complaint, adding similar allegations regarding the disclosures in the preliminary registration statement on Form S-4. The lawsuits seek unspecified damages, injunctive relief enjoining the Merger, and rescission of the Merger Agreement, among other relief. On January 23, 2015, the Delaware lawsuits were consolidated under the caption In re Baker Hughes Inc. Stockholders Litigation, Consolidated C.A. No. 10390-CB (the "Consolidated Case"). Pursuant to the Court's consolidation order, plaintiffs filed a consolidated complaint on February 4, 2015, which alleges substantially similar claims and seeks substantially similar relief to that raised in the six individual complaints, except that while Baker Hughes is named as a defendant, no claims are asserted against the Company.
On March 18, 2015, the parties reached an agreement in principle to settle the Consolidated Case in exchange for the Company making certain additional disclosures. Those disclosures were contained in a Form 8-K filed with the SEC on March 18, 2015. The settlement was made subject to certain conditions, including consummation of the Merger, final documentation, and court approval. With the termination of the Merger Agreement with Halliburton, the March 18, 2015 settlement agreement is rendered null and void. On May 31, 2016, the Consolidated Case and the claims asserted therein were dismissed, save and except for plaintiffs counsel's Fee and Expense Application to the Delaware Chancery Court. On October 13, 2016, the Delaware Chancery Court ruled on plaintiffs counsel's Fee and Expense Application. The amount awarded does not have a material impact on our financial position, results of operations or cash flows.
87
Baker Hughes Incorporated
Notes to Consolidated Financial Statements
On October 9, 2014, one of our subsidiaries filed a Request for Arbitration against a customer before the London Court of International Arbitration, pursuing claims for the non-payment of invoices for goods and services provided in an amount provisionally quantified to exceed $67.9 million. In our Request for Arbitration, we also noted that invoices in an amount exceeding $57 million had been issued to the customer, and would be added to the claim in the event that they became overdue. On November 6, 2014, the customer filed its Response and Counterclaim, denying liability and counterclaiming damages for breach of contract of approximately $182 million. On March 31, 2016, the parties agreed to a settlement principally involving the purchase by the customer of certain inventory held by our subsidiary, with all other claims and counterclaims being released and discharged by each party, and the arbitral proceedings being discontinued. On April 18, 2016, all claims and counterclaims filed in the London Court of International Arbitration were released and discontinued. The settlement did not have a material impact on our financial position, results of operations or cash flows.
During 2014, we received customer notifications related to a possible equipment failure in a natural gas storage system in Northern Germany, which includes certain of our products. We are currently investigating the cause of the possible failure and, if necessary, possible repair and replacement options for our products. Similar products were utilized in other natural gas storage systems for this and other customers. The customer initiated arbitral proceedings against us on June 19, 2015, under the rules of the German Institute of Arbitration e.V. (DIS). On August 3, 2016, the customer amended its claims and now alleges damages of approximately $224 million plus interest at an annual rate of prime + 5%. A hearing before the arbitration panel was held January 16, 2017 through January 23, 2017, and an additional hearing is scheduled for March 20, 2017 and March 21, 2017. In addition, on September 21, 2015, TRIUVA Kapitalverwaltungsgesellschaft mbH filed a lawsuit in the United States District Court for the Southern District of Texas, Houston Division against the Company and Baker Hughes Oilfield Operations, Inc. alleging that the plaintiff is the owner of gas storage caverns in Etzel, Germany in which the Company provided certain equipment in connection with the development of the gas storage caverns. The plaintiff further alleges that the Company supplied equipment that was either defectively designed or failed to warn of risks that the equipment posed, and that these alleged defects caused damage to the plaintiff's property. The plaintiff seeks recovery of alleged compensatory and punitive damages of an unspecified amount, in addition to reasonable attorneys' fees, court costs and pre-judgment and post-judgment interest. The allegations in this lawsuit are related to the claims made in the June 19, 2015, German arbitration referenced above. At this time, we are not able to predict the outcome of these claims or whether either will have any material impact on our financial position, results of operations or cash flows.
On August 31, 2015, a customer of one of the Company's subsidiaries issued a Letter of Claim pursuant to a Construction and Engineering Contract. The customer had claimed $369 million plus loss of production resulting from a breach of contract related to five electric submersible pumps installed by the subsidiary in Europe. On January 29, 2016, the Customer served its Statement of Claim, Case No. CL-2015-00584, in the Commercial Court Queen's Bench Division of the High Court of Justice. On September 20, 2016, the parties entered a settlement agreement by which all claims were released and discharged by each party. On October 6, 2016, the Commercial Court entered a Consent Order dismissing all claims in the litigation. The settlement did not have a material impact on our financial position, results of operations or cash flows.
On October 30, 2015, Chieftain Sand and Proppant Barron, LLC initiated arbitration against our subsidiary, Baker Hughes Oilfield Operations, Inc., in the American Arbitration Association. The Claimant alleged that the Company failed to purchase the required sand tonnage for the contract year 2014-2015 and further alleged that the Company repudiated its yearly purchase obligations over the remaining contract term. The Claimant alleged damages of approximately $110 million plus interest, attorneys' fees and costs. On June 2, 2016, the parties agreed to a settlement of all claims and counterclaims asserted in the Arbitration. The settlement did not have a material impact on our financial position, results of operations or cash flows.
On April 30, 2015, a class and collective action lawsuit alleging that we failed to pay a nationwide class of workers overtime in compliance with the Fair Labor Standards Act and North Dakota law was filed titled Williams et al. v. Baker Hughes Oilfield Operations, Inc. in the U.S. District Court for the District of North Dakota. On February 8, 2016, the Court conditionally certified certain subclasses of employees for collective action treatment. We are evaluating the background facts and at this time cannot predict the outcome of this lawsuit and are not able to reasonably estimate the potential impact, if any, such outcome would have on our financial position, results of operations or cash flows.
88
Baker Hughes Incorporated
Notes to Consolidated Financial Statements
On July 31, 2015, Rapid Completions LLC filed a lawsuit in federal court in the Eastern District of Texas against Baker Hughes Incorporated, Baker Hughes Oilfield Operations, Inc., and others claiming infringement of U.S. Patent Nos. 6,907,936; 7,134,505; 7,543,634; 7,861,774; and 8,657,009. On August 6, 2015, Rapid Completions amended its complaint to allege infringement of U.S. Patent No. 9,074,451. On September 17, 2015, Rapid Completions and Packers Plus Energy Services Inc., sued Baker Hughes Canada Company in the Canada Federal Court on related Canadian patent 2,412,072. On April 1, 2016, Rapid Completions removed U.S. Patent No. 6,907,936 from its claims in the lawsuit. On April 5, 2016, Rapid Completions filed a second lawsuit in federal court in the Eastern District of Texas against Baker Hughes Incorporated, Baker Hughes Oilfield Operations, Inc. and others claiming infringement of U.S. Patent No. 9,303,501. These patents relate primarily to certain specific downhole completions equipment. The plaintiff has requested a permanent injunction against further alleged infringement, damages in an unspecified amount, supplemental and enhanced damages, and additional relief such as attorney's fees and costs. During August and September 2016, the United States Patent and Trademark office agreed to institute an inter-partes review of U.S. Patent Nos 7,861,774; 7,134,505; 7,534,634; 6,907,936; 8,657,009; and 9,074,451. At this time, we are not able to predict the outcome of these claims or whether they will have a material impact on our financial position, results of operations or cash flows.
On April 6, 2016, a civil Complaint against Baker Hughes Incorporated and Halliburton Company was filed by the United States of America seeking a permanent injunction restraining Baker Hughes and Halliburton from carrying out the planned acquisition of Baker Hughes by Halliburton or any other transaction that would combine the two companies. The lawsuit is styled United States of America v. Halliburton Co. and Baker Hughes Inc., in the U.S. District Court for the District of Delaware, Case No. 1:16-cv-00233-UNA. The Complaint alleges that the proposed transaction between Halliburton and Baker Hughes would violate Section 7 of the Clayton Act. Subsequent to the filing of the Complaint, on April 30, 2016, the Merger Agreement with Halliburton was terminated as described in Note 2. "Halliburton Terminated Merger Agreement." On May 4, 2016, the United States filed a Notice of Voluntary Dismissal of the Complaint.
On May 30, 2013, we received a Civil Investigative Demand ("CID") from the U.S. Department of Justice ("DOJ") pursuant to the Antitrust Civil Process Act. The CID sought documents and information from us for the period from May 29, 2011 through the date of the CID in connection with a DOJ investigation related to pressure pumping services in the U.S. On May 18, 2016, we received notice from the DOJ that they have closed the investigation with no further action requested of the Company.
ENVIRONMENTAL MATTERS
Our past and present operations include activities that are subject to extensive domestic (including U.S. federal, state and local) and international environmental regulations with regard to air, land and water quality and other environmental matters. Our environmental procedures, policies and practices are designed to ensure compliance with existing laws and regulations and to minimize the possibility of significant environmental damage.
We are involved in voluntary remediation projects at certain of our facilities. On rare occasions, remediation activities are conducted as specified by a government agency-issued consent decree or agreed order. Remediation costs are accrued based on estimates of probable exposure using currently available facts, existing environmental permits, technology and presently enacted laws and regulations. Remediation cost estimates include direct costs related to the environmental investigation, external consulting activities, governmental oversight fees, treatment equipment and costs associated with long-term operation, maintenance and monitoring of a remediation project.
We have also been identified as a potentially responsible party ("PRP") in remedial activities related to various Superfund sites. In these instances, we participate in the process set out in the Joint Participation and Defense Agreement to negotiate with government agencies, identify other PRPs, and determine each PRP's allocation and estimate remediation costs. We have accrued what we believe to be our pro-rata share of the total estimated cost of remediation and associated management of these Superfund sites. This share is based upon the ratio that the estimated volume of waste we contributed to the site to the total estimated volume of waste disposed at the site. Applicable U.S. federal law imposes joint and several liability on each PRP for the cleanup of these sites leaving us with the uncertainty that we may be responsible for the remediation cost attributable to other PRPs who are unable to pay their share. No accrual has been made under the joint and several liability concept for those Superfund sites where our participation is de minimis since we believe that the probability that we will have to pay material costs
89
Baker Hughes Incorporated
Notes to Consolidated Financial Statements
above our volumetric share is remote. We believe there are other PRPs who have greater involvement on a volumetric calculation basis, who have substantial assets and who may be reasonably expected to pay their share of the cost of remediation. For those Superfund sites where we are a significant PRP, remediation costs are estimated to include recalcitrant parties. In some cases, we have insurance coverage or contractual indemnities from third parties to cover a portion of the ultimate liability.
Our total accrual for environmental remediation is $31 million and $35 million, at December 31, 2016 and 2015, respectively, which includes accruals of $2 million in each year for the various Superfund sites. The determination of the required accruals for remediation costs is subject to uncertainty, including the evolving nature of environmental regulations and the difficulty in estimating the extent and type of remediation activity that is necessary.
OTHER
In the normal course of business with customers, vendors and others, we have entered into off-balance sheet arrangements, such as surety bonds for performance, letters of credit and other bank issued guarantees, which totaled approximately $1.0 billion at December 31, 2016. It is not practicable to estimate the fair value of these financial instruments. None of the off-balance sheet arrangements either has, or is likely to have, a material effect on our consolidated financial statements. We also had commitments outstanding for purchase obligations related to capital expenditures, inventory and services under contracts, for each of the five years in the period ending December 31, 2021 of $102 million, $43 million, $38 million, $36 million and $30 million, respectively, and $37 million in the aggregate thereafter.
90
Baker Hughes Incorporated
Notes to Consolidated Financial Statements
NOTE 16. ACCUMULATED OTHER COMPREHENSIVE LOSS
The following table presents the changes in accumulated other comprehensive loss, net of tax:
Pensions and Other Postretirement Benefits | Foreign Currency Translation Adjustments | Accumulated Other Comprehensive Loss | |||||||
Balance at December 31, 2014 | $ | (246 | ) | $ | (503 | ) | $ | (749 | ) |
Other comprehensive income before reclassifications: | |||||||||
Foreign currency translation adjustments | (241 | ) | (241 | ) | |||||
Pensions and other postretirement benefits: | |||||||||
Actuarial net loss arising in the year | (18 | ) | (18 | ) | |||||
Deferred taxes | 10 | 10 | |||||||
Amounts reclassified from accumulated other comprehensive loss: | |||||||||
Amortization of net actuarial loss | 16 | 16 | |||||||
Amortization of prior service credit | (10 | ) | (10 | ) | |||||
Curtailment | (18 | ) | (18 | ) | |||||
Deferred taxes | 5 | 5 | |||||||
Balance at December 31, 2015 | (261 | ) | (744 | ) | (1,005 | ) | |||
Other comprehensive income before reclassifications: | |||||||||
Foreign currency translation adjustments | (5 | ) | (5 | ) | |||||
Pensions and other postretirement benefits: | |||||||||
Actuarial net loss arising in the year | (23 | ) | (23 | ) | |||||
Amounts reclassified from accumulated other comprehensive loss: | |||||||||
Amortization of net actuarial loss | 17 | 17 | |||||||
Amortization of prior service credit | (9 | ) | (9 | ) | |||||
Curtailment | (9 | ) | (9 | ) | |||||
Deferred taxes | 1 | 1 | |||||||
Balance at December 31, 2016 | $ | (284 | ) | $ | (749 | ) | $ | (1,033 | ) |
The amounts reclassified from accumulated other comprehensive loss during the twelve months ended December 31, 2016 and 2015 represent the amortization of net actuarial loss and prior service credit, and curtailments which are included in the computation of net periodic pension cost (see Note 14. "Employee Benefit Plans" for additional details). Net periodic pension cost is recorded across the various cost and expense line items within the consolidated statement of income (loss).
91
Baker Hughes Incorporated
Notes to Consolidated Financial Statements
NOTE 17. QUARTERLY DATA (UNAUDITED)
First Quarter | Second Quarter | Third Quarter | Fourth Quarter | Total Year | |||||||||||||||
2016 | |||||||||||||||||||
Revenue | $ | 2,670 | $ | 2,408 | $ | 2,353 | $ | 2,410 | $ | 9,841 | |||||||||
Gross profit (1) | (90 | ) | (803 | ) | 203 | 174 | (516 | ) | |||||||||||
Impairment and restructuring charges (2) | 160 | 1,126 | 304 | 145 | 1,735 | ||||||||||||||
Goodwill impairment (3) | — | 1,841 | 17 | — | 1,858 | ||||||||||||||
Merger termination fee (4) | — | (3,500 | ) | — | — | (3,500 | ) | ||||||||||||
Net loss attributable to Baker Hughes | (981 | ) | (911 | ) | (429 | ) | (417 | ) | (2,738 | ) | |||||||||
Basic and diluted loss per share attributable to Baker Hughes | (2.22 | ) | (2.08 | ) | (1.00 | ) | (0.98 | ) | (6.31 | ) | |||||||||
Dividends per share | 0.17 | 0.17 | 0.17 | 0.17 | 0.68 | ||||||||||||||
Common stock market prices: | |||||||||||||||||||
High | 47.44 | 49.52 | 52.70 | 66.89 | |||||||||||||||
Low | 38.88 | 39.36 | 43.54 | 49.96 | |||||||||||||||
2015 | |||||||||||||||||||
Revenue | $ | 4,594 | $ | 3,968 | $ | 3,786 | $ | 3,394 | $ | 15,742 | |||||||||
Gross profit (1) | 114 | 266 | 301 | 180 | 861 | ||||||||||||||
Impairment and restructuring charges (2) | 573 | 76 | 98 | 1,246 | 1,993 | ||||||||||||||
Net loss attributable to Baker Hughes | (589 | ) | (188 | ) | (159 | ) | (1,031 | ) | (1,967 | ) | |||||||||
Basic and diluted loss per share attributable to Baker Hughes | (1.35 | ) | (0.43 | ) | (0.36 | ) | (2.35 | ) | (4.49 | ) | |||||||||
Dividends per share | 0.17 | 0.17 | 0.17 | 0.17 | 0.68 | ||||||||||||||
Common stock market prices: | |||||||||||||||||||
High | 65.04 | 69.13 | 61.13 | 57.33 | |||||||||||||||
Low | 53.53 | 61.11 | 45.76 | 43.36 | |||||||||||||||
(1) | Represents revenue less cost of sales, cost of services and research and engineering. |
(2) | Impairment and restructuring charges associated with asset impairments, workforce reductions, facility closures and contract terminations recorded during 2015 and 2016. See Note 4. "Impairment and Restructuring Charges" for further discussion. |
(3) | Goodwill impairment recognized in the second and third quarters of 2016. See Note 12. "Goodwill and Intangible Assets" for further discussion. |
(4) | Merger termination fee received from Halliburton. See Note 2. "Halliburton Terminated Merger Agreement" for further discussion. |
92
ITEM 9. CHANGES IN AND DISAGREEMENTS WITH ACCOUNTANTS ON ACCOUNTING AND FINANCIAL DISCLOSURE
None.
ITEM 9A. CONTROLS AND PROCEDURES
Evaluation of Disclosure Controls and Procedures
As of the end of the period covered by this annual report, we have evaluated the effectiveness of the design and operation of our disclosure controls and procedures pursuant to Rule 13a-15 of the Exchange Act of 1934, as amended (the "Exchange Act"). This evaluation was carried out under the supervision and with the participation of our management, including our principal executive officer and principal financial officer. Based on this evaluation, these officers have concluded that, as of December 31, 2016, our disclosure controls and procedures, as defined by Rule 13a-15(e) of the Exchange Act, are effective at a reasonable assurance level.
During the quarter ended March 31, 2016, we identified a material weakness in our controls related to the determination of valuation allowances for deferred tax assets. A material weakness is a deficiency, or a combination of deficiencies, in internal control over financial reporting, such that there is a reasonable possibility that a material misstatement of the company's annual or interim financial statements will not be prevented or detected on a timely basis. Our identified weakness had no impact on any amounts reported in the financial statements for the quarter ended March 31, 2016 or for any previous period. We evaluated the controls associated with valuation allowances for deferred tax assets and designed a remediation plan to address the identified weakness by strengthening the controls over this process. During the second and third quarters of 2016, we implemented a remediation plan which included various control enhancements. Subsequent to implementation, the control enhancements were tested and determined to be designed and operating effectively. Accordingly, we believe the weakness is considered remediated.
Disclosure controls and procedures are our controls and other procedures that are designed to ensure that information required to be disclosed by us in the reports that we file or submit under the Exchange Act, such as this annual report, is recorded, processed, summarized and reported within the time periods specified in the SEC's rules and forms. Disclosure controls and procedures include, without limitation, controls and procedures designed to ensure that information required to be disclosed by us in the reports that we file under the Exchange Act is accumulated and communicated to our management, including our principal executive officer and principal financial officer, as appropriate, to allow timely decisions regarding required disclosure.
Design and Evaluation of Internal Control Over Financial Reporting
Pursuant to Section 404 of the Sarbanes-Oxley Act of 2002, our management included a report of their assessment of the design and effectiveness of our internal controls over financial reporting as part of this annual report on Form 10-K for the fiscal year ended December 31, 2016. Deloitte & Touche LLP, the Company's independent registered public accounting firm, has issued an attestation report on the effectiveness of the Company's internal control over financial reporting. Management's report and the independent registered public accounting firm's attestation report are included in Item 8 under the caption entitled "Management's Report on Internal Control Over Financial Reporting" and "Report of Independent Registered Public Accounting Firm" and are incorporated herein by reference.
Changes in Internal Control Over Financial Reporting
There has been no change in our internal controls over financial reporting during the quarter ended December 31, 2016 that has materially affected, or is reasonably likely to materially affect, our internal controls over financial reporting.
ITEM 9B. OTHER INFORMATION
None.
93
PART III
ITEM 10. DIRECTORS, EXECUTIVE OFFICERS AND CORPORATE GOVERNANCE
Information regarding the Business Code of Conduct and Code of Ethical Conduct Certificates for our principal executive officer, principal financial officer and principal accounting officer are described in Item 1. Business of this Annual Report. Information concerning our directors is set forth in the sections entitled "Proposal No. 1, Election of Directors," and "Corporate Governance - Committees of the Board" in our Definitive Proxy Statement for the 2017Annual Meeting of Stockholders to be filed with the SEC pursuant to the Exchange Act within 120 days of the end of our fiscal year on December 31, 2016 ("Proxy Statement"), which sections are incorporated herein by reference. For information regarding our executive officers, see "Item 1. Business - Executive Officers" in this annual report on Form 10-K. Additional information regarding compliance by directors and executive officers with Section 16(a) of the Exchange Act is set forth under the section entitled "Compliance with Section 16(a) of the Securities Exchange Act of 1934" in our Proxy Statement, which section is incorporated herein by reference.
ITEM 11. EXECUTIVE COMPENSATION
Information for this item is set forth in the following sections of our Proxy Statement, which sections are incorporated herein by reference: "Compensation Discussion and Analysis," "Director Compensation," "Compensation Committee Interlocks and Insider Participation" and "Compensation Committee Report."
ITEM 12. SECURITY OWNERSHIP OF CERTAIN BENEFICIAL OWNERS AND MANAGEMENT AND RELATED STOCKHOLDER MATTERS
Information concerning security ownership of certain beneficial owners and our management is set forth in the sections entitled "Voting Securities" and "Security Ownership of Management" in our Proxy Statement, which sections are incorporated herein by reference.
Our Board of Directors has approved procedures for use under our Securities Trading and Disclosure Policy to permit our employees, officers and directors to enter into written trading plans complying with Rule 10b5-1 under the Exchange Act. Rule 10b5-1 provides criteria under which such an individual may establish a prearranged plan to buy or sell a specified number of shares of a company's stock over a set period of time. Any such plan must be entered into in good faith at a time when the individual is not in possession of material, nonpublic information. If an individual establishes a plan satisfying the requirements of Rule 10b5-1, such individual's subsequent receipt of material, nonpublic information will not prevent transactions under the plan from being executed. Certain of our officers have advised us that they have and may enter into a stock sales plan for the sale of shares of our common stock which are intended to comply with the requirements of Rule 10b5-1 of the Exchange Act. In addition, the Company has and may in the future enter into repurchases of our common stock under a plan that complies with Rule 10b5-1 or Rule 10b-18 of the Exchange Act.
Equity Compensation Plan Information
The information in the following table is presented as of December 31, 2016 with respect to shares of our common stock that may be issued under our existing equity compensation plans, including the Baker Hughes Incorporated 2002 Employee Long-Term Incentive Plan, the Baker Hughes Incorporated 2002 Director & Officer Long-Term Incentive Plan, and the Employee Stock Purchase Plan, all of which have been approved by our stockholders (in millions, except per share prices).
94
Equity Compensation Plan Category | Number of Securities to be Issued Upon Exercise of Outstanding Options, Warrants and Rights | Weighted Average Exercise Price of Outstanding Options, Warrants and Rights | Number of Securities Remaining Available for Future Issuance Under Equity Compensation Plans (excluding securities reflected in the first column) | ||||||||||||
Stockholder-approved plans (excluding Employee Stock Purchase Plan) | 7.1 | $ | 54.11 | 16.4 | |||||||||||
Nonstockholder-approved plans (1) | 0.1 | 46.72 | 0.5 | ||||||||||||
Subtotal (except for weighted average exercise price) | 7.2 | 54.09 | 16.9 | ||||||||||||
Employee Stock Purchase Plan (2) | — | — | 2.7 | ||||||||||||
Total | 7.2 | $ | 54.09 | 19.6 | |||||||||||
(1) | The table includes the following nonstockholder-approved plan: the Director Compensation Deferral Plan. A description of this plan is set forth below. |
(2) | The per share purchase price under the Baker Hughes Incorporated Employee Stock Purchase Plan is determined in accordance with section 423 of the Code and is 85% of the lower of the fair market value of a share of our common stock on the date of grant or the date of purchase. |
Our nonstockholder-approved plan is described below:
Director Compensation Deferral Plan
The Baker Hughes Incorporated Director Compensation Deferral Plan, as amended and restated effective January 1, 2009 and as further amended on July 25, 2013 (the "Deferral Plan"), is intended to provide a means for members of our Board of Directors to defer compensation otherwise payable and provide flexibility with respect to our compensation policies. Under the provisions of the Deferral Plan, directors may elect to defer income with respect to each calendar year. The compensation deferrals may be stock option-related deferrals or cash-based deferrals. If a director elects a stock option-related deferral, on the last day of each calendar quarter he or she will be granted a non-qualified stock option. The number of shares subject to the stock option is calculated by multiplying the amount of the deferred compensation that otherwise would have been paid to the director during the quarter by 4.4 and then dividing by the fair market value of our common stock on the last day of the quarter. The per share exercise price of the option will be the fair market value of a share of our common stock on the date the option is granted. Stock options granted under the Deferral Plan vest on the first anniversary of the date of grant and must be exercised within ten years of the date of grant. If a director's directorship terminates for any reason, any options outstanding will expire on the earlier of five years after the termination of the directorship or the option expiration date. The maximum aggregate number of shares of our common stock that may be issued under the Deferral Plan is 0.5 million. As of December 31, 2016, options covering approximately 17,000 shares of our common stock were outstanding under the Deferral Plan, there were no shares exercised during fiscal year 2016 and approximately 0.5 million shares remained available for future options.
ITEM 13. CERTAIN RELATIONSHIPS AND RELATED TRANSACTIONS, AND DIRECTOR INDEPENDENCE
Information for this item is set forth in the sections entitled "Corporate Governance-Director Independence" and "Certain Relationships and Related Transactions" in our Proxy Statement, which sections are incorporated herein by reference.
ITEM 14. PRINCIPAL ACCOUNTING FEES AND SERVICES
Information concerning principal accountant fees and services is set forth in the section entitled "Fees Paid to Deloitte & Touche LLP" in our Proxy Statement, which section is incorporated herein by reference.
95
PART IV
ITEM 15. EXHIBITS AND FINANCIAL STATEMENT SCHEDULES
(a) List of Documents filed as part of this annual report.
(1) Financial Statements
All financial statements of the Company as set forth under Item 8 of this annual report on Form 10-K.
(2) Financial Statement Schedules
Schedule II - Valuation and Qualifying Accounts
(3) Exhibits
Each exhibit identified below is filed as a part of this annual report. Exhibits designated with an "*" are filed as an exhibit to this annual report on Form 10-K and exhibits designated with an "**" are furnished as an exhibit to this annual report on Form 10-K. Exhibits designated with a "+" are identified as management contracts or compensatory plans or arrangements. Exhibits previously filed as indicated below are incorporated by reference.
Exhibit Number | Exhibit Description |
2.1 | Agreement and Plan of Merger dated as of November 16, 2014 among Halliburton Company, Red Tiger LLC and Baker Hughes Incorporated (filed as Exhibit 2.1 to the Current Report of Baker Hughes Incorporated on Form 8-K filed on November 18, 2014). |
2.2 | Transaction Agreement and Plan of Merger dated as of October 30, 2016 among General Electric Company, Baker Hughes Incorporated, Bear Newco, Inc. and Bear MergerSub, Inc. (filed as Exhibit 2.1 to the Current Report of Baker Hughes Incorporated on Form 8-K filed on November 1, 2016). |
2.3 | Contribution Agreement dated as of November 29, 2016 among Baker Hughes Oilfield Operations, Inc., BJ Services LLC, and Allied Completions Holdings, LLC (filed as Exhibit 2.1 to the Current Report to Baker Hughes Incorporated on Form 8-K on December 1, 2016). |
3.1 | Certificate of Amendment dated April 22, 2010 and the Restated Certificate of Incorporation (filed as Exhibit 3.1 to the Quarterly Report of Baker Hughes Incorporated on Form 10-Q for the quarter ended March 31, 2010). |
3.2 | Restated Bylaws of Baker Hughes Incorporated effective as of January 26, 2017 (filed as Exhibit 3.1 to the Current Report of Baker Hughes Incorporated on Form 8-K filed on January 31, 2017). |
4.1 | Rights of Holders of the Company's Long-Term Debt. The Company has no long-term debt instrument with regard to which the securities authorized thereunder equal or exceed 10% of the total assets of the Company and its subsidiaries on a consolidated basis. The Company agrees to furnish a copy of its long-term debt instruments to the SEC upon request. |
4.2 | Certificate of Amendment dated April 22, 2010 and the Restated Certificate of Incorporation (filed as Exhibit 3.1 to the Quarterly Report of Baker Hughes Incorporated on Form 10-Q for the quarter ended March 31, 2010). |
4.3 | Restated Bylaws of Baker Hughes Incorporated effective as of January 26, 2017 (filed as Exhibit 3.1 to the Current Report of Baker Hughes Incorporated on Form 8-K filed on January 31, 2017). |
4.4 | Indenture dated as of May 15, 1994 between Western Atlas Inc. and The Bank of New York, Trustee, providing for the issuance of securities in series (filed as Exhibit 4.4 to the Annual Report of Baker Hughes Incorporated on Form 10-K for the year ended December 31, 2004). |
4.5 | Indenture dated October 28, 2008, between Baker Hughes Incorporated and The Bank of New York Mellon Trust Company, N.A., as trustee (filed as Exhibit 4.1 to the Current Report of Baker Hughes Incorporated on Form 8-K filed on October 29, 2008). |
4.6 | First Supplemental Indenture, dated August 17, 2011, between Baker Hughes Incorporated and The Bank of New York Mellon Trust Company, N.A., as trustee (including form of Notes) (filed as Exhibit 4.2 to the Current Report of Baker Hughes Incorporated on Form 8-K filed August 23, 2011). |
4.7 | Officers' Certificate of Baker Hughes Incorporated dated October 28, 2008 establishing the 6.50% Senior Notes due 2013 and the 7.50% Senior Notes due 2018 (filed as Exhibit 4.2 to the Current Report of Baker Hughes Incorporated on Form 8-K filed on October 29, 2008). |
96
4.8 | Form of 7.50% Senior Notes Due 2018 (filed as Exhibit 4.4 to the Current Report of Baker Hughes Incorporated on Form 8-K filed on October 29, 2008). |
4.9 | Officers' Certificate of Baker Hughes Incorporated dated August 24, 2010 establishing the 5.125% Senior Notes due 2040 (filed as Exhibit 4.2 to the Current Report of Baker Hughes Incorporated on Form 8-K filed on August 24, 2010). |
4.10 | Form of 5.125% Senior Notes due 2040 (filed as Exhibit 4.3 to the Current Report of Baker Hughes Incorporated on Form 8-K filed on August 24, 2010). |
4.11 | Indenture, dated June 8, 2006, between BJ Services Company, as issuer, and Wells Fargo Bank, N.A., as trustee (filed as Exhibit 4.1 to the Current Report of BJ Services Company on Form 8-K filed on June 12, 2006). |
4.12 | Third Supplemental Indenture, dated May 19, 2008, between BJ Services Company, as issuer, and Wells Fargo Bank, N.A., as trustee, with respect to the 6% Senior Notes due 2018 (filed as Exhibit 4.2 to the Current Report of BJ Services Company on Form 8-K filed on May 23, 2008). |
4.13 | Fourth Supplemental Indenture, dated April 28, 2010, between BJ Services Company, as issuer, BSA Acquisition LLC, Baker Hughes Incorporated and Wells Fargo Bank, N.A., as trustee, with respect to the 5.75% Senior Notes due 2011 and the 6% Senior Notes due 2018 (filed as Exhibit 4.4 to the Current Report of Baker Hughes Incorporated on Form 8-K filed on April 29, 2010). |
4.14 | Fifth Supplemental Indenture, dated June 21, 2011, between BJ Services Company LLC, as company, Western Atlas Inc. as successor company and Wells Fargo Bank, N.A., as trustee, with respect to the 6.00% Senior Notes due 2018 (incorporated by reference to Exhibit 4.4 to the Current Report of Baker Hughes Incorporated on Form 8-K filed on June 23, 2011). |
4.15 | Registration Rights Agreement dated August 17, 2011 among Baker Hughes Incorporated and J.P. Morgan Securities LLC and Merrill Lynch, Pierce, Fenner & Smith Incorporated, as representatives of the several initial purchasers named therein (filed as Exhibit 10.1 to the Current Report of Baker Hughes Incorporated on Form 8-K filed on August 23, 2011). |
10.1+ | Form of Amended and Restated Change in Control Agreement between Baker Hughes Incorporated and each of the executive officers effective as of January 1, 2009 (filed as Exhibit 10.2 to the Current Report of Baker Hughes Incorporated on Form 8-K filed on December 19, 2008). |
10.2+ | Amendment and Restatement of the Baker Hughes Incorporated Change in Control Severance Plan effective as of January 1, 2009 (filed as Exhibit 10.3 to the Current Report of Baker Hughes Incorporated on Form 8-K filed on December 19, 2008). |
10.3+ | Form of Change in Control Agreement between Baker Hughes Incorporated and certain of the executive officers effective as of July 16, 2012 (filed as Exhibit 10.1 to the Quarterly Report of Baker Hughes Incorporated on Form 10-Q for the quarter ended June 30, 2012). |
10.4+ | Form of Executive Loyalty, Confidentiality, Non-Solicitation, and Non-Competition Agreement between Baker Hughes Incorporated and certain of the executive officers (filed as Exhibit 10.3 to the Annual Report of Baker Hughes Incorporated on Form 10-K for the year ended December 31, 2011). |
10.5+ | Baker Hughes Incorporated Compensation Recoupment Policy effective January 1, 2014 (filed as Exhibit 10.10 to the Current Report of Baker Hughes Incorporated on Form 8-K filed on January 28, 2014). |
10.6+ | Letter Agreement between Baker Hughes Incorporated and Alan R. Crain dated July 29, 2016 (filed as Exhibit 10.1 to the Quarterly Report of Baker Hughes Incorporated on Form 10-Q for the quarter ended September 30, 2016). |
10.7 +* | Letter Agreement between Baker Hughes Incorporated and Kimberly A. Ross dated December 30, 2016. |
10.8+ | Form of Indemnification Agreement between Baker Hughes Incorporated and each of the directors and executive officers (filed as Exhibit 10.4 to the Annual Report of Baker Hughes Incorporated on Form 10-K for the year ended December 31, 2003). |
10.9+ | Form of Amendment to the Indemnification Agreement between Baker Hughes Incorporated and each of the directors and executive officers effective as of January 1, 2009 (filed as Exhibit 10.4 to the Current Report of Baker Hughes Incorporated on Form 8-K filed on December 19, 2008). |
10.10+ | Baker Hughes Incorporated Director Retirement Policy for Certain Members of the Board of Directors (filed as Exhibit 10.10 to the Annual Report of Baker Hughes Incorporated on Form 10-K for the year ended December 31, 2003). |
10.11+ | Baker Hughes Incorporated Director Compensation Deferral Plan, as amended and restated effective as of January 1, 2009 (filed as Exhibit 10.2 to the Quarterly Report of Baker Hughes Incorporated on Form 10-Q for the quarter ended June 30, 2008). |
10.12+ | Amendment to Baker Hughes Incorporated Director Compensation Deferral Plan effective as of January 1, 2009 (filed as Exhibit 10.5 to the Current Report of Baker Hughes Incorporated on Form 8-K filed on December 19, 2008). |
97
10.13+ | Amendment to the Baker Hughes Incorporated Director Compensation Deferral Plan effective as of July 25, 2013 (filed as Exhibit 10.11 to the Annual Report of Baker Hughes Incorporated on Form 10-K for the year ended December 31, 2013). |
10.14 + | Amendment and Restatement of the Baker Hughes Incorporated Executive Severance Plan effective as of May 24, 2016 (filed as Exhibit 10.1 to the Current Report of Baker Hughes Incorporated on Form 8-K filed on May 25, 2016). |
10.15+ | Baker Hughes Incorporated Annual Incentive Compensation Plan for officers, as amended and restated on January 23, 2014 (filed as Exhibit 10.5 to the Current Report of Baker Hughes Incorporated on Form 8-K filed on January 28, 2014). |
10.16+ | Amendment to the Amended and Restated Baker Hughes Incorporated Annual Incentive Compensation Plan for employees dated March 13, 2015 (filed as Exhibit 10.2 to the Current Report of Baker Hughes Incorporated on Form 8-K filed on March 18, 2015). |
10.17+ | Baker Hughes Incorporated Supplemental Retirement Plan, as amended and restated effective as of January 1, 2012 (filed as Exhibit 10.1 to the Current Report of Baker Hughes Incorporated on Form 8-K filed on December 20, 2011). |
10.18+ | Amended and Restated Baker Hughes Incorporated 2002 Employee Long-Term Incentive Plan effective April 24, 2014 (filed as Exhibit 10.2 to the Current Report of Baker Hughes Incorporated on Form 8-K filed on April 29, 2014). |
10.19+ | Amended and Restated Baker Hughes Incorporated 2002 Director & Officer Long-Term Incentive Plan effective April 24, 2014 (filed as Exhibit 10.1 to the Current Report of Baker Hughes Incorporated on Form 8-K filed on April 29, 2014). |
10.20+ | Baker Hughes Incorporated Employee Stock Purchase Plan, as amended and restated, effective as of January 1, 2012 (filed as Exhibit 10.25 to the Annual Report of Baker Hughes Incorporated on Form 10-K for the year ending December 31, 2012). |
10.21+ | Amendment to the Baker Hughes Incorporated Employee Stock Purchase Plan effective as of April 25, 2013 (filed as Exhibit 10.2 to the Current Report of Baker Hughes Incorporated on Form 8-K filed on April 30, 2013). |
10.22+ | Amendment to the Baker Hughes Incorporated Employee Stock Purchase Plan effective as of December 31, 2014 (filed as Exhibit 10.28 to the Annual Report of Baker Hughes Incorporated on Form 10-K for the fiscal year ending December 31, 2014). |
10.23+ | Form of Baker Hughes Incorporated Nonqualified Stock Option Agreement with Terms and Conditions for officers (filed as Exhibit 10.30 to the Annual Report of Baker Hughes Incorporated on Form 10-K for the year ended December 31, 2009). |
10.24+ | Form of Baker Hughes Incorporated Nonqualified Stock Option Award Agreement and Terms and Conditions for officers (filed as Exhibit 10.70 to the Annual Report of Baker Hughes Incorporated on Form 10-K for the year ended December 31, 2011). |
10.25+ | Form of Baker Hughes Incorporated Nonqualified Stock Option Award Agreement and Terms and Conditions for officers (filed as Exhibit 10.6 to the Current Report of Baker Hughes Incorporated on Form 8-K filed on January 28, 2014). |
10.26+ | Form of Baker Hughes Incorporated Nonqualified Stock Option Award Agreement and Terms and Conditions for officers (filed as Exhibit 10.6 to the Quarterly Report of Baker Hughes Incorporated on Form 10-Q for the quarter ended June 30, 2014). |
10.27+ | Form of Baker Hughes Incorporated Incentive Stock Option Award Agreement and Terms and Conditions for officers (filed as Exhibit 10.33 to the Annual Report of Baker Hughes Incorporated on Form 10-K for the year ended December 31, 2009). |
10.28+ | Form of Baker Hughes Incorporated Incentive Stock Option Award Agreement and Terms and Conditions for officers (filed as Exhibit 10.71 to the Annual Report of Baker Hughes Incorporated on Form 10-K for the year ended December 31, 2011). |
10.29+ | Form of Baker Hughes Incorporated Incentive Stock Option Award Agreement and Terms and Conditions for officers (filed as Exhibit 10.7 to the Current Report of Baker Hughes Incorporated on Form 8-K filed on January 28, 2014). |
10.30+ | Form of Baker Hughes Incorporated Incentive Stock Option Award Agreement and Terms and Conditions for officers (filed as Exhibit 10.7 to the Quarterly Report of Baker Hughes Incorporated on Form 10-Q for the quarter ended June 30, 2014). |
10.31+ | Form of Baker Hughes Incorporated Restricted Stock Unit Award Agreement and Terms and Conditions for officers (filed as Exhibit 10.9 to the Current Report of Baker Hughes Incorporated on Form 8-K filed on January 28, 2014). |
10.32+ | Form of Baker Hughes Incorporated Restricted Stock Award Agreement and Terms and Conditions for officers (filed as Exhibit 10.8 to the Current Report of Baker Hughes Incorporated on Form 8-K filed on January 28, 2014). |
98
10.33+ | Form of Baker Hughes Incorporated Restricted Stock Unit Award Agreement and Terms and Conditions for officers (filed as Exhibit 10.5 to the Quarterly Report of Baker Hughes Incorporated on Form 10-Q for the quarter ended June 30, 2014). |
10.34+ | Form of Baker Hughes Incorporated Restricted Stock Unit Award Agreement and Terms and Conditions for officers (filed as Exhibit 10.42 to the Annual Report of Baker Hughes Incorporated on Form 10-K for the year ended December 31, 2014). |
10.35+ | Form of Baker Hughes Incorporated Restricted Stock Award Agreement and Terms and Conditions for officers (filed as Exhibit 10.2 to the Current Report of Baker Hughes Incorporated on Form 8-K filed on May 25, 2016). |
10.36+ | Form of Baker Hughes Incorporated Restricted Stock Unit Award Agreement and Terms and Conditions for officers with a three-year cliff vesting (filed as Exhibit 10.1 to the Current Report of Baker Hughes Incorporated on Form 8-K filed on July 29, 2016). |
10.37+ | Form of Baker Hughes Incorporated Restricted Stock Unit Award Agreement and Terms and Conditions for officers with a three-year graded vesting (filed as Exhibit 10.2 to the Current Report of Baker Hughes Incorporated on Form 8-K filed on July 29, 2016). |
10.38+ | Form of Baker Hughes Incorporated Restricted Stock Unit Award Agreement and Terms and Conditions for officers with a three-year graded vesting (filed as Exhibit 10.2 to the Current Report of Baker Hughes Incorporated on Form 8-K filed on January 31, 2017). |
10.39+ | Form of Baker Hughes Incorporated Restricted Stock Unit Award Agreement and Terms and Conditions for officers with a three-year cliff vesting (filed as Exhibit 10.1 to the Current Report of Baker Hughes Incorporated on Form 8-K filed on January 31, 2017). |
10.40+ | Form of Baker Hughes Incorporated Restricted Stock Unit Award Agreement and Terms and Conditions for directors (filed as Exhibit 10.44 to the Annual Report of Baker Hughes Incorporated on Form 10-K for the year ended December 31, 2014). |
10.41+* | Form of Baker Hughes Incorporated Restricted Stock Unit Award Agreement and Terms and Conditions for directors. |
10.42+ | Form of Baker Hughes Incorporated Stock Option Award Agreement, including Terms and Conditions for directors (filed as Exhibit 10.41 to the Annual Report of Baker Hughes Incorporated on Form 10-K for the year ended December 31, 2005). |
10.43+ | Form of Baker Hughes Incorporated Performance Unit Award Agreement and Terms and Conditions for certain officers payable in cash (filed as Exhibit 10.3 to the Current Report of Baker Hughes Incorporated on Form 8-K filed on January 28, 2014). |
10.44+ | Form of Baker Hughes Incorporated Performance Unit Award Agreement and Terms and Conditions for certain officers payable in shares (filed as Exhibit 10.4 to the Current Report of Baker Hughes Incorporated on Form 8-K filed on January 28, 2014). |
10.45+ | Form of Baker Hughes Incorporated Performance Unit Award Agreement and Terms and Conditions for certain officers payable in cash (filed as Exhibit 10.3 to the Quarterly Report of Baker Hughes Incorporated on Form 10-Q for the quarter ended June 30, 2014). |
10.46+ | Form of Baker Hughes Incorporated Performance Unit Award Agreement and Terms and Conditions for certain officers payable in shares (filed as Exhibit 10.4 to the Quarterly Report of Baker Hughes Incorporated on Form 10-Q for the quarter ended June 30, 2014). |
10.47+ | Form of Baker Hughes Incorporated Performance Based Restricted Stock Unit Award Agreement and Terms and Conditions for officers with a three-year cliff vesting (filed as Exhibit 10.3 to the Current Report of Baker Hughes Incorporated on Form 8-K filed on January 31, 2017). |
10.48+ | Performance Goals adopted January 22, 2014 for the Performance Unit Awards payable in cash granted in 2014 (filed as Exhibit 10.1 to the Current Report of Baker Hughes Incorporated on Form 8-K filed on January 28, 2014). |
10.49+ | Performance Goals adopted January 22, 2014 for the Performance Unit Awards payable in shares granted in 2014 (filed as Exhibit 10.2 to the Current Report of Baker Hughes Incorporated on Form 8-K filed on January 28, 2014). |
10.50+ | Performance Goals adopted January 25, 2017 for the Performance Based Restricted Stock Unit Awards granted in 2017 (filed as Exhibit 10.4 to the Current Report of Baker Hughes Incorporated on Form 8-K filed on January 31, 2017). |
10.51 | Credit Agreement dated as of July 13, 2016, among Baker Hughes Incorporated, JP Morgan Chase Bank, N.A., as Administrative Agent and twenty lenders for $2.5 billion, in the aggregate for all banks (filed as Exhibit 10.1 to the Current Report of Baker Hughes Incorporated on Form 8-K filed July 14, 2016). |
99
10.52 | Plea Agreement between Baker Hughes Services International, Inc. and the United States Department of Justice filed on April 26, 2007, with the United States District Court of Texas, Houston Division (filed as Exhibit 10.5 to the Quarterly Report of Baker Hughes Incorporated on Form 10-Q for the quarter ended March 31, 2007). |
10.53 | Termination Agreement dated as of April 30, 2016 among Halliburton Company, Red Tiger LLC and Baker Hughes Incorporated (filed as Exhibit 10.1 to the Current Report of Baker Hughes Incorporated on Form 8-K filed on May 2, 2016). |
21.1* | Subsidiaries of Company. |
23.1* | Consent of Deloitte & Touche LLP. |
31.1** | Certification of Martin S. Craighead, Chairman and Chief Executive Officer, furnished pursuant to Rule 13a-14(a) of the Securities Exchange Act of 1934, as amended. |
31.2** | Certification of Kimberly A. Ross, Chief Financial Officer, furnished pursuant to Rule 13a-14(a) of the Securities Exchange Act of 1934, as amended. |
32** | Statement of Martin S. Craighead, Chairman and Chief Executive Officer, and Kimberly A. Ross, Chief Financial Officer, furnished pursuant to Rule 13a-14(b) of the Securities Exchange Act of 1934, as amended. |
95* | Mine Safety Disclosures. |
101.INS* | XBRL Instance Document. |
101.SCH* | XBRL Schema Document. |
101.CAL* | XBRL Calculation Linkbase Document. |
101.LAB* | XBRL Label Linkbase Document. |
101.PRE* | XBRL Presentation Linkbase Document. |
101.DEF* | XBRL Definition Linkbase Document. |
100
Baker Hughes Incorporated
Schedule II - Valuation and Qualifying Accounts
(In millions) | Balance at Beginning of Period | Charged to Cost and Expenses | Write-offs (1) | Other Changes (2) (3) | Balance at End of Period | ||||||||||||||
Year Ended December 31, 2016 | |||||||||||||||||||
Reserve for doubtful accounts receivable | $ | 383 | $ | 188 | $ | (59 | ) | $ | (3 | ) | $ | 509 | |||||||
Reserve for inventories | 278 | 181 | (275 | ) | 4 | 188 | |||||||||||||
Year Ended December 31, 2015 | |||||||||||||||||||
Reserve for doubtful accounts receivable | 224 | 193 | (23 | ) | (11 | ) | 383 | ||||||||||||
Reserve for inventories | 319 | 195 | (235 | ) | (1 | ) | 278 | ||||||||||||
Year Ended December 31, 2014 | |||||||||||||||||||
Reserve for doubtful accounts receivable | 238 | 102 | (71 | ) | (45 | ) | 224 | ||||||||||||
Reserve for inventories | 382 | 37 | (92 | ) | (8 | ) | 319 | ||||||||||||
(1) | Represents the elimination of accounts receivable and inventory deemed uncollectible or worthless. See Note 10. "Inventories" of the Notes to Consolidated Financial Statements in Item 8 herein for further discussion of the inventory write-offs and related reserves. |
(2) | Represents transfers, currency translation adjustments and divestitures. |
(3) | For the year ended December 31, 2014, the reserve for doubtful accounts receivable includes a $39 million reduction due to the currency devaluation in Venezuela. |
101
SIGNATURES
Pursuant to the requirements of Section 13 or 15(d) of the Securities Exchange Act of 1934, as amended, the registrant has duly caused this report to be signed on its behalf by the undersigned, thereunto duly authorized.
BAKER HUGHES INCORPORATED | |||
Date: | February 7, 2017 | /s/ MARTIN S. CRAIGHEAD | |
Martin S. Craighead Chairman and Chief Executive Officer | |||
KNOWN ALL PERSONS BY THESE PRESENTS, that each person whose signature appears below constitutes and appoints Martin S. Craighead and Kimberly A. Ross, each of whom may act without joinder of the other, as their true and lawful attorneys-in-fact and agents, each with full power of substitution and resubstitution, for such person and in his or her name, place and stead, in any and all capacities, to sign any and all amendments to this Annual Report on Form 10-K, and to file the same, with all exhibits thereto and other documents in connection therewith, with the Securities and Exchange Commission, granting unto said attorneys-in-fact and agents full power and authority to do and perform each and every act and thing requisite and necessary to be done in and about the premises, as fully to all intents and purposes as he might or could do in person, hereby ratifying and confirming all that said attorneys-in-fact and agents, or their substitutes, may lawfully do or cause to be done by virtue hereof.
Pursuant to the requirements of the Securities Exchange Act of 1934, as amended, this report has been signed below by the following persons on behalf of the registrant and in the capacities indicated on this 7th day of February 2017.
Signature | Title | |
/S/ MARTIN S. CRAIGHEAD | Chairman and Chief Executive Officer | |
(Martin S. Craighead) | (principal executive officer) | |
/S/ KIMBERLY A. ROSS | Senior Vice President and Chief Financial Officer | |
(Kimberly A. Ross) | (principal financial officer) | |
/S/ KELLY C. JANZEN | Vice President, Controller and Chief Accounting Officer | |
(Kelly C. Janzen) | (principal accounting officer) | |
102
/s/ GREGORY D. BRENNEMAN | Director | |
(Gregory D. Brenneman) | ||
/s/ CLARENCE P. CAZALOT, JR. | Director | |
(Clarence P. Cazalot, Jr.) | ||
/s/ WILLIAM H. EASTER III | Director | |
(William H. Easter III) | ||
/s/ LYNN L. ELSENHANS | Director | |
(Lynn L. Elsenhans) | ||
/s/ ANTHONY G. FERNANDES | Director | |
(Anthony G. Fernandes) | ||
/s/ CLAIRE W. GARGALLI | Director | |
(Claire W. Gargalli) | ||
/s/ PIERRE H. JUNGELS | Director | |
(Pierre H. Jungels) | ||
/s/ JAMES A. LASH | Director | |
(James A. Lash) | ||
/s/ J. LARRY NICHOLS | Director | |
(J. Larry Nichols) | ||
/s/ JAMES W. STEWART | Director | |
(James W. Stewart) | ||
/s/ CHARLES L. WATSON | Director | |
(Charles L. Watson) | ||
103