Attached files
| file | filename |
|---|---|
| EX-99.1 - EX-99.1 - PetroShare Corp. | a17-3884_1ex99d1.htm |
| 8-K - 8-K - PetroShare Corp. | a17-3884_18k.htm |
Exhibit 99.2
December 2016 PetroShare Corp. (OTCQB:PRHR) Corporate Presentation

Forward-looking Statement PetroShare Corp. (“PetroShare”) cautions that this presentation (along with oral commentary that accompanies it) may contain certain forward looking-statements that involve substantial risk and uncertainties and should be read in conjunction with the private placement memorandum. All statements, other than statements of historical facts, contained in this presentation, including statements regarding estimates, forecasts, projections, expectations or beliefs as to future events and results are forward-looking statements within the meaning of Section 27A of the Securities Act of 1933, as amended, and Section 21E of the Securities Exchange Act of 1934, as amended. The words “believe,” “will,” “may,” “estimate,” “continue,” “anticipate,” “intend,” “would,” “should,” “plan,” “expect,” “predict,” “could,” “potentially,” or other similar expressions are intended to identify forward-looking statements, although not all forward-looking statements contain these identifying words. Forward-looking statements and information are necessarily based on a number of estimates and assumptions that, while considered reasonable by management, are inherently subject to significant business, technical, economic and competitive uncertainties, risks and contingencies, and there can be no assurance that such statements and information will prove to be accurate. Therefore, actual results and future events could differ materially from those anticipated in such statements and information. Risks and uncertainties that could cause results or future events to differ materially from current expectations expressed or implied by the forward-looking statements and information include, but are not limited to, risks related to receipt of working capital, identification and acquisition of economically desirable properties, fluctuations in the market price of crude oil and natural gas, industry risks, risks related to permitting and the projected timeframes to receive the necessary permits, risks associated with crude oil operations, the construction of crude oil production operations and commencement of production and the projected costs thereof, risks related to litigation, property title, the state of the capital markets, environmental risks and hazards, uncertainty as to calculation of crude oil and natural gas resources and reserves and other risks. See PetroShare’s Form 10-K for the year ended December 31, 2015 and other filings with the Securities and Exchange Commission, under the caption “Risk Factors” for additional information on risks, uncertainties and other factors relating to the forward-looking statements and information regarding PetroShare. The forward-looking statements contained in this presentation speak only as of the date of this presentation and are based on information available to us as of such date and/or management’s good faith belief as of such date with respect to future events. Readers should not place undue reliance on forward-looking statements or information included herein. PetroShare undertakes no obligation to reissue or update forward-looking statements or information as a result of new information or events after the date hereof except as may be required by law. All forward-looking statements and information made in this presentation are qualified by this cautionary statement. 2
Company Overview
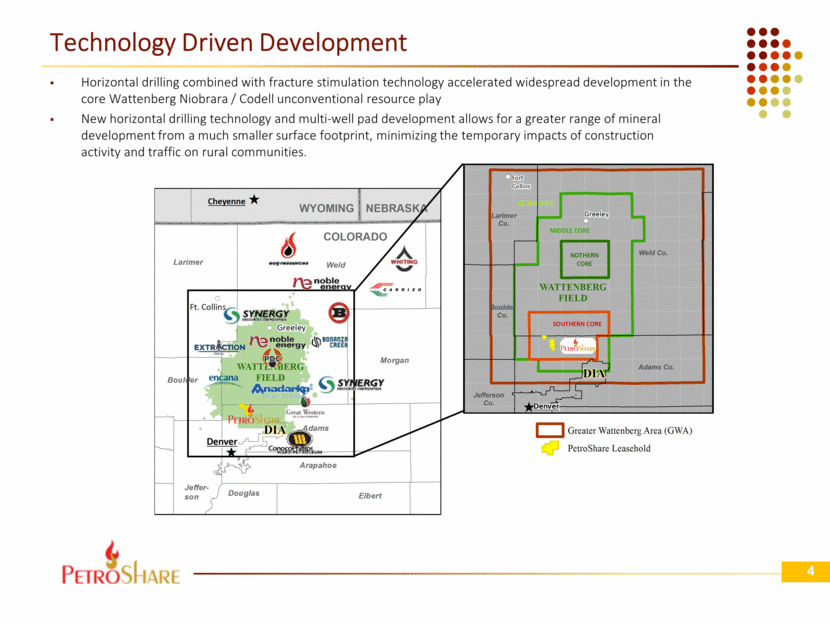
Technology Driven Development Horizontal drilling combined with fracture stimulation technology accelerated widespread development in the core Wattenberg Niobrara / Codell unconventional resource play New horizontal drilling technology and multi-well pad development allows for a greater range of mineral development from a much smaller surface footprint, minimizing the temporary impacts of construction activity and traffic on rural communities.
PetroShare Focus Area – Southern Wattenberg Field Geoscience and Target Zones * From S. Sonneberg (2002) SR = Source Rock, oil generated in place and migrates into adjacent porous zones The DJ Basin/Wattenberg has emerged as one of the premier oil and gas plays in the US EOG Resources kicked off the trend towards horizontal drilling in late 2009 with its Jake well at Hereford Ranch Field in northern Weld County Several other operators including Anadarko, Noble, PDC, Synergy Resources and others followed suit and have continually led horizontal development of the play until present day
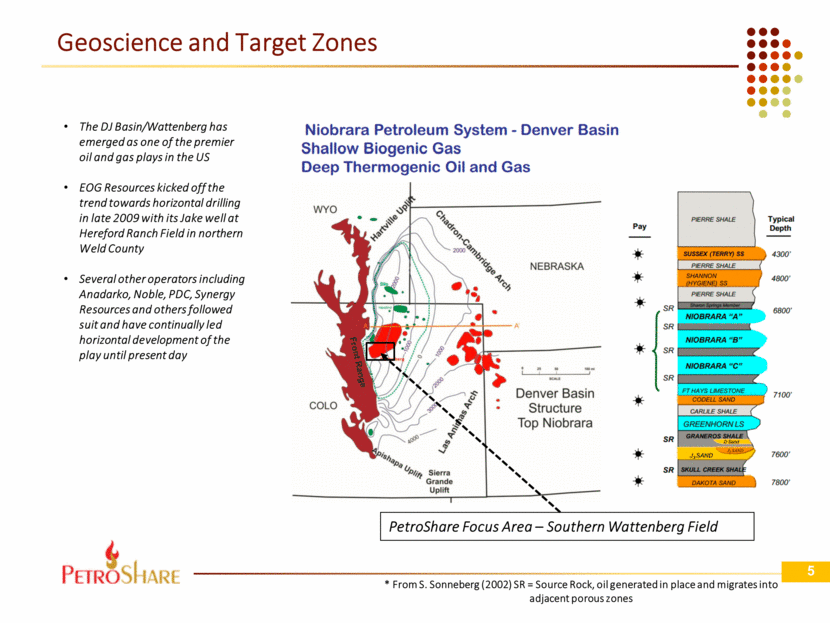
Focus Area – Southern Wattenberg Core Area* Approx. 26,800 Gross Acres (8,165 Net) 133+ Horizontal Drilling Locations 68+ locations are fully permitted or in the final permitting stages Approx. 40 Gross (14 net) Vertical D&J Sand locations identified 17 well non-operated drilling programs already underway Operations on our 14 well Shook Pad planned for Q1 2017 Approx. 100 BOE/d net – from 88 operated producing wells Weld County Adams County Proposed Discovery Pipeline Route Todd Creek Farms Focus Area South Brighton Focus Area Runway D&J Sand Focus Area
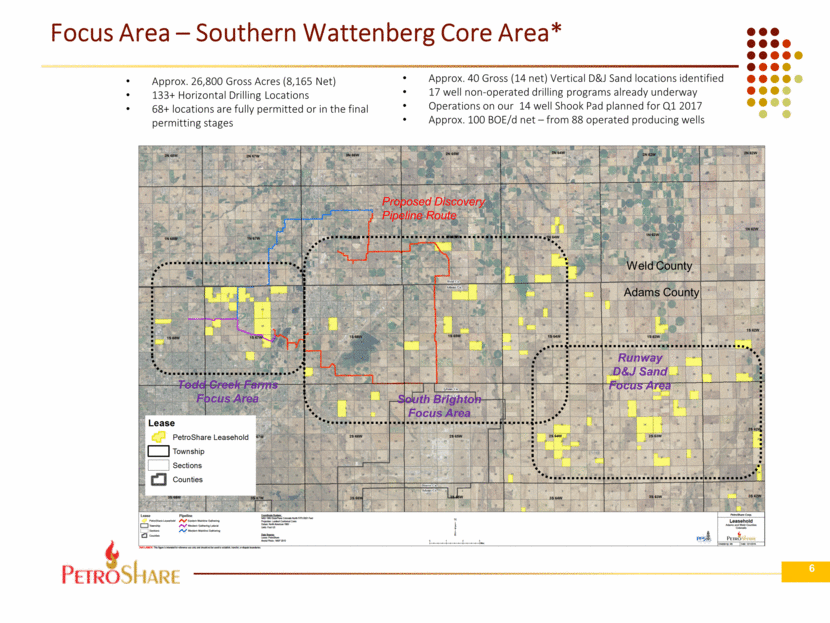
Focus Area – Southern Wattenberg “Sweet Spot” Southern Core Geo-Mechanical Productivity Limits – 3,800 Net Core Acres Estimated Limit of Codell SS Productivity Potential Estimated Limit of Niobrara Productivity Potential D & J Sand Vertical & Horizontal Potential PetroShare Operated Drill Pads Permitted or being Spaced
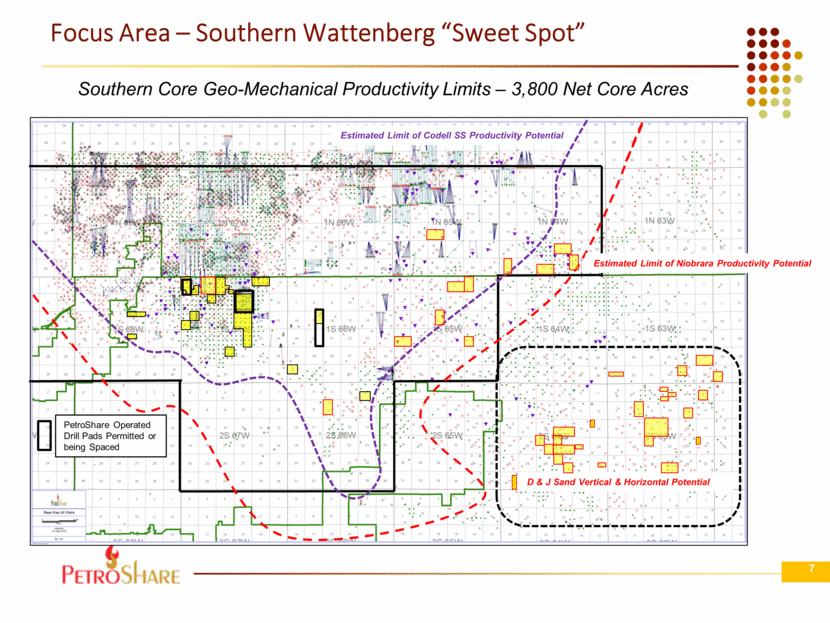
Horizontal Drilling Activity – Southern Core Area Todd Creek Farms Focus Area – Southern Core Area PetroShare Shook Pad Up to 50.0% WI (40.0% NRI) 14 Wells – (6) Codell, (4) Niobrara B, (2) Niobrara C, (2) Niobrara A PLUS (2) Niobrara XRL Great Western PDC Jacobucci Pad (14 Mid Range laterals) 8% to 27% WI 14 Wells – (6) Codell, (3) Niobrara B, (5) Niobrara C – All wells Drilled and Cased - Completion Scheduled for January 2017 PetroShare Corcillius Pad Up to 44.0% WI (34.1% NRI) 8 Wells – (3) Codell, (2) Niobrara B, (2) Niobrara C, (1) Niobrara A Ward Riverdale Pad (11 Standard laterals) Riverdale #14-3 Codell HZ – IP 90 Codell – 531 bopd / 788 mcfd Riverdale #15-3 Codell HZ – Approx. 11% WI 20 day average – 473 BOPD + 673 MCFG Great Western New Permits Up to 15 Extended Length Laterals – 11% to 15% WI IP 90 Codell XRL377C - 781 bopd / 810mcfd IP 90 Nio XRL 374N – 401 bopd / 1161mcfd PetroShare Corcillius
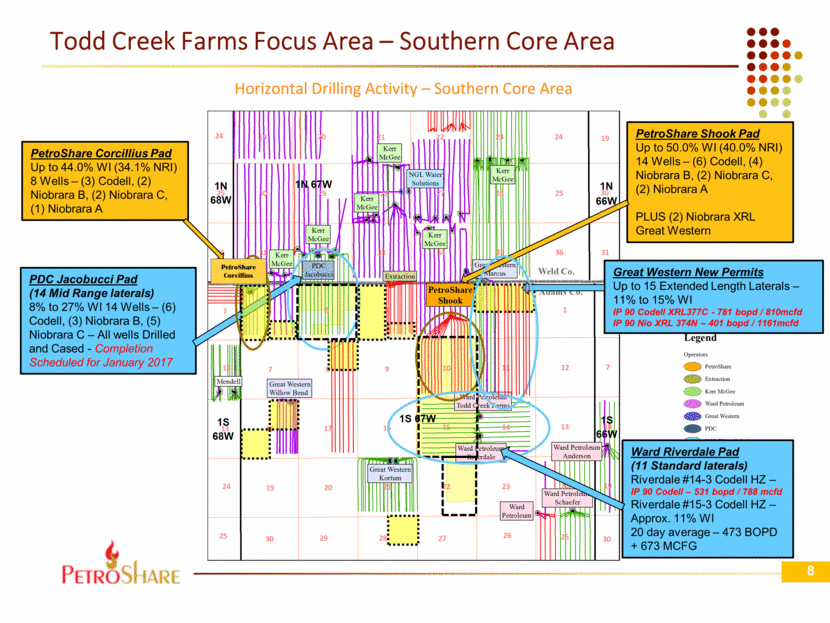
South Brighton Focus Area – Southern Core Area PetroShare’s Proposed So. Brighton Lakes Pad COGCC 640 DSU Spacing Request – 2 Mile Horizontal Wells (XRL’s) 8 Wells – (2) Codell, (3) Niobrara B, (2) Niobrara C, (1) Niobrara A Ward Petroleum Riverdale #14-3 IP 90 = 531 bopd / 788 mcfd #15-2 IP 20 = 473 bopd / 673 mcfd PetroShare Shook Pad 14 Horizontal Well Permits Ward Petroleum Anderson Pad #19-1 IP 90 = 542 bopd / 405 mcfd #18-3 IP 90 = 420 bopd / 538 mcfd Edge Petroleum 10 Well Pad Great Western 40 Well Pad HRM (Barrett)
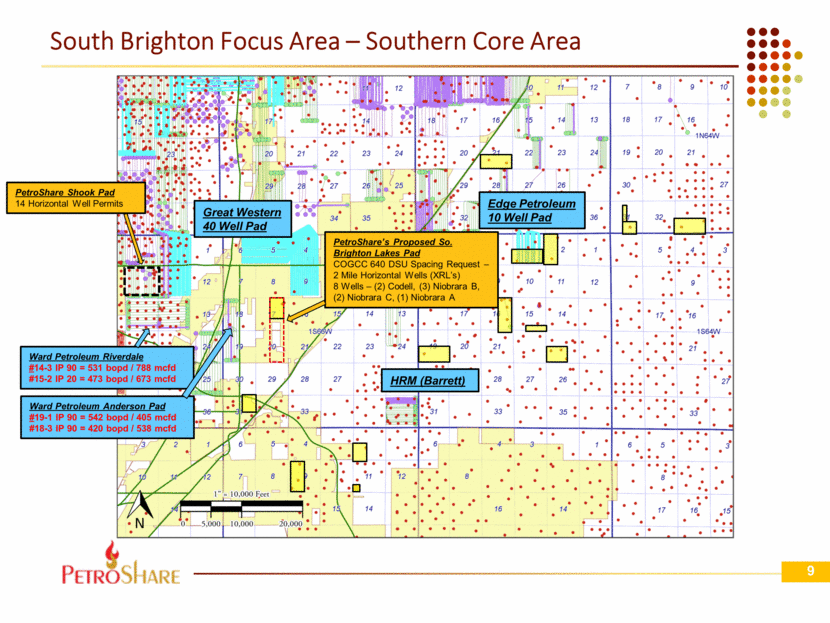
Runway Focus Area – Southern Core Area Established D&J Sand Producing Area Extensive Hydrocarbon Saturation in Tight Sand Reservoirs Access to new 3D Seismic Data to Determine Additional Low Risk Infill Locations Existing Gathering Infrastructure Horizontal Development Potential
Our Position Advantage – Quality Inventory PetroShare expects to capitalize on its current lease position The Company’s current lease position provides PetroShare with approximately 5% to 50% working interest in up to 134 horizontal well locations (approx. 61 net wells) Develop and convert an expanding reserve base to cash flow in orderly manner and grow proven reserve inventory Strategic agreements provide assistance for access to surface drill sites and water for drilling and completion activities as well as the provisions for certain pipeline easements Southern Core Drilling Inventory – Up to 134 Horizontal Wells* (based on 16 wells per sq. mile) Operated Well Pads – up to 92 (55 net) Horizontal Wells 22 Permitted Locations - Shook Pad – 14 wells & Corcillius Pad – 8 wells Operated by PetroShare Anticipate beginning first series of Shook well(s) in Q1 2017 Additional Well Pads – up to 70 additional wells Opportunity to acquire additional acreage in operated drilling blocks Opportunity to swap / trade acreage to increase and consolidate company operated drilling blocks Construction of the Shook Pad pipeline system anticipated to be in Q1 2017 Additional HZ well inventory associated with the Niobrara A zone. Non – Operated Drilling Activity – up to 42 (6.2 net) Horizontal Wells Jacobucci Pad [PDC] – 14 Mid-Range length HZ wells – slated for completion beginning in January 2017 Marcus Pad [Great Western O&G] – 2 lease line wells being completed plus 15 Extended Length HZ wells to be drilled Riverdale Pad [Ward Energy Corp] – 1 standard HZ well online plus 10 Standard Length HZ wells to be drilled Additional Non-Operated well inventory in the permitting phase
PetroShare Business Strategy and Key Partnerships
Providence Energy Group based out of Dallas, TX (“PRO”) is a $600 MM pension fund-backed energy investment firm which focuses on acquiring operated and non-operated oil and gas assets in major onshore U.S. basins. PRO is PetroShare’s largest shareholder, and currently owns 13.7% of the Company through its purchase of $3,000,000 in common stock in PetroShare’s initial public offering. PRO and its affiliates have provided PetroShare $15.0 MM in flexible debt capital to the Company, of which approximately $12.1 MM has been drawn to date. These funds will be used for current and future acquisitions and accelerated non-operated drilling program activity on its existing leasehold. In addition to providing debt capital, PRO partnered with PetroShare to acquire assets within the DJ Basin/Wattenberg in the form of a 50% participation rights agreement within a defined AMI. PRO has elected to take its 50% share in all acquisitions to date Todd Creek Farms (Kingdom Lease) Various “tuck-in” lease and royalty acquisitions PDC asset acquisition Approximately an 80% NRI conveyed to PetroShare/Providence Various follow on acquisitions made to date Key Strategic Relationship - Providence Energy
Building Our Position – M&A Capitalize on Fragmentation – Have’s and Have Not’s $1 MM to $100 MM transaction size Big publics and small privates are currently rationalizing properties – concentrate on core areas – divest to pay down debt Farm-in as non-op to get foot in the door and leverage to get an operated position 2016 Acquisition Activity: Secured grass root leases leveraging our real estate expertise and acquired HBP producing properties from operators rationalizing assets and/or fixing balance sheets Approx. 26,800 gross acres (8,165 net) in Weld and Adams County, Colo. 88 operated producing wells approx. 200 BOE/d (100 net BOE/d) Inventory: Producing vertical wellbores with low cost workover and equipment repair upside 133+ horizontal Niobrara and Codell well locations 40 identified vertical in-fill D & J Sand well locations 22 Fully-permitted horizontal wells on two pads Leverage PRO relationship to acquire additional assets and participate in attractive development opportunities in the Southern Core Area Our Competitive Advantages in the Acquisition Market: Logical Buyer – we have an existing presence and the potential to transact quickly for cash Collaboration with Stakeholders enhances the potential for: Reduced surface facilities footprint - real estate developers love it and less visible to local traffic Pad drilling – efficient monetization of mineral owner rights from central locations Midstream infrastructure – Oil & Natural Gas Gathering – the key to reducing surface footprint Active in the local community and good relationship with Adams County Commissioners We expect to acquire additional production and leasehold using our specific expertise and strategic relationships.
Reserves & Economic Sensitivity
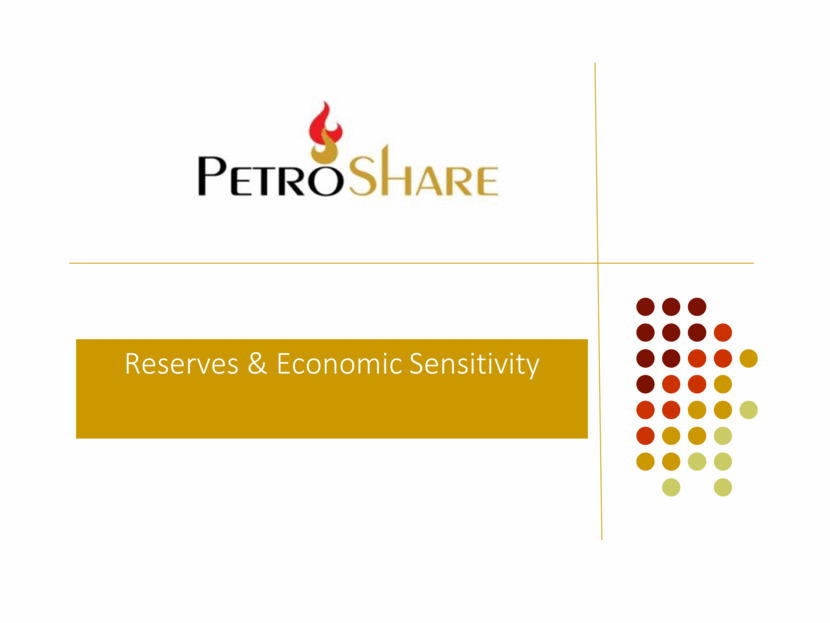
Economics – Accretive Projects at Low Oil Prices Based on CAPEX of $3.0 MM and $3.5 MM for standard length (4,300’) and medium length (6,750’) laterals respectively, less $6.50/bbl WTI adjustment and an 80% NRI 0 20 40 60 80 100 120 140 160 180 200 30 35 40 45 50 55 60 65 70 ROR (%) NYMEX Oil Price ($/bbl) PetroShare Planned Horizontal Wells - ROR vs NYMEX Oil* Codell Standard Lateral Codell Medium Lateral Niobrara Standard Lateral Niobrara Medium Lateral
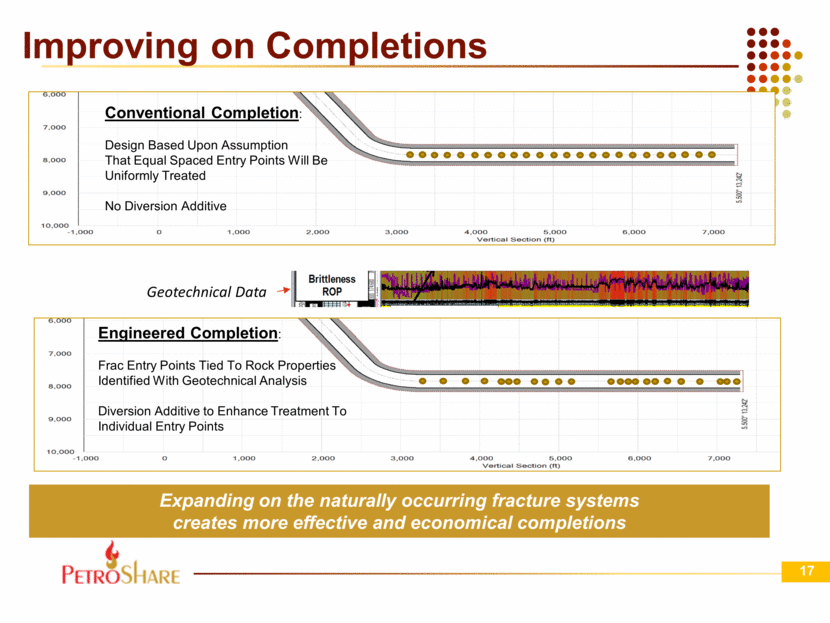
Geotechnical Data Improving on Completions Expanding on the naturally occurring fracture systems creates more effective and economical completions Conventional Completion: Design Based Upon Assumption That Equal Spaced Entry Points Will Be Uniformly Treated No Diversion Additive Engineered Completion: Frac Entry Points Tied To Rock Properties Identified With Geotechnical Analysis Diversion Additive to Enhance Treatment To Individual Entry Points
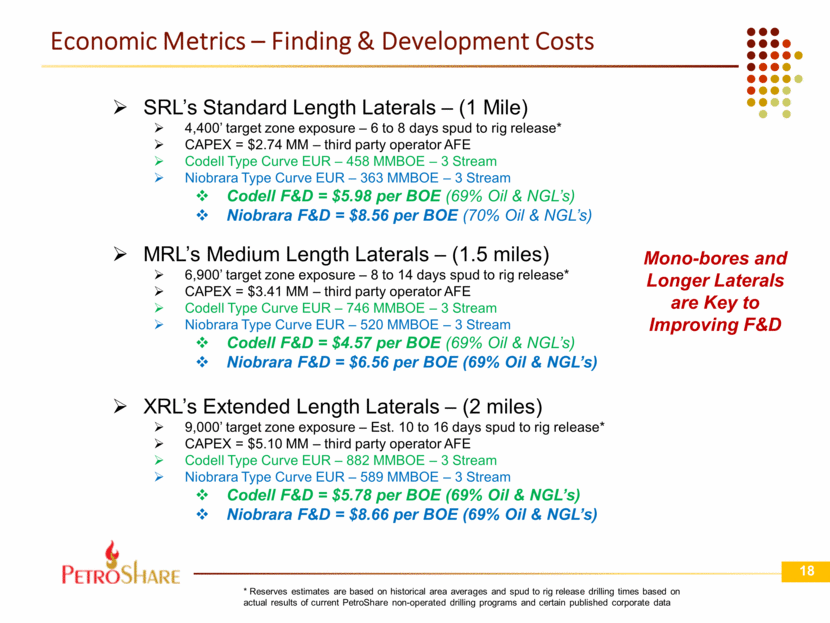
Economic Metrics – Finding & Development Costs SRL’s Standard Length Laterals – (1 Mile) 4,400’ target zone exposure – 6 to 8 days spud to rig release* CAPEX = $2.74 MM – third party operator AFE Codell Type Curve EUR – 458 MMBOE – 3 Stream Niobrara Type Curve EUR – 363 MMBOE – 3 Stream Codell F&D = $5.98 per BOE (69% Oil & NGL’s) Niobrara F&D = $8.56 per BOE (70% Oil & NGL’s) MRL’s Medium Length Laterals – (1.5 miles) 6,900’ target zone exposure – 8 to 14 days spud to rig release* CAPEX = $3.41 MM – third party operator AFE Codell Type Curve EUR – 746 MMBOE – 3 Stream Niobrara Type Curve EUR – 520 MMBOE – 3 Stream Codell F&D = $4.57 per BOE (69% Oil & NGL’s) Niobrara F&D = $6.56 per BOE (69% Oil & NGL’s) XRL’s Extended Length Laterals – (2 miles) 9,000’ target zone exposure – Est. 10 to 16 days spud to rig release* CAPEX = $5.10 MM – third party operator AFE Codell Type Curve EUR – 882 MMBOE – 3 Stream Niobrara Type Curve EUR – 589 MMBOE – 3 Stream Codell F&D = $5.78 per BOE (69% Oil & NGL’s) Niobrara F&D = $8.66 per BOE (69% Oil & NGL’s) Mono-bores and Longer Laterals are Key to Improving F&D * Reserves estimates are based on historical area averages and spud to rig release drilling times based on actual results of current PetroShare non-operated drilling programs and certain published corporate data
Financing and Capital Programs
2016 CAPEX Program Q4 – Pursue Active Drilling and Acquisitions Programs Complete planning and permitting activities for Shook Pad and order long lead time equipment Participate in drilling the remaining PDC Jacobucci Pad wells 14 (2.46 net) and 1 (0.11 net) Ward Riverdale Pad well Participate in drilling up to 2 (0.3 net) Great Western Marcus Pad wells Pursue “tuck-in” acquisitions to consolidate acreage blocks Pursue logical acquisition opportunities 2017 CAPEX Program Q1 – Participate in the completion program for the 14 Jacobucci Pad wells Q2 - Drill & Complete up to 7 (3.1 net) operated horizontal wells on our Shook Pad Q1 thru Q4 – Evaluate and participate, if warranted, in proposed non-operated wells behind experienced area operators Pursue “tuck-in” acquisition to consolidate acreage blocks Pursue logical acquisition opportunities Establish reserve-backed borrowing base for increased financial flexibility 2018 & 2019 CAPEX Program Drill future inventory out of cash flow based on commodity price support Pursue “tuck-in” acquisitions to consolidate acreage blocks Pursue logical acquisition opportunities Control G&A growth 2017 Drilling Schedule & CAPEX Pursue complementary acquisitions in geo-mechanical sweet spots
2016 Q4 Operated and Non-Operated Production Growth 100 BOEPD – Operated Conventional Production 65 BOEPD – New Codell SRL HZ online at IP20 = 585 BOEPD – (0.11 Net Well) 110 BOEPD – Two New Niobrara XRL (2 mile laterals) HZ online IP10 days, cleaning up – (0.30 Net Wells) 275 BOEPD = Estimated December 31, 2016 Net Exit Rate 2017 Q1 – Q2 Operated and Non-Operated CAPEX Program* Production Rates from 3 (0.41 net) new Non-Op HZ wells expected to improves has wells clean-up after frac Final completion and fracture stimulation operations to begin in January on 14 (2.46 net) Non-Op Wells = 8 Niobrara plus 6 Codell MRL (1 ½ mile laterals) Initiate well pad construction and drilling operations of PetroShare’s operated 14 well Shook Pad Pursue spacing and permitting activities on PetroShare operated drilling blocks 2016 Q4 – 2017 Q2 Potential Production Growth All non – operated activities are at sole discretion of the well operator Subject to availability of adequate capital
The PetroShare Team
Skill Sets – Building Partnerships with Stakeholders Real Estate Development, Land & Surface Use Experience PetroShare and its partners provide a unique range of experience in real estate development in our focus area We understand the issues facing, community governments, real estate developers, school districts, and home owners in developing rural areas We collaborate with all stakeholders to develop private and public mineral rights, minimizing impacts of traffic and noise during temporary well drilling, completion and wellsite construction Our real estate experience allows us to structure access to water and to negotiate surface locations which will not interfere with future surface and land uses We can aid and assist real estate developers with structuring metro districts to take advantage of oil and gas generated tax revenues for green belts, parks and recreation areas Technical & Operating Geology, Drilling & Completions Our team has over 100 years of experience in oil and gas exploration, development and operations Our team has experience in horizontal drilling and completion operations employing the latest proven technology advancements resulting in enhanced reserve recoveries and cost saving efficiencies We have over 35 years experience in a wide variety of geoscience disciplines Our team understands the regulatory environment and can design well site facilities to minimize surface disturbance and reduce visual impact. Infrastructure Midstream & Facilities PetroShare management has experience in planning, installing and operating oil and gas gathering and compression facilities Access to properly constructed midstream facilities is the key to minimizing surface impact.
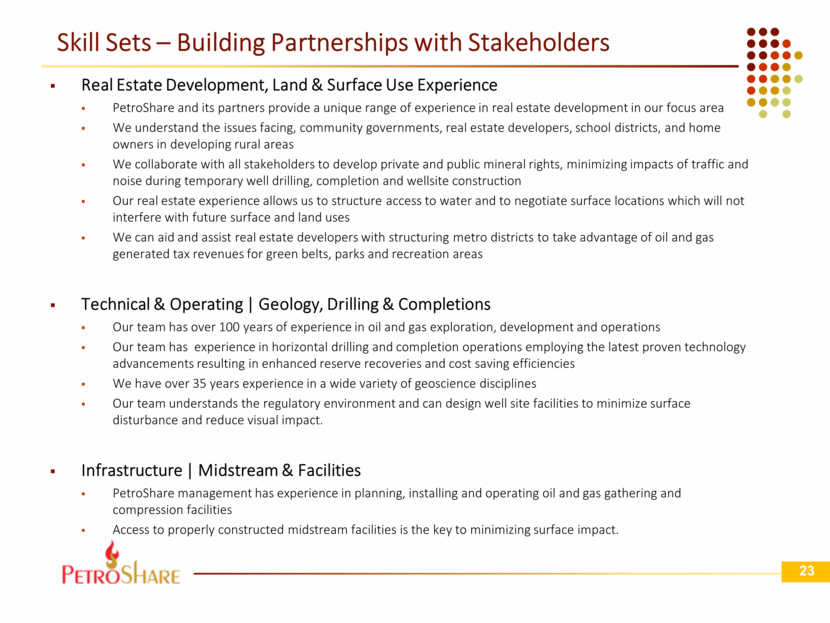
Management Team Bill Conrad, Chairman Over 20 years of experience as an executive or director of oil and gas companies Former director of Synergy Resources Corporation, (“SYRG”) a publicly traded oil and gas company, with securities listed on the NYSE MKT Chairman of the Board of Gold Resource Corporation, (“GORO”) a publicly traded gold mining and exploration company with securities listed on the NYSE MKT Stephen Foley, CEO Mr. Foley has served as the Chief Executive Officer of PetroShare since its inception 15 years of experience in property investment and real estate development in Colorado 11 seasons as a safety with the Denver Broncos football organization (’76-’86) Fredrick Witsell, President Over 35 years of experience in several facets of the oil and gas industry, including geoscience, prospect development, conventional and horizontal drilling and completion operations, project management, gathering and compression systems and marketing and risk management Served as an executive and co-founder of a series of small, privately-funded oil and gas companies with properties in North Dakota, Wyoming, Utah and Colorado
William Lloyd, Executive VP of Engineering, Chief Operating Officer Over 35 years of experience, leading operations for extensive drilling and completion programs in the Rocky Mountains, California, Norway and Alaska, which included a record horizontal well, the longest Extended Reach well and the largest ice road construction and exploration drilling program Most recently served as Senior VP of Operations for a successful private Rocky Mountain Oil and Gas Company with divestitures in excess of $500MM William Givan, Vice President of Land Over 35 years of experience, in all facets of land work, administration and business development. Most recently served as Senior Land Manager for a successful private Rocky Mountain Oil and Gas Company with over 1.0 million acres under management Jon Kruljac, Capital Markets & Investor Relations, Advisor Over 30 years of Wall Street and industry experience focused on small-cap oil and gas companies since 1991, as an institutional salesman, investment banker, and investor relations consultant Most recently served as Vice President of Capital Markets and Investor Relations with Synergy Resources Corporation

Summary Highlights Geologic Discipline Identify and target geo-mechanical “sweet spots” in the southern portion of the Wattenberg Identify horizontal development potential of previously conventionally developed stratigraphic zones Economic drilling in the current commodity price environment Pure play public DJ-Basin (Wattenberg) Avoided the “land grab”; overpaying for acreage (North Core/Greeley area) Financial Prudence & Flexibility Providence Energy Group - $600 MM Strategic Financial Partner and Lender Ability to transact quickly for cash and then do an orderly capital raise to buy up to 50% Keeps balance sheet clean, but deal flow active Ideal for non-op to cover AFEs Low Cost Structure – Grassroots with a Major Mindset Lower G&A via lean team, outsourcing basic accounting / financial reporting / permitting & compliance Target lower D&C via pad drilling efficiencies and engineered completions Focus on lower LOE due to a concentrated property base and lower G&A burden Minimal Debt - $15 MM LOC’s Operational Prudence Concentrated contiguous acreage; “a lot with a little” $100MM+ Development Program possible with existing acreage Acreage HBP; optionality to capture good prices - drill when ready Capitalize on Fragmentation & Financial Distress – Have’s and Have Not’s $1 MM to $100 MM transaction size Big publics and small privates are currently rationalizing properties – concentrate on core areas – divest to pay down debt Farm-in as non-op to get foot in the door and leverage to get an operated position
THANK YOU
APPENDIX
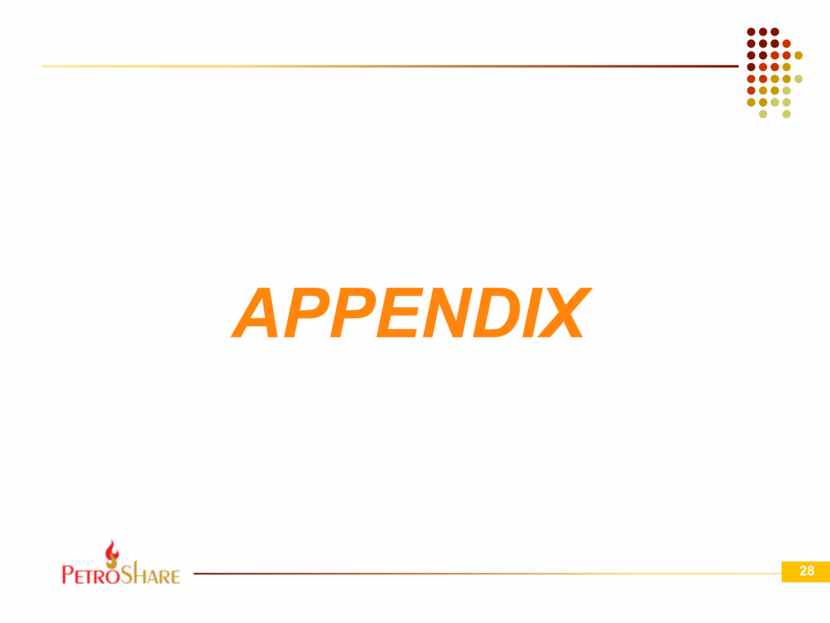
Technology Assisted Production Facilities – TAP Pad Standard Production Facility TAP Pad Facility Oil Tank Farm Individual Well Separators Wellheads Wellheads Prod Sep Test Sep Recycle Oil & Production Water Tanks Oil Transfer Unit Control Skid Flameless Incinerator Flameless Incinerators * TAP Pad design requires access to an oil pipeline Oil Surge Tank Control Skid Oil Surge Tank Launcher TAP Pad results in beneficial reduction of surface footprint & traffic Standard facility design has greater visual impact and requires increased truck traffic for maintenance and oil hauling
Southern Core – Codell Reserves verses Lateral Length IP 60: 491 BOPD, 1470 MCFD EUR = 202 MMBO + 1.398 BCF EUR = 458 MMBOE – 3 Stream [104 BOE per completed foot] *PDC SRL’s = 600 MBOE – Inner Core *PDC SRL’s = 460 MBOE – Middle Core (avg.) *PDC SRL’s = 311 MBOE – Outer Core ** SYRG SRL’s = 350 MBOE – Middle Core ***BCEI SRL’s = 354 MBOE – Middle Core IP 60: 681 BOPD, 1955 MCFD EUR = 276 MMBO + 1.878 BCF EUR = 746 MMBOE – 3 Stream [108 BOE per completed foot] *PDC MRL’s = 685 MBOE – Middle Core ** SYRG MRL’s = 670 MBOE – Inner Core SRL- 4,400’ MRL- 6,900’ Evolving Completion Practices are Improving EUR’s Codell Mid-Range Laterals Maximize IRR EUR’s assume 80 bbls NGL’s per 1000 MCFG average area plant recoveries
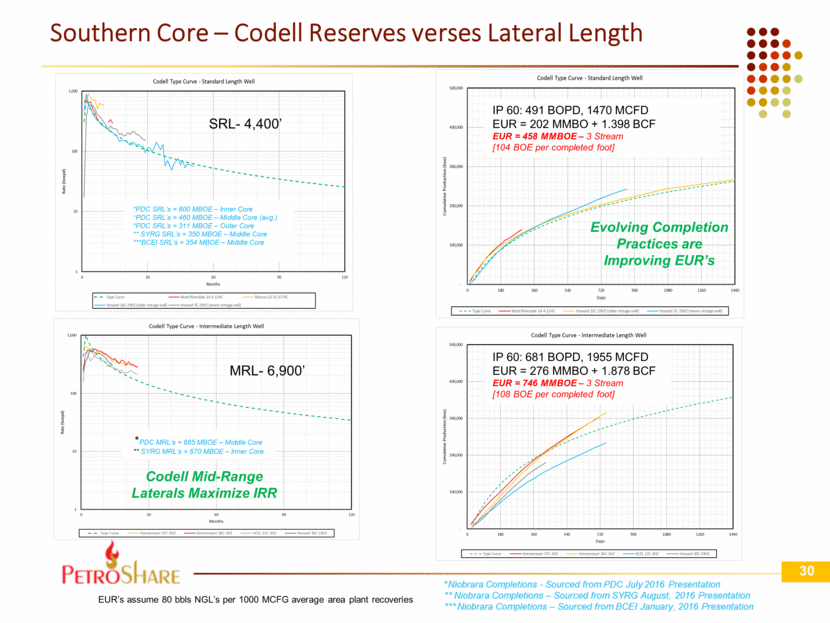
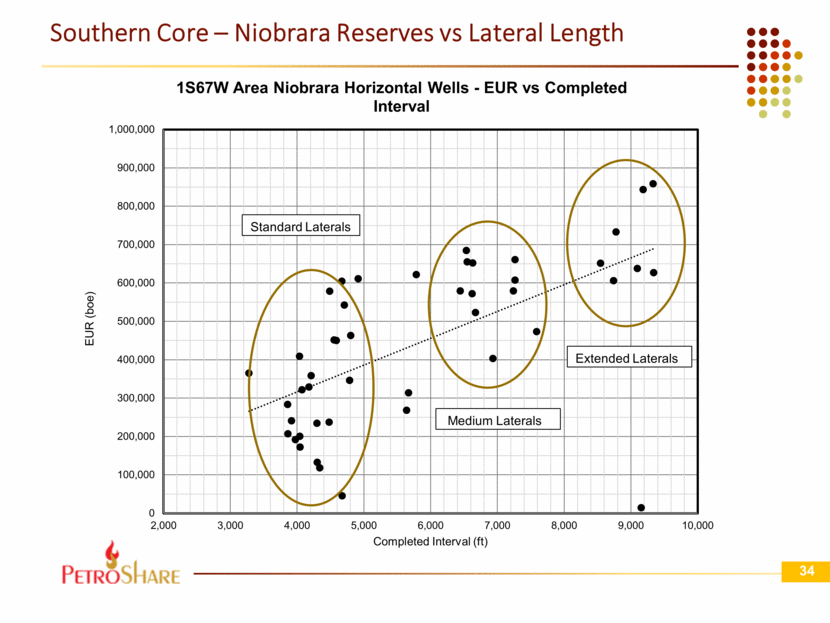
Southern Core – Niobrara Reserves verses Lateral Length IP 60: 409 BOPD, 1273 MCFD EUR = 153 MMBO + 1.025 BCF EUR = 363 MMBOE – 2nd generation completions [82 BOE per completed foot] IP 60: 525 BOPD, 1592 MCFD EUR = 207 MMBO + 1.251 BCF EUR = 520 MMBOE – 3 Stream [78 BOE per completed foot] *PDC MRL’s = 685 MBOE – Middle Core ** SYRG MRL’s = 670 MBOE – Inner Core *PDC SRL’s = 600 MBOE – Inner Core *PDC SRL’s = 460 MBOE – Middle Core (avg.) *PDC SRL’s = 311 MBOE – Outer Core ** SYRG SRL’s = 350 MBOE – Middle Core ***BCEI SRL’s = 354 MBOE – Middle Core SRL- 4,400’ Evolving Completion Practices are Improving EUR’s EUR’s assume 80 bbls NGL’s per 1000 MCFG average area plant recoveries
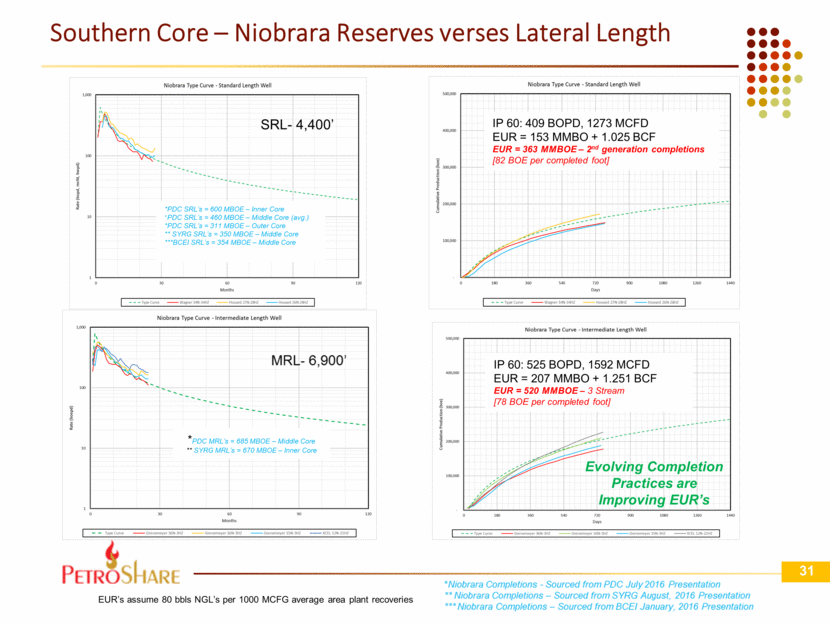
Southern Core – Extended Length Laterals IP 60: 542 BOPD, 1676 MCFD EUR = 228 MMBO + 1.445 BCF EUR = 589 MMBOE [58 BOE per completed foot] IP 60: 497 BOPD, 2245 MCFD EUR = 338 MMBO + 2.175 BCF EUR = 882 MMBOE [98 BOE per completed foot] XRL- 9,000’ XRL- 9,000’ Mono-bores and Longer Laterals are Key to Improving Niobrara EUR’s EUR’s assume 80 bbls NGL’s per 1000 MCFG average area plant recoveries
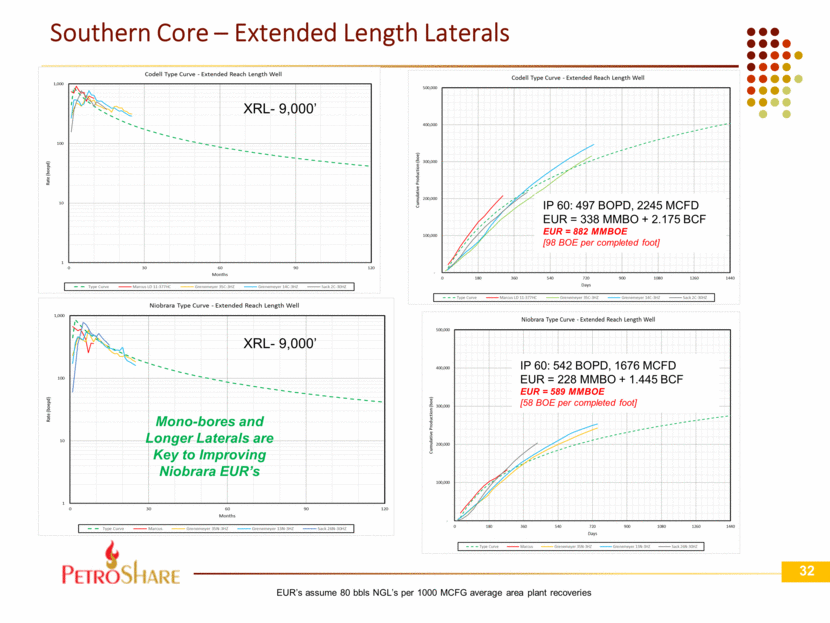
Southern Core – Codell Reserves vs Lateral Length 0 200,000 400,000 600,000 800,000 1,000,000 1,200,000 2,000 3,000 4,000 5,000 6,000 7,000 8,000 9,000 10,000 EUR (boe) Completed Interval (ft) 1S67W Area Codell Horizontal Wells - EUR vs Completed Interval Standard Laterals Medium Laterals Extended Laterals
Southern Core – Niobrara Reserves vs Lateral Length Standard Laterals Medium Laterals Extended Laterals 0 100,000 200,000 300,000 400,000 500,000 600,000 700,000 800,000 900,000 1,000,000 2,000 3,000 4,000 5,000 6,000 7,000 8,000 9,000 10,000 EUR (boe) Completed Interval (ft) 1S67W Area Niobrara Horizontal Wells - EUR vs Completed Interval
