Attached files
| file | filename |
|---|---|
| EX-99.1 - EXHIBIT 99.1 - MYRIAD GENETICS INC | d344203dex991.htm |
| 8-K - FORM 8-K - MYRIAD GENETICS INC | d344203d8k.htm |

Myriad Genetics Fiscal Second-Quarter 2017 Earnings Call 02/07/2017 Exhibit 99.2
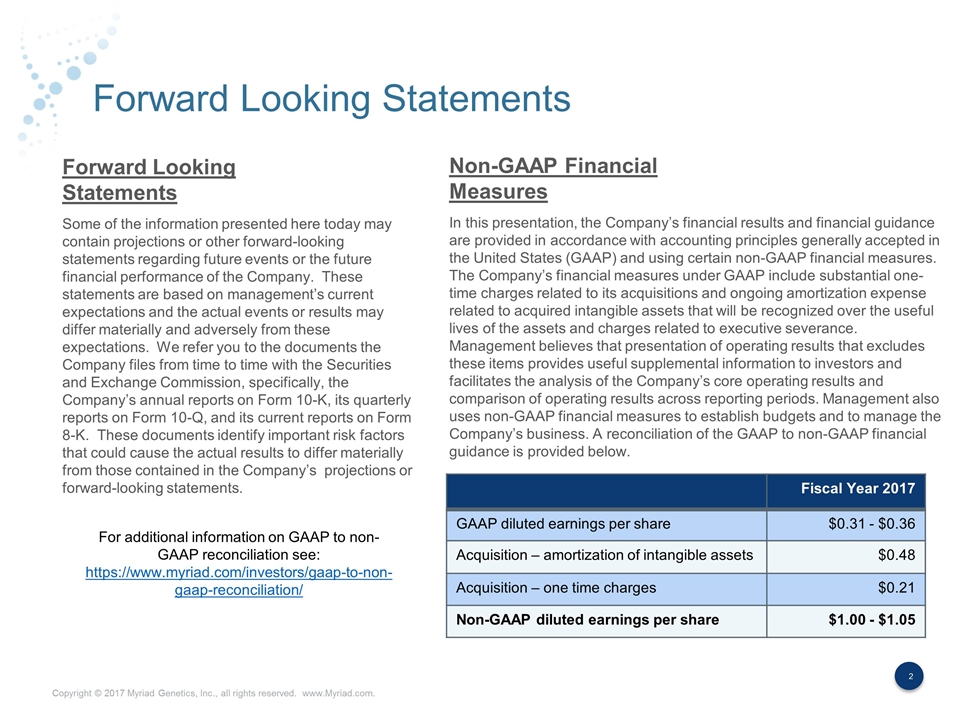
Forward Looking Statements Some of the information presented here today may contain projections or other forward-looking statements regarding future events or the future financial performance of the Company. These statements are based on management’s current expectations and the actual events or results may differ materially and adversely from these expectations. We refer you to the documents the Company files from time to time with the Securities and Exchange Commission, specifically, the Company’s annual reports on Form 10-K, its quarterly reports on Form 10-Q, and its current reports on Form 8-K. These documents identify important risk factors that could cause the actual results to differ materially from those contained in the Company’s projections or forward-looking statements. In this presentation, the Company’s financial results and financial guidance are provided in accordance with accounting principles generally accepted in the United States (GAAP) and using certain non-GAAP financial measures. The Company’s financial measures under GAAP include substantial one-time charges related to its acquisitions and ongoing amortization expense related to acquired intangible assets that will be recognized over the useful lives of the assets and charges related to executive severance. Management believes that presentation of operating results that excludes these items provides useful supplemental information to investors and facilitates the analysis of the Company’s core operating results and comparison of operating results across reporting periods. Management also uses non-GAAP financial measures to establish budgets and to manage the Company’s business. A reconciliation of the GAAP to non-GAAP financial guidance is provided below. Forward Looking Statements Non-GAAP Financial Measures Fiscal Year 2017 GAAP diluted earnings per share $0.31 - $0.36 Acquisition – amortization of intangible assets $0.48 Acquisition – one time charges $0.21 Non-GAAP diluted earnings per share $1.00 - $1.05 For additional information on GAAP to non-GAAP reconciliation see: https://www.myriad.com/investors/gaap-to-non-gaap-reconciliation/
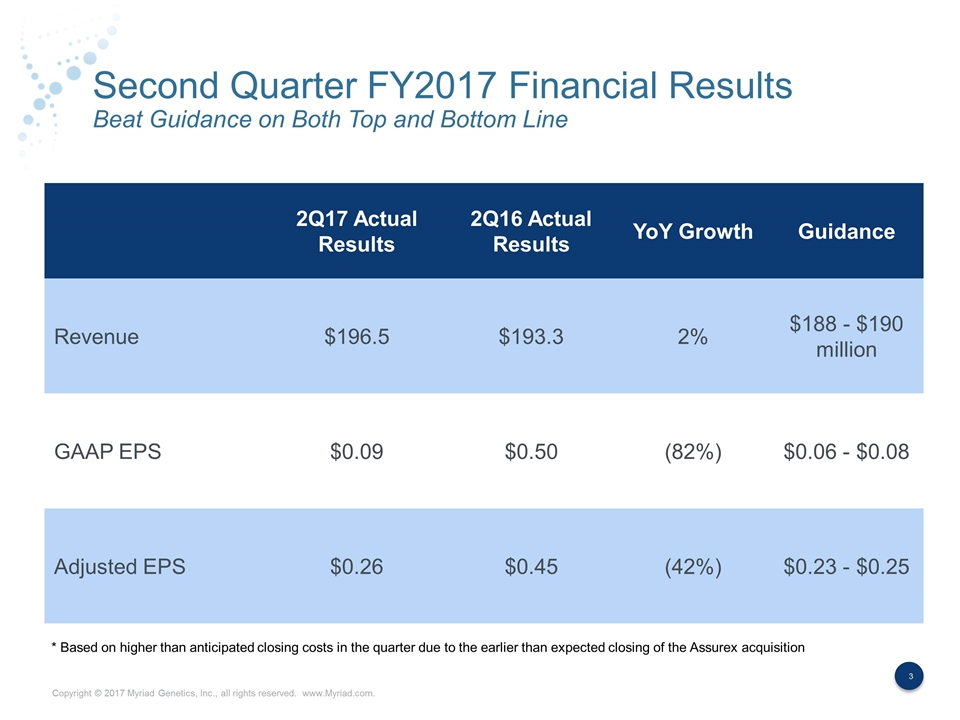
Second Quarter FY2017 Financial Results Beat Guidance on Both Top and Bottom Line 2Q17 Actual Results 2Q16 Actual Results YoY Growth Guidance Revenue $196.5 $193.3 2% $188 - $190 million GAAP EPS $0.09 $0.50 (82%) $0.06 - $0.08 Adjusted EPS $0.26 $0.45 (42%) $0.23 - $0.25 * Based on higher than anticipated closing costs in the quarter due to the earlier than expected closing of the Assurex acquisition
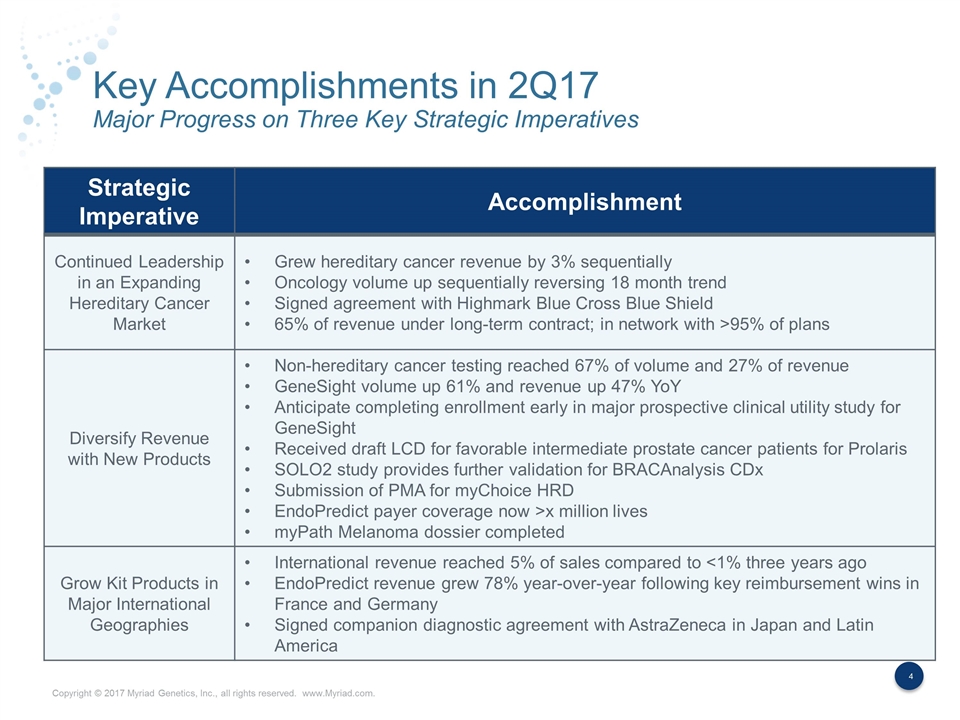
Key Accomplishments in 2Q17 Major Progress on Three Key Strategic Imperatives Strategic Imperative Accomplishment Continued Leadership in an Expanding Hereditary Cancer Market Grew hereditary cancer revenue by 3% sequentially Oncology volume up sequentially reversing 18 month trend Signed agreement with Highmark Blue Cross Blue Shield 65% of revenue under long-term contract; in network with >95% of plans Diversify Revenue with New Products Non-hereditary cancer testing reached 67% of volume and 27% of revenue GeneSight volume up 61% and revenue up 47% YoY Anticipate completing enrollment early in major prospective clinical utility study for GeneSight Received draft LCD for favorable intermediate prostate cancer patients for Prolaris SOLO2 study provides further validation for BRACAnalysis CDx Submission of PMA for myChoice HRD EndoPredict payer coverage now >x million lives myPath Melanoma dossier completed Grow Kit Products in Major International Geographies International revenue reached 5% of sales compared to <1% three years ago EndoPredict revenue grew 78% year-over-year following key reimbursement wins in France and Germany Signed companion diagnostic agreement with AstraZeneca in Japan and Latin America
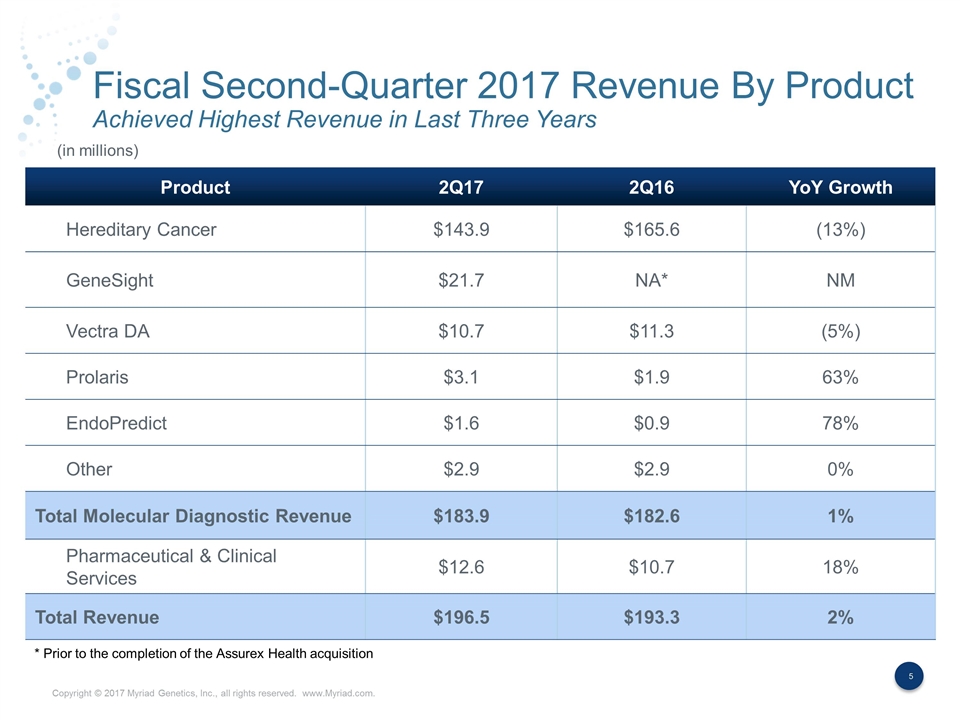
Fiscal Second-Quarter 2017 Revenue By Product Achieved Highest Revenue in Last Three Years Product 2Q17 2Q16 YoY Growth Hereditary Cancer $143.9 $165.6 (13%) GeneSight $21.7 NA* NM Vectra DA $10.7 $11.3 (5%) Prolaris $3.1 $1.9 63% EndoPredict $1.6 $0.9 78% Other $2.9 $2.9 0% Total Molecular Diagnostic Revenue $183.9 $182.6 1% Pharmaceutical & Clinical Services $12.6 $10.7 18% Total Revenue $196.5 $193.3 2% (in millions) * Prior to the completion of the Assurex Health acquisition
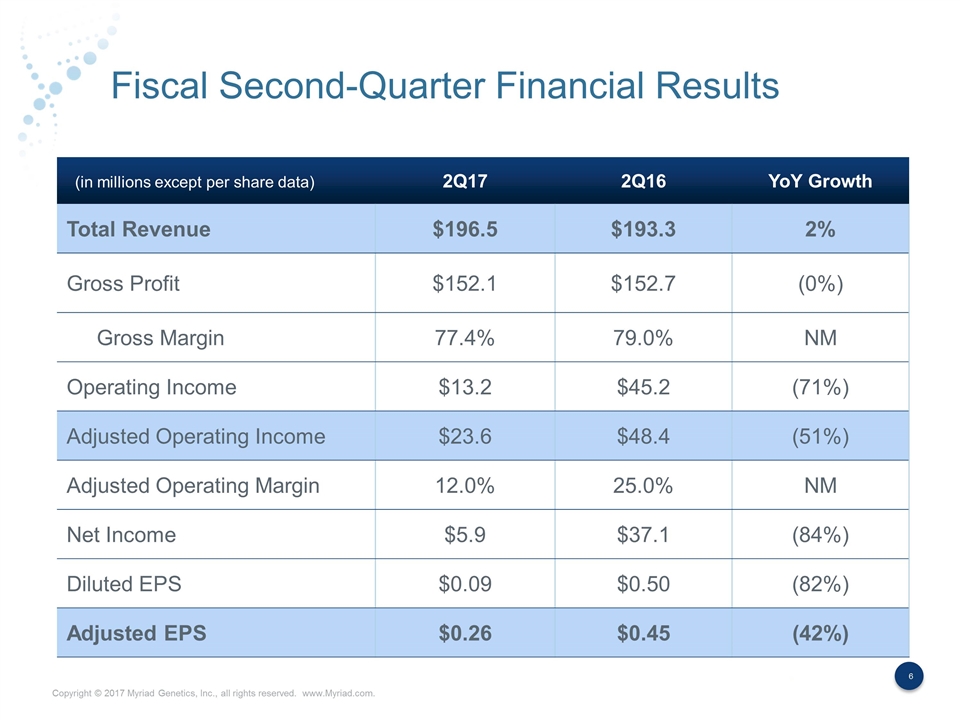
Fiscal Second-Quarter Financial Results 2Q17 2Q16 YoY Growth Total Revenue $196.5 $193.3 2% Gross Profit $152.1 $152.7 (0%) Gross Margin 77.4% 79.0% NM Operating Income $13.2 $45.2 (71%) Adjusted Operating Income $23.6 $48.4 (51%) Adjusted Operating Margin 12.0% 25.0% NM Net Income $5.9 $37.1 (84%) Diluted EPS $0.09 $0.50 (82%) Adjusted EPS $0.26 $0.45 (42%) (in millions except per share data)
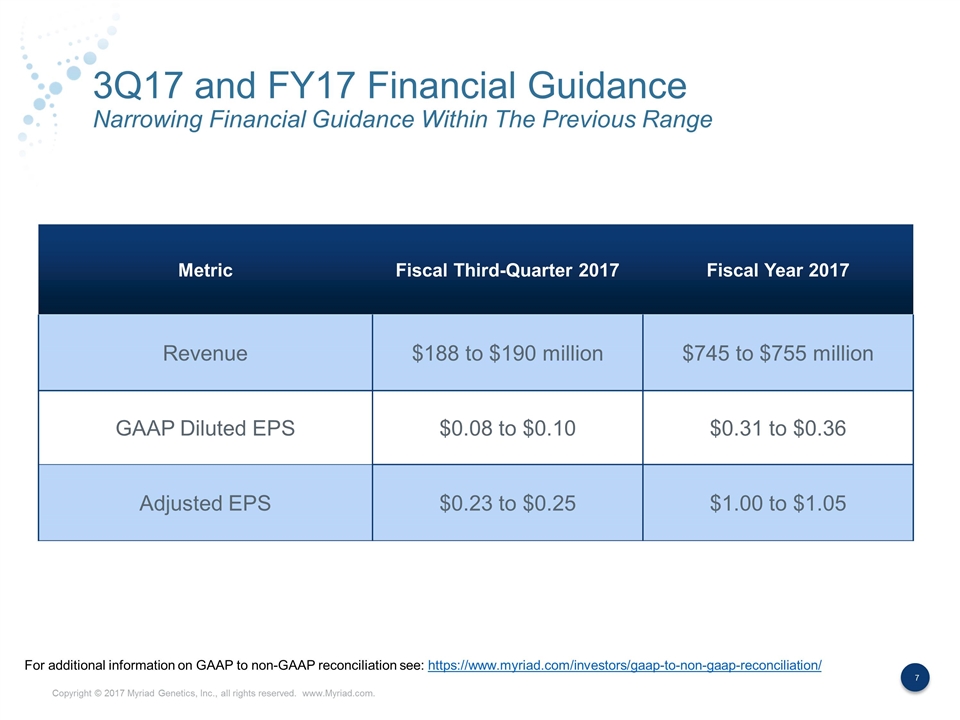
3Q17 and FY17 Financial Guidance Narrowing Financial Guidance Within The Previous Range Metric Fiscal Third-Quarter 2017 Fiscal Year 2017 Revenue $188 to $190 million $745 to $755 million GAAP Diluted EPS $0.08 to $0.10 $0.31 to $0.36 Adjusted EPS $0.23 to $0.25 $1.00 to $1.05 For additional information on GAAP to non-GAAP reconciliation see: https://www.myriad.com/investors/gaap-to-non-gaap-reconciliation/
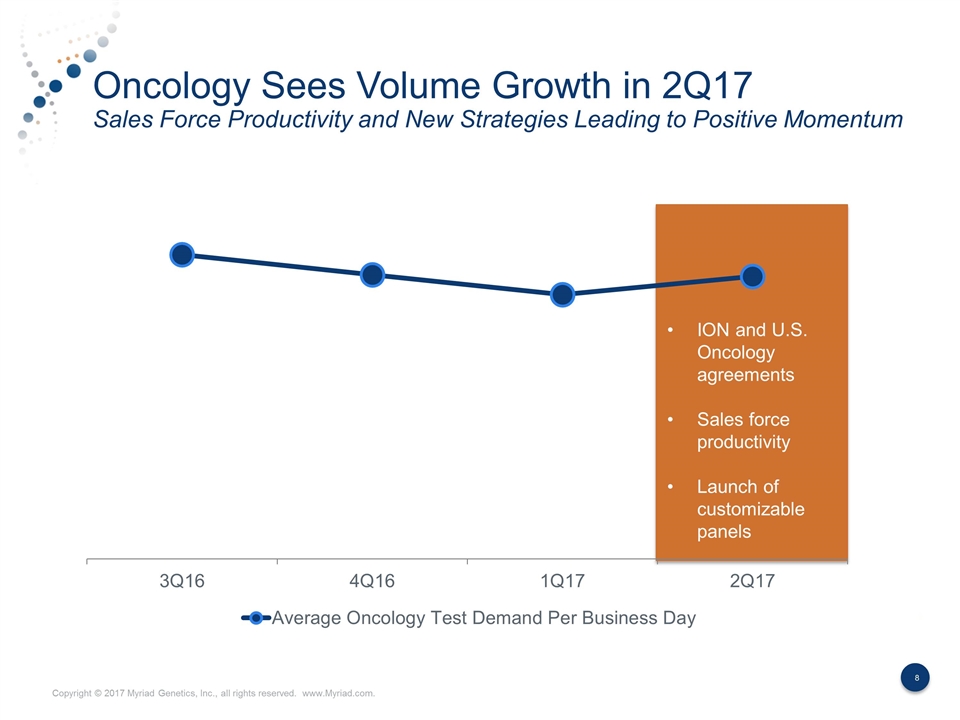
Oncology Sees Volume Growth in 2Q17 Sales Force Productivity and New Strategies Leading to Positive Momentum Sales Force Replenishment ION and U.S. Oncology agreements Sales force productivity Launch of customizable panels
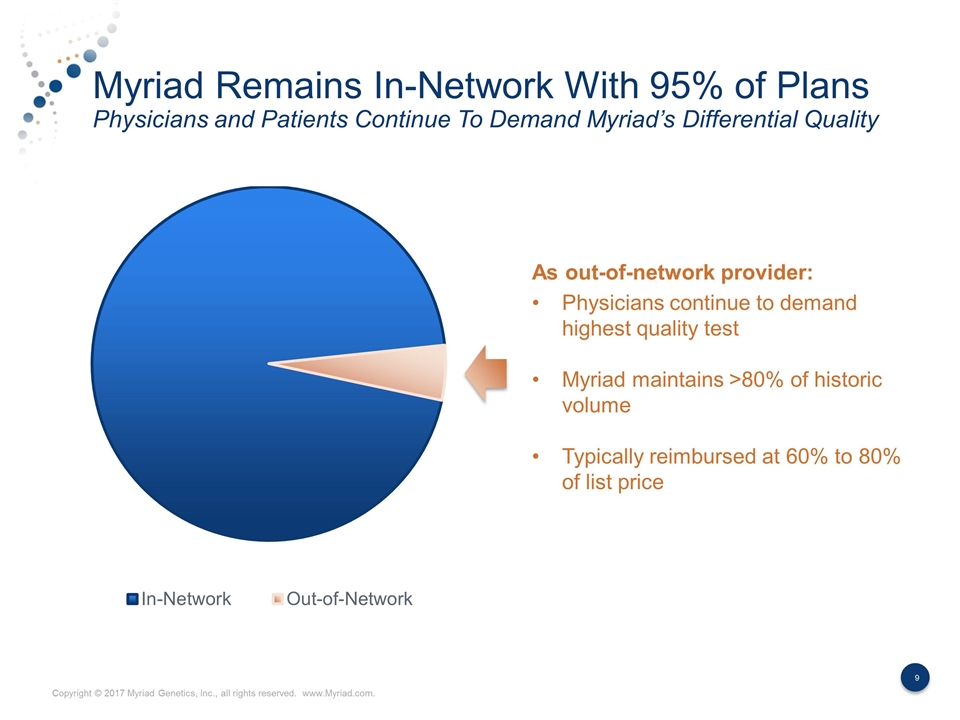
Myriad Remains In-Network With 95% of Plans Physicians and Patients Continue To Demand Myriad’s Differential Quality As out-of-network provider: Physicians continue to demand highest quality test Myriad maintains >80% of historic volume Typically reimbursed at 60% to 80% of list price
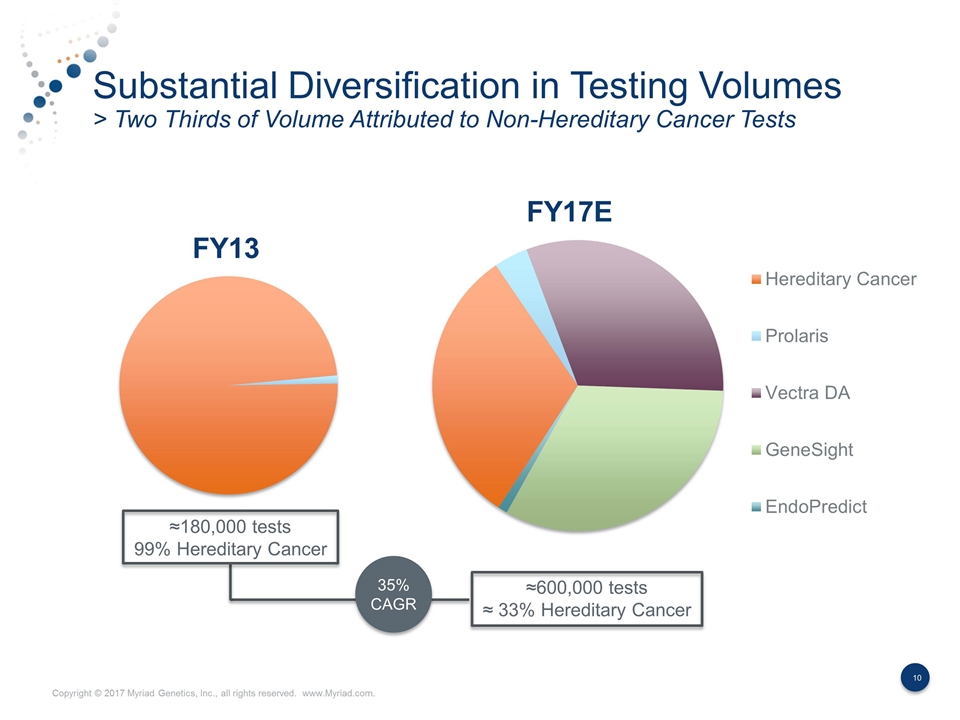
Substantial Diversification in Testing Volumes > Two Thirds of Volume Attributed to Non-Hereditary Cancer Tests 35% CAGR ≈180,000 tests 99% Hereditary Cancer ≈600,000 tests ≈ 33% Hereditary Cancer
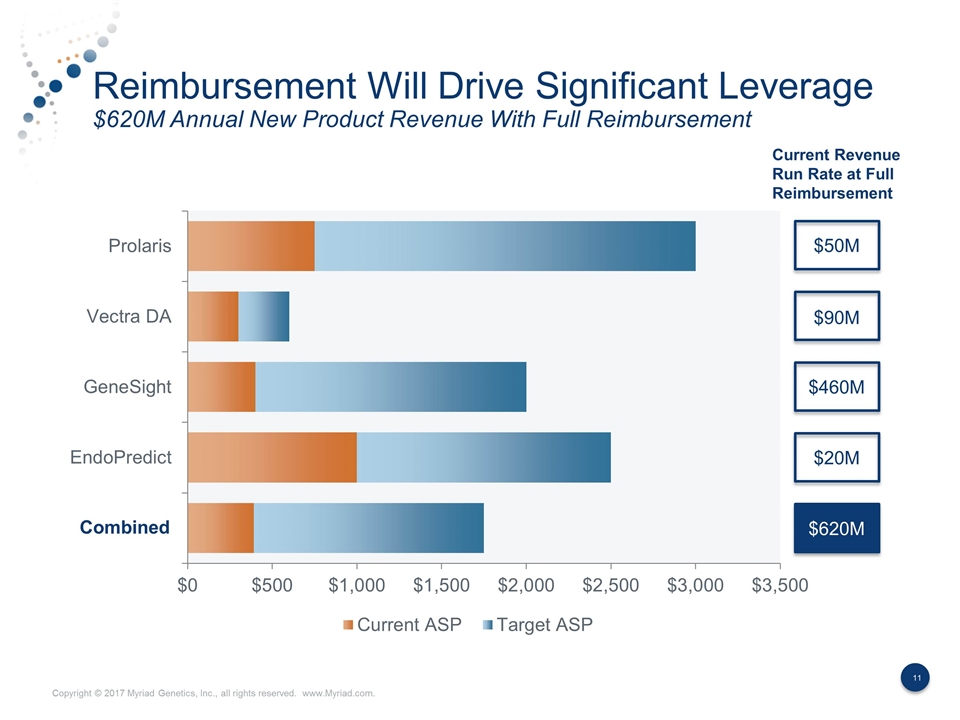
Reimbursement Will Drive Significant Leverage $620M Annual New Product Revenue With Full Reimbursement Current Revenue Run Rate at Full Reimbursement $50M $90M $460M $20M $620M Combined
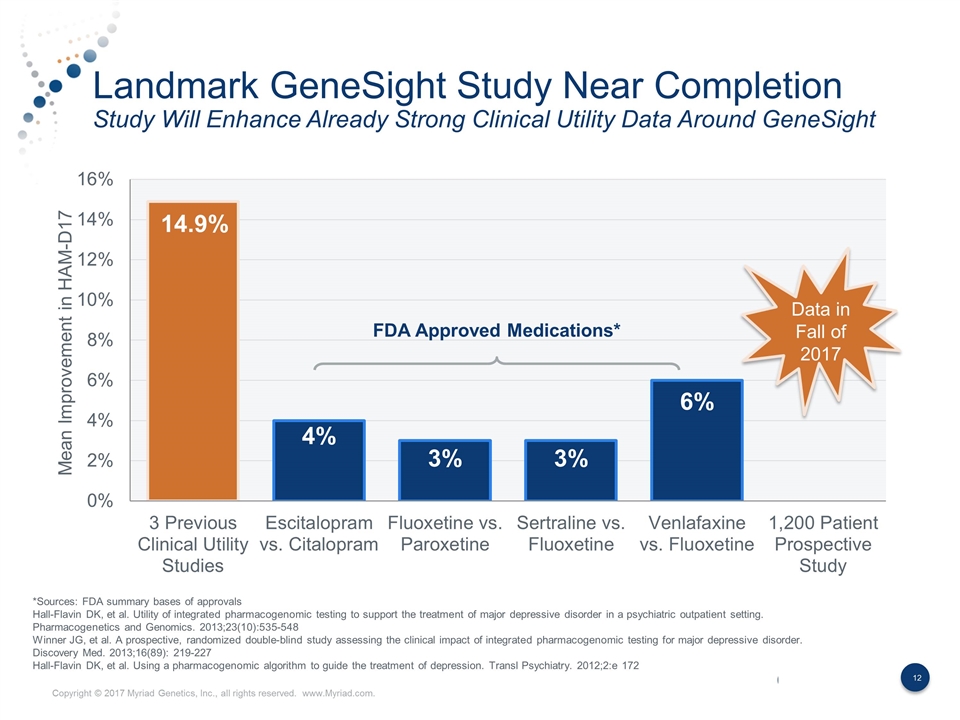
Landmark GeneSight Study Near Completion Study Will Enhance Already Strong Clinical Utility Data Around GeneSight Mean Improvement in HAM-D17 FDA Approved Medications* Data in Fall of 2017 *Sources: FDA summary bases of approvals Hall-Flavin DK, et al. Utility of integrated pharmacogenomic testing to support the treatment of major depressive disorder in a psychiatric outpatient setting. Pharmacogenetics and Genomics. 2013;23(10):535-548 Winner JG, et al. A prospective, randomized double-blind study assessing the clinical impact of integrated pharmacogenomic testing for major depressive disorder. Discovery Med. 2013;16(89): 219-227 Hall-Flavin DK, et al. Using a pharmacogenomic algorithm to guide the treatment of depression. Transl Psychiatry. 2012;2:e 172
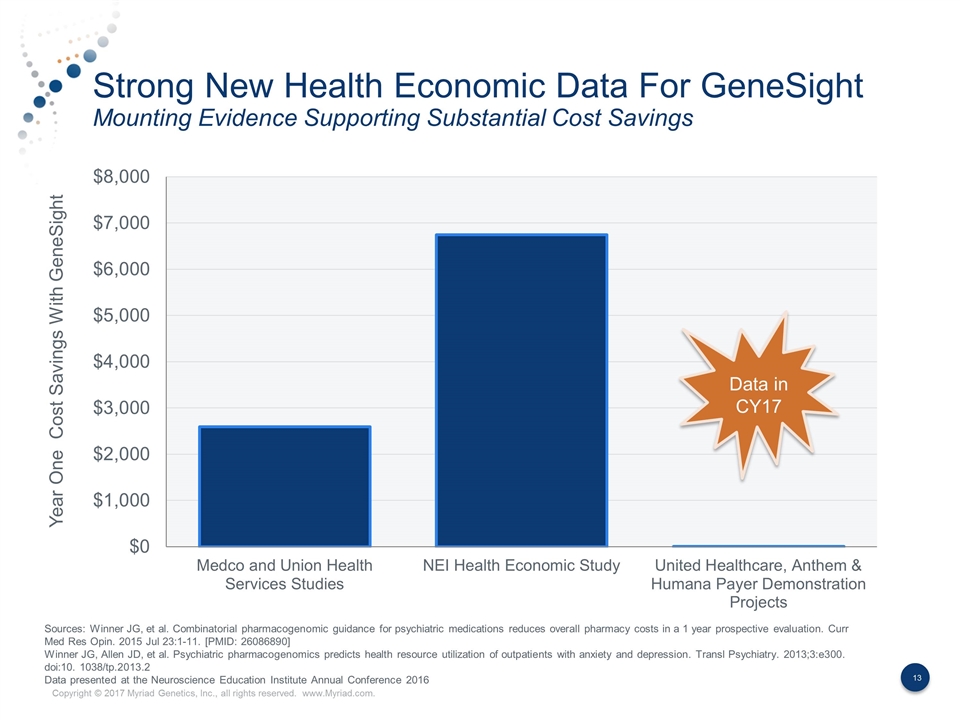
Strong New Health Economic Data For GeneSight Mounting Evidence Supporting Substantial Cost Savings Year One Cost Savings With GeneSight Data in CY17 Sources: Winner JG, et al. Combinatorial pharmacogenomic guidance for psychiatric medications reduces overall pharmacy costs in a 1 year prospective evaluation. Curr Med Res Opin. 2015 Jul 23:1-11. [PMID: 26086890] Winner JG, Allen JD, et al. Psychiatric pharmacogenomics predicts health resource utilization of outpatients with anxiety and depression. Transl Psychiatry. 2013;3:e300. doi:10. 1038/tp.2013.2 Data presented at the Neuroscience Education Institute Annual Conference 2016
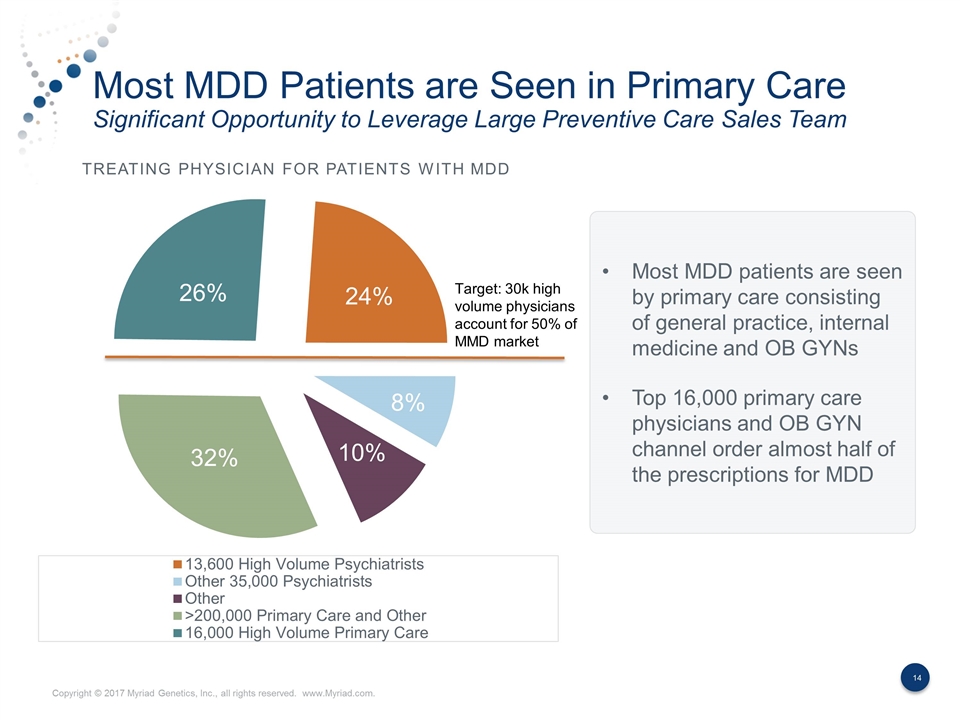
Most MDD Patients are Seen in Primary Care Significant Opportunity to Leverage Large Preventive Care Sales Team Treating Physician for Patients With MDD Most MDD patients are seen by primary care consisting of general practice, internal medicine and OB GYNs Top 16,000 primary care physicians and OB GYN channel order almost half of the prescriptions for MDD
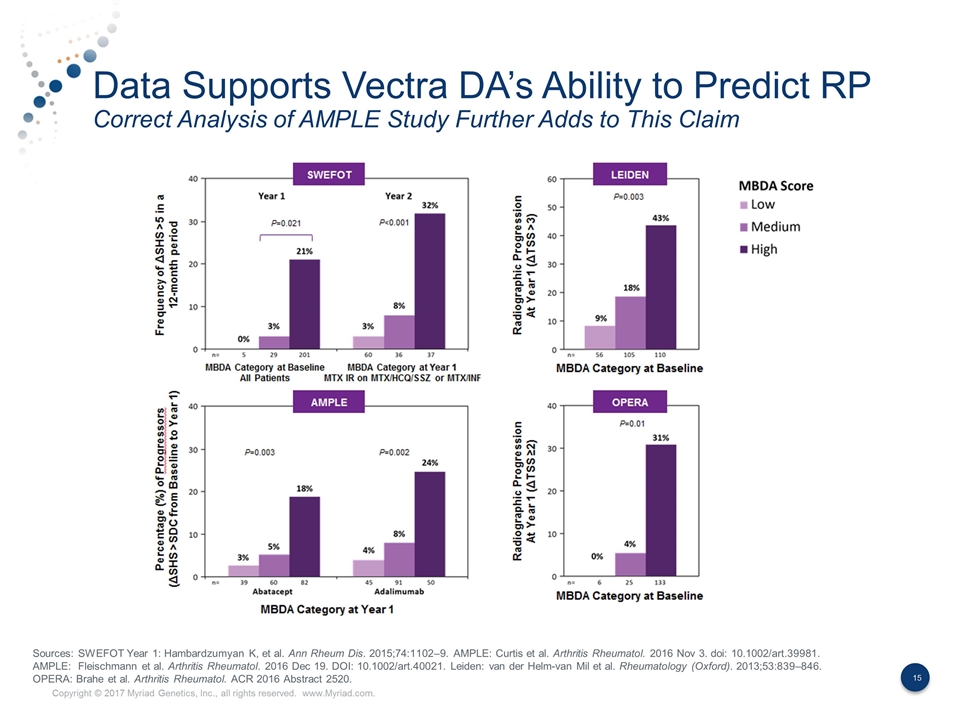
Data Supports Vectra DA’s Ability to Predict RP Correct Analysis of AMPLE Study Further Adds to This Claim Sources: SWEFOT Year 1: Hambardzumyan K, et al. Ann Rheum Dis. 2015;74:1102–9. AMPLE: Curtis et al. Arthritis Rheumatol. 2016 Nov 3. doi: 10.1002/art.39981. AMPLE: Fleischmann et al. Arthritis Rheumatol. 2016 Dec 19. DOI: 10.1002/art.40021. Leiden: van der Helm-van Mil et al. Rheumatology (Oxford). 2013;53:839–846. OPERA: Brahe et al. Arthritis Rheumatol. ACR 2016 Abstract 2520.
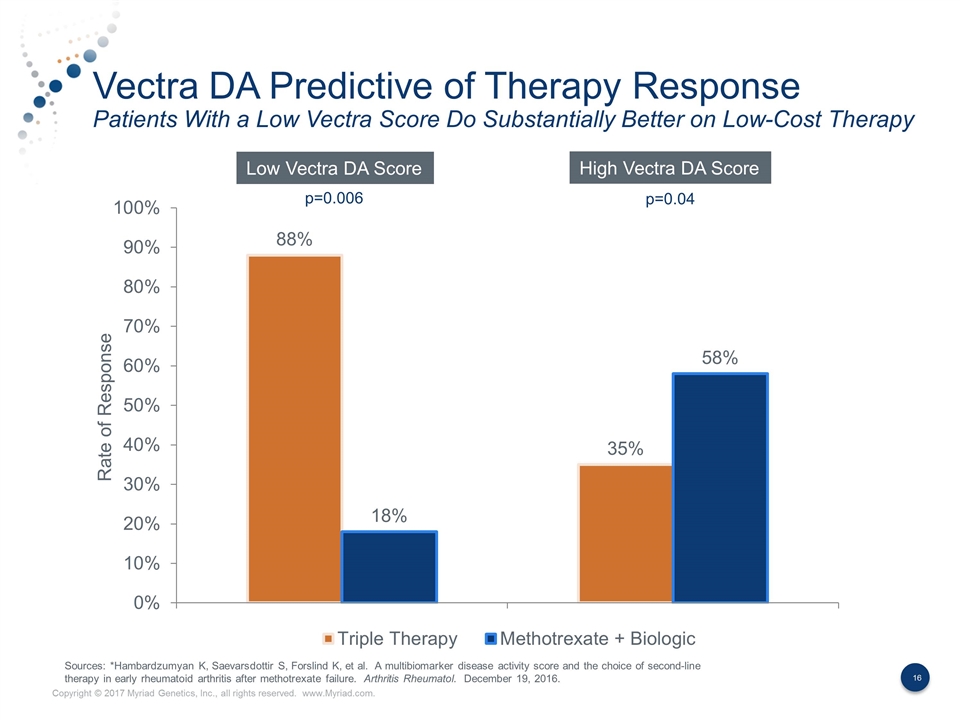
Vectra DA Predictive of Therapy Response Patients With a Low Vectra Score Do Substantially Better on Low-Cost Therapy Rate of Response Low Vectra DA Score High Vectra DA Score p=0.006 p=0.04 Sources: *Hambardzumyan K, Saevarsdottir S, Forslind K, et al. A multibiomarker disease activity score and the choice of second-line therapy in early rheumatoid arthritis after methotrexate failure. Arthritis Rheumatol. December 19, 2016.
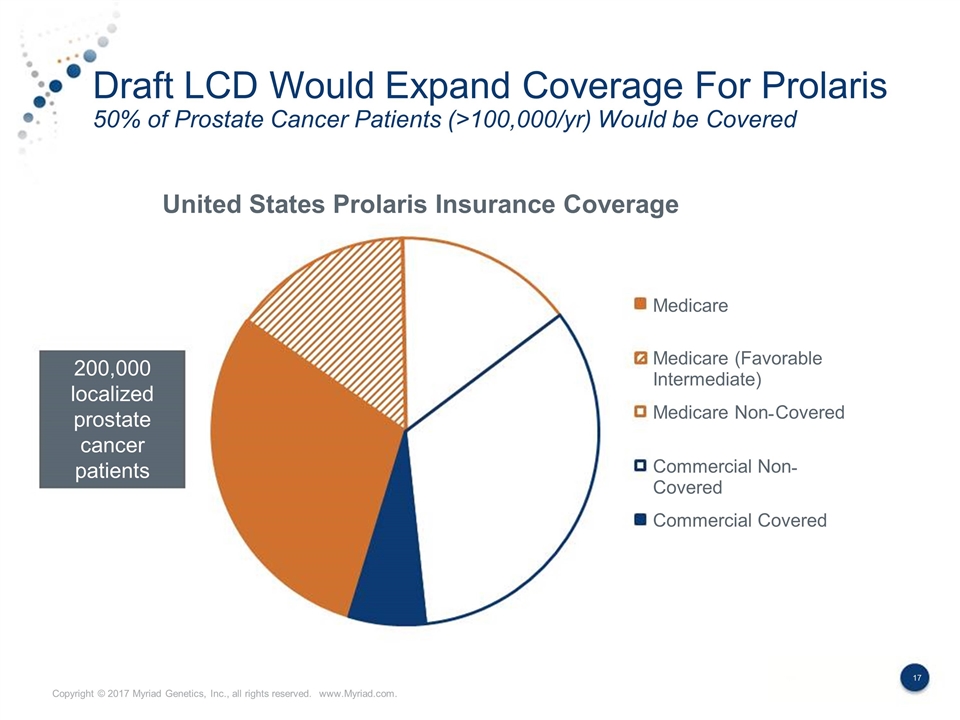
Draft LCD Would Expand Coverage For Prolaris 50% of Prostate Cancer Patients (>100,000/yr) Would be Covered 200,000 localized prostate cancer patients Medicare Medicare (Favorable Intermediate) Medicare Non - Covered Commercial Non - Covered Commercial Covered United States Prolaris Insurance Coverage Copyright © 2017 Myriad Genetics, Inc., all rights reserved. www.Myriad.com.
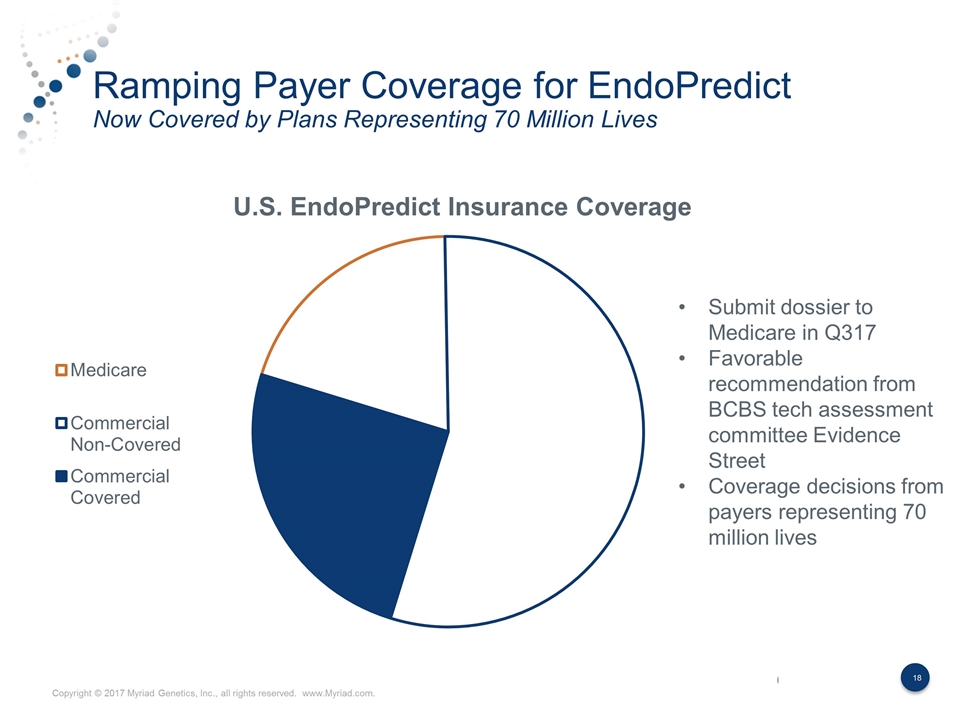
Ramping Payer Coverage for EndoPredict Now Covered by Plans Representing 70 Million Lives Commercial Covered Submit dossier to Medicare in Q317 Favorable recommendation from BCBS tech assessment committee Evidence Street Coverage decisions from payers representing 70 million lives
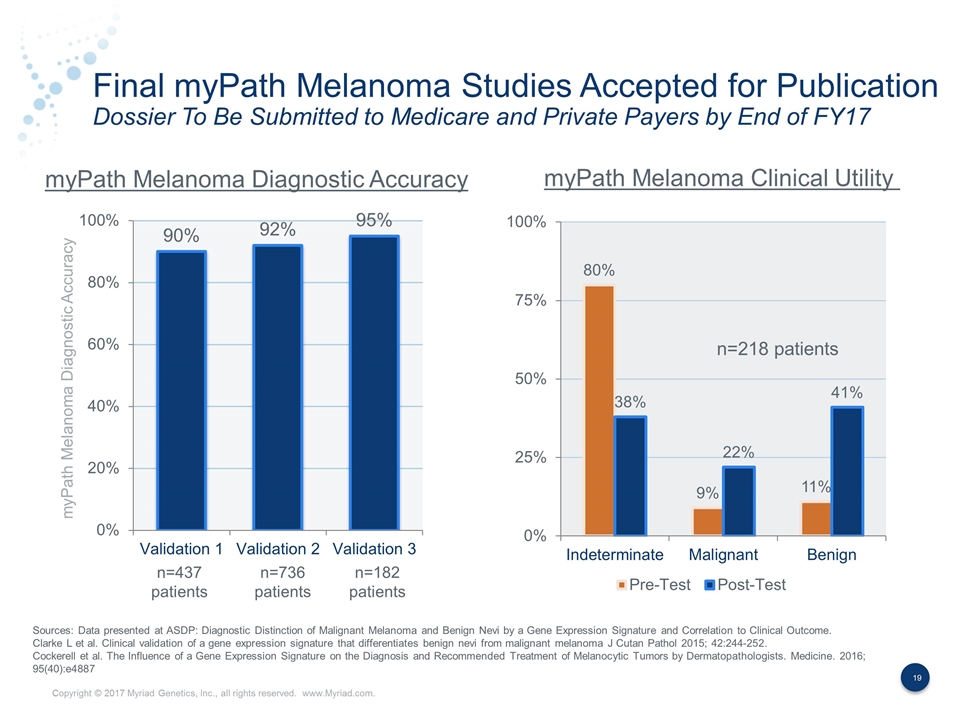
Final myPath Melanoma Studies Accepted for Publication Dossier To Be Submitted to Medicare and Private Payers by End of FY17 myPath Melanoma Diagnostic Accuracy myPath Melanoma Diagnostic Accuracy myPath Melanoma Clinical Utility n=437 patients n=736 patients n=218 patients n=182 patients Sources: Data presented at ASDP: Diagnostic Distinction of Malignant Melanoma and Benign Nevi by a Gene Expression Signature and Correlation to Clinical Outcome. Clarke L et al. Clinical validation of a gene expression signature that differentiates benign nevi from malignant melanoma J Cutan Pathol 2015; 42:244-252. Cockerell et al. The Influence of a Gene Expression Signature on the Diagnosis and Recommended Treatment of Melanocytic Tumors by Dermatopathologists. Medicine. 2016; 95(40):e4887
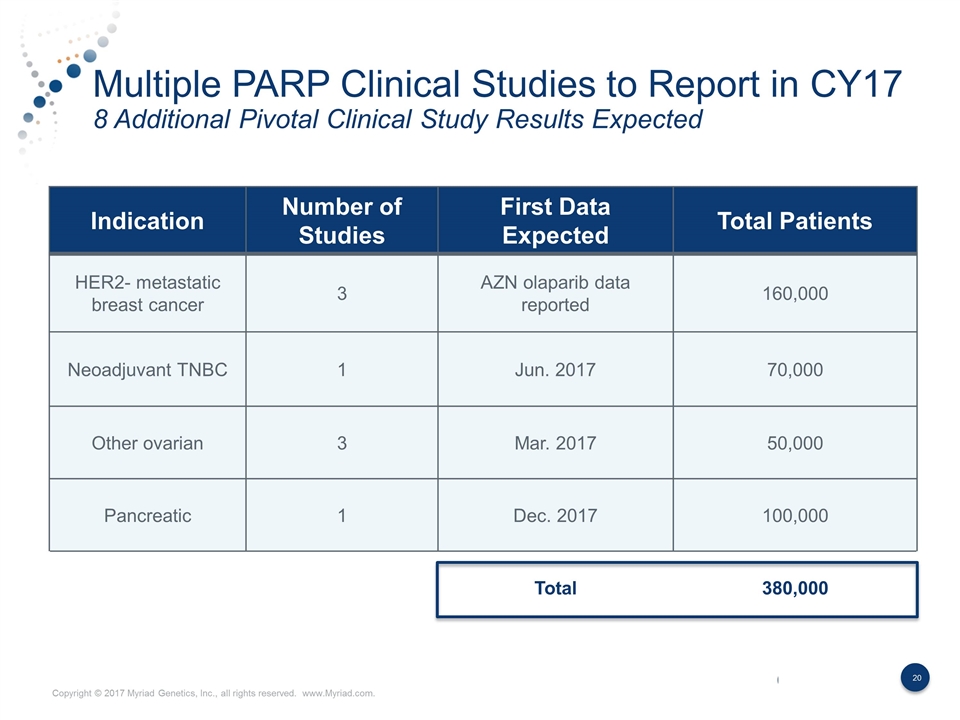
Multiple PARP Clinical Studies to Report in CY17 8 Additional Pivotal Clinical Study Results Expected Indication Number of Studies First Data Expected Total Patients HER2- metastatic breast cancer 3 AZN olaparib data reported 160,000 Neoadjuvant TNBC 1 Jun. 2017 70,000 Other ovarian 3 Mar. 2017 50,000 Pancreatic 1 Dec. 2017 100,000 Total 380,000
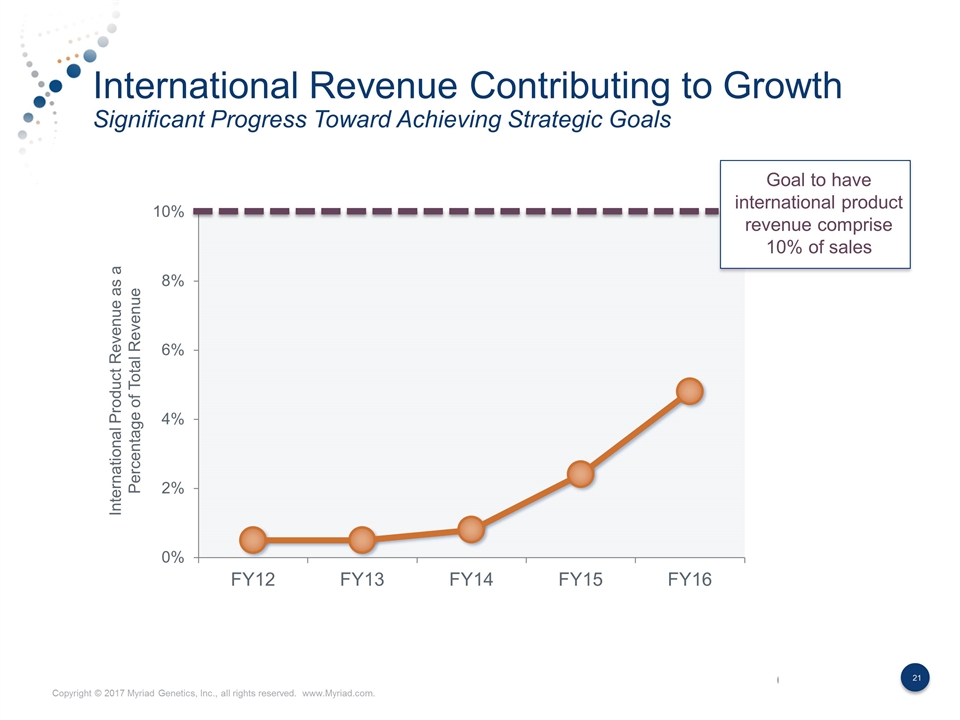
International Revenue Contributing to Growth Significant Progress Toward Achieving Strategic Goals International Product Revenue as a Percentage of Total Revenue Goal to have international product revenue comprise 10% of sales
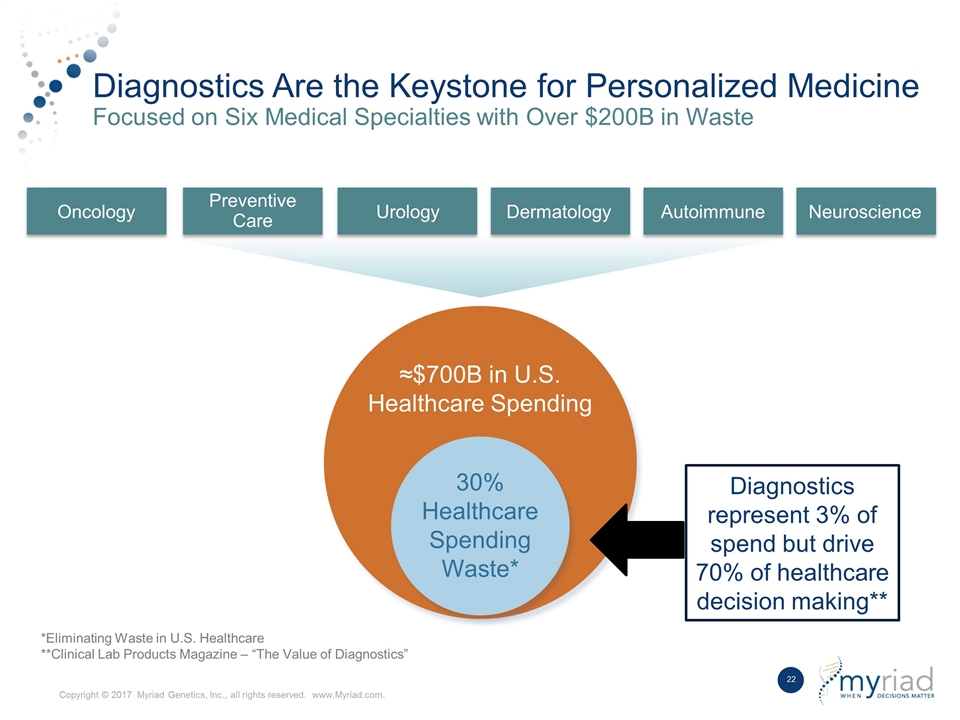
Diagnostics Are the Keystone for Personalized Medicine Focused on Six Medical Specialties with Over $200B in Waste ≈$700B in U.S. Healthcare Spending 30% Healthcare Spending Waste* Oncology Preventive Care Urology Dermatology Autoimmune Neuroscience Diagnostics represent 3% of spend but drive 70% of healthcare decision making** *Eliminating Waste in U.S. Healthcare **Clinical Lab Products Magazine – “The Value of Diagnostics” Copyright © 2017 Myriad Genetics, Inc., all rights reserved. www.Myriad.com.
