Attached files
| file | filename |
|---|---|
| EX-32.2 - EXHIBIT 32.2 - GENERAL DYNAMICS CORP | ex322-20161231.htm |
| EX-32.1 - EXHIBIT 32.1 - GENERAL DYNAMICS CORP | ex321-20161231.htm |
| EX-31.2 - EXHIBIT 31.2 - GENERAL DYNAMICS CORP | ex312-20161231.htm |
| EX-31.1 - EXHIBIT 31.1 - GENERAL DYNAMICS CORP | ex311-20161231.htm |
| EX-24 - EXHIBIT 24 - GENERAL DYNAMICS CORP | ex24-20161231.htm |
| EX-23 - EXHIBIT 23 - GENERAL DYNAMICS CORP | ex23-20161231.htm |
| EX-21 - EXHIBIT 21 - GENERAL DYNAMICS CORP | ex21-20161231.htm |
| EX-10.23 - EXHIBIT 10.23 - GENERAL DYNAMICS CORP | ex1023-20161231.htm |
| EX-10.20 - EXHIBIT 10.20 - GENERAL DYNAMICS CORP | ex1020-20161231.htm |
| EX-10.19 - EXHIBIT 10.19 - GENERAL DYNAMICS CORP | ex1019-20161231.htm |

UNITED STATES SECURITIES AND EXCHANGE COMMISSION
Washington, D.C. 20549
FORM 10-K
(Mark One)
[X] ANNUAL REPORT PURSUANT TO SECTION 13 OR 15(d) OF THE SECURITIES EXCHANGE ACT OF 1934
For the fiscal year ended December 31, 2016
OR
[ ] TRANSITION REPORT PURSUANT TO SECTION 13 OR 15(d) OF THE SECURITIES EXCHANGE ACT OF 1934
For the transition period from _______ to _______
Commission File Number 1-3671
GENERAL DYNAMICS CORPORATION
(Exact name of registrant as specified in its charter)
Delaware | 13-1673581 | |
State or other jurisdiction of incorporation or organization | IRS Employer Identification No. | |
2941 Fairview Park Drive, Suite 100 Falls Church, Virginia | 22042-4513 | |
Address of principal executive offices | Zip code | |
Registrant’s telephone number, including area code:
(703) 876-3000 |
Securities registered pursuant to Section 12(b) of the Act:
Title of each class | Name of exchange on which registered | |
Common stock, par value $1 per share | New York Stock Exchange | |
Securities registered pursuant to Section 12(g) of the Act:
None |
Indicate by check mark if the registrant is a well-known seasoned issuer, as defined in Rule 405 of the Securities Act. Yes ü No ___
Indicate by check mark if the registrant is not required to file reports pursuant to Section 13 or Section 15(d) of the Act. Yes ___ No ü
Indicate by check mark whether the registrant (1) has filed all reports required to be filed by Section 13 or 15(d) of the Securities Exchange Act of 1934 during the preceding 12 months (or for such shorter period that the registrant was required to file such reports), and (2) has been subject to such filing requirements for the past 90 days. Yes ü No ___
Indicate by check mark whether the registrant has submitted electronically and posted on its corporate Web site, if any, every Interactive Data File required to be submitted and posted pursuant to Rule 405 of Regulation S-T (§232.405 of this chapter) during the preceding 12 months (or for such shorter period that the registrant was required to submit and post such files). Yes ü No ___
Indicate by check mark if disclosure of delinquent filers pursuant to Item 405 of Regulation S-K is not contained herein, and will not be contained, to the best of registrant’s knowledge, in definitive proxy or information statements incorporated by reference in Part III of this Form 10-K or any amendment of this Form 10-K. ü
Indicate by check mark whether the registrant is a large accelerated filer, an accelerated filer, a non-accelerated filer, or a smaller reporting company. See the definitions of “large accelerated filer,” “accelerated filer” and “smaller reporting company” in Rule 12b-2 of the Exchange Act.
Large Accelerated Filer ü Accelerated Filer __ Non-Accelerated Filer __ Smaller Reporting Company ___
Indicate by check mark whether the registrant is a shell company (as defined in Rule 12b-2 of the Exchange Act). Yes No ü
The aggregate market value of the voting common equity held by non-affiliates of the registrant was $38,197,668,440 as of July 3, 2016 (based on the closing price of the shares on the New York Stock Exchange).
302,742,234 shares of the registrant’s common stock, $1 par value per share, were outstanding on January 29, 2017.
DOCUMENTS INCORPORATED BY REFERENCE:
Part III incorporates by reference information from certain portions of the registrant’s definitive proxy statement for the 2017 annual meeting of shareholders to be filed with the Securities and Exchange Commission within 120 days after the close of the fiscal year.
INDEX
PART I | PAGE | |
Item 1. | ||
Item 1A. | ||
Item 1B. | ||
Item 2. | ||
Item 3. | ||
Item 4. | ||
PART II | ||
Item 5. | ||
Item 6. | ||
Item 7. | ||
Item 7A. | ||
Item 8. | ||
Item 9. | ||
Item 9A. | ||
Item 9B. | ||
PART III | ||
Item 10. | ||
Item 11. | ||
Item 12. | ||
Item 13. | ||
Item 14. | Principal Accountant Fees and Services | |
PART IV | ||
Item 15. | ||
2
PART I
ITEM 1. BUSINESS
(Dollars in millions, except per-share amounts or unless otherwise noted)
BUSINESS OVERVIEW
General Dynamics is a global aerospace and defense company that offers a broad portfolio of products and services in business aviation; combat vehicles, weapons systems and munitions; information technology (IT) services and C4ISR (command, control, communications, computers, intelligence, surveillance and reconnaissance) solutions; and shipbuilding and ship repair.
Incorporated in Delaware in 1952, General Dynamics grew organically and through acquisitions until the early 1990s when we sold nearly all of our businesses. In the mid-1990s, we began expanding again by acquiring combat vehicle-related businesses, IT product and service companies, additional shipyards and Gulfstream Aerospace Corporation. We continued to grow organically and acquired companies throughout the portfolio. Today, we are focused on delivering superior products and services to our customers, operational excellence, generating cash and driving return on invested capital.
We operate through four business groups and each group has several business units. Each business has responsibility for its strategy and operational performance, providing the flexibility it needs to stay close to customers, perform on programs and remain agile. Our corporate headquarters is responsible for setting the overall direction of the company, the allocation of capital and promoting a culture of ethics and integrity that defines how we operate. Our management team delivers on our commitments to shareholders through disciplined backlog execution, efficient cash-flow conversion and prudent capital deployment. We manage costs, undertake continuous improvement initiatives and collaborate across our businesses to achieve our goals of maximizing earnings and cash and creating value for our shareholders.
Following is additional information on each of our business groups: Aerospace, Combat Systems, Information Systems and Technology, and Marine Systems. For selected financial information, see Note Q to the Consolidated Financial Statements in Item 8.
AEROSPACE
Our Aerospace group is at the forefront of the business-jet industry. We deliver a family of Gulfstream aircraft, provide aircraft services and perform completions for aircraft produced by other original equipment manufacturers (OEMs). The Aerospace group is known for:
• | superior aircraft design, quality, performance, safety and reliability; |
• | technologically advanced cockpit and cabin systems; and |
• | industry-leading product service and support. |
Gulfstream Aerospace Corporation designs, develops, manufactures, services and supports the world’s most technologically advanced business-jet aircraft. Our product line includes aircraft across a spectrum of price and performance options in the large- and mid-cabin business-jet market. The varying ranges, speeds and cabin dimensions of these aircraft are well-suited for the needs of a diverse, global customer base.
The G650 family of business jets exemplifies our commitment to performance, efficiency and innovation. The G650 can travel 7,000 nautical miles at Mach 0.85, and the G650ER extends that range to 7,500 nautical
3
miles at Mach 0.85, flying farther at faster speeds than any other business jet on the market. The G650 and G650ER have claimed more than 60 world speed records. Gulfstream received the 2014 National Aeronautic Association’s Robert J. Collier Trophy for the development of the G650, an annual award recognizing the greatest achievement in U.S. aeronautics or astronautics with respect to improving performance, efficiency and safety. In 2016, we delivered our 200th G650 jet and demand remains strong, with a backlog that extends into 2018.
We continue to invest in Gulfstream to introduce new products and first-to-market enhancements that broaden customer choice, improve aircraft performance and set new standards for customer safety, comfort and in-flight productivity. In 2014, we introduced two new large-cabin business jets, the G500 and G600. These clean-sheet next-generation business jets offer an optimized combination of comfort, speed and range, along with an advanced flight deck. At Mach 0.85, the G500 can fly 5,000 nautical miles, and the G600 can fly 6,200 nautical miles. The G500 completed its first flight in 2015, and now there are five aircraft in the flight-test program that have completed more than 2,000 test hours. The aircraft has reached speeds up to Mach 0.995 and an altitude over 50,000 feet. The G600 achieved its first flight in 2016. The G500 and G600 are expected to enter service in 2017 and 2018, respectively, each ahead of schedule, following Federal Aviation Administration (FAA) certification.
Our product enhancement and development efforts include initiatives in advanced avionics, composites, renewable fuels, flight-control systems, acoustics, cabin technologies and vision systems. A recent example is the Symmetry Flight Deck introduced with the G500 and G600, which includes 10 touchscreens and active control sidesticks. The touchscreens improve how pilots interact with onboard systems and the sidesticks are digitally linked to allow both pilots to see and feel each other’s control inputs, enhancing situational awareness and further improving safety of the flight.
Gulfstream designs, develops and manufactures aircraft in Savannah, Georgia, including manufacturing all large-cabin models. The mid-cabin models are constructed by a non-U.S. partner. All models are outfitted in the group’s U.S. facilities. In support of Gulfstream’s growing aircraft portfolio and customer base, we have invested in multi-year facilities projects at our Savannah campus, which are scheduled to continue through 2017. This expansion consists of constructing new facilities, including the purpose-built G500 and G600 manufacturing facilities, and renovating existing infrastructure. This effort follows earlier projects, including a purpose-built G650 manufacturing facility, increased aircraft service capacity, a new product support distribution center and dedicated research and development centers.
The group offers extensive support for the more than 2,500 Gulfstream aircraft in service with the largest factory-owned service network in the business-aviation industry, including professionals located around the globe. The service network for Gulfstream aircraft continues to evolve to address the demands of our growing international customer base. We operate 11 company-owned service centers worldwide and have more than 20 factory-authorized service centers and authorized warranty facilities on six continents. We also operate a 24-hour-per-day/365-day-per-year Customer Contact Center and offer on-call Gulfstream aircraft technicians ready to deploy for customer-service requirements.
Jet Aviation expands our Aerospace portfolio as a global leader in business aviation services, providing comprehensive services and a network of locations for aircraft owners and operators for 50 years. With more than 25 airport facilities throughout Europe, the Middle East, Asia, North America and the Caribbean, our service offerings include maintenance, repair, completions, aircraft management, charter, fixed-base operations (FBO) and staffing services.
In response to customer demand, we are growing this service network. We are opening a new maintenance facility in Macau, we are building a third hangar at our maintenance and FBO facility in Singapore, and we are increasing our Bedford, Massachusetts, footprint to include a 13,000 square-foot FBO, a 40,000 square-
4
foot hangar and increased ramp capacity. In 2016, we established a substantial presence on the West Coast with the acquisition of Burbank, California-based Avjet, which offers aircraft management and charter operations, and the opening of our eighth U.S. FBO facility at Van Nuys Airport in Los Angeles, California, from which we plan to build a larger FBO terminal and two hangars.
In addition to these capabilities, Jet Aviation offers custom complex completions for business-jet aircraft and narrow- and wide-body aircraft completions. To support demand for corporate and VIP aircraft interiors, we recently expanded production capacity at our Basel, Switzerland, facility.
As a market leader in the business-aviation industry, the Aerospace group is focused on developing innovative first-to-market technologies and products; providing exemplary and timely service to customers globally; and driving efficiencies and reducing costs in the aircraft production, outfitting and service processes.
Revenue for the Aerospace group was 27 percent of our consolidated revenue in 2016 and 28 percent in 2015 and 2014. Revenue by major products and services was as follows:
Year Ended December 31 | 2016 | 2015 | 2014 | ||||||||
Aircraft manufacturing, outfitting and completions | $ | 6,608 | $ | 7,156 | $ | 6,983 | |||||
Aircraft services | 1,638 | 1,584 | 1,599 | ||||||||
Pre-owned aircraft | 116 | 111 | 67 | ||||||||
Total Aerospace | $ | 8,362 | $ | 8,851 | $ | 8,649 | |||||
COMBAT SYSTEMS
Our Combat Systems group offers combat vehicles, weapons systems and munitions for the U.S. government and its allies around the world. We take a disciplined systems-engineering approach to deliver market-leading design, development, production, modernization and sustainment services. With extensive, diverse and proven product lines, we have the agility to deliver tailored solutions to meet a wide array of customer mission needs. Comprised of three business units, European Land Systems, Land Systems and Ordnance and Tactical Systems, the group’s product lines include:
• | wheeled combat and tactical vehicles; |
• | main battle tanks and tracked combat vehicles; |
• | weapons systems, armament and munitions; and |
• | maintenance and logistics support and sustainment services. |
Wheeled combat and tactical vehicles: The group provides a full spectrum of vehicle offerings to a global customer base. The eight-wheeled, medium-weight Stryker combat vehicle has proven itself as one of the most versatile vehicles in the U.S. Army’s fleet, combining mobility and survivability into a deployable and responsive combat support vehicle. There are 11 Stryker variants, with 85 percent commonality across the fleet. We are working with the Army to convert all nine of its Stryker Brigade Combat Teams to the double-V-hulled configuration, which significantly improves protection for soldiers. We are also modernizing the Stryker vehicle by upgrading the power train, suspension and network capabilities and implementing our patented double-V-hull survivability solution. The first of these Stryker vehicles are scheduled to be delivered in mid-2017.
In response to a dynamic threat environment, the Army identified a need to increase the lethality of Strykers. Through innovative research and development (R&D) and an accelerated acquisition effort, we are adding a 30-millimeter cannon to 83 Stryker Infantry Carrier Vehicles. We delivered the first prototype
5
to the Army in 2016, 15 months after the initial contract award, and the vehicles will be fielded to the Germany-based 2nd Cavalry Regiment in 2018.
The group has a market-leading position in light armored vehicles (LAVs) with more than 10,000 vehicles delivered around the world. We offer advanced technologies combined with combat-proven survivability. We are upgrading the Canadian Army’s fleet of LAVs to increase mobility, survivability and lethality, as well as enhancing the surveillance suite. We currently have a $10 billion contract to provide wheeled armored vehicles along with associated logistics support to a Middle Eastern customer into 2028.
We have delivered numerous high-mobility, versatile Pandur and Piranha armored vehicles. The Pandur family of vehicles serves as a common platform for various armament and equipment configurations and the Piranha is a multi-role vehicle well-suited for a variety of combat operations. We are delivering more than 300 Piranha vehicles in six variants to the Danish Ministry of Defence for its new armored personnel carrier program, as well as sustaining the vehicles in the future. The Spanish Army selected the Piranha as its 8x8 armored fighting vehicle and we are now performing extensive technological trials. In addition, we are producing Piranha armored vehicles equipped with mortar systems for the Swiss government.
Tactical vehicles offered by the group include the lightweight Flyer family of vehicles, a modular vehicle built for speed and mobility that allows access to previously unreachable terrain in demanding environments. We are delivering these vehicles to the U.S. Special Operations Command for the Internally Transportable Vehicle (ITV) and Ground Mobility Vehicle (GMV) programs. Outside the United States, the Duro and Eagle tactical vehicle families offer a range of options in the 6- to 15-ton weight class. In 2016, we received a contract from the Swiss government to upgrade Duro tactical vehicles through 2022.
Tanks and tracked combat vehicles: Combat Systems’ powerful tracked vehicles provide key combat capabilities to customers around the world. The Abrams main battle tank offers a proven, decisive edge in combat. We are maximizing the effectiveness and lethality of the U.S. Army’s M1A2 Abrams tank fleet with the System Enhancement Package (SEP) V3, providing a digital platform that includes an upgraded command-and-control system, new power generation and distribution systems, second-generation thermal sights and improved armor. Internationally, the group provides Abrams tanks to several U.S. allies. In 2016, the group received an award to deliver Abrams tanks to Saudi Arabia, and deliveries and modernization efforts continued in support of Kuwait, Egypt and Morocco.
The ASCOD is a highly versatile tracked combat vehicle with multiple versions, including the Spanish Pizarro and the Austrian Ulan. Currently the group is producing the British Army’s AJAX armoured fighting vehicle, a next-generation version of the ASCOD, and is scheduled to deliver the first AJAX platform in 2017. With six variants, AJAX offers advanced electronic architecture and proven technology for an unparalleled balance of protection, survivability and reliability for a vehicle in its weight class. In addition to production, the group will provide in-service support for the AJAX vehicle fleet through 2024.
With our large installed base of wheeled and tracked vehicles around the world and the expertise gained from our innovative research, engineering and production programs, we are well-positioned for vehicle modernization programs, support and sustainment services and future development programs.
Weapons systems, armament and munitions: Complementing these military-vehicle offerings, the group designs, develops and produces a comprehensive array of sophisticated weapons systems. For ground forces, we manufacture M2/M2-A1 heavy machine guns and MK19/MK47 grenade launchers. The group also produces legacy and next-generation weapons systems for shipboard applications. For airborne platforms, we produce weapons for fighter aircraft. For example, we provide high-speed Gatling guns for all U.S. fixed-wing military aircraft, including the Joint Strike Fighter.
6
Our munitions portfolio covers the full breadth of naval, air and ground forces applications across all calibers and weapons platforms for the U.S. government and its allies. In North America, the group maintains a market-leading position in the supply of Hydra-70 rockets, large-caliber tank ammunition, medium-caliber ammunition, mortar and artillery projectiles, tactical missile aerostructures, and high-performance warheads; military propellants; and conventional bombs and bomb cases.
The Combat Systems group emphasizes operational execution and continuous process improvements to enhance our productivity. In an environment of uncertain threats and evolving customer needs, the group is focused on innovation, affordability and speed-to-market to deliver increased performance and survivable, mission-effective products.
Revenue for the Combat Systems group was 18 percent of our consolidated revenue in each of the past three years. Revenue by major products and services was as follows:
Year Ended December 31 | 2016 | 2015 | 2014 | ||||||||
Wheeled combat vehicles | $ | 2,446 | $ | 2,599 | $ | 2,852 | |||||
Weapons systems and munitions | 1,533 | 1,496 | 1,635 | ||||||||
Tanks and tracked vehicles | 987 | 816 | 526 | ||||||||
Engineering and other services | 636 | 729 | 719 | ||||||||
Total Combat Systems | $ | 5,602 | $ | 5,640 | $ | 5,732 | |||||
INFORMATION SYSTEMS AND TECHNOLOGY
Our Information Systems and Technology group provides technologies, products and services in support of hundreds of programs for a wide range of military, federal/civilian, state, local and commercial customers. The group’s market leadership results from decades of domain expertise, incumbency on high-priority programs and continuous innovation to meet the ever-changing information-systems and mission support needs of our customers. The group’s diverse portfolio includes:
• | IT solutions and mission support services; and |
• | mobile communication, computers and command-and-control mission systems, and intelligence, surveillance and reconnaissance (ISR) solutions. |
IT solutions and mission support services: As a trusted systems integrator for more than 50 years, we design, build and operate large-scale, secure IT networks and systems and provide a broad range of professional and technical services.
The group is at the forefront of cloud and virtualization technologies and services, offering market-leading cloud-based solutions that meet multiple federal government and military compliance requirements. We developed and deployed the largest virtual desktop environment for the intelligence community, supporting over 8,000 users. We are currently implementing the DoD’s largest enterprise-wide email infrastructure.
We support the full enterprise IT lifecycle from designing and integrating, operating and maintaining to modernizing complex data, voice and multimedia networks. Working closely with our customers, we ensure their network infrastructures are secure, efficient, scalable and cost-effective. We have extensive experience consolidating, building and operating data centers. The group’s expertise extends beyond federal government and military customers. We engineer, design and install networks for commercial fiber-to-the-home providers and wireless carriers, and we are delivering Next Generation 911 emergency response systems to state and local governments.
7
Our Information Technology business is a leading provider in the healthcare IT market. Our offerings include cyber security services, big data analytics and fraud prevention and detection software for public and commercial health systems. We provide a broad suite of IT services and solutions for the Centers for Medicare & Medicaid Services, including operating a network of customer contact centers across the United States.
The group’s technical support personnel and domain specialists help customers meet critical planning, staffing, technology and operational needs. For example, in 2016 we were awarded a contract by the U.S. Special Operations Command for professional support services. We also provide leading-edge training technologies for military operations, range support, simulation and professional development. We deliver education curricula and training throughout the Navy and live, virtual, constructive and gaming capabilities to more than half of the Army’s Mission Training Complexes. In addition, we provide specialized security training to the U.S. Department of Homeland Security (DHS) to enhance civil aviation security.
Mobile communication, command-and-control mission systems and ISR solutions: We design, build, integrate, deploy and support communications, command-and-control and computer mission systems; imagery, signals- and multi-intelligence systems; and cyber security systems for customers in the U.S. defense, intelligence and homeland security communities, as well as U.S. allies.
The group is a leading manufacturer and integrator of secure communications systems, including fixed and mobile ground, radio and satellite systems and antenna technologies. As the prime contractor on the Common Hardware Systems-4 (CHS-4) contract, we provide the Army with next-generation computing and communications equipment. We are also the prime contractor for Warfighter Information Network-Tactical (WIN-T), the Army’s mobile communications network delivering voice and data communications to soldiers anywhere on the battlefield. WIN-T Increment 2 entered full rate production in 2015 and has been fielded to seven division headquarters and 14 brigade combat teams. We continue to evolve WIN-T and in 2016 we introduced new capabilities that greatly reduce its size and maintenance and logistics costs.
With a 50-year legacy in RF communications and networks, the group offers a range of radio products and systems for military, government and commercial customers, as well as long-term evolution (LTE) broadband communications networks for first responders. Our AN/USC-61 (C) Digital Modular Radio (DMR) is the first software-defined radio to become a communications system standard for the U.S. military. In 2016, we were awarded a contract by the Navy to further improve high-frequency communications on the DMR. We have delivered more than 5,000 AN/PRC-155 Manpack radios to the Army, the only fielded two-channel radios to successfully communicate using the Mobile User Objective System (MUOS) communications network. The group also delivered the 5,000th CM-300/350 V2 digital radio to the FAA in 2016, used by air traffic control centers, commercial airports, military air stations and range installations.
The Information Systems and Technology group provides many of these capabilities to non-U.S. agencies and commercial customers. In Canada, our public safety-focused communication system, known as the SHIELD Ecosystem, allows first responders to gather and exchange information quickly using digital applications on secure systems and provides the availability and location of in-field personnel at all times. We have also developed, deployed and continue to modernize and support the Canadian Army’s fully integrated, secure combat voice and data network. We leveraged this experience to deliver the U.K. Ministry of Defence’s Bowman tactical communication system, for which we currently provide ongoing support and capability upgrades.
In command-and-control systems, we have a 50-year legacy of providing advanced fire-control systems for Navy submarine programs, and we are developing and integrating commercial off-the-shelf software and hardware upgrades to improve the tactical control capabilities for several submarine classes. The group’s combat and seaframe control systems serve as the technology backbone for the Navy’s Independence-variant
8
Littoral Combat Ship (LCS) and the Expeditionary Fast Transport (EPF). To extend these offerings, we acquired in 2016 a manufacturer of unmanned undersea vehicles (UUVs) for the U.S. military and commercial customers. The UUVs offer a range of systems and configurations including more than 70 different sensors on 80 vehicles that can operate in the open ocean and constrained waterways.
We also deliver high-assurance mission and display systems, signal and sensor processing and command-and-control solutions for airborne platforms. Our aircraft mission computers are on the Navy’s F/A-18 Super Hornet strike fighter and the Marine Corps’ AV-8B Harrier II aircraft, giving pilots advanced situational awareness and combat systems control. The P-3 Orion and other maritime patrol aircraft use our digital stores management system.
The Information Systems and Technology group provides ISR solutions for classified programs. Our expertise includes multi-intelligence ground systems and large-scale, high-performance data and signal processing. We deliver high-reliability, long-life sensors and payloads designed to perform in the most extreme environments, including undersea sensor and power systems and space payloads. In 2016, we received awards for several digital space payloads.
Cyber security solutions are embedded throughout the group’s IT and systems engineering programs. We deliver comprehensive cyber security-related products and services to help customers defend and protect their networks from the persistent and growing cyber threat. For example, we continue to evolve our TACLANE family of network encryptors, the most widely-deployed NSA-certified Type 1 encryption device, and our NSA-certified ProtecD@R family of data-at-rest encryptors protect stored data on computers, tactical platforms, sensors and servers. We deliver technologies that provide access to information at various security levels, accommodating the increased demand for cloud computing and mobility. We also offer extensive cyber services to help defend mission-critical national and large-enterprise tactical networks.
The Information Systems and Technology group’s market is diverse and dynamic. We are focused on maintaining a market-leading position by developing innovative solutions to meet customer requirements and optimizing the performance of the business to ensure cost competitiveness. The group is well-positioned to continue meeting the needs of our broad customer base.
Revenue for the Information Systems and Technology group was 29 percent of our consolidated revenue in 2016 and 2015 and 30 percent in 2014. Revenue by major products and services was as follows:
Year Ended December 31 | 2016 | 2015 | 2014 | ||||||||
IT services | $ | 4,445 | $ | 4,505 | $ | 4,660 | |||||
C4ISR solutions | 4,742 | 4,460 | 4,499 | ||||||||
Total Information Systems and Technology | $ | 9,187 | $ | 8,965 | $ | 9,159 | |||||
MARINE SYSTEMS
Our Marine Systems group is a market-leading designer and builder of nuclear-powered submarines, surface combatants and auxiliary and combat-logistics ships for the U.S. Navy and Jones Act ships for commercial customers. With shipyards located on both U.S. coasts, we provide engineering, construction and assembly work, as well as maintenance and modernization support. The group’s portfolio of platforms and capabilities includes:
• | nuclear-powered submarines; |
• | surface combatants; |
• | auxiliary and combat-logistics ships; |
• | commercial product carriers and containerships; |
9
• | design and engineering support services; and |
• | maintenance, modernization and lifecycle support services. |
We have a long history as one of the primary shipbuilders for the Navy, constructing and delivering ships and designing and developing the next-generation of platforms. More than 90 percent of the group’s revenue is for major Navy construction, engineering and lifecycle support awarded under large, multi-ship contracts that span several years.
We are the prime contractor for the Virginia-class submarine program. Designed for the full range of global mission requirements, including intelligence gathering, special-operations missions and sea-based missile launch, these stealthy boats excel in littoral and open-ocean environments. Electric Boat has delivered 13 submarines in conjunction with an industry partner that shares in the construction. We are operating currently at a two submarines-per-year construction rate. The remaining 15 submarines under contract are scheduled for delivery through 2023. We are also developing the Virginia Payload Module (VPM) for the next block of Virginia-class submarines expected to start construction in 2019. The VPM is an 84-foot hull section that will add four additional payload tubes, more than tripling the strike capacity of these submarines and preserving the United States’ critical undersea capabilities.
The group is the prime contractor for the Navy’s Columbia-class ballistic missile submarine, a 12-boat program that the Navy calls its top priority. These submarines will provide strategic deterrent capabilities for decades to come when the current Ohio-class fleet reaches the end of service life starting in 2027. The lead ship is slated to start construction in 2021, with delivery to the Navy in 2027. In early 2017, the program achieved a major milestone with DoD approval to move forward into the detailed design phase, an important step to keep the program on schedule. We are preparing our workforce and facilities, including a new 113,000-square-foot automated frame and cylinder facility in Quonset Point, Rhode Island. Steel for the first Columbia-class hull was cut in August 2016, and 17 missile tubes are under construction to support the Common Missile Compartment work under joint development for the U.S. Navy and the U.K. Royal Navy.
We are the lead designer and builder of the Arleigh Burke-class (DDG-51) guided-missile destroyers, managing the design, modernization and lifecycle support. These highly capable, multi-mission ships provide offensive and defensive capabilities and are capable of simultaneously fighting air, surface and subsurface battles. They can operate independently or as part of carrier strike groups, surface action groups, amphibious-ready groups and underway replenishment groups. The Navy restarted the program in 2010 and Bath Iron Works has construction contracts for seven DDG-51s scheduled for delivery through 2022. The first ship in the restart program successfully completed Navy acceptance sea trials in December 2016 and is scheduled for delivery in early 2017.
Bath Iron Works is one of the Navy’s contractors involved in the development and construction of the Zumwalt-class (DDG-1000) platform, the Navy’s next-generation guided-missile destroyer. These ships are equipped with numerous technological enhancements, including a low radar profile, an integrated power system and a software environment that ties together nearly every system on the ship. DDG-1000s will provide independent forward presence and deterrence, support special operations forces and operate as an integral part of joint and combined expeditionary forces. We delivered the first ship in May 2016 and the remaining deliveries are scheduled through 2020.
NASSCO is building Expeditionary Sea Base (ESB) auxiliary support ships, a second variant of the original Expeditionary Support Dock (ESD) ships, which serve as floating transfer stations that improve the Navy’s ability to deliver large-scale equipment and expeditionary forces to areas without adequate port access. The ESBs, equipped with a 52,000-square-foot flight deck and accommodations for up to 250 personnel, are capable of supporting a variety of missions, including airborne mine countermeasure, maritime security operations and disaster relief missions. The group has delivered the first three ships in the program
10
and construction is underway on the fourth and fifth ships, scheduled for delivery in 2018 and 2019, respectively.
In 2016, we were awarded a six-ship contract by the Navy for the detailed design and construction for a new class of fleet oilers, the John Lewis class (TAO-205). Designed to transfer fuel to Navy surface ships operating at sea, the oilers will have the capacity to carry 156,000 barrels of oil as well as offer a significant dry cargo capacity and aviation capability. Engineering and design work is underway for the first ship in the program, with construction planned to begin in 2018.
Our Marine Systems group provides comprehensive ship and submarine maintenance, modernization and lifecycle support services to extend the service life and maximize the value of these ships. NASSCO conducts full-service maintenance and surface-ship repair operations in four primary locations within the Navy’s largest U.S. ports and at customer locations around the globe. Electric Boat provides extensive submarine maintenance and modernization services in a variety of U.S. locations and is converting two decommissioned submarines to moored training ships, which serve as nuclear training platforms. In support of allied navies, the group offers program management, planning, engineering and design support for submarine and surface-ship construction programs.
In addition to our work for the Navy, the Marine Systems group has extensive experience in all phases of ship construction for commercial customers, designing and building oil and product tankers and container and cargo ships for commercial markets since the 1970s. These ships help our commercial customers satisfy the Jones Act requirement that ships carrying cargo between U.S. ports be built in U.S. shipyards. The group has advanced commercial shipbuilding technology with NASSCO’s design and delivery of the world’s first liquefied natural gas (LNG)-powered containerships, using green ship technology to dramatically decrease emissions while increasing fuel efficiency. We are also designing and producing LNG-conversion-ready ships for commercial customers and delivered six of these ships in 2016, with two more scheduled for delivery in 2017. We signed a two-ship contract with a commercial customer in 2016 for the design and construction of LNG-capable containerships with roll-on, roll-off capability. With the age of the Jones Act fleet and environmental regulations that impose more stringent emission control limits, we anticipate additional commercial shipbuilding opportunities.
To further the group’s goals of operating efficiency, innovation and affordability for the customer, we make strategic investments in our business, often in cooperation with the Navy. In addition, the Marine Systems group leverages its design and engineering expertise across its shipyards to improve program execution and generate cost savings. This knowledge sharing enables the group to use resources more efficiently and drive process improvements. We are well-positioned to continue to fulfill the ship-construction and support requirements of our customers.
Revenue for the Marine Systems group was 26 percent of our consolidated revenue in 2016, 25 percent in 2015 and 24 percent in 2014. Revenue by major products and services was as follows:
Year Ended December 31 | 2016 | 2015 | 2014 | ||||||||
Nuclear-powered submarines | $ | 5,376 | $ | 5,003 | $ | 4,310 | |||||
Surface combatants | 1,019 | 1,049 | 1,084 | ||||||||
Auxiliary and commercial ships | 648 | 692 | 640 | ||||||||
Repair and other services | 1,159 | 1,269 | 1,278 | ||||||||
Total Marine Systems | $ | 8,202 | $ | 8,013 | $ | 7,312 | |||||
11
CUSTOMERS
In 2016, 60 percent of our revenue was from the U.S. government, 15 percent was from U.S. commercial customers, 13 percent was from non-U.S. commercial customers and the remaining 12 percent was from non-U.S. government customers.
U.S. GOVERNMENT
Our primary customer is the U.S. DoD. We also contract with other U.S. government customers, including the intelligence community, the Departments of Homeland Security and Health and Human Services, and first-responder agencies. Our revenue from the U.S. government was as follows:
Year Ended December 31 | 2016 | 2015 | 2014 | ||||||||
DoD | $ | 15,296 | $ | 14,699 | $ | 14,516 | |||||
Non-DoD | 2,825 | 2,830 | 2,750 | ||||||||
FMS* | 717 | 452 | 689 | ||||||||
Total U.S. government | $ | 18,838 | $ | 17,981 | $ | 17,955 | |||||
Percent of total revenue | 60 | % | 57 | % | 58 | % | |||||
* In addition to our direct non-U.S. sales, we sell to non-U.S. governments through the FMS program. Under the FMS program, we contract with and are paid by the U.S. government, and the U.S. government assumes the risk of collection from the non-U.S. government customer.
Our U.S. government businesses operate under fixed-price, cost-reimbursement and time-and-materials contracts. Our production contracts are primarily fixed-price. Under these contracts, we agree to perform a specific scope of work for a fixed amount. Contracts for research, engineering, repair and maintenance, and other services are typically cost-reimbursement or time-and-materials. Under cost-reimbursement contracts, the customer reimburses contract costs and pays a fixed, incentive or award-based fee. These fees are determined by our ability to achieve targets set in the contract, such as cost, quality, schedule and performance. Under time-and-materials contracts, the customer pays a fixed hourly rate for direct labor and generally reimburses us for the cost of materials.
In our U.S. government business, fixed-price contracts accounted for 53 percent in 2016, 54 percent in 2015 and 53 percent in 2014; cost-reimbursement contracts accounted for 43 percent in 2016, 42 percent in 2015 and 43 percent in 2014; and time-and-materials contracts accounted for 4 percent in each of the past three years.
Each of these contract types presents advantages and disadvantages. Typically, we assume more risk with fixed-price contracts. However, these types of contracts offer additional profits when we complete the work for less than the contract amount. Cost-reimbursement contracts generally subject us to lower risk. Accordingly, the associated fees are usually lower than fees earned on fixed-price contracts. Additionally, some costs are unallowable under these types of contracts, and the government reviews the costs we charge. Under time-and-materials contracts, our profit may vary if actual labor-hour costs vary significantly from the negotiated rates. Also, because these contracts can provide little or no fee for managing material costs, the content mix can impact margin rates.
U.S. COMMERCIAL
Our U.S. commercial revenue was $4.6 billion in 2016 and $5.3 billion in 2015 and 2014. This represented approximately 15 percent of our consolidated revenue in 2016 and 17 percent in 2015 and 2014. The majority of this revenue is for business-jet aircraft and related services where our customer base consists of individuals and public and privately held companies across a wide range of industries.
12
NON-U.S.
Our revenue from non-U.S. government and commercial customers was $7.9 billion in 2016, $8.2 billion in 2015 and $7.6 billion in 2014. This represented approximately 25 percent of our consolidated revenue in 2016, 26 percent in 2015 and 25 percent in 2014.
We conduct business with customers around the world, providing a broad portfolio of products and services. Our non-U.S. defense subsidiaries are committed to maintaining long-term relationships with their respective governments and have established themselves as principal regional suppliers and employers.
Our non-U.S. commercial business consists primarily of business-jet aircraft exports and worldwide aircraft services. The market for business-jet aircraft and related services outside North America has expanded significantly in recent years. While the installed base of aircraft is concentrated in North America, orders from non-U.S. customers represent a significant segment of our aircraft business with approximately 55 percent of the Aerospace group’s total backlog on December 31, 2016.
COMPETITION
Several factors determine our ability to compete successfully in the defense and business-aviation markets. While customers’ evaluation criteria vary, the principal competitive elements include:
• | the technical excellence, reliability, safety and cost competitiveness of our products and services; |
• | our ability to innovate and develop new products and technologies that improve mission performance and adapt to dynamic threats; |
• | successful program execution and on-time delivery of complex, integrated systems; |
• | our global footprint and accessibility to customers; |
• | the reputation and customer confidence derived from past performance; and |
• | the successful management of customer relationships. |
DEFENSE MARKET COMPETITION
The U.S. government contracts with numerous domestic and non-U.S. companies for products and services. We compete against other large platform and system-integration contractors as well as smaller companies that specialize in a particular technology or capability. Outside the United States, we compete with global defense contractors’ exports and the offerings of private and state-owned defense manufacturers. Our Combat Systems group competes with a large number of domestic and non-U.S. businesses. Our Information Systems and Technology group competes with many companies, from large defense companies to small niche competitors with specialized technologies or expertise. Our Marine Systems group has one primary competitor with which it also partners on the Virginia-class submarine program. The operating cycle of many of our major platform programs can result in sustained periods of program continuity when we perform successfully.
We are involved in teaming and subcontracting relationships with some of our competitors. Competitions for major defense programs often require companies to form teams to bring together a spectrum of capabilities to meet the customer’s requirements. Opportunities associated with these programs include roles as the program’s integrator, overseeing and coordinating the efforts of all participants on a team, or as a provider of a specific component or subsystem.
BUSINESS-JET AIRCRAFT MARKET COMPETITION
The Aerospace group has several competitors for each of its Gulfstream products. Key competitive factors include aircraft safety, reliability and performance; comfort and in-flight productivity; service quality, global
13
footprint and responsiveness; technological and new-product innovation; and price. We believe that Gulfstream competes effectively in all of these areas.
The Aerospace group competes worldwide in the business-jet aircraft services market primarily on the basis of price, quality and timeliness. In our maintenance, repair and FBO businesses, the group competes with several other large companies as well as a number of smaller companies, particularly in the maintenance business. In our completions business, the group competes with other OEMs, as well as several third-party providers.
BACKLOG
Our total backlog represents the estimated remaining value of work to be performed under firm contracts and includes funded and unfunded portions. For additional discussion of backlog, see Management’s Discussion and Analysis of Financial Condition and Results of Operations in Item 7.
Summary backlog information for each of our business groups follows:
2016 Total Backlog Not Expected to Be Completed in 2017 | |||||||||||||||||||||||||||
December 31 | 2016 | 2015 | |||||||||||||||||||||||||
Funded | Unfunded | Total | Funded | Unfunded | Total | ||||||||||||||||||||||
Aerospace | $ | 10,893 | $ | 96 | $ | 10,989 | $ | 13,292 | $ | 106 | $ | 13,398 | $ | 5,953 | |||||||||||||
Combat Systems | 17,124 | 597 | 17,721 | 18,398 | 597 | 18,995 | 12,621 | ||||||||||||||||||||
Information Systems and Technology | 6,425 | 2,015 | 8,440 | 6,827 | 1,755 | 8,582 | 2,270 | ||||||||||||||||||||
Marine Systems | 14,927 | 7,723 | 22,650 | 13,266 | 11,879 | 25,145 | 15,643 | ||||||||||||||||||||
Total backlog | $ | 49,369 | $ | 10,431 | $ | 59,800 | $ | 51,783 | $ | 14,337 | $ | 66,120 | $ | 36,487 | |||||||||||||
RESEARCH AND DEVELOPMENT
To foster innovative product development and evolution, we conduct sustained R&D activities as part of our normal business operations. Most of our Aerospace group’s R&D activities support Gulfstream’s product enhancement and development programs. In our U.S. defense businesses, we conduct customer-sponsored R&D activities under government contracts and company-sponsored R&D, investing in technologies and capabilities that provide solutions for our customers. In accordance with government regulations, we recover a portion of company-sponsored R&D expenditures through overhead charges to U.S. government contracts. For more information on our company-sponsored R&D activities, including our expenditures for the past three years, see Note A to the Consolidated Financial Statements in Item 8.
INTELLECTUAL PROPERTY
We develop technology, manufacturing processes and systems-integration practices. In addition to owning a large portfolio of proprietary intellectual property, we license some intellectual property rights to and from others. The U.S. government holds licenses to many of our patents developed in the performance of U.S. government contracts, and it may use or authorize others to use the inventions covered by these patents. Although these intellectual property rights are important to the operation of our business, no existing patent,
14
license or other intellectual property right is of such importance that its loss or termination would have a material impact on our business.
EMPLOYEES
On December 31, 2016, our subsidiaries had 98,800 employees, approximately one-fifth of whom work under collective agreements with various labor unions and worker representatives. Agreements covering approximately 3 percent of total employees are due to expire in 2017. Historically, we have renegotiated these labor agreements without any significant disruption to operating activities.
RAW MATERIALS, SUPPLIERS AND SEASONALITY
We depend on suppliers and subcontractors for raw materials, components and subsystems. Our U.S. government customer is a supplier on some of our programs. These supply networks can experience price fluctuations and capacity constraints, which can put pressure on our costs. Effective management and oversight of suppliers and subcontractors is an important element of our successful performance. We attempt to mitigate these risks with our suppliers by entering into long-term agreements and leveraging company-wide agreements to achieve economies of scale, and by negotiating flexible pricing terms in our customer contracts. We have not experienced, and do not foresee, significant difficulties in obtaining the materials, components or supplies necessary for our business operations.
Our business is not seasonal in nature. The receipt of contract awards, the availability of funding from the customer, the incurrence of contract costs and unit deliveries are all factors that influence the timing of our revenue. In the United States, these factors are influenced by the federal government’s budget cycle based on its October-to-September fiscal year.
REGULATORY MATTERS
U.S. GOVERNMENT CONTRACTS
U.S. government contracts are subject to procurement laws and regulations. The Federal Acquisition Regulation (FAR) and the Cost Accounting Standards (CAS) govern the majority of our contracts. The FAR mandates uniform policies and procedures for U.S. government acquisitions and purchased services. Also, individual agencies can have acquisition regulations that provide implementing language for the FAR or that supplement the FAR. For example, the DoD implements the FAR through the Defense Federal Acquisition Regulation Supplement (DFARS). For all federal government entities, the FAR regulates the phases of any product or service acquisition, including:
• | acquisition planning, |
• | competition requirements, |
• | contractor qualifications, |
• | protection of source selection and vendor information, and |
• | acquisition procedures. |
In addition, the FAR addresses the allowability of our costs, while the CAS address how those costs should be allocated to contracts. The FAR subjects us to audits and other government reviews covering issues such as cost, performance, internal controls and accounting practices relating to our contracts.
15
NON-U.S. REGULATORY
Our non-U.S. revenue is subject to the applicable foreign government regulations and procurement policies and practices, as well as U.S. policies and regulations. We are also subject to regulations governing investments, exchange controls, repatriation of earnings and import-export control.
BUSINESS-JET AIRCRAFT
The Aerospace group is subject to FAA regulation in the United States and other similar aviation regulatory authorities internationally, including the Civil Aviation Administration of Israel (CAAI), the European Aviation Safety Agency (EASA) and the Civil Aviation Administration of China (CAAC). For an aircraft to be manufactured and sold, the model must receive a type certificate from the appropriate aviation authority, and each aircraft must receive a certificate of airworthiness. Aircraft outfitting and completions also require approval by the appropriate aviation authority, which often is accomplished through a supplemental type certificate. Aviation authorities can require changes to a specific aircraft or model type before granting approval. Maintenance facilities and charter operations must be licensed by aviation authorities as well.
ENVIRONMENTAL
We are subject to a variety of federal, state, local and foreign environmental laws and regulations. These laws and regulations cover the discharge, treatment, storage, disposal, investigation and remediation of materials, substances and wastes identified in the laws and regulations. We are directly or indirectly involved in environmental investigations or remediation at some of our current and former facilities and at third-party sites that we do not own but where we have been designated a Potentially Responsible Party (PRP) by the U.S. Environmental Protection Agency or a state environmental agency. As a PRP, we are potentially liable to the government or third parties for the cost of remediating contamination. In cases where we have been designated a PRP, generally we seek to mitigate these environmental liabilities through available insurance coverage and by pursuing appropriate cost-recovery actions. In the unlikely event we are required to fully fund the remediation of a site, the current statutory framework would allow us to pursue contributions from other PRPs. We regularly assess our compliance status and management of environmental matters.
Operating and maintenance costs associated with environmental compliance and management of contaminated sites are a normal, recurring part of our operations. Historically, these costs have not been material. Environmental costs often are recoverable under our contracts with the U.S. government. Based on information currently available and current U.S. government policies relating to cost recovery, we do not expect continued compliance with environmental regulations to have a material impact on our results of operations, financial condition or cash flows. For additional information relating to the impact of environmental matters, see Note N to the Consolidated Financial Statements in Item 8.
AVAILABLE INFORMATION
We file reports and other information with the Securities and Exchange Commission (SEC) pursuant to Section 13(a) or 15(d) of the Securities Exchange Act of 1934, as amended. These reports and information include an annual report on Form 10-K, quarterly reports on Form 10-Q, current reports on Form 8-K and proxy statements. Free copies of these items are made available on our website (www.generaldynamics.com) as soon as practicable and through the General Dynamics investor relations office at (703) 876-3583. The SEC maintains a website (www.sec.gov) that contains reports, proxy and information statements, and other information. These items also can be read and copied at the SEC’s Public Reference Room at 100 F Street, N.E., Washington, DC 20549. Information on the operation of the Public Reference Room is available by calling the SEC at (800) SEC-0330.
16
ITEM 1A. RISK FACTORS
An investment in our common stock or debt securities is subject to risks and uncertainties. Investors should consider the following factors, in addition to the other information contained in this Annual Report on Form 10-K, before deciding whether to purchase our securities.
Investment risks can be market-wide as well as unique to a specific industry or company. The market risks faced by an investor in our stock are similar to the uncertainties faced by investors in a broad range of industries. There are some risks that apply more specifically to our business.
Our revenue is concentrated with the U.S. government. This customer relationship involves some specific risks. In addition, our sales to non-U.S. customers expose us to different financial and legal risks. Despite the varying nature of our U.S. and non-U.S. defense and business-aviation operations and the markets they serve, each group shares some common risks, such as the ongoing development of high-technology products and the price, availability and quality of commodities and subsystems.
The U.S. government provides a significant portion of our revenue. 60 percent of our consolidated revenue in 2016 was from the U.S. government. Levels of U.S. defense spending are driven by threats to national security. Competing demands for federal funds pressure various areas of spending. Decreases in U.S. government defense spending or changes in spending allocation or priorities could result in one or more of our programs being reduced, delayed or terminated, which could impact our financial performance.
For additional information relating to the U.S. defense budget, see the Business Environment section of Management’s Discussion and Analysis of Financial Condition and Results of Operations in Item 7.
U.S. government contracts are not always fully funded at inception, and any funding is subject to disruption or delay. Our U.S. government revenue is funded by agency budgets that operate on an October-to-September fiscal year. Early each calendar year, the President of the United States presents to Congress the budget for the upcoming fiscal year. This budget proposes funding levels for every federal agency and is the result of months of policy and program reviews throughout the Executive branch. For the remainder of the year, the appropriations and authorization committees of Congress review the President’s budget proposals and establish the funding levels for the upcoming fiscal year. Once these levels are enacted into law, the Executive Office of the President administers the funds to the agencies.
There are two primary risks associated with the U.S. government budget cycle. First, the annual process may be delayed or disrupted, which has occurred in recent years. For example, changes in congressional schedules due to elections or other legislative priorities, or negotiations for program funding levels can interrupt the process. If the annual budget is not approved by the beginning of the government fiscal year, portions of the U.S. government can shut down or operate under a continuing resolution that maintains spending at prior-year levels, which can impact funding for our programs and timing of new awards. Second, Congress typically appropriates funds on a fiscal-year basis, even though contract performance may extend over many years. Future revenue under existing multi-year contracts is conditioned on the continuing availability of congressional appropriations. Changes in appropriations in subsequent years may impact the funding available for these programs. Delays or changes in funding can impact the timing of available funds or lead to changes in program content.
Our U.S. government contracts are subject to termination rights by the customer. U.S. government contracts generally permit the government to terminate a contract, in whole or in part, for convenience. If a contract is terminated for convenience, a contractor usually is entitled to receive payments for its allowable costs incurred and the proportionate share of fees or earnings for the work performed. The government may also terminate a contract for default in the event of a breach by the contractor. If a contract is terminated
17
for default, the government in most cases pays only for the work it has accepted. The termination of multiple or large programs could have a material adverse effect on our future revenue and earnings.
Government contractors operate in a highly regulated environment and are subject to audit by the U.S. government. Numerous U.S. government agencies routinely audit and review government contractors. These agencies review a contractor’s performance under its contracts and compliance with applicable laws, regulations and standards. The U.S. government also reviews the adequacy of, and compliance with, internal control systems and policies, including the contractor’s purchasing, property, estimating, material, earned value management and accounting systems. In some cases, audits may result in delayed payments or contractor costs not being reimbursed or subject to repayment. If an audit or investigation were to result in allegations against a contractor of improper or illegal activities, civil or criminal penalties and administrative sanctions could result, including termination of contracts, forfeiture of profits, suspension of payments, fines and suspension or prohibition from doing business with the U.S. government. In addition, reputational harm could result if allegations of impropriety were made. In some cases, audits may result in disputes with the respective government agency that can result in negotiated settlements, arbitration or litigation. Moreover, new laws, regulations or standards, or changes to existing ones, can increase our performance and compliance costs and reduce our profitability.
Our Aerospace group is subject to changing customer demand for business aircraft. The business-jet market is driven by the demand for business-aviation products and services by business, individual and government customers in the United States and around the world. The Aerospace group’s results also depend on other factors, including general economic conditions, the availability of credit, pricing pressures and trends in capital goods markets. In addition, if customers default on existing contracts and the contracts are not replaced, the group’s anticipated revenue and profitability could be reduced materially.
Earnings and margin depend on our ability to perform on our contracts. When agreeing to contractual terms, our management team makes assumptions and projections about future conditions and events. The accounting for our contracts and programs requires assumptions and estimates about these conditions and events. These projections and estimates assess:
• | the productivity and availability of labor, |
• | the complexity of the work to be performed, |
• | the cost and availability of materials and components, and |
• | schedule requirements. |
If there is a significant change in one or more of these circumstances, estimates or assumptions, or if the risks under our contracts are not managed adequately, the profitability of contracts could be adversely affected. This could affect earnings and margin materially.
Earnings and margin depend in part on subcontractor and vendor performance. We rely on other companies to provide materials, components and subsystems for our products. Subcontractors also perform some of the services that we provide to our customers. We depend on these subcontractors and vendors to meet our contractual obligations in full compliance with customer requirements and applicable law. Misconduct by subcontractors, such as a failure to comply with procurement regulations or engaging in unauthorized activities, may harm our future revenue and earnings. We manage our supplier base carefully to avoid customer issues. We sometimes rely on only one or two sources of supply that, if disrupted, could have an adverse effect on our ability to meet our customer commitments. Our ability to perform our obligations may be materially adversely affected if one or more of these suppliers is unable to provide the agreed-upon supplies, perform the agreed-upon services in a timely and cost-effective manner, or engages in misconduct or other improper activities.
18
Sales and operations outside the United States are subject to different risks that may be associated with doing business in foreign countries. In some countries there is increased chance for economic, legal or political changes, and procurement procedures may be less robust or mature, which may complicate the contracting process. Our non-U.S. business may be sensitive to changes in a foreign government’s budgets, leadership and national priorities, which may occur suddenly. Non-U.S. transactions can involve increased financial and legal risks arising from foreign exchange-rate variability and differing legal systems. Our non-U.S. business is subject to U.S. and foreign laws and regulations, including laws and regulations relating to import-export controls, technology transfers, the Foreign Corrupt Practices Act and other anti-corruption laws, and the International Traffic in Arms Regulations (ITAR). An unfavorable event or trend in any one or more of these factors or a failure to comply with U.S. or foreign laws could result in administrative, civil or criminal liabilities, including suspension or debarment from government contracts or suspension of our export privileges, and could materially adversely affect revenue and earnings associated with our non-U.S. business.
In addition, some non-U.S. government customers require contractors to enter into letters of credit, performance or surety bonds, bank guarantees and other similar financial arrangements. We may also be required to agree to specific in-country purchases, manufacturing agreements or financial support arrangements, known as offsets, that require us to satisfy investment or other requirements or face penalties. Offset requirements may extend over several years and could require us to team with local companies to fulfill these requirements. If we do not satisfy these financial or offset requirements, our future revenue and earnings may be materially adversely affected.
Our future success depends in part on our ability to develop new products and technologies and maintain a qualified workforce to meet the needs of our customers. Many of the products and services we provide involve sophisticated technologies and engineering, with related complex manufacturing and system-integration processes. Our customers’ requirements change and evolve regularly. Accordingly, our future performance depends in part on our ability to continue to develop, manufacture and provide innovative products and services and bring those offerings to market quickly at cost-effective prices. Some new products, particularly in our Aerospace group, must meet extensive and time-consuming regulatory requirements that are often outside our control. Additionally, due to the highly specialized nature of our business, we must hire and retain the skilled and qualified personnel necessary to perform the services required by our customers. If we were unable to develop new products that meet customers’ changing needs and satisfy regulatory requirements in a timely manner or successfully attract and retain qualified personnel, our future revenue and earnings may be materially adversely affected.
We have made and expect to continue to make investments, including acquisitions and joint ventures, that involve risks and uncertainties. When evaluating potential acquisitions and joint ventures, we make judgments regarding the value of business opportunities, technologies, and other assets and the risks and costs of potential liabilities based on information available to us at the time of the transaction. Whether we realize the anticipated benefits from these transactions depends on multiple factors, including our integration of the businesses involved; the performance of the underlying products, capabilities or technologies; market conditions following the acquisition; and acquired liabilities, including some that may not have been identified prior to the acquisition. These factors could materially adversely affect our financial results.
Changes in business conditions may cause goodwill and other intangible assets to become impaired. Goodwill represents the purchase price paid in excess of the fair value of net tangible and intangible assets acquired in a business combination. Goodwill is not amortized and remains on our balance sheet indefinitely unless there is an impairment or a sale of a portion of the business. Goodwill is subject
19
to an impairment test on an annual basis and when circumstances indicate that an impairment is more likely than not. Such circumstances include a significant adverse change in the business climate for one of our business groups or a decision to dispose of a business group or a significant portion of a business group. We face some uncertainty in our business environment due to a variety of challenges, including changes in defense spending. We may experience unforeseen circumstances that adversely affect the value of our goodwill or intangible assets and trigger an evaluation of the amount of the recorded goodwill and intangible assets. Future write-offs of goodwill or other intangible assets as a result of an impairment in the business could materially adversely affect our results of operations and financial condition.
Our business could be negatively impacted by cyber security events and other disruptions. We face various cyber security threats, including threats to our information technology infrastructure and attempts to gain access to our proprietary or classified information, denial-of-service attacks, as well as threats to the physical security of our facilities and employees, and threats from terrorist acts. We also design and manage information technology systems and products that contain information technology systems for various customers. We generally face the same security threats for these systems as for our own internal systems. In addition, we face cyber threats from entities that may seek to target us through our customers, vendors, subcontractors and other third parties with whom we do business. Accordingly, we maintain information security staff, policies and procedures for managing risk to our information systems, and conduct employee training on cyber security to mitigate persistent and continuously evolving cyber security threats. We have experienced cyber security threats such as viruses and attacks by hackers targeting our information technology systems. Such prior events have not had a material impact on our financial condition, results of operations or liquidity. However, future threats could, among other things, cause harm to our business and our reputation; disrupt our operations; expose us to potential liability, regulatory actions and the loss of business; and challenge our eligibility for future work on sensitive or classified systems for government customers, as well as impact our results of operations materially. Due to the evolving nature of these security threats, the potential impact of any future incident cannot be predicted. Our insurance coverage may not be adequate to cover all the costs related to cyber security attacks or disruptions resulting from such events.
20
FORWARD-LOOKING STATEMENTS
This Annual Report on Form 10-K contains forward-looking statements that are based on management’s expectations, estimates, projections and assumptions. Words such as “expects,” “anticipates,” “plans,” “believes,” “scheduled,” “outlook,” “estimates,” “should” and variations of these words and similar expressions are intended to identify forward-looking statements. Examples include projections of revenue, earnings, operating margin, segment performance, cash flows, contract awards, aircraft production, deliveries and backlog. In making these statements we rely on assumptions and analyses based on our experience and perception of historical trends, current conditions and expected future developments as well as other factors we consider appropriate under the circumstances. We believe our estimates and judgments are reasonable based on information available to us at the time. Forward-looking statements are made pursuant to the safe harbor provisions of the Private Securities Litigation Reform Act of 1995, as amended. These statements are not guarantees of future performance and involve risks and uncertainties that are difficult to predict. Therefore, actual future results and trends may differ materially from what is forecast in forward-looking statements due to a variety of factors, including, without limitation, the risk factors discussed in this Form 10-K.
All forward-looking statements speak only as of the date of this report or, in the case of any document incorporated by reference, the date of that document. All subsequent written and oral forward-looking statements attributable to General Dynamics or any person acting on our behalf are qualified by the cautionary statements in this section. We do not undertake any obligation to update or publicly release any revisions to forward-looking statements to reflect events, circumstances or changes in expectations after the date of this report. These factors may be revised or supplemented in subsequent reports on SEC Forms 10-Q and 8-K.
ITEM 1B. UNRESOLVED STAFF COMMENTS
None.
ITEM 2. PROPERTIES
We operate in a number of offices, manufacturing plants, laboratories, warehouses and other facilities in the United States and abroad. We believe our facilities are adequate for our present needs and, given planned improvements and construction, expect them to remain adequate for the foreseeable future.
On December 31, 2016, our business groups had primary operations at the following locations:
• | Aerospace – Burbank, Lincoln, Long Beach and Van Nuys, California; West Palm Beach, Florida; Brunswick and Savannah, Georgia; Cahokia, Illinois; Bedford and Westfield, Massachusetts; Las Vegas, Nevada; Teterboro, New Jersey; Dallas and Houston, Texas; Appleton, Wisconsin; Vienna, Austria; Sorocaba, Brazil; Beijing and Hong Kong, China; Berlin, Dusseldorf and Munich, Germany; Mexicali, Mexico; Moscow, Russia; Singapore; Basel, Geneva and Zurich, Switzerland; Dubai, United Arab Emirates; Luton, United Kingdom. |
• | Combat Systems – Anniston, Alabama; East Camden and Hampton, Arkansas; Crawfordsville, St. Petersburg and Tallahassee, Florida; Marion, Illinois; Saco, Maine; Shelby Township and Sterling Heights, Michigan; Joplin, Missouri; Lincoln, Nebraska; Lima and Springboro, Ohio; Eynon, Red Lion and Scranton, Pennsylvania; Ladson, South Carolina; Garland, Texas; Williston, Vermont; Marion, Virginia; Auburn and Sumner, Washington; Vienna, Austria; La Gardeur, London, St. Augustin and |
21
Valleyfield, Canada; Kaiserslautern, Germany; Granada, Madrid, Sevilla and Trubia, Spain; Kreuzlingen, Switzerland; Oakdale and Merthyr Tydfil, United Kingdom.
• | Information Systems and Technology – Cullman, Alabama; Phoenix and Scottsdale, Arizona; Santa Clara, California; Lynn Haven and Riverview, Florida; Coralville and West Des Moines, Iowa; Lawrence, Kansas; Annapolis Junction and Towson, Maryland; Dedham, Pittsfield, Taunton and Westwood, Massachusetts; Bloomington, Minnesota; Hattiesburg, Mississippi; Catawba, Conover and Greensboro, North Carolina; Kilgore and Wortham, Texas; Sandy, Utah; Chesapeake, Chester, Fairfax, Herndon, Springfield and Sterling, Virginia; Calgary and Ottawa, Canada; Tallinn, Estonia; Oakdale and St. Leonards, United Kingdom. |
• | Marine Systems – San Diego, California; Groton and New London, Connecticut; Jacksonville, Florida; Bath and Brunswick, Maine; North Kingstown, Rhode Island; Norfolk and Portsmouth, Virginia; Bremerton, Washington; Mexicali, Mexico. |
A summary of floor space by business group on December 31, 2016, follows:
(Square feet in millions) | Company-owned Facilities | Leased Facilities | Government-owned Facilities | Total | |||||||
Aerospace | 5.9 | 7.2 | — | 13.1 | |||||||
Combat Systems | 7.7 | 3.6 | 5.5 | 16.8 | |||||||
Information Systems and Technology | 2.8 | 8.0 | 0.9 | 11.7 | |||||||
Marine Systems | 8.1 | 2.8 | — | 10.9 | |||||||
Total | 24.5 | 21.6 | 6.4 | 52.5 | |||||||
ITEM 3. LEGAL PROCEEDINGS
For information relating to legal proceedings, see Note N to the Consolidated Financial Statements in Item 8.
ITEM 4. MINE SAFETY DISCLOSURES
Not applicable.
EXECUTIVE OFFICERS OF THE COMPANY
All of our executive officers are appointed annually. None of our executive officers were selected pursuant to any arrangement or understanding between the officer and any other person. The name, age, offices and positions of our executives held for at least the past five years as of February 6, 2017, were as follows (references are to positions with General Dynamics Corporation, unless otherwise noted):
Name, Position and Office | Age |
Jason W. Aiken - Senior Vice President and Chief Financial Officer since January 2014; Vice President of the company and Chief Financial Officer of Gulfstream Aerospace Corporation, September 2011 - December 2013; Vice President and Controller, April 2010 - August 2011; Staff Vice President, Accounting, July 2006 - March 2010 | 44 |
22
Mark L. Burns - Vice President of the company and President of Gulfstream Aerospace Corporation since July 2015; Vice President of the company since February 2014; President, Product Support of Gulfstream Aerospace Corporation, June 2008 - June 2015 | 57 |
John P. Casey - Executive Vice President, Marine Systems, since May 2012; Vice President of the company and President of Electric Boat Corporation, October 2003 - May 2012; Vice President of Electric Boat Corporation, October 1996 - October 2003 | 62 |
Gregory S. Gallopoulos - Senior Vice President, General Counsel and Secretary since January 2010; Vice President and Deputy General Counsel, July 2008 - January 2010; Managing Partner of Jenner & Block LLP, January 2005 - June 2008 | 57 |
Jeffrey S. Geiger - Vice President of the company and President of Electric Boat Corporation since November 2013; Vice President of the company and President of Bath Iron Works Corporation, April 2009 - November 2013; Senior Vice President, Operations and Engineering of Bath Iron Works Corporation, March 2008 - March 2009 | 55 |
M. Amy Gilliland - Senior Vice President, Human Resources and Administration since April 2015; Vice President, Human Resources, February 2014 - March 2015; Staff Vice President, Strategic Planning, January 2013 - February 2014; Staff Vice President, Investor Relations, June 2008 - January 2013 | 42 |
Robert W. Helm - Senior Vice President, Planning and Development since May 2010; Vice President, Government Relations, of Northrop Grumman Corporation, August 1989 - April 2010 | 65 |
S. Daniel Johnson - Executive Vice President, Information Systems and Technology, and President of General Dynamics Information Technology since January 2015; Vice President of the company and President of General Dynamics Information Technology, April 2008 - December 2014; Executive Vice President of General Dynamics Information Technology, July 2006 - March 2008 | 69 |
Kimberly A. Kuryea - Vice President and Controller since September 2011; Chief Financial Officer of General Dynamics Advanced Information Systems, November 2007 - August 2011; Staff Vice President, Internal Audit, March 2004 - October 2007 | 49 |
Christopher Marzilli - Vice President of the company and President of General Dynamics Mission Systems since January 2015; Vice President of the company and President of General Dynamics C4 Systems, January 2006 - December 2014; Senior Vice President and Deputy General Manager of General Dynamics C4 Systems, November 2003 - January 2006 | 57 |
Phebe N. Novakovic - Chairman and Chief Executive Officer since January 2013; President and Chief Operating Officer, May 2012 - December 2012; Executive Vice President, Marine Systems, May 2010 - May 2012; Senior Vice President, Planning and Development, July 2005 - May 2010; Vice President, Strategic Planning, October 2002 - July 2005 | 59 |
Mark C. Roualet - Executive Vice President, Combat Systems, since March 2013; Vice President of the company and President of General Dynamics Land Systems, October 2008 - March 2013; Senior Vice President and Chief Operating Officer of General Dynamics Land Systems, July 2007 - October 2008 | 58 |
Gary L. Whited - Vice President of the company and President of General Dynamics Land Systems since March 2013; Senior Vice President of General Dynamics Land Systems, September 2011 - March 2013; Vice President and Chief Financial Officer of General Dynamics Land Systems, June 2006 - September 2011 | 56 |
23
PART II
ITEM 5. MARKET FOR THE COMPANY’S COMMON EQUITY, RELATED STOCKHOLDER MATTERS AND ISSUER PURCHASES OF EQUITY SECURITIES
Our common stock is listed on the New York Stock Exchange.
The high and low sales prices of our common stock and the cash dividends declared on our common stock for each quarter of 2015 and 2016 are included in the Supplementary Data contained in Item 8.
On January 29, 2017, there were approximately 12,000 holders of record of our common stock.
For information regarding securities authorized for issuance under our equity compensation plans, see Note O to the Consolidated Financial Statements contained in Item 8.
We did not make any unregistered sales of equity securities in 2016.
The following table provides information about our fourth-quarter repurchases of equity securities that are registered pursuant to Section 12 of the Securities Exchange Act of 1934, as amended:
Period | Total Number of Shares Purchased | Average Price Paid per Share | Total Number of Shares Purchased as Part of Publicly Announced Program* | Maximum Number of Shares That May Yet Be Purchased Under the Program* | |||||||||
Pursuant to Share Buyback Program | |||||||||||||
10/3/16-10/30/16 | 1,000,000 | $ | 151.89 | 1,000,000 | 7,390,054 | ||||||||
10/31/16-11/27/16 | 451,300 | 155.54 | 451,300 | 6,938,754 | |||||||||
11/28/16-12/31/16 | 1,550,000 | 175.04 | 1,550,000 | 5,388,754 | |||||||||
Total | 3,001,300 | $ | 164.39 | ||||||||||
* On March 2, 2016, the board of directors authorized management to repurchase 10 million additional shares of common stock.
For additional information relating to our repurchases of common stock during the past three years, see Financial Condition, Liquidity and Capital Resources - Financing Activities - Share Repurchases contained in Item 7.
The following performance graph compares the cumulative total return to shareholders on our common stock, assuming reinvestment of dividends, with similar returns for the Standard & Poor’s® 500 Index and the Standard & Poor’s® Aerospace & Defense Index, both of which include General Dynamics.
24
Cumulative Total Return
Based on Investments of $100 Beginning December 31, 2011
(Assumes Reinvestment of Dividends)
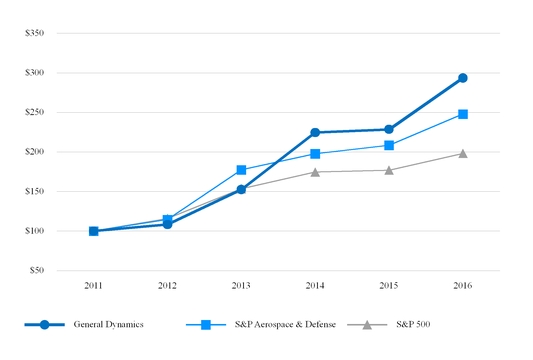
25
ITEM 6. SELECTED FINANCIAL DATA
The following table presents selected historical financial data derived from the Consolidated Financial Statements and other company information for each of the five years presented. This information should be read in conjunction with Management’s Discussion and Analysis of Financial Condition and Results of Operations and the Consolidated Financial Statements and the Notes thereto.
(Dollars and shares in millions, except per-share and employee amounts) | ||||||||||||||||||||
2016 | 2015 | 2014 | 2013 | 2012 | ||||||||||||||||
Summary of Operations | ||||||||||||||||||||
Revenue | $ | 31,353 | $ | 31,469 | $ | 30,852 | $ | 30,930 | $ | 30,992 | ||||||||||
Operating earnings | 4,309 | 4,178 | 3,889 | 3,689 | 765 | |||||||||||||||
Operating margin | 13.7 | % | 13.3 | % | 12.6 | % | 11.9 | % | 2.5% | |||||||||||
Interest, net | (91 | ) | (83 | ) | (86 | ) | (86 | ) | (156 | ) | ||||||||||
Provision for income tax, net | 1,169 | 1,137 | 1,129 | 1,125 | 854 | |||||||||||||||
Earnings (loss) from continuing operations | 3,062 | 2,965 | 2,673 | 2,486 | (381 | ) | ||||||||||||||
Return on sales (a) | 9.8 | % | 9.4 | % | 8.7 | % | 8.0 | % | (1.2 | )% | ||||||||||
Discontinued operations, net of tax | (107 | ) | — | (140 | ) | (129 | ) | 49 | ||||||||||||
Net earnings (loss) | 2,955 | 2,965 | 2,533 | 2,357 | (332 | ) | ||||||||||||||
Diluted earnings (loss) per share: | ||||||||||||||||||||
Continuing operations (b) | 9.87 | 9.08 | 7.83 | 7.03 | (1.08 | ) | ||||||||||||||
Net earnings (loss) (b) | 9.52 | 9.08 | 7.42 | 6.67 | (0.94 | ) | ||||||||||||||
Cash Flows | ||||||||||||||||||||
Net cash provided by operating activities | $ | 2,198 | $ | 2,607 | $ | 3,828 | $ | 3,159 | $ | 2,645 | ||||||||||
Net cash (used) provided by investing activities | (426 | ) | 200 | (1,102 | ) | (363 | ) | (642 | ) | |||||||||||
Net cash used by financing activities | (2,169 | ) | (4,367 | ) | (3,675 | ) | (773 | ) | (1,421 | ) | ||||||||||
Net cash (used) provided by discontinued operations | (54 | ) | (43 | ) | 36 | (18 | ) | 65 | ||||||||||||
Cash dividends declared per common share | 3.04 | 2.76 | 2.48 | 2.24 | 2.04 | |||||||||||||||
Financial Position | ||||||||||||||||||||
Cash and equivalents | $ | 2,334 | $ | 2,785 | $ | 4,388 | $ | 5,301 | $ | 3,296 | ||||||||||
Total assets | 32,872 | 31,997 | 35,337 | 35,473 | 34,285 | |||||||||||||||
Short- and long-term debt | 3,888 | 3,399 | 3,893 | 3,888 | 3,884 | |||||||||||||||
Shareholders’ equity | 10,976 | 10,738 | 11,829 | 14,501 | 11,390 | |||||||||||||||
Debt-to-equity (c) | 35.4 | % | 31.7 | % | 32.9 | % | 26.8 | % | 34.1% | |||||||||||
Book value per share (d) | 36.29 | 34.31 | 35.61 | 41.03 | 32.20 | |||||||||||||||
Other Information | ||||||||||||||||||||
Free cash flow from operations (e) | $ | 1,806 | $ | 2,038 | $ | 3,307 | $ | 2,723 | $ | 2,209 | ||||||||||
Return on invested capital (f) | 18.1 | % | 17.4 | % | 15.1 | % | 14.1 | % | 8.4% | |||||||||||
Funded backlog | 49,369 | 51,783 | 52,929 | 38,284 | 44,376 | |||||||||||||||
Total backlog | 59,800 | 66,120 | 72,410 | 45,885 | 51,132 | |||||||||||||||
Shares outstanding | 302.4 | 313.0 | 332.2 | 353.4 | 353.7 | |||||||||||||||
Weighted average shares outstanding: | ||||||||||||||||||||
Basic | 304.7 | 321.3 | 335.2 | 350.7 | 353.3 | |||||||||||||||
Diluted | 310.4 | 326.7 | 341.3 | 353.5 | 353.3 | |||||||||||||||
Employees | 98,800 | 99,900 | 99,500 | 96,000 | 92,200 | |||||||||||||||
Note: Prior period information has been restated to reflect the reclassification of certain items in accordance with Accounting Standards Update (ASU) 2016-09, Compensation - Stock Compensation (Topic 718): Improvements to Employee Share-Based Payment Accounting, which we adopted in 2016 as discussed in Note A to the Consolidated Financial Statements in Item 8.
(a) | Return on sales is calculated as earnings (loss) from continuing operations divided by revenue. |
(b) | 2012 amounts exclude the dilutive effect of stock options and restricted stock as it was antidilutive. |
(c) | Debt-to-equity ratio is calculated as total debt divided by total equity as of year end. |
(d) | Book value per share is calculated as total equity divided by total outstanding shares as of year end. |
(e) | See Item 7, Management’s Discussion and Analysis of Financial Condition and Results of Operations, for a reconciliation of net cash provided by operating activities to free cash flow from operations, a non-GAAP management metric. |
(f) | See Item 7, Management’s Discussion and Analysis of Financial Condition and Results of Operations, for the calculation of return on invested capital (ROIC), a non-GAAP management metric. 2012 ROIC was adjusted for a $2 billion goodwill impairment and associated $199 tax benefit. |
26
ITEM 7. MANAGEMENT’S DISCUSSION AND ANALYSIS OF FINANCIAL CONDITION AND RESULTS OF OPERATIONS
(Dollars in millions, except per-share amounts or unless otherwise noted)
For an overview of our business groups, including a discussion of products and services provided, see the Business discussion contained in Item 1. The following discussion should be read in conjunction with our Consolidated Financial Statements included in Item 8.
BUSINESS ENVIRONMENT
With 60 percent of our revenue from the U.S. government, our financial performance is impacted by U.S. government spending levels, particularly defense spending. Over the past several years, U.S. defense spending has been mandated by the Budget Control Act of 2011 (BCA). The BCA establishes spending caps over a 10-year period through 2021.
The fiscal year (FY) 2017 budget request for the Department of Defense (DoD) totals $589 billion, which includes $524 billion in the base budget in compliance with the BCA, as well as $65 billion for overseas contingency operations. The budget request represents a slight increase over FY 2016 spending levels. Congress has not yet passed the FY 2017 defense appropriation bill, and on December 10, 2016, a continuing resolution (CR), which funds government agencies at FY 2016 spending levels, was approved through April 28, 2017. To prevent detrimental changes or delays to certain government programs, the CR included exceptions that provide funding flexibility and additional appropriations for certain programs, including the Columbia-class submarine program. We do not anticipate that the current CR will have a material impact on our operating results in 2017.
The long-term outlook for our U.S. defense business is influenced by the relevance of our programs to the U.S. military’s funding priorities, the diversity of our programs and customers, our insight into customer requirements stemming from our incumbency on core programs, our ability to evolve our products to address a fast-changing threat environment and our proven track record of successful contract execution.
We continue to pursue international opportunities presented by demand for military equipment and information technologies from our non-U.S. operations and through exports from our North American businesses. While the revenue potential can be significant, these opportunities are subject to changing budget priorities and overall spending pressures unique to each country.
In our Aerospace group, business-jet orders reflected demand across our product portfolio. We expect our continued investment in the development of new aircraft products and technologies to support the Aerospace group’s long-term growth. Similarly, we believe the aircraft services business will continue to be a strong source of revenue as the global business-jet fleet grows.
In navigating the current business environment, we continue to focus on improving operating earnings, expanding margin and the efficient conversion of earnings into cash. We emphasize effective program execution, anticipate trends and react to changing circumstances in our business environment, and look for opportunities to drive cost-reduction activities across our business.
27
RESULTS OF OPERATIONS
INTRODUCTION
An understanding of our accounting practices is important to evaluate our financial statements and operating results. We recognize the majority of our revenue using the percentage-of-completion method of accounting. The following paragraphs explain how this method is applied in recognizing revenue and operating costs in our business groups for the periods reported in this Form 10-K.
In the Aerospace group, contracts for new aircraft have two major phases: the manufacture of the “green” aircraft and the aircraft’s outfitting, which includes exterior painting and installation of customer-selected interiors. We record revenue on these contracts at the completion of these two phases: when green aircraft are completed and accepted by the customer, and when the customer accepts final delivery of the outfitted aircraft. We do not recognize revenue at green delivery unless (1) a contract has been executed with the customer and (2) the customer can be expected to satisfy its obligations under the contract, as evidenced by the receipt of deposits from the customer and other factors. Revenue associated with the group’s completions of other original equipment manufacturers’ (OEMs) aircraft and the group’s services businesses are recognized as work progresses or upon delivery of services. Fluctuations in revenue from period to period result from the number and mix of new aircraft deliveries (green and outfitted), progress on aircraft completions and the level of aircraft service activity during the period.
The majority of the Aerospace group’s operating costs relates to new aircraft production on firm orders and consists of labor, material, subcontractor and overhead costs. The costs are accumulated in production lots, recorded in inventory and recognized as operating costs at green aircraft delivery based on the estimated average unit cost in a production lot. While changes in the estimated average unit cost for a production lot impact the level of operating costs, the amount of operating costs reported in a given period is based largely on the number and type of aircraft delivered. Operating costs in the Aerospace group’s completions and services businesses are recognized generally as incurred.
For new aircraft, operating earnings and margin are a function of the prices of our aircraft, our operational efficiency in manufacturing and outfitting the aircraft, and the mix of higher-margin large-cabin and lower-margin mid-cabin aircraft deliveries. Additional factors affecting the group’s earnings and margin include the volume, mix and profitability of completions and services work performed, the volume of and market for pre-owned aircraft and the level of general and administrative (G&A) and net research and development (R&D) costs incurred by the group.
In the three defense groups, revenue on our long-term government contracts is recognized as the work progresses, either as products are produced or as services are rendered. As a result, variations in revenue are discussed generally in terms of volume, typically measured by the level of activity on individual contracts or programs. Year-over-year variances attributed to volume are due to changes in production or service levels and delivery schedules.
Operating costs for the defense groups consist of labor, material, subcontractor, overhead and G&A costs and are recognized generally as incurred. Variances in costs recognized from period to period reflect primarily increases and decreases in production or activity levels on individual contracts and, therefore, result largely from the same factors that drive variances in revenue.
Operating earnings and margin in the defense groups are driven by changes in volume, performance or contract mix. Performance refers to changes in profitability based on adjustments to estimates at completion on individual contracts. These adjustments result from increases or decreases to the estimated value of the contract, the estimated costs to complete or both. Therefore, changes in costs incurred in the
28
period compared with prior periods do not necessarily impact profitability. It is only when total estimated costs at completion on a given contract change without a corresponding change in the contract value that the profitability of that contract may be impacted. Contract mix refers to changes in the volume of higher- vs. lower-margin work. Additionally, higher or lower margins can be inherent in the contract type (e.g., fixed-price/cost-reimbursable) or type of work (e.g., development/production).
CONSOLIDATED OVERVIEW
2016 IN REVIEW
• | Outstanding operating performance: |
◦ | Revenue of $31.4 billion, marked by growth in our defense business. |
◦ | Record-high operating earnings of $4.3 billion and operating margin of 13.7 percent increased 3.1 percent and 40 basis points, respectively, from 2015. |
◦ | Return on sales reached a new high of 9.8 percent, an increase of 40 basis points over 2015. |
◦ | $9.87 of earnings from continuing operations per diluted share increased 8.7 percent from 2015 to the highest level in our history. |
• | 14.2 million outstanding shares repurchased for $2 billion and $911 paid in cash dividends, returning approximately 160 percent of our free cash from operations to shareholders. |
• | Return on invested capital (ROIC) of 18.1 percent, 70 basis points higher than 2015. |
• | Robust backlog, including several significant contract awards received in 2016, providing stability well into the future. |
REVIEW OF 2016 VS. 2015
Year Ended December 31 | 2016 | 2015 | Variance | |||||||||||
Revenue | $ | 31,353 | $ | 31,469 | $ | (116 | ) | (0.4 | )% | |||||
Operating costs and expenses | 27,044 | 27,291 | (247 | ) | (0.9 | )% | ||||||||
Operating earnings | 4,309 | 4,178 | 131 | 3.1 | % | |||||||||
Operating margin | 13.7 | % | 13.3 | % | ||||||||||
Operating earnings and margin increased in 2016 on essentially flat revenue compared with 2015, continuing a trend of superb operating performance. Our volume reflects fewer aircraft deliveries in our Aerospace group offset largely by higher U.S. Navy engineering and ship construction work in our Marine Systems group and C4ISR (command, control, communications, computers, intelligence, surveillance and reconnaissance) solutions volume in our Information Systems and Technology group. Operating costs and expenses decreased at a greater rate than revenue, resulting in positive operating leverage. As a result, operating margin increased 40 basis points compared with 2015. This margin expansion was attributable to improved performance and continued cost reduction efforts in the Aerospace, Combat Systems and Information Systems and Technology groups.
29
REVIEW OF 2015 VS. 2014
Year Ended December 31 | 2015 | 2014 | Variance | |||||||||||
Revenue | $ | 31,469 | $ | 30,852 | $ | 617 | 2.0 | % | ||||||
Operating costs and expenses | 27,291 | 26,963 | 328 | 1.2 | % | |||||||||
Operating earnings | 4,178 | 3,889 | 289 | 7.4 | % | |||||||||
Operating margin | 13.3 | % | 12.6 | % | ||||||||||
We realized top-line revenue growth in 2015 driven primarily by higher ship construction and engineering activity in our Marine Systems group and additional deliveries of G650 aircraft in our Aerospace group. Revenue was down slightly in our Combat Systems and Information Systems and Technology groups. Operating costs and expenses increased less than revenue in 2015, resulting in a 70 basis-point increase in consolidated operating margin compared with 2014. Operating margin improved in the Aerospace, Combat Systems and Information Systems and Technology groups.
REVIEW OF BUSINESS GROUPS
Year Ended December 31 | 2016 | 2015 | 2014 | ||||||||||||||||||||
Revenue | Operating Earnings | Revenue | Operating Earnings | Revenue | Operating Earnings | ||||||||||||||||||
Aerospace | $ | 8,362 | $ | 1,718 | $ | 8,851 | $ | 1,706 | $ | 8,649 | $ | 1,611 | |||||||||||
Combat Systems | 5,602 | 914 | 5,640 | 882 | 5,732 | 862 | |||||||||||||||||
Information Systems and Technology | 9,187 | 992 | 8,965 | 903 | 9,159 | 785 | |||||||||||||||||
Marine Systems | 8,202 | 725 | 8,013 | 728 | 7,312 | 703 | |||||||||||||||||
Corporate* | — | (40 | ) | — | (41 | ) | — | (72 | ) | ||||||||||||||
Total | $ | 31,353 | $ | 4,309 | $ | 31,469 | $ | 4,178 | $ | 30,852 | $ | 3,889 | |||||||||||
* Corporate operating results consist primarily of stock option expense.
Following is a discussion of operating results for each of our business groups. For the Aerospace group, results are analyzed for specific types of products and services, consistent with how the group is managed. For the defense groups, the discussion is based on the lines of products and services each group offers with a supplemental discussion of specific contracts and programs when significant to the group’s results. Additional information regarding our business groups can be found in Note Q to the Consolidated Financial Statements in Item 8.
AEROSPACE
Review of 2016 vs. 2015
Year Ended December 31 | 2016 | 2015 | Variance | |||||||||||
Revenue | $ | 8,362 | $ | 8,851 | $ | (489 | ) | (5.5 | )% | |||||
Operating earnings | 1,718 | 1,706 | 12 | 0.7 | % | |||||||||
Operating margin | 20.5 | % | 19.3 | % | ||||||||||
Gulfstream aircraft deliveries (in units): | ||||||||||||||
Green | 128 | 147 | (19 | ) | (12.9 | )% | ||||||||
Outfitted | 115 | 154 | (39 | ) | (25.3 | )% | ||||||||
30
The change in the Aerospace group’s revenue in 2016 consisted of the following:
Aircraft manufacturing, outfitting and completions | $ | (548 | ) |
Aircraft services | 54 | ||
Pre-owned aircraft | 5 | ||
Total decrease | $ | (489 | ) |
Aircraft manufacturing, outfitting and completions revenue decreased in 2016 due primarily to a planned reduction in green and outfitted deliveries of G550 and G450 large-cabin and G280 mid-size aircraft, offset partially by additional deliveries of the ultra-large-cabin G650 aircraft. Aircraft services revenue increased in 2016 driven by higher demand for maintenance work and the acquisition of an aircraft management and charter services provider in 2016. We had one additional pre-owned aircraft sale in 2016 compared with 2015 (eight versus seven).
The change in the group’s operating earnings in 2016 consisted of the following:
Aircraft manufacturing, outfitting and completions | $ | (57 | ) |
Aircraft services | 63 | ||
Pre-owned aircraft | (6 | ) | |
G&A/other expenses | 12 | ||
Total increase | $ | 12 | |
Operating earnings were up slightly in 2016 compared with 2015 despite the top-line decrease in revenue. Aircraft manufacturing, outfitting and completions earnings were down due to fewer green and outfitted aircraft deliveries and the absence of a supplier settlement received in 2015, offset partially by favorable cost performance. The group’s aircraft services operating earnings were particularly strong in 2016 due to a favorable mix of work and improved labor efficiencies. In addition, G&A expenses were lower as a result of cost savings initiatives.
In 2016, the group’s operating margin increased 120 basis points to a record-high 20.5 percent. The margin expansion was driven primarily by ongoing cost savings initiatives and improved operating performance across the group.
Review of 2015 vs. 2014
Year Ended December 31 | 2015 | 2014 | Variance | |||||||||||
Revenue | $ | 8,851 | $ | 8,649 | $ | 202 | 2.3 | % | ||||||
Operating earnings | 1,706 | 1,611 | 95 | 5.9 | % | |||||||||
Operating margin | 19.3 | % | 18.6 | % | ||||||||||
Gulfstream aircraft deliveries (in units): | ||||||||||||||
Green | 147 | 144 | 3 | 2.1 | % | |||||||||
Outfitted | 154 | 150 | 4 | 2.7 | % | |||||||||
The Aerospace group’s revenue and earnings increased in 2015 due primarily to additional deliveries of G650 aircraft. Operating earnings in 2015 were affected favorably by a supplier settlement associated with aircraft component design and delivery delays. Additionally, the group’s services performance reflected a favorable mix of work. Partially offsetting these increases, the group’s performance was impacted by slightly
31
higher net R&D expenses associated with ongoing product-development efforts. Overall the Aerospace group’s operating margin increased 70 basis points to 19.3 percent in 2015.
COMBAT SYSTEMS
Review of 2016 vs. 2015
Year Ended December 31 | 2016 | 2015 | Variance | |||||||||||
Revenue | $ | 5,602 | $ | 5,640 | $ | (38 | ) | (0.7 | )% | |||||
Operating earnings | 914 | 882 | 32 | 3.6 | % | |||||||||
Operating margin | 16.3 | % | 15.6 | % | ||||||||||
The change in the Combat Systems group’s revenue in 2016 consisted of the following:
International military vehicles | $ | (69 | ) |
U.S. military vehicles | 33 | ||
Weapons systems and munitions | (2 | ) | |
Total decrease | $ | (38 | ) |
The transition from engineering to production on a major combat-vehicle contract in the Middle East and the timing of work on the group's contract to upgrade and modernize LAV III combat vehicles for the Canadian army resulted in lower revenue on our international military vehicle programs in 2016. This decrease was offset largely by higher volume on the Stryker program to upgrade vehicles with a 30-millimeter cannon.
Translation of our international businesses’ revenue into U.S. dollars in 2016 has been affected negatively by foreign currency exchange rate fluctuations, continuing a recent trend we have been experiencing. In 2016, the translation impact was due primarily to the strengthening of the U.S. dollar against the Canadian dollar and British pound. Had foreign currency exchange rates in 2016 held constant from 2015, revenue in the Combat Systems group would have increased 1.5 percent over 2015.
The Combat Systems group's operating margin increased 70 basis points in 2016 driven by favorable contract mix and improved operating performance.
Review of 2015 vs. 2014
Year Ended December 31 | 2015 | 2014 | Variance | |||||||||||
Revenue | $ | 5,640 | $ | 5,732 | $ | (92 | ) | (1.6 | )% | |||||
Operating earnings | 882 | 862 | 20 | 2.3 | % | |||||||||
Operating margin | 15.6 | % | 15.0 | % | ||||||||||
Revenue decreased in 2015 due primarily to lower revenue from U.S. military vehicles and weapons systems and munitions. In 2015, revenue from U.S. military vehicles declined as a result of the completion of the Ground Combat Vehicle (GCV) design and development program, offset partially by a ramp-up in work on the Stryker Engineering Change Proposal (ECP) upgrade program. Weapons systems and munitions revenue decreased in 2015 due primarily to lower volume of Hydra-70 rockets and decreased ammunition production for U.S. allies.
32
The Combat Systems group's operating margin increased 60 basis points in 2015 reflecting the group’s strong operating performance and cost cutting across the business, including reduced overhead costs following restructuring activities completed in 2014.
INFORMATION SYSTEMS AND TECHNOLOGY
Review of 2016 vs. 2015
Year Ended December 31 | 2016 | 2015 | Variance | |||||||||||
Revenue | $ | 9,187 | $ | 8,965 | $ | 222 | 2.5 | % | ||||||
Operating earnings | 992 | 903 | 89 | 9.9 | % | |||||||||
Operating margin | 10.8 | % | 10.1 | % | ||||||||||
The change in the Information Systems and Technology group’s revenue in 2016 consisted of the following:
C4ISR solutions | $ | 282 | |
Information technology (IT) services | (60 | ) | |
Total increase | $ | 222 | |
C4ISR solutions revenue increased in 2016 due to higher volume across the business, including the Warfighter Information Network-Tactical (WIN-T) mobile communications network program and several programs in Canada and the United Kingdom. Revenue decreased in 2016 in our IT services business driven by lower volume on our health solutions programs, including decreased contact-center services work for the Centers for Medicare & Medicaid Services.
Operating margin increased 70 basis points in 2016. This margin expansion was driven primarily by strong program performance and favorable contract mix across our portfolio. The group also continued to benefit from the 2015 consolidation of two of our businesses to form General Dynamics Mission Systems. Operating earnings in 2015 included a gain of $23 on the sale of a commercial cyber security product business. Excluding the impact of this gain on the prior-year period, the group's operating margin increased 100 basis points in 2016.
Review of 2015 vs. 2014
Year Ended December 31 | 2015 | 2014 | Variance | |||||||||||
Revenue | $ | 8,965 | $ | 9,159 | $ | (194 | ) | (2.1 | )% | |||||
Operating earnings | 903 | 785 | 118 | 15.0 | % | |||||||||
Operating margin | 10.1 | % | 8.6 | % | ||||||||||
In 2015, revenue was down across the Information Systems and Technology group. IT services revenue decreased due to lower volume on several programs, including our commercial wireless work. Revenue decreased slightly in our C4ISR solutions business due in part to lower volume on the Handheld, Manpack and Small Form Fit (HMS) radio program.
Despite the revenue decline, the group's operating margin increased 150 basis points in 2015 driven primarily by improved program performance and rightsizing across the group, including the favorable impact from the 2015 consolidation of businesses discussed previously. Operating earnings in 2015 also included the $23 gain on the sale of a commercial cyber security product business.
33
MARINE SYSTEMS
Review of 2016 vs. 2015
Year Ended December 31 | 2016 | 2015 | Variance | |||||||||||
Revenue | $ | 8,202 | $ | 8,013 | $ | 189 | 2.4 | % | ||||||
Operating earnings | 725 | 728 | (3 | ) | (0.4 | )% | ||||||||
Operating margin | 8.8 | % | 9.1 | % | ||||||||||
The change in the Marine Systems group’s revenue in 2016 consisted of the following:
U.S. Navy ship engineering, repair and other services | $ | 246 | |
U.S. Navy ship construction | 157 | ||
Commercial ship construction | (214 | ) | |
Total increase | $ | 189 | |
Revenue from U.S. Navy ship engineering, repair and other services increased in 2016 due to additional development work on the Columbia-class submarine program, offset partially by lower volume for U.S. Navy repair work. U.S. Navy ship construction revenue increased in 2016 due to higher volume on Block IV of the Virginia-class submarine program and the Expeditionary Sea Base (ESB) contract, as well as engineering and design work for the TAO-205 next-generation fleet oilers. Jones Act commercial ship construction revenue decreased following the delivery of six ships in 2016.
The Marine Systems group’s operating margin decreased 30 basis points in 2016 driven primarily by cost growth associated with the restart of the Navy's DDG-51 program. The group's operating margin was also affected unfavorably in 2016 by lower-margin engineering services and commercial ship work.
Review of 2015 vs. 2014
Year Ended December 31 | 2015 | 2014 | Variance | |||||||||||
Revenue | $ | 8,013 | $ | 7,312 | $ | 701 | 9.6 | % | ||||||
Operating earnings | 728 | 703 | 25 | 3.6 | % | |||||||||
Operating margin | 9.1 | % | 9.6 | % | ||||||||||
Revenue increased across the Marine Systems group in 2015. U.S. Navy ship construction revenue increased due primarily to higher volume on the Virginia-class submarine program as we completed the ramp-up in construction from one to two submarines per year. Revenue from U.S. Navy ship engineering, repair and other services increased due primarily to development work on the Columbia-class submarine program. Commercial ship construction revenue increased as work ramped up on the group's construction of Jones Act ships.
Operating margin decreased 50 basis points in 2015 due primarily to a shift in contract mix, including a gap in production on the mature ESB program that was replaced by Jones Act commercial ship contracts and the transition from Block III to Block IV of the Virginia-class submarine program. The group's operating margin was also affected unfavorably by cost growth on the Navy's DDG-1000 program and the restart of the DDG-51 program.
34
CORPORATE
Corporate results consist primarily of compensation expense for stock options. Corporate costs totaled $40 in 2016, $41 in 2015 and $72 in 2014. The decrease in 2015 and 2016 expense is due primarily to lower compensation expense for stock options, as options granted beginning in 2015 have a three-year vesting period versus a two-year vesting period for prior option grants. See Note O to the Consolidated Financial Statements in Item 8 for additional information regarding our equity compensation plans. We expect Corporate operating costs in 2017 of approximately $55. The increase over 2015 and 2016 reflects normalized compensation expense for stock options following the previously described vesting period change.
OTHER INFORMATION
PRODUCT AND SERVICE REVENUE AND OPERATING COSTS
Review of 2016 vs. 2015
Year Ended December 31 | 2016 | 2015 | Variance | |||||||||||
Revenue: | ||||||||||||||
Products | $ | 19,885 | $ | 20,280 | $ | (395 | ) | (1.9 | )% | |||||
Services | 11,468 | 11,189 | 279 | 2.5 | % | |||||||||
Operating Costs: | ||||||||||||||
Products | $ | 15,443 | $ | 15,871 | $ | (428 | ) | (2.7 | )% | |||||
Services | 9,661 | 9,468 | 193 | 2.0 | % | |||||||||
The change in product revenue in 2016 consisted of the following:
Aircraft manufacturing, outfitting and completions | $ | (548 | ) |
Ship construction | (57 | ) | |
C4ISR products | 181 | ||
Other, net | 29 | ||
Total decrease | $ | (395 | ) |
Product revenue decreased in 2016 due primarily to fewer aircraft deliveries and decreased Jones Act commercial ship construction volume following the delivery of six ships in 2016. Revenue from C4ISR products increased in 2016 due primarily to higher volume on the WIN-T program. Product operating costs decreased in 2016 consistent with the lower volume on the programs described above.
The change in service revenue in 2016 consisted of the following:
Ship engineering, repair and other services | $ | 246 | |
Other, net | 33 | ||
Total increase | $ | 279 | |
Service revenue increased in 2016 due primarily to additional development work on the Columbia-class submarine program. Service operating costs increased in 2016 consistent with the higher volume described above.
35
Review of 2015 vs. 2014
Year Ended December 31 | 2015 | 2014 | Variance | |||||||||||
Revenue: | ||||||||||||||
Products | $ | 20,280 | $ | 19,564 | $ | 716 | 3.7 | % | ||||||
Services | 11,189 | 11,288 | (99 | ) | (0.9 | )% | ||||||||
Operating Costs: | ||||||||||||||
Products | $ | 15,871 | $ | 15,335 | $ | 536 | 3.5 | % | ||||||
Services | 9,468 | 9,644 | (176 | ) | (1.8 | )% | ||||||||
The change in product revenue in 2015 consisted of the following:
Ship construction | $ | 476 | |
Aircraft manufacturing, outfitting and completions | 200 | ||
Other, net | 40 | ||
Total increase | $ | 716 | |
Ship construction revenue increased in 2015 due to higher volume on the Virginia-class submarine program and commercial Jones Act ships. Aircraft manufacturing, outfitting and completions revenue increased due to additional deliveries of G650 aircraft. Product operating costs increased in 2015 due primarily to higher volume on the programs described above.
The change in service revenue in 2015 consisted of the following:
Ship engineering, repair and other services | $ | 224 | |
IT services | (176 | ) | |
Military vehicle services | (65 | ) | |
Other, net | (82 | ) | |
Total decrease | $ | (99 | ) |
Ship engineering, repair and other services revenue was up in 2015 due to increased development work on the Columbia-class submarine program. IT services revenue decreased due to lower volume on several programs, particularly the group’s commercial wireless work. Military vehicle services revenue decreased due primarily to the completion of the GCV design and development program. Service operating costs decreased in 2015 due primarily to lower volume on the programs described above, as well as cost-reduction efforts in the Information Systems and Technology group.
G&A EXPENSES
As a percentage of revenue, G&A expenses were 6.2 percent in 2016 and 2015 and 6.4 percent in 2014. G&A expenses in 2014 included $29 of severance-related charges in our European military vehicles business in the Combat Systems group. We expect G&A expenses in 2017 to be generally consistent with 2016.
INTEREST, NET
Net interest expense was $91 in 2016, $83 in 2015 and $86 in 2014. We expect full-year 2017 net interest expense to be approximately $110, up from 2016 due primarily to a $500 net increase in long-term debt beginning in the third quarter of 2016 and less interest income on lower cash balances.
36
PROVISION FOR INCOME TAX, NET
Our effective tax rate was 27.6 percent in 2016, 27.7 percent in 2015 and 29.7 percent in 2014. The effective tax rate in 2016 was favorably impacted by increased international activity and the adoption of Accounting Standards Update (ASU) 2016-09. For further discussion of the adoption of ASU 2016-09, see Note A to the Consolidated Financial Statements in Item 8. The decrease in the effective tax rate in 2015 from 2014 was due primarily to the favorable impact of contract close-outs in 2015. For further discussion and a reconciliation of our effective tax rate from the statutory federal rate, see Note E to the Consolidated Financial Statements in Item 8. For 2017, we anticipate a full-year effective tax rate of approximately 28 percent.
DISCONTINUED OPERATIONS, NET OF TAX
In 2013, we settled litigation with the U.S. Navy related to the terminated A-12 aircraft contract in the company’s former tactical military aircraft business. In connection with the settlement, we released some rights to reimbursement of costs on ships under contract at the time at our Bath, Maine, shipyard. As we have progressed through the shipbuilding process, we have determined that the cost associated with this settlement is greater than anticipated. Therefore, in the third quarter of 2016, we recognized an $84 loss, net of tax, to adjust the previously-recognized settlement value. In addition, we recognized a $10 loss, net of tax, in the fourth quarter of 2016 related to an environmental matter associated with a former operation of the company.
In 2014, we entered into an agreement to sell our axle business in the Combat Systems group and recognized a $146 loss, net of tax (the sale was completed in January 2015). In the first quarter of 2016, we recognized a final adjustment of $13 to the loss on the sale of this business.
See Note A to the Consolidated Financial Statements in Item 8 for further discussion of these transactions.
2017 OUTLOOK
Our 2017 outlook has been developed under Accounting Standards Codification (ASC) Topic 606, Revenue from Contracts with Customers, which we adopted on January 1, 2017. We have assessed our 2015 and 2016 operating results under ASC Topic 606 as outlined in the table that follows.
The impact of ASC Topic 606 on our 2015 and 2016 operating results may or may not be representative of the impact on subsequent years' results. As described in the Application of Critical Accounting Policies discussion below, aircraft manufacturing revenue in our Aerospace group will be recognized when control is transferred to the customer, generally at customer acceptance and final delivery of the fully outfitted aircraft. Additionally, use of the cumulative catch-up method of recognizing adjustments in estimated profits on our long-term contracts will require us to recognize the total impact of an adjustment in the period it is identified rather than prospectively over the remaining contract term as we have in the past.
37
Revenue Recognition Accounting Change as of January 1, 2017 | ||||||||||||
Restated Revenue | Restated Operating Earnings | |||||||||||
Year Ended December 31 | 2016 | 2015 | 2016 | 2015 | ||||||||
Aerospace | $ | 7,815 | $ | 9,177 | $ | 1,407 | $ | 1,807 | ||||
Combat Systems | 5,530 | 5,643 | 831 | 886 | ||||||||
Information Systems and Technology | 9,144 | 8,929 | 941 | 895 | ||||||||
Marine Systems | 8,072 | 8,032 | 595 | 748 | ||||||||
Corporate | — | — | (40 | ) | (41 | ) | ||||||
Total | $ | 30,561 | $ | 31,781 | $ | 3,734 | $ | 4,295 | ||||
The following 2017 outlook for each of our business groups is compared with the 2016 restated operating results under the new standard shown in the table above:
• | Aerospace - We expect the Aerospace group’s 2017 revenue to be up about 6 percent from 2016. Operating margin is expected to be in the low-19 percent range. |
• | Combat Systems - We expect the Combat Systems group’s revenue to increase between 6 and 7 percent in 2017. Operating margin is expected to be in the mid-15 percent range. |
• | Information Systems and Technology - We expect the Information Systems and Technology group’s revenue to increase slightly in 2017, with operating margin approximating 11 percent. |
• | Marine Systems - We expect the Marine Systems group’s revenue to decrease slightly in 2017. Operating margin is expected to improve to the mid-8 percent range. |
For further discussion of our adoption of ASC Topic 606, see the Application of Critical Accounting Policies discussion below and Note S to the Consolidated Financial Statements in Item 8.
BACKLOG AND ESTIMATED POTENTIAL CONTRACT VALUE
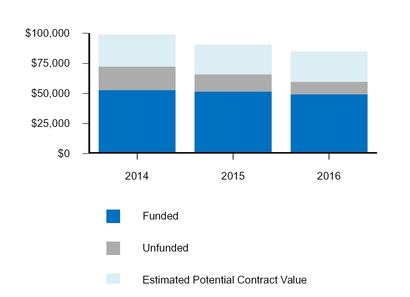
38
Our total backlog, including funded and unfunded portions, was $59.8 billion at the end of 2016, compared with $66.1 billion at the end of 2015. Our total estimated contract value, which combines total backlog with estimated potential contract value, was $84.8 billion on December 31, 2016.
Estimated potential contract value includes work awarded on unfunded indefinite delivery, indefinite quantity (IDIQ) contracts and unexercised options associated with existing firm contracts. Contract options in our defense business represent agreements to perform additional work under existing contracts at the election of the customer. The actual amount of funding received in the future may be higher or lower than our estimate of potential contract value. We recognize options in backlog when the customer exercises the option and establishes a firm order.
AEROSPACE
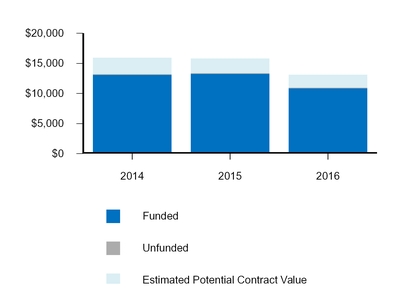
Aerospace funded backlog represents aircraft and custom completion orders for which we have definitive purchase contracts and deposits from customers. Unfunded backlog consists of agreements to provide future aircraft maintenance and support services. The Aerospace group ended 2016 with backlog of $11 billion, compared with $13.4 billion at year-end 2015.
Orders in 2016 reflected solid demand across our product and services portfolio. We continued to receive additional orders for the new family of business jets introduced in 2014, the G500 and G600 aircraft, which are expected to enter into service in 2017 and 2018, respectively, as well as orders for all models of in-production aircraft.
Estimated potential contract value in the Aerospace group represents primarily options to purchase new aircraft and long-term agreements with fleet customers. Estimated potential contract value was $2.1 billion on December 31, 2016, down slightly from $2.4 billion at year-end 2015.
Demand for Gulfstream aircraft remains strong across customer types and geographic regions, generating orders from public and privately held companies, individuals and governments around the world. Geographically, U.S. customers represented over half of the group’s orders in 2016 and approximately 45 percent of the group’s backlog on December 31, 2016, demonstrating continued strong domestic demand.
39
DEFENSE GROUPS
The total backlog in our three defense groups represents the estimated remaining sales value of work to be performed under firm contracts. The funded portion of this backlog includes items that have been authorized and appropriated by Congress and funded by the customer, as well as commitments by international customers that are similarly approved and funded by their governments. We have included in total backlog firm contracts at the amounts that we believe we are likely to receive funding, but there is no guarantee that future budgets and appropriations will provide the funding necessary for a given program.
Total backlog in our defense groups was $48.8 billion on December 31, 2016, down from $52.7 billion at the end of 2015. Estimated potential contract value was $22.9 billion on December 31, 2016, compared with $22 billion at year-end 2015.
COMBAT SYSTEMS
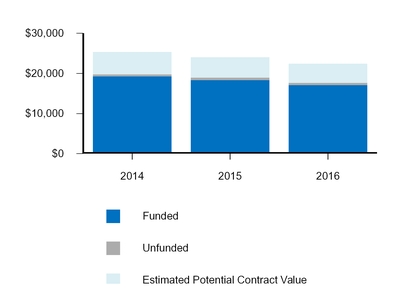
Combat Systems’ total backlog was $17.7 billion at the end of 2016, down from $19 billion at year-end 2015 as the group performs on significant multi-year contracts. The group’s backlog includes remaining work on two major contracts awarded in 2014:
• | $6.8 billion to provide wheeled armored vehicles and logistics support to a Middle Eastern customer through 2028. |
• | $4.3 billion from the U.K. Ministry of Defence to produce AJAX armoured fighting vehicles scheduled for delivery to the British Army between 2017 and 2024 and related in-service support. |
The group also has several additional international military vehicle production contracts in backlog, notably:
• | $640 for light armored vehicles (LAVs) for various non-U.S. customers, including $435 for the upgrade and modernization of LAV III combat vehicles for the Canadian Army. |
• | $510 to produce over 300 armored personnel carriers (APCs) for the Danish Defence Acquisition and Logistics Organization. |
• | $355 to upgrade Duro tactical vehicles for the Swiss government through 2022. |
40
The U.S. Army’s Stryker wheeled combat vehicle program represented $850 of the group’s backlog on December 31, 2016, with vehicles scheduled for delivery through 2018. The group received $900 of Stryker orders in 2016, including awards to produce double-V-hulled vehicles, upgrade vehicles with an integrated 30-millimeter cannon and provide contractor logistics support and engineering services.
The group’s backlog on December 31, 2016, included $810 for Abrams main battle tank modernization and upgrade programs for the Army and U.S. allies around the world, including $210 for M1A2 System Enhancement Program (SEP) components and associated program management and $155 to refurbish and upgrade Abrams main battle tanks to the situational awareness configuration for the Kingdom of Morocco. The group received $500 of Abrams orders in 2016.
The Combat Systems group’s backlog on December 31, 2016, also included $2.3 billion for multiple weapons systems and munitions programs, including $170 received in 2016 from the Army for production of Hydra-70 rockets.
Combat Systems’ estimated potential contract value was $4.7 billion on December 31, 2016, down slightly from $5.1 billion at year-end 2015.
INFORMATION SYSTEMS AND TECHNOLOGY
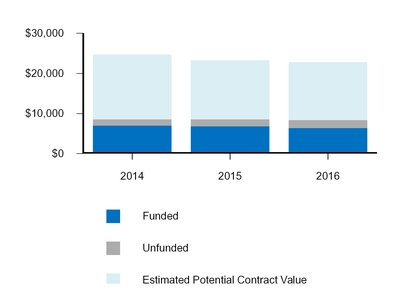
Unlike our other defense businesses, the Information Systems and Technology group’s backlog consists of thousands of contracts and is reconstituted each year with new programs and task order awards. The group’s total backlog was $8.4 billion at the end of 2016, down slightly from $8.6 billion at year-end 2015. This amount does not include $14.3 billion of estimated potential contract value associated with its anticipated share of IDIQ contracts and unexercised options. In 2016, funding under IDIQ contracts and options contributed $3.9 billion to the group’s orders.
The group achieved a book-to-bill ratio (orders divided by revenue) of approximately one-to-one in 2016 driven by several significant contract awards during the year, including the following:
• | $630 from the Centers for Medicare & Medicaid Services for contact-center services, with $335 remaining in backlog at year-end 2016. |
• | $375 from the U.S. Army for ruggedized computing equipment under the Common Hardware Systems-4 (CHS-4) program. $690 of estimated potential contract value remains under this IDIQ contract. |
41
• | $350 for various space payloads. |
• | $270 from the U.S. Department of State to provide supply chain management services. |
• | A contract from the U.S. Census Bureau to provide contact-center systems and operations support for the 2020 Census Questionnaire Assistance program. The contract has a value of $430 over five years. |
The group’s backlog at year-end 2016 also included the following key programs:
• | $840 for the Canadian Maritime Helicopter Project (MHP) to provide integrated mission systems, training and support for Canadian marine helicopters. |
• | $420 of support and modernization work for the intelligence community, the DoD and the Department of Homeland Security, including the St. Elizabeths campus, New Campus East and Enterprise Transport infrastructure programs. |
• | $310 for combat and seaframe control systems for U.S. Navy Independence-variant Littoral Combat Ships (LCS). |
• | $300 to provide fire control system modifications for ballistic-missile (SSBN) submarines. |
• | $295 for the WIN-T mobile communications network program. The group received $230 of orders in 2016 for additional Increment 2 equipment. |
• | $270 for long-term support and capability upgrades for the U.K.’s Bowman tactical communication system. |
MARINE SYSTEMS
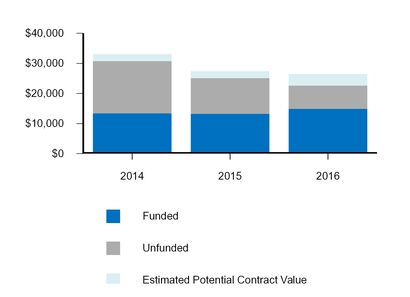
The Marine Systems group’s backlog consists of long-term submarine and ship construction programs, as well as numerous engineering and repair contracts. The group periodically receives large contract awards that provide backlog for several years. This backlog then decreases over subsequent years as the group performs on these contracts. Consistent with this pattern, backlog decreased to $22.7 billion on December 31, 2016, compared with $25.1 billion at the end of 2015.
The Virginia-class submarine program was the company’s largest program in 2016 and the largest contract in the company’s backlog. In 2014, we received a contract for the construction of 10 submarines
42
in Block IV of the program. The group’s backlog at year-end 2016 included $14.1 billion for 15 Virginia-class submarines scheduled for delivery through 2023.
Navy destroyer programs represented $3.5 billion of the group’s backlog at year-end 2016. We have construction contracts for seven DDG-51 destroyers scheduled for delivery through 2022. Backlog at year-end 2016 also included two ships under the DDG-1000 program scheduled for delivery through 2020.
The Marine Systems group’s backlog on December 31, 2016, included $625 for construction of ESB auxiliary support ships. The group has delivered the first three ships in the program and construction is underway on the fourth and fifth ships, scheduled for delivery in 2018 and 2019, respectively.
In 2016, we were awarded a six-ship contract by the Navy for the detailed design and construction of a new class of fleet oilers, the John Lewis class (TAO-205). Backlog at year-end 2016 included $600 for the lead ship. An additional $2.4 billion is included in our estimated potential contract value at year end, representing options for the additional five ships.
The year-end backlog also included $530 for four LNG-conversion-ready Jones Act ships for commercial customers scheduled for delivery through 2020.
Complementing these ship construction programs, engineering services represented approximately $1.8 billion of the Marine Systems group’s backlog on December 31, 2016. Design and development efforts on the Columbia-class ballistic missile submarine program represent $375 of this amount. The approved CR permits the DoD to use specified procurement funds to begin advance procurement and detailed design work for the Columbia-class submarine program, allowing the program to move forward as planned in FY 2017. Additionally, year-end backlog for maintenance, repair and other services totaled $1.5 billion.
FINANCIAL CONDITION, LIQUIDITY AND CAPITAL RESOURCES
We place a strong emphasis on cash flow generation. This focus gives us the flexibility for capital deployment while preserving a strong balance sheet to position us for future opportunities. Cash generated by operating activities over the past three years was deployed to repurchase our common stock, pay dividends and fund capital expenditures.
Our cash balances are invested primarily in time deposits from highly rated banks rated A-/A3 or higher. On December 31, 2016, $1.1 billion of our cash was held by non-U.S. operations. Should this cash be repatriated, it generally would be subject to U.S. federal income tax but would generate offsetting foreign tax credits.
43
Year Ended December 31 | 2016 | 2015 | 2014 | ||||||||
Net cash provided by operating activities | $ | 2,198 | $ | 2,607 | $ | 3,828 | |||||
Net cash (used) provided by investing activities | (426 | ) | 200 | (1,102 | ) | ||||||
Net cash used by financing activities | (2,169 | ) | (4,367 | ) | (3,675 | ) | |||||
Net cash (used) provided by discontinued operations | (54 | ) | (43 | ) | 36 | ||||||
Net decrease in cash and equivalents | (451 | ) | (1,603 | ) | (913 | ) | |||||
Cash and equivalents at beginning of year | 2,785 | 4,388 | 5,301 | ||||||||
Cash and equivalents at end of year | 2,334 | 2,785 | 4,388 | ||||||||
Marketable securities | — | — | 500 | ||||||||
Short- and long-term debt | (3,888 | ) | (3,399 | ) | (3,893 | ) | |||||
Net (debt) cash | $ | (1,554 | ) | $ | (614 | ) | $ | 995 | |||
Debt-to-equity (a) | 35.4 | % | 31.7 | % | 32.9 | % | |||||
Debt-to-capital (b) | 26.2 | % | 24.0 | % | 24.8 | % | |||||
Note: Prior period information has been restated to reflect the reclassification of certain items in accordance with ASU 2016-09. For further discussion of the adoption of ASU 2016-09, see Note A to the Consolidated Financial Statements in Item 8.
(a) | Debt-to-equity ratio is calculated as total debt divided by total equity. |
(b) | Debt-to-capital ratio is calculated as total debt divided by the sum of total debt plus total equity. |
We expect to continue to generate funds in excess of our short- and long-term liquidity needs. We believe we have adequate funds on hand and sufficient borrowing capacity to execute our financial and operating strategy. The following is a discussion of our major operating, investing and financing activities for each of the past three years, as classified on the Consolidated Statement of Cash Flows in Item 8.
OPERATING ACTIVITIES
We generated cash from operating activities of $2.2 billion in 2016, $2.6 billion in 2015 and $3.8 billion in 2014. In all three years, the primary driver of cash flows was net earnings. Operating cash flows in 2014 included significant customer deposits related to a large contract for a Middle Eastern customer awarded in our Combat Systems group. In 2015 and 2016, operating cash flows were affected negatively by growth in operating working capital as these deposits were utilized. In our Aerospace group, the build-up of inventory related to the new G500 and G600 aircraft programs also unfavorably affected operating cash flows in both years.
INVESTING ACTIVITIES
Cash used for investing activities was $426 in 2016 compared with cash provided by investing activities of $200 in 2015 and cash used for investing activities of $1.1 billion in 2014. Our investing activities include cash paid for capital expenditures and business acquisitions; purchases, sales and maturities of marketable securities; and proceeds from asset sales.
Capital Expenditures. The primary use of investing cash in all three years was capital expenditures. Capital expenditures were $392 in 2016, $569 in 2015 and $521 in 2014. We expect capital expenditures of approximately 2 percent of revenue in 2017.
Marketable Securities. In 2015, we received $500 of proceeds from maturing held-to-maturity securities purchased in 2014. Other net purchases, sales and maturities of marketable securities in all three years were not material.
44
Other, Net. Investing activities also include proceeds from the sale of assets and cash paid for business acquisitions. In 2016, we acquired an aircraft management and charter services provider in our Aerospace group and a manufacturer of unmanned underwater vehicles (UUVs) in our Information Systems and Technology group. In 2015, we completed the sale of our axle business in the Combat Systems group and a commercial cyber security business in our Information Systems and Technology group. In 2014, we completed an acquisition of a provider of IT support to U.S. special operations forces in our Information Systems and Technology group.
FINANCING ACTIVITIES
We used $2.2 billion in 2016, $4.4 billion in 2015 and $3.7 billion in 2014 for financing activities. Our financing activities include repurchases of common stock, payment of dividends and debt repayments. Net cash from financing activities also includes proceeds received from debt issuances and employee stock option exercises.
Share Repurchases. We repurchased 14.2 million of our outstanding shares in 2016 for $2 billion, 22.8 million shares in 2015 for $3.2 billion and 29 million shares in 2014 for $3.4 billion. As a result, we have reduced our shares outstanding by approximately 14 percent since the end of 2013. As some of these share repurchases had not settled on December 31, 2016, the associated $35 cash outflow will be reported in the first quarter of 2017. On December 31, 2016, 5.4 million shares remained authorized by our board of directors for repurchase, approximately 2 percent of our total shares outstanding.
Dividends. On March 2, 2016, our board of directors declared an increased quarterly dividend of $0.76 per share, the 19th consecutive annual increase. Previously, the board had increased the quarterly dividend to $0.69 per share in March 2015 and $0.62 per share in March 2014. Cash dividends paid were $911 in 2016, $873 in 2015 and $822 in 2014.
Debt Issuances and Repayments. In 2016, we repaid $500 of fixed-rate notes on their maturity date with cash on hand and issued $1 billion of fixed-rate notes for general corporate purposes. In 2015, we repaid $500 of fixed-rate notes on their scheduled maturity date with the proceeds from maturing marketable securities.
We have no additional material repayments of long-term debt scheduled until $900 of fixed-rate notes mature in November 2017. As we approach the maturity date of this debt, we will determine whether to repay these notes with cash on hand or refinance the obligation. See Note J to the Consolidated Financial Statements in Item 8 for additional information regarding our debt obligations, including scheduled debt maturities and interest rates.
We ended 2016 with no commercial paper outstanding. We have $2 billion in bank credit facilities that remain available, including a $1 billion facility expiring in July 2018 and a $1 billion facility expiring in November 2020. These facilities are for general corporate purposes and working capital needs and are required by credit rating agencies to support our commercial paper issuances. We also have an effective shelf registration on file with the Securities and Exchange Commission that allows us to access the debt markets.
NON-GAAP MANAGEMENT METRICS
We emphasize the efficient conversion of net earnings into cash and the deployment of that cash to maximize shareholder returns. As described below, we use free cash flow and ROIC to measure our performance in
45
these areas. While we believe these metrics provide useful information, they are not defined operating measures under U.S. generally accepted accounting principles (GAAP), and there are limitations associated with their use. Our calculation of these metrics may not be completely comparable to similarly titled measures of other companies due to potential differences in the method of calculation. As a result, the use of these metrics should not be considered in isolation from, or as a substitute for, other GAAP measures.
Free Cash Flow. We define free cash flow from operations as net cash provided by operating activities less capital expenditures. We believe free cash flow from operations is a useful measure for investors because it portrays our ability to generate cash from our businesses for purposes such as repaying maturing debt, funding business acquisitions, repurchasing our common stock and paying dividends. We use free cash flow from operations to assess the quality of our earnings and as a key performance measure in evaluating management. The following table reconciles the free cash flow from operations with net cash provided by operating activities, as classified on the Consolidated Statement of Cash Flows:
Year Ended December 31 | 2016 | 2015 | 2014 | 2013 | 2012 | ||||||||||||||
Net cash provided by operating activities | $ | 2,198 | $ | 2,607 | $ | 3,828 | $ | 3,159 | $ | 2,645 | |||||||||
Capital expenditures | (392 | ) | (569 | ) | (521 | ) | (436 | ) | (436 | ) | |||||||||
Free cash flow from operations | $ | 1,806 | $ | 2,038 | $ | 3,307 | $ | 2,723 | $ | 2,209 | |||||||||
Cash flow as a percentage of earnings from continuing operations: | |||||||||||||||||||
Net cash provided by operating activities | 72 | % | 88 | % | 143 | % | 127 | % | NM* | ||||||||||
Free cash flow from operations | 59 | % | 69 | % | 124 | % | 110 | % | NM* | ||||||||||
* Not meaningful (NM) due to net loss in 2012.
As discussed previously, the decrease in free cash flow from operations in 2016 and 2015 is due primarily to growth in operating working capital in our Aerospace and Combat Systems groups.
Return on Invested Capital. We believe ROIC is a useful measure for investors because it reflects our ability to generate returns from the capital we have deployed in our operations. We use ROIC to evaluate investment decisions and as a performance measure in evaluating management. We define ROIC as net operating profit after taxes divided by average invested capital. Net operating profit after taxes is defined as earnings from continuing operations plus after-tax interest and amortization expense. Average invested capital is defined as the sum of the average debt and shareholders’ equity for the year. ROIC excludes accumulated other comprehensive loss, goodwill impairments and non-economic accounting changes as they are not reflective of our operating performance.
ROIC is calculated as follows:
Year Ended December 31 | 2016 | 2015 | 2014 | 2013 | 2012* | ||||||||||||||
Earnings from continuing operations | $ | 3,062 | $ | 2,965 | $ | 2,673 | $ | 2,486 | $ | 1,414 | |||||||||
After-tax interest expense | 64 | 64 | 67 | 67 | 109 | ||||||||||||||
After-tax amortization expense | 57 | 75 | 79 | 93 | 139 | ||||||||||||||
Net operating profit after taxes | $ | 3,183 | $ | 3,104 | $ | 2,819 | $ | 2,646 | $ | 1,662 | |||||||||
Average invested capital | $ | 17,619 | $ | 17,858 | $ | 18,673 | $ | 18,741 | $ | 19,887 | |||||||||
Return on invested capital | 18.1 | % | 17.4 | % | 15.1 | % | 14.1 | % | 8.4 | % | |||||||||
46
ADDITIONAL FINANCIAL INFORMATION
OFF-BALANCE SHEET ARRANGEMENTS
On December 31, 2016, other than operating leases, we had no material off-balance sheet arrangements.
CONTRACTUAL OBLIGATIONS AND COMMERCIAL COMMITMENTS
The following tables present information about our contractual obligations and commercial commitments on December 31, 2016:
Payments Due by Period | |||||||||||||||||||
Contractual Obligations | Total Amount Committed | Less Than 1 Year | 1-3 Years | 4-5 Years | More Than 5 Years | ||||||||||||||
Long-term debt (a) | $ | 4,791 | $ | 991 | $ | 162 | $ | 661 | $ | 2,977 | |||||||||
Capital lease obligations | 30 | 2 | 5 | 4 | 19 | ||||||||||||||
Operating leases | 1,187 | 241 | 339 | 164 | 443 | ||||||||||||||
Purchase obligations (b) | 26,155 | 11,783 | 9,938 | 3,443 | 991 | ||||||||||||||
Other long-term liabilities (c) | 18,169 | 3,004 | 2,287 | 1,783 | 11,095 | ||||||||||||||
$ | 50,332 | $ | 16,021 | $ | 12,731 | $ | 6,055 | $ | 15,525 | ||||||||||
(a)Includes scheduled interest payments. See Note J to the Consolidated Financial Statements in Item 8 for a discussion of long-term debt.
(b)Includes amounts committed under legally enforceable agreements for goods and services with defined terms as to quantity, price and timing of delivery. This amount includes $16.3 billion of purchase obligations for products and services to be delivered under firm government contracts under which we would expect full recourse under normal contract termination clauses.
(c)Represents other long-term liabilities on our Consolidated Balance Sheet, including the current portion of these liabilities. The projected timing of cash flows associated with these obligations is based on management’s estimates, which are based largely on historical experience. This amount also includes all liabilities under our defined-benefit retirement plans. See Note P to the Consolidated Financial Statements in Item 8 for information regarding these liabilities and the plan assets available to satisfy them.
Amount of Commitment Expiration by Period | |||||||||||||||||||
Commercial Commitments | Total Amount Committed | Less Than 1 Year | 1-3 Years | 4-5 Years | More Than 5 Years | ||||||||||||||
Letters of credit and guarantees* | $ | 1,044 | $ | 560 | $ | 257 | $ | 68 | $ | 159 | |||||||||
* See Note N to the Consolidated Financial Statements in Item 8 for a discussion of letters of credit.
APPLICATION OF CRITICAL ACCOUNTING POLICIES
Management’s Discussion and Analysis of Financial Condition and Results of Operations is based on our Consolidated Financial Statements, which have been prepared in accordance with GAAP. The preparation of financial statements in accordance with GAAP requires that we make estimates and assumptions that affect the reported amounts of assets and liabilities and the disclosure of contingent assets and liabilities at the date of the financial statements, as well as the reported amounts of revenue and expenses during the period. On an ongoing basis, we evaluate our estimates, including most pervasively those related to various assumptions and projections for our long-term contracts and programs. Other significant estimates include those related to goodwill and other intangible assets, income taxes, pension and other post-retirement benefits, workers’ compensation, warranty obligations and litigation and other contingencies. We employ judgment in making our estimates but they are based on historical experience, currently available information and various other assumptions that we believe to be reasonable under the circumstances. The results of these estimates form the basis for making judgments about the carrying values of assets and liabilities that are not readily available from other sources. Actual results may differ from these estimates.
47
We believe that our judgment is applied consistently and produces financial information that fairly depicts the results of operations for all periods presented.
In our opinion, the following policies are critical and require the use of significant judgment in their application:
Revenue Recognition
We account for revenue and earnings using the percentage-of-completion method. Under this method, we recognize contract costs and revenue as the work progresses, either as the products are produced or as services are rendered. We determine progress using either input measures (e.g., costs incurred) or output measures (e.g., contract milestones or units delivered), as appropriate to the circumstances. An input measure is used in most cases unless an output measure is identified that is reliably determinable and representative of progress toward completion. We estimate the profit on a contract as the difference between the total estimated revenue and expected costs to complete a contract and recognize that profit over the life of the contract. If at any time the estimate of contract profitability indicates an anticipated loss on the contract, we recognize the loss in the quarter it is identified.
We generally measure progress toward completion on contracts in our defense business based on the proportion of costs incurred to date relative to total estimated costs at completion. For our contracts for the manufacture of business-jet aircraft, we record revenue at two contractual milestones: when green aircraft are completed and accepted by the customer and when the customer accepts final delivery of the fully outfitted aircraft. We do not recognize revenue at green delivery unless (1) a contract has been executed with the customer and (2) the customer can be expected to satisfy its obligations under the contract, as evidenced by the receipt of deposits from the customer and other factors.
Accounting for long-term contracts and programs involves the use of various techniques to estimate total contract revenue and costs. Contract estimates are based on various assumptions to project the outcome of future events that often span several years. These assumptions include labor productivity and availability, the complexity of the work to be performed, the cost and availability of materials, the performance of subcontractors, and the availability and timing of funding from the customer. We include in our contract estimates additional revenue for submitted contract modifications or claims against the customer when the amount can be estimated reliably and its realization is probable. In evaluating these criteria, we consider the contractual/legal basis for the claim, the cause of any additional costs incurred, the reasonableness of those costs and the objective evidence available to support the claim. We include award or incentive fees in the estimated contract value when there is a basis to reasonably estimate the amount of the fee. Estimates of award or incentive fees are based on historical award experience and anticipated performance. These estimates are based on our best judgment at the time. As a significant change in one or more of these estimates could affect the profitability of our contracts, we review and update our contract-related estimates regularly.
We recognize adjustments in estimated profit on contracts under the reallocation method. Under the reallocation method, the impact of an adjustment in estimate is recognized prospectively over the remaining contract term. The net impact of adjustments in contract estimates on our operating earnings (and on a diluted per-share basis) totaled favorable adjustments of $246 ($0.52) in 2016, $222 ($0.44) in 2015 and $184 ($0.35) in 2014. No adjustment on any one contract was material to our Consolidated Financial Statements in 2016, 2015 or 2014.
Consistent with industry practice, we classify assets and liabilities related to long-term contracts as current, even though some of these amounts may not be realized within one year. All contracts are reported on the Consolidated Balance Sheet in a net asset (contracts in process) or liability (customer advances and
48
deposits) position on a contract-by-contract basis at the end of each reporting period. Our U.S. government customer generally asserts title to, or a security interest in, inventoried costs related to such contracts as a result of advances and progress payments. We reflect these advances and progress payments as an offset to the related inventoried costs.
Change in Revenue Recognition Standard (Adoption of ASC Topic 606). We adopted ASC Topic 606, Revenue from Contracts with Customers, on January 1, 2017. The standard outlines a five-step model whereby revenue is recognized as performance obligations within a contract are satisfied. The standard also requires new, expanded disclosures regarding revenue recognition. We adopted the new standard using the retrospective transition method.
Implementation Plan. Because the new standard impacted our business processes, systems and controls, we developed a comprehensive change management project plan to guide the implementation, which commenced in 2014. This project plan included analyzing the standard’s impact on our contract portfolio, comparing our historical accounting policies and practices to the requirements of the new standard, and identifying differences from applying the requirements of the new standard to our contracts. We developed internal controls to ensure that we adequately evaluated our portfolio of contracts under the five-step model to ensure proper assessment of our operating results under ASC Topic 606. We reported on the progress of the implementation to the Audit Committee and the Board of Directors on a regular basis during the project’s duration.
ASC Topic 606 Impacts. The majority of our long-term contracts will continue to recognize revenue and earnings over time as the work progresses because of the continuous transfer of control to the customer, generally using an input measure (e.g., costs incurred) to reflect progress. The adoption of ASC Topic 606 will have two primary impacts on our portfolio of contracts and our Consolidated Financial Statements. We will be precluded from using the reallocation method of recognizing adjustments in estimated profit on contracts. The total impact of an adjustment in estimated profit recorded to date on a contract will be recognized in the period it is identified (cumulative catch-up method), rather than recognizing the impact of an adjustment prospectively over the remaining contract term. As a result, adjustments in contract estimates may be larger and likely more variable from period to period, particularly on our contracts of greater value and with a longer performance period (for example, in our Marine Systems group). Despite this variability, a contract’s cash flows and overall profitability at completion are the same under the cumulative catch-up method and the reallocation method. Anticipated losses on contracts will continue to be recognized in the quarter they are identified.
For our contracts for the manufacture of business-jet aircraft in the Aerospace group, we will record revenue under ASC Topic 606 at a single point in time when control is transferred to the customer, generally when the customer accepts the fully outfitted aircraft. ASC Topic 606 will not change the total revenue or operating earnings recognized for each aircraft, only the timing of when those amounts are recognized. Prior to the adoption of ASC Topic 606, we recorded revenue for these contracts at two contractual milestones: when green aircraft were completed and accepted by the customer and when the customer accepted final delivery of the fully outfitted aircraft.
Numerous other contracts in our portfolio were impacted by ASC Topic 606, due primarily to the identification of multiple performance obligations within a single contract.
On our Consolidated Balance Sheet, long-term contracts will continue to be reported in a net contract asset (contracts in process) or contract liability (customer advances and deposits) position on a contract-by-contract basis at the end of each reporting period. Business-jet components in our Aerospace group will be reported in inventory until control of the aircraft transfers to the customer. The assessment of our
49
December 31, 2016, Consolidated Balance Sheet under ASC Topic 606 will result in some reclassifications among financial statement accounts, but these reclassifications will not materially change the total amount of net assets as of December 31, 2016.
See Note S to the Consolidated Financial Statements in Item 8 for additional information regarding our adoption of ASC Topic 606.
Long-lived Assets and Goodwill
We review long-lived assets, including intangible assets subject to amortization, for impairment whenever events or changes in circumstances indicate that the carrying value of the asset may not be recoverable. We assess the recoverability of the carrying value of assets held for use based on a review of undiscounted projected cash flows. Impairment losses, where identified, are measured as the excess of the carrying value of the long-lived asset over its estimated fair value.
Goodwill represents the purchase price paid in excess of the fair value of net tangible and intangible assets acquired. Goodwill is not amortized but is subject to an impairment test on an annual basis and when circumstances indicate that an impairment is more likely than not. Such circumstances include a significant adverse change in the business climate for one of our reporting units or a decision to dispose of a reporting unit or a significant portion of a reporting unit. The test for goodwill impairment is a two-step process that requires a significant level of estimation and use of judgment by management, particularly the estimate of the fair value of our reporting units. We estimate the fair value of our reporting units based primarily on the discounted projected cash flows of the underlying operations. This requires numerous assumptions, including the timing of work embedded in our backlog, our performance and profitability under our contracts, our success in securing future business, the appropriate risk-adjusted interest rate used to discount the projected cash flows, and terminal value growth and earnings rates applied to the final year of projected cash flows. Due to the variables inherent in our estimates of fair value, differences in assumptions may have a material effect on the result of our impairment analysis. To assess the reasonableness of our discounted projected cash flows, we compare the sum of our reporting units’ fair value to our market capitalization and calculate an implied control premium (the excess of the sum of the reporting units’ fair values over the market capitalization). Additionally, we evaluate the reasonableness of each reporting unit’s fair value by comparing the fair value to comparable peer companies and recent comparable market transactions.
We completed the required annual goodwill impairment test as of December 31, 2016. The first step of the goodwill impairment test compares the fair values of our reporting units to their carrying values. Our reporting units are consistent with our business groups. The estimated fair values for each of our reporting units were in excess of their respective carrying values as of December 31, 2016.
Commitments and Contingencies
We are subject to litigation and other legal proceedings arising either from the ordinary course of our business or under provisions relating to the protection of the environment. Estimating liabilities and costs associated with these matters requires the use of judgment. We record a charge against earnings when a liability associated with claims or pending or threatened litigation is probable and when our exposure is reasonably estimable. The ultimate resolution of our exposure related to these matters may change as further facts and circumstances become known.
Deferred Contract Costs
Certain costs incurred in the performance of our government contracts are recorded under GAAP but are not allocable currently to contracts. Such costs include a portion of our estimated workers’ compensation obligations, other insurance-related assessments, pension and other post-retirement benefits, and environmental expenses. These costs will become allocable to contracts generally after they are paid. We
50
have elected to defer, or inventory, these costs in contracts in process until they can be allocated to contracts. We expect to recover these costs through ongoing business, including existing backlog and probable follow-on contracts. We regularly assess the probability of recovery of these costs. This assessment requires that we make assumptions about future contract costs, the extent of cost recovery under our contracts and the amount of future contract activity. These estimates are based on our best judgment. If the backlog in the future does not support the continued deferral of these costs, the profitability of our remaining contracts could be adversely affected.
Retirement Plans
Our defined-benefit pension and other post-retirement benefit costs and obligations depend on several assumptions and estimates. The key assumptions include interest rates used to discount estimated future liabilities and projected long-term rates of return on plan assets. We base the discount rates on a current yield curve developed from a portfolio of high-quality, fixed-income investments with maturities consistent with the projected benefit payout period. Beginning in 2016, we refined the method used to determine the service and interest cost components of our net periodic benefit cost. Previously, the cost was determined using a single weighted-average discount rate derived from the yield curve described above. Under the refined method, known as the spot rate approach, we use individual spot rates along the yield curve that correspond with the timing of each service cost and discounted benefit obligation payment. We believe this change provides a more precise measurement of service and interest costs by improving the correlation between projected service cost and discounted benefit obligation cash outflows and corresponding spot rates on the yield curve. Compared to the previous method, the spot rate approach decreased the service and interest components of our benefit costs slightly in 2016. We accounted for this change prospectively as a change in accounting estimate.
We determine the long-term rate of return on assets based on consideration of historical and forward-looking returns and the current and expected asset allocation strategy. Following an assessment of the long-term returns of our various asset classes, we will alter the expected long-term rate of return on assets in our primary U.S. government and commercial pension plans by 75 basis points beginning in 2017, decreasing the weighted average expected long-term rate of return to approximately 7.4 percent. This decrease is not expected to have a material impact on our 2017 benefit costs.
In 2016, we adopted an updated mortality improvement scale published by the Society of Actuaries that reflects a slower average rate of improvement in mortality than in previous years. Additionally, we updated other assumptions to better align them with historical experience and anticipated future experience, including rates of retirement and cost of living increases. The impact of these changes was a net decrease of $247 and $14 in the benefit obligations of our pension and other post-retirement benefit plans, respectively, on December 31, 2016.
These retirement plan estimates are based on our best judgment, including consideration of current and future market conditions. In the event any of the assumptions change, pension and other post-retirement benefit cost could increase or decrease. For further discussion, including the impact of hypothetical changes in the discount rate and expected long-term rate of return on plan assets, see Note P to the Consolidated Financial Statements in Item 8.
As discussed under Deferred Contract Costs, our contractual arrangements with the U.S. government provide for the recovery of benefit costs for our government retirement plans. We have elected to defer recognition of the benefit costs until such costs can be allocated to contracts. Therefore, the impact of annual changes in financial reporting assumptions on the retirement benefit cost for these plans does not immediately affect our operating results.
51
Accounting Standards Updates
See Note A to the Consolidated Financial Statements in Item 8 for information regarding accounting standards we adopted in 2016 and other new accounting standards that have been issued by the FASB but are not effective until after December 31, 2016.
ITEM 7A. QUANTITATIVE AND QUALITATIVE DISCLOSURES ABOUT MARKET RISK
We are exposed to market risk, primarily from foreign currency exchange rates, interest rates, commodity prices and investments. See Note M to the Consolidated Financial Statements in Item 8 for a discussion of these risks. The following quantifies the market risk exposure arising from hypothetical changes in foreign currency exchange rates and interest rates.
We had notional forward exchange contracts outstanding of $6.3 billion on December 31, 2016, and $7.2 billion on December 31, 2015. A 10 percent unfavorable exchange rate movement in our portfolio of forward exchange contracts would have resulted in the following hypothetical, incremental pretax losses:
(Dollars in millions) | 2016 | 2015 | |||||
Recognized | $ | (27 | ) | $ | (8 | ) | |
Unrecognized | (536 | ) | (652 | ) | |||
Foreign Currency. Our exchange-rate sensitivity relates primarily to changes in the Canadian dollar, euro and British pound exchange rates. These losses would be offset by corresponding gains in the remeasurement of the underlying transactions being hedged. We believe these foreign currency forward contracts and the offsetting underlying commitments, when taken together, do not create material market risk.
Interest Rate Risk. Our financial instruments subject to interest rate risk include fixed-rate, long-term debt obligations and variable-rate commercial paper. On December 31, 2016, we had $3.9 billion par value of fixed-rate debt and no commercial paper outstanding. Our fixed-rate debt obligations are not putable, and we do not trade these securities in the market. A 10 percent unfavorable interest rate movement would not have a material impact on the fair value of our debt obligations.
Investment Risk. Our investment policy allows for purchases of fixed-income securities with an investment-grade rating and a maximum maturity of up to five years. On December 31, 2016, we held $2.3 billion in cash and equivalents, but held no marketable securities.
52
ITEM 8. FINANCIAL STATEMENTS AND SUPPLEMENTARY DATA
CONSOLIDATED STATEMENTS OF EARNINGS
Year Ended December 31 | |||||||||||
(Dollars in millions, except per-share amounts) | 2016 | 2015 | 2014 | ||||||||
Revenue: | |||||||||||
Products | $ | 19,885 | $ | 20,280 | $ | 19,564 | |||||
Services | 11,468 | 11,189 | 11,288 | ||||||||
31,353 | 31,469 | 30,852 | |||||||||
Operating costs and expenses: | |||||||||||
Products | 15,443 | 15,871 | 15,335 | ||||||||
Services | 9,661 | 9,468 | 9,644 | ||||||||
General and administrative (G&A) | 1,940 | 1,952 | 1,984 | ||||||||
27,044 | 27,291 | 26,963 | |||||||||
Operating earnings | 4,309 | 4,178 | 3,889 | ||||||||
Interest, net | (91 | ) | (83 | ) | (86 | ) | |||||
Other, net | 13 | 7 | (1 | ) | |||||||
Earnings from continuing operations before income tax | 4,231 | 4,102 | 3,802 | ||||||||
Provision for income tax, net | 1,169 | 1,137 | 1,129 | ||||||||
Earnings from continuing operations | 3,062 | 2,965 | 2,673 | ||||||||
Discontinued operations, net of tax benefit of $51 in 2016, $7 in 2015 and $16 in 2014 | (107 | ) | — | (140 | ) | ||||||
Net earnings | $ | 2,955 | $ | 2,965 | $ | 2,533 | |||||
Earnings per share | |||||||||||
Basic: | |||||||||||
Continuing operations | $ | 10.05 | $ | 9.23 | $ | 7.97 | |||||
Discontinued operations | (0.35 | ) | — | (0.41 | ) | ||||||
Net earnings | $ | 9.70 | $ | 9.23 | $ | 7.56 | |||||
Diluted: | |||||||||||
Continuing operations | $ | 9.87 | $ | 9.08 | $ | 7.83 | |||||
Discontinued operations | (0.35 | ) | — | (0.41 | ) | ||||||
Net earnings | $ | 9.52 | $ | 9.08 | $ | 7.42 | |||||
The accompanying Notes to Consolidated Financial Statements are an integral part of these financial statements.
53
CONSOLIDATED STATEMENTS OF COMPREHENSIVE INCOME
Year Ended December 31 | ||||||||||||
(Dollars in millions) | 2016 | 2015 | 2014 | |||||||||
Net earnings | $ | 2,955 | $ | 2,965 | $ | 2,533 | ||||||
Gains (losses) on cash flow hedges | 191 | (394 | ) | (279 | ) | |||||||
Unrealized (losses) gains on securities | (9 | ) | (2 | ) | 10 | |||||||
Foreign currency translation adjustments | (118 | ) | (374 | ) | (436 | ) | ||||||
Change in retirement plans’ funded status | (192 | ) | 500 | (1,745 | ) | |||||||
Other comprehensive loss, pretax | (128 | ) | (270 | ) | (2,450 | ) | ||||||
(Benefit) provision for income tax, net | (18 | ) | 84 | (703 | ) | |||||||
Other comprehensive loss, net of tax | (110 | ) | (354 | ) | (1,747 | ) | ||||||
Comprehensive income | $ | 2,845 | $ | 2,611 | $ | 786 | ||||||
The accompanying Notes to Consolidated Financial Statements are an integral part of these financial statements.
54
CONSOLIDATED BALANCE SHEETS
December 31 | |||||||
(Dollars in millions) | 2016 | 2015 | |||||
ASSETS | |||||||
Current assets: | |||||||
Cash and equivalents | $ | 2,334 | $ | 2,785 | |||
Accounts receivable | 3,611 | 3,446 | |||||
Contracts in process | 5,282 | 4,357 | |||||
Inventories | 3,523 | 3,366 | |||||
Other current assets | 697 | 617 | |||||
Total current assets | 15,447 | 14,571 | |||||
Noncurrent assets: | |||||||
Property, plant and equipment, net | 3,467 | 3,466 | |||||
Intangible assets, net | 678 | 763 | |||||
Goodwill | 11,445 | 11,443 | |||||
Other assets | 1,835 | 1,754 | |||||
Total noncurrent assets | 17,425 | 17,426 | |||||
Total assets | $ | 32,872 | $ | 31,997 | |||
LIABILITIES AND SHAREHOLDERS’ EQUITY | |||||||
Current liabilities: | |||||||
Short-term debt and current portion of long-term debt | $ | 900 | $ | 501 | |||
Accounts payable | 2,538 | 1,964 | |||||
Customer advances and deposits | 4,939 | 5,674 | |||||
Other current liabilities | 4,469 | 4,306 | |||||
Total current liabilities | 12,846 | 12,445 | |||||
Noncurrent liabilities: | |||||||
Long-term debt | 2,988 | 2,898 | |||||
Other liabilities | 6,062 | 5,916 | |||||
Commitments and contingencies (see Note N) | |||||||
Total noncurrent liabilities | 9,050 | 8,814 | |||||
Shareholders’ equity: | |||||||
Common stock | 482 | 482 | |||||
Surplus | 2,819 | 2,730 | |||||
Retained earnings | 25,227 | 23,204 | |||||
Treasury stock | (14,156 | ) | (12,392 | ) | |||
Accumulated other comprehensive loss | (3,396 | ) | (3,286 | ) | |||
Total shareholders’ equity | 10,976 | 10,738 | |||||
Total liabilities and shareholders’ equity | $ | 32,872 | $ | 31,997 | |||
55
CONSOLIDATED STATEMENTS OF CASH FLOWS
Year Ended December 31 | |||||||||||
(Dollars in millions) | 2016 | 2015 | 2014 | ||||||||
Cash flows from operating activities - continuing operations: | |||||||||||
Net earnings | $ | 2,955 | $ | 2,965 | $ | 2,533 | |||||
Adjustments to reconcile net earnings to net cash provided by operating activities: | |||||||||||
Depreciation of property, plant and equipment | 366 | 366 | 375 | ||||||||
Amortization of intangible assets | 88 | 116 | 121 | ||||||||
Equity-based compensation expense | 100 | 110 | 128 | ||||||||
Deferred income tax provision | 376 | 167 | 136 | ||||||||
Discontinued operations, net of tax | 107 | — | 140 | ||||||||
(Increase) decrease in assets, net of effects of business acquisitions: | |||||||||||
Accounts receivable | (161 | ) | 604 | 330 | |||||||
Contracts in process | (1,033 | ) | 231 | 281 | |||||||
Inventories | (154 | ) | (156 | ) | (303 | ) | |||||
Increase (decrease) in liabilities, net of effects of business acquisitions: | |||||||||||
Accounts payable | 567 | (89 | ) | (161 | ) | ||||||
Customer advances and deposits | (825 | ) | (1,756 | ) | 691 | ||||||
Other current liabilities | (30 | ) | (52 | ) | (229 | ) | |||||
Other, net | (158 | ) | 101 | (214 | ) | ||||||
Net cash provided by operating activities | 2,198 | 2,607 | 3,828 | ||||||||
Cash flows from investing activities: | |||||||||||
Capital expenditures | (392 | ) | (569 | ) | (521 | ) | |||||
Maturities of held-to-maturity securities | — | 500 | — | ||||||||
Purchases of held-to-maturity securities | — | — | (500 | ) | |||||||
Proceeds from sales of assets | 9 | 291 | 102 | ||||||||
Other, net | (43 | ) | (22 | ) | (183 | ) | |||||
Net cash (used) provided by investing activities | (426 | ) | 200 | (1,102 | ) | ||||||
Cash flows from financing activities: | |||||||||||
Purchases of common stock | (1,996 | ) | (3,233 | ) | (3,382 | ) | |||||
Proceeds from fixed-rate notes | 992 | — | — | ||||||||
Dividends paid | (911 | ) | (873 | ) | (822 | ) | |||||
Repayment of fixed-rate notes | (500 | ) | (500 | ) | — | ||||||
Proceeds from stock option exercises | 292 | 268 | 547 | ||||||||
Other, net | (46 | ) | (29 | ) | (18 | ) | |||||
Net cash used by financing activities | (2,169 | ) | (4,367 | ) | (3,675 | ) | |||||
Net cash (used) provided by discontinued operations | (54 | ) | (43 | ) | 36 | ||||||
Net decrease in cash and equivalents | (451 | ) | (1,603 | ) | (913 | ) | |||||
Cash and equivalents at beginning of year | 2,785 | 4,388 | 5,301 | ||||||||
Cash and equivalents at end of year | $ | 2,334 | $ | 2,785 | $ | 4,388 | |||||
The accompanying Notes to Consolidated Financial Statements are an integral part of these financial statements.
56
CONSOLIDATED STATEMENTS OF SHAREHOLDERS’ EQUITY
Common Stock | Retained | Treasury | Accumulated Other Comprehensive | Total Shareholders’ | |||||||||||||||||||
(Dollars in millions) | Par | Surplus | Earnings | Stock | Loss | Equity | |||||||||||||||||
December 31, 2013 | $ | 482 | $ | 2,226 | $ | 19,428 | $ | (6,450 | ) | $ | (1,185 | ) | $ | 14,501 | |||||||||
Net earnings | — | — | 2,533 | — | — | 2,533 | |||||||||||||||||
Cash dividends declared | — | — | (834 | ) | — | — | (834 | ) | |||||||||||||||
Equity-based awards | — | 322 | — | 436 | — | 758 | |||||||||||||||||
Shares purchased | — | — | — | (3,382 | ) | — | (3,382 | ) | |||||||||||||||
Other comprehensive loss | — | — | — | — | (1,747 | ) | (1,747 | ) | |||||||||||||||
December 31, 2014 | 482 | 2,548 | 21,127 | (9,396 | ) | (2,932 | ) | 11,829 | |||||||||||||||
Net earnings | — | — | 2,965 | — | — | 2,965 | |||||||||||||||||
Cash dividends declared | — | — | (888 | ) | — | — | (888 | ) | |||||||||||||||
Equity-based awards | — | 182 | — | 237 | — | 419 | |||||||||||||||||
Shares purchased | — | — | — | (3,233 | ) | — | (3,233 | ) | |||||||||||||||
Other comprehensive loss | — | — | — | — | (354 | ) | (354 | ) | |||||||||||||||
December 31, 2015 | 482 | 2,730 | 23,204 | (12,392 | ) | (3,286 | ) | 10,738 | |||||||||||||||
Net earnings | — | — | 2,955 | — | — | 2,955 | |||||||||||||||||
Cash dividends declared | — | — | (932 | ) | — | — | (932 | ) | |||||||||||||||
Equity-based awards | — | 89 | — | 267 | — | 356 | |||||||||||||||||
Shares purchased | — | — | — | (2,031 | ) | — | (2,031 | ) | |||||||||||||||
Other comprehensive loss | — | — | — | — | (110 | ) | (110 | ) | |||||||||||||||
December 31, 2016 | $ | 482 | $ | 2,819 | $ | 25,227 | $ | (14,156 | ) | $ | (3,396 | ) | $ | 10,976 | |||||||||
The accompanying Notes to Consolidated Financial Statements are an integral part of these financial statements.
57
NOTES TO CONSOLIDATED FINANCIAL STATEMENTS
(Dollars in millions, except per-share amounts or unless otherwise noted)
A. SUMMARY OF SIGNIFICANT ACCOUNTING POLICIES
Organization. General Dynamics is organized into four business groups: Aerospace, which produces Gulfstream aircraft, provides aircraft services and performs aircraft completions for other original equipment manufacturers (OEMs); Combat Systems, which designs and manufactures combat vehicles, weapons systems and munitions; Information Systems and Technology, which provides C4ISR (command, control, communication, computers, intelligence, surveillance and reconnaissance) solutions and information technology (IT) services; and Marine Systems, which designs, constructs and repairs surface ships and submarines. Our primary customer is the U.S. government. We also do significant business with non-U.S. governments and a diverse base of corporate and individual buyers of business aircraft.
Basis of Consolidation and Classification. The Consolidated Financial Statements include the accounts of General Dynamics Corporation and our wholly owned and majority-owned subsidiaries. We eliminate all inter-company balances and transactions in the Consolidated Financial Statements. Some prior-year amounts have been reclassified among financial statement accounts or disclosures to conform to the current-year presentation.
Use of Estimates. The nature of our business requires that we make a number of estimates and assumptions in accordance with U.S. generally accepted accounting principles (GAAP). These estimates and assumptions affect the reported amounts of assets and liabilities and the disclosure of contingent assets and liabilities at the date of the financial statements, as well as the reported amounts of revenue and expenses during the reporting period. We base our estimates on historical experience, currently available information and various other assumptions that we believe are reasonable under the circumstances. Actual results could differ from these estimates.
Revenue Recognition. We account for revenue and earnings using the percentage-of-completion method. Under this method, we recognize contract costs and revenue as the work progresses, either as the products are produced or as services are rendered. We estimate the profit on a contract as the difference between the total estimated revenue and expected costs to complete a contract and recognize that profit over the life of the contract. If at any time the estimate of contract profitability indicates an anticipated loss on the contract, we recognize the loss in the quarter it is identified.
We generally measure progress toward completion on contracts in our defense business based on the proportion of costs incurred to date relative to total estimated costs at completion. For our contracts for the manufacture of business-jet aircraft, we record revenue at two contractual milestones: when green aircraft are completed and accepted by the customer and when the customer accepts final delivery of the fully outfitted aircraft.
We review and update our contract-related estimates regularly. We recognize adjustments in estimated profit on contracts under the reallocation method. Under the reallocation method, the impact of an adjustment in estimate is recognized prospectively over the remaining contract term. The net impact of adjustments in contract estimates on our operating earnings (and on a diluted per-share basis) totaled favorable adjustments of $246 ($0.52) in 2016, $222 ($0.44) in 2015 and $184 ($0.35) in 2014. No adjustment on any one contract was material to our Consolidated Financial Statements in 2016, 2015 or 2014.
Consistent with industry practice, we classify assets and liabilities related to long-term contracts as current, even though some of these amounts may not be realized within one year. All contracts are reported
58
on the Consolidated Balance Sheet in a net asset (contracts in process) or liability (customer advances and deposits) position on a contract-by-contract basis at the end of each reporting period. Our U.S. government customer generally asserts title to, or a security interest in, inventoried costs related to such contracts as a result of advances and progress payments. We reflect these advances and progress payments as an offset to the related inventoried costs as shown in Note G.
In 2014, the Financial Accounting Standards Board (FASB) issued Accounting Standards Update (ASU) 2014-09, Revenue from Contracts with Customers (Topic 606). We adopted ASU 2014-09 and several associated ASUs on January 1, 2017. For further discussion of our adoption of Accounting Standards Codification (ASC) Topic 606, including our 2015 and 2016 operating results under the new standard, see Note S.
Discontinued Operations. In 2013, we settled litigation with the U.S. Navy related to the terminated A-12 aircraft contract in the company’s former tactical military aircraft business. In connection with the settlement, we released some rights to reimbursement of costs on ships under contract at the time at our Bath, Maine, shipyard. As we have progressed through the shipbuilding process, we have determined that the cost associated with this settlement is greater than anticipated. Therefore, in the third quarter of 2016, we recognized an $84 loss, net of tax, to adjust the previously-recognized settlement value. In addition, we recognized a $10 loss, net of tax, in the fourth quarter of 2016 related to an environmental matter associated with a former operation of the company.
In 2014, we entered into an agreement to sell our axle business in the Combat Systems group and recognized a $146 loss, net of tax (the sale was completed in January 2015). The financial statements reflect the results of operations of this business in discontinued operations with the revenue of the business eliminated, and the net loss reported separately below earnings from continuing operations. In the first quarter of 2016, we recognized a final adjustment of $13 to the loss on the sale of this business.
Research and Development Expenses. Company-sponsored research and development (R&D) expenses, including product development costs, were $418 in 2016, $395 in 2015 and $358 in 2014. R&D expenses are included in operating costs and expenses in the Consolidated Statements of Earnings in the period in which they are incurred. Customer-sponsored R&D expenses are charged directly to the related contracts.
The Aerospace group has cost-sharing arrangements with some of its suppliers that enhance the group’s internal development capabilities and offset a portion of the financial cost associated with the group’s product development efforts. These arrangements explicitly state that supplier contributions are for reimbursements of costs we incur in the development of new aircraft models and technologies, and we retain substantial rights in the products developed under these arrangements. We record amounts received from these cost-sharing arrangements as a reduction of R&D expenses. We have no obligation to refund any amounts received under the agreements regardless of the outcome of the development efforts. Under the typical terms of an agreement, payments received from suppliers for their share of the costs are based on milestones and are recognized as received. Our policy is to defer payments in excess of the costs we have incurred.
Interest, Net. Net interest expense consisted of the following:
Year Ended December 31 | 2016 | 2015 | 2014 | ||||||||
Interest expense | $ | 99 | $ | 98 | $ | 103 | |||||
Interest income | (8 | ) | (15 | ) | (17 | ) | |||||
Interest expense, net | $ | 91 | $ | 83 | $ | 86 | |||||
59
Cash and Equivalents and Investments in Debt and Equity Securities. We consider securities with a maturity of three months or less to be cash equivalents. Our investments in other securities are included in other current and noncurrent assets on the Consolidated Balance Sheet (see Note D). We report our held-to-maturity securities at amortized cost. We report our available-for-sale securities at fair value. Changes in the fair value of available-for-sale securities are recognized as a component of other comprehensive income (loss) in the Consolidated Statement of Comprehensive Income. We had no trading securities on December 31, 2016 or 2015.
Cash flows from operating activities in 2014 included customer deposits related to a large contract for a Middle Eastern customer awarded in our Combat Systems group. In 2015 and 2016, operating cash flows were affected negatively by growth in operating working capital as these deposits were utilized.
Long-lived Assets and Goodwill. We review long-lived assets, including intangible assets subject to amortization, for impairment whenever events or changes in circumstances indicate that the carrying value of the asset may not be recoverable. We assess the recoverability of the carrying value of assets held for use based on a review of undiscounted projected cash flows. Impairment losses, where identified, are measured as the excess of the carrying value of the long-lived asset over its estimated fair value as determined by discounted projected cash flows.
We review goodwill for impairment annually or when circumstances indicate that an impairment is more likely than not. Goodwill represents the purchase price paid in excess of the fair value of net tangible and intangible assets acquired. The test for goodwill impairment is a two-step process to first identify potential goodwill impairment for each reporting unit and then, if necessary, measure the amount of the impairment loss. Our reporting units are consistent with our business groups in Note Q. We completed the required annual goodwill impairment test as of December 31, 2016. The first step of the goodwill impairment test compares the fair value of each of our reporting units to its carrying value. We estimate the fair value of our reporting units based primarily on the discounted projected cash flows of the underlying operations. The estimated fair value for each of our reporting units was in excess of its respective carrying values as of December 31, 2016. For a summary of our goodwill by reporting unit, see Note B.
Accounting Standards Updates. We adopted the standards described below in 2016:
• | ASU 2015-07, Fair Value Measurement (Topic 820): Disclosures for Investments in Certain Entities That Calculate Net Asset Value per Share (or Its Equivalent). ASU 2015-07 removes from the fair value hierarchy all investments for which fair value is measured using net asset value per share (NAV) as a practical expedient. As the ASU was adopted retrospectively, we have restated our prior-period investments in Note P accordingly. None of our investments in Note D are measured using NAV as a practical expedient. |
• | ASU 2016-09, Compensation - Stock Compensation (Topic 718): Improvements to Employee Share-Based Payment Accounting. ASU 2016-09 impacted several aspects of our accounting for share-based payment transactions. The ASU requires that excess tax benefits and tax deficiencies (the difference between the deduction for tax purposes and the compensation cost recognized for financial reporting purposes) be recognized as income tax expense or benefit in the Consolidated Statement of Earnings. Previously, these amounts were recognized directly to shareholders' equity. In the Consolidated Statement of Cash Flows, the excess tax benefit from equity-based compensation, previously classified as a financing activity, is now classified as an operating activity. Additionally, cash paid when directly withholding shares on an employee's behalf for tax withholding purposes is classified as a financing activity. |
60
The impact of the adoption in 2016 was a tax benefit of approximately $84. As this area of the ASU permits only prospective adoption, there was no impact on our 2015 or 2014 Consolidated Financial Statements.
In the Consolidated Statement of Cash Flows, the impact of the adoption in 2016 was a $123 increase in net cash provided by operating activities and a corresponding $123 increase in net cash used by financing activities. The areas of the ASU that relate to the Consolidated Statement of Cash Flows were adopted retrospectively. We have therefore restated our prior-period Consolidated Statements of Cash Flows accordingly, resulting in a $108 and $100 increase in net cash provided by operating activities and a corresponding $108 and $100 increase in net cash used by financing activities for the years ended December 31, 2015 and 2014, respectively. The other aspects of the ASU did not have a material impact on our results of operations, financial condition or cash flows.
There are several other new accounting standards that have been issued by the FASB but are not effective until after December 31, 2016, including the following:
• | ASU 2015-17, Income Taxes (Topic 740): Balance Sheet Classification of Deferred Taxes. ASU 2015-17 requires that deferred tax assets and liabilities be classified as noncurrent on the Consolidated Balance Sheet. We adopted the standard prospectively on the effective date, January 1, 2017. The adoption of ASU 2015-17 resulted in reclassifications among financial statement accounts, but these reclassifications did not change the total amount of our net deferred tax asset. |
• | ASU 2016-01, Financial Instruments - Overall (Subtopic 825-10): Recognition and Measurement of Financial Assets and Financial Liabilities. ASU 2016-01 addresses certain aspects of recognition, measurement, presentation and disclosure of financial instruments. Specific to our business, ASU 2016-01 requires equity investments to be measured at fair value with changes in fair value recognized in net income. The ASU eliminates the available-for-sale classification for equity investments that recognized changes in the fair value as a component of other comprehensive income. We intend to adopt the standard on the effective date with a cumulative-effect adjustment to the Consolidated Balance Sheet as of January 1, 2018. We do not expect the adoption of ASU 2016-01 to have a material effect on our results of operations, financial condition or cash flows. |
• | ASU 2016-02, Leases (Topic 842). ASU 2016-02 requires the recognition of lease rights and obligations as assets and liabilities on the balance sheet. Previously, lessees were not required to recognize on the balance sheet assets and liabilities arising from operating leases. The ASU also requires disclosure of key information about leasing arrangements. ASU 2016-02 is effective on January 1, 2019, using the modified retrospective method of adoption, with early adoption permitted. We are in the preliminary phases of assessing the effect of the ASU on our portfolio of leases. While this assessment continues, we have not yet selected a transition date nor have we yet determined the effect of the ASU on our results of operations, financial condition or cash flows. |
• | ASU 2016-15, Statement of Cash Flows (Topic 230): Classification of Certain Cash Receipts and Cash Payments. ASU 2016-15 is intended to reduce diversity in practice in how certain cash receipts and cash payments are presented and classified in the Consolidated Statement of Cash Flows by providing guidance on eight specific cash flow issues. ASU 2016-15 is effective retrospectively on January 1, 2018, with early adoption permitted. We have not yet determined the effect of the ASU on our results of operations, financial condition or cash flows nor have we selected a transition date. |
• | ASU 2016-16, Income Taxes (Topic 740): Intra-Entity Transfers of Assets Other Than Inventory. ASU 2016-16 requires recognition of the current and deferred income tax effects of an intra-entity asset transfer, other than inventory, when the transfer occurs, as opposed to current GAAP, which requires companies to defer the income tax effects of intra-entity asset transfers until the asset has been sold to an outside party. The income tax effects of intra-entity inventory transfers will continue to be deferred |
61
until the inventory is sold. ASU 2016-16 is effective on January 1, 2018, with early adoption permitted. The standard is required to be adopted on a modified retrospective basis with a cumulative-effect adjustment recorded to retained earnings as of the beginning of the period of adoption. We have not yet determined the effect of the ASU on our results of operations, financial condition or cash flows nor have we selected a transition date.
• | ASU 2016-18, Statement of Cash Flows (Topic 230): Restricted Cash. ASU 2016-18 is intended to reduce diversity in practice in the classification and presentation of changes in restricted cash on the Consolidated Statement of Cash Flows. The ASU requires that the Consolidated Statement of Cash Flows explain the change in total cash and equivalents and amounts generally described as restricted cash or restricted cash equivalents when reconciling the beginning-of-period and end-of-period total amounts. The ASU also requires a reconciliation between the total of cash and equivalents and restricted cash presented on the Consolidated Statement of Cash Flows and the cash and equivalents balance presented on the Consolidated Balance Sheet. ASU 2016-18 is effective retrospectively on January 1, 2018, with early adoption permitted. We have not yet selected a transition date. We do not expect the adoption of ASU 2016-18 to have a material effect on our results of operations, financial condition or cash flows. |
B. ACQUISITIONS AND DIVESTITURES, GOODWILL, AND INTANGIBLE ASSETS
Acquisitions and Divestitures
In 2016, we acquired an aircraft management and charter services provider in our Aerospace group and a manufacturer of unmanned underwater vehicles (UUVs) in our Information Systems and Technology group. We did not acquire any businesses in 2015. In 2014, our Information Systems and Technology group acquired a provider of IT support to U.S. special operations forces. As the purchase prices of these acquisitions are not material, they are included in other investing activities in the Consolidated Statement of Cash Flows.
The operating results of these acquisitions have been included with our reported results since the respective closing dates. The purchase prices of the acquisitions have been allocated to the estimated fair value of net tangible and intangible assets acquired, with any excess purchase price recorded as goodwill.
In 2015, we completed the sale of our axle business in our Combat Systems group and a commercial cyber security business in our Information Systems and Technology group.
Goodwill
The changes in the carrying amount of goodwill by reporting unit were as follows:
Aerospace | Combat Systems | Information Systems and Technology | Marine Systems | Total Goodwill | |||||||||||||||
December 31, 2014 (a) | $ | 2,555 | $ | 2,750 | $ | 6,137 | $ | 289 | $ | 11,731 | |||||||||
Acquisitions/divestitures (b) | — | — | (76 | ) | — | (76 | ) | ||||||||||||
Other (c) | (13 | ) | (159 | ) | (40 | ) | — | (212 | ) | ||||||||||
December 31, 2015 | 2,542 | 2,591 | 6,021 | 289 | 11,443 | ||||||||||||||
Acquisitions (b) | 29 | — | 2 | — | 31 | ||||||||||||||
Other (c) | (34 | ) | 7 | (10 | ) | 8 | (29 | ) | |||||||||||
December 31, 2016 | $ | 2,537 | $ | 2,598 | $ | 6,013 | $ | 297 | $ | 11,445 | |||||||||
(a)Goodwill on December 31, 2014, in the Information Systems and Technology reporting unit is net of $2 billion of accumulated impairment losses.
(b)Includes adjustments during the purchase price allocation period and an allocation of goodwill associated with the 2015 sale of a commercial cyber security business discussed above.
(c)Consists primarily of adjustments for foreign currency translation.
62
Intangible Assets
Intangible assets consisted of the following:
Gross Carrying Amount (a) | Accumulated Amortization | Net Carrying Amount | Gross Carrying Amount (a) | Accumulated Amortization | Net Carrying Amount | ||||||||||||||
December 31 | 2016 | 2015 | |||||||||||||||||
Contract and program intangible assets (b) | $ | 1,633 | $ | (1,281 | ) | $ | 352 | $ | 1,626 | $ | (1,214 | ) | $ | 412 | |||||
Trade names and trademarks | 446 | (139 | ) | 307 | 455 | (127 | ) | 328 | |||||||||||
Technology and software | 121 | (102 | ) | 19 | 119 | (96 | ) | 23 | |||||||||||
Other intangible assets | 154 | (154 | ) | — | 154 | (154 | ) | — | |||||||||||
Total intangible assets | $ | 2,354 | $ | (1,676 | ) | $ | 678 | $ | 2,354 | $ | (1,591 | ) | $ | 763 | |||||
(a)Change in gross carrying amounts consists primarily of adjustments for foreign currency translation and acquired intangible assets.
(b)Consists of acquired backlog and probable follow-on work and associated customer relationships.
We did not recognize any impairments of our intangible assets in 2016, 2015 or 2014. The amortization lives (in years) of our intangible assets on December 31, 2016, were as follows:
Range of Amortization Life | ||
Contract and program intangible assets | 7-30 | |
Trade names and trademarks | 30 | |
Technology and software | 7-15 | |
Amortization expense was $88 in 2016, $116 in 2015 and $121 in 2014. We expect to record annual amortization expense over the next five years as follows:
2017 | $ | 74 | |
2018 | 66 | ||
2019 | 51 | ||
2020 | 48 | ||
2021 | 43 | ||
C. EARNINGS PER SHARE
We compute basic earnings per share (EPS) using net earnings for the period and the weighted average number of common shares outstanding during the period. Basic weighted average shares outstanding have decreased throughout 2016 and 2015 due to share repurchases. See Note L for additional details of our share repurchases. Diluted EPS incorporates the additional shares issuable upon the assumed exercise of stock options and the release of restricted stock and restricted stock units (RSUs). The dilutive effect of stock options and restricted stock/RSUs increased because of the adoption of ASU 2016-09 in 2016. See Note A for additional detail of our adoption of this accounting standard.
63
Basic and diluted weighted average shares outstanding were as follows (in thousands):
Year Ended December 31 | 2016 | 2015 | 2014 | |||
Basic weighted average shares outstanding | 304,707 | 321,313 | 335,192 | |||
Dilutive effect of stock options and restricted stock/RSUs* | 5,680 | 5,339 | 6,139 | |||
Diluted weighted average shares outstanding | 310,387 | 326,652 | 341,331 | |||
* Excludes outstanding options to purchase shares of common stock because these options had exercise prices in excess of the average market price of our common stock during the year and therefore the effect of including these options would be antidilutive. These options totaled 4,201 in 2016, 1,706 in 2015 and 3,683 in 2014.
D. FAIR VALUE
Fair value is defined as the price that would be received to sell an asset or paid to transfer a liability in the principal or most advantageous market in an orderly transaction between marketplace participants. Various valuation approaches can be used to determine fair value, each requiring different valuation inputs. The following hierarchy classifies the inputs used to determine fair value into three levels:
• | Level 1 - quoted prices in active markets for identical assets or liabilities; |
• | Level 2 - inputs, other than quoted prices, observable by a marketplace participant either directly or indirectly; and |
• | Level 3 - unobservable inputs significant to the fair value measurement. |
We did not have any significant non-financial assets or liabilities measured at fair value on December 31, 2016 or 2015.
Our financial instruments include cash and equivalents and other investments, accounts receivable and payable, short- and long-term debt, and derivative financial instruments. The carrying values of cash and equivalents, accounts receivable and payable, and short-term debt on the Consolidated Balance Sheet approximate their fair value. The following tables present the fair values of our other financial assets and liabilities on December 31, 2016 and 2015, and the basis for determining their fair values:
Carrying Value | Fair Value | Quoted Prices in Active Markets for Identical Assets (Level 1) | Significant Other Observable Inputs (Level 2) (b) | ||||||||||||
Financial Assets (Liabilities) (a) | December 31, 2016 | ||||||||||||||
Available-for-sale securities | $ | 177 | $ | 177 | $ | 59 | $ | 118 | |||||||
Derivatives | (477 | ) | (477 | ) | — | (477 | ) | ||||||||
Long-term debt, including current portion | (3,924 | ) | (3,849 | ) | — | (3,849 | ) | ||||||||
December 31, 2015 | |||||||||||||||
Available-for-sale securities | $ | 186 | $ | 186 | $ | 92 | $ | 94 | |||||||
Derivatives | (673 | ) | (673 | ) | — | (673 | ) | ||||||||
Long-term debt, including current portion | (3,425 | ) | (3,381 | ) | — | (3,381 | ) | ||||||||
(a)We had no Level 3 financial instruments on December 31, 2016 or 2015.
(b)Determined under a market approach using valuation models that incorporate observable inputs such as interest rates, bond yields and quoted prices for similar assets and liabilities.
64
E. INCOME TAXES
Income Tax Provision. We calculate our provision for federal, state and international income taxes based on current tax law. The reported tax provision differs from the amounts currently receivable or payable because some income and expense items are recognized in different time periods for financial reporting than for income tax purposes. The following is a summary of our net provision for income taxes for continuing operations:
Year Ended December 31 | 2016 | 2015 | 2014 | ||||||||
Current: | |||||||||||
U.S. federal | $ | 698 | $ | 841 | $ | 856 | |||||
State | 24 | 31 | 31 | ||||||||
International | 71 | 98 | 106 | ||||||||
Total current | 793 | 970 | 993 | ||||||||
Deferred: | |||||||||||
U.S. federal | 316 | 116 | 110 | ||||||||
State | 14 | 5 | (3 | ) | |||||||
International | 46 | 46 | 29 | ||||||||
Total deferred | 376 | 167 | 136 | ||||||||
Provision for income taxes, net | $ | 1,169 | $ | 1,137 | $ | 1,129 | |||||
Net income tax payments | $ | 959 | $ | 871 | $ | 1,019 | |||||
State and local income taxes allocable to U.S. government contracts are included in operating costs and expenses in the Consolidated Statement of Earnings and, therefore, are not included in the provision above.
The reconciliation from the statutory federal income tax rate to our effective income tax rate follows:
Year Ended December 31 | 2016 | 2015 | 2014 | |||||
Statutory federal income tax rate | 35.0 | % | 35.0 | % | 35.0 | % | ||
State tax on commercial operations, net of federal benefits | 0.6 | 0.6 | 0.5 | |||||
Impact of international operations | (3.8 | ) | (1.4 | ) | (2.6 | ) | ||
Domestic production deduction | (1.3 | ) | (1.6 | ) | (1.9 | ) | ||
Adoption of ASU 2016-09 | (2.0 | ) | — | — | ||||
Domestic tax credits | (0.8 | ) | (1.1 | ) | (0.7 | ) | ||
Contract close-outs | — | (2.9 | ) | — | ||||
Other, net | (0.1 | ) | (0.9 | ) | (0.6 | ) | ||
Effective income tax rate | 27.6 | % | 27.7 | % | 29.7 | % | ||
The effective tax rate in 2016 was impacted favorably by increased international activity and the adoption of ASU 2016-09. See Note A for further discussion of our adoption of this accounting standard. The decrease in the effective tax rate in 2015 from 2014 was due primarily to the favorable impact of contract close-outs, largely resulting from interest from the completion of a long-term contract triggered by the prior settlement of litigation.
65
Net Deferred Tax Assets. The tax effects of temporary differences between reported earnings and taxable income consisted of the following:
December 31 | 2016 | 2015 | |||||
Retirement benefits | $ | 1,461 | $ | 1,347 | |||
Tax loss and credit carryforwards | 480 | 522 | |||||
Salaries and wages | 257 | 275 | |||||
Workers’ compensation | 235 | 248 | |||||
Other | 396 | 406 | |||||
Deferred assets | 2,829 | 2,798 | |||||
Valuation allowances | (406 | ) | (425 | ) | |||
Net deferred assets | $ | 2,423 | $ | 2,373 | |||
Intangible assets | $ | (1,049 | ) | $ | (1,013 | ) | |
Contract accounting methods | (532 | ) | (261 | ) | |||
Property, plant and equipment | (320 | ) | (285 | ) | |||
Capital Construction Fund qualified ships | (240 | ) | (240 | ) | |||
Other | (245 | ) | (203 | ) | |||
Deferred liabilities | $ | (2,386 | ) | $ | (2,002 | ) | |
Net deferred tax asset | $ | 37 | $ | 371 | |||
Our net deferred tax asset consisted of the following:
December 31 | 2016 | 2015 | |||||
Current deferred tax asset | $ | 5 | $ | 3 | |||
Current deferred tax liability | (1,258 | ) | (829 | ) | |||
Noncurrent deferred tax asset | 1,362 | 1,272 | |||||
Noncurrent deferred tax liability | (72 | ) | (75 | ) | |||
Net deferred tax asset | $ | 37 | $ | 371 | |||
We believe it is more likely than not that we will generate sufficient taxable income in future periods to realize our deferred tax assets, subject to the valuation allowances recognized.
Our retirement benefits deferred tax amount includes a deferred tax asset of $1.7 billion on December 31, 2016, and $1.6 billion on December 31, 2015, related to the amounts recorded in accumulated other comprehensive loss (AOCL) to recognize the funded status of our retirement plans. See Notes L and P for further discussion.
One of our deferred tax liabilities results from our participation in the Capital Construction Fund (CCF), a program established by the U.S. government and administered by the Maritime Administration that supports the acquisition, construction, reconstruction or operation of U.S. flag merchant marine vessels. The program allows us to defer federal and state income taxes on earnings derived from eligible programs as long as the proceeds are deposited in the fund and withdrawals are used for qualified activities. We had U.S. government accounts receivable pledged (and thereby deposited) to the CCF of $388 on December 31, 2016, and $42 on December 31, 2015.
66
On December 31, 2016, we had net operating loss carryforwards of $950 that begin to expire in 2019, a capital loss carryforward of $243 that expires in 2020 and tax credit carryforwards of $109 that begin to expire in 2017.
Earnings from continuing operations before income taxes included non-U.S. income of $593 in 2016, $573 in 2015 and $507 in 2014. We intend to reinvest indefinitely the undistributed earnings of some of our non-U.S. subsidiaries. On December 31, 2016, we had approximately $1.8 billion of undistributed earnings from these non-U.S. subsidiaries. In general, should these earnings be distributed, a portion would be treated as dividends under U.S. tax law and thus subject to U.S. federal corporate income tax at the statutory rate of 35 percent, but would generate offsetting foreign tax credits.
Tax Uncertainties. For all periods open to examination by tax authorities, we periodically assess our liabilities and contingencies based on the latest available information. Where we believe there is more than a 50 percent chance that our tax position will not be sustained, we record our best estimate of the resulting tax liability, including interest, in the Consolidated Financial Statements. We include any interest or penalties incurred in connection with income taxes as part of income tax expense. The total amount of these tax liabilities on December 31, 2016, is not material to our results of operations, financial condition or cash flow.
We participate in the Internal Revenue Service (IRS) Compliance Assurance Process (CAP), a real-time audit of our consolidated federal corporate income tax return. The IRS has examined our consolidated federal income tax returns through 2015. We do not expect the resolution of tax matters for open years to have a material impact on our results of operations, financial condition, cash flows or effective tax rate.
Based on all known facts and circumstances and current tax law, we believe the total amount of any unrecognized tax benefits on December 31, 2016, is not material to our results of operations, financial condition or cash flows, and if recognized, would not have a material impact on our effective tax rate. In addition, there are no tax positions for which it is reasonably possible that the unrecognized tax benefits will significantly vary over the next 12 months, producing, individually or in the aggregate, a material effect on our results of operations, financial condition or cash flows.
F. ACCOUNTS RECEIVABLE
Accounts receivable represent amounts billed and currently due from customers. Payment is typically received from our customers either at periodic intervals (e.g., biweekly or monthly) or upon achievement of contractual milestones. Accounts receivable consisted of the following:
December 31 | 2016 | 2015 | |||||
Non-U.S. government | $ | 2,147 | $ | 2,144 | |||
U.S. government | 793 | 683 | |||||
Commercial | 671 | 619 | |||||
Total accounts receivable | $ | 3,611 | $ | 3,446 | |||
Receivables from non-U.S. government customers include amounts related to long-term production programs for the Spanish Ministry of Defence of $2 billion on December 31, 2016. A different ministry, the Spanish Ministry of Industry, has funded work on these programs in advance of costs incurred by the company. The cash advances are reported on the Consolidated Balance Sheet in current customer advances and deposits and will be repaid to the Ministry of Industry as we collect on the outstanding receivables from the Ministry of Defence. The net amount for these programs on December 31, 2016, is an advance
67
payment of $58. With respect to our other receivables, we expect to collect substantially all of the year-end 2016 balance during 2017.
G. CONTRACTS IN PROCESS
Contracts in process represent recoverable costs and, where applicable, accrued profit related to long-term contracts less associated advances and progress payments. These amounts have been inventoried until the customer is billed, generally in accordance with the agreed-upon billing terms or upon shipment of products or rendering of services. Contracts in process consisted of the following:
December 31 | 2016 | 2015 | |||||
Contract costs and estimated profits | $ | 27,794 | $ | 20,742 | |||
Other contract costs | 699 | 965 | |||||
28,493 | 21,707 | ||||||
Advances and progress payments | (23,211 | ) | (17,350 | ) | |||
Total contracts in process | $ | 5,282 | $ | 4,357 | |||
Contract costs include primarily labor, material, overhead and, when appropriate, G&A expenses. G&A costs in contracts in process on December 31, 2016 and 2015, were $256 and $211, respectively. Contract costs also may include estimated contract recoveries for matters such as contract changes and claims for unanticipated contract costs. We record revenue associated with these matters only when the amount of recovery can be estimated reliably and realization is probable.
Other contract costs represent amounts that are not currently allocable to government contracts, such as a portion of our estimated workers’ compensation obligations, other insurance-related assessments, pension and other post-retirement benefits, and environmental expenses. These costs will become allocable to contracts generally after they are paid. We expect to recover these costs through ongoing business, including existing backlog and probable follow-on contracts. If the backlog in the future does not support the continued deferral of these costs, the profitability of our remaining contracts could be adversely affected.
The increase in contracts in process is due primarily to the 2016 transition for a large program in our Combat Systems group from a net liability position (customer advances and deposits) to a net asset position (contracts in process) as we utilized significant customer deposits received upon contract award.
Excluding our other contract costs, we expect to bill all but approximately 10 percent of our year-end 2016 contracts-in-process balance in the normal course of business during 2017. Of the amount not expected to be billed in 2017, approximately $145 relates to a single contract in our Information Systems and Technology group, the Canadian Maritime Helicopter Project (MHP), which is expected to be billed and recovered over the following four years.
H. INVENTORIES
Our inventories represent primarily business-jet components and are stated at the lower of cost or net realizable value. Work in process represents largely labor, material and overhead costs associated with aircraft in the manufacturing process and is based primarily on the estimated average unit cost of the units in a production lot. Raw materials are valued primarily on the first-in, first-out method. We record pre-owned aircraft acquired in connection with the sale of new aircraft at the lower of the trade-in value or the estimated net realizable value.
Inventories consisted of the following:
December 31 | 2016 | 2015 | |||||
Work in process | $ | 2,058 | $ | 1,889 | |||
Raw materials | 1,415 | 1,376 | |||||
Finished goods | 28 | 28 | |||||
Pre-owned aircraft | 22 | 73 | |||||
Total inventories | $ | 3,523 | $ | 3,366 | |||
I. PROPERTY, PLANT AND EQUIPMENT, NET
Property, plant and equipment (PP&E) is carried at historical cost, net of accumulated depreciation. The major classes of PP&E were as follows:
December 31 | 2016 | 2015 | |||||
Machinery and equipment | $ | 4,582 | $ | 4,394 | |||
Buildings and improvements | 2,745 | 2,666 | |||||
Land and improvements | 333 | 328 | |||||
Construction in process | 269 | 288 | |||||
Total PP&E | 7,929 | 7,676 | |||||
Accumulated depreciation | (4,462 | ) | (4,210 | ) | |||
PP&E, net | $ | 3,467 | $ | 3,466 | |||
68
We depreciate most of our assets using the straight-line method and the remainder using accelerated methods. Buildings and improvements are depreciated over periods of up to 50 years. Machinery and equipment are depreciated over periods of up to 30 years. Our government customers provide certain facilities and equipment for our use that are not included above.
69
J. DEBT
Debt consisted of the following:
December 31 | 2016 | 2015 | ||||||
Fixed-rate notes due: | Interest rate | |||||||
July 2016 | 2.250% | $ | — | $ | 500 | |||
November 2017 | 1.000% | 900 | 900 | |||||
July 2021 | 3.875% | 500 | 500 | |||||
November 2022 | 2.250% | 1,000 | 1,000 | |||||
August 2023 | 1.875% | 500 | — | |||||
August 2026 | 2.125% | 500 | — | |||||
November 2042 | 3.600% | 500 | 500 | |||||
Other | Various | 24 | 25 | |||||
Total debt - principal | 3,924 | 3,425 | ||||||
Less unamortized debt issuance costs and discounts | 36 | 26 | ||||||
Total debt | 3,888 | 3,399 | ||||||
Less current portion | 900 | 501 | ||||||
Long-term debt | $ | 2,988 | $ | 2,898 | ||||
In 2016, we repaid $500 of fixed-rate notes on their maturity date with cash on hand. We also issued $1 billion of fixed-rate notes for general corporate purposes. Interest payments associated with our debt were $83 in 2016, $90 in 2015 and $94 in 2014.
Our fixed-rate notes are fully and unconditionally guaranteed by several of our 100-percent-owned subsidiaries. See Note R for condensed consolidating financial statements. We have the option to redeem the notes prior to their maturity in whole or in part for the principal plus any accrued but unpaid interest and applicable make-whole amounts.
The aggregate amounts of scheduled principal maturities of our debt for the next five years are as follows:
Year Ended December 31 | |||
2017 | $ | 902 | |
2018 | 1 | ||
2019 | 1 | ||
2020 | 1 | ||
2021 | 501 | ||
Thereafter | 2,518 | ||
Total debt - principal | $ | 3,924 | |
Fixed-rate notes of $900 mature in November 2017. As we approach the maturity date of this debt, we will determine whether to repay these notes with cash on hand or refinance the obligation.
On December 31, 2016, we had no commercial paper outstanding, but we maintain the ability to access the commercial paper market in the future. We have $2 billion in committed bank credit facilities for general corporate purposes and working capital needs. These credit facilities include a $1 billion multi-year facility expiring in July 2018 and a $1 billion multi-year facility expiring in November 2020. These facilities are required by credit rating agencies to support our commercial paper issuances. We may renew or replace
70
these credit facilities in whole or in part at or prior to their expiration dates. Our bank credit facilities are guaranteed by several of our 100-percent-owned subsidiaries. We also have an effective shelf registration on file with the SEC that allows us to access the debt markets.
Our financing arrangements contain a number of customary covenants and restrictions. We were in compliance with all covenants on December 31, 2016.
K. OTHER LIABILITIES
A summary of significant other liabilities by balance sheet caption follows:
December 31 | 2016 | 2015 | |||||
Deferred income taxes | $ | 1,258 | $ | 829 | |||
Salaries and wages | 695 | 648 | |||||
Fair value of cash flow hedges | 521 | 780 | |||||
Workers’ compensation | 337 | 369 | |||||
Retirement benefits | 303 | 304 | |||||
Other (a) | 1,355 | 1,376 | |||||
Total other current liabilities | $ | 4,469 | $ | 4,306 | |||
Retirement benefits | $ | 4,393 | $ | 4,251 | |||
Customer deposits on commercial contracts | 418 | 506 | |||||
Deferred income taxes | 72 | 75 | |||||
Other (b) | 1,179 | 1,084 | |||||
Total other liabilities | $ | 6,062 | $ | 5,916 | |||
(a)Consists primarily of dividends payable, taxes payable, environmental remediation reserves, warranty reserves, deferred revenue and supplier contributions in the Aerospace group, liabilities of discontinued operations, and insurance-related costs.
(b)Consists primarily of warranty reserves, workers’ compensation liabilities and liabilities of discontinued operations.
L. SHAREHOLDERS’ EQUITY
Authorized Stock. Our authorized capital stock consists of 500 million shares of $1 per share par value common stock and 50 million shares of $1 per share par value preferred stock. The preferred stock is issuable in series, with the rights, preferences and limitations of each series to be determined by our board of directors.
Shares Issued and Outstanding. On December 31, 2016, we had 481,880,634 shares of common stock issued and 302,418,528 shares of common stock outstanding, including unvested restricted stock of 1,121,480 shares. On December 31, 2015, we had 481,880,634 shares of common stock issued and 312,987,277 shares of common stock outstanding. No shares of our preferred stock were outstanding on either date. The only changes in our shares outstanding during 2016 and 2015 resulted from shares repurchased in the open market and share activity under our equity compensation plans. See Note O for additional details.
Share Repurchases. Our board of directors authorizes management’s repurchase of shares of common stock on the open market from time to time. In 2016, we repurchased 14.2 million of our outstanding shares for $2 billion. As some of these share repurchases had not settled on December 31, 2016, the associated $35 cash outflow will be reported in the first quarter of 2017. On December 31, 2016, 5.4 million shares remained authorized by our board of directors for repurchase, approximately 2 percent of our total shares
71
outstanding. We repurchased 22.8 million shares for a total of $3.2 billion in 2015 and 29 million shares for a total of $3.4 billion in 2014.
Dividends per Share. Dividends declared per share were $3.04 in 2016, $2.76 in 2015 and $2.48 in 2014. Cash dividends paid were $911 in 2016, $873 in 2015 and $822 in 2014.
Accumulated Other Comprehensive Loss. The changes, pretax and net of tax, in each component of accumulated other comprehensive loss (AOCL) consisted of the following:
Gains (Losses) on Cash Flow Hedges | Unrealized Gains on Securities | Foreign Currency Translation Adjustments | Changes in Retirement Plans’ Funded Status | AOCL | |||||||||||
December 31, 2013 | $ | 9 | $ | 15 | $ | 974 | $ | (2,183 | ) | $ | (1,185 | ) | |||
Other comprehensive loss, pretax | (279 | ) | 10 | (436 | ) | (1,745 | ) | (2,450 | ) | ||||||
Benefit for income tax, net | (97 | ) | 3 | (3 | ) | (606 | ) | (703 | ) | ||||||
Other comprehensive loss, net of tax | (182 | ) | 7 | (433 | ) | (1,139 | ) | (1,747 | ) | ||||||
December 31, 2014 | (173 | ) | 22 | 541 | (3,322 | ) | (2,932 | ) | |||||||
Other comprehensive loss, pretax | (394 | ) | (2 | ) | (374 | ) | 500 | (270 | ) | ||||||
Provision for income tax, net | (80 | ) | — | (11 | ) | 175 | 84 | ||||||||
Other comprehensive loss, net of tax | (314 | ) | (2 | ) | (363 | ) | 325 | (354 | ) | ||||||
December 31, 2015 | (487 | ) | 20 | 178 | (2,997 | ) | (3,286 | ) | |||||||
Other comprehensive loss, pretax | 191 | (9 | ) | (118 | ) | (192 | ) | (128 | ) | ||||||
Benefit for income tax, net | 49 | (3 | ) | — | (64 | ) | (18 | ) | |||||||
Other comprehensive loss, net of tax | 142 | (6 | ) | (118 | ) | (128 | ) | (110 | ) | ||||||
December 31, 2016 | $ | (345 | ) | $ | 14 | $ | 60 | $ | (3,125 | ) | $ | (3,396 | ) | ||
Amounts reclassified out of AOCL related primarily to changes in retirement plans' funded status and consisted of pretax recognized net actuarial losses of $340 in 2016, $423 in 2015 and $329 in 2014. This was offset partially by pretax amortization of prior service credit of $74 in 2016, $72 in 2015 and $69 in 2014. These AOCL components are included in our net periodic pension and other post-retirement benefit cost. See Note P for additional details.
M. DERIVATIVE INSTRUMENTS AND HEDGING ACTIVITIES
We are exposed to market risk, primarily from foreign currency exchange rates, interest rates, commodity prices and investments. We may use derivative financial instruments to hedge some of these risks as described below. We had $6.3 billion in notional forward exchange contracts outstanding on December 31, 2016, and $7.2 billion on December 31, 2015. We do not use derivatives for trading or speculative purposes. We recognize derivative financial instruments on the Consolidated Balance Sheet at fair value. See Note D for additional details.
Foreign Currency Risk and Hedging Activities. Our foreign currency exchange rate risk relates to receipts from customers, payments to suppliers and inter-company transactions denominated in foreign currencies. To the extent possible, we include terms in our contracts that are designed to protect us from this risk. Otherwise, we enter into derivative financial instruments, principally foreign currency forward purchase and sale contracts, designed to offset and minimize our risk. The three-year average maturity of these instruments generally matches the duration of the activities that are at risk.
72
We record changes in the fair value of derivative financial instruments in operating costs and expenses in the Consolidated Statement of Earnings or in other comprehensive loss (OCL) within the Consolidated Statement of Comprehensive Income depending on whether the derivative is designated and qualifies for hedge accounting. Gains and losses related to derivatives that qualify as cash flow hedges are deferred in OCL until the underlying transaction is reflected in earnings. We adjust derivative financial instruments not designated as cash flow hedges to market value each period and record the gain or loss in the Consolidated Statement of Earnings. The gains and losses on these instruments generally offset losses and gains on the assets, liabilities and other transactions being hedged. Gains and losses resulting from hedge ineffectiveness are recognized in the Consolidated Statement of Earnings for all derivative financial instruments, regardless of designation.
Net gains and losses on derivative financial instruments recognized in earnings, including gains and losses related to hedge ineffectiveness, were not material to our results of operations in any of the past three years. Net gains and losses reclassified to earnings from OCL were not material to our results of operations in any of the past three years, and we do not expect the amount of these gains and losses that will be reclassified to earnings in 2017 to be material.
We had no material derivative financial instruments designated as fair value or net investment hedges on December 31, 2016 or 2015.
Interest Rate Risk. Our financial instruments subject to interest rate risk include fixed-rate long-term debt obligations and variable-rate commercial paper. However, the risk associated with these instruments is not material.
Commodity Price Risk. We are subject to rising labor and commodity price risk, primarily on long-term, fixed-price contracts. To the extent possible, we include terms in our contracts that are designed to protect us from these risks. Some of the protective terms included in our contracts are considered derivatives but are not accounted for separately because they are clearly and closely related to the host contract. We have not entered into any material commodity hedging contracts but may do so as circumstances warrant. We do not believe that changes in labor or commodity prices will have a material impact on our results of operations or cash flows.
Investment Risk. Our investment policy allows for purchases of fixed-income securities with an investment-grade rating and a maximum maturity of up to five years. On December 31, 2016, we held $2.3 billion in cash and equivalents, but held no marketable securities.
Foreign Currency Financial Statement Translation. We translate foreign currency balance sheets from our international businesses’ functional currency (generally the respective local currency) to U.S. dollars at end-of-period exchange rates, and statements of earnings at average exchange rates for each period. The resulting foreign currency translation adjustments are a component of OCL.
We do not hedge the fluctuation in reported revenue and earnings resulting from the translation of these international operations’ results into U.S. dollars. The negative impact of translating our non-U.S. operations’ revenue into U.S. dollars was not material to our results of operations in any of the past three years. The impact in 2016 was most pronounced in our Combat Systems group. In addition, the effect of changes in foreign exchange rates on non-U.S. cash balances was not material in each of the past three years.
73
N. COMMITMENTS AND CONTINGENCIES
Litigation
In 2015, Electric Boat Corporation, a subsidiary of General Dynamics Corporation, received a Civil Investigative Demand from the U.S. Department of Justice regarding an investigation of potential False Claims Act violations relating to alleged failures of Electric Boat’s quality system with respect to allegedly non-conforming parts purchased from a supplier. In 2016, Electric Boat was made aware that it is a defendant in a lawsuit related to this matter filed under seal in U.S. district court. Also in 2016, the Suspending and Debarring Official for the U.S. Department of the Navy issued a Show Cause Letter to Electric Boat requesting that Electric Boat respond to the official’s concerns regarding Electric Boat’s oversight and management with respect to its quality assurance systems for subcontractors and suppliers. Electric Boat responded to the Show Cause Letter and has been engaged in discussions with the official. Given the current status of these matters, we are unable to express a view regarding the ultimate outcome or, if the outcome is adverse, to estimate an amount or range of reasonably possible loss. Depending on the outcome of these matters, there could be a material impact on our results of operations, financial condition and cash flows.
Additionally, various claims and legal proceedings incidental to the normal course of business are pending or threatened against us. These other matters relate to such issues as government investigations and claims, the protection of the environment, asbestos-related claims and employee-related matters. The nature of litigation is such that we cannot predict the outcome of these other matters. However, based on information currently available, we believe any potential liabilities in these proceedings, individually or in the aggregate, will not have a material impact on our results of operations, financial condition or cash flows.
Environmental
We are subject to and affected by a variety of federal, state, local and foreign environmental laws and regulations. We are directly or indirectly involved in environmental investigations or remediation at some of our current and former facilities and third-party sites that we do not own but where we have been designated a Potentially Responsible Party (PRP) by the U.S. Environmental Protection Agency or a state environmental agency. Based on historical experience, we expect that a significant percentage of the total remediation and compliance costs associated with these facilities will continue to be allowable contract costs and, therefore, recoverable under U.S. government contracts.
As required, we provide financial assurance for certain sites undergoing or subject to investigation or remediation. We accrue environmental costs when it is probable that a liability has been incurred and the amount can be reasonably estimated. Where applicable, we seek insurance recovery for costs related to environmental liabilities. We do not record insurance recoveries before collection is considered probable. Based on all known facts and analyses, we do not believe that our liability at any individual site, or in the aggregate, arising from such environmental conditions, will be material to our results of operations, financial condition or cash flows. We also do not believe that the range of reasonably possible additional loss beyond what has been recorded would be material to our results of operations, financial condition or cash flows.
Minimum Lease Payments
Total expense under operating leases was $307 in 2016, $283 in 2015 and $297 in 2014. Operating leases are primarily for facilities and equipment. Future minimum lease payments are as follows:
74
Year Ended December 31 | |||
2017 | $ | 241 | |
2018 | 195 | ||
2019 | 144 | ||
2020 | 92 | ||
2021 | 72 | ||
Thereafter | 443 | ||
Total minimum lease payments | $ | 1,187 | |
Other
Government Contracts. As a government contractor, we are subject to U.S. government audits and investigations relating to our operations, including claims for fines, penalties, and compensatory and treble damages. We believe the outcome of such ongoing government audits and investigations will not have a material impact on our results of operations, financial condition or cash flows.
In the performance of our contracts, we routinely request contract modifications that require additional funding from the customer. Most often, these requests are due to customer-directed changes in the scope of work. While we are entitled to recovery of these costs under our contracts, the administrative process with our customer may be protracted. Based upon the circumstances, we periodically file requests for equitable adjustment (REAs) that are sometimes converted into claims. In some cases, these requests are disputed by our customer. We believe our outstanding modifications, REAs and other claims will be resolved without material impact to our results of operations, financial condition or cash flows.
Letters of Credit and Guarantees. In the ordinary course of business, we have entered into letters of credit, bank guarantees, surety bonds and other similar arrangements with financial institutions and insurance carriers totaling approximately $1 billion on December 31, 2016. In addition, from time to time and in the ordinary course of business, we contractually guarantee the payment or performance obligations of our subsidiaries arising under certain contracts.
Aircraft Trade-ins. In connection with orders for new aircraft in funded contract backlog, our Aerospace group has outstanding options with some customers to trade in aircraft as partial consideration in their new-aircraft transaction. These trade-in commitments are structured to establish the fair market value of the trade-in aircraft at a date generally 45 or fewer days preceding delivery of the new aircraft to the customer. At that time, the customer is required to either exercise the option or allow its expiration. Any excess of the pre-established trade-in price above the fair market value at the time the new outfitted aircraft is delivered is treated as a reduction of revenue in the new-aircraft sales transaction.
Labor Agreements. Approximately one-fifth of the employees of our subsidiaries work under collectively-bargained terms and conditions, including 49 collective agreements that we have negotiated directly with unions and works councils. A number of these agreements expire within any given year. Historically, we have been successful at renegotiating these labor agreements without any material disruption of operating activities. In 2017, we expect to negotiate the terms of 11 agreements covering approximately 2,700 employees. We do not expect the renegotiations will, either individually or in the aggregate, have a material impact on our results of operations, financial condition or cash flows.
Product Warranties. We provide warranties to our customers associated with certain product sales. We record estimated warranty costs in the period in which the related products are delivered. The warranty liability recorded at each balance sheet date is generally based on the number of months of warranty coverage remaining for the products delivered and the average historical monthly warranty payments. Warranty obligations incurred in connection with long-term production contracts are accounted for within the contract
75
estimates at completion. Our other warranty obligations, primarily for business-jet aircraft, are included in other current and noncurrent liabilities on the Consolidated Balance Sheet.
The changes in the carrying amount of warranty liabilities for each of the past three years were as follows:
Year Ended December 31 | 2016 | 2015 | 2014 | ||||||||
Beginning balance | $ | 465 | $ | 428 | $ | 354 | |||||
Warranty expense | 140 | 158 | 146 | ||||||||
Payments | (91 | ) | (120 | ) | (78 | ) | |||||
Adjustments | 1 | (1 | ) | 6 | |||||||
Ending balance | $ | 515 | $ | 465 | $ | 428 | |||||
O. EQUITY COMPENSATION PLANS
Equity Compensation Overview. We have equity compensation plans for employees, as well as for non-employee members of our board of directors. The equity compensation plans seek to provide an effective means of attracting, retaining and motivating directors, officers and key employees, and to provide them with incentives to enhance our growth and profitability. Under the equity compensation plans, awards may be granted to officers, employees or non-employee directors in common stock, options to purchase common stock, restricted shares of common stock, participation units or any combination of these.
We grant annual stock option awards to participants in the equity compensation plans on the first Wednesday of March based on the average of the high and low stock prices on that day as listed on the New York Stock Exchange. We may make limited ad hoc grants at other times during the year for new hires or promotions. Stock options granted under the equity compensation plans are issued with an exercise price at the fair market value of the common stock on the date of grant.
In 2015, we made several changes to the equity compensation program, including an increase in the term of the stock options from seven to 10 years and a change to a three-year vesting period versus a two-year vesting period for prior option grants. Stock options now vest over three years, with 50 percent of the options vesting after two years and the remaining 50 percent vesting the following year. Outstanding stock options granted prior to 2015 vested over two years and expire seven years after the grant date.
Grants of restricted stock are awards of shares of common stock that vest approximately four years after the grant date. During the restriction period, recipients may not sell, transfer, pledge, assign or otherwise convey their restricted shares to another party. During this period, the recipient is entitled to vote the restricted shares and receive cash dividends on those shares.
Participation units represent obligations that have a value derived from or related to the value of our common stock. These include stock appreciation rights, phantom stock units and RSUs, and are payable in cash or common stock. In 2012, we started granting RSUs with a performance measure derived from a non-GAAP-based management metric, return on invested capital (ROIC). Depending on the company’s performance with respect to this metric, the number of RSUs earned may be less than, equal to or greater than the original number of RSUs awarded subject to a payout range. The performance period for the ROIC metric was extended from one to three years in 2015.
Participation units vest approximately three years after the grant date with recipients prohibited from certain activities during the restriction period. During this period, the recipient receives dividend-equivalent
76
units rather than cash dividends, and is not entitled to vote the participation units or the dividend-equivalent units. Participation units granted prior to 2015 vest over four years with the same conditions and limitations described above.
We issue common stock under our equity compensation plans from treasury stock. On December 31, 2016, in addition to the shares reserved for issuance upon the exercise of outstanding stock options, approximately 8 million shares have been authorized for awards that may be granted in the future.
Equity-based Compensation Expense. Equity-based compensation expense is included in G&A expenses. The following table details the components of equity-based compensation expense recognized in net earnings in each of the past three years:
Year Ended December 31 | 2016 | 2015 | 2014 | ||||||||
Stock options | $ | 25 | $ | 32 | $ | 38 | |||||
Restricted stock | 40 | 40 | 45 | ||||||||
Total equity-based compensation expense, net of tax | $ | 65 | $ | 72 | $ | 83 | |||||
Stock Options. We recognize compensation expense related to stock options on a straight-line basis over the vesting period of the awards, net of estimated forfeitures. Estimated forfeitures are based on our historical forfeiture experience. We estimate the fair value of stock options on the date of grant using the Black-Scholes option pricing model with the following assumptions for each of the past three years:
Year Ended December 31 | 2016 | 2015 | 2014 | |||||
Expected volatility | 19.1-20.0% | 20.1-24.1% | 19.4-20.8% | |||||
Weighted average expected volatility | 20.0 | % | 24.0 | % | 20.2 | % | ||
Expected term (in months) | 70 | 74 | 43/53 | |||||
Risk-free interest rate | 1.5-1.6% | 1.7-1.9% | 1.1-1.4% | |||||
Expected dividend yield | 2.0 | % | 2.0 | % | 2.5 | % | ||
We determine the above assumptions based on the following:
• | Expected volatility is based on the historical volatility of our common stock over a period equal to the expected term of the option. |
• | In 2016 and 2015, expected term is based on assumptions used by a set of comparable peer companies as sufficient entity-specific information is not available. In 2014, using historical option exercise data, we estimated different expected terms and determined a separate fair value for options granted for two employee populations. |
• | Risk-free interest rate is the yield on a U.S. Treasury zero-coupon issue with a remaining term equal to the expected term of the option at the grant date. |
• | Expected dividend yield is based on our historical dividend yield. |
The resulting weighted average fair value per stock option granted was $22.11 in 2016, $27.54 in 2015 and $13.99 in 2014. Stock option expense reduced pretax operating earnings (and on a diluted per-share basis) by $39 ($0.08) in 2016, $49 ($0.10) in 2015 and $59 ($0.11) in 2014. Compensation expense for stock options is reported as a Corporate expense for segment reporting purposes (see Note Q). On December 31, 2016, we had $65 of unrecognized compensation cost related to stock options, which is expected to be recognized over a weighted average period of 1.9 years.
77
A summary of stock option activity during 2016 follows:
Shares Under Option | Weighted Average Exercise Price Per Share | |||||
Outstanding on December 31, 2015 | 12,175,661 | $ | 94.17 | |||
Granted | 2,732,700 | 135.96 | ||||
Exercised | (3,823,862 | ) | 82.25 | |||
Forfeited/canceled | (149,878 | ) | 134.55 | |||
Outstanding on December 31, 2016 | 10,934,621 | $ | 108.23 | |||
Vested and expected to vest on December 31, 2016 | 10,756,736 | $ | 107.76 | |||
Exercisable on December 31, 2016 | 6,320,162 | $ | 87.69 | |||
Summary information with respect to our stock options’ intrinsic value and remaining contractual term on December 31, 2016, follows:
Weighted Average Remaining Contractual Term (in years) | Aggregate Intrinsic Value | ||||
Outstanding | 5.5 | $ | 705 | ||
Vested and expected to vest | 5.5 | 698 | |||
Exercisable | 3.2 | 537 | |||
In the table above, intrinsic value is calculated as the excess, if any, between the market price of our stock on the last trading day of the year and the exercise price of the options. For stock options exercised, intrinsic value is calculated as the difference between the market price on the date of exercise and the exercise price. The total intrinsic value of stock options exercised was $263 in 2016, $238 in 2015 and $340 in 2014.
Restricted Stock/Restricted Stock Units. We determine the fair value of restricted stock and RSUs as the average of the high and low market prices of our stock on the date of grant. We generally recognize compensation expense related to restricted stock and RSUs on a straight-line basis over the period during which the restriction lapses.
Compensation expense related to restricted stock and RSUs reduced pretax operating earnings (and on a diluted per-share basis) by $61 ($0.13) in 2016, $61 ($0.12) in 2015 and $69 ($0.13) in 2014. Compensation expense for restricted stock and RSUs is reported as an operating expense of our business groups for segment reporting purposes (see Note Q). On December 31, 2016, we had $46 of unrecognized compensation cost related to restricted stock and RSUs, which is expected to be recognized over a weighted average period of 1.8 years.
A summary of restricted stock and RSU activity during 2016 follows:
Shares/ Share-Equivalent Units | Weighted Average Grant-Date Fair Value Per Share | |||||
Nonvested at December 31, 2015 | 2,859,171 | $ | 91.03 | |||
Granted | 476,399 | 135.96 | ||||
Vested | (499,198 | ) | 70.91 | |||
Forfeited | (30,244 | ) | 116.87 | |||
Nonvested at December 31, 2016 | 2,806,128 | $ | 101.54 | |||
78
The total fair value of vesting shares was $68 in 2016, $76 in 2015 and $47 in 2014.
P. RETIREMENT PLANS
We provide defined-contribution benefits to eligible employees, as well as some remaining defined-benefit pension and other post-retirement benefits. Substantially all of our plans use a December 31 measurement date consistent with our fiscal year.
Retirement Plan Summary Information
Defined-contribution Benefits. We provide eligible employees the opportunity to participate in defined-contribution savings plans (commonly known as 401(k) plans), which permit contributions on a before-tax and after-tax basis. Employees may contribute to various investment alternatives. In most of these plans, we match a portion of the employees’ contributions. Our contributions to these plans totaled $261 in 2016, $240 in 2015 and $238 in 2014. The defined-contribution plans held approximately 22 million and 24 million shares of our common stock, representing approximately 7 percent and 8 percent of our outstanding shares on December 31, 2016 and 2015, respectively.
Pension Benefits. We have six noncontributory and five contributory trusteed, qualified defined-benefit pension plans covering eligible government business employees, and two noncontributory and four contributory plans covering eligible commercial business employees, including some employees of our international operations. The primary factors affecting the benefits earned by participants in our pension plans are employees’ years of service and compensation levels. Our primary government pension plan, which comprises the majority of our unfunded obligation, was closed to new salaried participants on January 1, 2007. Additionally, we made changes to this plan for certain participants effective in 2014 that limit or cease the benefits that accrue for future service. We made similar changes to our primary commercial pension plan in 2015.
We also sponsor one funded and several unfunded non-qualified supplemental executive plans, which provide participants with additional benefits, including excess benefits over limits imposed on qualified plans by federal tax law.
Other Post-retirement Benefits. We maintain plans that provide post-retirement healthcare and life insurance coverage for certain employees and retirees. These benefits vary by employment status, age, service and salary level at retirement. The coverage provided and the extent to which the retirees share in the cost of the program vary throughout the company. The plans provide health and life insurance benefits only to those employees who retire directly from our service and not to those who terminate service prior to eligibility for retirement.
Contributions and Benefit Payments
It is our policy to fund our defined-benefit retirement plans in a manner that optimizes the tax deductibility and contract recovery of contributions considered within our capital deployment framework. Therefore, we may make discretionary contributions in addition to the required contributions determined in accordance with IRS regulations. We contributed $208 to our pension plans in 2016 and expect to contribute approximately $190 in 2017.
We maintain several tax-advantaged accounts, primarily Voluntary Employees’ Beneficiary Association (VEBA) trusts, to fund the obligations for some of our other post-retirement benefit plans. For non-funded plans, claims are paid as received. Contributions to our other post-retirement plans were not material in 2016 and are not expected to be material in 2017.
79
We expect the following benefits to be paid from our retirement plans over the next 10 years:
Pension Benefits | Other Post-retirement Benefits | ||||||
2017 | $ | 594 | $ | 65 | |||
2018 | 619 | 65 | |||||
2019 | 644 | 65 | |||||
2020 | 674 | 64 | |||||
2021 | 704 | 64 | |||||
2022-2026 | 3,905 | 306 | |||||
Government Contract Considerations
Our contractual arrangements with the U.S. government provide for the recovery of contributions to our pension and other post-retirement benefit plans covering employees working in our defense business groups. For non-funded plans, our government contracts allow us to recover claims paid. Following payment, these recoverable amounts are allocated to contracts and billed to the customer in accordance with the Cost Accounting Standards (CAS) and specific contractual terms. For some of these plans, the cumulative pension and other post-retirement benefit cost exceeds the amount currently allocable to contracts. To the extent recovery of the cost is considered probable based on our backlog and probable follow-on contracts, we defer the excess in contracts in process on the Consolidated Balance Sheet until the cost is allocable to contracts. See Note G for discussion of our deferred contract costs. For other plans, the amount allocated to contracts and included in revenue has exceeded the plans’ cumulative benefit cost. We have deferred recognition of these excess earnings to provide a better matching of revenue and expenses. These deferrals have been classified against the plan assets on the Consolidated Balance Sheet.
Defined-benefit Retirement Plan Summary Financial Information
Estimating retirement plan assets, liabilities and costs requires the extensive use of actuarial assumptions. These include the long-term rate of return on plan assets, the interest rates used to discount projected benefit payments, healthcare cost trend rates and future salary increases. Given the long-term nature of the assumptions being made, actual outcomes can and often do differ from these estimates.
Our annual benefit cost consists of three primary elements: the cost of benefits earned by employees for services rendered during the year, an interest charge on our plan liabilities and an assumed return on our plan assets for the year. The annual cost also includes gains and losses resulting from changes in actuarial assumptions, differences between the actual and assumed long-term rate of return on assets and gains and losses resulting from changes we make to plan benefit terms.
We recognize an asset or liability on the Consolidated Balance Sheet equal to the funded status of each of our defined-benefit retirement plans. The funded status is the difference between the fair value of the plan’s assets and its benefit obligation. Changes in plan assets and liabilities due to differences between actuarial assumptions and the actual results of the plan are deferred in OCL rather than charged to earnings. These differences are then amortized over future years as a component of our annual benefit cost. We amortize actuarial differences under qualified plans on a straight-line basis over the average remaining service period of eligible employees. We recognize the difference between the actual and expected return on plan assets for qualified plans over five years. The deferral of these differences reduces the volatility of our annual benefit cost that can result either from year-to-year changes in the assumptions or from actual results that are not necessarily representative of the long-term financial position of these plans. We recognize differences under nonqualified plans immediately.
80
Our annual pension and other post-retirement benefit costs consisted of the following:
Pension Benefits | |||||||||||
Year Ended December 31 | 2016 | 2015 | 2014 | ||||||||
Service cost | $ | 173 | $ | 210 | $ | 186 | |||||
Interest cost | 456 | 529 | 532 | ||||||||
Expected return on plan assets | (713 | ) | (693 | ) | (655 | ) | |||||
Recognized net actuarial loss | 343 | 417 | 320 | ||||||||
Amortization of prior service credit | (68 | ) | (67 | ) | (67 | ) | |||||
Net annual benefit cost | $ | 191 | $ | 396 | $ | 316 | |||||
Other Post-retirement Benefits | |||||||||||
Year Ended December 31 | 2016 | 2015 | 2014 | ||||||||
Service cost | $ | 10 | $ | 11 | $ | 12 | |||||
Interest cost | 34 | 44 | 52 | ||||||||
Expected return on plan assets | (33 | ) | (32 | ) | (31 | ) | |||||
Recognized net actuarial (gain) loss | (3 | ) | 6 | 9 | |||||||
Amortization of prior service credit | (6 | ) | (5 | ) | (2 | ) | |||||
Net annual benefit cost | $ | 2 | $ | 24 | $ | 40 | |||||
The following is a reconciliation of the benefit obligations and plan/trust assets, and the resulting funded status, of our defined-benefit retirement plans:
Pension Benefits | Other Post-retirement Benefits | ||||||||||||||
Year Ended December 31 | 2016 | 2015 | 2016 | 2015 | |||||||||||
Change in Benefit Obligation | |||||||||||||||
Benefit obligation at beginning of year | $ | (12,554 | ) | $ | (13,236 | ) | $ | (991 | ) | $ | (1,130 | ) | |||
Service cost | (173 | ) | (210 | ) | (10 | ) | (11 | ) | |||||||
Interest cost | (456 | ) | (529 | ) | (34 | ) | (44 | ) | |||||||
Amendments | — | 6 | (13 | ) | (10 | ) | |||||||||
Actuarial (loss) gain | (383 | ) | 685 | (18 | ) | 104 | |||||||||
Settlement/curtailment/other | (4 | ) | 195 | (3 | ) | 35 | |||||||||
Benefits paid | 548 | 535 | 64 | 65 | |||||||||||
Benefit obligation at end of year | $ | (13,022 | ) | $ | (12,554 | ) | $ | (1,005 | ) | $ | (991 | ) | |||
Change in Plan/Trust Assets | |||||||||||||||
Fair value of assets at beginning of year | $ | 8,608 | $ | 9,084 | $ | 527 | $ | 553 | |||||||
Actual return on plan assets | 694 | (85 | ) | 9 | 13 | ||||||||||
Employer contributions | 208 | 187 | 5 | — | |||||||||||
Settlement/curtailment/other | 5 | (54 | ) | — | — | ||||||||||
Benefits paid | (535 | ) | (524 | ) | (42 | ) | (39 | ) | |||||||
Fair value of assets at end of year | $ | 8,980 | $ | 8,608 | $ | 499 | $ | 527 | |||||||
Funded status at end of year | $ | (4,042 | ) | $ | (3,946 | ) | $ | (506 | ) | $ | (464 | ) | |||
81
Amounts recognized on our Consolidated Balance Sheet consisted of the following:
Pension Benefits | Other Post-retirement Benefits | ||||||||||||||
December 31 | 2016 | 2015 | 2016 | 2015 | |||||||||||
Noncurrent assets | $ | 138 | $ | 145 | $ | 10 | $ | — | |||||||
Current liabilities | (132 | ) | (125 | ) | (171 | ) | (179 | ) | |||||||
Noncurrent liabilities | (4,048 | ) | (3,966 | ) | (345 | ) | (285 | ) | |||||||
Net liability recognized | $ | (4,042 | ) | $ | (3,946 | ) | $ | (506 | ) | $ | (464 | ) | |||
Amounts deferred in AOCL consisted of the following:
Pension Benefits | Other Post-retirement Benefits | ||||||||||||||
December 31 | 2016 | 2015 | 2016 | 2015 | |||||||||||
Net actuarial loss (gain) | $ | 4,947 | $ | 4,887 | $ | 36 | $ | (9 | ) | ||||||
Prior service credit | (190 | ) | (258 | ) | (6 | ) | (25 | ) | |||||||
Total amount recognized in AOCL, pretax | $ | 4,757 | $ | 4,629 | $ | 30 | $ | (34 | ) | ||||||
The following is a reconciliation of the change in AOCL for our defined-benefit retirement plans:
Pension Benefits | Other Post-retirement Benefits | ||||||||||||||
Year Ended December 31 | 2016 | 2015 | 2016 | 2015 | |||||||||||
Net actuarial loss (gain) | $ | 402 | $ | 93 | $ | 42 | $ | (85 | ) | ||||||
Prior service (credit) cost | — | (6 | ) | 13 | 10 | ||||||||||
Amortization of: | |||||||||||||||
Net actuarial loss from prior years | (343 | ) | (417 | ) | 3 | (6 | ) | ||||||||
Prior service credit | 68 | 67 | 6 | 5 | |||||||||||
Other* | 1 | (152 | ) | — | (9 | ) | |||||||||
Change in AOCL, pretax | $ | 128 | $ | (415 | ) | $ | 64 | $ | (85 | ) | |||||
* Includes foreign exchange translation and curtailment adjustments.
The following table represents amounts deferred in AOCL on the Consolidated Balance Sheet on December 31, 2016, that we expect to recognize in our retirement benefit cost in 2017:
Pension Benefits | Other Post-retirement Benefits | ||||||
Net actuarial loss (gain) | $ | 344 | $ | (3 | ) | ||
Prior service credit | (66 | ) | (5 | ) | |||
A pension plan’s funded status is the difference between the plan’s assets and its projected benefit obligation (PBO). The PBO is the present value of future benefits attributed to employee services rendered to date, including assumptions about future compensation levels. A pension plan’s accumulated benefit obligation (ABO) is the present value of future benefits attributed to employee services rendered to date, excluding assumptions about future compensation levels. The ABO for all defined-benefit pension plans was $12.7 billion and $12.2 billion on December 31, 2016 and 2015, respectively. On December 31, 2016 and 2015, some of our pension plans had an ABO that exceeded the plans’ assets. Summary information for those plans follows:
82
December 31 | 2016 | 2015 | |||||
PBO | $ | (12,817 | ) | $ | (12,368 | ) | |
ABO | (12,557 | ) | (12,082 | ) | |||
Fair value of plan assets | 8,722 | 8,360 | |||||
Retirement Plan Assumptions
We calculate the plan assets and liabilities for a given year and the net periodic benefit cost for the subsequent year using assumptions determined as of December 31 of the year in question.
The following table summarizes the weighted average assumptions used to determine our benefit obligations:
Assumptions on December 31 | 2016 | 2015 | |||
Pension Benefits | |||||
Benefit obligation discount rate | 4.19 | % | 4.46 | % | |
Rate of increase in compensation levels | 2.92 | % | 3.40 | % | |
Other Post-retirement Benefits | |||||
Benefit obligation discount rate | 4.11 | % | 4.35 | % | |
Healthcare cost trend rate: | |||||
Trend rate for next year | 6.50 | % | 7.00 | % | |
Ultimate trend rate | 5.00 | % | 5.00 | % | |
Year rate reaches ultimate trend rate | 2024 | 2024 | |||
The following table summarizes the weighted average assumptions used to determine our net periodic benefit costs:
Assumptions for Year Ended December 31 | 2016 | 2015 | 2014 | |||||
Pension Benefits | ||||||||
Discount rates: | ||||||||
Benefit obligation | 4.46 | % | 4.10 | % | 4.95 | % | ||
Service cost | 4.42 | % | * | * | ||||
Interest cost | 3.71 | % | * | * | ||||
Expected long-term rate of return on assets | 8.14 | % | 8.15 | % | 8.16 | % | ||
Rate of increase in compensation levels | 3.39 | % | 3.43 | % | 3.78 | % | ||
Other Post-retirement Benefits | ||||||||
Discount rates: | ||||||||
Benefit obligation | 4.35 | % | 4.03 | % | 4.74 | % | ||
Service cost | 4.52 | % | * | * | ||||
Interest cost | 3.53 | % | * | * | ||||
Expected long-term rate of return on assets | 7.81 | % | 8.03 | % | 8.03 | % | ||
* Not applicable as we changed to the spot rate approach beginning in 2016 further described below.
We base the discount rates on a current yield curve developed from a portfolio of high-quality, fixed-income investments with maturities consistent with the projected benefit payout period. Beginning in 2016, we refined the method used to determine the service and interest cost components of our net periodic benefit cost. Previously, the cost was determined using a single weighted-average discount rate derived from the yield curve described above. Under the refined method, known as the spot rate approach, we use individual spot rates along the yield curve that correspond with the timing of each service cost and discounted benefit
83
obligation payment. We believe this change provides a more precise measurement of service and interest costs by improving the correlation between projected service cost and discounted benefit obligation cash outflows and corresponding spot rates on the yield curve. Compared to the previous method, the spot rate approach decreased the service and interest components of our benefit costs slightly in 2016. We accounted for this change prospectively as a change in accounting estimate.
We determine the long-term rate of return on assets based on consideration of historical and forward-looking returns and the current and expected asset allocation strategy. Following an assessment of the long-term returns of our various asset classes, we will alter the expected long-term rate of return on assets in our primary U.S. government and commercial pension plans by 75 basis points beginning in 2017, decreasing the weighted average expected long-term rate of return to approximately 7.4 percent. This decrease is not expected to have a material impact on our 2017 benefit costs.
In 2016, we adopted an updated mortality improvement scale published by the Society of Actuaries that reflects a slower average rate of improvement in mortality than in previous years. Additionally, we updated other assumptions to better align them with historical experience and anticipated future experience, including rates of retirement and cost of living increases. The impact of these changes was a net decrease of $247 and $14 in the benefit obligations of our pension and other post-retirement benefit plans, respectively, on December 31, 2016.
Retirement plan assumptions are based on our best judgment, including consideration of current and future market conditions. Changes in these estimates impact future pension and other post-retirement benefit costs. As discussed above, we defer recognition of the cumulative benefit cost for our government plans in excess of costs allocable to contracts to provide a better matching of revenue and expenses. Therefore, the impact of annual changes in financial reporting assumptions on the cost for these plans does not immediately affect our operating results. For our U.S. pension plans that represent the majority of our total obligation, the following hypothetical changes in the discount rates and expected long-term rate of return on plan assets would have had the following impact in 2016:
Increase 25 Basis Points | Decrease 25 Basis Points | ||||||
Increase (decrease) to net pension cost from: | |||||||
Change in discount rates | $ | (28 | ) | $ | 29 | ||
Change in long-term rate of return on plan assets | (20 | ) | 20 | ||||
A 25-basis-point change in these assumed rates would not have had a measurable impact on the benefit cost for our other post-retirement plans in 2016. For our healthcare plans, the effect of a 1 percentage point increase or decrease in the assumed healthcare cost trend rate on the 2016 net periodic benefit cost is $5 and ($4), respectively, and the effect on the December 31, 2016, accumulated other post-retirement benefit obligation is $83 and ($66), respectively.
Plan Assets
A committee of our board of directors is responsible for the strategic oversight of our defined-benefit retirement plan assets held in trust. Management develops investment policies and provides oversight of a third-party investment manager who reports to the committee on a regular basis. The outsourced third-party investment manager develops investment strategies and makes all day-to-day investment decisions related to defined-benefit retirement plan assets in accordance with our investment policy and target allocation percentages.
84
Our investment policy endeavors to strike the appropriate balance among capital preservation, asset growth and current income. The objective of our investment policy is to generate future returns consistent with our assumed long-term rate of return used to determine our benefit obligations and net periodic benefit costs. Target allocation percentages vary over time depending on the perceived risk and return potential of various asset classes and market conditions. At the end of 2016, our asset allocation policy ranges were:
Equities | 48-68% |
Fixed income | 20-48% |
Cash | 0-5% |
Other asset classes | 0-16% |
More than 90 percent of our pension plan assets are held in a single trust for our primary U.S. government and commercial pension plans. On December 31, 2016, the trust was invested largely in publicly traded equities, fixed-income securities and commingled funds comprised of equity and fixed-income securities. The trust also invests in other asset classes consistent with our investment policy. Our investments in equity assets include U.S. and international securities and equity funds. Our investments in fixed-income assets include U.S. Treasury and U.S. agency securities, corporate bonds, mortgage-backed securities and other asset-backed securities. Our investment policy allows the use of derivative instruments when appropriate to reduce anticipated asset volatility, to gain exposure to an asset class or to adjust the duration of fixed-income assets.
Assets for our non-U.S. pension plans are held in trusts in the countries in which the related operations reside. Our non-U.S. operations maintain investment policies for their individual plans based on country-specific regulations. The non-U.S. plan assets are invested primarily in commingled funds comprised of equity and fixed-income securities.
We hold assets in VEBA trusts for some of our other post-retirement plans. These assets are managed by a third-party investment manager with oversight by management and are generally invested in equities, corporate bonds and equity-based mutual funds. Our asset allocation strategy for the VEBA trusts considers potential fluctuations in our other post-retirement liability, the taxable nature of certain VEBA trusts, tax deduction limits on contributions and the regulatory environment.
Our retirement plan assets are reported at fair value. See Note D for a discussion of the hierarchy for determining fair value. Our Level 1 assets include investments in publicly traded equity securities. These securities are actively traded and valued using quoted prices for identical securities from the market exchanges. Our Level 2 assets consist of fixed-income securities and commingled funds whose underlying investments are valued using observable marketplace inputs. The fair value of plan assets invested in fixed-income securities is generally determined using valuation models that use observable inputs such as interest rates, bond yields, low-volume market quotes and quoted prices for similar assets. Our plan assets that are invested in commingled funds are valued using a unit price or net asset value (NAV) that is based on the underlying investments of the fund. Our Level 3 assets include real estate funds, insurance deposit contracts and direct private equity investments.
Certain investments are valued using NAV as a practical expedient. These investments have no unfunded commitments and are redeemable at NAV. These assets are redeemable monthly or quarterly and have redemption notice periods of up to 90 days.
In 2016, we adopted ASU 2015-07, Fair Value Measurement (Topic 820): Disclosures for Investments in Certain Entities That Calculate Net Asset Value per Share (or Its Equivalent). See Note A for further discussion of ASU 2015-07. In accordance with the transition requirements, we have removed our pension
85
and other post-retirement benefits investments that are measured using NAV as a practical expedient from the fair value hierarchy. As the ASU was adopted retrospectively, we have restated our prior-period investments accordingly, resulting in the removal of $783 and $3 of pension and other post-retirement benefits investments, respectively, from the fair value hierarchy on December 31, 2015.
The fair value of our pension plan assets by investment category and the corresponding level within the fair value hierarchy were as follows:
Fair Value | Quoted Prices in Active Markets for Identical Assets (Level 1) | Significant Other Observable Inputs (Level 2) | Significant Unobservable Inputs (Level 3) | ||||||||||||
Asset Category | December 31, 2016 | ||||||||||||||
Cash and equivalents | $ | 71 | $ | 10 | $ | 61 | $ | — | |||||||
Equity securities (a): | |||||||||||||||
U.S. companies | 786 | 786 | — | — | |||||||||||
Non-U.S. companies | 74 | 74 | — | — | |||||||||||
Private equity investments | 13 | — | — | 13 | |||||||||||
Fixed-income securities: | |||||||||||||||
Treasury securities | 239 | — | 239 | — | |||||||||||
Corporate bonds (b) | 2,115 | — | 2,115 | — | |||||||||||
Commingled funds: | |||||||||||||||
Equity funds | 4,285 | — | 4,285 | — | |||||||||||
Fixed-income funds | 567 | — | 567 | — | |||||||||||
Real estate funds | 42 | — | — | 42 | |||||||||||
Other investments: | |||||||||||||||
Insurance deposit contracts | 109 | — | — | 109 | |||||||||||
Total plan assets in fair value hierarchy | $ | 8,301 | $ | 870 | $ | 7,267 | $ | 164 | |||||||
Plan assets measured using NAV as a practical expedient (c): | |||||||||||||||
Hedge funds | 314 | ||||||||||||||
Real estate funds | 365 | ||||||||||||||
Total pension plan assets | $ | 8,980 | |||||||||||||
(a)No single equity holding amounted to more than 1 percent of the total fair value.
(b)Our corporate bond investments had an average rating of BBB+.
(c)Investments measured at fair value using NAV as a practical expedient have not been classified in the fair value hierarchy. The fair value amounts presented in this table for these investments are included to permit reconciliation of the fair value hierarchy to the total plan assets.
86
Fair Value | Quoted Prices in Active Markets for Identical Assets (Level 1) | Significant Other Observable Inputs (Level 2) | Significant Unobservable Inputs (Level 3) | ||||||||||||
Asset Category | December 31, 2015 | ||||||||||||||
Cash and equivalents | $ | 116 | $ | 12 | $ | 104 | $ | — | |||||||
Equity securities (a): | |||||||||||||||
U.S. companies | 675 | 675 | — | — | |||||||||||
Non-U.S. companies | 64 | 64 | — | — | |||||||||||
Private equity investments | 12 | — | — | 12 | |||||||||||
Fixed-income securities: | |||||||||||||||
Treasury securities | 261 | — | 261 | — | |||||||||||
Corporate bonds (b) | 1,986 | — | 1,986 | — | |||||||||||
Commingled funds: | |||||||||||||||
Equity funds | 4,006 | — | 4,006 | — | |||||||||||
Fixed-income funds | 560 | — | 560 | — | |||||||||||
Real estate funds | 42 | — | — | 42 | |||||||||||
Other investments: | |||||||||||||||
Insurance deposit contracts | 103 | — | — | 103 | |||||||||||
Total plan assets in fair value hierarchy | $ | 7,825 | $ | 751 | $ | 6,917 | $ | 157 | |||||||
Plan assets measured using NAV as a practical expedient (c): | |||||||||||||||
Hedge funds | 445 | ||||||||||||||
Real estate funds | 338 | ||||||||||||||
Total pension plan assets | $ | 8,608 | |||||||||||||
(a)No single equity holding amounted to more than 1 percent of the total fair value.
(b)Our corporate bond investments had an average rating of BBB+.
(c)Investments measured at fair value using NAV as a practical expedient have not been classified in the fair value hierarchy. The fair value amounts presented in this table for these investments are included to permit reconciliation of the fair value hierarchy to the total plan assets.
87
The fair value of our other post-retirement plan assets by category and the corresponding level within the fair value hierarchy were as follows:
Fair Value | Quoted Prices in Active Markets for Identical Assets (Level 1) | Significant Other Observable Inputs (Level 2) | |||||||||
Asset Category | December 31, 2016 | ||||||||||
Cash equivalents | $ | 10 | $ | — | $ | 10 | |||||
Equity securities | 69 | 69 | — | ||||||||
Fixed-income securities | 88 | — | 88 | ||||||||
Commingled funds: | |||||||||||
Equity funds | 236 | — | 236 | ||||||||
Fixed-income funds | 92 | — | 92 | ||||||||
Real estate funds | 2 | 2 | — | ||||||||
Total plan assets in fair value hierarchy | $ | 497 | $ | 71 | $ | 426 | |||||
Plan assets measured using NAV as a practical expedient*: | |||||||||||
Hedge funds | 1 | ||||||||||
Real estate funds | 1 | ||||||||||
Total other post-retirement plan assets | $ | 499 | |||||||||
Fair Value | Quoted Prices in Active Markets for Identical Assets (Level 1) | Significant Other Observable Inputs (Level 2) | |||||||||
Asset Category | December 31, 2015 | ||||||||||
Cash equivalents | $ | 79 | $ | — | $ | 79 | |||||
Equity securities | 77 | 77 | — | ||||||||
Fixed-income securities | 21 | — | 21 | ||||||||
Commingled funds: | |||||||||||
Equity funds | 246 | — | 246 | ||||||||
Fixed-income funds | 99 | — | 99 | ||||||||
Real estate funds | 2 | 2 | — | ||||||||
Total plan assets in fair value hierarchy | $ | 524 | $ | 79 | $ | 445 | |||||
Plan assets measured using NAV as a practical expedient*: | |||||||||||
Hedge funds | 2 | ||||||||||
Real estate funds | 1 | ||||||||||
Total other post-retirement plan assets | $ | 527 | |||||||||
* Investments measured at fair value using NAV as a practical expedient have not been classified in the fair value hierarchy. The fair value amounts presented in this table for these investments are included to permit reconciliation of the fair value hierarchy to the total plan assets.
88
Changes in our Level 3 retirement plan assets during 2016 and 2015 were as follows:
Private Equity Investments | Real Estate Funds | Insurance Deposits Agreements | Total Level 3 Assets | ||||||||||||
December 31, 2014 | $ | 9 | $ | 42 | $ | 103 | $ | 154 | |||||||
Actual return on plan assets: | |||||||||||||||
Unrealized gains, net | 1 | 2 | 2 | 5 | |||||||||||
Purchases, sales and settlements, net | 2 | (2 | ) | (2 | ) | (2 | ) | ||||||||
December 31, 2015 | 12 | 42 | 103 | 157 | |||||||||||
Actual return on plan assets: | |||||||||||||||
Unrealized losses, net | 1 | — | (2 | ) | (1 | ) | |||||||||
Realized gains, net | — | — | 3 | 3 | |||||||||||
Purchases, sales and settlements, net | — | — | 5 | 5 | |||||||||||
December 31, 2016 | $ | 13 | $ | 42 | $ | 109 | $ | 164 | |||||||
Q. BUSINESS GROUP INFORMATION
We operate in four business groups: Aerospace, Combat Systems, Information Systems and Technology, and Marine Systems. We organize our business groups in accordance with the nature of products and services offered. We measure each group’s profitability based on operating earnings. As a result, we do not allocate net interest, other income and expense items, and income taxes to our business groups.
Summary financial information for each of our business groups follows:
Revenue | Operating Earnings | Revenue from U.S. Government | |||||||||||||||||||||||||||
Year Ended December 31 | 2016 | 2015 | 2014 | 2016 | 2015 | 2014 | 2016 | 2015 | 2014 | ||||||||||||||||||||
Aerospace | $ | 8,362 | $ | 8,851 | $ | 8,649 | $ | 1,718 | $ | 1,706 | $ | 1,611 | $ | 339 | $ | 104 | $ | 99 | |||||||||||
Combat Systems | 5,602 | 5,640 | 5,732 | 914 | 882 | 862 | 2,630 | 2,583 | 2,970 | ||||||||||||||||||||
Information Systems and Technology | 9,187 | 8,965 | 9,159 | 992 | 903 | 785 | 8,018 | 7,856 | 7,985 | ||||||||||||||||||||
Marine Systems | 8,202 | 8,013 | 7,312 | 725 | 728 | 703 | 7,851 | 7,438 | 6,901 | ||||||||||||||||||||
Corporate* | — | — | — | (40 | ) | (41 | ) | (72 | ) | — | — | — | |||||||||||||||||
Total | $ | 31,353 | $ | 31,469 | $ | 30,852 | $ | 4,309 | $ | 4,178 | $ | 3,889 | $ | 18,838 | $ | 17,981 | $ | 17,955 | |||||||||||
* Corporate operating results consist primarily of stock option expense.
Identifiable Assets | Capital Expenditures | Depreciation and Amortization | |||||||||||||||||||||||||||
Year Ended December 31 | 2016 | 2015 | 2014 | 2016 | 2015 | 2014 | 2016 | 2015 | 2014 | ||||||||||||||||||||
Aerospace | $ | 8,558 | $ | 8,359 | $ | 8,188 | $ | 125 | $ | 210 | $ | 227 | $ | 154 | $ | 147 | $ | 137 | |||||||||||
Combat Systems | 8,972 | 7,751 | 9,146 | 71 | 79 | 46 | 86 | 91 | 100 | ||||||||||||||||||||
Information Systems and Technology | 8,474 | 8,575 | 9,063 | 97 | 73 | 54 | 103 | 131 | 146 | ||||||||||||||||||||
Marine Systems | 3,077 | 2,970 | 3,110 | 92 | 166 | 124 | 105 | 106 | 106 | ||||||||||||||||||||
Corporate* | 3,791 | 4,342 | 5,830 | 7 | 41 | 70 | 6 | 7 | 7 | ||||||||||||||||||||
Total | $ | 32,872 | $ | 31,997 | $ | 35,337 | $ | 392 | $ | 569 | $ | 521 | $ | 454 | $ | 482 | $ | 496 | |||||||||||
* Corporate identifiable assets are primarily cash and equivalents and deferred income tax assets.
89
The following table presents our revenue by geographic area based on the location of our customers:
Year Ended December 31 | 2016 | 2015 | 2014 | ||||||||
North America: | |||||||||||
United States | $ | 23,431 | $ | 23,257 | $ | 23,222 | |||||
Other | 691 | 1,080 | 1,174 | ||||||||
Total North America | 24,122 | 24,337 | 24,396 | ||||||||
Europe | 2,355 | 2,485 | 2,410 | ||||||||
Asia/Pacific | 1,914 | 1,678 | 1,608 | ||||||||
Africa/Middle East | 2,668 | 2,508 | 2,163 | ||||||||
South America | 294 | 461 | 275 | ||||||||
Total revenue | $ | 31,353 | $ | 31,469 | $ | 30,852 | |||||
Our revenue from non-U.S. operations was $3.7 billion in 2016 and 2015 and $3.6 billion in 2014. The long-lived assets associated with these operations were 5 percent of our total long-lived assets on December 31, 2016 and 2015.
R. CONDENSED CONSOLIDATING FINANCIAL STATEMENTS
The fixed-rate notes described in Note J are fully and unconditionally guaranteed on an unsecured, joint and several basis by several of our 100-percent-owned subsidiaries (the guarantors). The following condensed consolidating financial statements illustrate the composition of the parent, the guarantors on a combined basis (each guarantor together with its majority-owned subsidiaries) and all other subsidiaries on a combined basis.
90
CONDENSED CONSOLIDATING STATEMENTS OF EARNINGS
Year Ended December 31, 2016 | Parent | Guarantors on a Combined Basis | Other Subsidiaries on a Combined Basis | Consolidating Adjustments | Total Consolidated | ||||||||||
Revenue | $ | — | $ | 27,310 | $ | 4,043 | $ | — | $ | 31,353 | |||||
Cost of sales | — | 22,011 | 3,093 | — | 25,104 | ||||||||||
G&A | 39 | 1,585 | 316 | — | 1,940 | ||||||||||
Operating earnings | (39 | ) | 3,714 | 634 | — | 4,309 | |||||||||
Interest, net | (91 | ) | (2 | ) | 2 | — | (91 | ) | |||||||
Other, net | 12 | (4 | ) | 5 | — | 13 | |||||||||
Earnings before income tax | (118 | ) | 3,708 | 641 | — | 4,231 | |||||||||
Provision for income tax, net | (121 | ) | 1,238 | 52 | — | 1,169 | |||||||||
Discontinued operations, net of tax | (107 | ) | — | — | — | (107 | ) | ||||||||
Equity in net earnings of subsidiaries | 3,059 | — | — | (3,059 | ) | — | |||||||||
Net earnings | $ | 2,955 | $ | 2,470 | $ | 589 | $ | (3,059 | ) | $ | 2,955 | ||||
Comprehensive income | $ | 2,845 | $ | 2,445 | $ | 592 | $ | (3,037 | ) | $ | 2,845 | ||||
Year Ended December 31, 2015 | |||||||||||||||
Revenue | $ | — | $ | 27,398 | $ | 4,071 | $ | — | $ | 31,469 | |||||
Cost of sales | (6 | ) | 22,191 | 3,154 | — | 25,339 | |||||||||
G&A | 46 | 1,609 | 297 | — | 1,952 | ||||||||||
Operating earnings | (40 | ) | 3,598 | 620 | — | 4,178 | |||||||||
Interest, net | (89 | ) | (1 | ) | 7 | — | (83 | ) | |||||||
Other, net | 4 | 2 | 1 | — | 7 | ||||||||||
Earnings before income tax | (125 | ) | 3,599 | 628 | — | 4,102 | |||||||||
Provision for income tax, net | (151 | ) | 1,154 | 134 | — | 1,137 | |||||||||
Equity in net earnings of subsidiaries | 2,939 | — | — | (2,939 | ) | — | |||||||||
Net earnings | $ | 2,965 | $ | 2,445 | $ | 494 | $ | (2,939 | ) | $ | 2,965 | ||||
Comprehensive income | $ | 2,611 | $ | 2,653 | $ | (178 | ) | $ | (2,475 | ) | $ | 2,611 | |||
Year Ended December 31, 2014 | |||||||||||||||
Revenue | $ | — | $ | 26,819 | $ | 4,033 | $ | — | $ | 30,852 | |||||
Cost of sales | 9 | 21,792 | 3,178 | — | 24,979 | ||||||||||
G&A | 62 | 1,633 | 289 | — | 1,984 | ||||||||||
Operating earnings | (71 | ) | 3,394 | 566 | — | 3,889 | |||||||||
Interest, net | (93 | ) | — | 7 | — | (86 | ) | ||||||||
Other, net | — | (2 | ) | 1 | — | (1 | ) | ||||||||
Earnings before income tax | (164 | ) | 3,392 | 574 | — | 3,802 | |||||||||
Provision for income tax, net | (54 | ) | 1,099 | 84 | — | 1,129 | |||||||||
Discontinued operations, net of tax | (140 | ) | — | — | — | (140 | ) | ||||||||
Equity in net earnings of subsidiaries | 2,783 | — | — | (2,783 | ) | — | |||||||||
Net earnings | $ | 2,533 | $ | 2,293 | $ | 490 | $ | (2,783 | ) | $ | 2,533 | ||||
Comprehensive income | $ | 786 | $ | 2,147 | $ | (125 | ) | $ | (2,022 | ) | $ | 786 | |||
91
CONDENSED CONSOLIDATING BALANCE SHEET
December 31, 2016 | Parent | Guarantors on a Combined Basis | Other Subsidiaries on a Combined Basis | Consolidating Adjustments | Total Consolidated | ||||||||||
ASSETS | |||||||||||||||
Current assets: | |||||||||||||||
Cash and equivalents | $ | 1,254 | $ | — | $ | 1,080 | $ | — | $ | 2,334 | |||||
Accounts receivable | — | 1,367 | 2,244 | — | 3,611 | ||||||||||
Contracts in process | 304 | 2,820 | 2,158 | — | 5,282 | ||||||||||
Inventories | |||||||||||||||
Work in process | — | 2,047 | 11 | — | 2,058 | ||||||||||
Raw materials | — | 1,378 | 37 | — | 1,415 | ||||||||||
Finished goods | — | 22 | 6 | — | 28 | ||||||||||
Pre-owned aircraft | — | 22 | — | — | 22 | ||||||||||
Other current assets | 330 | 186 | 181 | — | 697 | ||||||||||
Total current assets | 1,888 | 7,842 | 5,717 | — | 15,447 | ||||||||||
Noncurrent assets: | |||||||||||||||
PP&E | 197 | 6,586 | 1,146 | — | 7,929 | ||||||||||
Accumulated depreciation of PP&E | (67 | ) | (3,663 | ) | (732 | ) | — | (4,462 | ) | ||||||
Intangible assets | — | 1,450 | 904 | — | 2,354 | ||||||||||
Accumulated amortization of intangible assets | — | (1,185 | ) | (491 | ) | — | (1,676 | ) | |||||||
Goodwill | — | 8,050 | 3,395 | — | 11,445 | ||||||||||
Other assets | 1,445 | 224 | 166 | — | 1,835 | ||||||||||
Investment in subsidiaries | 42,949 | — | — | (42,949 | ) | — | |||||||||
Total noncurrent assets | 44,524 | 11,462 | 4,388 | (42,949 | ) | 17,425 | |||||||||
Total assets | $ | 46,412 | $ | 19,304 | $ | 10,105 | $ | (42,949 | ) | $ | 32,872 | ||||
LIABILITIES AND SHAREHOLDERS’ EQUITY | |||||||||||||||
Current liabilities: | |||||||||||||||
Short-term debt and current portion of long-term debt | $ | 898 | $ | 2 | $ | — | $ | — | $ | 900 | |||||
Customer advances and deposits | — | 2,459 | 2,480 | — | 4,939 | ||||||||||
Other current liabilities | 1,734 | 3,505 | 1,768 | — | 7,007 | ||||||||||
Total current liabilities | 2,632 | 5,966 | 4,248 | — | 12,846 | ||||||||||
Noncurrent liabilities: | |||||||||||||||
Long-term debt | 2,966 | 22 | — | — | 2,988 | ||||||||||
Other liabilities | 3,472 | 2,070 | 520 | — | 6,062 | ||||||||||
Total noncurrent liabilities | 6,438 | 2,092 | 520 | — | 9,050 | ||||||||||
Intercompany | 26,366 | (25,828 | ) | (538 | ) | — | — | ||||||||
Shareholders’ equity: | |||||||||||||||
Common stock | 482 | 6 | 2,354 | (2,360 | ) | 482 | |||||||||
Other shareholders’ equity | 10,494 | 37,068 | 3,521 | (40,589 | ) | 10,494 | |||||||||
Total shareholders’ equity | 10,976 | 37,074 | 5,875 | (42,949 | ) | 10,976 | |||||||||
Total liabilities and shareholders’ equity | $ | 46,412 | $ | 19,304 | $ | 10,105 | $ | (42,949 | ) | $ | 32,872 | ||||
92
CONDENSED CONSOLIDATING BALANCE SHEET
December 31, 2015 | Parent | Guarantors on a Combined Basis | Other Subsidiaries on a Combined Basis | Consolidating Adjustments | Total Consolidated | ||||||||||
ASSETS | |||||||||||||||
Current assets: | |||||||||||||||
Cash and equivalents | $ | 1,732 | $ | — | $ | 1,053 | $ | — | $ | 2,785 | |||||
Accounts receivable | — | 1,181 | 2,265 | — | 3,446 | ||||||||||
Contracts in process | 514 | 2,795 | 1,048 | — | 4,357 | ||||||||||
Inventories | |||||||||||||||
Work in process | — | 1,882 | 7 | — | 1,889 | ||||||||||
Raw materials | — | 1,344 | 32 | — | 1,376 | ||||||||||
Finished goods | — | 23 | 5 | — | 28 | ||||||||||
Pre-owned aircraft | — | 73 | — | — | 73 | ||||||||||
Other current assets | 140 | 213 | 264 | — | 617 | ||||||||||
Total current assets | 2,386 | 7,511 | 4,674 | — | 14,571 | ||||||||||
Noncurrent assets: | |||||||||||||||
PP&E | 189 | 6,386 | 1,101 | — | 7,676 | ||||||||||
Accumulated depreciation of PP&E | (59 | ) | (3,462 | ) | (689 | ) | — | (4,210 | ) | ||||||
Intangible assets | — | 1,445 | 909 | — | 2,354 | ||||||||||
Accumulated amortization of intangible assets | — | (1,122 | ) | (469 | ) | — | (1,591 | ) | |||||||
Goodwill | — | 8,040 | 3,403 | — | 11,443 | ||||||||||
Other assets | 1,379 | 207 | 168 | — | 1,754 | ||||||||||
Investment in subsidiaries | 40,062 | — | — | (40,062 | ) | — | |||||||||
Total noncurrent assets | 41,571 | 11,494 | 4,423 | (40,062 | ) | 17,426 | |||||||||
Total assets | $ | 43,957 | $ | 19,005 | $ | 9,097 | $ | (40,062 | ) | $ | 31,997 | ||||
LIABILITIES AND SHAREHOLDERS’ EQUITY | |||||||||||||||
Current liabilities: | |||||||||||||||
Short-term debt and current portion of long-term debt | $ | 500 | $ | 1 | $ | — | $ | — | $ | 501 | |||||
Customer advances and deposits | — | 3,038 | 2,636 | — | 5,674 | ||||||||||
Other current liabilities | 1,331 | 3,309 | 1,630 | — | 6,270 | ||||||||||
Total current liabilities | 1,831 | 6,348 | 4,266 | — | 12,445 | ||||||||||
Noncurrent liabilities: | |||||||||||||||
Long-term debt | 2,874 | 24 | — | — | 2,898 | ||||||||||
Other liabilities | 3,417 | 2,021 | 478 | — | 5,916 | ||||||||||
Total noncurrent liabilities | 6,291 | 2,045 | 478 | — | 8,814 | ||||||||||
Intercompany | 25,097 | (23,816 | ) | (1,281 | ) | — | — | ||||||||
Shareholders’ equity: | |||||||||||||||
Common stock | 482 | 6 | 2,354 | (2,360 | ) | 482 | |||||||||
Other shareholders’ equity | 10,256 | 34,422 | 3,280 | (37,702 | ) | 10,256 | |||||||||
Total shareholders’ equity | 10,738 | 34,428 | 5,634 | (40,062 | ) | 10,738 | |||||||||
Total liabilities and shareholders’ equity | $ | 43,957 | $ | 19,005 | $ | 9,097 | $ | (40,062 | ) | $ | 31,997 | ||||
93
CONDENSED CONSOLIDATING STATEMENTS OF CASH FLOWS
Year Ended December 31, 2016 | Parent | Guarantors on a Combined Basis | Other Subsidiaries on a Combined Basis | Consolidating Adjustments | Total Consolidated | ||||||||||
Net cash provided by operating activities* | $ | 219 | $ | 1,914 | $ | 65 | $ | — | $ | 2,198 | |||||
Cash flows from investing activities: | |||||||||||||||
Capital expenditures | (8 | ) | (336 | ) | (48 | ) | — | (392 | ) | ||||||
Other, net | 5 | (1 | ) | (38 | ) | — | (34 | ) | |||||||
Net cash used by investing activities | (3 | ) | (337 | ) | (86 | ) | — | (426 | ) | ||||||
Cash flows from financing activities: | |||||||||||||||
Purchases of common stock | (1,996 | ) | — | — | — | (1,996 | ) | ||||||||
Proceeds from fixed-rate notes | 992 | — | — | — | 992 | ||||||||||
Dividends paid | (911 | ) | — | — | — | (911 | ) | ||||||||
Repayment of fixed-rate notes | (500 | ) | — | — | — | (500 | ) | ||||||||
Proceeds from stock option exercises | 292 | — | — | — | 292 | ||||||||||
Other, net | (45 | ) | (1 | ) | — | — | (46 | ) | |||||||
Net cash used by financing activities | (2,168 | ) | (1 | ) | — | — | (2,169 | ) | |||||||
Net cash used by discontinued operations | (54 | ) | — | — | — | (54 | ) | ||||||||
Cash sweep/funding by parent | 1,528 | (1,576 | ) | 48 | — | — | |||||||||
Net decrease in cash and equivalents | (478 | ) | — | 27 | — | (451 | ) | ||||||||
Cash and equivalents at beginning of year | 1,732 | — | 1,053 | — | 2,785 | ||||||||||
Cash and equivalents at end of year | $ | 1,254 | $ | — | $ | 1,080 | $ | — | $ | 2,334 | |||||
Year Ended December 31, 2015 | |||||||||||||||
Net cash provided by operating activities* | $ | 50 | $ | 2,202 | $ | 355 | $ | — | $ | 2,607 | |||||
Cash flows from investing activities: | |||||||||||||||
Capital expenditures | (42 | ) | (475 | ) | (52 | ) | — | (569 | ) | ||||||
Maturities of held-to-maturity securities | 500 | — | — | — | 500 | ||||||||||
Proceeds from sales of assets | 162 | 129 | — | — | 291 | ||||||||||
Other, net | 4 | (26 | ) | — | — | (22 | ) | ||||||||
Net cash provided by investing activities | 624 | (372 | ) | (52 | ) | — | 200 | ||||||||
Cash flows from financing activities: | |||||||||||||||
Purchases of common stock | (3,233 | ) | — | — | — | (3,233 | ) | ||||||||
Dividends paid | (873 | ) | — | — | — | (873 | ) | ||||||||
Repayment of fixed-rate notes | (500 | ) | — | — | — | (500 | ) | ||||||||
Proceeds from stock option exercises | 268 | — | — | — | 268 | ||||||||||
Other, net | (31 | ) | 2 | — | — | (29 | ) | ||||||||
Net cash used by financing activities | (4,369 | ) | 2 | — | — | (4,367 | ) | ||||||||
Net cash used by discontinued operations | (43 | ) | — | — | — | (43 | ) | ||||||||
Cash sweep/funding by parent | 2,934 | (1,832 | ) | (1,102 | ) | — | — | ||||||||
Net decrease in cash and equivalents | (804 | ) | — | (799 | ) | — | (1,603 | ) | |||||||
Cash and equivalents at beginning of year | 2,536 | — | 1,852 | — | 4,388 | ||||||||||
Cash and equivalents at end of year | $ | 1,732 | $ | — | $ | 1,053 | $ | — | $ | 2,785 | |||||
* Continuing operations only.
94
CONDENSED CONSOLIDATING STATEMENT OF CASH FLOWS
Year Ended December 31, 2014 | Parent | Guarantors on a Combined Basis | Other Subsidiaries on a Combined Basis | Consolidating Adjustments | Total Consolidated | ||||||||||
Net cash provided by operating activities* | $ | (196 | ) | $ | 2,798 | $ | 1,226 | $ | — | $ | 3,828 | ||||
Cash flows from investing activities: | |||||||||||||||
Capital expenditures | (71 | ) | (409 | ) | (41 | ) | — | (521 | ) | ||||||
Purchases of held-to-maturity securities | (500 | ) | — | — | — | (500 | ) | ||||||||
Other, net | 3 | (74 | ) | (10 | ) | — | (81 | ) | |||||||
Net cash used by investing activities | (568 | ) | (483 | ) | (51 | ) | — | (1,102 | ) | ||||||
Cash flows from financing activities: | |||||||||||||||
Purchases of common stock | (3,382 | ) | — | — | — | (3,382 | ) | ||||||||
Dividends paid | (822 | ) | — | — | — | (822 | ) | ||||||||
Proceeds from stock option exercises | 547 | — | — | — | 547 | ||||||||||
Other, net | (17 | ) | (1 | ) | — | — | (18 | ) | |||||||
Net cash used by financing activities | (3,674 | ) | (1 | ) | — | — | (3,675 | ) | |||||||
Net cash provided by discontinued operations | 36 | — | — | — | 36 | ||||||||||
Cash sweep/funding by parent | 2,759 | (2,314 | ) | (445 | ) | — | — | ||||||||
Net decrease in cash and equivalents | (1,643 | ) | — | 730 | — | (913 | ) | ||||||||
Cash and equivalents at beginning of year | 4,179 | — | 1,122 | — | 5,301 | ||||||||||
Cash and equivalents at end of year | $ | 2,536 | $ | — | $ | 1,852 | $ | — | $ | 4,388 | |||||
* Continuing operations only.
95
S. ADOPTION OF ASC TOPIC 606, REVENUE FROM CONTRACTS WITH CUSTOMERS, EFFECTIVE JANUARY 1, 2017
As discussed in Note A, the FASB issued ASU 2014-09, Revenue from Contracts with Customers (Topic 606), in 2014. The standard outlines a five-step model whereby revenue is recognized as performance obligations within a contract are satisfied. The standard also requires new, expanded disclosures regarding revenue recognition. Several ASUs have been issued since the issuance of ASU 2014-09. These ASUs, which modify certain sections of ASU 2014-09, are intended to promote a more consistent interpretation and application of the principles outlined in the standard. We adopted the new standard on January 1, 2017, using the retrospective transition method.
ASC Topic 606 Impacts. The majority of our long-term contracts will continue to recognize revenue and earnings over time as the work progresses because of the continuous transfer of control to the customer, generally using an input measure (e.g., costs incurred) to reflect progress. The adoption of ASC Topic 606 will have two primary impacts on our portfolio of contracts and our Consolidated Financial Statements. We will be precluded from using the reallocation method of recognizing adjustments in estimated profit on contracts discussed in Note A. The total impact of an adjustment in estimated profit recorded to date on a contract will be recognized in the period it is identified (cumulative catch-up method), rather than recognizing the impact of an adjustment prospectively over the remaining contract term. As a result, adjustments in contract estimates may be larger and likely more variable from period to period, particularly on our contracts of greater value and with a longer performance period (for example, in our Marine Systems group). Despite this variability, a contract’s cash flows and overall profitability at completion are the same under the cumulative catch-up method and the reallocation method. Anticipated losses on contracts will continue to be recognized in the quarter they are identified.
For our contracts for the manufacture of business-jet aircraft in the Aerospace group, we will record revenue under ASC Topic 606 at a single point in time when control is transferred to the customer, generally when the customer accepts the fully outfitted aircraft. ASC Topic 606 will not change the total revenue or operating earnings recognized for each aircraft, only the timing of when those amounts are recognized. Prior to the adoption of ASC Topic 606, we recorded revenue for these contracts at two contractual milestones: when green aircraft were completed and accepted by the customer and when the customer accepted final delivery of the fully outfitted aircraft.
Numerous other contracts in our portfolio were impacted by ASC Topic 606, due primarily to the identification of multiple performance obligations within a single contract.
Assessment. We have assessed our 2015 and 2016 operating results under ASC Topic 606 as outlined in the tables below. The difference between the operating results reported in the Consolidated Financial Statements and the business group information in Note Q and the operating results in the table below is due only to the adoption of ASC Topic 606. Summary financial information for each of our business groups follows:
96
Revenue Recognition Accounting Change as of January 1, 2017 | ||||||||||||
Restated Revenue | Restated Operating Earnings | |||||||||||
Year Ended December 31 | 2016 | 2015 | 2016 | 2015 | ||||||||
Aerospace | $ | 7,815 | $ | 9,177 | $ | 1,407 | $ | 1,807 | ||||
Combat Systems | 5,530 | 5,643 | 831 | 886 | ||||||||
Information Systems and Technology | 9,144 | 8,929 | 941 | 895 | ||||||||
Marine Systems | 8,072 | 8,032 | 595 | 748 | ||||||||
Corporate* | — | — | (40 | ) | (41 | ) | ||||||
Total | $ | 30,561 | $ | 31,781 | $ | 3,734 | $ | 4,295 | ||||
* Corporate operating results consist primarily of stock option expense.
Diluted earnings per share from continuing operations reflecting the adoption of ASC Topic 606 were $8.64 in 2016 and $9.29 in 2015. The primary driver of this difference is due to fewer outfitted aircraft deliveries in 2016 than in 2015. The impact of ASC Topic 606 on our 2015 and 2016 operating results may or may not be representative of the impact on subsequent years’ results. As noted above, aircraft manufacturing revenue in our Aerospace group will be recognized when control is transferred to the customer, generally when the customer accepts the fully outfitted aircraft. Moreover, in our defense groups, use of the cumulative catch-up method of recognizing adjustments in estimated profits on our long-term contracts will require us to recognize the total impact of an adjustment in the period it is identified rather than prospectively over the remaining contract term as we have in the past.
On our Consolidated Balance Sheet, long-term contracts will continue to be reported in a net contract asset (contracts in process) or contract liability (customer advances and deposits) position on a contract-by-contract basis at the end of each reporting period. Business-jet components in our Aerospace group will be reported in inventory until control of the aircraft transfers to the customer. The assessment of our December 31, 2016, Consolidated Balance Sheet under ASC Topic 606 will result in some reclassifications among financial statement accounts, but these reclassifications will not materially change the total amount of net assets as of December 31, 2016.
97
REPORT OF INDEPENDENT REGISTERED PUBLIC ACCOUNTING FIRM
The Board of Directors and Shareholders of General Dynamics Corporation:
We have audited the accompanying Consolidated Balance Sheets of General Dynamics Corporation and subsidiaries (the Company) as of December 31, 2016 and 2015, and the related Consolidated Statements of Earnings, Comprehensive Income, Cash Flows, and Shareholders’ Equity for each of the years in the three-year period ended December 31, 2016. These Consolidated Financial Statements are the responsibility of the Company’s management. Our responsibility is to express an opinion on these Consolidated Financial Statements based on our audits.
We conducted our audits in accordance with the standards of the Public Company Accounting Oversight Board (United States). Those standards require that we plan and perform the audit to obtain reasonable assurance about whether the financial statements are free of material misstatement. An audit includes examining, on a test basis, evidence supporting the amounts and disclosures in the financial statements. An audit also includes assessing the accounting principles used and significant estimates made by management, as well as evaluating the overall financial statement presentation. We believe that our audits provide a reasonable basis for our opinion.
In our opinion, the Consolidated Financial Statements referred to above present fairly, in all material respects, the financial position of General Dynamics Corporation and subsidiaries as of December 31, 2016 and 2015, and the results of their operations and their cash flows for each of the years in the three-year period ended December 31, 2016, in conformity with U.S. generally accepted accounting principles.
We also have audited, in accordance with the standards of the Public Company Accounting Oversight Board (United States), General Dynamics Corporation’s internal control over financial reporting as of December 31, 2016, based on the criteria established in Internal Control – Integrated Framework (2013) issued by the Committee of Sponsoring Organizations of the Treadway Commission (COSO), and our report dated February 6, 2017, expressed an unqualified opinion on the effectiveness of the Company’s internal control over financial reporting.
 | ||
McLean, Virginia
February 6, 2017
98
SUPPLEMENTARY DATA
(UNAUDITED)
(Dollars in millions, except per-share amounts) | 2015 | 2016 | |||||||||||||||||||||||||||||
1Q | 2Q | 3Q | 4Q | 1Q (a) | 2Q | 3Q (b) | 4Q (c) | ||||||||||||||||||||||||
Revenue | $ | 7,784 | $ | 7,882 | $ | 7,994 | $ | 7,809 | $ | 7,724 | $ | 7,665 | $ | 7,731 | $ | 8,233 | |||||||||||||||
Operating earnings | 1,027 | 1,081 | 1,034 | 1,036 | 1,053 | 1,070 | 1,069 | 1,117 | |||||||||||||||||||||||
Earnings from continuing operations | 716 | 752 | 733 | 764 | 745 | 743 | 767 | 807 | |||||||||||||||||||||||
Discontinued operations | — | — | — | — | (13 | ) | — | (84 | ) | (10 | ) | ||||||||||||||||||||
Net earnings | $ | 716 | $ | 752 | $ | 733 | $ | 764 | $ | 732 | $ | 743 | $ | 683 | $ | 797 | |||||||||||||||
Earnings per share - basic (d): | |||||||||||||||||||||||||||||||
Continuing operations | $ | 2.18 | $ | 2.31 | $ | 2.31 | $ | 2.44 | $ | 2.42 | $ | 2.44 | $ | 2.52 | $ | 2.67 | |||||||||||||||
Discontinued operations | — | — | — | — | (0.04 | ) | — | (0.27 | ) | (0.04 | ) | ||||||||||||||||||||
Net earnings | $ | 2.18 | $ | 2.31 | $ | 2.31 | $ | 2.44 | $ | 2.38 | $ | 2.44 | $ | 2.25 | $ | 2.63 | |||||||||||||||
Earnings per share - diluted (d): | |||||||||||||||||||||||||||||||
Continuing operations | $ | 2.14 | $ | 2.27 | $ | 2.28 | $ | 2.40 | $ | 2.37 | $ | 2.40 | $ | 2.48 | $ | 2.62 | |||||||||||||||
Discontinued operations | — | — | — | — | (0.04 | ) | — | (0.27 | ) | (0.04 | ) | ||||||||||||||||||||
Net earnings | $ | 2.14 | $ | 2.27 | $ | 2.28 | $ | 2.40 | $ | 2.33 | $ | 2.40 | $ | 2.21 | $ | 2.58 | |||||||||||||||
Market price range: | |||||||||||||||||||||||||||||||
High | $ | 142.55 | $ | 147.03 | $ | 153.76 | $ | 152.51 | $ | 138.53 | $ | 147.16 | $ | 156.97 | $ | 180.09 | |||||||||||||||
Low | 131.33 | 130.91 | 132.02 | 136.08 | 121.61 | 129.55 | 136.71 | 148.76 | |||||||||||||||||||||||
Dividends declared | $ | 0.69 | $ | 0.69 | $ | 0.69 | $ | 0.69 | $ | 0.76 | $ | 0.76 | $ | 0.76 | $ | 0.76 | |||||||||||||||
Quarterly data are based on a 13-week period. Because our fiscal year ends on December 31, the number of days in our first and fourth quarters varies slightly from year to year.
(a)First-quarter 2016 includes a $13 loss in discontinued operations for the final adjustment to the loss on the sale of our axle business in the Combat Systems group.
(b)Third-quarter 2016 includes an $84 loss, net of tax, in discontinued operations to adjust the value of a previously-recognized settlement related to litigation associated with a former business of the company.
(c)Fourth-quarter 2016 includes a $10 loss, net of tax, related to an environmental matter associated with a former operation of the company.
(d)The sum of the basic and diluted earnings per share for the four quarters of the year may differ from the annual basic and diluted earnings per share due to the required method of computing the weighted average number of shares in interim periods.
ITEM 9. CHANGES IN AND DISAGREEMENTS WITH ACCOUNTANTS ON ACCOUNTING AND FINANCIAL DISCLOSURE
None.
99
ITEM 9A. CONTROLS AND PROCEDURES
EVALUATION OF DISCLOSURE CONTROLS AND PROCEDURES
Our management, under the supervision and with the participation of the Chief Executive Officer and the Chief Financial Officer, evaluated the effectiveness of our disclosure controls and procedures as of December 31, 2016 (as defined in Rule 13a-15(e) and Rule 15d-15(e) under the Securities Exchange Act of 1934, as amended (Exchange Act)). Based on this evaluation, the Chief Executive Officer and Chief Financial Officer concluded that, on December 31, 2016, our disclosure controls and procedures were effective.
The certifications of the company’s Chief Executive Officer and Chief Financial Officer required under Section 302 of the Sarbanes-Oxley Act have been filed as Exhibits 31.1 and 31.2 to this report.
100
MANAGEMENT’S REPORT ON INTERNAL CONTROL OVER FINANCIAL REPORTING
To the Shareholders of General Dynamics Corporation:
The management of General Dynamics Corporation is responsible for establishing and maintaining adequate internal control over financial reporting and for its assessment of the effectiveness of internal control over financial reporting as defined in Rules 13a-15(f) and 15d-15(f) under the Exchange Act. Our internal control system was designed to provide reasonable assurance to our management and board of directors regarding the preparation and fair presentation of published financial statements.
Because of its inherent limitations, internal control over financial reporting may not prevent or detect misstatements. Also, projections of any evaluation of effectiveness to future periods are subject to the risk that controls may become inadequate because of changes in conditions, or that the degree of compliance with the policies or procedures may deteriorate.
Our management evaluated the effectiveness of our internal control over financial reporting as of December 31, 2016. In making this evaluation, we used the criteria set forth by the Committee of Sponsoring Organizations of the Treadway Commission (COSO) in Internal Control – Integrated Framework (2013). Based on our evaluation we believe that, as of December 31, 2016, our internal control over financial reporting is effective based on those criteria.
KPMG LLP has issued an audit report on the effectiveness of our internal control over financial reporting. The KPMG report immediately follows this report.
 |  | |||
Phebe N. Novakovic | Jason W. Aiken | |||
Chairman and Chief Executive Officer | Senior Vice President and Chief Financial Officer | |||
101
REPORT OF INDEPENDENT REGISTERED PUBLIC ACCOUNTING FIRM
The Board of Directors and Shareholders of General Dynamics Corporation:
We have audited General Dynamics Corporation’s internal control over financial reporting as of December 31, 2016, based on the criteria established in Internal Control – Integrated Framework (2013) issued by the Committee of Sponsoring Organizations of the Treadway Commission (COSO). General Dynamics Corporation’s management is responsible for maintaining effective internal control over financial reporting and for its assessment of the effectiveness of internal control over financial reporting, included in the accompanying Management’s Report on Internal Control over Financial Reporting. Our responsibility is to express an opinion on the Company’s internal control over financial reporting based on our audit.
We conducted our audit in accordance with the standards of the Public Company Accounting Oversight Board (United States). Those standards require that we plan and perform the audit to obtain reasonable assurance about whether effective internal control over financial reporting was maintained in all material respects. Our audit included obtaining an understanding of internal control over financial reporting, assessing the risk that a material weakness exists, and testing and evaluating the design and operating effectiveness of internal control based on the assessed risk. Our audit also included performing such other procedures as we considered necessary in the circumstances. We believe that our audit provides a reasonable basis for our opinion.
A company’s internal control over financial reporting is a process designed to provide reasonable assurance regarding the reliability of financial reporting and the preparation of financial statements for external purposes in accordance with generally accepted accounting principles. A company’s internal control over financial reporting includes those policies and procedures that (1) pertain to the maintenance of records that, in reasonable detail, accurately and fairly reflect the transactions and dispositions of the assets of the company; (2) provide reasonable assurance that transactions are recorded as necessary to permit preparation of financial statements in accordance with generally accepted accounting principles, and that receipts and expenditures of the company are being made only in accordance with authorizations of management and directors of the company; and (3) provide reasonable assurance regarding prevention or timely detection of unauthorized acquisition, use, or disposition of the company’s assets that could have a material effect on the financial statements.
Because of its inherent limitations, internal control over financial reporting may not prevent or detect misstatements. Also, projections of any evaluation of effectiveness to future periods are subject to the risk that controls may become inadequate because of changes in conditions, or that the degree of compliance with the policies or procedures may deteriorate.
In our opinion, General Dynamics Corporation maintained, in all material respects, effective internal control over financial reporting as of December 31, 2016, based on the criteria established in Internal Control – Integrated Framework (2013) issued by the COSO.
102
We also have audited, in accordance with the standards of the Public Company Accounting Oversight Board (United States), the Consolidated Balance Sheets of General Dynamics Corporation and subsidiaries as of December 31, 2016 and 2015, and the related Consolidated Statements of Earnings, Comprehensive Income, Cash Flows and Shareholders’ Equity for each of the years in the three-year period ended December 31, 2016, and our report dated February 6, 2017, expressed an unqualified opinion on those Consolidated Financial Statements.
| ||
McLean, Virginia | ||
February 6, 2017 | ||
CHANGES IN INTERNAL CONTROL OVER FINANCIAL REPORTING
There were no significant changes in our internal control over financial reporting that occurred during the quarter ended December 31, 2016, that have materially affected, or are reasonably likely to materially affect, our internal control over financial reporting.
ITEM 9B. OTHER INFORMATION
None.
PART III
ITEM 10. DIRECTORS, EXECUTIVE OFFICERS AND CORPORATE GOVERNANCE
The information required to be set forth herein, except for the information included under Executive Officers of the Company in Part I, is included in the sections entitled “Election of the Board of Directors of the Company,” “Governance of the Company – Our Culture of Ethics,” “Audit Committee Report” and “Other Information – Section 16(a) Beneficial Ownership Reporting Compliance” in our definitive proxy statement for our 2017 annual shareholders meeting (the Proxy Statement), which sections are incorporated herein by reference.
ITEM 11. EXECUTIVE COMPENSATION
The information required to be set forth herein is included in the sections entitled “Governance of the Company – Director Compensation,” “Compensation Discussion and Analysis,” “Executive Compensation” and “Compensation Committee Report” in our Proxy Statement, which sections are incorporated herein by reference.
103
ITEM 12. SECURITY OWNERSHIP OF CERTAIN BENEFICIAL OWNERS AND MANAGEMENT AND RELATED STOCKHOLDER MATTERS
The information required to be set forth herein is included in the sections entitled “Security Ownership of Management” and “Security Ownership of Certain Beneficial Owners” in our Proxy Statement, which sections are incorporated herein by reference.
The information required to be set forth herein with respect to securities authorized for issuance under our equity compensation plans is included in the section entitled “Equity Compensation Plan Information” in our Proxy Statement, which section is incorporated herein by reference.
ITEM 13. CERTAIN RELATIONSHIPS AND RELATED TRANSACTIONS, AND DIRECTOR INDEPENDENCE
The information required to be set forth herein is included in the sections entitled “Governance of the Company – Related Person Transactions Policy” and “Governance of the Company – Director Independence” in our Proxy Statement, which sections are incorporated herein by reference.
ITEM 14. PRINCIPAL ACCOUNTANT FEES AND SERVICES
The information required to be set forth herein is included in the section entitled “Selection of Independent Auditors – Audit and Non-Audit Fees” in our Proxy Statement, which section is incorporated herein by reference.
PART IV
ITEM 15. EXHIBITS
1. Consolidated Financial Statements
Consolidated Statements of Earnings |
Consolidated Statements of Comprehensive Income |
Consolidated Balance Sheets |
Consolidated Statements of Cash Flows |
Consolidated Statements of Shareholders’ Equity |
Notes to Consolidated Financial Statements (A to S) |
2. Exhibits | ||||
See Index on pages 107 through 110 of this Annual Report on Form 10-K for the year ended December 31, 2016. | ||||
104
SIGNATURES
Pursuant to the requirements of Section 13 or 15(d) of the Securities Exchange Act of 1934, as amended, the Registrant has duly caused this report to be signed on its behalf by the undersigned, thereunto duly authorized.
GENERAL DYNAMICS CORPORATION | ||
by |  | |
Kimberly A. Kuryea | ||
Vice President and Controller | ||
Dated: February 6, 2017 | ||
Pursuant to the requirements of the Securities Exchange Act of 1934, as amended, this report has been signed below on February 6, 2017, by the following persons on behalf of the Registrant and in the capacities indicated, including a majority of the directors.
105
| Chairman, Chief Executive Officer and Director |
Phebe N. Novakovic | (Principal Executive Officer) |
| Senior Vice President and Chief Financial Officer |
Jason W. Aiken | (Principal Financial Officer) |
| Vice President and Controller |
Kimberly A. Kuryea | (Principal Accounting Officer) |
* | |
Mary T. Barra | Director |
* | |
Nicholas D. Chabraja | Director |
* | |
James S. Crown | Director |
* | |
Rudy F. deLeon | Director |
* | |
William P. Fricks | Director |
* | |
John M. Keane | Director |
* | |
Lester L. Lyles | Director |
* | |
Mark M. Malcolm | Director |
* | |
William A. Osborn | Director |
* | |
Laura J. Schumacher | Director |
* | |
Peter A. Wall | Director |
* By Gregory S. Gallopoulos pursuant to a Power of Attorney executed by the directors listed above, which Power of Attorney has been filed as an exhibit hereto and incorporated herein by reference thereto.
 | |||
Gregory S. Gallopoulos | |||
Senior Vice President, General Counsel and Secretary | |||
106
INDEX TO EXHIBITS – GENERAL DYNAMICS CORPORATION
COMMISSION FILE NO. 1-3671
Exhibits listed below, which have been filed with the Commission pursuant to the Securities Act of 1933, as amended, or the Securities Exchange Act of 1934, as amended, and which were filed as noted below, are hereby incorporated by reference and made a part of this report with the same effect as if filed herewith.
Exhibit Number | Description |
3.1 | Restated Certificate of Incorporation of the company (incorporated herein by reference from the company’s current report on Form 8-K, filed with the Commission October 7, 2004) |
3.2 | Amended and Restated Bylaws of General Dynamics Corporation (as amended effective December 2, 2015) (incorporated herein by reference from the company’s current report on Form 8-K, filed with the Commission December 3, 2015) |
4.1 | Indenture dated as of August 27, 2001, among the company, the Guarantors (as defined therein) and The Bank of New York, as Trustee (incorporated herein by reference from the company’s registration statement on Form S-4, filed with the Commission January 18, 2002) |
4.2 | Sixth Supplemental Indenture dated as of July 12, 2011, among the company, the Guarantors (as defined therein) and The Bank of New York Mellon, as Trustee (incorporated herein by reference from the company’s current report on Form 8-K, filed with the Commission July 12, 2011) |
4.3 | Seventh Supplemental Indenture dated as of November 6, 2012, among the company, the Guarantors (as defined therein) and The Bank of New York Mellon, as Trustee (incorporated herein by reference from the company’s current report on Form 8-K, filed with the Commission November 6, 2012) |
4.4 | Indenture dated as of March 24, 2015, among the company, the Guarantors (as defined therein) and The Bank of New York Mellon, as Trustee (incorporated herein by reference from the company’s registration statement on Form S-3, filed with the Commission March 24, 2015) |
4.5 | First Supplemental Indenture dated as of August 12, 2016, among the company, the Guarantors (as defined therein) and The Bank of New York Mellon, as Trustee (incorporated herein by reference from the company’s current report on Form 8-K, filed with the Commission August 12, 2016) |
10.1* | General Dynamics Corporation 2009 Equity Compensation Plan (incorporated herein by reference from the company’s registration statement on Form S-8 (No. 333-159038) filed with the Commission May 7, 2009) |
10.2* | Form of Non-Statutory Stock Option Agreement pursuant to the General Dynamics Corporation 2009 Equity Compensation Plan (incorporated herein by reference from the company’s quarterly report on Form 10-Q for the quarter ended July 5, 2009, filed with the Commission August 4, 2009) |
10.3* | General Dynamics Corporation 2012 Equity Compensation Plan (incorporated herein by reference from the company’s registration statement on Form S-8 (No. 333-181124) filed with the Commission May 3, 2012) |
107
10.4* | Form of Non-Statutory Stock Option Agreement pursuant to the General Dynamics Corporation 2012 Equity Compensation Plan (incorporated herein by reference from the company’s quarterly report on Form 10-Q for the quarter ended July 1, 2012, filed with the Commission August 1, 2012) |
10.5* | Form of Non-Statutory Stock Option Agreement pursuant to the General Dynamics Corporation 2012 Equity Compensation Plan (for certain executive officers who are subject to the company’s Compensation Recoupment Policy) (incorporated herein by reference from the company’s quarterly report on Form 10-Q for the period ended March 30, 2014, filed with the Commission April 23, 2014) |
10.6* | Form of Non-Statutory Stock Option Agreement pursuant to the General Dynamics Corporation 2012 Equity Compensation Plan (for grants made March 4, 2015, through March 1, 2016, and including, as indicated therein, provisions for certain executive officers who are subject to the company’s Compensation Recoupment Policy) (incorporated herein by reference from the company’s quarterly report on Form 10-Q for the period ended April 5, 2015, filed with the Commission April 29, 2015) |
10.7* | Form of Non-Statutory Stock Option Agreement pursuant to the General Dynamics 2012 Equity Compensation Plan (for grants beginning March 2, 2016, and including, as indicated therein, provisions for certain executive officers who are subject to the company’s Compensation Recoupment Policy) (incorporated herein by reference from the company’s quarterly report on Form 10-Q for the period ended April 3, 2016, filed with the Commission April 27, 2016) |
10.8* | Form of Restricted Stock Award Agreement pursuant to the General Dynamics Corporation 2012 Equity Compensation Plan (incorporated herein by reference from the company’s quarterly report on Form 10-Q for the quarter ended July 1, 2012, filed with the Commission August 1, 2012) |
10.9* | Form of Restricted Stock Award Agreement pursuant to the General Dynamics Corporation 2012 Equity Compensation Plan (for certain executive officers who are subject to the company’s Compensation Recoupment Policy) (incorporated herein by reference from the company’s quarterly report on Form 10-Q for the period ended March 30, 2014, filed with the Commission April 23, 2014) |
10.10* | Form of Restricted Stock Award Agreement pursuant to the General Dynamics 2012 Equity Compensation Plan (for grants beginning March 4, 2015, and including, as indicated therein, provisions for certain executive officers who are subject to the company’s Compensation Recoupment Policy) (incorporated herein by reference from the company’s quarterly report on Form 10-Q for the period ended April 5, 2015, filed with the Commission April 29, 2015) |
10.11* | Form of Restricted Stock Unit Award Agreement pursuant to the General Dynamics Corporation 2012 Equity Compensation Plan (incorporated herein by reference from the company’s quarterly report on Form 10-Q for the quarter ended July 1, 2012, filed with the Commission August 1, 2012) |
10.12* | Form of Restricted Stock Unit Award Agreement pursuant to the General Dynamics 2012 Equity Compensation Plan (for grants made March 4, 2015 through March 1, 2016) (incorporated herein by reference from the company’s quarterly report on Form 10-Q for the period ended April 5, 2015, filed with the Commission April 29, 2015) |
10.13* | Form of Restricted Stock Unit Award Agreement pursuant to the General Dynamics Corporation 2012 Equity Compensation Plan (for grants beginning March 2, 2016) (incorporated herein by reference from the company’s quarterly report on Form 10-Q for the period ended April 3, 2016, filed with the Commission April 27, 2016) |
108
10.14* | Form of Performance Restricted Stock Unit Award Agreement pursuant to the General Dynamics Corporation 2012 Equity Compensation Plan (incorporated herein by reference from the company’s quarterly report on Form 10-Q for the quarter ended July 1, 2012, filed with the Commission August 1, 2012) |
10.15* | Form of Performance Restricted Stock Unit Award Agreement pursuant to the General Dynamics Corporation 2012 Equity Compensation Plan (for certain executive officers who are subject to the company’s Compensation Recoupment Policy) (incorporated herein by reference from the company’s quarterly report on Form 10-Q for the period ended March 30, 2014, filed with the Commission April 23, 2014) |
10.16* | Form of Performance Restricted Stock Unit Award Agreement pursuant to the General Dynamics 2012 Equity Compensation Plan (for grants made March 4, 2015, through March 1, 2016, and including, as indicated therein, provisions for certain executive officers who are subject to the company’s Compensation Recoupment Policy) (incorporated herein by reference from the company’s quarterly report on Form 10-Q for the period ended April 5, 2015, filed with the Commission April 29, 2015) |
10.17* | Form of Performance Restricted Stock Unit Award Agreement pursuant to the General Dynamics Corporation 2012 Equity Compensation Plan (for grants beginning March 2, 2016, and including, as indicated therein, provisions for certain executive officers who are subject to the company’s Compensation Recoupment Policy) (incorporated herein by reference from the company’s quarterly report on Form 10-Q for the period ended April 3, 2016, filed with the Commission April 27, 2016) |
10.18* | Successor Retirement Plan for Directors (incorporated herein by reference from the company’s annual report on Form 10-K for the year ended December 31, 2003, filed with the Commission March 5, 2004) |
10.19* | General Dynamics Corporation Supplemental Savings Plan, amended and restated effective as of January 1, 2017** |
10.20* | Form of Severance Protection Agreement entered into by substantially all executive officers** |
10.21* | General Dynamics Corporation Supplemental Retirement Plan, restated effective January 1, 2010 (incorporating amendments through March 31, 2011) (incorporated herein by reference from the company’s quarterly report on Form 10-Q for the quarterly period ended April 3, 2011, filed with the Commission May 3, 2011) |
10.22* | Amendment to General Dynamics Corporation Supplemental Retirement Plan, effective January 5, 2015 (incorporated herein by reference from the company’s annual report on Form 10-K for the year ended December 31, 2014, filed with the Commission February 9, 2015) |
10.23* | Amendment to General Dynamics Corporation Supplemental Retirement Plan, effective January 1, 2016** |
21 | Subsidiaries** |
23 | Consent of Independent Registered Public Accounting Firm** |
24 | Power of Attorney** |
31.1 | Certification by CEO pursuant to Section 302 of the Sarbanes-Oxley Act of 2002** |
31.2 | Certification by CFO pursuant to Section 302 of the Sarbanes-Oxley Act of 2002** |
109
32.1 | Certification by CEO pursuant to 18 U.S.C. Section 1350, as adopted pursuant to Section 906 of the Sarbanes-Oxley Act of 2002** |
32.2 | Certification by CFO pursuant to 18 U.S.C. Section 1350, as adopted pursuant to Section 906 of the Sarbanes-Oxley Act of 2002** |
101 | Interactive Data File** |
* Indicates a management contract or compensatory plan or arrangement required to be filed pursuant to Item 15(b) of Form 10-K.
** Filed herewith.
110