Attached files
| file | filename |
|---|---|
| EX-99.1 - EXHIBIT 99.1 - ATHENAHEALTH INC | athnq42016earningsrelease.htm |
| 8-K - 8-K - ATHENAHEALTH INC | athn-20161231x8k.htm |
Fourth Quarter and Fiscal Year 2016 
Prepared Remarks February 2, 2017
Jonathan Bush, Chairman & Chief Executive Officer
Karl Stubelis, Senior Vice President, Chief Financial Officer
About These Remarks
The following commentary is provided by management in conjunction with the fourth quarter and full year 2016 earnings press release issued by athenahealth, Inc. (“athenahealth” or “we”). These remarks represent management’s current views on our financial and operational performance and are provided to give investors and analysts more time to analyze and understand our performance in advance of the earnings conference call. These prepared remarks will not be read on the conference call. A complete reconciliation between generally accepted accounting principles (“GAAP”) and non-GAAP results, as well as a summary of supplemental metrics and definitions, is provided in the tables following these prepared remarks.
Earnings Conference Call Information
To participate in our live conference call and webcast, please dial 877.853.5645 (or 408.940.3868 for international calls) using conference code no. 46669941, or visit the Investors section of our website at www.athenahealth.com. A replay will be available for one week following the conference call at 855.859.2056 (and 404.537.3406 for international calls) using conference code no. 46669941. A webcast replay will also be archived on our website.
Safe Harbor and Forward-Looking Statements
These remarks contain forward-looking statements within the meaning of Section 27A of the Securities Act of 1933, as amended, and Section 21E of the Securities Exchange Act of 1934, as amended. All statements other than statements of historical fact contained in these remarks are forward-looking statements, including statements regarding management’s expectations for future financial and operational performance and operational expenditures, expected growth, and business outlook, including fiscal 2017 guidance; statements regarding the timing of our clients’ transition to Streamlined; statements regarding our ability to implement changes to our workflows and technology platform; statements regarding our ability to reduce work and workflows for our clients; statements regarding our ability to expand our patient engagement services to provide more convenient patient access and to measure patient satisfaction; statements regarding our internal goals and areas of key focus; statements regarding our ability to organize data for our clients to make it more available, more insightful, and easier to utilize during moments of care; statements regarding our ability to deepen, expand, and scale our network-enabled services; statements regarding our ability to further expand into the inpatient market; statements regarding our investments, including in products and our MDP program; and statements found under our “Reconciliation of Non-GAAP Financial Measures to Comparable GAAP Measures” and “Reconciliation of Non-GAAP Financial Measures to Comparable GAAP Measures for Fiscal Year 2017 Guidance” sections of these remarks. Forward-looking statements may be identified with words such as “will,” “may,” “expect,” “plan,” “anticipate,” “upcoming,” “believe,” “estimates,” “expect,” or similar terminology, and the negative of these terms. Forward-looking statements are not promises or guarantees of future performance, and are subject to a variety of risks and uncertainties, many of which are beyond our control, which could cause actual results to differ materially from those contemplated in these forward-looking statements. These risks and uncertainties include: our highly competitive industry and our ability to compete effectively and remain innovative; the development of the market for cloud-based healthcare information technology services; changes in the healthcare industry and their impact on the
1
demand for our services; our ability to effectively manage our growth; our ability to protect our intellectual property; current and future litigation, including for intellectual property infringement; our dependence on third-party providers; risks and costs associated with our worldwide operations; our ability to attract and retain highly skilled employees; our fluctuating operating results; our ability to retain our clients and maintain client revenue; our tax liability; our variable sales and implementation cycles; the timing at which we recognize certain revenue and our ability to evaluate our prospects; defects and errors in our software or services, or interruptions or damages to our systems or those of third parties on which we rely; a data security breach; limitations on our use of data; the effect of payer and provider conduct; the failure of our services to provide accurate and timely information; changing government regulation and the costs, complexity and challenges of compliance; risks associated with our international operations; risks associated with the integration and success of acquired companies; the potential for illegal behavior by employees or subcontractors; and the price volatility of our common stock. Forward-looking statements speak only as of the date hereof and, except as required by law, we undertake no obligation to update or revise these forward-looking statements. For additional information regarding these and other risks faced by us, refer to our public filings with the Securities and Exchange Commission (“SEC”), available on the Investors section of our website at www.athenahealth.com and on the SEC’s website at www.sec.gov.
Use of Non-GAAP Financial Measures
These remarks contain non-GAAP financial measures, as defined by Regulation G. The GAAP financial measure most directly comparable to each non-GAAP financial measure used or discussed, and a reconciliation of the differences between each non-GAAP financial measure and the comparable GAAP financial measure, are included following these prepared remarks and can be found within our fourth quarter and full year 2016 earnings press release in the Investors section of our web site at www.athenahealth.com.
About athenahealth
athenahealth partners with hospital and ambulatory clients to drive clinical and financial results. We offer network-enabled medical record, revenue cycle, patient engagement, care coordination, and population health services, as well as Epocrates® and other point-of-care mobile apps.
athenahealth connects care across a national network of nearly 88,000 providers and nearly 86 million patients. Our network provides clients better insight across their own organization as well as the ability to learn from the experience of every other provider on the network. Through our model, we infuse the knowledge clients need to thrive in a changing industry directly into their workflow, from clinical guidelines to payer rules. We take on back-office work at scale so providers can focus on patients, not paperwork, and get paid more, faster.
athenahealth received two 2015/2016 Best in KLAS awards, including #1 Ambulatory EHR (11-75 physicians) and #1 Practice Management (11-75 physicians), and was rated a leader in interoperability.
Opening Remarks
It is all about the network. 2016 has been a year of executing against our network strategy to 1) drive growth, 2) broaden and deepen our services, and 3) boost interoperability. First, we grew our network to nearly 88,000 providers, nearly 86 million patients, and over 143,000 network endpoints. Second, we made notable progress in the under 50 bed hospital market with the near doubling of our contracted hospital client base and the onboarding of 35 clients on our athenaOne for Hospitals & Health Systems service. Finally, we increased our connections with legacy software vendors. We now have connections with over 150 Epic communities via Carequality and over 1,400 Cerner care sites via CommonWell. Looking ahead, we remain focused on further executing against our network strategy. As discussed at the Ninth Annual Investor Summit on December 15, 2016, our strategic initiatives are focused on deepening our services, helping clients grow their market share, and creating network-effect.
2
Highlights from Q4 2016 include the following:
• | Grew Q4 2016 consolidated revenue by 12% over Q4 2015 and FY 2016 consolidated revenue by 17% over FY 2015 |
• | Delivered GAAP Gross Margin of 53.7%, up 170 basis points from 52.0% in Q4 2015 |
• | Delivered Service Automation Rate, formerly referred to as Non-GAAP Adjusted Gross Margin, of 66.2%, up 120 basis points from 65.0% in Q4 2015 |
• | Delivered GAAP Operating Margin of 4.3%, up from 2.6% in Q4 2015 |
• | Delivered Non-GAAP Adjusted Operating Margin of 14.7%, up from 12.1% in Q4 2015 |
• | Net new active physicians added to the network: athenaCollector (1,366 physicians added), athenaClinicals (1,573 physicians added), and athenaCommunicator (2,009 physicians added) in Q4 2016, compared to athenaCollector (2,148 physicians added), athenaClinicals (1,126 physicians added), and athenaCommunicator (1,965 physicians added) in Q4 2015 |
◦ | Grew athenaCollector physicians by 15%, athenaClinicals physicians by 25%, and athenaCommunicator physicians by 21% over Q4 2015, representing continued strong network growth in 2016 |
• | Net new active providers added to the network: athenaCollector (2,226 providers added), athenaClinicals (2,288 providers added), and athenaCommunicator (3,074 providers added) in Q4 2016, compared to athenaCollector (3,102 providers added), athenaClinicals (1,613 providers added), and athenaCommunicator (2,835 providers added) in Q4 2015 |
◦ | Grew athenaCollector providers by 16%, athenaClinicals providers by 26%, and athenaCommunicator providers by 23% over Q4 2015, representing continued strong network growth in 2016 |
• | Completed the implementation at Michigan State Health Team (athenaOne), brought two additional waves live at NewYork-Presbyterian Medical Groups (athenaOne), brought another wave live at Adventist Health System (athenaOne), brought additional service areas live at Dignity Health (population health), and brought the first service area live at Providence Health & Services (population health) |
• | Published our first athenaClinicals for Hospitals & Health Systems case study profiling Jasper General Hospital’s streamlined ordering and charting, increased time spent with patients during visits, and ease of meeting Meaningful Use requirements |
Results Overview
During 2016, we adopted a change in presentation on our consolidated statements of income in order to present a gross profit line and allocate certain overhead expenses, the presentation of which is consistent with our peers. Under the new presentation, we began allocating overhead expenses, such as occupancy charges, depreciation, and amortization of capitalized software for our GAAP financial results. Prior periods have been revised to reflect this change in presentation.
athenahealth’s top line results for the fourth quarter and fiscal year (“FY”) 2016 reflect solid revenue growth:
• | Total revenue: |
◦ | $288.2 million in Q4 2016, representing 12% growth over $257.5 million in Q4 2015 |
◦ | $1,082.9 million in FY 2016, representing 17% growth over $924.7 million in FY 2015 |
3
Our bottom line results for Q4 and FY 2016, consistent with our growth strategy, demonstrate focused sales, marketing, and research and development investments, and a focus on operating efficiencies:
• | GAAP Gross Profit and Margin: |
• | $154.7 million, or 53.7% of total revenue, in Q4 2016, an increase of 15.6% over $133.8 million, or 52.0% of total revenue, in Q4 2015 |
• | $549.4 million, or 50.7% of total revenue, in FY 2016, an increase of 18.8% over $462.5 million, or 50.0% of total revenue, in FY 2015 |
• | Service Automation Profit and Rate (formerly referred to as Non-GAAP Adjusted Gross Profit and Margin): |
◦ | $190.7 million, or 66.2% of total revenue, in Q4 2016, an increase of 14% over $167.4 million, or 65.0% of total revenue, in Q4 2015 |
◦ | $694.0 million, or 64.1% of total revenue, in FY 2016, an increase of 18% over $587.4 million, or 63.5% of total revenue, in FY 2015 |
• | GAAP selling and marketing expense: |
◦ | $67.1 million, or 23.3% of total revenue, in Q4 2016, a decrease of 2% over $68.2 million, or 26.5% of total revenue, in Q4 2015 |
◦ | $256.6 million, or 23.7% of total revenue, in FY 2016, an increase of 8% over $237.3 million, or 25.7% of total revenue, in FY 2015 |
• | GAAP research and development expense: |
◦ | $44.4 million, or 15.4% of total revenue, in Q4 2016, an increase of 56% over $28.4 million, or 11.0% of total revenue, in Q4 2015 |
◦ | $134.5 million, or 12.4% of total revenue, in FY 2016, an increase of 21% over $111.0 million, or 12.0% of total revenue, in FY 2015 |
• | GAAP general and administrative expense: |
◦ | $30.8 million, or 10.7% of total revenue, in Q4 2016, an increase of 1% from $30.5 million, or 11.8% of total revenue, in Q4 2015 |
◦ | $131.7 million, or 12.2% of total revenue, in FY 2016, an increase of 11% over $118.3 million, or 12.8% of total revenue, in FY 2015 |
• | GAAP Operating Income (Loss) and Margin: |
◦ | $12.4 million, or 4.3% of total revenue, in Q4 2016, an increase of 85% over $6.7 million, or 2.6% of total revenue, in Q4 2015 |
◦ | $26.6 million, or 2.5% of total revenue in FY 2016, an increase of 749% over $(4.1) million, or 0.4% of total revenue, in FY 2015 |
◦ | Non-GAAP Adjusted Operating Income and Margin: |
◦ | $42.5 million, or 14.7% of total revenue, in Q4 2016, an increase of 36% from $31.3 million, or 12.1% of total revenue, in Q4 2015 |
◦ | $132.3 million, or 12.2% of total revenue in FY 2016, an increase of 39% over $95.1 million, or 10.3% of total revenue, in FY 2015 |
• | GAAP Net Income and GAAP Net Income per Diluted Share: |
4
◦ | $9.8 million, or $0.24 per diluted share, in Q4 2016, compared to $7.7 million, or $0.19 per diluted share, in Q4 2015 |
◦ | $21.0 million, or $0.52 per diluted share, in FY 2016, compared to $14.0 million, or $0.35 per diluted share, in FY 2015 |
• | Non-GAAP Adjusted Net Income and Non-GAAP Adjusted Net Income per Diluted Share: |
◦ | $25.0 million, or $0.62 per diluted share, in Q4 2016, an increase of 40% from $17.8 million, or $0.45 per diluted share, in Q4 2015 |
◦ | $76.0 million, or $1.90 per diluted share, in FY 2016, an increase of 42% from $53.7 million, or $1.35 per diluted share, in FY 2015 |
We measure our performance based on a balanced scorecard model. We believe that this framework is an excellent report card for our performance for the current year and that it measures the key performance indicators required for long-term success. In 2016, we developed a more streamlined and more heavily weighted scorecard focused on eight key stability, performance, satisfaction, and financial metrics. The table below shows the scorecard results for Q1 2016, Q2 2016, Q3 2016, Q4 2016, and full year 2016. Please reference the last page of this document for definitions of our corporate scorecard metrics.
Q1 2016 Results | Q2 2016 Results | Q3 2016 Results | Q4 2016 Results | FY 2016 Results | |||||||||||
Stability (10% weight) | |||||||||||||||
Voluntary Turnover | 2.4 | % | 3.8 | % | 3.7 | % | 2.4 | % | 12.3 | % | |||||
Employee Engagement | (a) | 4.2 | (a) | 4.2 | 4.2 | ||||||||||
Stability Results | 113 | % | 61 | % | 67 | % | 113 | % | 88 | % | |||||
Performance (40% weight) | |||||||||||||||
athenaCollector Composite | 103.1 | % | 100.7 | % | 96.6 | % | 95.5 | % | 98.9 | % | |||||
athenaClinicals Composite | 89.1 | % | 98.0 | % | 92.9 | % | 89.3 | % | 95.7 | % | |||||
athenaCommunicator Composite | 96.8 | % | 96.9 | % | 96.9 | % | 95.7 | % | 96.6 | % | |||||
athenaCoordinator Composite | 108.0 | % | 109.8 | % | 108.3 | % | 107.6 | % | 108.4 | % | |||||
Epocrates Composite | 100.7 | % | 102.2 | % | 97.9 | % | 100.4 | % | 100.3 | % | |||||
Performance Results | 98 | % | 100 | % | 97 | % | 96 | % | 99 | % | |||||
Satisfaction (15% weight) | |||||||||||||||
Net Promoter Score | 34 | 29.3 | 20.2 | 23.9 | 26.8 | ||||||||||
Satisfaction Results | 77 | % | 67 | % | 46 | % | 54 | % | 61 | % | |||||
Financial (35% weight) | |||||||||||||||
Bookings ($M) | n/a | n/a | n/a | n/a | $ | 348.4 | |||||||||
Non-GAAP Adjusted Operating Income ($M) | $ | 24.2 | $ | 24.1 | $ | 41.5 | $ | 42.6 | $ | 132.3 | |||||
Financial Results | 96 | % | 97 | % | 77 | % | 85 | % | 87 | % | |||||
Total Results | 96 | % | 90 | % | 80 | % | 88 | % | 88 | % | |||||
(a) | Employee Engagement surveys are completed twice per year with results reported in Q2 and Q4 only. |
We believe our corporate scorecard metrics results support the underlying drivers of our long-term success. Notably, Voluntary Turnover and Net Promoter improved sequentially from Q3 2016 to Q4 2016.
5
However, Voluntary Turnover and Net Promoter Score were below our internal goals for full year 2016 and remain key areas of focus for the company in 2017.
• | Voluntary Turnover of 2.4% in Q4 2016 was favorable to our goal of 2.8%. FY 2016 Voluntary Turnover was 12.3% versus our goal of 11.0%. We are happy to report than Voluntary Turnover improved sequentially from 3.7% in Q3 2016 to 2.4% in Q4 2016. We closely track employee retention metrics and monitor employee engagement via our semi-annual engagement surveys. We continue to focus on programs that attract, develop, and retain top talent across all of our locations. |
• | athenaCollector Composite result of 95.5% in Q4 2016, as strong performance in the Time of Service “TOS” Collection Rate metric, mainly attributable to the introduction of our new TOS workflow in Q4 2015, was slightly offset by higher than planned Days in Accounts Receivable (40.2 days versus goal of 37.7 days). FY 2016 athenaCollector Composite result was 98.9%. |
• | athenaClinicals Composite result of 89.3% in Q4 2016, driven by slightly higher than expected After Hours Physician Documentation Time. We expect to improve the After Hours Physician Documentation Time metric as we fully transition the entire athenaClinicals client base to the Streamlined experience. FY 2016 athenaClinicals Composite result was 95.7%. |
• | athenaCommunicator Composite result of 95.7% in Q4 2016, driven by slightly lower than expected Portal Adoption and Portal Engagement Rate metric results. We remain focused on improving our patient portal and broader patient communication strategies in order to improve portal experience and increase portal adoption and patient engagement over time. FY 2016 athenaCommunicator Composite result was 96.6%. |
• | athenaCoordinator Composite result of 107.6% in Q4 2016, driven by strong performance in the Coordinated Patient Rate metric, resulting from the growth in the amount of activity associated with chart sharing between athenaNet and third-party vendors. FY 2016 athenaCoordinator Composite result was 108.4%. |
• | Epocrates Composite result was 100.4% in Q4 2016, as the 90 Day Active Doc Engagement rate metric result was in line with our goal. FY 2016 Epocrates Composite result was 100.3%. |
• | Net Promoter Score of 23.9 in Q4 2016, versus goal of 44.0. FY 2016 Net Promoter Score was 26.8. We are happy to report that our Net Promoter Score improved slightly from 20.2 in Q3 2016 to 23.9 in Q4 2016. As discussed previously, we have a number of initiatives underway that we believe will improve our Net Promoter Score over the long run. First, we have product leaders focused solely on improving service delivery and performance. Second, we are reducing the number of releases that impact client workflows to three times a year as part of our agile transformation. Finally, we are working on improving our overall service experience, particularly on the customer support side by taking care of client issues in a more timely fashion. These initiatives continue to be major areas of focus for us in 2017. |
athenahealth’s client base continues to expand while client adoption of other services in the athenahealth service suite grows. As our client base expands outside the traditional ambulatory market, we believe that total active providers, covered lives, and discharge bed days managed by or transacted across our network are the more appropriate metrics to use in measuring network growth and our market share. During Q4 2016 and FY 2016:
• | 84% of all new athenaCollector deals included athenaClinicals in Q4 2016, compared to 85% in Q4 2015 |
◦ | 82% of all new athenaCollector deals included athenaClinicals in FY 2016, compared to 84% in FY 2015 |
6
• | 81% of all new athenaCollector deals included athenaClinicals and athenaCommunicator in Q4 2016, compared to 82% in Q4 2015. Additionally, 81% of all new athenaOne deals sold during Q4 2016 also included athenaCoordinator, compared to 82% in Q4 2015 |
◦ | 79% of all new athenaCollector deals included athenaClinicals, athenaCommunicator, and athenaCoordinator in FY 2016, compared to 81% in FY 2015 |
• | 47% of total athenaCollector providers have adopted athenaClinicals as of Q4 2016, up from 43% as of Q4 2015 |
• | 74% of total athenaCollector providers have adopted athenaCommunicator as of Q4 2016, up from 70% as of Q4 2015 |
• | Net new physicians and providers added sequentially to the network were as follows: |
athenaCollector | athenaClinicals | athenaCommunicator | ||||||||||||
Active physicians and providers: | Physicians | Providers | Physicians | Providers | Physicians | Providers | ||||||||
Beginning balance as of 9/30/16 | 62,450 | 85,465 | 29,439 | 39,052 | 47,183 | 61,689 | ||||||||
Net new additions | 1,366 | 2,226 | 1,573 | 2,288 | 2,009 | 3,074 | ||||||||
Ending balance as of 12/31/16 | 63,816 | 87,691 | 31,012 | 41,340 | 49,192 | 64,763 | ||||||||
Sequential growth % | 2 | % | 3 | % | 5 | % | 6 | % | 4 | % | 5 | % | ||
• | Net new physicians and providers added to the network since Q4 2015 were as follows: |
athenaCollector | athenaClinicals | athenaCommunicator | ||||||||||||
Active physicians and providers: | Physicians | Providers | Physicians | Providers | Physicians | Providers | ||||||||
Beginning balance as of 12/31/15 | 55,277 | 75,416 | 24,867 | 32,684 | 40,635 | 52,821 | ||||||||
Net new additions | 8,539 | 12,275 | 6,145 | 8,656 | 8,557 | 11,942 | ||||||||
Ending balance as of 12/31/16 | 63,816 | 87,691 | 31,012 | 41,340 | 49,192 | 64,763 | ||||||||
Y/Y growth % | 15 | % | 16 | % | 25 | % | 26 | % | 21 | % | 23 | % | ||
• | As discussed at the Ninth Annual Investor Summit on December 15, 2016, we are making some changes to our network growth metrics disclosure starting with fiscal year 2017. We will disclose the following network growth metrics going forward: 1) providers on athenaCollector, athenaClinicals, and athenaCommunicator for athenaOne (ambulatory); 2) discharge bed days for athenaOne (hospital); and 3) covered lives for population health. In addition to providing these new metrics for athenaOne for Hospitals & Health Systems and athenahealth Population Health, we have also refined our definition of providers on our core ambulatory services to include additional provider types such as behavioral interventionists and certified physician assistants and further refined our definition of providers for athenaCommunicator to reflect providers whose practices have enabled the patient portal. We will begin reporting the provider counts with these refined definitions in Q1 2017. The baseline metrics results as of December 31, 2016 are detailed in the table below: |
7
athenaOne (Ambulatory) | athenaOne (Hospital) | Population Health | ||||||||||
Collector Providers | Clinicals Providers | Communicator Providers | Discharge Bed Days | Covered Lives | ||||||||
Ending Balance as of 12/31/16 (Historic definition) | 87,691 | 41,340 | 64,763 | 6,107 | 2,215,451 | |||||||
Incremental Providers1 | 8,851 | 8,142 | (6,902 | ) | n/a | n/a | ||||||
Ending Balance as of 12/31/16 (Refined definition) | 96,542 | 49,482 | 57,861 | 6,107 | 2,215,451 | |||||||
1Refined provider definition includes additional provider types (e.g., behavioral interventionists and certified physician assistants) and further refined the provider definition for athenaCommunicator to reflect providers whose practices have enabled the patient portal
• | 3,000 network end points were added to the network in Q4 2016, bringing our total network end points to over 143,000 as of December 31, 2016 |
Revenue Discussion
Q4 2016 revenue reached $288.2 million and grew by 12% (or $30.7 million) over Q4 2015. Our total revenue of $1,082.9 million for FY 2016 grew by 17% (or $158.2 million) over FY 2015.
Q4 2016 | Q4 2015 | Y/Y Growth% | ||
Business Services | $278.9 | $247.9 | 13 | % |
Third-party tenant and other non-core | $9.3 | $9.6 | (3 | )% |
Consolidated | $288.2 | $257.5 | 12 | % |
FY 2016 | FY 2015 | Y/Y Growth% | ||
athenahealth-branded | $1,047.6 | $886.1 | 18 | % |
Third-party tenant and other non-core | $35.3 | $38.6 | (9 | )% |
Consolidated | $1,082.9 | $924.7 | 17 | % |
In terms of trends in our recurring revenue base, same-store analysis of claims created—a proxy for physician office utilization—indicates that physician office activity in Q4 2016 was lower compared to the fourth quarter from prior years. While our analysis showed a slight increase in physician office activity in Q4 2016 compared to Q3 2016, it was lower than the sequential increase in physician office activity typically experienced from Q3 to Q4.
8
Fiscal Year 2017 Outlook
We are reaffirming our fiscal year 2017 guidance communicated on December 15, 2016 at our Ninth Annual Investor Summit. Our fiscal year 2017 guidance is summarized in the following table below:
For the Fiscal Year Ending December 31, 2017 | |
Forward-Looking Guidance | |
Financial Measures | |
GAAP Total Revenue | $1,290 million - $1,330 million |
GAAP Operating Income | $61 million - $81 million |
Non-GAAP Adjusted Operating Income | $170 million - $190 million |
Financial Metric | |
Annual Bookings | $400 million - $450 million |
Service Automation Rate Discussion
Our service automation rate, formerly referred to as Non-GAAP Adjusted Gross Margin, was 66.2% for Q4 2016, up approximately 120 basis points from 65.0% in Q4 2015. Our service automation rate was 64.1% for FY 2016, in line with the mid-point of our fiscal year 2016 guidance, and up 60 basis points from 63.5% in FY 2015. As planned, we continue to invest in our go-live support, client support center, and emerging services personnel to support the growth of our core and emerging services. One of our goals is to improve automation rates on a service-line basis each year. As previously discussed, the expansion of our newer service offerings, such as athenaOne for Hospitals and Health Systems, is expected to serve as a headwind to total company service automation rate expansion until these newer services become more automated and scalable.
Balance Sheet and Cash Flow Highlights
As of December 31, 2016, we had cash and cash equivalents of $147.4 million and outstanding indebtedness of $292.5 million. Operating cash flow increased by $18.8 million from net cash provided by operating activities of $163.8 million for the twelve months ended December 31, 2015, to net cash provided by operating activities of $182.6 million for the twelve months ended December 31, 2016.
Service Development Discussion
Service development at athenahealth is organized around our mission to be healthcare providers’ most trusted service, helping them do well by doing the right thing. By combining three distinct but interconnected components - network, knowledge, and work - we empower our clients to achieve and sustain financial health while staying focused on quality patient care. We have developed a number of network-enabled services to support healthcare providers across the continuum of care. We offer various combinations of our services to our clients, including athenaOne and athenaOne for Hospitals and Health Systems, depending on whether they are medical groups and practices or hospitals and larger health systems. We offer network-enabled medical record, revenue cycle, patient engagement, care coordination, and population health services, as well as Epocrates and other point-of-care mobile apps.
athenahealth-branded and Epocrates-branded service offerings
The following suite of network-enabled services connects our clients to financial results, clinical outcomes, patients, and the broader care continuum:
Medical Billing and Practice Management
athenaCollector is our network-enabled billing and practice management solution that eliminates or reduces many time-consuming activities that typically burden our clients and their staff, allowing them to focus more on patient care and other business priorities. athenaCollector includes our intuitive, web-based practice management solution that helps clients improve practice management by simplifying workflows related to patient registration, scheduling, check-in, charge entry, referral management, checkout, follow-
9
up, collections, accounting, and reporting. In addition, athenaCollector includes our patented billing rules engine, which represents the industry’s largest database of payer-specific reimbursement requirements. It delivers in-depth insight and knowledge to our clients that helps them get paid by health insurers. Additionally, with athenaCollector, we perform back-office services in partnership with our clients at all key steps of the billing process, including: generating and submitting electronic and paper claims, confirming receipt of claims and resubmitting lost claims, posting remittance advice received from payers, following up on unpaid and denied claims, updating our rules engine to help prevent denial recurrences, and reviewing key performance metrics.
Electronic Health Records
athenaClinicals, our network-enabled electronic health record, or EHR, service, organizes the moment of care to help providers maximize their clinical productivity and maintain focus on their patients. athenaClinicals combines a web-based EHR with a clinical cycle management solution and a back-office document management service to help manage patient’s clinical documentation. The web-based EHR application included in athenaClinicals addresses the core clinical workflows of a practice including: clinical chart, encounter documentation, order entry, results viewing, patient call tracking, clinical reminder tracking, and workflow task management. athenaClinicals includes a global library of content that is available for all clients and provides a starting point for certain specialty-specific content. In keeping with our service model of network, knowledge, and work, athenaClinicals also acts as a virtual clinical back office for our clients. Our document services team takes on burdensome administrative work on behalf of our clients by processing incoming documents and routing them to the practice’s staff for review via document routing rules defined by the client.
Patient Engagement
athenaCommunicator is our network-enabled patient engagement and communication solution that provides an on-demand, automated communication service between patients and provider practices for interactions outside the exam room. athenaCommunicator uses phone, e-mail, a patient portal, and our own team of operators to help improve financial and operational performance for our clients. athenaCommunicator enables clients to build a highly flexible set of communication rules with their patients. Our automated messaging platform delivers phone calls, text messages, and e-mails to patients, including appointment reminders, past due balance alerts, disease management initiatives, secure test results, and other compliance-driven campaigns. Our patient portal enables patients to express communication preferences, view lab results, review appointment information, exchange secure messages with providers, update personal information, and pay bills. Additionally, we print and mail paper statements to patients on behalf of our clients to assist with patient payment collection. Collectively, these activities expand the availability of the medical practice to patients and help alleviate the burden of administrative communications, freeing staff to focus on higher-value and more critical tasks. In addition, by tracking patients' responses, we are able to optimize the effectiveness of these communications.
Order Transmission and Care Coordination
athenaCoordinator is our network-enabled order transmission and care coordination service. athenaCoordinator is focused on increasing efficiency for healthcare providers utilizing multiple information technology systems and helps to provide efficient care for patients. athenaCoordinator is founded on three core value drivers: more convenient access to patient data for referring providers, greater visibility into a patient’s full care picture and ordering choices, and less work in managing the movement of patients and their data through the referral chain. This value is delivered through six core network service elements: order management and referral management, scheduling, registration, messaging, charts, and third-party integration. athenaCoordinator is not offered as a stand-alone solution but instead must be utilized with athenaCollector, athenaClinicals, and athenaCommunicator.
Population Health Management
10
athenahealth Population Health is our population health solution that combines services with software and analytics. This comprehensive, cloud-based population health service identifies patients in need of care and analyzes the clinical and financial results of that care to drive improvements in outcomes and costs. After clients transfer data from payers, finance systems, laboratories, clinical repositories, and/or EHRs, athenahealth Population Health processes and integrates that data and provides a platform through which clients can gain insight into and manage the health of their patient population. The population health management functionality of athenahealth Population Health consists of data integration for payer feeds and EHRs, a virtual desktop, and a web portal to gain insight into and take action on that data.
Clinical Decision Support
In addition to providing native decision support functionality into our suite of service offerings, athenahealth also offers other stand-alone applications to providers at the point of care. These services, provided through our Epocrates brand, center around a variety of clinical information and decision support offerings available through healthcare providers’ mobile devices. Epocrates services include: drug and disease information, medical calculator and tools, clinical guidelines, clinical messaging, and market research. The majority of healthcare professionals using our clinical information services access the free versions of our applications; premium subscriptions for some of these services are also available, and some services are sponsored by clients in the healthcare industry (e.g., pharmaceutical companies, managed care companies, and market research firms) that seek opportunities to engage with our network of members. The Epocrates network of members consists of over one million healthcare professionals, including approximately 50% of U.S. physicians. We believe the features available through our Epocrates and other point-of-care mobile applications allow healthcare professionals to leverage technology and clinical content to help inform prescribing decisions, improve workflow, and enhance patient safety.
Connecting to financial results:
Our athenaCollector team continued to innovate and transform the revenue cycle process in 2016. As one of the only internet-based companies of any size and scale in healthcare technology today, we have been proactively leveraging our network intelligence to reduce client work, master collections of self-pay balances, and add capabilities to expand in key markets. In particular, we are constantly working across our network to develop insights that enable clients to eliminate work. In doing so, we continually find ways to reduce manual actions that lead to delays in processing claims. During the second half of 2016, the athenaCollector team doubled down on client work reduction efforts and eliminated more than one million monthly claim holds, a decline of nearly twenty percent versus client baseline trends. For example, we recently leveraged our network intelligence to automatically add the appropriate administration codes required by Medicare when billing specific vaccines. As a result, claim accuracy for these Medicare vaccines has increased, our clients have saved time, and the client experience has improved.
On the self-pay front, the evolving healthcare reimbursement landscape and the shift of financial responsibility to the patient has made our ability to improve patient pay education and the overall patient pay experience even more critical to practice collections. Our implementation of new tools such as the Time of Service (“TOS”) workflow and the QuickPay Portal has improved both practice collections and the patient pay experience. TOS provides an improved user interface and better information to assist front office staff with patient collections, while QuickPay offers patients an easy way to pay their balances online. Reducing client work and improving the client experience will continue to be major areas of focus in 2017. As discussed at the Ninth Annual Investor Summit, we will continue to seek out new ways to use the power of our network-enabled services to remove friction from the revenue cycle process for all participants in healthcare.
Connecting to clinical outcomes:
Our athenaClinicals service helps providers deliver high quality care by organizing the moment of care for maximum clinical productivity and reimbursement. As with all of our services, we are focused on
11
improving client performance and delivering results across the entire network. During 2016, we launched athenaClinicals Streamlined, which enhances our industry-leading, network-driven electronic health record service by radically improving the provider experience. The Streamlined experience centers the encounter around the patient, improves the amount and ease of delegating work away from the physicians, allows the physicians to document as they would communicate, and includes a variety of accelerators to speed documentation of the patient story. We finished the year with nearly 90% of our athenaClinicals providers and over 98% of our athenaClinicals clients on the Streamlined workflow. Our remaining client base will transition in early 2017.
With the launch of Streamlined, we are reducing administrative tasks that burden our clients and we are delivering sustained improvements in key performance metrics like Same Day Encounter Close Rate and Post-Visit Documentation Rate. Our existing athenaClinicals providers are on average 3% more efficient at documenting during the encounter and are experiencing an average 20% drop in documentation after the visit, while our net new athenaClinicals providers are enjoying an average 8% improvement in documentation efficiency and are spending an average 23% less time documenting after the patient visit. In addition, our clients’ staffs are taking over about one third of the burdensome documentation work that physicians themselves typically have to perform, thereby allowing more time for physicians to focus on their patients. At the same time, we continue to drive higher rates of success than the national average for our clients with federal mandate programs such as Meaningful Use and Physician Quality Reporting System.
athenaClinicals Streamlined provides a solid foundation for continuing to enhance the provider experience based on an always learning, always updating network. As a result of our cloud-based architecture, we can efficiently release changes to our workflows and technology platform that incorporate client feedback and optimize clinical productivity. We take client feedback very seriously and will continue to incorporate feedback in upcoming releases. In 2017, we plan to add features and functionality that further reduce work for our clients by removing documents from inboxes through increased automation, better connections, and enhanced machine learning. We also plan to alleviate workflows around prescription ordering and refilling, simplify online self-reporting of patient health history, and improve document labeling to make chart reading easier for our providers.
Connecting to patients:
athenaCommunicator is our patient engagement service that helps practices delight patients with the quality of their experience, fully engages patients in their care, and eliminates unnecessary work for our clients. As the healthcare industry becomes increasingly consumer-driven, we are focused on expanding these services to reduce work, provide more convenient patient access, and measure patient satisfaction. In 2016, we leveraged our consumer marketing expertise to substantially improve the effectiveness of patient wellness campaigns like Medicare Annual Wellness Visit, Adult Annual Preventive Visit, and Adolescent Well-Care Visit. We track the success of these programs based on our Wellness Scheduling Campaign Success measure, which measures the percentage of time that patients successfully schedule an appointment within 14 days of being contacted. Our monthly rate increased from 11.2% in December 2015 to 16.1% in December 2016.
The athenaCommunicator team further reduced client work and created a better patient experience by launching an improved patient self-check-in workflow during 2016. The improved workflow presents patients with an easy, on-line experience to check-in for his or her appointment via a desktop computer or mobile device pre-appointment. More importantly, this improved check-in experience is available to all patients, whether or not they already have a patient portal account, enabling clients to engage with a greater number of patients. The improved self-check-in workflow eliminates unnecessary work for practices and enables patients to view and confirm appointment details, view and update demographics,
12
pay copay and previous balances, e-sign consent forms, and register for the patient portal. It also provides another avenue to drive patient portal registration and engagement.
Patient portals are gaining importance as the industry transitions to value-based care models. Our recent study of portal use in athenahealth’s network found that patient portals deliver clear financial benefits and provide an essential bridge to better patient outcomes under value-based reimbursement. This research also indicates that increased portal adoption can improve patient pay yield, increase patient loyalty, reduce workload for providers and staff, and improve health outcomes based on the notion that engaged patients are typically more proactive about managing their own health. Our patient engagement efforts continue to yield benefits. For example, total patients registered on the portal grew from 9.5 million in 2015 to 14.8 million in 2016, an increase of 56% year over year. Our patient portal adoption rate has increased to 32.1% as of Q4 2016, up from 30.1% as of Q4 2015. Additionally, while registered patients on the portal have increased 56%, patient collections through our athenaCommunicator service grew even faster to $350.4 million in 2016, an increase of 80% from $194.4 million collected in 2015.
Connecting to the care continuum:
We are committed to building the most connected network in healthcare and to driving meaningful, measurable results for everyone on our network. We connect providers on athenaNet with labs,
pharmacies, hospitals, imaging centers, and public health agencies as well as nearly every insurer in the country. We followed through on our commitment and made meaningful progress on many fronts in 2016. First, we grew our connected network. Today, we have over 86 million unique patient records and support the medical operations of nearly 88,000 providers. In 2016, we exchanged 6.7 billion electronic transactions across over 143,000 network end points, representing 68% growth from the 4.0 billion electronic transactions exchanged in 2015. Second, we boosted interoperability by growing and deepening our connections to key trading partners as well as to legacy software vendors through the CommonWell network and the Carequality framework. As a result of this work, we are now managing coverage across the continuum and have grown coverage dramatically during 2016 with connections to over 1,400 Cerner care sites via CommonWell and with connections to over 150 Epic communities via Carequality. During 2016, we advanced patient record sharing across the network through both direct connections and patient record sharing partners. In 2016, we traded patient records through 118,656 direct connections with 56,755 providers, up significantly from 2015 when we traded patient records through 50,457 direct connections with 30,397 providers. We have also grown our connections with patient record exchange partners by nearly 200%, from 3,106 connections in 2015 to 8,910 connections in 2016. Finally, we received high interoperability scores in the 2016 KLAS Interoperability report and we ranked highest among healthcare technology vendors for our ability to share data with other electronic medical record systems. While we are pleased with the progress we made in 2016, we believe that the real work to connect healthcare is just beginning. We believe that in order to achieve a truly connected healthcare system, we must not only ensure the data is flowing but also ensure that the data is organized in a way that parses signal from noise, streamlines and reduces work, and most importantly, influences clinical outcomes. Looking ahead, we will be focused on organizing data for our clients to make it more available, more insightful, and easier to utilize during moments of care.
Network Expansion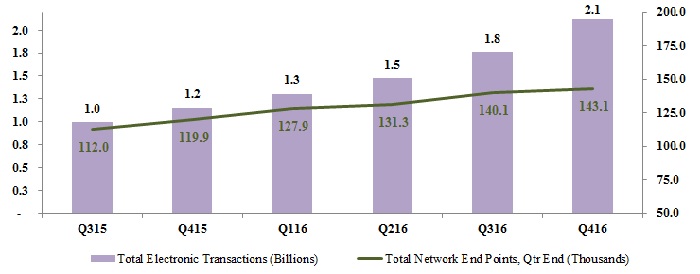
We have made meaningful progress in bringing the power of our network-enabled services to the hospital and health systems market in 2016. We signed 52 clients onto our full athenaOne for Hospitals & Health System service in 2016, near doubling our contracted base of hospital clients. This drove bookings performance to over 120% of the goal for 2016. We also brought 35 clients live on all or a portion of our athenaOne for Hospitals & Health Systems service this year. We are excited about the increased awareness and momentum we are building in the under 50 bed hospital market, as well as how quickly we have demonstrated our ability to drive outcomes and results in this hospital market at scale.
We have learned a great deal since entering the inpatient space two years ago. One key lesson is that maintaining and improving cash flow is critical to these under 50 bed hospitals. These hospitals need cash not only to support their growth and strategic priorities but more importantly to remain in business. We are pleased to report that we drove an average of 106.5% of cash flow as a percentage of baseline for our hospital clients in 2016. We also reported an average 16% decline in Days in Accounts Receivable and an average 15% increase in primary claims paid within 40 days, during the past year. While we are still in the early stages of implementing and scaling the performance management process for our hospital clients, we will continue to track and report on these key sentinel metrics. As we look ahead, we remain focused on deepening, expanding, and scaling our network-enabled services to help our hospital clients thrive and grow during industry change by 1) boosting our clients’ bottom lines, 2) enabling our clients to drive better clinical quality and control, and 3) helping our clients become providers of choice in their communities.
Business Development Update
More Disruption Please (“MDP”)
The mission of our MDP program is to create a true distribution platform that attracts and supports new generations of innovators and entrepreneurs and that delivers innovative solutions to help our clients optimize their financial and operational performance. The MDP team remains focused on leveraging all three major components of this program - the network, the marketplace, and the accelerator - to identify opportunities in the market and seamlessly integrate innovative solutions that will benefit athenahealth, our clients, and the healthcare industry as a whole. Our MDP team made meaningful progress across all three facets of the program in 2016, helping to bring us closer to achieving our ultimate goal of building the healthcare internet. Notably, during 2016 we more than doubled the number of partners live on the MDP Marketplace, nearly doubled unique client adoption of these solutions, and added two portfolio investments. We also acquired two MDP Accelerator companies, Arsenal Health in Q1 2016 and Patient IO in Q3 2016. These successful acquisitions further demonstrate the importance of our MDP program to our overall build/buy/partner strategy as we look to broaden and deepen our services across the full continuum of care. As of year-end, our MDP Marketplace features 134 partners, 92 of which are generally available across 47 capabilities, and another 42 partners that are currently in pilot phase. There are also
13
over 1,500 unique clients using at least one MDP solution, representing growth of 80% since 2015. Our MDP program is growing, but more importantly, it is helping us drive positive outcomes for our clients. We know this because we studied the relationship between the MDP Marketplace and overall client satisfaction and retention. Our internal analysis demonstrated the following: 1) clients using an MDP solution are nearly 40% more likely to be promoters than other similar non-users, 2) no matter the level of satisfaction, we see lower termination rates in clients who are using an MDP solution, and 3) after going live on an MDP solution, over 30% of practices moved from non-promoter to promoter status.
Client satisfaction is paramount to us and our business model demands it. We are financially aligned with our clients and we only do well when our clients do well. In 2017, the MDP team will work to bring this program to the next level. As Jonathan Porter, our Senior Vice President of Network Services, stated at our Ninth Annual Investor summit: “The Marketplace itself is the thing that will be our future and is the most exciting use case for platform technology.” To this end, we will continue to invest in our platform and leverage this program to expand beyond ambulatory in a meaningful way. For example, we launched seven inpatient partners to support our athenaOne for Hospitals & Health Systems service in 2016. However, we realize filling product gaps is not enough and we must focus our energy and investments on continuing to build the network. In 2017, we plan to further expand into the inpatient market, grow our population health service and Epocrates services, and create a universal patient experience in order to better serve our clients and support our partners across more care settings. To learn more about our MDP program and partnership opportunities and to explore the athenahealth MDP Marketplace, please visit www.athenahealth.com/disruption.
Client Base Discussion
As our client base expands outside the traditional ambulatory market, we believe that total active providers, covered lives, and discharge bed days are the more appropriate metrics to use to define our network growth, client base, and market share.
As discussed at the Ninth Annual Investor Summit on December 15, 2016, we are making some changes to our network growth metrics disclosure beginning in fiscal year 2017. We will disclose the following network growth metrics going forward: 1) providers on athenaCollector, athenaClinicals and athenaCommunicator for athenaOne (ambulatory), 2) discharge bed days for athenaOne (hospital), and 3) covered lives for population health. In addition to providing these new metrics for athenaOne for Hospitals & Health Systems and athenahealth Population Health, we have also refined our definition of providers on our core ambulatory services to include additional provider types such as behavioral interventionists and certified physician assistants and further refined our definition of providers for athenaCommunicator to reflect providers whose practices have enabled the patient portal. We will begin reporting the provider counts with these refined definitions in Q1 2017. The baseline metrics results as of December 31, 2016 are detailed in the table below:
14
athenaOne (Ambulatory) | athenaOne (Hospital) | Population Health | ||||||||||
Collector Providers | Clinicals Providers | Communicator Providers | Discharge Bed Days | Covered Lives | ||||||||
Ending Balance as of 12/31/16 (Historic definition) | 87,691 | 41,340 | 64,763 | 6,107 | 2,215,451 | |||||||
Incremental Providers1 | 8,851 | 8,142 | (6,902 | ) | n/a | n/a | ||||||
Ending Balance as of 12/31/16 (Refined definition) | 96,542 | 49,482 | 57,861 | 6,107 | 2,215,451 | |||||||
1Refined provider definition includes additional provider types (e.g., behavioral interventionists and certified physician assistants) and further refined the provider definition for athenaCommunicator to reflect providers whose practices have enabled the patient portal
New Deals
On December 15, 2016, we announced an expanded partnership with Tenet Health at our Ninth Annual Investor Summit. As part of this expanded partnership, we will work with Tenet Health to implement a phased rollout of over 1,500 providers onto our suite of ambulatory services, athenaOne.
On January 23, 2017, we announced a new partnership with OurHealth, an independent provider of employer on-site and near-site primary care clinics. As part of the partner agreement, OurHealth will utilize our cloud-based electronic health record and practice management services across OurHealth’s network of nearly 40 employer-sponsored clinics across the U.S. midwest and southern regions.
Client Implementations
Below are the publicly disclosed clients that went live or partially live during Q4 2016:
• | Michigan State University Health Team went live on our full suite of ambulatory services, athenaOne, in Q4 2016. |
• | NewYork-Presbyterian continued the phased rollout of our suite of ambulatory services, athenaOne, and brought two additional waves live at NewYork-Presbyterian Medical Groups in Q4 2016. |
• | Adventist Health continued the phased rollout of our suite of ambulatory services, athenaOne, and brought another wave live in Q4 2016. |
• | Dignity Health continued the phased rollout of our Population Health service, with implementation of four additional service areas live in Q4 2016. |
• | Providence Health & Services started the phased rollout of our Population Health service, with implementation of the first service area in Q4 2016. |
Growth Discussion
The athenahealth marketing organization encompasses our growth operations, event and partner marketing, inside sales agents, advertising, corporate communications, and product marketing teams. This organization executes in-market investments in an effort to generate new business opportunities for athenahealth. The athenahealth sales organization includes all quota-carrying sales representatives, as well as our sales team leaders, channel sales team, and sales training and development organization.
During 2016, we signed $348 million in bookings which includes $295 million of recurring revenue bookings from our athenahealth-branded services and $53 million of contracted bookings from our Epocrates-branded service. As a reminder, we define bookings as the sum of the expected annualized recurring revenue from athenahealth-branded services and the contracted value from Epocrates-branded services; net of any chargebacks. Looking ahead to 2017, we remain confident in our ability to deliver on
15
our 2017 bookings goals and are reaffirming our fiscal year 2017 bookings guidance of $400 million to $450 million.
As of December 31, 2016, we had a total of 210 quota-carrying sales representatives focused on sales of our athenahealth-branded services, up 25% from December 31, 2015. During 2016, our athenahealth-branded services sales force was divided into four groups: enterprise, which is dedicated to serving the largest managed care organizations, as well as those with high growth potential; group, which is dedicated to medical practices with seven to 150 physicians; small group, which is dedicated to medical practices with one to six physicians; and hospital, which is dedicated to hospitals and hospital-owned clinics and medical groups with 50 beds or less. In 2017, we reorganized our sales force into two segments for sales of athenahealth-branded services to better address our clients’ needs and our markets: the enterprise team, which will be dedicated to serving community hospitals, regional and national health systems, payers, and integrated healthcare enterprises; and the independent medical group team, which will be dedicated to independent medical practices of all sizes. We also have a pharmaceutical sales team dedicated to sales of our Epocrates-branded services for pharmaceutical and other institutional clients. Our sales force is supported by personnel in our marketing organization, who provide specialized support for promotional and selling efforts. Due to our ongoing service relationship with clients, we conduct a consultative sales process for most of our offerings, which generally includes understanding the needs of prospective clients, developing service proposals, and negotiating contracts to enable the commencement of services.
16
Stock-Based Compensation Expense, Amortization of Purchased Intangible Assets, and Reconciliation of Non-GAAP Financial Measures
athenahealth, Inc.
STOCK-BASED COMPENSATION
(Unaudited, in millions)
Set forth below is a breakout of stock-based compensation impacting the Consolidated Statements of Income for the three and twelve months ended December 31, 2016, and 2015:
(unaudited, in millions) | Three Months Ended December 31, | Twelve Months Ended December 31, | |||||||||||||
2016 | 2015 | 2016 | 2015 | ||||||||||||
Stock-based compensation charged to Consolidated Statements of Income: | |||||||||||||||
Cost of revenue | $ | 4.2 | $ | 3.7 | $ | 17.9 | $ | 14.6 | |||||||
Selling and marketing | 4.7 | 4.7 | 19.0 | 18.4 | |||||||||||
Research and development | 2.9 | 2.2 | 12.3 | 9.0 | |||||||||||
General and administrative | 3.9 | 5.6 | 17.3 | 22.1 | |||||||||||
Total stock-based compensation expense | 15.7 | 16.2 | 66.5 | 64.1 | |||||||||||
Amortization of capitalized stock-based compensation related to software development allocated to cost of revenue (1) | 1.1 | 1.4 | 4.9 | 4.4 | |||||||||||
Amortization of capitalized stock-based compensation related to software development allocated to research and development (1) | — | — | 0.1 | — | |||||||||||
$ | 16.8 | $ | 17.6 | $ | 71.5 | $ | 68.5 | ||||||||
(1) | In addition, for the three months ended December 31, 2016, and 2015, $0.1 million and $1.9 million, respectively, of stock-based compensation was capitalized in the line item Capitalized Software Costs, net in the Consolidated Balance Sheets. For the twelve months ended December 31, 2016, and 2015, $2.2 million and $7.3 million, respectively, of stock-based compensation was capitalized in the line item Capitalized Software Costs, net in the Consolidated Balance Sheets. |
athenahealth, Inc.
AMORTIZATION OF PURCHASED INTANGIBLE ASSETS
(Unaudited, in millions)
Set forth below is a breakout of amortization of purchased intangible assets impacting the Consolidated Statements of Income for the three and twelve months ended December 31, 2016, and 2015:
(unaudited, in millions) | Three Months Ended December 31, | Twelve Months Ended December 31, | |||||||||||||
2016 | 2015 | 2016 | 2015 | ||||||||||||
Amortization of purchased intangible assets allocated to: | |||||||||||||||
Cost of revenue | $ | 2.0 | $ | 3.4 | $ | 9.1 | $ | 14.6 | |||||||
Selling and marketing | 3.0 | 2.4 | 11.7 | 9.4 | |||||||||||
Total amortization of purchased intangible assets | $ | 5.0 | $ | 5.8 | $ | 20.8 | $ | 24.0 | |||||||
17
athenahealth, Inc.
RECONCILIATION OF NON-GAAP FINANCIAL MEASURES
TO COMPARABLE GAAP MEASURES
(Unaudited, in millions, except per share amounts)
The following is a reconciliation of the non-GAAP financial measures used by us to describe our financial results determined in accordance with accounting principles generally accepted in the United States of America (“GAAP”). An explanation of these measures is also included below under the heading “Explanation of Non-GAAP Financial Measures.”
While management believes that these non-GAAP financial measures provide useful supplemental information to investors regarding the underlying performance of our business operations, investors are reminded to consider these non-GAAP measures in addition to, and not as a substitute for, financial performance measures prepared in accordance with GAAP. In addition, it should be noted that these non-GAAP financial measures may be different from non-GAAP measures used by other companies, and management may utilize other measures to illustrate performance in the future. Non-GAAP measures have limitations in that they do not reflect all of the amounts associated with our results of operations as determined in accordance with GAAP.
Please note that these figures may not sum exactly due to rounding.
18
Non-GAAP Adjusted Gross Margin and Service Automation Rate
Set forth below is a presentation of our “Non-GAAP Adjusted Gross Profit” and “Non-GAAP Adjusted Gross Margin,” which represents Non-GAAP Adjusted Gross Profit as a percentage of total revenue and our “Service Automation Profit” and “Service Automation Rate,” which represents Service Automation Profit as a percentage of total revenue.
(unaudited, in millions) | Three Months Ended | Twelve Months Ended | |||||||||||||
December 31, | December 31, | ||||||||||||||
2016 | 2015 | 2016 | 2015 | ||||||||||||
Total revenue | $ | 288.2 | $ | 257.5 | $ | 1,082.9 | $ | 924.7 | |||||||
Cost of revenue | 133.5 | 123.7 | 533.5 | 462.2 | |||||||||||
GAAP Gross Profit | 154.7 | 133.8 | 549.4 | 462.5 | |||||||||||
GAAP Gross Margin | 53.7 | % | 52.0 | % | 50.7 | % | 50.0 | % | |||||||
Add: Stock-based compensation allocated to cost of revenue | 4.2 | 3.7 | 17.9 | 14.6 | |||||||||||
Add: Amortization of capitalized stock-based compensation related to software development allocated to cost of revenue | 1.1 | 1.4 | 4.9 | 4.4 | |||||||||||
Add: Amortization of purchased intangible assets allocated to cost of revenue | 2.0 | 3.4 | 9.1 | 14.6 | |||||||||||
Add: Integration and transaction costs allocated to cost of revenue | 0.1 | — | 0.1 | — | |||||||||||
Add: Exit costs, including restructuring costs allocated to cost of revenue | 0.1 | — | 0.4 | — | |||||||||||
Non-GAAP Adjusted Gross Profit (as redefined) | $ | 162.2 | $ | 142.3 | $ | 581.8 | $ | 496.1 | |||||||
Non-GAAP Adjusted Gross Margin (as redefined) | 56.3 | % | 55.3 | % | 53.7 | % | 53.6 | % | |||||||
Add: Amortization and depreciation expense allocated to cost of revenue | 23.9 | 21.3 | 94.4 | 76.6 | |||||||||||
Add: Overhead expense allocated to cost of revenue | 4.6 | 3.8 | 17.8 | 14.7 | |||||||||||
Service Automation Profit (1) | $ | 190.7 | $ | 167.4 | $ | 694.0 | $ | 587.4 | |||||||
Service Automation Rate (1) | 66.2 | % | 65.0 | % | 64.1 | % | 63.5 | % | |||||||
(1) | Service Automation Profit and Rate, formerly referred to as Non-GAAP Adjusted Gross Profit and Margin, excludes amortization, depreciation, and overhead costs. |
19
Non-GAAP Adjusted Operating Income
Set forth below is a reconciliation of our “Non-GAAP Adjusted Operating Income” and “Non-GAAP Adjusted Operating Income Margin,” which represents Non-GAAP Adjusted Operating Income as a percentage of total revenue.
(unaudited, in millions) | Three Months Ended | Twelve Months Ended | |||||||||||||
December 31, | December 31, | ||||||||||||||
2016 | 2015 | 2016 | 2015 | ||||||||||||
Total revenue | $ | 288.2 | $ | 257.5 | $ | 1,082.9 | $ | 924.7 | |||||||
GAAP net income | 9.8 | 7.7 | 21.0 | 14.0 | |||||||||||
Add: Provision for (benefit) from income taxes | 1.7 | (2.6 | ) | — | 4.9 | ||||||||||
Add: Total other expense (income) | 0.9 | 1.6 | 5.6 | (23.0 | ) | ||||||||||
GAAP operating income (loss) | $ | 12.4 | $ | 6.7 | $ | 26.6 | $ | (4.1 | ) | ||||||
GAAP operating margin (loss) | 4.3 | % | 2.6 | % | 2.5 | % | (0.4 | )% | |||||||
Add: Stock-based compensation expense | 15.7 | 16.2 | 66.5 | 64.1 | |||||||||||
Add: Amortization of capitalized stock-based compensation related to software development | 1.1 | 1.4 | 5.0 | 4.4 | |||||||||||
Add: Amortization of purchased intangible assets | 5.0 | 5.8 | 20.8 | 24.0 | |||||||||||
Add: Integration and transaction costs | 1.3 | — | 2.4 | 1.0 | |||||||||||
Add: Exit costs, including restructuring costs | 7.0 | 1.2 | 11.3 | 5.7 | |||||||||||
Less: Gain on investments, net | — | — | (0.3 | ) | — | ||||||||||
Non-GAAP Adjusted Operating Income | $ | 42.5 | $ | 31.3 | $ | 132.3 | $ | 95.1 | |||||||
Non-GAAP Adjusted Operating Income Margin | 14.7 | % | 12.1 | % | 12.2 | % | 10.3 | % | |||||||
20
Non-GAAP Adjusted Net Income
Set forth below is a reconciliation of our “Non-GAAP Adjusted Net Income” and “Non-GAAP Adjusted Net Income per Diluted Share.”
(unaudited, in millions) | Three Months Ended | Twelve Months Ended | |||||||||||||
December 31, | December 31, | ||||||||||||||
2016 | 2015 | 2016 | 2015 | ||||||||||||
GAAP net income | $ | 9.8 | $ | 7.7 | $ | 21.0 | $ | 14.0 | |||||||
Add: Stock-based compensation expense | 15.7 | 16.2 | 66.5 | 64.1 | |||||||||||
Add: Amortization of capitalized stock-based compensation related to software development | 1.1 | 1.4 | 5.0 | 4.4 | |||||||||||
Add: Amortization of purchased intangible assets | 5.0 | 5.8 | 20.8 | 24.0 | |||||||||||
Add: Integration and transaction costs | 1.3 | — | 2.4 | 1.0 | |||||||||||
Add: Exit costs, including restructuring costs | 7.0 | 1.2 | 11.3 | 5.7 | |||||||||||
Less: Gain on investments, net | — | — | (0.3 | ) | (28.6 | ) | |||||||||
Sub-total of tax deductible items | 30.1 | 24.6 | 105.7 | 70.6 | |||||||||||
Less: Tax impact of tax deductible items (1) | (12.0 | ) | (9.8 | ) | (42.3 | ) | (28.2 | ) | |||||||
Add: Tax impact resulting from applying non-GAAP tax rate (2) | (2.9 | ) | (4.7 | ) | (8.4 | ) | (2.7 | ) | |||||||
Non-GAAP Adjusted Net Income | $ | 25.0 | $ | 17.8 | $ | 76.0 | $ | 53.7 | |||||||
Weighted average shares - diluted | 40.1 | 39.8 | 40.1 | 39.6 | |||||||||||
Non-GAAP Adjusted Net Income per Diluted Share | $ | 0.62 | $ | 0.45 | $ | 1.90 | $ | 1.35 | |||||||
(1) | Tax impact calculated using a statutory tax rate of 40%. |
(2) | Represents adjusting the GAAP net income at a non-GAAP tax rate of 40%. We used a non-GAAP tax rate of 40% to normalize the tax impact to our Non-GAAP Adjusted Net Income per Diluted Share based on the fact that a relatively small change in pre-tax GAAP income (loss) in any one period could result in a volatile GAAP effective tax rate. |
21
(unaudited, in millions) | Three Months Ended | Twelve Months Ended | |||||||||||||
December 31, | December 31, | ||||||||||||||
2016 | 2015 | 2016 | 2015 | ||||||||||||
GAAP net income per share - diluted | $ | 0.24 | $ | 0.19 | $ | 0.52 | $ | 0.35 | |||||||
Add: Stock-based compensation expense | 0.39 | 0.41 | 1.66 | 1.62 | |||||||||||
Add: Amortization of capitalized stock-based compensation related to software development | 0.03 | 0.03 | 0.12 | 0.11 | |||||||||||
Add: Amortization of purchased intangible assets | 0.12 | 0.14 | 0.52 | 0.61 | |||||||||||
Add: Integration and transaction costs | 0.03 | — | 0.06 | 0.02 | |||||||||||
Add: Exit costs, including restructuring costs | 0.17 | 0.03 | 0.28 | 0.14 | |||||||||||
Less: Gain on investments, net | — | — | (0.01 | ) | (0.72 | ) | |||||||||
Sub-total of tax deductible items | 0.75 | 0.62 | 2.64 | 1.78 | |||||||||||
Less: Tax impact of tax deductible items (1) | (0.30 | ) | (0.25 | ) | (1.05 | ) | (0.71 | ) | |||||||
Add: Tax impact resulting from applying non-GAAP tax rate (2) | (0.07 | ) | (0.12 | ) | (0.21 | ) | (0.07 | ) | |||||||
Non-GAAP Adjusted Net Income per Diluted Share | $ | 0.62 | $ | 0.45 | $ | 1.90 | $ | 1.35 | |||||||
Weighted average shares - diluted | 40.1 | 39.8 | 40.1 | 39.6 | |||||||||||
(1) | Tax impact calculated using a statutory tax rate of 40%. |
(2) | Represents adjusting the GAAP net income at a non-GAAP tax rate of 40%. We used a non-GAAP tax rate of 40% to normalize the tax impact to our Non-GAAP Adjusted Net Income per Diluted Share based on the fact that a relatively small change in pre-tax GAAP income (loss) in any one period could result in a volatile GAAP effective tax rate. |
22
athenahealth, Inc.
RECONCILIATION OF NON-GAAP FINANCIAL MEASURES
TO COMPARABLE GAAP MEASURES FOR FISCAL YEAR 2017 GUIDANCE
(Unaudited, in millions)
Please note that the figures presented below may not sum exactly due to rounding.
Non-GAAP Adjusted Operating Income Guidance
Set forth below is a reconciliation of our “Non-GAAP Adjusted Operating Income” and “Non-GAAP Adjusted Operating Income Margin” guidance for fiscal year 2017, which represents Non-GAAP Adjusted Operating Income as a percentage of total revenue.
(unaudited, in millions) | LOW | HIGH | |||||
Fiscal Year Ending December 31, 2017 | |||||||
Total revenue | $ | 1,290.0 | $ | 1,330.0 | |||
GAAP operating income | 61.0 | 81.0 | |||||
GAAP operating income margin | 4.7 | % | 6.1 | % | |||
Add: Stock-based compensation expense | 85.0 | 85.0 | |||||
Add: Amortization of capitalized stock-based compensation related to software development | 3.0 | 3.0 | |||||
Add: Amortization of purchased intangible assets | 17.0 | 17.0 | |||||
Add: Integration and transaction costs | 5.0 | 5.0 | |||||
Add: Exit costs, including restructuring (1) | — | — | |||||
Add: Gain or loss on investments (1) | — | — | |||||
Non-GAAP Adjusted Operating Income | $ | 170.0 | $ | 190.0 | |||
Non-GAAP Adjusted Operating Income Margin | 13.2 | % | 14.3 | % | |||
(1) | We currently do not anticipate exit costs, including restructuring or gain or loss on investments during fiscal year 2017. However, if these items occur in fiscal year 2017, we would exclude these items from our Non-GAAP Adjusted Operating Income and Non-GAAP Adjusted Operating Income Margin. |
23
Explanation of Non-GAAP Financial Measures
We report our financial results in accordance with accounting principles generally accepted in the United States of America, or GAAP. However, management believes that, in order to properly understand our short-term and long-term financial and operational trends, investors may wish to consider the impact of certain non-cash or non-recurring items, when used as a supplement to financial performance measures in accordance with GAAP. These items result from facts and circumstances that vary in frequency and impact on continuing operations. Management also uses results of operations before such items to evaluate the operating performance of athenahealth and compare it against past periods, make operating decisions, and serve as a basis for strategic planning. These non-GAAP financial measures provide management with additional means to understand and evaluate the operating results and trends in our ongoing business by eliminating certain non-cash expenses and other items that management believes might otherwise make comparisons of our ongoing business with prior periods more difficult, obscure trends in ongoing operations, or reduce management’s ability to make useful forecasts. Management believes that these non-GAAP financial measures provide additional means of evaluating period-over-period operating performance. In addition, management understands that some investors and financial analysts find this information helpful in analyzing our financial and operational performance and comparing this performance to our peers and competitors.
In Q4 2016, management redefined “Non-GAAP Adjusted Gross Profit” as total revenue, less cost of revenue, plus (1) stock-based compensation expense allocated to cost of revenue, (2) amortization of purchased intangible assets allocated to cost of revenue, (3) integration and transactions costs allocated to cost of revenue, and (4) exit costs, including restructuring costs allocated to cost of revenue, and “Non-GAAP Adjusted Gross Margin” as Non-GAAP Adjusted Gross Profit as a percentage of total revenue. Management defines “Service Automation Profit”, formerly referred to as Non-GAAP Adjusted Gross Profit, as total revenue, less cost of revenue, plus (1) stock-based compensation expense allocated to cost of revenue, (2) amortization of purchased intangible assets allocated to cost of revenue, (3) integration and transaction costs allocated to cost of revenue, (4) exit costs, including restructuring costs allocated to cost of revenue, (5) amortization and depreciation expense allocated to cost of revenue, and (6) overhead expense allocated to cost of revenue, and “Service Automation Rate”, formerly referred to as Non-GAAP Adjusted Gross Margin, as Service Automation Profit as a percentage of total revenue. Management considers these non-GAAP financial measures and metrics to be important indicators of our operational strength and performance of our business and a good measure of our historical operating trends. Moreover, management believes that these measures and metrics enable investors and financial analysts to closely monitor and understand changes in our ability to generate income from ongoing business operations.
Management defines “Non-GAAP Adjusted Operating Income” as the sum of GAAP net income before provision for (benefit from) income taxes; total other expense (income); stock-based compensation expense; amortization of capitalized stock-based compensation related to software development; amortization of purchased intangible assets; integration and transaction costs; exit costs, including restructuring costs; and gain or loss on investments; and “Non-GAAP Adjusted Operating Income Margin” as Non-GAAP Adjusted Operating Income as a percentage of total revenue. Management defines “Non-GAAP Adjusted Net Income” as the sum of GAAP net income before stock-based compensation expense; amortization of capitalized stock-based compensation related to software development; amortization of purchased intangible assets; integration and transaction costs; exit costs, including restructuring costs; and gain or loss on investments and any tax impact related to these preceding items; and an adjustment to the tax provision for the non-GAAP tax rate and “Non-GAAP Adjusted Net Income per Diluted Share” as Non-GAAP Adjusted Net Income divided by weighted average diluted shares outstanding. Management considers these non-GAAP financial measures to be important indicators of our operational strength and performance of our business and a good measure of our historical operating
24
trends. Moreover, management believes that these measures enable investors and financial analysts to closely monitor and understand changes in our ability to generate income from ongoing business operations.
Management excludes or adjusts each of the items identified below from the applicable non-GAAP financial measure or metric referenced above for the reasons set forth with respect to that excluded item:
• | Stock-based compensation expense and amortization of capitalized stock-based compensation related to software development — excluded because these are non-cash expenditures that management does not consider part of ongoing operating results when assessing the performance of our business, and also because the total amount of the expenditure is partially outside of our control because it is based on factors such as stock price, volatility, and interest rates, which may be unrelated to our performance during the period in which the expenses are incurred. |
• | Amortization of purchased intangible assets — purchased intangible assets are amortized over their estimated useful lives and generally cannot be changed or influenced by management after the acquisition. Accordingly, this item is not considered by management in making operating decisions. Management does not believe such charges accurately reflect the performance of our ongoing operations for the period in which such charges are incurred. |
• | Integration and transaction costs — Integration costs are the severance payments and retention bonuses for certain employees related to specific transactions. Transaction costs are costs related to strategic transactions. Accordingly, management believes that such expenses do not have a direct correlation to future business operations, and therefore, these costs are not considered by management in making operating decisions. Management does not believe such charges accurately reflect the performance of our ongoing operations for the period in which such charges are incurred. |
• | Exit costs, including restructuring costs — represents costs related to workforce reductions and to terminate certain lease or other agreements for strategic realignment purposes. Management does not believe such costs accurately reflect the performance of our ongoing operations for the period in which such costs are incurred. |
• | Gain or loss on investments — represents gains or losses on the sales, conversions, or impairments of our investments, such as marketable securities and More Disruption Please (“MDP”) Accelerator investments. Management does not believe such gains or losses accurately reflect the performance of our ongoing operations for the period in which such gains or losses are reported. |
• | Non-GAAP tax rate — We use a non-GAAP tax rate of 40% to normalize the tax impact to our Non-GAAP Adjusted Net Income per Diluted Share based on the fact that a relatively small change in pre-tax GAAP income (loss) in any one period could result in a volatile GAAP effective tax rate. |
25
Supplemental Metrics and Definitions
Fiscal Year 2015 | Fiscal Year 2016 | ||||||||||||||||||
Q1 | Q2 | Q3 | Q4 | Q1 | Q2 | Q3 | Q4 | ||||||||||||
Client Base (Historic Definition) | |||||||||||||||||||
Total Physicians on athenaCollector | 47,062 | 49,176 | 53,129 | 55,277 | 57,093 | 58,621 | 62,450 | 63,816 | |||||||||||
Total Providers on athenaCollector | 64,648 | 67,530 | 72,314 | 75,416 | 78,158 | 80,373 | 85,465 | 87,691 | |||||||||||
Total Physicians on athenaClinicals | 19,796 | 20,923 | 23,741 | 24,867 | 26,169 | 27,349 | 29,439 | 31,012 | |||||||||||
Total Providers on athenaClinicals | 26,166 | 27,641 | 31,071 | 32,684 | 34,576 | 36,208 | 39,052 | 41,340 | |||||||||||
Total Physicians on athenaCommunicator | 33,578 | 35,248 | 38,670 | 40,635 | 42,278 | 43,767 | 47,183 | 49,192 | |||||||||||
Total Providers on athenaCommunicator | 43,770 | 45,902 | 49,986 | 52,821 | 55,244 | 57,211 | 61,689 | 64,763 | |||||||||||
Network Growth | |||||||||||||||||||
Total Providers on athenaCollector (1) | n/a | n/a | n/a | n/a | n/a | n/a | n/a | 96,542 | |||||||||||
Total Providers on athenaClinicals (1) | n/a | n/a | n/a | n/a | n/a | n/a | n/a | 49,482 | |||||||||||
Total Providers on athenaCommunicator (1) | n/a | n/a | n/a | n/a | n/a | n/a | n/a | 57,861 | |||||||||||
Total Discharge Bed Days | n/a | n/a | n/a | n/a | n/a | n/a | 3,802 | 6,107 | |||||||||||
Total Covered Lives | n/a | n/a | n/a | n/a | n/a | n/a | 2,064,126 | 2,215,451 | |||||||||||
Client Performance | |||||||||||||||||||
Net Promoter Score | 42.3 | 40.5 | 39.9 | 40.3 | 34.0 | 29.3 | 20.2 | 23.9 | |||||||||||
Client Days in Accounts Receivable (“DAR”) | 41.1 | 40.8 | 40.7 | 40.1 | 41.3 | 40.6 | 41.5 | 40.2 | |||||||||||
First Pass Resolution (“FPR”) Rate | 93.7 | % | 94 | % | 93.8 | % | 94 | % | 94.2 | % | 94.7 | % | 94.5 | % | 94.7 | % | |||
Electronic Remittance Advice (“ERA”) Rate | 83.2 | % | 82.9 | % | 82.3 | % | 84.2 | % | 83.8 | % | 84.9 | % | 84.5 | % | 85.3 | % | |||
Total Claims Submitted | 32,809,734 | 35,002,061 | 35,826,192 | 40,191,950 | 41,246,696 | 42,261,855 | 42,611,244 | 45,841,213 | |||||||||||
Total Client Collections ($) | 4,110,989,781 | 4,633,427,941 | 4,803,761,899 | 5,281,307,644 | 5,203,424,281 | 5,563,351,503 | 5,714,549,558 | 6,133,676,322 | |||||||||||
Total Working Days | 61 | 64 | 64 | 62 | 62 | 64 | 64 | 61 | |||||||||||
Employees | |||||||||||||||||||
Cost of Revenue | 1,914 | 2,123 | 2,285 | 2,296 | 2,310 | 2,481 | 2,653 | 2,799 | |||||||||||
Selling & Marketing | 602 | 649 | 666 | 668 | 652 | 727 | 762 | 769 | |||||||||||
Research & Development | 1,010 | 1,172 | 1,262 | 1,280 | 1,355 | 1,336 | 1,406 | 1,283 | |||||||||||
General & Administrative | 351 | 380 | 407 | 424 | 435 | 446 | 446 | 454 | |||||||||||
Total Employees | 3,877 | 4,324 | 4,619 | 4,668 | 4,752 | 4,990 | 5,267 | 5,305 | |||||||||||
Quota Carrying Sales Force | |||||||||||||||||||
Total Quota Carrying Sales Representatives | 153 | 156 | 166 | 168 | 170 | 204 | 212 | 210 | |||||||||||
(1) Refined provider definition includes additional provider types (e.g., behavioral interventionists and certified physician assistants) and further refined the provider definition for athenaCommunicator to reflect providers whose practices have enabled the patient portal
Supplemental Metrics Definitions | |
Client Base/Network Growth | |
Total Physicians on athenaCollector | The number of physicians that have rendered a service which generated a medical claim that was billed during the last 91 days on the athenaCollector platform. Examples of physicians include Medical Doctors and Doctors of Osteopathic Medicine. |
Total Providers on athenaCollector | The number of providers, including physicians, that have rendered a service which generated a medical claim that was billed during the last 91 days on the athenaCollector platform. Examples of non-physician providers are Nurse Practitioners and Registered Nurses. |
Total Physicians on athenaClinicals | The number of physicians that have rendered a service through the athenaClinicals platform which generated an encounter or generated a medical claim that was billed during the last 91 days on the athenaCollector platform. |
Total Providers on athenaClinicals | The number of providers, including physicians, that have rendered a service through the athenaClinicals platform which generated an encounter or generated a medical claim that was billed during the last 91 days on the athenaCollector platform. |
Total Physicians on athenaCommunicator | The number of physicians that have rendered a service which generated a medical claim that was billed during the last 91 days on the athenaCollector platform and whose practice is actively using athenaCommunicator. |
Total Providers on athenaCommunicator | The number of providers, including physicians, that have rendered a service which generated a medical claim that was billed during the last 91 days on the athenaCollector platform and whose practice is actively using athenaCommunicator. Effective January 1, 2017, total providers on athenaCommunicator is defined as total providers whose practices have enabled the patient portal. |
Discharge Bed Days | Discharge bed days is defined as the number of days a patient is hospitalized in an inpatient level of care during the quarter. The day of the admission, but not the day of discharge, is counted. If both admission and discharge occur on the same day, it is counted as one inpatient day. |
Covered Lives | Covered lives on the network is defined as the quarterly average of the number of patients for which we have eligibility, claims, pharmacy or risk data in the Population Health platform, for a given client in a given month. |
Client Performance | |
Net Promoter Score | The percentage of clients who chose 9 or 10 (defined as promoters) less the percentage of clients who chose 0 through 6 (defined as detractors) on a scale of 1 to 10 when asked if they would recommend athenahealth to a trusted friend or colleague. These responses are generated from a "client listening" survey that the Company conducts for its client base twice per year. |
Client Days in Accounts Receivable (“DAR”) | The average number of days that it takes outstanding balances on claims to be resolved, e.g. paid, for clients on athenaCollector. Clients that have been live less than 90 days are excluded, as well as clients who are terminating services. |
First Pass Resolution (“FPR”) Rate | Approximates the percentage of primary claims that are favorably adjudicated and closed after a single submission during the period. Currently, the FPR rate is calculated on a monthly basis, and certain practices are excluded (e.g. those that have been live for less than 90 days). |
Electronic Remittance Advice (“ERA”) Rate | Remittance refers to the information about payments (a/k/a explanations of benefits) received from insurance companies during the period. The ERA rate reflects the percentage of total charges that were posted using electronic remittance. |
Total Claims Submitted | The number of claims billed through athenaNet during the period. |
Total Client Collections | The dollar value of collections posted on behalf of clients during the period. |
Total Working Days | The total number of days during the quarter minus weekends and U.S. Post Office holidays. |
Employees | |
Cost of Revenue | The total number of full time equivalent individuals (“FTEs”) employed by athenahealth to support its service operations as of quarter end. This team includes production systems, enrollment services, paper claim submission, claim resolution, clinical operations, professional services, account management, and client services. |
Selling & Marketing | The total number of FTEs employed by athenahealth to support its sales and marketing efforts as of quarter end. This team includes sales representatives, business development staff and the marketing team. |
Research & Development | The total number of FTEs employed by athenahealth to support its research and development efforts as of quarter end. This team includes product development and product management. |
General & Administrative | The total number of FTEs employed by athenahealth to support its general and administrative functions as of quarter end. This team includes finance, human resources, compliance, learning and development, internal audit, corporate technology, recruiting, facilities, and legal. |
Total Employees | The total number of FTEs employed by athenahealth as of quarter end. This number excludes interns and seasonal employees. |
Total Quota Carrying Sales Representatives | The total number of athenahealth-branded services sales representatives who carry quota for net new annual recurring revenue as of quarter end. |
Corporate Scorecard Metrics Definitions | |
Stability | |
Voluntary Turnover | The number of voluntary terminations within a quarter divided by the average of the starting headcount and ending headcount for the quarter. Voluntary turnover excludes employees on action plans or employees on counseling out plans. |
Employee Engagement | Quarterly engagement survey results for employees. Employee engagement results are reported in Q2 and Q4 only. |
Performance | |
athenaCollector Composite | athenaCollector Composite consists of Days in Accounts Receivable (the average number of days that it takes outstanding balances on claims to be resolved), Client Collection Rate (the percentage of charges that are not written off), and Time of Service Collection Rate (the percentage of patient responsibility collected at the time of service in the office). |
athenaClinicals Composite | athenaClinicals Composite consists of PQRS Success (the percent of providers who avoid the Value Modifier penalty based on PQRS performance), Days Documents Open (days of work in the Clinicals inbox), and After Hours Physician Documentation (the percentage of physician encounter documentation that happens after clinical hours). |
athenaCommunicator Composite | athenaCommunicator Composite consists of Portal Adoption Rate (the percentage of patients who have registered for the portal), Portal Engagement Rate (the percentage of patients who logged into the portal within 30 days before or after their appointments), and Annual Visit Rate (the percentage of patients contacted by a well-visit campaign who ultimately scheduled an appointment with the practice). |
athenaCoordinator Composite | athenaCoordinator Composite consists of Coordinator Exchange Rate (the percentage of document exchanges, both inbound and outbound, sent electronically) and Coordinated Patient Rate (the percentage of time that key patient information, for both inbound and outbound transitions of care, is available at the next point of care). |
Epocrates Composite | Epocrates Composite consists of 90 Day Active Physician Engagement (the percentage Epocrates physicians active on the mobile app or website in 9 of the 12 weeks in each quarter). |
Satisfaction | |
Net Promoter Score | Survey respondents from athenaOne survey (sample includes all clients live, surveyed on a bi-annual basis) are categorized as detractors (0-6 score for "likelihood to recommend"), passives (7-8), and promoters (9-10). The Net Promoter Score is calculated by subtracting the % of detractors from the % of promoters. |
Financial | |
Bookings ($M) | Annual bookings are defined as the sum of the expected annualized recurring revenue from our athenahealth-branded services and the contracted value from our Epocrates-branded services; net of actual charge backs. |
Non-GAAP Adjusted Operating Income ($M) | Total Non-GAAP Adjusted Operating Income for fiscal year 2016. |