Attached files
| file | filename |
|---|---|
| EX-99.2 - CAPSTONE COMPANIES, INC. | form8ka013017ex99-2.htm |
| 8-K/A - CAPSTONE COMPANIES, INC. | form8ka013017.htm |
Exhibit 99.3
Investor Presentation
NobleCon13 Investor PresentationJanuary 30, 2017

This presentation contains "forward-looking statements" as that term is defined in the Private Securities Litigation Reform Act of 1995, as amended. Such statements consist of words like “anticipate,” “expect,” “project,” “continue” and similar words. These statements are based on the Company’s and its subsidiaries’ current expectations and involve risks and uncertainties, which may cause results to differ materially from those set forth in the forward-looking statements. Factors that may cause actual results to differ materially from those contemplated by such forward-looking statements, include consumer acceptance of the Company’s products, its ability to deliver new products, the success of its strategy to broaden market channels and the relationships it has with retailers and distributors. Prior success in operations does not necessarily mean success in future operations. The ability of the Company to adequately and affordably fund operations and any growth will be critical to achieving and sustaining any expansion of markets and revenue. The introduction of new products or the expanded availability of products does not mean that the Company will enjoy better financial or business performance. The risks associated with any investment in Capstone Companies, Inc., which is a small business concern and a "penny-stock Company” and, as such, a highly risky investment suitable for only those who can afford to lose such investment, should be evaluated together with the risks and uncertainties more fully described in the Company’s Annual and Quarterly Reports filed with the Securities and Exchange Commission. Capstone Companies, Inc. undertakes no obligation to publicly update or revise any forward-looking statement, whether as a result of new information, future events, or otherwise. Contents of referenced URLs are not incorporated into this press release. Safe Harbor

A designer of innovative LED lighting solutionsfor consumers worldwide… Recent Price $0.43 Shares outstanding (millions) 48.1 Market Capitalization (millions) $20.5 Float (millions) 29.6 Avg. daily volume (3 mo., thousands) 20.5 Insider ownership 38.5% Book value per share $0.10 Q3 2016 TTM Revenue (millions) $29.8 2010 – September 30, 2016 TTM revenue CAGR* 35.1% Capstone Companies, Inc. Market data is as of 1/25/17; ownership is as of latest filing; book value per share is as of 9/30/16*Compounded annual growth rate

Decorative & AestheticBath Vanity LightsSconcesUnder Cabinet Accent LightsPower FailureTurns on when the power goes outSafety & SecurityMotion Sensor LightsNight Lights Diverse LED Lighting Solutions

THE Power Failure Solution Capstone Power Control (“CPC”) technology makes solid state lighting “Power Failure” readyLED bulb with patented technology (Patent Number – 9,425,649 / Issued August 23, 2016)Competitively pricedCPC is a proprietary power failure detection and on/off switchable back-up battery lighting technologyConserves electricity during prolonged outagesNo impact on aesthetic of lighting fixture Capstone Power Control Technology

Building a Leader in LED Lighting Growing Global LED lighting market Expected to grow to ~$42 billion by 2020(1)Annual growth rate of approximately 13.5%(1)Expanding offerings into all categories of LED home lightingFocused on niche product opportunities under exploited by competitionLeveraging product successes & momentumOngoing development of innovative and advanced ideas and conceptsBranding Strategy: Establishing multiple trusted brandsCapstone LightingHoover® Home LED (partnership)Deepening relationships with large retailers Developing New Products While Building & Deepening Relationships Source: Allied Market Research, September 2014 Global Light Emitting Diode Market Report

Reaching end users through multiple channelsWarehouse ClubsBig Box RetailersHome CentersOnline RetailersExpertise in marketing and salesKnowledge of purchase practicesStrong relationships built on trustResponsive, reactive and cost competitiveInternational MarketsLatin AmericaAsia PacificEurope Global Customers & End Markets

Low cost offshore manufacturingManufacturing partners held to compliance, security and equipment evaluation auditsCapstone Hong Kong based team manages and oversees all QA/QC testingOn demand manufacturing and importingBenefits working capitalU.S. warehouse provides capacity for onshore stocking and service when required Direct Import Strategy
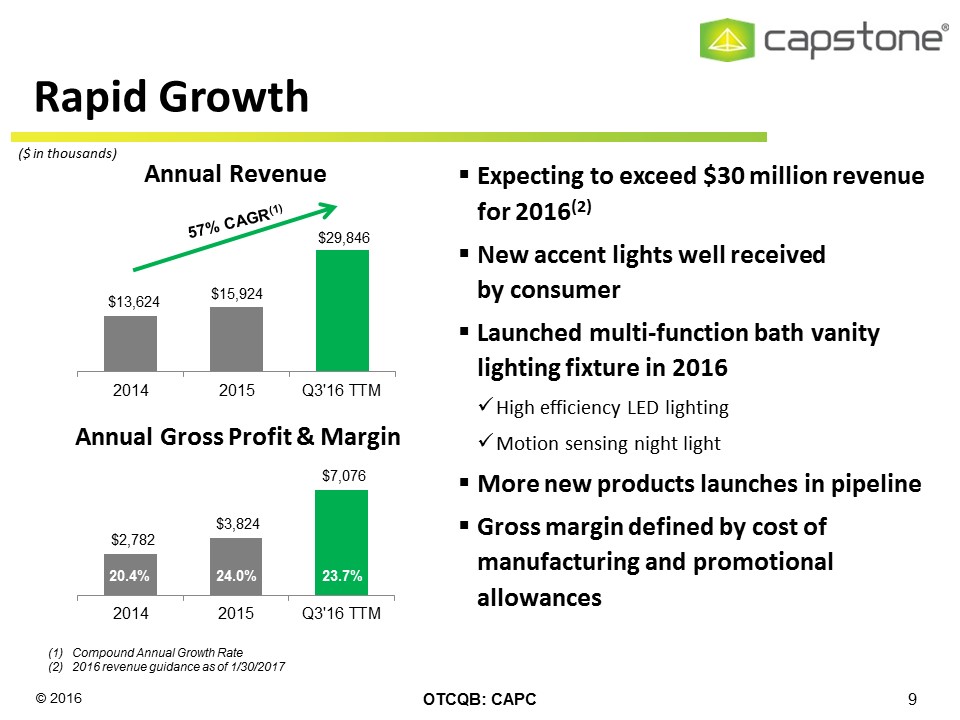
Annual Revenue ($ in thousands) Compound Annual Growth Rate2016 revenue guidance as of 1/30/2017 Rapid Growth Annual Gross Profit & Margin Expecting to exceed $30 million revenue for 2016(2)New accent lights well received by consumerLaunched multi-function bath vanity lighting fixture in 2016High efficiency LED lightingMotion sensing night lightMore new products launches in pipeline Gross margin defined by cost of manufacturing and promotional allowances

Annual Operating Profit & Margin ($ in thousands) Significant Operating Leverage Annual Net (Loss) Income Strong operating leverage on higher salesInterest expense impact:2014: $328 thousand2015: $317 thousandQ3 2016 TTM: $325 thousandTax rate reflects net operating loss recognitionExpected to utilize all remaining NOLs by 2H 2017

Quarterly Revenue ($ in thousands) Setting New Records Quarterly Gross Profit & Margin 20.7% 29.5% 23.9% 12.7% 7.6% (4.8)% 12.2% Quarterly Net Income (Loss) & Margin New products drive record setting revenue and gross profitSeasonality: Promotional scheduling typically dampens Q1 results and drives stronger Q2 and Q3 24.4%
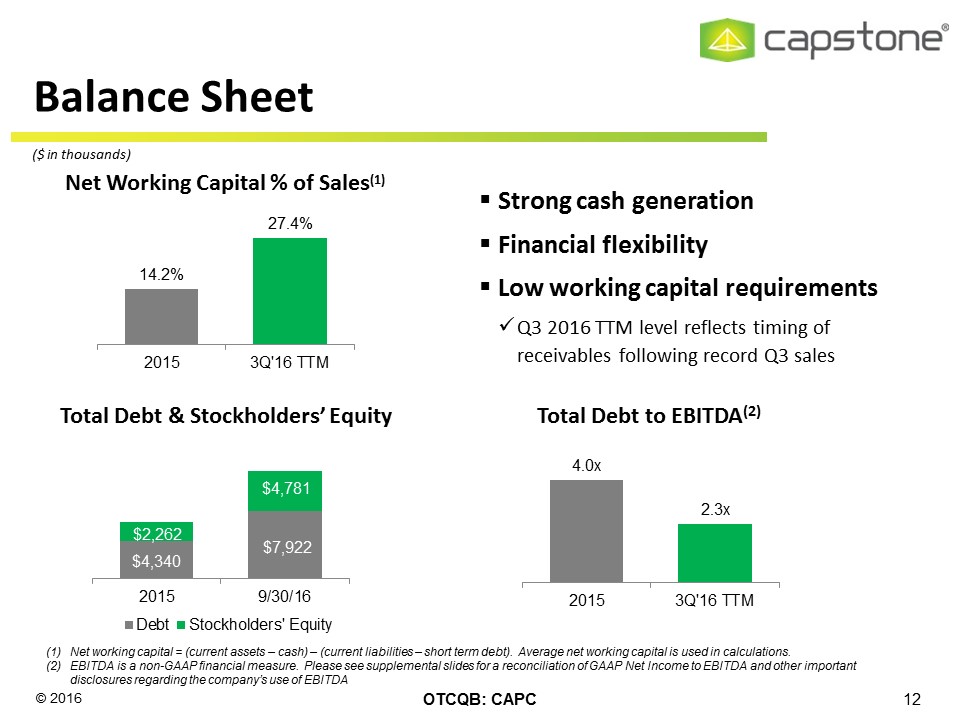
($ in thousands) Net working capital = (current assets – cash) – (current liabilities – short term debt). Average net working capital is used in calculations.EBITDA is a non-GAAP financial measure. Please see supplemental slides for a reconciliation of GAAP Net Income to EBITDA and other important disclosures regarding the company’s use of EBITDA Balance Sheet Strong cash generationFinancial flexibilityLow working capital requirementsQ3 2016 TTM level reflects timing of receivables following record Q3 sales Net Working Capital % of Sales(1) Total Debt & Stockholders’ Equity Total Debt to EBITDA(2)

Rapidly growing LED lighting manufacturer Designs and engineers unique productsUntapped intellectual propertyHoover® license agreement and partnerships accelerate end-user adoption Strong management team with over 100 years combined of experience in international business and offshore manufacturingEstablished relationships with large retailersLow cost manufacturing → Strong margin profile Direct import distribution → Low working capital Key Takeaways

Supplemental Slides
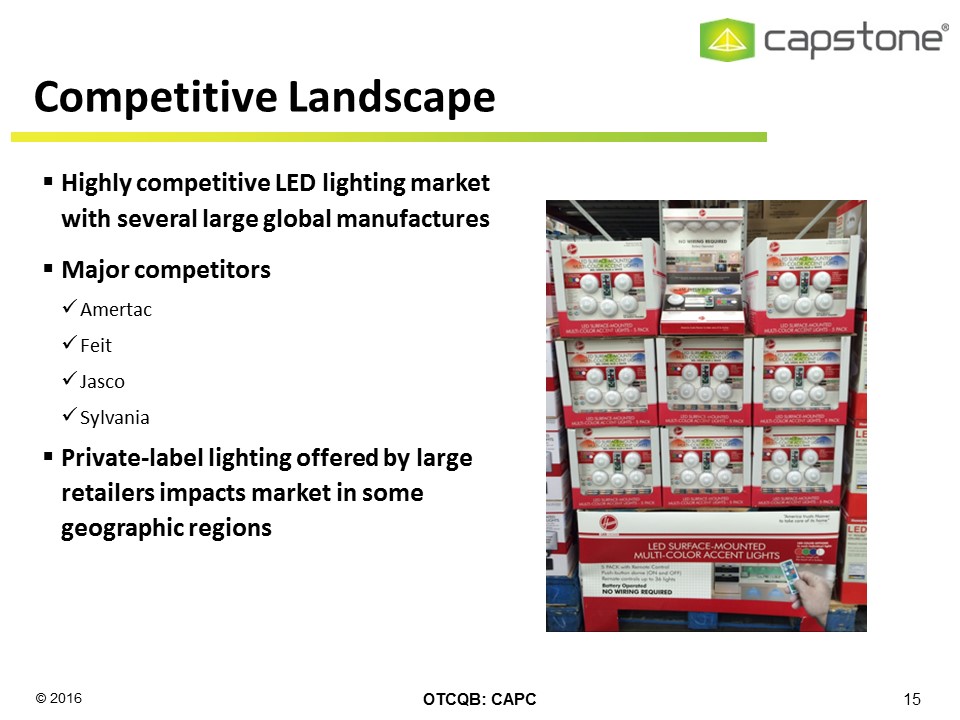
Highly competitive LED lighting market with several large global manufactures Major competitorsAmertacFeitJascoSylvaniaPrivate-label lighting offered by large retailers impacts market in some geographic regions Competitive Landscape

($ in thousands) The Company believes EBITDA, a non-GAAP financial measure, is often a useful measure of a Company’s operating performance and is a significant basis used by the Company’s management to measure the operating performance of the Company’s business because EBITDA excludes charges for depreciation and amortization, and interest expense resulting from our debt financings, as well as our provision for income tax expense. EBITDA does not represent and should not be considered as an alternative to net income, operating income, net cash provided by operating activities or any other measure for determining operating performance or liquidity that is calculated in accordance with generally accepted accounting principles. EBITDA RECONCILIATION Twelve Months Ended Dec. 31, Sept. 30, 2015 2016 Net (loss) Income $ 699 $ 3,021 Interest expense, net 317 325 Provision for income taxes 8 45 Depreciation and amortization 72 67 EBITDA $ 1,096 $ 3,458