Attached files
| file | filename |
|---|---|
| 8-K - 8-K - Guaranty Bancorp | gbnk-20170131x8k.htm |
 FIG Partners 8th Annual West Coast Bank CEO Forum Los Angeles, CA February 1st – 2nd, 2017
 This presentation contains forward-looking statements, which are included in accordance with the “safe harbor” provisions of the Private Securities Litigation Reform Act of 1995. In some cases, you can identify forward-looking statements by terminology such as “may,” “will,” “should,” “could,” “expects,” “plans,” “intends,” “anticipates,” “believes,” “estimates,” “predicts,” “potential,” or “continue,” or the negative of such terms and other comparable terminology. These forward-looking statements involve known and unknown risks, uncertainties and other factors that may cause the Company’s actual results, performance or achievements to be materially different from any future results, performance or achievements expressed or implied by such forward-looking statements. Such factors include, among others, the following: failure to maintain adequate levels of capital and liquidity to support the company’s operations; general economic and business conditions in those areas in which the Company operates, including the impact of global and national economic conditions on our local economy; demographic changes; competition; fluctuations in interest rates; continued ability to attract and employ qualified personnel; ability to receive regulatory approval for the bank subsidiary to declare dividends to the Company; adequacy of the allowance for loan losses, changes in credit quality and the effect of credit quality on the provision for credit losses and allowance for loan losses; changes in governmental legislation or regulation, including, but not limited to, any increase in FDIC insurance premiums; changes in accounting policies and practices; changes in business strategy or development plans; failure or inability to complete mergers or other corporate transactions; failure or inability to realize fully the expected benefits of mergers or other corporate transactions; changes in the securities markets; changes in consumer spending, borrowing and savings habits; the availability of capital from private or government sources; competition for loans and deposits and failure to attract or retain loans and deposits; failure to recognize expected cost savings; changes in the financial performance and/or condition of our borrowers and the ability of our borrowers to perform under the terms of their loans and terms of other credit agreements; changes in oil and natural gas prices; political instability, acts of war or terrorism and natural disasters; and additional “Risk Factors” referenced in the Company’s most recent Annual Report on Form 10-K filed with the Securities and Exchange Commission, as supplemented from time to time. When relying on forward-looking statements to make decisions with respect to the Company, investors and others are cautioned to consider these and other risks and uncertainties. The Company can give no assurance that any goal or plan or expectation set forth in any forward-looking statement can be achieved and readers are cautioned not to place undue reliance on such statements, which speak only as of the date made. The forward-looking statements are made as of the date of this presentation, and, except as may otherwise be required by law, the Company does not intend, and assumes no obligation, to update the forward-looking statements or to update the reasons why actual results could differ from those projected in the forward-looking statements.
Investors and security holders are urged to read the Company’s Annual Report on Form 10-K, Quarterly Reports on Form 10-Q and other documents filed by the Company with the SEC. The documents filed by the Company with the SEC may be obtained at the Company’s website at www.gbnk.com or at the SEC's website at www.sec.gov. These documents may also be obtained free of charge from the Company by directing a request to: Guaranty Bancorp, 1331 Seventeenth St., Suite 200, Denver, CO 80202, Attention: Christopher Treece/Investor Relations; Telephone 303-675-1194.
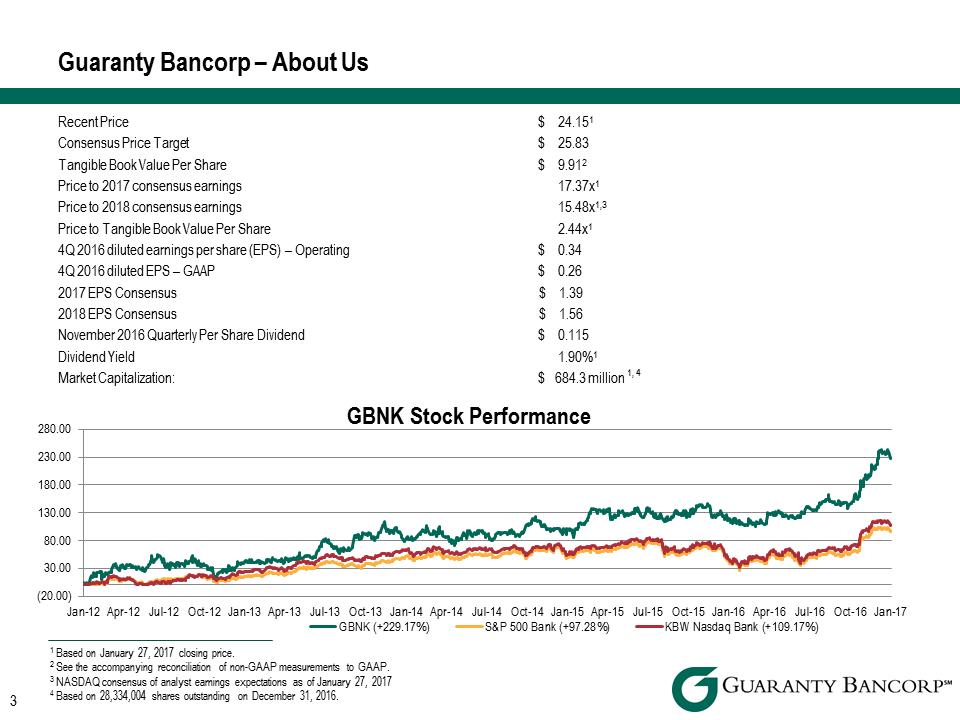 Recent Price $ 24.151 Consensus Price Target $ 25.83 Tangible Book Value Per Share $ 9.912 Price to 2017 consensus earnings 17.37x1 Price to 2018 consensus earnings 15.48x1,3 Price to Tangible Book Value Per Share 2.44x1 4Q 2016 diluted earnings per share (EPS) – Operating $ 0.34 4Q 2016 diluted EPS – GAAP $ 0.26 2017 EPS Consensus $ 1.39 2018 EPS Consensus $ 1.56 November 2016 Quarterly Per Share Dividend $ 0.115 Dividend Yield 1.90%1 Market Capitalization: $ 684.3 million 1, 4 Guaranty Bancorp – About Us 3 1 Based on January 27, 2017 closing price. 2 See the accompanying reconciliation of non-GAAP measurements to GAAP. 3 NASDAQ consensus of analyst earnings expectations as of January 27, 2017 4 Based on 28,334,004 shares outstanding on December 31, 2016. (20.00) 30.00 80.00 130.00 180.00 230.00 280.00 Jan-12 Apr-12 Jul-12 Oct-12 Jan-13 Apr-13 Jul-13 Oct-13 Jan-14 Apr-14 Jul-14 Oct-14 Jan-15 Apr-15 Jul-15 Oct-15 Jan-16 Apr-16 Jul-16 Oct-16 Jan-17 GBNK Stock Performance GBNK (+229.17%)S&P 500 Bank (+97.28%)KBW Nasdaq Bank (+109.17%)
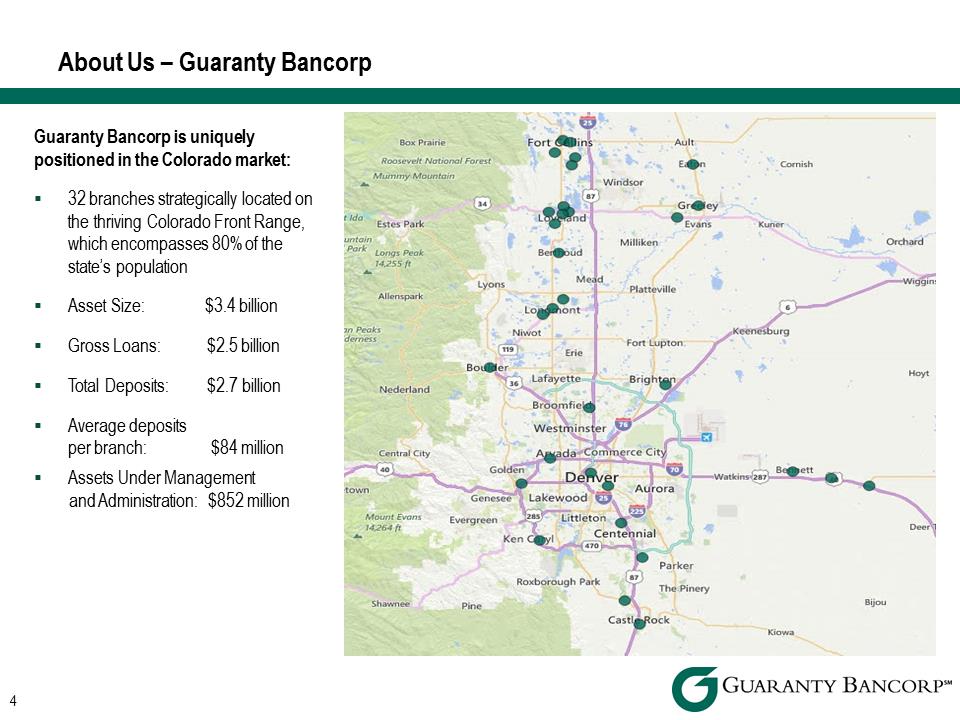 Guaranty Bancorp is uniquely positioned in the Colorado market: .32 branches strategically located on the thriving Colorado Front Range, which encompasses 80% of the state’s population .Asset Size: $3.4 billion .Gross Loans: $2.5 billion .Total Deposits: $2.7 billion .Average deposits per branch: $84 million .Assets Under Management and Administration: $852 million 4
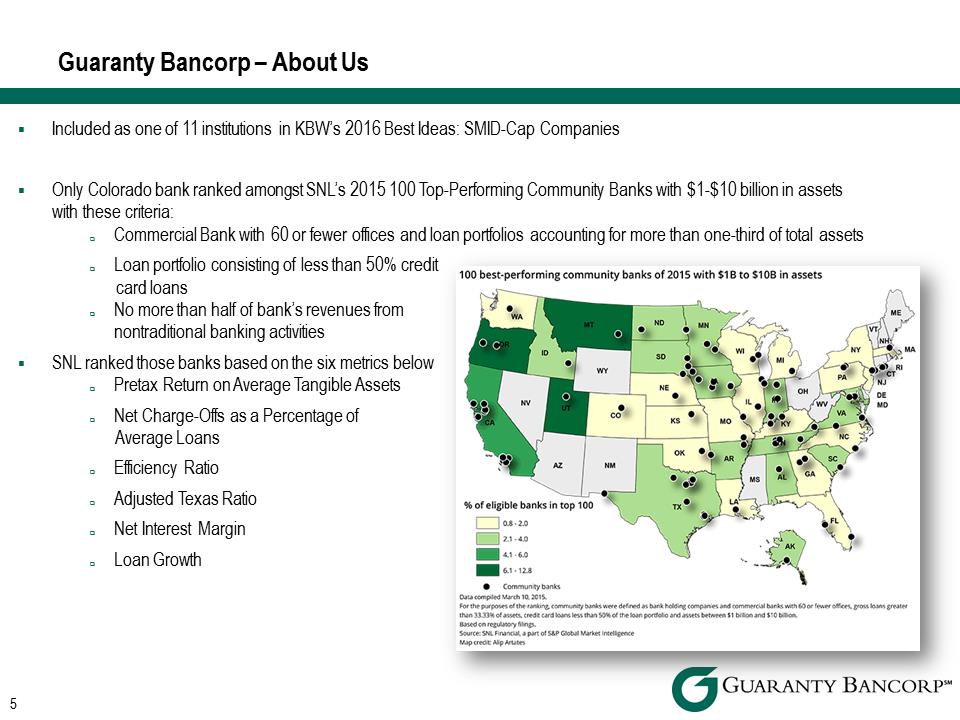 .Included as one of 11 institutions in KBW’s 2016 Best Ideas: SMID-Cap Companies Only Colorado bank ranked amongst SNL’s 2015 100 Top-Performing Community Banks with $1-$10 billion in assets with these criteria: .Commercial Bank with 60 or fewer offices and loan portfolios accounting for more than one-third of total assets .Loan portfolio consisting of less than 50% credit card loans .No more than half of bank’s revenues from nontraditional banking activities .SNL ranked those banks based on the six metrics below .Pretax Return on Average Tangible Assets .Net Charge-Offs as a Percentage of Average Loans .Efficiency Ratio .Adjusted Texas Ratio .Net Interest Margin .Loan Growth 5
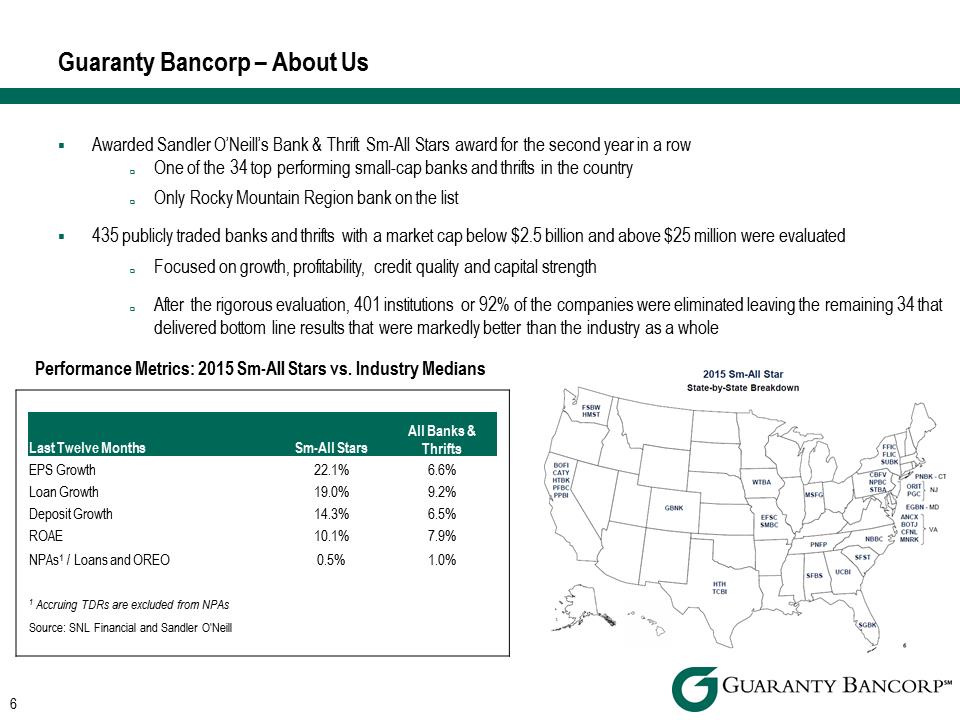 .Awarded Sandler O’Neill’s Bank & Thrift Sm-All Stars award for the second year in a row .One of the 34 top performing small-cap banks and thrifts in the country .Only Rocky Mountain Region bank on the list .435 publicly traded banks and thrifts with a market cap below $2.5 billion and above $25 million were evaluated .Focused on growth, profitability, credit quality and capital strength .After the rigorous evaluation, 401 institutions or 92% of the companies were eliminated leaving the remaining 34 that delivered bottom line results that were markedly better than the industry as a whole Performance Metrics: 2015 Sm-All Stars vs. Industry Medians Last Twelve Months Sm-All Stars All Banks & Thrifts EPS Growth 22.1% 6.6% Loan Growth 19.0% 9.2% Deposit Growth 14.3% 6.5% ROAE 10.1% 7.9% NPAs1 / Loans and OREO 0.5% 1.0% 1 Accruing TDRs are excluded from NPAs Source: SNL Financial and Sandler O'Neill 6
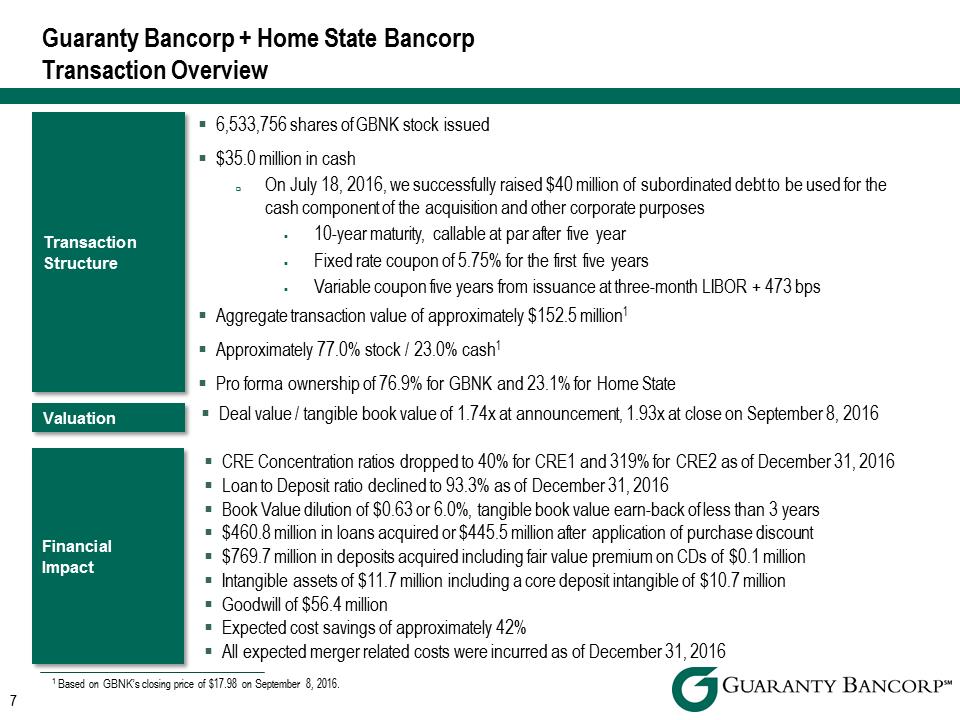 7 Transaction Structure .6,533,756 shares of GBNK stock issued .$35.0 million in cash .On July 18, 2016, we successfully raised $40 million of subordinated debt to be used for the cash component of the acquisition and other corporate purposes .10-year maturity, callable at par after five year .Fixed rate coupon of 5.75% for the first five years .Variable coupon five years from issuance at three-month LIBOR + 473 bps .Aggregate transaction value of approximately $152.5 million1 .Approximately 77.0% stock / 23.0% cash1 .Pro forma ownership of 76.9% for GBNK and 23.1% for Home State Valuation Financial Impact .CRE Concentration ratios dropped to 40% for CRE1 and 319% for CRE2 as of December 31, 2016 .Loan to Deposit ratio declined to 93.3% as of December 31, 2016 .Book Value dilution of $0.63 or 6.0%, tangible book value earn-back of less than 3 years .$460.8 million in loans acquired or $445.5 million after application of purchase discount .$769.7 million in deposits acquired including fair value premium on CDs of $0.1 million .Intangible assets of $11.7 million including a core deposit intangible of $10.7 million .Goodwill of $56.4
million .Expected cost savings of approximately 42% .All expected merger related costs were incurred as of December 31, 2016 Guaranty Bancorp + Home State Bancorp Transaction Overview 1 Based on GBNK’s closing price of $17.98 on September 8, 2016. .Deal value / tangible book value of 1.74x at announcement, 1.93x at close on September 8, 2016 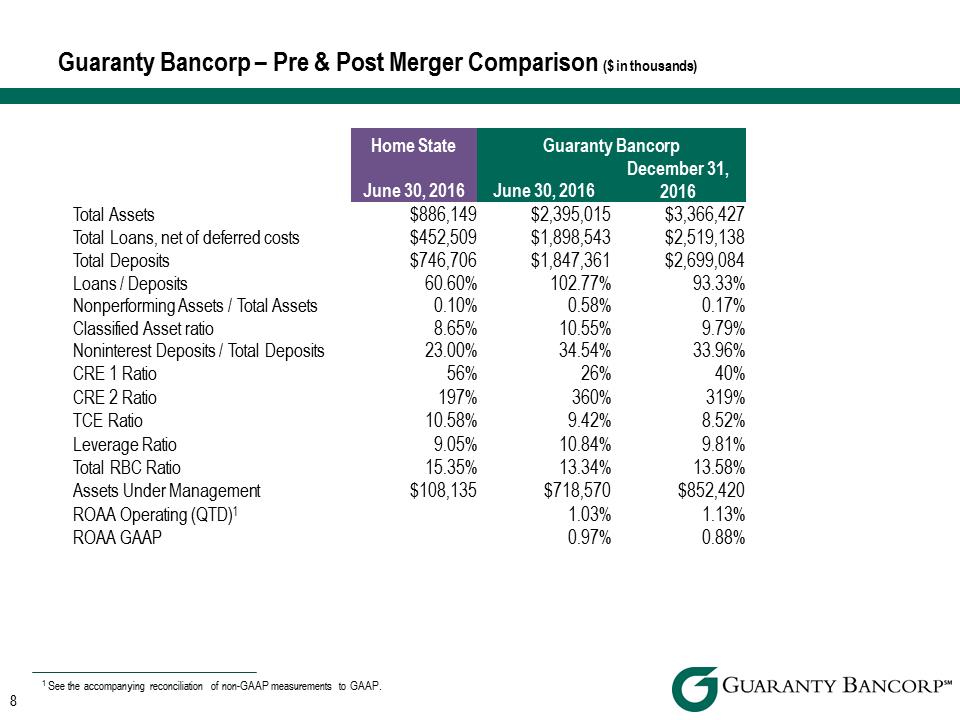
Home State Guaranty Bancorp June 30, 2016 June 30, 2016 December 31, 2016 Total Assets $886,149 $2,395,015 $3,366,427 Total Loans, net of deferred costs $452,509 $1,898,543 $2,519,138 Total Deposits $746,706 $1,847,361 $2,699,084 Loans / Deposits 60.60% 102.77% 93.33% Nonperforming Assets / Total Assets 0.10% 0.58% 0.17% Classified Asset ratio 8.65% 10.55% 9.79% Noninterest Deposits / Total Deposits 23.00% 34.54% 33.96% CRE 1 Ratio 56% 26% 40% CRE 2 Ratio 197% 360% 319% TCE Ratio 10.58% 9.42% 8.52% Leverage Ratio 9.05% 10.84% 9.81% Total RBC Ratio 15.35% 13.34% 13.58% Assets Under Management $108,135 $718,570 $852,420 ROAA Operating (QTD)1 1.03% 1.13% ROAA GAAP 0.97% 0.88% Guaranty Bancorp – Pre & Post Merger Comparison ($ in thousands) 1 See the accompanying reconciliation of non-GAAP measurements to GAAP.
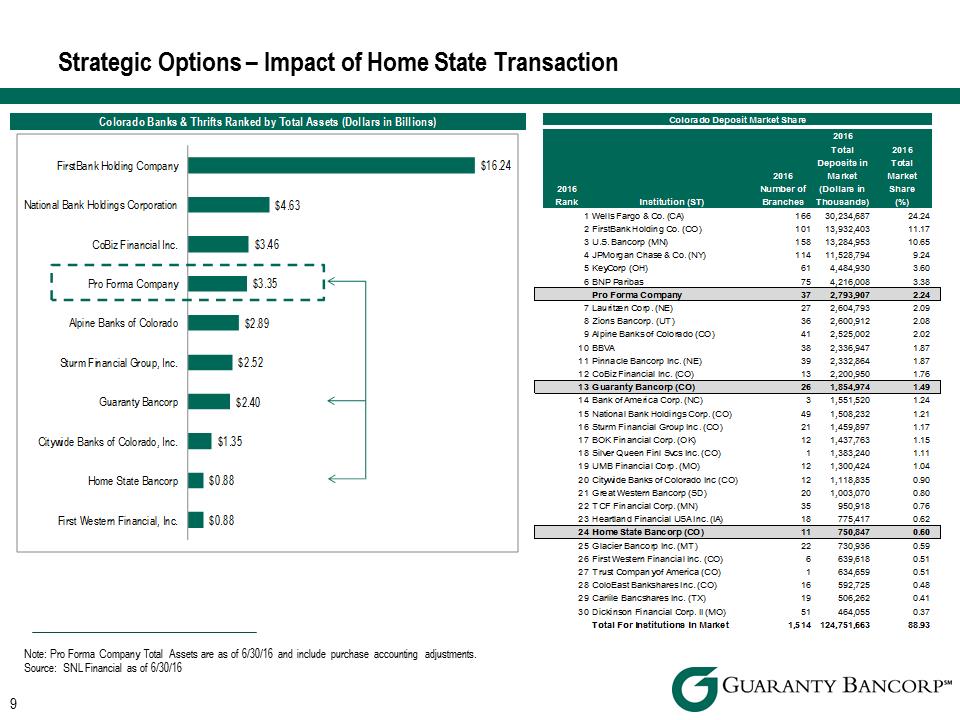 Strategic Options – Impact of Home State Transaction Colorado Banks & Thrifts Ranked by Total Assets (Dollars in Billions)$0.88 $0.88 $1.35 $2.40 $2.52 $2.89 $3.35 $3.46 $4.63 $16.24 First Western Financial, Inc. Home State Bancorp Citywide Banks of Colorado, Inc. Guaranty Bancorp Sturm Financial Group, Inc. Alpine Banks of Colorado Pro Forma Company CoBiz Financial Inc.National Bank Holdings Corporation FirstBank Holding Company 2016 Rank Institution (ST)2016 Number of Branches 2016 Total Deposits in Market (Dollars in Thousands)2016 Total Market Share (%)1Wells Fargo & Co. (CA)16630,234,68724.242FirstBank Holding Co. (CO)10113,932,40311.173U.S. Bancorp (MN)15813,284,95310.654JPMorgan Chase & Co. (NY)11411,528,7949.245KeyCorp (OH)614,484,9303.606BNP Paribas754,216,0083.38Pro Forma Company372,793,9072.247Lauritzen Corp. (NE)272,604,7932.098Zions Bancorp. (UT)362,600,9122.089Alpine Banks of Colorado (CO)412,525,0022.0210BBVA382,336,9471.8711Pinnacle Bancorp Inc. (NE)392,332,8641.8712CoBiz Financial Inc. (CO)132,200,9501.7613Guaranty Bancorp (CO)261,854,9741.4914Bank of America Corp. (NC)31,551,5201.2415National Bank Holdings Corp. (CO)491,508,2321.2116Sturm Financial Group Inc. (CO)211,459,8971.1717BOK Financial Corp. (OK)121,437,7631.1518Silver Queen Finl Svcs Inc. (CO)11,383,2401.1119UMB Financial Corp. (MO)121,300,4241.0420Citywide Banks of Colorado Inc (CO)121,118,8350.9021Great Western Bancorp (SD)201,003,0700.8022TCF Financial Corp. (MN)35950,9180.7623Heartland Financial USA Inc. (IA)18775,4170.6224Home State Bancorp (CO)11750,8470.6025Glacier Bancorp Inc. (MT)22730,9360.5926First Western Financial Inc. (CO)6639,6180.5127Trust Company of America (CO)1634,6590.5128ColoEast Bankshares Inc. (CO)16592,7250.4829Carlile Bancshares Inc. (TX)19506,2620.4130Dickinson Financial Corp. II (MO)51464,0550.37Total For Institutions In Market1,514124,751,66388.93Colorado Deposit Market ShareNote: Pro Forma Company Total Assets are as of 6/30/16 and include purchase accounting adjustments. Source: SNL Financial as of 6/30/16
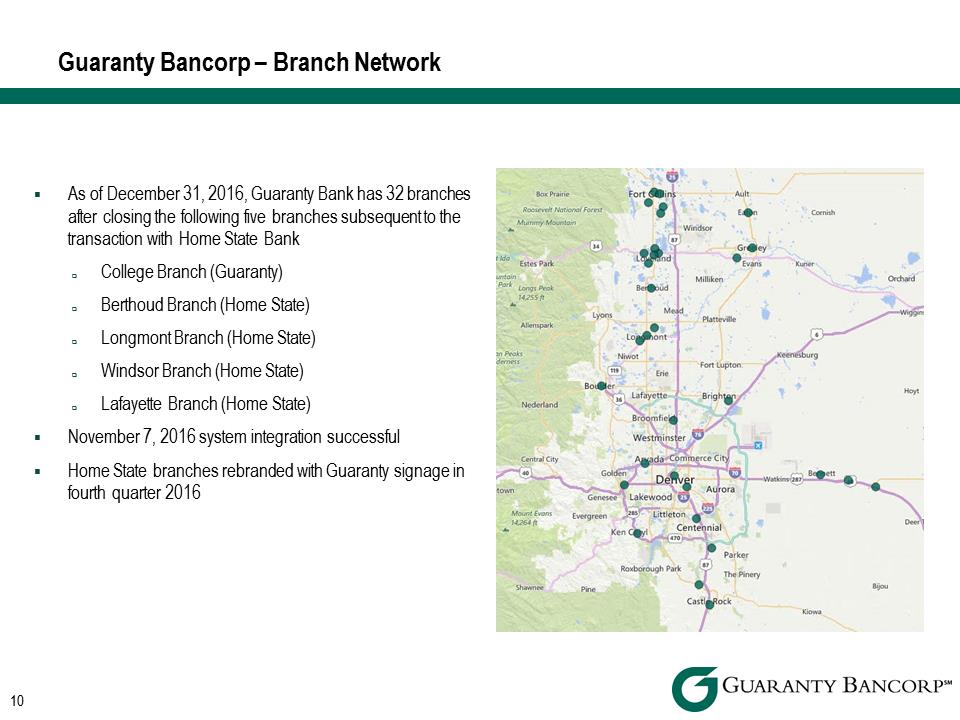 .As of December 31, 2016, Guaranty Bank has 32 branches after closing the following five branches subsequent to the transaction with Home State Bank .College Branch (Guaranty) .Berthoud Branch (Home State) .Longmont ranch (Home State) .Windsor Branch (Home State) .Lafayette Branch (Home State) .November 7, 2016 system integration successful .Home State branches rebranded with Guaranty signage in fourth quarter 2016 10
Guaranty Bancorp – Branch Network 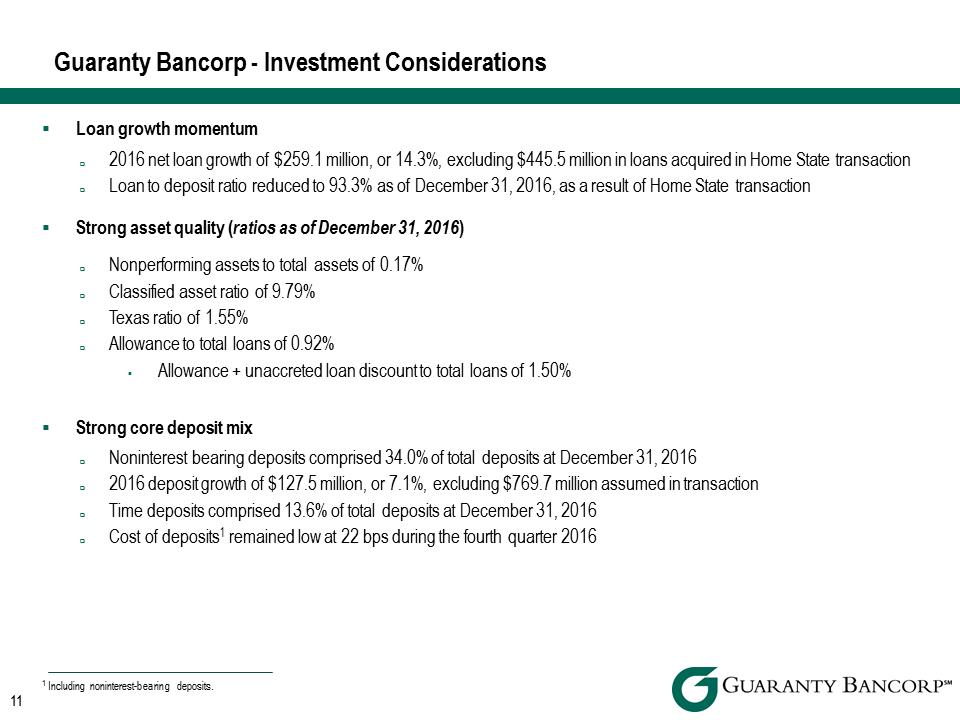 .Loan growth momentum .2016 net loan growth of $259.1 million, or 14.3%, excluding $445.5 million in loans acquired in Home State transaction .Loan to deposit ratio reduced to 93.3% as of December 31, 2016, as a result of Home State transaction .Strong asset quality (ratios as of December 31, 2016) .Nonperforming assets to total assets of 0.17% .Classified asset ratio of 9.79% .Texas ratio of 1.55% .Allowance to total loans of 0.92% .Allowance + unaccreted loan discount to total loans of 1.50% .Strong core deposit mix .Noninterest bearing deposits comprised 34.0% of
total deposits at December 31, 2016 .2016 deposit growth of $127.5 million, or 7.1%, excluding $769.7 million assumed in transaction .Time deposits comprised 13.6% of total deposits at December 31, 2016 .Cost of deposits1 remained low at 22 bps during the fourth quarter 2016 11 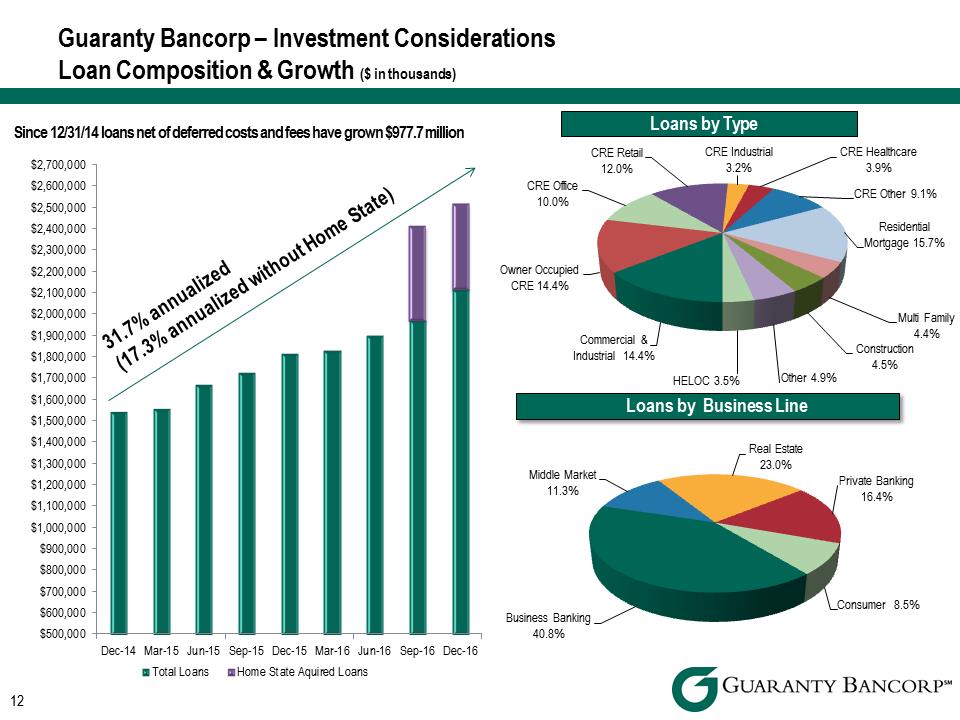
Guaranty Bancorp - Investment Considerations Bancorp Logo.jpg $500,000 $600,000 $700,000 $800,000 $900,000 $1,000,000 $1,100,000 $1,200,000 $1,300,000 $1,400,000 $1,500,000 $1,600,000 $1,700,000 $1,800,000 $1,900,000 $2,000,000 $2,100,000 $2,200,000 $2,300,000 $2,400,000 $2,500,000 $2,600,000 $2,700,000 Dec-14 Mar-15 Jun-15 Sep-15 Dec-15 Mar-16 Jun-16 Sep-16 Dec-16 Total Loans Home State Aquired Loans Guaranty Bancorp – Investment Considerations Loan Composition & Growth ($ in thousands) 12 Since 12/31/14 loans net of deferred costs and fees have grown $977.7 million 31.7% annualized (17.3% annualized without Home State)Consumer 8.5% Business Banking 40.8% Middle Market 11.3% Real Estate 23.0% Private Banking 16.4% _____ _ __Loans by Business Line_ _____ Commercial & Industrial 14.4% Owner Occupied CRE 14.4% CRE Office 10.0% CRE Retail 12.0% CRE Industrial 3.2% CRE Healthcare 3.9% CRE Other 9.1% Residential Mortgage 15.7% Multi Family 4.4% Construction 4.5% Other 4.9% HELOC 3.5% Loans by Type
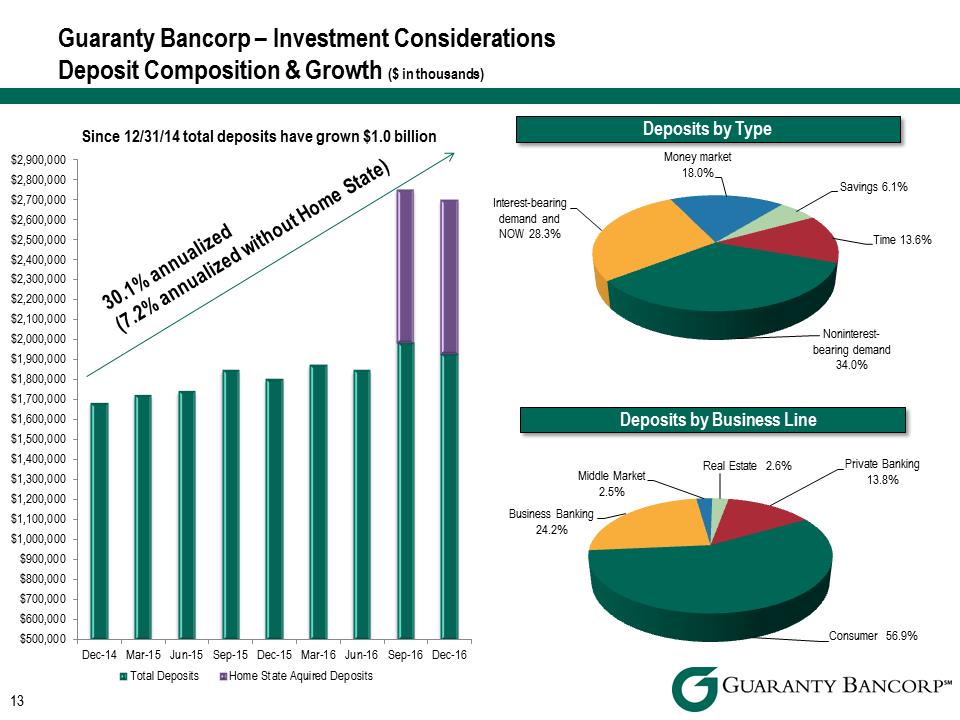 $500,000 $600,000 $700,000 $800,000 $900,000 $1,000,000 $1,100,000 $1,200,000 $1,300,000 $1,400,000 $1,500,000 $1,600,000 $1,700,000 $1,800,000 $1,900,000 $2,000,000 $2,100,000 $2,200,000 $2,300,000 $2,400,000 $2,500,000 $2,600,000 $2,700,000 $2,800,000 $2,900,000 Dec-14 Mar-15 Jun-15 Sep-15 Dec-15 Mar-16 Jun-16 Sep-16 Dec-16 Total Deposits Home State Aquired Deposits 13 Since 12/31/14 total deposits have grown $1.0 billion Guaranty Bancorp – Investment Considerations Deposit Composition & Growth ($ in thousands) 30.1% annualized(7.2% annualized without Home State) Noninterest-bearing demand 34.0% Interest-bearing demand and NOW 28.3% Money market 18.0% Savings 6.1% Time 13.6% ' Deposits by Type ' Consumer 56.9% Business Banking 24.2% Middle Market 2.5% Real Estate 2.6% Private Banking 13.8% _____ _ _ __Deposits by Business Line ______
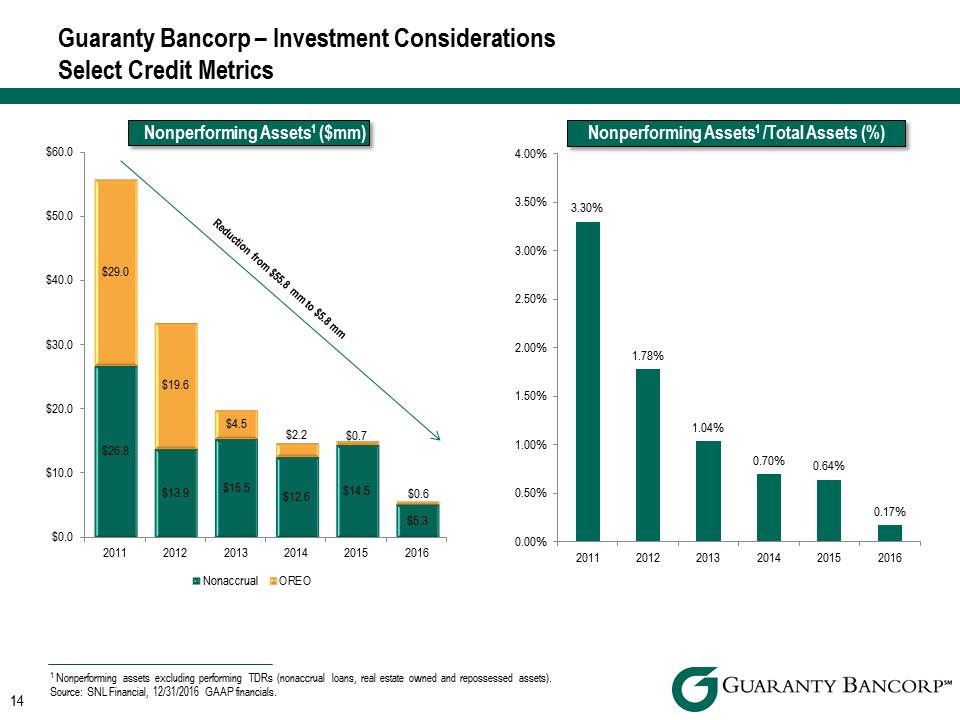 Bancorp Logo.jpg $26.8 $13.9 $15.5 $12.6 $14.5 $5.3 $29.0 $19.6 $4.5 $2.2 $0.7 $0.6 $0.0 $10.0 $20.0 $30.0 $40.0 $50.0 $60.0 2011 2012 2013 2014 2015 2016 Nonperforming Assets1 ($mm) Nonaccrual OREO14 Guaranty Bancorp – Investment Considerations Select Credit Metrics 1 Nonperforming assets excluding performing TDRs (nonaccrual loans, real estate owned and repossessed assets). Source: SNL Financial, 12/31/2016 GAAP financials. Reduction from $55.8 mm to $5.8 mm 3.30% 1.78% 1.04% 0.70% 0.64% 0.17% 0.00% 0.50% 1.00% 1.50% 2.00% 2.50% 3.00% 3.50% 4.00% 2011 2012 2013 2014 2015 2016 Nonperforming Assets1 /Total Assets (%)
 Bancorp .Strong capital structure supportive of future growth (ratios as of December 31, 2016) .Tangible Common Equity Ratio of 8.52%1 .GAAP Equity Ratio of 10.47% .Total Risk-Based Capital Ratio of 13.58% .Leverage Ratio of 9.81% .Tier 1 Common Equity Ratio of 10.46% .Net Interest Margin stable net interest margin anchored by low cost of funds .Noninterest income growth .Investment advisory fees .Total assets under management and administration at December 31, 2016 of $852.4 million .Continued focus on growth in investment management and trust fee income through organic growth and fee enhancement .Gains on the sales of SBA loans remain strong, Guaranty Bank is a Preferred Lender by the SBA .Expense management .Improved efficiency ratio to 55.13% in the fourth quarter 2016 compared to 56.78% in the third quarter 2016 .Continue to pursue bank and non-bank acquisition opportunities 15 1 See accompanying reconciliation of non-GAAP financial measurements to GAAP.
Guaranty Bancorp - Investment Considerations 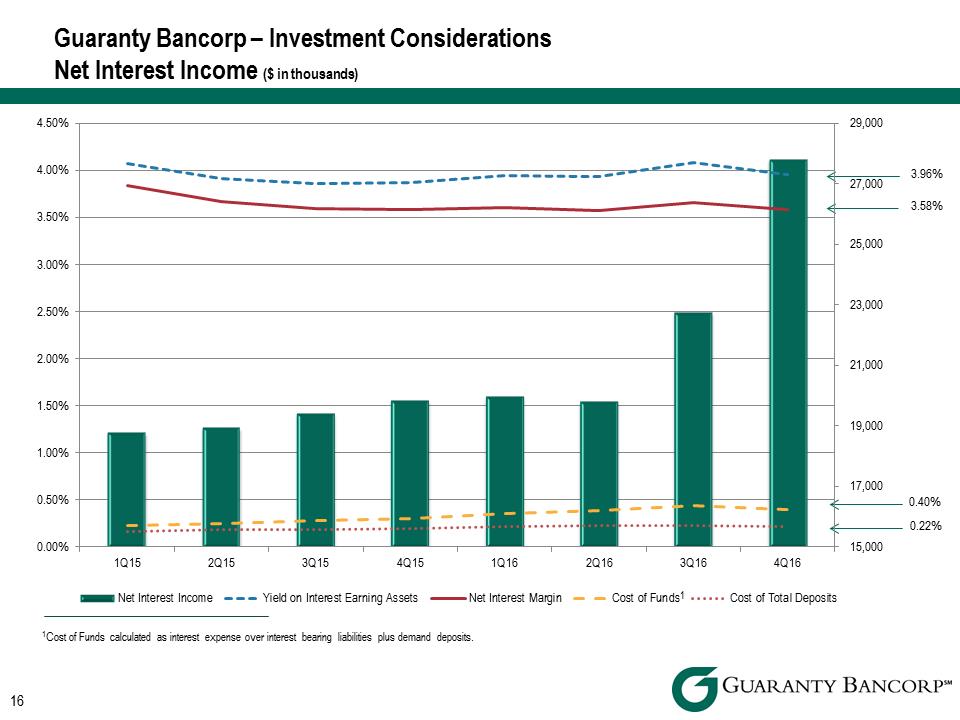 Guaranty Bancorp – Investment Considerations Net Interest Income ($ in thousands) 16 1Cost of Funds calculated as interest expense over interest bearing liabilities plus demand deposits. 3.96% 3.58% 0.22% 0.40% 1 15,000 17,000 19,000 21,000 23,000 25,000 27,000 29,000 0.00% 0.50% 1.00% 1.50% 2.00% 2.50% 3.00% 3.50% 4.00% 4.50% 1Q15 2Q15 3Q15 4Q15 1Q16 2Q16 3Q16 4Q16 Net Interest Income Yield on Interest Earning Assets Net Interest Margin Cost of Funds Cost of Total Deposits
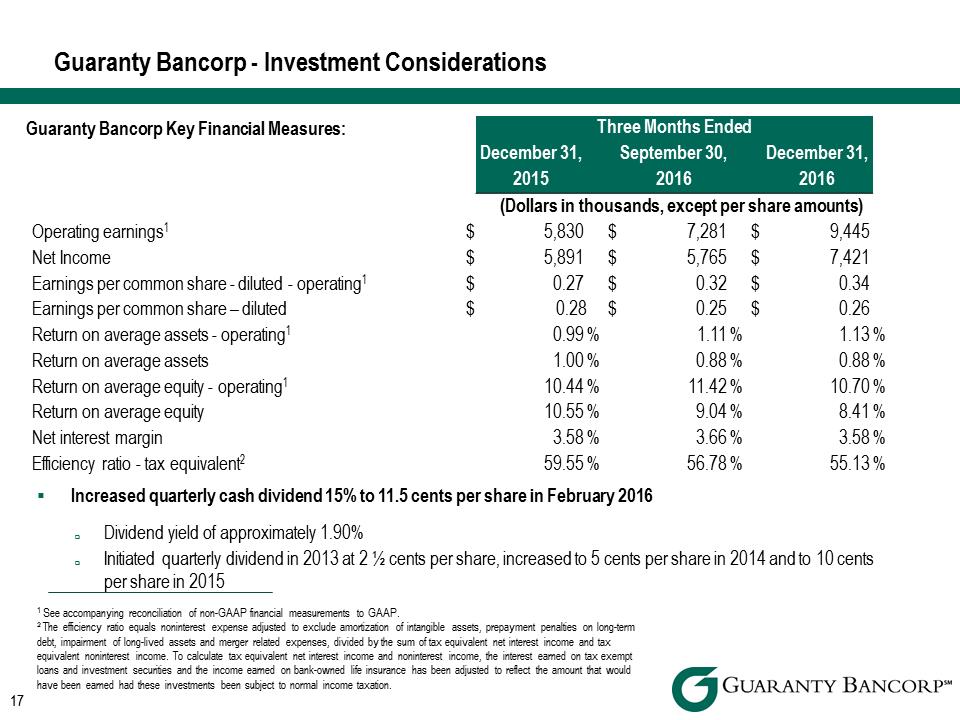 Guaranty Bancorp Key Financial Measures: Guaranty Bancorp - Investment Considerations 17 1 See accompanying reconciliation of non-GAAP financial measurements to GAAP. 2 The efficiency ratio equals noninterest expense adjusted to exclude amortization of intangible assets, prepayment penalties on long-term debt, impairment of long-lived assets and merger related expenses, divided by the sum of tax equivalent net interest income and tax equivalent noninterest income. To calculate tax equivalent net interest income and noninterest income, the interest earned on tax exempt loans and investment securities and the income earned on bank-owned life insurance has been adjusted to reflect the amount that would have been earned had these investments been subject to normal income taxation. Three Months Ended December 31, September 30, December 31, 2015 2016 2016 (Dollars in thousands, except per share amounts) Operating earnings1 $5,830 $7,281 $9,445 Net Income $ 5,891 $5,765 $ 7,421 Earnings per common share - diluted - operating1 $ 0.27 $0.32 $ 0.34 Earnings per common share – diluted $ 0.28 $ 0.25 $ 0.26 Return on average assets - operating1 0.99% 1.11% 1.13% Return on average assets 1.00% 0.88% 0.88% Return on average equity - operating1 10.44% 11.42% 10.70% Return on average equity 10.55% 9.04% 8.41% Net interest margin 3.58% 3.66% 3.58% Efficiency ratio - tax equivalent2 59.55 % 56.78 % 55.13 % .Increased quarterly cash dividend 15% to 11.5 cents per share in February 2016 .Dividend yield of approximately 1.90% .Initiated quarterly dividend in 2013 at 2 ½ cents per share, increased to 5 cents per share in 2014 and to 10 cents per share in 2015
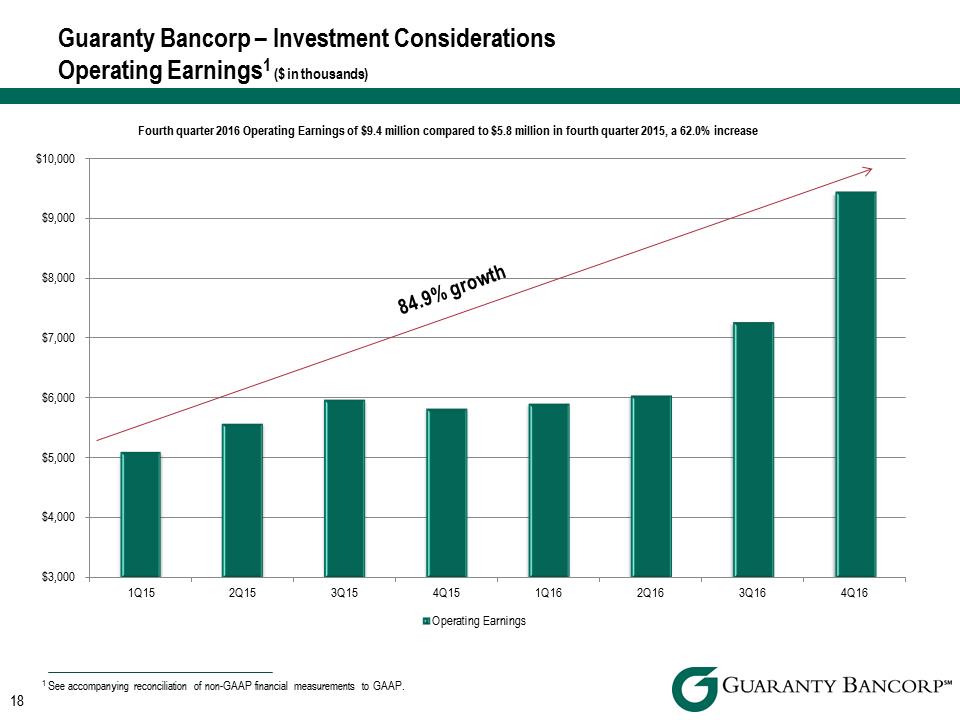 $3,000 $4,000 $5,000 $6,000 $7,000 $8,000 $9,000 $10,000 1Q15 2Q15 3Q15 4Q15 1Q16 2Q16 3Q16 4Q16 Operating Earnings 18 Guaranty Bancorp – Investment Considerations Operating Earnings1 ($ in thousands) 1 See accompanying reconciliation of non-GAAP financial measurements to GAAP. Fourth quarter 2016 Operating Earnings of $9.4 million compared to $5.8 million in fourth quarter 2015, a 62.0% increase 84.9% growth
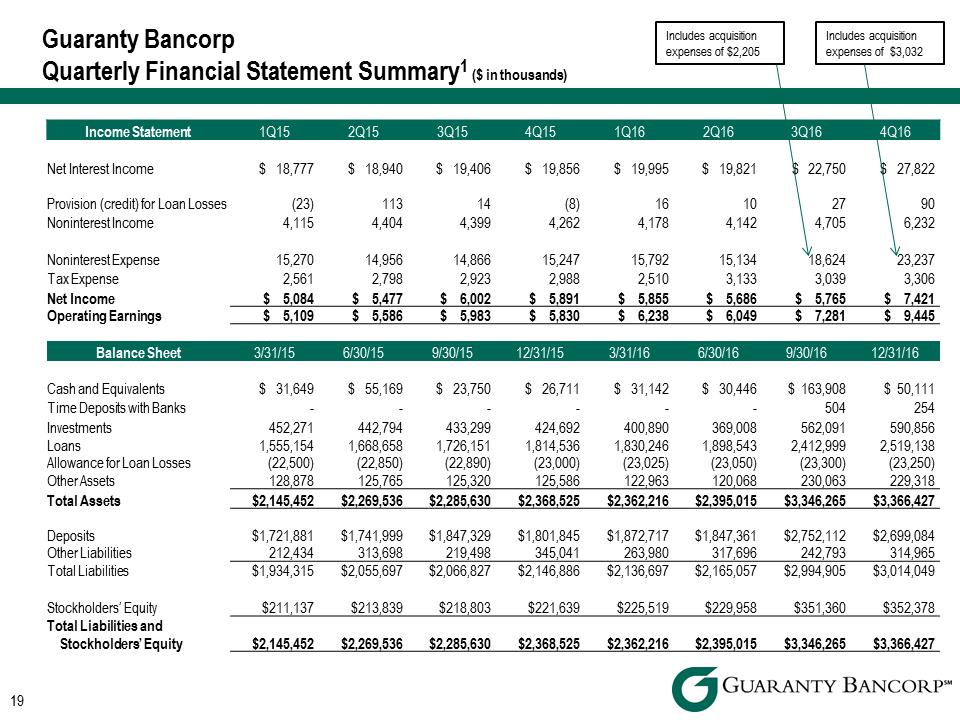 Income Statement 1Q15 2Q15 3Q15 4Q15 1Q16 2Q16 3Q16 4Q16 Net Interest Income $ 18,777 $ 18,940 $ 19,406 $ 19,856 $ 19,995 $ 19,821 $ 22,750 $ 27,822 Provision (credit) for Loan Losses (23) 113 14 (8) 16 10 27 90 Noninterest Income 4,115 4,404 4,399 4,262 4,178 4,142 4,705 6,232 Noninterest Expense 15,270 14,956 14,866 15,247 15,792 15,134 18,624 23,237 Tax Expense 2,561 2,798 2,923 2,988 2,510 3,133 3,039 3,306 Net Income $ 5,084 $ 5,477 $ 6,002 $ 5,891 $ 5,855 $ 5,686 $ 5,765 $ 7,421 Operating Earnings $ 5,109 $ 5,586 $ 5,983 $ 5,830 $ 6,238 $ 6,049 $ 7,281 $ 9,445 Balance Sheet 3/31/15 6/30/15 9/30/15 12/31/15 3/31/16 6/30/16 9/30/16 12/31/16 Cash and Equivalents $ 31,649 $ 55,169 $ 23,750 $ 26,711 $ 31,142 $ 30,446 $ 163,908 $ 50,111 Time Deposits with Banks - - - 504 254 Investments 452,271 442,794 433,299 424,692 400,890 369,008 562,091 590,856 Loans 1,555,154 1,668,658 1,726,151 1,814,536 1,830,246 1,898,543 2,412,999 2,519,138 Allowance for Loan Losses (22,500) (22,850) (22,890) (23,000) (23,025) (23,050) (23,300) (23,250) Other Assets 128,878 125,765 125,320 125,586 122,963 120,068 230,063 229,318 Total Assets $2,145,452 $2,269,536 $2,285,630 $2,368,525 $2,362,216 $2,395,015 $3,346,265 $3,366,427 Deposits $1,721,881 $1,741,999 $1,847,329 $1,801,845 $1,872,717 $1,847,361 $2,752,112 $2,699,084 Other Liabilities 212,434 313,698 219,498 345,041 263,980 317,696 242,793 314,965 Total Liabilities $1,934,315 $2,055,697 $2,066,827 $2,146,886 $2,136,697 $2,165,057 $2,994,905 $3,014,049 Stockholders’ Equity $211,137 $213,839 $218,803 $221,639 $225,519 $229,958 $351,360 $352,378Total Liabilities and Stockholders’ Equity $2,145,452 $2,269,536 $2,285,630 $2,368,525 $2,362,216 $2,395,015 $3,346,265 $3,366,427 Guaranty Bancorp Quarterly Financial Statement Summary1 ($ in thousands) 19 Includes acquisition expenses of $2,205 Includes acquisition expenses of $3,032
 Colorado Market
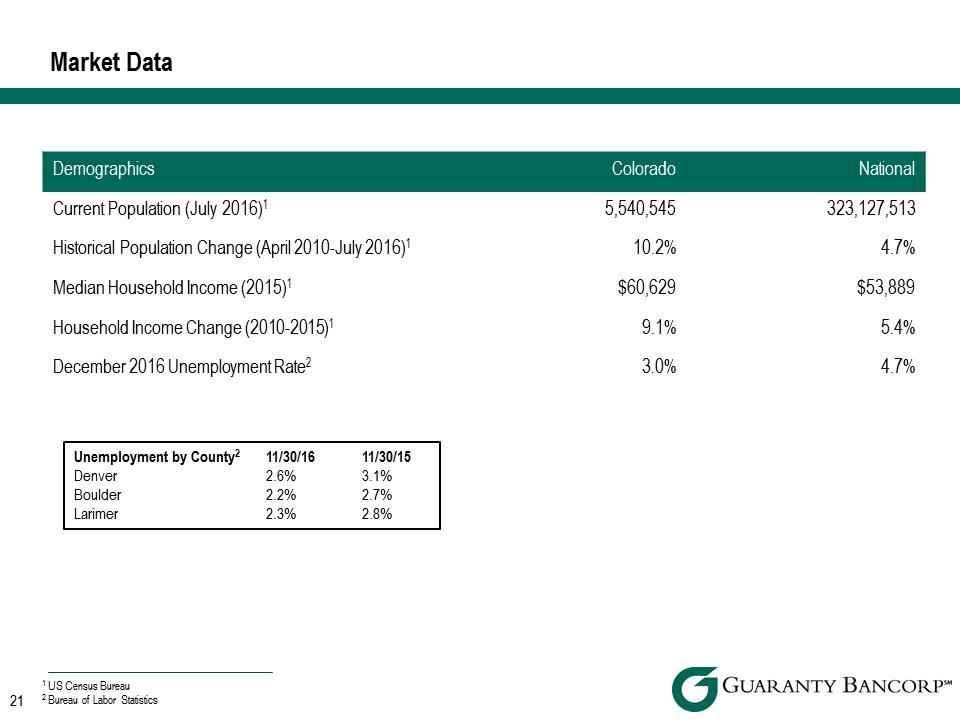 Demographics Colorado National Current Population (July 2016)1 5,540,545 323,127,513 Historical Population Change (April 2010-July 2016)1 10.2% 4.7% Median Household Income (2015)1 $60,629 $53,889 Household Income Change (2010-2015)1 9.1% 5.4% December 2016 Unemployment Rate2 3.0% 4.7% Market Data 21 1 US Census Bureau 2 Bureau of Labor Statistics Unemployment by County2 11/30/16 11/30/15 Denver 2.6% 3.1% Boulder 2.2% 2.7% Larimer 2.3% 2.8%
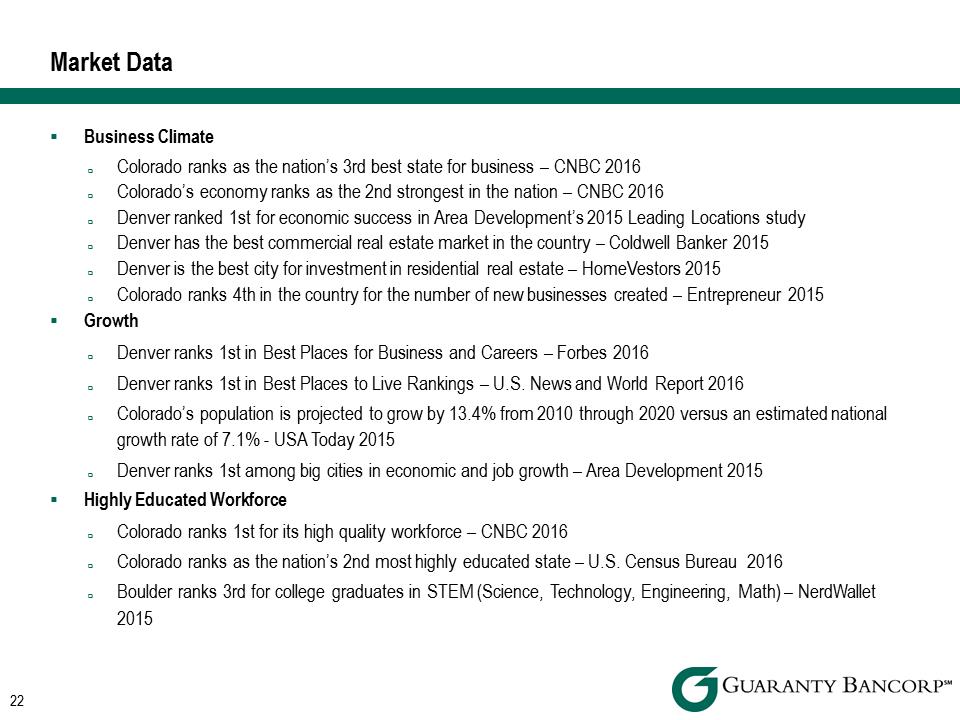 .Business Climate .Colorado ranks as the nation’s 3rd best state for business – CNBC 2016 .Colorado’s economy ranks as the 2nd strongest in the nation – CNBC 2016 .Denver ranked 1st for economic success in Area Development’s 2015 Leading Locations study .Denver has the best commercial real estate market in the country – Coldwell Banker 2015 .Denver is the best city for investment in residential real estate – HomeVestors 2015 .Colorado ranks 4th in the country for the number of new businesses created – Entrepreneur 2015 .Growth .Denver ranks 1st in Best Places for Business and Careers – Forbes 2016 .Denver ranks 1st in Best Places to Live Rankings – U.S. News and World Report 2016 .Colorado’s population is projected to grow by 13.4% from 2010 through 2020 versus an estimated national growth rate of 7.1% - USA Today 2015 .Denver ranks 1st among big cities in economic and job growth – Area Development 2015 .Highly Educated Workforce .Colorado ranks 1st for its high quality workforce – CNBC 2016 .Colorado ranks as the nation’s 2nd most highly educated state – U.S. Census Bureau 2016 .Boulder ranks 3rd for college graduates in STEM (Science, Technology, Engineering, Math) – NerdWallet 2015 Market Data 22
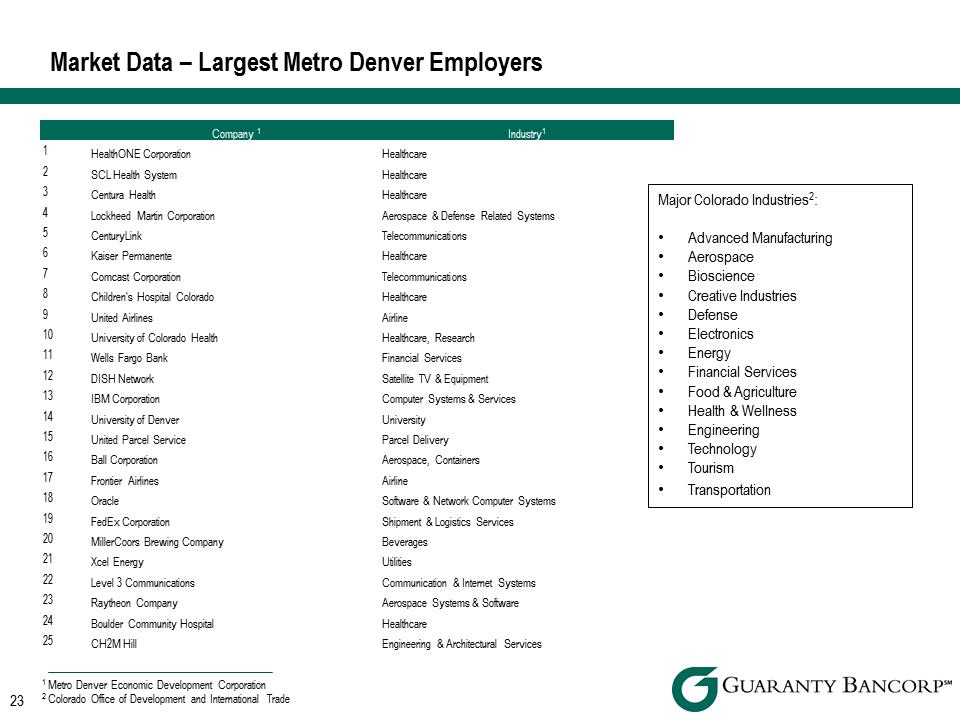 23 Market Data – Largest Metro Denver Employers Company 1 Industry1 1 HealthONE Corporation Healthcare 2 SCL Health System Healthcare 3 Centura Health Healthcare 4 Lockheed Martin Corporation Aerospace & Defense Related Systems 5 CenturyLink Telecommunications 6 Kaiser Permanente Healthcare 7 Comcast Corporation Telecommunications 8 Children's Hospital Colorado Healthcare 9 United Airlines Airline 10 University of Colorado Health Healthcare, Research 11 Wells Fargo Bank Financial Services 12 DISH Network Satellite TV & Equipment 13 IBM Corporation Computer Systems & Services 14 University of Denver University 15 United Parcel Service Parcel Delivery 16 Ball Corporation Aerospace, Containers 17 Frontier Airlines Airline 18 Oracle Software & Network Computer Systems 19 FedEx Corporation Shipment & Logistics Services 20 MillerCoors Brewing Company Beverages 21 Xcel Energy Utilities 22 Level 3 Communications Communication & Internet Systems 23 Raytheon Company Aerospace Systems & Software 24 Boulder Community Hospital Healthcare 25 CH2M Hill Engineering & Architectural Services 1
Metro Denver Economic Development Corporation 2 Colorado Office of Development and International Trade Major Colorado Industries2: •Advanced Manufacturing •Aerospace •Bioscience •Creative Industries •Defense •Electronics •Energy •Financial Services •Food & Agriculture •Health & Wellness •Engineering •Technology •Tourism •Transportation 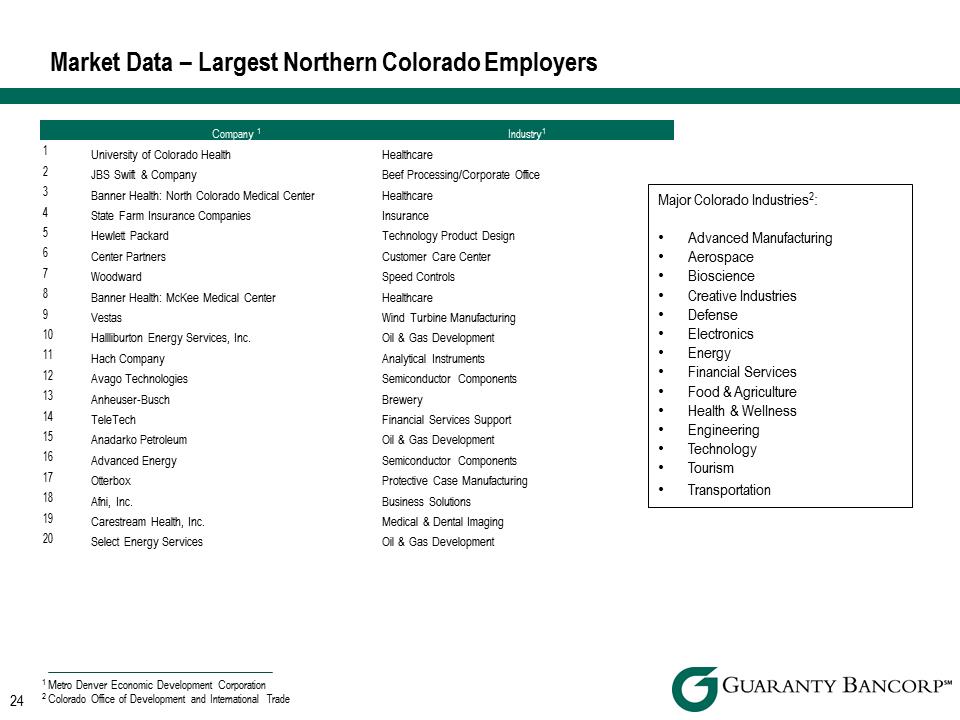
Market Data – Largest Northern Colorado Employers Company 1 Industry1 1 University of Colorado Health Healthcare 2 JBS Swift & Company Beef Processing/Corporate Office 3 Banner Health: North Colorado Medical Center Healthcare 4 State Farm Insurance Companies Insurance 5 Hewlett Packard Technology Product Design 6 Center Partners Customer Care Center 7 Woodward Speed Controls 8 Banner Health: McKee Medical Center Healthcare 9 Vestas Wind Turbine Manufacturing 10 Hallliburton Energy Services, Inc. Oil & Gas Development 11 Hach Company Analytical Instruments 12 Avago Technologies Semiconductor Components 13 Anheuser-Busch Brewery 14 TeleTech Financial Services Support 15 Anadarko Petroleum Oil & Gas Development 16 Advanced energy Semiconductor Components 17 Otterbox Protective Case Manufacturing 18 Afni, Inc. Business Solutions 19 Carestream Health, Inc. Medical & Dental Imaging 20 Select Energy Services Oil & Gas Development 1 Metro Denver Economic Development Corporation 2 Colorado Office of Development and International Trade Major Colorado Industries2: •Advanced Manufacturing •Aerospace •Bioscience •Creative Industries •Defense •Electronics •Energy •Financial Services •Food & Agriculture •Health & Wellness •Engineering •Technology •Tourism •Transportation
 Reconciliation of Non-GAAP Financial Measures
25 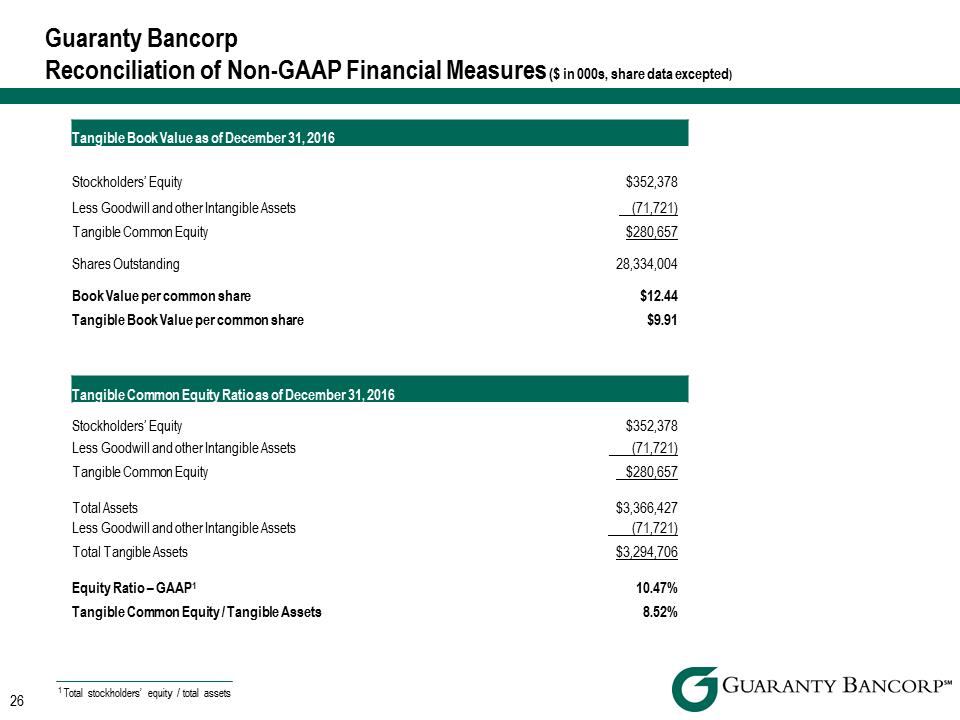 Tangible Book Value as of December 31, 2016 Stockholders’ Equity $352,378 Less Goodwill and other Intangible Assets (71,721) Tangible Common Equity $280,657 Shares Outstanding 28,334,004 Book Value per common share $12.44 Tangible Book Value per common share $9.91 Tangible Common Equity Ratio as of December 31, 2016 Stockholders’ Equity $352,378 Less Goodwill and other Intangible Assets (71,721)Tangible Common Equity $280,657 Total Assets $3,366,427 Less Goodwill and other Intangible Assets (71,721) Total Tangible Assets $3,294,706 Equity Ratio – GAAP1 10.47% Tangible Common Equity / Tangible Assets 8.52% 1 Total stockholders’ equity / total assets Guaranty Bancorp Reconciliation of Non-GAAP Financial Measures ($ in 000s, share data excepted) 26
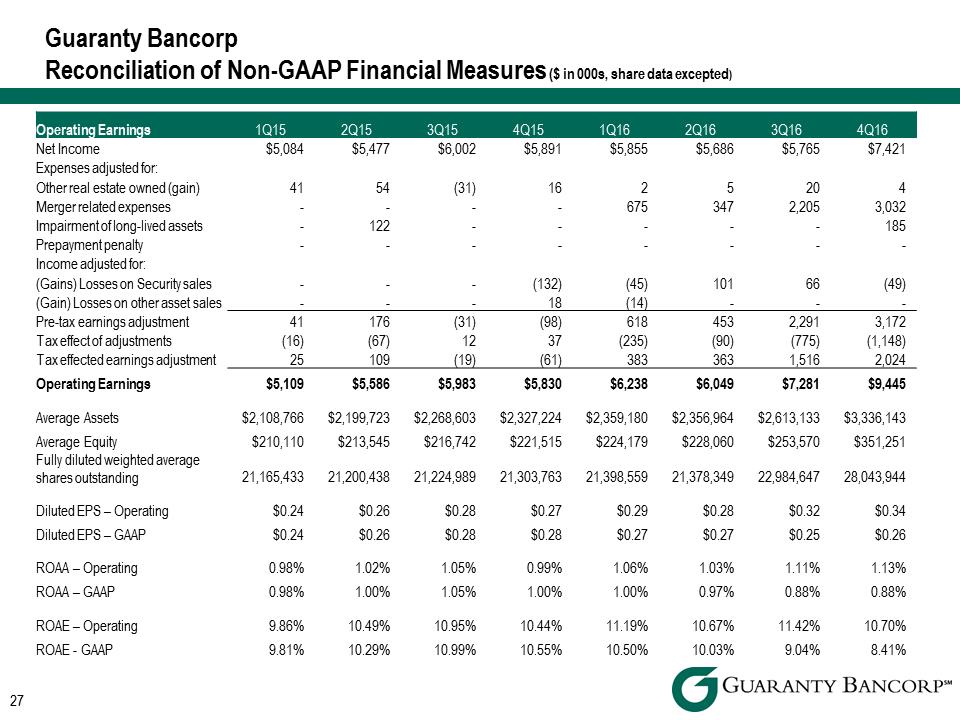 Operating Earnings 1Q15 2Q15 3Q15 4Q15 1Q16 2Q16 3Q16 4Q16 Net Income $5,084 $5,477 $6,002 $5,891 $5,855 $5,686 $5,765 $7,421 Expenses adjusted for: Other real estate owned (gain) 41 54 (31) 16 2 5 20 4 Merger related expenses - - - 675 347 2,205 3,032 Impairment of long-lived assets - 122 - - - - - 185 Prepayment penalty - - - - - - - Income adjusted for: (Gains) Losses on Security sales - - - (132) (45) 101 66 (49) (Gain) Losses on other asset sales - - - 18 (14) - - - Pre-tax earnings adjustment 41 176 (31) (98) 618 453 2,291 3,172 Tax effect of adjustments (16) (67) 12 37 (235) (90) (775) (1,148) Tax effected earnings adjustment 25 109 (19) (61) 383 363 1,516 2,024 Operating Earnings $5,109 $5,586 $5,983 $5,830 $6,238 $6,049 $7,281 $9,445 Average Assets $2,108,766 $2,199,723 $2,268,603 $2,327,224 $2,359,180 $2,356,964 $2,613,133 $3,336,143 Average Equity $210,110 $213,545 $216,742 $221,515 $224,179 $228,060 $253,570 $351,251 Fully diluted weighted average shares outstanding 21,165,433 21,200,438 21,224,989 21,303,763 21,398,559 21,378,349 22,984,647 28,043,944 Diluted EPS – Operating $0.24 $0.26 $0.28 $0.27 $0.29 $0.28 $0.32 $0.34 Diluted EPS – GAAP $0.24 $0.26 $0.28 $0.28 $0.27 $0.27 $0.25 $0.26 ROAA – Operating 0.98% 1.02% 1.05% 0.99% 1.06% 1.03% 1.11% 1.13% ROAA – GAAP 0.98% 1.00% 1.05% 1.00% 1.00% 0.97% 0.88% 0.88% ROAE – Operating 9.86% 10.49% 10.95% 10.44% 11.19% 10.67% 11.42% 10.70% ROAE - GAAP 9.81% 10.29% 10.99% 10.55% 10.50% 10.03% 9.04% 8.41% 27 Guaranty Bancorp
Reconciliation of Non-GAAP Financial Measures ($ in 000s, share data excepted)