Attached files
| file | filename |
|---|---|
| EX-99.2 - EX-99.2 - Astria Therapeutics, Inc. | a17-3519_1ex99d2.htm |
| 8-K - 8-K - Astria Therapeutics, Inc. | a17-3519_18k.htm |
Exhibit 99.1
January 31, 2017 Edasalonexent: Top-Line Results for Part B of the MoveDMD® Trial

2 Forward Looking Statements This presentation contains forward-looking statements within the meaning of The Private Securities Litigation Reform Act of 1995, including statements regarding our expectations and beliefs about our business, future financial and operating performance, clinical trial plans, product development plans and prospects. The words “believe”, “anticipate”, “plans,” “expect”, “could”, “should”, “will”, “would”, “may”, “intend” and similar expressions are intended to identify forward-looking statements, although not all forward-looking statements contain these identifying words. The forward-looking statements contained in this presentation and in remarks made during this presentation and the following Q&A session are subject to important risks and uncertainties that may cause actual events or results to differ materially from our current expectations and beliefs, including: uncertainties inherent in the initiation and completion of preclinical studies and clinical trials and clinical development of our product candidates; availability and timing of results from preclinical studies and clinical trials; whether interim results from a clinical trial will be predictive of the final results of the trial or the results of future trials; expectations for regulatory approvals to conduct trials or to market products; availability of funding sufficient for our foreseeable and unforeseeable operating expenses and capital expenditure requirements; other matters that could affect the availability or commercial potential of our product candidates; and general economic and market conditions. These and other risks are described under the caption “Risk Factors” in our Quarterly Report on Form 10-Q for the quarter ended September 30, 2016, which is on file with the Securities and Exchange Commission, and in other filings that we may make with the Securities and Exchange Commission in the future. In addition, the forward-looking statements included in this presentation represent our views as of the date of this presentation. We anticipate that subsequent events and developments will cause our views to change. However, while we may elect to update these forward-looking statements at some point in the future, we specifically disclaim any obligation to do so. These forward-looking statements should not be relied upon as representing our views as of any date subsequent to the date of this presentation.
3 Rationale for MoveDMD Trial Design Chronic activation of NF-B is a key driver of the muscle degeneration and inhibition of muscle regeneration that occurs in DMD Develop edasalonexent as an oral inhibitor of NF-kB with potential that may be effective in all patients with DMD Initiation of corticosteroids is associated with: Significant decrease in MRI T2 in leg muscles at 3 months Better performance on the timed function tests (10-meter walk/run, 4-stair climb and time to stand) at time periods of > 6 months Design a Phase 1 / 2 trial in 4 – 7 year old boys to evaluate initial safety and efficacy using observations from corticosteroids: Assess MRI T2 as an early, innovative biomarker at 12 weeks Assess functional measures over a longer time period Background Product Development Strategy
4 Summary of Top-Line Results for Part B of the MoveDMD Trial MoveDMD is a 3-part trial in 4 – 7 year old boys with DMD who are steroid naïve or off steroids for >6 months Part A previously showed PK and PD proof of technology, safety and tolerability Part B was a 12-week placebo-controlled trial using MRI as an early biomarker end point Part C is an open-label extension to assess effects over a longer time Top-line results for Part B of the trial: No significant change in primary end point of change from baseline in MRI T2 of the composite of lower leg muscles for pooled edasalonexent doses vs. placebo The edasalonexent 100 mg/kg/day treatment group consistently showed numerical improvement vs. placebo across multiple measures although the changes were not statistically significant. The 67 mg/kg/day group had mixed results compared with both the 100 mg/kg/day treatment group and placebo, which in each case was not statistically significant No safety signals were seen and edasalonexent was well tolerated with an adverse event profile consistent with prior findings. There were no dose reductions or discontinuations Continue to assess effects in patients on edasalonexent over a longer time in the ongoing OLE (Part C) MRI, timed function tests, North Star Ambulatory Assessment (NSAA), muscle strength, pediatric outcomes data collection instrument (PODCI)
5 MoveDMD Trial Design Assess the safety and PK of edasalonexent in ~18 boys with Duchenne ages 4-7 Showed positive PK, NF-B biomarker effects, safety and tolerability Study Population: All DMD mutations, ages 4 – 7, steroid naïve or off steroids for >6 months Part A 7-day, open-label dose-ranging trial N ~ 6 per arm Part B 12-week, randomized, double-blind placebo-controlled trial N ~ 10 per arm Part C 36-week, open-label treatment period N ~ 10 per arm Edasalonexent 67 mg/kg/day 33 mg/kg/day Edasalonexent 67 mg/kg/day Edasalonexent 100 mg/kg/day 67 mg/kg/day Measure the same safety and efficacy parameters as in Part B of the trial to assess treatment effects over a longer time Placebo 100 mg/kg/day Edasalonexent 100 mg/kg/day or 67 mg/kg/day Edasalonexent 100 mg/kg/day Assess the safety and efficacy of edasalonexent versus placebo using MRI as an early biomarker; trial was powered only for the primary end point of change from baseline in MRI T2 of composite of lower leg muscles Other measures: timed function tests (10-meter walk/run, 4-stair climb, time to stand), NSAA, muscle strength, PODCI
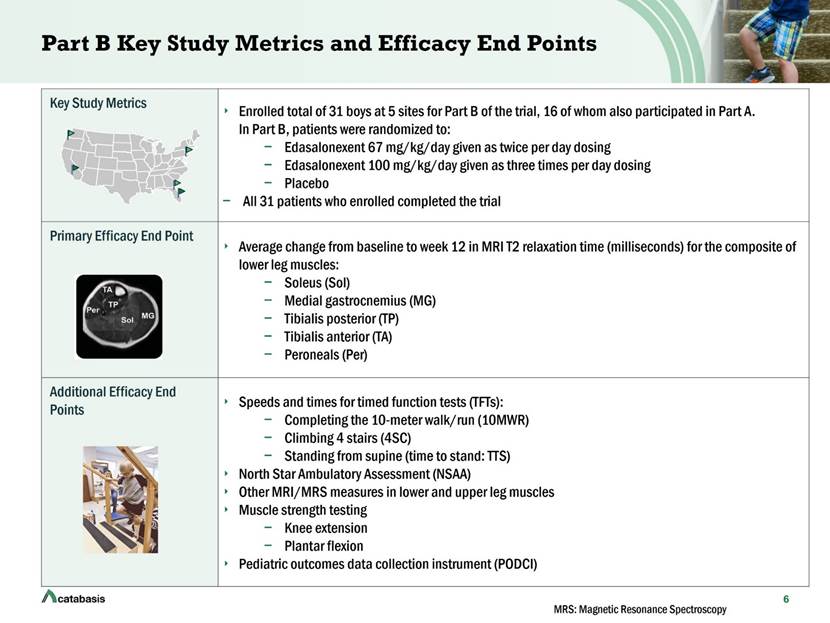
Key Study Metrics Enrolled total of 31 boys at 5 sites for Part B of the trial, 16 of whom also participated in Part A. In Part B, patients were randomized to: Edasalonexent 67 mg/kg/day given as twice per day dosing Edasalonexent 100 mg/kg/day given as three times per day dosing Placebo All 31 patients who enrolled completed the trial Primary Efficacy End Point Average change from baseline to week 12 in MRI T2 relaxation time (milliseconds) for the composite of lower leg muscles: Soleus (Sol) Medial gastrocnemius (MG) Tibialis posterior (TP) Tibialis anterior (TA) Peroneals (Per) Additional Efficacy End Points Speeds and times for timed function tests (TFTs): Completing the 10-meter walk/run (10MWR) Climbing 4 stairs (4SC) Standing from supine (time to stand: TTS) North Star Ambulatory Assessment (NSAA) Other MRI/MRS measures in lower and upper leg muscles Muscle strength testing Knee extension Plantar flexion Pediatric outcomes data collection instrument (PODCI) Part B Key Study Metrics and Efficacy End Points 6 MRS: Magnetic Resonance Spectroscopy
7 Baseline Demographics and Values 1Patient randomization was stratified for baseline age and 10-meter walk/run 2Patients in the edasalonexent 100 mg/kg/day group were symptomatic at a younger age and did not perform as well on the 4-stair climb and the time to stand function tests at baseline; characteristics consistent with more advanced disease Values shown are means Patients were all male and steroid-naive and predominantly Caucasian For context, mean times for timed function tests in normal boys of similar age as those in the MoveDMD trial are 10MWR: 3.4 seconds; 4-stair climb: 1.4 seconds; and TTS: 2.1 seconds (ImagingDMD data presented at Catabasis Investor Day Nov 2016) Treatment Group Placebo Edasalonexent 67 mg/kg/day Edasalonexent 100 mg/kg/day Overall Edasalonexent (n =11) (n =10) (n =10) (n =20) Age at Week 0 (years)1 6.3 6.0 6.0 6.0 Age at Symptom Onset (years)2 3.7 3.0 2.0 2.5 Age at Diagnosis (years) 2 4.6 3.5 3.0 3.3 Weight at randomization (kg) 21.4 22.1 22.0 22.1 10-meter walk/run (10MWR in seconds)1 6.9 6.3 6.8 6.6 4-stair climb (4SC in seconds)2 5.0 4.5 6.3 5.4 Time to stand (TTS in seconds)2 6.5 7.0 12.0 9.4
8 MoveDMD Trial Part B Results Primary Efficacy End Point No significant change in the primary end point, average change from baseline to Week 12 in the MRI T2 measure for a composite of lower leg muscles for the pooled edasalonexent treatment groups vs. placebo. Primary end point numerically better for edasalonexent 100 mg/kg/day vs. placebo P = NS Change in MRI T2 (milliseconds) Change in MRI T2 from Baseline to Week 12 in Composite of 5 Lower Leg Muscles Error bars in chart denote SEM Smaller increase in MRI T2 correlates with less muscle inflammation Placebo 67 mg/kg 100 mg/kg Pooled 0.0 0.2 0.4 0.6 0.8 1.0 Lower leg Composite - 5 muscles Change in MRI T2 (msec) Edasalonexant
9 10-meter Walk/Run Speed and Time to Stand Speed Change in Speed (units / second) Change in 10-meter Walk/Run Speed from Baseline to Week 12 Change in Speed (units / second) Change in Time to Stand Speed from Baseline to Week 12 Change in timed function test Speeds at Week 12 were pre-defined end points Speed is the reciprocal of the time to perform the function test. In contrast to Time, Speed allows for accounting for boys who are unable to perform tests Change in 10-meter walk/run Speed and change in time to stand Speed numerically better for edasalonexent 100 mg/kg/day vs. placebo although neither was statistically significant Faster vs. baseline Faster vs. baseline Error bars in chart denote SEM Placebo 67 mg/kg 100 mg/kg Pooled -0.020 -0.015 -0.010 -0.005 0.000 0.005 0.010 Change in 10 meter walk/run speed speed (meters/sec) Edasalonexant Placebo 67 mg/kg 100 mg/kg Pooled -0.06 -0.04 -0.02 0.00 0.02 Change in time to stand speed speed (1/seconds) Edasalonexant
10 4-Stair Climb Speed and Change in MRI T2 of Vastus Lateralis (Upper Leg Muscle Enlisted in 4-Stair Climb) Change in 4-stair climb Speed and change in MRI T2 of vastus lateralis numerically better for edasalonexent 100 mg/kg/day vs. placebo, although not statistically significant Change in Speed (4-Stairs / second) Change in 4-Stair Climb Speed from Baseline to Week 12 Change in MRI T2 (milliseconds) Change in MRI T2 of Vastus Lateralis from Baseline to Week 12 Better vs. baseline Faster vs. baseline Error bars in chart denote SEM Placebo 67 mg/kg 100 mg/kg Pooled -0.04 -0.02 0.00 0.02 0.04 Change in 4-step climb speed Speed (steps/second) Edasalonexant Placebo 67 mg/kg 100 mg/kg Pooled -1 0 1 2 3 Vastus Lateralis Change in MRI T2 (msec) Edasalonexant
11 North Star Ambulatory Assessment (NSAA) Change in NSAA was numerically better for edasalonexent 100 mg/kg/day vs. placebo although not statistically significant Change in NSAA Score (units) Change in Total NSAA Score from Baseline to Week 12 Better vs. baseline Error bars in chart denote SEM Placebo 67 mg/kg 100 mg/kg Pooled -2 -1 0 1 2 Change in NSAA Score Edasalonexant
12 Adverse Events: No Safety Signals and Well Tolerated No safety signals Well tolerated with majority of adverse events being mild in nature Most common treatment-related adverse events were mild diarrhea and vomiting No serious treatment-related adverse events No dose reductions No discontinuations Placebo n = 11 n (%) Edasalonexent 67 mg/kg n = 10 n (%) Edasalonexent 100 mg/kg n = 10 n (%) Edasalonexent Overall n = 20 n (%) Any TEAE 10 (91) 9 (90) 8 (80) 17 (85) Severe TEAE 1 (9) 0 (0) 0 (0) 0 (0) Serious Adverse Events 1 (9) 0 (0) 0 (0) 0 (0) Any drug related TEAE 0 (0) 4 (40) 7 (70) 11 (55) Discontinuation due to TEAE 0 (0) 0 (0) 0 (0) 0 (0) Deaths 0 (0) 0 (0) 0 (0) 0 (0) Values shown are treatment emergent adverse event (TEAE), defined as any adverse event (AE) that starts during or after the first dose of investigational product through the end of the safety follow-up period Overview of Treatment-Emergent Adverse Events
13 Ongoing OLE (Part C) is Anticipated to Yield Additional Data for Edasalonexent Treatment Over a Longer Time Assess treatment effect once full dataset is available, including data from OLE (Part C) Study was powered for statistically significant changes in the primary end point for Part B, change in MRI T2 from baseline to Week 12 in composite of lower leg muscles, but is not powered to see statistically significant changes for any other measures in Part B or Part C Measure Part B Baseline Part B Week 12 Part C Week 24 Part C Week 36 Part C Week 48 MRI measures of lower leg muscles T2 Fat Fraction MRI measures of upper leg muscles T2 Fat Fraction Timed function tests 10-meter walk/run 4-stair climb Time to stand NSAA and PODCI NSAA PODCI Muscle strength Knee extension Plantar flexion Planned assessments in trial Top-line data analyses shown today Pending full data analyses, expect to present in 2017
14 MoveDMD Trial Thank You Thank you to the boys and parents involved in the MoveDMD trial, the trial site staff, patient groups, the ImagingDMD consortium, and members of the Duchenne community for their support
15 Summary of Edasalonexent Program and Anticipated Next Steps What we have shown prior to Part B of the MoveDMD trial Positive proof of technology in in vitro studies (J Med Chem Jan 2016) Functional benefit in preclinical models of DMD with 6 – 9 months of treatment (JCI Insight Dec 2016) Positive PK and PD proof of technology, safety and tolerability in adults (J Clin Pharmacol Jan 2017) Top-line results for Part B of the trial No significant change in primary end point of change from baseline in MRI T2 of the composite of lower leg muscles for pooled edasalonexent doses vs. placebo The edasalonexent 100 mg/kg/day treatment group consistently showed numerical improvement vs. placebo across multiple measures although the changes were not statistically significant. The 67 mg/kg/day group had mixed results compared with both the 100 mg/kg/day treatment group and placebo, which in each case was not statistically significant No safety signals were seen and edasalonexent was well tolerated with an adverse event profile consistent with prior findings. There were no dose reductions or discontinuations Anticipated next steps Complete full analyses of data from Part B of the trial Present data at upcoming scientific conferences in 2017 Continue the OLE (Part C) to assess effects in patients on edasalonexent over a longer time Report analyses from OLE (Part C) in 2017 with an interim update in Q2