Attached files
| file | filename |
|---|---|
| EX-99.1 - EX-99.1 - SILGAN HOLDINGS INC | d334680dex991.htm |
| 8-K - FORM 8-K - SILGAN HOLDINGS INC | d334680d8k.htm |
Exhibit 99.2

SILGAN TO ACQUIRE DISPENSING SYSTEMS BUSINESS Expanding Franchises in Rigid Packaging January 23, 2017
FORWARD LOOKING STATEMENTS & NON-GAAP MEASURES This communication is not intended to and does not constitute an offer to sell or the solicitation of an offer to subscribe for or buy or an invitation to purchase or subscribe for any securities. Certain statements made in the course of this presentation may be forward looking and involve a number of risks and uncertainties. These statements are only predictions based on our current expectations and projections about future events. Because these forward-looking statements involve risks and uncertainties, there are important factors that could cause our actual results, level of activity, performance or achievements to differ materially from the results, level of activity, performance or achievements expressed or implied by the forward-looking statements. In this regard, you should consider the numerous uncertainties and risks described in our Annual Report on Form 10-K for the year ended December 31, 2015 and our other filings with the Securities and Exchange Commission. EBITDA, Adjusted EBITDA, Adjusted EBITDA Margin and adjusted total equity are not defined terms under U.S. generally accepted accounting principles (non-GAAP measures). Non-GAAP measures should not be considered in isolation or as a substitute for net income, cash flow or total equity data prepared in accordance with GAAP and may not be comparable to calculations of similarly titled measures by other companies. EBITDA, Adjusted EBITDA, Adjusted EBITDA Margin and adjusted total equity are derived from the Company’s Consolidated Statements of Operations and Consolidated Balance Sheets. 2 I SILGAN HOLDINGS INC.
AGENDA Expanding Franchises in Rigid Packaging About Silgan About New Dispensing Systems Business Transaction Summary and Strategic Rationale Financial Impact Q & A 3 I SILGAN HOLDINGS INC.
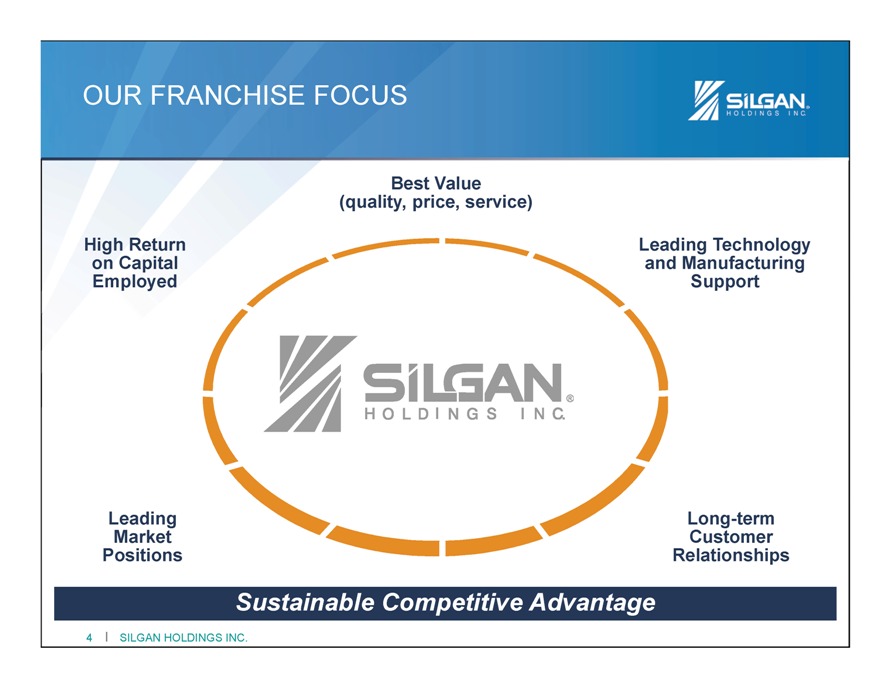
OUR FRANCHISE FOCUS Best Value (quality, price, service) High Return on Capital Employed Leading Technology and Manufacturing Support Leading Market Positions Long-term Customer Relationships Sustainable Competitive Advantage 4 I SILGAN HOLDINGS INC.
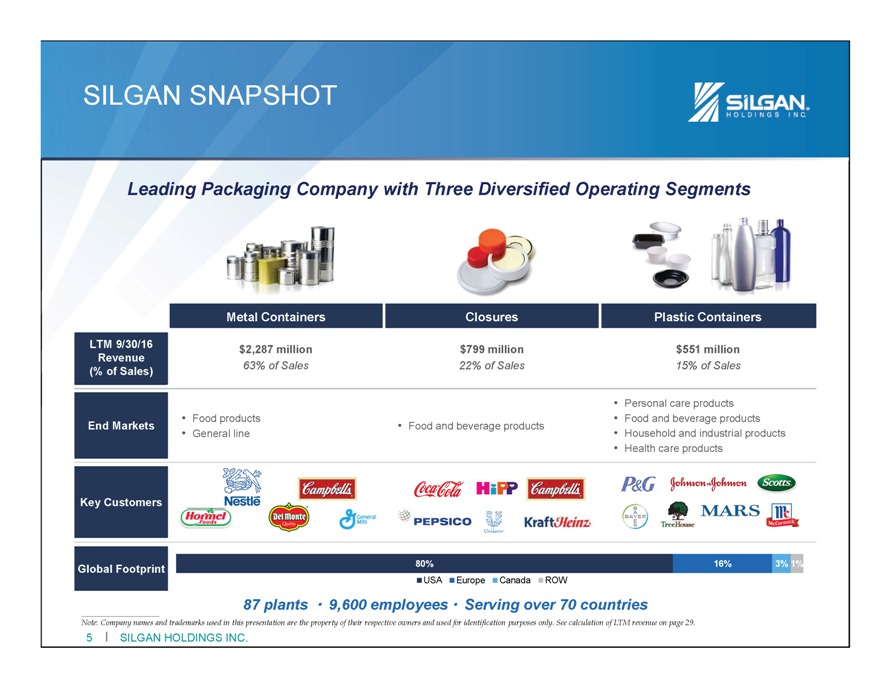
SILGAN SNAPSHOT Leading Packaging Company with Three Diversified Operating Segments Metal Containers Closures Plastic Containers LTM 9/30/16 Revenue (% of Sales) End Markets Key Customers Global Footprint $2,287 million $799 million $551 million 63% of Sales 22% of Sales 15% of Sales • Food products • General line Food and beverage products • Food and beverage products • Household and industrial products • Health care products 80% 16% 3% 1% 87 plants ? 9,600 employees ? Serving over 70 countries USA Europe Canada ROW Note: Company names and trademarks used in this presentation are the property of their respective owners and used for identification purposes only. See calculation of LTM revenue on page 29. 5 I SILGAN HOLDINGS INC.
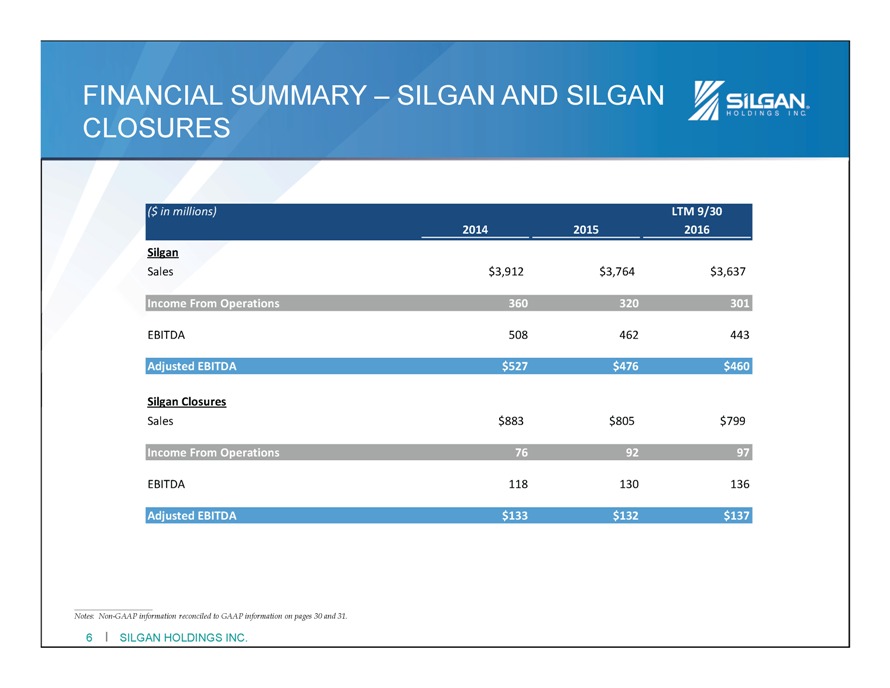
FINANCIAL SUMMARY – SILGAN AND SILGAN CLOSURES ($ in millions) LTM 9/30 2014 2015 2016 Silgan Sales $3,912 $3,764 $3,637 Income From Operations 360 320 301 EBITDA 508 462 443 Adjusted EBITDA $527 $476 $460 Silgan Closures Sales $883 $805 $799 Income From Operations 76 92 97 EBITDA 118 130 136 Adjusted EBITDA $133 $132 $137 Notes: Non-GAAP information reconciled to GAAP information on pages 30 and 31. 6 I SILGAN HOLDINGS INC.
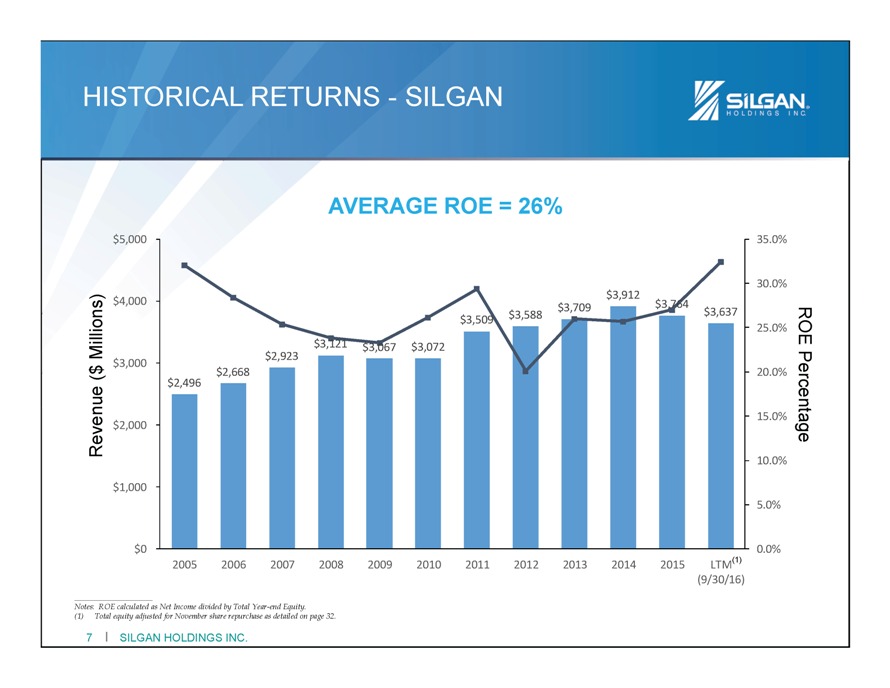
HISTORICAL RETURNS - SILGAN AVERAGE ROE = 26% $5,000 35.0% 4,000 $3,912 30.0% $ $3,509 $3,588 $3,709 $3,764 $3,637 25.0% Millions) $3,000 $2,923 $3,121 $3,067 $3,072 $ $2,668 20.0% ( $2,496 Revenue $2,000 15.0% 10.0% $1,000 5.0% $0 0.0% 2005 2006 2007 2008 2009 2010 2011 2012 2013 2014 2015 LTM(1) (9/30/16) ROE Percentage Notes: ROE calculated as Net Income divided by Total Year-end Equity. (1) Total equity adjusted for November share repurchase as detailed on page 32. 7 I SILGAN HOLDINGS INC.
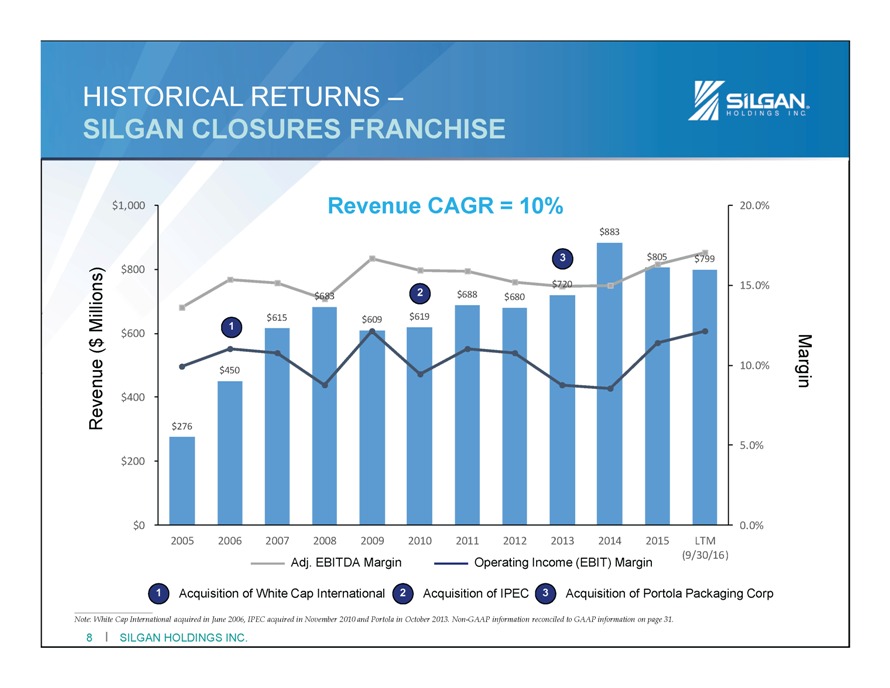
HISTORICAL RETURNS – SILGAN CLOSURES FRANCHISE $1,000 Revenue CAGR = 10% 20.0% $883 $800 3 $805 $799 2 $720 15.0% $683 $688 $680 $615 $609 $619 Millions) $600 1 $ ( $450 10.0% Margin $400 Revenue $276 5.0% $200 $0 0.0% 2005 2006 2007 2008 2009 2010 2011 2012 2013 2014 2015 LTM Adj. EBITDA Margin Operating Income (EBIT) Margin (9/30/16) 1 Acquisition of White Cap International 2 Acquisition of IPEC 3 Acquisition of Portola Packaging Corp Note: White Cap International acquired in June 2006, IPEC acquired in November 2010 and Portola in October 2013. Non-GAAP information reconciled to GAAP information on page 31. 8 I SILGAN HOLDINGS INC.
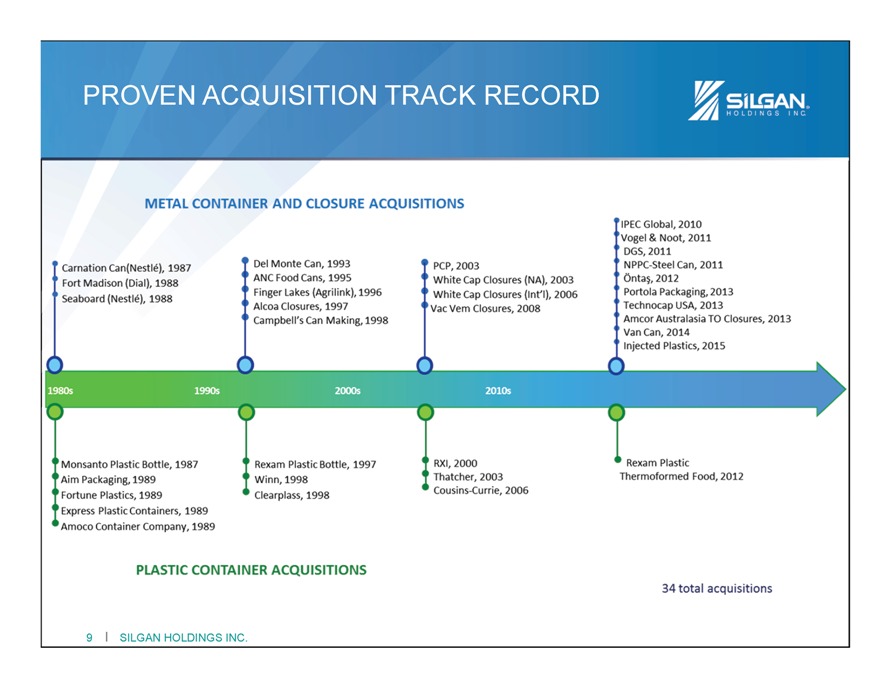
PROVEN ACQUISITION TRACK RECORD METAL CONTAINER AND CLOSURE ACQUISITIONS Carnation Can(Nestle), 1987 Fort Madison (Dial), 1988 Seaboard (Nestle), 1988 Del Monte Can, 1993 ANC Food Cans, 1995 Finger Lakes (Agrilink), 1996 Alcoa Closures, 1997 Campbell’s Can Making, 1998 PCP, 2003 White Cap Closures (NA), 2003 White Cap Closures (Int’l), 2006 Vac Vem Closures, 2008 IPEC Global, 2010 Vogel&Noot, 2011 DGS, 2011 NPPC-Steel Can, 2011 Ontaj, 2012 Portola Packaging, 2013 Technocap USA, 2013 Amcor Australasia TO Closures, 2013 Van Can, 2014 Injected Plastics, 2015 Monsanto Plastic Bottle, 1987 Aim Packaging, 1989 Fortune Plastics, 1989 Express Plastic Containers, 1989 Amoco Container Company, 1989 Rexam Plastic Bottle, 1997 Winn, 1998 Clearplass, 1998 RXI, 2000 Thatcher, 2003 Cousins-Currie, 2006 Rexam Plastic Thermoformed Food, 2012 PLASTIC CONTAINER ACQUISITIONS 34 total acquisitions 9 I SILGAN HOLDINGS INC.
AGENDA Expanding Franchises in Rigid Packaging About Silgan About New Dispensing Systems Business Transaction Summary and Strategic Rationale Financial Impact Q & A 10 I SILGAN HOLDINGS INC.
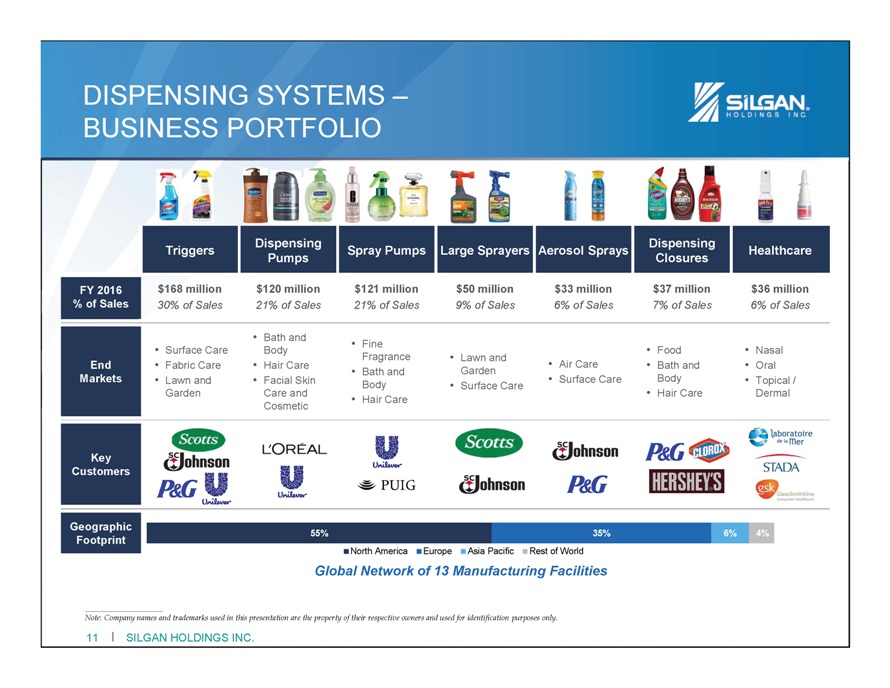
DISPENSING SYSTEMS –BUSINESS PORTFOLIO Triggers Dispensing Spray Pumps Large Sprayers Aerosol Sprays Dispensing Healthcare Pumps Closures FY 2016 $168 million $120 million $121 million $50 million $33 million $37 million $36 million % of Sales 30% of Sales 21% of Sales 21% of Sales 9% of Sales 6% of Sales 7% of Sales 6% of Sales • Bath and • Fine • Surface Care Body Fragrance • Lawn and • Food • Nasal End • Fabric Care • Hair Care • Bath and Garden • Air Care • Bath and • Oral Markets • Lawn and • Facial Skin Body • Surface Care • Surface Care Body • Topical / Garden Care and • Hair Care • Hair Care Dermal Cosmetic Key Customers Geographic 55% 35% 6% 4% Footprint North America Europe Asia Pacific Rest of World Global Network of 13 Manufacturing Facilities Note: Company names and trademarks used in this presentation are the property of their respective owners and used for identification purposes only. 11 I SILGAN HOLDINGS INC.
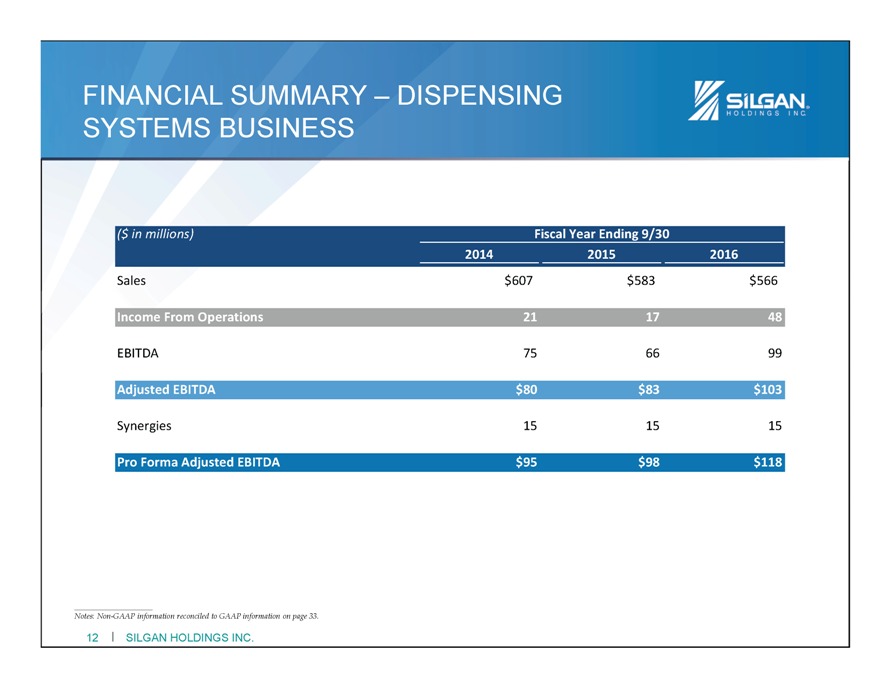
FINANCIAL SUMMARY – DISPENSING SYSTEMS BUSINESS ($ in millions) Fiscal Year Ending 9/30 2014 2015 2016 Sales $607 $583 $566 Income From Operations 21 17 48 EBITDA 75 66 99 Adjusted EBITDA $80 $83 $103 Synergies 15 15 15 Pro Forma Adjusted EBITDA $95 $98 $118 Notes: Non-GAAP information reconciled to GAAP information on page 33. 12 I SILGAN HOLDINGS INC.
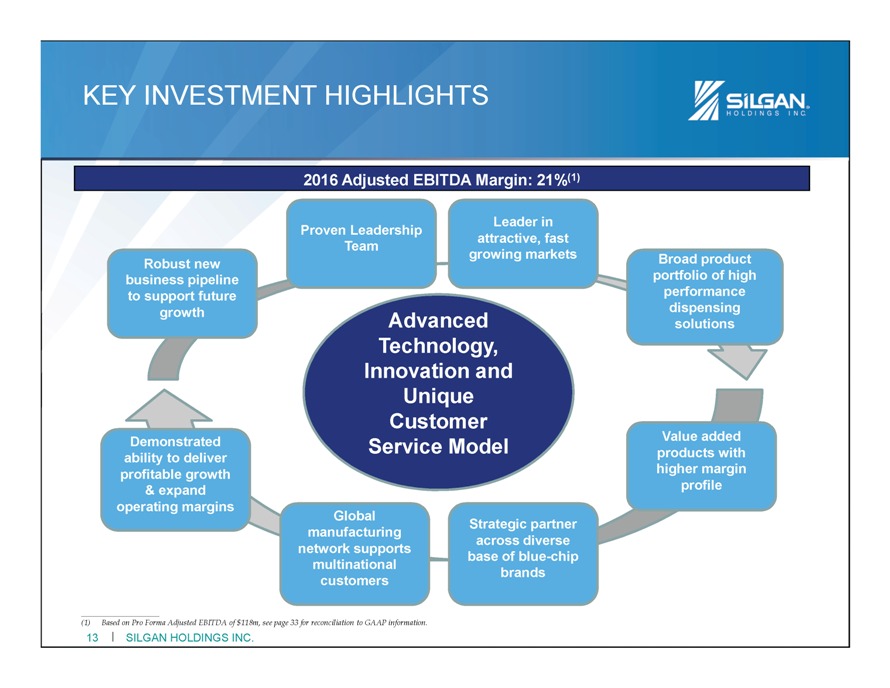
KEY INVESTMENT HIGHLIGHTS 2016 Adjusted EBITDA Margin: 21%(1) Proven Leadership Leader in Team attractive, fast Robust new growing markets Broad product business pipeline portfolio of high to support future performance growth Advanced dispensing Technology, solutions Innovation and Unique Customer Demonstrated Service Model Value added ability to deliver products with profitable growth higher margin & expand profile operating margins Global manufacturing Strategic partner network supports across diverse multinational base of blue-chip customers brands (1) Based on Pro Forma Adjusted EBITDA of $118m, see page 33 for reconciliation to GAAP information. 13 I SILGAN HOLDINGS INC.
AGENDA Expanding Franchises in Rigid Packaging About Silgan About New Dispensing Systems Business Transaction Summary and Strategic Rationale Financial Impact Q & A 14 I SILGAN HOLDINGS INC.
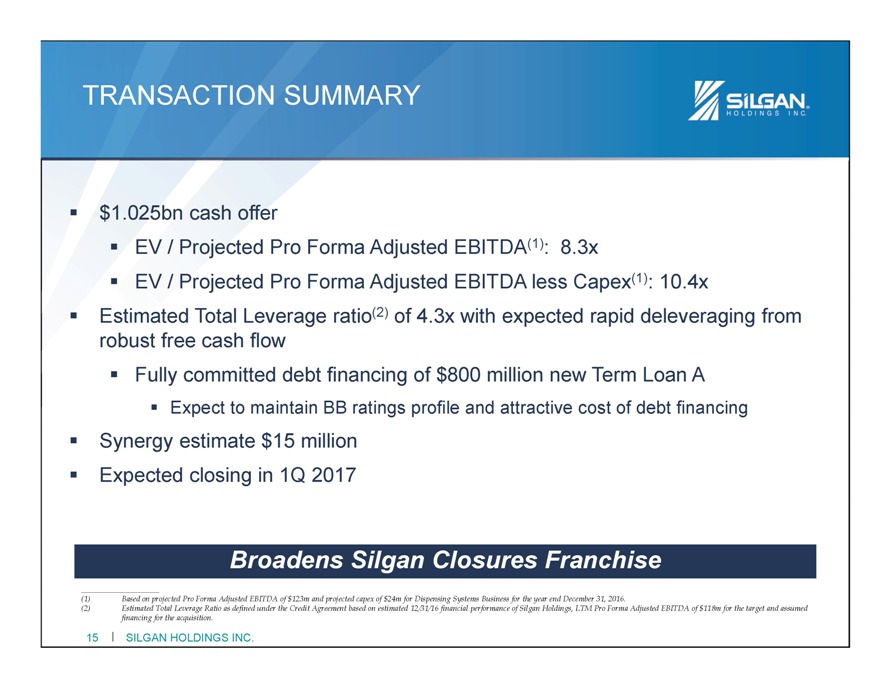
TRANSACTION SUMMARY $1.025bn cash offer EV / Projected Pro Forma Adjusted EBITDA(1): 8.3x EV / Projected Pro Forma Adjusted EBITDA less Capex(1): 10.4x Estimated Total Leverage ratio(2) of 4.3x with expected rapid deleveraging from robust free cash flow Fully committed debt financing of $800 million new Term Loan A Expect to maintain BB ratings profile and attractive cost of debt financing Synergy estimate $15 million Expected closing in 1Q 2017 Broadens Silgan Closures Franchise (1) Based on projected Pro Forma Adjusted EBITDA of $123m and projected capex of $24m for Dispensing Systems Business for the year end December 31, 2016. (2) Estimated Total Leverage Ratio as defined under the Credit Agreement based on estimated 12/31/16 financial performance of Silgan Holdings, LTM Pro Forma Adjusted EBITDA of $118m for the target and assumed financing for the acquisition. 15 I SILGAN HOLDINGS INC.
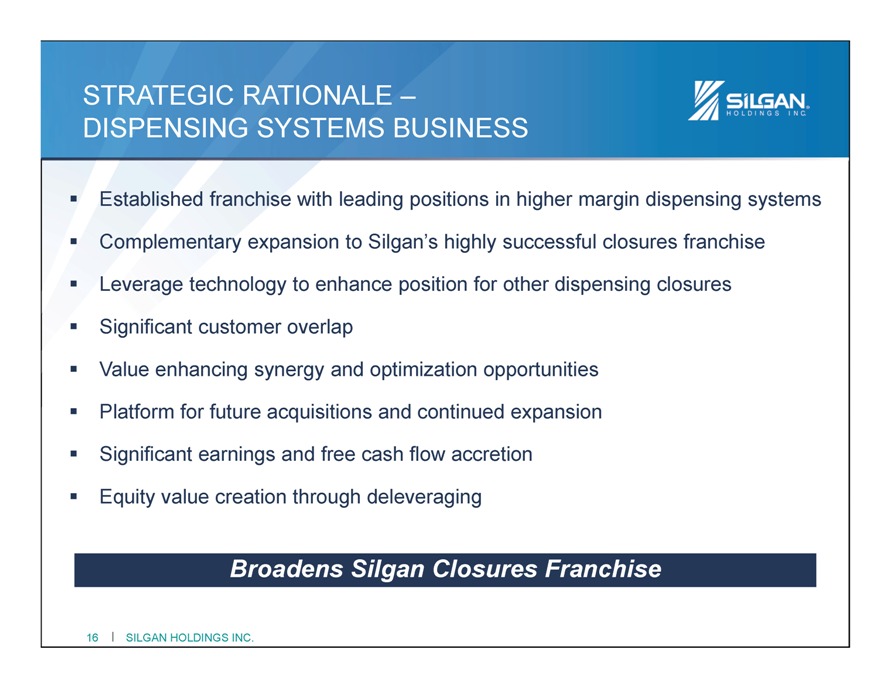
DISPENSING SYSTEMS BUSINESS Established franchise with leading positions in higher margin dispensing systems Complementary expansion to Silgan’s highly successful closures franchise Leverage technology to enhance position for other dispensing closures Significant customer overlap Value enhancing synergy and optimization opportunities Platform for future acquisitions and continued expansion Significant earnings and free cash flow accretion Equity value creation through deleveraging Broadens Silgan Closures Franchise 16 I SILGAN HOLDINGS INC.
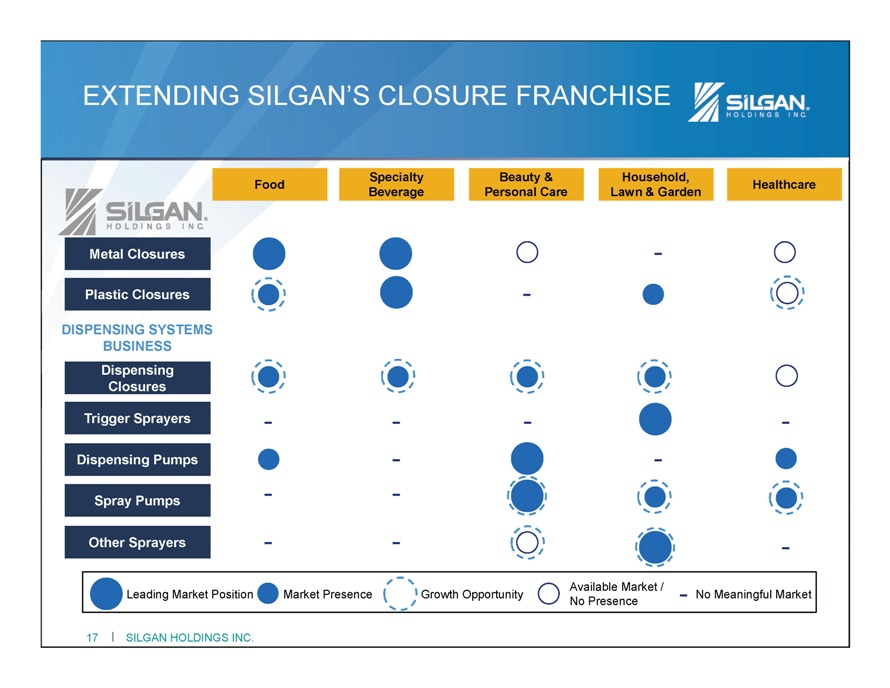
EXTENDING SILGAN’S CLOSURE FRANCHISE Food Specialty Beauty & Household, Healthcare Beverage Personal Care Lawn & Garden Metal Closures -Plastic Closures -DISPENSING SYSTEMS BUSINESS Dispensing Closures Trigger Sprayers - - - -Dispensing Pumps - -- -Spray Pumps Other Sprayers - - - Leading Market Position Market Presence Growth Opportunity Available Market / - No Meaningful Market No Presence 17 I SILGAN HOLDINGS INC.
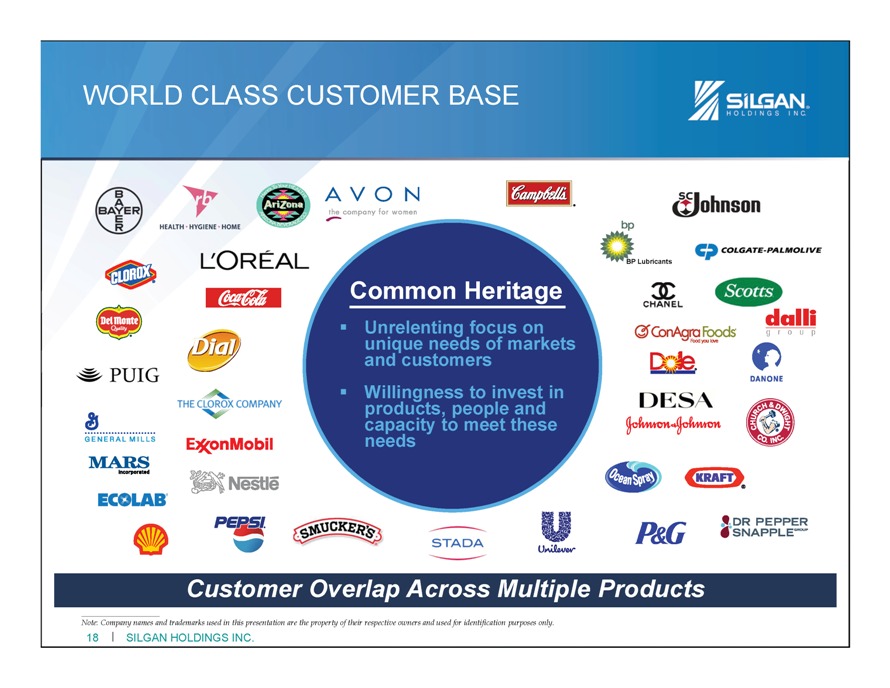
WORLD CLASS CUSTOMER BASE Common Heritage BP Lubricants Unrelenting unique needs focus of markets on and customers Willingness products, people to invest and in capacity needs to meet these Customer Overlap Across Multiple Products Note: Company names and trademarks used in this presentation are the property of their respective owners and used for identification purposes only. 18 I SILGAN HOLDINGS INC.
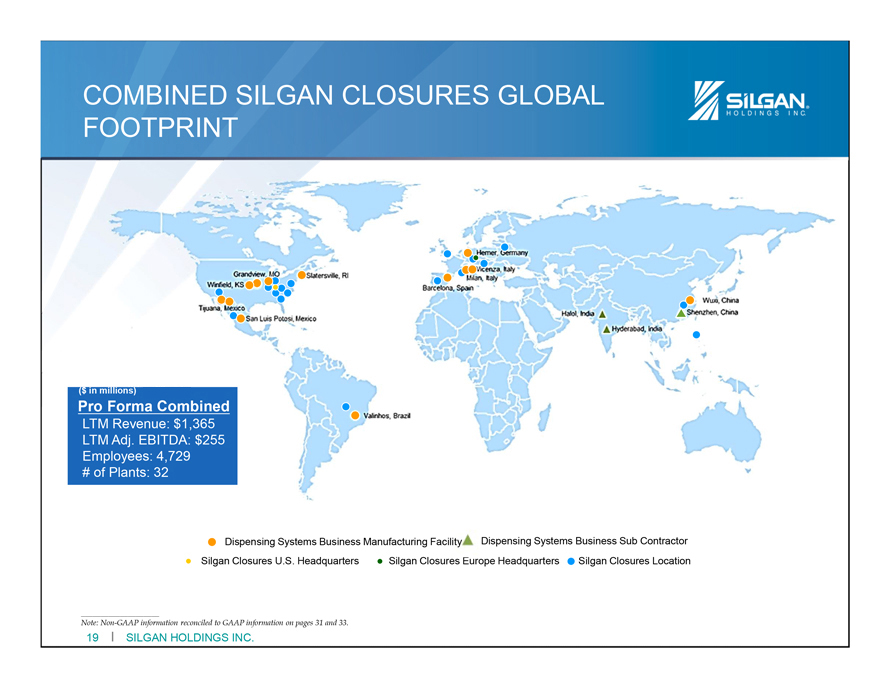
($ in millions) COMBINED SILGAN CLOSURES GLOBAL FOOTPRINT Pro Forma Combined LTM Revenue: $1,365 LTM Adj. EBITDA: $255 Employees: 4,729 # of Plants: 32 Dispensing Systems Business Manufacturing Facility Dispensing Systems Business Sub Contractor Silgan Closures U.S. Headquarters Silgan Closure ope Headquarters Silgan Closures Location Note: Non-GAAP information reconciled to GAAP information on pages 31 and 33. 19 I SILGAN HOLDINGS INC.
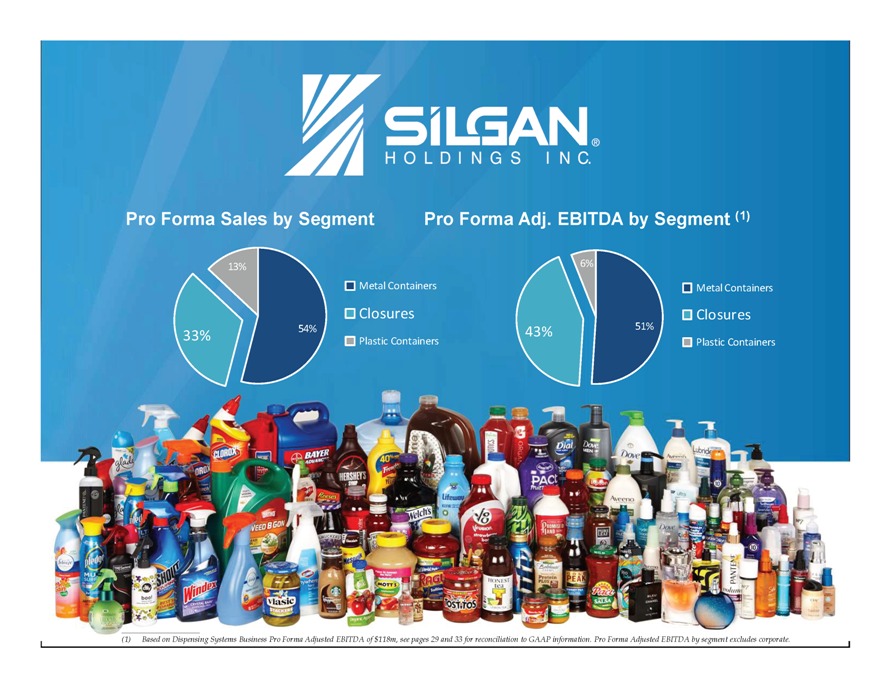
Pro Forma Sales by Segment Pro Forma Adj. EBITDA by Segment (1) 13% Metal Containers 6% Metal Containers Closures Closures 33% 54% 43% 51% Plastic Containers Plastic Containers (1) Based on Dispensing Systems Business Pro Forma Adjusted EBITDA of $118m, see pages 29 and 33 for reconciliation to GAAP information. Pro Forma Adjusted EBITDA by segment excludes corporate.
AGENDA Expanding Franchises in Rigid Packaging About Silgan About New Dispensing Systems Business Transaction Summary and Strategic Rationale Financial Impact Q & A 21 I SILGAN HOLDINGS INC.
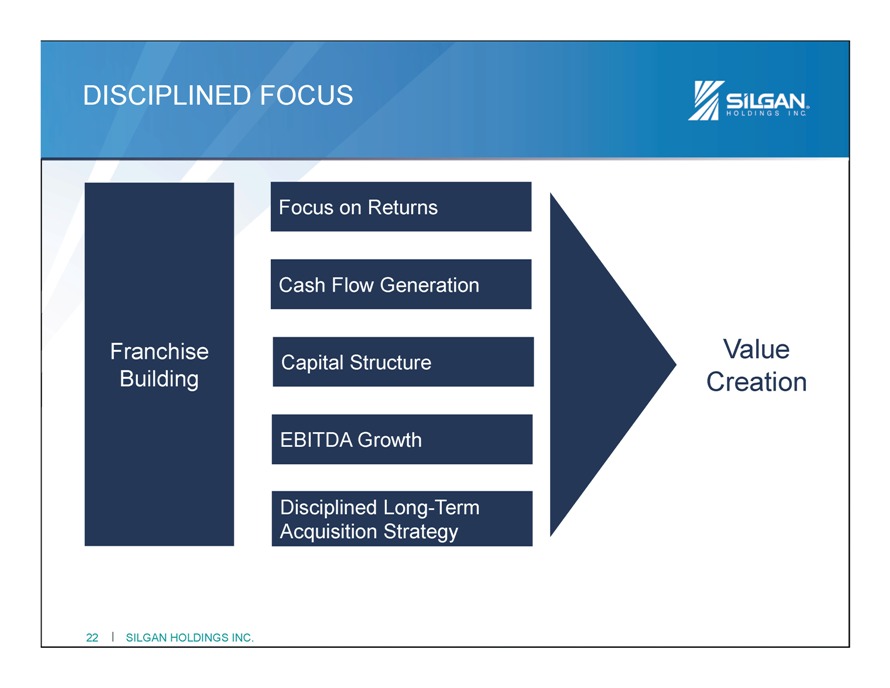
DISCIPLINED FOCUS Focus on Returns Cash Flow Generation Franchise Capital Structure Value Building Creation EBITDA Growth Disciplined Long-Term Acquisition Strategy 22 I SILGAN HOLDINGS INC.

SUPERIOR RETURNS AND CASH FLOW Adj. EBITDA – Capex as % of Sales 20.0% 15.0% 10.0% 5.0% 0.0% (1) 16.6% (1) 9.9% 8.7% 6.4% 8.5% 6.1% ? Silgan ? Dispensing Systems Normalized Capex(2) Business Note: Non-GAAP information reconciled to GAAP information on pages 30 and 33. (1) Calculated using Pro Forma Adjusted EBUDA. See reconciliation to GAAP information on page 33. (2) Assumes normalized capex of $150m. Average capex from 2012-2014 was $121m 23 I SILGAN HOLDINGS INC.
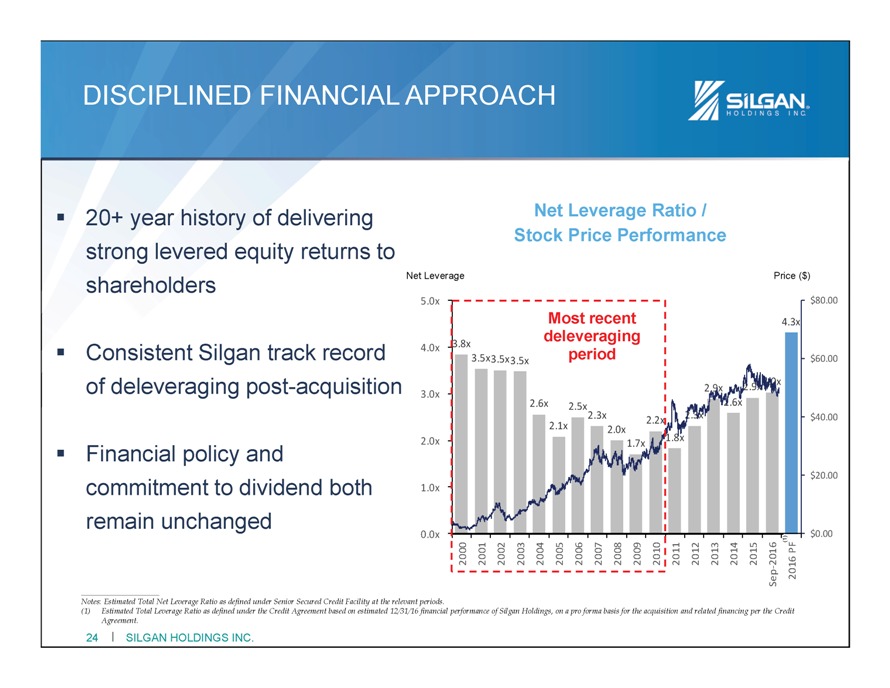
DISCIPLINED FINANCIAL APPROACH 20+ year history of delivering Net Leverage Ratio / strong levered equity returns to Stock Price Performance shareholders Net Leverage Price ($) 5.0x $80.00 Most recent 4.3x 4.0x 3.8x deleveraging Consistent Silgan track record 3.5x 3.5x 3.5x period $60.00 of deleveraging post-acquisition 2.9x 2.9x 3.0x 3.0x 2.6x 2.6x 2.5x 2.3x 2.3x 2.1x 2.2x $40.00 2.0x 1.8x Financial policy and 2.0x 1.7x $20.00 commitment to dividend both 1.0x remain unchanged 0.0x $0.00 PF (1) 20002001200220032004200520062007200820092010201120122013201420152016 Sep -2016 Notes: Estimated Total Net Leverage Ratio as defined under Senior Secured Credit Facility at the relevant periods. (1) Estimated Total Leverage Ratio as defined under the Credit Agreement based on estimated 12/31/16 financial performance of Silgan Holdings, on a pro forma basis for the acquisition and related financing per the Credit Agreement. 24 I SILGAN HOLDINGS INC.
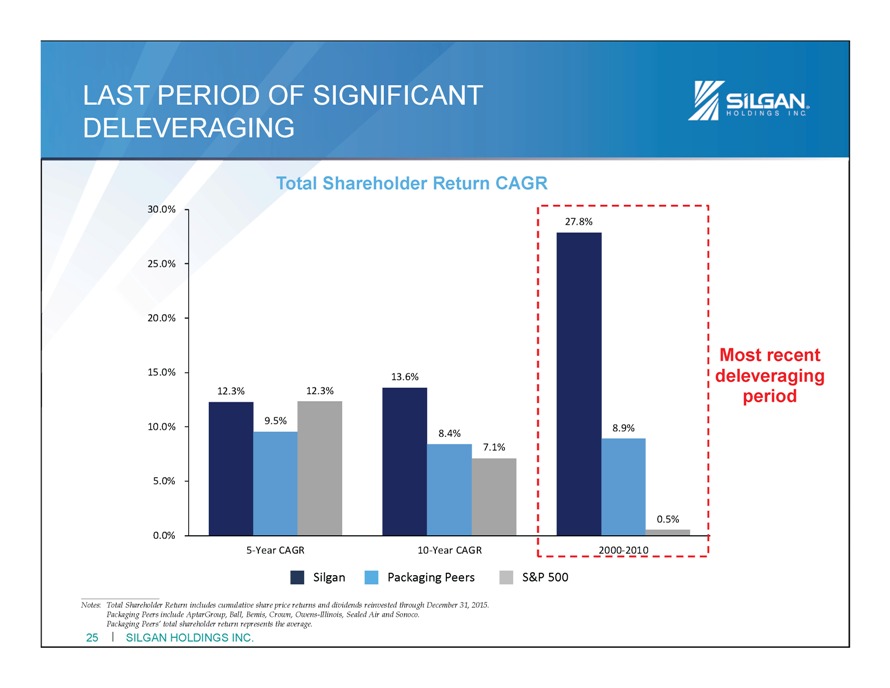
LAST PERIOD OF SIGNIFICANT DELEVERAGING Total Shareholder Return CAGR 30.0% 27.8% 25.0% 20.0% Most recent 15.0% 13.6% deleveraging 12.3% 12.3% period 10.0% 9.5% 8.9% 8.4% 7.1% 5.0% 0.5% 0.0% 5-Year CAGR 10-Year CAGR 2000-2010 Silgan Packaging Peers S&P 500 Notes: Total Shareholder Return includes cumulative share price returns and dividends reinvested through December 31, 2015. Packaging Peers include AptarGroup, Ball, Bemis, Crown, Owens-Illinois, Sealed Air and Sonoco. Packaging Peers’ total shareholder return represents the average. 25 I SILGAN HOLDINGS INC.
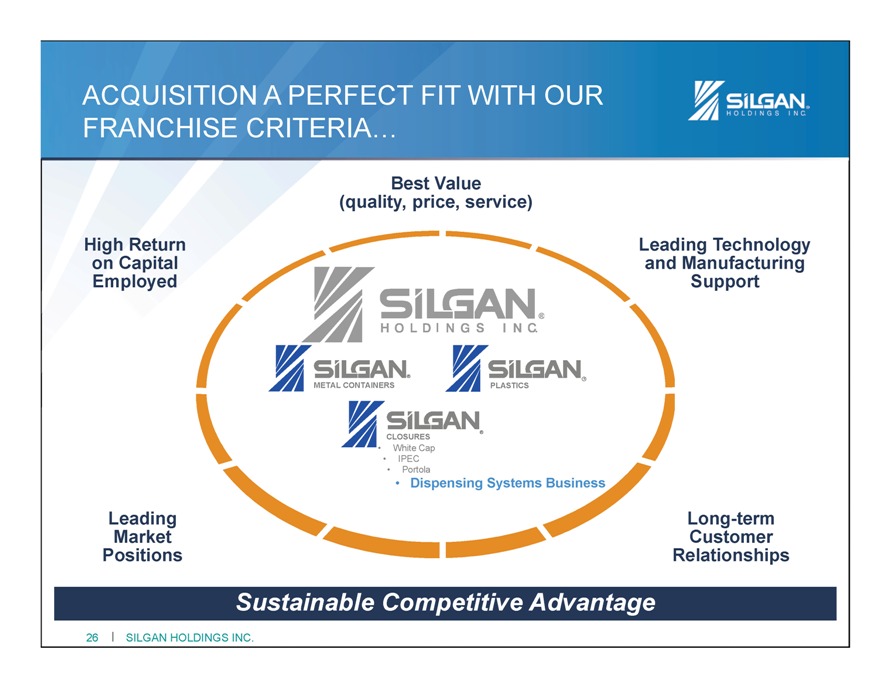
ACQUISITION A PERFECT FIT WITH OUR FRANCHISE CRITERIA… Best Value (quality, price, service) High Return Leading Technology on Capital and Manufacturing Employed Support METAL CONTAINERS PLASTICS CLOSURES • White Cap • IPEC • •Portola Dispensing Systems Business Leading Long-term Market Customer Positions Relationships Sustainable Competitive Advantage 26 I SILGAN HOLDINGS INC.
AGENDA Expanding Franchises in Rigid Packaging About Silgan About New Dispensing Systems Business Transaction Summary and Strategic Rationale Financial Impact Q & A 27 I SILGAN HOLDINGS INC.
Appendix
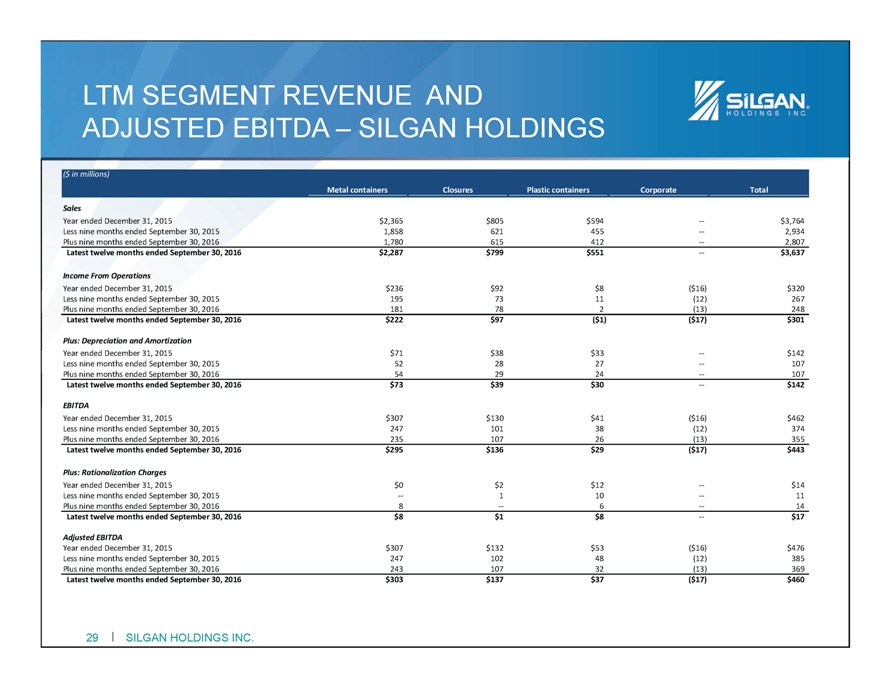
LTM SEGMENT REVENUE AND ADJUSTED EBITDA – SILGAN HOLDINGS ($ in millions) Metal containers Closures Plastic containers Corporate Total Year ended December 31, 2015 $2,365 $805 $594 $3,764 Less nine months ended September 30, 2015 1,858 621 455 -- 2,934 Plus nine months ended September 30, 2016 1,780 615 412 -- 2,807 Latest twelve months ended September 30, 2016 $2,287 $799 $551 -- $3,637 Income From Operations Year ended December 31, 2015 $236 $92 $8 ($16) $320 Less nine months ended September 30, 2015 195 73 11 (12) 267 Plus nine months ended September 30, 2016 181 78 2 (13) 248 Latest twelve months ended September 30, 2016 $222 $97 ($1) ($17) $301 Plus: Depreciation and Amortization Year ended December 31, 2015 $71 $38 $33 -- $142 Less nine months ended September 30, 2015 52 28 27 -- 107 Plus nine months ended September 30, 2016 54 29 24 -- 107 Latest twelve months ended September 30, 2016 $73 $39 $30 -- $142 EBITDA Year ended December 31, 2015 $307 $130 $41 ($16) $462 Less nine months ended September 30, 2015 247 101 38 (12) 374 Plus nine months ended September 30, 2016 235 107 26 (13) 355 Latest twelve months ended September 30, 2016 $295 $136 $29 ($17) $443 Plus: Rationalization Charges Year ended December 31, 2015 $0 $2 $12 -- $14 Less nine months ended September 30, 2015 -- 1 10 -- 11 Plus nine months ended September 30, 2016 8 -- 6 -- 14 Latest twelve months ended September 30, 2016 $8 $1 $8 -- $17 Adjusted EBITDA Year ended December 31, 2015 $307 $132 $53 ($16) $476 Less nine months ended September 30, 2015 247 102 48 (12) 385 Plus nine months ended September 30, 2016 243 107 32 (13) 369 Latest twelve months ended September 30, 2016 $303 $137 $37 ($17) $460 29 I SILGAN HOLDINGS INC
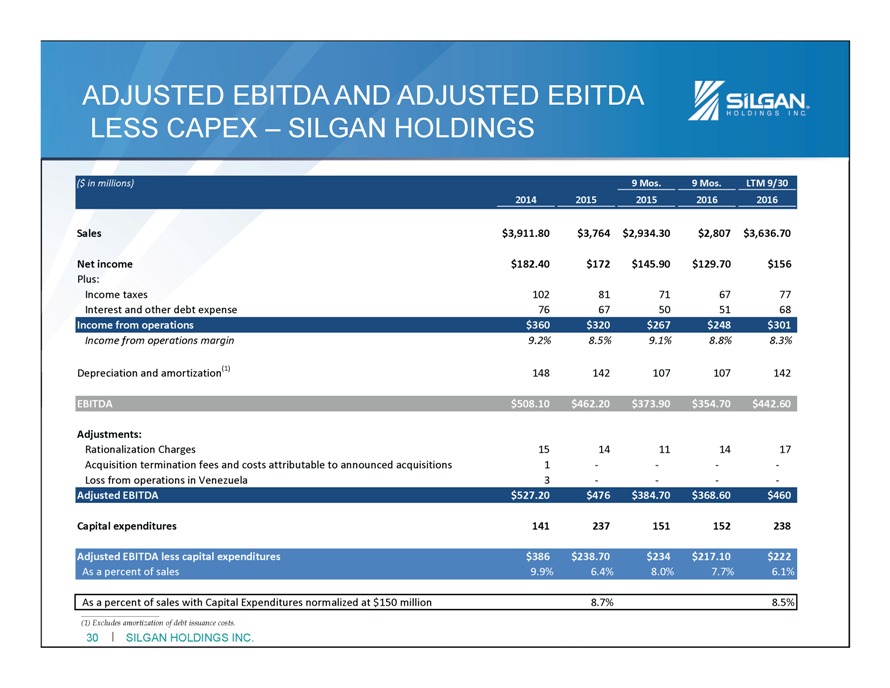
ADJUSTED EBITDA AND ADJUSTED EBITDA LESS CAPEX – SILGAN HOLDINGS ($ in millions) 9 Mos. 9 Mos. LTM 9/30 2014 2015 2015 2016 2016 Sales $3,911.80 $3,764 $2,934.30 $2,807 $3,636.70 Net income $182.40 $172 $145.90 $129.70 $156 Plus: Income taxes 102 81 71 67 77 Interest and other debt expense 76 67 50 51 68 Income from operations $360 $320 $267 $248 $301 Income from operations margin 9.2% 8.5% 9.1% 8.8% 8.3% Depreciation and amortization(1) 148 142 107 107 142 EBITDA $508.10 $462.20 $373.90 $354.70 $442.60 Adjustments: Rationalization Charges 15 14 11 14 17 Acquisition termination fees and costs attributable to announced acquisitions 1 - - - - Loss from operations in Venezuela 3 - - - - Adjusted EBITDA $527.20 $476 $384.70 $368.60 $460 Capital expenditures 141 237 151 152 238 Adjusted EBITDA less capital expenditures $386 $238.70 $234 $217.10 $222 As a percent of sales 9.9% 6.4% 8.0% 7.7% 6.1% As a percent of sales with Capital Expenditures normalized at $150 million 8.7% 8.5% (1) Excludes amortization of debt issuance costs 30 I SILGAN HOLDINGS INC.
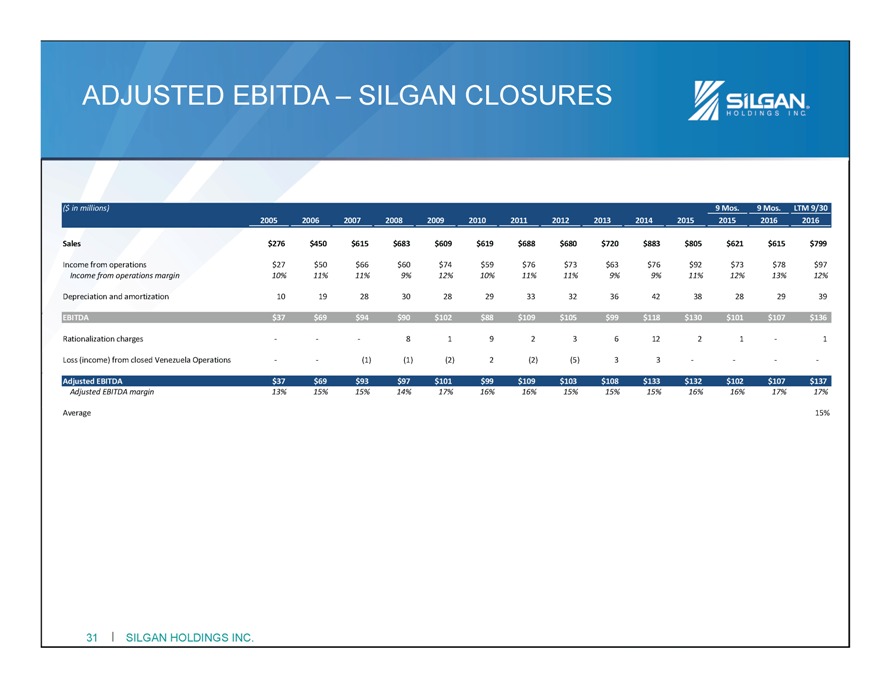
ADJUSTED EBITDA – SILGAN CLOSURES ($ in millions) 9 Mos. 9 Mos. LTM 9/30 2005 2006 2007 2008 2009 2010 2011 2012 2013 2014 2015 2015 2016 2016 Sales $276 $450 $615 $683 $609 $619 $688 $680 $720 $883 $805 $621 $615 $799 Income from operations $27 $50 $66 $60 $74 $59 $76 $73 $63 $76 $92 $73 $78 $97 Income from operations margin 10% 11% 11% 9% 12% 10% 11% 11% 9% 9% 11% 12% 13% 12% Depreciation and amortization 10 19 28 30 28 29 33 32 36 42 38 28 29 39 Rationalization charges - - - 8 1 9 2 3 6 12 2 1 - 1 Loss (income) from closed Venezuela Operations - - (1) (1) (2) 2 (2) (5) 3 3 - - - - Adjusted EBITDA margin 13% 15% 15% 14% 17% 16% 16% 15% 15% 15% 16% 16% 17% 17% Average 15% 31 SILGAN HOLDINGS INC.
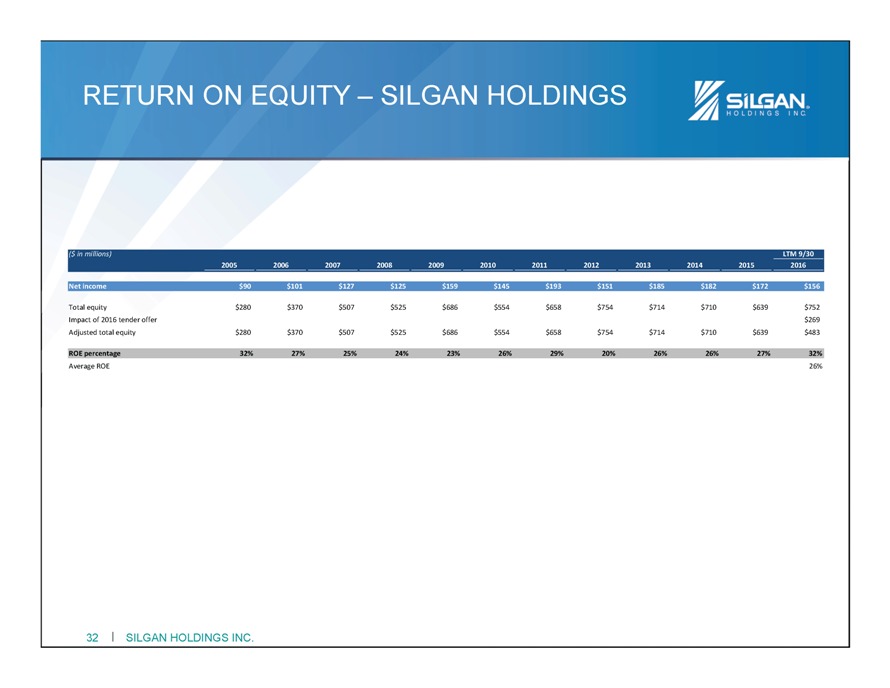
RETURN ON EQUITY – SILGAN HOLDINGS ($ in millions) LTM 9/30 2005 2006 2007 2008 2009 2010 2011 2012 2013 2014 2015 2016 Net income $90 $101 $127 $125 $159 $145 $193 $151 $185 $182 $172 $156 Total equity $280 $370 $507 $525 $686 $554 $658 $754 $714 $710 $639 $752 Impact of 2016 tender offer $269 Adjusted total equity $280 $370 $507 $525 $686 $554 $658 $754 $714 $710 $639 $483 ROE percentage 32% 27% 25% 24% 23% 26% 29% 20% 26% 26% 27% 32% Average ROE 26% 32 I SILGAN HOLDINGS INC.
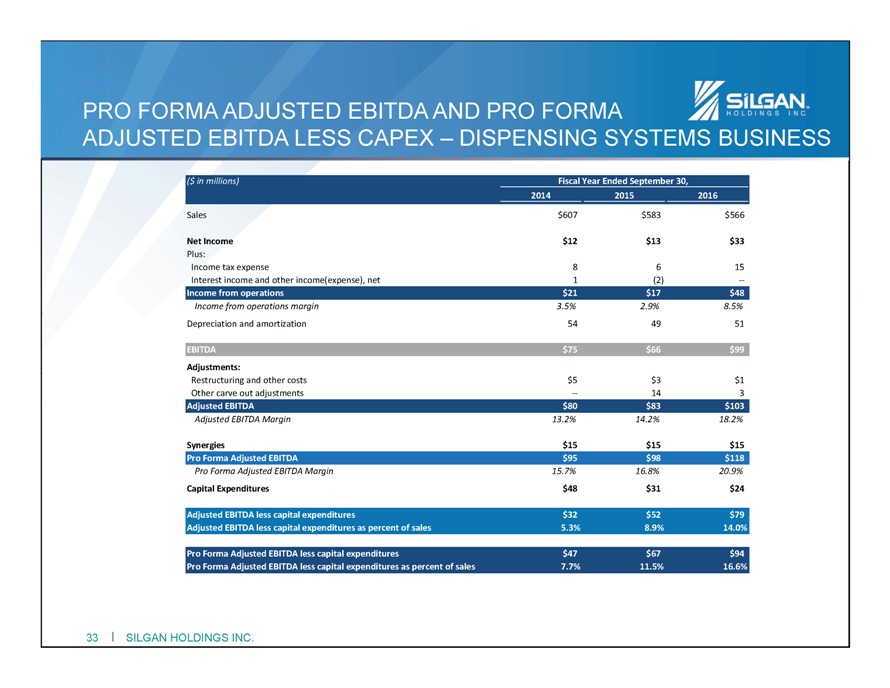
PRO FORMA ADJUSTED EBITDA AND PRO FORMA ADJUSTED EBITDA LESS CAPEX – DISPENSING SYSTEMS BUSINESS ($ in millions) Fiscal Year Ended September 30, 2014 2015 2016 Sales $607 $583 $566 Net Income $12 $13 $33 Plus: Income tax expense 8 6 15 Interest income and other income(expense), net 1 (2) -- Income from operations $21 $17 $48 Income from operations margin 3.5% 2.9% 8.5% Depreciation and amortization 54 49 51 EBITDA $75 $66 $99 Adjustments: Restructuring and other costs $5 $3 $1 Other carve out adjustments -- 14 3 Adjusted EBITDA $80 $83 $103 Adjusted EBITDA Margin 13.2% 14.2% 18.2% Synergies $15 $15 $15 Pro Forma Adjusted EBITDA $95 $98 $118 Pro Forma Adjusted EBITDA Margin 15.7% 16.8% 20.9% Capital Expenditures $48 $31 $24 Adjusted EBITDA less capital expenditures $32 $52 $79 Adjusted EBITDA less capital expenditures as percent of sales 5.3% 8.9% 14.0% Pro Forma Adjusted EBITDA less capital expenditures $47 $67 $94 Pro Forma Adjusted EBITDA less capital expenditures as percent of sales 7.7% 11.5% 16.6% 33 I SILGAN HOLDINGS INC.
SILGAN TO ACQUIRE DISPENSING SYSTEMS BUSINESS Expanding Franchises in Rigid Packaging